Barbadian vs Icelander 2 or more Vehicles in Household
COMPARE
Barbadian
Icelander
2 or more Vehicles in Household
2 or more Vehicles in Household Comparison
Barbadians
Icelanders
38.3%
2 OR MORE VEHICLES IN HOUSEHOLD
0.0/ 100
METRIC RATING
337th/ 347
METRIC RANK
58.0%
2 OR MORE VEHICLES IN HOUSEHOLD
99.2/ 100
METRIC RATING
83rd/ 347
METRIC RANK
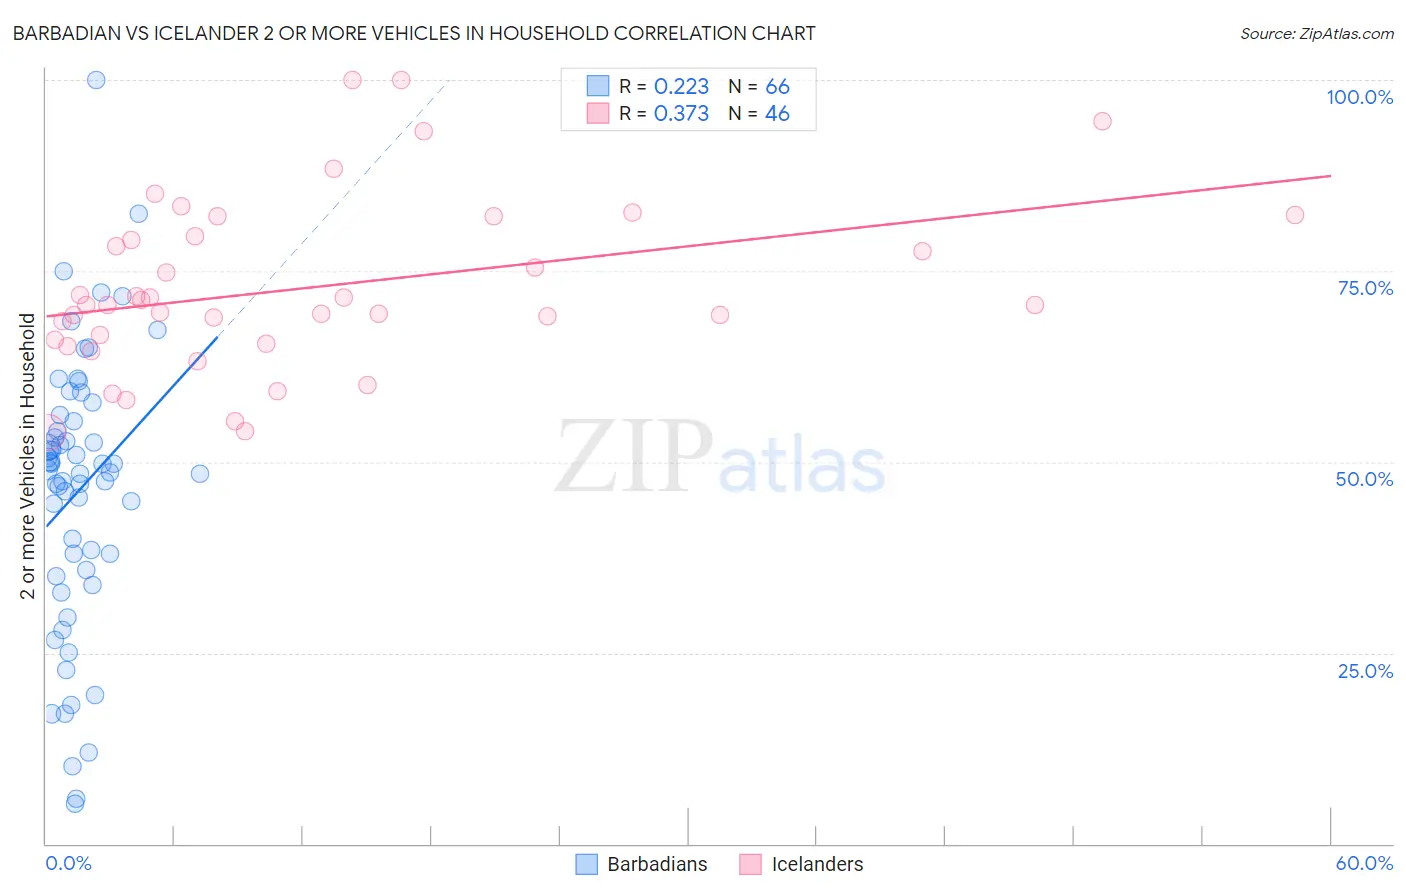
Barbadian vs Icelander 2 or more Vehicles in Household Correlation Chart
The statistical analysis conducted on geographies consisting of 141,285,511 people shows a weak positive correlation between the proportion of Barbadians and percentage of households with 2 or more vehicles available in the United States with a correlation coefficient (R) of 0.223 and weighted average of 38.3%. Similarly, the statistical analysis conducted on geographies consisting of 159,625,716 people shows a mild positive correlation between the proportion of Icelanders and percentage of households with 2 or more vehicles available in the United States with a correlation coefficient (R) of 0.373 and weighted average of 58.0%, a difference of 51.3%.
2 or more Vehicles in Household Correlation Summary
| Measurement | Barbadian | Icelander |
| Minimum | 5.2% | 53.8% |
| Maximum | 100.0% | 100.0% |
| Range | 94.8% | 46.2% |
| Mean | 46.2% | 72.9% |
| Median | 48.8% | 70.6% |
| Interquartile 25% (IQ1) | 35.8% | 66.0% |
| Interquartile 75% (IQ3) | 55.4% | 79.6% |
| Interquartile Range (IQR) | 19.6% | 13.6% |
| Standard Deviation (Sample) | 18.2% | 11.2% |
| Standard Deviation (Population) | 18.0% | 11.1% |
Similar Demographics by 2 or more Vehicles in Household
Demographics Similar to Barbadians by 2 or more Vehicles in Household
In terms of 2 or more vehicles in household, the demographic groups most similar to Barbadians are Vietnamese (38.5%, a difference of 0.41%), Immigrants from Bangladesh (38.8%, a difference of 1.1%), Immigrants from Uzbekistan (37.9%, a difference of 1.2%), Immigrants from Trinidad and Tobago (40.3%, a difference of 5.0%), and Immigrants from Ecuador (40.5%, a difference of 5.6%).
| Demographics | Rating | Rank | 2 or more Vehicles in Household |
| Immigrants | Dominica | 0.0 /100 | #330 | Tragic 41.6% |
| West Indians | 0.0 /100 | #331 | Tragic 41.3% |
| Trinidadians and Tobagonians | 0.0 /100 | #332 | Tragic 40.9% |
| Immigrants | Ecuador | 0.0 /100 | #333 | Tragic 40.5% |
| Immigrants | Trinidad and Tobago | 0.0 /100 | #334 | Tragic 40.3% |
| Immigrants | Bangladesh | 0.0 /100 | #335 | Tragic 38.8% |
| Vietnamese | 0.0 /100 | #336 | Tragic 38.5% |
| Barbadians | 0.0 /100 | #337 | Tragic 38.3% |
| Immigrants | Uzbekistan | 0.0 /100 | #338 | Tragic 37.9% |
| Immigrants | Barbados | 0.0 /100 | #339 | Tragic 35.8% |
| British West Indians | 0.0 /100 | #340 | Tragic 35.4% |
| Guyanese | 0.0 /100 | #341 | Tragic 35.4% |
| Dominicans | 0.0 /100 | #342 | Tragic 35.3% |
| Immigrants | Guyana | 0.0 /100 | #343 | Tragic 35.0% |
| Yup'ik | 0.0 /100 | #344 | Tragic 34.9% |
Demographics Similar to Icelanders by 2 or more Vehicles in Household
In terms of 2 or more vehicles in household, the demographic groups most similar to Icelanders are Maltese (58.0%, a difference of 0.030%), Iranian (58.1%, a difference of 0.040%), Slovak (58.0%, a difference of 0.080%), Potawatomi (58.0%, a difference of 0.11%), and Immigrants from Iraq (58.1%, a difference of 0.12%).
| Demographics | Rating | Rank | 2 or more Vehicles in Household |
| Creek | 99.5 /100 | #76 | Exceptional 58.3% |
| Slovenes | 99.5 /100 | #77 | Exceptional 58.3% |
| Lithuanians | 99.5 /100 | #78 | Exceptional 58.2% |
| Delaware | 99.4 /100 | #79 | Exceptional 58.2% |
| Immigrants | England | 99.3 /100 | #80 | Exceptional 58.1% |
| Immigrants | Iraq | 99.3 /100 | #81 | Exceptional 58.1% |
| Iranians | 99.3 /100 | #82 | Exceptional 58.1% |
| Icelanders | 99.2 /100 | #83 | Exceptional 58.0% |
| Maltese | 99.2 /100 | #84 | Exceptional 58.0% |
| Slovaks | 99.2 /100 | #85 | Exceptional 58.0% |
| Potawatomi | 99.1 /100 | #86 | Exceptional 58.0% |
| Thais | 99.1 /100 | #87 | Exceptional 57.9% |
| Immigrants | Iran | 99.1 /100 | #88 | Exceptional 57.9% |
| Immigrants | Germany | 99.0 /100 | #89 | Exceptional 57.9% |
| Hispanics or Latinos | 99.0 /100 | #90 | Exceptional 57.9% |