Zip Codes with the Highest Percentage of Self-Employed / Not Incorporated in Dallas, TX

RELATED REPORTS & OPTIONS

Self-Employed / Not Incorporated
Population
Families and Households
Female Fertility
Female Fertility (Unmarried)
Race (Community Size)
Race (Percentage)
Ancestry (Community Size)
AfghanAfricanAlaska NativeAlbanianAlsatianAmericanApacheArabArgentineanArmenianAssyrian / Chaldean / SyriacAustralianAustrianBahamianBangladeshiBarbadianBasqueBelgianBelizeanBhutaneseBlackfeetBolivianBrazilianBritishBritish West IndianBulgarianBurmeseCajunCambodianCanadianCape VerdeanCelticCentral AmericanCentral American IndianCherokeeChickasawChileanChippewaChoctawColombianComancheCosta RicanCreekCroatianCubanCypriotCzechCzechoslovakianDanishDominicanDutchDutch West IndianEastern EuropeanEcuadorianEgyptianEnglishEstonianEthiopianEuropeanFilipinoFinnishFrenchFrench CanadianGermanGhanaianGreekGuamanian / ChamorroGuatemalanGuyaneseHaitianHonduranHungarianIcelanderIndian (Asian)IndonesianIranianIraqiIrishIroquoisIsraeliItalianJamaicanJapaneseJordanianKenyanKoreanLaotianLatvianLebaneseLiberianLithuanianLuxembourgerMalaysianMalteseMexicanMexican American IndianMongolianMoroccanNative HawaiianNavajoNew ZealanderNicaraguanNigerianNorthern EuropeanNorwegianOkinawanOsagePakistaniPalestinianPanamanianParaguayanPennsylvania GermanPeruvianPolishPortuguesePotawatomiPuebloPuerto RicanRomanianRussianSalvadoranSamoanScandinavianScotch-IrishScottishSeminoleSenegaleseSerbianSierra LeoneanSiouxSlavicSlovakSloveneSomaliSouth AfricanSouth AmericanSouth American IndianSpaniardSpanishSpanish AmericanSpanish American IndianSri LankanSubsaharan AfricanSudaneseSwedishSwissSyrianThaiTohono O'OdhamTonganTrinidadian and TobagonianTurkishUgandanUkrainianUruguayanVenezuelanVietnameseWelshWest IndianYaquiYugoslavianZimbabwean
Ancestry (Percentage)
AfghanAfricanAlaska NativeAlbanianAlsatianAmericanApacheArabArgentineanArmenianAssyrian / Chaldean / SyriacAustralianAustrianBahamianBangladeshiBarbadianBasqueBelgianBelizeanBhutaneseBlackfeetBolivianBrazilianBritishBritish West IndianBulgarianBurmeseCajunCambodianCanadianCape VerdeanCelticCentral AmericanCentral American IndianCherokeeChickasawChileanChippewaChoctawColombianComancheCosta RicanCreekCroatianCubanCypriotCzechCzechoslovakianDanishDominicanDutchDutch West IndianEastern EuropeanEcuadorianEgyptianEnglishEstonianEthiopianEuropeanFilipinoFinnishFrenchFrench CanadianGermanGhanaianGreekGuamanian / ChamorroGuatemalanGuyaneseHaitianHonduranHungarianIcelanderIndian (Asian)IndonesianIranianIraqiIrishIroquoisIsraeliItalianJamaicanJapaneseJordanianKenyanKoreanLaotianLatvianLebaneseLiberianLithuanianLuxembourgerMalaysianMalteseMexicanMexican American IndianMongolianMoroccanNative HawaiianNavajoNew ZealanderNicaraguanNigerianNorthern EuropeanNorwegianOkinawanOsagePakistaniPalestinianPanamanianParaguayanPennsylvania GermanPeruvianPolishPortuguesePotawatomiPuebloPuerto RicanRomanianRussianSalvadoranSamoanScandinavianScotch-IrishScottishSeminoleSenegaleseSerbianSierra LeoneanSiouxSlavicSlovakSloveneSomaliSouth AfricanSouth AmericanSouth American IndianSpaniardSpanishSpanish AmericanSpanish American IndianSri LankanSubsaharan AfricanSudaneseSwedishSwissSyrianThaiTohono O'OdhamTonganTrinidadian and TobagonianTurkishUgandanUkrainianUruguayanVenezuelanVietnameseWelshWest IndianYaquiYugoslavianZimbabwean
Immigrant Origin (Total)
AfghanistanAfricaAlbaniaArgentinaArmeniaAsiaAustraliaAustriaBahamasBangladeshBelarusBelgiumBelizeBoliviaBosnia and HerzegovinaBrazilBulgariaBurma / MyanmarCambodiaCameroonCanadaCaribbeanCentral AmericaChileChinaColombiaCongoCosta RicaCroatiaCubaCzechoslovakiaDenmarkDominicaDominican RepublicEastern AfricaEastern AsiaEastern EuropeEcuadorEgyptEl SalvadorEnglandEritreaEthiopiaEuropeFijiFranceGermanyGhanaGreeceGuatemalaGuyanaHaitiHondurasHong KongHungaryIndiaIndonesiaIranIraqIrelandIsraelItalyJamaicaJapanJordanKazakhstanKenyaKoreaKuwaitLaosLatin AmericaLatviaLebanonLiberiaMalaysiaMexicoMiddle AfricaMoldovaMoroccoNepalNetherlandsNicaraguaNigeriaNorthern AfricaNorthern EuropeNorwayOceaniaPakistanPanamaPeruPhilippinesPolandPortugalRomaniaRussiaSaudi ArabiaScotlandSenegalSerbiaSierra LeoneSingaporeSomaliaSouth AfricaSouth AmericaSouth Central AsiaSouth Eastern AsiaSouthern EuropeSpainSri LankaSudanSwedenSwitzerlandSyriaTaiwanThailandTrinidad and TobagoTurkeyUgandaUkraineUruguayUzbekistanVenezuelaVietnamWest IndiesWestern AfricaWestern AsiaWestern EuropeYemenZaireZimbabwe
Immigrant Origin (Percentage)
AfghanistanAfricaAlbaniaArgentinaArmeniaAsiaAustraliaAustriaBahamasBangladeshBelarusBelgiumBelizeBoliviaBosnia and HerzegovinaBrazilBulgariaBurma / MyanmarCambodiaCameroonCanadaCaribbeanCentral AmericaChileChinaColombiaCongoCosta RicaCroatiaCubaCzechoslovakiaDenmarkDominicaDominican RepublicEastern AfricaEastern AsiaEastern EuropeEcuadorEgyptEl SalvadorEnglandEritreaEthiopiaEuropeFijiFranceGermanyGhanaGreeceGuatemalaGuyanaHaitiHondurasHong KongHungaryIndiaIndonesiaIranIraqIrelandIsraelItalyJamaicaJapanJordanKazakhstanKenyaKoreaKuwaitLaosLatin AmericaLatviaLebanonLiberiaMalaysiaMexicoMiddle AfricaMoldovaMoroccoNepalNetherlandsNicaraguaNigeriaNorthern AfricaNorthern EuropeNorwayOceaniaPakistanPanamaPeruPhilippinesPolandPortugalRomaniaRussiaSaudi ArabiaScotlandSenegalSerbiaSierra LeoneSingaporeSomaliaSouth AfricaSouth AmericaSouth Central AsiaSouth Eastern AsiaSouthern EuropeSpainSri LankaSudanSwedenSwitzerlandSyriaTaiwanThailandTrinidad and TobagoTurkeyUgandaUkraineUruguayUzbekistanVenezuelaVietnamWest IndiesWestern AfricaWestern AsiaWestern EuropeYemenZaireZimbabwe
Income
Income (Families)
Income (Households)
Poverty
Poverty (Families)
Unemployment
Employment Occupations
Employment Industries
Employer Class
Commute Time
Commute Means
School Enrollment
Education by Degree Field
Occupancy
Finances
Physical Characteristics
Dallas
Compare Zip Codes
Comparison Subject

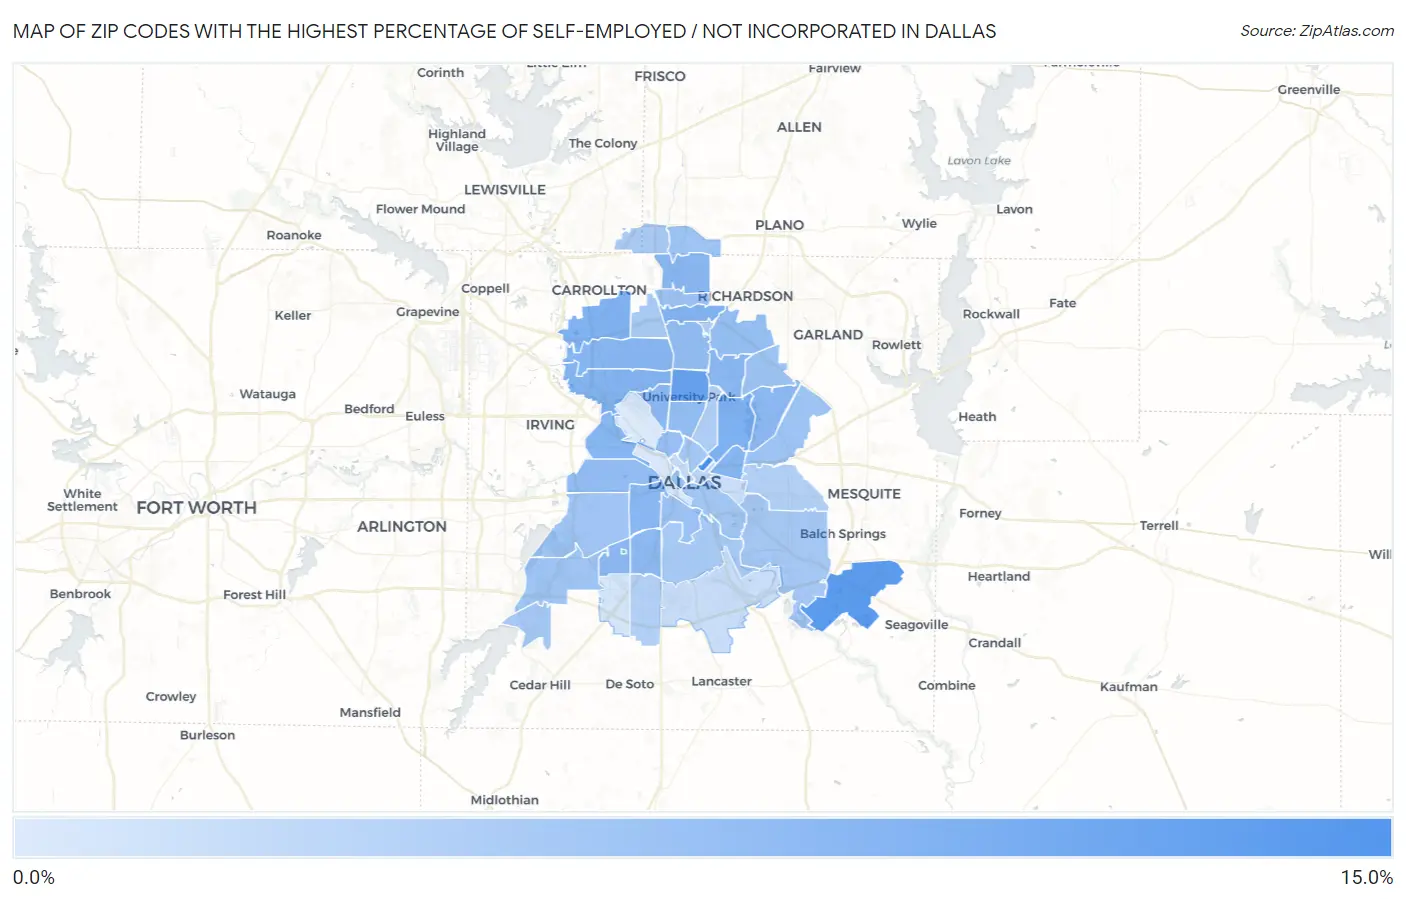
Map of Zip Codes with the Highest Percentage of Self-Employed / Not Incorporated in Dallas

0.0%
15.0%
Zip Codes with the Highest Percentage of Self-Employed / Not Incorporated in Dallas Map

Zip Codes with the Highest Percentage of Self-Employed / Not Incorporated in Dallas, TX

Zip Code % Self-Employed / Not Incorporated vs State vs National
1.7524613.9%6.7%(+7.19)#2215.8%(+8.11)#3,940
2.7525312.0%6.7%(+5.27)#3205.8%(+6.19)#5,286
3.7522511.2%6.7%(+4.42)#3675.8%(+5.34)#6,048
4.752149.2%6.7%(+2.42)#5535.8%(+3.34)#8,533
5.752348.8%6.7%(+2.09)#6035.8%(+3.01)#9,114
6.752408.7%6.7%(+2.00)#6195.8%(+2.92)#9,267
7.752208.6%6.7%(+1.87)#6315.8%(+2.79)#9,454
8.752238.3%6.7%(+1.61)#6765.8%(+2.53)#9,956
9.752298.3%6.7%(+1.56)#6825.8%(+2.47)#10,080
10.752478.3%6.7%(+1.53)#6855.8%(+2.45)#10,116
11.752088.2%6.7%(+1.44)#6995.8%(+2.36)#10,298
12.752488.1%6.7%(+1.35)#7165.8%(+2.27)#10,468
13.752318.1%6.7%(+1.35)#7185.8%(+2.26)#10,485
14.752338.0%6.7%(+1.27)#7305.8%(+2.19)#10,623
15.752188.0%6.7%(+1.27)#7325.8%(+2.18)#10,644
16.752097.8%6.7%(+1.11)#7605.8%(+2.02)#10,981
17.752247.7%6.7%(+0.985)#7855.8%(+1.90)#11,258
18.752057.4%6.7%(+0.679)#8475.8%(+1.60)#12,004
19.752127.3%6.7%(+0.617)#8555.8%(+1.53)#12,176
20.752307.3%6.7%(+0.585)#8575.8%(+1.50)#12,247
21.752437.1%6.7%(+0.363)#9025.8%(+1.28)#12,765
22.752197.0%6.7%(+0.257)#9245.8%(+1.17)#13,083
23.752546.7%6.7%(-0.032)#9875.8%(+0.885)#13,863
24.752036.6%6.7%(-0.138)#1,0085.8%(+0.779)#14,149
25.752026.5%6.7%(-0.212)#1,0215.8%(+0.705)#14,410
26.752386.4%6.7%(-0.331)#1,0475.8%(+0.586)#14,779
27.752286.3%6.7%(-0.405)#1,0725.8%(+0.512)#15,001
28.752526.3%6.7%(-0.422)#1,0765.8%(+0.495)#15,060
29.752366.2%6.7%(-0.506)#1,0905.8%(+0.411)#15,336
30.752116.1%6.7%(-0.600)#1,1165.8%(+0.317)#15,636
31.752046.0%6.7%(-0.749)#1,1595.8%(+0.168)#16,129
32.752155.9%6.7%(-0.844)#1,1805.8%(+0.073)#16,411
33.752175.8%6.7%(-0.925)#1,2045.8%(-0.008)#16,684
34.752495.8%6.7%(-0.949)#1,2115.8%(-0.032)#16,758
35.752445.6%6.7%(-1.12)#1,2595.8%(-0.201)#17,359
36.752165.5%6.7%(-1.19)#1,2735.8%(-0.273)#17,635
37.752875.5%6.7%(-1.25)#1,2855.8%(-0.331)#17,828
38.752515.1%6.7%(-1.62)#1,3715.8%(-0.706)#19,253
39.752065.0%6.7%(-1.73)#1,3925.8%(-0.811)#19,653
40.752324.7%6.7%(-2.07)#1,4455.8%(-1.16)#20,945
41.752274.6%6.7%(-2.10)#1,4515.8%(-1.18)#21,029
42.752263.9%6.7%(-2.85)#1,5505.8%(-1.94)#23,805
43.752013.3%6.7%(-3.45)#1,6125.8%(-2.53)#25,638
44.752413.0%6.7%(-3.69)#1,6305.8%(-2.77)#26,268
45.752102.9%6.7%(-3.88)#1,6455.8%(-2.97)#26,721
46.752371.9%6.7%(-4.87)#1,6925.8%(-3.95)#28,413
47.752071.6%6.7%(-5.15)#1,7015.8%(-4.23)#28,659
48.752351.3%6.7%(-5.44)#1,7125.8%(-4.52)#28,918

Common Questions

What are the Top 10 Zip Codes with the Highest Percentage of Self-Employed / Not Incorporated in Dallas, TX?
Top 10 Zip Codes with the Highest Percentage of Self-Employed / Not Incorporated in Dallas, TX are:
#1
13.9%
#2
12.0%
#3
11.2%
#4
9.2%
#5
8.8%
#6
8.7%
#7
8.6%
#8
8.3%
#9
8.3%
#10
8.3%
What zip code has the Highest Percentage of Self-Employed / Not Incorporated in Dallas, TX?
75246 has the Highest Percentage of Self-Employed / Not Incorporated in Dallas, TX with 13.9%.
What is the Percentage of Self-Employed / Not Incorporated in Dallas, TX?
Percentage of Self-Employed / Not Incorporated in Dallas is 6.5%.
What is the Percentage of Self-Employed / Not Incorporated in Texas?
Percentage of Self-Employed / Not Incorporated in Texas is 6.7%.
What is the Percentage of Self-Employed / Not Incorporated in the United States?
Percentage of Self-Employed / Not Incorporated in the United States is 5.8%.