Zip Codes with the Highest Percentage of Self-Employed / Not Incorporated in Duncanville, TX
RELATED REPORTS & OPTIONS
Self-Employed / Not Incorporated
Duncanville
Compare Zip Codes
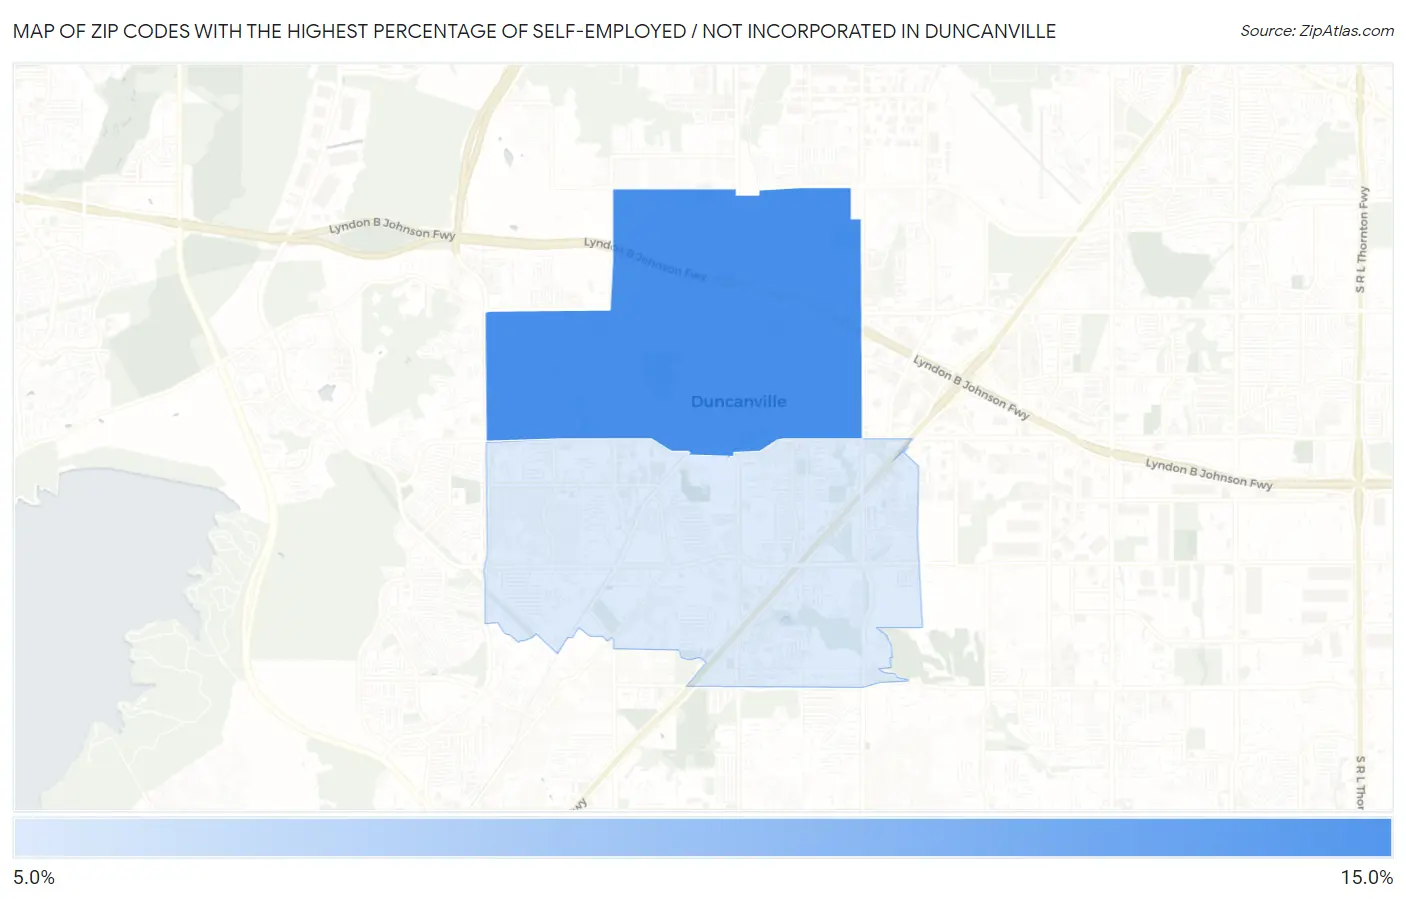
Map of Zip Codes with the Highest Percentage of Self-Employed / Not Incorporated in Duncanville
0.0%
15.0%
Zip Codes with the Highest Percentage of Self-Employed / Not Incorporated in Duncanville, TX
| Zip Code | % Self-Employed / Not Incorporated | vs State | vs National | |
| 1. | 75116 | 11.2% | 6.7%(+4.45)#365 | 5.8%(+5.36)#6,024 |
| 2. | 75137 | 5.6% | 6.7%(-1.15)#1,266 | 5.8%(-0.234)#17,475 |
1
Common Questions
What are the Top Zip Codes with the Highest Percentage of Self-Employed / Not Incorporated in Duncanville, TX?
Top Zip Codes with the Highest Percentage of Self-Employed / Not Incorporated in Duncanville, TX are:
What zip code has the Highest Percentage of Self-Employed / Not Incorporated in Duncanville, TX?
75116 has the Highest Percentage of Self-Employed / Not Incorporated in Duncanville, TX with 11.2%.
What is the Percentage of Self-Employed / Not Incorporated in Duncanville, TX?
Percentage of Self-Employed / Not Incorporated in Duncanville is 8.3%.
What is the Percentage of Self-Employed / Not Incorporated in Texas?
Percentage of Self-Employed / Not Incorporated in Texas is 6.7%.
What is the Percentage of Self-Employed / Not Incorporated in the United States?
Percentage of Self-Employed / Not Incorporated in the United States is 5.8%.