Zip Codes with the Lowest Poverty Level Among Single Mothers in Buffalo, NY

RELATED REPORTS & OPTIONS

Lowest Poverty | Single Mother
Population
Families and Households
Female Fertility
Female Fertility (Unmarried)
Race (Community Size)
Race (Percentage)
Ancestry (Community Size)
AfghanAfricanAlbanianAlsatianAmericanArabArgentineanArmenianAustralianAustrianBahamianBarbadianBelgianBelizeanBhutaneseBlackfeetBolivianBrazilianBritishBritish West IndianBulgarianBurmeseCajunCambodianCanadianCarpatho RusynCelticCentral AmericanCentral American IndianCherokeeChileanChippewaColombianCosta RicanCreekCroatianCubanCzechCzechoslovakianDanishDominicanDutchDutch West IndianEastern EuropeanEcuadorianEgyptianEnglishEstonianEthiopianEuropeanFilipinoFinnishFrenchFrench American IndianFrench CanadianGermanGerman RussianGhanaianGreekGuamanian / ChamorroGuatemalanGuyaneseHaitianHonduranHungarianIcelanderIndian (Asian)IndonesianIranianIraqiIrishIroquoisIsraeliItalianJamaicanJapaneseJordanianKenyanKoreanLaotianLatvianLebaneseLithuanianMacedonianMalaysianMalteseMexicanMexican American IndianMongolianMoroccanNative HawaiianNavajoNicaraguanNigerianNorthern EuropeanNorwegianOkinawanPakistaniPalestinianPanamanianPennsylvania GermanPeruvianPolishPortuguesePuerto RicanRomanianRussianSalvadoranSamoanScandinavianScotch-IrishScottishSerbianSiouxSlavicSlovakSloveneSomaliSouth AfricanSouth AmericanSouth American IndianSpaniardSpanishSri LankanSubsaharan AfricanSudaneseSwedishSwissSyrianTaiwaneseThaiTrinidadian and TobagonianTurkishUkrainianVenezuelanVietnameseWelshWest IndianYugoslavian
Ancestry (Percentage)
AfghanAfricanAlbanianAlsatianAmericanArabArgentineanArmenianAustralianAustrianBahamianBarbadianBelgianBelizeanBhutaneseBlackfeetBolivianBrazilianBritishBritish West IndianBulgarianBurmeseCajunCambodianCanadianCarpatho RusynCelticCentral AmericanCentral American IndianCherokeeChileanChippewaColombianCosta RicanCreekCroatianCubanCzechCzechoslovakianDanishDominicanDutchDutch West IndianEastern EuropeanEcuadorianEgyptianEnglishEstonianEthiopianEuropeanFilipinoFinnishFrenchFrench American IndianFrench CanadianGermanGerman RussianGhanaianGreekGuamanian / ChamorroGuatemalanGuyaneseHaitianHonduranHungarianIcelanderIndian (Asian)IndonesianIranianIraqiIrishIroquoisIsraeliItalianJamaicanJapaneseJordanianKenyanKoreanLaotianLatvianLebaneseLithuanianMacedonianMalaysianMalteseMexicanMexican American IndianMongolianMoroccanNative HawaiianNavajoNicaraguanNigerianNorthern EuropeanNorwegianOkinawanPakistaniPalestinianPanamanianPennsylvania GermanPeruvianPolishPortuguesePuerto RicanRomanianRussianSalvadoranSamoanScandinavianScotch-IrishScottishSerbianSiouxSlavicSlovakSloveneSomaliSouth AfricanSouth AmericanSouth American IndianSpaniardSpanishSri LankanSubsaharan AfricanSudaneseSwedishSwissSyrianTaiwaneseThaiTrinidadian and TobagonianTurkishUkrainianVenezuelanVietnameseWelshWest IndianYugoslavian
Immigrant Origin (Total)
AfghanistanAfricaAlbaniaArgentinaAsiaAustraliaAustriaBangladeshBarbadosBelarusBosnia and HerzegovinaBrazilBulgariaBurma / MyanmarCameroonCanadaCaribbeanCentral AmericaChinaColombiaCongoCosta RicaCroatiaCubaCzechoslovakiaDominican RepublicEastern AfricaEastern AsiaEastern EuropeEcuadorEgyptEl SalvadorEnglandEritreaEthiopiaEuropeFranceGermanyGhanaGreeceGuatemalaGuyanaHaitiHondurasHong KongHungaryIndiaIndonesiaIranIraqIrelandIsraelItalyJamaicaJapanJordanKazakhstanKenyaKoreaKuwaitLaosLatin AmericaLatviaLebanonLiberiaLithuaniaMalaysiaMexicoMiddle AfricaMoldovaMoroccoNepalNetherlandsNigeriaNorth MacedoniaNorthern AfricaNorthern EuropeNorwayOceaniaPakistanPanamaPeruPhilippinesPolandRomaniaRussiaSaudi ArabiaScotlandSerbiaSierra LeoneSingaporeSomaliaSouth AfricaSouth AmericaSouth Central AsiaSouth Eastern AsiaSouthern EuropeSpainSri LankaSt. Vincent and the GrenadinesSudanSwedenSwitzerlandSyriaTaiwanThailandTrinidad and TobagoTurkeyUgandaUkraineUzbekistanVenezuelaVietnamWest IndiesWestern AfricaWestern AsiaWestern EuropeYemenZaire
Immigrant Origin (Percentage)
AfghanistanAfricaAlbaniaArgentinaAsiaAustraliaAustriaBangladeshBarbadosBelarusBosnia and HerzegovinaBrazilBulgariaBurma / MyanmarCameroonCanadaCaribbeanCentral AmericaChinaColombiaCongoCosta RicaCroatiaCubaCzechoslovakiaDominican RepublicEastern AfricaEastern AsiaEastern EuropeEcuadorEgyptEl SalvadorEnglandEritreaEthiopiaEuropeFranceGermanyGhanaGreeceGuatemalaGuyanaHaitiHondurasHong KongHungaryIndiaIndonesiaIranIraqIrelandIsraelItalyJamaicaJapanJordanKazakhstanKenyaKoreaKuwaitLaosLatin AmericaLatviaLebanonLiberiaLithuaniaMalaysiaMexicoMiddle AfricaMoldovaMoroccoNepalNetherlandsNigeriaNorth MacedoniaNorthern AfricaNorthern EuropeNorwayOceaniaPakistanPanamaPeruPhilippinesPolandRomaniaRussiaSaudi ArabiaScotlandSerbiaSierra LeoneSingaporeSomaliaSouth AfricaSouth AmericaSouth Central AsiaSouth Eastern AsiaSouthern EuropeSpainSri LankaSt. Vincent and the GrenadinesSudanSwedenSwitzerlandSyriaTaiwanThailandTrinidad and TobagoTurkeyUgandaUkraineUzbekistanVenezuelaVietnamWest IndiesWestern AfricaWestern AsiaWestern EuropeYemenZaire
Income
Income (Families)
Income (Households)
Poverty
Poverty (Families)
Unemployment
Employment Occupations
Employment Industries
Employer Class
Commute Time
Commute Means
School Enrollment
Education by Degree Field
Occupancy
Finances
Physical Characteristics
Buffalo
Compare Zip Codes
Comparison Subject

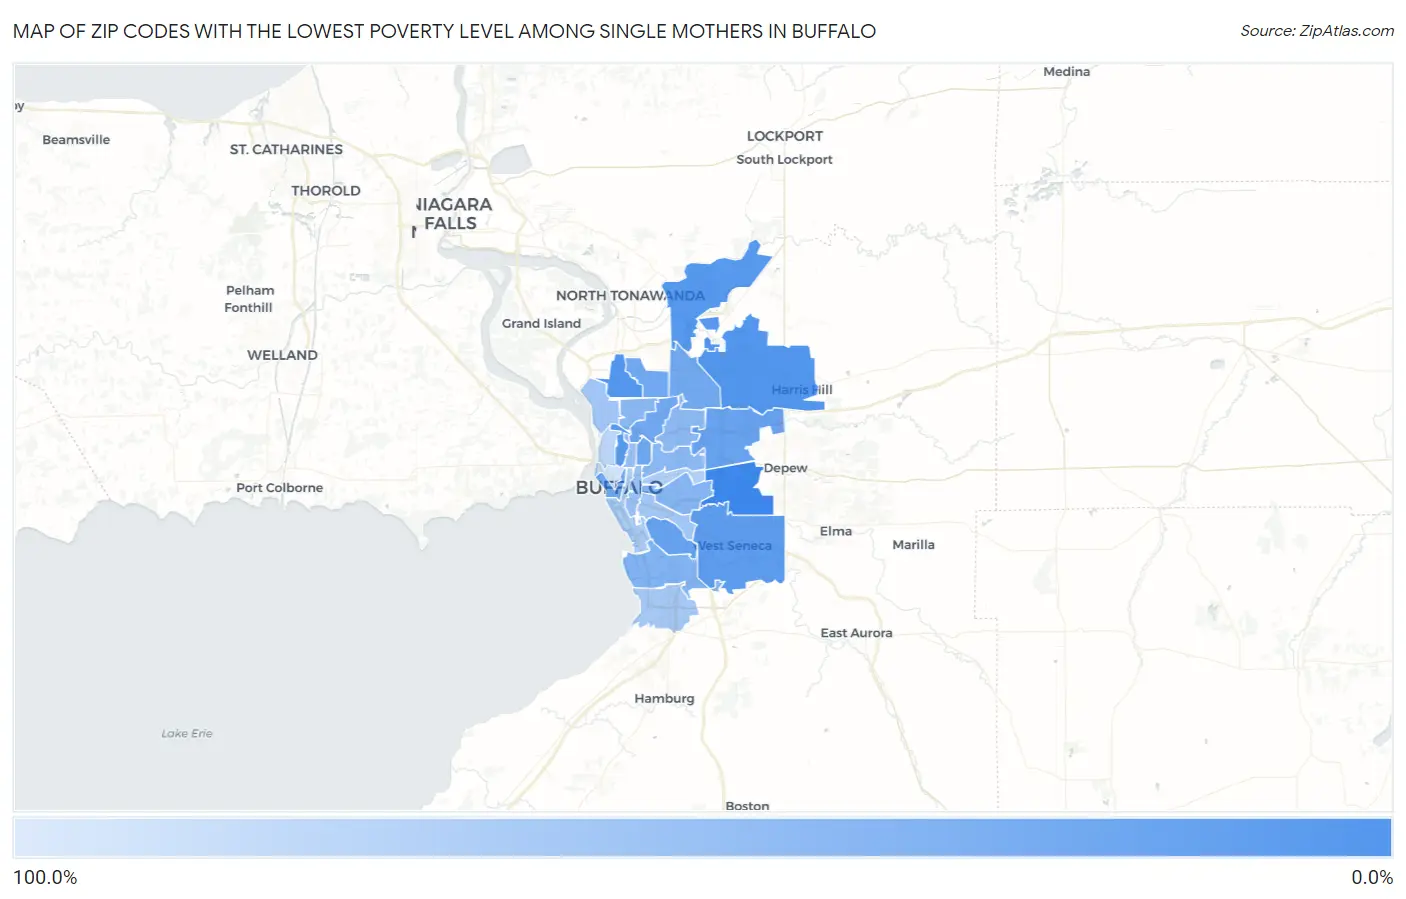
Map of Zip Codes with the Lowest Poverty Level Among Single Mothers in Buffalo

84.2%
4.8%
Zip Codes with the Lowest Poverty Level Among Single Mothers in Buffalo Map

Zip Codes with the Lowest Poverty Level Among Single Mothers in Buffalo, NY

Zip Code Single Mother Poverty vs State vs National
1.142274.8%32.6%(-27.7)#3533.1%(-28.3)#457
2.1422114.0%32.6%(-18.5)#18633.1%(-19.1)#2,965
3.1421714.3%32.6%(-18.2)#19733.1%(-18.8)#3,096
4.1422816.6%32.6%(-15.9)#25033.1%(-16.5)#3,843
5.1422216.7%32.6%(-15.9)#25133.1%(-16.5)#3,849
6.1422419.2%32.6%(-13.4)#30833.1%(-14.0)#4,851
7.1422022.8%32.6%(-9.78)#41733.1%(-10.4)#6,326
8.1422523.7%32.6%(-8.90)#43333.1%(-9.47)#6,654
9.1420825.9%32.6%(-6.67)#47333.1%(-7.24)#7,575
10.1422327.6%32.6%(-5.00)#51233.1%(-5.57)#8,207
11.1421428.4%32.6%(-4.16)#52633.1%(-4.74)#8,538
12.1422629.6%32.6%(-2.97)#55233.1%(-3.54)#9,003
13.1420230.5%32.6%(-2.09)#57833.1%(-2.67)#9,376
14.1421835.8%32.6%(+3.20)#67833.1%(+2.62)#11,516
15.1420638.0%32.6%(+5.39)#71633.1%(+4.82)#12,375
16.1421140.6%32.6%(+8.05)#76933.1%(+7.47)#13,347
17.1421641.0%32.6%(+8.48)#77233.1%(+7.91)#13,484
18.1421542.0%32.6%(+9.43)#78733.1%(+8.85)#13,802
19.1420946.7%32.6%(+14.1)#84633.1%(+13.5)#15,257
20.1420449.8%32.6%(+17.2)#87233.1%(+16.6)#16,058
21.1420753.1%32.6%(+20.5)#91333.1%(+19.9)#17,005
22.1421054.6%32.6%(+22.1)#92833.1%(+21.5)#17,340
23.1421956.1%32.6%(+23.5)#93733.1%(+22.9)#17,655
24.1420359.7%32.6%(+27.1)#97333.1%(+26.6)#18,346
25.1421263.2%32.6%(+30.6)#99733.1%(+30.1)#18,929
26.1421368.6%32.6%(+36.0)#1,02633.1%(+35.5)#19,644
27.1420184.2%32.6%(+51.6)#1,07633.1%(+51.0)#20,915

Common Questions

What are the Top 10 Zip Codes with the Lowest Poverty Level Among Single Mothers in Buffalo, NY?
Top 10 Zip Codes with the Lowest Poverty Level Among Single Mothers in Buffalo, NY are:
#1
4.8%
#2
14.0%
#3
14.3%
#4
16.6%
#5
16.7%
#6
19.2%
#7
22.8%
#8
23.7%
#9
25.9%
#10
27.6%
What zip code has the Lowest Poverty Level Among Single Mothers in Buffalo, NY?
14227 has the Lowest Poverty Level Among Single Mothers in Buffalo, NY with 4.8%.
What is the Poverty Level Among Single Mothers in Buffalo, NY?
Poverty Level Among Single Mothers in Buffalo is 47.4%.
What is the Poverty Level Among Single Mothers in New York?
Poverty Level Among Single Mothers in New York is 32.6%.
What is the Poverty Level Among Single Mothers in the United States?
Poverty Level Among Single Mothers in the United States is 33.1%.