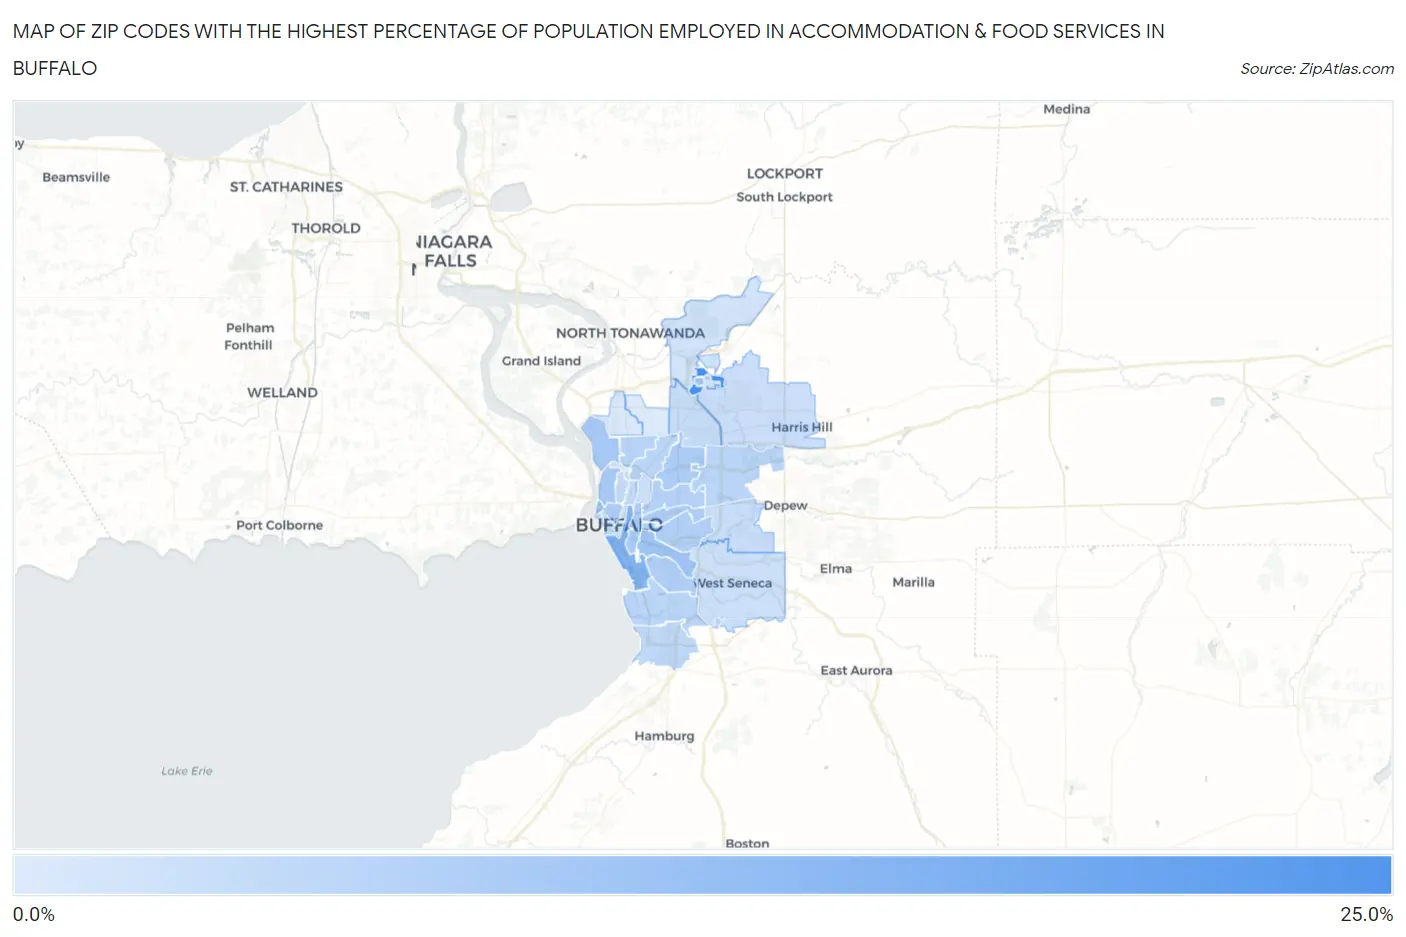
Zip Codes with the Highest Percentage of Population Employed in Accommodation & Food Services in Buffalo, NY
RELATED REPORTS & OPTIONS
Accommodation & Food Services
Buffalo
Compare Zip Codes
Map of Zip Codes with the Highest Percentage of Population Employed in Accommodation & Food Services in Buffalo
3.3%
24.0%
Zip Codes with the Highest Percentage of Population Employed in Accommodation & Food Services in Buffalo, NY
| Zip Code | % Employed | vs State | vs National | |
| 1. | 14261 | 24.0% | 6.2%(+17.9)#29 | 6.9%(+17.1)#554 |
| 2. | 14203 | 14.8% | 6.2%(+8.68)#84 | 6.9%(+7.97)#1,719 |
| 3. | 14260 | 11.9% | 6.2%(+5.79)#139 | 6.9%(+5.07)#2,861 |
| 4. | 14210 | 11.6% | 6.2%(+5.41)#157 | 6.9%(+4.69)#3,109 |
| 5. | 14207 | 10.6% | 6.2%(+4.43)#192 | 6.9%(+3.71)#3,895 |
| 6. | 14213 | 10.1% | 6.2%(+3.93)#213 | 6.9%(+3.21)#4,420 |
| 7. | 14204 | 10.0% | 6.2%(+3.86)#217 | 6.9%(+3.14)#4,511 |
| 8. | 14201 | 9.7% | 6.2%(+3.56)#241 | 6.9%(+2.84)#4,900 |
| 9. | 14212 | 9.6% | 6.2%(+3.48)#247 | 6.9%(+2.77)#4,996 |
| 10. | 14215 | 9.5% | 6.2%(+3.32)#259 | 6.9%(+2.61)#5,226 |
| 11. | 14220 | 9.4% | 6.2%(+3.23)#263 | 6.9%(+2.51)#5,366 |
| 12. | 14206 | 9.0% | 6.2%(+2.87)#286 | 6.9%(+2.15)#5,905 |
| 13. | 14211 | 8.8% | 6.2%(+2.62)#309 | 6.9%(+1.91)#6,303 |
| 14. | 14216 | 8.0% | 6.2%(+1.85)#374 | 6.9%(+1.14)#7,784 |
| 15. | 14214 | 7.7% | 6.2%(+1.58)#400 | 6.9%(+0.868)#8,371 |
| 16. | 14218 | 7.7% | 6.2%(+1.53)#406 | 6.9%(+0.815)#8,500 |
| 17. | 14225 | 7.6% | 6.2%(+1.48)#408 | 6.9%(+0.767)#8,630 |
| 18. | 14219 | 7.2% | 6.2%(+1.06)#469 | 6.9%(+0.341)#9,750 |
| 19. | 14222 | 6.7% | 6.2%(+0.486)#538 | 6.9%(-0.231)#11,356 |
| 20. | 14209 | 6.4% | 6.2%(+0.262)#569 | 6.9%(-0.455)#12,075 |
| 21. | 14226 | 6.2% | 6.2%(+0.084)#612 | 6.9%(-0.633)#12,650 |
| 22. | 14227 | 5.9% | 6.2%(-0.308)#693 | 6.9%(-1.02)#13,933 |
| 23. | 14221 | 5.6% | 6.2%(-0.570)#733 | 6.9%(-1.29)#14,718 |
| 24. | 14208 | 5.6% | 6.2%(-0.611)#741 | 6.9%(-1.33)#14,887 |
| 25. | 14224 | 5.2% | 6.2%(-0.930)#823 | 6.9%(-1.65)#15,992 |
| 26. | 14228 | 4.8% | 6.2%(-1.38)#919 | 6.9%(-2.09)#17,527 |
| 27. | 14202 | 4.1% | 6.2%(-2.07)#1,067 | 6.9%(-2.79)#19,827 |
| 28. | 14217 | 3.5% | 6.2%(-2.68)#1,176 | 6.9%(-3.39)#21,813 |
| 29. | 14223 | 3.3% | 6.2%(-2.84)#1,197 | 6.9%(-3.56)#22,318 |
1
Common Questions
What are the Top 10 Zip Codes with the Highest Percentage of Population Employed in Accommodation & Food Services in Buffalo, NY?
Top 10 Zip Codes with the Highest Percentage of Population Employed in Accommodation & Food Services in Buffalo, NY are:
What zip code has the Highest Percentage of Population Employed in Accommodation & Food Services in Buffalo, NY?
14261 has the Highest Percentage of Population Employed in Accommodation & Food Services in Buffalo, NY with 24.0%.
What is the Percentage of Population Employed in Accommodation & Food Services in Buffalo, NY?
Percentage of Population Employed in Accommodation & Food Services in Buffalo is 8.7%.
What is the Percentage of Population Employed in Accommodation & Food Services in New York?
Percentage of Population Employed in Accommodation & Food Services in New York is 6.2%.
What is the Percentage of Population Employed in Accommodation & Food Services in the United States?
Percentage of Population Employed in Accommodation & Food Services in the United States is 6.9%.