Zip Codes with the Highest Percentage of Not-for-profit Organizations in Buffalo, NY

RELATED REPORTS & OPTIONS

Not-for-profit Organizations
Population
Families and Households
Female Fertility
Female Fertility (Unmarried)
Race (Community Size)
Race (Percentage)
Ancestry (Community Size)
AfghanAfricanAlbanianAlsatianAmericanArabArgentineanArmenianAustralianAustrianBahamianBarbadianBelgianBelizeanBhutaneseBlackfeetBolivianBrazilianBritishBritish West IndianBulgarianBurmeseCajunCambodianCanadianCarpatho RusynCelticCentral AmericanCentral American IndianCherokeeChileanChippewaColombianCosta RicanCreekCroatianCubanCzechCzechoslovakianDanishDominicanDutchDutch West IndianEastern EuropeanEcuadorianEgyptianEnglishEstonianEthiopianEuropeanFilipinoFinnishFrenchFrench American IndianFrench CanadianGermanGerman RussianGhanaianGreekGuamanian / ChamorroGuatemalanGuyaneseHaitianHonduranHungarianIcelanderIndian (Asian)IndonesianIranianIraqiIrishIroquoisIsraeliItalianJamaicanJapaneseJordanianKenyanKoreanLaotianLatvianLebaneseLithuanianMacedonianMalaysianMalteseMexicanMexican American IndianMongolianMoroccanNative HawaiianNavajoNicaraguanNigerianNorthern EuropeanNorwegianOkinawanPakistaniPalestinianPanamanianPennsylvania GermanPeruvianPolishPortuguesePuerto RicanRomanianRussianSalvadoranSamoanScandinavianScotch-IrishScottishSerbianSiouxSlavicSlovakSloveneSomaliSouth AfricanSouth AmericanSouth American IndianSpaniardSpanishSri LankanSubsaharan AfricanSudaneseSwedishSwissSyrianTaiwaneseThaiTrinidadian and TobagonianTurkishUkrainianVenezuelanVietnameseWelshWest IndianYugoslavian
Ancestry (Percentage)
AfghanAfricanAlbanianAlsatianAmericanArabArgentineanArmenianAustralianAustrianBahamianBarbadianBelgianBelizeanBhutaneseBlackfeetBolivianBrazilianBritishBritish West IndianBulgarianBurmeseCajunCambodianCanadianCarpatho RusynCelticCentral AmericanCentral American IndianCherokeeChileanChippewaColombianCosta RicanCreekCroatianCubanCzechCzechoslovakianDanishDominicanDutchDutch West IndianEastern EuropeanEcuadorianEgyptianEnglishEstonianEthiopianEuropeanFilipinoFinnishFrenchFrench American IndianFrench CanadianGermanGerman RussianGhanaianGreekGuamanian / ChamorroGuatemalanGuyaneseHaitianHonduranHungarianIcelanderIndian (Asian)IndonesianIranianIraqiIrishIroquoisIsraeliItalianJamaicanJapaneseJordanianKenyanKoreanLaotianLatvianLebaneseLithuanianMacedonianMalaysianMalteseMexicanMexican American IndianMongolianMoroccanNative HawaiianNavajoNicaraguanNigerianNorthern EuropeanNorwegianOkinawanPakistaniPalestinianPanamanianPennsylvania GermanPeruvianPolishPortuguesePuerto RicanRomanianRussianSalvadoranSamoanScandinavianScotch-IrishScottishSerbianSiouxSlavicSlovakSloveneSomaliSouth AfricanSouth AmericanSouth American IndianSpaniardSpanishSri LankanSubsaharan AfricanSudaneseSwedishSwissSyrianTaiwaneseThaiTrinidadian and TobagonianTurkishUkrainianVenezuelanVietnameseWelshWest IndianYugoslavian
Immigrant Origin (Total)
AfghanistanAfricaAlbaniaArgentinaAsiaAustraliaAustriaBangladeshBarbadosBelarusBosnia and HerzegovinaBrazilBulgariaBurma / MyanmarCameroonCanadaCaribbeanCentral AmericaChinaColombiaCongoCosta RicaCroatiaCubaCzechoslovakiaDominican RepublicEastern AfricaEastern AsiaEastern EuropeEcuadorEgyptEl SalvadorEnglandEritreaEthiopiaEuropeFranceGermanyGhanaGreeceGuatemalaGuyanaHaitiHondurasHong KongHungaryIndiaIndonesiaIranIraqIrelandIsraelItalyJamaicaJapanJordanKazakhstanKenyaKoreaKuwaitLaosLatin AmericaLatviaLebanonLiberiaLithuaniaMalaysiaMexicoMiddle AfricaMoldovaMoroccoNepalNetherlandsNigeriaNorth MacedoniaNorthern AfricaNorthern EuropeNorwayOceaniaPakistanPanamaPeruPhilippinesPolandRomaniaRussiaSaudi ArabiaScotlandSerbiaSierra LeoneSingaporeSomaliaSouth AfricaSouth AmericaSouth Central AsiaSouth Eastern AsiaSouthern EuropeSpainSri LankaSt. Vincent and the GrenadinesSudanSwedenSwitzerlandSyriaTaiwanThailandTrinidad and TobagoTurkeyUgandaUkraineUzbekistanVenezuelaVietnamWest IndiesWestern AfricaWestern AsiaWestern EuropeYemenZaire
Immigrant Origin (Percentage)
AfghanistanAfricaAlbaniaArgentinaAsiaAustraliaAustriaBangladeshBarbadosBelarusBosnia and HerzegovinaBrazilBulgariaBurma / MyanmarCameroonCanadaCaribbeanCentral AmericaChinaColombiaCongoCosta RicaCroatiaCubaCzechoslovakiaDominican RepublicEastern AfricaEastern AsiaEastern EuropeEcuadorEgyptEl SalvadorEnglandEritreaEthiopiaEuropeFranceGermanyGhanaGreeceGuatemalaGuyanaHaitiHondurasHong KongHungaryIndiaIndonesiaIranIraqIrelandIsraelItalyJamaicaJapanJordanKazakhstanKenyaKoreaKuwaitLaosLatin AmericaLatviaLebanonLiberiaLithuaniaMalaysiaMexicoMiddle AfricaMoldovaMoroccoNepalNetherlandsNigeriaNorth MacedoniaNorthern AfricaNorthern EuropeNorwayOceaniaPakistanPanamaPeruPhilippinesPolandRomaniaRussiaSaudi ArabiaScotlandSerbiaSierra LeoneSingaporeSomaliaSouth AfricaSouth AmericaSouth Central AsiaSouth Eastern AsiaSouthern EuropeSpainSri LankaSt. Vincent and the GrenadinesSudanSwedenSwitzerlandSyriaTaiwanThailandTrinidad and TobagoTurkeyUgandaUkraineUzbekistanVenezuelaVietnamWest IndiesWestern AfricaWestern AsiaWestern EuropeYemenZaire
Income
Income (Families)
Income (Households)
Poverty
Poverty (Families)
Unemployment
Employment Occupations
Employment Industries
Employer Class
Commute Time
Commute Means
School Enrollment
Education by Degree Field
Occupancy
Finances
Physical Characteristics
Buffalo
Compare Zip Codes
Comparison Subject

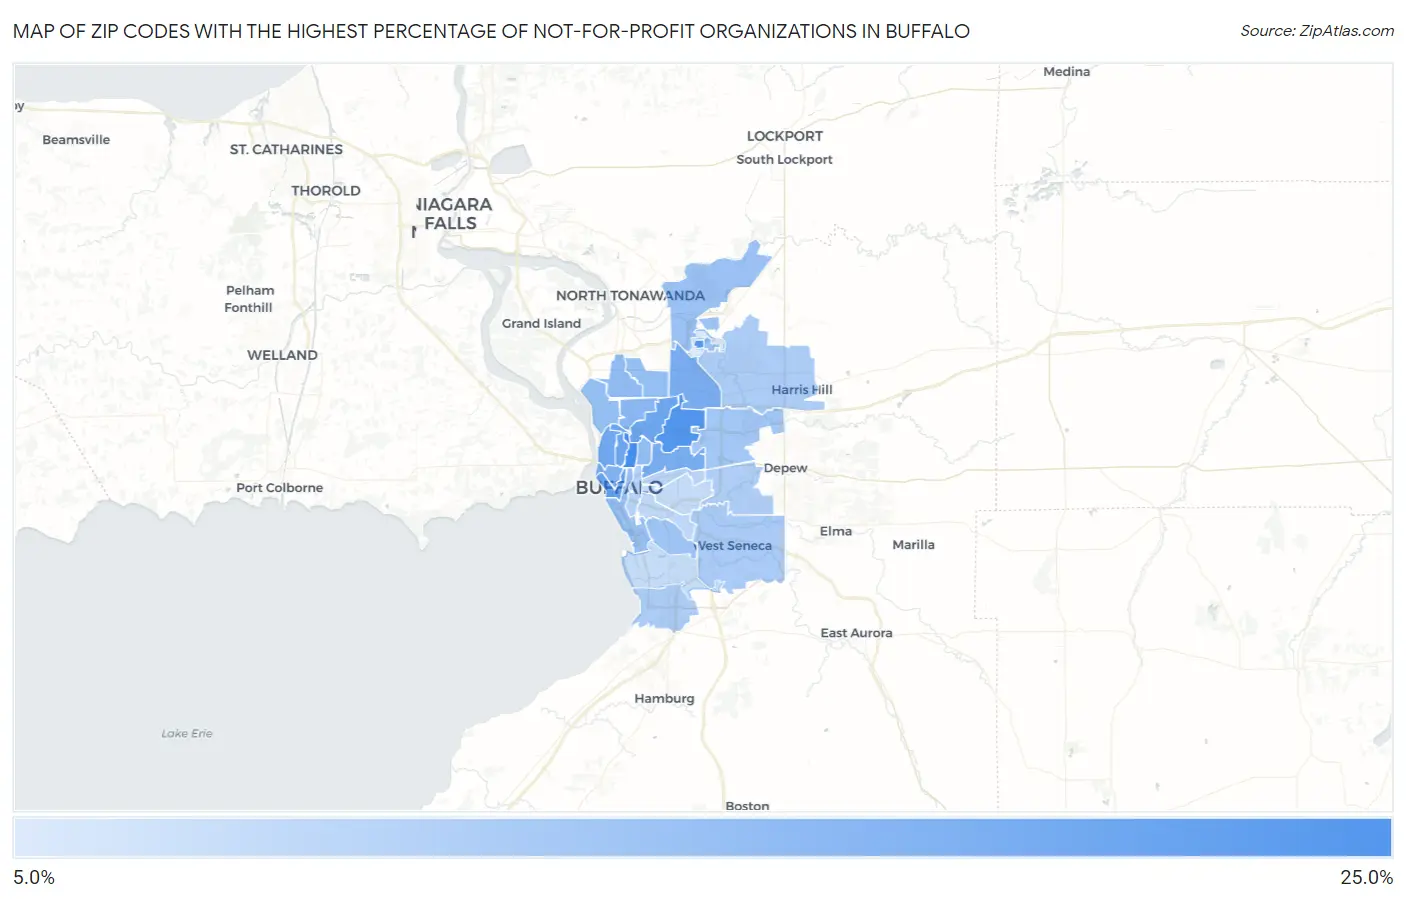
Map of Zip Codes with the Highest Percentage of Not-for-profit Organizations in Buffalo

0.0%
25.0%
Zip Codes with the Highest Percentage of Not-for-profit Organizations in Buffalo Map

Zip Codes with the Highest Percentage of Not-for-profit Organizations in Buffalo, NY

Zip Code % Employed in Not-for-profit vs State vs National
1.1420921.8%11.3%(+10.5)#1148.4%(+13.4)#1,033
2.1421520.4%11.3%(+9.01)#1448.4%(+11.9)#1,232
3.1426020.3%11.3%(+8.91)#1488.4%(+11.8)#1,251
4.1420217.6%11.3%(+6.29)#2088.4%(+9.20)#1,815
5.1422217.6%11.3%(+6.23)#2118.4%(+9.13)#1,840
6.1421417.1%11.3%(+5.79)#2338.4%(+8.69)#1,983
7.1421317.1%11.3%(+5.73)#2388.4%(+8.63)#2,001
8.1421116.1%11.3%(+4.78)#2748.4%(+7.69)#2,392
9.1422615.9%11.3%(+4.56)#2848.4%(+7.46)#2,484
10.1420115.2%11.3%(+3.86)#3308.4%(+6.76)#2,826
11.1421614.1%11.3%(+2.78)#3998.4%(+5.68)#3,479
12.1421713.3%11.3%(+1.97)#4928.4%(+4.88)#4,207
13.1420813.0%11.3%(+1.62)#5208.4%(+4.53)#4,532
14.1422312.8%11.3%(+1.48)#5338.4%(+4.38)#4,673
15.1420712.8%11.3%(+1.42)#5448.4%(+4.32)#4,753
16.1422812.4%11.3%(+1.01)#5798.4%(+3.91)#5,197
17.1420312.1%11.3%(+0.789)#6078.4%(+3.69)#5,460
18.1422011.8%11.3%(+0.431)#6538.4%(+3.33)#5,921
19.1422511.3%11.3%(-0.077)#7168.4%(+2.83)#6,630
20.1422410.6%11.3%(-0.763)#8048.4%(+2.14)#7,758
21.1422110.3%11.3%(-1.07)#8558.4%(+1.83)#8,356
22.1421910.2%11.3%(-1.17)#8778.4%(+1.73)#8,549
23.1422710.0%11.3%(-1.30)#8968.4%(+1.60)#8,819
24.142049.4%11.3%(-1.95)#9928.4%(+0.952)#10,176
25.142128.9%11.3%(-2.40)#1,0738.4%(+0.502)#11,187
26.142108.2%11.3%(-3.10)#1,1698.4%(-0.200)#12,976
27.142067.7%11.3%(-3.62)#1,2328.4%(-0.713)#14,383
28.142187.7%11.3%(-3.67)#1,2438.4%(-0.767)#14,535
29.142615.2%11.3%(-6.18)#1,4738.4%(-3.28)#21,888

Common Questions

What are the Top 10 Zip Codes with the Highest Percentage of Not-for-profit Organizations in Buffalo, NY?
Top 10 Zip Codes with the Highest Percentage of Not-for-profit Organizations in Buffalo, NY are:
#1
21.8%
#2
20.4%
#3
20.3%
#4
17.6%
#5
17.6%
#6
17.1%
#7
17.1%
#8
16.1%
#9
15.9%
#10
15.2%
What zip code has the Highest Percentage of Not-for-profit Organizations in Buffalo, NY?
14209 has the Highest Percentage of Not-for-profit Organizations in Buffalo, NY with 21.8%.
What is the Percentage of Not-for-profit Organizations in Buffalo, NY?
Percentage of Not-for-profit Organizations in Buffalo is 15.1%.
What is the Percentage of Not-for-profit Organizations in New York?
Percentage of Not-for-profit Organizations in New York is 11.3%.
What is the Percentage of Not-for-profit Organizations in the United States?
Percentage of Not-for-profit Organizations in the United States is 8.4%.