Zip Codes with the Highest Percentage of Self-Employed / Not Incorporated in Buffalo, NY

RELATED REPORTS & OPTIONS

Self-Employed / Not Incorporated
Population
Families and Households
Female Fertility
Female Fertility (Unmarried)
Race (Community Size)
Race (Percentage)
Ancestry (Community Size)
AfghanAfricanAlbanianAlsatianAmericanArabArgentineanArmenianAustralianAustrianBahamianBarbadianBelgianBelizeanBhutaneseBlackfeetBolivianBrazilianBritishBritish West IndianBulgarianBurmeseCajunCambodianCanadianCarpatho RusynCelticCentral AmericanCentral American IndianCherokeeChileanChippewaColombianCosta RicanCreekCroatianCubanCzechCzechoslovakianDanishDominicanDutchDutch West IndianEastern EuropeanEcuadorianEgyptianEnglishEstonianEthiopianEuropeanFilipinoFinnishFrenchFrench American IndianFrench CanadianGermanGerman RussianGhanaianGreekGuamanian / ChamorroGuatemalanGuyaneseHaitianHonduranHungarianIcelanderIndian (Asian)IndonesianIranianIraqiIrishIroquoisIsraeliItalianJamaicanJapaneseJordanianKenyanKoreanLaotianLatvianLebaneseLithuanianMacedonianMalaysianMalteseMexicanMexican American IndianMongolianMoroccanNative HawaiianNavajoNicaraguanNigerianNorthern EuropeanNorwegianOkinawanPakistaniPalestinianPanamanianPennsylvania GermanPeruvianPolishPortuguesePuerto RicanRomanianRussianSalvadoranSamoanScandinavianScotch-IrishScottishSerbianSiouxSlavicSlovakSloveneSomaliSouth AfricanSouth AmericanSouth American IndianSpaniardSpanishSri LankanSubsaharan AfricanSudaneseSwedishSwissSyrianTaiwaneseThaiTrinidadian and TobagonianTurkishUkrainianVenezuelanVietnameseWelshWest IndianYugoslavian
Ancestry (Percentage)
AfghanAfricanAlbanianAlsatianAmericanArabArgentineanArmenianAustralianAustrianBahamianBarbadianBelgianBelizeanBhutaneseBlackfeetBolivianBrazilianBritishBritish West IndianBulgarianBurmeseCajunCambodianCanadianCarpatho RusynCelticCentral AmericanCentral American IndianCherokeeChileanChippewaColombianCosta RicanCreekCroatianCubanCzechCzechoslovakianDanishDominicanDutchDutch West IndianEastern EuropeanEcuadorianEgyptianEnglishEstonianEthiopianEuropeanFilipinoFinnishFrenchFrench American IndianFrench CanadianGermanGerman RussianGhanaianGreekGuamanian / ChamorroGuatemalanGuyaneseHaitianHonduranHungarianIcelanderIndian (Asian)IndonesianIranianIraqiIrishIroquoisIsraeliItalianJamaicanJapaneseJordanianKenyanKoreanLaotianLatvianLebaneseLithuanianMacedonianMalaysianMalteseMexicanMexican American IndianMongolianMoroccanNative HawaiianNavajoNicaraguanNigerianNorthern EuropeanNorwegianOkinawanPakistaniPalestinianPanamanianPennsylvania GermanPeruvianPolishPortuguesePuerto RicanRomanianRussianSalvadoranSamoanScandinavianScotch-IrishScottishSerbianSiouxSlavicSlovakSloveneSomaliSouth AfricanSouth AmericanSouth American IndianSpaniardSpanishSri LankanSubsaharan AfricanSudaneseSwedishSwissSyrianTaiwaneseThaiTrinidadian and TobagonianTurkishUkrainianVenezuelanVietnameseWelshWest IndianYugoslavian
Immigrant Origin (Total)
AfghanistanAfricaAlbaniaArgentinaAsiaAustraliaAustriaBangladeshBarbadosBelarusBosnia and HerzegovinaBrazilBulgariaBurma / MyanmarCameroonCanadaCaribbeanCentral AmericaChinaColombiaCongoCosta RicaCroatiaCubaCzechoslovakiaDominican RepublicEastern AfricaEastern AsiaEastern EuropeEcuadorEgyptEl SalvadorEnglandEritreaEthiopiaEuropeFranceGermanyGhanaGreeceGuatemalaGuyanaHaitiHondurasHong KongHungaryIndiaIndonesiaIranIraqIrelandIsraelItalyJamaicaJapanJordanKazakhstanKenyaKoreaKuwaitLaosLatin AmericaLatviaLebanonLiberiaLithuaniaMalaysiaMexicoMiddle AfricaMoldovaMoroccoNepalNetherlandsNigeriaNorth MacedoniaNorthern AfricaNorthern EuropeNorwayOceaniaPakistanPanamaPeruPhilippinesPolandRomaniaRussiaSaudi ArabiaScotlandSerbiaSierra LeoneSingaporeSomaliaSouth AfricaSouth AmericaSouth Central AsiaSouth Eastern AsiaSouthern EuropeSpainSri LankaSt. Vincent and the GrenadinesSudanSwedenSwitzerlandSyriaTaiwanThailandTrinidad and TobagoTurkeyUgandaUkraineUzbekistanVenezuelaVietnamWest IndiesWestern AfricaWestern AsiaWestern EuropeYemenZaire
Immigrant Origin (Percentage)
AfghanistanAfricaAlbaniaArgentinaAsiaAustraliaAustriaBangladeshBarbadosBelarusBosnia and HerzegovinaBrazilBulgariaBurma / MyanmarCameroonCanadaCaribbeanCentral AmericaChinaColombiaCongoCosta RicaCroatiaCubaCzechoslovakiaDominican RepublicEastern AfricaEastern AsiaEastern EuropeEcuadorEgyptEl SalvadorEnglandEritreaEthiopiaEuropeFranceGermanyGhanaGreeceGuatemalaGuyanaHaitiHondurasHong KongHungaryIndiaIndonesiaIranIraqIrelandIsraelItalyJamaicaJapanJordanKazakhstanKenyaKoreaKuwaitLaosLatin AmericaLatviaLebanonLiberiaLithuaniaMalaysiaMexicoMiddle AfricaMoldovaMoroccoNepalNetherlandsNigeriaNorth MacedoniaNorthern AfricaNorthern EuropeNorwayOceaniaPakistanPanamaPeruPhilippinesPolandRomaniaRussiaSaudi ArabiaScotlandSerbiaSierra LeoneSingaporeSomaliaSouth AfricaSouth AmericaSouth Central AsiaSouth Eastern AsiaSouthern EuropeSpainSri LankaSt. Vincent and the GrenadinesSudanSwedenSwitzerlandSyriaTaiwanThailandTrinidad and TobagoTurkeyUgandaUkraineUzbekistanVenezuelaVietnamWest IndiesWestern AfricaWestern AsiaWestern EuropeYemenZaire
Income
Income (Families)
Income (Households)
Poverty
Poverty (Families)
Unemployment
Employment Occupations
Employment Industries
Employer Class
Commute Time
Commute Means
School Enrollment
Education by Degree Field
Occupancy
Finances
Physical Characteristics
Buffalo
Compare Zip Codes
Comparison Subject

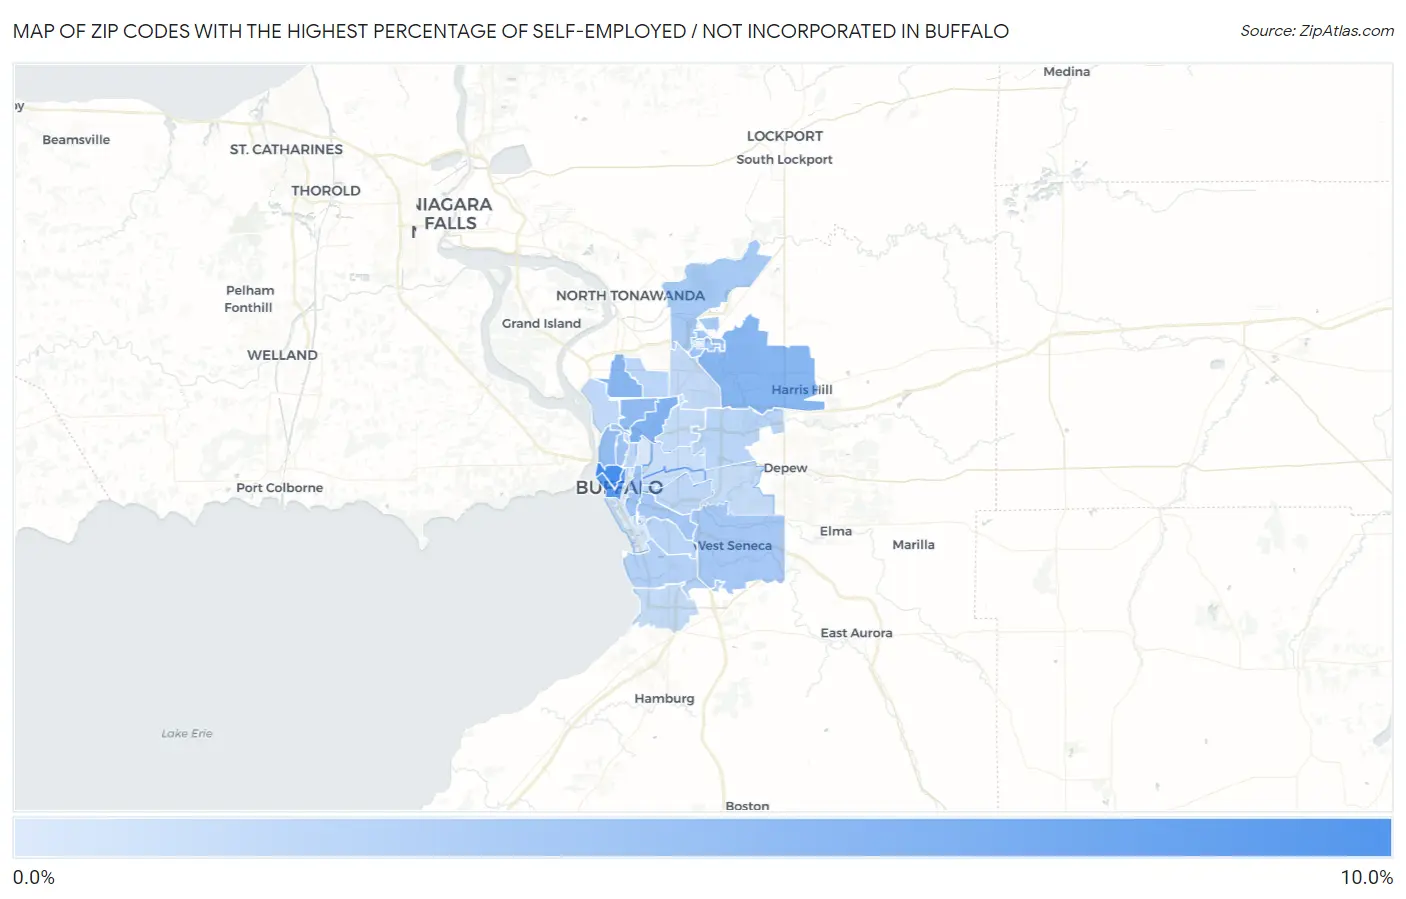
Map of Zip Codes with the Highest Percentage of Self-Employed / Not Incorporated in Buffalo

0.0%
10.0%
Zip Codes with the Highest Percentage of Self-Employed / Not Incorporated in Buffalo Map

Zip Codes with the Highest Percentage of Self-Employed / Not Incorporated in Buffalo, NY

Zip Code % Self-Employed / Not Incorporated vs State vs National
1.142018.7%5.5%(+3.25)#3865.8%(+2.93)#9,238
2.142027.8%5.5%(+2.33)#4845.8%(+2.01)#11,009
3.142145.8%5.5%(+0.354)#7745.8%(+0.033)#16,554
4.142175.5%5.5%(+0.028)#8455.8%(-0.293)#17,696
5.142215.5%5.5%(-0.029)#8555.8%(-0.349)#17,887
6.142165.0%5.5%(-0.460)#9565.8%(-0.781)#19,535
7.142134.9%5.5%(-0.553)#9745.8%(-0.874)#19,880
8.142224.4%5.5%(-1.14)#1,1135.8%(-1.46)#22,118
9.142044.2%5.5%(-1.29)#1,1515.8%(-1.61)#22,672
10.142614.2%5.5%(-1.30)#1,1525.8%(-1.62)#22,686
11.142104.0%5.5%(-1.46)#1,1925.8%(-1.78)#23,279
12.142244.0%5.5%(-1.47)#1,1945.8%(-1.79)#23,291
13.142283.9%5.5%(-1.58)#1,2215.8%(-1.90)#23,681
14.142183.4%5.5%(-2.10)#1,3235.8%(-2.42)#25,313
15.142253.1%5.5%(-2.43)#1,3775.8%(-2.75)#26,210
16.142203.0%5.5%(-2.50)#1,3895.8%(-2.82)#26,379
17.142233.0%5.5%(-2.51)#1,3925.8%(-2.83)#26,402
18.142062.9%5.5%(-2.61)#1,4045.8%(-2.93)#26,643
19.142092.8%5.5%(-2.73)#1,4285.8%(-3.05)#26,904
20.142072.7%5.5%(-2.75)#1,4335.8%(-3.07)#26,948
21.142262.7%5.5%(-2.84)#1,4475.8%(-3.16)#27,120
22.142192.6%5.5%(-2.92)#1,4545.8%(-3.24)#27,282
23.142152.6%5.5%(-2.92)#1,4555.8%(-3.24)#27,291
24.142272.4%5.5%(-3.05)#1,4645.8%(-3.37)#27,504
25.142122.4%5.5%(-3.12)#1,4715.8%(-3.44)#27,614
26.142112.3%5.5%(-3.15)#1,4795.8%(-3.47)#27,672
27.142081.5%5.5%(-3.95)#1,5385.8%(-4.27)#28,695
28.142031.3%5.5%(-4.15)#1,5495.8%(-4.47)#28,867

Common Questions

What are the Top 10 Zip Codes with the Highest Percentage of Self-Employed / Not Incorporated in Buffalo, NY?
Top 10 Zip Codes with the Highest Percentage of Self-Employed / Not Incorporated in Buffalo, NY are:
#1
8.7%
#2
7.8%
#3
5.8%
#4
5.5%
#5
5.5%
#6
5.0%
#7
4.9%
#8
4.4%
#9
4.2%
#10
4.2%
What zip code has the Highest Percentage of Self-Employed / Not Incorporated in Buffalo, NY?
14201 has the Highest Percentage of Self-Employed / Not Incorporated in Buffalo, NY with 8.7%.
What is the Percentage of Self-Employed / Not Incorporated in Buffalo, NY?
Percentage of Self-Employed / Not Incorporated in Buffalo is 3.9%.
What is the Percentage of Self-Employed / Not Incorporated in New York?
Percentage of Self-Employed / Not Incorporated in New York is 5.5%.
What is the Percentage of Self-Employed / Not Incorporated in the United States?
Percentage of Self-Employed / Not Incorporated in the United States is 5.8%.