Zip Codes with the Highest Percentage of Population Taking Taxi / Cab to Work in Buffalo, NY

RELATED REPORTS & OPTIONS

Taxi / Cab
Population
Families and Households
Female Fertility
Female Fertility (Unmarried)
Race (Community Size)
Race (Percentage)
Ancestry (Community Size)
AfghanAfricanAlbanianAlsatianAmericanArabArgentineanArmenianAustralianAustrianBahamianBarbadianBelgianBelizeanBhutaneseBlackfeetBolivianBrazilianBritishBritish West IndianBulgarianBurmeseCajunCambodianCanadianCarpatho RusynCelticCentral AmericanCentral American IndianCherokeeChileanChippewaColombianCosta RicanCreekCroatianCubanCzechCzechoslovakianDanishDominicanDutchDutch West IndianEastern EuropeanEcuadorianEgyptianEnglishEstonianEthiopianEuropeanFilipinoFinnishFrenchFrench American IndianFrench CanadianGermanGerman RussianGhanaianGreekGuamanian / ChamorroGuatemalanGuyaneseHaitianHonduranHungarianIcelanderIndian (Asian)IndonesianIranianIraqiIrishIroquoisIsraeliItalianJamaicanJapaneseJordanianKenyanKoreanLaotianLatvianLebaneseLithuanianMacedonianMalaysianMalteseMexicanMexican American IndianMongolianMoroccanNative HawaiianNavajoNicaraguanNigerianNorthern EuropeanNorwegianOkinawanPakistaniPalestinianPanamanianPennsylvania GermanPeruvianPolishPortuguesePuerto RicanRomanianRussianSalvadoranSamoanScandinavianScotch-IrishScottishSerbianSiouxSlavicSlovakSloveneSomaliSouth AfricanSouth AmericanSouth American IndianSpaniardSpanishSri LankanSubsaharan AfricanSudaneseSwedishSwissSyrianTaiwaneseThaiTrinidadian and TobagonianTurkishUkrainianVenezuelanVietnameseWelshWest IndianYugoslavian
Ancestry (Percentage)
AfghanAfricanAlbanianAlsatianAmericanArabArgentineanArmenianAustralianAustrianBahamianBarbadianBelgianBelizeanBhutaneseBlackfeetBolivianBrazilianBritishBritish West IndianBulgarianBurmeseCajunCambodianCanadianCarpatho RusynCelticCentral AmericanCentral American IndianCherokeeChileanChippewaColombianCosta RicanCreekCroatianCubanCzechCzechoslovakianDanishDominicanDutchDutch West IndianEastern EuropeanEcuadorianEgyptianEnglishEstonianEthiopianEuropeanFilipinoFinnishFrenchFrench American IndianFrench CanadianGermanGerman RussianGhanaianGreekGuamanian / ChamorroGuatemalanGuyaneseHaitianHonduranHungarianIcelanderIndian (Asian)IndonesianIranianIraqiIrishIroquoisIsraeliItalianJamaicanJapaneseJordanianKenyanKoreanLaotianLatvianLebaneseLithuanianMacedonianMalaysianMalteseMexicanMexican American IndianMongolianMoroccanNative HawaiianNavajoNicaraguanNigerianNorthern EuropeanNorwegianOkinawanPakistaniPalestinianPanamanianPennsylvania GermanPeruvianPolishPortuguesePuerto RicanRomanianRussianSalvadoranSamoanScandinavianScotch-IrishScottishSerbianSiouxSlavicSlovakSloveneSomaliSouth AfricanSouth AmericanSouth American IndianSpaniardSpanishSri LankanSubsaharan AfricanSudaneseSwedishSwissSyrianTaiwaneseThaiTrinidadian and TobagonianTurkishUkrainianVenezuelanVietnameseWelshWest IndianYugoslavian
Immigrant Origin (Total)
AfghanistanAfricaAlbaniaArgentinaAsiaAustraliaAustriaBangladeshBarbadosBelarusBosnia and HerzegovinaBrazilBulgariaBurma / MyanmarCameroonCanadaCaribbeanCentral AmericaChinaColombiaCongoCosta RicaCroatiaCubaCzechoslovakiaDominican RepublicEastern AfricaEastern AsiaEastern EuropeEcuadorEgyptEl SalvadorEnglandEritreaEthiopiaEuropeFranceGermanyGhanaGreeceGuatemalaGuyanaHaitiHondurasHong KongHungaryIndiaIndonesiaIranIraqIrelandIsraelItalyJamaicaJapanJordanKazakhstanKenyaKoreaKuwaitLaosLatin AmericaLatviaLebanonLiberiaLithuaniaMalaysiaMexicoMiddle AfricaMoldovaMoroccoNepalNetherlandsNigeriaNorth MacedoniaNorthern AfricaNorthern EuropeNorwayOceaniaPakistanPanamaPeruPhilippinesPolandRomaniaRussiaSaudi ArabiaScotlandSerbiaSierra LeoneSingaporeSomaliaSouth AfricaSouth AmericaSouth Central AsiaSouth Eastern AsiaSouthern EuropeSpainSri LankaSt. Vincent and the GrenadinesSudanSwedenSwitzerlandSyriaTaiwanThailandTrinidad and TobagoTurkeyUgandaUkraineUzbekistanVenezuelaVietnamWest IndiesWestern AfricaWestern AsiaWestern EuropeYemenZaire
Immigrant Origin (Percentage)
AfghanistanAfricaAlbaniaArgentinaAsiaAustraliaAustriaBangladeshBarbadosBelarusBosnia and HerzegovinaBrazilBulgariaBurma / MyanmarCameroonCanadaCaribbeanCentral AmericaChinaColombiaCongoCosta RicaCroatiaCubaCzechoslovakiaDominican RepublicEastern AfricaEastern AsiaEastern EuropeEcuadorEgyptEl SalvadorEnglandEritreaEthiopiaEuropeFranceGermanyGhanaGreeceGuatemalaGuyanaHaitiHondurasHong KongHungaryIndiaIndonesiaIranIraqIrelandIsraelItalyJamaicaJapanJordanKazakhstanKenyaKoreaKuwaitLaosLatin AmericaLatviaLebanonLiberiaLithuaniaMalaysiaMexicoMiddle AfricaMoldovaMoroccoNepalNetherlandsNigeriaNorth MacedoniaNorthern AfricaNorthern EuropeNorwayOceaniaPakistanPanamaPeruPhilippinesPolandRomaniaRussiaSaudi ArabiaScotlandSerbiaSierra LeoneSingaporeSomaliaSouth AfricaSouth AmericaSouth Central AsiaSouth Eastern AsiaSouthern EuropeSpainSri LankaSt. Vincent and the GrenadinesSudanSwedenSwitzerlandSyriaTaiwanThailandTrinidad and TobagoTurkeyUgandaUkraineUzbekistanVenezuelaVietnamWest IndiesWestern AfricaWestern AsiaWestern EuropeYemenZaire
Income
Income (Families)
Income (Households)
Poverty
Poverty (Families)
Unemployment
Employment Occupations
Employment Industries
Employer Class
Commute Time
Commute Means
School Enrollment
Education by Degree Field
Occupancy
Finances
Physical Characteristics
Buffalo
Compare Zip Codes
Comparison Subject

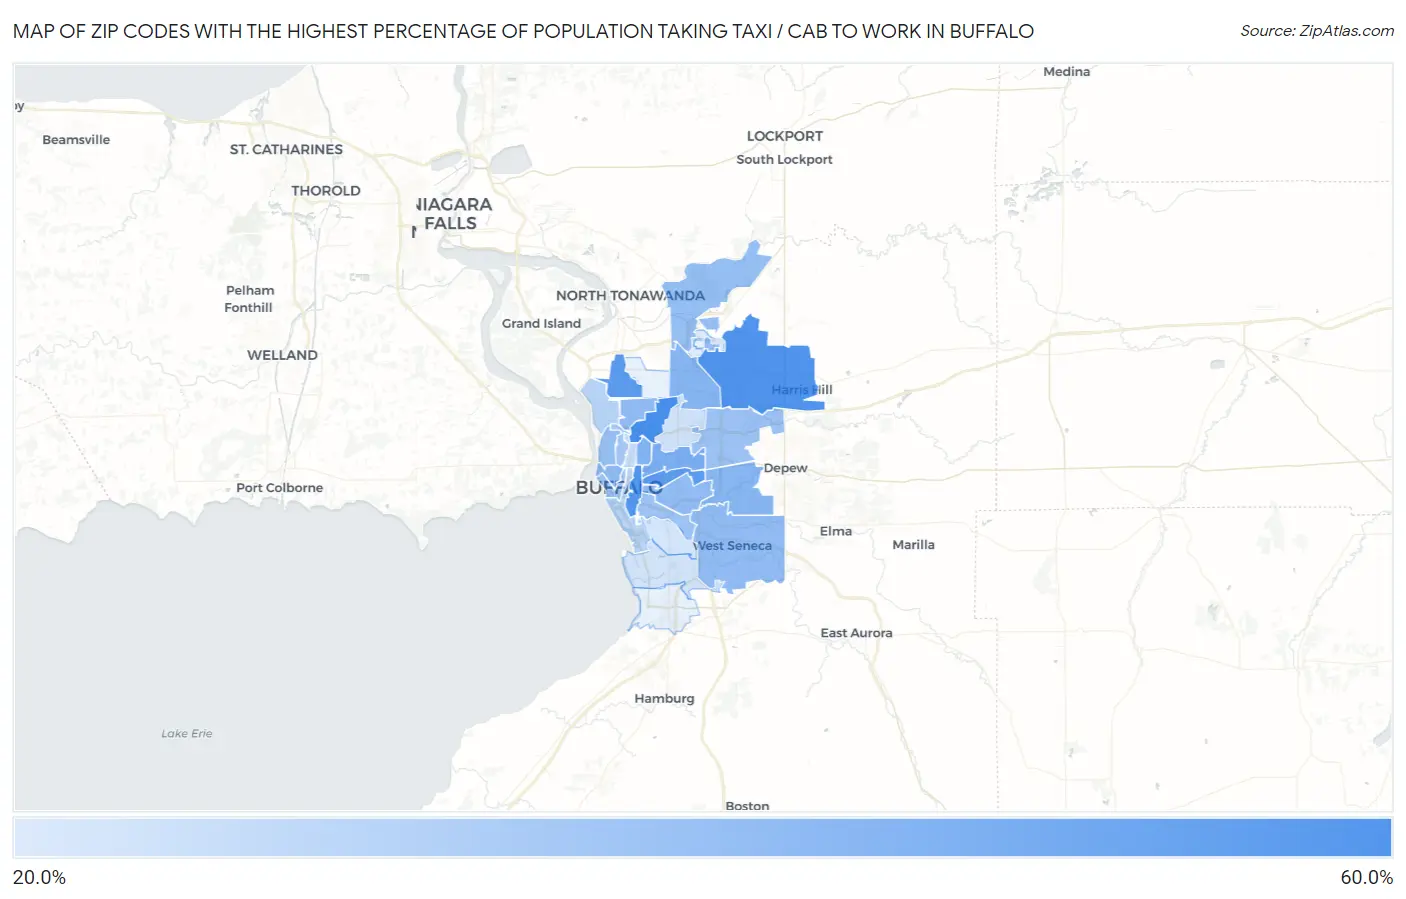
Map of Zip Codes with the Highest Percentage of Population Taking Taxi / Cab to Work in Buffalo

0.0%
60.0%
Zip Codes with the Highest Percentage of Population Taking Taxi / Cab to Work in Buffalo Map

Zip Codes with the Highest Percentage of Population Taking Taxi / Cab to Work in Buffalo, NY

Zip Code % Take Taxi / Cab vs State vs National
1.1421458.3%40.0%(+18.3)#5938.2%(+20.1)#940
2.1422156.1%40.0%(+16.1)#7238.2%(+17.9)#1,345
3.1420455.1%40.0%(+15.1)#9038.2%(+16.9)#1,585
4.1421253.6%40.0%(+13.6)#10638.2%(+15.4)#1,931
5.1421752.6%40.0%(+12.6)#12538.2%(+14.4)#2,204
6.1421145.0%40.0%(+5.00)#26038.2%(+6.80)#4,657
7.1420843.4%40.0%(+3.40)#29938.2%(+5.20)#5,241
8.1422641.9%40.0%(+1.90)#32838.2%(+3.70)#5,760
9.1422741.7%40.0%(+1.70)#33138.2%(+3.50)#5,863
10.1420139.8%40.0%(-0.200)#38438.2%(+1.60)#6,709
11.1420639.4%40.0%(-0.600)#39238.2%(+1.20)#6,893
12.1421639.3%40.0%(-0.700)#39438.2%(+1.10)#6,941
13.1422439.0%40.0%(-1.00)#40138.2%(+0.800)#7,061
14.1422838.3%40.0%(-1.70)#42238.2%(+0.100)#7,359
15.1421338.2%40.0%(-1.80)#42538.2%(=0.000)#7,402
16.1422536.4%40.0%(-3.60)#47338.2%(-1.80)#8,256
17.1421036.0%40.0%(-4.00)#48138.2%(-2.20)#8,425
18.1420235.2%40.0%(-4.80)#50438.2%(-3.00)#8,823
19.1422234.0%40.0%(-6.00)#52938.2%(-4.20)#9,350
20.1420730.5%40.0%(-9.50)#60338.2%(-7.70)#10,745
21.1420329.6%40.0%(-10.4)#61538.2%(-8.60)#11,086
22.1420927.5%40.0%(-12.5)#65238.2%(-10.7)#11,712
23.1421524.7%40.0%(-15.3)#67738.2%(-13.5)#12,297
24.1421824.6%40.0%(-15.4)#68138.2%(-13.6)#12,341
25.1422023.9%40.0%(-16.1)#68538.2%(-14.3)#12,457
26.1426121.9%40.0%(-18.1)#70138.2%(-16.3)#12,787

Common Questions

What are the Top 10 Zip Codes with the Highest Percentage of Population Taking Taxi / Cab to Work in Buffalo, NY?
Top 10 Zip Codes with the Highest Percentage of Population Taking Taxi / Cab to Work in Buffalo, NY are:
#1
58.3%
#2
56.1%
#3
55.1%
#4
53.6%
#5
52.6%
#6
45.0%
#7
43.4%
#8
41.9%
#9
41.7%
#10
39.8%
What zip code has the Highest Percentage of Population Taking Taxi / Cab to Work in Buffalo, NY?
14214 has the Highest Percentage of Population Taking Taxi / Cab to Work in Buffalo, NY with 58.3%.
What is the Percentage of Population Taking Taxi / Cab to Work in Buffalo, NY?
Percentage of Population Taking Taxi / Cab to Work in Buffalo is 36.7%.
What is the Percentage of Population Taking Taxi / Cab to Work in New York?
Percentage of Population Taking Taxi / Cab to Work in New York is 40.0%.
What is the Percentage of Population Taking Taxi / Cab to Work in the United States?
Percentage of Population Taking Taxi / Cab to Work in the United States is 38.2%.