Zip Codes with the Highest Percentage of Population with a Degree in Literature and Languages in Buffalo, NY

RELATED REPORTS & OPTIONS

Literature and Languages
Population
Families and Households
Female Fertility
Female Fertility (Unmarried)
Race (Community Size)
Race (Percentage)
Ancestry (Community Size)
AfghanAfricanAlbanianAlsatianAmericanArabArgentineanArmenianAustralianAustrianBahamianBarbadianBelgianBelizeanBhutaneseBlackfeetBolivianBrazilianBritishBritish West IndianBulgarianBurmeseCajunCambodianCanadianCarpatho RusynCelticCentral AmericanCentral American IndianCherokeeChileanChippewaColombianCosta RicanCreekCroatianCubanCzechCzechoslovakianDanishDominicanDutchDutch West IndianEastern EuropeanEcuadorianEgyptianEnglishEstonianEthiopianEuropeanFilipinoFinnishFrenchFrench American IndianFrench CanadianGermanGerman RussianGhanaianGreekGuamanian / ChamorroGuatemalanGuyaneseHaitianHonduranHungarianIcelanderIndian (Asian)IndonesianIranianIraqiIrishIroquoisIsraeliItalianJamaicanJapaneseJordanianKenyanKoreanLaotianLatvianLebaneseLithuanianMacedonianMalaysianMalteseMexicanMexican American IndianMongolianMoroccanNative HawaiianNavajoNicaraguanNigerianNorthern EuropeanNorwegianOkinawanPakistaniPalestinianPanamanianPennsylvania GermanPeruvianPolishPortuguesePuerto RicanRomanianRussianSalvadoranSamoanScandinavianScotch-IrishScottishSerbianSiouxSlavicSlovakSloveneSomaliSouth AfricanSouth AmericanSouth American IndianSpaniardSpanishSri LankanSubsaharan AfricanSudaneseSwedishSwissSyrianTaiwaneseThaiTrinidadian and TobagonianTurkishUkrainianVenezuelanVietnameseWelshWest IndianYugoslavian
Ancestry (Percentage)
AfghanAfricanAlbanianAlsatianAmericanArabArgentineanArmenianAustralianAustrianBahamianBarbadianBelgianBelizeanBhutaneseBlackfeetBolivianBrazilianBritishBritish West IndianBulgarianBurmeseCajunCambodianCanadianCarpatho RusynCelticCentral AmericanCentral American IndianCherokeeChileanChippewaColombianCosta RicanCreekCroatianCubanCzechCzechoslovakianDanishDominicanDutchDutch West IndianEastern EuropeanEcuadorianEgyptianEnglishEstonianEthiopianEuropeanFilipinoFinnishFrenchFrench American IndianFrench CanadianGermanGerman RussianGhanaianGreekGuamanian / ChamorroGuatemalanGuyaneseHaitianHonduranHungarianIcelanderIndian (Asian)IndonesianIranianIraqiIrishIroquoisIsraeliItalianJamaicanJapaneseJordanianKenyanKoreanLaotianLatvianLebaneseLithuanianMacedonianMalaysianMalteseMexicanMexican American IndianMongolianMoroccanNative HawaiianNavajoNicaraguanNigerianNorthern EuropeanNorwegianOkinawanPakistaniPalestinianPanamanianPennsylvania GermanPeruvianPolishPortuguesePuerto RicanRomanianRussianSalvadoranSamoanScandinavianScotch-IrishScottishSerbianSiouxSlavicSlovakSloveneSomaliSouth AfricanSouth AmericanSouth American IndianSpaniardSpanishSri LankanSubsaharan AfricanSudaneseSwedishSwissSyrianTaiwaneseThaiTrinidadian and TobagonianTurkishUkrainianVenezuelanVietnameseWelshWest IndianYugoslavian
Immigrant Origin (Total)
AfghanistanAfricaAlbaniaArgentinaAsiaAustraliaAustriaBangladeshBarbadosBelarusBosnia and HerzegovinaBrazilBulgariaBurma / MyanmarCameroonCanadaCaribbeanCentral AmericaChinaColombiaCongoCosta RicaCroatiaCubaCzechoslovakiaDominican RepublicEastern AfricaEastern AsiaEastern EuropeEcuadorEgyptEl SalvadorEnglandEritreaEthiopiaEuropeFranceGermanyGhanaGreeceGuatemalaGuyanaHaitiHondurasHong KongHungaryIndiaIndonesiaIranIraqIrelandIsraelItalyJamaicaJapanJordanKazakhstanKenyaKoreaKuwaitLaosLatin AmericaLatviaLebanonLiberiaLithuaniaMalaysiaMexicoMiddle AfricaMoldovaMoroccoNepalNetherlandsNigeriaNorth MacedoniaNorthern AfricaNorthern EuropeNorwayOceaniaPakistanPanamaPeruPhilippinesPolandRomaniaRussiaSaudi ArabiaScotlandSerbiaSierra LeoneSingaporeSomaliaSouth AfricaSouth AmericaSouth Central AsiaSouth Eastern AsiaSouthern EuropeSpainSri LankaSt. Vincent and the GrenadinesSudanSwedenSwitzerlandSyriaTaiwanThailandTrinidad and TobagoTurkeyUgandaUkraineUzbekistanVenezuelaVietnamWest IndiesWestern AfricaWestern AsiaWestern EuropeYemenZaire
Immigrant Origin (Percentage)
AfghanistanAfricaAlbaniaArgentinaAsiaAustraliaAustriaBangladeshBarbadosBelarusBosnia and HerzegovinaBrazilBulgariaBurma / MyanmarCameroonCanadaCaribbeanCentral AmericaChinaColombiaCongoCosta RicaCroatiaCubaCzechoslovakiaDominican RepublicEastern AfricaEastern AsiaEastern EuropeEcuadorEgyptEl SalvadorEnglandEritreaEthiopiaEuropeFranceGermanyGhanaGreeceGuatemalaGuyanaHaitiHondurasHong KongHungaryIndiaIndonesiaIranIraqIrelandIsraelItalyJamaicaJapanJordanKazakhstanKenyaKoreaKuwaitLaosLatin AmericaLatviaLebanonLiberiaLithuaniaMalaysiaMexicoMiddle AfricaMoldovaMoroccoNepalNetherlandsNigeriaNorth MacedoniaNorthern AfricaNorthern EuropeNorwayOceaniaPakistanPanamaPeruPhilippinesPolandRomaniaRussiaSaudi ArabiaScotlandSerbiaSierra LeoneSingaporeSomaliaSouth AfricaSouth AmericaSouth Central AsiaSouth Eastern AsiaSouthern EuropeSpainSri LankaSt. Vincent and the GrenadinesSudanSwedenSwitzerlandSyriaTaiwanThailandTrinidad and TobagoTurkeyUgandaUkraineUzbekistanVenezuelaVietnamWest IndiesWestern AfricaWestern AsiaWestern EuropeYemenZaire
Income
Income (Families)
Income (Households)
Poverty
Poverty (Families)
Unemployment
Employment Occupations
Employment Industries
Employer Class
Commute Time
Commute Means
School Enrollment
Education by Degree Field
Occupancy
Finances
Physical Characteristics
Buffalo
Compare Zip Codes
Comparison Subject

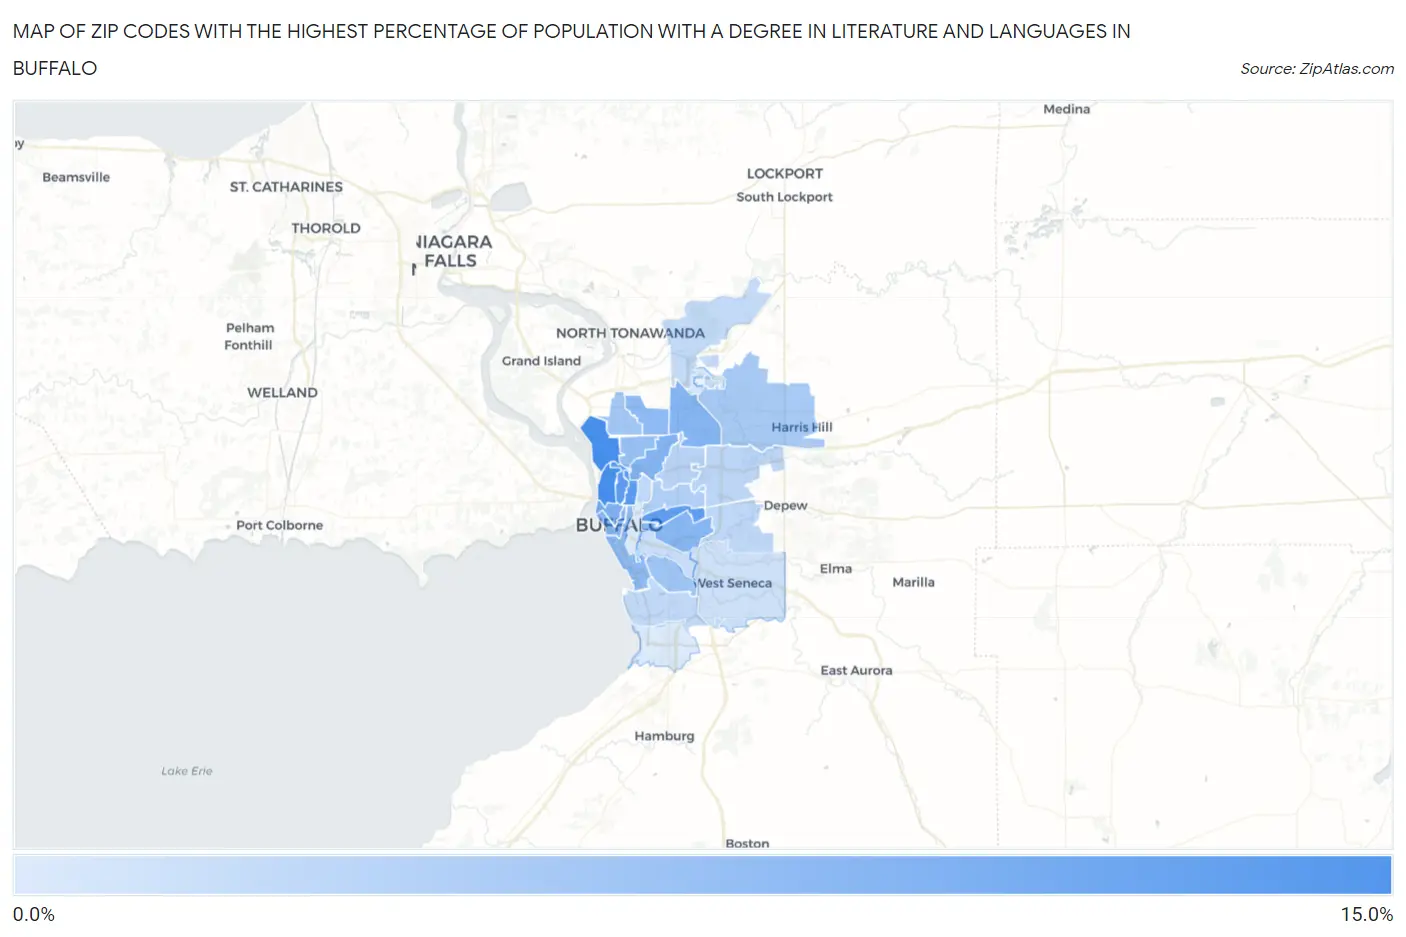
Map of Zip Codes with the Highest Percentage of Population with a Degree in Literature and Languages in Buffalo

0.0%
15.0%
Zip Codes with the Highest Percentage of Population with a Degree in Literature and Languages in Buffalo Map

Zip Codes with the Highest Percentage of Population with a Degree in Literature and Languages in Buffalo, NY

Zip Code % Graduates vs State vs National
1.1421311.5%5.9%(+5.59)#1214.4%(+7.08)#1,332
2.1420711.5%5.9%(+5.56)#1224.4%(+7.05)#1,340
3.1420910.0%5.9%(+4.11)#1804.4%(+5.59)#1,814
4.142229.9%5.9%(+4.02)#1834.4%(+5.51)#1,866
5.142129.6%5.9%(+3.75)#1994.4%(+5.24)#1,981
6.142017.6%5.9%(+1.68)#3444.4%(+3.17)#3,369
7.142147.3%5.9%(+1.41)#3694.4%(+2.90)#3,652
8.142267.1%5.9%(+1.24)#3884.4%(+2.72)#3,833
9.142067.0%5.9%(+1.08)#4044.4%(+2.57)#4,018
10.142026.5%5.9%(+0.635)#4554.4%(+2.12)#4,598
11.142236.4%5.9%(+0.507)#4814.4%(+2.00)#4,791
12.142036.1%5.9%(+0.249)#5214.4%(+1.74)#5,180
13.142165.8%5.9%(-0.107)#5704.4%(+1.38)#5,768
14.142205.3%5.9%(-0.618)#6514.4%(+0.870)#6,770
15.142175.0%5.9%(-0.918)#6974.4%(+0.570)#7,413
16.142214.8%5.9%(-1.12)#7434.4%(+0.368)#7,961
17.142114.1%5.9%(-1.75)#8794.4%(-0.262)#9,771
18.142153.7%5.9%(-2.24)#9704.4%(-0.749)#11,298
19.142253.3%5.9%(-2.59)#1,0304.4%(-1.10)#12,495
20.142083.2%5.9%(-2.67)#1,0494.4%(-1.18)#12,794
21.142273.2%5.9%(-2.72)#1,0634.4%(-1.23)#12,985
22.142183.0%5.9%(-2.85)#1,0884.4%(-1.36)#13,426
23.142282.9%5.9%(-3.03)#1,1184.4%(-1.54)#14,007
24.142102.3%5.9%(-3.57)#1,2124.4%(-2.08)#15,935
25.142242.1%5.9%(-3.76)#1,2284.4%(-2.27)#16,612
26.142611.6%5.9%(-4.34)#1,3014.4%(-2.85)#18,450
27.142191.2%5.9%(-4.67)#1,3304.4%(-3.18)#19,501
28.142041.2%5.9%(-4.73)#1,3374.4%(-3.24)#19,660

Common Questions

What are the Top 10 Zip Codes with the Highest Percentage of Population with a Degree in Literature and Languages in Buffalo, NY?
Top 10 Zip Codes with the Highest Percentage of Population with a Degree in Literature and Languages in Buffalo, NY are:
#1
11.5%
#2
11.5%
#3
10.0%
#4
9.9%
#5
9.6%
#6
7.6%
#7
7.3%
#8
7.1%
#9
7.0%
#10
6.5%
What zip code has the Highest Percentage of Population with a Degree in Literature and Languages in Buffalo, NY?
14213 has the Highest Percentage of Population with a Degree in Literature and Languages in Buffalo, NY with 11.5%.
What is the Percentage of Population with a Degree in Literature and Languages in Buffalo, NY?
Percentage of Population with a Degree in Literature and Languages in Buffalo is 7.4%.
What is the Percentage of Population with a Degree in Literature and Languages in New York?
Percentage of Population with a Degree in Literature and Languages in New York is 5.9%.
What is the Percentage of Population with a Degree in Literature and Languages in the United States?
Percentage of Population with a Degree in Literature and Languages in the United States is 4.4%.