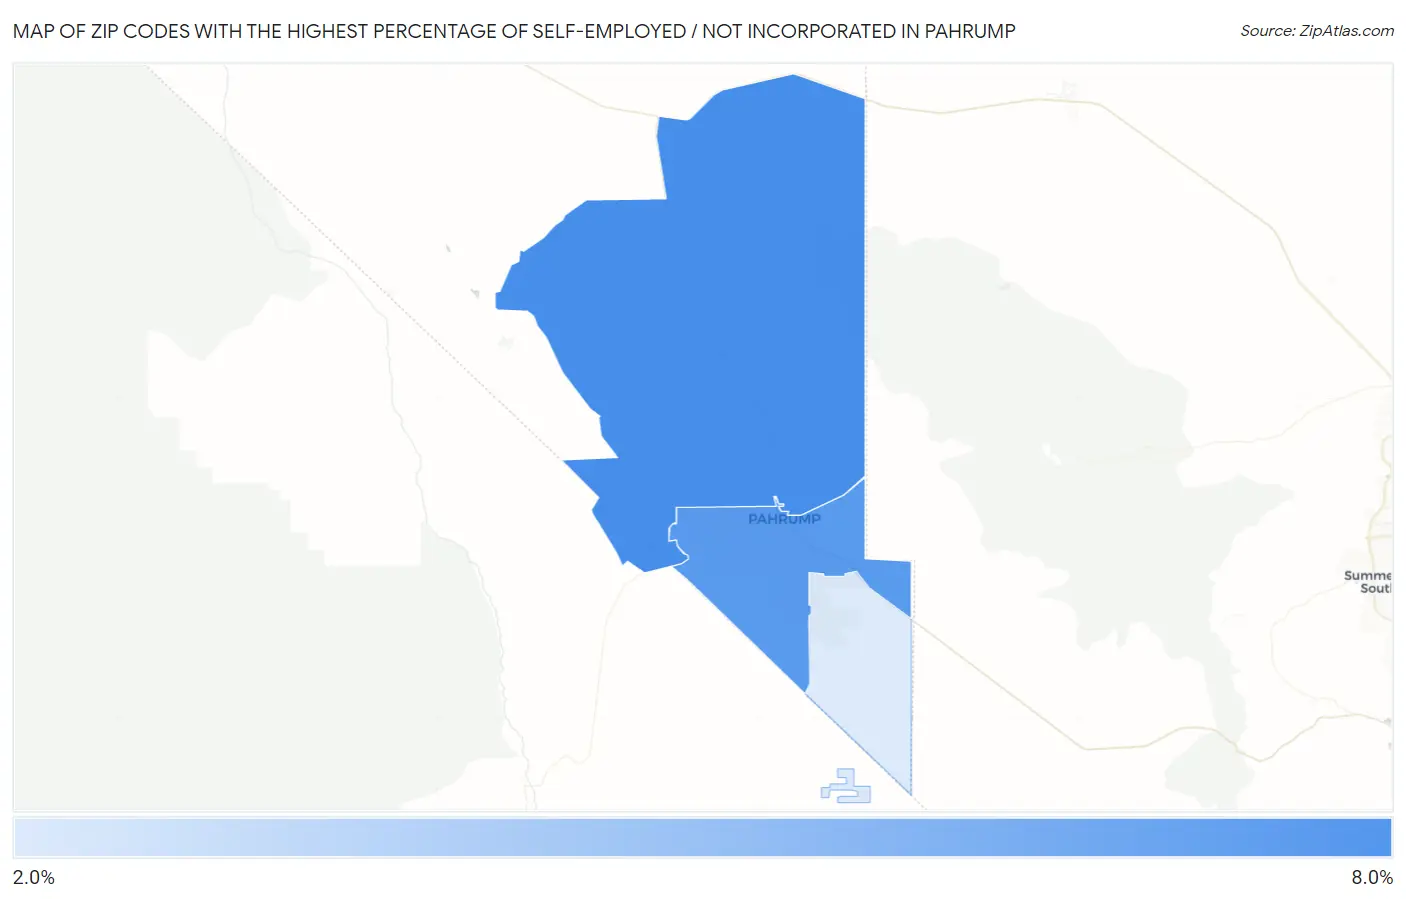
Zip Codes with the Highest Percentage of Self-Employed / Not Incorporated in Pahrump, NV
RELATED REPORTS & OPTIONS
Self-Employed / Not Incorporated
Pahrump
Compare Zip Codes
Map of Zip Codes with the Highest Percentage of Self-Employed / Not Incorporated in Pahrump
0.0%
8.0%
Zip Codes with the Highest Percentage of Self-Employed / Not Incorporated in Pahrump, NV
| Zip Code | % Self-Employed / Not Incorporated | vs State | vs National | |
| 1. | 89060 | 6.9% | 5.3%(+1.57)#41 | 5.8%(+1.07)#13,353 |
| 2. | 89048 | 6.5% | 5.3%(+1.14)#46 | 5.8%(+0.642)#14,600 |
| 3. | 89061 | 2.9% | 5.3%(-2.42)#126 | 5.8%(-2.92)#26,618 |
1
Common Questions
What are the Top Zip Codes with the Highest Percentage of Self-Employed / Not Incorporated in Pahrump, NV?
Top Zip Codes with the Highest Percentage of Self-Employed / Not Incorporated in Pahrump, NV are:
What zip code has the Highest Percentage of Self-Employed / Not Incorporated in Pahrump, NV?
89060 has the Highest Percentage of Self-Employed / Not Incorporated in Pahrump, NV with 6.9%.
What is the Percentage of Self-Employed / Not Incorporated in Pahrump, NV?
Percentage of Self-Employed / Not Incorporated in Pahrump is 6.0%.
What is the Percentage of Self-Employed / Not Incorporated in Nevada?
Percentage of Self-Employed / Not Incorporated in Nevada is 5.3%.
What is the Percentage of Self-Employed / Not Incorporated in the United States?
Percentage of Self-Employed / Not Incorporated in the United States is 5.8%.