United States Zip Codes & Characteristics
United States Map
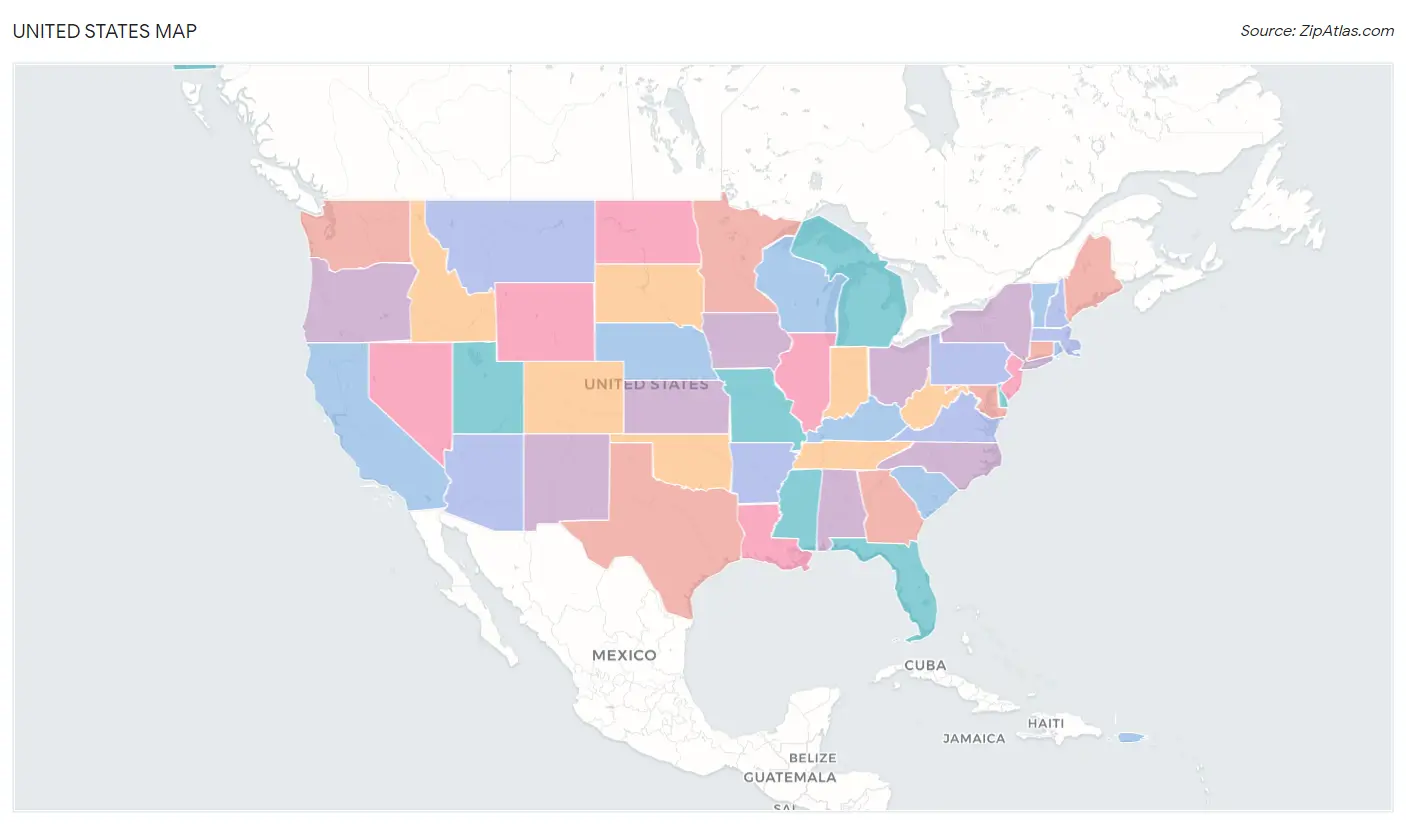
United States Overview
08701
LARGEST ZIP CODE
New York
LARGEST CITY
Los Angeles County
LARGEST COUNTY
331,097,593
TOTAL POPULATION
164,200,298
MALE POPULATION
166,897,295
FEMALE POPULATION
98.38
MALES / 100 FEMALES
101.64
FEMALES / 100 MALES
38.5
MEDIAN AGE
3.2
AVG FAMILY SIZE
2.6
AVG HOUSEHOLD SIZE
$41,261
PER CAPITA INCOME
$92,646
AVG FAMILY INCOME
$75,149
AVG HOUSEHOLD INCOME
28.0%
WAGE / INCOME GAP [ % ]
72.0¢/ $1
WAGE / INCOME GAP [ $ ]
$11,046
FAMILY INCOME DEFICIT
0.48
INEQUALITY / GINI INDEX
169,171,603
LABOR FORCE [ PEOPLE ]
63.5%
PERCENT IN LABOR FORCE
5.3%
UNEMPLOYMENT RATE
United States Area Codes
Untied States Zip Atlas
Welcome to ZipAtlas, explore the social, economic, demographic, and housing characteristics of each zip code, city, county, and state in the United States. We aim to provide you with comprehensive data and insights that can help you make informed decisions about where to live, work, and invest.
Whether you are a student, a professional, a researcher, or just someone who wants to learn more about your community, our website offers a wealth of information that can be customized to your needs. We have collected and analyzed data from various sources, including the U.S. Census Bureau, the Bureau of Labor Statistics, the Department of Housing and Urban Development, and other reputable organizations.
You can enter the name or code of the location you are interested into get detailed report that includes the following information:
Social Characteristics
Our website provides data on the social characteristics of each location, including population size, age distribution, gender composition, race and ethnicity, education level, marital status, and language spoken at home. You can use this information to understand the diversity and cultural makeup of the community and how it may impact your investments, lifestyle, and social interactions.
Economic Characteristics
ZipAtlas provides data on the economic characteristics of each location, including employment rates, income levels, poverty rates, industries and occupations, as well as cost of living. You can use this information to evaluate the economic opportunities and challenges in the community and how they may affect your career and financial goals.
Demographic Characteristics
ZipAtlas offers data on the demographic characteristics of each location, including population dynamics, family structure, household size and type, and health insurance coverage. You can use this information to understand the changing demographics of the community and how they may impact the demand for housing, services, and infrastructure.
Housing Characteristics
We provide data on the housing characteristics of each location, including median home value, rental rates, housing affordability, age and condition of homes, and type of housing units. You can use this information to evaluate the housing market and affordability in the community and how it may impact your housing choices and investment decisions.
ZipAtlas is free to use and accessible to everyone, and we are committed to providing timely, accurate, and reliable data and insights
Largest Zip Codes by Population in the United States
The largest zip codes in the United States by population are 08701 (134,008), 77494 (130,920), 77449 (122,098), 78660 (113,386), and 11368 (112,750).
1.08701,
134,008 (0.04%)
2.77494,
130,920 (0.04%)
3.77449,
122,098 (0.04%)
4.78660,
113,386 (0.03%)
5.11368,
112,750 (0.03%)
6.60629,
108,997 (0.03%)
7.77084,
108,557 (0.03%)
8.11208,
108,180 (0.03%)
9.77433,
107,887 (0.03%)
10.79936,
107,512 (0.03%)
11.90011,
106,042 (0.03%)
12.11385,
105,521 (0.03%)
13.11373,
102,618 (0.03%)
14.90650,
101,983 (0.03%)
15.11226,
101,053 (0.03%)
16.94565,
100,826 (0.03%)
17.92336,
100,571 (0.03%)
18.11236,
100,082 (0.03%)
19.30044,
100,056 (0.03%)
20.91331,
99,804 (0.03%)
21.37013,
99,800 (0.03%)
22.90044,
98,990 (0.03%)
23.10467,
98,713 (0.03%)
24.10025,
96,988 (0.03%)
25.11207,
96,801 (0.03%)
26.92335,
96,704 (0.03%)
27.90805,
96,515 (0.03%)
28.90250,
96,200 (0.03%)
29.77573,
95,704 (0.03%)
30.79938,
95,452 (0.03%)
Largest Cities by Population in the United States
The largest cities in the United States by population are New York (8,622,467), Los Angeles (3,881,041), Chicago (2,721,914), Houston (2,296,253), and Phoenix (1,609,456).
1.New York,
8,622,467 (2.60%)
2.Los Angeles,
3,881,041 (1.17%)
3.Chicago,
2,721,914 (0.82%)
4.Houston,
2,296,253 (0.69%)
5.Phoenix,
1,609,456 (0.49%)
6.Philadelphia,
1,593,208 (0.48%)
7.San Antonio,
1,445,662 (0.44%)
8.San Diego,
1,383,987 (0.42%)
9.Dallas,
1,300,642 (0.39%)
10.San Jose,
1,001,176 (0.30%)
11.Austin,
958,202 (0.29%)
12.Jacksonville,
950,203 (0.29%)
13.Fort Worth,
924,663 (0.28%)
14.Columbus,
902,449 (0.27%)
15.Indianapolis,
882,006 (0.27%)
16.Charlotte,
875,045 (0.26%)
17.San Francisco,
851,036 (0.26%)
18.Seattle,
734,603 (0.22%)
19.Denver,
710,800 (0.21%)
20.Nashville,
684,103 (0.21%)
21.Oklahoma City,
681,088 (0.21%)
22.El Paso,
677,181 (0.20%)
23.Washington,
670,587 (0.20%)
24.Boston,
665,945 (0.20%)
25.Portland,
646,101 (0.20%)
26.Las Vegas,
644,835 (0.19%)
27.Detroit,
636,787 (0.19%)
28.Memphis,
630,027 (0.19%)
29.Louisville,
629,176 (0.19%)
30.Baltimore,
584,548 (0.18%)
Largest Counties by Population in the United States
The largest counties in the United States by population are Los Angeles County (9,936,690), Cook County (5,225,367), Harris County (4,726,177), Maricopa County (4,430,871), and San Diego County (3,289,701).
9,936,690 (3.00%)
2.Cook County,
5,225,367 (1.58%)
4,726,177 (1.43%)
4,430,871 (1.34%)
3,289,701 (0.99%)
3,175,227 (0.96%)
2,688,237 (0.81%)
8.Kings County,
2,679,620 (0.81%)
2,604,053 (0.79%)
10.Riverside County,
2,429,487 (0.73%)
11.Queens County,
2,360,826 (0.71%)
12.Clark County,
2,265,926 (0.68%)
13.King County,
2,254,371 (0.68%)
2,180,563 (0.66%)
15.Tarrant County,
2,113,854 (0.64%)
16.Bexar County,
2,014,059 (0.61%)
17.Broward County,
1,940,907 (0.59%)
1,916,831 (0.58%)
19.Wayne County,
1,781,641 (0.54%)
20.Alameda County,
1,663,823 (0.50%)
21.New York County,
1,645,867 (0.50%)
22.Middlesex County,
1,623,109 (0.49%)
1,593,208 (0.48%)
1,579,211 (0.48%)
25.Suffolk County,
1,524,486 (0.46%)
1,494,805 (0.45%)
1,468,560 (0.44%)
28.Bronx County,
1,443,229 (0.44%)
29.Orange County,
1,427,403 (0.43%)
30.Nassau County,
1,389,160 (0.42%)
Race in the United States
The most populous races in the United States are White / Caucasian (218,123,424 | 65.9%), Hispanic or Latino (61,755,866 | 18.6%), and Black / African American (41,288,572 | 12.5%).
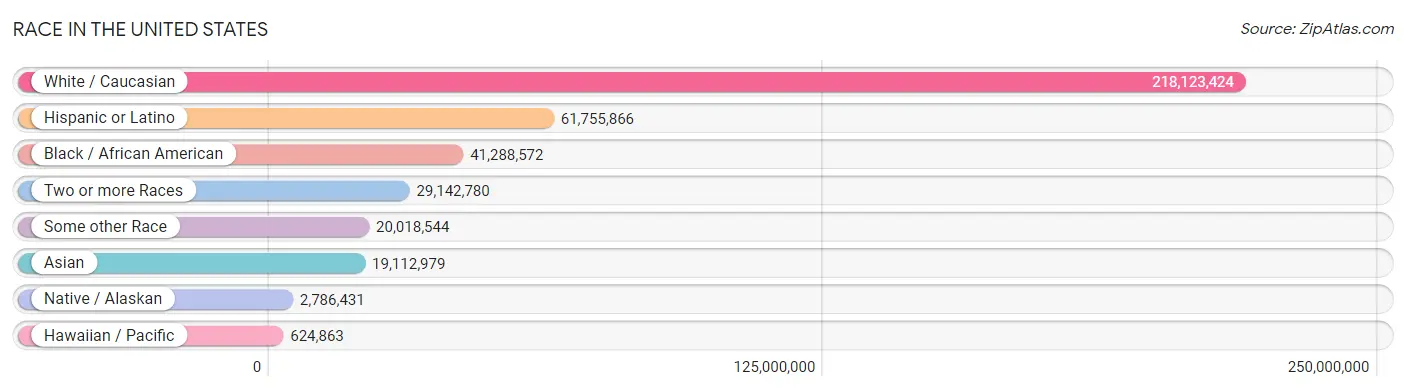
| Race | # Population | % Population |
| Asian | 19,112,979 | 5.8% |
| Black / African American | 41,288,572 | 12.5% |
| Hawaiian / Pacific | 624,863 | 0.2% |
| Hispanic or Latino | 61,755,866 | 18.6% |
| Native / Alaskan | 2,786,431 | 0.8% |
| White / Caucasian | 218,123,424 | 65.9% |
| Two or more Races | 29,142,780 | 8.8% |
| Some other Race | 20,018,544 | 6.0% |
| Total | 331,097,593 | 100.0% |
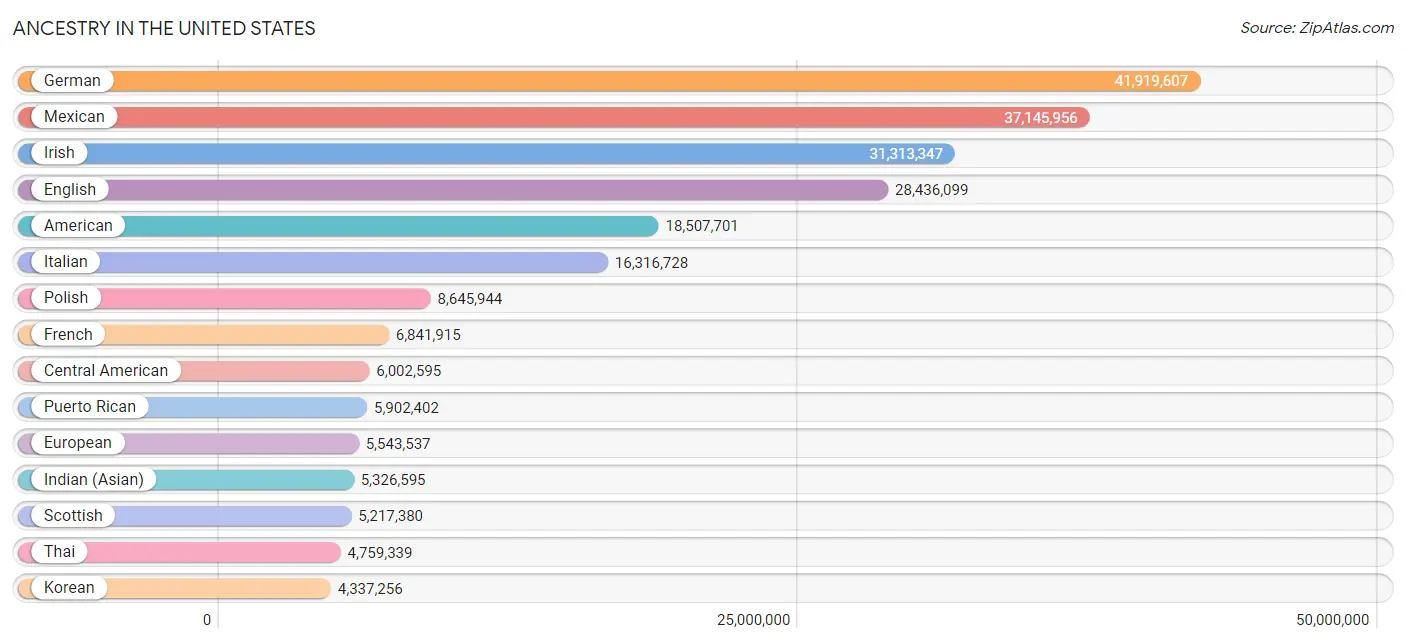
Ancestry in the United States
The most populous ancestries reported in the United States are German (41,919,607 | 12.7%), Mexican (37,145,956 | 11.2%), Irish (31,313,347 | 9.5%), English (28,436,099 | 8.6%), and American (18,507,701 | 5.6%), together accounting for 47.5% of all the United States residents.
| Ancestry | # Population | % Population |
| Afghan | 150,943 | 0.1% |
| African | 1,871,898 | 0.6% |
| Alaska Native | 28,462 | 0.0% |
| Alaskan Athabascan | 25,222 | 0.0% |
| Albanian | 218,774 | 0.1% |
| Aleut | 21,486 | 0.0% |
| Alsatian | 10,513 | 0.0% |
| American | 18,507,701 | 5.6% |
| Apache | 165,366 | 0.1% |
| Arab | 2,164,088 | 0.6% |
| Arapaho | 10,089 | 0.0% |
| Argentinean | 304,672 | 0.1% |
| Armenian | 453,620 | 0.1% |
| Assyrian / Chaldean / Syriac | 96,423 | 0.0% |
| Australian | 96,505 | 0.0% |
| Austrian | 616,016 | 0.2% |
| Bahamian | 56,778 | 0.0% |
| Bangladeshi | 348,407 | 0.1% |
| Barbadian | 69,202 | 0.0% |
| Basque | 59,818 | 0.0% |
| Belgian | 327,258 | 0.1% |
| Belizean | 63,801 | 0.0% |
| Bermudan | 8,131 | 0.0% |
| Bhutanese | 1,614,103 | 0.5% |
| Blackfeet | 203,870 | 0.1% |
| Bolivian | 128,584 | 0.0% |
| Brazilian | 509,391 | 0.2% |
| British | 1,754,174 | 0.5% |
| British West Indian | 121,005 | 0.0% |
| Bulgarian | 108,637 | 0.0% |
| Burmese | 1,977,441 | 0.6% |
| Cajun | 97,224 | 0.0% |
| Cambodian | 33,559 | 0.0% |
| Canadian | 590,636 | 0.2% |
| Cape Verdean | 106,855 | 0.0% |
| Carpatho Rusyn | 8,669 | 0.0% |
| Celtic | 48,447 | 0.0% |
| Central American | 6,002,595 | 1.8% |
| Central American Indian | 374,148 | 0.1% |
| Cherokee | 1,150,610 | 0.4% |
| Cheyenne | 21,018 | 0.0% |
| Chickasaw | 68,827 | 0.0% |
| Chilean | 182,671 | 0.1% |
| Chinese | 20,179 | 0.0% |
| Chippewa | 191,286 | 0.1% |
| Choctaw | 257,004 | 0.1% |
| Colombian | 1,357,798 | 0.4% |
| Colville | 11,194 | 0.0% |
| Comanche | 31,883 | 0.0% |
| Costa Rican | 173,375 | 0.1% |
| Cree | 13,512 | 0.0% |
| Creek | 107,761 | 0.0% |
| Croatian | 399,455 | 0.1% |
| Crow | 18,832 | 0.0% |
| Cuban | 2,405,080 | 0.7% |
| Cypriot | 10,804 | 0.0% |
| Czech | 1,267,179 | 0.4% |
| Czechoslovakian | 260,400 | 0.1% |
| Danish | 1,182,895 | 0.4% |
| Delaware | 22,581 | 0.0% |
| Dominican | 2,267,142 | 0.7% |
| Dutch | 3,357,158 | 1.0% |
| Dutch West Indian | 27,716 | 0.0% |
| Eastern European | 1,005,654 | 0.3% |
| Ecuadorian | 803,854 | 0.2% |
| Egyptian | 309,357 | 0.1% |
| English | 28,436,099 | 8.6% |
| Estonian | 28,951 | 0.0% |
| Ethiopian | 355,176 | 0.1% |
| European | 5,543,537 | 1.7% |
| Fijian | 41,335 | 0.0% |
| Filipino | 280,778 | 0.1% |
| Finnish | 628,742 | 0.2% |
| French | 6,841,915 | 2.1% |
| French American Indian | 33,399 | 0.0% |
| French Canadian | 1,802,745 | 0.5% |
| German | 41,919,607 | 12.7% |
| German Russian | 23,539 | 0.0% |
| Ghanaian | 185,371 | 0.1% |
| Greek | 1,230,319 | 0.4% |
| Guamanian / Chamorro | 154,057 | 0.1% |
| Guatemalan | 1,669,094 | 0.5% |
| Guyanese | 258,522 | 0.1% |
| Haitian | 1,060,713 | 0.3% |
| Hmong | 1,767 | 0.0% |
| Honduran | 1,068,265 | 0.3% |
| Hopi | 23,953 | 0.0% |
| Houma | 12,212 | 0.0% |
| Hungarian | 1,294,135 | 0.4% |
| Icelander | 51,665 | 0.0% |
| Indian (Asian) | 5,326,595 | 1.6% |
| Indonesian | 218,048 | 0.1% |
| Inupiat | 46,707 | 0.0% |
| Iranian | 487,189 | 0.2% |
| Iraqi | 165,123 | 0.1% |
| Irish | 31,313,347 | 9.5% |
| Iroquois | 95,118 | 0.0% |
| Israeli | 149,556 | 0.1% |
| Italian | 16,316,728 | 4.9% |
| Jamaican | 1,203,841 | 0.4% |
| Japanese | 351,951 | 0.1% |
| Jordanian | 93,877 | 0.0% |
| Kenyan | 103,802 | 0.0% |
| Kiowa | 11,793 | 0.0% |
| Korean | 4,337,256 | 1.3% |
| Laotian | 145,031 | 0.0% |
| Latvian | 84,991 | 0.0% |
| Lebanese | 546,795 | 0.2% |
| Liberian | 92,606 | 0.0% |
| Lithuanian | 613,139 | 0.2% |
| Lumbee | 79,560 | 0.0% |
| Luxembourger | 42,059 | 0.0% |
| Macedonian | 65,370 | 0.0% |
| Malaysian | 250,948 | 0.1% |
| Maltese | 41,206 | 0.0% |
| Marshallese | 8,839 | 0.0% |
| Menominee | 12,682 | 0.0% |
| Mexican | 37,145,956 | 11.2% |
| Mexican American Indian | 517,224 | 0.2% |
| Mongolian | 38,751 | 0.0% |
| Moroccan | 130,410 | 0.0% |
| Native Hawaiian | 654,614 | 0.2% |
| Navajo | 409,349 | 0.1% |
| Nepalese | 13,631 | 0.0% |
| New Zealander | 20,873 | 0.0% |
| Nicaraguan | 441,378 | 0.1% |
| Nigerian | 581,853 | 0.2% |
| Northern European | 487,800 | 0.2% |
| Norwegian | 4,123,617 | 1.3% |
| Okinawan | 12,195 | 0.0% |
| Osage | 23,782 | 0.0% |
| Ottawa | 12,883 | 0.0% |
| Paiute | 16,911 | 0.0% |
| Pakistani | 321,133 | 0.1% |
| Palestinian | 152,586 | 0.1% |
| Panamanian | 224,385 | 0.1% |
| Paraguayan | 27,522 | 0.0% |
| Pennsylvania German | 253,502 | 0.1% |
| Peruvian | 712,740 | 0.2% |
| Pima | 30,653 | 0.0% |
| Polish | 8,645,944 | 2.6% |
| Portuguese | 1,351,314 | 0.4% |
| Potawatomi | 39,386 | 0.0% |
| Pueblo | 83,443 | 0.0% |
| Puerto Rican | 5,902,402 | 1.8% |
| Puget Sound Salish | 24,173 | 0.0% |
| Romanian | 458,947 | 0.1% |
| Russian | 2,387,570 | 0.7% |
| Salvadoran | 2,389,469 | 0.7% |
| Samoan | 228,399 | 0.1% |
| Scandinavian | 1,007,557 | 0.3% |
| Scotch-Irish | 2,707,911 | 0.8% |
| Scottish | 5,217,380 | 1.6% |
| Seminole | 38,510 | 0.0% |
| Senegalese | 26,624 | 0.0% |
| Serbian | 194,511 | 0.1% |
| Shoshone | 17,934 | 0.0% |
| Sierra Leonean | 34,407 | 0.0% |
| Sioux | 201,645 | 0.1% |
| Slavic | 129,541 | 0.0% |
| Slovak | 633,591 | 0.2% |
| Slovene | 171,250 | 0.1% |
| Somali | 167,300 | 0.1% |
| South African | 79,446 | 0.0% |
| South American | 4,248,408 | 1.3% |
| South American Indian | 61,478 | 0.0% |
| Soviet Union | 3,767 | 0.0% |
| Spaniard | 946,224 | 0.3% |
| Spanish | 776,448 | 0.2% |
| Spanish American | 33,509 | 0.0% |
| Spanish American Indian | 18,660 | 0.0% |
| Sri Lankan | 2,246,463 | 0.7% |
| Subsaharan African | 4,023,199 | 1.2% |
| Sudanese | 72,799 | 0.0% |
| Swedish | 3,471,233 | 1.1% |
| Swiss | 876,797 | 0.3% |
| Syrian | 195,361 | 0.1% |
| Taiwanese | 3,248 | 0.0% |
| Thai | 4,759,339 | 1.4% |
| Tlingit-Haida | 27,205 | 0.0% |
| Tohono O'Odham | 26,820 | 0.0% |
| Tongan | 69,511 | 0.0% |
| Trinidadian and Tobagonian | 233,908 | 0.1% |
| Tsimshian | 4,099 | 0.0% |
| Turkish | 234,282 | 0.1% |
| U.S. Virgin Islander | 24,162 | 0.0% |
| Ugandan | 25,234 | 0.0% |
| Ukrainian | 1,042,925 | 0.3% |
| Uruguayan | 71,984 | 0.0% |
| Ute | 14,696 | 0.0% |
| Venezuelan | 627,961 | 0.2% |
| Vietnamese | 235,353 | 0.1% |
| Welsh | 1,736,338 | 0.5% |
| West Indian | 267,308 | 0.1% |
| Yakama | 11,255 | 0.0% |
| Yaqui | 54,320 | 0.0% |
| Yugoslavian | 220,292 | 0.1% |
| Yuman | 11,233 | 0.0% |
| Yup'ik | 45,405 | 0.0% |
| Zimbabwean | 12,733 | 0.0% | View All 200 Rows |
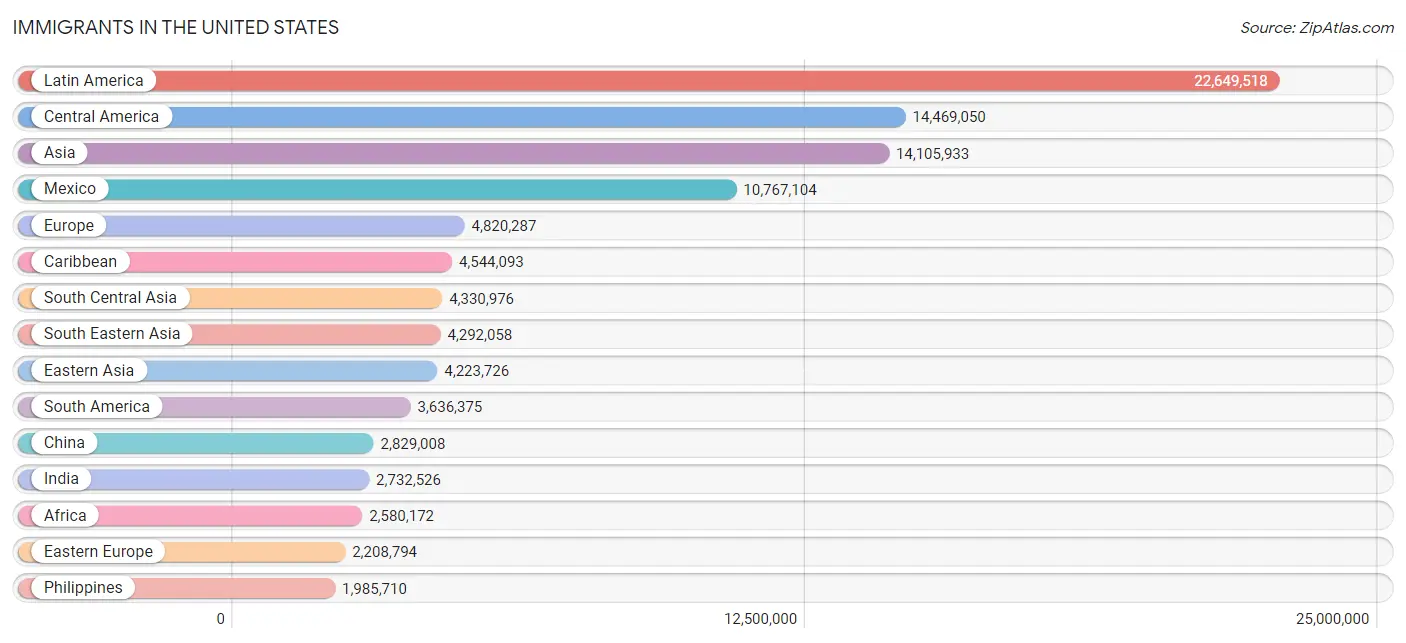
Immigrants in the United States
The most numerous immigrant groups reported in the United States came from Latin America (22,649,518 | 6.8%), Central America (14,469,050 | 4.4%), Asia (14,105,933 | 4.3%), Mexico (10,767,104 | 3.3%), and Europe (4,820,287 | 1.5%), together accounting for 20.2% of all the United States residents.
| Immigration Origin | # Population | % Population |
| Afghanistan | 136,364 | 0.0% |
| Africa | 2,580,172 | 0.8% |
| Albania | 103,117 | 0.0% |
| Argentina | 200,110 | 0.1% |
| Armenia | 96,007 | 0.0% |
| Asia | 14,105,933 | 4.3% |
| Australia | 98,163 | 0.0% |
| Austria | 39,066 | 0.0% |
| Azores | 25,748 | 0.0% |
| Bahamas | 35,359 | 0.0% |
| Bangladesh | 271,479 | 0.1% |
| Barbados | 51,525 | 0.0% |
| Belarus | 71,687 | 0.0% |
| Belgium | 34,732 | 0.0% |
| Belize | 47,034 | 0.0% |
| Bolivia | 80,173 | 0.0% |
| Bosnia and Herzegovina | 106,359 | 0.0% |
| Brazil | 552,373 | 0.2% |
| Bulgaria | 74,305 | 0.0% |
| Cabo Verde | 44,567 | 0.0% |
| Cambodia | 149,355 | 0.1% |
| Cameroon | 82,690 | 0.0% |
| Canada | 821,792 | 0.3% |
| Caribbean | 4,544,093 | 1.4% |
| Central America | 14,469,050 | 4.4% |
| Chile | 106,565 | 0.0% |
| China | 2,829,008 | 0.9% |
| Colombia | 860,787 | 0.3% |
| Congo | 34,616 | 0.0% |
| Costa Rica | 95,844 | 0.0% |
| Croatia | 38,180 | 0.0% |
| Cuba | 1,325,277 | 0.4% |
| Czechoslovakia | 65,085 | 0.0% |
| Denmark | 28,517 | 0.0% |
| Dominica | 33,030 | 0.0% |
| Dominican Republic | 1,223,316 | 0.4% |
| Eastern Africa | 752,337 | 0.2% |
| Eastern Asia | 4,223,726 | 1.3% |
| Eastern Europe | 2,208,794 | 0.7% |
| Ecuador | 480,873 | 0.2% |
| Egypt | 221,329 | 0.1% |
| El Salvador | 1,408,349 | 0.4% |
| England | 318,896 | 0.1% |
| Eritrea | 50,543 | 0.0% |
| Ethiopia | 275,476 | 0.1% |
| Europe | 4,820,287 | 1.5% |
| Fiji | 43,247 | 0.0% |
| France | 184,998 | 0.1% |
| Germany | 543,047 | 0.2% |
| Ghana | 201,796 | 0.1% |
| Greece | 118,932 | 0.0% |
| Grenada | 34,433 | 0.0% |
| Guatemala | 1,051,999 | 0.3% |
| Guyana | 287,198 | 0.1% |
| Haiti | 694,547 | 0.2% |
| Honduras | 727,303 | 0.2% |
| Hong Kong | 239,302 | 0.1% |
| Hungary | 64,894 | 0.0% |
| India | 2,732,526 | 0.8% |
| Indonesia | 99,615 | 0.0% |
| Iran | 391,354 | 0.1% |
| Iraq | 234,088 | 0.1% |
| Ireland | 119,836 | 0.0% |
| Israel | 139,089 | 0.0% |
| Italy | 312,941 | 0.1% |
| Jamaica | 785,998 | 0.2% |
| Japan | 342,380 | 0.1% |
| Jordan | 88,074 | 0.0% |
| Kazakhstan | 37,031 | 0.0% |
| Kenya | 158,590 | 0.1% |
| Korea | 1,034,299 | 0.3% |
| Kuwait | 35,679 | 0.0% |
| Laos | 174,982 | 0.1% |
| Latin America | 22,649,518 | 6.8% |
| Latvia | 23,603 | 0.0% |
| Lebanon | 133,021 | 0.0% |
| Liberia | 98,441 | 0.0% |
| Lithuania | 33,942 | 0.0% |
| Malaysia | 82,574 | 0.0% |
| Mexico | 10,767,104 | 3.3% |
| Micronesia | 32,739 | 0.0% |
| Middle Africa | 193,874 | 0.1% |
| Moldova | 53,673 | 0.0% |
| Morocco | 88,055 | 0.0% |
| Nepal | 165,080 | 0.1% |
| Netherlands | 83,187 | 0.0% |
| Nicaragua | 255,152 | 0.1% |
| Nigeria | 416,418 | 0.1% |
| North Macedonia | 28,387 | 0.0% |
| Northern Africa | 421,832 | 0.1% |
| Northern Europe | 944,917 | 0.3% |
| Norway | 21,736 | 0.0% |
| Oceania | 293,459 | 0.1% |
| Pakistan | 393,877 | 0.1% |
| Panama | 105,274 | 0.0% |
| Peru | 461,322 | 0.1% |
| Philippines | 1,985,710 | 0.6% |
| Poland | 408,899 | 0.1% |
| Portugal | 169,177 | 0.1% |
| Romania | 164,406 | 0.1% |
| Russia | 406,732 | 0.1% |
| Saudi Arabia | 65,497 | 0.0% |
| Scotland | 57,530 | 0.0% |
| Senegal | 33,541 | 0.0% |
| Serbia | 42,332 | 0.0% |
| Sierra Leone | 47,598 | 0.0% |
| Singapore | 35,435 | 0.0% |
| Somalia | 98,399 | 0.0% |
| South Africa | 117,055 | 0.0% |
| South America | 3,636,375 | 1.1% |
| South Central Asia | 4,330,976 | 1.3% |
| South Eastern Asia | 4,292,058 | 1.3% |
| Southern Europe | 728,588 | 0.2% |
| Spain | 120,953 | 0.0% |
| Sri Lanka | 56,619 | 0.0% |
| St. Vincent and the Grenadines | 22,120 | 0.0% |
| Sudan | 55,115 | 0.0% |
| Sweden | 46,845 | 0.0% |
| Switzerland | 37,522 | 0.0% |
| Syria | 108,470 | 0.0% |
| Taiwan | 376,336 | 0.1% |
| Thailand | 256,546 | 0.1% |
| Trinidad and Tobago | 231,222 | 0.1% |
| Turkey | 140,331 | 0.0% |
| Uganda | 36,662 | 0.0% |
| Ukraine | 383,359 | 0.1% |
| Uruguay | 51,485 | 0.0% |
| Uzbekistan | 71,316 | 0.0% |
| Venezuela | 519,103 | 0.2% |
| Vietnam | 1,349,684 | 0.4% |
| West Indies | 20,386 | 0.0% |
| Western Africa | 985,560 | 0.3% |
| Western Asia | 1,204,112 | 0.4% |
| Western Europe | 924,665 | 0.3% |
| Yemen | 62,169 | 0.0% |
| Zaire | 56,604 | 0.0% |
| Zimbabwe | 26,959 | 0.0% | View All 137 Rows |
Sex and Age in the United States
Sex and Age in the United States
The most populous age groups in the United States are 25 to 29 Years (11,574,776 | 7.0%) for men and 30 to 34 Years (11,181,154 | 6.7%) for women.
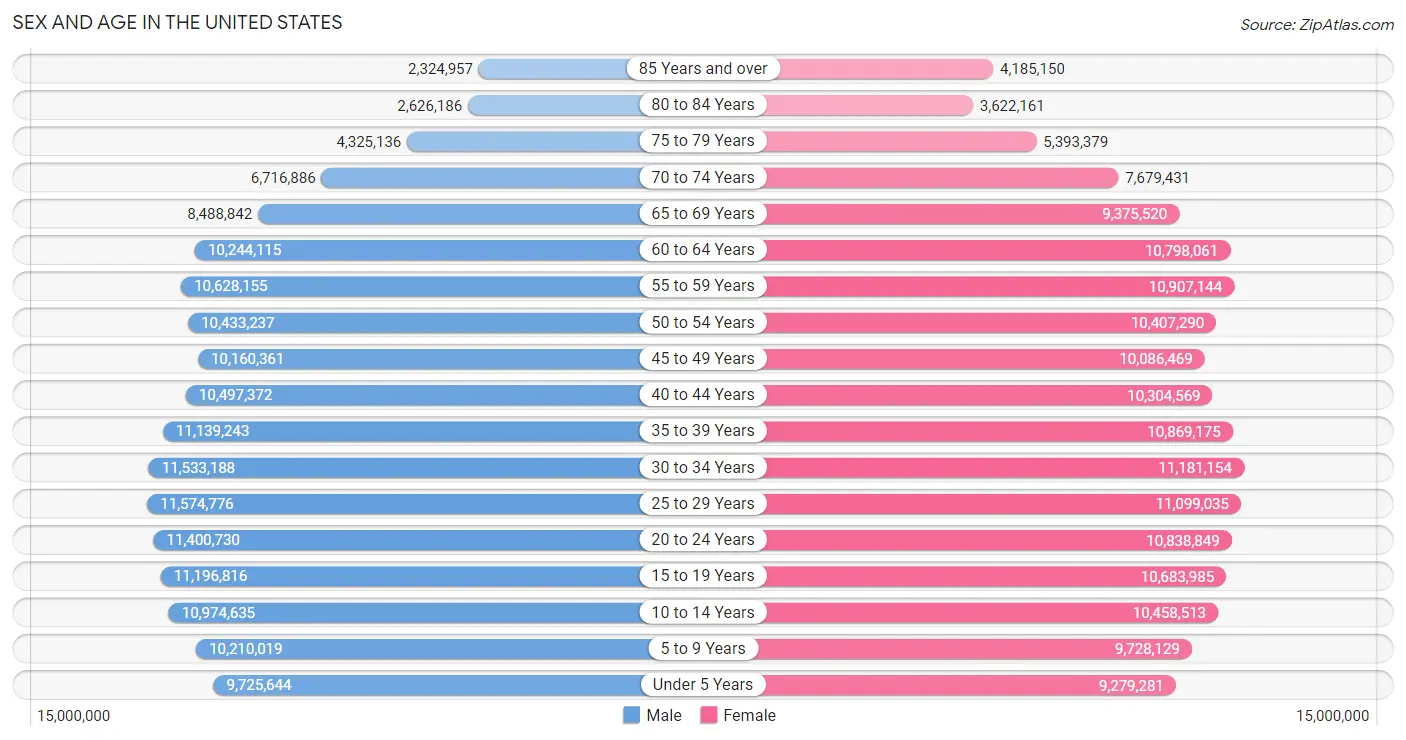
| Age Bracket | Male | Female |
| Under 5 Years | 9,725,644 (5.9%) | 9,279,281 (5.6%) |
| 5 to 9 Years | 10,210,019 (6.2%) | 9,728,129 (5.8%) |
| 10 to 14 Years | 10,974,635 (6.7%) | 10,458,513 (6.3%) |
| 15 to 19 Years | 11,196,816 (6.8%) | 10,683,985 (6.4%) |
| 20 to 24 Years | 11,400,730 (6.9%) | 10,838,849 (6.5%) |
| 25 to 29 Years | 11,574,776 (7.0%) | 11,099,035 (6.7%) |
| 30 to 34 Years | 11,533,188 (7.0%) | 11,181,154 (6.7%) |
| 35 to 39 Years | 11,139,243 (6.8%) | 10,869,175 (6.5%) |
| 40 to 44 Years | 10,497,372 (6.4%) | 10,304,569 (6.2%) |
| 45 to 49 Years | 10,160,361 (6.2%) | 10,086,469 (6.0%) |
| 50 to 54 Years | 10,433,237 (6.4%) | 10,407,290 (6.2%) |
| 55 to 59 Years | 10,628,155 (6.5%) | 10,907,144 (6.5%) |
| 60 to 64 Years | 10,244,115 (6.2%) | 10,798,061 (6.5%) |
| 65 to 69 Years | 8,488,842 (5.2%) | 9,375,520 (5.6%) |
| 70 to 74 Years | 6,716,886 (4.1%) | 7,679,431 (4.6%) |
| 75 to 79 Years | 4,325,136 (2.6%) | 5,393,379 (3.2%) |
| 80 to 84 Years | 2,626,186 (1.6%) | 3,622,161 (2.2%) |
| 85 Years and over | 2,324,957 (1.4%) | 4,185,150 (2.5%) |
| Total | 164,200,298 (100.0%) | 166,897,295 (100.0%) |
Families and Households in the United States
Median Family Size in the United States
The median family size in the United States is 3.18 persons per family, with married-couple families (59,760,581 | 73.4%) accounting for the largest median family size of 3.21 persons per family. On the other hand, single male/father families (6,298,607 | 7.7%) represent the smallest median family size with 2.90 persons per family.
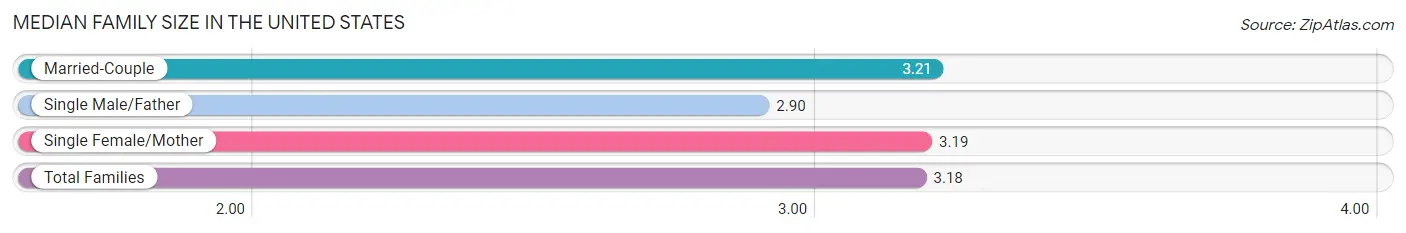
| Family Type | # Families | Family Size |
| Married-Couple | 59,760,581 (73.4%) | 3.21 |
| Single Male/Father | 6,298,607 (7.7%) | 2.90 |
| Single Female/Mother | 15,373,720 (18.9%) | 3.19 |
| Total Families | 81,432,908 (100.0%) | 3.18 |
Median Household Size in the United States
The median household size in the United States is 2.57 persons per household, with single female/mother households (15,373,720 | 12.2%) accounting for the largest median household size of 3.42 persons per household. non-family households (44,303,445 | 35.2%) represent the smallest median household size with 1.27 persons per household.
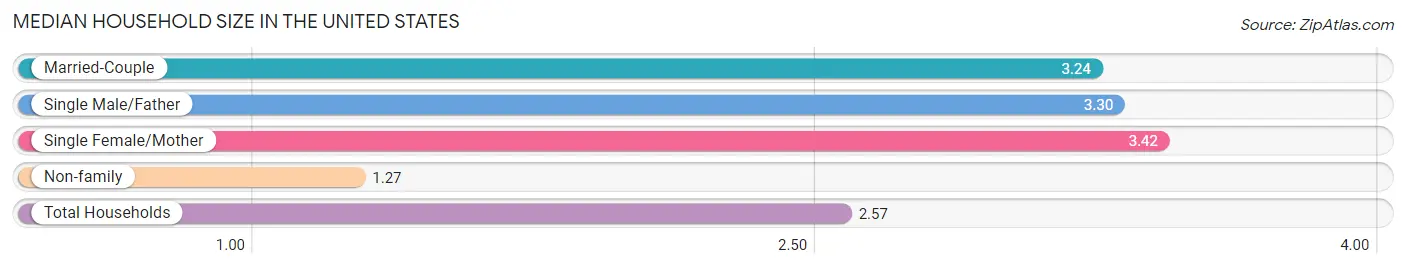
| Household Type | # Households | Household Size |
| Married-Couple | 59,760,581 (47.5%) | 3.24 |
| Single Male/Father | 6,298,607 (5.0%) | 3.30 |
| Single Female/Mother | 15,373,720 (12.2%) | 3.42 |
| Non-family | 44,303,445 (35.2%) | 1.27 |
| Total Households | 125,736,353 (100.0%) | 2.57 |
Household Size by Marriage Status in the United States
Out of a total of 125,736,353 households in the United States, 81,432,908 (64.8%) are family households, while 44,303,445 (35.2%) are nonfamily households. The most numerous type of family households are 2-person households, comprising 35,334,514, and the most common type of nonfamily households are 1-person households, comprising 35,550,232.
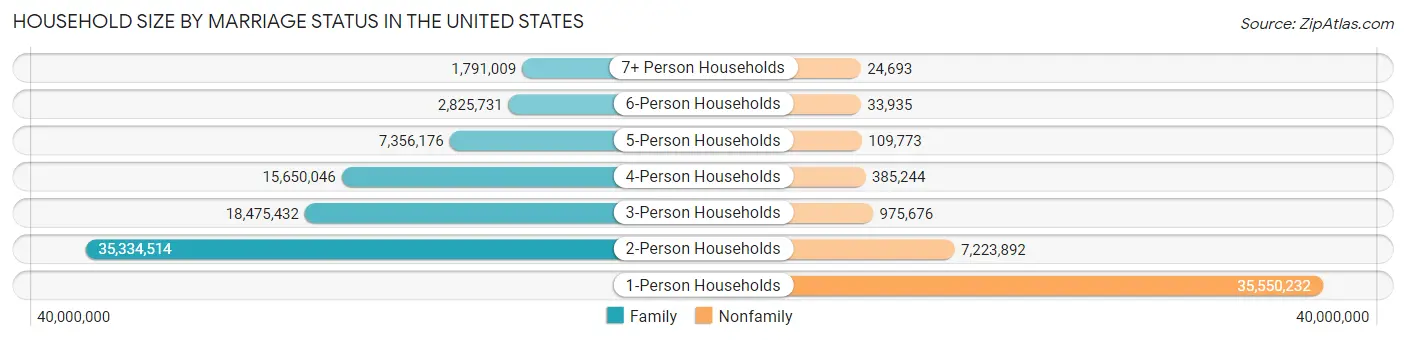
| Household Size | Family Households | Nonfamily Households |
| 1-Person Households | - | 35,550,232 (28.3%) |
| 2-Person Households | 35,334,514 (28.1%) | 7,223,892 (5.8%) |
| 3-Person Households | 18,475,432 (14.7%) | 975,676 (0.8%) |
| 4-Person Households | 15,650,046 (12.4%) | 385,244 (0.3%) |
| 5-Person Households | 7,356,176 (5.9%) | 109,773 (0.1%) |
| 6-Person Households | 2,825,731 (2.2%) | 33,935 (0.0%) |
| 7+ Person Households | 1,791,009 (1.4%) | 24,693 (0.0%) |
| Total | 81,432,908 (64.8%) | 44,303,445 (35.2%) |
Female Fertility in the United States
Fertility by Age in the United States
Average fertility rate in the United States is 52.0 births per 1,000 women. Women in the age bracket of 20 to 34 years have the highest fertility rate with 85.0 births per 1,000 women. Women in the age bracket of 20 to 34 years acount for 70.5% of all women with births.
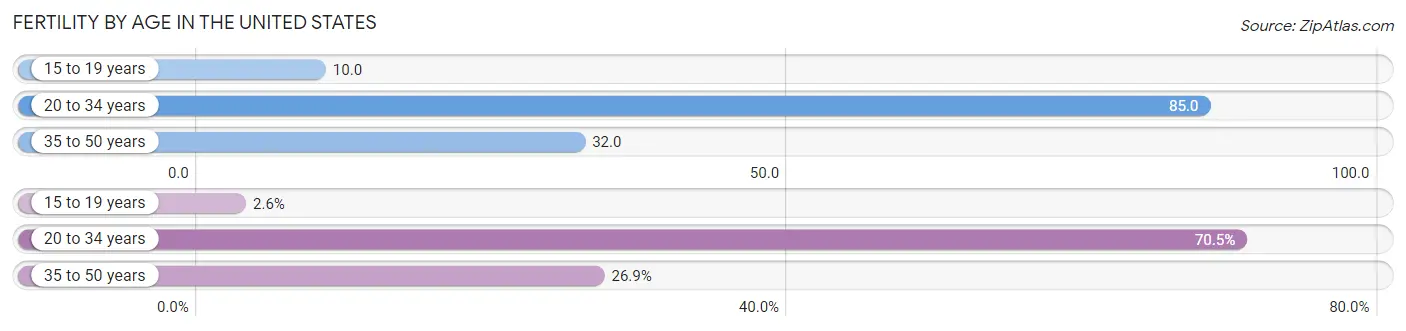
| Age Bracket | Women with Births | Births / 1,000 Women |
| 15 to 19 years | 102,904 (2.6%) | 10.0 |
| 20 to 34 years | 2,808,021 (70.5%) | 85.0 |
| 35 to 50 years | 1,071,479 (26.9%) | 32.0 |
| Total | 3,982,404 (100.0%) | 52.0 |
Fertility by Age by Marriage Status in the United States
67.9% of women with births (3,982,404) in the United States are married. The highest percentage of unmarried women with births falls into 15 to 19 years age bracket with 86.9% of them unmarried at the time of birth, while the lowest percentage of unmarried women with births belong to 35 to 50 years age bracket with 20.1% of them unmarried.
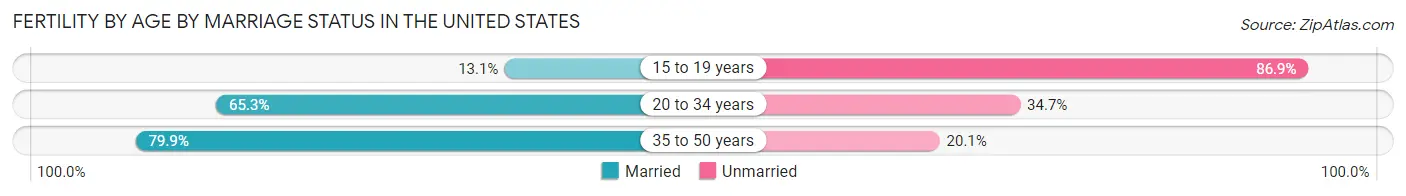
| Age Bracket | Married | Unmarried |
| 15 to 19 years | 13,480 (13.1%) | 89,424 (86.9%) |
| 20 to 34 years | 1,833,638 (65.3%) | 974,383 (34.7%) |
| 35 to 50 years | 856,112 (79.9%) | 215,367 (20.1%) |
| Total | 2,704,052 (67.9%) | 1,278,352 (32.1%) |
Fertility by Education in the United States
Average fertility rate in the United States is 52.0 births per 1,000 women. Women with the education attainment of graduate degree have the highest fertility rate of 62.0 births per 1,000 women, while women with the education attainment of less than high school have the lowest fertility at 34.0 births per 1,000 women. Women with the education attainment of college or associate's degree represent 29.6% of all women with births.
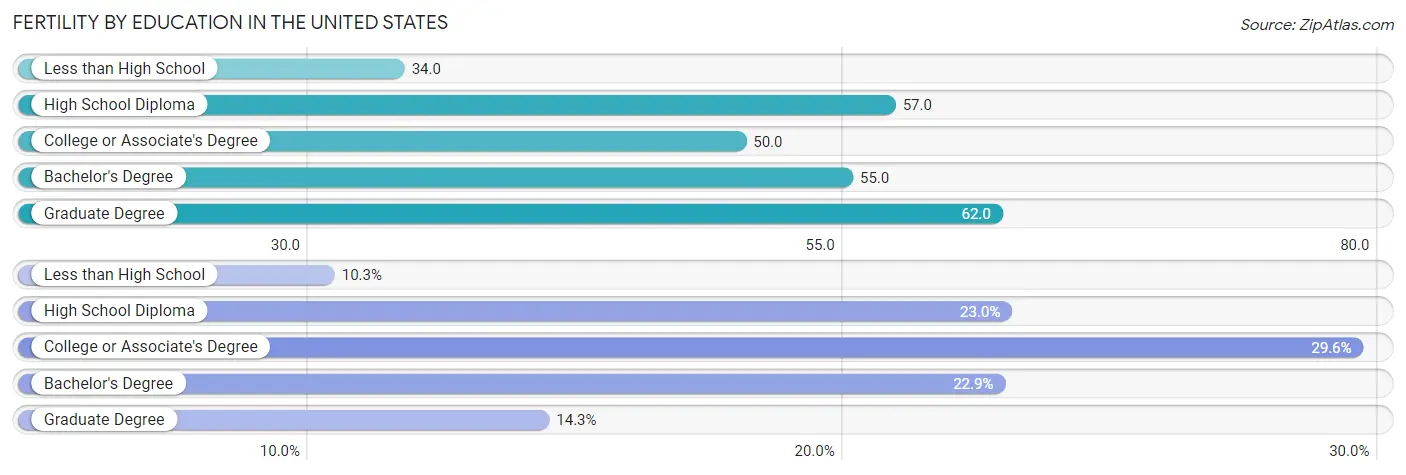
| Educational Attainment | Women with Births | Births / 1,000 Women |
| Less than High School | 409,777 (10.3%) | 34.0 |
| High School Diploma | 915,355 (23.0%) | 57.0 |
| College or Associate's Degree | 1,177,395 (29.6%) | 50.0 |
| Bachelor's Degree | 909,814 (22.9%) | 55.0 |
| Graduate Degree | 570,063 (14.3%) | 62.0 |
| Total | 3,982,404 (100.0%) | 52.0 |
Fertility by Education by Marriage Status in the United States
32.1% of women with births in the United States are unmarried. Women with the educational attainment of graduate degree are most likely to be married with 92.3% of them married at childbirth, while women with the educational attainment of less than high school are least likely to be married with 50.7% of them unmarried at childbirth.
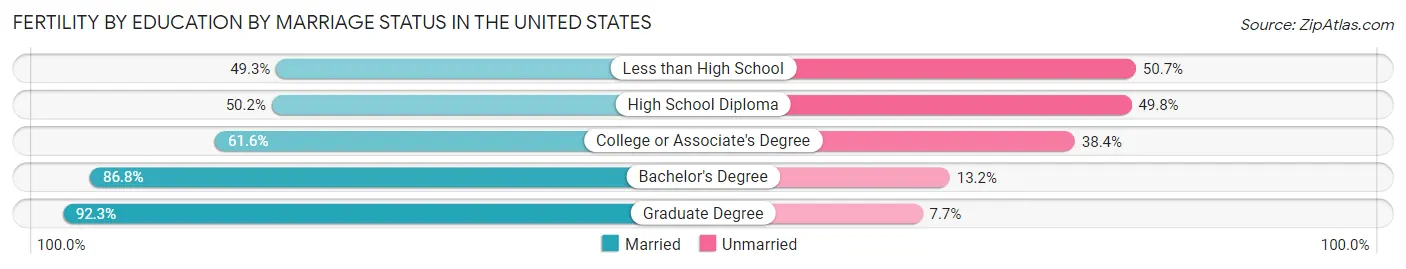
| Educational Attainment | Married | Unmarried |
| Less than High School | 202,020 (49.3%) | 207,757 (50.7%) |
| High School Diploma | 459,508 (50.2%) | 455,847 (49.8%) |
| College or Associate's Degree | 725,275 (61.6%) | 452,120 (38.4%) |
| Bachelor's Degree | 789,719 (86.8%) | 120,095 (13.2%) |
| Graduate Degree | 526,168 (92.3%) | 43,895 (7.7%) |
| Total | 2,704,052 (67.9%) | 1,278,352 (32.1%) |
Income in the United States
Income Overview in the United States
Per Capita Income in the United States is $41,261, while median incomes of families and households are $92,646 and $75,149 respectively.
| Characteristic | Number | Measure |
| Per Capita Income | 331,097,593 | $41,261 |
| Median Family Income | 81,432,908 | $92,646 |
| Mean Family Income | 81,432,908 | $124,530 |
| Median Household Income | 125,736,353 | $75,149 |
| Mean Household Income | 125,736,353 | $105,833 |
| Income Deficit | 81,432,908 | $11,046 |
| Wage / Income Gap (%) | 331,097,593 | 27.98% |
| Wage / Income Gap ($) | 331,097,593 | 72.02¢ per $1 |
| Gini / Inequality Index | 331,097,593 | 0.48 |
Earnings by Sex in the United States
Average Earnings in the United States are $42,131, $49,109 for men and $35,367 for women, a difference of 28.0%.
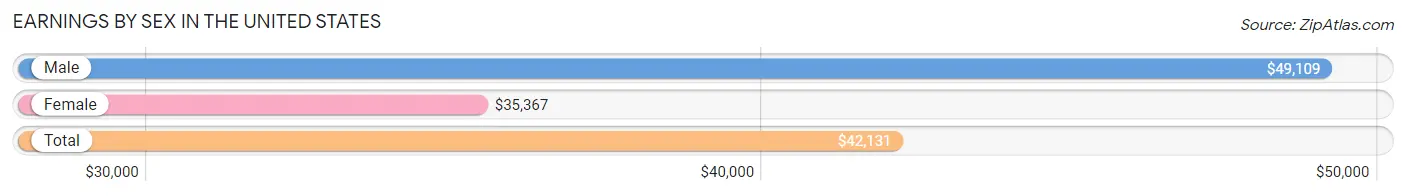
| Sex | Number | Average Earnings |
| Male | 93,031,893 (52.8%) | $49,109 |
| Female | 83,005,608 (47.1%) | $35,367 |
| Total | 176,037,501 (100.0%) | $42,131 |
Earnings by Sex by Income Bracket in the United States
The most common earnings brackets in the United States are $100,000+ for men (18,706,194 | 20.1%) and $100,000+ for women (8,611,012 | 10.4%).
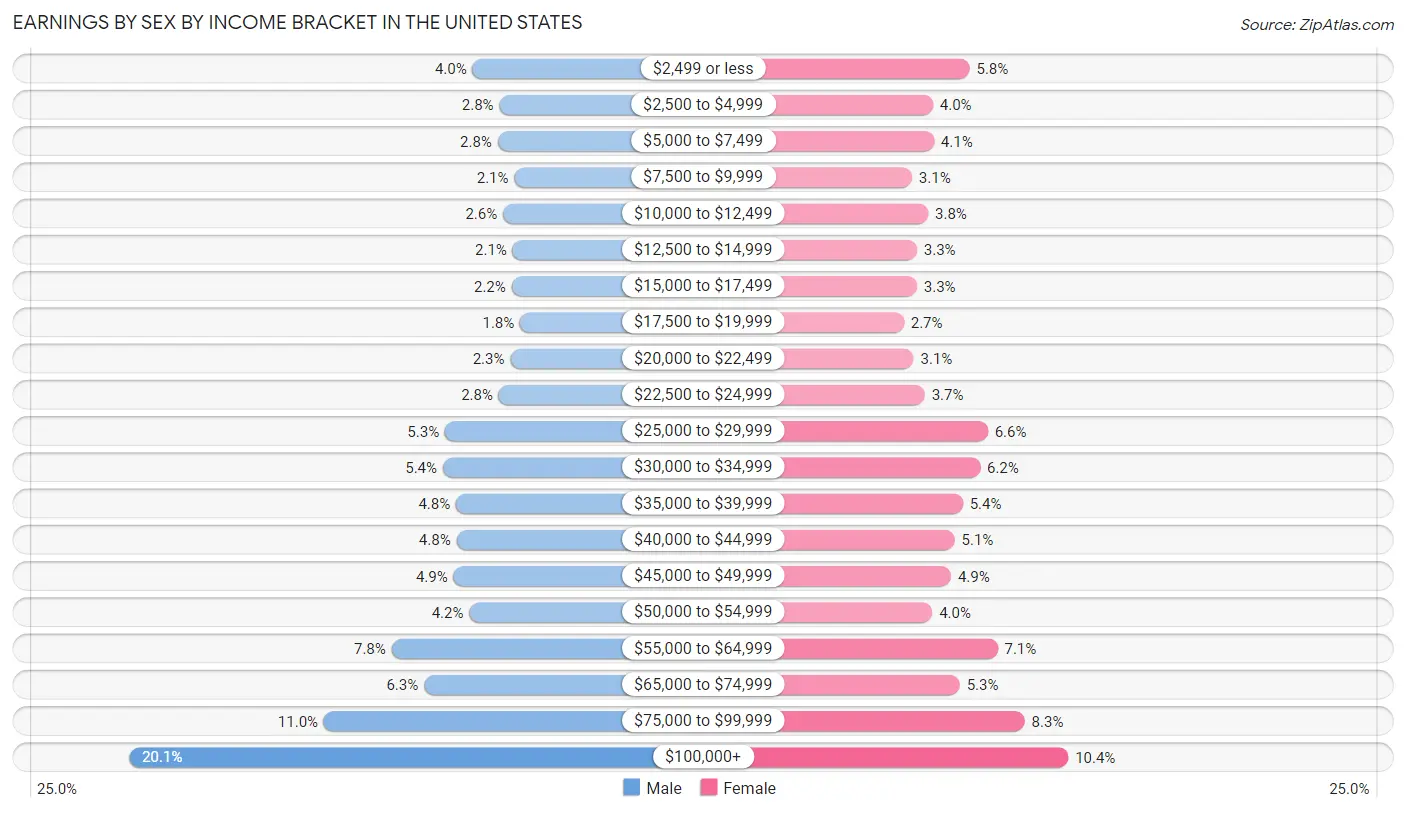
| Income | Male | Female |
| $2,499 or less | 3,738,668 (4.0%) | 4,770,301 (5.8%) |
| $2,500 to $4,999 | 2,568,628 (2.8%) | 3,343,215 (4.0%) |
| $5,000 to $7,499 | 2,644,051 (2.8%) | 3,386,843 (4.1%) |
| $7,500 to $9,999 | 1,918,335 (2.1%) | 2,532,065 (3.0%) |
| $10,000 to $12,499 | 2,413,452 (2.6%) | 3,161,115 (3.8%) |
| $12,500 to $14,999 | 1,994,499 (2.1%) | 2,726,732 (3.3%) |
| $15,000 to $17,499 | 2,041,359 (2.2%) | 2,722,627 (3.3%) |
| $17,500 to $19,999 | 1,668,815 (1.8%) | 2,212,911 (2.7%) |
| $20,000 to $22,499 | 2,091,590 (2.2%) | 2,597,743 (3.1%) |
| $22,500 to $24,999 | 2,598,059 (2.8%) | 3,033,756 (3.6%) |
| $25,000 to $29,999 | 4,938,949 (5.3%) | 5,478,837 (6.6%) |
| $30,000 to $34,999 | 5,034,040 (5.4%) | 5,181,883 (6.2%) |
| $35,000 to $39,999 | 4,455,777 (4.8%) | 4,506,829 (5.4%) |
| $40,000 to $44,999 | 4,434,983 (4.8%) | 4,190,064 (5.1%) |
| $45,000 to $49,999 | 4,572,400 (4.9%) | 4,053,338 (4.9%) |
| $50,000 to $54,999 | 3,879,862 (4.2%) | 3,324,321 (4.0%) |
| $55,000 to $64,999 | 7,262,755 (7.8%) | 5,861,594 (7.1%) |
| $65,000 to $74,999 | 5,851,668 (6.3%) | 4,393,815 (5.3%) |
| $75,000 to $99,999 | 10,217,809 (11.0%) | 6,916,607 (8.3%) |
| $100,000+ | 18,706,194 (20.1%) | 8,611,012 (10.4%) |
| Total | 93,031,893 (100.0%) | 83,005,608 (100.0%) |
Earnings by Sex by Educational Attainment in the United States
Average earnings in the United States are $56,671 for men and $41,333 for women, a difference of 27.1%. Men with an educational attainment of graduate degree enjoy the highest average annual earnings of $105,983, while those with less than high school education earn the least with $34,709. Women with an educational attainment of graduate degree earn the most with the average annual earnings of $72,916, while those with less than high school education have the smallest earnings of $22,680.
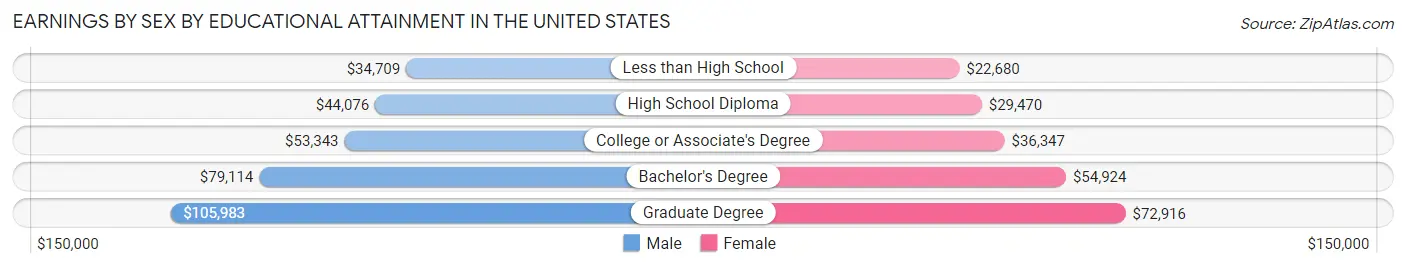
| Educational Attainment | Male Income | Female Income |
| Less than High School | $34,709 | $22,680 |
| High School Diploma | $44,076 | $29,470 |
| College or Associate's Degree | $53,343 | $36,347 |
| Bachelor's Degree | $79,114 | $54,924 |
| Graduate Degree | $105,983 | $72,916 |
| Total | $56,671 | $41,333 |
Family Income in the United States
Family Income Brackets in the United States
According to the the United States family income data, there are 16,449,447 families falling into the $100,000 to $149,999 income range, which is the most common income bracket and makes up 20.2% of all families. Conversely, the $10,000 to $14,999 income bracket is the least frequent group with only 1,465,792 families (1.8%) belonging to this category.
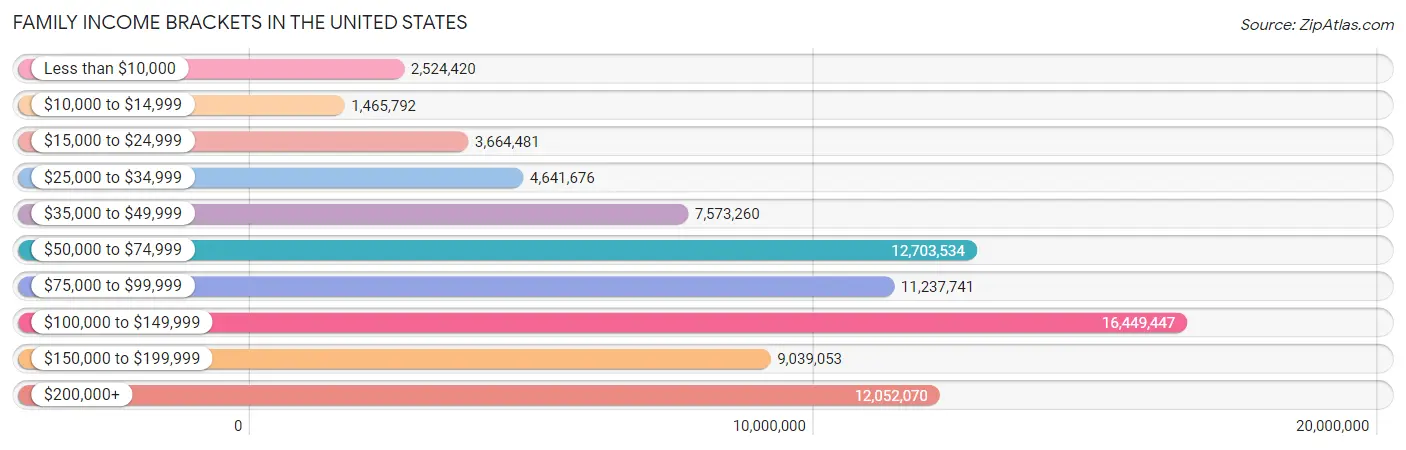
| Income Bracket | # Families | % Families |
| Less than $10,000 | 2,524,420 | 3.1% |
| $10,000 to $14,999 | 1,465,792 | 1.8% |
| $15,000 to $24,999 | 3,664,481 | 4.5% |
| $25,000 to $34,999 | 4,641,676 | 5.7% |
| $35,000 to $49,999 | 7,573,260 | 9.3% |
| $50,000 to $74,999 | 12,703,534 | 15.6% |
| $75,000 to $99,999 | 11,237,741 | 13.8% |
| $100,000 to $149,999 | 16,449,447 | 20.2% |
| $150,000 to $199,999 | 9,039,053 | 11.1% |
| $200,000+ | 12,052,070 | 14.8% |
Family Income by Famaliy Size in the United States
4-person families (14,817,641 | 18.2%) account for the highest median family income in the United States with $114,425 per family, while 2-person families (37,874,563 | 46.5%) have the highest median income of $40,554 per family member.
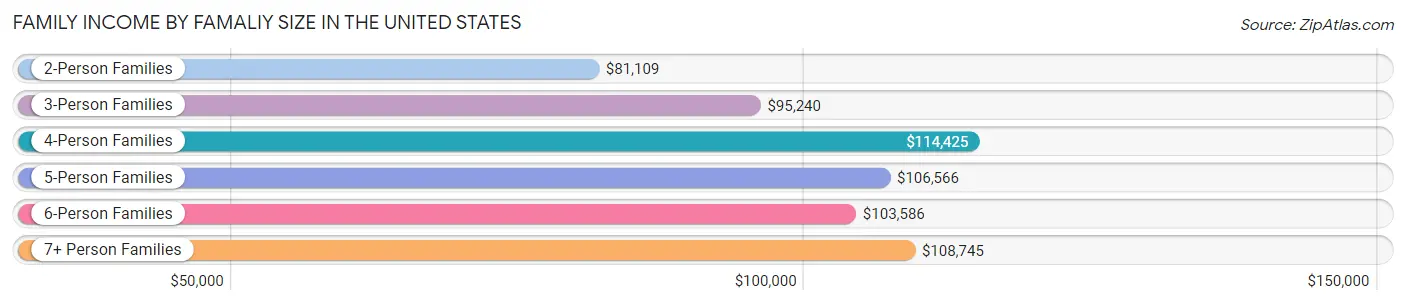
| Income Bracket | # Families | Median Income |
| 2-Person Families | 37,874,563 (46.5%) | $81,109 |
| 3-Person Families | 18,061,999 (22.2%) | $95,240 |
| 4-Person Families | 14,817,641 (18.2%) | $114,425 |
| 5-Person Families | 6,693,222 (8.2%) | $106,566 |
| 6-Person Families | 2,494,411 (3.1%) | $103,586 |
| 7+ Person Families | 1,491,072 (1.8%) | $108,745 |
| Total | 81,432,908 (100.0%) | $92,646 |
Family Income by Number of Earners in the United States
The median family income in the United States is $92,646, with families comprising 3+ earners (9,817,758) having the highest median family income of $145,016, while families with no earners (12,017,878) have the lowest median family income of $49,345, accounting for 12.1% and 14.8% of families, respectively.
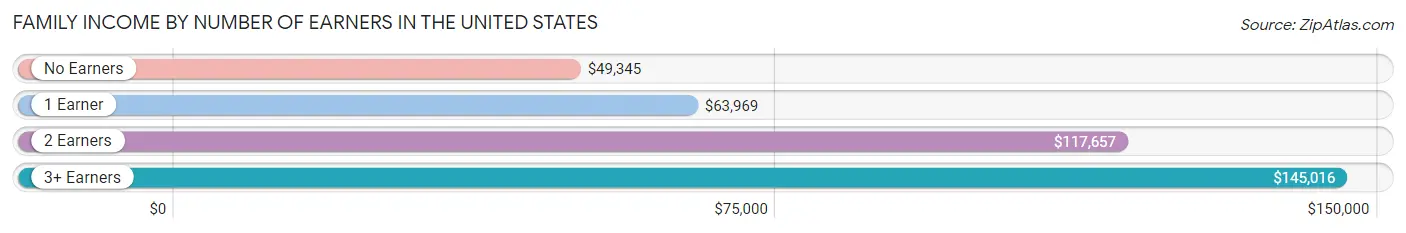
| Number of Earners | # Families | Median Income |
| No Earners | 12,017,878 (14.8%) | $49,345 |
| 1 Earner | 25,766,173 (31.6%) | $63,969 |
| 2 Earners | 33,831,099 (41.5%) | $117,657 |
| 3+ Earners | 9,817,758 (12.1%) | $145,016 |
| Total | 81,432,908 (100.0%) | $92,646 |
Household Income in the United States
Household Income Brackets in the United States
With 21,500,916 households falling in the category, the $100,000 to $149,999 income range is the most frequent in the United States, accounting for 17.1% of all households. In contrast, only 4,777,981 households (3.8%) fall into the $10,000 to $14,999 income bracket, making it the least populous group.
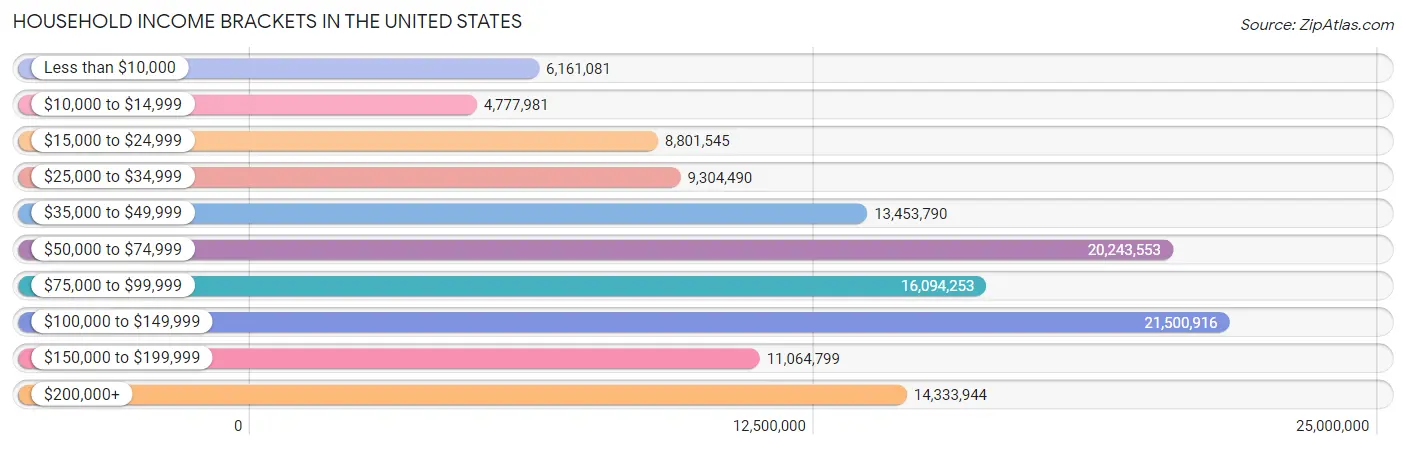
| Income Bracket | # Households | % Households |
| Less than $10,000 | 6,161,081 | 4.9% |
| $10,000 to $14,999 | 4,777,981 | 3.8% |
| $15,000 to $24,999 | 8,801,545 | 7.0% |
| $25,000 to $34,999 | 9,304,490 | 7.4% |
| $35,000 to $49,999 | 13,453,790 | 10.7% |
| $50,000 to $74,999 | 20,243,553 | 16.1% |
| $75,000 to $99,999 | 16,094,253 | 12.8% |
| $100,000 to $149,999 | 21,500,916 | 17.1% |
| $150,000 to $199,999 | 11,064,799 | 8.8% |
| $200,000+ | 14,333,944 | 11.4% |
Household Income by Householder Age in the United States
The median household income in the United States is $75,149, with the highest median household income of $90,808 found in the 45 to 64 years age bracket for the primary householder. A total of 46,462,494 households (36.9%) fall into this category. Meanwhile, the 15 to 24 years age bracket for the primary householder has the lowest median household income of $41,114, with 4,746,998 households (3.8%) in this group.
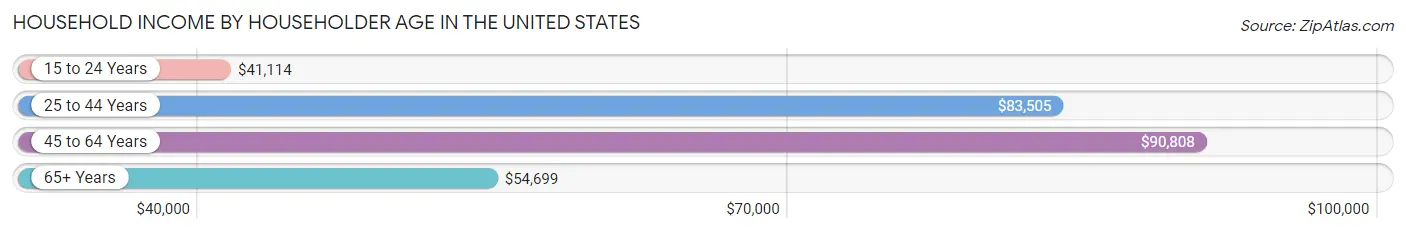
| Income Bracket | # Households | Median Income |
| 15 to 24 Years | 4,746,998 (3.8%) | $41,114 |
| 25 to 44 Years | 40,935,085 (32.6%) | $83,505 |
| 45 to 64 Years | 46,462,494 (36.9%) | $90,808 |
| 65+ Years | 33,591,776 (26.7%) | $54,699 |
| Total | 125,736,353 (100.0%) | $75,149 |
Poverty in the United States
Income Below Poverty by Sex and Age in the United States
With 11.3% poverty level for males and 13.7% for females among the residents of the United States, under 5 year old males and 18 to 24 year old females are the most vulnerable to poverty, with 1,716,029 males (18.0%) and 2,965,894 females (21.6%) in their respective age groups living below the poverty level.
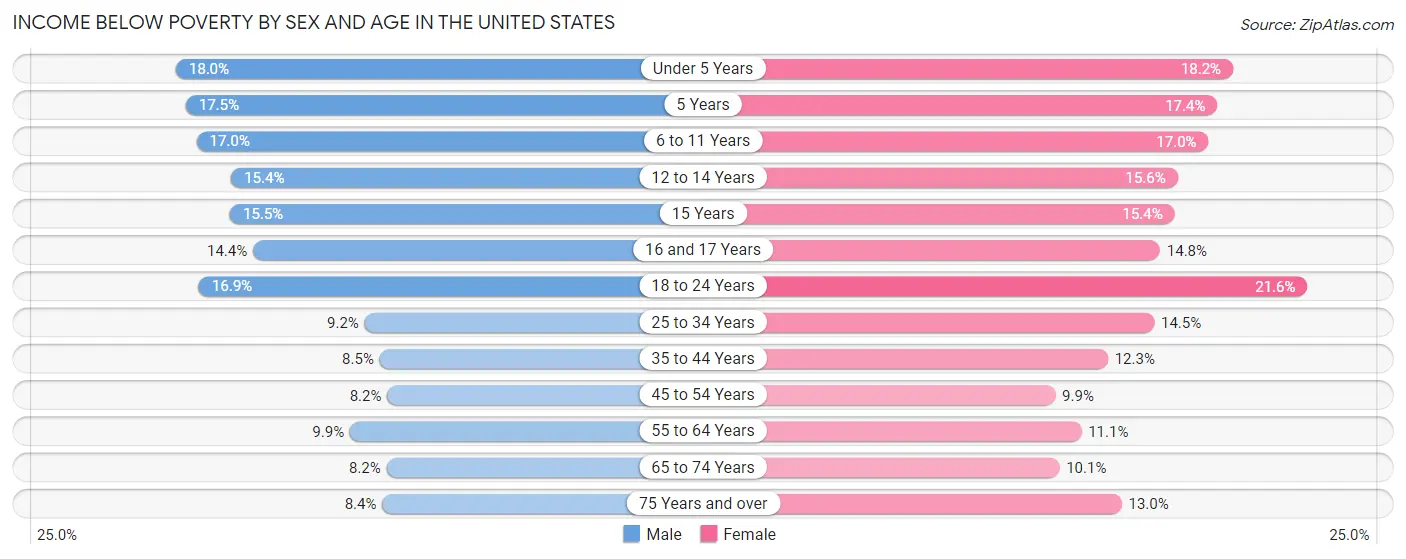
| Age Bracket | Male | Female |
| Under 5 Years | 1,716,029 (18.0%) | 1,653,500 (18.1%) |
| 5 Years | 343,218 (17.5%) | 325,304 (17.4%) |
| 6 to 11 Years | 2,100,532 (17.0%) | 1,998,340 (17.0%) |
| 12 to 14 Years | 1,002,438 (15.4%) | 966,440 (15.6%) |
| 15 Years | 339,091 (15.5%) | 324,669 (15.4%) |
| 16 and 17 Years | 623,439 (14.4%) | 609,351 (14.8%) |
| 18 to 24 Years | 2,436,020 (16.9%) | 2,965,894 (21.6%) |
| 25 to 34 Years | 2,072,903 (9.2%) | 3,214,333 (14.5%) |
| 35 to 44 Years | 1,799,531 (8.5%) | 2,603,074 (12.3%) |
| 45 to 54 Years | 1,654,399 (8.2%) | 2,024,014 (9.9%) |
| 55 to 64 Years | 2,039,358 (9.9%) | 2,400,255 (11.1%) |
| 65 to 74 Years | 1,229,026 (8.2%) | 1,702,847 (10.1%) |
| 75 Years and over | 753,348 (8.4%) | 1,624,231 (13.0%) |
| Total | 18,109,332 (11.3%) | 22,412,252 (13.7%) |
Income Above Poverty by Sex and Age in the United States
According to the poverty statistics in the United States, males aged 45 to 54 years and females aged 45 to 54 years are the age groups that are most secure financially, with 91.8% of males and 90.1% of females in these age groups living above the poverty line.
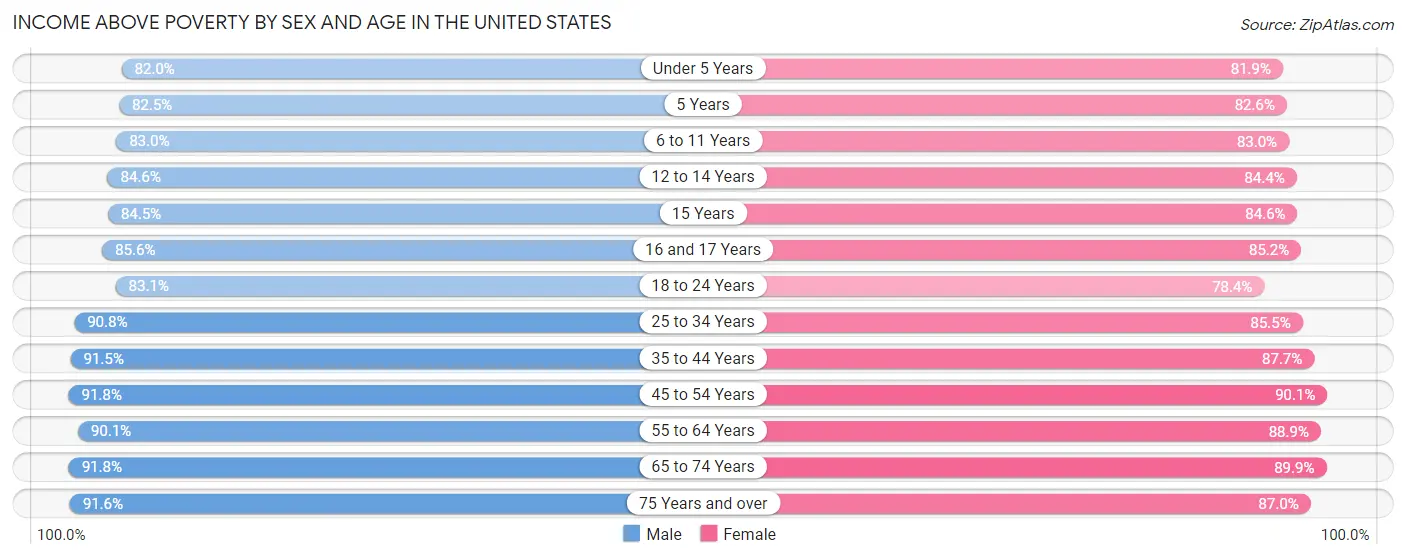
| Age Bracket | Male | Female |
| Under 5 Years | 7,828,521 (82.0%) | 7,456,485 (81.9%) |
| 5 Years | 1,615,466 (82.5%) | 1,541,796 (82.6%) |
| 6 to 11 Years | 10,243,322 (83.0%) | 9,752,218 (83.0%) |
| 12 to 14 Years | 5,503,106 (84.6%) | 5,236,877 (84.4%) |
| 15 Years | 1,853,039 (84.5%) | 1,777,706 (84.6%) |
| 16 and 17 Years | 3,706,624 (85.6%) | 3,517,847 (85.2%) |
| 18 to 24 Years | 11,970,126 (83.1%) | 10,766,638 (78.4%) |
| 25 to 34 Years | 20,398,806 (90.8%) | 18,962,921 (85.5%) |
| 35 to 44 Years | 19,310,595 (91.5%) | 18,500,018 (87.7%) |
| 45 to 54 Years | 18,597,721 (91.8%) | 18,413,176 (90.1%) |
| 55 to 64 Years | 18,552,169 (90.1%) | 19,205,776 (88.9%) |
| 65 to 74 Years | 13,763,780 (91.8%) | 15,173,040 (89.9%) |
| 75 Years and over | 8,219,399 (91.6%) | 10,886,692 (87.0%) |
| Total | 141,562,674 (88.7%) | 141,191,190 (86.3%) |
Income Below Poverty Among Married-Couple Families in the United States
The poverty statistics for married-couple families in the United States show that 4.5% or 2,666,469 of the total 59,760,581 families live below the poverty line. Families with 5 or more children have the highest poverty rate of 22.7%, comprising of 104,403 families. On the other hand, families with no children have the lowest poverty rate of 3.5%, which includes 1,211,821 families.
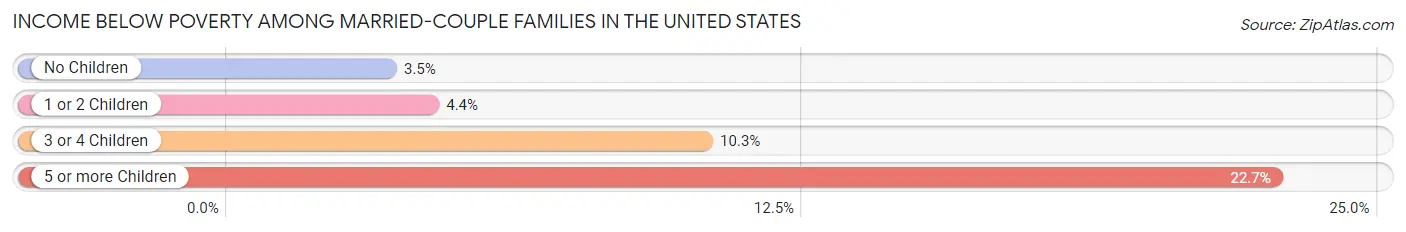
| Children | Above Poverty | Below Poverty |
| No Children | 33,845,050 (96.5%) | 1,211,821 (3.5%) |
| 1 or 2 Children | 18,560,139 (95.6%) | 850,343 (4.4%) |
| 3 or 4 Children | 4,333,921 (89.7%) | 499,902 (10.3%) |
| 5 or more Children | 355,002 (77.3%) | 104,403 (22.7%) |
| Total | 57,094,112 (95.5%) | 2,666,469 (4.5%) |
Income Below Poverty Among Single-Parent Households in the United States
According to the poverty data in the United States, 12.4% or 783,254 single-father households and 24.1% or 3,701,444 single-mother households are living below the poverty line. Among single-father households, those with 5 or more children have the highest poverty rate, with 17,008 households (39.7%) experiencing poverty. Likewise, among single-mother households, those with 5 or more children have the highest poverty rate, with 116,298 households (69.4%) falling below the poverty line.
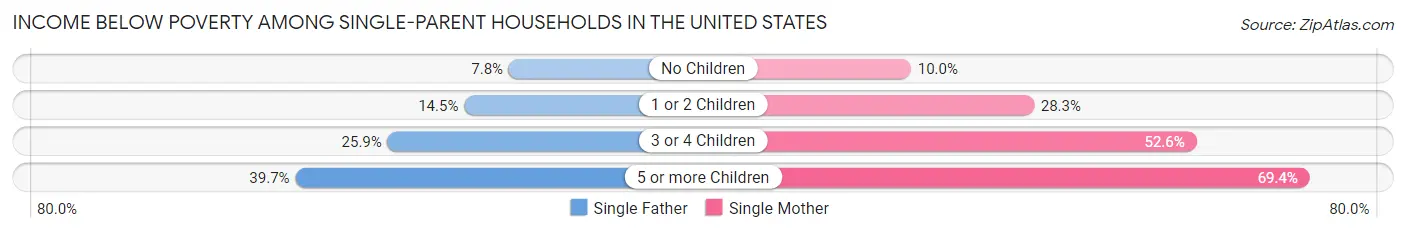
| Children | Single Father | Single Mother |
| No Children | 227,988 (7.8%) | 601,809 (10.0%) |
| 1 or 2 Children | 415,694 (14.5%) | 2,157,243 (28.3%) |
| 3 or 4 Children | 122,564 (25.9%) | 826,094 (52.6%) |
| 5 or more Children | 17,008 (39.7%) | 116,298 (69.4%) |
| Total | 783,254 (12.4%) | 3,701,444 (24.1%) |
Income Below Poverty Among Married-Couple vs Single-Parent Households in the United States
The poverty data for the United States shows that 2,666,469 of the married-couple family households (4.5%) and 4,484,698 of the single-parent households (20.7%) are living below the poverty level. Within the married-couple family households, those with 5 or more children have the highest poverty rate, with 104,403 households (22.7%) falling below the poverty line. Among the single-parent households, those with 5 or more children have the highest poverty rate, with 133,306 household (63.4%) living below poverty.
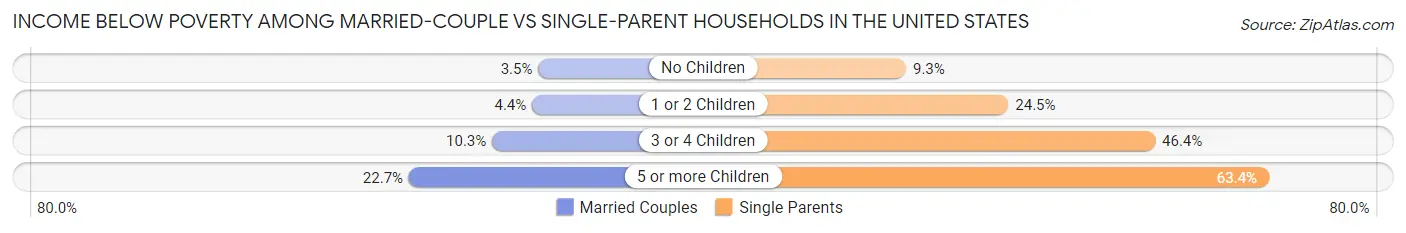
| Children | Married-Couple Families | Single-Parent Households |
| No Children | 1,211,821 (3.5%) | 829,797 (9.3%) |
| 1 or 2 Children | 850,343 (4.4%) | 2,572,937 (24.5%) |
| 3 or 4 Children | 499,902 (10.3%) | 948,658 (46.4%) |
| 5 or more Children | 104,403 (22.7%) | 133,306 (63.4%) |
| Total | 2,666,469 (4.5%) | 4,484,698 (20.7%) |
Employment Characteristics in the United States
Employment by Class of Employer in the United States
Among the 156,703,623 employed individuals in the United States, private company employees (104,816,245 | 66.9%), not-for-profit organizations (13,232,766 | 8.4%), and local government employees (11,326,003 | 7.2%) make up the most common classes of employment.
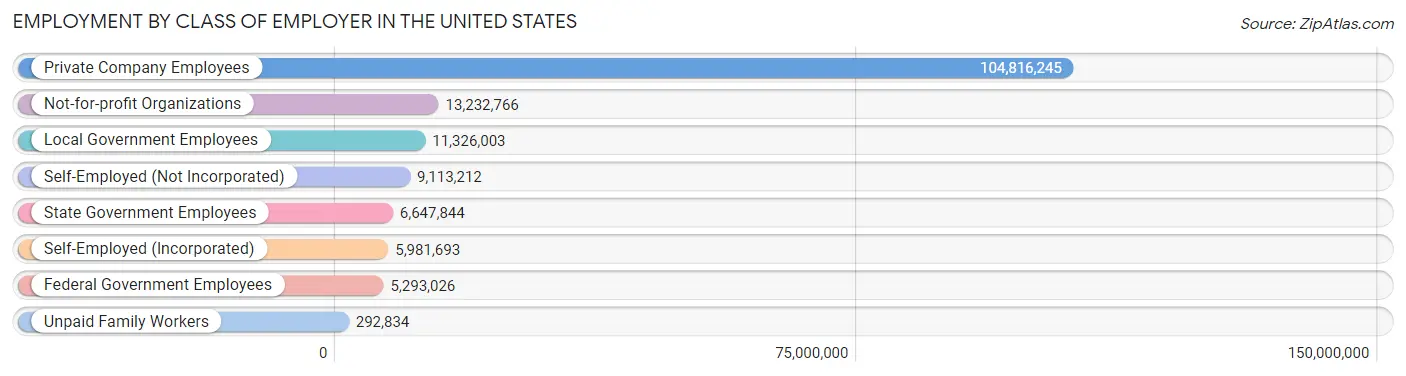
| Employer Class | # Employees | % Employees |
| Private Company Employees | 104,816,245 | 66.9% |
| Self-Employed (Incorporated) | 5,981,693 | 3.8% |
| Self-Employed (Not Incorporated) | 9,113,212 | 5.8% |
| Not-for-profit Organizations | 13,232,766 | 8.4% |
| Local Government Employees | 11,326,003 | 7.2% |
| State Government Employees | 6,647,844 | 4.2% |
| Federal Government Employees | 5,293,026 | 3.4% |
| Unpaid Family Workers | 292,834 | 0.2% |
| Total | 156,703,623 | 100.0% |
Employment Status by Age in the United States
According to the labor force statistics for the United States, out of the total population over 16 years of age (266,411,973), 63.5% or 169,171,603 individuals are in the labor force, with 5.3% or 8,966,095 of them unemployed. The age group with the highest labor force participation rate is 25 to 29 years, with 83.6% or 18,955,306 individuals in the labor force. Within the labor force, the 16 to 19 years age range has the highest percentage of unemployed individuals, with 14.8% or 1,022,023 of them being unemployed.
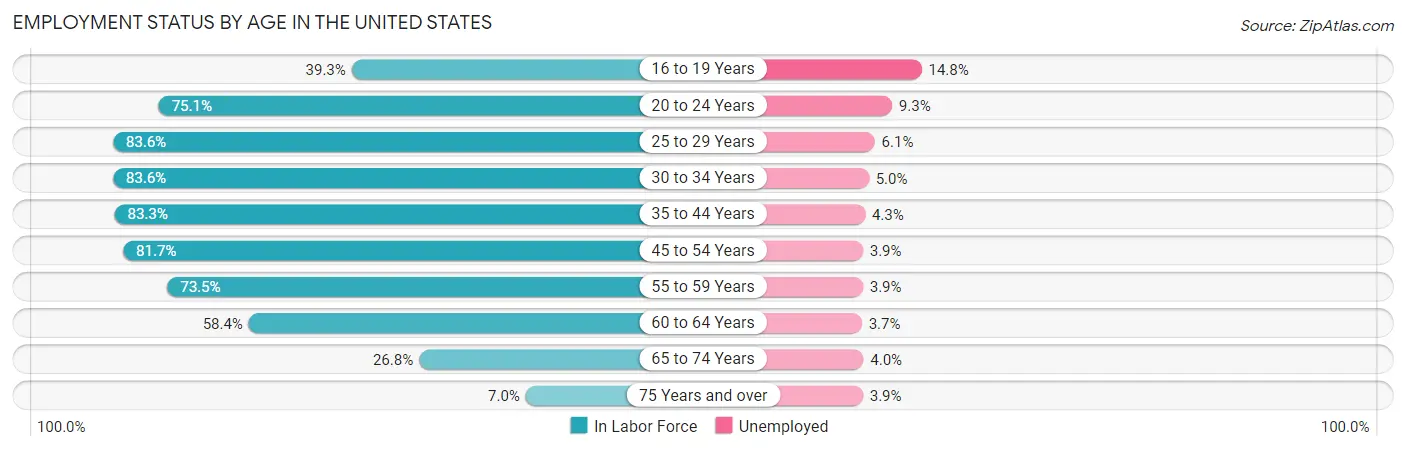
| Age Bracket | In Labor Force | Unemployed |
| 16 to 19 Years | 6,905,561 (39.3%) | 1,022,023 (14.8%) |
| 20 to 24 Years | 16,701,924 (75.1%) | 1,553,279 (9.3%) |
| 25 to 29 Years | 18,955,306 (83.6%) | 1,156,274 (6.1%) |
| 30 to 34 Years | 18,989,190 (83.6%) | 949,460 (5.0%) |
| 35 to 44 Years | 35,661,029 (83.3%) | 1,533,424 (4.3%) |
| 45 to 54 Years | 33,568,371 (81.7%) | 1,309,166 (3.9%) |
| 55 to 59 Years | 15,828,445 (73.5%) | 617,309 (3.9%) |
| 60 to 64 Years | 12,288,631 (58.4%) | 454,679 (3.7%) |
| 65 to 74 Years | 8,645,862 (26.8%) | 345,834 (4.0%) |
| 75 Years and over | 1,573,388 (7.0%) | 61,362 (3.9%) |
| Total | 169,171,603 (63.5%) | 8,966,095 (5.3%) |
Employment Status by Educational Attainment in the United States
According to labor force statistics for the United States, 78.7% of individuals (135,256,452) out of the total population between 25 and 64 years of age (171,863,344) are in the labor force, with 4.5% or 6,086,540 of them being unemployed. The group with the highest labor force participation rate are those with the educational attainment of bachelor's degree or higher, with 87.3% or 53,697,668 individuals in the labor force. Within the labor force, individuals with less than high school education have the highest percentage of unemployment, with 7.8% or 830,714 of them being unemployed.
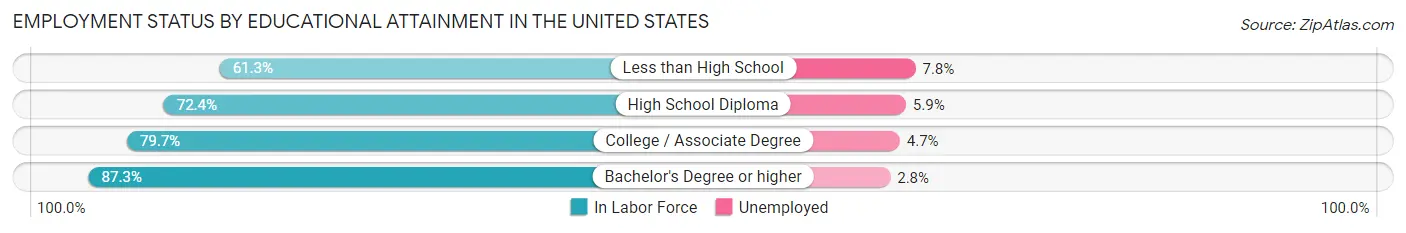
| Educational Attainment | In Labor Force | Unemployed |
| Less than High School | 10,650,180 (61.3%) | 1,355,162 (7.8%) |
| High School Diploma | 31,259,604 (72.4%) | 2,547,399 (5.9%) |
| College / Associate Degree | 39,693,687 (79.7%) | 2,340,782 (4.7%) |
| Bachelor's Degree or higher | 53,697,668 (87.3%) | 1,722,262 (2.8%) |
| Total | 135,256,452 (78.7%) | 7,733,850 (4.5%) |
Employment Occupations by Sex in the United States
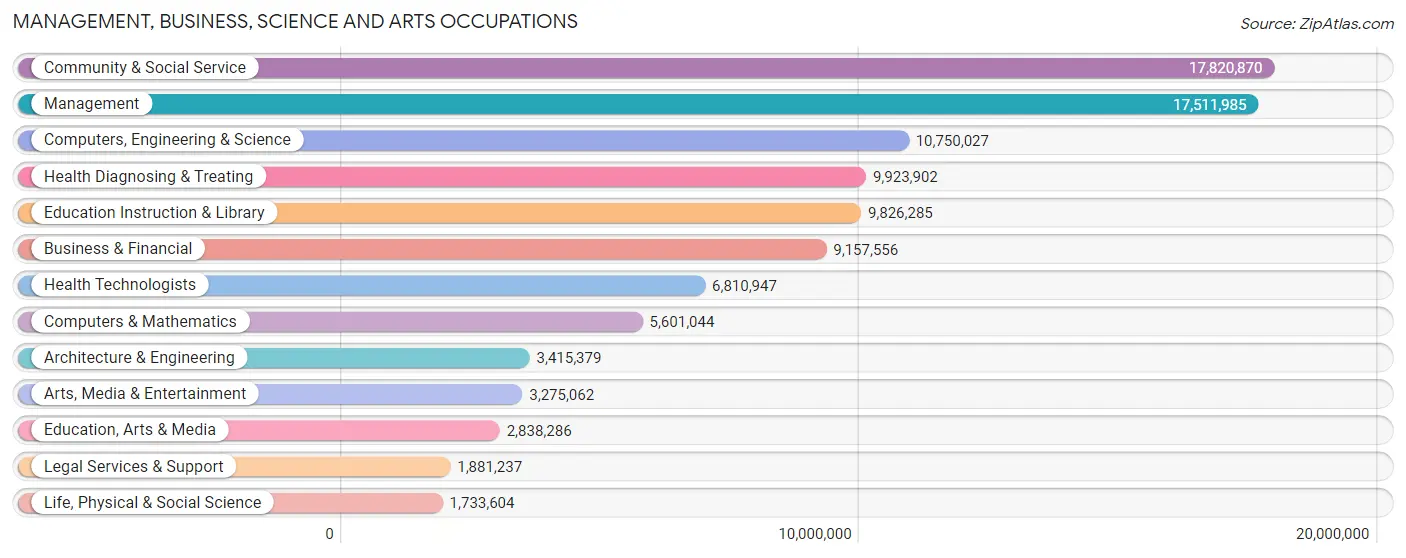
Management, Business, Science and Arts Occupations
The most common Management, Business, Science and Arts occupations in the United States are Community & Social Service (17,820,870 | 11.2%), Management (17,511,985 | 11.0%), Computers, Engineering & Science (10,750,027 | 6.8%), Health Diagnosing & Treating (9,923,902 | 6.2%), and Education Instruction & Library (9,826,285 | 6.2%).
Management, Business, Science and Arts Occupations by Sex
Within the Management, Business, Science and Arts occupations in the United States, the most male-oriented occupations are Architecture & Engineering (83.7%), Computers & Mathematics (74.2%), and Computers, Engineering & Science (73.7%), while the most female-oriented occupations are Health Diagnosing & Treating (74.7%), Health Technologists (74.1%), and Education Instruction & Library (72.7%).
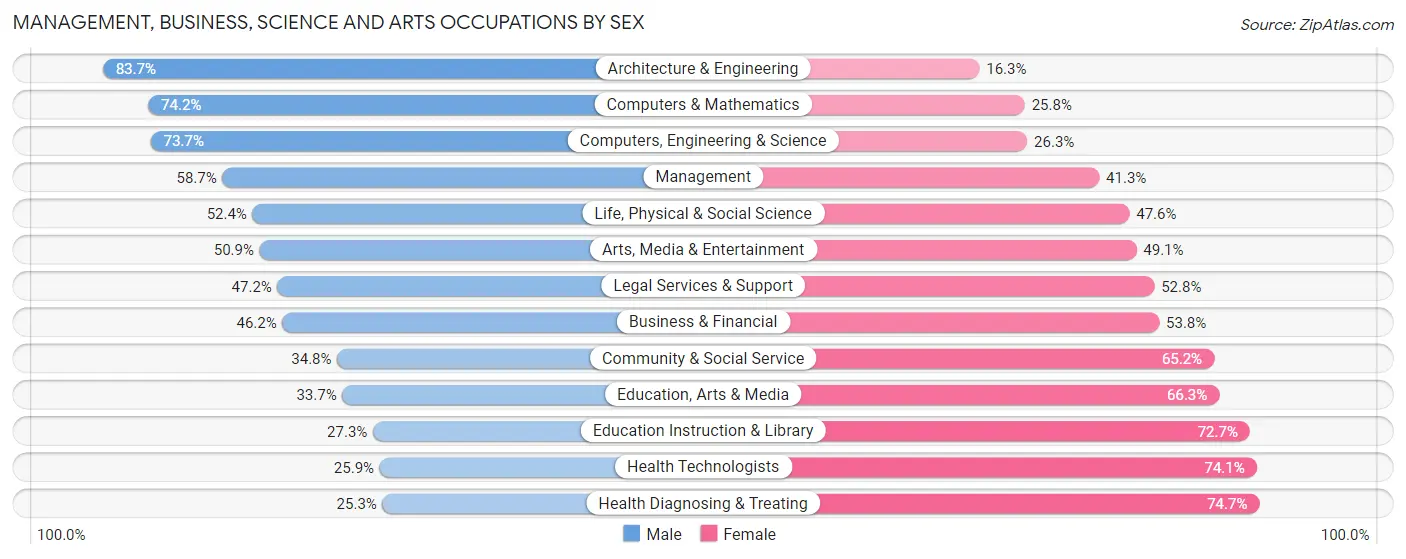
| Occupation | Male | Female |
| Management | 10,279,869 (58.7%) | 7,232,116 (41.3%) |
| Business & Financial | 4,229,692 (46.2%) | 4,927,864 (53.8%) |
| Computers, Engineering & Science | 7,924,695 (73.7%) | 2,825,332 (26.3%) |
| Computers & Mathematics | 4,157,123 (74.2%) | 1,443,921 (25.8%) |
| Architecture & Engineering | 2,858,760 (83.7%) | 556,619 (16.3%) |
| Life, Physical & Social Science | 908,812 (52.4%) | 824,792 (47.6%) |
| Community & Social Service | 6,194,394 (34.8%) | 11,626,476 (65.2%) |
| Education, Arts & Media | 956,112 (33.7%) | 1,882,174 (66.3%) |
| Legal Services & Support | 888,074 (47.2%) | 993,163 (52.8%) |
| Education Instruction & Library | 2,682,054 (27.3%) | 7,144,231 (72.7%) |
| Arts, Media & Entertainment | 1,668,154 (50.9%) | 1,606,908 (49.1%) |
| Health Diagnosing & Treating | 2,512,035 (25.3%) | 7,411,867 (74.7%) |
| Health Technologists | 1,762,468 (25.9%) | 5,048,479 (74.1%) |
| Total (Category) | 31,140,685 (47.8%) | 34,023,655 (52.2%) |
| Total (Overall) | 83,957,980 (52.8%) | 74,955,224 (47.2%) |
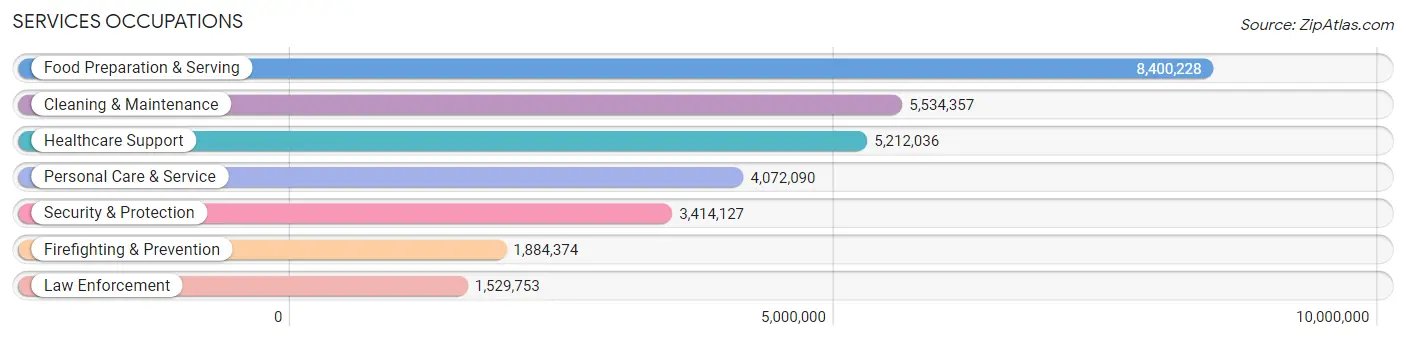
Services Occupations
The most common Services occupations in the United States are Food Preparation & Serving (8,400,228 | 5.3%), Cleaning & Maintenance (5,534,357 | 3.5%), Healthcare Support (5,212,036 | 3.3%), Personal Care & Service (4,072,090 | 2.6%), and Security & Protection (3,414,127 | 2.1%).
Services Occupations by Sex
Within the Services occupations in the United States, the most male-oriented occupations are Law Enforcement (80.5%), Security & Protection (76.8%), and Firefighting & Prevention (73.9%), while the most female-oriented occupations are Healthcare Support (84.9%), Personal Care & Service (74.9%), and Food Preparation & Serving (54.4%).
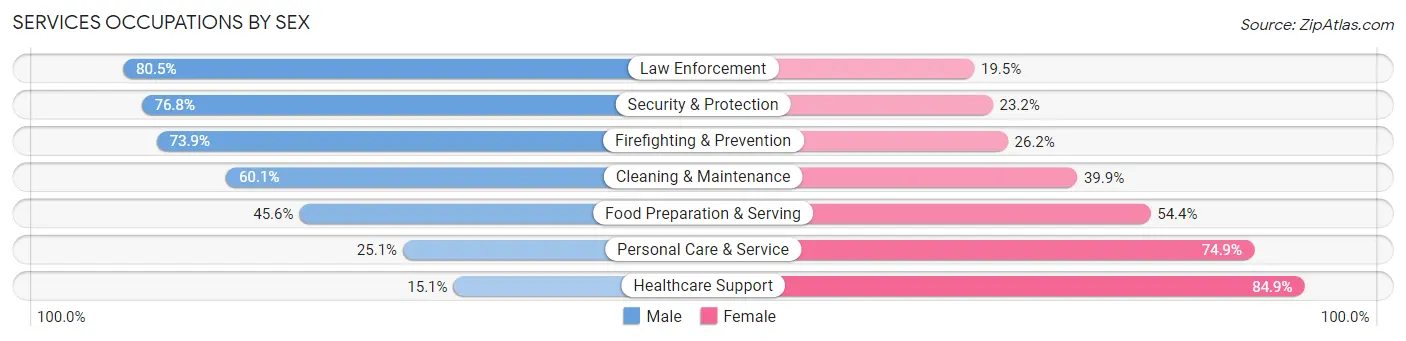
| Occupation | Male | Female |
| Healthcare Support | 786,983 (15.1%) | 4,425,053 (84.9%) |
| Security & Protection | 2,623,135 (76.8%) | 790,992 (23.2%) |
| Firefighting & Prevention | 1,391,647 (73.9%) | 492,727 (26.2%) |
| Law Enforcement | 1,231,488 (80.5%) | 298,265 (19.5%) |
| Food Preparation & Serving | 3,830,919 (45.6%) | 4,569,309 (54.4%) |
| Cleaning & Maintenance | 3,326,515 (60.1%) | 2,207,842 (39.9%) |
| Personal Care & Service | 1,021,869 (25.1%) | 3,050,221 (74.9%) |
| Total (Category) | 11,589,421 (43.5%) | 15,043,417 (56.5%) |
| Total (Overall) | 83,957,980 (52.8%) | 74,955,224 (47.2%) |
Sales and Office Occupations
The most common Sales and Office occupations in the United States are Office & Administration (17,252,296 | 10.9%), and Sales & Related (15,247,792 | 9.6%).

Sales and Office Occupations by Sex
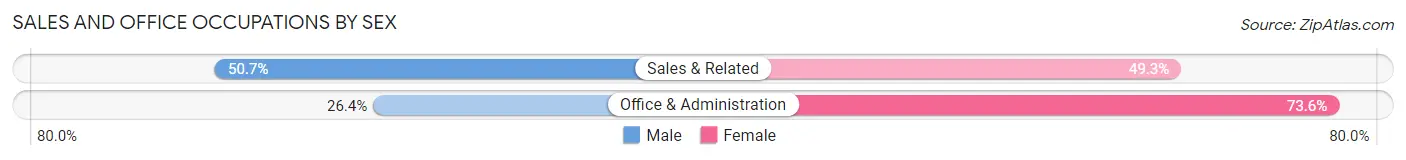
| Occupation | Male | Female |
| Sales & Related | 7,730,002 (50.7%) | 7,517,790 (49.3%) |
| Office & Administration | 4,552,181 (26.4%) | 12,700,115 (73.6%) |
| Total (Category) | 12,282,183 (37.8%) | 20,217,905 (62.2%) |
| Total (Overall) | 83,957,980 (52.8%) | 74,955,224 (47.2%) |
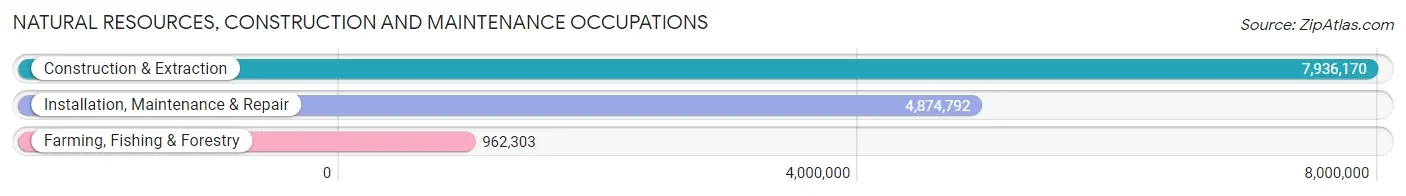
Natural Resources, Construction and Maintenance Occupations
The most common Natural Resources, Construction and Maintenance occupations in the United States are Construction & Extraction (7,936,170 | 5.0%), Installation, Maintenance & Repair (4,874,792 | 3.1%), and Farming, Fishing & Forestry (962,303 | 0.6%).
Natural Resources, Construction and Maintenance Occupations by Sex
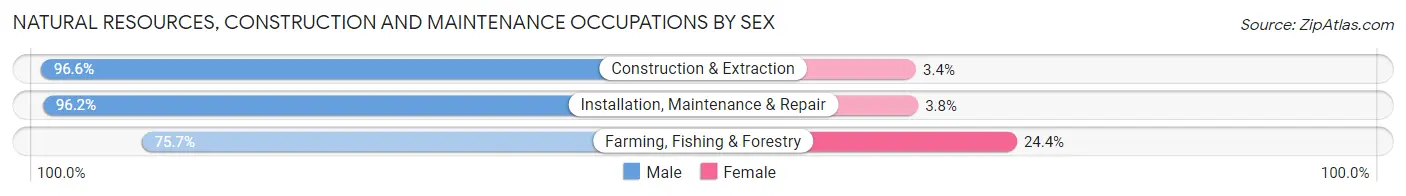
| Occupation | Male | Female |
| Farming, Fishing & Forestry | 727,963 (75.6%) | 234,340 (24.3%) |
| Construction & Extraction | 7,668,061 (96.6%) | 268,109 (3.4%) |
| Installation, Maintenance & Repair | 4,688,937 (96.2%) | 185,855 (3.8%) |
| Total (Category) | 13,084,961 (95.0%) | 688,304 (5.0%) |
| Total (Overall) | 83,957,980 (52.8%) | 74,955,224 (47.2%) |
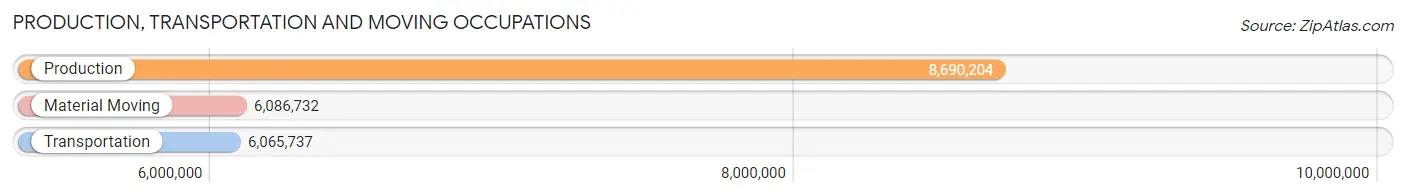
Production, Transportation and Moving Occupations
The most common Production, Transportation and Moving occupations in the United States are Production (8,690,204 | 5.5%), Material Moving (6,086,732 | 3.8%), and Transportation (6,065,737 | 3.8%).
Production, Transportation and Moving Occupations by Sex
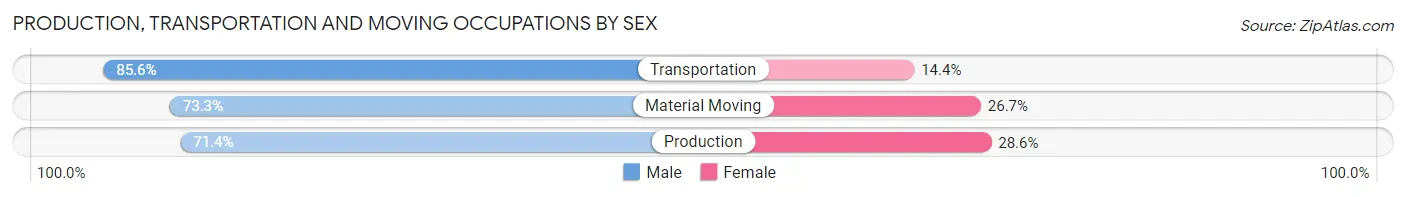
| Occupation | Male | Female |
| Production | 6,206,472 (71.4%) | 2,483,732 (28.6%) |
| Transportation | 5,190,034 (85.6%) | 875,703 (14.4%) |
| Material Moving | 4,464,224 (73.3%) | 1,622,508 (26.7%) |
| Total (Category) | 15,860,730 (76.1%) | 4,981,943 (23.9%) |
| Total (Overall) | 83,957,980 (52.8%) | 74,955,224 (47.2%) |
Employment Industries by Sex in the United States
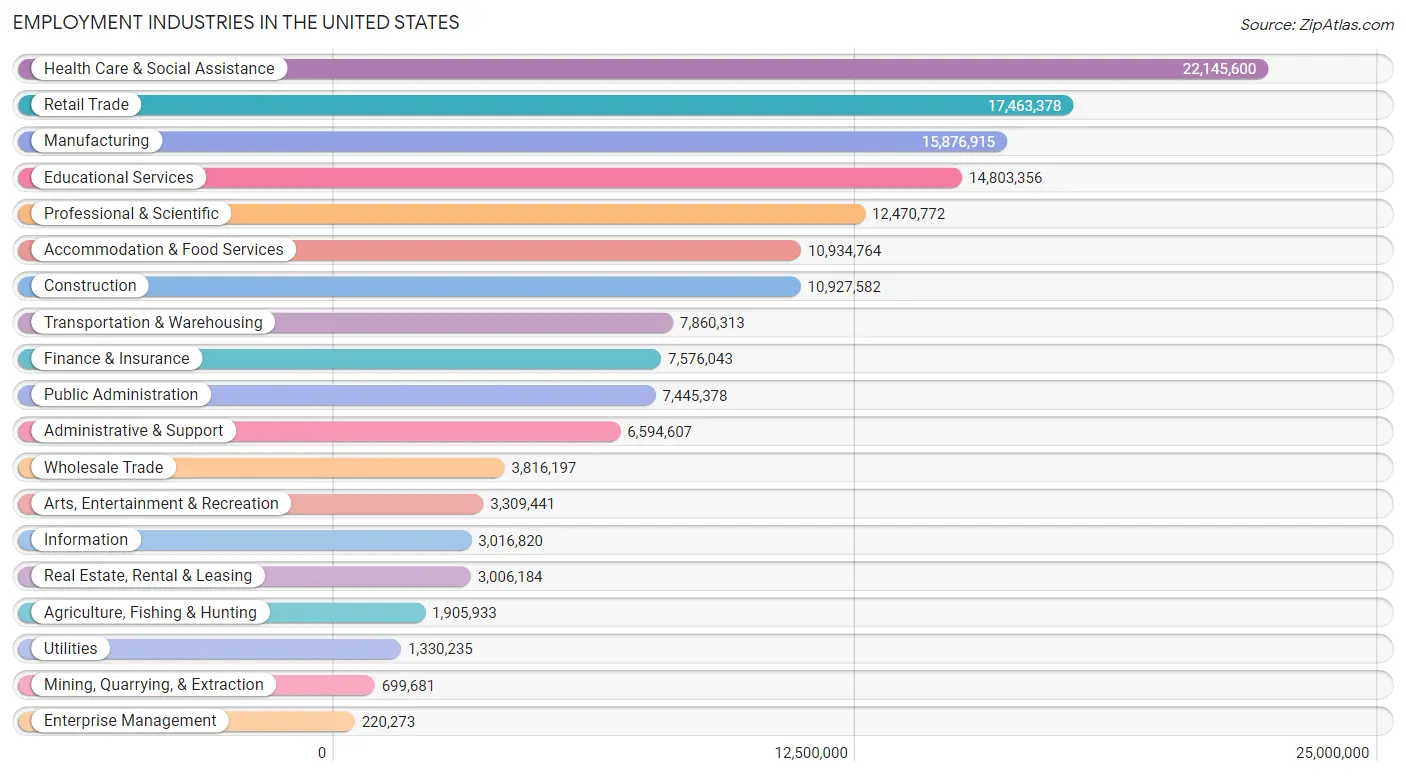
Employment Industries in the United States
The major employment industries in the United States include Health Care & Social Assistance (22,145,600 | 13.9%), Retail Trade (17,463,378 | 11.0%), Manufacturing (15,876,915 | 10.0%), Educational Services (14,803,356 | 9.3%), and Professional & Scientific (12,470,772 | 7.9%).
Employment Industries by Sex in the United States
The the United States industries that see more men than women are Construction (89.4%), Mining, Quarrying, & Extraction (85.7%), and Utilities (77.6%), whereas the industries that tend to have a higher number of women are Health Care & Social Assistance (77.4%), Educational Services (68.0%), and Finance & Insurance (55.3%).
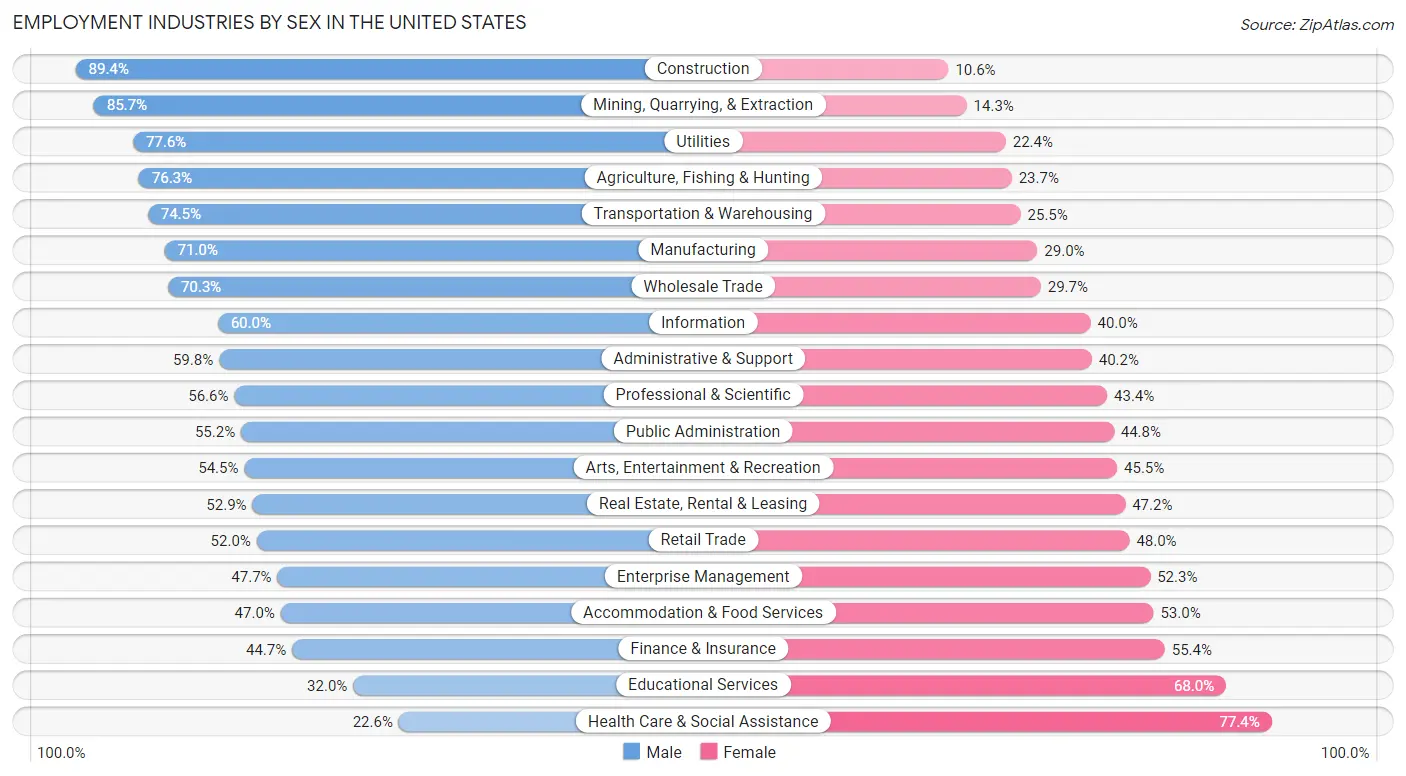
| Industry | Male | Female |
| Agriculture, Fishing & Hunting | 1,455,029 (76.3%) | 450,904 (23.7%) |
| Mining, Quarrying, & Extraction | 599,383 (85.7%) | 100,298 (14.3%) |
| Construction | 9,773,442 (89.4%) | 1,154,140 (10.6%) |
| Manufacturing | 11,277,067 (71.0%) | 4,599,848 (29.0%) |
| Wholesale Trade | 2,683,666 (70.3%) | 1,132,531 (29.7%) |
| Retail Trade | 9,075,783 (52.0%) | 8,387,595 (48.0%) |
| Transportation & Warehousing | 5,855,914 (74.5%) | 2,004,399 (25.5%) |
| Utilities | 1,031,816 (77.6%) | 298,419 (22.4%) |
| Information | 1,810,777 (60.0%) | 1,206,043 (40.0%) |
| Finance & Insurance | 3,382,871 (44.7%) | 4,193,172 (55.3%) |
| Real Estate, Rental & Leasing | 1,588,685 (52.8%) | 1,417,499 (47.1%) |
| Professional & Scientific | 7,058,612 (56.6%) | 5,412,160 (43.4%) |
| Enterprise Management | 105,007 (47.7%) | 115,266 (52.3%) |
| Administrative & Support | 3,940,680 (59.8%) | 2,653,927 (40.2%) |
| Educational Services | 4,735,390 (32.0%) | 10,067,966 (68.0%) |
| Health Care & Social Assistance | 4,996,424 (22.6%) | 17,149,176 (77.4%) |
| Arts, Entertainment & Recreation | 1,804,610 (54.5%) | 1,504,831 (45.5%) |
| Accommodation & Food Services | 5,139,015 (47.0%) | 5,795,749 (53.0%) |
| Public Administration | 4,110,719 (55.2%) | 3,334,659 (44.8%) |
| Total | 83,957,980 (52.8%) | 74,955,224 (47.2%) |
Education in the United States
School Enrollment in the United States
The most common levels of schooling among the 80,425,705 students in the United States are college / undergraduate (17,479,826 | 21.7%), high school (17,242,773 | 21.4%), and middle school (16,782,016 | 20.9%).
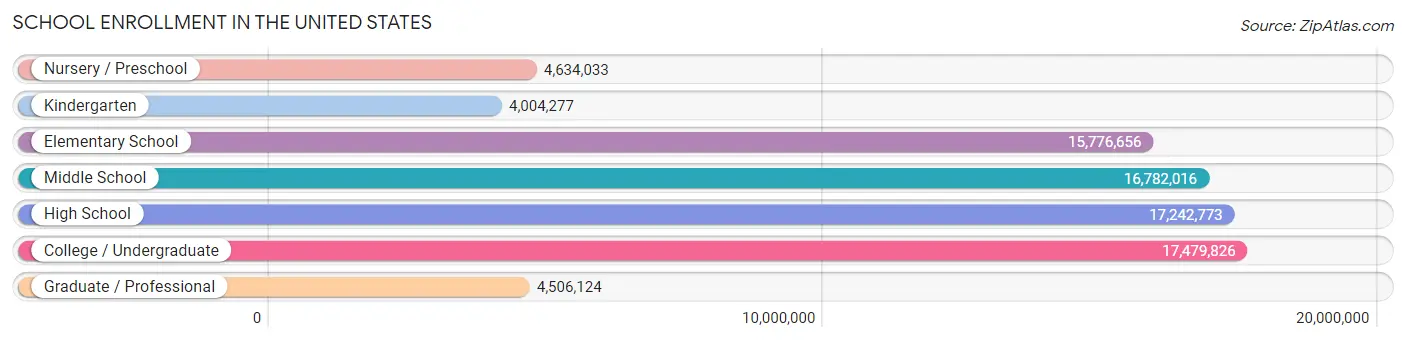
| School Level | # Students | % Students |
| Nursery / Preschool | 4,634,033 | 5.8% |
| Kindergarten | 4,004,277 | 5.0% |
| Elementary School | 15,776,656 | 19.6% |
| Middle School | 16,782,016 | 20.9% |
| High School | 17,242,773 | 21.4% |
| College / Undergraduate | 17,479,826 | 21.7% |
| Graduate / Professional | 4,506,124 | 5.6% |
| Total | 80,425,705 | 100.0% |
School Enrollment by Age by Funding Source in the United States
Out of a total of 80,425,705 students who are enrolled in schools in the United States, 13,913,647 (17.3%) attend a private institution, while the remaining 66,512,058 (82.7%) are enrolled in public schools. The age group of 3 to 4 year olds has the highest likelihood of being enrolled in private schools, with 1,522,101 (41.9% in the age bracket) enrolled. Conversely, the age group of 15 to 17 year olds has the lowest likelihood of being enrolled in a private school, with 11,030,798 (89.2% in the age bracket) attending a public institution.
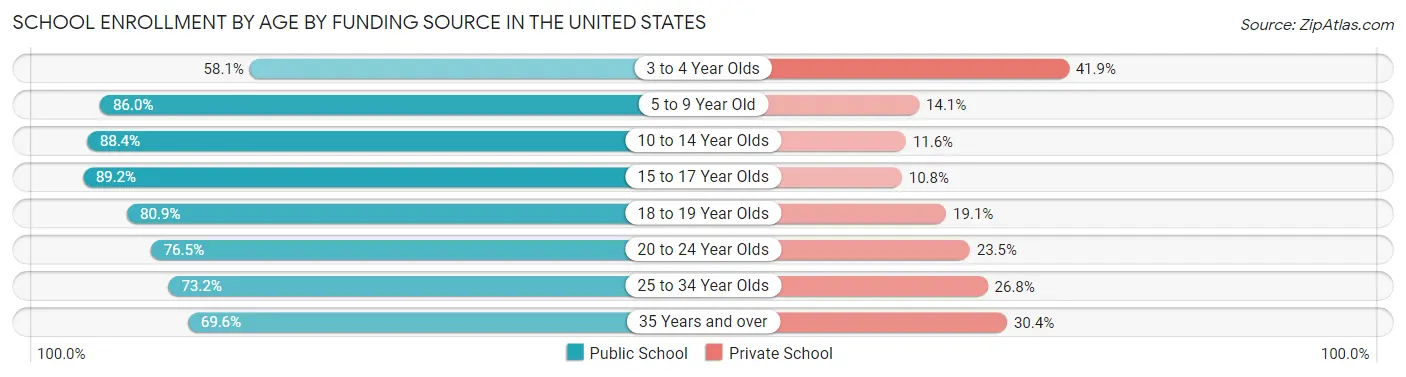
| Age Bracket | Public School | Private School |
| 3 to 4 Year Olds | 2,108,920 (58.1%) | 1,522,101 (41.9%) |
| 5 to 9 Year Old | 16,108,712 (86.0%) | 2,633,860 (14.1%) |
| 10 to 14 Year Olds | 18,461,630 (88.4%) | 2,423,411 (11.6%) |
| 15 to 17 Year Olds | 11,030,798 (89.2%) | 1,339,763 (10.8%) |
| 18 to 19 Year Olds | 5,396,118 (80.9%) | 1,273,298 (19.1%) |
| 20 to 24 Year Olds | 6,821,971 (76.5%) | 2,095,630 (23.5%) |
| 25 to 34 Year Olds | 3,680,085 (73.2%) | 1,348,021 (26.8%) |
| 35 Years and over | 2,909,321 (69.6%) | 1,272,066 (30.4%) |
| Total | 66,512,058 (82.7%) | 13,913,647 (17.3%) |
Educational Attainment by Field of Study in the United States
Business (16,366,079 | 19.5%), education (9,281,893 | 11.1%), science & technology (8,209,837 | 9.8%), social sciences (6,774,333 | 8.1%), and engineering (6,418,778 | 7.6%) are the most common fields of study among 83,932,731 individuals in the United States who have obtained a bachelor's degree or higher.
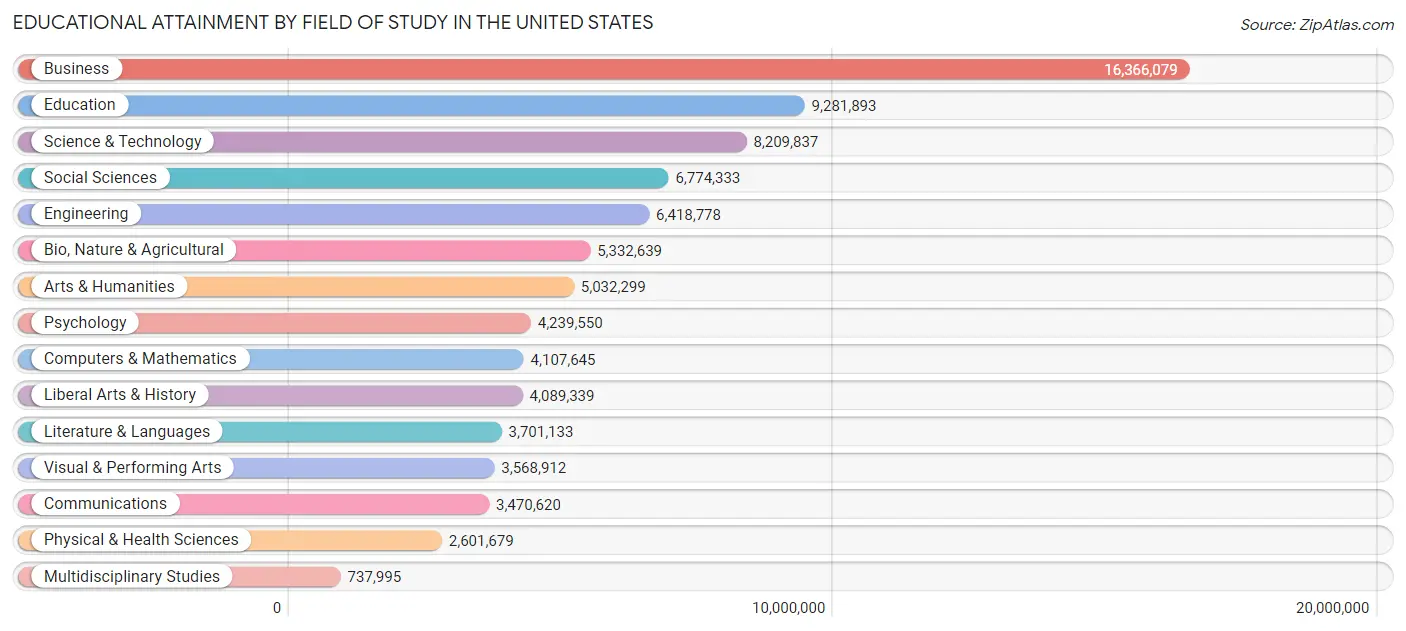
| Field of Study | # Graduates | % Graduates |
| Computers & Mathematics | 4,107,645 | 4.9% |
| Bio, Nature & Agricultural | 5,332,639 | 6.4% |
| Physical & Health Sciences | 2,601,679 | 3.1% |
| Psychology | 4,239,550 | 5.1% |
| Social Sciences | 6,774,333 | 8.1% |
| Engineering | 6,418,778 | 7.6% |
| Multidisciplinary Studies | 737,995 | 0.9% |
| Science & Technology | 8,209,837 | 9.8% |
| Business | 16,366,079 | 19.5% |
| Education | 9,281,893 | 11.1% |
| Literature & Languages | 3,701,133 | 4.4% |
| Liberal Arts & History | 4,089,339 | 4.9% |
| Visual & Performing Arts | 3,568,912 | 4.3% |
| Communications | 3,470,620 | 4.1% |
| Arts & Humanities | 5,032,299 | 6.0% |
| Total | 83,932,731 | 100.0% |
Transportation & Commute in the United States
Vehicle Availability by Sex in the United States
The most prevalent vehicle ownership categories in the United States are males with 2 vehicles (34,004,047, accounting for 41.1%) and females with 2 vehicles (28,496,689, making up 46.9%).
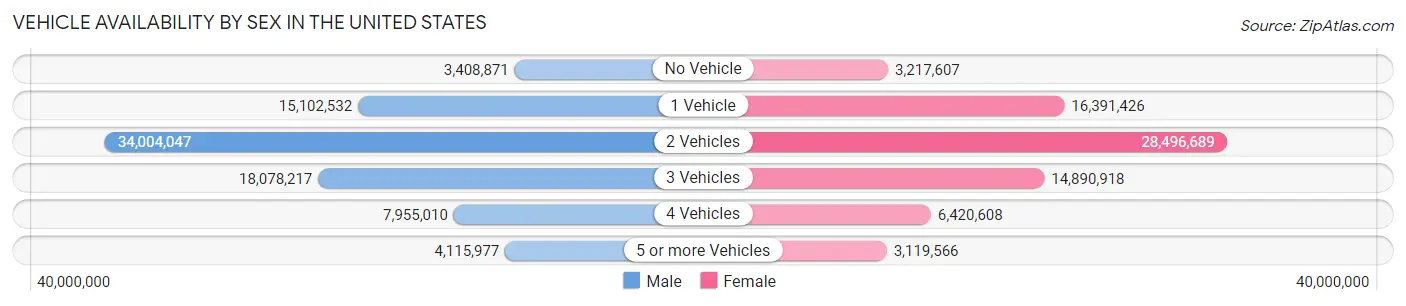
| Vehicles Available | Male | Female |
| No Vehicle | 3,408,871 (4.1%) | 3,217,607 (4.4%) |
| 1 Vehicle | 15,102,532 (18.3%) | 16,391,426 (22.6%) |
| 2 Vehicles | 34,004,047 (41.1%) | 28,496,689 (39.3%) |
| 3 Vehicles | 18,078,217 (21.9%) | 14,890,918 (20.5%) |
| 4 Vehicles | 7,955,010 (9.6%) | 6,420,608 (8.8%) |
| 5 or more Vehicles | 4,115,977 (5.0%) | 3,119,566 (4.3%) |
| Total | 82,664,654 (100.0%) | 72,536,814 (100.0%) |
Commute Time in the United States
The most frequently occuring commute durations in the United States are 15 to 19 minutes (21,192,685 commuters, 15.3%), 20 to 24 minutes (19,841,141 commuters, 14.3%), and 30 to 34 minutes (19,001,358 commuters, 13.7%).
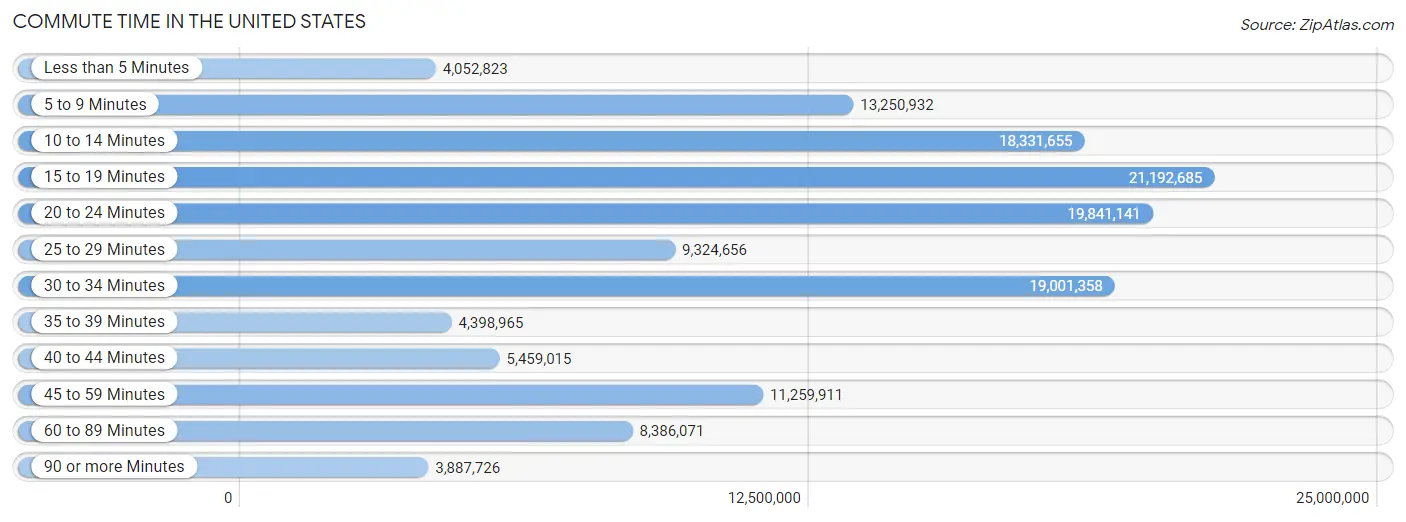
| Commute Time | # Commuters | % Commuters |
| Less than 5 Minutes | 4,052,823 | 2.9% |
| 5 to 9 Minutes | 13,250,932 | 9.6% |
| 10 to 14 Minutes | 18,331,655 | 13.3% |
| 15 to 19 Minutes | 21,192,685 | 15.3% |
| 20 to 24 Minutes | 19,841,141 | 14.3% |
| 25 to 29 Minutes | 9,324,656 | 6.7% |
| 30 to 34 Minutes | 19,001,358 | 13.7% |
| 35 to 39 Minutes | 4,398,965 | 3.2% |
| 40 to 44 Minutes | 5,459,015 | 3.9% |
| 45 to 59 Minutes | 11,259,911 | 8.1% |
| 60 to 89 Minutes | 8,386,071 | 6.1% |
| 90 or more Minutes | 3,887,726 | 2.8% |
Commute Time by Sex in the United States
The most common commute times in the United States are 15 to 19 minutes (10,879,757 commuters, 14.6%) for males and 15 to 19 minutes (10,312,928 commuters, 16.1%) for females.
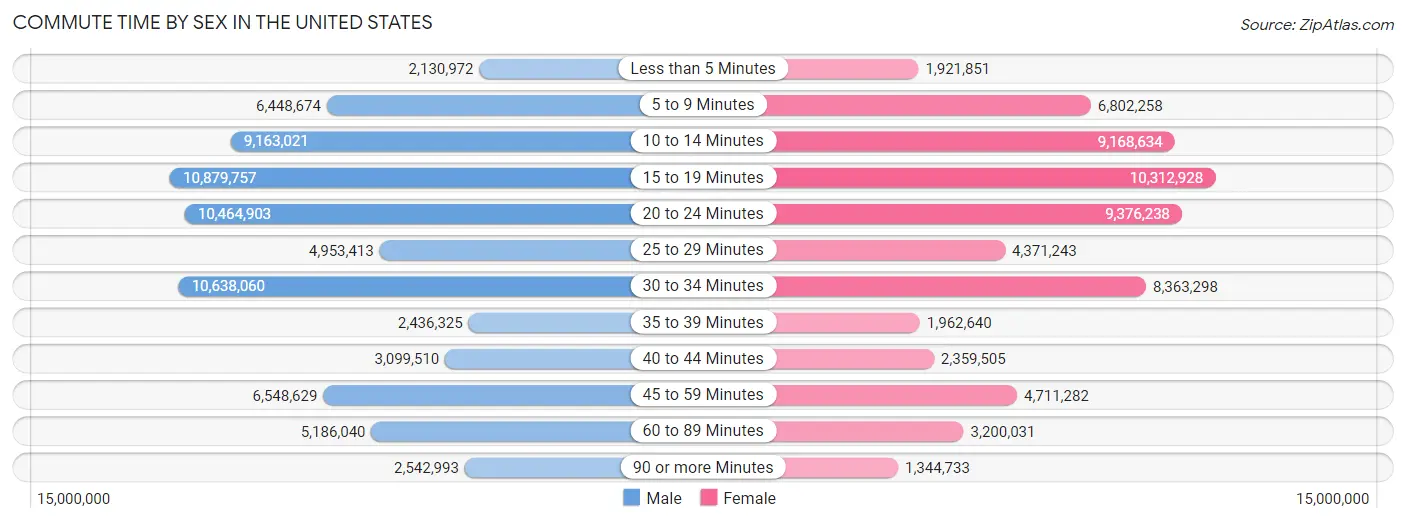
| Commute Time | Male | Female |
| Less than 5 Minutes | 2,130,972 (2.9%) | 1,921,851 (3.0%) |
| 5 to 9 Minutes | 6,448,674 (8.7%) | 6,802,258 (10.6%) |
| 10 to 14 Minutes | 9,163,021 (12.3%) | 9,168,634 (14.3%) |
| 15 to 19 Minutes | 10,879,757 (14.6%) | 10,312,928 (16.1%) |
| 20 to 24 Minutes | 10,464,903 (14.1%) | 9,376,238 (14.7%) |
| 25 to 29 Minutes | 4,953,413 (6.7%) | 4,371,243 (6.8%) |
| 30 to 34 Minutes | 10,638,060 (14.3%) | 8,363,298 (13.1%) |
| 35 to 39 Minutes | 2,436,325 (3.3%) | 1,962,640 (3.1%) |
| 40 to 44 Minutes | 3,099,510 (4.2%) | 2,359,505 (3.7%) |
| 45 to 59 Minutes | 6,548,629 (8.8%) | 4,711,282 (7.4%) |
| 60 to 89 Minutes | 5,186,040 (7.0%) | 3,200,031 (5.0%) |
| 90 or more Minutes | 2,542,993 (3.4%) | 1,344,733 (2.1%) |
Time of Departure to Work by Sex in the United States
The most frequent times of departure to work in the United States are 7:00 AM to 7:29 AM (10,210,023, 13.7%) for males and 7:00 AM to 7:29 AM (9,794,683, 15.3%) for females.
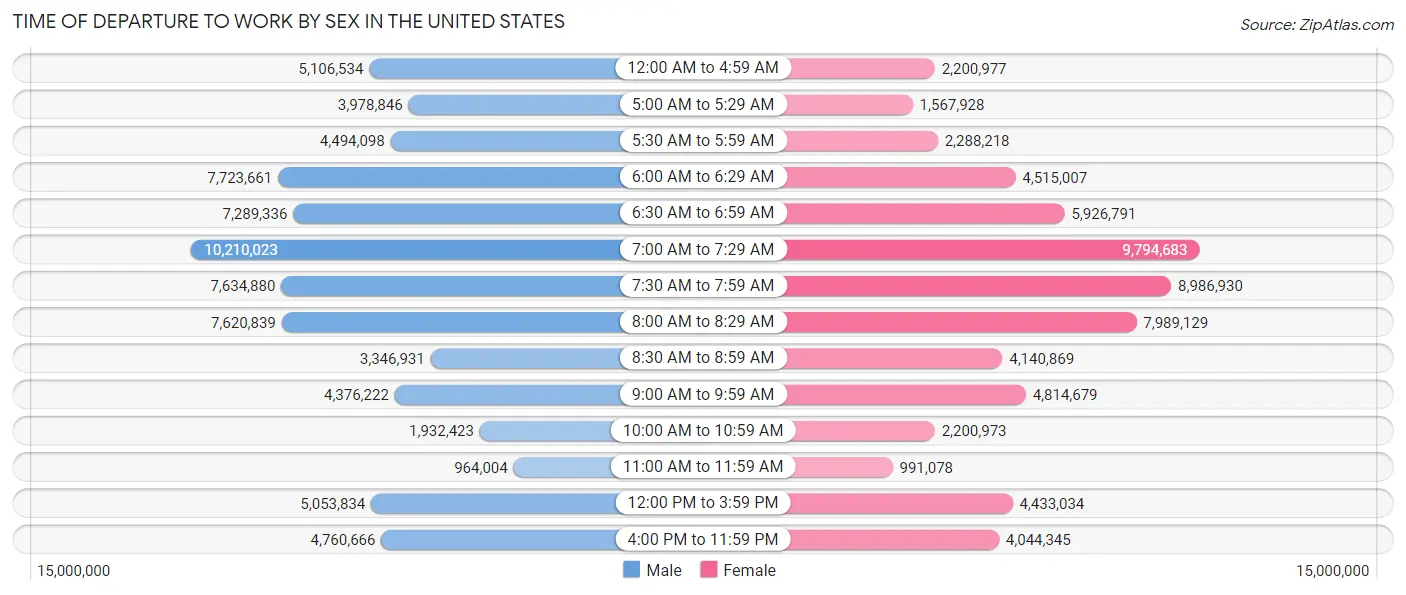
| Time of Departure | Male | Female |
| 12:00 AM to 4:59 AM | 5,106,534 (6.9%) | 2,200,977 (3.4%) |
| 5:00 AM to 5:29 AM | 3,978,846 (5.3%) | 1,567,928 (2.5%) |
| 5:30 AM to 5:59 AM | 4,494,098 (6.0%) | 2,288,218 (3.6%) |
| 6:00 AM to 6:29 AM | 7,723,661 (10.4%) | 4,515,007 (7.1%) |
| 6:30 AM to 6:59 AM | 7,289,336 (9.8%) | 5,926,791 (9.3%) |
| 7:00 AM to 7:29 AM | 10,210,023 (13.7%) | 9,794,683 (15.3%) |
| 7:30 AM to 7:59 AM | 7,634,880 (10.2%) | 8,986,930 (14.1%) |
| 8:00 AM to 8:29 AM | 7,620,839 (10.2%) | 7,989,129 (12.5%) |
| 8:30 AM to 8:59 AM | 3,346,931 (4.5%) | 4,140,869 (6.5%) |
| 9:00 AM to 9:59 AM | 4,376,222 (5.9%) | 4,814,679 (7.5%) |
| 10:00 AM to 10:59 AM | 1,932,423 (2.6%) | 2,200,973 (3.4%) |
| 11:00 AM to 11:59 AM | 964,004 (1.3%) | 991,078 (1.5%) |
| 12:00 PM to 3:59 PM | 5,053,834 (6.8%) | 4,433,034 (6.9%) |
| 4:00 PM to 11:59 PM | 4,760,666 (6.4%) | 4,044,345 (6.3%) |
| Total | 74,492,297 (100.0%) | 63,894,641 (100.0%) |
Housing Occupancy in the United States
Occupancy by Ownership in the United States
Of the total 125,736,353 dwellings in the United States, owner-occupied units account for 81,497,760 (64.8%), while renter-occupied units make up 44,238,593 (35.2%).
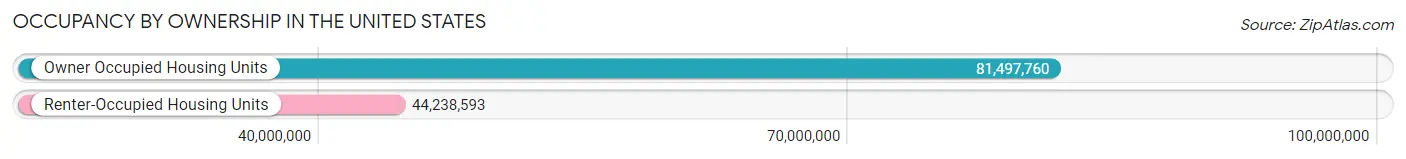
| Occupancy | # Housing Units | % Housing Units |
| Owner Occupied Housing Units | 81,497,760 | 64.8% |
| Renter-Occupied Housing Units | 44,238,593 | 35.2% |
| Total Occupied Housing Units | 125,736,353 | 100.0% |
Occupancy by Household Size in the United States
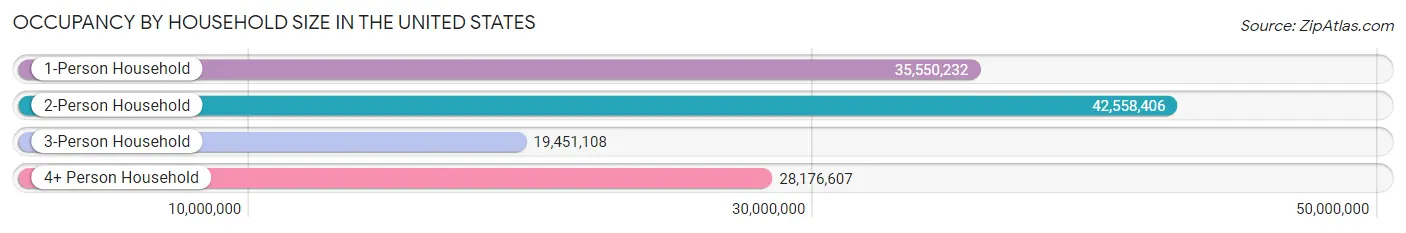
| Household Size | # Housing Units | % Housing Units |
| 1-Person Household | 35,550,232 | 28.3% |
| 2-Person Household | 42,558,406 | 33.9% |
| 3-Person Household | 19,451,108 | 15.5% |
| 4+ Person Household | 28,176,607 | 22.4% |
| Total Housing Units | 125,736,353 | 100.0% |
Occupancy by Ownership by Household Size in the United States
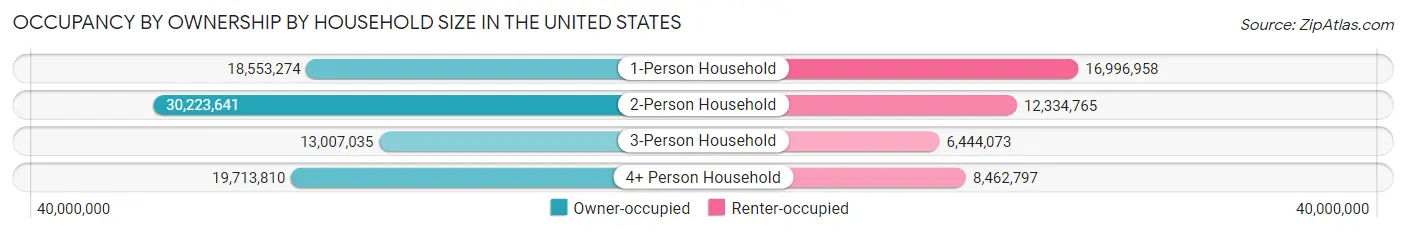
| Household Size | Owner-occupied | Renter-occupied |
| 1-Person Household | 18,553,274 (52.2%) | 16,996,958 (47.8%) |
| 2-Person Household | 30,223,641 (71.0%) | 12,334,765 (29.0%) |
| 3-Person Household | 13,007,035 (66.9%) | 6,444,073 (33.1%) |
| 4+ Person Household | 19,713,810 (70.0%) | 8,462,797 (30.0%) |
| Total Housing Units | 81,497,760 (64.8%) | 44,238,593 (35.2%) |
Occupancy by Educational Attainment in the United States
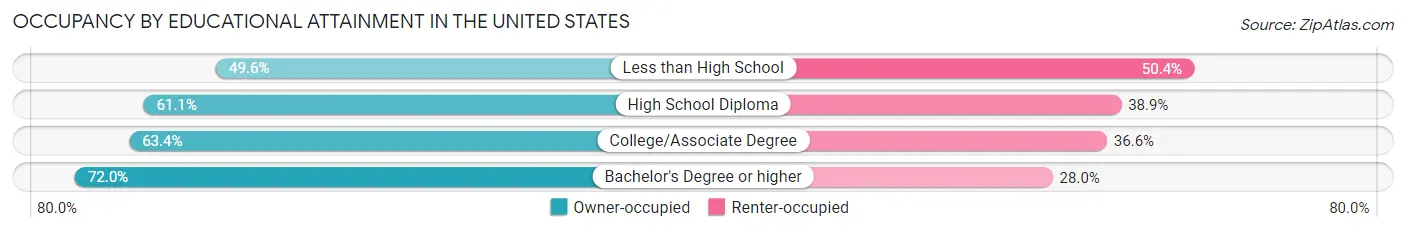
| Household Size | Owner-occupied | Renter-occupied |
| Less than High School | 5,615,221 (49.6%) | 5,702,423 (50.4%) |
| High School Diploma | 18,145,743 (61.1%) | 11,533,516 (38.9%) |
| College/Associate Degree | 24,162,174 (63.4%) | 13,951,343 (36.6%) |
| Bachelor's Degree or higher | 33,574,622 (72.0%) | 13,051,311 (28.0%) |
Occupancy by Age of Householder in the United States
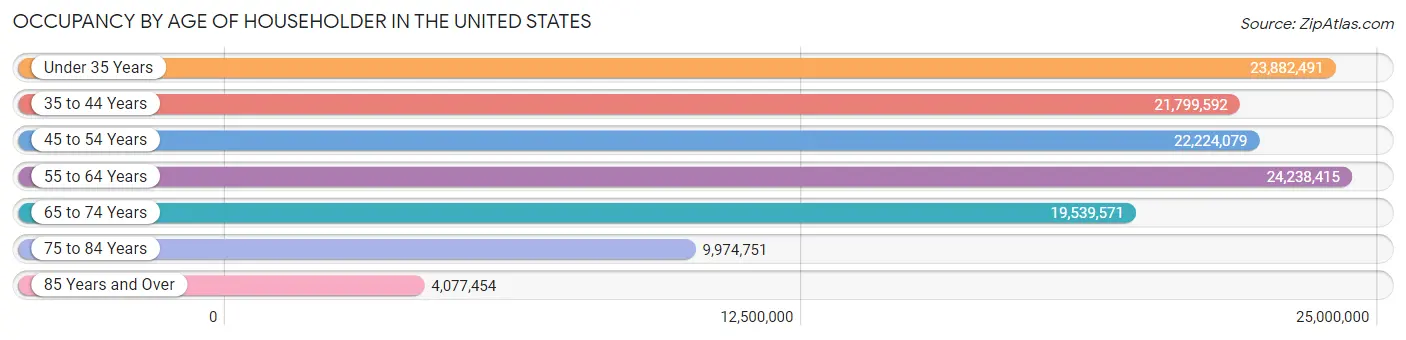
| Age Bracket | # Households | % Households |
| Under 35 Years | 23,882,491 | 19.0% |
| 35 to 44 Years | 21,799,592 | 17.3% |
| 45 to 54 Years | 22,224,079 | 17.7% |
| 55 to 64 Years | 24,238,415 | 19.3% |
| 65 to 74 Years | 19,539,571 | 15.5% |
| 75 to 84 Years | 9,974,751 | 7.9% |
| 85 Years and Over | 4,077,454 | 3.2% |
| Total | 125,736,353 | 100.0% |
Housing Finances in the United States
Median Income by Occupancy in the United States
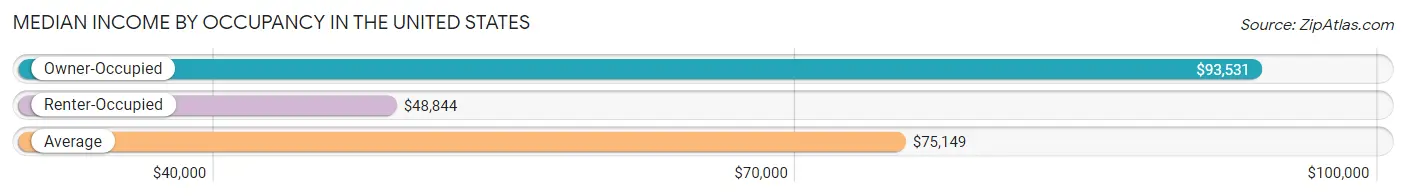
| Occupancy Type | # Households | Median Income |
| Owner-Occupied | 81,497,760 (64.8%) | $93,531 |
| Renter-Occupied | 44,238,593 (35.2%) | $48,844 |
| Average | 125,736,353 (100.0%) | $75,149 |
Occupancy by Householder Income Bracket in the United States
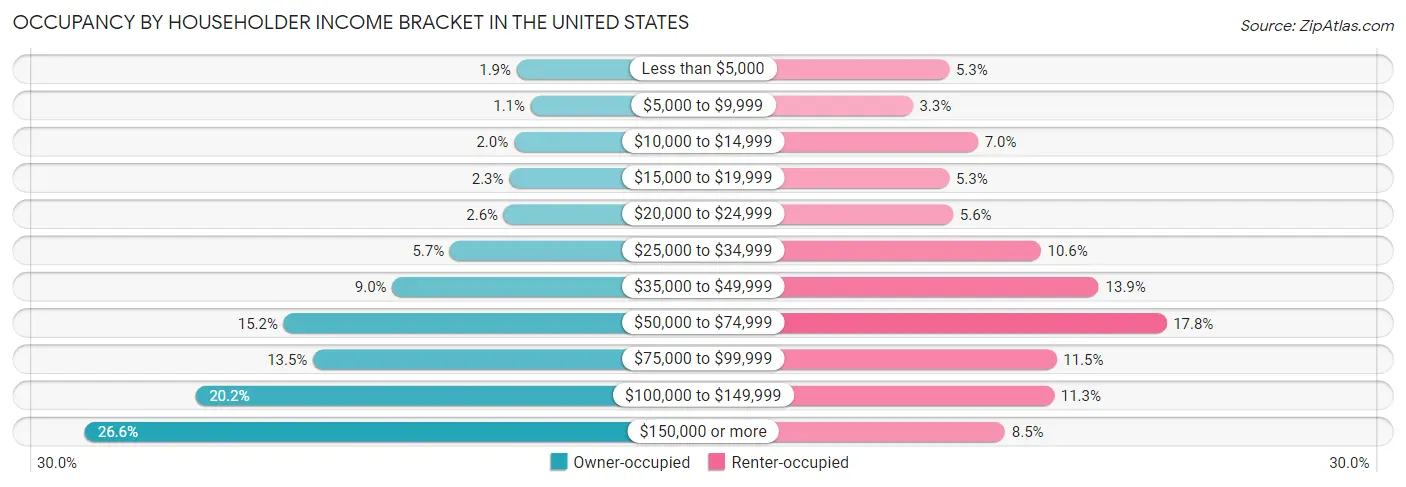
| Income Bracket | Owner-occupied | Renter-occupied |
| Less than $5,000 | 1,522,491 (1.9%) | 2,361,194 (5.3%) |
| $5,000 to $9,999 | 868,988 (1.1%) | 1,439,407 (3.3%) |
| $10,000 to $14,999 | 1,655,085 (2.0%) | 3,088,625 (7.0%) |
| $15,000 to $19,999 | 1,873,550 (2.3%) | 2,361,601 (5.3%) |
| $20,000 to $24,999 | 2,129,991 (2.6%) | 2,457,946 (5.6%) |
| $25,000 to $34,999 | 4,633,589 (5.7%) | 4,675,837 (10.6%) |
| $35,000 to $49,999 | 7,318,760 (9.0%) | 6,145,162 (13.9%) |
| $50,000 to $74,999 | 12,377,458 (15.2%) | 7,850,960 (17.7%) |
| $75,000 to $99,999 | 11,013,013 (13.5%) | 5,072,289 (11.5%) |
| $100,000 to $149,999 | 16,455,763 (20.2%) | 5,011,161 (11.3%) |
| $150,000 or more | 21,649,072 (26.6%) | 3,774,411 (8.5%) |
| Total | 81,497,760 (100.0%) | 44,238,593 (100.0%) |
Monthly Housing Cost Tiers in the United States
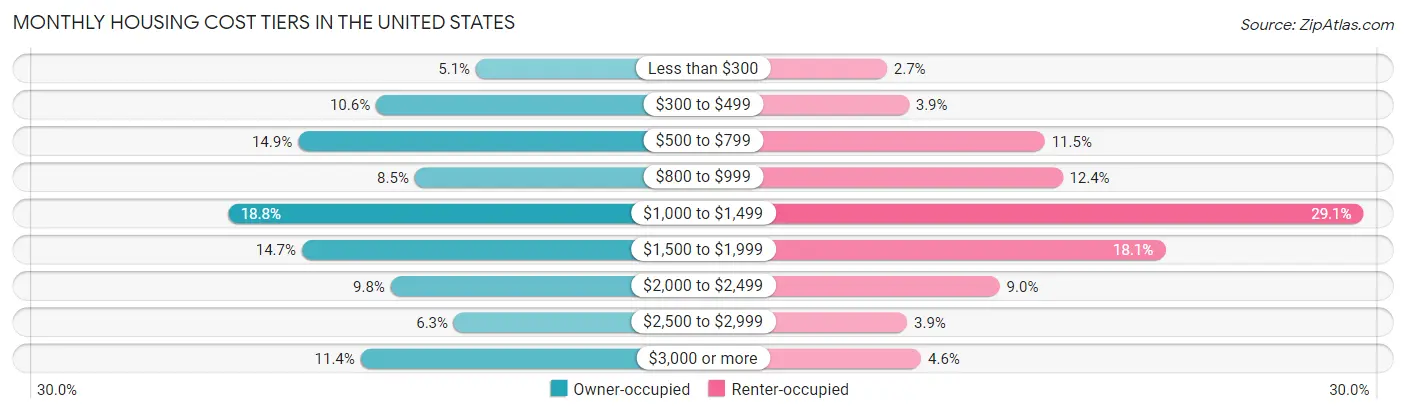
| Monthly Cost | Owner-occupied | Renter-occupied |
| Less than $300 | 4,131,636 (5.1%) | 1,207,804 (2.7%) |
| $300 to $499 | 8,632,178 (10.6%) | 1,741,099 (3.9%) |
| $500 to $799 | 12,147,029 (14.9%) | 5,063,423 (11.5%) |
| $800 to $999 | 6,886,106 (8.5%) | 5,500,734 (12.4%) |
| $1,000 to $1,499 | 15,305,826 (18.8%) | 12,851,449 (29.0%) |
| $1,500 to $1,999 | 11,968,759 (14.7%) | 8,006,332 (18.1%) |
| $2,000 to $2,499 | 7,971,720 (9.8%) | 3,965,502 (9.0%) |
| $2,500 to $2,999 | 5,127,699 (6.3%) | 1,704,480 (3.8%) |
| $3,000 or more | 9,326,807 (11.4%) | 2,045,034 (4.6%) |
| Total | 81,497,760 (100.0%) | 44,238,593 (100.0%) |
Physical Housing Characteristics in the United States
Housing Structures in the United States
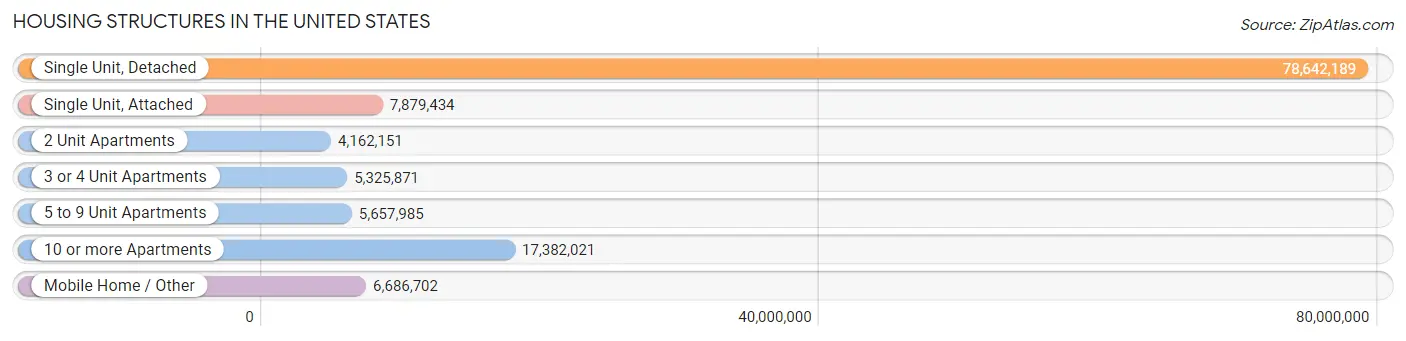
| Structure Type | # Housing Units | % Housing Units |
| Single Unit, Detached | 78,642,189 | 62.5% |
| Single Unit, Attached | 7,879,434 | 6.3% |
| 2 Unit Apartments | 4,162,151 | 3.3% |
| 3 or 4 Unit Apartments | 5,325,871 | 4.2% |
| 5 to 9 Unit Apartments | 5,657,985 | 4.5% |
| 10 or more Apartments | 17,382,021 | 13.8% |
| Mobile Home / Other | 6,686,702 | 5.3% |
| Total | 125,736,353 | 100.0% |
Housing Structures by Occupancy in the United States
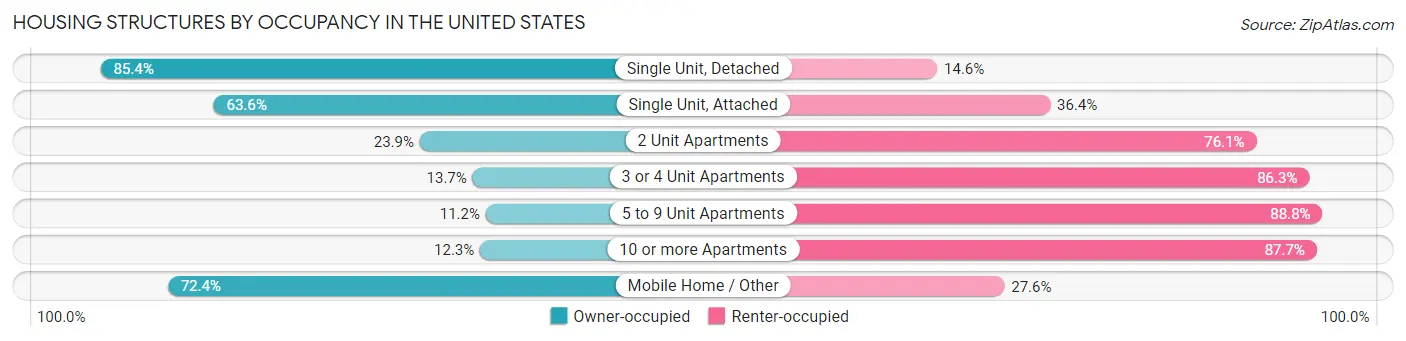
| Structure Type | Owner-occupied | Renter-occupied |
| Single Unit, Detached | 67,141,934 (85.4%) | 11,500,255 (14.6%) |
| Single Unit, Attached | 5,012,816 (63.6%) | 2,866,618 (36.4%) |
| 2 Unit Apartments | 995,333 (23.9%) | 3,166,818 (76.1%) |
| 3 or 4 Unit Apartments | 731,893 (13.7%) | 4,593,978 (86.3%) |
| 5 to 9 Unit Apartments | 633,717 (11.2%) | 5,024,268 (88.8%) |
| 10 or more Apartments | 2,138,028 (12.3%) | 15,243,993 (87.7%) |
| Mobile Home / Other | 4,844,039 (72.4%) | 1,842,663 (27.6%) |
| Total | 81,497,760 (64.8%) | 44,238,593 (35.2%) |
Housing Structures by Number of Rooms in the United States
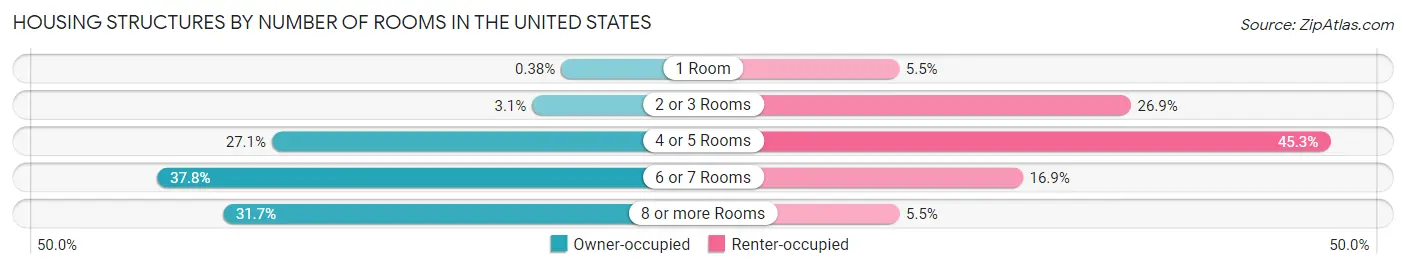
| Number of Rooms | Owner-occupied | Renter-occupied |
| 1 Room | 306,105 (0.4%) | 2,409,535 (5.4%) |
| 2 or 3 Rooms | 2,493,475 (3.1%) | 11,889,613 (26.9%) |
| 4 or 5 Rooms | 22,121,595 (27.1%) | 20,049,596 (45.3%) |
| 6 or 7 Rooms | 30,764,923 (37.8%) | 7,470,163 (16.9%) |
| 8 or more Rooms | 25,811,662 (31.7%) | 2,419,686 (5.5%) |
| Total | 81,497,760 (100.0%) | 44,238,593 (100.0%) |
Housing Structure by Heating Type in the United States
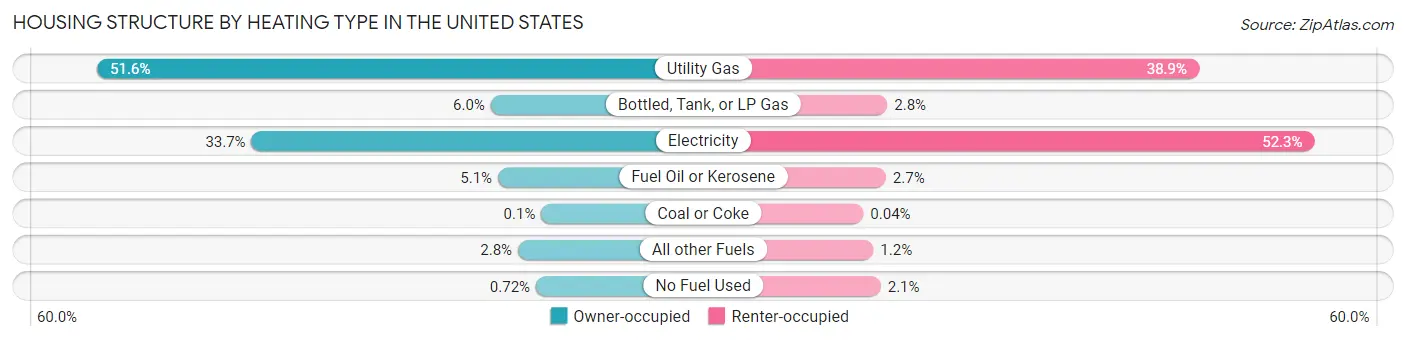
| Heating Type | Owner-occupied | Renter-occupied |
| Utility Gas | 42,052,669 (51.6%) | 17,216,419 (38.9%) |
| Bottled, Tank, or LP Gas | 4,859,219 (6.0%) | 1,249,646 (2.8%) |
| Electricity | 27,461,441 (33.7%) | 23,141,999 (52.3%) |
| Fuel Oil or Kerosene | 4,170,572 (5.1%) | 1,171,666 (2.6%) |
| Coal or Coke | 83,469 (0.1%) | 17,807 (0.0%) |
| All other Fuels | 2,280,018 (2.8%) | 530,959 (1.2%) |
| No Fuel Used | 590,372 (0.7%) | 910,097 (2.1%) |
| Total | 81,497,760 (100.0%) | 44,238,593 (100.0%) |
Household Vehicle Usage in the United States
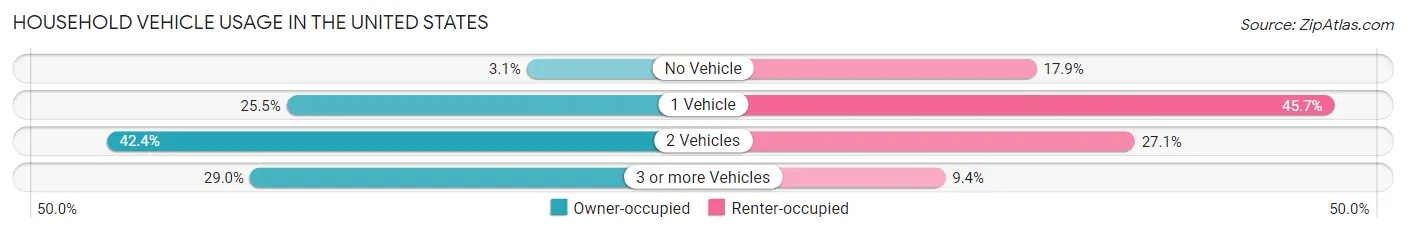
| Vehicles per Household | Owner-occupied | Renter-occupied |
| No Vehicle | 2,560,689 (3.1%) | 7,914,181 (17.9%) |
| 1 Vehicle | 20,810,976 (25.5%) | 20,210,896 (45.7%) |
| 2 Vehicles | 34,517,198 (42.3%) | 11,968,699 (27.1%) |
| 3 or more Vehicles | 23,608,897 (29.0%) | 4,144,817 (9.4%) |
| Total | 81,497,760 (100.0%) | 44,238,593 (100.0%) |
Real Estate & Mortgages in the United States
Real Estate and Mortgage Overview in the United States
| Characteristic | Without Mortgage | With Mortgage |
| Housing Units | 31,349,301 | 50,148,459 |
| Median Property Value | $233,000 | $311,300 |
| Median Household Income | $67,171 | $16,222,716 |
| Monthly Housing Costs | $584 | $9,053,942 |
| Real Estate Taxes | $2,361 | $1,423,512 |
Property Value by Mortgage Status in the United States
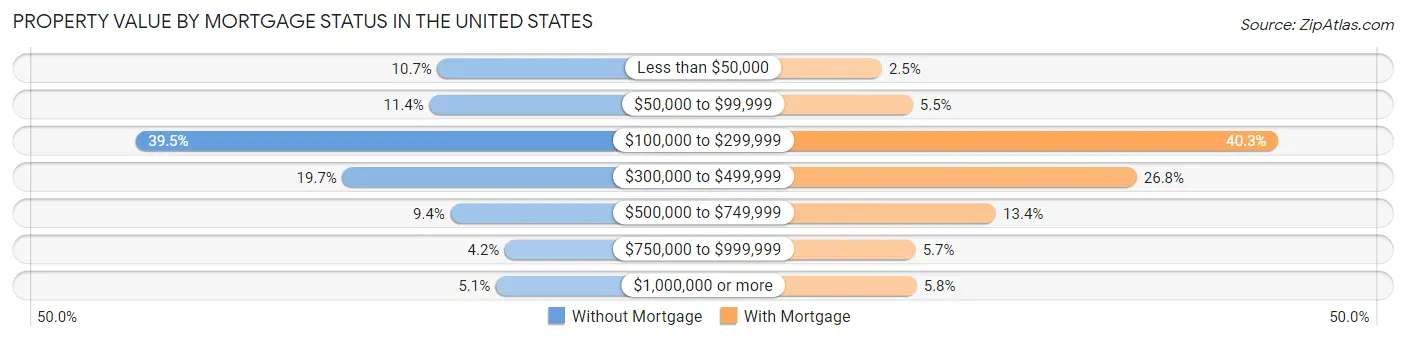
| Property Value | Without Mortgage | With Mortgage |
| Less than $50,000 | 3,342,532 (10.7%) | 1,265,517 (2.5%) |
| $50,000 to $99,999 | 3,583,621 (11.4%) | 2,735,854 (5.5%) |
| $100,000 to $299,999 | 12,366,291 (39.5%) | 20,195,722 (40.3%) |
| $300,000 to $499,999 | 6,179,939 (19.7%) | 13,433,754 (26.8%) |
| $500,000 to $749,999 | 2,951,590 (9.4%) | 6,717,344 (13.4%) |
| $750,000 to $999,999 | 1,325,606 (4.2%) | 2,874,261 (5.7%) |
| $1,000,000 or more | 1,599,722 (5.1%) | 2,926,007 (5.8%) |
| Total | 31,349,301 (100.0%) | 50,148,459 (100.0%) |
Household Income by Mortgage Status in the United States
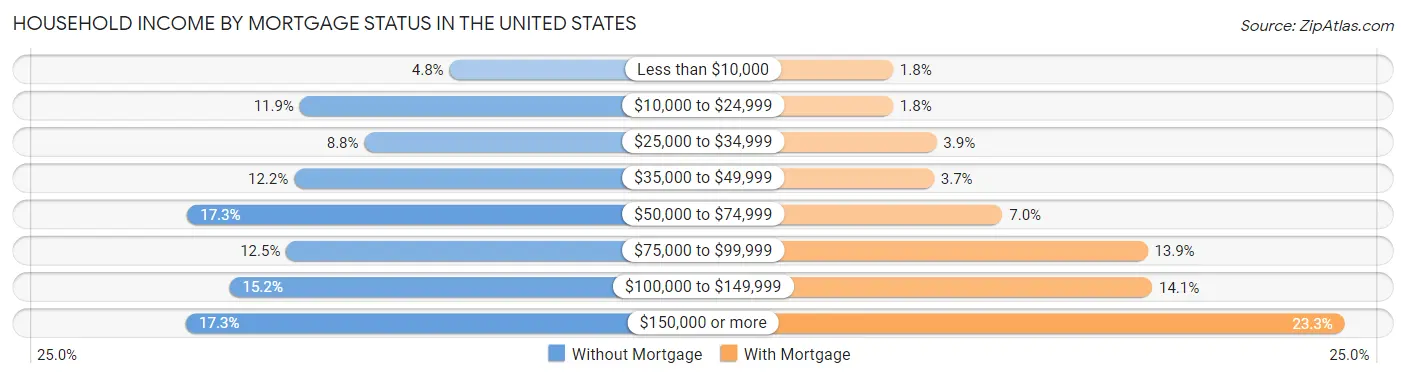
| Household Income | Without Mortgage | With Mortgage |
| Less than $10,000 | 1,496,864 (4.8%) | 892,692 (1.8%) |
| $10,000 to $24,999 | 3,729,625 (11.9%) | 894,615 (1.8%) |
| $25,000 to $34,999 | 2,764,624 (8.8%) | 1,929,001 (3.8%) |
| $35,000 to $49,999 | 3,815,415 (12.2%) | 1,868,965 (3.7%) |
| $50,000 to $74,999 | 5,407,939 (17.2%) | 3,503,345 (7.0%) |
| $75,000 to $99,999 | 3,931,509 (12.5%) | 6,969,519 (13.9%) |
| $100,000 to $149,999 | 4,776,969 (15.2%) | 7,081,504 (14.1%) |
| $150,000 or more | 5,426,356 (17.3%) | 11,678,794 (23.3%) |
| Total | 31,349,301 (100.0%) | 50,148,459 (100.0%) |
Property Value to Household Income Ratio in the United States
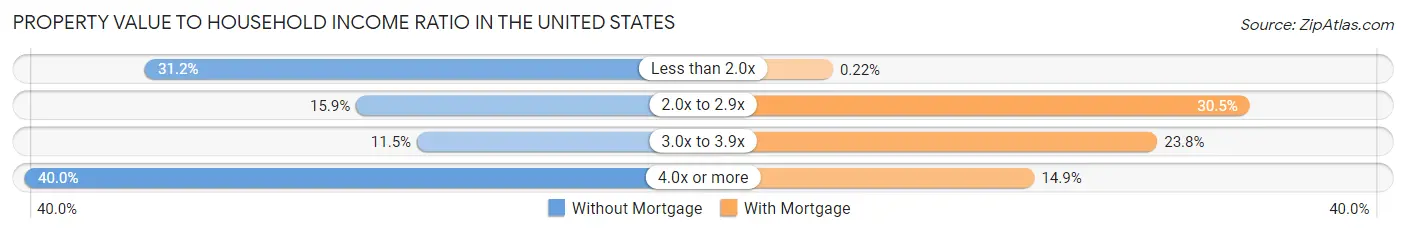
| Value-to-Income Ratio | Without Mortgage | With Mortgage |
| Less than 2.0x | 9,793,977 (31.2%) | 110,515 (0.2%) |
| 2.0x to 2.9x | 4,991,859 (15.9%) | 15,287,925 (30.5%) |
| 3.0x to 3.9x | 3,603,995 (11.5%) | 11,926,511 (23.8%) |
| 4.0x or more | 12,526,449 (40.0%) | 7,451,525 (14.9%) |
| Total | 31,349,301 (100.0%) | 50,148,459 (100.0%) |
Real Estate Taxes by Mortgage Status in the United States
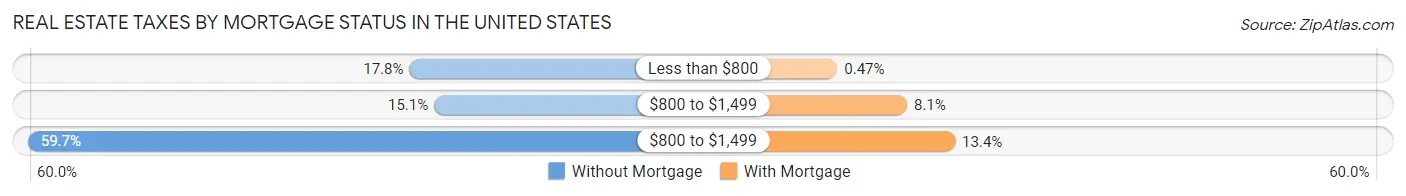
| Property Taxes | Without Mortgage | With Mortgage |
| Less than $800 | 5,592,100 (17.8%) | 236,321 (0.5%) |
| $800 to $1,499 | 4,742,162 (15.1%) | 4,068,964 (8.1%) |
| $800 to $1,499 | 18,701,135 (59.7%) | 6,708,120 (13.4%) |
| Total | 31,349,301 (100.0%) | 50,148,459 (100.0%) |
Health & Disability in the United States
Health Insurance Coverage by Age in the United States
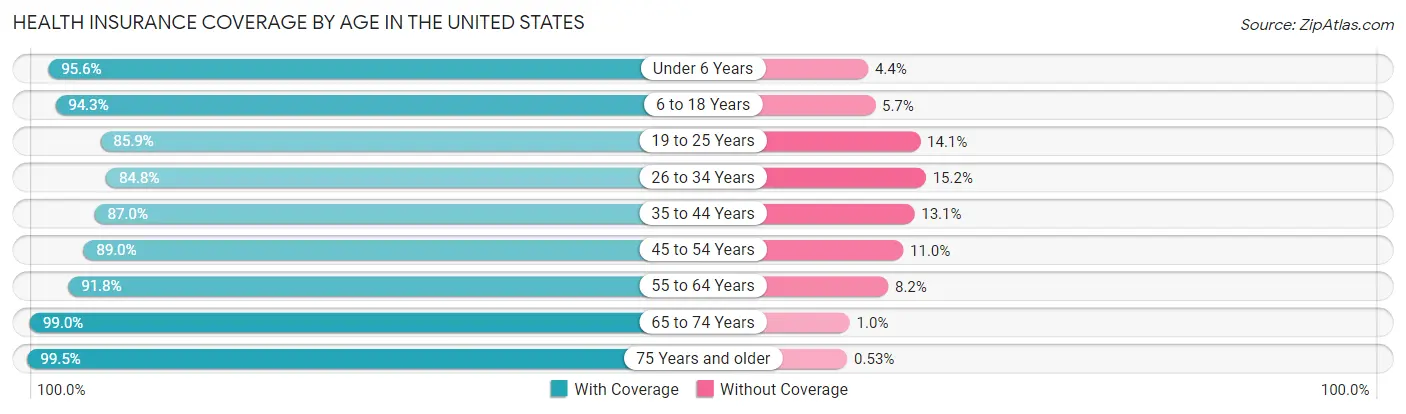
| Age Bracket | With Coverage | Without Coverage |
| Under 6 Years | 21,886,670 (95.6%) | 1,010,492 (4.4%) |
| 6 to 18 Years | 51,735,363 (94.3%) | 3,144,853 (5.7%) |
| 19 to 25 Years | 26,031,366 (85.9%) | 4,288,165 (14.1%) |
| 26 to 34 Years | 33,860,361 (84.8%) | 6,062,261 (15.2%) |
| 35 to 44 Years | 36,492,156 (87.0%) | 5,479,236 (13.1%) |
| 45 to 54 Years | 36,160,714 (89.0%) | 4,454,479 (11.0%) |
| 55 to 64 Years | 38,744,999 (91.8%) | 3,443,977 (8.2%) |
| 65 to 74 Years | 31,551,173 (99.0%) | 317,575 (1.0%) |
| 75 Years and older | 21,369,616 (99.5%) | 114,054 (0.5%) |
| Total | 297,832,418 (91.3%) | 28,315,092 (8.7%) |
Health Insurance Coverage by Citizenship Status in the United States
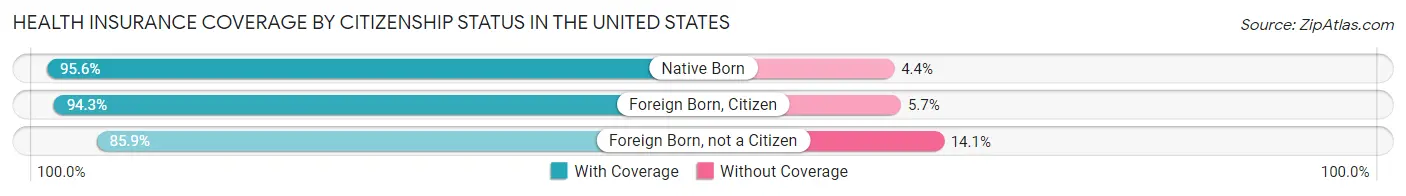
| Citizenship Status | With Coverage | Without Coverage |
| Native Born | 21,886,670 (95.6%) | 1,010,492 (4.4%) |
| Foreign Born, Citizen | 51,735,363 (94.3%) | 3,144,853 (5.7%) |
| Foreign Born, not a Citizen | 26,031,366 (85.9%) | 4,288,165 (14.1%) |
Health Insurance Coverage by Household Income in the United States
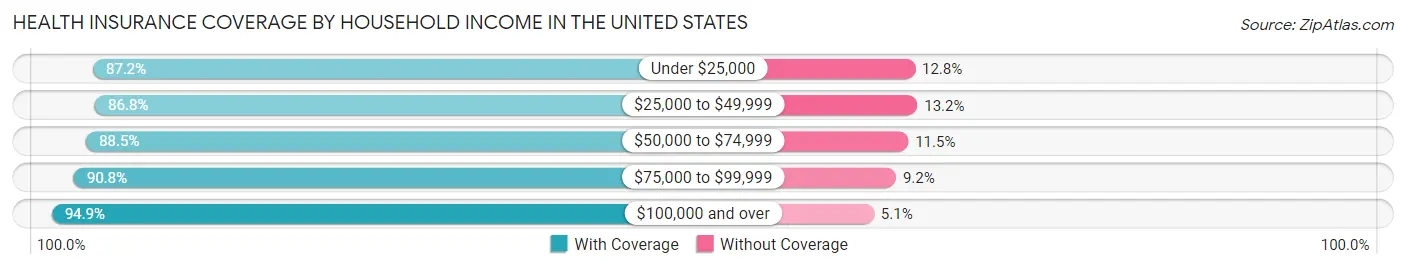
| Household Income | With Coverage | Without Coverage |
| Under $25,000 | 30,557,402 (87.2%) | 4,480,697 (12.8%) |
| $25,000 to $49,999 | 42,493,895 (86.8%) | 6,467,625 (13.2%) |
| $50,000 to $74,999 | 43,567,478 (88.5%) | 5,667,522 (11.5%) |
| $75,000 to $99,999 | 39,358,466 (90.8%) | 3,998,504 (9.2%) |
| $100,000 and over | 138,072,573 (94.9%) | 7,394,413 (5.1%) |
Public vs Private Health Insurance Coverage by Age in the United States
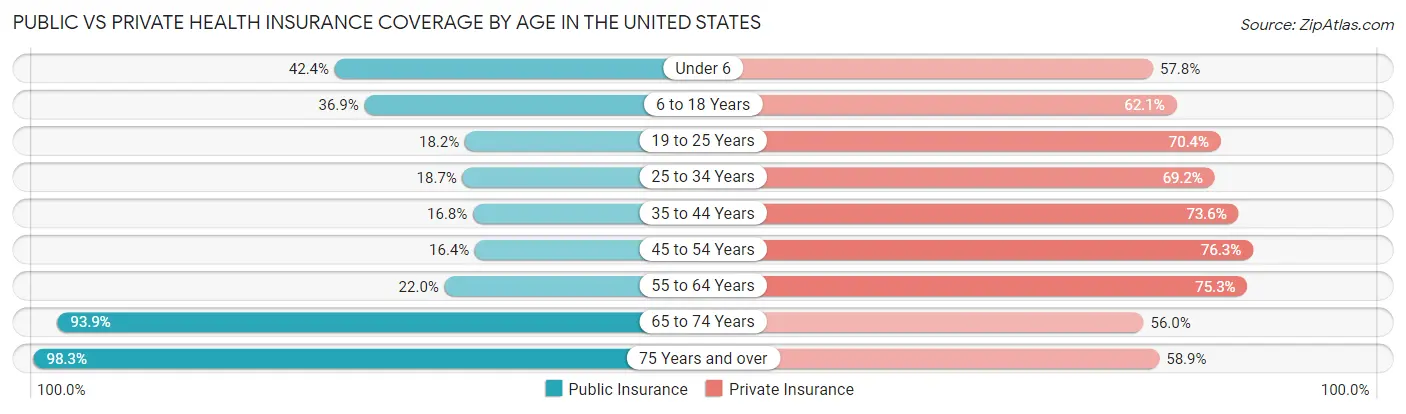
| Age Bracket | Public Insurance | Private Insurance |
| Under 6 | 9,711,479 (42.4%) | 13,226,991 (57.8%) |
| 6 to 18 Years | 20,250,974 (36.9%) | 34,098,628 (62.1%) |
| 19 to 25 Years | 5,529,657 (18.2%) | 21,328,962 (70.4%) |
| 25 to 34 Years | 7,460,560 (18.7%) | 27,632,249 (69.2%) |
| 35 to 44 Years | 7,028,469 (16.8%) | 30,904,431 (73.6%) |
| 45 to 54 Years | 6,652,277 (16.4%) | 31,007,428 (76.3%) |
| 55 to 64 Years | 9,293,396 (22.0%) | 31,758,199 (75.3%) |
| 65 to 74 Years | 29,923,610 (93.9%) | 17,851,037 (56.0%) |
| 75 Years and over | 21,125,720 (98.3%) | 12,659,940 (58.9%) |
| Total | 116,976,142 (35.9%) | 220,467,865 (67.6%) |
Disability Status by Sex by Age in the United States
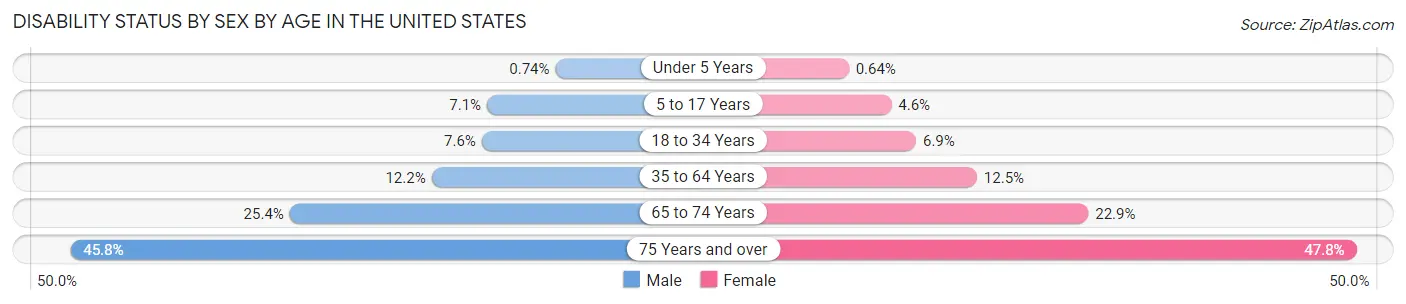
| Age Bracket | Male | Female |
| Under 5 Years | 72,084 (0.7%) | 59,605 (0.6%) |
| 5 to 17 Years | 1,965,188 (7.1%) | 1,215,129 (4.6%) |
| 18 to 34 Years | 2,850,221 (7.6%) | 2,570,461 (6.9%) |
| 35 to 64 Years | 7,547,610 (12.2%) | 7,911,528 (12.5%) |
| 65 to 74 Years | 3,808,696 (25.4%) | 3,860,511 (22.9%) |
| 75 Years and over | 4,105,827 (45.8%) | 5,974,596 (47.8%) |
Disability Class by Sex by Age in the United States
Disability Class: Hearing Difficulty
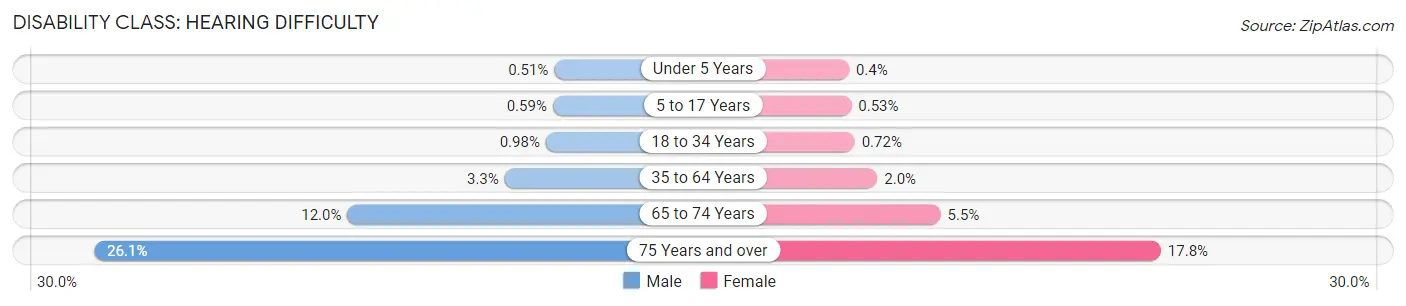
| Age Bracket | Male | Female |
| Under 5 Years | 49,303 (0.5%) | 36,722 (0.4%) |
| 5 to 17 Years | 164,565 (0.6%) | 140,296 (0.5%) |
| 18 to 34 Years | 367,612 (1.0%) | 269,665 (0.7%) |
| 35 to 64 Years | 2,014,743 (3.3%) | 1,248,539 (2.0%) |
| 65 to 74 Years | 1,803,545 (12.0%) | 927,368 (5.5%) |
| 75 Years and over | 2,344,978 (26.1%) | 2,223,426 (17.8%) |
Disability Class: Vision Difficulty
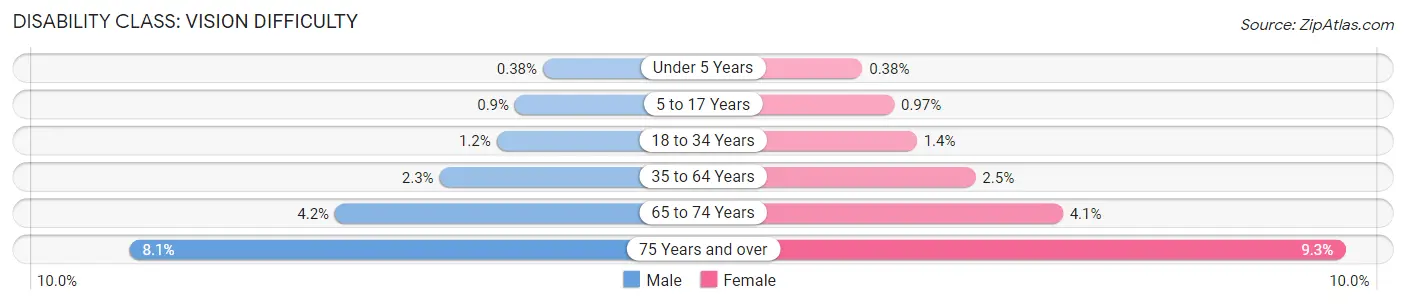
| Age Bracket | Male | Female |
| Under 5 Years | 37,386 (0.4%) | 35,689 (0.4%) |
| 5 to 17 Years | 249,527 (0.9%) | 256,341 (1.0%) |
| 18 to 34 Years | 467,580 (1.2%) | 519,405 (1.4%) |
| 35 to 64 Years | 1,419,422 (2.3%) | 1,567,480 (2.5%) |
| 65 to 74 Years | 635,758 (4.2%) | 691,503 (4.1%) |
| 75 Years and over | 722,264 (8.1%) | 1,168,817 (9.3%) |
Disability Class: Cognitive Difficulty
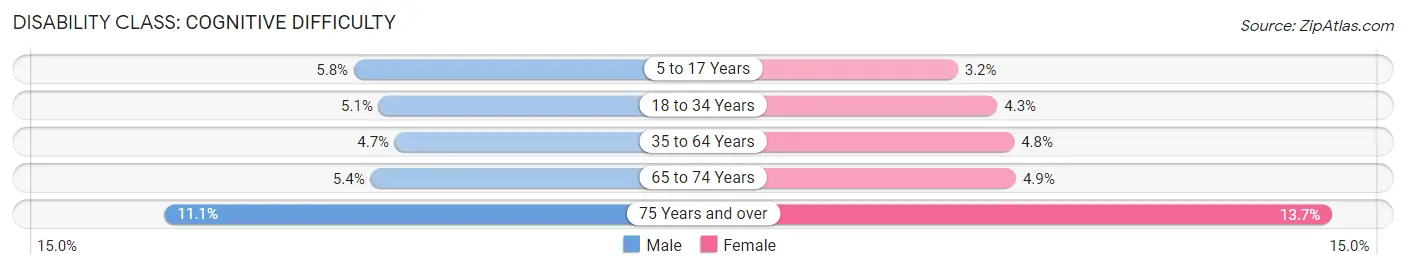
| Age Bracket | Male | Female |
| 5 to 17 Years | 1,613,706 (5.8%) | 853,467 (3.2%) |
| 18 to 34 Years | 1,931,972 (5.1%) | 1,615,245 (4.3%) |
| 35 to 64 Years | 2,892,691 (4.7%) | 3,030,139 (4.8%) |
| 65 to 74 Years | 804,491 (5.4%) | 818,164 (4.9%) |
| 75 Years and over | 996,066 (11.1%) | 1,708,011 (13.7%) |
Disability Class: Ambulatory Difficulty
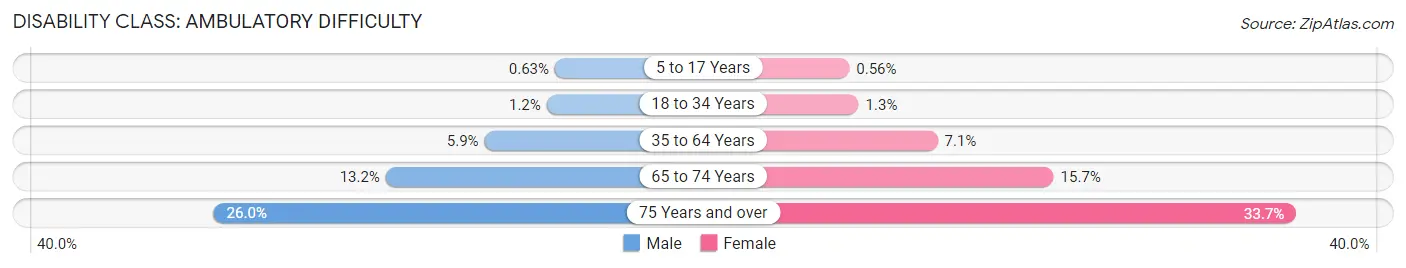
| Age Bracket | Male | Female |
| 5 to 17 Years | 175,275 (0.6%) | 148,445 (0.6%) |
| 18 to 34 Years | 467,114 (1.2%) | 464,251 (1.3%) |
| 35 to 64 Years | 3,611,290 (5.9%) | 4,489,480 (7.1%) |
| 65 to 74 Years | 1,978,171 (13.2%) | 2,655,148 (15.7%) |
| 75 Years and over | 2,328,964 (26.0%) | 4,220,393 (33.7%) |
Disability Class: Self-Care Difficulty
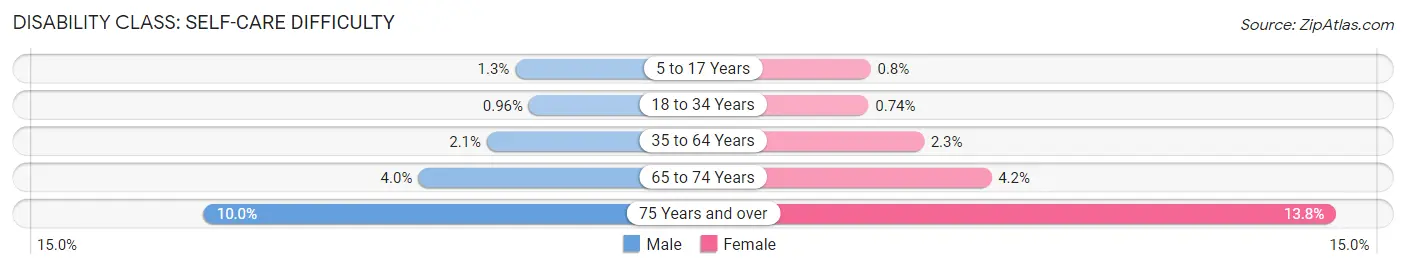
| Age Bracket | Male | Female |
| 5 to 17 Years | 371,067 (1.3%) | 210,393 (0.8%) |
| 18 to 34 Years | 361,228 (1.0%) | 276,756 (0.7%) |
| 35 to 64 Years | 1,312,869 (2.1%) | 1,441,793 (2.3%) |
| 65 to 74 Years | 606,321 (4.0%) | 701,636 (4.2%) |
| 75 Years and over | 898,127 (10.0%) | 1,721,461 (13.8%) |
Technology Access in the United States
Computing Device Access in the United States
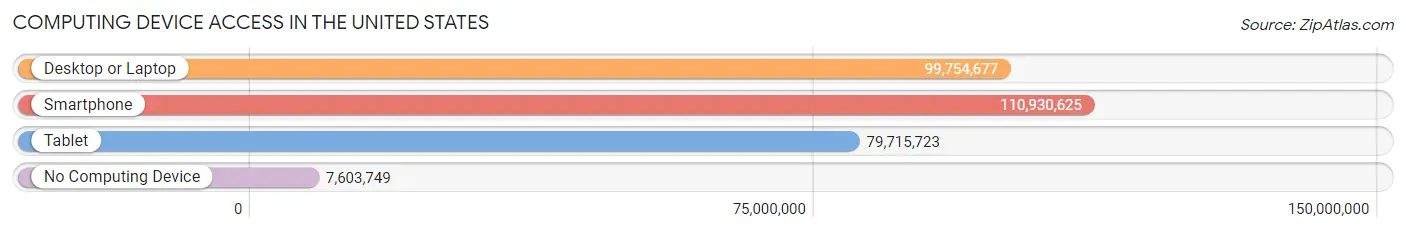
| Device Type | # Households | % Households |
| Desktop or Laptop | 99,754,677 | 79.3% |
| Smartphone | 110,930,625 | 88.2% |
| Tablet | 79,715,723 | 63.4% |
| No Computing Device | 7,603,749 | 6.0% |
| Total | 125,736,353 | 100.0% |
Internet Access in the United States
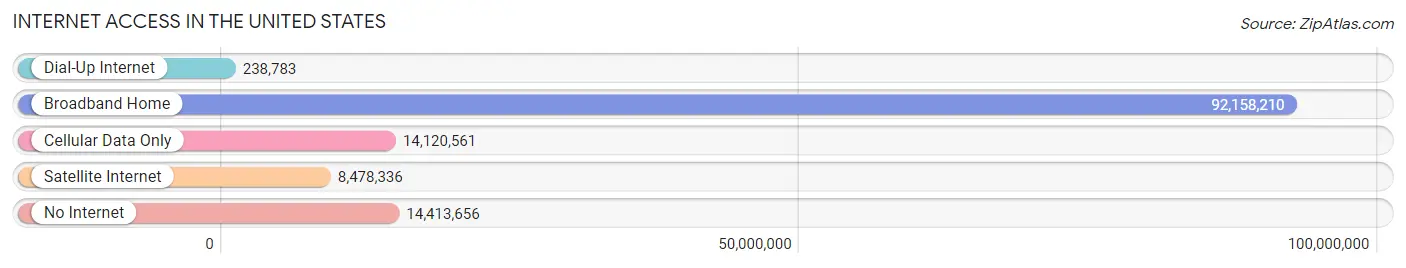
| Internet Type | # Households | % Households |
| Dial-Up Internet | 238,783 | 0.2% |
| Broadband Home | 92,158,210 | 73.3% |
| Cellular Data Only | 14,120,561 | 11.2% |
| Satellite Internet | 8,478,336 | 6.7% |
| No Internet | 14,413,656 | 11.5% |
| Total | 125,736,353 | 100.0% |
Common Questions
What is the Total Population of the United States?
Total Population of the United States is 331,097,593.
What is the Total Male Population of the United States?
Total Male Population of the United States is 164,200,298.
What is the Total Female Population of the United States?
Total Female Population of the United States is 166,897,295.
What is the Ratio of Males per 100 Females in the United States?
There are 98.38 Males per 100 Females in the United States.
What is the Ratio of Females per 100 Males in the United States?
There are 101.64 Females per 100 Males in the United States.
What is the Median Population Age in the United States?
Median Population Age in the United States is 38.5 Years.
What is the Average Family Size in the United States
Average Family Size in the United States is 3.2 People.
What is the Average Household Size in the United States
Average Household Size in the United States is 2.6 People.
What is Per Capita Income in the United States?
Per Capita income in the United States is $41,261.
What is the Median Family Income in the United States?
Median Family Income in the United States is $92,646.
What is the Median Household income in the United States?
Median Household Income in the United States is $75,149.
What is Income or Wage Gap in the United States?
Income or Wage Gap in the United States is 28.0%.
Women in the United States earn 72.0 cents for every dollar earned by a man.
What is Family Income Deficit in the United States?
Family Income Deficit in the United States is $11,046.
Families that are below poverty line in the United States earn $11,046 less on average than the poverty threshold level.
What is Inequality or Gini Index in the United States?
Inequality or Gini Index in the United States is 0.48.
How Large is the Labor Force in the United States?
There are 169,171,603 People in the Labor Forcein in the United States.
What is the Percentage of People in the Labor Force in the United States?
63.5% of People are in the Labor Force in the United States.
What is the Unemployment Rate in the United States?
Unemployment Rate in the United States is 5.3%.