Area Code 251 Map & Demographics
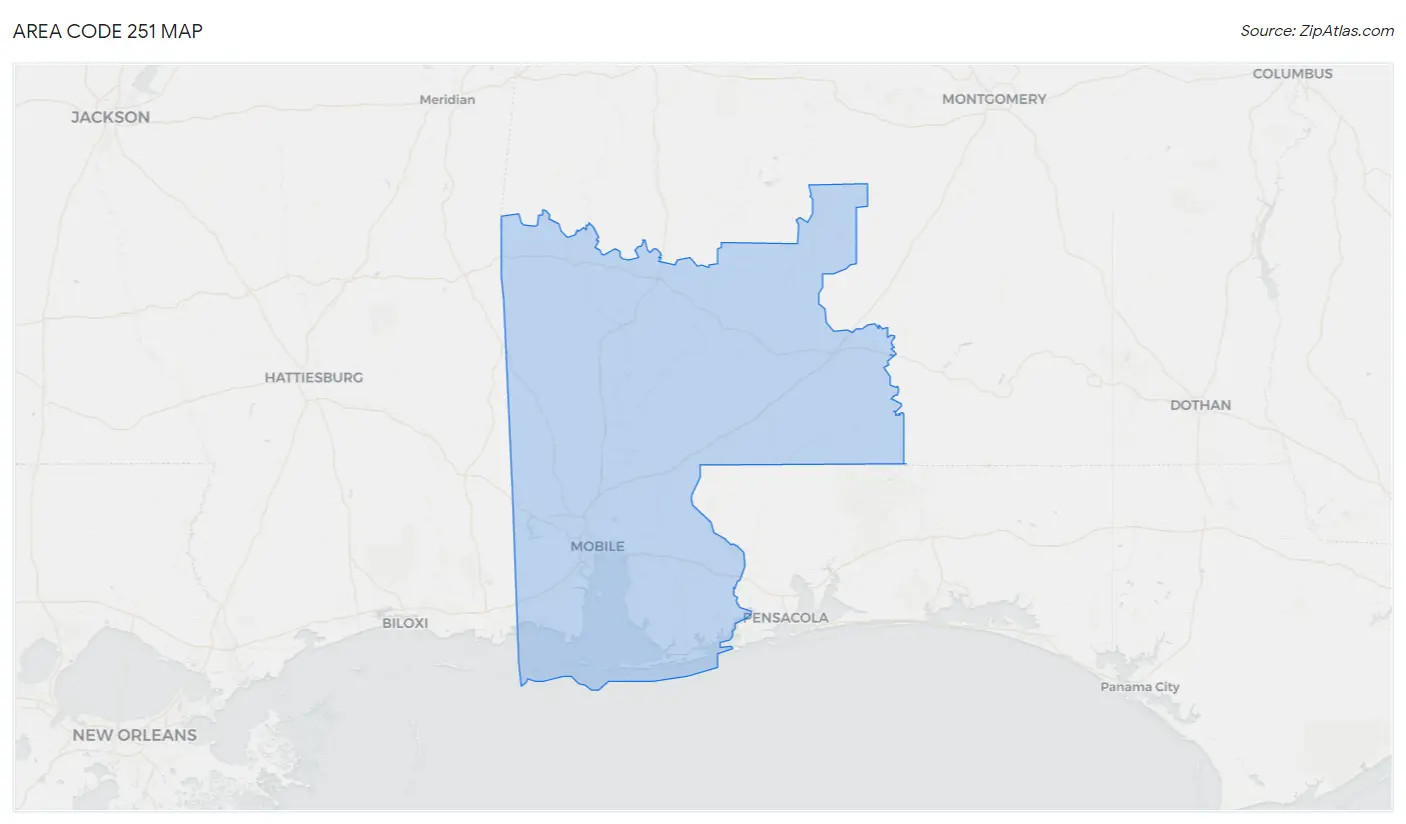
Area Code 251 Map
Area Code 251 Overview
$31,556
PER CAPITA INCOME
$70,996
AVG FAMILY INCOME
$56,678
AVG HOUSEHOLD INCOME
35.7%
WAGE / INCOME GAP [ % ]
64.3¢/ $1
WAGE / INCOME GAP [ $ ]
$11,835
FAMILY INCOME DEFICIT
41.58
INEQUALITY / GINI INDEX
752,045
TOTAL POPULATION
364,634
MALE POPULATION
387,411
FEMALE POPULATION
94.12
MALES / 100 FEMALES
106.25
FEMALES / 100 MALES
44.2
MEDIAN AGE
3.2
AVG FAMILY SIZE
2.6
AVG HOUSEHOLD SIZE
308,250
LABOR FORCE [ PEOPLE ]
51.1%
PERCENT IN LABOR FORCE
7.1%
UNEMPLOYMENT RATE
Income in Area Code 251
Income Overview in Area Code 251
Per Capita Income in Area Code 251 is $31,556, while median incomes of families and households are $70,996 and $56,678 respectively.
| Characteristic | Number | Measure |
| Per Capita Income | 752,045 | $31,556 |
| Median Family Income | 186,412 | $70,996 |
| Mean Family Income | 186,412 | $7,939,544 |
| Median Household Income | 288,514 | $56,678 |
| Mean Household Income | 288,514 | $6,823,557 |
| Income Deficit | 186,412 | $11,835 |
| Wage / Income Gap (%) | 752,045 | 35.71% |
| Wage / Income Gap ($) | 752,045 | 64.29¢ per $1 |
| Gini / Inequality Index | 752,045 | 41.58 |
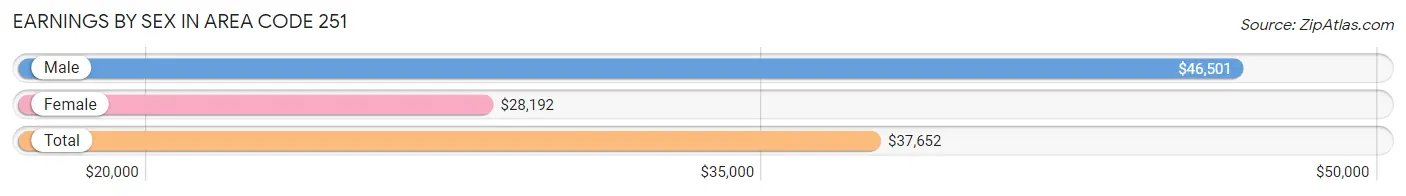
Earnings by Sex in Area Code 251
Average Earnings in Area Code 251 are $37,652, $46,501 for men and $28,192 for women, a difference of 39.4%.
| Sex | Number | Average Earnings |
| Male | 181,995 (51.8%) | $46,501 |
| Female | 169,439 (48.2%) | $28,192 |
| Total | 351,434 (100.0%) | $37,652 |
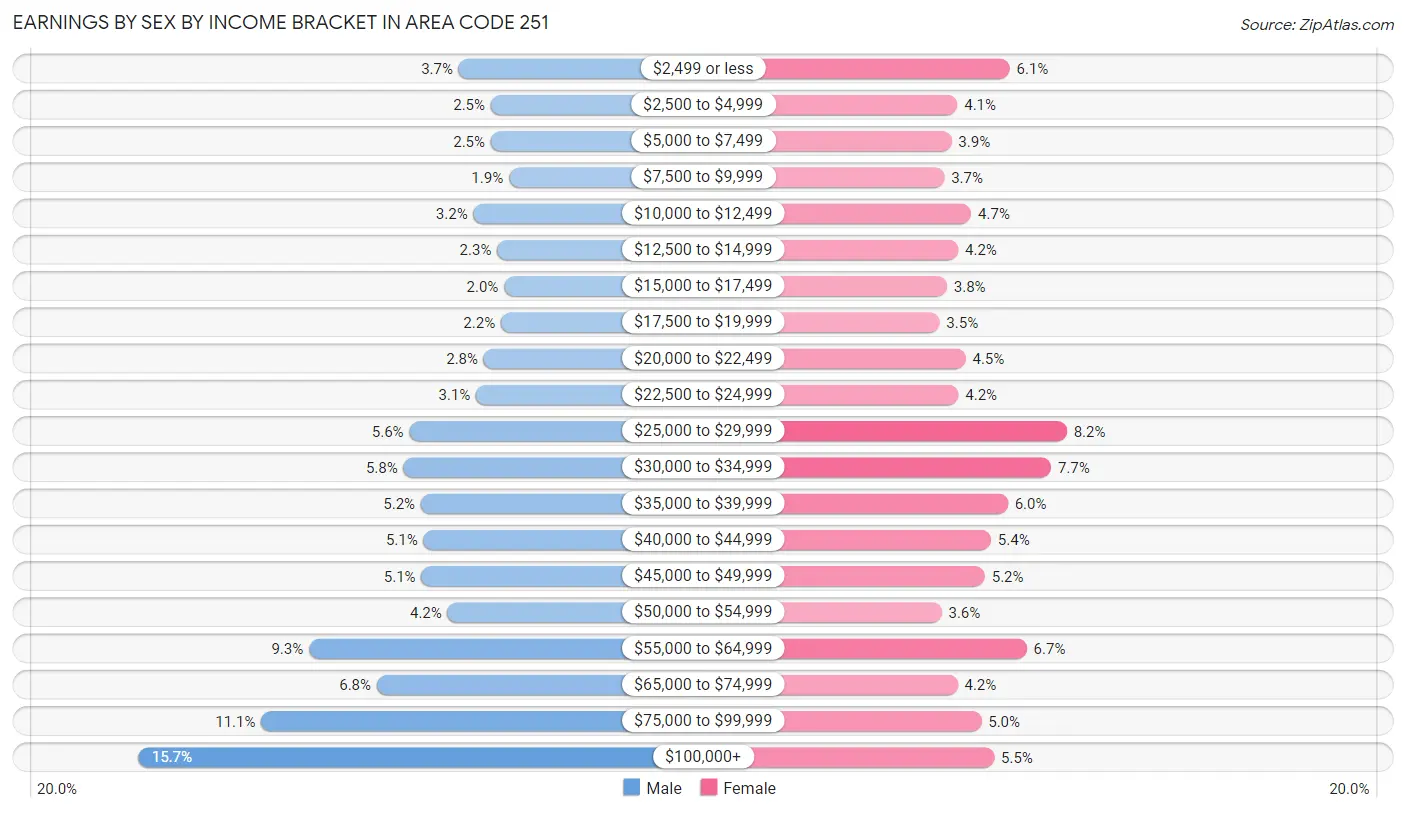
Earnings by Sex by Income Bracket in Area Code 251
The most common earnings brackets in Area Code 251 are $100,000+ for men (28,601 | 15.7%) and $25,000 to $29,999 for women (13,961 | 8.2%).
| Income | Male | Female |
| $2,499 or less | 6,786 (3.7%) | 10,339 (6.1%) |
| $2,500 to $4,999 | 4,608 (2.5%) | 7,011 (4.1%) |
| $5,000 to $7,499 | 4,596 (2.5%) | 6,638 (3.9%) |
| $7,500 to $9,999 | 3,376 (1.8%) | 6,184 (3.6%) |
| $10,000 to $12,499 | 5,791 (3.2%) | 7,899 (4.7%) |
| $12,500 to $14,999 | 4,165 (2.3%) | 7,064 (4.2%) |
| $15,000 to $17,499 | 3,694 (2.0%) | 6,356 (3.7%) |
| $17,500 to $19,999 | 3,907 (2.1%) | 5,886 (3.5%) |
| $20,000 to $22,499 | 5,074 (2.8%) | 7,542 (4.4%) |
| $22,500 to $24,999 | 5,606 (3.1%) | 7,087 (4.2%) |
| $25,000 to $29,999 | 10,163 (5.6%) | 13,961 (8.2%) |
| $30,000 to $34,999 | 10,560 (5.8%) | 12,969 (7.6%) |
| $35,000 to $39,999 | 9,364 (5.1%) | 10,221 (6.0%) |
| $40,000 to $44,999 | 9,184 (5.1%) | 9,146 (5.4%) |
| $45,000 to $49,999 | 9,337 (5.1%) | 8,752 (5.2%) |
| $50,000 to $54,999 | 7,554 (4.2%) | 6,023 (3.5%) |
| $55,000 to $64,999 | 16,991 (9.3%) | 11,422 (6.7%) |
| $65,000 to $74,999 | 12,377 (6.8%) | 7,036 (4.2%) |
| $75,000 to $99,999 | 20,261 (11.1%) | 8,542 (5.0%) |
| $100,000+ | 28,601 (15.7%) | 9,361 (5.5%) |
| Total | 181,995 (100.0%) | 169,439 (100.0%) |
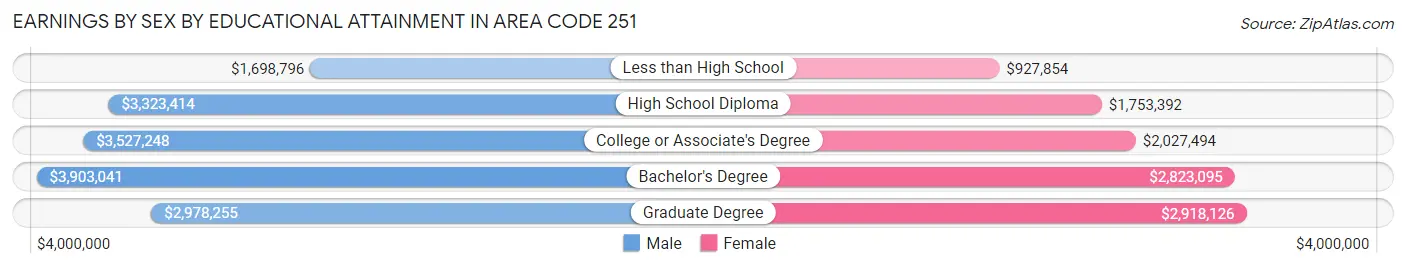
Earnings by Sex by Educational Attainment in Area Code 251
Average earnings in Area Code 251 are $4,369,365 for men and $2,421,766 for women, a difference of 44.6%. Men with an educational attainment of bachelor's degree enjoy the highest average annual earnings of $3,903,041, while those with less than high school education earn the least with $1,698,796. Women with an educational attainment of graduate degree earn the most with the average annual earnings of $2,918,126, while those with less than high school education have the smallest earnings of $927,854.
| Educational Attainment | Male Income | Female Income |
| Less than High School | $1,698,796 | $927,854 |
| High School Diploma | $3,323,414 | $1,753,392 |
| College or Associate's Degree | $3,527,248 | $2,027,494 |
| Bachelor's Degree | $3,903,041 | $2,823,095 |
| Graduate Degree | $2,978,255 | $2,918,126 |
| Total | $4,369,365 | $2,421,766 |
Family Income in Area Code 251
Family Income Brackets in Area Code 251
According to the Area Code 251 family income data, there are 3,186,340 families falling into the $50,000 to $74,999 income range, which is the most common income bracket and makes up 1,709.3% of all families. Conversely, the $10,000 to $14,999 income bracket is the least frequent group with only 732,599 families (393.0%) belonging to this category.
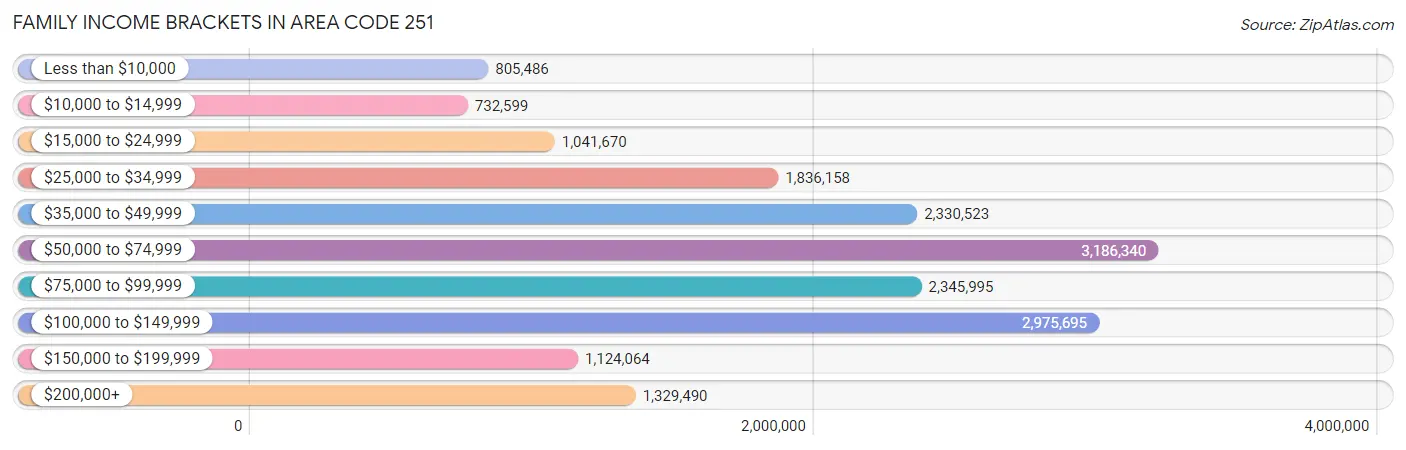
| Income Bracket | # Families | % Families |
| Less than $10,000 | 805,486 | 432.1% |
| $10,000 to $14,999 | 732,599 | 393.0% |
| $15,000 to $24,999 | 1,041,670 | 558.8% |
| $25,000 to $34,999 | 1,836,158 | 985.0% |
| $35,000 to $49,999 | 2,330,523 | 1,250.2% |
| $50,000 to $74,999 | 3,186,340 | 1,709.3% |
| $75,000 to $99,999 | 2,345,995 | 1,258.5% |
| $100,000 to $149,999 | 2,975,695 | 1,596.3% |
| $150,000 to $199,999 | 1,124,064 | 603.0% |
| $200,000+ | 1,329,490 | 713.2% |
Family Income by Famaliy Size in Area Code 251
6-person families (5,470 | 2.9%) account for the highest median family income in Area Code 251 with $105,626 per family, while 2-person families (95,316 | 51.1%) have the highest median income of $32,897 per family member.
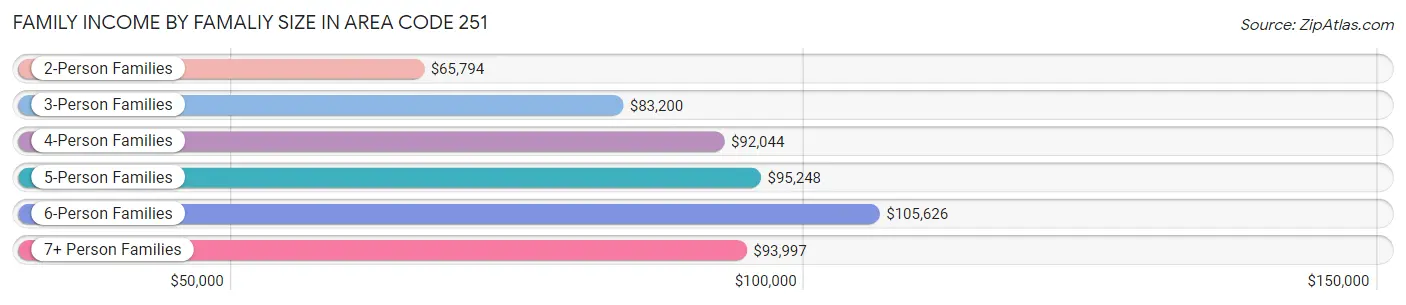
| Income Bracket | # Families | Median Income |
| 2-Person Families | 95,316 (51.1%) | $65,794 |
| 3-Person Families | 40,930 (22.0%) | $83,200 |
| 4-Person Families | 29,229 (15.7%) | $92,044 |
| 5-Person Families | 13,541 (7.3%) | $95,248 |
| 6-Person Families | 5,470 (2.9%) | $105,626 |
| 7+ Person Families | 1,926 (1.0%) | $93,997 |
| Total | 186,412 (100.0%) | $70,996 |
Family Income by Number of Earners in Area Code 251
The median family income in Area Code 251 is $70,996, with families comprising 3+ earners (14,893) having the highest median family income of $137,658, while families with no earners (37,663) have the lowest median family income of $39,497, accounting for 8.0% and 20.2% of families, respectively.
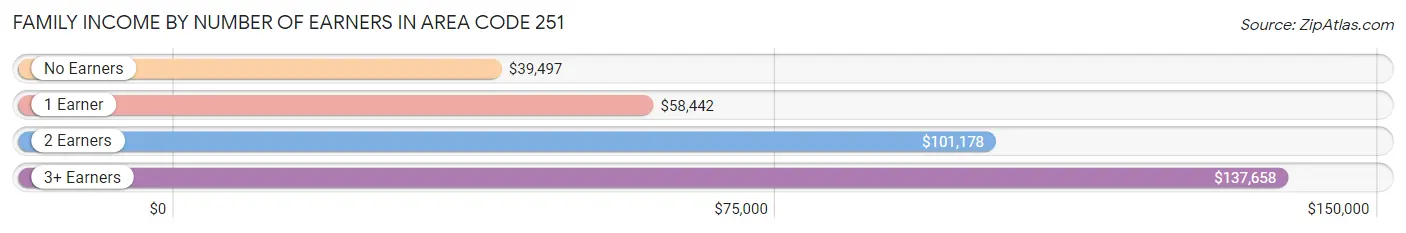
| Number of Earners | # Families | Median Income |
| No Earners | 37,663 (20.2%) | $39,497 |
| 1 Earner | 64,795 (34.8%) | $58,442 |
| 2 Earners | 69,061 (37.0%) | $101,178 |
| 3+ Earners | 14,893 (8.0%) | $137,658 |
| Total | 186,412 (100.0%) | $70,996 |
Household Income in Area Code 251
Household Income Brackets in Area Code 251
With 4,389,741 households falling in the category, the $50,000 to $74,999 income range is the most frequent in Area Code 251, accounting for 1,521.5% of all households. In contrast, only 1,310,719 households (454.3%) fall into the $150,000 to $199,999 income bracket, making it the least populous group.
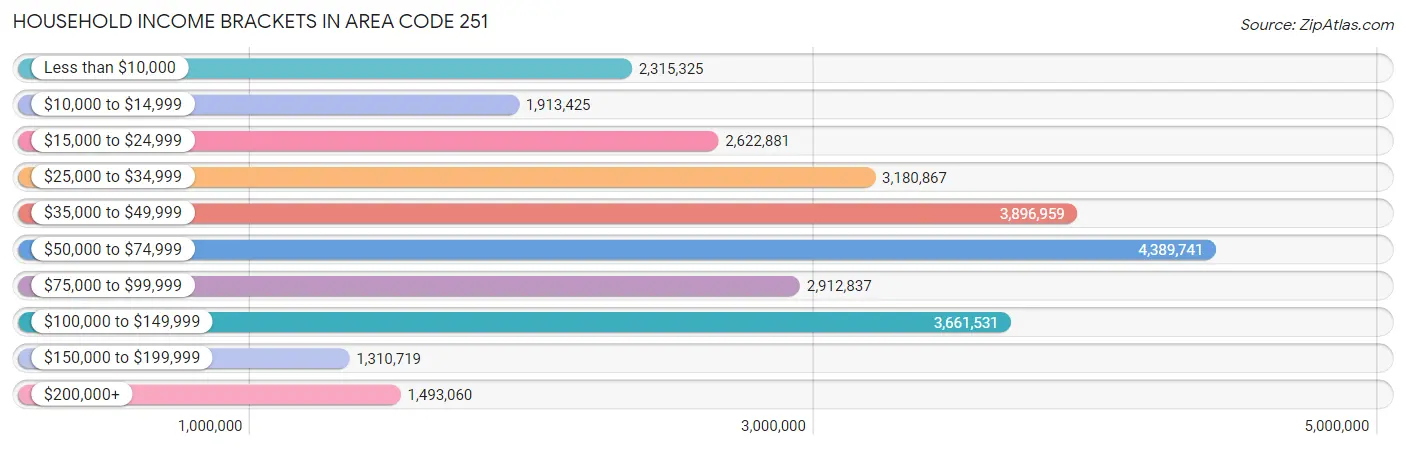
| Income Bracket | # Households | % Households |
| Less than $10,000 | 2,315,325 | 802.5% |
| $10,000 to $14,999 | 1,913,425 | 663.2% |
| $15,000 to $24,999 | 2,622,881 | 909.1% |
| $25,000 to $34,999 | 3,180,867 | 1,102.5% |
| $35,000 to $49,999 | 3,896,959 | 1,350.7% |
| $50,000 to $74,999 | 4,389,741 | 1,521.5% |
| $75,000 to $99,999 | 2,912,837 | 1,009.6% |
| $100,000 to $149,999 | 3,661,531 | 1,269.1% |
| $150,000 to $199,999 | 1,310,719 | 454.3% |
| $200,000+ | 1,493,060 | 517.5% |
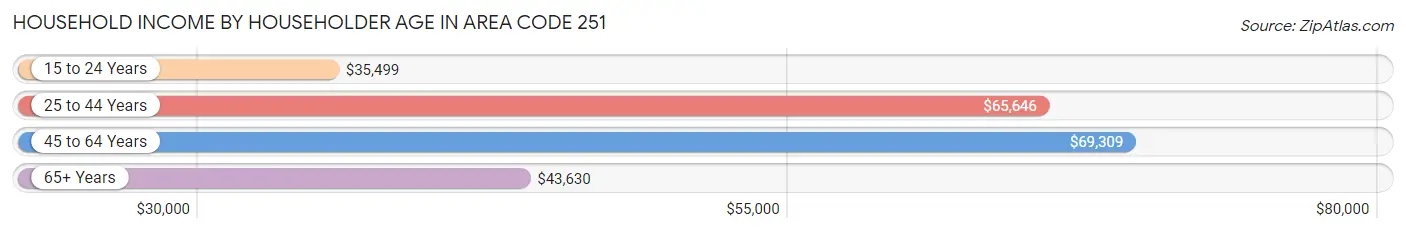
Household Income by Householder Age in Area Code 251
The median household income in Area Code 251 is $56,678, with the highest median household income of $69,309 found in the 45 to 64 years age bracket for the primary householder. A total of 106,846 households (37.0%) fall into this category. Meanwhile, the 15 to 24 years age bracket for the primary householder has the lowest median household income of $35,499, with 9,303 households (3.2%) in this group.
| Income Bracket | # Households | Median Income |
| 15 to 24 Years | 9,303 (3.2%) | $35,499 |
| 25 to 44 Years | 85,843 (29.7%) | $65,646 |
| 45 to 64 Years | 106,846 (37.0%) | $69,309 |
| 65+ Years | 86,522 (30.0%) | $43,630 |
| Total | 288,514 (100.0%) | $56,678 |
Poverty in Area Code 251
Income Below Poverty by Sex and Age in Area Code 251
With 13.7% poverty level for males and 17.6% for females among the residents of Area Code 251, under 5 year old males and under 5 year old females are the most vulnerable to poverty, with 6,156 males (27.4%) and 5,092 females (24.9%) in their respective age groups living below the poverty level.
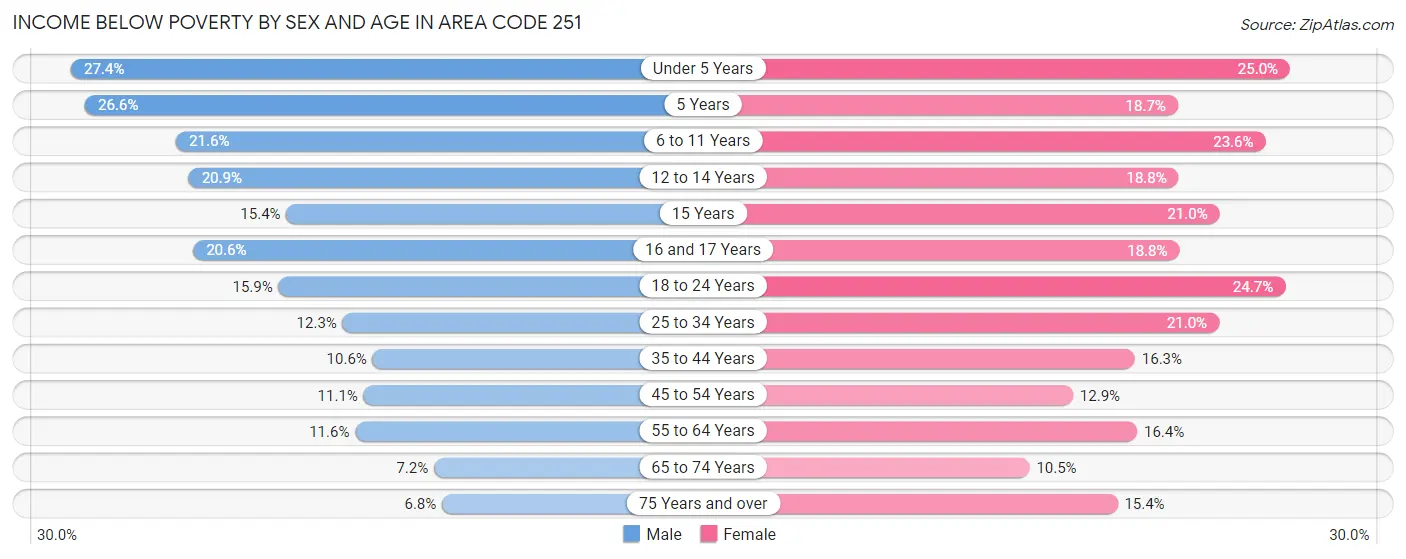
| Age Bracket | Male | Female |
| Under 5 Years | 6,156 (27.4%) | 5,092 (24.9%) |
| 5 Years | 1,035 (26.6%) | 812 (18.7%) |
| 6 to 11 Years | 5,992 (21.6%) | 6,243 (23.6%) |
| 12 to 14 Years | 3,288 (20.9%) | 2,781 (18.8%) |
| 15 Years | 854 (15.4%) | 982 (21.0%) |
| 16 and 17 Years | 1,900 (20.6%) | 1,853 (18.8%) |
| 18 to 24 Years | 4,864 (15.9%) | 7,444 (24.7%) |
| 25 to 34 Years | 5,496 (12.3%) | 10,031 (21.0%) |
| 35 to 44 Years | 4,495 (10.6%) | 7,616 (16.3%) |
| 45 to 54 Years | 4,848 (11.1%) | 6,079 (12.9%) |
| 55 to 64 Years | 5,623 (11.6%) | 8,833 (16.4%) |
| 65 to 74 Years | 2,778 (7.2%) | 4,572 (10.4%) |
| 75 Years and over | 1,503 (6.8%) | 4,888 (15.3%) |
| Total | 48,832 (13.7%) | 67,226 (17.6%) |
Income Above Poverty by Sex and Age in Area Code 251
According to the poverty statistics in Area Code 251, males aged 75 years and over and females aged 65 to 74 years are the age groups that are most secure financially, with 93.2% of males and 89.5% of females in these age groups living above the poverty line.
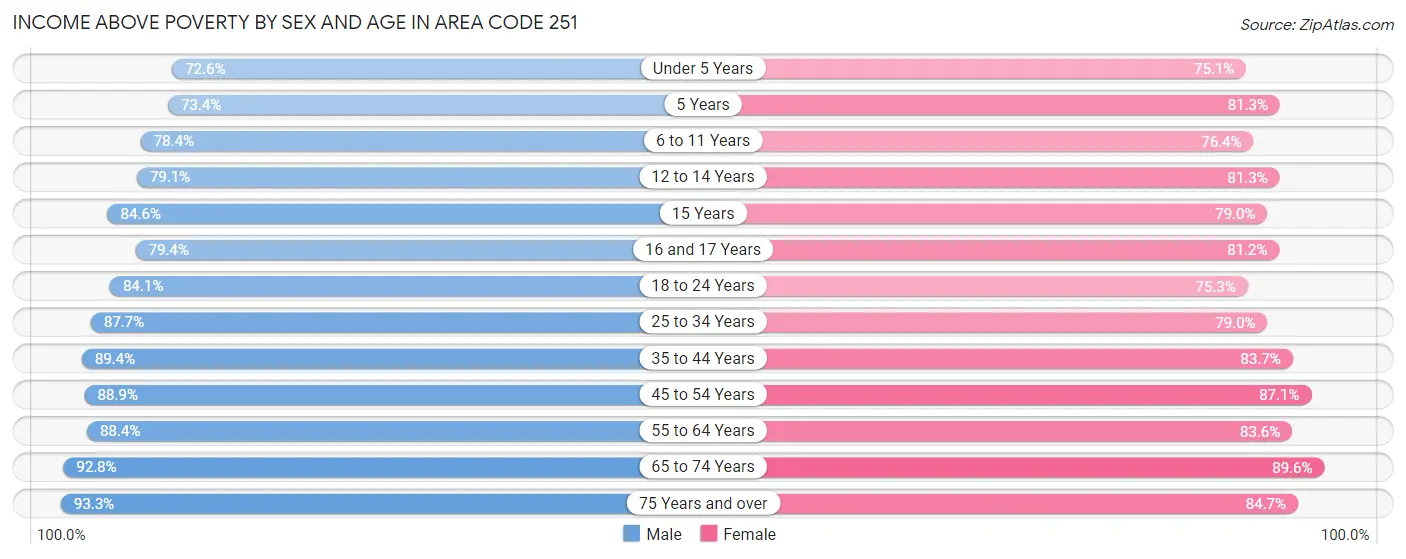
| Age Bracket | Male | Female |
| Under 5 Years | 16,305 (72.6%) | 15,319 (75.0%) |
| 5 Years | 2,852 (73.4%) | 3,530 (81.3%) |
| 6 to 11 Years | 21,796 (78.4%) | 20,234 (76.4%) |
| 12 to 14 Years | 12,475 (79.1%) | 12,049 (81.2%) |
| 15 Years | 4,685 (84.6%) | 3,688 (79.0%) |
| 16 and 17 Years | 7,321 (79.4%) | 8,009 (81.2%) |
| 18 to 24 Years | 25,800 (84.1%) | 22,721 (75.3%) |
| 25 to 34 Years | 39,226 (87.7%) | 37,744 (79.0%) |
| 35 to 44 Years | 37,848 (89.4%) | 39,058 (83.7%) |
| 45 to 54 Years | 38,736 (88.9%) | 41,141 (87.1%) |
| 55 to 64 Years | 42,899 (88.4%) | 44,907 (83.6%) |
| 65 to 74 Years | 35,790 (92.8%) | 39,190 (89.5%) |
| 75 Years and over | 20,777 (93.2%) | 26,964 (84.7%) |
| Total | 306,510 (86.3%) | 314,554 (82.4%) |
Income Below Poverty Among Married-Couple Families in Area Code 251
The poverty statistics for married-couple families in Area Code 251 show that 4.6% or 6,327 of the total 136,648 families live below the poverty line. Families with 5 or more children have the highest poverty rate of 23.1%, comprising of 137 families. On the other hand, families with no children have the lowest poverty rate of 3.3%, which includes 2,818 families.
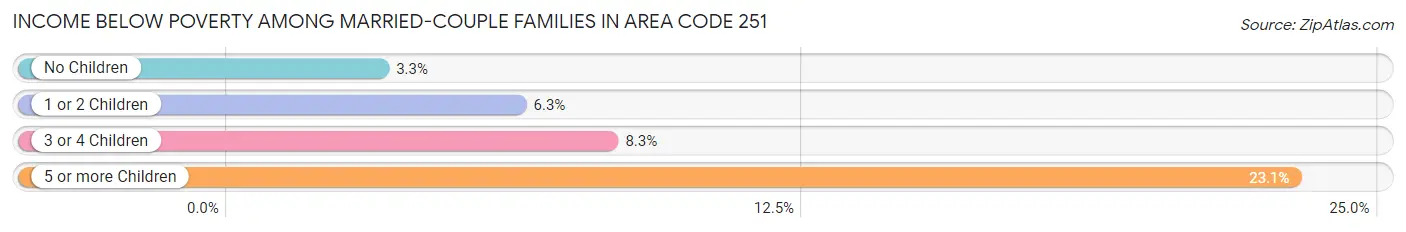
| Children | Above Poverty | Below Poverty |
| No Children | 82,736 (96.7%) | 2,818 (3.3%) |
| 1 or 2 Children | 37,908 (93.7%) | 2,539 (6.3%) |
| 3 or 4 Children | 9,222 (91.7%) | 833 (8.3%) |
| 5 or more Children | 455 (76.9%) | 137 (23.1%) |
| Total | 130,321 (95.4%) | 6,327 (4.6%) |
Income Below Poverty Among Single-Parent Households in Area Code 251
According to the poverty data in Area Code 251, 18.9% or 2,205 single-father households and 32.0% or 12,197 single-mother households are living below the poverty line. Among single-father households, those with 5 or more children have the highest poverty rate, with 53 households (31.2%) experiencing poverty. Likewise, among single-mother households, those with 5 or more children have the highest poverty rate, with 286 households (69.8%) falling below the poverty line.
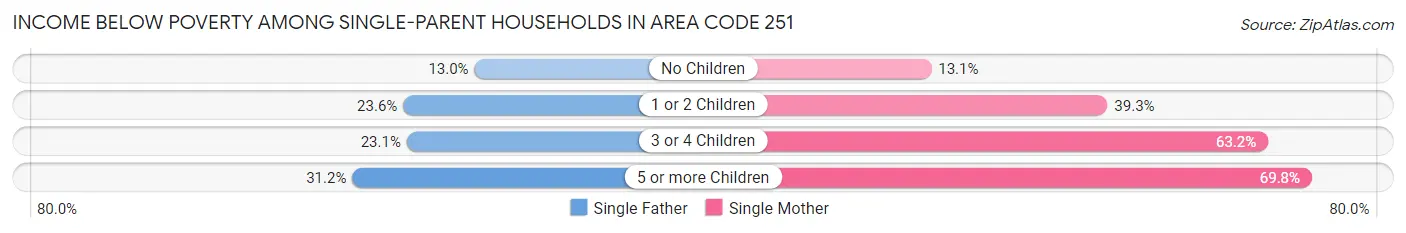
| Children | Single Father | Single Mother |
| No Children | 686 (13.0%) | 1,904 (13.1%) |
| 1 or 2 Children | 1,288 (23.6%) | 7,536 (39.3%) |
| 3 or 4 Children | 178 (23.1%) | 2,471 (63.2%) |
| 5 or more Children | 53 (31.2%) | 286 (69.8%) |
| Total | 2,205 (18.9%) | 12,197 (32.0%) |
Income Below Poverty Among Married-Couple vs Single-Parent Households in Area Code 251
The poverty data for Area Code 251 shows that 6,327 of the married-couple family households (4.6%) and 14,402 of the single-parent households (28.9%) are living below the poverty level. Within the married-couple family households, those with 5 or more children have the highest poverty rate, with 137 households (23.1%) falling below the poverty line. Among the single-parent households, those with 5 or more children have the highest poverty rate, with 339 household (58.5%) living below poverty.
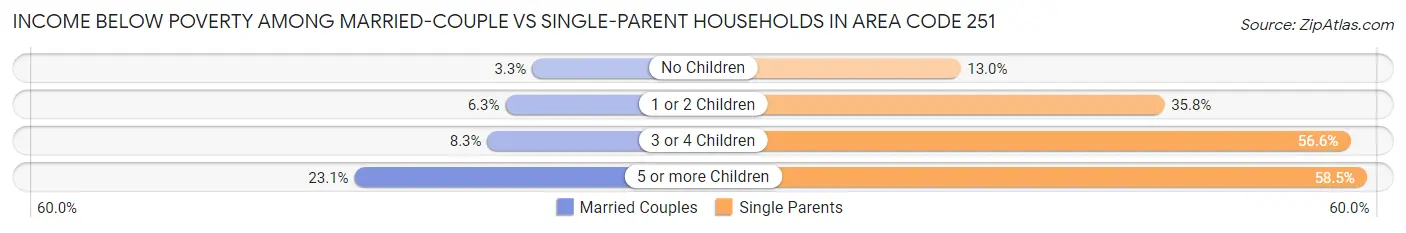
| Children | Married-Couple Families | Single-Parent Households |
| No Children | 2,818 (3.3%) | 2,590 (13.0%) |
| 1 or 2 Children | 2,539 (6.3%) | 8,824 (35.8%) |
| 3 or 4 Children | 833 (8.3%) | 2,649 (56.6%) |
| 5 or more Children | 137 (23.1%) | 339 (58.5%) |
| Total | 6,327 (4.6%) | 14,402 (28.9%) |
Race in Area Code 251
The most populous races in Area Code 251 are White / Caucasian (491,293 | 65.3%), Black / African American (207,740 | 27.6%), and Two or more Races (27,165 | 3.6%).
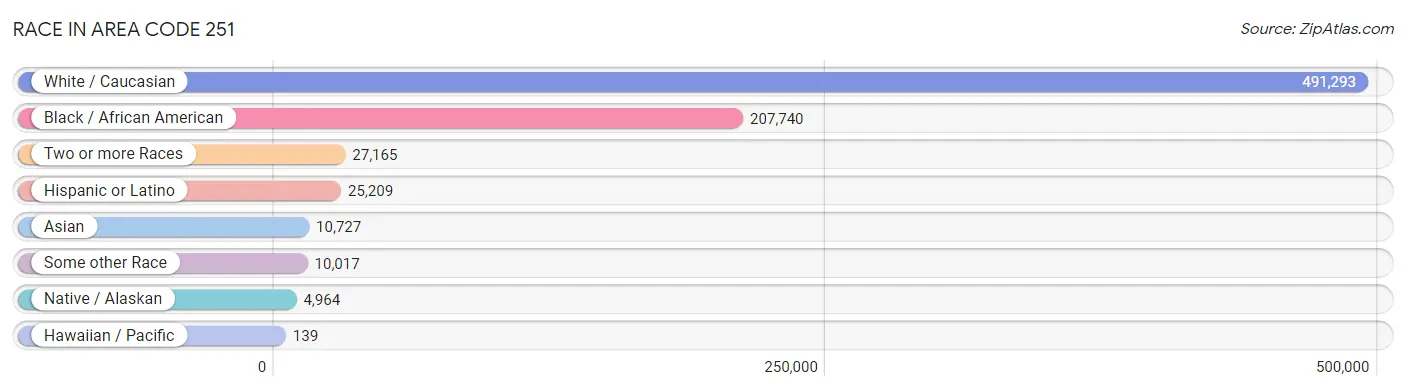
| Race | # Population | % Population |
| Asian | 10,727 | 1.4% |
| Black / African American | 207,740 | 27.6% |
| Hawaiian / Pacific | 139 | 0.0% |
| Hispanic or Latino | 25,209 | 3.4% |
| Native / Alaskan | 4,964 | 0.7% |
| White / Caucasian | 491,293 | 65.3% |
| Two or more Races | 27,165 | 3.6% |
| Some other Race | 10,017 | 1.3% |
| Total | 752,045 | 100.0% |
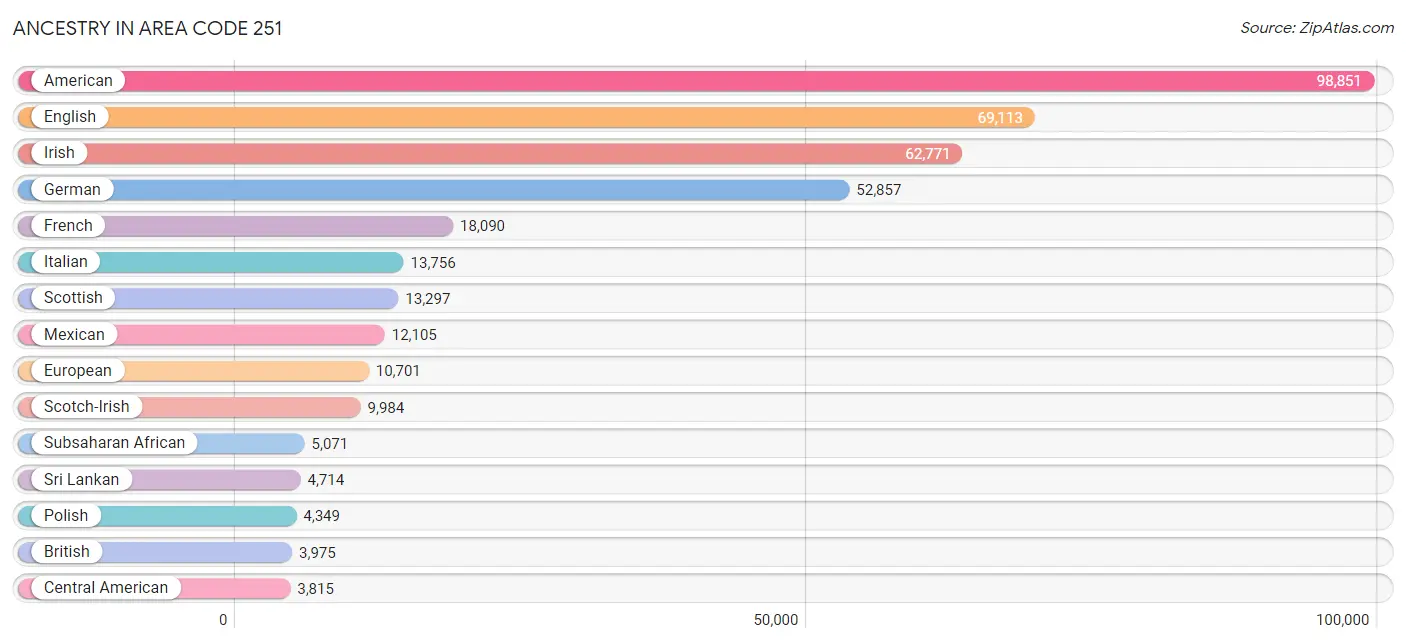
Ancestry in Area Code 251
The most populous ancestries reported in Area Code 251 are American (98,851 | 13.1%), English (69,113 | 9.2%), Irish (62,771 | 8.4%), German (52,857 | 7.0%), and French (18,090 | 2.4%), together accounting for 40.1% of all Area Code 251 residents.
| Ancestry | # Population | % Population |
| African | 3,763 | 0.5% |
| Alaska Native | 9 | 0.0% |
| American | 98,851 | 13.1% |
| Apache | 47 | 0.0% |
| Arab | 2,890 | 0.4% |
| Arapaho | 19 | 0.0% |
| Argentinean | 176 | 0.0% |
| Armenian | 44 | 0.0% |
| Australian | 33 | 0.0% |
| Austrian | 543 | 0.1% |
| Bahamian | 70 | 0.0% |
| Bangladeshi | 24 | 0.0% |
| Belgian | 127 | 0.0% |
| Belizean | 94 | 0.0% |
| Bhutanese | 1,010 | 0.1% |
| Blackfeet | 134 | 0.0% |
| Brazilian | 1,109 | 0.2% |
| British | 3,975 | 0.5% |
| British West Indian | 70 | 0.0% |
| Bulgarian | 25 | 0.0% |
| Burmese | 627 | 0.1% |
| Cajun | 253 | 0.0% |
| Canadian | 401 | 0.1% |
| Cape Verdean | 13 | 0.0% |
| Carpatho Rusyn | 12 | 0.0% |
| Celtic | 83 | 0.0% |
| Central American | 3,815 | 0.5% |
| Central American Indian | 489 | 0.1% |
| Cherokee | 3,404 | 0.4% |
| Cheyenne | 22 | 0.0% |
| Chickasaw | 51 | 0.0% |
| Chilean | 235 | 0.0% |
| Chinese | 3 | 0.0% |
| Chippewa | 61 | 0.0% |
| Choctaw | 2,894 | 0.4% |
| Colombian | 191 | 0.0% |
| Comanche | 8 | 0.0% |
| Costa Rican | 22 | 0.0% |
| Cree | 10 | 0.0% |
| Creek | 2,411 | 0.3% |
| Croatian | 171 | 0.0% |
| Cuban | 1,174 | 0.2% |
| Czech | 1,660 | 0.2% |
| Czechoslovakian | 509 | 0.1% |
| Danish | 987 | 0.1% |
| Dominican | 604 | 0.1% |
| Dutch | 3,223 | 0.4% |
| Dutch West Indian | 29 | 0.0% |
| Eastern European | 960 | 0.1% |
| Ecuadorian | 148 | 0.0% |
| Egyptian | 101 | 0.0% |
| English | 69,113 | 9.2% |
| Estonian | 4 | 0.0% |
| Ethiopian | 40 | 0.0% |
| European | 10,701 | 1.4% |
| Filipino | 36 | 0.0% |
| Finnish | 465 | 0.1% |
| French | 18,090 | 2.4% |
| French American Indian | 46 | 0.0% |
| French Canadian | 1,957 | 0.3% |
| German | 52,857 | 7.0% |
| German Russian | 67 | 0.0% |
| Ghanaian | 10 | 0.0% |
| Greek | 2,370 | 0.3% |
| Guamanian / Chamorro | 57 | 0.0% |
| Guatemalan | 1,549 | 0.2% |
| Guyanese | 6 | 0.0% |
| Haitian | 172 | 0.0% |
| Honduran | 904 | 0.1% |
| Houma | 18 | 0.0% |
| Hungarian | 929 | 0.1% |
| Icelander | 21 | 0.0% |
| Indian (Asian) | 2,128 | 0.3% |
| Iranian | 92 | 0.0% |
| Iraqi | 83 | 0.0% |
| Irish | 62,771 | 8.4% |
| Iroquois | 35 | 0.0% |
| Israeli | 9 | 0.0% |
| Italian | 13,756 | 1.8% |
| Jamaican | 903 | 0.1% |
| Japanese | 740 | 0.1% |
| Jordanian | 8 | 0.0% |
| Kenyan | 22 | 0.0% |
| Korean | 2,387 | 0.3% |
| Laotian | 270 | 0.0% |
| Latvian | 8 | 0.0% |
| Lebanese | 951 | 0.1% |
| Lithuanian | 313 | 0.0% |
| Lumbee | 69 | 0.0% |
| Macedonian | 36 | 0.0% |
| Malaysian | 674 | 0.1% |
| Maltese | 34 | 0.0% |
| Mexican | 12,105 | 1.6% |
| Mexican American Indian | 205 | 0.0% |
| Mongolian | 151 | 0.0% |
| Moroccan | 255 | 0.0% |
| Native Hawaiian | 640 | 0.1% |
| Navajo | 356 | 0.1% |
| New Zealander | 19 | 0.0% |
| Nicaraguan | 298 | 0.0% |
| Nigerian | 223 | 0.0% |
| Northern European | 787 | 0.1% |
| Norwegian | 3,277 | 0.4% |
| Ottawa | 29 | 0.0% |
| Pakistani | 710 | 0.1% |
| Palestinian | 544 | 0.1% |
| Panamanian | 537 | 0.1% |
| Paraguayan | 47 | 0.0% |
| Pennsylvania German | 16 | 0.0% |
| Peruvian | 242 | 0.0% |
| Polish | 4,349 | 0.6% |
| Portuguese | 408 | 0.1% |
| Potawatomi | 17 | 0.0% |
| Puerto Rican | 3,320 | 0.4% |
| Romanian | 261 | 0.0% |
| Russian | 1,085 | 0.1% |
| Salvadoran | 452 | 0.1% |
| Samoan | 53 | 0.0% |
| Scandinavian | 1,474 | 0.2% |
| Scotch-Irish | 9,984 | 1.3% |
| Scottish | 13,297 | 1.8% |
| Seminole | 8 | 0.0% |
| Senegalese | 199 | 0.0% |
| Serbian | 61 | 0.0% |
| Sioux | 124 | 0.0% |
| Slavic | 40 | 0.0% |
| Slovak | 262 | 0.0% |
| Slovene | 13 | 0.0% |
| South African | 312 | 0.0% |
| South American | 1,159 | 0.2% |
| South American Indian | 14 | 0.0% |
| Spaniard | 1,030 | 0.1% |
| Spanish | 473 | 0.1% |
| Spanish American Indian | 28 | 0.0% |
| Sri Lankan | 4,714 | 0.6% |
| Subsaharan African | 5,071 | 0.7% |
| Swedish | 2,923 | 0.4% |
| Swiss | 517 | 0.1% |
| Syrian | 258 | 0.0% |
| Thai | 1,249 | 0.2% |
| Tongan | 117 | 0.0% |
| Trinidadian and Tobagonian | 86 | 0.0% |
| Turkish | 118 | 0.0% |
| Ukrainian | 582 | 0.1% |
| Venezuelan | 54 | 0.0% |
| Vietnamese | 52 | 0.0% |
| Welsh | 3,338 | 0.4% |
| West Indian | 221 | 0.0% |
| Yugoslavian | 284 | 0.0% |
| Zimbabwean | 7 | 0.0% | View All 150 Rows |
Immigrants in Area Code 251
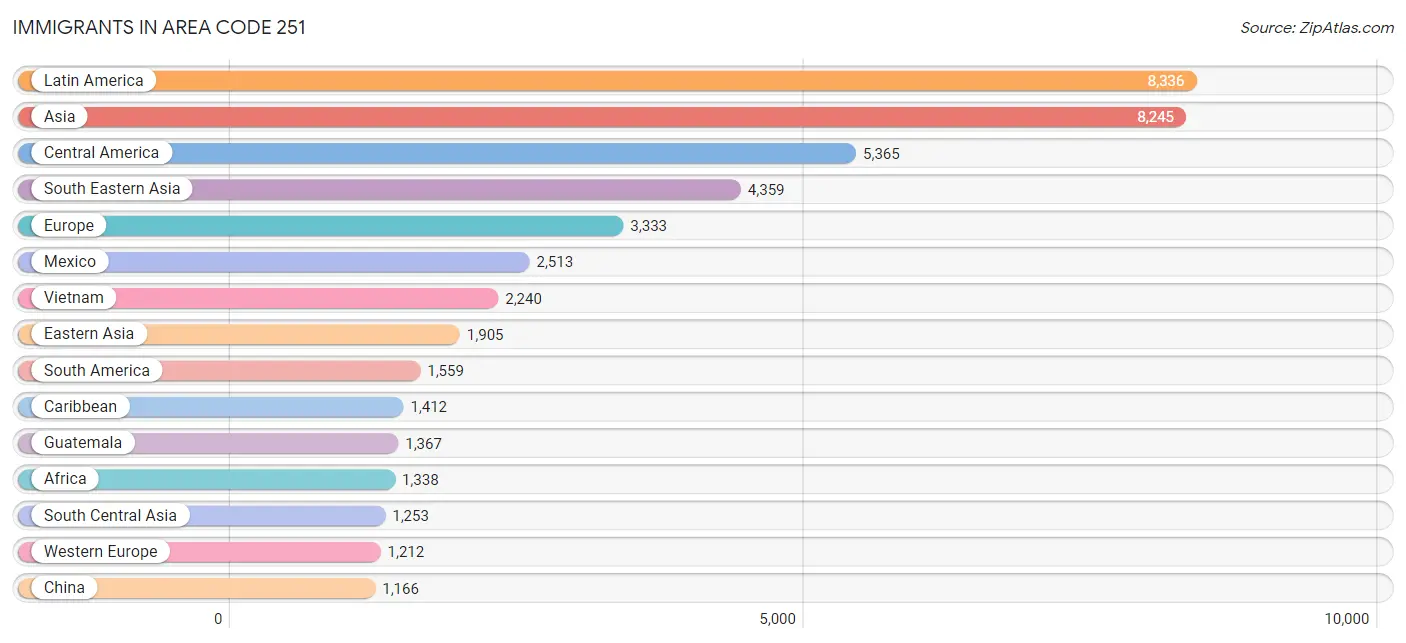
The most numerous immigrant groups reported in Area Code 251 came from Latin America (8,336 | 1.1%), Asia (8,245 | 1.1%), Central America (5,365 | 0.7%), South Eastern Asia (4,359 | 0.6%), and Europe (3,333 | 0.4%), together accounting for 3.9% of all Area Code 251 residents.
| Immigration Origin | # Population | % Population |
| Africa | 1,338 | 0.2% |
| Argentina | 51 | 0.0% |
| Asia | 8,245 | 1.1% |
| Australia | 105 | 0.0% |
| Austria | 41 | 0.0% |
| Bangladesh | 102 | 0.0% |
| Belize | 26 | 0.0% |
| Bolivia | 66 | 0.0% |
| Bosnia and Herzegovina | 174 | 0.0% |
| Brazil | 603 | 0.1% |
| Bulgaria | 8 | 0.0% |
| Cambodia | 268 | 0.0% |
| Canada | 615 | 0.1% |
| Caribbean | 1,412 | 0.2% |
| Central America | 5,365 | 0.7% |
| Chile | 235 | 0.0% |
| China | 1,166 | 0.2% |
| Colombia | 216 | 0.0% |
| Congo | 160 | 0.0% |
| Croatia | 16 | 0.0% |
| Cuba | 235 | 0.0% |
| Czechoslovakia | 99 | 0.0% |
| Denmark | 11 | 0.0% |
| Dominican Republic | 346 | 0.1% |
| Eastern Africa | 420 | 0.1% |
| Eastern Asia | 1,905 | 0.3% |
| Eastern Europe | 1,100 | 0.2% |
| Ecuador | 76 | 0.0% |
| Egypt | 91 | 0.0% |
| El Salvador | 551 | 0.1% |
| England | 355 | 0.1% |
| Ethiopia | 73 | 0.0% |
| Europe | 3,333 | 0.4% |
| Fiji | 14 | 0.0% |
| France | 306 | 0.0% |
| Germany | 805 | 0.1% |
| Greece | 30 | 0.0% |
| Grenada | 58 | 0.0% |
| Guatemala | 1,367 | 0.2% |
| Haiti | 36 | 0.0% |
| Honduras | 552 | 0.1% |
| Hong Kong | 15 | 0.0% |
| Hungary | 28 | 0.0% |
| India | 717 | 0.1% |
| Indonesia | 81 | 0.0% |
| Iran | 76 | 0.0% |
| Iraq | 116 | 0.0% |
| Ireland | 35 | 0.0% |
| Israel | 7 | 0.0% |
| Italy | 144 | 0.0% |
| Jamaica | 616 | 0.1% |
| Japan | 344 | 0.1% |
| Jordan | 47 | 0.0% |
| Kazakhstan | 22 | 0.0% |
| Kenya | 89 | 0.0% |
| Korea | 395 | 0.1% |
| Kuwait | 6 | 0.0% |
| Laos | 182 | 0.0% |
| Latin America | 8,336 | 1.1% |
| Lebanon | 39 | 0.0% |
| Malaysia | 136 | 0.0% |
| Mexico | 2,513 | 0.3% |
| Micronesia | 41 | 0.0% |
| Middle Africa | 393 | 0.1% |
| Moldova | 152 | 0.0% |
| Nepal | 35 | 0.0% |
| Netherlands | 60 | 0.0% |
| Nicaragua | 188 | 0.0% |
| Nigeria | 97 | 0.0% |
| Northern Africa | 165 | 0.0% |
| Northern Europe | 733 | 0.1% |
| Norway | 29 | 0.0% |
| Oceania | 168 | 0.0% |
| Pakistan | 295 | 0.0% |
| Panama | 168 | 0.0% |
| Peru | 144 | 0.0% |
| Philippines | 1,147 | 0.2% |
| Poland | 116 | 0.0% |
| Portugal | 31 | 0.0% |
| Romania | 75 | 0.0% |
| Russia | 70 | 0.0% |
| Saudi Arabia | 6 | 0.0% |
| Scotland | 70 | 0.0% |
| Senegal | 104 | 0.0% |
| Serbia | 16 | 0.0% |
| Singapore | 72 | 0.0% |
| South Africa | 59 | 0.0% |
| South America | 1,559 | 0.2% |
| South Central Asia | 1,253 | 0.2% |
| South Eastern Asia | 4,359 | 0.6% |
| Southern Europe | 288 | 0.0% |
| Spain | 83 | 0.0% |
| Sri Lanka | 6 | 0.0% |
| Syria | 49 | 0.0% |
| Taiwan | 204 | 0.0% |
| Thailand | 233 | 0.0% |
| Trinidad and Tobago | 32 | 0.0% |
| Turkey | 77 | 0.0% |
| Ukraine | 251 | 0.0% |
| Uruguay | 65 | 0.0% |
| Venezuela | 58 | 0.0% |
| Vietnam | 2,240 | 0.3% |
| West Indies | 50 | 0.0% |
| Western Africa | 210 | 0.0% |
| Western Asia | 386 | 0.1% |
| Western Europe | 1,212 | 0.2% |
| Zaire | 180 | 0.0% |
| Zimbabwe | 51 | 0.0% | View All 108 Rows |
Sex and Age in Area Code 251
Sex and Age in Area Code 251
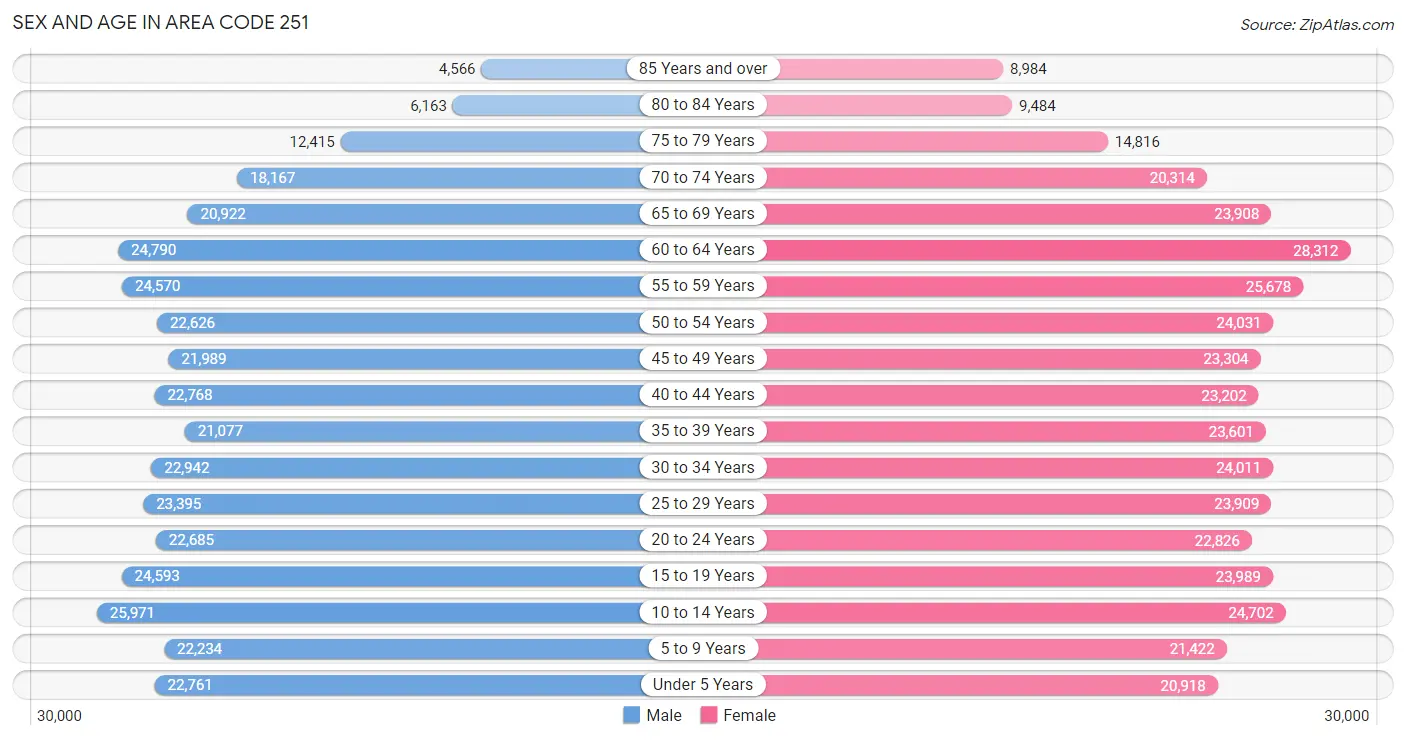
The most populous age groups in Area Code 251 are 10 to 14 Years (25,971 | 7.1%) for men and 60 to 64 Years (28,312 | 7.3%) for women.
| Age Bracket | Male | Female |
| Under 5 Years | 22,761 (6.2%) | 20,918 (5.4%) |
| 5 to 9 Years | 22,234 (6.1%) | 21,422 (5.5%) |
| 10 to 14 Years | 25,971 (7.1%) | 24,702 (6.4%) |
| 15 to 19 Years | 24,593 (6.7%) | 23,989 (6.2%) |
| 20 to 24 Years | 22,685 (6.2%) | 22,826 (5.9%) |
| 25 to 29 Years | 23,395 (6.4%) | 23,909 (6.2%) |
| 30 to 34 Years | 22,942 (6.3%) | 24,011 (6.2%) |
| 35 to 39 Years | 21,077 (5.8%) | 23,601 (6.1%) |
| 40 to 44 Years | 22,768 (6.2%) | 23,202 (6.0%) |
| 45 to 49 Years | 21,989 (6.0%) | 23,304 (6.0%) |
| 50 to 54 Years | 22,626 (6.2%) | 24,031 (6.2%) |
| 55 to 59 Years | 24,570 (6.7%) | 25,678 (6.6%) |
| 60 to 64 Years | 24,790 (6.8%) | 28,312 (7.3%) |
| 65 to 69 Years | 20,922 (5.7%) | 23,908 (6.2%) |
| 70 to 74 Years | 18,167 (5.0%) | 20,314 (5.2%) |
| 75 to 79 Years | 12,415 (3.4%) | 14,816 (3.8%) |
| 80 to 84 Years | 6,163 (1.7%) | 9,484 (2.5%) |
| 85 Years and over | 4,566 (1.3%) | 8,984 (2.3%) |
| Total | 364,634 (100.0%) | 387,411 (100.0%) |
Families and Households in Area Code 251
Median Family Size in Area Code 251
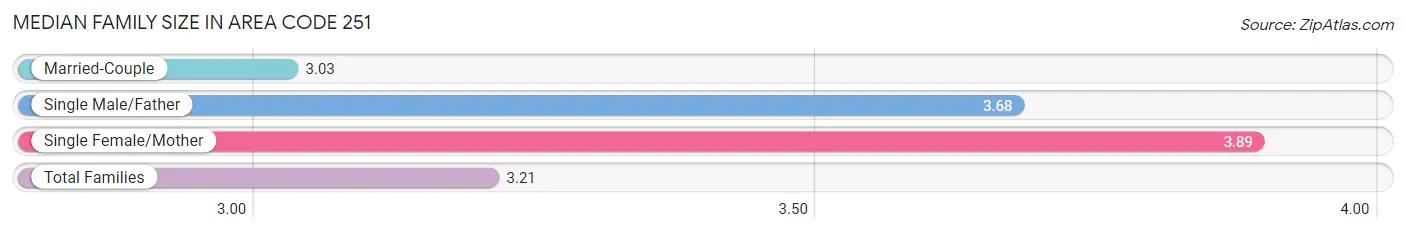
The median family size in Area Code 251 is 3.21 persons per family, with single female/mother families (38,071 | 20.4%) accounting for the largest median family size of 3.89107 persons per family. On the other hand, married-couple families (136,648 | 73.3%) represent the smallest median family size with 3.03 persons per family.
| Family Type | # Families | Family Size |
| Married-Couple | 136,648 (73.3%) | 3.03 |
| Single Male/Father | 11,693 (6.3%) | 3.68 |
| Single Female/Mother | 38,071 (20.4%) | 3.89 |
| Total Families | 186,412 (100.0%) | 3.21 |
Median Household Size in Area Code 251
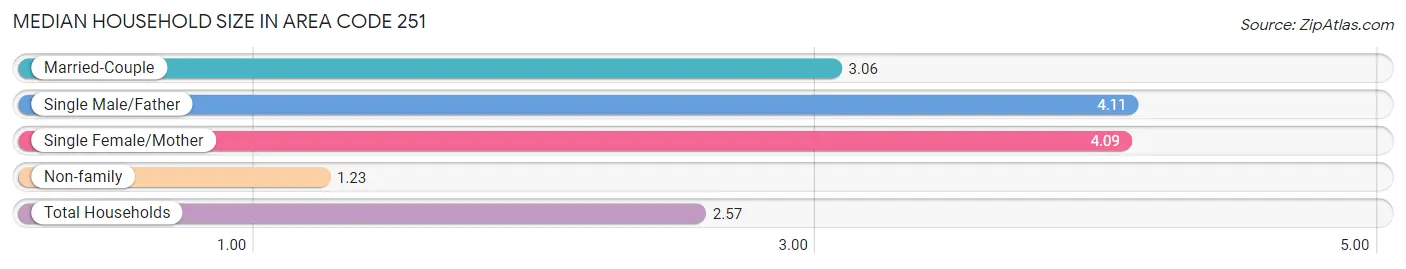
The median household size in Area Code 251 is 2.57 persons per household, with single male/father households (11,693 | 4.1%) accounting for the largest median household size of 4.11324 persons per household. non-family households (102,102 | 35.4%) represent the smallest median household size with 1.23 persons per household.
| Household Type | # Households | Household Size |
| Married-Couple | 136,648 (47.4%) | 3.06 |
| Single Male/Father | 11,693 (4.1%) | 4.11 |
| Single Female/Mother | 38,071 (13.2%) | 4.09 |
| Non-family | 102,102 (35.4%) | 1.23 |
| Total Households | 288,514 (100.0%) | 2.57 |
Household Size by Marriage Status in Area Code 251
Out of a total of 288,514 households in Area Code 251, 186,412 (64.6%) are family households, while 102,102 (35.4%) are nonfamily households. The most numerous type of family households are 2-person households, comprising 90,343, and the most common type of nonfamily households are 1-person households, comprising 90,383.
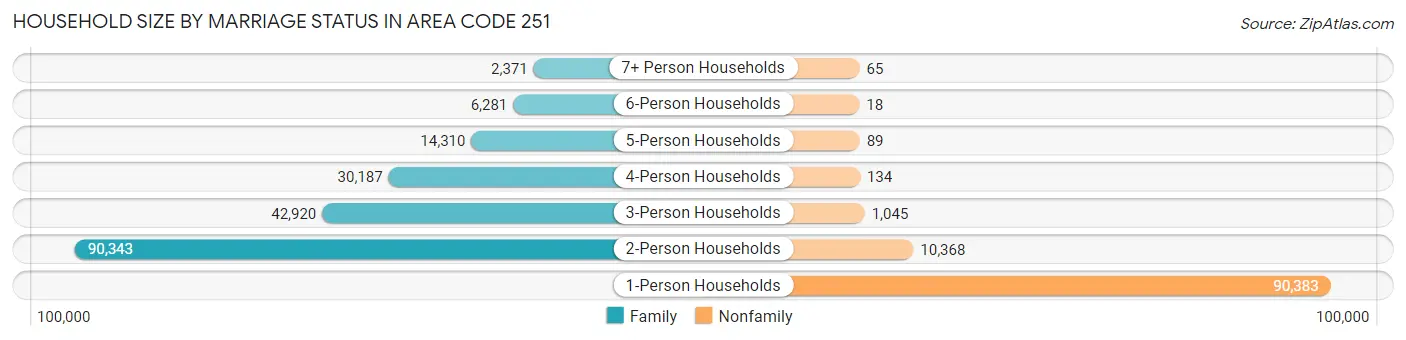
| Household Size | Family Households | Nonfamily Households |
| 1-Person Households | - | 90,383 (31.3%) |
| 2-Person Households | 90,343 (31.3%) | 10,368 (3.6%) |
| 3-Person Households | 42,920 (14.9%) | 1,045 (0.4%) |
| 4-Person Households | 30,187 (10.5%) | 134 (0.1%) |
| 5-Person Households | 14,310 (5.0%) | 89 (0.0%) |
| 6-Person Households | 6,281 (2.2%) | 18 (0.0%) |
| 7+ Person Households | 2,371 (0.8%) | 65 (0.0%) |
| Total | 186,412 (64.6%) | 102,102 (35.4%) |
Female Fertility in Area Code 251
Fertility by Age in Area Code 251
Average fertility rate in Area Code 251 is 79.8 births per 1,000 women. Women in the age bracket of 20 to 34 years have the highest fertility rate with 129.0 births per 1,000 women. Women in the age bracket of 20 to 34 years acount for 81.1% of all women with births.
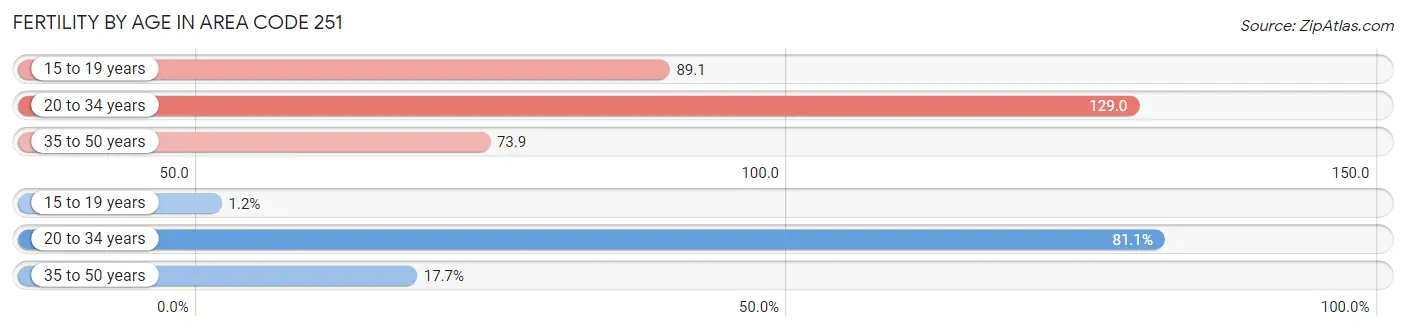
| Age Bracket | Women with Births | Births / 1,000 Women |
| 15 to 19 years | 100 (1.1%) | 89.1 |
| 20 to 34 years | 7,041 (81.1%) | 129.0 |
| 35 to 50 years | 1,537 (17.7%) | 73.9 |
| Total | 8,678 (100.0%) | 79.8 |
Fertility by Age by Marriage Status in Area Code 251
45.5% of women with births (8,678) in Area Code 251 are married. The highest percentage of unmarried women with births falls into 15 to 19 years age bracket with 97.0% of them unmarried at the time of birth, while the lowest percentage of unmarried women with births belong to 20 to 34 years age bracket with 57.2% of them unmarried.
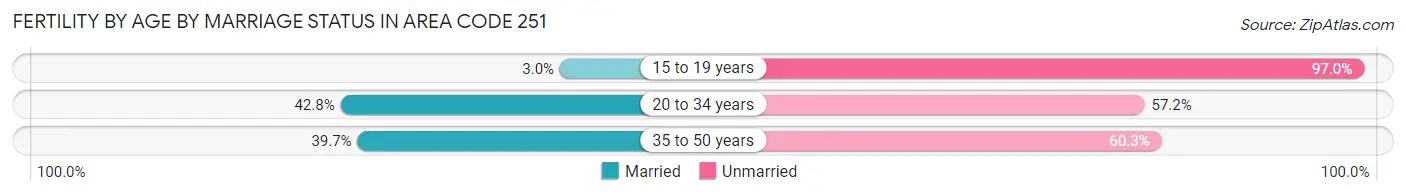
| Age Bracket | Married | Unmarried |
| 15 to 19 years | 3 (3.0%) | 97 (97.0%) |
| 20 to 34 years | 3,011 (42.8%) | 4,030 (57.2%) |
| 35 to 50 years | 610 (39.7%) | 927 (60.3%) |
| Total | 3,951 (45.5%) | 4,727 (54.5%) |
Fertility by Education in Area Code 251
Average fertility rate in Area Code 251 is 79.8 births per 1,000 women. Women with the education attainment of less than high school have the highest fertility rate of 125.0 births per 1,000 women, while women with the education attainment of college or associate's degree have the lowest fertility at 73.5 births per 1,000 women. Women with the education attainment of college or associate's degree represent 34.8% of all women with births.
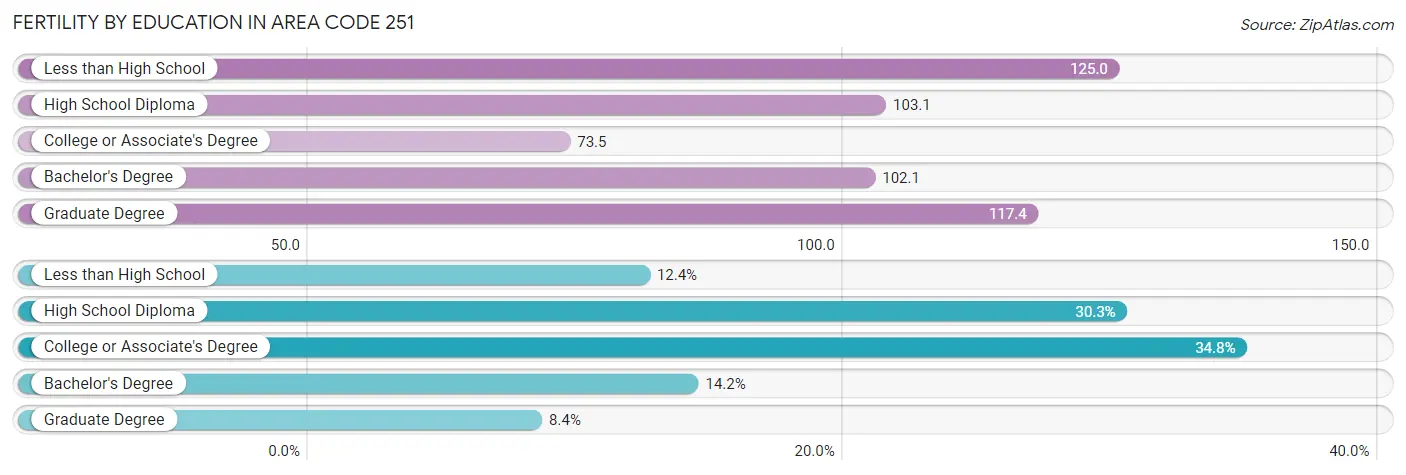
| Educational Attainment | Women with Births | Births / 1,000 Women |
| Less than High School | 1,075 (12.4%) | 125.0 |
| High School Diploma | 2,628 (30.3%) | 103.1 |
| College or Associate's Degree | 3,017 (34.8%) | 73.5 |
| Bachelor's Degree | 1,233 (14.2%) | 102.1 |
| Graduate Degree | 725 (8.4%) | 117.4 |
| Total | 8,678 (100.0%) | 79.8 |
Fertility by Education by Marriage Status in Area Code 251
54.5% of women with births in Area Code 251 are unmarried. Women with the educational attainment of bachelor's degree are most likely to be married with 44.3% of them married at childbirth, while women with the educational attainment of graduate degree are least likely to be married with 100.0% of them unmarried at childbirth.
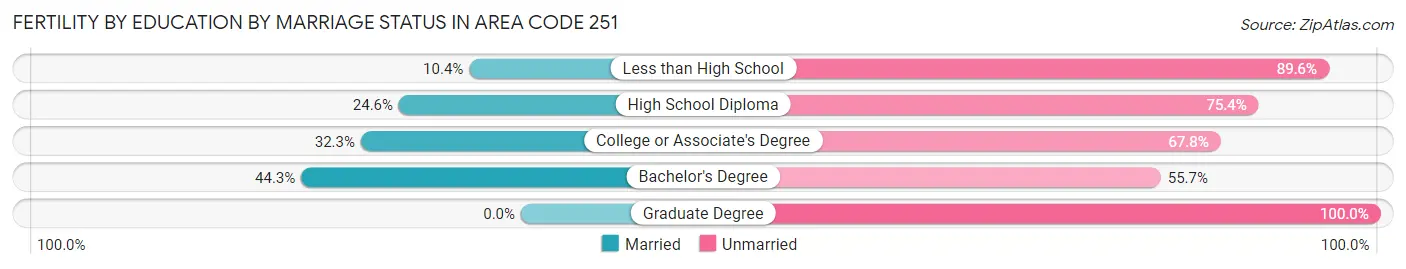
| Educational Attainment | Married | Unmarried |
| Less than High School | 112 (10.4%) | 963 (89.6%) |
| High School Diploma | 646 (24.6%) | 1,982 (75.4%) |
| College or Associate's Degree | 973 (32.3%) | 2,044 (67.7%) |
| Bachelor's Degree | 546 (44.3%) | 687 (55.7%) |
| Graduate Degree | 0 (0.0%) | 725 (100.0%) |
| Total | 3,951 (45.5%) | 4,727 (54.5%) |
Employment Characteristics in Area Code 251
Employment by Class of Employer in Area Code 251
Among the 315,480 employed individuals in Area Code 251, private company employees (216,631 | 68.7%), local government employees (23,142 | 7.3%), and not-for-profit organizations (19,716 | 6.2%) make up the most common classes of employment.
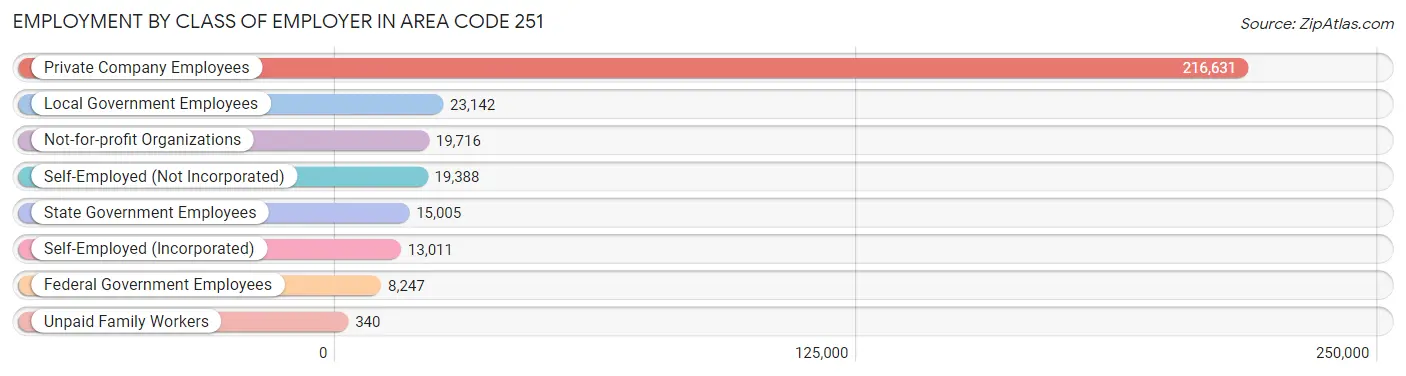
| Employer Class | # Employees | % Employees |
| Private Company Employees | 216,631 | 68.7% |
| Self-Employed (Incorporated) | 13,011 | 4.1% |
| Self-Employed (Not Incorporated) | 19,388 | 6.1% |
| Not-for-profit Organizations | 19,716 | 6.2% |
| Local Government Employees | 23,142 | 7.3% |
| State Government Employees | 15,005 | 4.8% |
| Federal Government Employees | 8,247 | 2.6% |
| Unpaid Family Workers | 340 | 0.1% |
| Total | 315,480 | 100.0% |
Employment Status by Age in Area Code 251
According to the labor force statistics for Area Code 251, out of the total population over 16 years of age (603,775), 51.0% or 308,227 individuals are in the labor force, with 7.1% or 21,792 of them unemployed. The age group with the highest labor force participation rate is 25 to 29 years, with 79.2% or 37,455 individuals in the labor force. Within the labor force, the 16 to 19 years age range has the highest percentage of unemployed individuals, with 1,381.8% or 194,171 of them being unemployed.
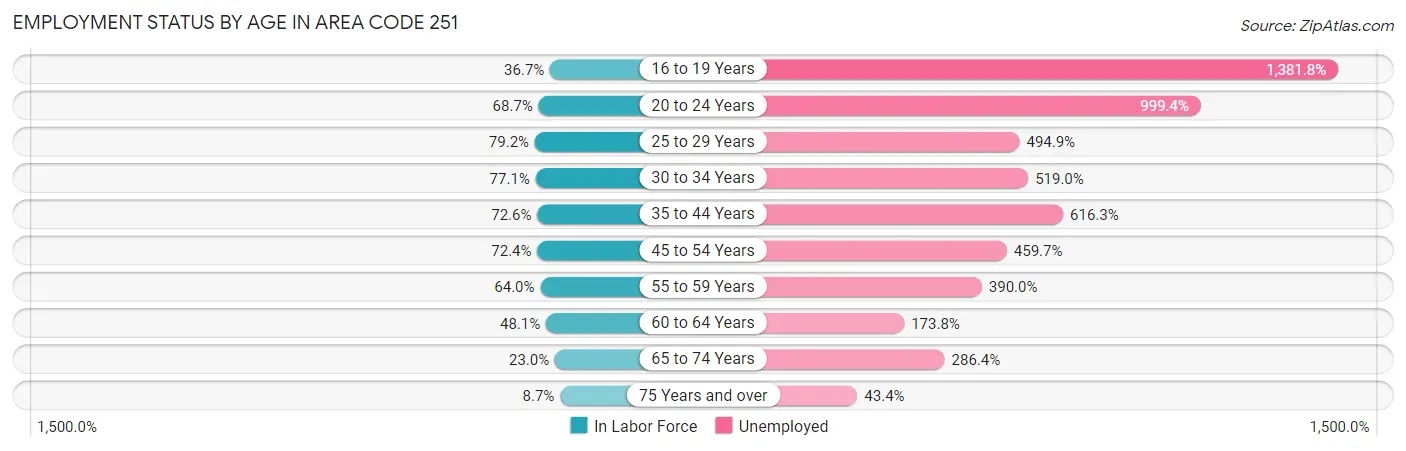
| Age Bracket | In Labor Force | Unemployed |
| 16 to 19 Years | 14,050 (36.7%) | 194,171 (1,381.8%) |
| 20 to 24 Years | 31,267 (68.7%) | 312,472 (999.4%) |
| 25 to 29 Years | 37,455 (79.2%) | 185,365 (494.9%) |
| 30 to 34 Years | 36,196 (77.1%) | 187,857 (519.0%) |
| 35 to 44 Years | 65,833 (72.6%) | 405,704 (616.3%) |
| 45 to 54 Years | 66,536 (72.4%) | 305,861 (459.7%) |
| 55 to 59 Years | 32,170 (64.0%) | 125,459 (390.0%) |
| 60 to 64 Years | 25,561 (48.1%) | 44,428 (173.8%) |
| 65 to 74 Years | 19,196 (23.0%) | 54,974 (286.4%) |
| 75 Years and over | 4,929 (8.7%) | 2,140 (43.4%) |
| Total | 308,250 (51.0%) | 21,784 (7.1%) |
Employment Status by Educational Attainment in Area Code 251
According to labor force statistics for Area Code 251, 67.4% of individuals (256,448) out of the total population between 25 and 64 years of age (380,205) are in the labor force, with 481.6% or 1,235,054 of them being unemployed. The group with the highest labor force participation rate are those with the educational attainment of bachelor's degree or higher, with 81.4% or 79,431 individuals in the labor force. Within the labor force, individuals with less than high school education have the highest percentage of unemployment, with 1,118.0% or 240,549 of them being unemployed.
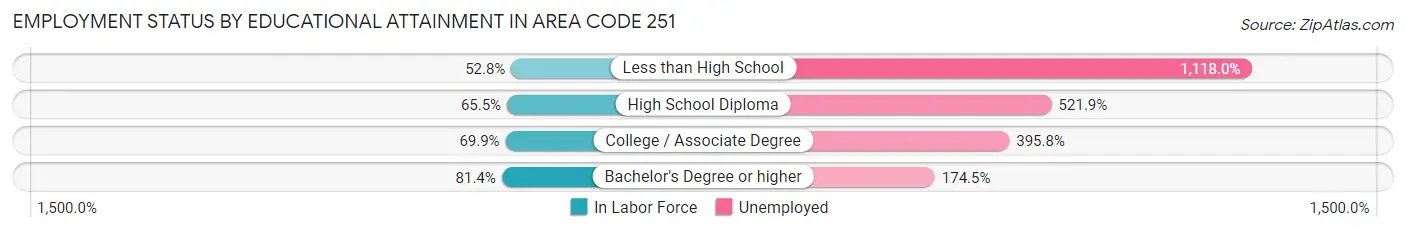
| Educational Attainment | In Labor Force | Unemployed |
| Less than High School | 21,517 (52.8%) | 455,507 (1,118.0%) |
| High School Diploma | 81,752 (65.5%) | 651,420 (521.9%) |
| College / Associate Degree | 81,889 (69.9%) | 463,434 (395.8%) |
| Bachelor's Degree or higher | 79,427 (81.4%) | 170,237 (174.5%) |
| Total | 256,442 (67.4%) | 1,831,067 (481.6%) |
Employment Occupations by Sex in Area Code 251
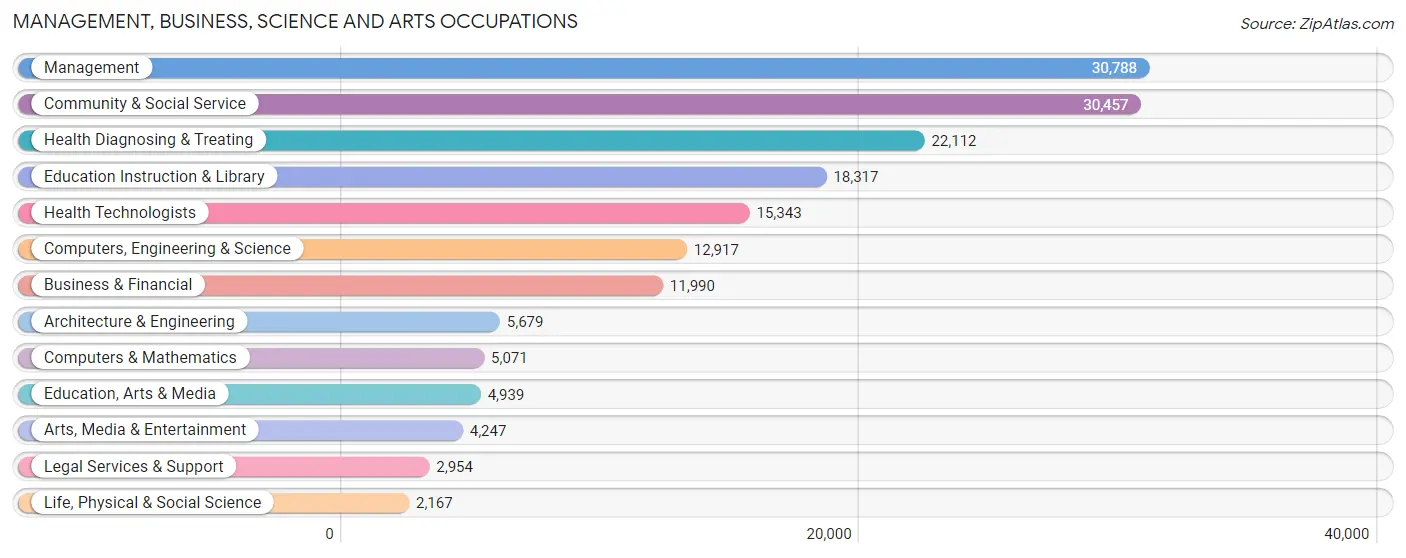
Management, Business, Science and Arts Occupations
The most common Management, Business, Science and Arts occupations in Area Code 251 are Management (30,788 | 9.6%), Community & Social Service (30,457 | 9.5%), Health Diagnosing & Treating (22,112 | 6.9%), Education Instruction & Library (18,317 | 5.7%), and Health Technologists (15,343 | 4.8%).
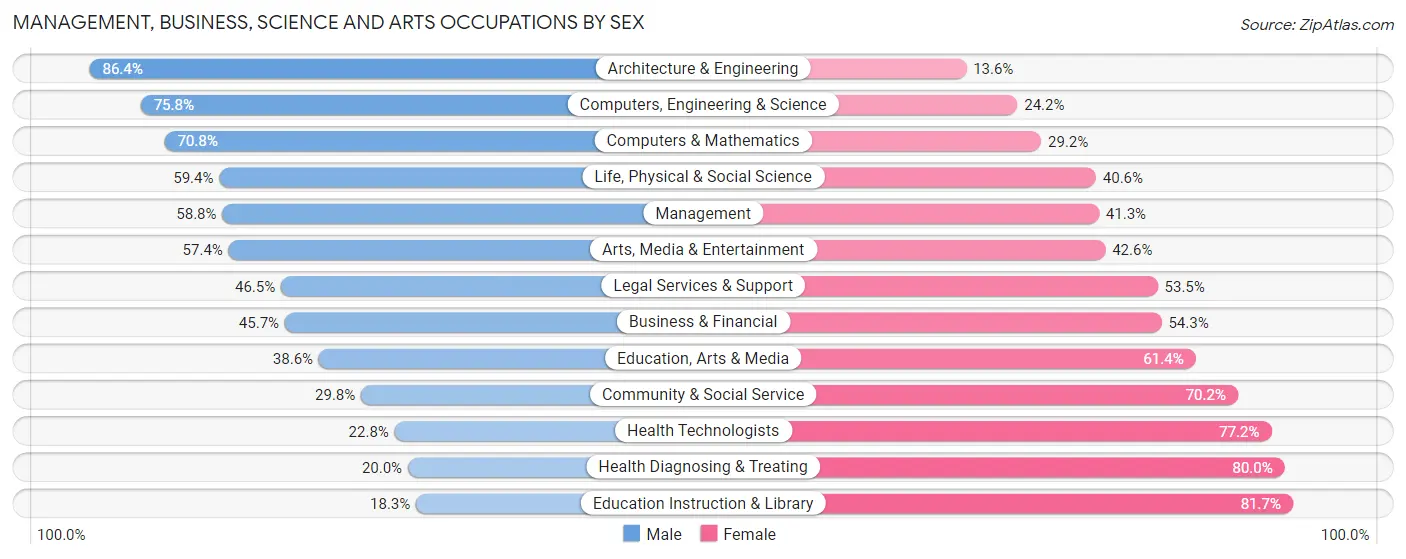
Management, Business, Science and Arts Occupations by Sex
Within the Management, Business, Science and Arts occupations in Area Code 251, the most male-oriented occupations are Architecture & Engineering (86.4%), Computers, Engineering & Science (75.8%), and Computers & Mathematics (70.8%), while the most female-oriented occupations are Education Instruction & Library (81.7%), Health Diagnosing & Treating (80.0%), and Health Technologists (77.2%).
| Occupation | Male | Female |
| Management | 18,087 (58.8%) | 12,701 (41.2%) |
| Business & Financial | 5,480 (45.7%) | 6,510 (54.3%) |
| Computers, Engineering & Science | 9,787 (75.8%) | 3,130 (24.2%) |
| Computers & Mathematics | 3,591 (70.8%) | 1,480 (29.2%) |
| Architecture & Engineering | 4,909 (86.4%) | 770 (13.6%) |
| Life, Physical & Social Science | 1,287 (59.4%) | 880 (40.6%) |
| Community & Social Service | 9,077 (29.8%) | 21,380 (70.2%) |
| Education, Arts & Media | 1,907 (38.6%) | 3,032 (61.4%) |
| Legal Services & Support | 1,374 (46.5%) | 1,580 (53.5%) |
| Education Instruction & Library | 3,357 (18.3%) | 14,960 (81.7%) |
| Arts, Media & Entertainment | 2,439 (57.4%) | 1,808 (42.6%) |
| Health Diagnosing & Treating | 4,430 (20.0%) | 17,682 (80.0%) |
| Health Technologists | 3,498 (22.8%) | 11,845 (77.2%) |
| Total (Category) | 46,861 (43.3%) | 61,403 (56.7%) |
| Total (Overall) | 165,794 (51.8%) | 154,000 (48.2%) |
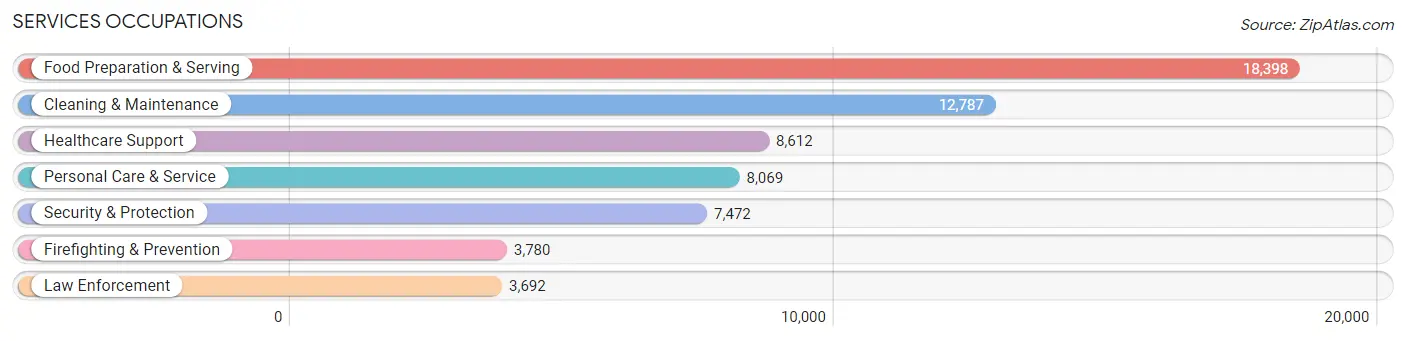
Services Occupations
The most common Services occupations in Area Code 251 are Food Preparation & Serving (18,398 | 5.8%), Cleaning & Maintenance (12,787 | 4.0%), Healthcare Support (8,612 | 2.7%), Personal Care & Service (8,069 | 2.5%), and Security & Protection (7,472 | 2.3%).
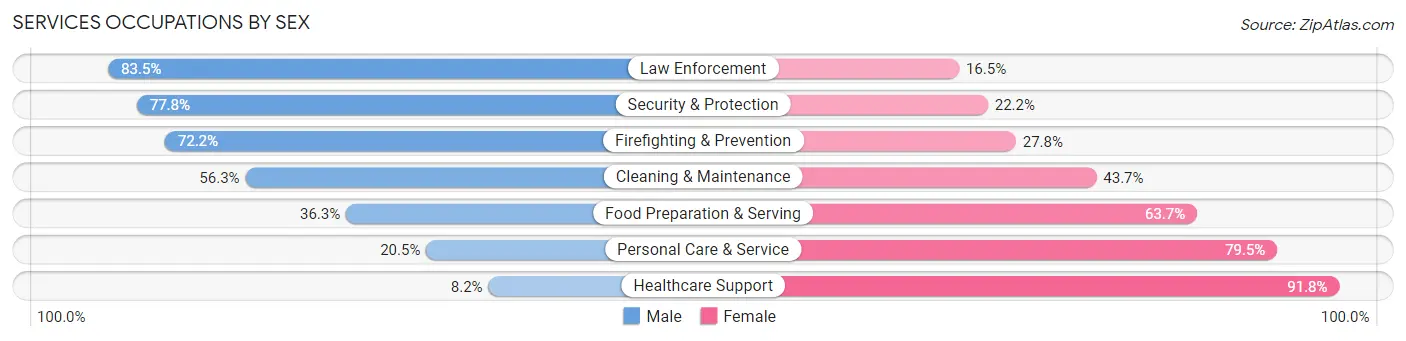
Services Occupations by Sex
Within the Services occupations in Area Code 251, the most male-oriented occupations are Law Enforcement (83.5%), Security & Protection (77.8%), and Firefighting & Prevention (72.2%), while the most female-oriented occupations are Healthcare Support (91.8%), Personal Care & Service (79.5%), and Food Preparation & Serving (63.7%).
| Occupation | Male | Female |
| Healthcare Support | 703 (8.2%) | 7,909 (91.8%) |
| Security & Protection | 5,812 (77.8%) | 1,660 (22.2%) |
| Firefighting & Prevention | 2,730 (72.2%) | 1,050 (27.8%) |
| Law Enforcement | 3,082 (83.5%) | 610 (16.5%) |
| Food Preparation & Serving | 6,685 (36.3%) | 11,713 (63.7%) |
| Cleaning & Maintenance | 7,196 (56.3%) | 5,591 (43.7%) |
| Personal Care & Service | 1,652 (20.5%) | 6,417 (79.5%) |
| Total (Category) | 22,048 (39.8%) | 33,290 (60.2%) |
| Total (Overall) | 165,794 (51.8%) | 154,000 (48.2%) |
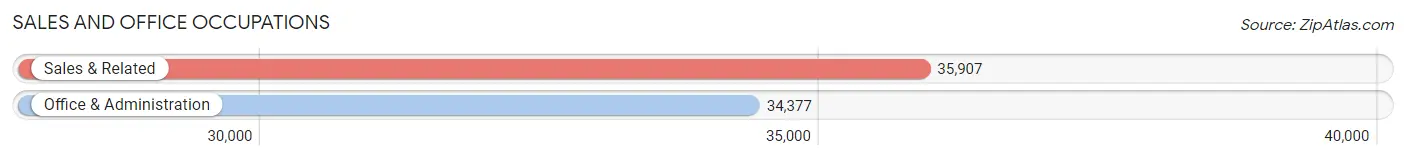
Sales and Office Occupations
The most common Sales and Office occupations in Area Code 251 are Sales & Related (35,907 | 11.2%), and Office & Administration (34,377 | 10.7%).
Sales and Office Occupations by Sex
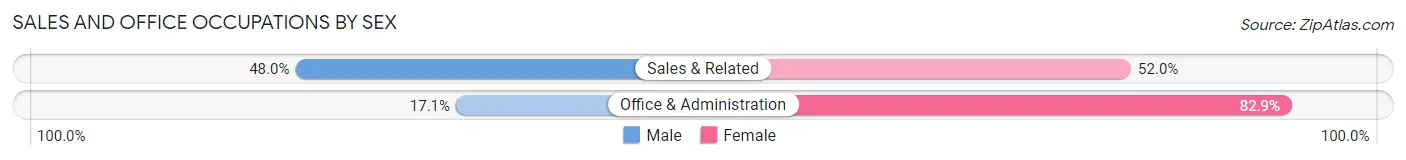
| Occupation | Male | Female |
| Sales & Related | 17,221 (48.0%) | 18,686 (52.0%) |
| Office & Administration | 5,864 (17.1%) | 28,513 (82.9%) |
| Total (Category) | 23,085 (32.9%) | 47,199 (67.1%) |
| Total (Overall) | 165,794 (51.8%) | 154,000 (48.2%) |
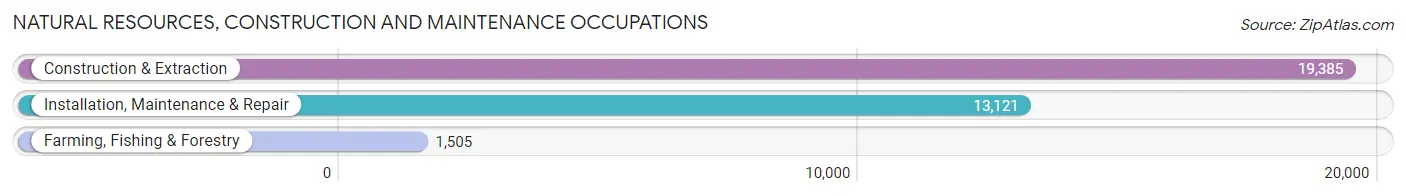
Natural Resources, Construction and Maintenance Occupations
The most common Natural Resources, Construction and Maintenance occupations in Area Code 251 are Construction & Extraction (19,385 | 6.1%), Installation, Maintenance & Repair (13,121 | 4.1%), and Farming, Fishing & Forestry (1,505 | 0.5%).
Natural Resources, Construction and Maintenance Occupations by Sex
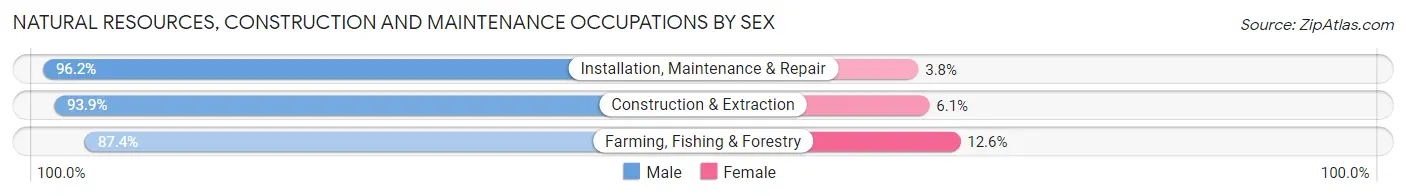
| Occupation | Male | Female |
| Farming, Fishing & Forestry | 1,316 (87.4%) | 189 (12.6%) |
| Construction & Extraction | 18,196 (93.9%) | 1,189 (6.1%) |
| Installation, Maintenance & Repair | 12,620 (96.2%) | 501 (3.8%) |
| Total (Category) | 32,132 (94.5%) | 1,879 (5.5%) |
| Total (Overall) | 165,794 (51.8%) | 154,000 (48.2%) |
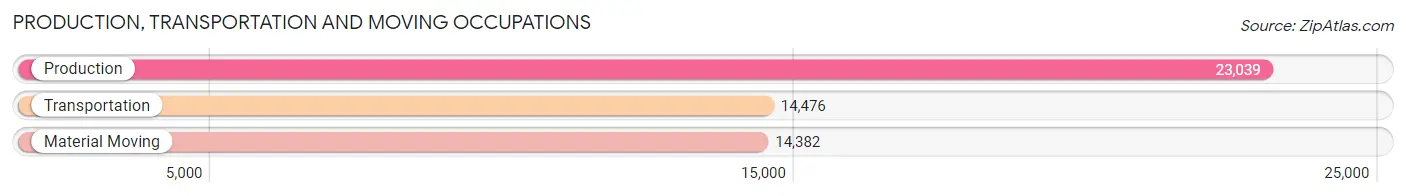
Production, Transportation and Moving Occupations
The most common Production, Transportation and Moving occupations in Area Code 251 are Production (23,039 | 7.2%), Transportation (14,476 | 4.5%), and Material Moving (14,382 | 4.5%).
Production, Transportation and Moving Occupations by Sex
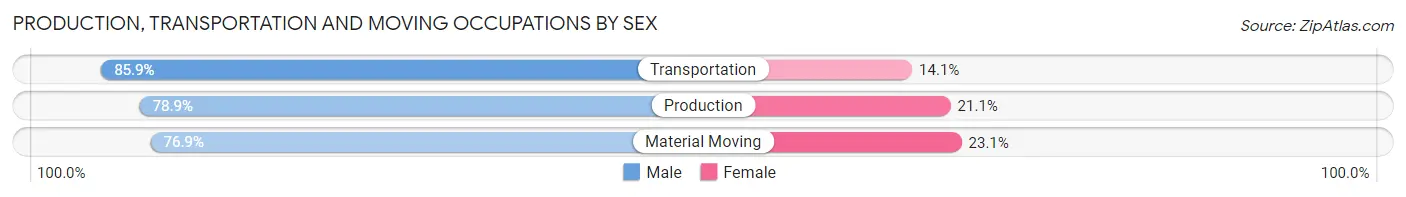
| Occupation | Male | Female |
| Production | 18,173 (78.9%) | 4,866 (21.1%) |
| Transportation | 12,440 (85.9%) | 2,036 (14.1%) |
| Material Moving | 11,055 (76.9%) | 3,327 (23.1%) |
| Total (Category) | 41,668 (80.3%) | 10,229 (19.7%) |
| Total (Overall) | 165,794 (51.8%) | 154,000 (48.2%) |
Employment Industries by Sex in Area Code 251
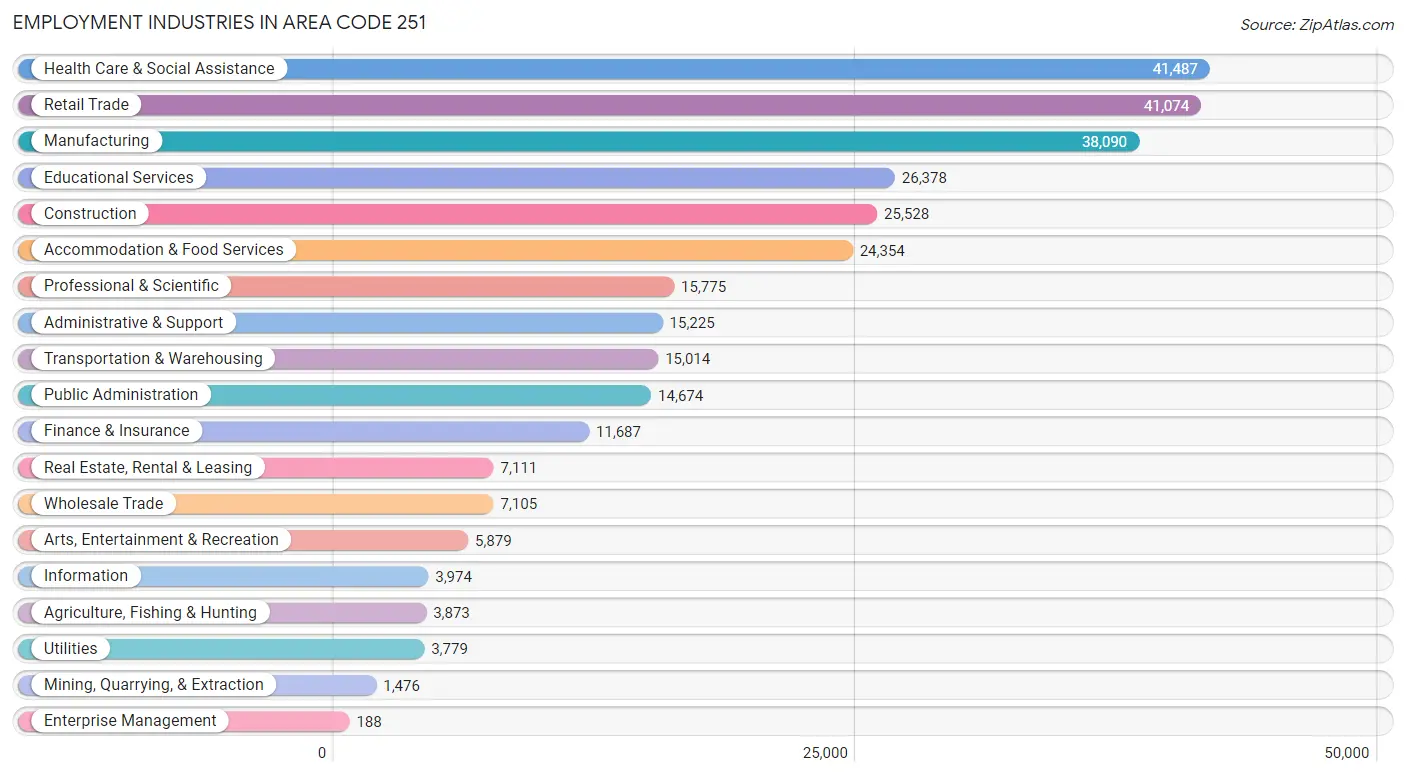
Employment Industries in Area Code 251
The major employment industries in Area Code 251 include Health Care & Social Assistance (41,487 | 13.0%), Retail Trade (41,074 | 12.8%), Manufacturing (38,090 | 11.9%), Educational Services (26,378 | 8.3%), and Construction (25,528 | 8.0%).
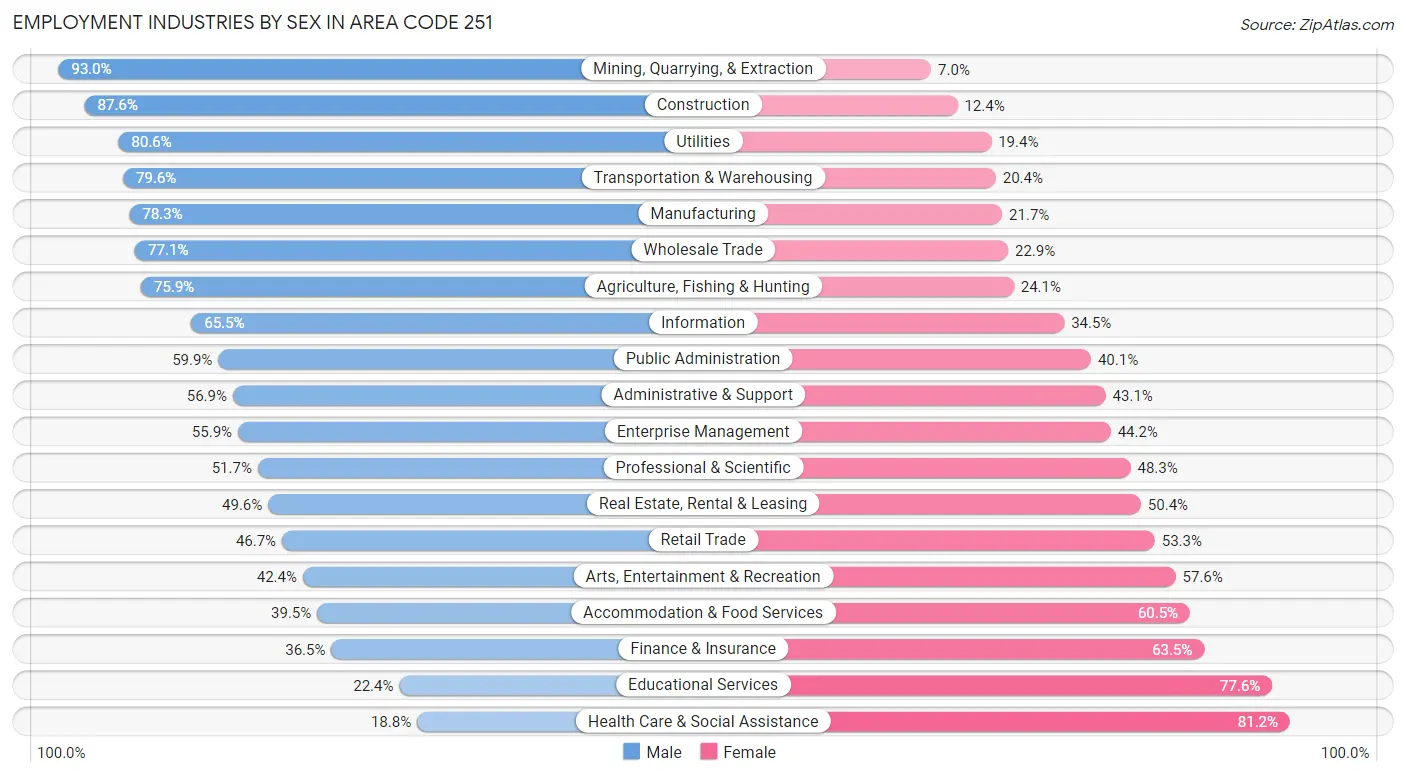
Employment Industries by Sex in Area Code 251
The Area Code 251 industries that see more men than women are Mining, Quarrying, & Extraction (93.0%), Construction (87.6%), and Utilities (80.6%), whereas the industries that tend to have a higher number of women are Health Care & Social Assistance (81.2%), Educational Services (77.6%), and Finance & Insurance (63.5%).
| Industry | Male | Female |
| Agriculture, Fishing & Hunting | 2,940 (75.9%) | 933 (24.1%) |
| Mining, Quarrying, & Extraction | 1,373 (93.0%) | 103 (7.0%) |
| Construction | 22,355 (87.6%) | 3,173 (12.4%) |
| Manufacturing | 29,831 (78.3%) | 8,259 (21.7%) |
| Wholesale Trade | 5,479 (77.1%) | 1,626 (22.9%) |
| Retail Trade | 19,193 (46.7%) | 21,881 (53.3%) |
| Transportation & Warehousing | 11,957 (79.6%) | 3,057 (20.4%) |
| Utilities | 3,045 (80.6%) | 734 (19.4%) |
| Information | 2,602 (65.5%) | 1,372 (34.5%) |
| Finance & Insurance | 4,267 (36.5%) | 7,420 (63.5%) |
| Real Estate, Rental & Leasing | 3,527 (49.6%) | 3,584 (50.4%) |
| Professional & Scientific | 8,162 (51.7%) | 7,613 (48.3%) |
| Enterprise Management | 105 (55.8%) | 83 (44.2%) |
| Administrative & Support | 8,663 (56.9%) | 6,562 (43.1%) |
| Educational Services | 5,918 (22.4%) | 20,460 (77.6%) |
| Health Care & Social Assistance | 7,790 (18.8%) | 33,697 (81.2%) |
| Arts, Entertainment & Recreation | 2,494 (42.4%) | 3,385 (57.6%) |
| Accommodation & Food Services | 9,611 (39.5%) | 14,743 (60.5%) |
| Public Administration | 8,794 (59.9%) | 5,880 (40.1%) |
| Total | 165,794 (51.8%) | 154,000 (48.2%) |
Education in Area Code 251
School Enrollment in Area Code 251
The most common levels of schooling among the 164,512 students in Area Code 251 are high school (39,036 | 23.7%), middle school (38,849 | 23.6%), and elementary school (34,295 | 20.8%).
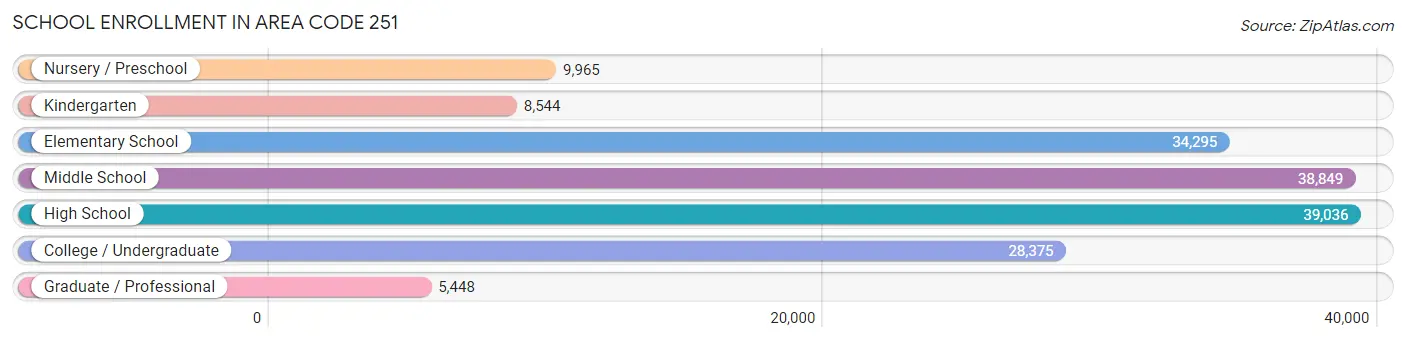
| School Level | # Students | % Students |
| Nursery / Preschool | 9,965 | 6.1% |
| Kindergarten | 8,544 | 5.2% |
| Elementary School | 34,295 | 20.8% |
| Middle School | 38,849 | 23.6% |
| High School | 39,036 | 23.7% |
| College / Undergraduate | 28,375 | 17.2% |
| Graduate / Professional | 5,448 | 3.3% |
| Total | 164,512 | 100.0% |
School Enrollment by Age by Funding Source in Area Code 251
Out of a total of 164,512 students who are enrolled in schools in Area Code 251, 30,782 (18.7%) attend a private institution, while the remaining 133,730 (81.3%) are enrolled in public schools. The age group of 3 to 4 year olds has the highest likelihood of being enrolled in private schools, with 2,870 (38.0% in the age bracket) enrolled. Conversely, the age group of 18 to 19 year olds has the lowest likelihood of being enrolled in a private school, with 10,776 (85.2% in the age bracket) attending a public institution.
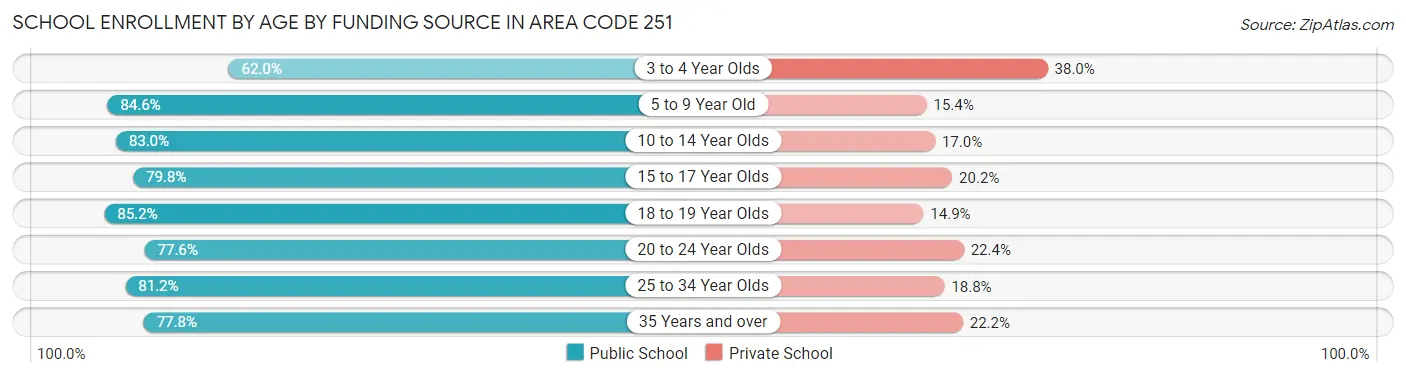
| Age Bracket | Public School | Private School |
| 3 to 4 Year Olds | 4,684 (62.0%) | 2,870 (38.0%) |
| 5 to 9 Year Old | 33,913 (84.6%) | 6,187 (15.4%) |
| 10 to 14 Year Olds | 40,678 (83.0%) | 8,338 (17.0%) |
| 15 to 17 Year Olds | 22,093 (79.8%) | 5,595 (20.2%) |
| 18 to 19 Year Olds | 10,776 (85.2%) | 1,880 (14.8%) |
| 20 to 24 Year Olds | 11,299 (77.6%) | 3,255 (22.4%) |
| 25 to 34 Year Olds | 5,309 (81.2%) | 1,227 (18.8%) |
| 35 Years and over | 4,986 (77.8%) | 1,422 (22.2%) |
| Total | 133,730 (81.3%) | 30,782 (18.7%) |
Educational Attainment by Field of Study in Area Code 251
Business (31,556 | 22.5%), education (22,800 | 16.3%), science & technology (16,817 | 12.0%), arts & humanities (9,454 | 6.7%), and engineering (9,183 | 6.6%) are the most common fields of study among 140,174 individuals in Area Code 251 who have obtained a bachelor's degree or higher.
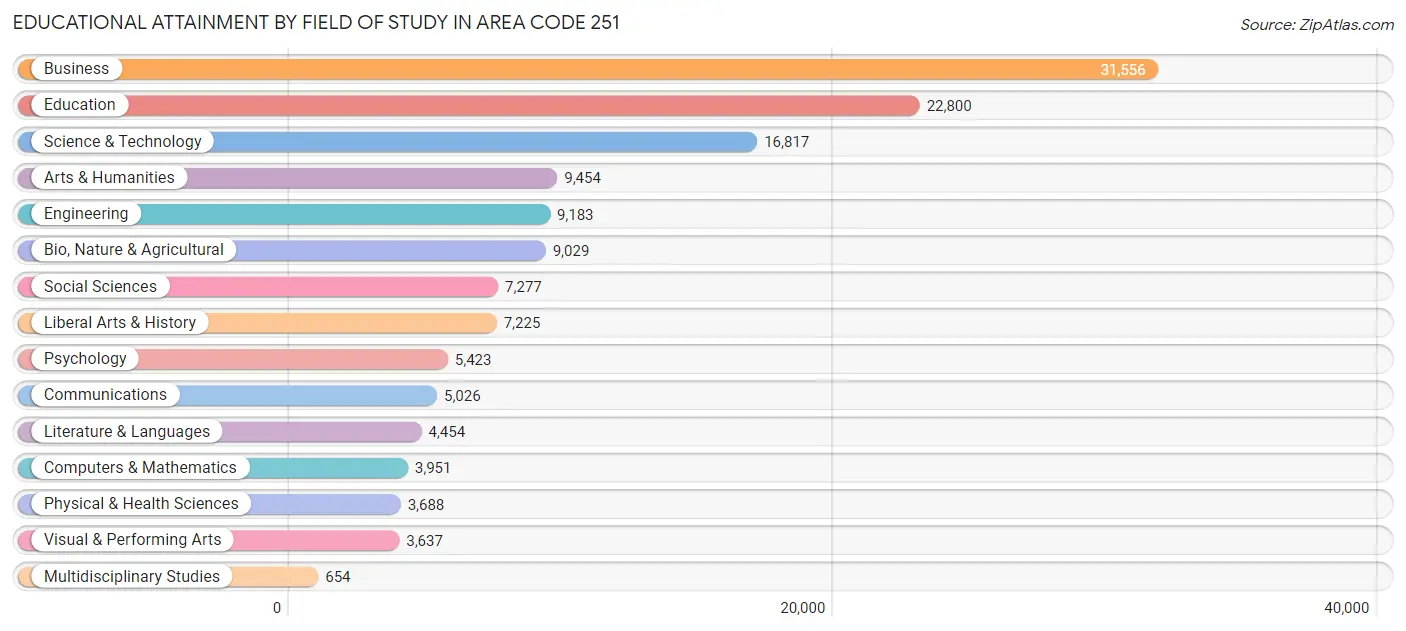
| Field of Study | # Graduates | % Graduates |
| Computers & Mathematics | 3,951 | 2.8% |
| Bio, Nature & Agricultural | 9,029 | 6.4% |
| Physical & Health Sciences | 3,688 | 2.6% |
| Psychology | 5,423 | 3.9% |
| Social Sciences | 7,277 | 5.2% |
| Engineering | 9,183 | 6.6% |
| Multidisciplinary Studies | 654 | 0.5% |
| Science & Technology | 16,817 | 12.0% |
| Business | 31,556 | 22.5% |
| Education | 22,800 | 16.3% |
| Literature & Languages | 4,454 | 3.2% |
| Liberal Arts & History | 7,225 | 5.1% |
| Visual & Performing Arts | 3,637 | 2.6% |
| Communications | 5,026 | 3.6% |
| Arts & Humanities | 9,454 | 6.7% |
| Total | 140,174 | 100.0% |
Transportation & Commute in Area Code 251
Vehicle Availability by Sex in Area Code 251
The most prevalent vehicle ownership categories in Area Code 251 are males with 2 vehicles (69,577, accounting for 42.3%) and females with 2 vehicles (59,805, making up 46.5%).
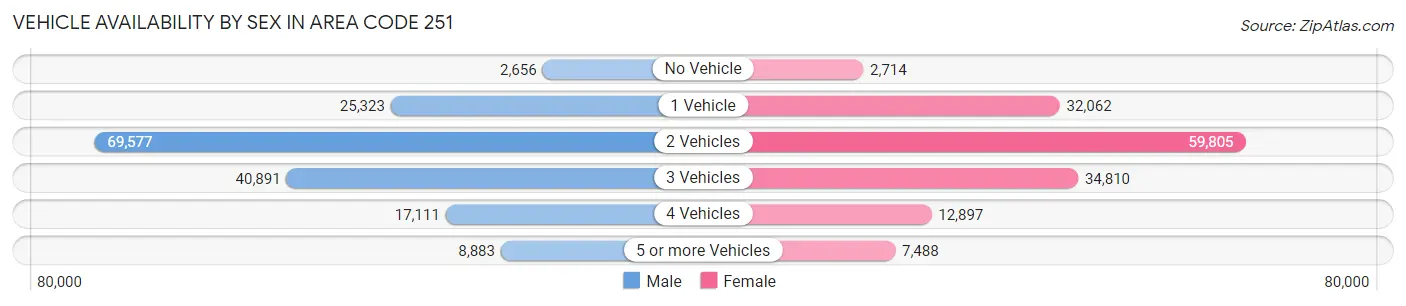
| Vehicles Available | Male | Female |
| No Vehicle | 2,656 (1.6%) | 2,714 (1.8%) |
| 1 Vehicle | 25,323 (15.4%) | 32,062 (21.4%) |
| 2 Vehicles | 69,577 (42.3%) | 59,805 (39.9%) |
| 3 Vehicles | 40,891 (24.9%) | 34,810 (23.2%) |
| 4 Vehicles | 17,111 (10.4%) | 12,897 (8.6%) |
| 5 or more Vehicles | 8,883 (5.4%) | 7,488 (5.0%) |
| Total | 164,441 (100.0%) | 149,776 (100.0%) |
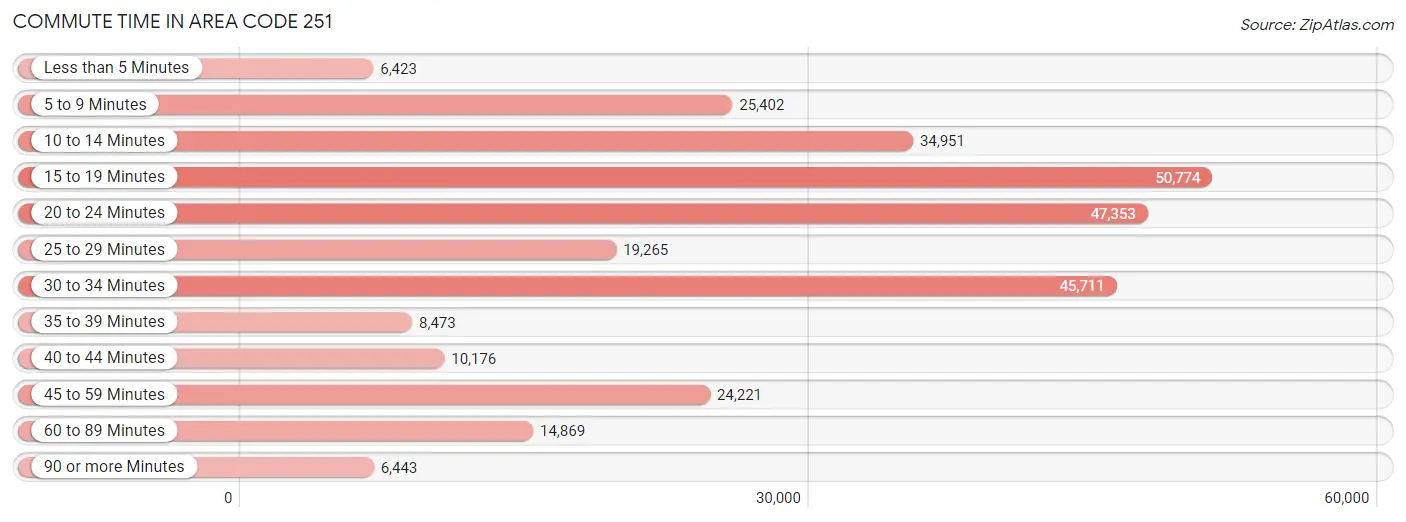
Commute Time in Area Code 251
The most frequently occuring commute durations in Area Code 251 are 15 to 19 minutes (50,774 commuters, 17.3%), 20 to 24 minutes (47,353 commuters, 16.1%), and 30 to 34 minutes (45,711 commuters, 15.5%).
| Commute Time | # Commuters | % Commuters |
| Less than 5 Minutes | 6,423 | 2.2% |
| 5 to 9 Minutes | 25,402 | 8.6% |
| 10 to 14 Minutes | 34,951 | 11.9% |
| 15 to 19 Minutes | 50,774 | 17.3% |
| 20 to 24 Minutes | 47,353 | 16.1% |
| 25 to 29 Minutes | 19,265 | 6.6% |
| 30 to 34 Minutes | 45,711 | 15.5% |
| 35 to 39 Minutes | 8,473 | 2.9% |
| 40 to 44 Minutes | 10,176 | 3.5% |
| 45 to 59 Minutes | 24,221 | 8.2% |
| 60 to 89 Minutes | 14,869 | 5.1% |
| 90 or more Minutes | 6,443 | 2.2% |
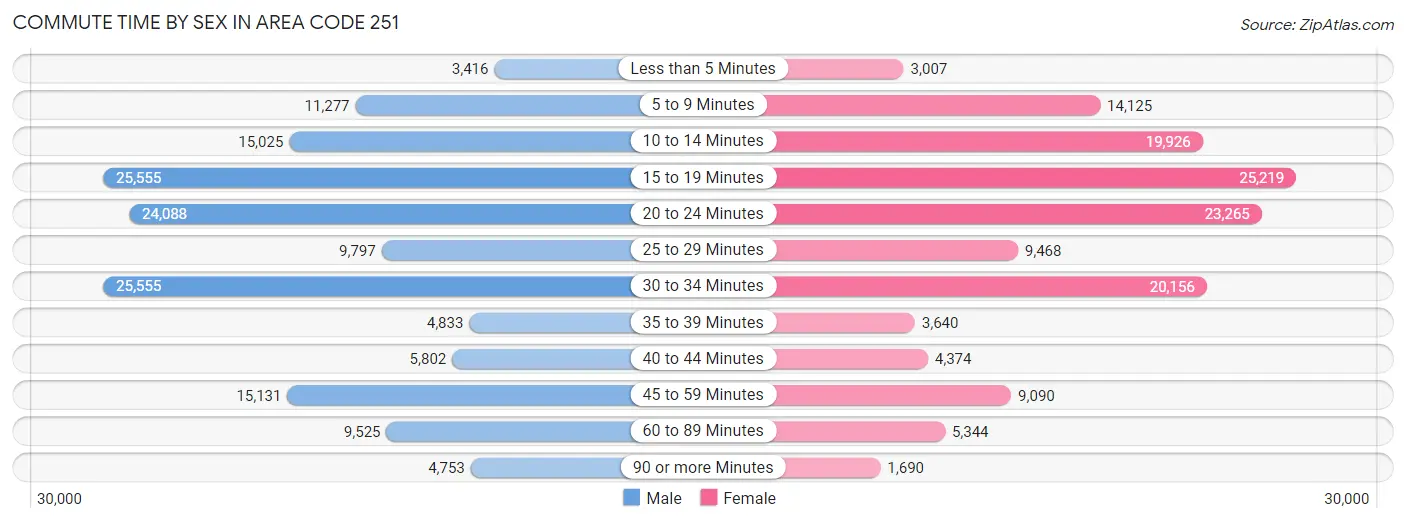
Commute Time by Sex in Area Code 251
The most common commute times in Area Code 251 are 15 to 19 minutes (25,555 commuters, 16.5%) for males and 15 to 19 minutes (25,219 commuters, 18.1%) for females.
| Commute Time | Male | Female |
| Less than 5 Minutes | 3,416 (2.2%) | 3,007 (2.2%) |
| 5 to 9 Minutes | 11,277 (7.3%) | 14,125 (10.1%) |
| 10 to 14 Minutes | 15,025 (9.7%) | 19,926 (14.3%) |
| 15 to 19 Minutes | 25,555 (16.5%) | 25,219 (18.1%) |
| 20 to 24 Minutes | 24,088 (15.6%) | 23,265 (16.7%) |
| 25 to 29 Minutes | 9,797 (6.3%) | 9,468 (6.8%) |
| 30 to 34 Minutes | 25,555 (16.5%) | 20,156 (14.5%) |
| 35 to 39 Minutes | 4,833 (3.1%) | 3,640 (2.6%) |
| 40 to 44 Minutes | 5,802 (3.7%) | 4,374 (3.1%) |
| 45 to 59 Minutes | 15,131 (9.8%) | 9,090 (6.5%) |
| 60 to 89 Minutes | 9,525 (6.1%) | 5,344 (3.8%) |
| 90 or more Minutes | 4,753 (3.1%) | 1,690 (1.2%) |
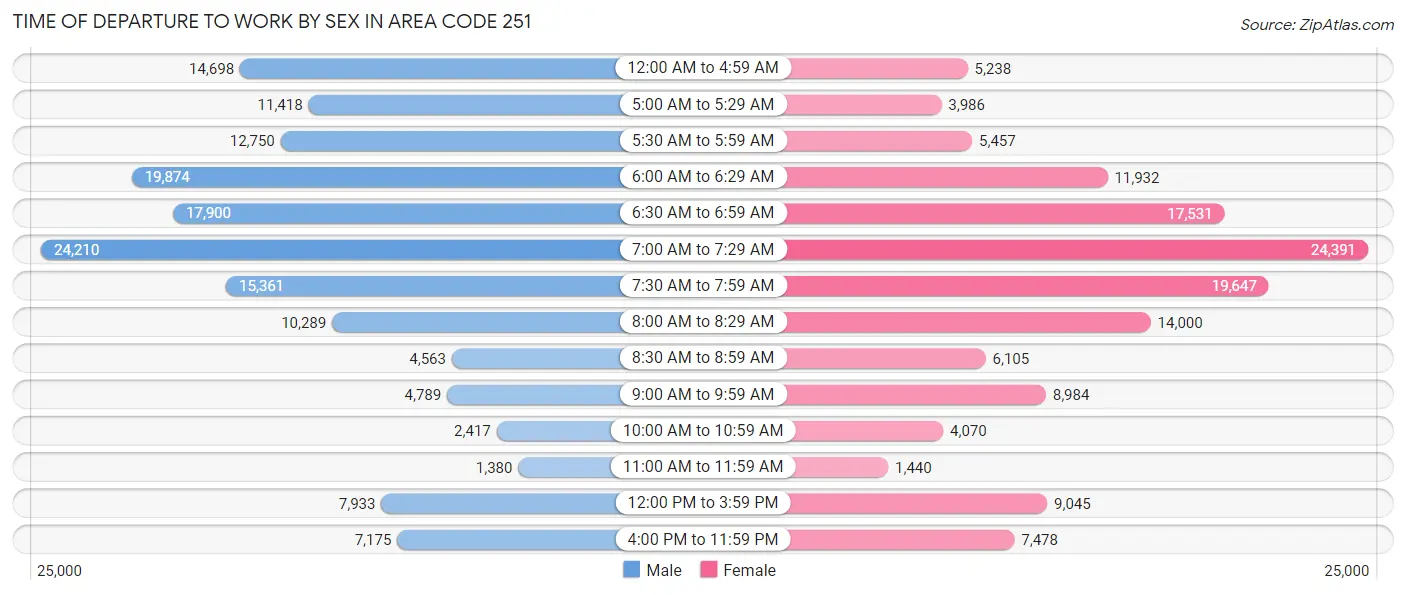
Time of Departure to Work by Sex in Area Code 251
The most frequent times of departure to work in Area Code 251 are 7:00 AM to 7:29 AM (24,210, 15.6%) for males and 7:00 AM to 7:29 AM (24,391, 17.5%) for females.
| Time of Departure | Male | Female |
| 12:00 AM to 4:59 AM | 14,698 (9.5%) | 5,238 (3.8%) |
| 5:00 AM to 5:29 AM | 11,418 (7.4%) | 3,986 (2.9%) |
| 5:30 AM to 5:59 AM | 12,750 (8.2%) | 5,457 (3.9%) |
| 6:00 AM to 6:29 AM | 19,874 (12.8%) | 11,932 (8.6%) |
| 6:30 AM to 6:59 AM | 17,900 (11.6%) | 17,531 (12.6%) |
| 7:00 AM to 7:29 AM | 24,210 (15.6%) | 24,391 (17.5%) |
| 7:30 AM to 7:59 AM | 15,361 (9.9%) | 19,647 (14.1%) |
| 8:00 AM to 8:29 AM | 10,289 (6.7%) | 14,000 (10.1%) |
| 8:30 AM to 8:59 AM | 4,563 (2.9%) | 6,105 (4.4%) |
| 9:00 AM to 9:59 AM | 4,789 (3.1%) | 8,984 (6.5%) |
| 10:00 AM to 10:59 AM | 2,417 (1.6%) | 4,070 (2.9%) |
| 11:00 AM to 11:59 AM | 1,380 (0.9%) | 1,440 (1.0%) |
| 12:00 PM to 3:59 PM | 7,933 (5.1%) | 9,045 (6.5%) |
| 4:00 PM to 11:59 PM | 7,175 (4.6%) | 7,478 (5.4%) |
| Total | 154,757 (100.0%) | 139,304 (100.0%) |
Housing Occupancy in Area Code 251
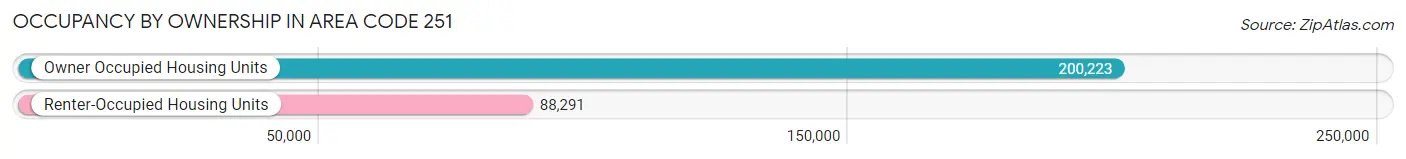
Occupancy by Ownership in Area Code 251
Of the total 288,514 dwellings in Area Code 251, owner-occupied units account for 200,223 (69.4%), while renter-occupied units make up 88,291 (30.6%).
| Occupancy | # Housing Units | % Housing Units |
| Owner Occupied Housing Units | 200,223 | 69.4% |
| Renter-Occupied Housing Units | 88,291 | 30.6% |
| Total Occupied Housing Units | 288,514 | 100.0% |
Occupancy by Household Size in Area Code 251
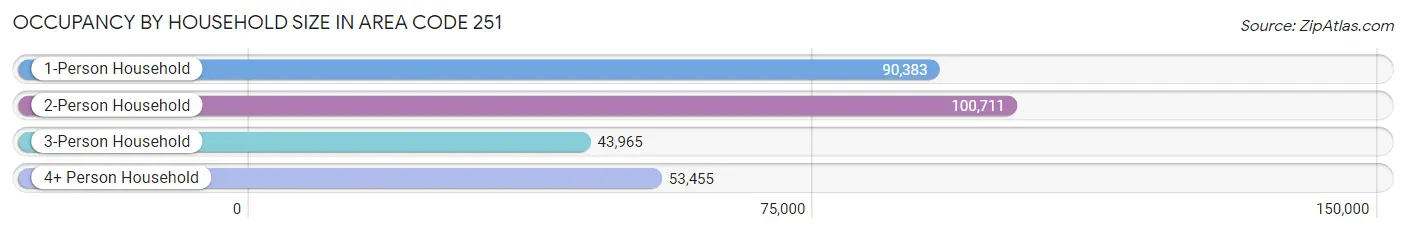
| Household Size | # Housing Units | % Housing Units |
| 1-Person Household | 90,383 | 31.3% |
| 2-Person Household | 100,711 | 34.9% |
| 3-Person Household | 43,965 | 15.2% |
| 4+ Person Household | 53,455 | 18.5% |
| Total Housing Units | 288,514 | 100.0% |
Occupancy by Ownership by Household Size in Area Code 251
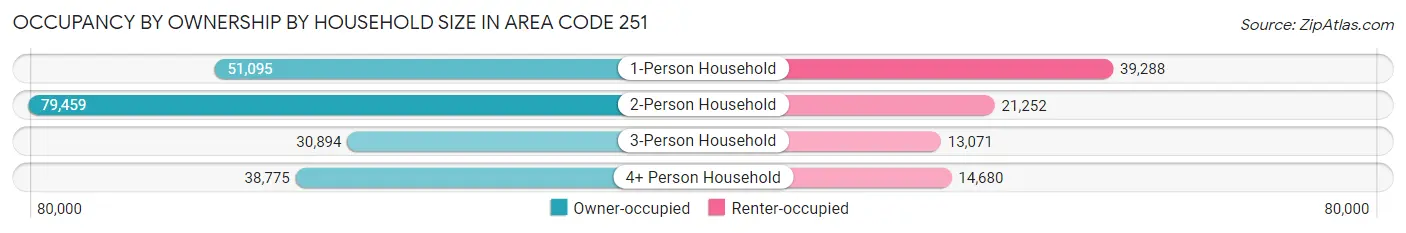
| Household Size | Owner-occupied | Renter-occupied |
| 1-Person Household | 51,095 (56.5%) | 39,288 (43.5%) |
| 2-Person Household | 79,459 (78.9%) | 21,252 (21.1%) |
| 3-Person Household | 30,894 (70.3%) | 13,071 (29.7%) |
| 4+ Person Household | 38,775 (72.5%) | 14,680 (27.5%) |
| Total Housing Units | 200,223 (69.4%) | 88,291 (30.6%) |
Occupancy by Educational Attainment in Area Code 251
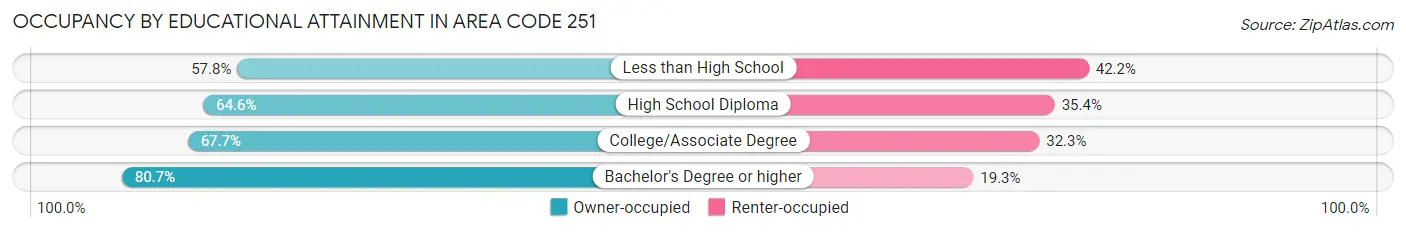
| Household Size | Owner-occupied | Renter-occupied |
| Less than High School | 16,103 (57.8%) | 11,739 (42.2%) |
| High School Diploma | 57,666 (64.6%) | 31,596 (35.4%) |
| College/Associate Degree | 61,699 (67.7%) | 29,497 (32.3%) |
| Bachelor's Degree or higher | 64,755 (80.7%) | 15,459 (19.3%) |
Occupancy by Age of Householder in Area Code 251
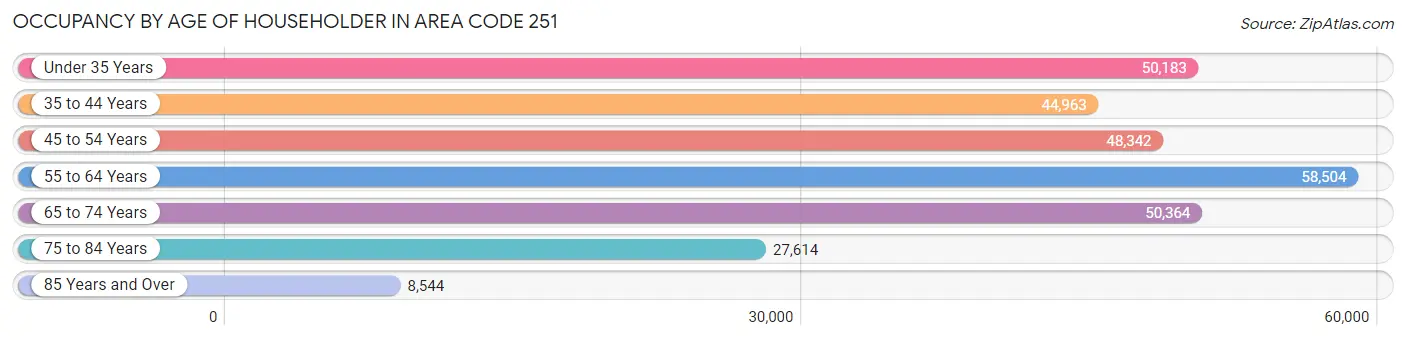
| Age Bracket | # Households | % Households |
| Under 35 Years | 50,183 | 17.4% |
| 35 to 44 Years | 44,963 | 15.6% |
| 45 to 54 Years | 48,342 | 16.8% |
| 55 to 64 Years | 58,504 | 20.3% |
| 65 to 74 Years | 50,364 | 17.5% |
| 75 to 84 Years | 27,614 | 9.6% |
| 85 Years and Over | 8,544 | 3.0% |
| Total | 288,514 | 100.0% |
Housing Finances in Area Code 251
Median Income by Occupancy in Area Code 251
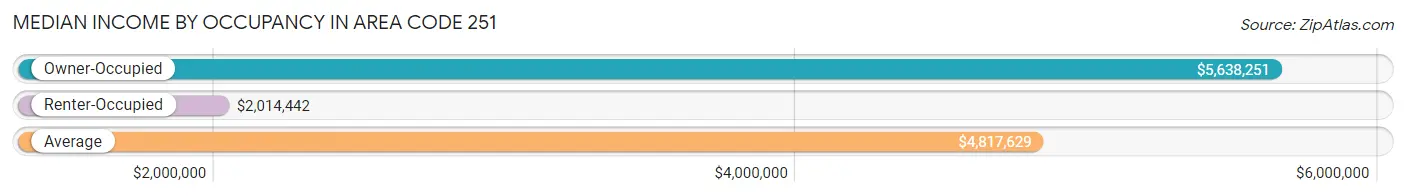
| Occupancy Type | # Households | Median Income |
| Owner-Occupied | 200,223 (69.4%) | $5,638,251 |
| Renter-Occupied | 88,291 (30.6%) | $2,014,442 |
| Average | 288,514 (100.0%) | $4,817,629 |
Occupancy by Householder Income Bracket in Area Code 251
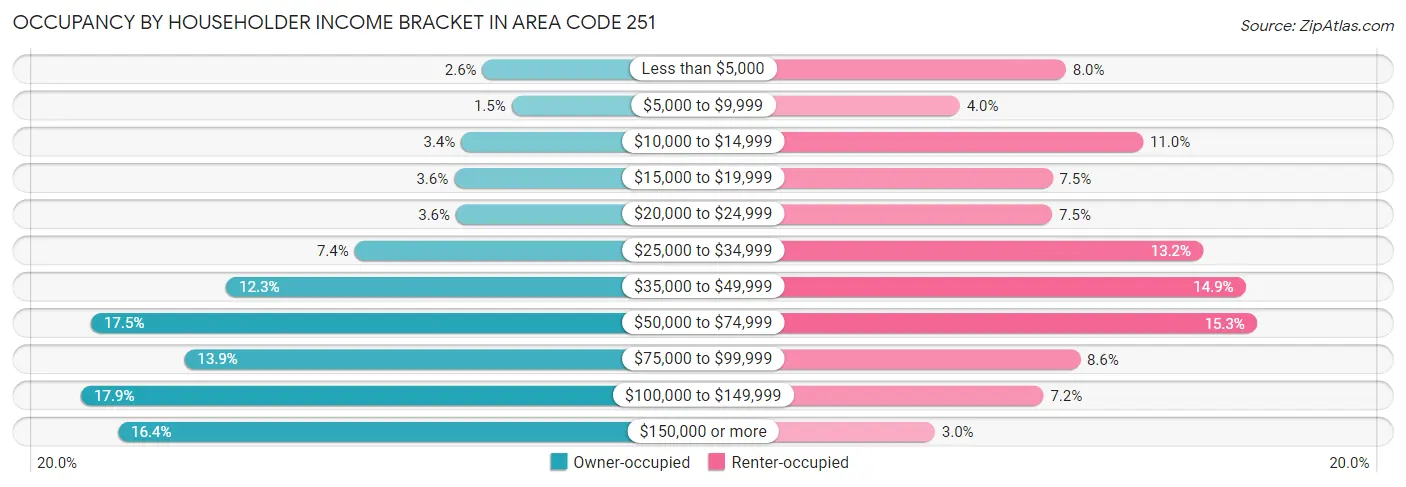
| Income Bracket | Owner-occupied | Renter-occupied |
| Less than $5,000 | 5,122 (2.6%) | 7,069 (8.0%) |
| $5,000 to $9,999 | 2,896 (1.5%) | 3,508 (4.0%) |
| $10,000 to $14,999 | 6,743 (3.4%) | 9,664 (11.0%) |
| $15,000 to $19,999 | 7,285 (3.6%) | 6,624 (7.5%) |
| $20,000 to $24,999 | 7,144 (3.6%) | 6,610 (7.5%) |
| $25,000 to $34,999 | 14,878 (7.4%) | 11,679 (13.2%) |
| $35,000 to $49,999 | 24,668 (12.3%) | 13,108 (14.8%) |
| $50,000 to $74,999 | 34,972 (17.5%) | 13,494 (15.3%) |
| $75,000 to $99,999 | 27,856 (13.9%) | 7,552 (8.6%) |
| $100,000 to $149,999 | 35,744 (17.8%) | 6,318 (7.2%) |
| $150,000 or more | 32,915 (16.4%) | 2,665 (3.0%) |
| Total | 200,223 (100.0%) | 88,291 (100.0%) |
Monthly Housing Cost Tiers in Area Code 251
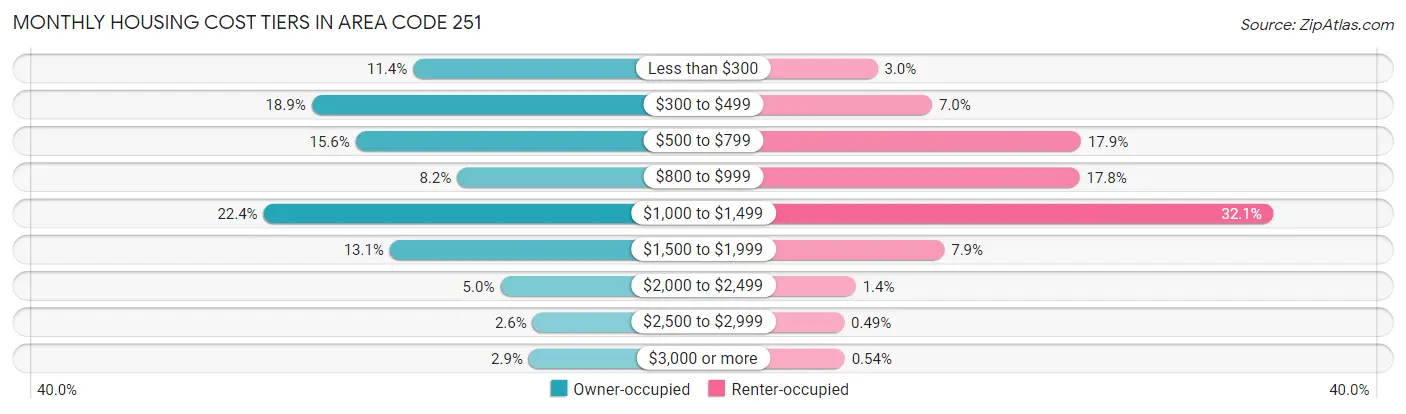
| Monthly Cost | Owner-occupied | Renter-occupied |
| Less than $300 | 22,812 (11.4%) | 2,601 (2.9%) |
| $300 to $499 | 37,779 (18.9%) | 6,152 (7.0%) |
| $500 to $799 | 31,290 (15.6%) | 15,838 (17.9%) |
| $800 to $999 | 16,311 (8.2%) | 15,741 (17.8%) |
| $1,000 to $1,499 | 44,878 (22.4%) | 28,357 (32.1%) |
| $1,500 to $1,999 | 26,253 (13.1%) | 6,945 (7.9%) |
| $2,000 to $2,499 | 9,958 (5.0%) | 1,196 (1.3%) |
| $2,500 to $2,999 | 5,190 (2.6%) | 431 (0.5%) |
| $3,000 or more | 5,752 (2.9%) | 481 (0.5%) |
| Total | 200,223 (100.0%) | 88,291 (100.0%) |
Physical Housing Characteristics in Area Code 251
Housing Structures in Area Code 251
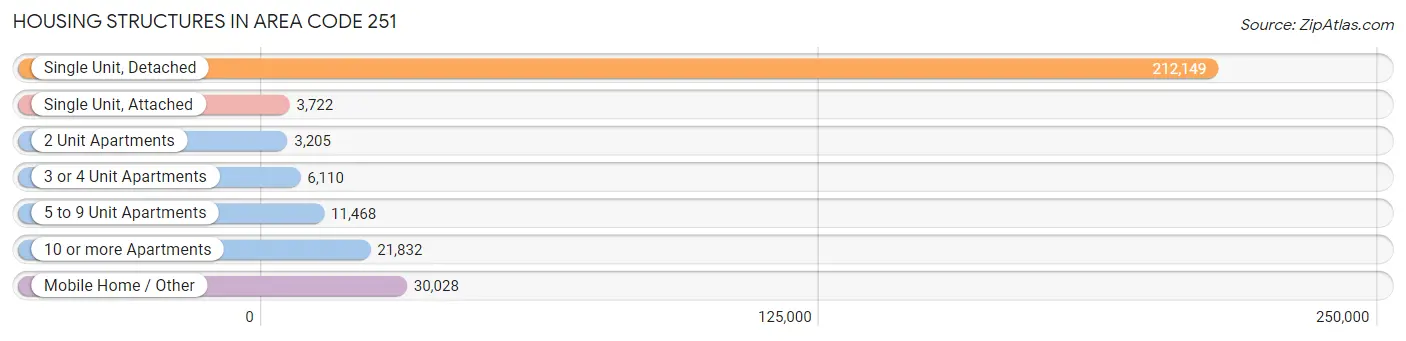
| Structure Type | # Housing Units | % Housing Units |
| Single Unit, Detached | 212,149 | 73.5% |
| Single Unit, Attached | 3,722 | 1.3% |
| 2 Unit Apartments | 3,205 | 1.1% |
| 3 or 4 Unit Apartments | 6,110 | 2.1% |
| 5 to 9 Unit Apartments | 11,468 | 4.0% |
| 10 or more Apartments | 21,832 | 7.6% |
| Mobile Home / Other | 30,028 | 10.4% |
| Total | 288,514 | 100.0% |
Housing Structures by Occupancy in Area Code 251
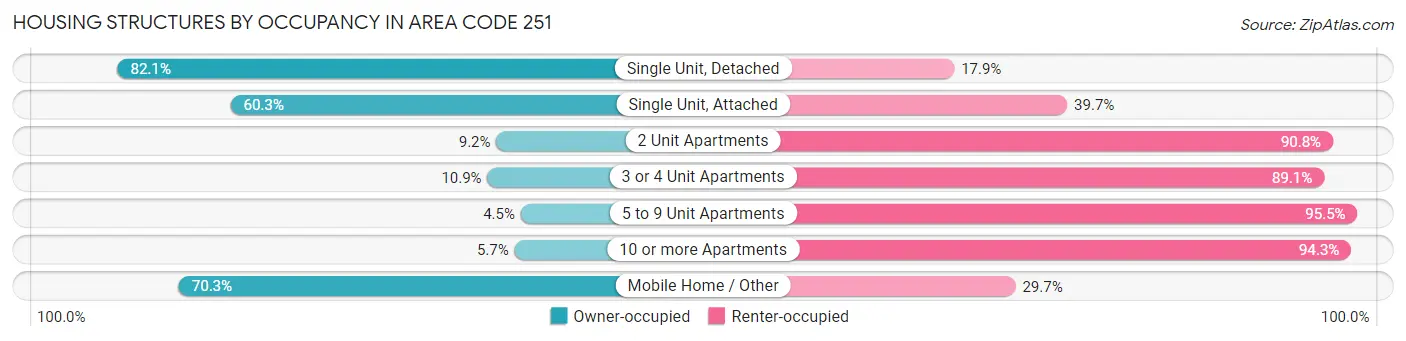
| Structure Type | Owner-occupied | Renter-occupied |
| Single Unit, Detached | 174,163 (82.1%) | 37,986 (17.9%) |
| Single Unit, Attached | 2,246 (60.3%) | 1,476 (39.7%) |
| 2 Unit Apartments | 294 (9.2%) | 2,911 (90.8%) |
| 3 or 4 Unit Apartments | 665 (10.9%) | 5,445 (89.1%) |
| 5 to 9 Unit Apartments | 512 (4.5%) | 10,956 (95.5%) |
| 10 or more Apartments | 1,236 (5.7%) | 20,596 (94.3%) |
| Mobile Home / Other | 21,107 (70.3%) | 8,921 (29.7%) |
| Total | 200,223 (69.4%) | 88,291 (30.6%) |
Housing Structures by Number of Rooms in Area Code 251
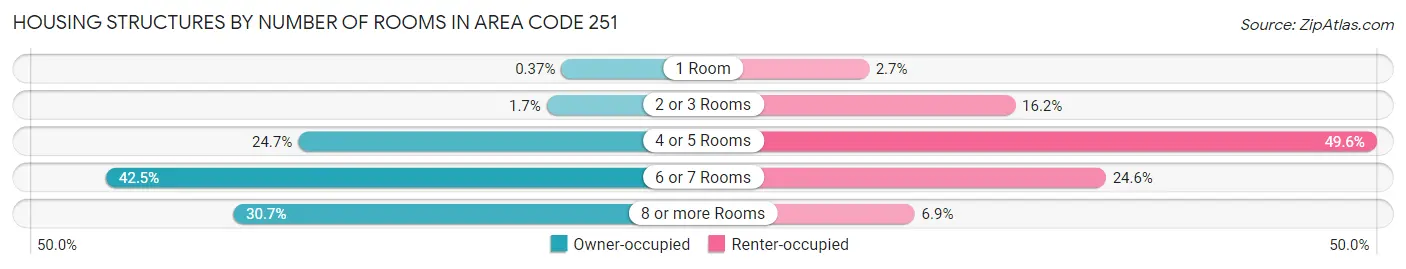
| Number of Rooms | Owner-occupied | Renter-occupied |
| 1 Room | 747 (0.4%) | 2,351 (2.7%) |
| 2 or 3 Rooms | 3,436 (1.7%) | 14,307 (16.2%) |
| 4 or 5 Rooms | 49,482 (24.7%) | 43,830 (49.6%) |
| 6 or 7 Rooms | 85,062 (42.5%) | 21,701 (24.6%) |
| 8 or more Rooms | 61,496 (30.7%) | 6,102 (6.9%) |
| Total | 200,223 (100.0%) | 88,291 (100.0%) |
Housing Structure by Heating Type in Area Code 251
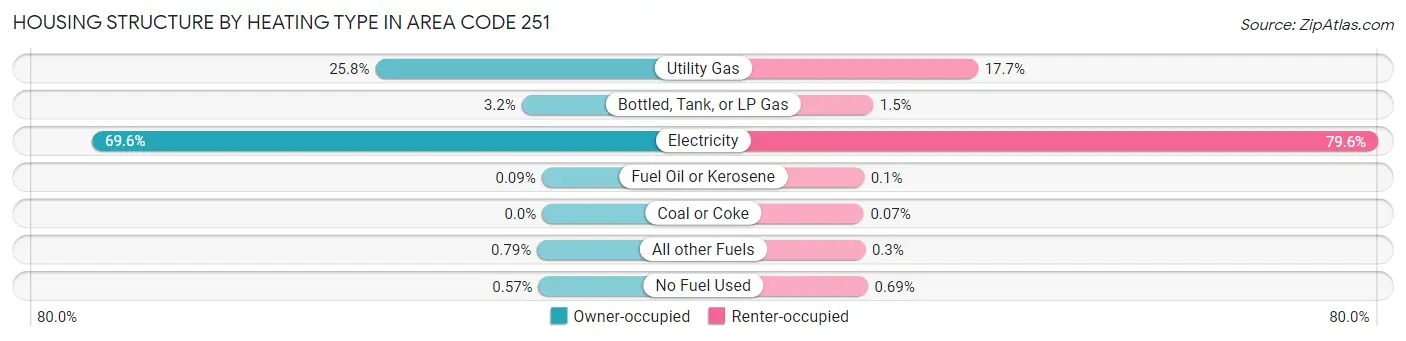
| Heating Type | Owner-occupied | Renter-occupied |
| Utility Gas | 51,656 (25.8%) | 15,654 (17.7%) |
| Bottled, Tank, or LP Gas | 6,371 (3.2%) | 1,343 (1.5%) |
| Electricity | 139,301 (69.6%) | 70,275 (79.6%) |
| Fuel Oil or Kerosene | 174 (0.1%) | 84 (0.1%) |
| Coal or Coke | 0 (0.0%) | 58 (0.1%) |
| All other Fuels | 1,577 (0.8%) | 269 (0.3%) |
| No Fuel Used | 1,144 (0.6%) | 608 (0.7%) |
| Total | 200,223 (100.0%) | 88,291 (100.0%) |
Household Vehicle Usage in Area Code 251
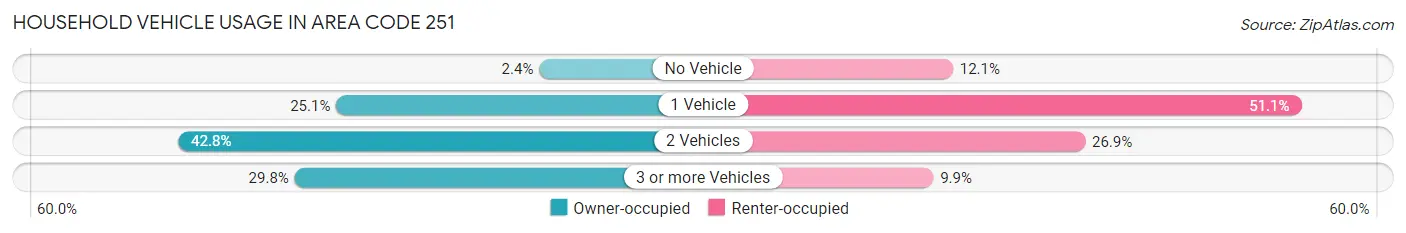
| Vehicles per Household | Owner-occupied | Renter-occupied |
| No Vehicle | 4,697 (2.4%) | 10,667 (12.1%) |
| 1 Vehicle | 50,233 (25.1%) | 45,138 (51.1%) |
| 2 Vehicles | 85,725 (42.8%) | 23,750 (26.9%) |
| 3 or more Vehicles | 59,568 (29.7%) | 8,736 (9.9%) |
| Total | 200,223 (100.0%) | 88,291 (100.0%) |
Real Estate & Mortgages in Area Code 251
Real Estate and Mortgage Overview in Area Code 251
| Characteristic | Without Mortgage | With Mortgage |
| Housing Units | 88,985 | 111,238 |
| Median Property Value | $11,545,699 | $14,971,500 |
| Median Household Income | $4,222,781 | $23,691 |
| Monthly Housing Costs | $34,976 | $5,636 |
| Real Estate Taxes | $41,541 | $13,754 |
Property Value by Mortgage Status in Area Code 251
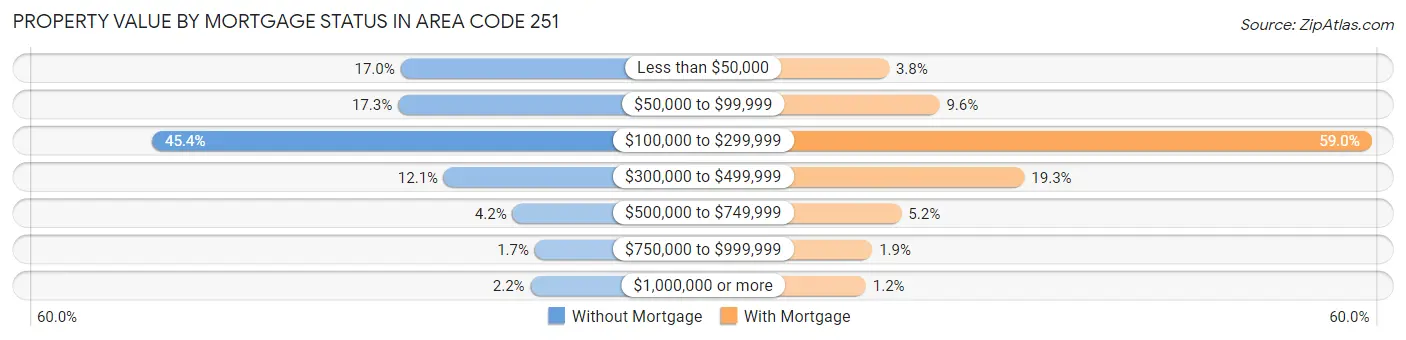
| Property Value | Without Mortgage | With Mortgage |
| Less than $50,000 | 15,166 (17.0%) | 4,245 (3.8%) |
| $50,000 to $99,999 | 15,422 (17.3%) | 10,666 (9.6%) |
| $100,000 to $299,999 | 40,426 (45.4%) | 65,593 (59.0%) |
| $300,000 to $499,999 | 10,748 (12.1%) | 21,466 (19.3%) |
| $500,000 to $749,999 | 3,769 (4.2%) | 5,824 (5.2%) |
| $750,000 to $999,999 | 1,507 (1.7%) | 2,129 (1.9%) |
| $1,000,000 or more | 1,947 (2.2%) | 1,315 (1.2%) |
| Total | 88,985 (100.0%) | 111,238 (100.0%) |
Household Income by Mortgage Status in Area Code 251
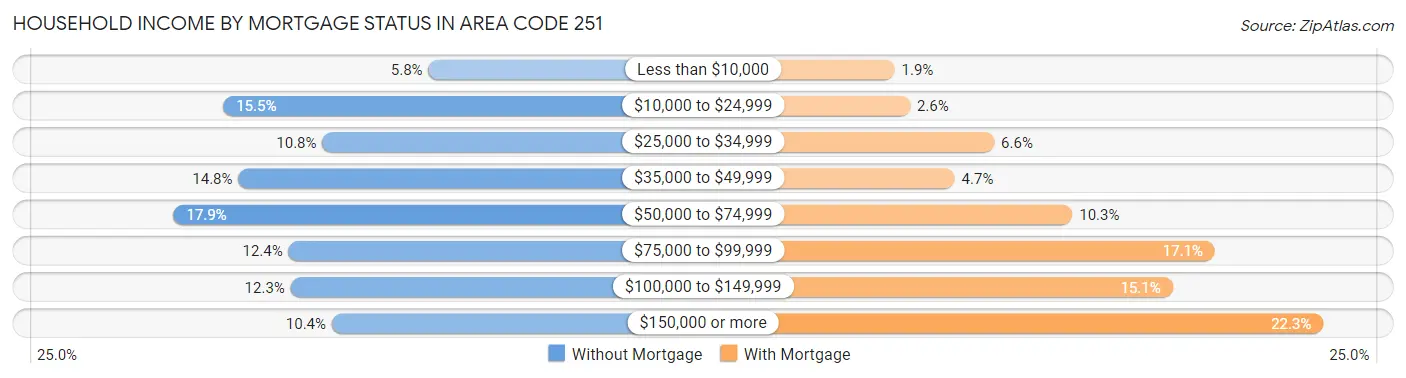
| Household Income | Without Mortgage | With Mortgage |
| Less than $10,000 | 5,138 (5.8%) | 2,068 (1.9%) |
| $10,000 to $24,999 | 13,832 (15.5%) | 2,880 (2.6%) |
| $25,000 to $34,999 | 9,632 (10.8%) | 7,340 (6.6%) |
| $35,000 to $49,999 | 13,189 (14.8%) | 5,246 (4.7%) |
| $50,000 to $74,999 | 15,940 (17.9%) | 11,479 (10.3%) |
| $75,000 to $99,999 | 11,061 (12.4%) | 19,032 (17.1%) |
| $100,000 to $149,999 | 10,969 (12.3%) | 16,795 (15.1%) |
| $150,000 or more | 9,224 (10.4%) | 24,775 (22.3%) |
| Total | 88,985 (100.0%) | 111,238 (100.0%) |
Property Value to Household Income Ratio in Area Code 251
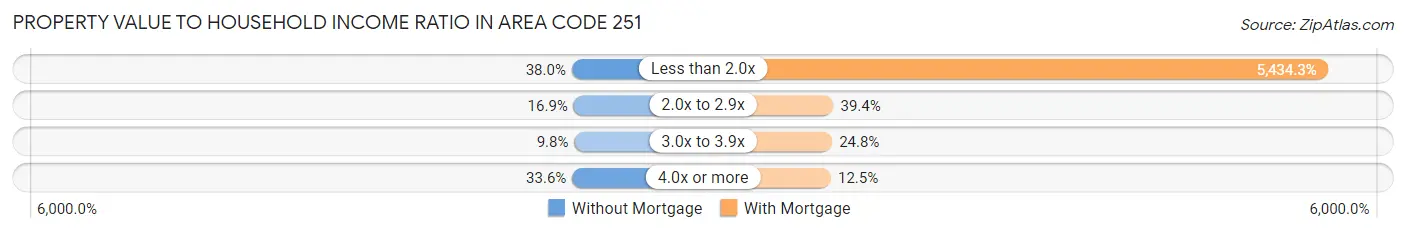
| Value-to-Income Ratio | Without Mortgage | With Mortgage |
| Less than 2.0x | 33,772 (38.0%) | 6,044,965 (5,434.3%) |
| 2.0x to 2.9x | 15,052 (16.9%) | 43,842 (39.4%) |
| 3.0x to 3.9x | 8,688 (9.8%) | 27,596 (24.8%) |
| 4.0x or more | 29,852 (33.6%) | 13,908 (12.5%) |
| Total | 88,985 (100.0%) | 111,238 (100.0%) |
Real Estate Taxes by Mortgage Status in Area Code 251
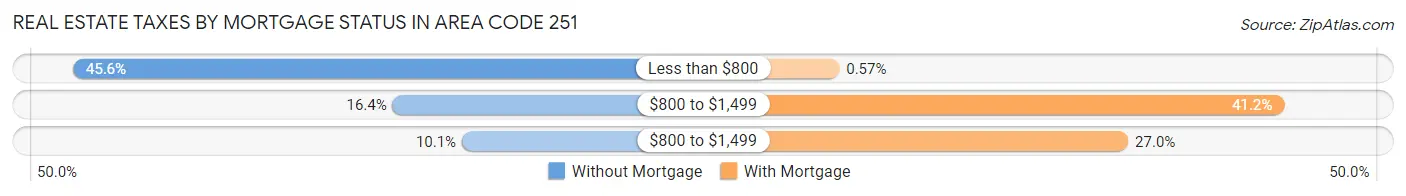
| Property Taxes | Without Mortgage | With Mortgage |
| Less than $800 | 40,570 (45.6%) | 639 (0.6%) |
| $800 to $1,499 | 14,595 (16.4%) | 45,826 (41.2%) |
| $800 to $1,499 | 8,955 (10.1%) | 29,982 (27.0%) |
| Total | 88,985 (100.0%) | 111,238 (100.0%) |
Health & Disability in Area Code 251
Health Insurance Coverage by Age in Area Code 251
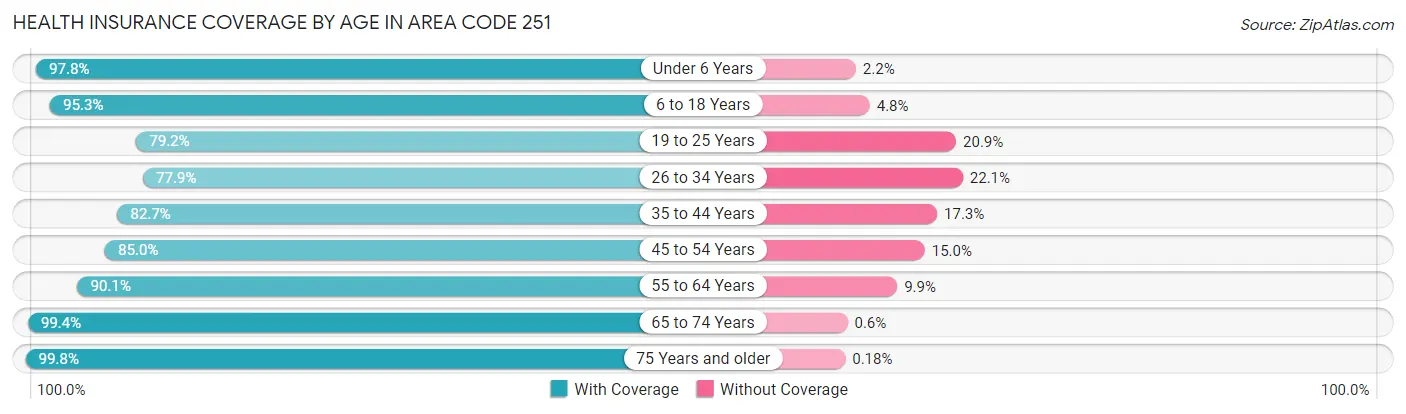
| Age Bracket | With Coverage | Without Coverage |
| Under 6 Years | 50,939 (97.8%) | 1,123 (2.2%) |
| 6 to 18 Years | 119,069 (95.3%) | 5,934 (4.8%) |
| 19 to 25 Years | 50,824 (79.1%) | 13,385 (20.8%) |
| 26 to 34 Years | 63,868 (77.9%) | 18,126 (22.1%) |
| 35 to 44 Years | 72,998 (82.7%) | 15,284 (17.3%) |
| 45 to 54 Years | 76,980 (85.0%) | 13,592 (15.0%) |
| 55 to 64 Years | 92,145 (90.1%) | 10,093 (9.9%) |
| 65 to 74 Years | 81,835 (99.4%) | 495 (0.6%) |
| 75 Years and older | 54,035 (99.8%) | 97 (0.2%) |
| Total | 662,693 (89.4%) | 78,129 (10.5%) |
Health Insurance Coverage by Citizenship Status in Area Code 251
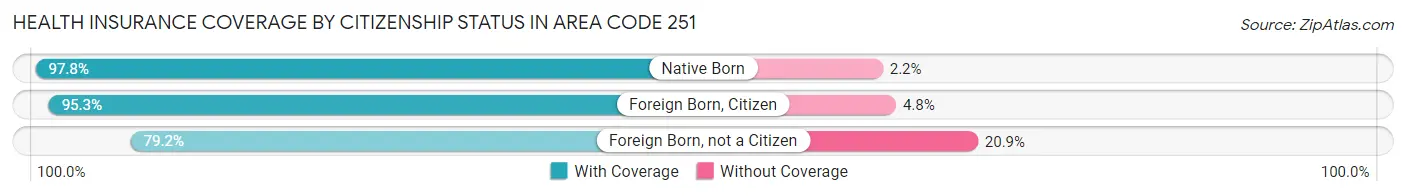
| Citizenship Status | With Coverage | Without Coverage |
| Native Born | 50,939 (97.8%) | 1,123 (2.2%) |
| Foreign Born, Citizen | 119,069 (95.3%) | 5,934 (4.8%) |
| Foreign Born, not a Citizen | 50,824 (79.1%) | 13,385 (20.8%) |
Health Insurance Coverage by Household Income in Area Code 251
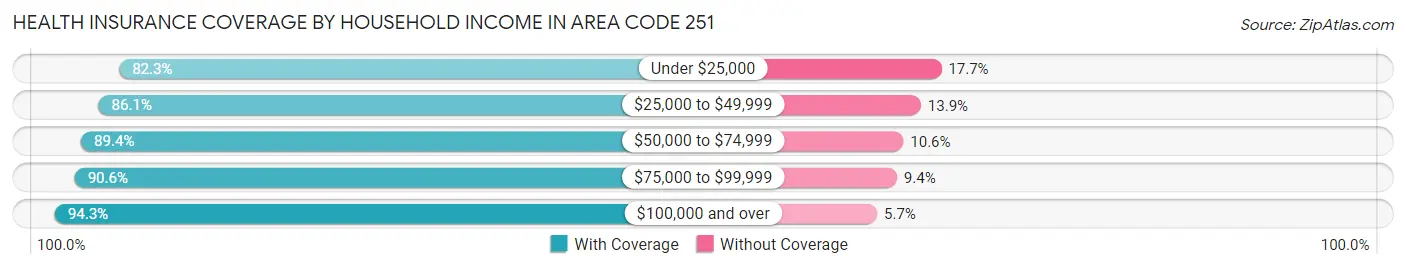
| Household Income | With Coverage | Without Coverage |
| Under $25,000 | 96,426 (82.3%) | 20,784 (17.7%) |
| $25,000 to $49,999 | 122,374 (86.1%) | 19,727 (13.9%) |
| $50,000 to $74,999 | 113,690 (89.4%) | 13,482 (10.6%) |
| $75,000 to $99,999 | 91,785 (90.6%) | 9,511 (9.4%) |
| $100,000 and over | 233,979 (94.3%) | 14,079 (5.7%) |
Public vs Private Health Insurance Coverage by Age in Area Code 251
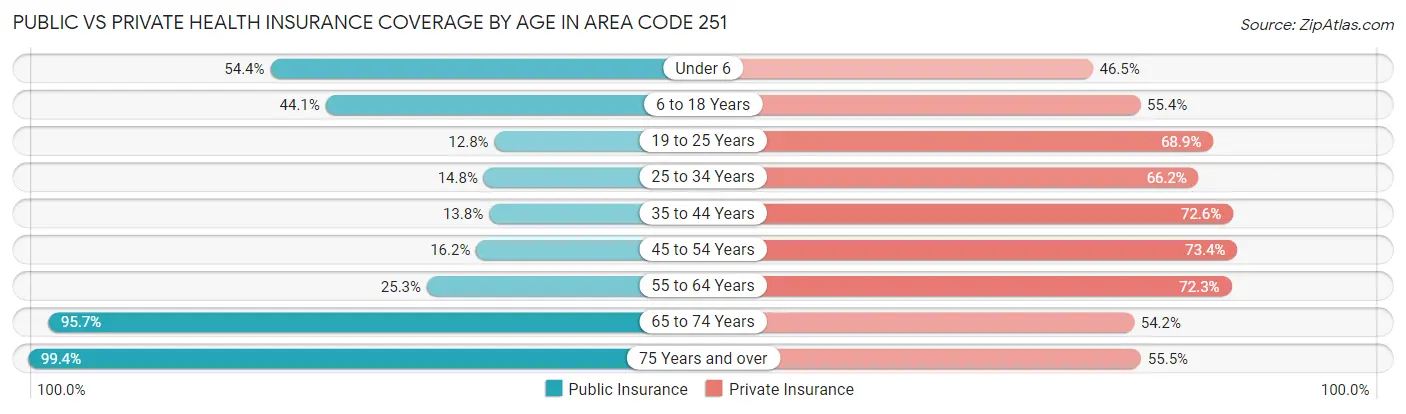
| Age Bracket | Public Insurance | Private Insurance |
| Under 6 | 28,309 (54.4%) | 24,228 (46.5%) |
| 6 to 18 Years | 55,167 (44.1%) | 69,201 (55.4%) |
| 19 to 25 Years | 8,220 (12.8%) | 44,266 (68.9%) |
| 25 to 34 Years | 12,118 (14.8%) | 54,314 (66.2%) |
| 35 to 44 Years | 12,183 (13.8%) | 64,101 (72.6%) |
| 45 to 54 Years | 14,644 (16.2%) | 66,502 (73.4%) |
| 55 to 64 Years | 25,911 (25.3%) | 73,926 (72.3%) |
| 65 to 74 Years | 78,763 (95.7%) | 44,626 (54.2%) |
| 75 Years and over | 53,800 (99.4%) | 30,054 (55.5%) |
| Total | 289,115 (39.0%) | 471,218 (63.6%) |
Disability Status by Sex by Age in Area Code 251
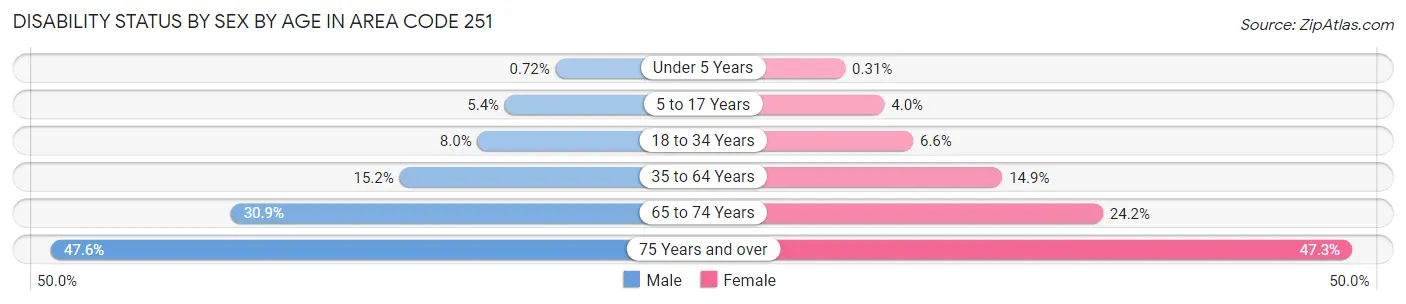
| Age Bracket | Male | Female |
| Under 5 Years | 163 (0.7%) | 64 (0.3%) |
| 5 to 17 Years | 3,413 (5.4%) | 2,394 (4.0%) |
| 18 to 34 Years | 6,067 (8.0%) | 5,280 (6.6%) |
| 35 to 64 Years | 20,290 (15.2%) | 21,981 (14.9%) |
| 65 to 74 Years | 11,907 (30.9%) | 10,604 (24.2%) |
| 75 Years and over | 10,594 (47.5%) | 15,078 (47.3%) |
Disability Class by Sex by Age in Area Code 251
Disability Class: Hearing Difficulty
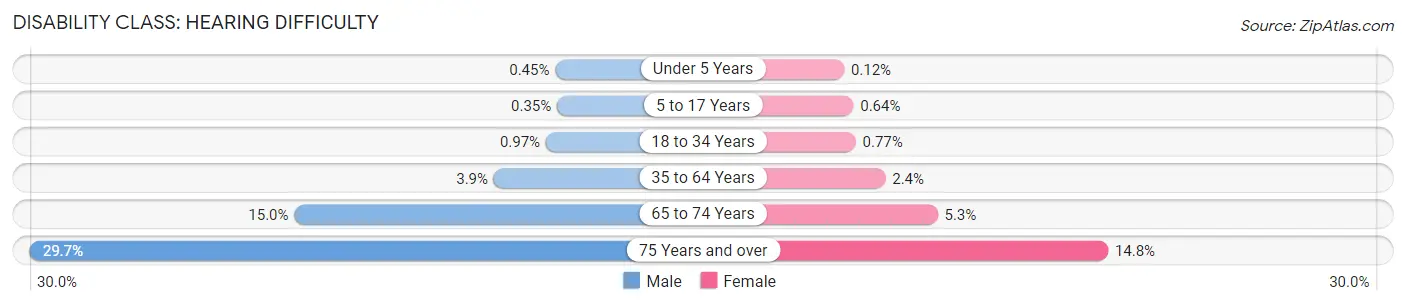
| Age Bracket | Male | Female |
| Under 5 Years | 103 (0.4%) | 26 (0.1%) |
| 5 to 17 Years | 218 (0.4%) | 391 (0.6%) |
| 18 to 34 Years | 740 (1.0%) | 616 (0.8%) |
| 35 to 64 Years | 5,171 (3.9%) | 3,575 (2.4%) |
| 65 to 74 Years | 5,778 (15.0%) | 2,333 (5.3%) |
| 75 Years and over | 6,619 (29.7%) | 4,721 (14.8%) |
Disability Class: Vision Difficulty
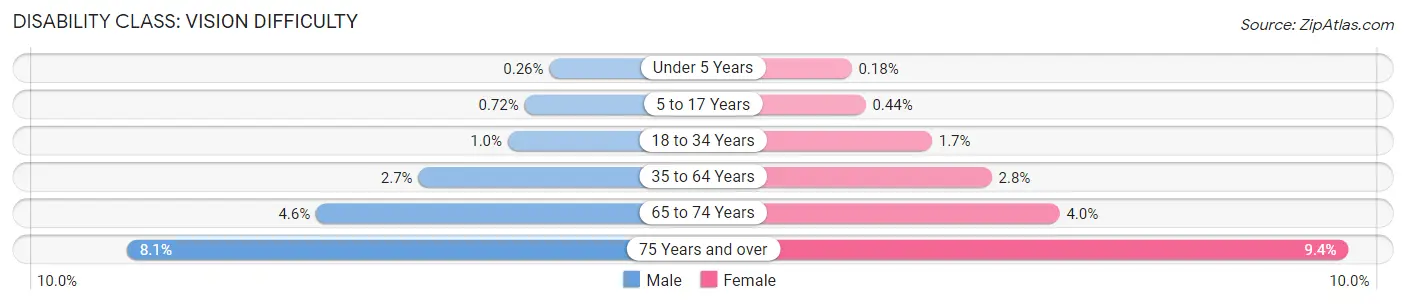
| Age Bracket | Male | Female |
| Under 5 Years | 60 (0.3%) | 38 (0.2%) |
| 5 to 17 Years | 455 (0.7%) | 264 (0.4%) |
| 18 to 34 Years | 788 (1.0%) | 1,334 (1.7%) |
| 35 to 64 Years | 3,587 (2.7%) | 4,100 (2.8%) |
| 65 to 74 Years | 1,771 (4.6%) | 1,770 (4.0%) |
| 75 Years and over | 1,805 (8.1%) | 2,995 (9.4%) |
Disability Class: Cognitive Difficulty
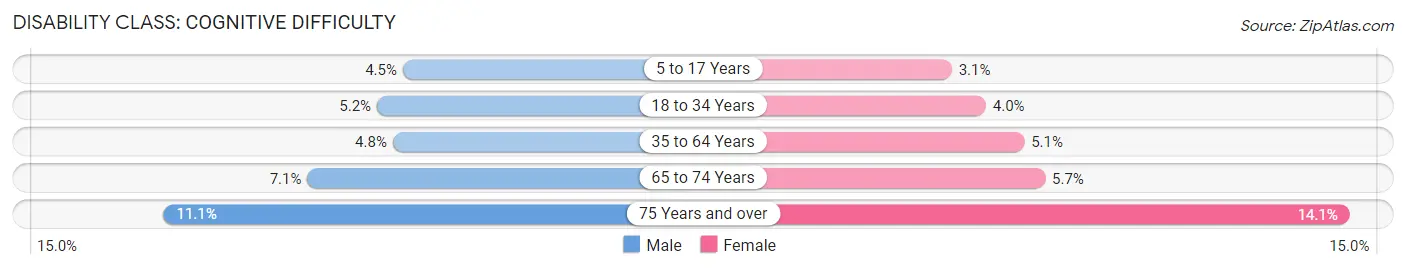
| Age Bracket | Male | Female |
| 5 to 17 Years | 2,812 (4.5%) | 1,854 (3.1%) |
| 18 to 34 Years | 3,949 (5.2%) | 3,199 (4.0%) |
| 35 to 64 Years | 6,347 (4.8%) | 7,491 (5.1%) |
| 65 to 74 Years | 2,750 (7.1%) | 2,477 (5.7%) |
| 75 Years and over | 2,479 (11.1%) | 4,504 (14.1%) |
Disability Class: Ambulatory Difficulty
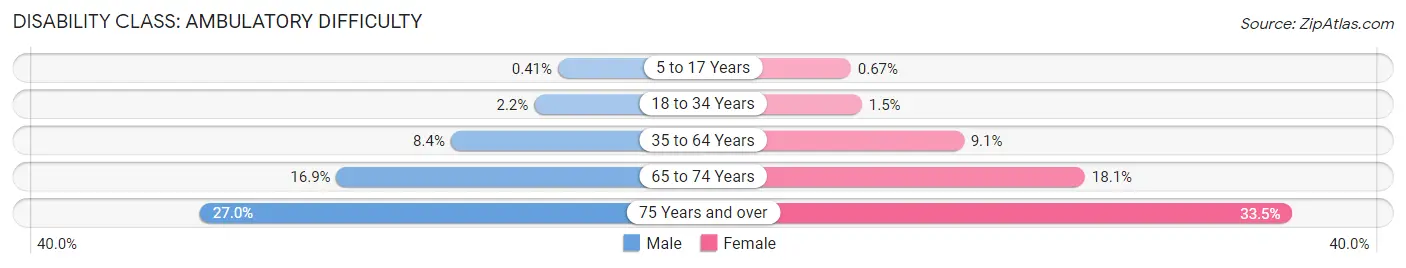
| Age Bracket | Male | Female |
| 5 to 17 Years | 257 (0.4%) | 409 (0.7%) |
| 18 to 34 Years | 1,653 (2.2%) | 1,186 (1.5%) |
| 35 to 64 Years | 11,166 (8.4%) | 13,364 (9.0%) |
| 65 to 74 Years | 6,497 (16.9%) | 7,898 (18.0%) |
| 75 Years and over | 6,011 (27.0%) | 10,655 (33.5%) |
Disability Class: Self-Care Difficulty
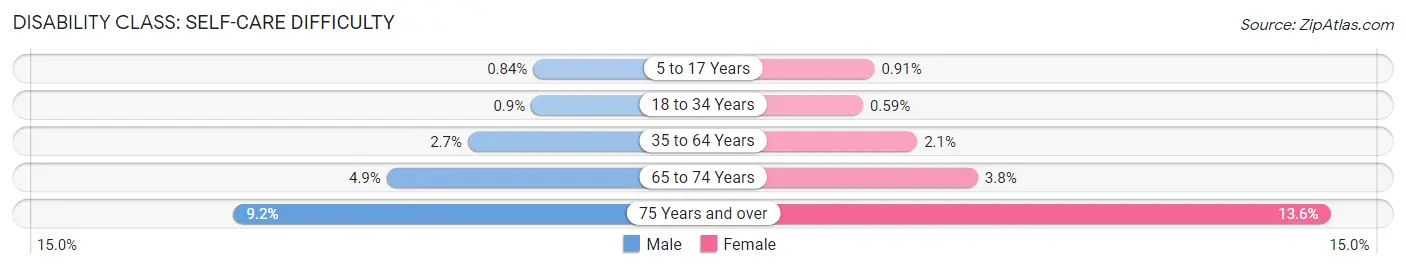
| Age Bracket | Male | Female |
| 5 to 17 Years | 526 (0.8%) | 549 (0.9%) |
| 18 to 34 Years | 686 (0.9%) | 474 (0.6%) |
| 35 to 64 Years | 3,556 (2.7%) | 3,095 (2.1%) |
| 65 to 74 Years | 1,896 (4.9%) | 1,658 (3.8%) |
| 75 Years and over | 2,046 (9.2%) | 4,333 (13.6%) |
Technology Access in Area Code 251
Computing Device Access in Area Code 251
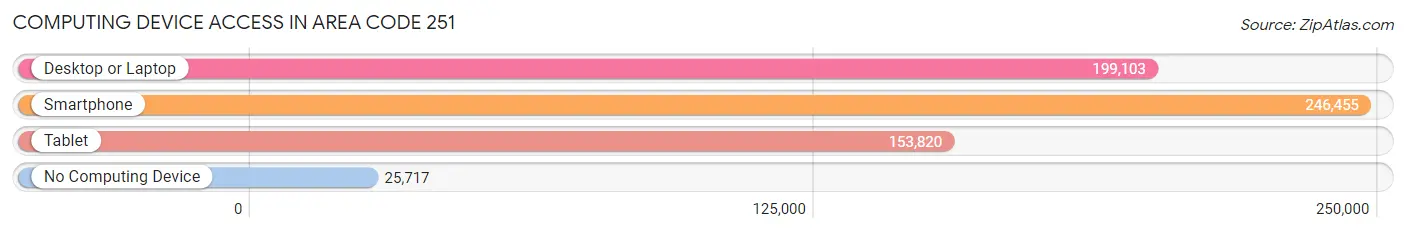
| Device Type | # Households | % Households |
| Desktop or Laptop | 199,103 | 69.0% |
| Smartphone | 246,455 | 85.4% |
| Tablet | 153,820 | 53.3% |
| No Computing Device | 25,717 | 8.9% |
| Total | 288,514 | 100.0% |
Internet Access in Area Code 251
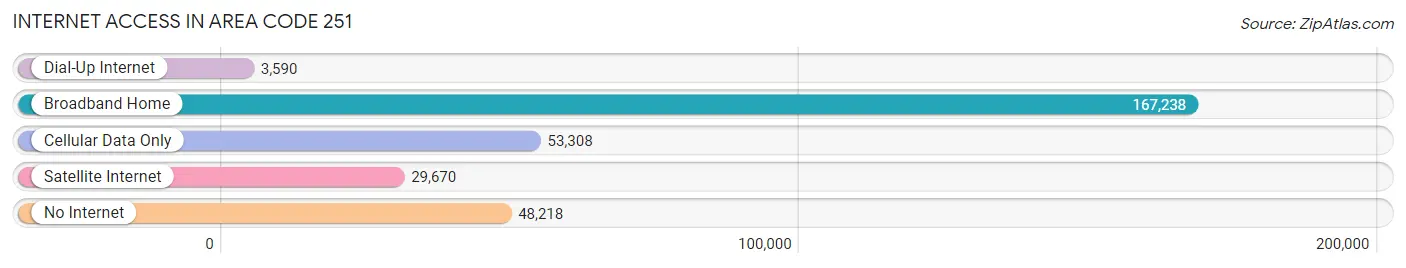
| Internet Type | # Households | % Households |
| Dial-Up Internet | 3,590 | 1.2% |
| Broadband Home | 167,238 | 58.0% |
| Cellular Data Only | 53,308 | 18.5% |
| Satellite Internet | 29,670 | 10.3% |
| No Internet | 48,218 | 16.7% |
| Total | 288,514 | 100.0% |
Area Code 251 Summary
Geography
Area code 251 is a telephone area code in the North American Numbering Plan (NANP) for the southern part of the U.S. state of Alabama. It serves the Mobile metropolitan area, including the cities of Mobile, Prichard, Saraland, Satsuma, and Bay Minette.
Social
Area code 251 is a vibrant and diverse area with a rich cultural history. The area is home to a variety of attractions, including the USS Alabama Battleship Memorial Park, the Mobile Carnival Museum, and the Mobile Botanical Gardens. The area is also home to a number of festivals and events, such as the Mobile Mardi Gras and the BayFest Music Festival.
Economics
Area code 251 is an economically diverse area, with a variety of industries and businesses. The area is home to a number of large employers, such as the University of South Alabama, the Mobile County Public School System, and the Mobile Area Chamber of Commerce. The area is also home to a number of small businesses, such as restaurants, retail stores, and service providers.
Demographics
Area code 251 is home to a diverse population, with a variety of ethnic and racial backgrounds. According to the 2010 U.S. Census, the population of the area is approximately 545,000, with a median age of 36. The area is also home to a variety of religious denominations, including Christianity, Judaism, and Islam.
Common Questions
What is Per Capita Income in Area Code 251?
Per Capita income in Area Code 251 is $31,556.
What is the Median Family Income in Area Code 251?
Median Family Income in Area Code 251 is $70,996.
What is the Median Household income in Area Code 251?
Median Household Income in Area Code 251 is $56,678.
What is Income or Wage Gap in Area Code 251?
Income or Wage Gap in Area Code 251 is 35.7%.
Women in Area Code 251 earn 64.3 cents for every dollar earned by a man.
What is Family Income Deficit in Area Code 251?
Family Income Deficit in Area Code 251 is $11,835.
Families that are below poverty line in Area Code 251 earn $11,835 less on average than the poverty threshold level.
What is Inequality or Gini Index in Area Code 251?
Inequality or Gini Index in Area Code 251 is 41.58.
What is the Total Population of Area Code 251?
Total Population of Area Code 251 is 752,045.
What is the Total Male Population of Area Code 251?
Total Male Population of Area Code 251 is 364,634.
What is the Total Female Population of Area Code 251?
Total Female Population of Area Code 251 is 387,411.
What is the Ratio of Males per 100 Females in Area Code 251?
There are 94.12 Males per 100 Females in Area Code 251.
What is the Ratio of Females per 100 Males in Area Code 251?
There are 106.25 Females per 100 Males in Area Code 251.
What is the Median Population Age in Area Code 251?
Median Population Age in Area Code 251 is 44.2 Years.
What is the Average Family Size in Area Code 251
Average Family Size in Area Code 251 is 3.2 People.
What is the Average Household Size in Area Code 251
Average Household Size in Area Code 251 is 2.6 People.
How Large is the Labor Force in Area Code 251?
There are 308,250 People in the Labor Forcein in Area Code 251.
What is the Percentage of People in the Labor Force in Area Code 251?
51.1% of People are in the Labor Force in Area Code 251.
What is the Unemployment Rate in Area Code 251?
Unemployment Rate in Area Code 251 is 7.1%.