Area Code 225 Map & Demographics
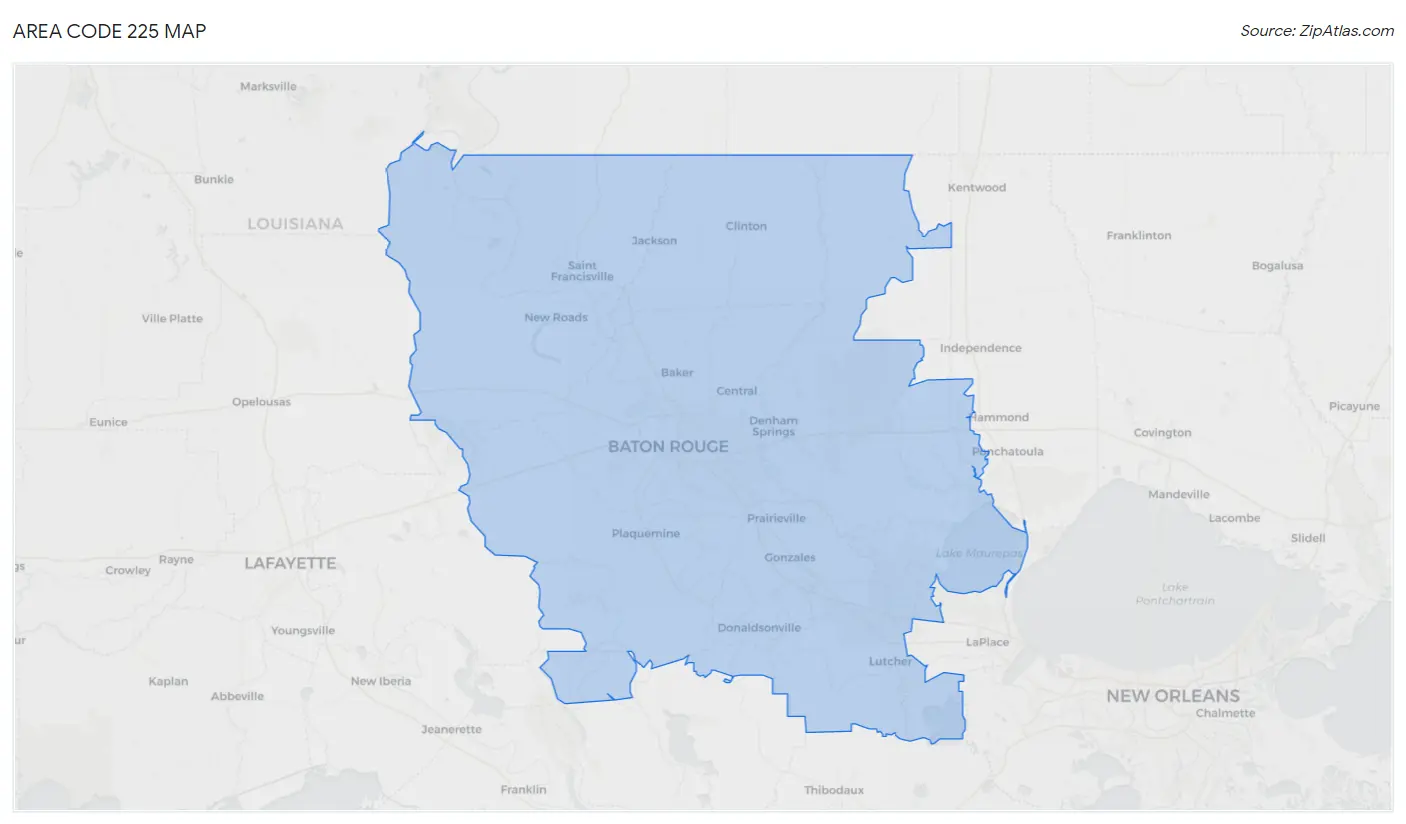
Area Code 225 Map
Area Code 225 Overview
$33,227
PER CAPITA INCOME
$81,913
AVG FAMILY INCOME
$67,928
AVG HOUSEHOLD INCOME
34.3%
WAGE / INCOME GAP [ % ]
65.7¢/ $1
WAGE / INCOME GAP [ $ ]
$10,924
FAMILY INCOME DEFICIT
34.98
INEQUALITY / GINI INDEX
885,458
TOTAL POPULATION
434,579
MALE POPULATION
450,879
FEMALE POPULATION
96.38
MALES / 100 FEMALES
103.75
FEMALES / 100 MALES
39.2
MEDIAN AGE
3.2
AVG FAMILY SIZE
2.6
AVG HOUSEHOLD SIZE
415,303
LABOR FORCE [ PEOPLE ]
58.9%
PERCENT IN LABOR FORCE
8.5%
UNEMPLOYMENT RATE
Income in Area Code 225
Income Overview in Area Code 225
Per Capita Income in Area Code 225 is $33,227, while median incomes of families and households are $81,913 and $67,928 respectively.
| Characteristic | Number | Measure |
| Per Capita Income | 885,458 | $33,227 |
| Median Family Income | 211,971 | $81,913 |
| Mean Family Income | 211,971 | $7,778,129 |
| Median Household Income | 327,134 | $67,928 |
| Mean Household Income | 327,134 | $6,926,364 |
| Income Deficit | 211,971 | $10,924 |
| Wage / Income Gap (%) | 885,458 | 34.34% |
| Wage / Income Gap ($) | 885,458 | 65.66¢ per $1 |
| Gini / Inequality Index | 885,458 | 34.98 |
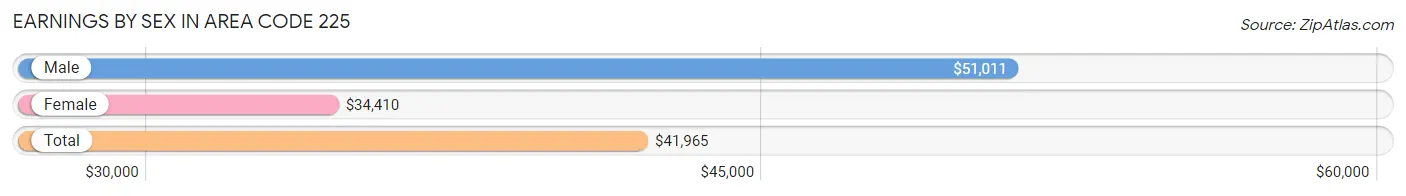
Earnings by Sex in Area Code 225
Average Earnings in Area Code 225 are $41,965, $51,011 for men and $34,410 for women, a difference of 32.5%.
| Sex | Number | Average Earnings |
| Male | 235,853 (51.8%) | $51,011 |
| Female | 219,714 (48.2%) | $34,410 |
| Total | 455,567 (100.0%) | $41,965 |
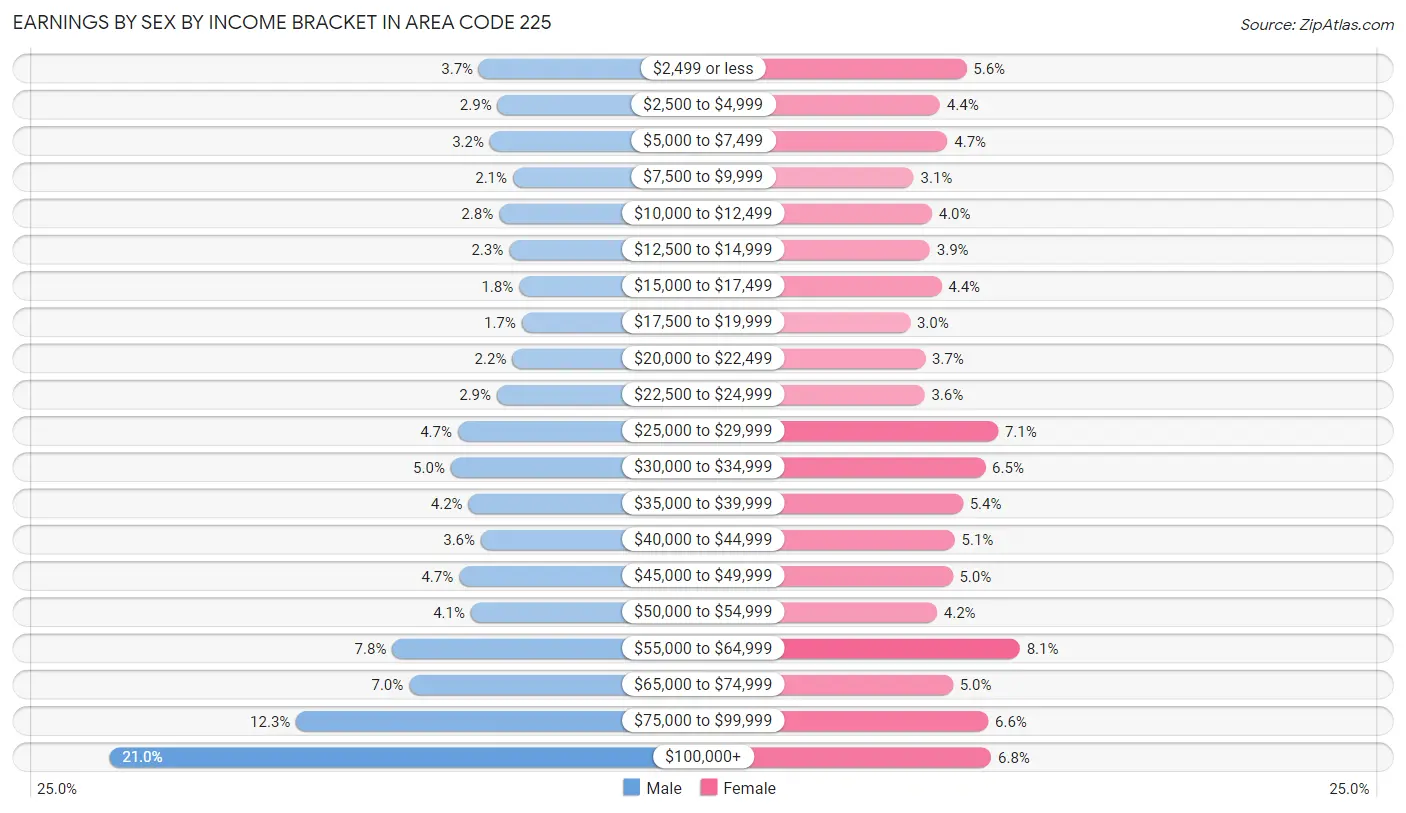
Earnings by Sex by Income Bracket in Area Code 225
The most common earnings brackets in Area Code 225 are $100,000+ for men (49,594 | 21.0%) and $55,000 to $64,999 for women (17,786 | 8.1%).
| Income | Male | Female |
| $2,499 or less | 8,770 (3.7%) | 12,296 (5.6%) |
| $2,500 to $4,999 | 6,717 (2.9%) | 9,584 (4.4%) |
| $5,000 to $7,499 | 7,565 (3.2%) | 10,357 (4.7%) |
| $7,500 to $9,999 | 5,030 (2.1%) | 6,882 (3.1%) |
| $10,000 to $12,499 | 6,561 (2.8%) | 8,737 (4.0%) |
| $12,500 to $14,999 | 5,441 (2.3%) | 8,545 (3.9%) |
| $15,000 to $17,499 | 4,328 (1.8%) | 9,739 (4.4%) |
| $17,500 to $19,999 | 4,047 (1.7%) | 6,506 (3.0%) |
| $20,000 to $22,499 | 5,105 (2.2%) | 8,044 (3.7%) |
| $22,500 to $24,999 | 6,781 (2.9%) | 7,995 (3.6%) |
| $25,000 to $29,999 | 11,108 (4.7%) | 15,558 (7.1%) |
| $30,000 to $34,999 | 11,878 (5.0%) | 14,247 (6.5%) |
| $35,000 to $39,999 | 9,927 (4.2%) | 11,920 (5.4%) |
| $40,000 to $44,999 | 8,558 (3.6%) | 11,090 (5.1%) |
| $45,000 to $49,999 | 10,970 (4.6%) | 10,867 (5.0%) |
| $50,000 to $54,999 | 9,670 (4.1%) | 9,268 (4.2%) |
| $55,000 to $64,999 | 18,344 (7.8%) | 17,786 (8.1%) |
| $65,000 to $74,999 | 16,491 (7.0%) | 10,893 (5.0%) |
| $75,000 to $99,999 | 28,968 (12.3%) | 14,538 (6.6%) |
| $100,000+ | 49,594 (21.0%) | 14,862 (6.8%) |
| Total | 235,853 (100.0%) | 219,714 (100.0%) |
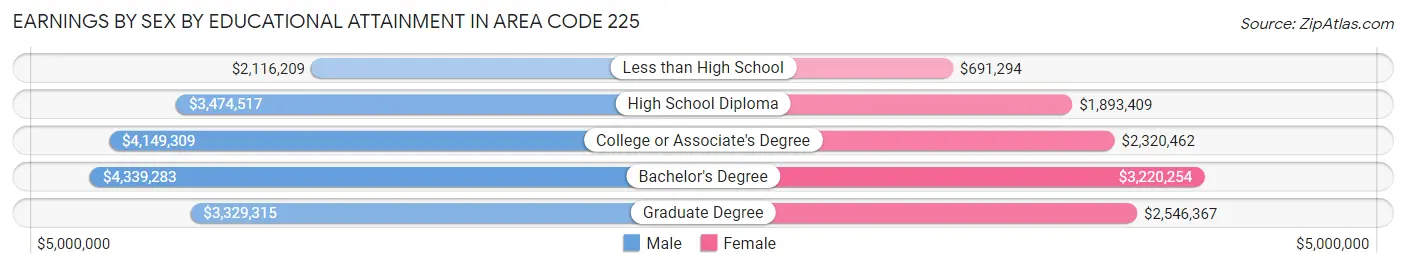
Earnings by Sex by Educational Attainment in Area Code 225
Average earnings in Area Code 225 are $4,145,784 for men and $2,905,340 for women, a difference of 29.9%. Men with an educational attainment of bachelor's degree enjoy the highest average annual earnings of $4,339,283, while those with less than high school education earn the least with $2,116,209. Women with an educational attainment of bachelor's degree earn the most with the average annual earnings of $3,220,254, while those with less than high school education have the smallest earnings of $691,294.
| Educational Attainment | Male Income | Female Income |
| Less than High School | $2,116,209 | $691,294 |
| High School Diploma | $3,474,517 | $1,893,409 |
| College or Associate's Degree | $4,149,309 | $2,320,462 |
| Bachelor's Degree | $4,339,283 | $3,220,254 |
| Graduate Degree | $3,329,315 | $2,546,367 |
| Total | $4,145,784 | $2,905,340 |
Family Income in Area Code 225
Family Income Brackets in Area Code 225
According to the Area Code 225 family income data, there are 3,394,080 families falling into the $100,000 to $149,999 income range, which is the most common income bracket and makes up 1,601.2% of all families. Conversely, the $10,000 to $14,999 income bracket is the least frequent group with only 447,683 families (211.2%) belonging to this category.
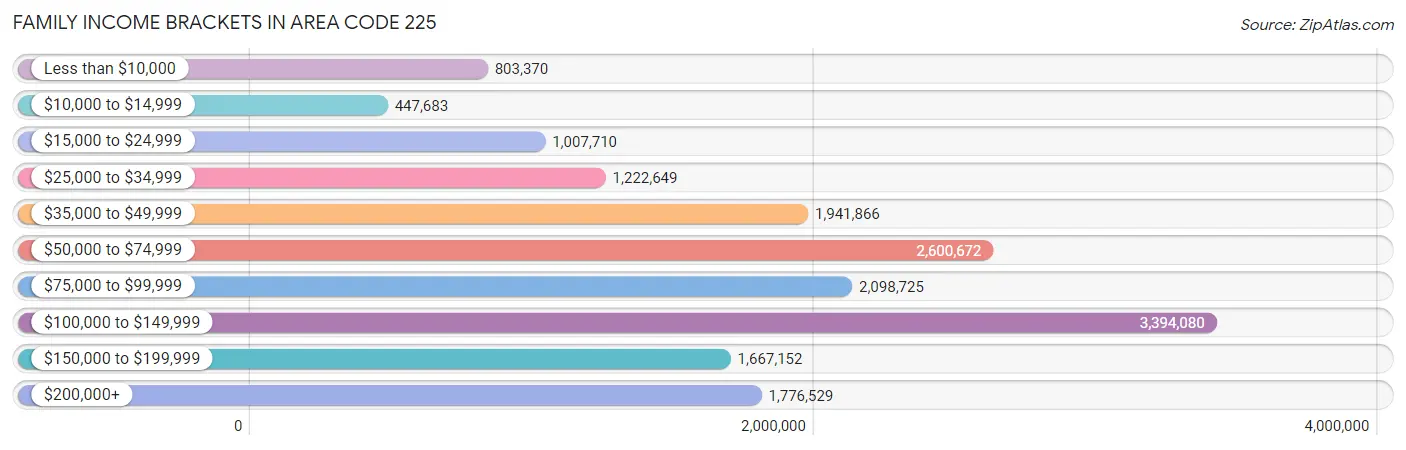
| Income Bracket | # Families | % Families |
| Less than $10,000 | 803,370 | 379.0% |
| $10,000 to $14,999 | 447,683 | 211.2% |
| $15,000 to $24,999 | 1,007,710 | 475.4% |
| $25,000 to $34,999 | 1,222,649 | 576.8% |
| $35,000 to $49,999 | 1,941,866 | 916.1% |
| $50,000 to $74,999 | 2,600,672 | 1,226.9% |
| $75,000 to $99,999 | 2,098,725 | 990.1% |
| $100,000 to $149,999 | 3,394,080 | 1,601.2% |
| $150,000 to $199,999 | 1,667,152 | 786.5% |
| $200,000+ | 1,776,529 | 838.1% |
Family Income by Famaliy Size in Area Code 225
7+ person families (2,811 | 1.3%) account for the highest median family income in Area Code 225 with $146,708 per family, while 2-person families (100,417 | 47.4%) have the highest median income of $34,654 per family member.
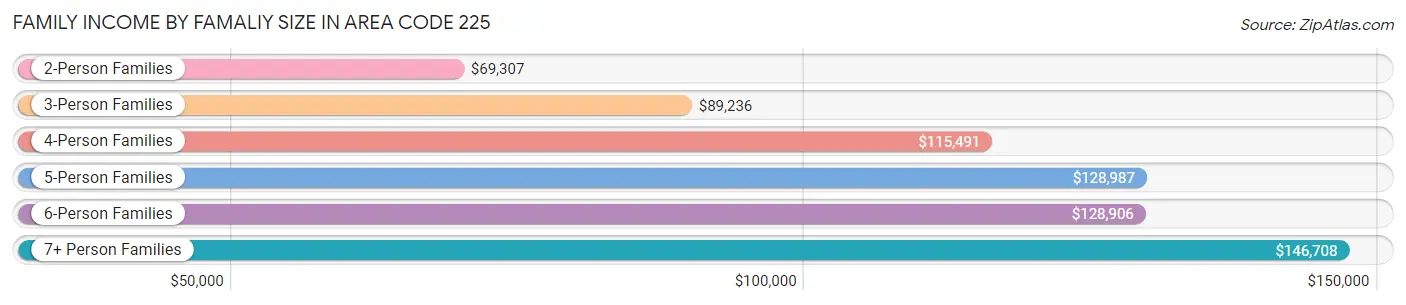
| Income Bracket | # Families | Median Income |
| 2-Person Families | 100,417 (47.4%) | $69,307 |
| 3-Person Families | 48,325 (22.8%) | $89,236 |
| 4-Person Families | 38,514 (18.2%) | $115,491 |
| 5-Person Families | 16,867 (8.0%) | $128,987 |
| 6-Person Families | 5,037 (2.4%) | $128,906 |
| 7+ Person Families | 2,811 (1.3%) | $146,708 |
| Total | 211,971 (100.0%) | $81,913 |
Family Income by Number of Earners in Area Code 225
The median family income in Area Code 225 is $81,913, with families comprising 3+ earners (19,723) having the highest median family income of $151,685, while families with no earners (32,558) have the lowest median family income of $43,094, accounting for 9.3% and 15.4% of families, respectively.
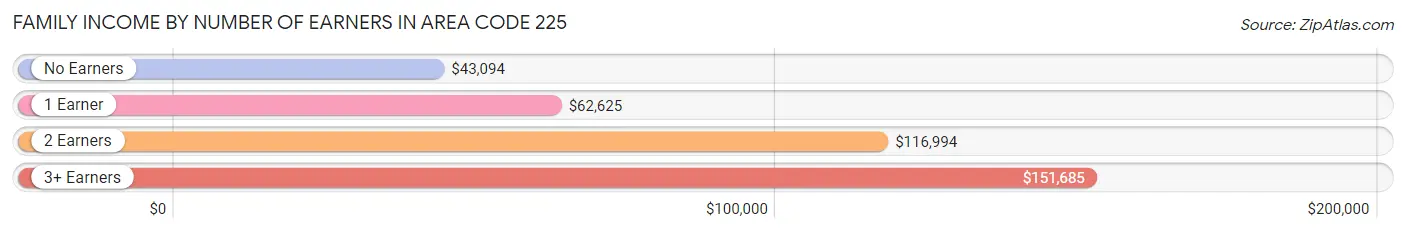
| Number of Earners | # Families | Median Income |
| No Earners | 32,558 (15.4%) | $43,094 |
| 1 Earner | 73,401 (34.6%) | $62,625 |
| 2 Earners | 86,289 (40.7%) | $116,994 |
| 3+ Earners | 19,723 (9.3%) | $151,685 |
| Total | 211,971 (100.0%) | $81,913 |
Household Income in Area Code 225
Household Income Brackets in Area Code 225
With 4,331,581 households falling in the category, the $100,000 to $149,999 income range is the most frequent in Area Code 225, accounting for 1,324.1% of all households. In contrast, only 1,393,918 households (426.1%) fall into the $10,000 to $14,999 income bracket, making it the least populous group.
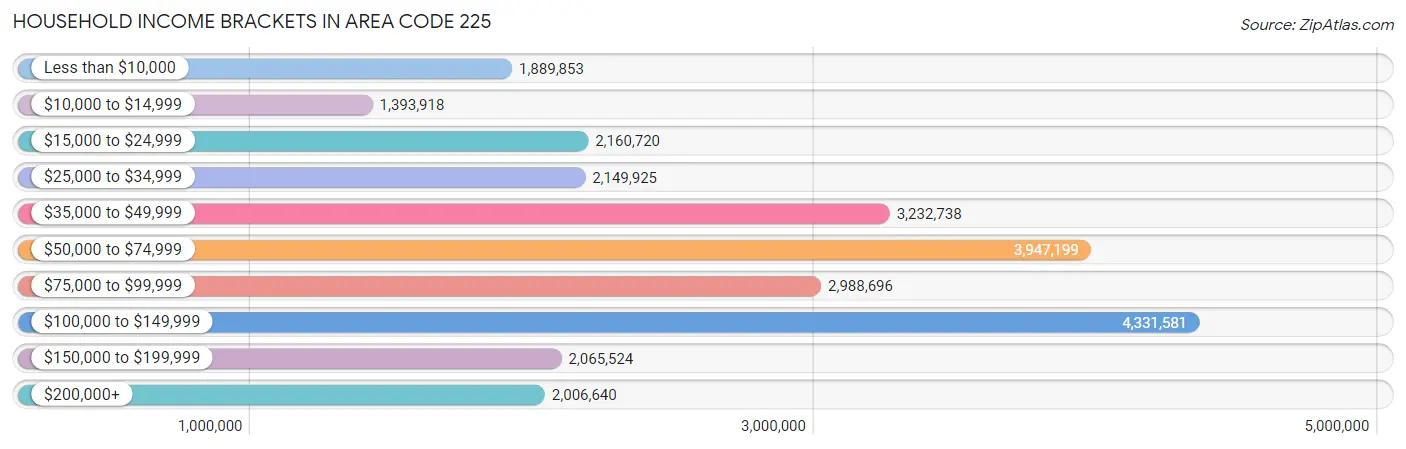
| Income Bracket | # Households | % Households |
| Less than $10,000 | 1,889,853 | 577.7% |
| $10,000 to $14,999 | 1,393,918 | 426.1% |
| $15,000 to $24,999 | 2,160,720 | 660.5% |
| $25,000 to $34,999 | 2,149,925 | 657.2% |
| $35,000 to $49,999 | 3,232,738 | 988.2% |
| $50,000 to $74,999 | 3,947,199 | 1,206.6% |
| $75,000 to $99,999 | 2,988,696 | 913.6% |
| $100,000 to $149,999 | 4,331,581 | 1,324.1% |
| $150,000 to $199,999 | 2,065,524 | 631.4% |
| $200,000+ | 2,006,640 | 613.4% |
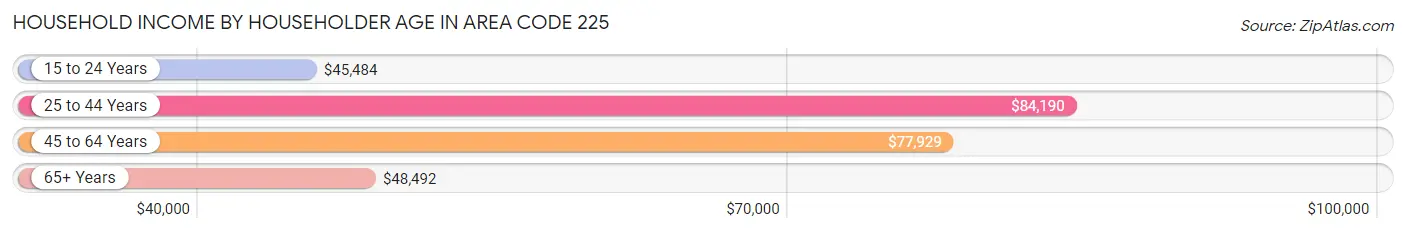
Household Income by Householder Age in Area Code 225
The median household income in Area Code 225 is $67,928, with the highest median household income of $84,190 found in the 25 to 44 years age bracket for the primary householder. A total of 111,972 households (34.2%) fall into this category. Meanwhile, the 15 to 24 years age bracket for the primary householder has the lowest median household income of $45,484, with 18,117 households (5.5%) in this group.
| Income Bracket | # Households | Median Income |
| 15 to 24 Years | 18,117 (5.5%) | $45,484 |
| 25 to 44 Years | 111,972 (34.2%) | $84,190 |
| 45 to 64 Years | 115,341 (35.3%) | $77,929 |
| 65+ Years | 81,704 (25.0%) | $48,492 |
| Total | 327,134 (100.0%) | $67,928 |
Poverty in Area Code 225
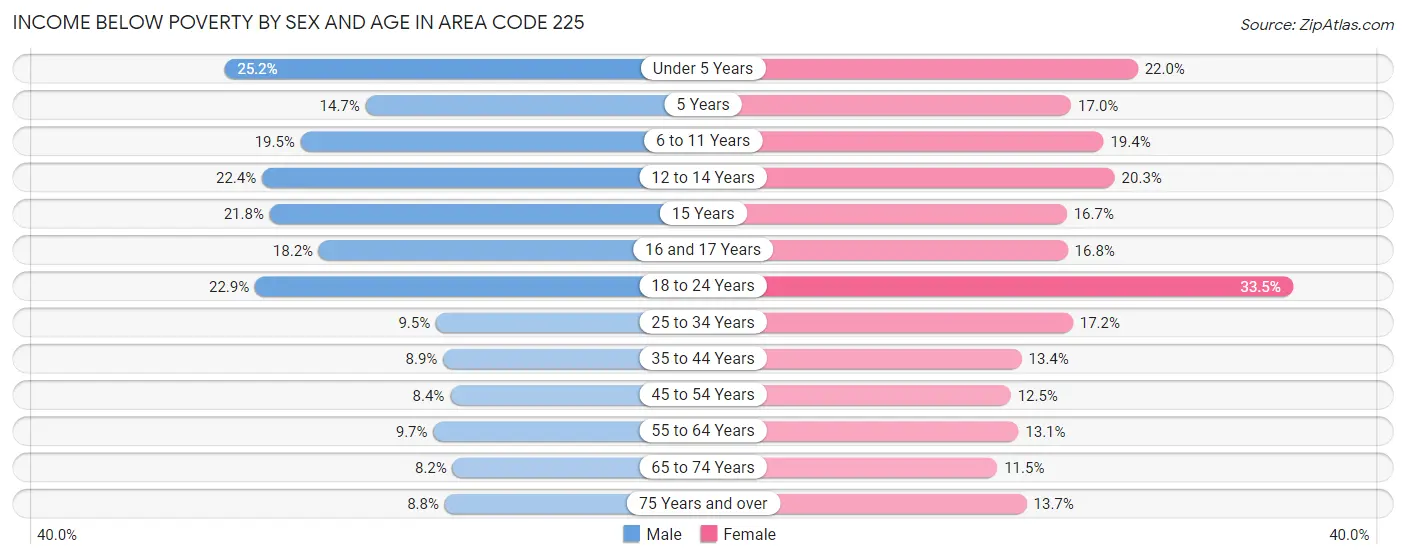
Income Below Poverty by Sex and Age in Area Code 225
With 13.6% poverty level for males and 17.1% for females among the residents of Area Code 225, under 5 year old males and 18 to 24 year old females are the most vulnerable to poverty, with 6,945 males (25.2%) and 15,528 females (33.5%) in their respective age groups living below the poverty level.
| Age Bracket | Male | Female |
| Under 5 Years | 6,945 (25.2%) | 5,885 (22.0%) |
| 5 Years | 951 (14.7%) | 958 (17.0%) |
| 6 to 11 Years | 6,582 (19.5%) | 6,237 (19.4%) |
| 12 to 14 Years | 3,854 (22.4%) | 3,615 (20.3%) |
| 15 Years | 1,262 (21.8%) | 916 (16.7%) |
| 16 and 17 Years | 2,240 (18.1%) | 1,919 (16.8%) |
| 18 to 24 Years | 10,800 (22.9%) | 15,528 (33.5%) |
| 25 to 34 Years | 5,491 (9.5%) | 10,286 (17.2%) |
| 35 to 44 Years | 5,001 (8.9%) | 7,823 (13.4%) |
| 45 to 54 Years | 4,096 (8.4%) | 6,417 (12.5%) |
| 55 to 64 Years | 4,747 (9.7%) | 7,156 (13.1%) |
| 65 to 74 Years | 2,953 (8.2%) | 4,930 (11.5%) |
| 75 Years and over | 1,713 (8.8%) | 3,923 (13.7%) |
| Total | 56,635 (13.6%) | 75,593 (17.1%) |
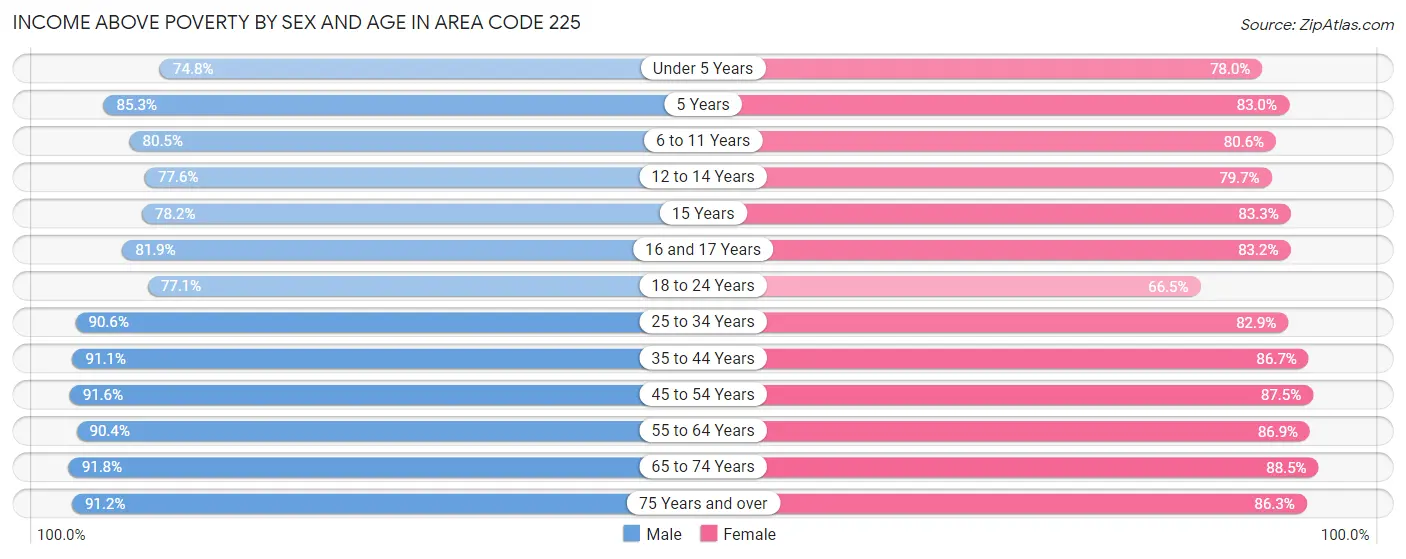
Income Above Poverty by Sex and Age in Area Code 225
According to the poverty statistics in Area Code 225, males aged 65 to 74 years and females aged 65 to 74 years are the age groups that are most secure financially, with 91.8% of males and 88.5% of females in these age groups living above the poverty line.
| Age Bracket | Male | Female |
| Under 5 Years | 20,648 (74.8%) | 20,901 (78.0%) |
| 5 Years | 5,525 (85.3%) | 4,666 (83.0%) |
| 6 to 11 Years | 27,177 (80.5%) | 25,859 (80.6%) |
| 12 to 14 Years | 13,375 (77.6%) | 14,232 (79.7%) |
| 15 Years | 4,526 (78.2%) | 4,569 (83.3%) |
| 16 and 17 Years | 10,101 (81.9%) | 9,525 (83.2%) |
| 18 to 24 Years | 36,379 (77.1%) | 30,866 (66.5%) |
| 25 to 34 Years | 52,637 (90.5%) | 49,680 (82.9%) |
| 35 to 44 Years | 51,089 (91.1%) | 50,798 (86.7%) |
| 45 to 54 Years | 44,674 (91.6%) | 44,769 (87.5%) |
| 55 to 64 Years | 44,439 (90.3%) | 47,412 (86.9%) |
| 65 to 74 Years | 32,966 (91.8%) | 37,794 (88.5%) |
| 75 Years and over | 17,745 (91.2%) | 24,670 (86.3%) |
| Total | 361,281 (86.5%) | 365,741 (82.9%) |
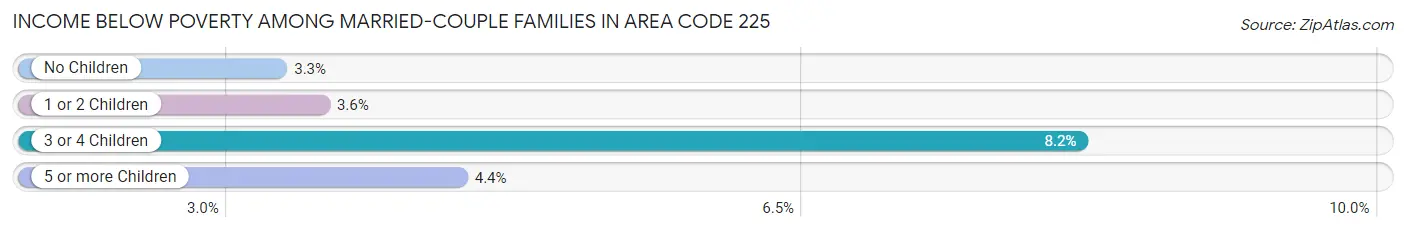
Income Below Poverty Among Married-Couple Families in Area Code 225
The poverty statistics for married-couple families in Area Code 225 show that 3.8% or 5,410 of the total 143,860 families live below the poverty line. Families with 3 or 4 children have the highest poverty rate of 8.2%, comprising of 880 families. On the other hand, families with no children have the lowest poverty rate of 3.3%, which includes 2,800 families.
| Children | Above Poverty | Below Poverty |
| No Children | 81,994 (96.7%) | 2,800 (3.3%) |
| 1 or 2 Children | 45,529 (96.4%) | 1,682 (3.6%) |
| 3 or 4 Children | 9,884 (91.8%) | 880 (8.2%) |
| 5 or more Children | 1,043 (95.6%) | 48 (4.4%) |
| Total | 138,450 (96.2%) | 5,410 (3.8%) |
Income Below Poverty Among Single-Parent Households in Area Code 225
According to the poverty data in Area Code 225, 16.1% or 2,813 single-father households and 28.8% or 14,614 single-mother households are living below the poverty line. Among single-father households, those with 5 or more children have the highest poverty rate, with 55 households (52.4%) experiencing poverty. Likewise, among single-mother households, those with 5 or more children have the highest poverty rate, with 388 households (88.0%) falling below the poverty line.
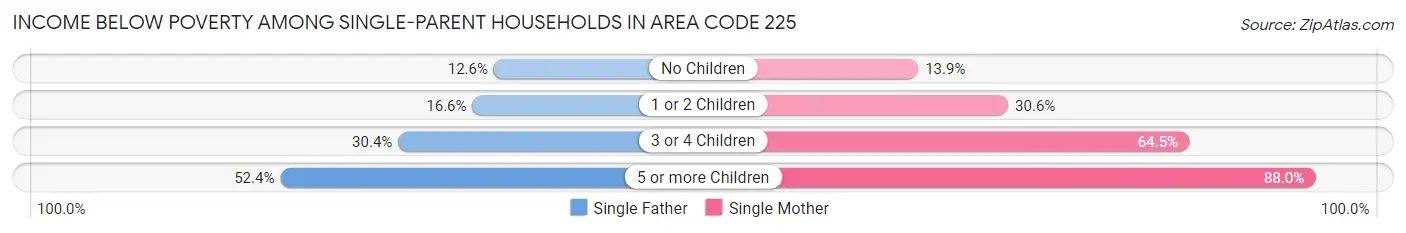
| Children | Single Father | Single Mother |
| No Children | 944 (12.6%) | 2,562 (13.9%) |
| 1 or 2 Children | 1,414 (16.6%) | 8,004 (30.6%) |
| 3 or 4 Children | 400 (30.4%) | 3,660 (64.5%) |
| 5 or more Children | 55 (52.4%) | 388 (88.0%) |
| Total | 2,813 (16.1%) | 14,614 (28.8%) |
Income Below Poverty Among Married-Couple vs Single-Parent Households in Area Code 225
The poverty data for Area Code 225 shows that 5,410 of the married-couple family households (3.8%) and 17,427 of the single-parent households (25.6%) are living below the poverty level. Within the married-couple family households, those with 3 or 4 children have the highest poverty rate, with 880 households (8.2%) falling below the poverty line. Among the single-parent households, those with 5 or more children have the highest poverty rate, with 443 household (81.1%) living below poverty.
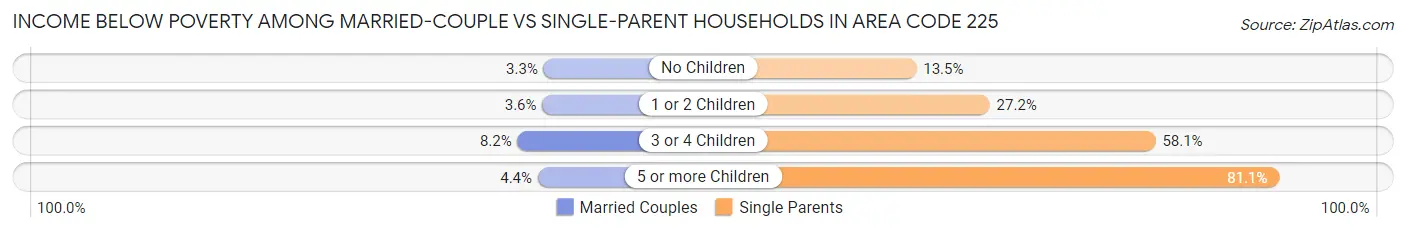
| Children | Married-Couple Families | Single-Parent Households |
| No Children | 2,800 (3.3%) | 3,506 (13.5%) |
| 1 or 2 Children | 1,682 (3.6%) | 9,418 (27.2%) |
| 3 or 4 Children | 880 (8.2%) | 4,060 (58.1%) |
| 5 or more Children | 48 (4.4%) | 443 (81.1%) |
| Total | 5,410 (3.8%) | 17,427 (25.6%) |
Race in Area Code 225
The most populous races in Area Code 225 are White / Caucasian (494,074 | 55.8%), Black / African American (317,314 | 35.8%), and Hispanic or Latino (38,436 | 4.3%).
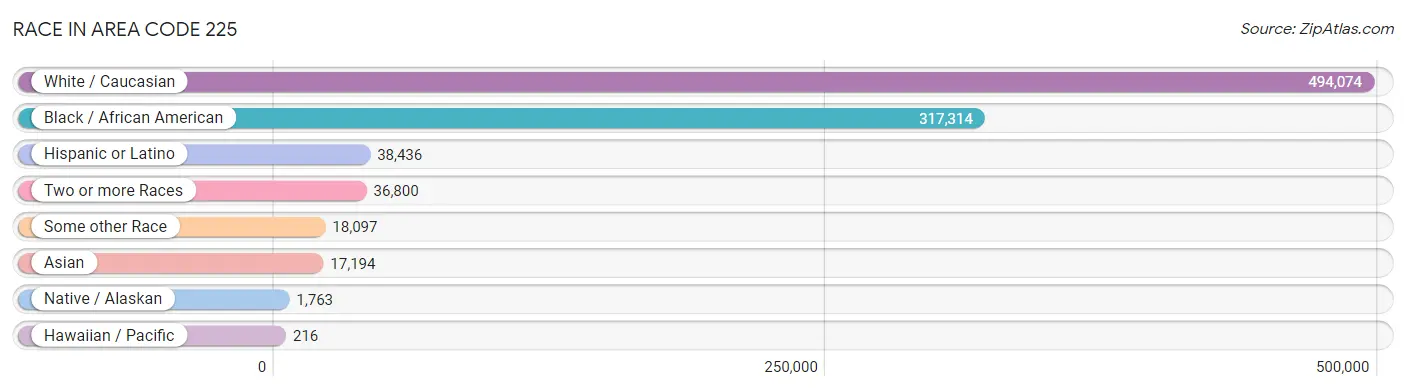
| Race | # Population | % Population |
| Asian | 17,194 | 1.9% |
| Black / African American | 317,314 | 35.8% |
| Hawaiian / Pacific | 216 | 0.0% |
| Hispanic or Latino | 38,436 | 4.3% |
| Native / Alaskan | 1,763 | 0.2% |
| White / Caucasian | 494,074 | 55.8% |
| Two or more Races | 36,800 | 4.2% |
| Some other Race | 18,097 | 2.0% |
| Total | 885,458 | 100.0% |
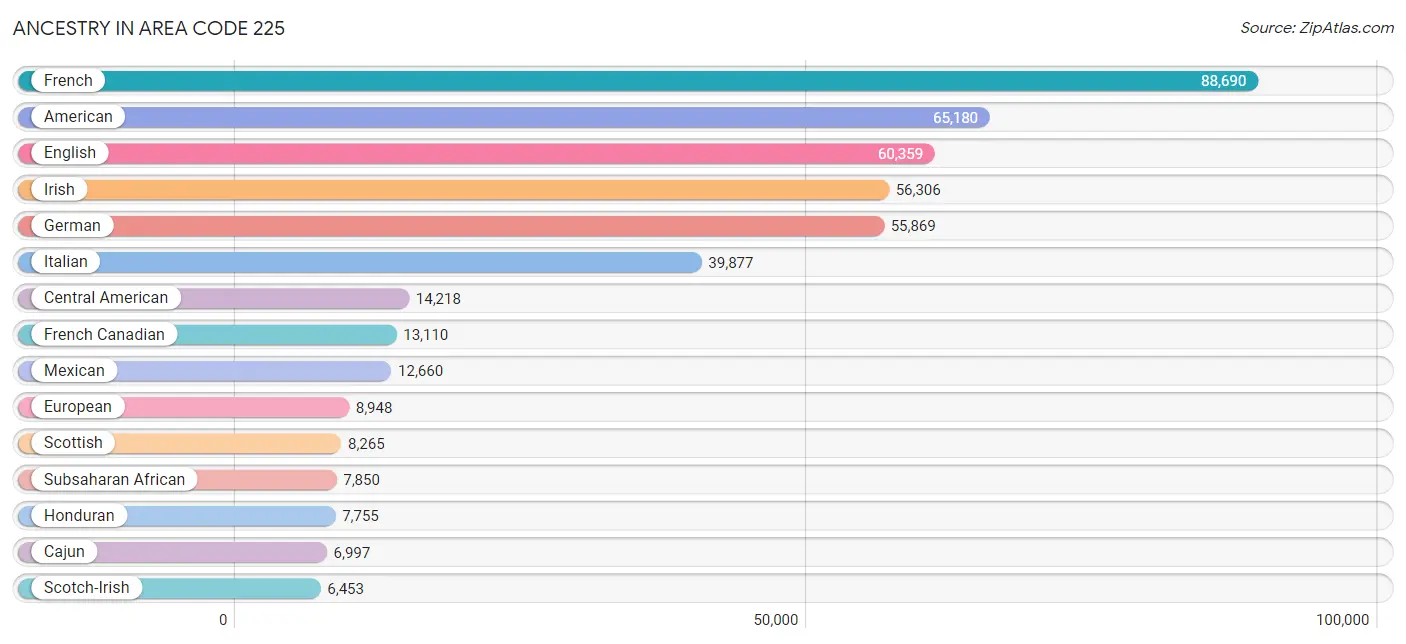
Ancestry in Area Code 225
The most populous ancestries reported in Area Code 225 are French (88,690 | 10.0%), American (65,180 | 7.4%), English (60,359 | 6.8%), Irish (56,306 | 6.4%), and German (55,869 | 6.3%), together accounting for 36.9% of all Area Code 225 residents.
| Ancestry | # Population | % Population |
| Afghan | 31 | 0.0% |
| African | 5,866 | 0.7% |
| Alaska Native | 34 | 0.0% |
| American | 65,180 | 7.4% |
| Apache | 80 | 0.0% |
| Arab | 4,330 | 0.5% |
| Argentinean | 32 | 0.0% |
| Armenian | 106 | 0.0% |
| Australian | 168 | 0.0% |
| Austrian | 247 | 0.0% |
| Bahamian | 8 | 0.0% |
| Basque | 22 | 0.0% |
| Belgian | 576 | 0.1% |
| Belizean | 71 | 0.0% |
| Bhutanese | 1,135 | 0.1% |
| Blackfeet | 221 | 0.0% |
| Bolivian | 10 | 0.0% |
| Brazilian | 861 | 0.1% |
| British | 2,291 | 0.3% |
| Bulgarian | 128 | 0.0% |
| Burmese | 1,203 | 0.1% |
| Cajun | 6,997 | 0.8% |
| Canadian | 429 | 0.1% |
| Cape Verdean | 20 | 0.0% |
| Celtic | 22 | 0.0% |
| Central American | 14,218 | 1.6% |
| Central American Indian | 246 | 0.0% |
| Cherokee | 1,471 | 0.2% |
| Chickasaw | 144 | 0.0% |
| Chilean | 121 | 0.0% |
| Choctaw | 1,068 | 0.1% |
| Colombian | 769 | 0.1% |
| Comanche | 8 | 0.0% |
| Costa Rican | 288 | 0.0% |
| Creek | 70 | 0.0% |
| Croatian | 235 | 0.0% |
| Crow | 9 | 0.0% |
| Cuban | 1,543 | 0.2% |
| Czech | 616 | 0.1% |
| Czechoslovakian | 222 | 0.0% |
| Danish | 361 | 0.0% |
| Dominican | 407 | 0.1% |
| Dutch | 2,705 | 0.3% |
| Eastern European | 754 | 0.1% |
| Ecuadorian | 118 | 0.0% |
| Egyptian | 426 | 0.1% |
| English | 60,359 | 6.8% |
| Estonian | 127 | 0.0% |
| Ethiopian | 61 | 0.0% |
| European | 8,948 | 1.0% |
| Filipino | 192 | 0.0% |
| Finnish | 320 | 0.0% |
| French | 88,690 | 10.0% |
| French American Indian | 218 | 0.0% |
| French Canadian | 13,110 | 1.5% |
| German | 55,869 | 6.3% |
| Ghanaian | 209 | 0.0% |
| Greek | 991 | 0.1% |
| Guamanian / Chamorro | 54 | 0.0% |
| Guatemalan | 1,884 | 0.2% |
| Guyanese | 223 | 0.0% |
| Haitian | 390 | 0.0% |
| Honduran | 7,755 | 0.9% |
| Houma | 785 | 0.1% |
| Hungarian | 1,612 | 0.2% |
| Indian (Asian) | 4,122 | 0.5% |
| Iranian | 610 | 0.1% |
| Iraqi | 132 | 0.0% |
| Irish | 56,306 | 6.4% |
| Iroquois | 289 | 0.0% |
| Israeli | 489 | 0.1% |
| Italian | 39,877 | 4.5% |
| Jamaican | 585 | 0.1% |
| Japanese | 18 | 0.0% |
| Jordanian | 103 | 0.0% |
| Kiowa | 53 | 0.0% |
| Korean | 3,503 | 0.4% |
| Laotian | 493 | 0.1% |
| Latvian | 8 | 0.0% |
| Lebanese | 1,629 | 0.2% |
| Lithuanian | 362 | 0.0% |
| Lumbee | 23 | 0.0% |
| Macedonian | 28 | 0.0% |
| Malaysian | 545 | 0.1% |
| Maltese | 14 | 0.0% |
| Menominee | 43 | 0.0% |
| Mexican | 12,660 | 1.4% |
| Mexican American Indian | 381 | 0.0% |
| Mongolian | 13 | 0.0% |
| Moroccan | 85 | 0.0% |
| Native Hawaiian | 509 | 0.1% |
| Navajo | 157 | 0.0% |
| Nicaraguan | 1,133 | 0.1% |
| Nigerian | 1,093 | 0.1% |
| Northern European | 819 | 0.1% |
| Norwegian | 2,167 | 0.2% |
| Paiute | 3 | 0.0% |
| Pakistani | 215 | 0.0% |
| Palestinian | 213 | 0.0% |
| Panamanian | 125 | 0.0% |
| Paraguayan | 1 | 0.0% |
| Pennsylvania German | 44 | 0.0% |
| Peruvian | 124 | 0.0% |
| Polish | 3,479 | 0.4% |
| Portuguese | 520 | 0.1% |
| Potawatomi | 32 | 0.0% |
| Pueblo | 51 | 0.0% |
| Puerto Rican | 1,760 | 0.2% |
| Romanian | 275 | 0.0% |
| Russian | 978 | 0.1% |
| Salvadoran | 2,716 | 0.3% |
| Samoan | 58 | 0.0% |
| Scandinavian | 1,169 | 0.1% |
| Scotch-Irish | 6,453 | 0.7% |
| Scottish | 8,265 | 0.9% |
| Seminole | 3 | 0.0% |
| Serbian | 10 | 0.0% |
| Sierra Leonean | 4 | 0.0% |
| Sioux | 224 | 0.0% |
| Slavic | 31 | 0.0% |
| Slovak | 321 | 0.0% |
| Slovene | 44 | 0.0% |
| South African | 11 | 0.0% |
| South American | 1,588 | 0.2% |
| South American Indian | 50 | 0.0% |
| Spaniard | 1,266 | 0.1% |
| Spanish | 3,036 | 0.3% |
| Spanish American | 26 | 0.0% |
| Spanish American Indian | 73 | 0.0% |
| Sri Lankan | 6,238 | 0.7% |
| Subsaharan African | 7,850 | 0.9% |
| Sudanese | 22 | 0.0% |
| Swedish | 2,866 | 0.3% |
| Swiss | 907 | 0.1% |
| Syrian | 108 | 0.0% |
| Thai | 3,548 | 0.4% |
| Trinidadian and Tobagonian | 143 | 0.0% |
| Turkish | 326 | 0.0% |
| Ugandan | 106 | 0.0% |
| Ukrainian | 670 | 0.1% |
| Ute | 4 | 0.0% |
| Venezuelan | 413 | 0.1% |
| Vietnamese | 143 | 0.0% |
| Welsh | 3,092 | 0.4% |
| West Indian | 291 | 0.0% |
| Yugoslavian | 76 | 0.0% |
| Zimbabwean | 22 | 0.0% | View All 147 Rows |
Immigrants in Area Code 225
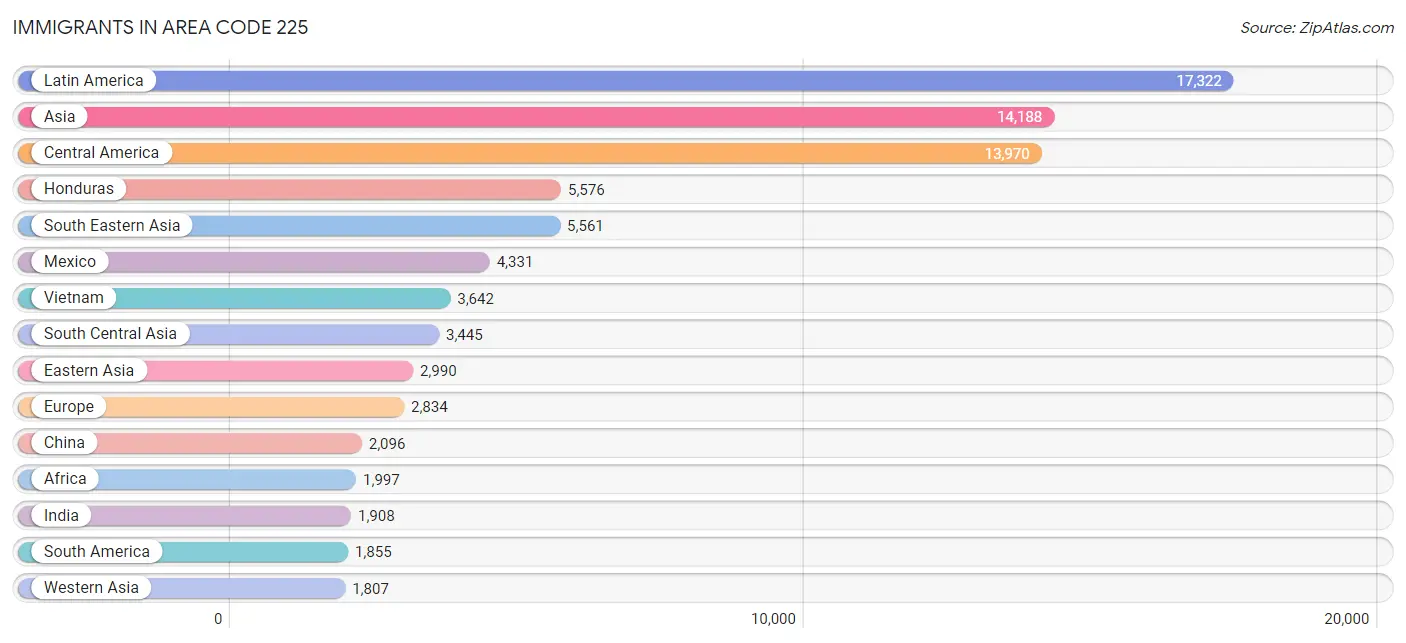
The most numerous immigrant groups reported in Area Code 225 came from Latin America (17,322 | 2.0%), Asia (14,188 | 1.6%), Central America (13,970 | 1.6%), Honduras (5,576 | 0.6%), and South Eastern Asia (5,561 | 0.6%), together accounting for 6.4% of all Area Code 225 residents.
| Immigration Origin | # Population | % Population |
| Afghanistan | 12 | 0.0% |
| Africa | 1,997 | 0.2% |
| Argentina | 41 | 0.0% |
| Armenia | 5 | 0.0% |
| Asia | 14,188 | 1.6% |
| Australia | 187 | 0.0% |
| Austria | 6 | 0.0% |
| Bangladesh | 618 | 0.1% |
| Barbados | 41 | 0.0% |
| Belgium | 128 | 0.0% |
| Belize | 44 | 0.0% |
| Bolivia | 10 | 0.0% |
| Brazil | 846 | 0.1% |
| Bulgaria | 132 | 0.0% |
| Cambodia | 18 | 0.0% |
| Cameroon | 270 | 0.0% |
| Canada | 595 | 0.1% |
| Caribbean | 1,497 | 0.2% |
| Central America | 13,970 | 1.6% |
| Chile | 119 | 0.0% |
| China | 2,096 | 0.2% |
| Colombia | 265 | 0.0% |
| Costa Rica | 172 | 0.0% |
| Croatia | 122 | 0.0% |
| Cuba | 667 | 0.1% |
| Czechoslovakia | 31 | 0.0% |
| Denmark | 4 | 0.0% |
| Dominican Republic | 213 | 0.0% |
| Eastern Africa | 369 | 0.0% |
| Eastern Asia | 2,990 | 0.3% |
| Eastern Europe | 1,112 | 0.1% |
| Ecuador | 102 | 0.0% |
| Egypt | 258 | 0.0% |
| El Salvador | 1,782 | 0.2% |
| England | 234 | 0.0% |
| Ethiopia | 125 | 0.0% |
| Europe | 2,834 | 0.3% |
| France | 151 | 0.0% |
| Germany | 661 | 0.1% |
| Ghana | 164 | 0.0% |
| Greece | 11 | 0.0% |
| Guatemala | 1,042 | 0.1% |
| Guyana | 258 | 0.0% |
| Haiti | 21 | 0.0% |
| Honduras | 5,576 | 0.6% |
| Hong Kong | 109 | 0.0% |
| Hungary | 18 | 0.0% |
| India | 1,908 | 0.2% |
| Indonesia | 179 | 0.0% |
| Iran | 630 | 0.1% |
| Iraq | 222 | 0.0% |
| Ireland | 63 | 0.0% |
| Israel | 115 | 0.0% |
| Italy | 184 | 0.0% |
| Jamaica | 194 | 0.0% |
| Japan | 351 | 0.0% |
| Jordan | 150 | 0.0% |
| Kazakhstan | 45 | 0.0% |
| Kenya | 15 | 0.0% |
| Korea | 543 | 0.1% |
| Kuwait | 102 | 0.0% |
| Laos | 57 | 0.0% |
| Latin America | 17,322 | 2.0% |
| Latvia | 25 | 0.0% |
| Lebanon | 181 | 0.0% |
| Lithuania | 32 | 0.0% |
| Malaysia | 56 | 0.0% |
| Mexico | 4,331 | 0.5% |
| Middle Africa | 270 | 0.0% |
| Morocco | 91 | 0.0% |
| Nepal | 150 | 0.0% |
| Netherlands | 36 | 0.0% |
| Nicaragua | 554 | 0.1% |
| Nigeria | 346 | 0.0% |
| Northern Africa | 530 | 0.1% |
| Northern Europe | 514 | 0.1% |
| Norway | 16 | 0.0% |
| Oceania | 231 | 0.0% |
| Pakistan | 38 | 0.0% |
| Panama | 161 | 0.0% |
| Peru | 40 | 0.0% |
| Philippines | 1,330 | 0.2% |
| Poland | 26 | 0.0% |
| Romania | 104 | 0.0% |
| Russia | 363 | 0.0% |
| Saudi Arabia | 86 | 0.0% |
| Scotland | 14 | 0.0% |
| Senegal | 3 | 0.0% |
| Sierra Leone | 4 | 0.0% |
| Singapore | 10 | 0.0% |
| South Africa | 196 | 0.0% |
| South America | 1,855 | 0.2% |
| South Central Asia | 3,445 | 0.4% |
| South Eastern Asia | 5,561 | 0.6% |
| Southern Europe | 226 | 0.0% |
| Spain | 31 | 0.0% |
| Sri Lanka | 44 | 0.0% |
| Sudan | 47 | 0.0% |
| Sweden | 28 | 0.0% |
| Syria | 126 | 0.0% |
| Taiwan | 150 | 0.0% |
| Thailand | 269 | 0.0% |
| Trinidad and Tobago | 209 | 0.0% |
| Turkey | 186 | 0.0% |
| Uganda | 136 | 0.0% |
| Ukraine | 246 | 0.0% |
| Venezuela | 165 | 0.0% |
| Vietnam | 3,642 | 0.4% |
| West Indies | 17 | 0.0% |
| Western Africa | 528 | 0.1% |
| Western Asia | 1,807 | 0.2% |
| Western Europe | 982 | 0.1% |
| Yemen | 557 | 0.1% |
| Zimbabwe | 69 | 0.0% | View All 114 Rows |
Sex and Age in Area Code 225
Sex and Age in Area Code 225
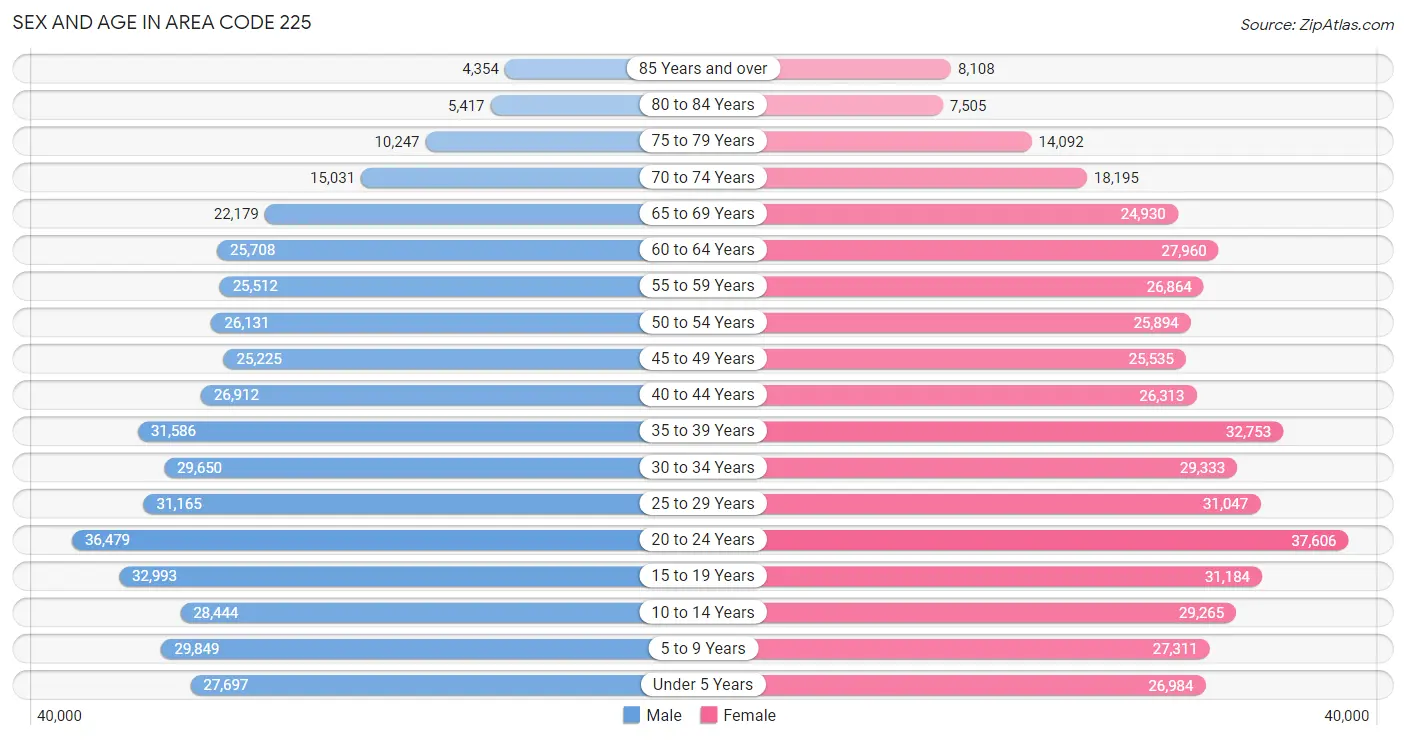
The most populous age groups in Area Code 225 are 20 to 24 Years (36,479 | 8.4%) for men and 20 to 24 Years (37,606 | 8.3%) for women.
| Age Bracket | Male | Female |
| Under 5 Years | 27,697 (6.4%) | 26,984 (6.0%) |
| 5 to 9 Years | 29,849 (6.9%) | 27,311 (6.1%) |
| 10 to 14 Years | 28,444 (6.6%) | 29,265 (6.5%) |
| 15 to 19 Years | 32,993 (7.6%) | 31,184 (6.9%) |
| 20 to 24 Years | 36,479 (8.4%) | 37,606 (8.3%) |
| 25 to 29 Years | 31,165 (7.2%) | 31,047 (6.9%) |
| 30 to 34 Years | 29,650 (6.8%) | 29,333 (6.5%) |
| 35 to 39 Years | 31,586 (7.3%) | 32,753 (7.3%) |
| 40 to 44 Years | 26,912 (6.2%) | 26,313 (5.8%) |
| 45 to 49 Years | 25,225 (5.8%) | 25,535 (5.7%) |
| 50 to 54 Years | 26,131 (6.0%) | 25,894 (5.7%) |
| 55 to 59 Years | 25,512 (5.9%) | 26,864 (6.0%) |
| 60 to 64 Years | 25,708 (5.9%) | 27,960 (6.2%) |
| 65 to 69 Years | 22,179 (5.1%) | 24,930 (5.5%) |
| 70 to 74 Years | 15,031 (3.5%) | 18,195 (4.0%) |
| 75 to 79 Years | 10,247 (2.4%) | 14,092 (3.1%) |
| 80 to 84 Years | 5,417 (1.3%) | 7,505 (1.7%) |
| 85 Years and over | 4,354 (1.0%) | 8,108 (1.8%) |
| Total | 434,579 (100.0%) | 450,879 (100.0%) |
Families and Households in Area Code 225
Median Family Size in Area Code 225
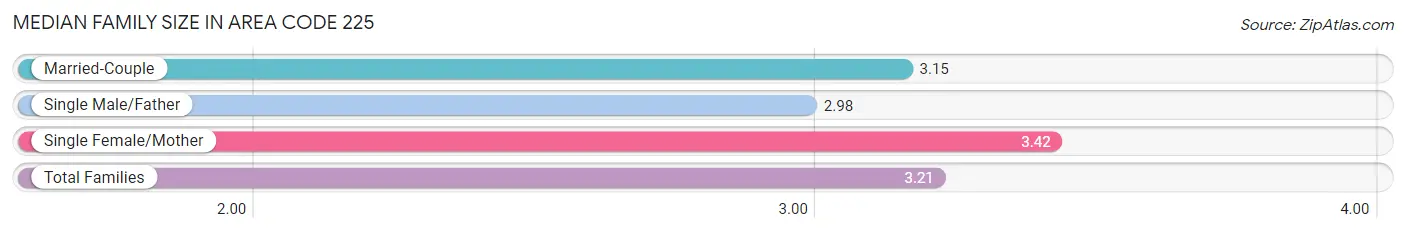
The median family size in Area Code 225 is 3.21 persons per family, with single female/mother families (50,686 | 23.9%) accounting for the largest median family size of 3.42133 persons per family. On the other hand, single male/father families (17,425 | 8.2%) represent the smallest median family size with 2.98 persons per family.
| Family Type | # Families | Family Size |
| Married-Couple | 143,860 (67.9%) | 3.15 |
| Single Male/Father | 17,425 (8.2%) | 2.98 |
| Single Female/Mother | 50,686 (23.9%) | 3.42 |
| Total Families | 211,971 (100.0%) | 3.21 |
Median Household Size in Area Code 225
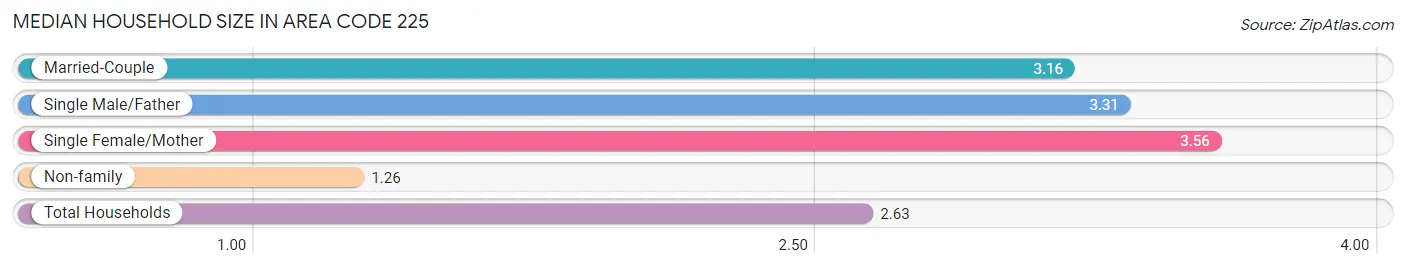
The median household size in Area Code 225 is 2.63 persons per household, with single female/mother households (50,686 | 15.5%) accounting for the largest median household size of 3.55733 persons per household. non-family households (115,163 | 35.2%) represent the smallest median household size with 1.26 persons per household.
| Household Type | # Households | Household Size |
| Married-Couple | 143,860 (44.0%) | 3.16 |
| Single Male/Father | 17,425 (5.3%) | 3.31 |
| Single Female/Mother | 50,686 (15.5%) | 3.56 |
| Non-family | 115,163 (35.2%) | 1.26 |
| Total Households | 327,134 (100.0%) | 2.63 |
Household Size by Marriage Status in Area Code 225
Out of a total of 327,134 households in Area Code 225, 211,971 (64.8%) are family households, while 115,163 (35.2%) are nonfamily households. The most numerous type of family households are 2-person households, comprising 94,273, and the most common type of nonfamily households are 1-person households, comprising 93,111.
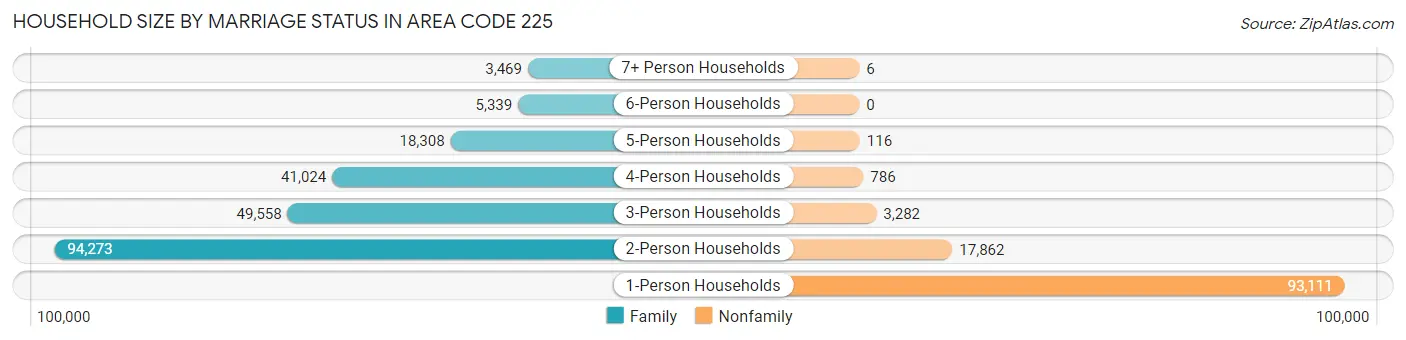
| Household Size | Family Households | Nonfamily Households |
| 1-Person Households | - | 93,111 (28.5%) |
| 2-Person Households | 94,273 (28.8%) | 17,862 (5.5%) |
| 3-Person Households | 49,558 (15.1%) | 3,282 (1.0%) |
| 4-Person Households | 41,024 (12.5%) | 786 (0.2%) |
| 5-Person Households | 18,308 (5.6%) | 116 (0.0%) |
| 6-Person Households | 5,339 (1.6%) | 0 (0.0%) |
| 7+ Person Households | 3,469 (1.1%) | 6 (0.0%) |
| Total | 211,971 (64.8%) | 115,163 (35.2%) |
Female Fertility in Area Code 225
Fertility by Age in Area Code 225
Average fertility rate in Area Code 225 is 61.1 births per 1,000 women. Women in the age bracket of 20 to 34 years have the highest fertility rate with 128.3 births per 1,000 women. Women in the age bracket of 20 to 34 years acount for 73.7% of all women with births.
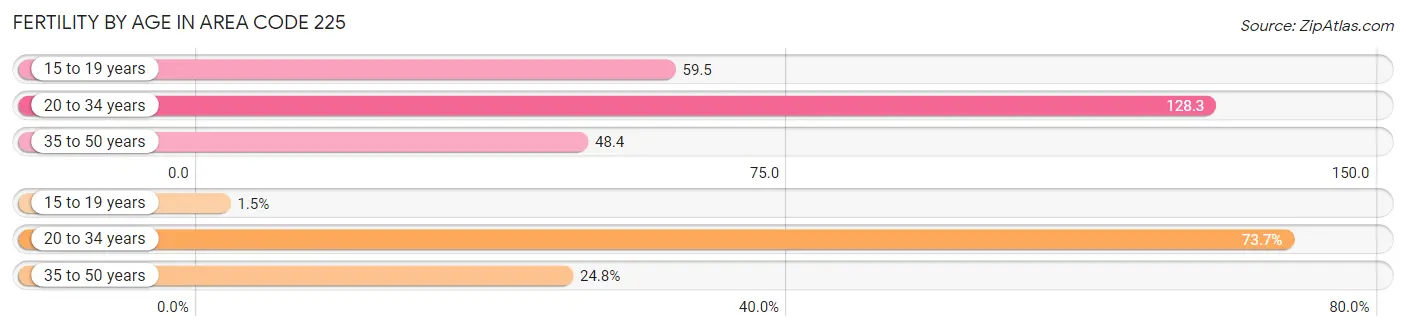
| Age Bracket | Women with Births | Births / 1,000 Women |
| 15 to 19 years | 168 (1.5%) | 59.5 |
| 20 to 34 years | 8,149 (73.7%) | 128.3 |
| 35 to 50 years | 2,738 (24.8%) | 48.4 |
| Total | 11,055 (100.0%) | 61.1 |
Fertility by Age by Marriage Status in Area Code 225
48.1% of women with births (11,055) in Area Code 225 are married. The highest percentage of unmarried women with births falls into 15 to 19 years age bracket with 100.0% of them unmarried at the time of birth, while the lowest percentage of unmarried women with births belong to 35 to 50 years age bracket with 53.7% of them unmarried.
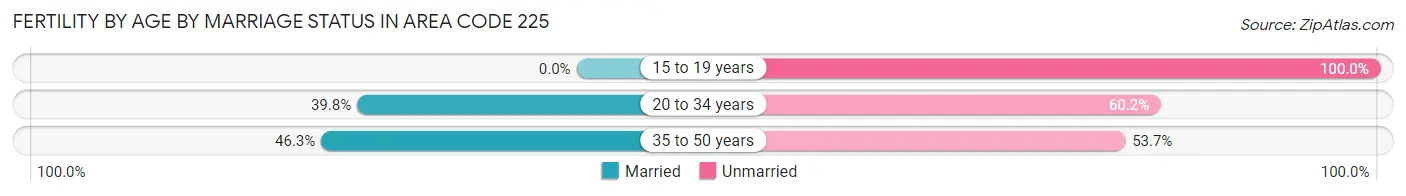
| Age Bracket | Married | Unmarried |
| 15 to 19 years | 0 (0.0%) | 168 (100.0%) |
| 20 to 34 years | 3,241 (39.8%) | 4,908 (60.2%) |
| 35 to 50 years | 1,267 (46.3%) | 1,471 (53.7%) |
| Total | 5,318 (48.1%) | 5,737 (51.9%) |
Fertility by Education in Area Code 225
Average fertility rate in Area Code 225 is 61.1 births per 1,000 women. Women with the education attainment of graduate degree have the highest fertility rate of 154.8 births per 1,000 women, while women with the education attainment of college or associate's degree have the lowest fertility at 59.0 births per 1,000 women. Women with the education attainment of high school diploma represent 31.5% of all women with births.
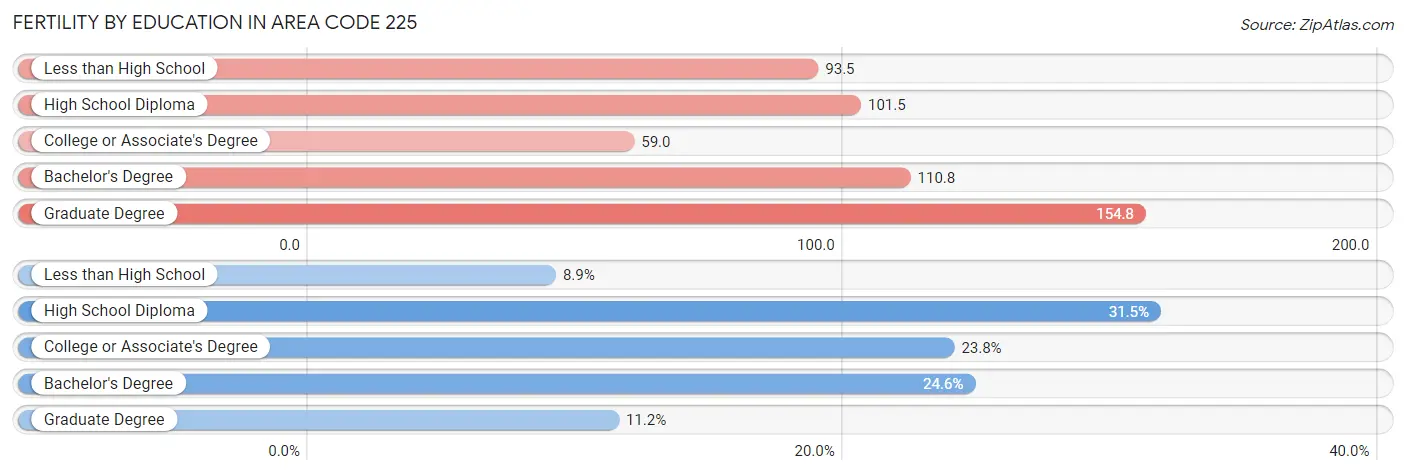
| Educational Attainment | Women with Births | Births / 1,000 Women |
| Less than High School | 981 (8.9%) | 93.5 |
| High School Diploma | 3,486 (31.5%) | 101.5 |
| College or Associate's Degree | 2,631 (23.8%) | 59.0 |
| Bachelor's Degree | 2,716 (24.6%) | 110.8 |
| Graduate Degree | 1,241 (11.2%) | 154.8 |
| Total | 11,055 (100.0%) | 61.1 |
Fertility by Education by Marriage Status in Area Code 225
51.9% of women with births in Area Code 225 are unmarried. Women with the educational attainment of bachelor's degree are most likely to be married with 61.6% of them married at childbirth, while women with the educational attainment of less than high school are least likely to be married with 83.0% of them unmarried at childbirth.
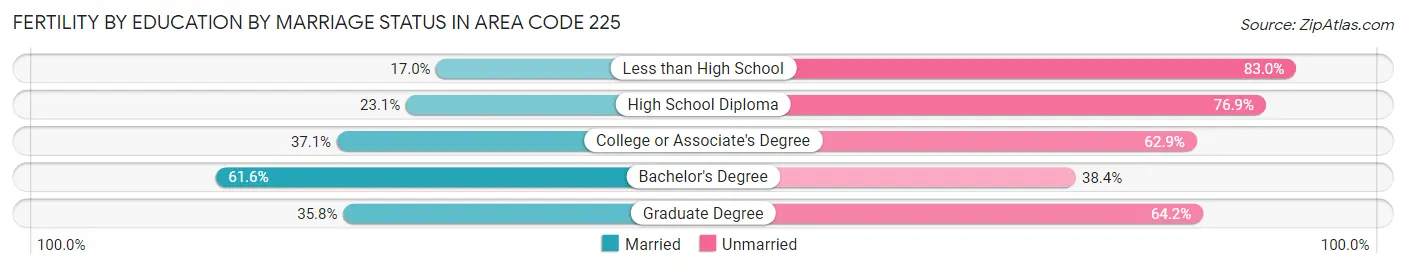
| Educational Attainment | Married | Unmarried |
| Less than High School | 167 (17.0%) | 814 (83.0%) |
| High School Diploma | 806 (23.1%) | 2,680 (76.9%) |
| College or Associate's Degree | 975 (37.1%) | 1,656 (62.9%) |
| Bachelor's Degree | 1,672 (61.6%) | 1,044 (38.4%) |
| Graduate Degree | 444 (35.8%) | 797 (64.2%) |
| Total | 5,318 (48.1%) | 5,737 (51.9%) |
Employment Characteristics in Area Code 225
Employment by Class of Employer in Area Code 225
Among the 403,676 employed individuals in Area Code 225, private company employees (269,605 | 66.8%), state government employees (36,320 | 9.0%), and local government employees (28,315 | 7.0%) make up the most common classes of employment.
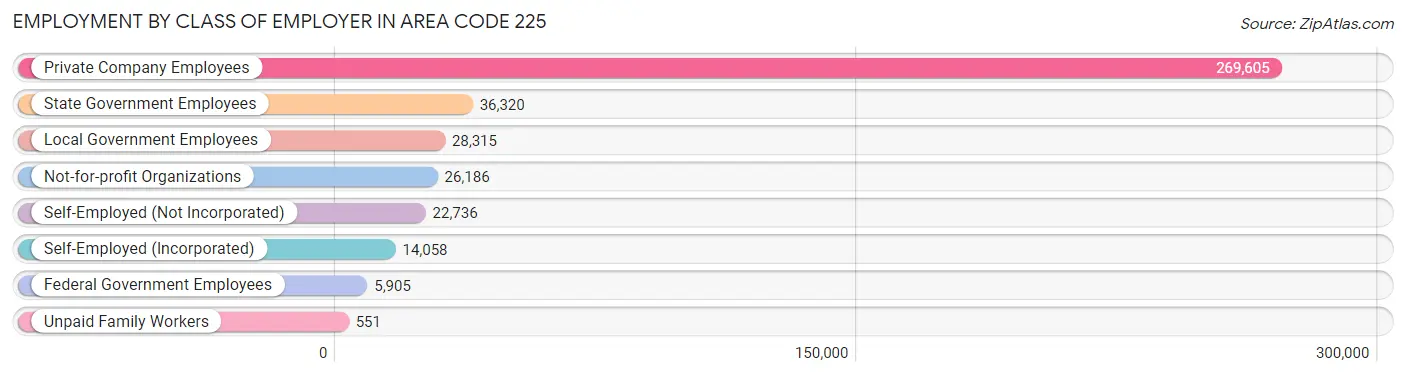
| Employer Class | # Employees | % Employees |
| Private Company Employees | 269,605 | 66.8% |
| Self-Employed (Incorporated) | 14,058 | 3.5% |
| Self-Employed (Not Incorporated) | 22,736 | 5.6% |
| Not-for-profit Organizations | 26,186 | 6.5% |
| Local Government Employees | 28,315 | 7.0% |
| State Government Employees | 36,320 | 9.0% |
| Federal Government Employees | 5,905 | 1.5% |
| Unpaid Family Workers | 551 | 0.1% |
| Total | 403,676 | 100.0% |
Employment Status by Age in Area Code 225
According to the labor force statistics for Area Code 225, out of the total population over 16 years of age (704,631), 58.9% or 415,310 individuals are in the labor force, with 8.5% or 35,301 of them unemployed. The age group with the highest labor force participation rate is 30 to 34 years, with 82.2% or 48,484 individuals in the labor force. Within the labor force, the 16 to 19 years age range has the highest percentage of unemployed individuals, with 923.5% or 189,548 of them being unemployed.
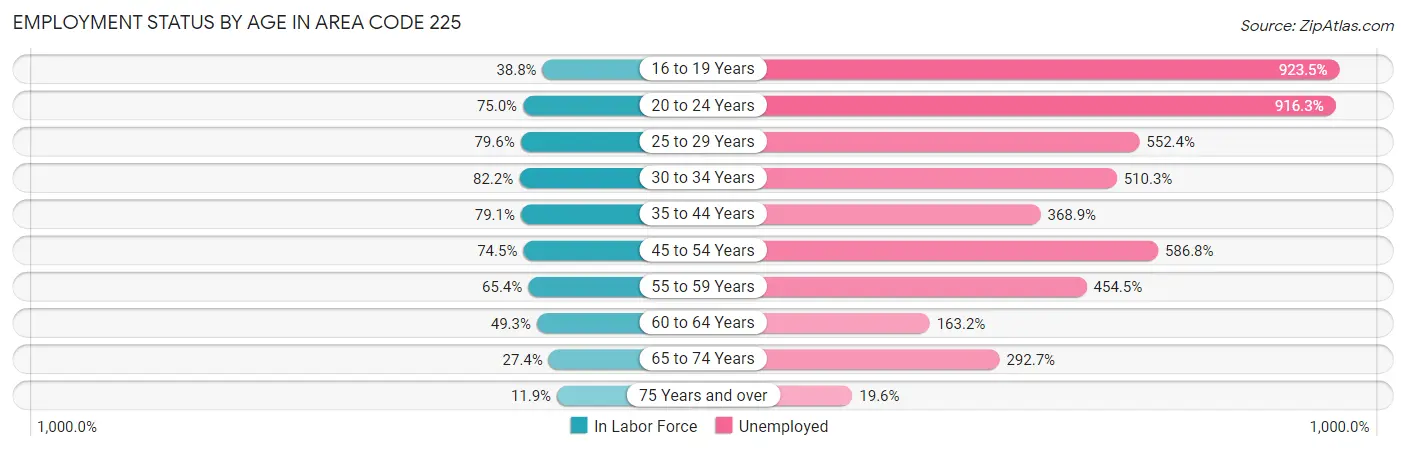
| Age Bracket | In Labor Force | Unemployed |
| 16 to 19 Years | 20,523 (38.8%) | 189,548 (923.5%) |
| 20 to 24 Years | 55,566 (75.0%) | 509,133 (916.3%) |
| 25 to 29 Years | 49,518 (79.6%) | 273,554 (552.4%) |
| 30 to 34 Years | 48,486 (82.2%) | 247,414 (510.3%) |
| 35 to 44 Years | 92,950 (79.1%) | 342,878 (368.9%) |
| 45 to 54 Years | 76,566 (74.5%) | 449,283 (586.8%) |
| 55 to 59 Years | 34,274 (65.4%) | 155,780 (454.5%) |
| 60 to 64 Years | 26,445 (49.3%) | 43,163 (163.2%) |
| 65 to 74 Years | 22,003 (27.4%) | 64,406 (292.7%) |
| 75 Years and over | 5,900 (11.9%) | 1,157 (19.6%) |
| Total | 415,303 (58.9%) | 35,296 (8.5%) |
Employment Status by Educational Attainment in Area Code 225
According to labor force statistics for Area Code 225, 72.2% of individuals (323,159) out of the total population between 25 and 64 years of age (447,588) are in the labor force, with 536.8% or 1,734,718 of them being unemployed. The group with the highest labor force participation rate are those with the educational attainment of bachelor's degree or higher, with 85.3% or 117,323 individuals in the labor force. Within the labor force, individuals with less than high school education have the highest percentage of unemployment, with 1,105.7% or 284,674 of them being unemployed.
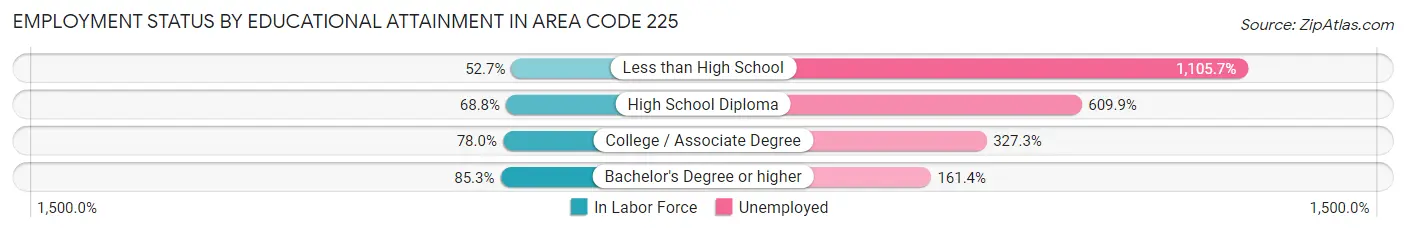
| Educational Attainment | In Labor Force | Unemployed |
| Less than High School | 25,745 (52.7%) | 540,079 (1,105.7%) |
| High School Diploma | 91,410 (68.8%) | 810,886 (609.9%) |
| College / Associate Degree | 100,024 (78.0%) | 419,808 (327.3%) |
| Bachelor's Degree or higher | 117,318 (85.3%) | 221,965 (161.4%) |
| Total | 323,142 (72.2%) | 2,402,652 (536.8%) |
Employment Occupations by Sex in Area Code 225
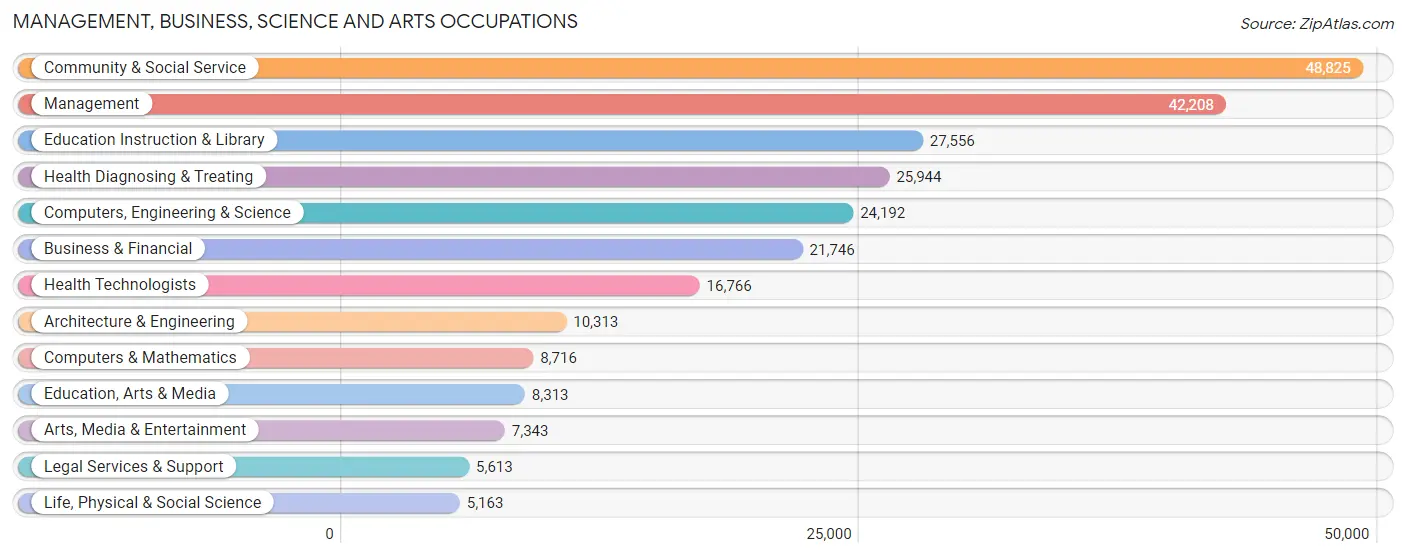
Management, Business, Science and Arts Occupations
The most common Management, Business, Science and Arts occupations in Area Code 225 are Community & Social Service (48,825 | 11.9%), Management (42,208 | 10.3%), Education Instruction & Library (27,556 | 6.7%), Health Diagnosing & Treating (25,944 | 6.3%), and Computers, Engineering & Science (24,192 | 5.9%).
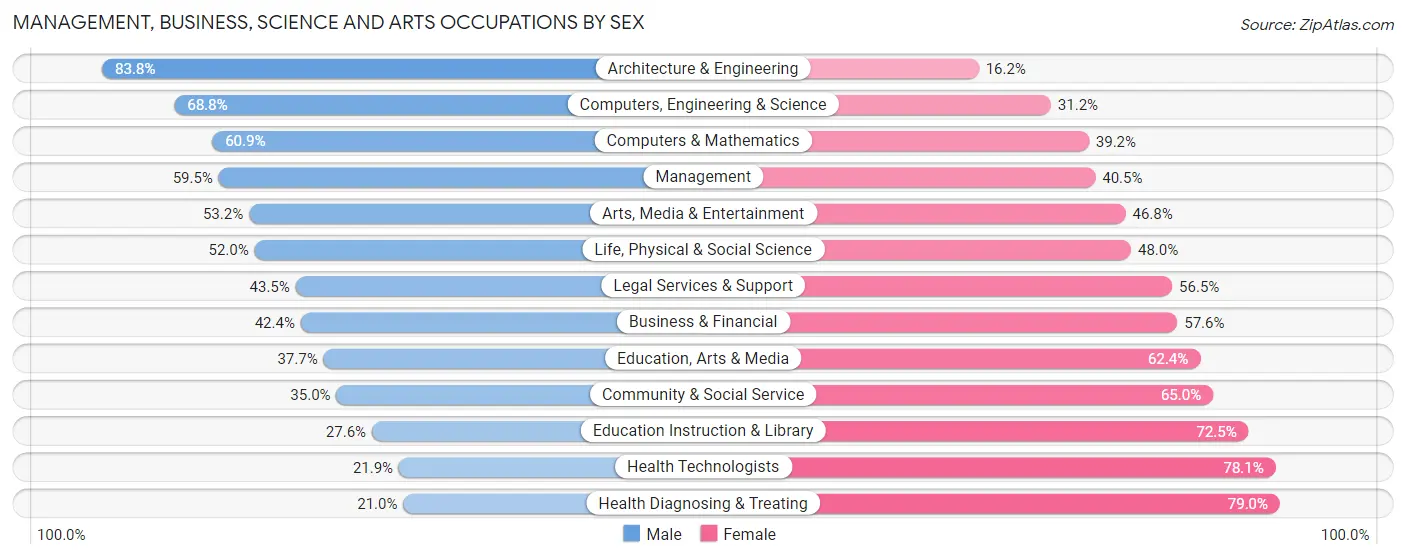
Management, Business, Science and Arts Occupations by Sex
Within the Management, Business, Science and Arts occupations in Area Code 225, the most male-oriented occupations are Architecture & Engineering (83.8%), Computers, Engineering & Science (68.8%), and Computers & Mathematics (60.9%), while the most female-oriented occupations are Health Diagnosing & Treating (79.0%), Health Technologists (78.1%), and Education Instruction & Library (72.5%).
| Occupation | Male | Female |
| Management | 25,120 (59.5%) | 17,088 (40.5%) |
| Business & Financial | 9,221 (42.4%) | 12,525 (57.6%) |
| Computers, Engineering & Science | 16,636 (68.8%) | 7,556 (31.2%) |
| Computers & Mathematics | 5,304 (60.9%) | 3,412 (39.2%) |
| Architecture & Engineering | 8,645 (83.8%) | 1,668 (16.2%) |
| Life, Physical & Social Science | 2,687 (52.0%) | 2,476 (48.0%) |
| Community & Social Service | 17,069 (35.0%) | 31,756 (65.0%) |
| Education, Arts & Media | 3,130 (37.7%) | 5,183 (62.4%) |
| Legal Services & Support | 2,440 (43.5%) | 3,173 (56.5%) |
| Education Instruction & Library | 7,593 (27.6%) | 19,963 (72.5%) |
| Arts, Media & Entertainment | 3,906 (53.2%) | 3,437 (46.8%) |
| Health Diagnosing & Treating | 5,452 (21.0%) | 20,492 (79.0%) |
| Health Technologists | 3,674 (21.9%) | 13,092 (78.1%) |
| Total (Category) | 73,498 (45.1%) | 89,417 (54.9%) |
| Total (Overall) | 213,616 (52.0%) | 197,375 (48.0%) |
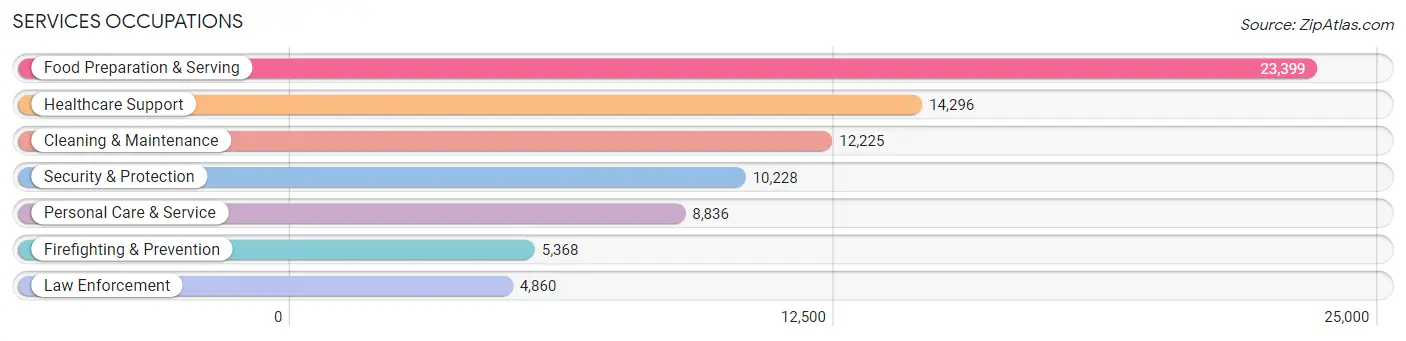
Services Occupations
The most common Services occupations in Area Code 225 are Food Preparation & Serving (23,399 | 5.7%), Healthcare Support (14,296 | 3.5%), Cleaning & Maintenance (12,225 | 3.0%), Security & Protection (10,228 | 2.5%), and Personal Care & Service (8,836 | 2.1%).
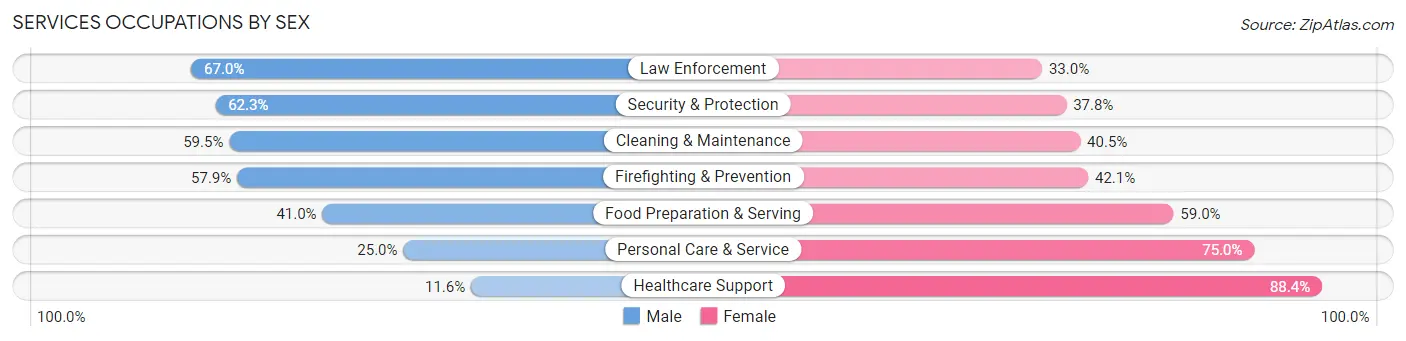
Services Occupations by Sex
Within the Services occupations in Area Code 225, the most male-oriented occupations are Law Enforcement (67.0%), Security & Protection (62.3%), and Cleaning & Maintenance (59.5%), while the most female-oriented occupations are Healthcare Support (88.4%), Personal Care & Service (75.0%), and Food Preparation & Serving (59.0%).
| Occupation | Male | Female |
| Healthcare Support | 1,659 (11.6%) | 12,637 (88.4%) |
| Security & Protection | 6,367 (62.3%) | 3,861 (37.8%) |
| Firefighting & Prevention | 3,109 (57.9%) | 2,259 (42.1%) |
| Law Enforcement | 3,258 (67.0%) | 1,602 (33.0%) |
| Food Preparation & Serving | 9,599 (41.0%) | 13,800 (59.0%) |
| Cleaning & Maintenance | 7,272 (59.5%) | 4,953 (40.5%) |
| Personal Care & Service | 2,209 (25.0%) | 6,627 (75.0%) |
| Total (Category) | 27,106 (39.3%) | 41,878 (60.7%) |
| Total (Overall) | 213,616 (52.0%) | 197,375 (48.0%) |
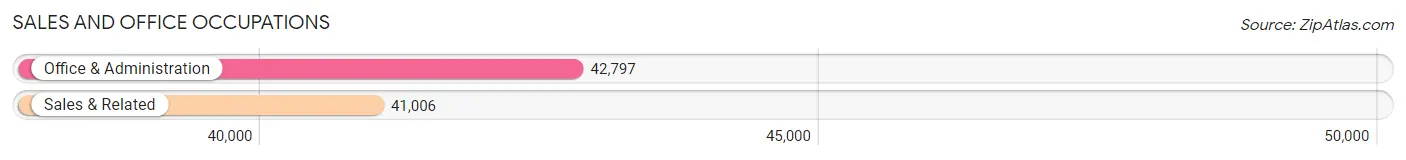
Sales and Office Occupations
The most common Sales and Office occupations in Area Code 225 are Office & Administration (42,797 | 10.4%), and Sales & Related (41,006 | 10.0%).
Sales and Office Occupations by Sex
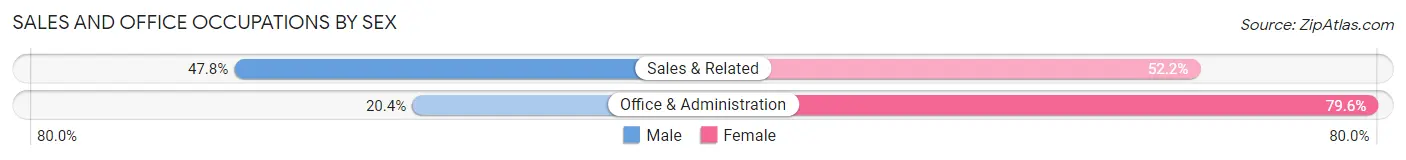
| Occupation | Male | Female |
| Sales & Related | 19,592 (47.8%) | 21,414 (52.2%) |
| Office & Administration | 8,732 (20.4%) | 34,065 (79.6%) |
| Total (Category) | 28,324 (33.8%) | 55,479 (66.2%) |
| Total (Overall) | 213,616 (52.0%) | 197,375 (48.0%) |
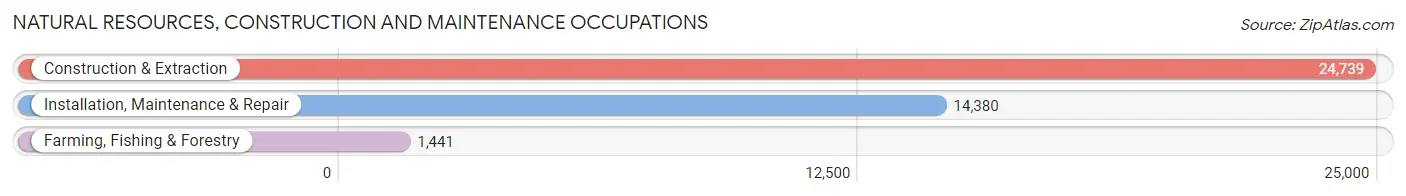
Natural Resources, Construction and Maintenance Occupations
The most common Natural Resources, Construction and Maintenance occupations in Area Code 225 are Construction & Extraction (24,739 | 6.0%), Installation, Maintenance & Repair (14,380 | 3.5%), and Farming, Fishing & Forestry (1,441 | 0.4%).
Natural Resources, Construction and Maintenance Occupations by Sex
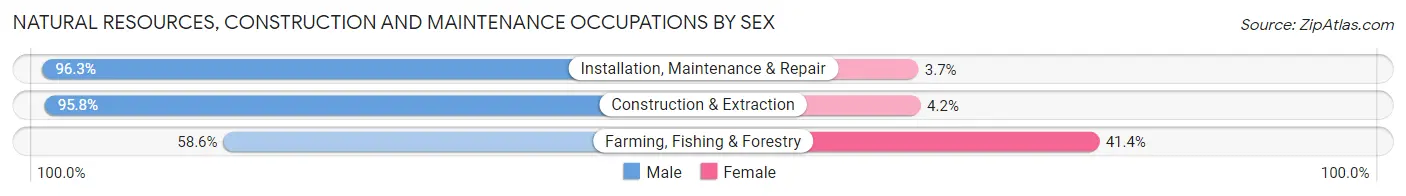
| Occupation | Male | Female |
| Farming, Fishing & Forestry | 845 (58.6%) | 596 (41.4%) |
| Construction & Extraction | 23,697 (95.8%) | 1,042 (4.2%) |
| Installation, Maintenance & Repair | 13,844 (96.3%) | 536 (3.7%) |
| Total (Category) | 38,386 (94.6%) | 2,174 (5.4%) |
| Total (Overall) | 213,616 (52.0%) | 197,375 (48.0%) |
Production, Transportation and Moving Occupations
The most common Production, Transportation and Moving occupations in Area Code 225 are Production (23,804 | 5.8%), Transportation (16,729 | 4.1%), and Material Moving (14,196 | 3.5%).
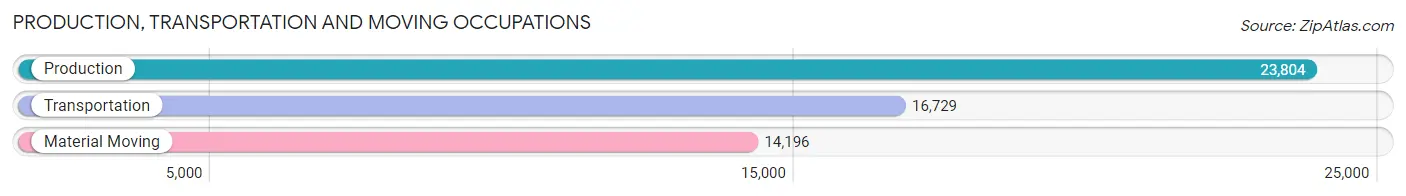
Production, Transportation and Moving Occupations by Sex
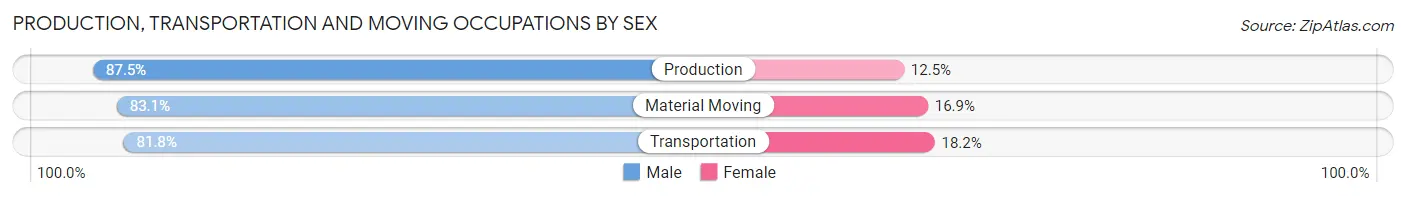
| Occupation | Male | Female |
| Production | 20,818 (87.5%) | 2,986 (12.5%) |
| Transportation | 13,690 (81.8%) | 3,039 (18.2%) |
| Material Moving | 11,794 (83.1%) | 2,402 (16.9%) |
| Total (Category) | 46,302 (84.6%) | 8,427 (15.4%) |
| Total (Overall) | 213,616 (52.0%) | 197,375 (48.0%) |
Employment Industries by Sex in Area Code 225
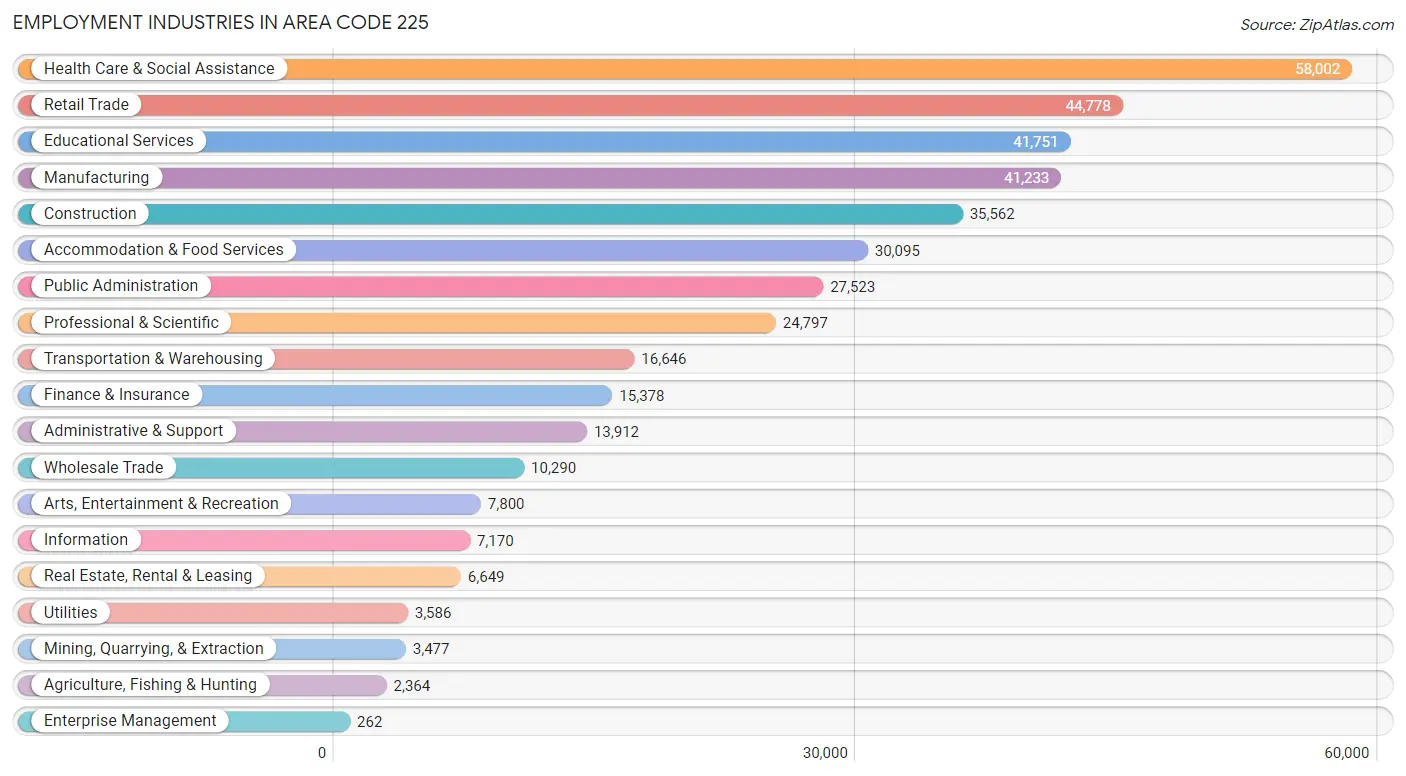
Employment Industries in Area Code 225
The major employment industries in Area Code 225 include Health Care & Social Assistance (58,002 | 14.1%), Retail Trade (44,778 | 10.9%), Educational Services (41,751 | 10.2%), Manufacturing (41,233 | 10.0%), and Construction (35,562 | 8.6%).
Employment Industries by Sex in Area Code 225
The Area Code 225 industries that see more men than women are Construction (87.9%), Manufacturing (83.2%), and Mining, Quarrying, & Extraction (82.3%), whereas the industries that tend to have a higher number of women are Health Care & Social Assistance (80.8%), Enterprise Management (75.2%), and Educational Services (71.9%).
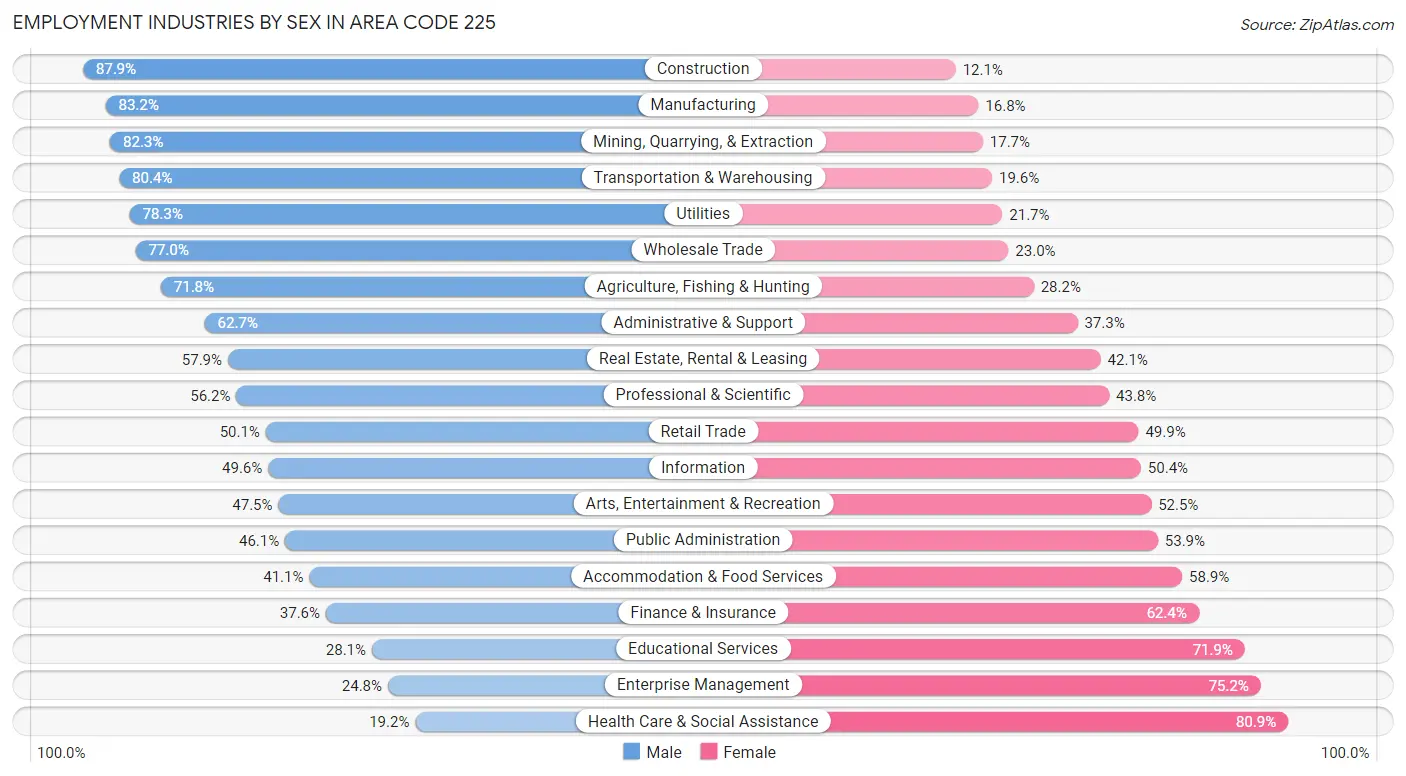
| Industry | Male | Female |
| Agriculture, Fishing & Hunting | 1,697 (71.8%) | 667 (28.2%) |
| Mining, Quarrying, & Extraction | 2,862 (82.3%) | 615 (17.7%) |
| Construction | 31,275 (87.9%) | 4,287 (12.1%) |
| Manufacturing | 34,323 (83.2%) | 6,910 (16.8%) |
| Wholesale Trade | 7,926 (77.0%) | 2,364 (23.0%) |
| Retail Trade | 22,436 (50.1%) | 22,342 (49.9%) |
| Transportation & Warehousing | 13,387 (80.4%) | 3,259 (19.6%) |
| Utilities | 2,807 (78.3%) | 779 (21.7%) |
| Information | 3,556 (49.6%) | 3,614 (50.4%) |
| Finance & Insurance | 5,788 (37.6%) | 9,590 (62.4%) |
| Real Estate, Rental & Leasing | 3,852 (57.9%) | 2,797 (42.1%) |
| Professional & Scientific | 13,931 (56.2%) | 10,866 (43.8%) |
| Enterprise Management | 65 (24.8%) | 197 (75.2%) |
| Administrative & Support | 8,727 (62.7%) | 5,185 (37.3%) |
| Educational Services | 11,739 (28.1%) | 30,012 (71.9%) |
| Health Care & Social Assistance | 11,105 (19.2%) | 46,897 (80.8%) |
| Arts, Entertainment & Recreation | 3,703 (47.5%) | 4,097 (52.5%) |
| Accommodation & Food Services | 12,360 (41.1%) | 17,735 (58.9%) |
| Public Administration | 12,686 (46.1%) | 14,837 (53.9%) |
| Total | 213,616 (52.0%) | 197,375 (48.0%) |
Education in Area Code 225
School Enrollment in Area Code 225
The most common levels of schooling among the 234,373 students in Area Code 225 are college / undergraduate (57,686 | 24.6%), middle school (46,455 | 19.8%), and high school (46,043 | 19.7%).
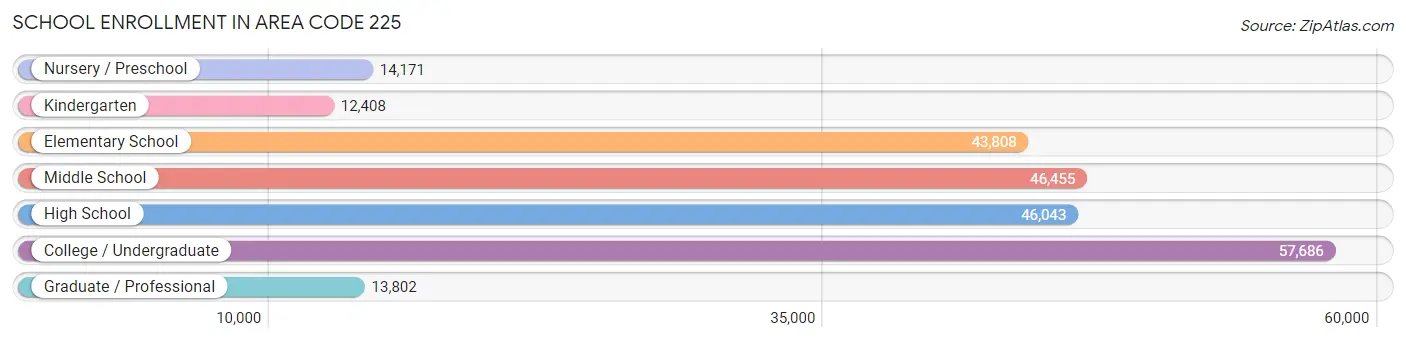
| School Level | # Students | % Students |
| Nursery / Preschool | 14,171 | 6.0% |
| Kindergarten | 12,408 | 5.3% |
| Elementary School | 43,808 | 18.7% |
| Middle School | 46,455 | 19.8% |
| High School | 46,043 | 19.7% |
| College / Undergraduate | 57,686 | 24.6% |
| Graduate / Professional | 13,802 | 5.9% |
| Total | 234,373 | 100.0% |
School Enrollment by Age by Funding Source in Area Code 225
Out of a total of 234,373 students who are enrolled in schools in Area Code 225, 42,709 (18.2%) attend a private institution, while the remaining 191,664 (81.8%) are enrolled in public schools. The age group of 3 to 4 year olds has the highest likelihood of being enrolled in private schools, with 4,681 (40.9% in the age bracket) enrolled. Conversely, the age group of 20 to 24 year olds has the lowest likelihood of being enrolled in a private school, with 29,433 (89.9% in the age bracket) attending a public institution.
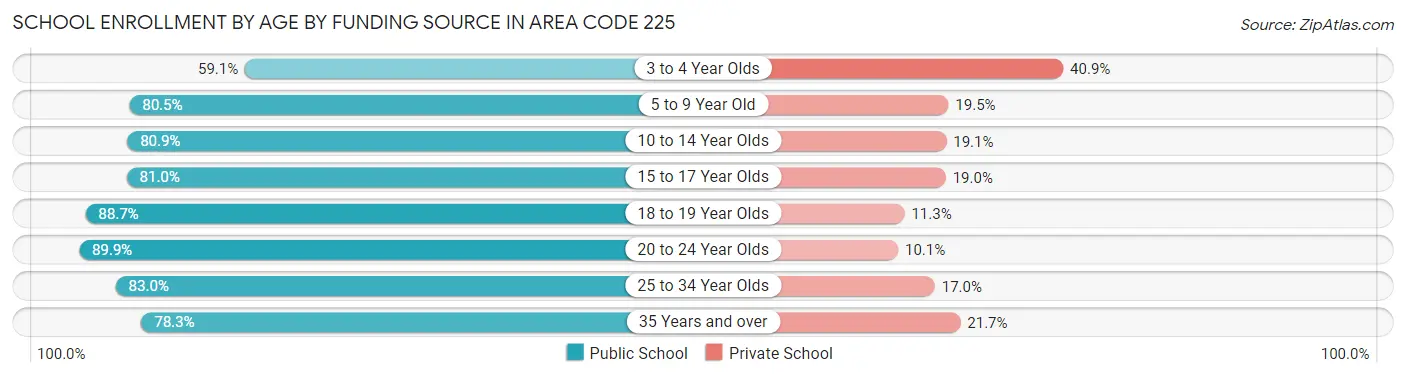
| Age Bracket | Public School | Private School |
| 3 to 4 Year Olds | 6,770 (59.1%) | 4,681 (40.9%) |
| 5 to 9 Year Old | 43,485 (80.5%) | 10,539 (19.5%) |
| 10 to 14 Year Olds | 45,263 (80.9%) | 10,699 (19.1%) |
| 15 to 17 Year Olds | 27,475 (81.0%) | 6,447 (19.0%) |
| 18 to 19 Year Olds | 19,947 (88.7%) | 2,549 (11.3%) |
| 20 to 24 Year Olds | 29,433 (89.9%) | 3,317 (10.1%) |
| 25 to 34 Year Olds | 11,512 (83.0%) | 2,353 (17.0%) |
| 35 Years and over | 7,750 (78.3%) | 2,153 (21.7%) |
| Total | 191,664 (81.8%) | 42,709 (18.2%) |
Educational Attainment by Field of Study in Area Code 225
Business (34,168 | 18.7%), education (25,676 | 14.1%), science & technology (22,256 | 12.2%), engineering (14,711 | 8.1%), and liberal arts & history (13,462 | 7.4%) are the most common fields of study among 182,522 individuals in Area Code 225 who have obtained a bachelor's degree or higher.
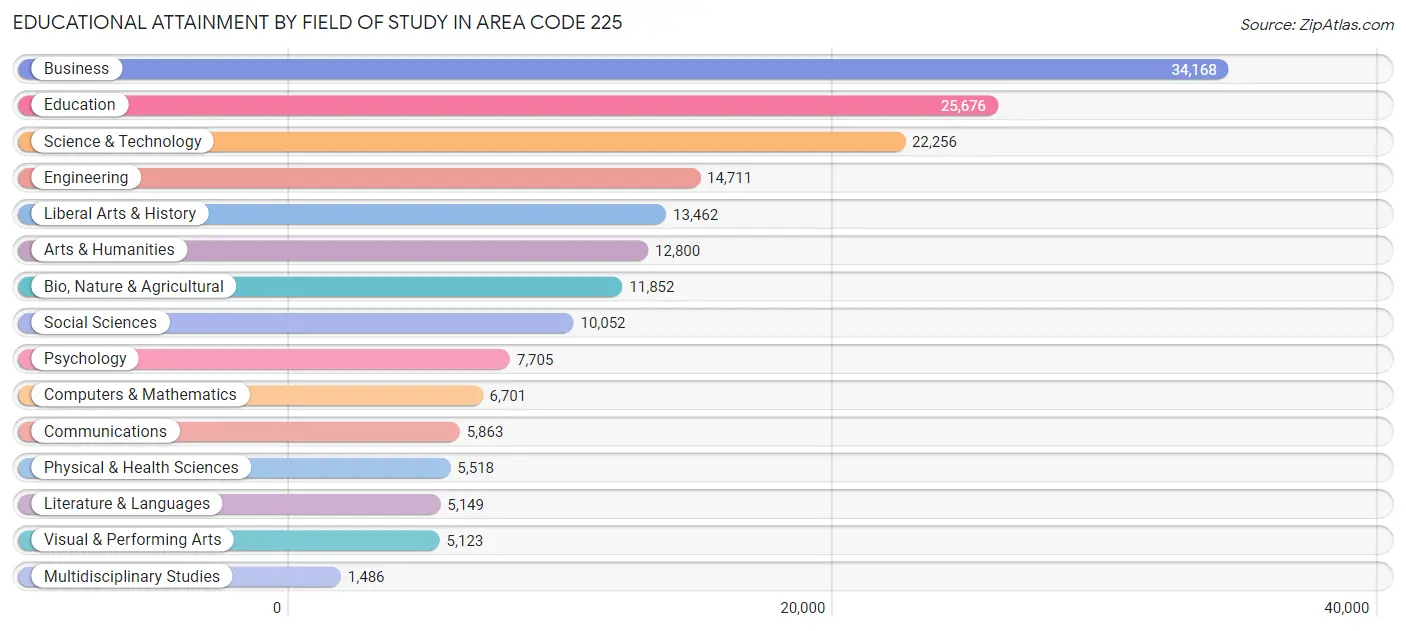
| Field of Study | # Graduates | % Graduates |
| Computers & Mathematics | 6,701 | 3.7% |
| Bio, Nature & Agricultural | 11,852 | 6.5% |
| Physical & Health Sciences | 5,518 | 3.0% |
| Psychology | 7,705 | 4.2% |
| Social Sciences | 10,052 | 5.5% |
| Engineering | 14,711 | 8.1% |
| Multidisciplinary Studies | 1,486 | 0.8% |
| Science & Technology | 22,256 | 12.2% |
| Business | 34,168 | 18.7% |
| Education | 25,676 | 14.1% |
| Literature & Languages | 5,149 | 2.8% |
| Liberal Arts & History | 13,462 | 7.4% |
| Visual & Performing Arts | 5,123 | 2.8% |
| Communications | 5,863 | 3.2% |
| Arts & Humanities | 12,800 | 7.0% |
| Total | 182,522 | 100.0% |
Transportation & Commute in Area Code 225
Vehicle Availability by Sex in Area Code 225
The most prevalent vehicle ownership categories in Area Code 225 are males with 2 vehicles (97,626, accounting for 46.5%) and females with 2 vehicles (80,608, making up 51.3%).
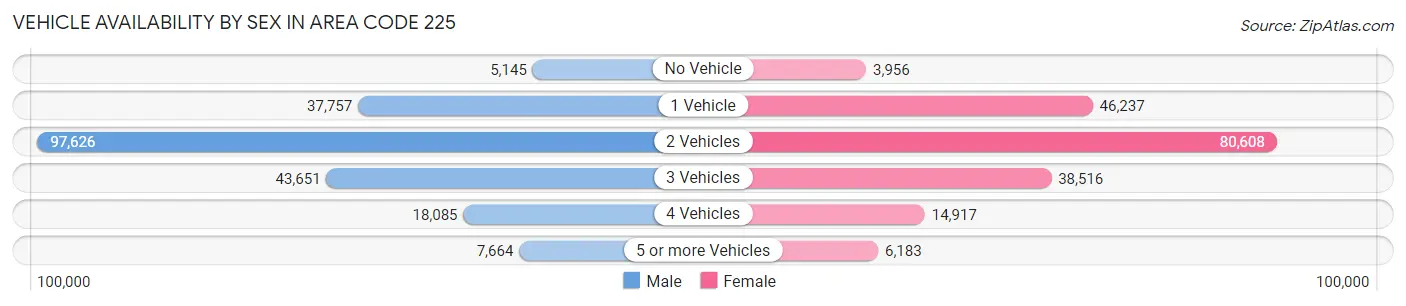
| Vehicles Available | Male | Female |
| No Vehicle | 5,145 (2.5%) | 3,956 (2.1%) |
| 1 Vehicle | 37,757 (18.0%) | 46,237 (24.3%) |
| 2 Vehicles | 97,626 (46.5%) | 80,608 (42.3%) |
| 3 Vehicles | 43,651 (20.8%) | 38,516 (20.2%) |
| 4 Vehicles | 18,085 (8.6%) | 14,917 (7.8%) |
| 5 or more Vehicles | 7,664 (3.6%) | 6,183 (3.3%) |
| Total | 209,928 (100.0%) | 190,417 (100.0%) |
Commute Time in Area Code 225
The most frequently occuring commute durations in Area Code 225 are 15 to 19 minutes (60,738 commuters, 16.0%), 30 to 34 minutes (59,159 commuters, 15.6%), and 20 to 24 minutes (55,254 commuters, 14.5%).
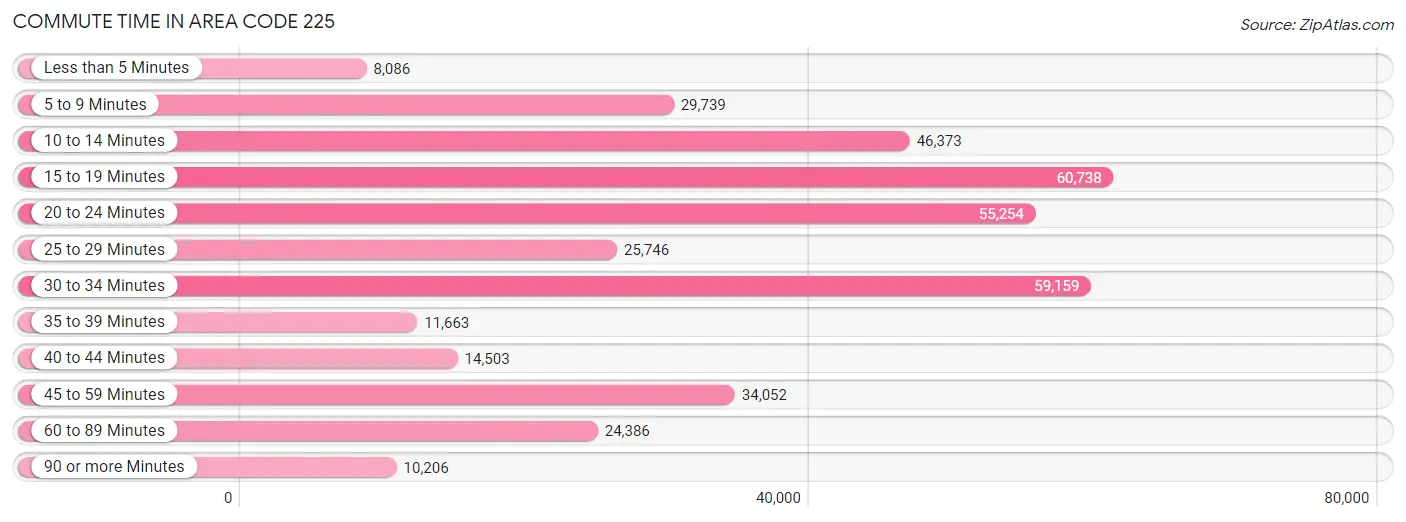
| Commute Time | # Commuters | % Commuters |
| Less than 5 Minutes | 8,086 | 2.1% |
| 5 to 9 Minutes | 29,739 | 7.8% |
| 10 to 14 Minutes | 46,373 | 12.2% |
| 15 to 19 Minutes | 60,738 | 16.0% |
| 20 to 24 Minutes | 55,254 | 14.5% |
| 25 to 29 Minutes | 25,746 | 6.8% |
| 30 to 34 Minutes | 59,159 | 15.6% |
| 35 to 39 Minutes | 11,663 | 3.1% |
| 40 to 44 Minutes | 14,503 | 3.8% |
| 45 to 59 Minutes | 34,052 | 9.0% |
| 60 to 89 Minutes | 24,386 | 6.4% |
| 90 or more Minutes | 10,206 | 2.7% |
Commute Time by Sex in Area Code 225
The most common commute times in Area Code 225 are 30 to 34 minutes (31,717 commuters, 15.9%) for males and 15 to 19 minutes (32,195 commuters, 17.9%) for females.
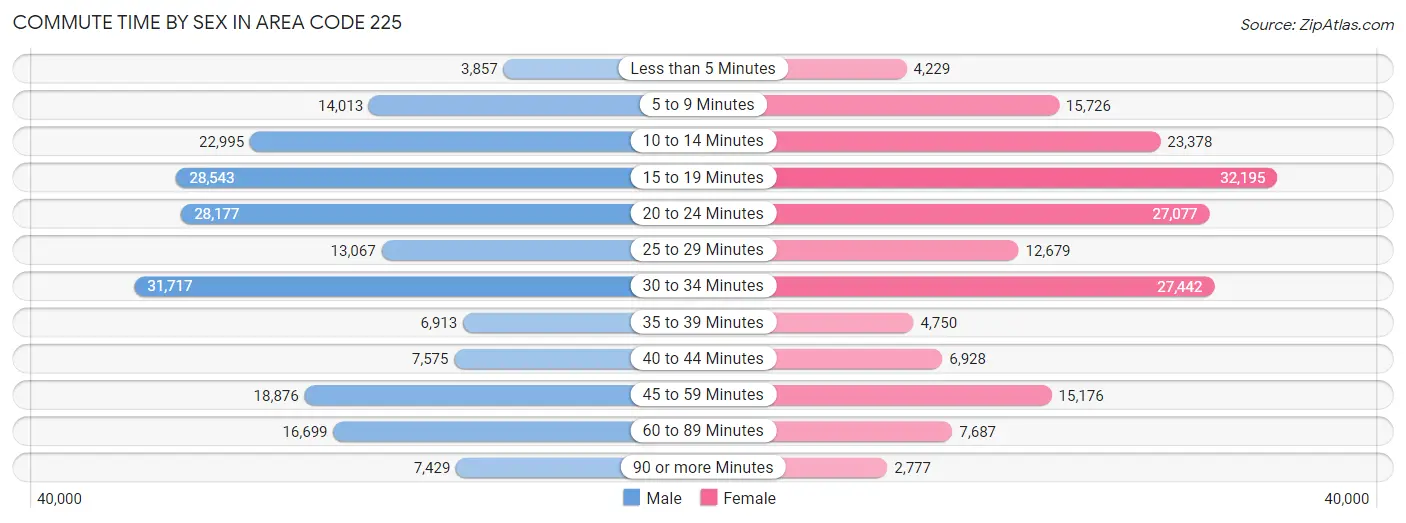
| Commute Time | Male | Female |
| Less than 5 Minutes | 3,857 (1.9%) | 4,229 (2.4%) |
| 5 to 9 Minutes | 14,013 (7.0%) | 15,726 (8.7%) |
| 10 to 14 Minutes | 22,995 (11.5%) | 23,378 (13.0%) |
| 15 to 19 Minutes | 28,543 (14.3%) | 32,195 (17.9%) |
| 20 to 24 Minutes | 28,177 (14.1%) | 27,077 (15.0%) |
| 25 to 29 Minutes | 13,067 (6.5%) | 12,679 (7.0%) |
| 30 to 34 Minutes | 31,717 (15.9%) | 27,442 (15.2%) |
| 35 to 39 Minutes | 6,913 (3.5%) | 4,750 (2.6%) |
| 40 to 44 Minutes | 7,575 (3.8%) | 6,928 (3.8%) |
| 45 to 59 Minutes | 18,876 (9.4%) | 15,176 (8.4%) |
| 60 to 89 Minutes | 16,699 (8.4%) | 7,687 (4.3%) |
| 90 or more Minutes | 7,429 (3.7%) | 2,777 (1.5%) |
Time of Departure to Work by Sex in Area Code 225
The most frequent times of departure to work in Area Code 225 are 12:00 AM to 4:59 AM (28,763, 14.4%) for males and 7:00 AM to 7:29 AM (29,428, 16.3%) for females.
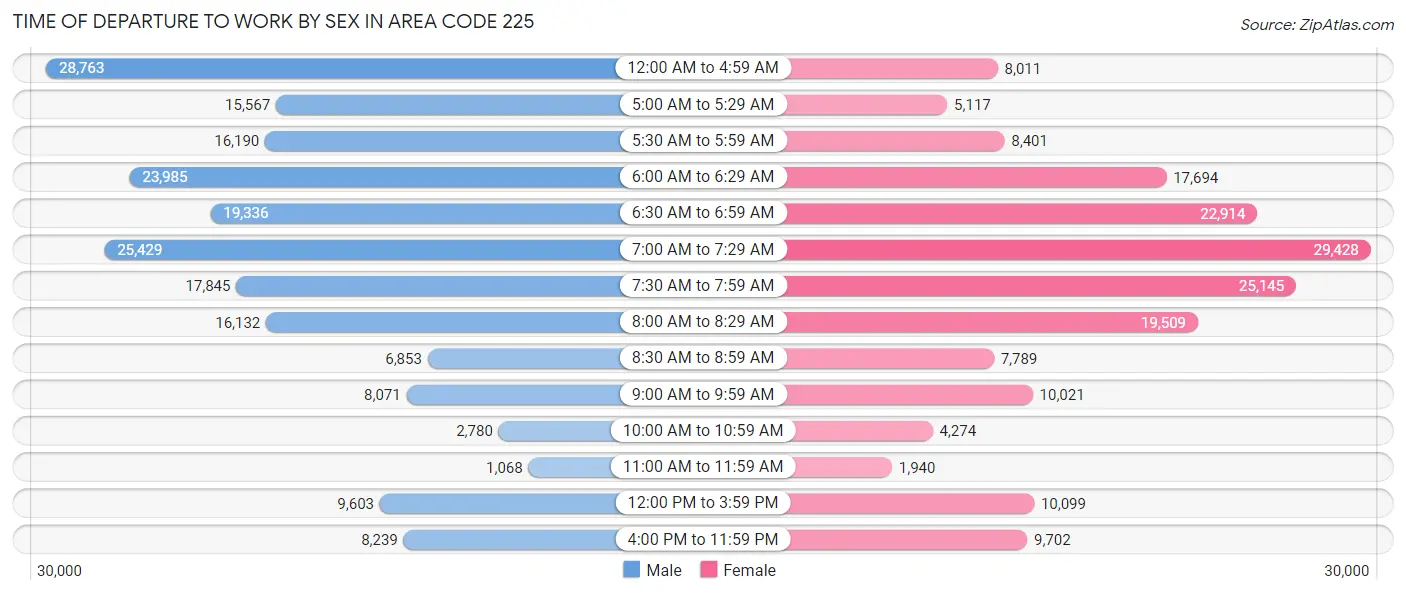
| Time of Departure | Male | Female |
| 12:00 AM to 4:59 AM | 28,763 (14.4%) | 8,011 (4.4%) |
| 5:00 AM to 5:29 AM | 15,567 (7.8%) | 5,117 (2.8%) |
| 5:30 AM to 5:59 AM | 16,190 (8.1%) | 8,401 (4.7%) |
| 6:00 AM to 6:29 AM | 23,985 (12.0%) | 17,694 (9.8%) |
| 6:30 AM to 6:59 AM | 19,336 (9.7%) | 22,914 (12.7%) |
| 7:00 AM to 7:29 AM | 25,429 (12.7%) | 29,428 (16.3%) |
| 7:30 AM to 7:59 AM | 17,845 (8.9%) | 25,145 (14.0%) |
| 8:00 AM to 8:29 AM | 16,132 (8.1%) | 19,509 (10.8%) |
| 8:30 AM to 8:59 AM | 6,853 (3.4%) | 7,789 (4.3%) |
| 9:00 AM to 9:59 AM | 8,071 (4.0%) | 10,021 (5.6%) |
| 10:00 AM to 10:59 AM | 2,780 (1.4%) | 4,274 (2.4%) |
| 11:00 AM to 11:59 AM | 1,068 (0.5%) | 1,940 (1.1%) |
| 12:00 PM to 3:59 PM | 9,603 (4.8%) | 10,099 (5.6%) |
| 4:00 PM to 11:59 PM | 8,239 (4.1%) | 9,702 (5.4%) |
| Total | 199,861 (100.0%) | 180,044 (100.0%) |
Housing Occupancy in Area Code 225
Occupancy by Ownership in Area Code 225
Of the total 327,134 dwellings in Area Code 225, owner-occupied units account for 227,457 (69.5%), while renter-occupied units make up 99,677 (30.5%).
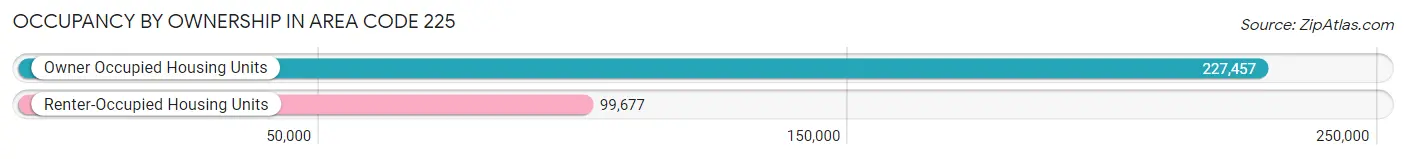
| Occupancy | # Housing Units | % Housing Units |
| Owner Occupied Housing Units | 227,457 | 69.5% |
| Renter-Occupied Housing Units | 99,677 | 30.5% |
| Total Occupied Housing Units | 327,134 | 100.0% |
Occupancy by Household Size in Area Code 225
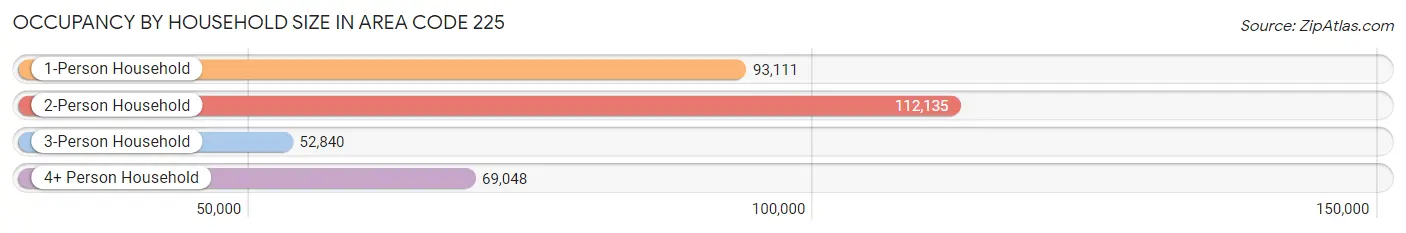
| Household Size | # Housing Units | % Housing Units |
| 1-Person Household | 93,111 | 28.5% |
| 2-Person Household | 112,135 | 34.3% |
| 3-Person Household | 52,840 | 16.2% |
| 4+ Person Household | 69,048 | 21.1% |
| Total Housing Units | 327,134 | 100.0% |
Occupancy by Ownership by Household Size in Area Code 225
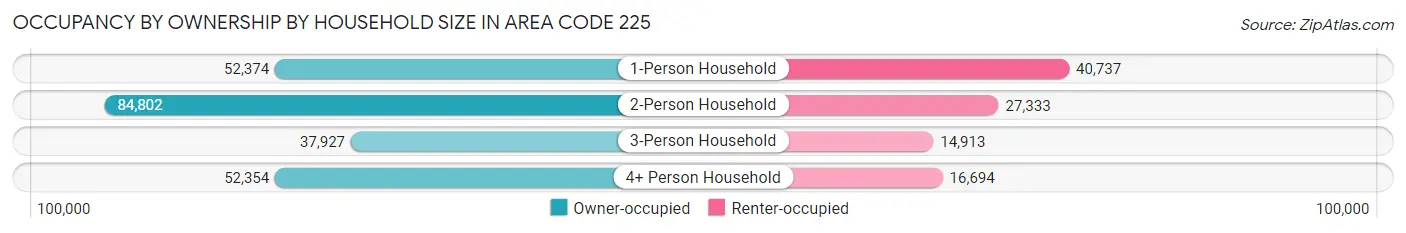
| Household Size | Owner-occupied | Renter-occupied |
| 1-Person Household | 52,374 (56.2%) | 40,737 (43.8%) |
| 2-Person Household | 84,802 (75.6%) | 27,333 (24.4%) |
| 3-Person Household | 37,927 (71.8%) | 14,913 (28.2%) |
| 4+ Person Household | 52,354 (75.8%) | 16,694 (24.2%) |
| Total Housing Units | 227,457 (69.5%) | 99,677 (30.5%) |
Occupancy by Educational Attainment in Area Code 225
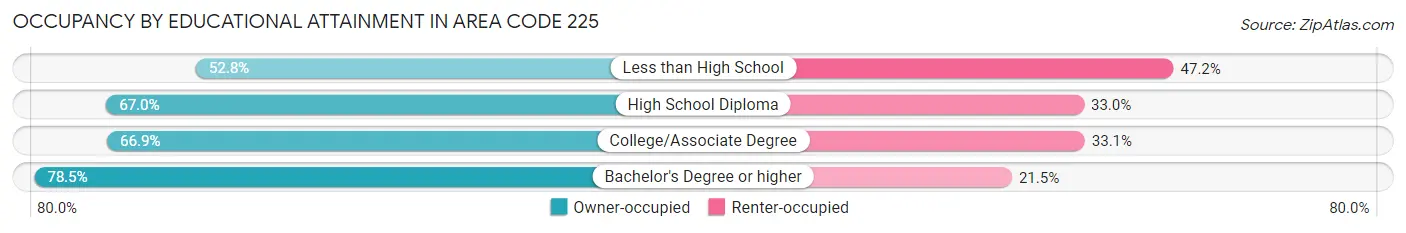
| Household Size | Owner-occupied | Renter-occupied |
| Less than High School | 15,421 (52.8%) | 13,777 (47.2%) |
| High School Diploma | 60,458 (67.0%) | 29,737 (33.0%) |
| College/Associate Degree | 66,068 (66.9%) | 32,686 (33.1%) |
| Bachelor's Degree or higher | 85,510 (78.5%) | 23,477 (21.5%) |
Occupancy by Age of Householder in Area Code 225
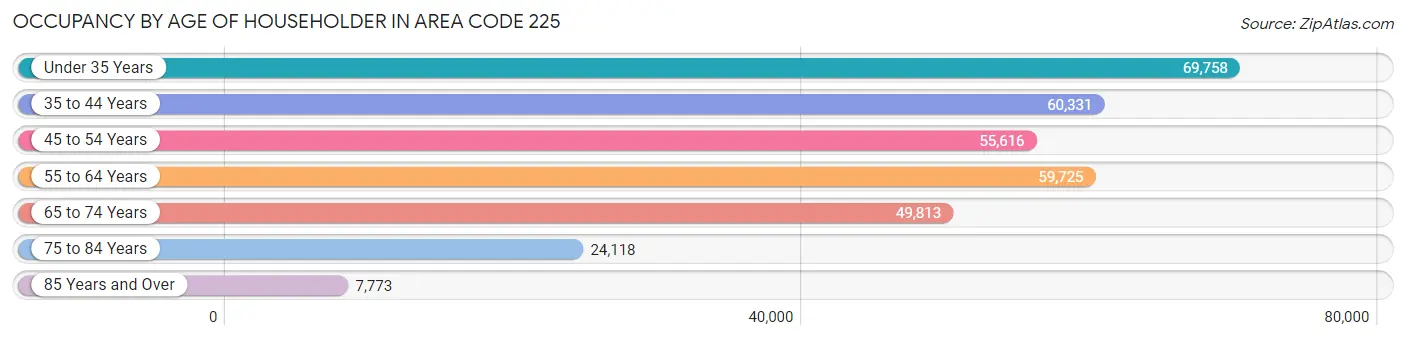
| Age Bracket | # Households | % Households |
| Under 35 Years | 69,758 | 21.3% |
| 35 to 44 Years | 60,331 | 18.4% |
| 45 to 54 Years | 55,616 | 17.0% |
| 55 to 64 Years | 59,725 | 18.3% |
| 65 to 74 Years | 49,813 | 15.2% |
| 75 to 84 Years | 24,118 | 7.4% |
| 85 Years and Over | 7,773 | 2.4% |
| Total | 327,134 | 100.0% |
Housing Finances in Area Code 225
Median Income by Occupancy in Area Code 225
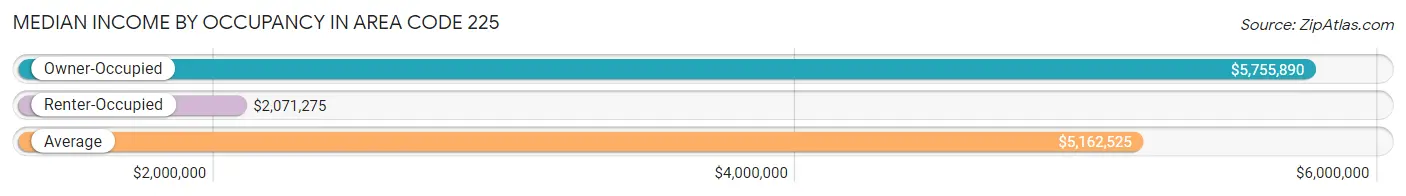
| Occupancy Type | # Households | Median Income |
| Owner-Occupied | 227,457 (69.5%) | $5,755,890 |
| Renter-Occupied | 99,677 (30.5%) | $2,071,275 |
| Average | 327,134 (100.0%) | $5,162,525 |
Occupancy by Householder Income Bracket in Area Code 225
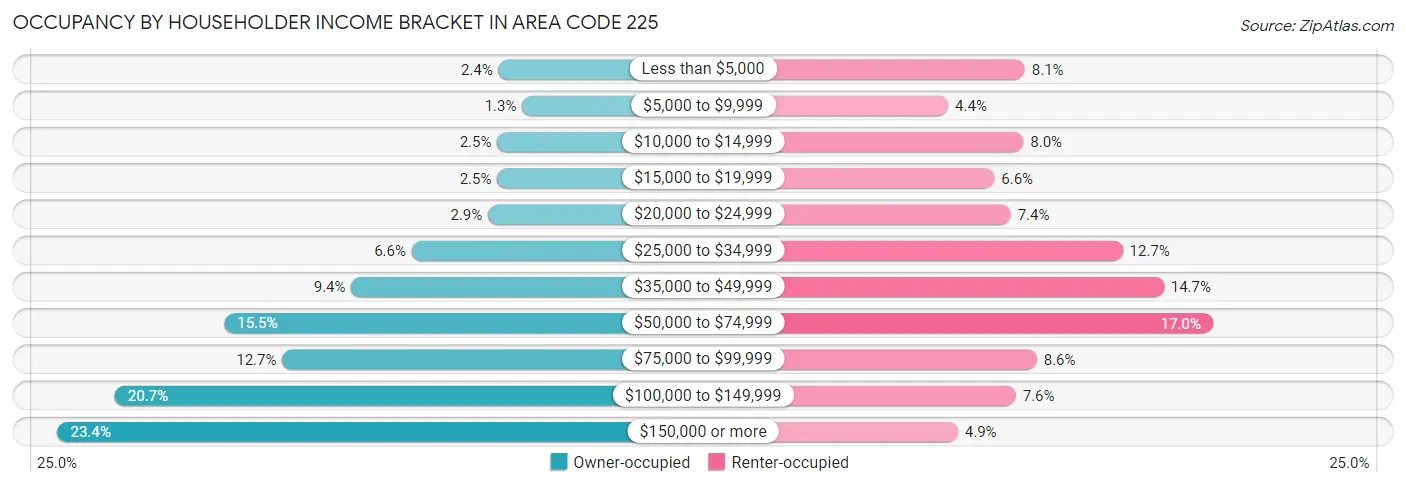
| Income Bracket | Owner-occupied | Renter-occupied |
| Less than $5,000 | 5,531 (2.4%) | 8,029 (8.1%) |
| $5,000 to $9,999 | 2,964 (1.3%) | 4,397 (4.4%) |
| $10,000 to $14,999 | 5,665 (2.5%) | 7,961 (8.0%) |
| $15,000 to $19,999 | 5,670 (2.5%) | 6,587 (6.6%) |
| $20,000 to $24,999 | 6,661 (2.9%) | 7,365 (7.4%) |
| $25,000 to $34,999 | 14,915 (6.6%) | 12,683 (12.7%) |
| $35,000 to $49,999 | 21,468 (9.4%) | 14,628 (14.7%) |
| $50,000 to $74,999 | 35,241 (15.5%) | 16,956 (17.0%) |
| $75,000 to $99,999 | 28,952 (12.7%) | 8,606 (8.6%) |
| $100,000 to $149,999 | 47,094 (20.7%) | 7,608 (7.6%) |
| $150,000 or more | 53,296 (23.4%) | 4,857 (4.9%) |
| Total | 227,457 (100.0%) | 99,677 (100.0%) |
Monthly Housing Cost Tiers in Area Code 225
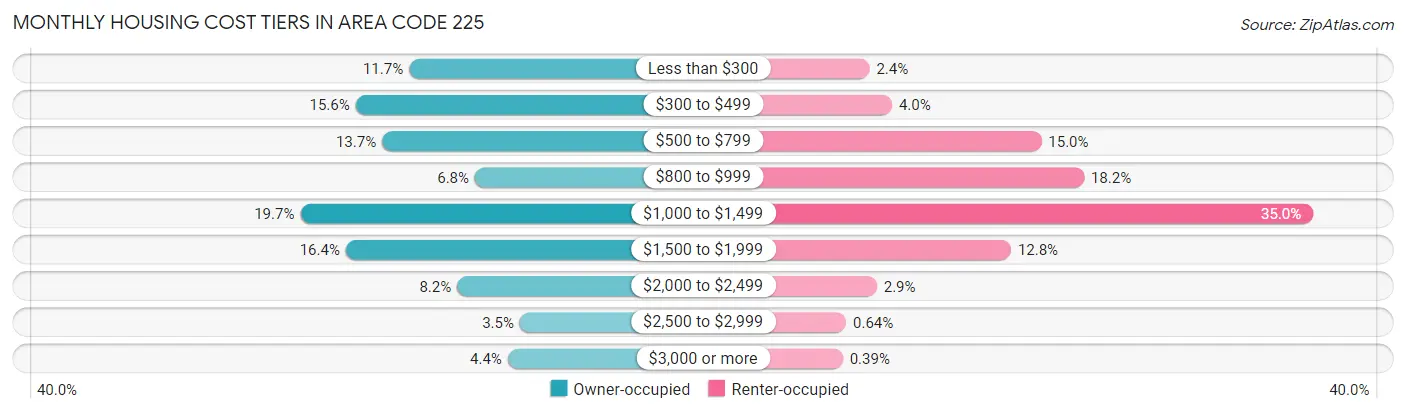
| Monthly Cost | Owner-occupied | Renter-occupied |
| Less than $300 | 26,599 (11.7%) | 2,353 (2.4%) |
| $300 to $499 | 35,554 (15.6%) | 4,008 (4.0%) |
| $500 to $799 | 31,123 (13.7%) | 14,970 (15.0%) |
| $800 to $999 | 15,566 (6.8%) | 18,102 (18.2%) |
| $1,000 to $1,499 | 44,811 (19.7%) | 34,919 (35.0%) |
| $1,500 to $1,999 | 37,187 (16.4%) | 12,735 (12.8%) |
| $2,000 to $2,499 | 18,534 (8.2%) | 2,891 (2.9%) |
| $2,500 to $2,999 | 8,034 (3.5%) | 635 (0.6%) |
| $3,000 or more | 10,049 (4.4%) | 385 (0.4%) |
| Total | 227,457 (100.0%) | 99,677 (100.0%) |
Physical Housing Characteristics in Area Code 225
Housing Structures in Area Code 225
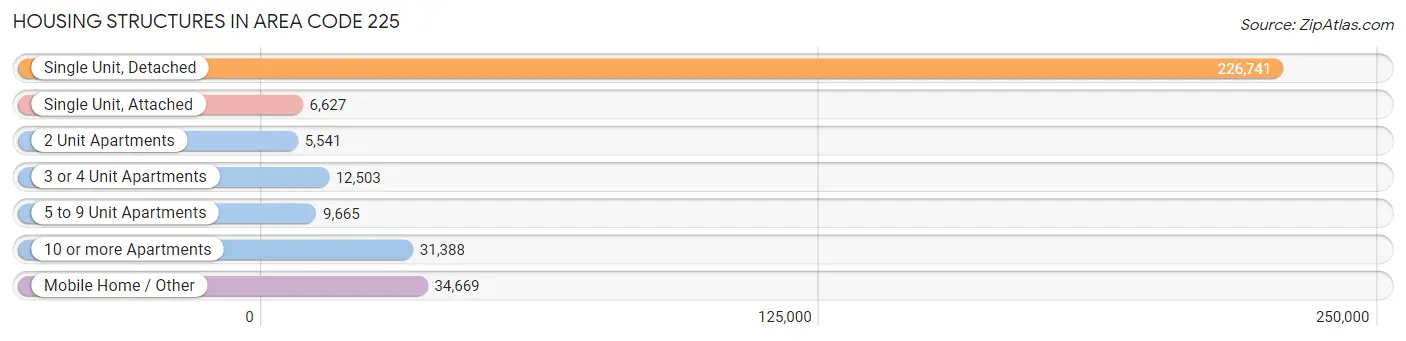
| Structure Type | # Housing Units | % Housing Units |
| Single Unit, Detached | 226,741 | 69.3% |
| Single Unit, Attached | 6,627 | 2.0% |
| 2 Unit Apartments | 5,541 | 1.7% |
| 3 or 4 Unit Apartments | 12,503 | 3.8% |
| 5 to 9 Unit Apartments | 9,665 | 2.9% |
| 10 or more Apartments | 31,388 | 9.6% |
| Mobile Home / Other | 34,669 | 10.6% |
| Total | 327,134 | 100.0% |
Housing Structures by Occupancy in Area Code 225
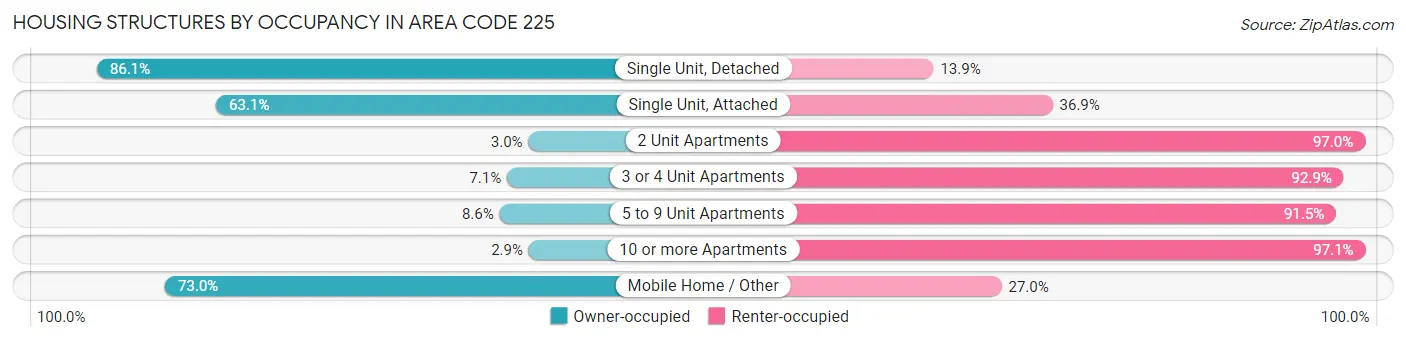
| Structure Type | Owner-occupied | Renter-occupied |
| Single Unit, Detached | 195,178 (86.1%) | 31,563 (13.9%) |
| Single Unit, Attached | 4,184 (63.1%) | 2,443 (36.9%) |
| 2 Unit Apartments | 166 (3.0%) | 5,375 (97.0%) |
| 3 or 4 Unit Apartments | 889 (7.1%) | 11,614 (92.9%) |
| 5 to 9 Unit Apartments | 826 (8.6%) | 8,839 (91.4%) |
| 10 or more Apartments | 917 (2.9%) | 30,471 (97.1%) |
| Mobile Home / Other | 25,297 (73.0%) | 9,372 (27.0%) |
| Total | 227,457 (69.5%) | 99,677 (30.5%) |
Housing Structures by Number of Rooms in Area Code 225
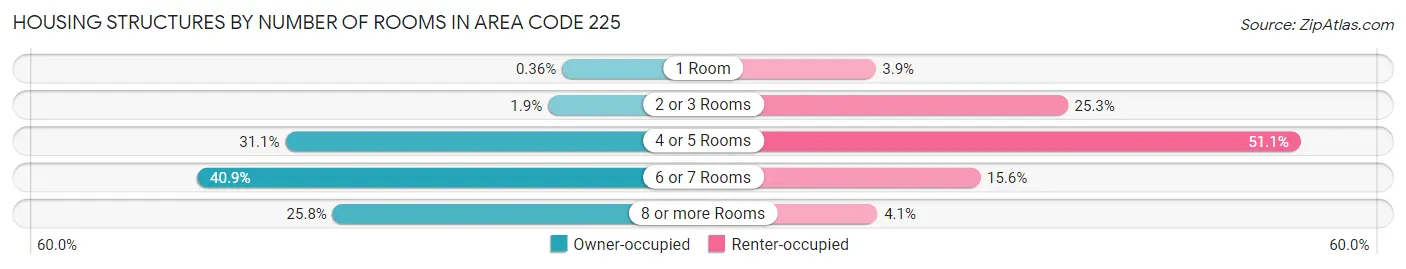
| Number of Rooms | Owner-occupied | Renter-occupied |
| 1 Room | 824 (0.4%) | 3,913 (3.9%) |
| 2 or 3 Rooms | 4,347 (1.9%) | 25,186 (25.3%) |
| 4 or 5 Rooms | 70,666 (31.1%) | 50,946 (51.1%) |
| 6 or 7 Rooms | 92,922 (40.8%) | 15,501 (15.5%) |
| 8 or more Rooms | 58,698 (25.8%) | 4,131 (4.1%) |
| Total | 227,457 (100.0%) | 99,677 (100.0%) |
Housing Structure by Heating Type in Area Code 225
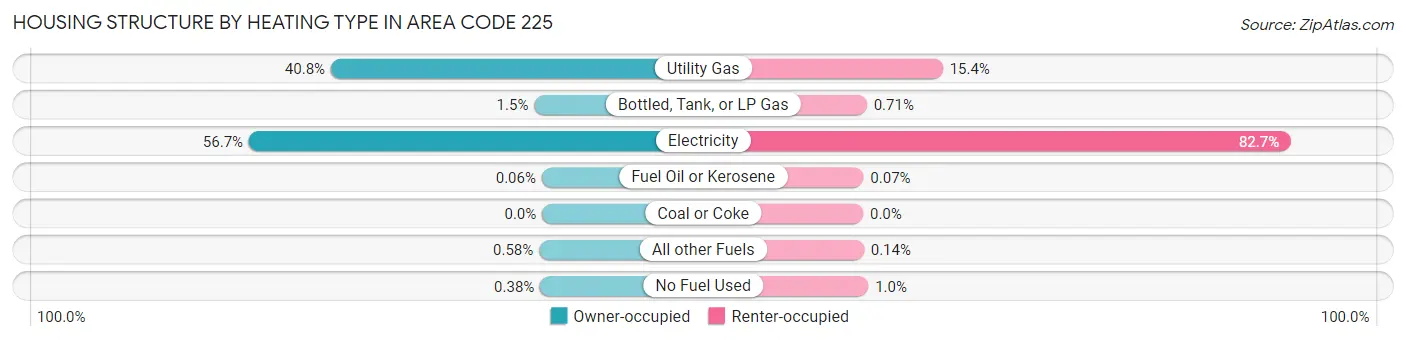
| Heating Type | Owner-occupied | Renter-occupied |
| Utility Gas | 92,831 (40.8%) | 15,340 (15.4%) |
| Bottled, Tank, or LP Gas | 3,451 (1.5%) | 710 (0.7%) |
| Electricity | 128,870 (56.7%) | 82,426 (82.7%) |
| Fuel Oil or Kerosene | 130 (0.1%) | 65 (0.1%) |
| Coal or Coke | 0 (0.0%) | 0 (0.0%) |
| All other Fuels | 1,311 (0.6%) | 144 (0.1%) |
| No Fuel Used | 864 (0.4%) | 992 (1.0%) |
| Total | 227,457 (100.0%) | 99,677 (100.0%) |
Household Vehicle Usage in Area Code 225
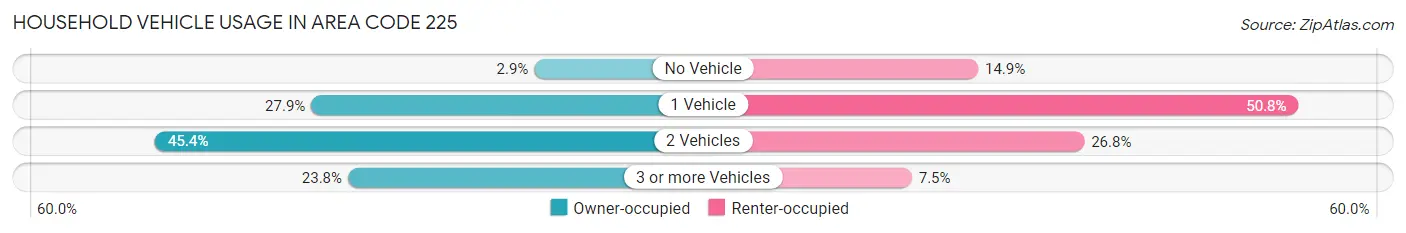
| Vehicles per Household | Owner-occupied | Renter-occupied |
| No Vehicle | 6,634 (2.9%) | 14,858 (14.9%) |
| 1 Vehicle | 63,466 (27.9%) | 50,626 (50.8%) |
| 2 Vehicles | 103,235 (45.4%) | 26,725 (26.8%) |
| 3 or more Vehicles | 54,122 (23.8%) | 7,468 (7.5%) |
| Total | 227,457 (100.0%) | 99,677 (100.0%) |
Real Estate & Mortgages in Area Code 225
Real Estate and Mortgage Overview in Area Code 225
| Characteristic | Without Mortgage | With Mortgage |
| Housing Units | 94,186 | 133,271 |
| Median Property Value | $12,692,400 | $14,614,100 |
| Median Household Income | $4,365,378 | $38,500 |
| Monthly Housing Costs | $29,352 | $9,816 |
| Real Estate Taxes | $51,516 | $11,265 |
Property Value by Mortgage Status in Area Code 225
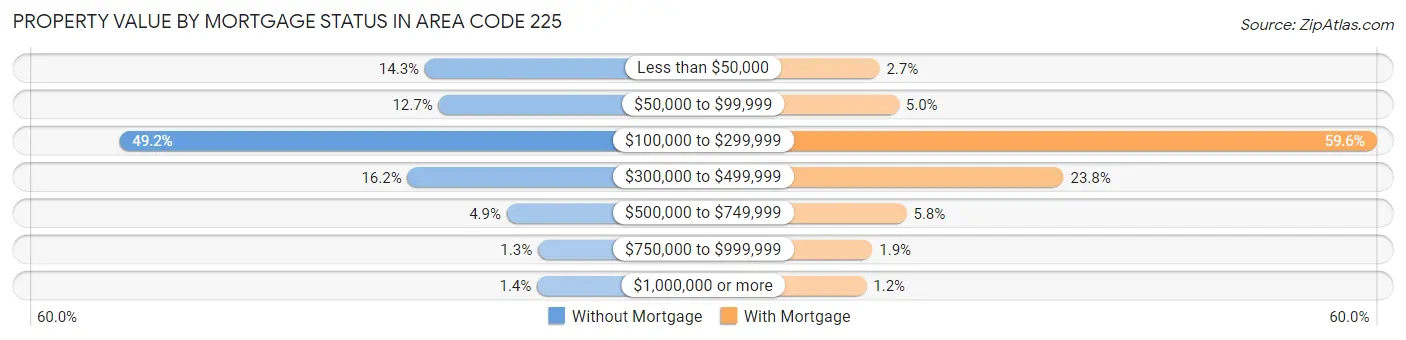
| Property Value | Without Mortgage | With Mortgage |
| Less than $50,000 | 13,426 (14.2%) | 3,632 (2.7%) |
| $50,000 to $99,999 | 11,958 (12.7%) | 6,603 (5.0%) |
| $100,000 to $299,999 | 46,304 (49.2%) | 79,384 (59.6%) |
| $300,000 to $499,999 | 15,295 (16.2%) | 31,678 (23.8%) |
| $500,000 to $749,999 | 4,609 (4.9%) | 7,772 (5.8%) |
| $750,000 to $999,999 | 1,249 (1.3%) | 2,564 (1.9%) |
| $1,000,000 or more | 1,345 (1.4%) | 1,638 (1.2%) |
| Total | 94,186 (100.0%) | 133,271 (100.0%) |
Household Income by Mortgage Status in Area Code 225
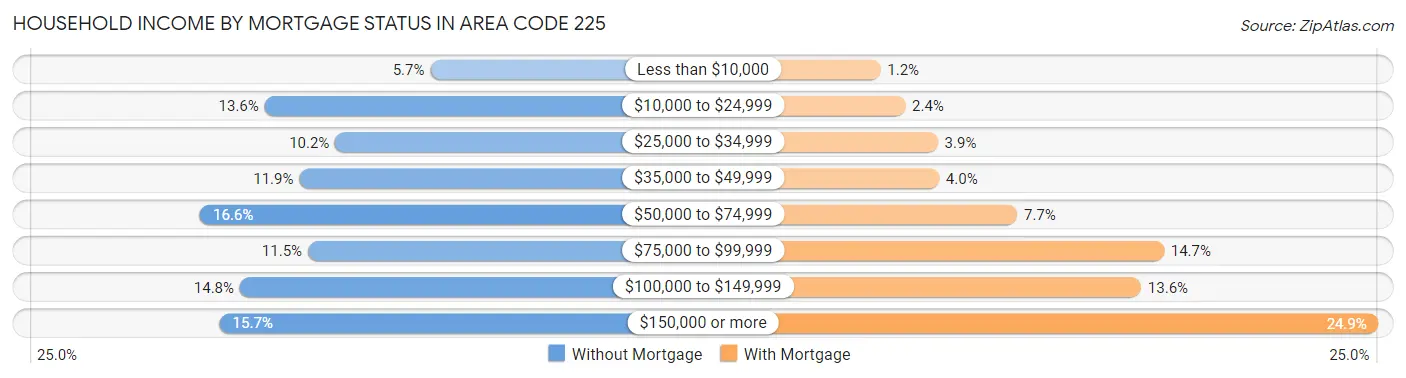
| Household Income | Without Mortgage | With Mortgage |
| Less than $10,000 | 5,351 (5.7%) | 1,566 (1.2%) |
| $10,000 to $24,999 | 12,785 (13.6%) | 3,144 (2.4%) |
| $25,000 to $34,999 | 9,619 (10.2%) | 5,211 (3.9%) |
| $35,000 to $49,999 | 11,226 (11.9%) | 5,296 (4.0%) |
| $50,000 to $74,999 | 15,676 (16.6%) | 10,242 (7.7%) |
| $75,000 to $99,999 | 10,843 (11.5%) | 19,565 (14.7%) |
| $100,000 to $149,999 | 13,890 (14.7%) | 18,109 (13.6%) |
| $150,000 or more | 14,796 (15.7%) | 33,204 (24.9%) |
| Total | 94,186 (100.0%) | 133,271 (100.0%) |
Property Value to Household Income Ratio in Area Code 225
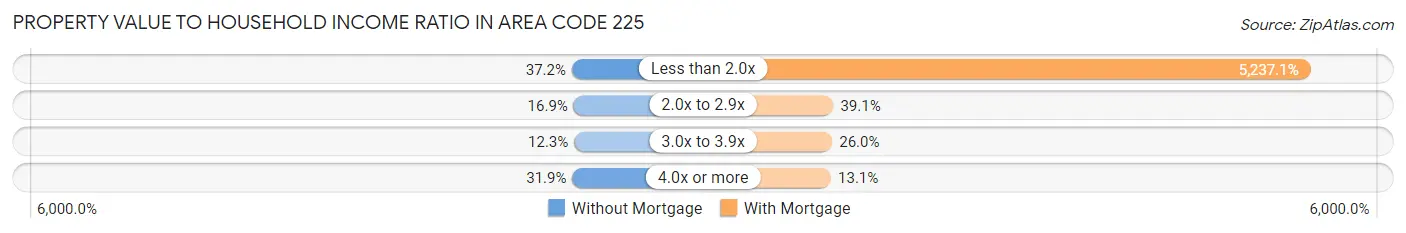
| Value-to-Income Ratio | Without Mortgage | With Mortgage |
| Less than 2.0x | 35,072 (37.2%) | 6,979,496 (5,237.1%) |
| 2.0x to 2.9x | 15,883 (16.9%) | 52,165 (39.1%) |
| 3.0x to 3.9x | 11,589 (12.3%) | 34,624 (26.0%) |
| 4.0x or more | 30,001 (31.9%) | 17,437 (13.1%) |
| Total | 94,186 (100.0%) | 133,271 (100.0%) |
Real Estate Taxes by Mortgage Status in Area Code 225
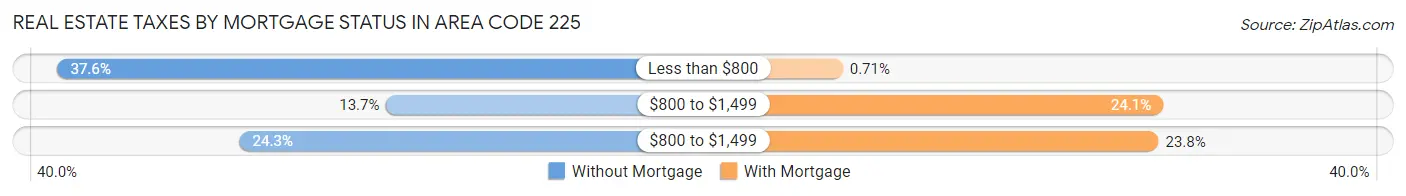
| Property Taxes | Without Mortgage | With Mortgage |
| Less than $800 | 35,407 (37.6%) | 951 (0.7%) |
| $800 to $1,499 | 12,854 (13.7%) | 32,126 (24.1%) |
| $800 to $1,499 | 22,881 (24.3%) | 31,697 (23.8%) |
| Total | 94,186 (100.0%) | 133,271 (100.0%) |
Health & Disability in Area Code 225
Health Insurance Coverage by Age in Area Code 225
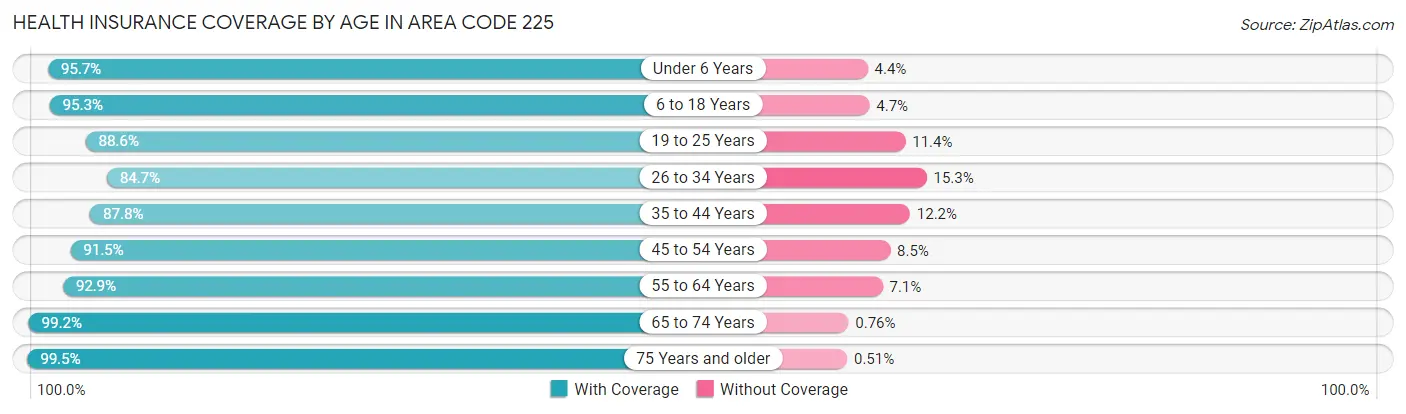
| Age Bracket | With Coverage | Without Coverage |
| Under 6 Years | 64,234 (95.7%) | 2,918 (4.3%) |
| 6 to 18 Years | 145,623 (95.3%) | 7,151 (4.7%) |
| 19 to 25 Years | 87,172 (88.6%) | 11,178 (11.4%) |
| 26 to 34 Years | 89,985 (84.7%) | 16,310 (15.3%) |
| 35 to 44 Years | 100,574 (87.8%) | 14,009 (12.2%) |
| 45 to 54 Years | 91,350 (91.5%) | 8,526 (8.5%) |
| 55 to 64 Years | 96,361 (92.9%) | 7,393 (7.1%) |
| 65 to 74 Years | 78,042 (99.2%) | 601 (0.8%) |
| 75 Years and older | 47,807 (99.5%) | 244 (0.5%) |
| Total | 801,148 (92.1%) | 68,330 (7.9%) |
Health Insurance Coverage by Citizenship Status in Area Code 225
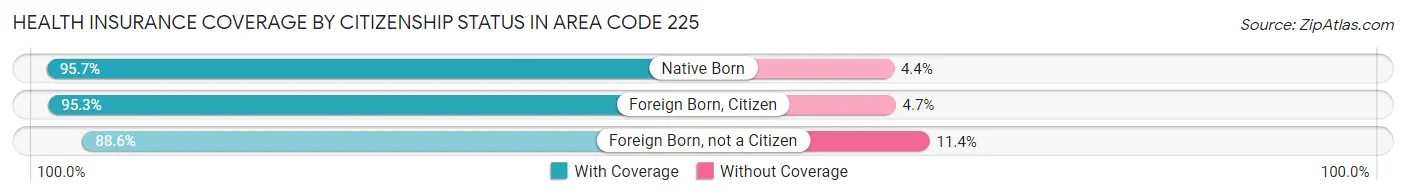
| Citizenship Status | With Coverage | Without Coverage |
| Native Born | 64,234 (95.7%) | 2,918 (4.3%) |
| Foreign Born, Citizen | 145,623 (95.3%) | 7,151 (4.7%) |
| Foreign Born, not a Citizen | 87,172 (88.6%) | 11,178 (11.4%) |
Health Insurance Coverage by Household Income in Area Code 225
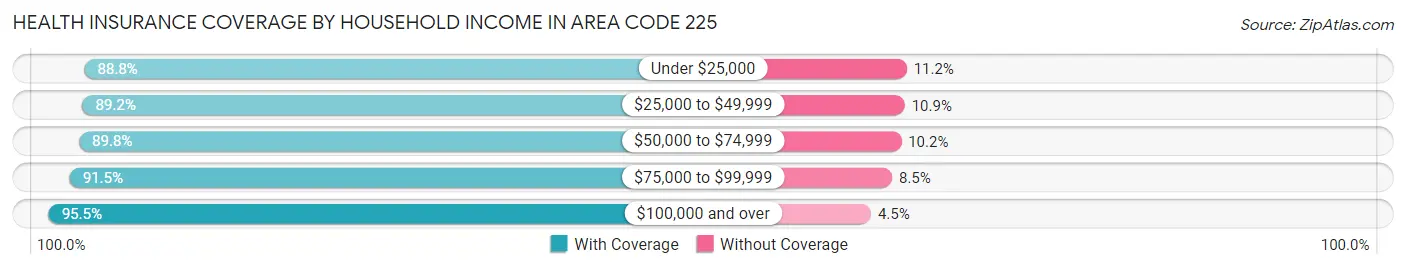
| Household Income | With Coverage | Without Coverage |
| Under $25,000 | 104,336 (88.8%) | 13,182 (11.2%) |
| $25,000 to $49,999 | 131,465 (89.1%) | 16,002 (10.8%) |
| $50,000 to $74,999 | 115,793 (89.8%) | 13,157 (10.2%) |
| $75,000 to $99,999 | 94,768 (91.5%) | 8,777 (8.5%) |
| $100,000 and over | 344,720 (95.5%) | 16,368 (4.5%) |
Public vs Private Health Insurance Coverage by Age in Area Code 225
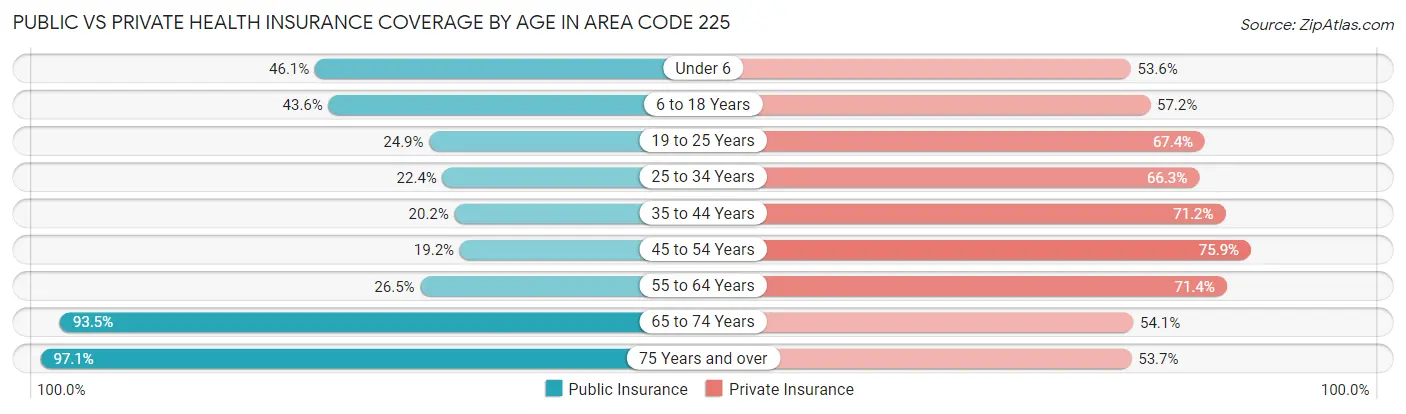
| Age Bracket | Public Insurance | Private Insurance |
| Under 6 | 30,946 (46.1%) | 35,990 (53.6%) |
| 6 to 18 Years | 66,562 (43.6%) | 87,402 (57.2%) |
| 19 to 25 Years | 24,457 (24.9%) | 66,290 (67.4%) |
| 25 to 34 Years | 23,810 (22.4%) | 70,498 (66.3%) |
| 35 to 44 Years | 23,127 (20.2%) | 81,573 (71.2%) |
| 45 to 54 Years | 19,179 (19.2%) | 75,831 (75.9%) |
| 55 to 64 Years | 27,522 (26.5%) | 74,111 (71.4%) |
| 65 to 74 Years | 73,489 (93.4%) | 42,513 (54.1%) |
| 75 Years and over | 46,632 (97.1%) | 25,816 (53.7%) |
| Total | 335,724 (38.6%) | 560,024 (64.4%) |
Disability Status by Sex by Age in Area Code 225
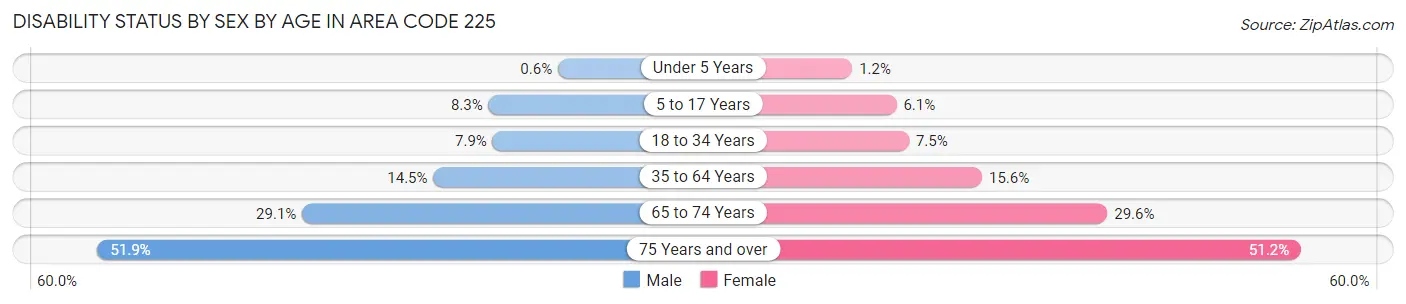
| Age Bracket | Male | Female |
| Under 5 Years | 165 (0.6%) | 313 (1.2%) |
| 5 to 17 Years | 6,366 (8.3%) | 4,478 (6.1%) |
| 18 to 34 Years | 8,524 (7.9%) | 8,346 (7.5%) |
| 35 to 64 Years | 22,281 (14.5%) | 25,666 (15.6%) |
| 65 to 74 Years | 10,449 (29.1%) | 12,634 (29.6%) |
| 75 Years and over | 10,097 (51.9%) | 14,626 (51.1%) |
Disability Class by Sex by Age in Area Code 225
Disability Class: Hearing Difficulty
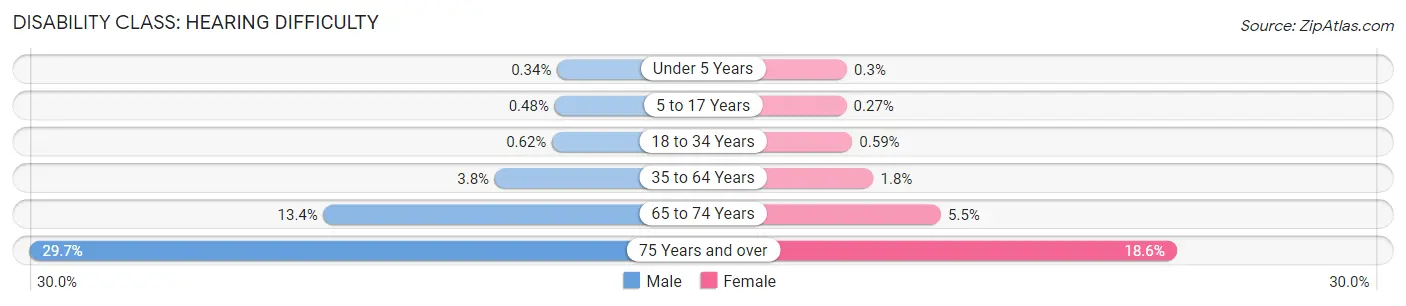
| Age Bracket | Male | Female |
| Under 5 Years | 95 (0.3%) | 82 (0.3%) |
| 5 to 17 Years | 368 (0.5%) | 197 (0.3%) |
| 18 to 34 Years | 675 (0.6%) | 659 (0.6%) |
| 35 to 64 Years | 5,860 (3.8%) | 2,914 (1.8%) |
| 65 to 74 Years | 4,794 (13.4%) | 2,362 (5.5%) |
| 75 Years and over | 5,785 (29.7%) | 5,330 (18.6%) |
Disability Class: Vision Difficulty
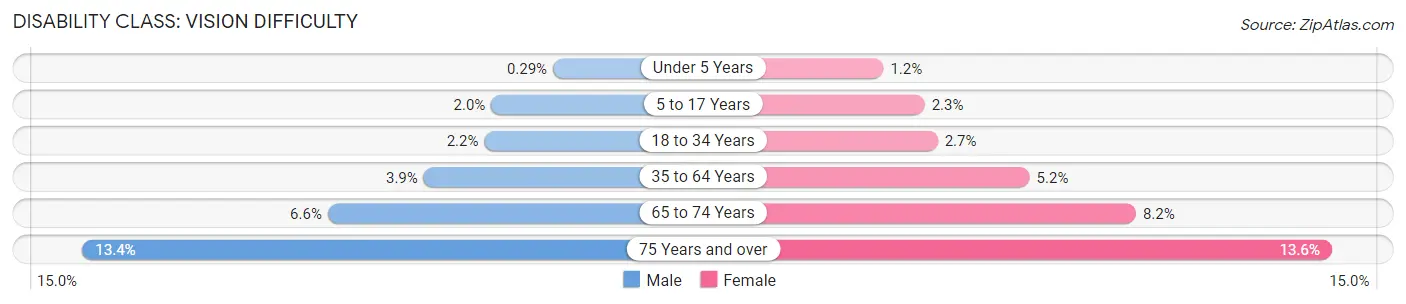
| Age Bracket | Male | Female |
| Under 5 Years | 80 (0.3%) | 313 (1.2%) |
| 5 to 17 Years | 1,537 (2.0%) | 1,700 (2.3%) |
| 18 to 34 Years | 2,382 (2.2%) | 2,975 (2.7%) |
| 35 to 64 Years | 5,991 (3.9%) | 8,588 (5.2%) |
| 65 to 74 Years | 2,356 (6.6%) | 3,499 (8.2%) |
| 75 Years and over | 2,605 (13.4%) | 3,899 (13.6%) |
Disability Class: Cognitive Difficulty
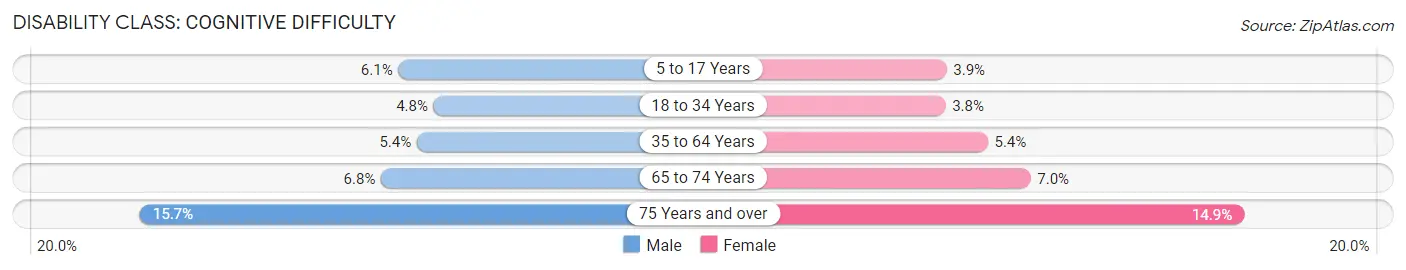
| Age Bracket | Male | Female |
| 5 to 17 Years | 4,677 (6.1%) | 2,849 (3.9%) |
| 18 to 34 Years | 5,207 (4.8%) | 4,281 (3.8%) |
| 35 to 64 Years | 8,354 (5.4%) | 8,898 (5.4%) |
| 65 to 74 Years | 2,429 (6.8%) | 2,992 (7.0%) |
| 75 Years and over | 3,059 (15.7%) | 4,268 (14.9%) |
Disability Class: Ambulatory Difficulty
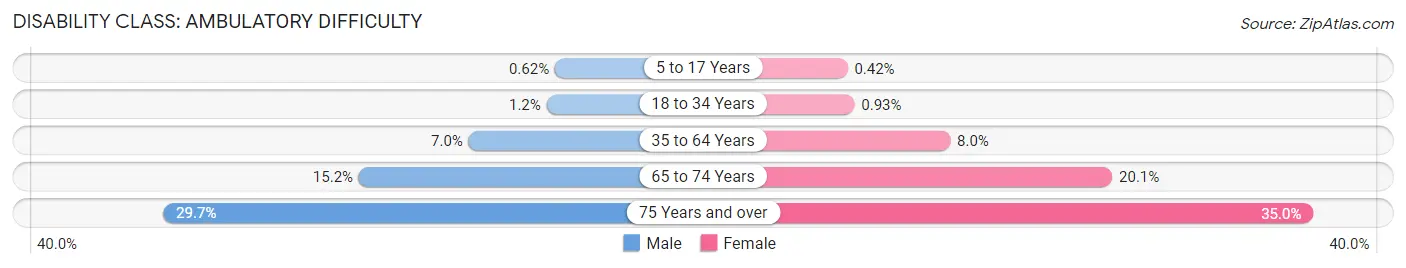
| Age Bracket | Male | Female |
| 5 to 17 Years | 474 (0.6%) | 309 (0.4%) |
| 18 to 34 Years | 1,343 (1.2%) | 1,033 (0.9%) |
| 35 to 64 Years | 10,809 (7.0%) | 13,218 (8.0%) |
| 65 to 74 Years | 5,451 (15.2%) | 8,575 (20.1%) |
| 75 Years and over | 5,781 (29.7%) | 10,008 (35.0%) |
Disability Class: Self-Care Difficulty
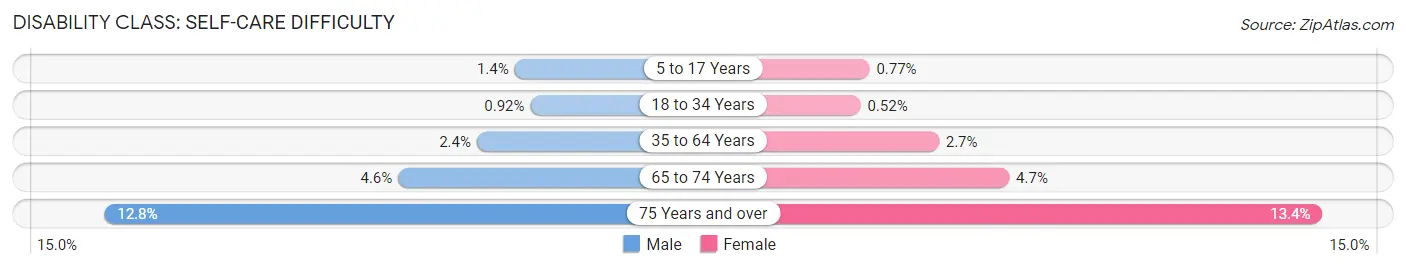
| Age Bracket | Male | Female |
| 5 to 17 Years | 1,038 (1.4%) | 568 (0.8%) |
| 18 to 34 Years | 1,002 (0.9%) | 579 (0.5%) |
| 35 to 64 Years | 3,707 (2.4%) | 4,443 (2.7%) |
| 65 to 74 Years | 1,651 (4.6%) | 1,989 (4.7%) |
| 75 Years and over | 2,486 (12.8%) | 3,825 (13.4%) |
Technology Access in Area Code 225
Computing Device Access in Area Code 225
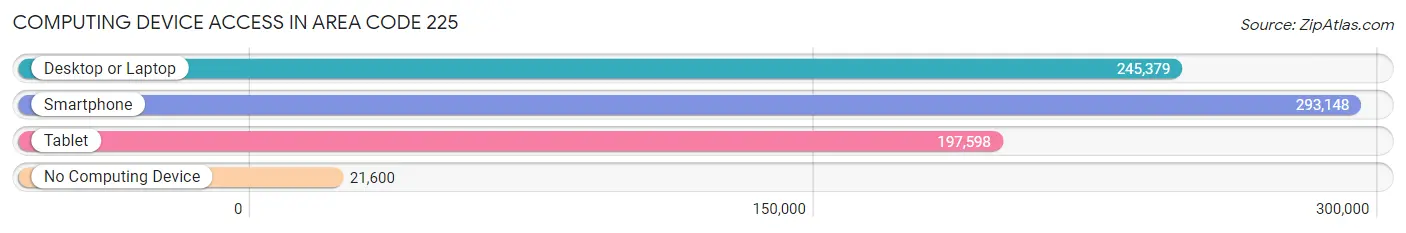
| Device Type | # Households | % Households |
| Desktop or Laptop | 245,379 | 75.0% |
| Smartphone | 293,148 | 89.6% |
| Tablet | 197,598 | 60.4% |
| No Computing Device | 21,600 | 6.6% |
| Total | 327,134 | 100.0% |
Internet Access in Area Code 225
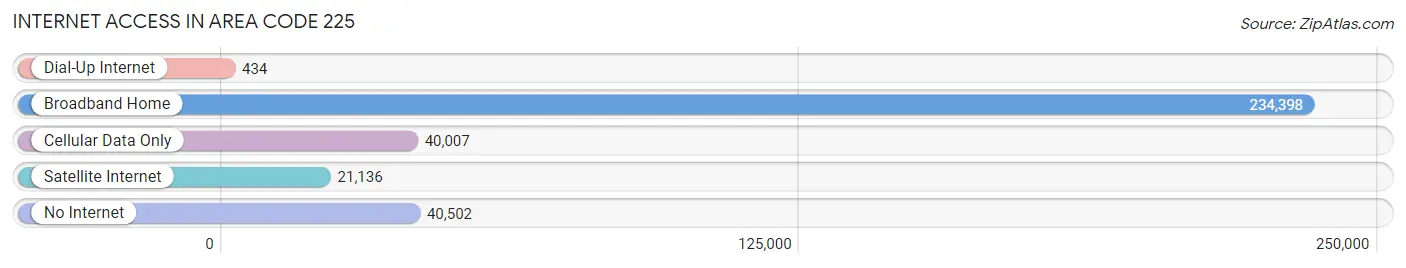
| Internet Type | # Households | % Households |
| Dial-Up Internet | 434 | 0.1% |
| Broadband Home | 234,398 | 71.7% |
| Cellular Data Only | 40,007 | 12.2% |
| Satellite Internet | 21,136 | 6.5% |
| No Internet | 40,502 | 12.4% |
| Total | 327,134 | 100.0% |
Area Code 225 Summary
Geography
Area code 225 is located in the state of Louisiana. It covers the Baton Rouge metropolitan area, which includes the cities of Baton Rouge, Gonzales, Denham Springs, and Zachary.
Social
The area code 225 is home to a diverse population of people from all walks of life. The area is known for its vibrant culture, with a variety of festivals, events, and attractions.
Economics
The economy of the area code 225 is largely driven by the oil and gas industry, as well as the manufacturing and service sectors. The area is also home to a number of universities and colleges, which provide a strong base for the local economy.
Demographics
The population of the area code 225 is estimated to be around 1.2 million people. The majority of the population is African American, with a significant Hispanic population as well. The median household income is around $50,000, and the unemployment rate is around 5%.
Common Questions
What is Per Capita Income in Area Code 225?
Per Capita income in Area Code 225 is $33,227.
What is the Median Family Income in Area Code 225?
Median Family Income in Area Code 225 is $81,913.
What is the Median Household income in Area Code 225?
Median Household Income in Area Code 225 is $67,928.
What is Income or Wage Gap in Area Code 225?
Income or Wage Gap in Area Code 225 is 34.3%.
Women in Area Code 225 earn 65.7 cents for every dollar earned by a man.
What is Family Income Deficit in Area Code 225?
Family Income Deficit in Area Code 225 is $10,924.
Families that are below poverty line in Area Code 225 earn $10,924 less on average than the poverty threshold level.
What is Inequality or Gini Index in Area Code 225?
Inequality or Gini Index in Area Code 225 is 34.98.
What is the Total Population of Area Code 225?
Total Population of Area Code 225 is 885,458.
What is the Total Male Population of Area Code 225?
Total Male Population of Area Code 225 is 434,579.
What is the Total Female Population of Area Code 225?
Total Female Population of Area Code 225 is 450,879.
What is the Ratio of Males per 100 Females in Area Code 225?
There are 96.38 Males per 100 Females in Area Code 225.
What is the Ratio of Females per 100 Males in Area Code 225?
There are 103.75 Females per 100 Males in Area Code 225.
What is the Median Population Age in Area Code 225?
Median Population Age in Area Code 225 is 39.2 Years.
What is the Average Family Size in Area Code 225
Average Family Size in Area Code 225 is 3.2 People.
What is the Average Household Size in Area Code 225
Average Household Size in Area Code 225 is 2.6 People.
How Large is the Labor Force in Area Code 225?
There are 415,303 People in the Labor Forcein in Area Code 225.
What is the Percentage of People in the Labor Force in Area Code 225?
58.9% of People are in the Labor Force in Area Code 225.
What is the Unemployment Rate in Area Code 225?
Unemployment Rate in Area Code 225 is 8.5%.