Area Code 727 Map & Demographics
Area Code 727 Map
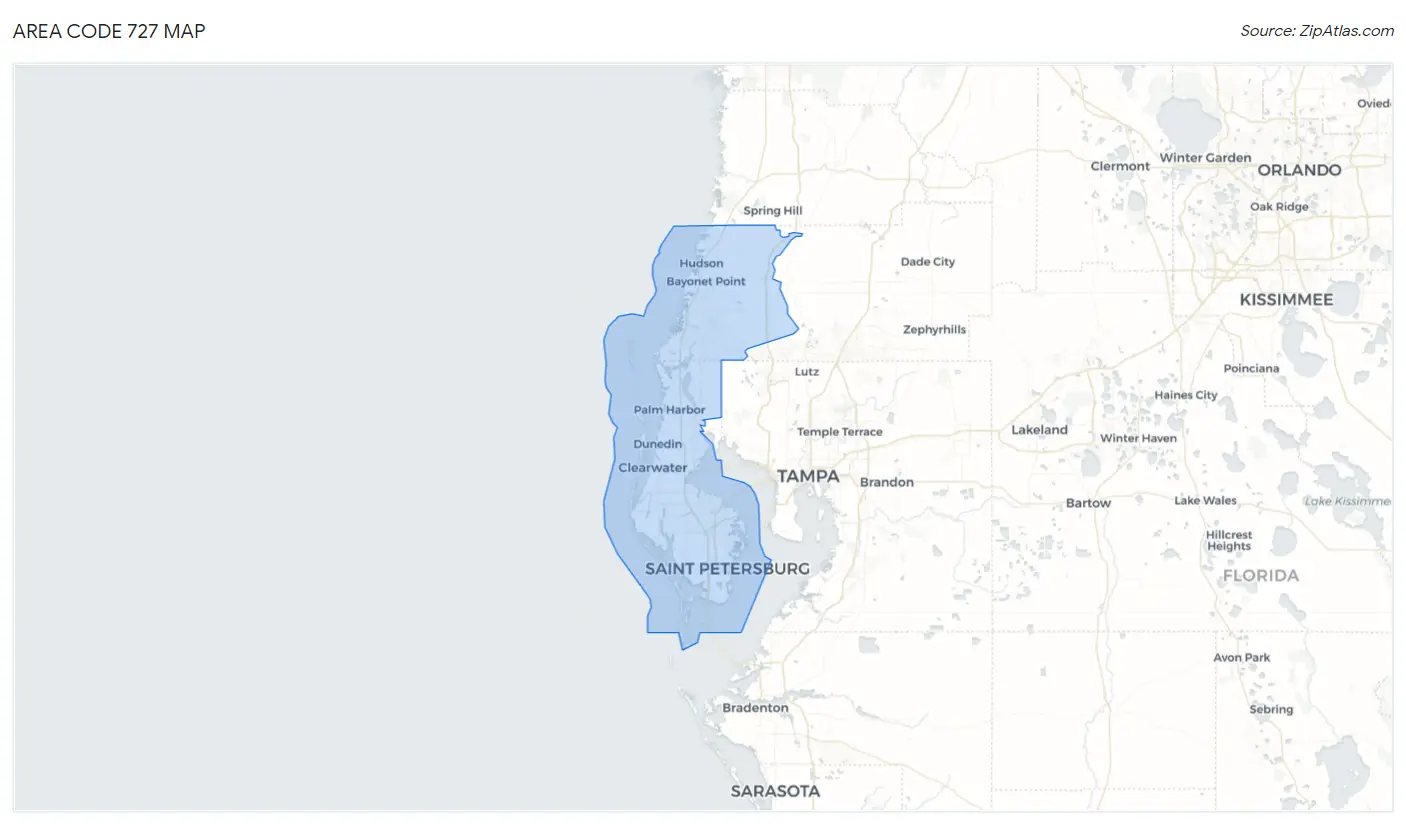
Area Code 727 Overview
$46,277
PER CAPITA INCOME
$94,058
AVG FAMILY INCOME
$71,988
AVG HOUSEHOLD INCOME
20.7%
WAGE / INCOME GAP [ % ]
79.3¢/ $1
WAGE / INCOME GAP [ $ ]
$10,358
FAMILY INCOME DEFICIT
29.13
INEQUALITY / GINI INDEX
1,382,951
TOTAL POPULATION
669,824
MALE POPULATION
713,127
FEMALE POPULATION
93.93
MALES / 100 FEMALES
106.46
FEMALES / 100 MALES
48.5
MEDIAN AGE
2.9
AVG FAMILY SIZE
2.3
AVG HOUSEHOLD SIZE
687,533
LABOR FORCE [ PEOPLE ]
58.2%
PERCENT IN LABOR FORCE
4.7%
UNEMPLOYMENT RATE
Income in Area Code 727
Income Overview in Area Code 727
Per Capita Income in Area Code 727 is $46,277, while median incomes of families and households are $94,058 and $71,988 respectively.
| Characteristic | Number | Measure |
| Per Capita Income | 1,382,951 | $46,277 |
| Median Family Income | 339,575 | $94,058 |
| Mean Family Income | 339,575 | $7,786,755 |
| Median Household Income | 598,330 | $71,988 |
| Mean Household Income | 598,330 | $6,349,087 |
| Income Deficit | 339,575 | $10,358 |
| Wage / Income Gap (%) | 1,382,951 | 20.68% |
| Wage / Income Gap ($) | 1,382,951 | 79.32¢ per $1 |
| Gini / Inequality Index | 1,382,951 | 29.13 |
Earnings by Sex in Area Code 727
Average Earnings in Area Code 727 are $45,144, $50,983 for men and $39,312 for women, a difference of 22.9%.
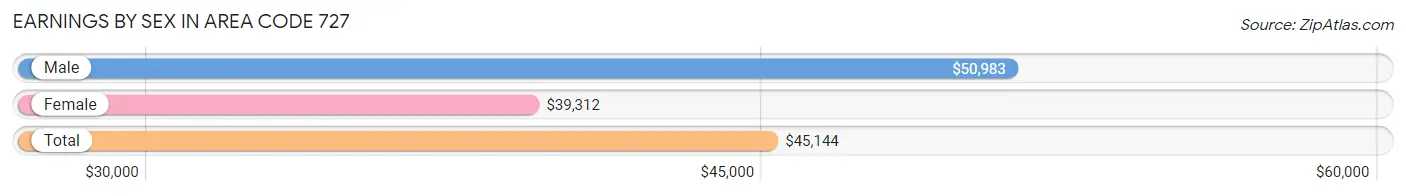
| Sex | Number | Average Earnings |
| Male | 364,653 (51.3%) | $50,983 |
| Female | 346,773 (48.7%) | $39,312 |
| Total | 711,426 (100.0%) | $45,144 |
Earnings by Sex by Income Bracket in Area Code 727
The most common earnings brackets in Area Code 727 are $100,000+ for men (66,687 | 18.3%) and $100,000+ for women (32,433 | 9.3%).
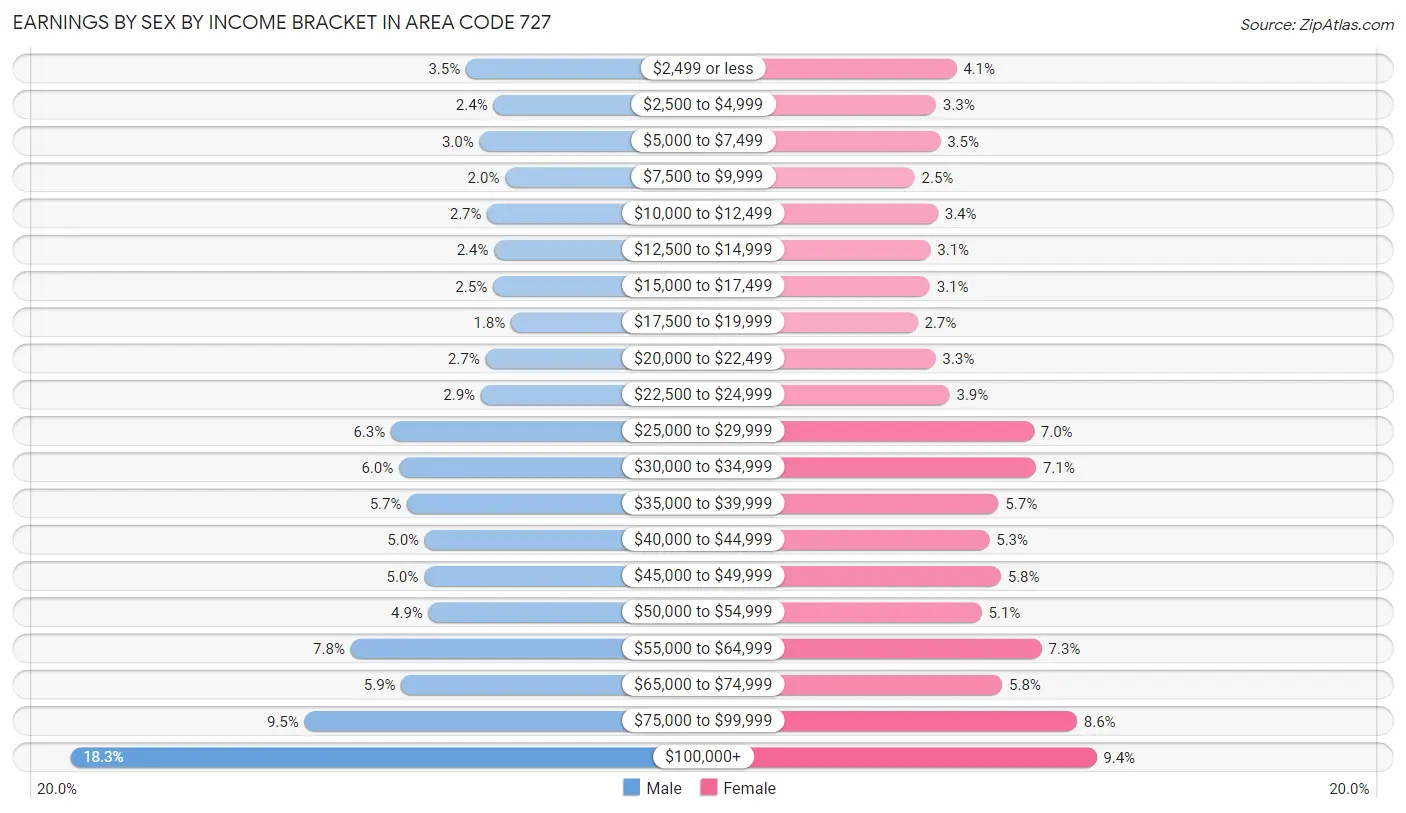
| Income | Male | Female |
| $2,499 or less | 12,601 (3.5%) | 14,220 (4.1%) |
| $2,500 to $4,999 | 8,858 (2.4%) | 11,597 (3.3%) |
| $5,000 to $7,499 | 10,764 (2.9%) | 12,152 (3.5%) |
| $7,500 to $9,999 | 7,262 (2.0%) | 8,815 (2.5%) |
| $10,000 to $12,499 | 9,706 (2.7%) | 11,824 (3.4%) |
| $12,500 to $14,999 | 8,752 (2.4%) | 10,859 (3.1%) |
| $15,000 to $17,499 | 8,931 (2.5%) | 10,772 (3.1%) |
| $17,500 to $19,999 | 6,469 (1.8%) | 9,194 (2.6%) |
| $20,000 to $22,499 | 9,961 (2.7%) | 11,526 (3.3%) |
| $22,500 to $24,999 | 10,588 (2.9%) | 13,364 (3.8%) |
| $25,000 to $29,999 | 22,849 (6.3%) | 24,302 (7.0%) |
| $30,000 to $34,999 | 21,776 (6.0%) | 24,579 (7.1%) |
| $35,000 to $39,999 | 20,625 (5.7%) | 19,709 (5.7%) |
| $40,000 to $44,999 | 18,237 (5.0%) | 18,516 (5.3%) |
| $45,000 to $49,999 | 18,348 (5.0%) | 20,017 (5.8%) |
| $50,000 to $54,999 | 17,739 (4.9%) | 17,501 (5.1%) |
| $55,000 to $64,999 | 28,380 (7.8%) | 25,310 (7.3%) |
| $65,000 to $74,999 | 21,434 (5.9%) | 20,182 (5.8%) |
| $75,000 to $99,999 | 34,686 (9.5%) | 29,901 (8.6%) |
| $100,000+ | 66,687 (18.3%) | 32,433 (9.3%) |
| Total | 364,653 (100.0%) | 346,773 (100.0%) |
Earnings by Sex by Educational Attainment in Area Code 727
Average earnings in Area Code 727 are $3,408,153 for men and $2,697,521 for women, a difference of 20.8%. Men with an educational attainment of graduate degree enjoy the highest average annual earnings of $5,464,210, while those with less than high school education earn the least with $1,566,996. Women with an educational attainment of graduate degree earn the most with the average annual earnings of $4,010,763, while those with less than high school education have the smallest earnings of $1,168,566.
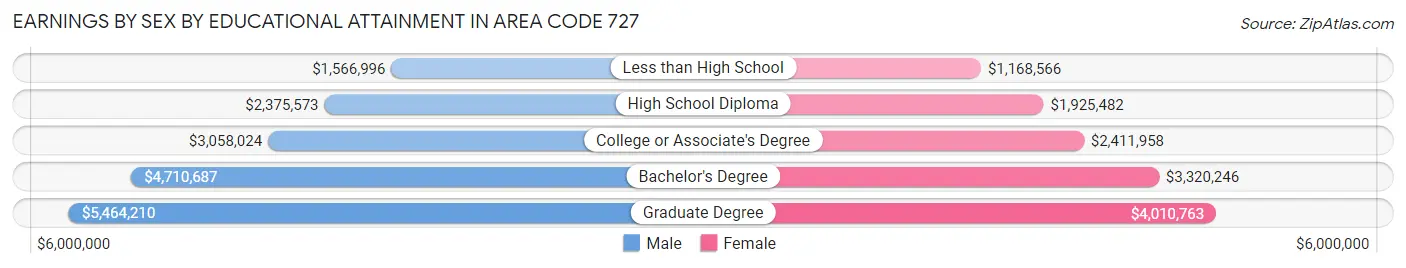
| Educational Attainment | Male Income | Female Income |
| Less than High School | $1,566,996 | $1,168,566 |
| High School Diploma | $2,375,573 | $1,925,482 |
| College or Associate's Degree | $3,058,024 | $2,411,958 |
| Bachelor's Degree | $4,710,687 | $3,320,246 |
| Graduate Degree | $5,464,210 | $4,010,763 |
| Total | $3,408,153 | $2,697,521 |
Family Income in Area Code 727
Family Income Brackets in Area Code 727
According to the Area Code 727 family income data, there are 3,999,854 families falling into the $100,000 to $149,999 income range, which is the most common income bracket and makes up 1,177.9% of all families. Conversely, the $10,000 to $14,999 income bracket is the least frequent group with only 309,692 families (91.2%) belonging to this category.
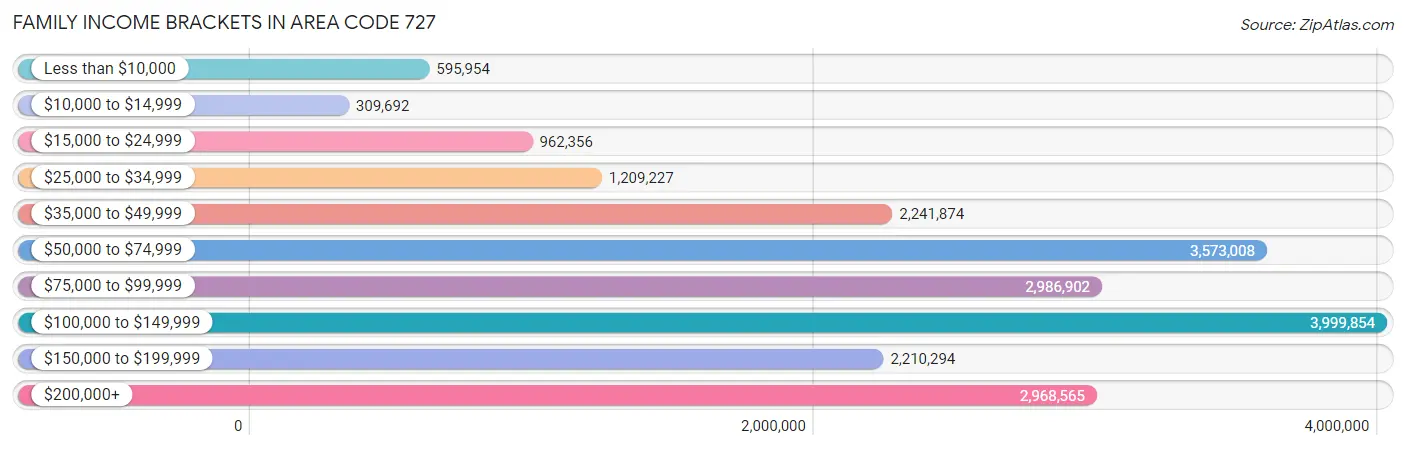
| Income Bracket | # Families | % Families |
| Less than $10,000 | 595,954 | 175.5% |
| $10,000 to $14,999 | 309,692 | 91.2% |
| $15,000 to $24,999 | 962,356 | 283.4% |
| $25,000 to $34,999 | 1,209,227 | 356.1% |
| $35,000 to $49,999 | 2,241,874 | 660.2% |
| $50,000 to $74,999 | 3,573,008 | 1,052.2% |
| $75,000 to $99,999 | 2,986,902 | 879.6% |
| $100,000 to $149,999 | 3,999,854 | 1,177.9% |
| $150,000 to $199,999 | 2,210,294 | 650.9% |
| $200,000+ | 2,968,565 | 874.2% |
Family Income by Famaliy Size in Area Code 727
5-person families (17,042 | 5.0%) account for the highest median family income in Area Code 727 with $126,382 per family, while 2-person families (196,822 | 58.0%) have the highest median income of $41,961 per family member.
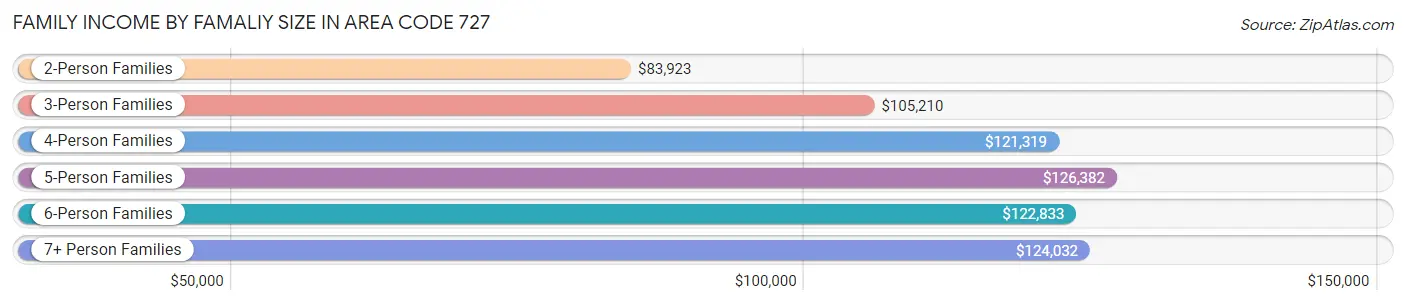
| Income Bracket | # Families | Median Income |
| 2-Person Families | 196,822 (58.0%) | $83,923 |
| 3-Person Families | 70,510 (20.8%) | $105,210 |
| 4-Person Families | 47,609 (14.0%) | $121,319 |
| 5-Person Families | 17,042 (5.0%) | $126,382 |
| 6-Person Families | 5,350 (1.6%) | $122,833 |
| 7+ Person Families | 2,242 (0.7%) | $124,032 |
| Total | 339,575 (100.0%) | $94,058 |
Family Income by Number of Earners in Area Code 727
The median family income in Area Code 727 is $94,058, with families comprising 3+ earners (27,734) having the highest median family income of $147,076, while families with no earners (70,544) have the lowest median family income of $55,606, accounting for 8.2% and 20.8% of families, respectively.
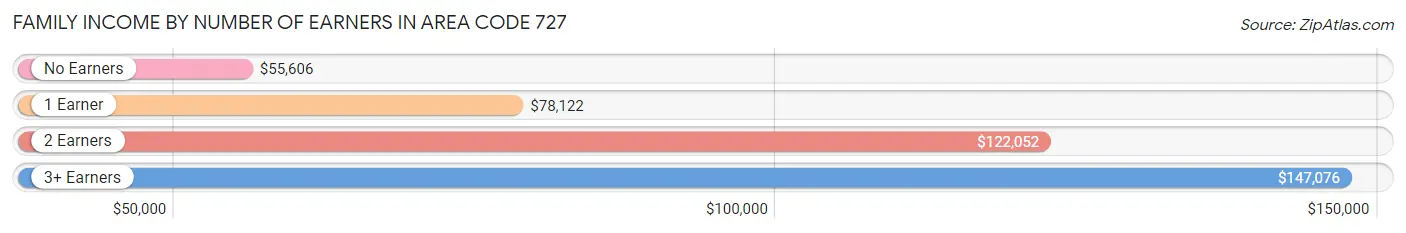
| Number of Earners | # Families | Median Income |
| No Earners | 70,544 (20.8%) | $55,606 |
| 1 Earner | 109,421 (32.2%) | $78,122 |
| 2 Earners | 131,876 (38.8%) | $122,052 |
| 3+ Earners | 27,734 (8.2%) | $147,076 |
| Total | 339,575 (100.0%) | $94,058 |
Household Income in Area Code 727
Household Income Brackets in Area Code 727
With 6,441,022 households falling in the category, the $50,000 to $74,999 income range is the most frequent in Area Code 727, accounting for 1,076.5% of all households. In contrast, only 1,362,996 households (227.8%) fall into the $10,000 to $14,999 income bracket, making it the least populous group.
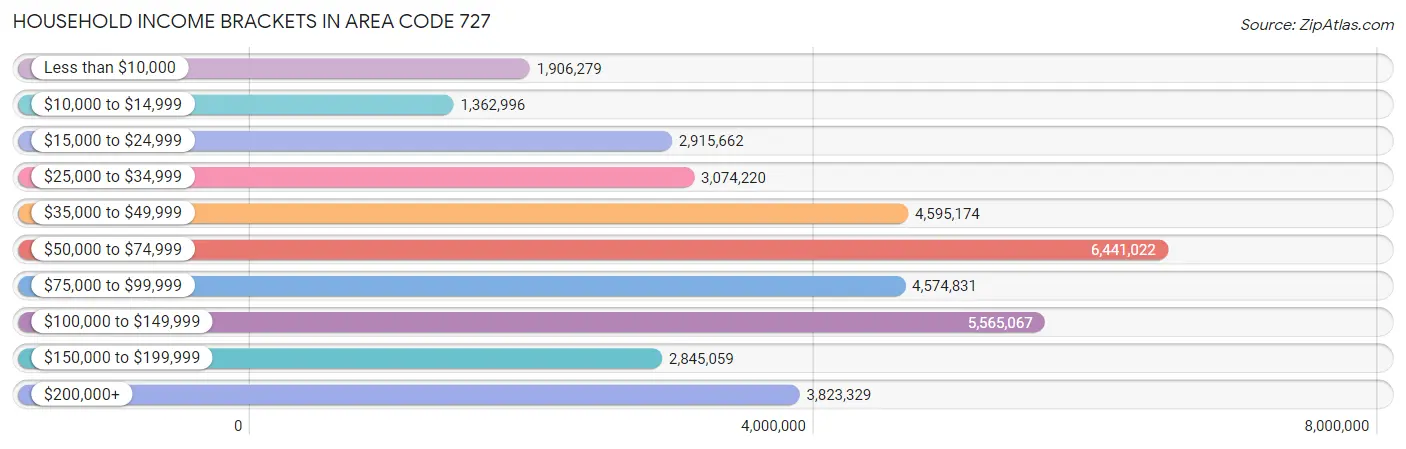
| Income Bracket | # Households | % Households |
| Less than $10,000 | 1,906,279 | 318.6% |
| $10,000 to $14,999 | 1,362,996 | 227.8% |
| $15,000 to $24,999 | 2,915,662 | 487.3% |
| $25,000 to $34,999 | 3,074,220 | 513.8% |
| $35,000 to $49,999 | 4,595,174 | 768.0% |
| $50,000 to $74,999 | 6,441,022 | 1,076.5% |
| $75,000 to $99,999 | 4,574,831 | 764.6% |
| $100,000 to $149,999 | 5,565,067 | 930.1% |
| $150,000 to $199,999 | 2,845,059 | 475.5% |
| $200,000+ | 3,823,329 | 639.0% |
Household Income by Householder Age in Area Code 727
The median household income in Area Code 727 is $71,988, with the highest median household income of $88,362 found in the 25 to 44 years age bracket for the primary householder. A total of 151,916 households (25.4%) fall into this category. Meanwhile, the 15 to 24 years age bracket for the primary householder has the lowest median household income of $47,399, with 12,502 households (2.1%) in this group.
| Income Bracket | # Households | Median Income |
| 15 to 24 Years | 12,502 (2.1%) | $47,399 |
| 25 to 44 Years | 151,916 (25.4%) | $88,362 |
| 45 to 64 Years | 223,703 (37.4%) | $87,908 |
| 65+ Years | 210,209 (35.1%) | $51,584 |
| Total | 598,330 (100.0%) | $71,988 |
Poverty in Area Code 727
Income Below Poverty by Sex and Age in Area Code 727
With 10.9% poverty level for males and 12.6% for females among the residents of Area Code 727, under 5 year old males and 5 year old females are the most vulnerable to poverty, with 4,900 males (16.7%) and 1,218 females (20.2%) in their respective age groups living below the poverty level.
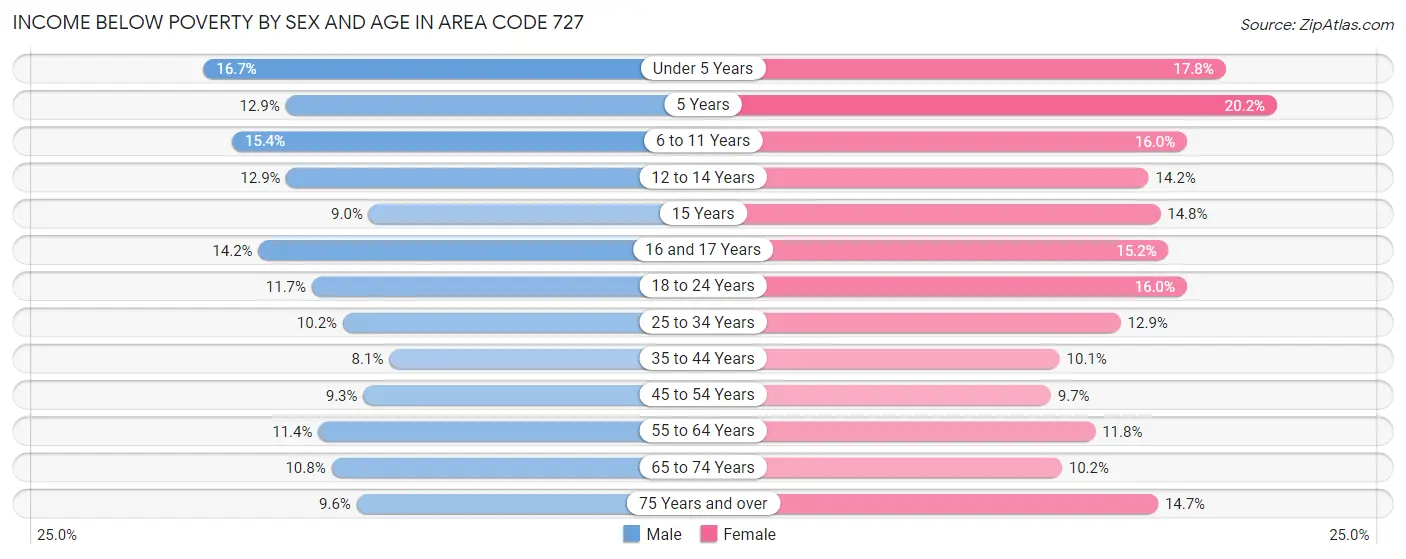
| Age Bracket | Male | Female |
| Under 5 Years | 4,900 (16.7%) | 5,114 (17.8%) |
| 5 Years | 727 (12.9%) | 1,218 (20.2%) |
| 6 to 11 Years | 5,994 (15.4%) | 5,967 (16.0%) |
| 12 to 14 Years | 2,596 (12.9%) | 2,419 (14.2%) |
| 15 Years | 673 (9.0%) | 1,037 (14.8%) |
| 16 and 17 Years | 1,925 (14.1%) | 2,127 (15.2%) |
| 18 to 24 Years | 5,122 (11.7%) | 6,971 (16.0%) |
| 25 to 34 Years | 8,520 (10.2%) | 10,908 (12.9%) |
| 35 to 44 Years | 6,343 (8.1%) | 8,092 (10.1%) |
| 45 to 54 Years | 8,202 (9.3%) | 8,761 (9.7%) |
| 55 to 64 Years | 11,689 (11.4%) | 13,053 (11.8%) |
| 65 to 74 Years | 8,917 (10.8%) | 9,784 (10.2%) |
| 75 Years and over | 6,078 (9.6%) | 12,584 (14.7%) |
| Total | 71,686 (10.9%) | 88,035 (12.6%) |
Income Above Poverty by Sex and Age in Area Code 727
According to the poverty statistics in Area Code 727, males aged 35 to 44 years and females aged 45 to 54 years are the age groups that are most secure financially, with 91.9% of males and 90.3% of females in these age groups living above the poverty line.
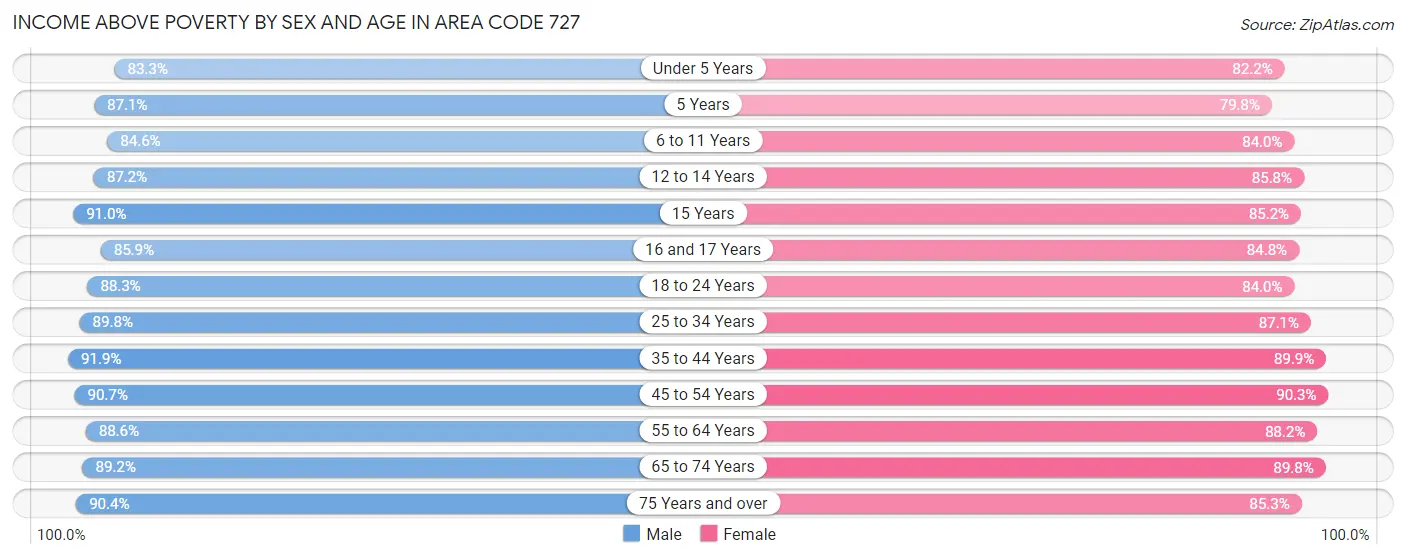
| Age Bracket | Male | Female |
| Under 5 Years | 24,447 (83.3%) | 23,597 (82.2%) |
| 5 Years | 4,911 (87.1%) | 4,814 (79.8%) |
| 6 to 11 Years | 32,985 (84.6%) | 31,276 (84.0%) |
| 12 to 14 Years | 17,609 (87.2%) | 14,567 (85.8%) |
| 15 Years | 6,777 (91.0%) | 5,981 (85.2%) |
| 16 and 17 Years | 11,680 (85.9%) | 11,904 (84.8%) |
| 18 to 24 Years | 38,774 (88.3%) | 36,557 (84.0%) |
| 25 to 34 Years | 74,780 (89.8%) | 73,413 (87.1%) |
| 35 to 44 Years | 72,123 (91.9%) | 71,965 (89.9%) |
| 45 to 54 Years | 80,172 (90.7%) | 81,590 (90.3%) |
| 55 to 64 Years | 91,107 (88.6%) | 97,936 (88.2%) |
| 65 to 74 Years | 73,993 (89.2%) | 86,054 (89.8%) |
| 75 Years and over | 57,284 (90.4%) | 73,198 (85.3%) |
| Total | 586,642 (89.1%) | 612,852 (87.4%) |
Income Below Poverty Among Married-Couple Families in Area Code 727
The poverty statistics for married-couple families in Area Code 727 show that 4.5% or 11,316 of the total 253,166 families live below the poverty line. Families with 5 or more children have the highest poverty rate of 18.9%, comprising of 138 families. On the other hand, families with no children have the lowest poverty rate of 3.9%, which includes 6,949 families.
| Children | Above Poverty | Below Poverty |
| No Children | 170,108 (96.1%) | 6,949 (3.9%) |
| 1 or 2 Children | 61,306 (95.0%) | 3,223 (5.0%) |
| 3 or 4 Children | 9,843 (90.7%) | 1,006 (9.3%) |
| 5 or more Children | 593 (81.1%) | 138 (18.9%) |
| Total | 241,850 (95.5%) | 11,316 (4.5%) |
Income Below Poverty Among Single-Parent Households in Area Code 727
According to the poverty data in Area Code 727, 13.0% or 3,029 single-father households and 18.1% or 11,467 single-mother households are living below the poverty line. Among single-father households, those with 1 or 2 children have the highest poverty rate, with 1,998 households (18.0%) experiencing poverty. Likewise, among single-mother households, those with 3 or 4 children have the highest poverty rate, with 2,402 households (48.3%) falling below the poverty line.
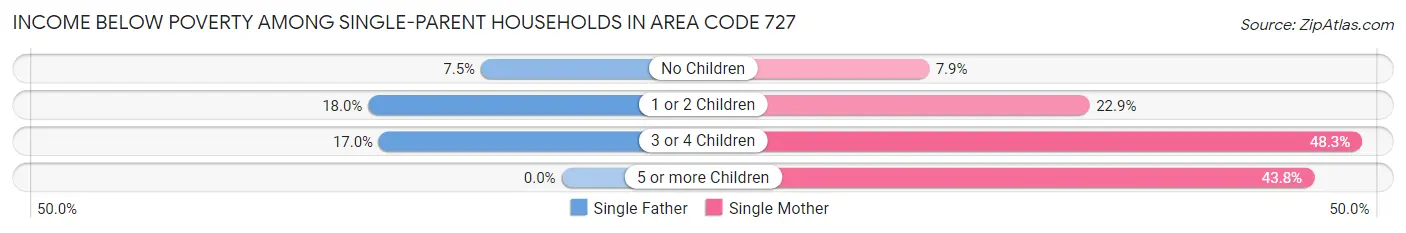
| Children | Single Father | Single Mother |
| No Children | 812 (7.5%) | 2,300 (7.9%) |
| 1 or 2 Children | 1,998 (18.0%) | 6,564 (22.9%) |
| 3 or 4 Children | 219 (17.0%) | 2,402 (48.3%) |
| 5 or more Children | 0 (0.0%) | 201 (43.8%) |
| Total | 3,029 (13.0%) | 11,467 (18.1%) |
Income Below Poverty Among Married-Couple vs Single-Parent Households in Area Code 727
The poverty data for Area Code 727 shows that 11,316 of the married-couple family households (4.5%) and 14,496 of the single-parent households (16.8%) are living below the poverty level. Within the married-couple family households, those with 5 or more children have the highest poverty rate, with 138 households (18.9%) falling below the poverty line. Among the single-parent households, those with 3 or 4 children have the highest poverty rate, with 2,621 household (41.8%) living below poverty.
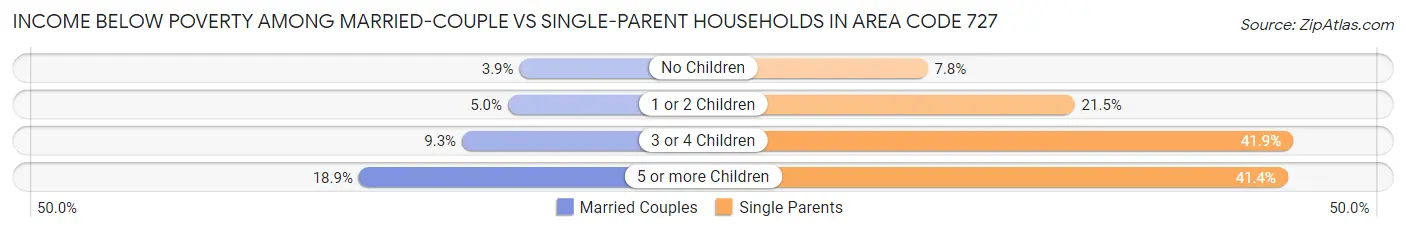
| Children | Married-Couple Families | Single-Parent Households |
| No Children | 6,949 (3.9%) | 3,112 (7.8%) |
| 1 or 2 Children | 3,223 (5.0%) | 8,562 (21.5%) |
| 3 or 4 Children | 1,006 (9.3%) | 2,621 (41.8%) |
| 5 or more Children | 138 (18.9%) | 201 (41.4%) |
| Total | 11,316 (4.5%) | 14,496 (16.8%) |
Race in Area Code 727
The most populous races in Area Code 727 are White / Caucasian (1,068,674 | 77.3%), Hispanic or Latino (188,704 | 13.7%), and Black / African American (119,829 | 8.7%).
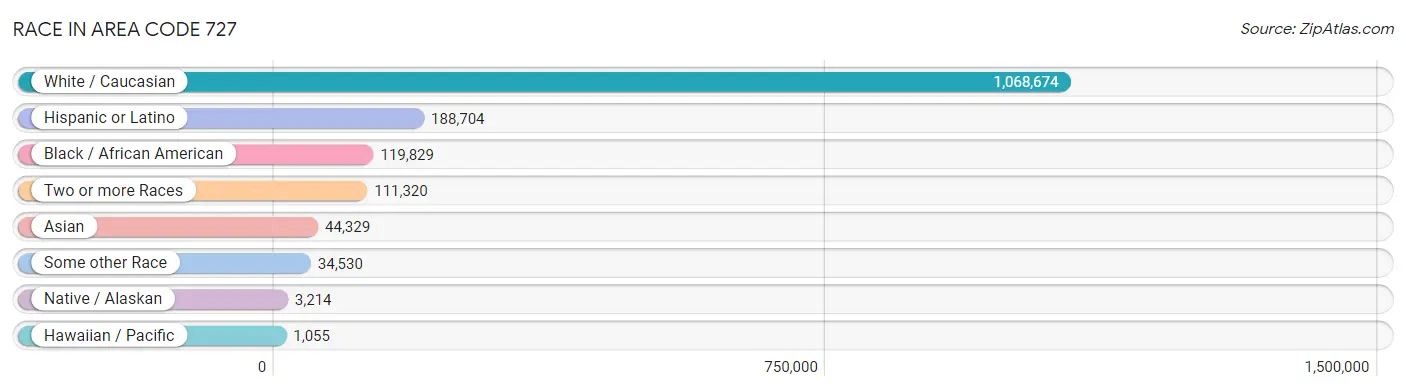
| Race | # Population | % Population |
| Asian | 44,329 | 3.2% |
| Black / African American | 119,829 | 8.7% |
| Hawaiian / Pacific | 1,055 | 0.1% |
| Hispanic or Latino | 188,704 | 13.7% |
| Native / Alaskan | 3,214 | 0.2% |
| White / Caucasian | 1,068,674 | 77.3% |
| Two or more Races | 111,320 | 8.1% |
| Some other Race | 34,530 | 2.5% |
| Total | 1,382,951 | 100.0% |
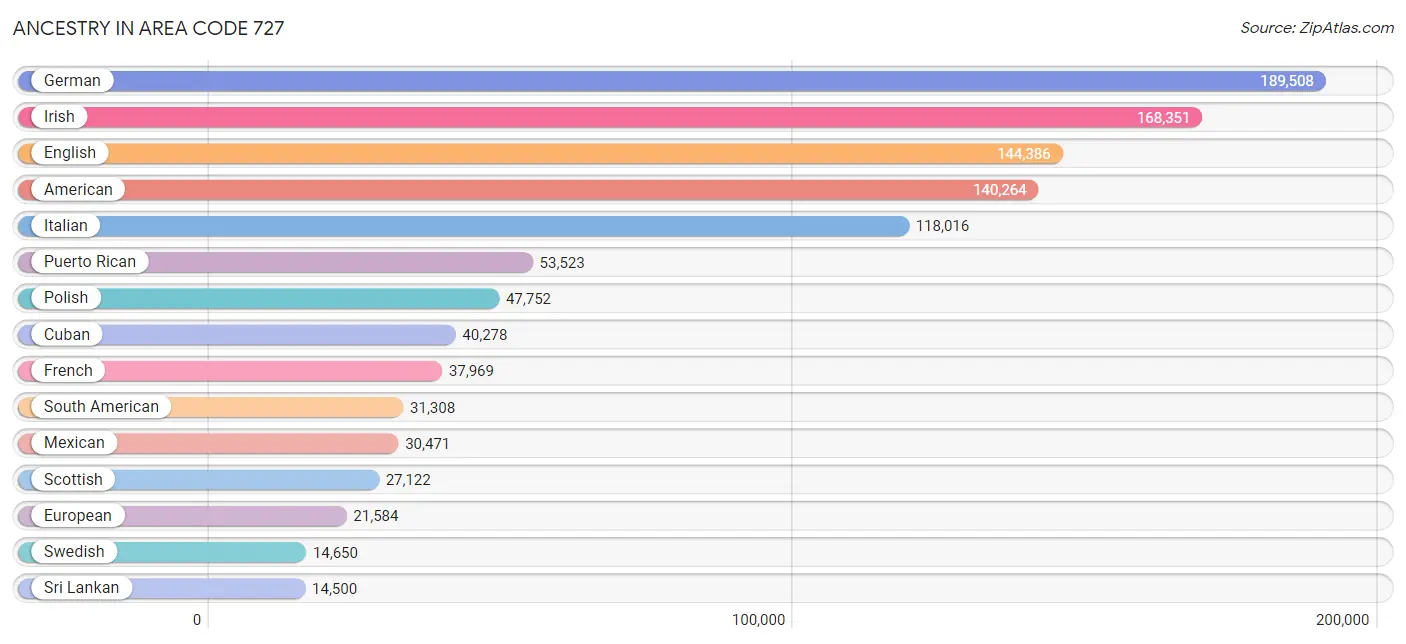
Ancestry in Area Code 727
The most populous ancestries reported in Area Code 727 are German (189,508 | 13.7%), Irish (168,351 | 12.2%), English (144,386 | 10.4%), American (140,264 | 10.1%), and Italian (118,016 | 8.5%), together accounting for 55.0% of all Area Code 727 residents.
| Ancestry | # Population | % Population |
| Afghan | 97 | 0.0% |
| African | 5,113 | 0.4% |
| Alaska Native | 54 | 0.0% |
| Albanian | 3,515 | 0.3% |
| Aleut | 13 | 0.0% |
| Alsatian | 77 | 0.0% |
| American | 140,264 | 10.1% |
| Apache | 124 | 0.0% |
| Arab | 10,962 | 0.8% |
| Argentinean | 1,185 | 0.1% |
| Armenian | 753 | 0.1% |
| Assyrian / Chaldean / Syriac | 86 | 0.0% |
| Australian | 948 | 0.1% |
| Austrian | 3,234 | 0.2% |
| Bahamian | 472 | 0.0% |
| Bangladeshi | 275 | 0.0% |
| Barbadian | 98 | 0.0% |
| Basque | 143 | 0.0% |
| Belgian | 1,747 | 0.1% |
| Belizean | 145 | 0.0% |
| Bermudan | 111 | 0.0% |
| Bhutanese | 2,217 | 0.2% |
| Blackfeet | 736 | 0.1% |
| Bolivian | 404 | 0.0% |
| Brazilian | 3,731 | 0.3% |
| British | 10,795 | 0.8% |
| British West Indian | 697 | 0.1% |
| Bulgarian | 962 | 0.1% |
| Burmese | 3,230 | 0.2% |
| Cajun | 172 | 0.0% |
| Cambodian | 28 | 0.0% |
| Canadian | 6,178 | 0.4% |
| Cape Verdean | 169 | 0.0% |
| Carpatho Rusyn | 132 | 0.0% |
| Celtic | 279 | 0.0% |
| Central American | 10,558 | 0.8% |
| Central American Indian | 1,436 | 0.1% |
| Cherokee | 3,530 | 0.3% |
| Chickasaw | 22 | 0.0% |
| Chilean | 1,135 | 0.1% |
| Chinese | 23 | 0.0% |
| Chippewa | 387 | 0.0% |
| Choctaw | 404 | 0.0% |
| Colombian | 14,075 | 1.0% |
| Comanche | 20 | 0.0% |
| Costa Rican | 1,277 | 0.1% |
| Cree | 35 | 0.0% |
| Creek | 204 | 0.0% |
| Croatian | 2,216 | 0.2% |
| Crow | 11 | 0.0% |
| Cuban | 40,278 | 2.9% |
| Cypriot | 45 | 0.0% |
| Czech | 5,027 | 0.4% |
| Czechoslovakian | 2,049 | 0.2% |
| Danish | 4,383 | 0.3% |
| Delaware | 129 | 0.0% |
| Dominican | 7,977 | 0.6% |
| Dutch | 13,185 | 0.9% |
| Dutch West Indian | 110 | 0.0% |
| Eastern European | 4,324 | 0.3% |
| Ecuadorian | 2,887 | 0.2% |
| Egyptian | 3,012 | 0.2% |
| English | 144,386 | 10.4% |
| Estonian | 273 | 0.0% |
| Ethiopian | 283 | 0.0% |
| European | 21,584 | 1.6% |
| Fijian | 201 | 0.0% |
| Filipino | 230 | 0.0% |
| Finnish | 2,797 | 0.2% |
| French | 37,969 | 2.8% |
| French American Indian | 83 | 0.0% |
| French Canadian | 10,283 | 0.7% |
| German | 189,508 | 13.7% |
| German Russian | 14 | 0.0% |
| Ghanaian | 201 | 0.0% |
| Greek | 13,998 | 1.0% |
| Guamanian / Chamorro | 391 | 0.0% |
| Guatemalan | 1,759 | 0.1% |
| Guyanese | 357 | 0.0% |
| Haitian | 3,333 | 0.2% |
| Honduran | 1,761 | 0.1% |
| Hungarian | 8,801 | 0.6% |
| Icelander | 181 | 0.0% |
| Indian (Asian) | 6,684 | 0.5% |
| Indonesian | 187 | 0.0% |
| Inupiat | 18 | 0.0% |
| Iranian | 930 | 0.1% |
| Iraqi | 480 | 0.0% |
| Irish | 168,351 | 12.2% |
| Iroquois | 318 | 0.0% |
| Israeli | 392 | 0.0% |
| Italian | 118,016 | 8.5% |
| Jamaican | 7,306 | 0.5% |
| Japanese | 1,671 | 0.1% |
| Jordanian | 154 | 0.0% |
| Kenyan | 40 | 0.0% |
| Korean | 10,634 | 0.8% |
| Laotian | 163 | 0.0% |
| Latvian | 415 | 0.0% |
| Lebanese | 3,389 | 0.3% |
| Liberian | 335 | 0.0% |
| Lithuanian | 4,248 | 0.3% |
| Lumbee | 40 | 0.0% |
| Luxembourger | 133 | 0.0% |
| Macedonian | 246 | 0.0% |
| Malaysian | 2,824 | 0.2% |
| Maltese | 201 | 0.0% |
| Marshallese | 15 | 0.0% |
| Menominee | 55 | 0.0% |
| Mexican | 30,471 | 2.2% |
| Mexican American Indian | 721 | 0.1% |
| Mongolian | 72 | 0.0% |
| Moroccan | 606 | 0.0% |
| Native Hawaiian | 606 | 0.0% |
| Navajo | 19 | 0.0% |
| New Zealander | 204 | 0.0% |
| Nicaraguan | 1,769 | 0.1% |
| Nigerian | 791 | 0.1% |
| Northern European | 1,807 | 0.1% |
| Norwegian | 11,352 | 0.8% |
| Okinawan | 11 | 0.0% |
| Osage | 64 | 0.0% |
| Pakistani | 1,550 | 0.1% |
| Palestinian | 493 | 0.0% |
| Panamanian | 1,830 | 0.1% |
| Paraguayan | 70 | 0.0% |
| Pennsylvania German | 853 | 0.1% |
| Peruvian | 4,171 | 0.3% |
| Pima | 6 | 0.0% |
| Polish | 47,752 | 3.5% |
| Portuguese | 6,908 | 0.5% |
| Potawatomi | 92 | 0.0% |
| Pueblo | 60 | 0.0% |
| Puerto Rican | 53,523 | 3.9% |
| Romanian | 2,221 | 0.2% |
| Russian | 11,917 | 0.9% |
| Salvadoran | 2,019 | 0.2% |
| Samoan | 176 | 0.0% |
| Scandinavian | 3,910 | 0.3% |
| Scotch-Irish | 13,915 | 1.0% |
| Scottish | 27,122 | 2.0% |
| Seminole | 214 | 0.0% |
| Senegalese | 104 | 0.0% |
| Serbian | 2,326 | 0.2% |
| Shoshone | 32 | 0.0% |
| Sierra Leonean | 15 | 0.0% |
| Sioux | 316 | 0.0% |
| Slavic | 853 | 0.1% |
| Slovak | 2,889 | 0.2% |
| Slovene | 836 | 0.1% |
| Somali | 10 | 0.0% |
| South African | 492 | 0.0% |
| South American | 31,308 | 2.3% |
| South American Indian | 173 | 0.0% |
| Soviet Union | 34 | 0.0% |
| Spaniard | 4,674 | 0.3% |
| Spanish | 2,698 | 0.2% |
| Spanish American | 8 | 0.0% |
| Spanish American Indian | 20 | 0.0% |
| Sri Lankan | 14,500 | 1.1% |
| Subsaharan African | 7,833 | 0.6% |
| Swedish | 14,650 | 1.1% |
| Swiss | 3,118 | 0.2% |
| Syrian | 837 | 0.1% |
| Taiwanese | 15 | 0.0% |
| Thai | 11,628 | 0.8% |
| Tongan | 218 | 0.0% |
| Trinidadian and Tobagonian | 1,861 | 0.1% |
| Turkish | 1,327 | 0.1% |
| U.S. Virgin Islander | 213 | 0.0% |
| Ugandan | 33 | 0.0% |
| Ukrainian | 6,140 | 0.4% |
| Uruguayan | 653 | 0.1% |
| Venezuelan | 6,614 | 0.5% |
| Vietnamese | 47 | 0.0% |
| Welsh | 8,945 | 0.6% |
| West Indian | 1,387 | 0.1% |
| Yaqui | 19 | 0.0% |
| Yugoslavian | 3,775 | 0.3% |
| Zimbabwean | 17 | 0.0% | View All 180 Rows |
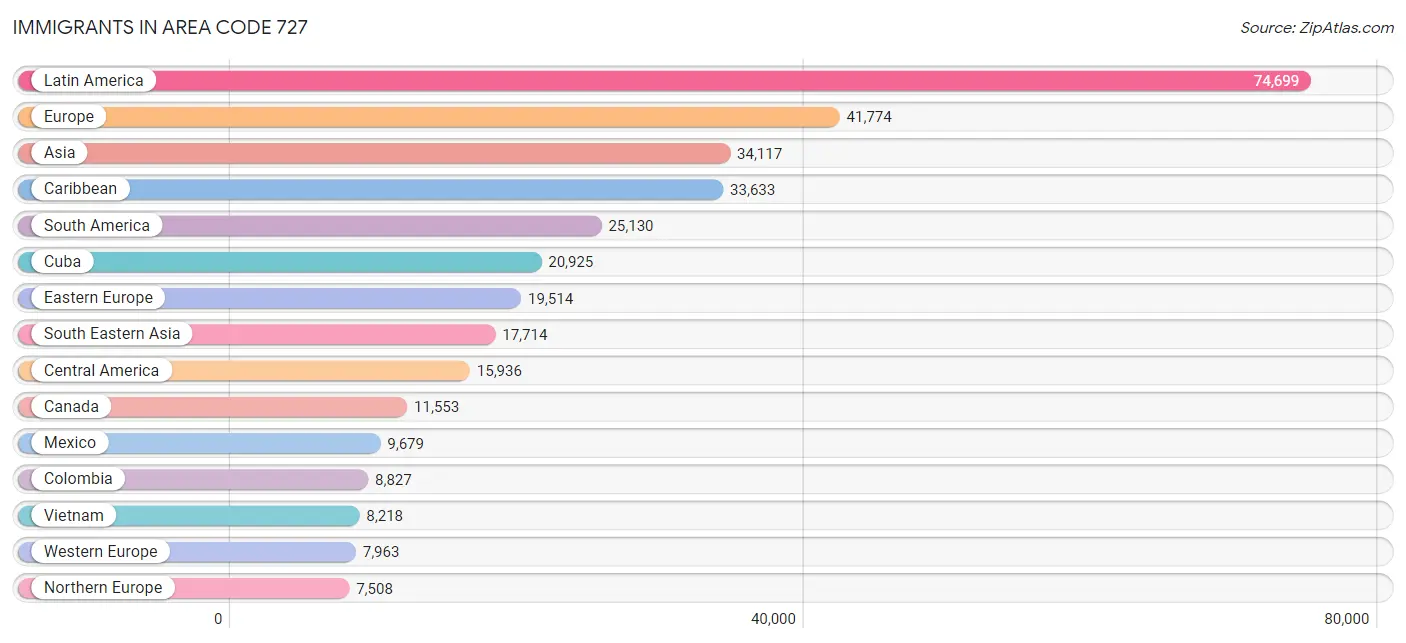
Immigrants in Area Code 727
The most numerous immigrant groups reported in Area Code 727 came from Latin America (74,699 | 5.4%), Europe (41,774 | 3.0%), Asia (34,117 | 2.5%), Caribbean (33,633 | 2.4%), and South America (25,130 | 1.8%), together accounting for 15.1% of all Area Code 727 residents.
| Immigration Origin | # Population | % Population |
| Afghanistan | 18 | 0.0% |
| Africa | 6,587 | 0.5% |
| Albania | 2,309 | 0.2% |
| Argentina | 797 | 0.1% |
| Armenia | 39 | 0.0% |
| Asia | 34,117 | 2.5% |
| Australia | 917 | 0.1% |
| Austria | 308 | 0.0% |
| Azores | 91 | 0.0% |
| Bahamas | 394 | 0.0% |
| Bangladesh | 247 | 0.0% |
| Barbados | 42 | 0.0% |
| Belarus | 114 | 0.0% |
| Belgium | 426 | 0.0% |
| Belize | 146 | 0.0% |
| Bolivia | 325 | 0.0% |
| Bosnia and Herzegovina | 2,400 | 0.2% |
| Brazil | 3,800 | 0.3% |
| Bulgaria | 673 | 0.1% |
| Cabo Verde | 25 | 0.0% |
| Cambodia | 533 | 0.0% |
| Cameroon | 21 | 0.0% |
| Canada | 11,553 | 0.8% |
| Caribbean | 33,633 | 2.4% |
| Central America | 15,936 | 1.1% |
| Chile | 428 | 0.0% |
| China | 3,020 | 0.2% |
| Colombia | 8,827 | 0.6% |
| Costa Rica | 763 | 0.1% |
| Croatia | 1,092 | 0.1% |
| Cuba | 20,925 | 1.5% |
| Czechoslovakia | 521 | 0.0% |
| Denmark | 92 | 0.0% |
| Dominica | 91 | 0.0% |
| Dominican Republic | 3,481 | 0.3% |
| Eastern Africa | 704 | 0.1% |
| Eastern Asia | 4,902 | 0.4% |
| Eastern Europe | 19,514 | 1.4% |
| Ecuador | 1,600 | 0.1% |
| Egypt | 3,136 | 0.2% |
| El Salvador | 1,061 | 0.1% |
| England | 2,759 | 0.2% |
| Eritrea | 34 | 0.0% |
| Ethiopia | 226 | 0.0% |
| Europe | 41,774 | 3.0% |
| Fiji | 40 | 0.0% |
| France | 1,012 | 0.1% |
| Germany | 5,322 | 0.4% |
| Ghana | 222 | 0.0% |
| Greece | 3,054 | 0.2% |
| Grenada | 69 | 0.0% |
| Guatemala | 1,038 | 0.1% |
| Guyana | 1,217 | 0.1% |
| Haiti | 1,770 | 0.1% |
| Honduras | 1,258 | 0.1% |
| Hong Kong | 321 | 0.0% |
| Hungary | 812 | 0.1% |
| India | 5,668 | 0.4% |
| Indonesia | 258 | 0.0% |
| Iran | 668 | 0.1% |
| Iraq | 486 | 0.0% |
| Ireland | 774 | 0.1% |
| Israel | 472 | 0.0% |
| Italy | 2,456 | 0.2% |
| Jamaica | 4,875 | 0.4% |
| Japan | 525 | 0.0% |
| Jordan | 127 | 0.0% |
| Kazakhstan | 258 | 0.0% |
| Kenya | 122 | 0.0% |
| Korea | 1,357 | 0.1% |
| Kuwait | 260 | 0.0% |
| Laos | 1,462 | 0.1% |
| Latin America | 74,699 | 5.4% |
| Latvia | 81 | 0.0% |
| Lebanon | 746 | 0.1% |
| Liberia | 108 | 0.0% |
| Lithuania | 714 | 0.1% |
| Malaysia | 365 | 0.0% |
| Mexico | 9,679 | 0.7% |
| Micronesia | 160 | 0.0% |
| Middle Africa | 42 | 0.0% |
| Moldova | 118 | 0.0% |
| Morocco | 402 | 0.0% |
| Nepal | 67 | 0.0% |
| Netherlands | 608 | 0.0% |
| Nicaragua | 908 | 0.1% |
| Nigeria | 430 | 0.0% |
| North Macedonia | 178 | 0.0% |
| Northern Africa | 3,755 | 0.3% |
| Northern Europe | 7,508 | 0.5% |
| Norway | 226 | 0.0% |
| Oceania | 1,584 | 0.1% |
| Pakistan | 263 | 0.0% |
| Panama | 1,083 | 0.1% |
| Peru | 2,441 | 0.2% |
| Philippines | 5,707 | 0.4% |
| Poland | 3,603 | 0.3% |
| Portugal | 743 | 0.1% |
| Romania | 613 | 0.0% |
| Russia | 1,650 | 0.1% |
| Saudi Arabia | 257 | 0.0% |
| Scotland | 741 | 0.1% |
| Senegal | 45 | 0.0% |
| Serbia | 697 | 0.1% |
| Sierra Leone | 125 | 0.0% |
| Singapore | 36 | 0.0% |
| Somalia | 10 | 0.0% |
| South Africa | 1,065 | 0.1% |
| South America | 25,130 | 1.8% |
| South Central Asia | 7,301 | 0.5% |
| South Eastern Asia | 17,714 | 1.3% |
| Southern Europe | 6,753 | 0.5% |
| Spain | 411 | 0.0% |
| Sri Lanka | 77 | 0.0% |
| St. Vincent and the Grenadines | 72 | 0.0% |
| Sudan | 78 | 0.0% |
| Sweden | 249 | 0.0% |
| Switzerland | 262 | 0.0% |
| Syria | 295 | 0.0% |
| Taiwan | 456 | 0.0% |
| Thailand | 1,007 | 0.1% |
| Trinidad and Tobago | 1,478 | 0.1% |
| Turkey | 982 | 0.1% |
| Uganda | 85 | 0.0% |
| Ukraine | 2,417 | 0.2% |
| Uruguay | 482 | 0.0% |
| Uzbekistan | 26 | 0.0% |
| Venezuela | 4,893 | 0.4% |
| Vietnam | 8,218 | 0.6% |
| West Indies | 103 | 0.0% |
| Western Africa | 957 | 0.1% |
| Western Asia | 4,015 | 0.3% |
| Western Europe | 7,963 | 0.6% |
| Zimbabwe | 28 | 0.0% | View All 134 Rows |
Sex and Age in Area Code 727
Sex and Age in Area Code 727
The most populous age groups in Area Code 727 are 55 to 59 Years (52,191 | 7.8%) for men and 60 to 64 Years (56,845 | 8.0%) for women.
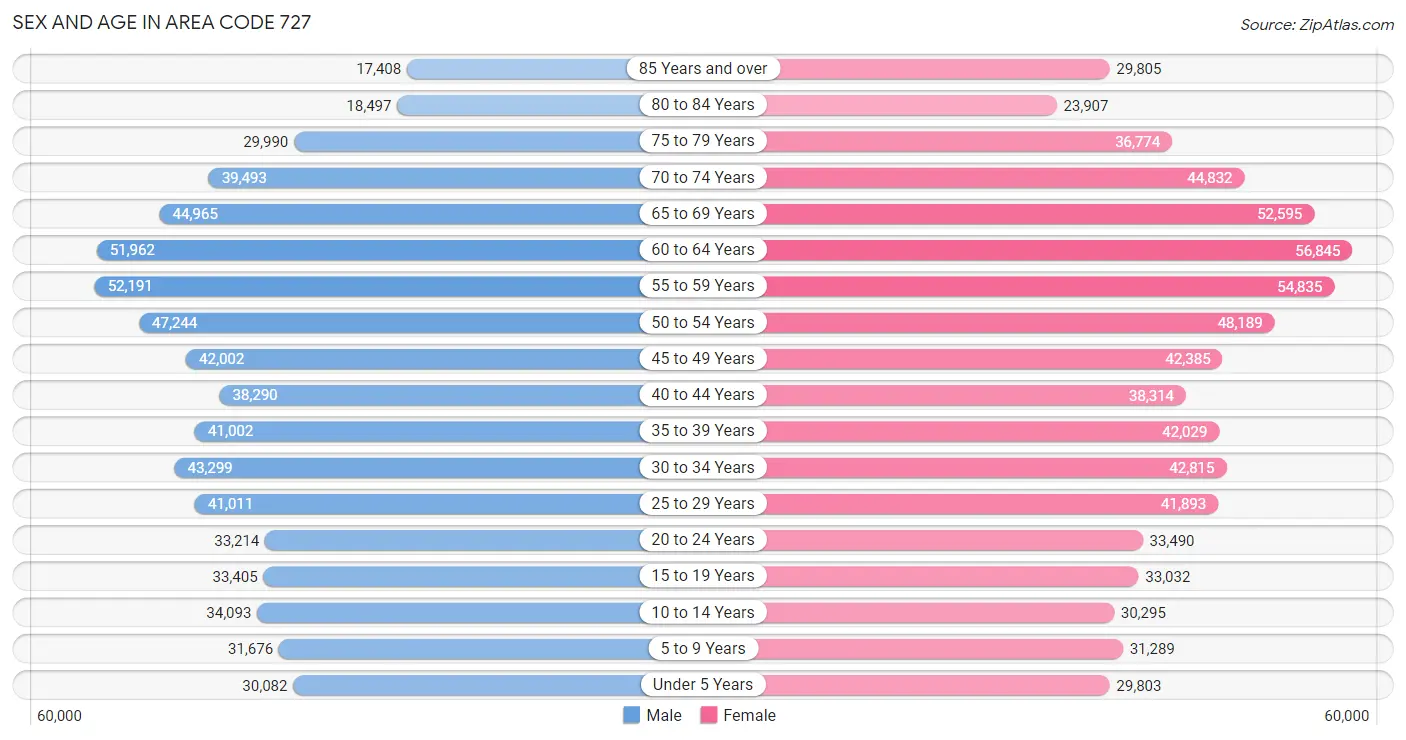
| Age Bracket | Male | Female |
| Under 5 Years | 30,082 (4.5%) | 29,803 (4.2%) |
| 5 to 9 Years | 31,676 (4.7%) | 31,289 (4.4%) |
| 10 to 14 Years | 34,093 (5.1%) | 30,295 (4.3%) |
| 15 to 19 Years | 33,405 (5.0%) | 33,032 (4.6%) |
| 20 to 24 Years | 33,214 (5.0%) | 33,490 (4.7%) |
| 25 to 29 Years | 41,011 (6.1%) | 41,893 (5.9%) |
| 30 to 34 Years | 43,299 (6.5%) | 42,815 (6.0%) |
| 35 to 39 Years | 41,002 (6.1%) | 42,029 (5.9%) |
| 40 to 44 Years | 38,290 (5.7%) | 38,314 (5.4%) |
| 45 to 49 Years | 42,002 (6.3%) | 42,385 (5.9%) |
| 50 to 54 Years | 47,244 (7.0%) | 48,189 (6.8%) |
| 55 to 59 Years | 52,191 (7.8%) | 54,835 (7.7%) |
| 60 to 64 Years | 51,962 (7.8%) | 56,845 (8.0%) |
| 65 to 69 Years | 44,965 (6.7%) | 52,595 (7.4%) |
| 70 to 74 Years | 39,493 (5.9%) | 44,832 (6.3%) |
| 75 to 79 Years | 29,990 (4.5%) | 36,774 (5.2%) |
| 80 to 84 Years | 18,497 (2.8%) | 23,907 (3.4%) |
| 85 Years and over | 17,408 (2.6%) | 29,805 (4.2%) |
| Total | 669,824 (100.0%) | 713,127 (100.0%) |
Families and Households in Area Code 727
Median Family Size in Area Code 727
The median family size in Area Code 727 is 2.91 persons per family, with single female/mother families (63,172 | 18.6%) accounting for the largest median family size of 3.13193 persons per family. On the other hand, married-couple families (253,166 | 74.6%) represent the smallest median family size with 2.86 persons per family.
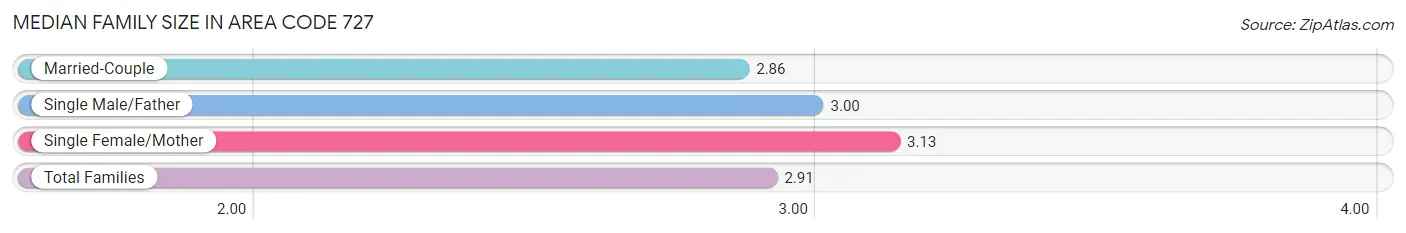
| Family Type | # Families | Family Size |
| Married-Couple | 253,166 (74.6%) | 2.86 |
| Single Male/Father | 23,237 (6.8%) | 3.00 |
| Single Female/Mother | 63,172 (18.6%) | 3.13 |
| Total Families | 339,575 (100.0%) | 2.91 |
Median Household Size in Area Code 727
The median household size in Area Code 727 is 2.26 persons per household, with single female/mother households (63,172 | 10.6%) accounting for the largest median household size of 3.3508 persons per household. non-family households (258,755 | 43.2%) represent the smallest median household size with 1.26 persons per household.
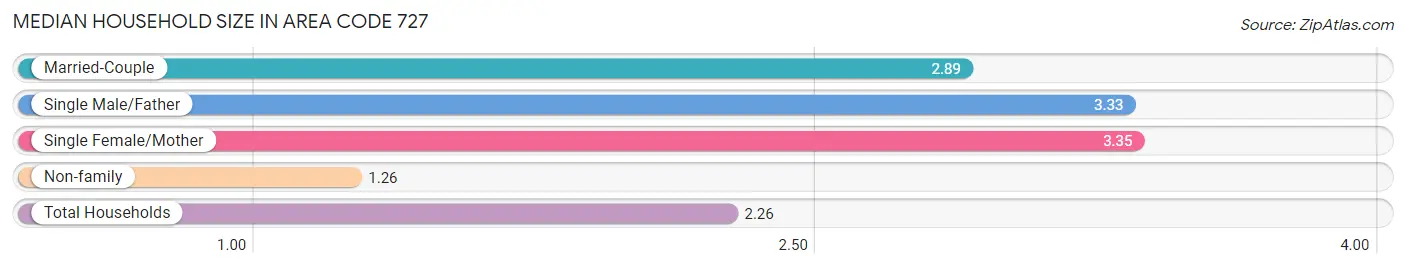
| Household Type | # Households | Household Size |
| Married-Couple | 253,166 (42.3%) | 2.89 |
| Single Male/Father | 23,237 (3.9%) | 3.33 |
| Single Female/Mother | 63,172 (10.6%) | 3.35 |
| Non-family | 258,755 (43.2%) | 1.26 |
| Total Households | 598,330 (100.0%) | 2.26 |
Household Size by Marriage Status in Area Code 727
Out of a total of 598,330 households in Area Code 727, 339,575 (56.8%) are family households, while 258,755 (43.2%) are nonfamily households. The most numerous type of family households are 2-person households, comprising 186,999, and the most common type of nonfamily households are 1-person households, comprising 209,984.
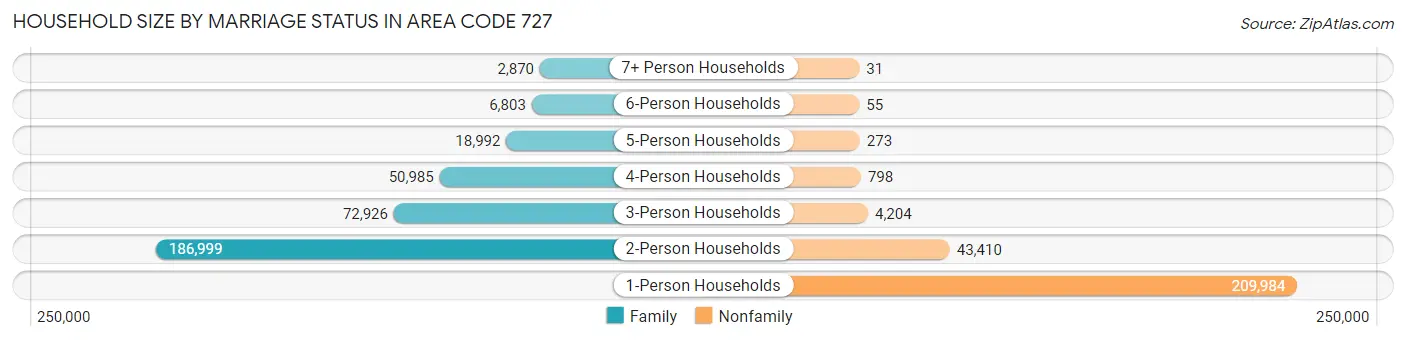
| Household Size | Family Households | Nonfamily Households |
| 1-Person Households | - | 209,984 (35.1%) |
| 2-Person Households | 186,999 (31.2%) | 43,410 (7.3%) |
| 3-Person Households | 72,926 (12.2%) | 4,204 (0.7%) |
| 4-Person Households | 50,985 (8.5%) | 798 (0.1%) |
| 5-Person Households | 18,992 (3.2%) | 273 (0.1%) |
| 6-Person Households | 6,803 (1.1%) | 55 (0.0%) |
| 7+ Person Households | 2,870 (0.5%) | 31 (0.0%) |
| Total | 339,575 (56.8%) | 258,755 (43.2%) |
Female Fertility in Area Code 727
Fertility by Age in Area Code 727
Average fertility rate in Area Code 727 is 46.1 births per 1,000 women. Women in the age bracket of 20 to 34 years have the highest fertility rate with 73.2 births per 1,000 women. Women in the age bracket of 20 to 34 years acount for 66.9% of all women with births.
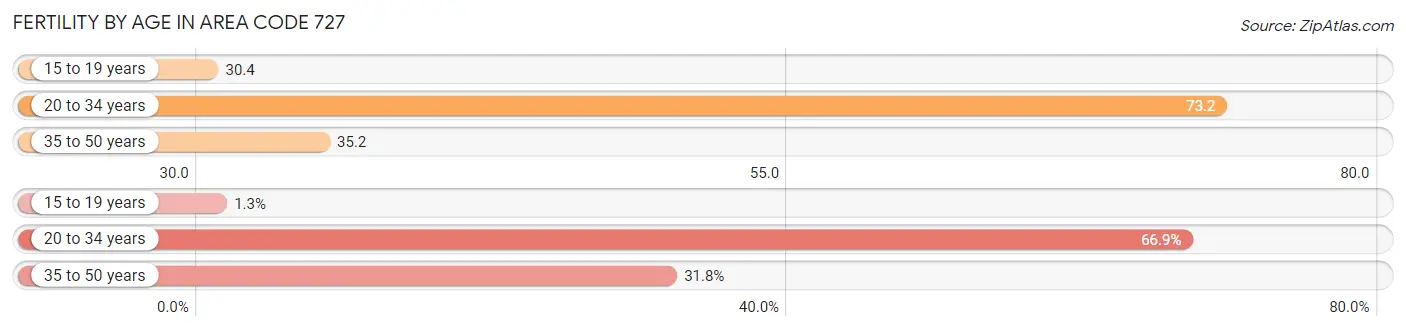
| Age Bracket | Women with Births | Births / 1,000 Women |
| 15 to 19 years | 169 (1.3%) | 30.4 |
| 20 to 34 years | 8,665 (66.9%) | 73.2 |
| 35 to 50 years | 4,126 (31.8%) | 35.2 |
| Total | 12,960 (100.0%) | 46.1 |
Fertility by Age by Marriage Status in Area Code 727
64.8% of women with births (12,960) in Area Code 727 are married. The highest percentage of unmarried women with births falls into 15 to 19 years age bracket with 100.0% of them unmarried at the time of birth, while the lowest percentage of unmarried women with births belong to 20 to 34 years age bracket with 43.2% of them unmarried.
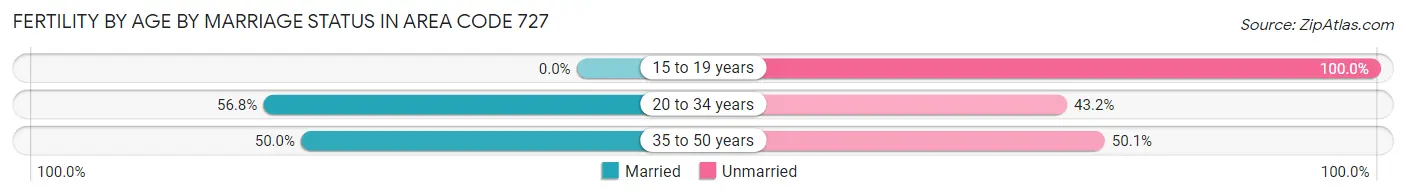
| Age Bracket | Married | Unmarried |
| 15 to 19 years | 0 (0.0%) | 169 (100.0%) |
| 20 to 34 years | 4,921 (56.8%) | 3,744 (43.2%) |
| 35 to 50 years | 2,061 (49.9%) | 2,065 (50.0%) |
| Total | 8,396 (64.8%) | 4,564 (35.2%) |
Fertility by Education in Area Code 727
Average fertility rate in Area Code 727 is 46.1 births per 1,000 women. Women with the education attainment of graduate degree have the highest fertility rate of 66.2 births per 1,000 women, while women with the education attainment of college or associate's degree have the lowest fertility at 42.6 births per 1,000 women. Women with the education attainment of bachelor's degree represent 30.2% of all women with births.
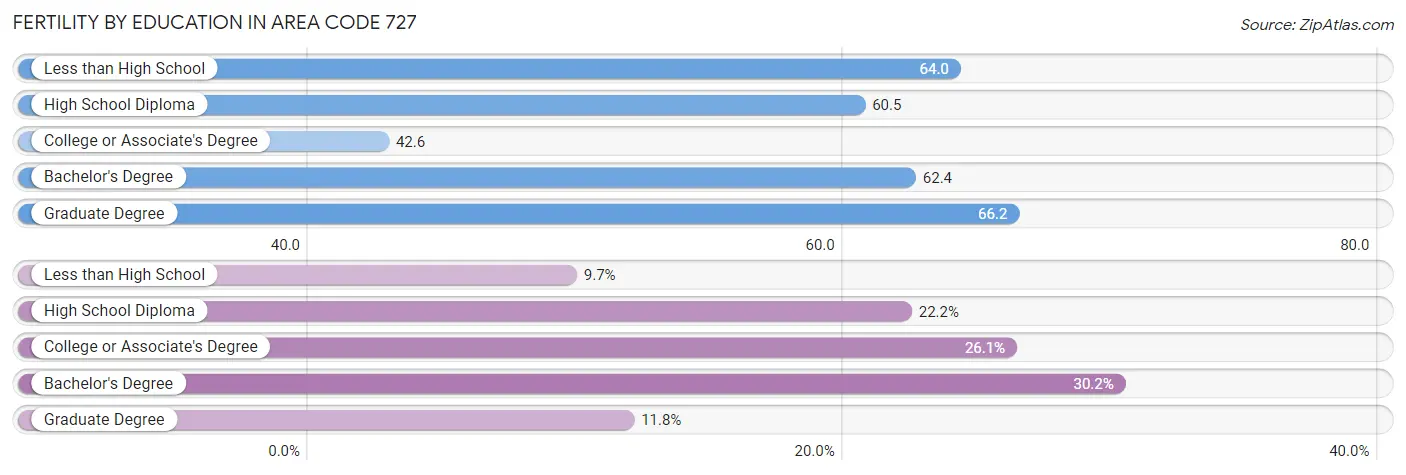
| Educational Attainment | Women with Births | Births / 1,000 Women |
| Less than High School | 1,251 (9.7%) | 64.0 |
| High School Diploma | 2,877 (22.2%) | 60.5 |
| College or Associate's Degree | 3,388 (26.1%) | 42.6 |
| Bachelor's Degree | 3,915 (30.2%) | 62.4 |
| Graduate Degree | 1,529 (11.8%) | 66.2 |
| Total | 12,960 (100.0%) | 46.1 |
Fertility by Education by Marriage Status in Area Code 727
35.2% of women with births in Area Code 727 are unmarried. Women with the educational attainment of bachelor's degree are most likely to be married with 59.1% of them married at childbirth, while women with the educational attainment of less than high school are least likely to be married with 80.3% of them unmarried at childbirth.
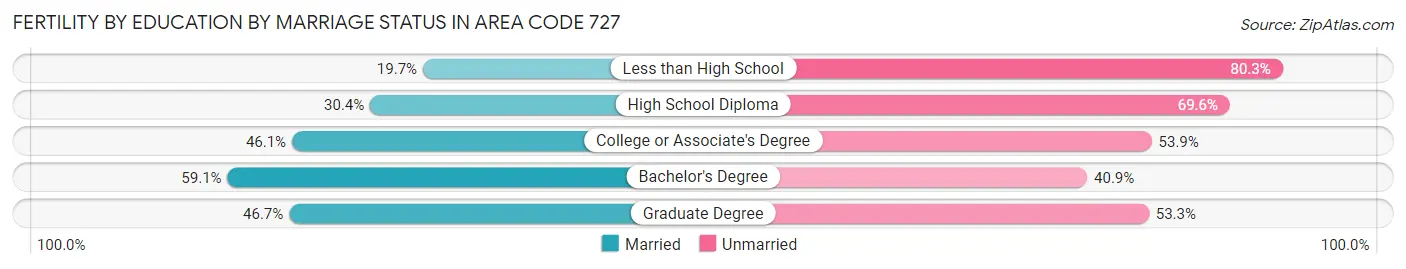
| Educational Attainment | Married | Unmarried |
| Less than High School | 247 (19.7%) | 1,004 (80.3%) |
| High School Diploma | 874 (30.4%) | 2,003 (69.6%) |
| College or Associate's Degree | 1,563 (46.1%) | 1,825 (53.9%) |
| Bachelor's Degree | 2,315 (59.1%) | 1,600 (40.9%) |
| Graduate Degree | 714 (46.7%) | 815 (53.3%) |
| Total | 8,396 (64.8%) | 4,564 (35.2%) |
Employment Characteristics in Area Code 727
Employment by Class of Employer in Area Code 727
Among the 646,772 employed individuals in Area Code 727, private company employees (447,199 | 69.1%), not-for-profit organizations (48,727 | 7.5%), and local government employees (42,724 | 6.6%) make up the most common classes of employment.
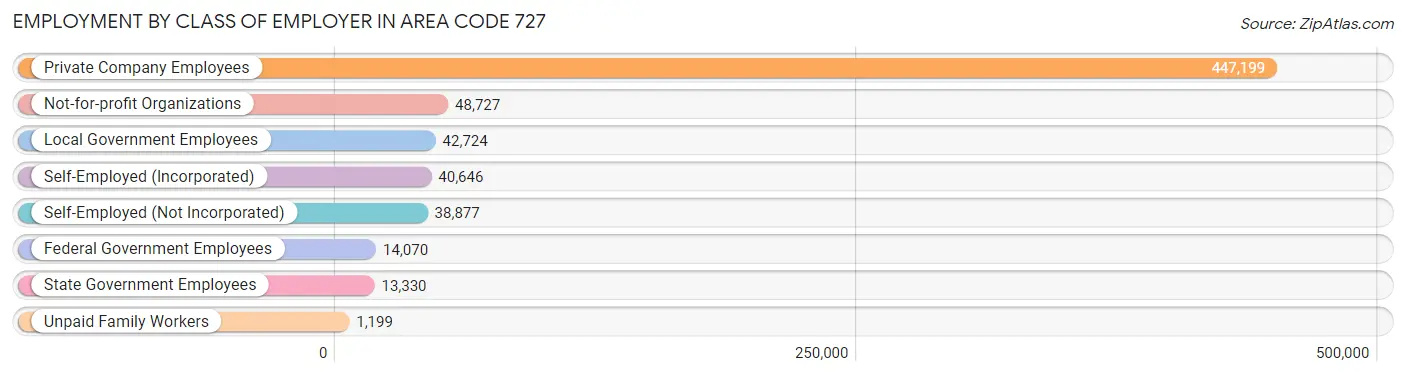
| Employer Class | # Employees | % Employees |
| Private Company Employees | 447,199 | 69.1% |
| Self-Employed (Incorporated) | 40,646 | 6.3% |
| Self-Employed (Not Incorporated) | 38,877 | 6.0% |
| Not-for-profit Organizations | 48,727 | 7.5% |
| Local Government Employees | 42,724 | 6.6% |
| State Government Employees | 13,330 | 2.1% |
| Federal Government Employees | 14,070 | 2.2% |
| Unpaid Family Workers | 1,199 | 0.2% |
| Total | 646,772 | 100.0% |
Employment Status by Age in Area Code 727
According to the labor force statistics for Area Code 727, out of the total population over 16 years of age (1,181,197), 58.2% or 687,575 individuals are in the labor force, with 4.7% or 32,454 of them unemployed. The age group with the highest labor force participation rate is 25 to 29 years, with 85.3% or 70,717 individuals in the labor force. Within the labor force, the 16 to 19 years age range has the highest percentage of unemployed individuals, with 870.9% or 183,673 of them being unemployed.
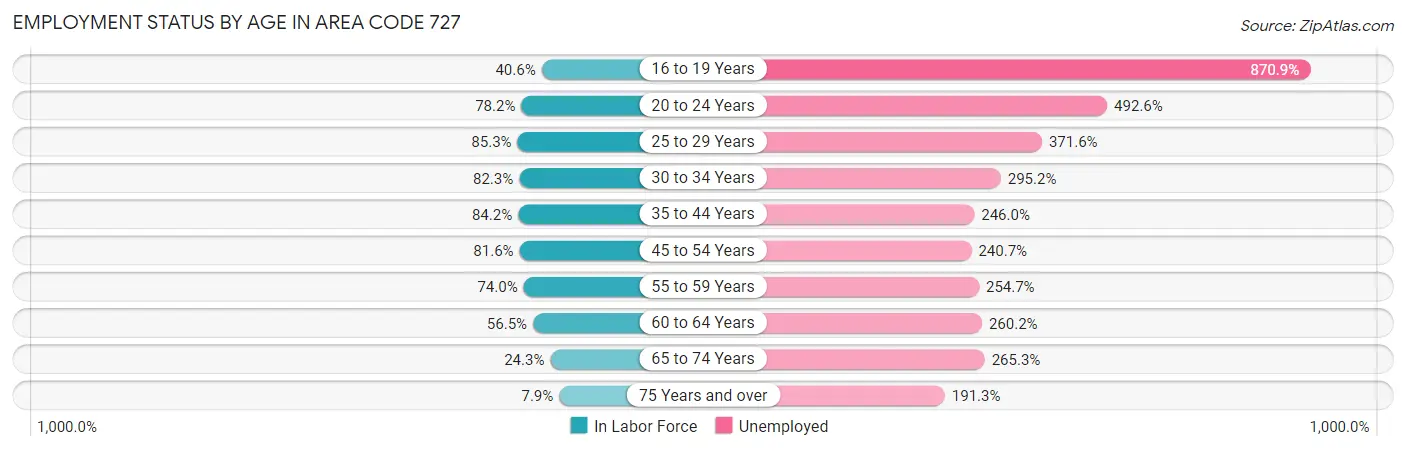
| Age Bracket | In Labor Force | Unemployed |
| 16 to 19 Years | 21,091 (40.6%) | 183,673 (870.9%) |
| 20 to 24 Years | 52,137 (78.2%) | 256,822 (492.6%) |
| 25 to 29 Years | 70,718 (85.3%) | 262,784 (371.6%) |
| 30 to 34 Years | 70,861 (82.3%) | 209,188 (295.2%) |
| 35 to 44 Years | 134,382 (84.2%) | 330,577 (246.0%) |
| 45 to 54 Years | 146,701 (81.6%) | 353,100 (240.7%) |
| 55 to 59 Years | 79,201 (74.0%) | 201,720 (254.7%) |
| 60 to 64 Years | 61,469 (56.5%) | 159,932 (260.2%) |
| 65 to 74 Years | 44,260 (24.3%) | 117,403 (265.3%) |
| 75 Years and over | 12,276 (7.9%) | 23,484 (191.3%) |
| Total | 687,533 (58.2%) | 32,460 (4.7%) |
Employment Status by Educational Attainment in Area Code 727
According to labor force statistics for Area Code 727, 77.7% of individuals (563,003) out of the total population between 25 and 64 years of age (724,306) are in the labor force, with 260.8% or 1,468,312 of them being unemployed. The group with the highest labor force participation rate are those with the educational attainment of bachelor's degree or higher, with 84.6% or 220,552 individuals in the labor force. Within the labor force, individuals with less than high school education have the highest percentage of unemployment, with 395.8% or 130,772 of them being unemployed.
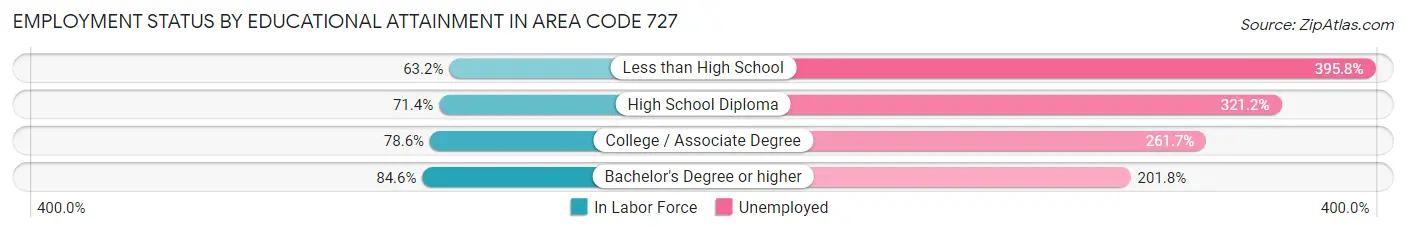
| Educational Attainment | In Labor Force | Unemployed |
| Less than High School | 33,041 (63.2%) | 206,786 (395.8%) |
| High School Diploma | 135,748 (71.4%) | 611,022 (321.2%) |
| College / Associate Degree | 173,751 (78.6%) | 578,697 (261.7%) |
| Bachelor's Degree or higher | 220,540 (84.6%) | 526,093 (201.8%) |
| Total | 562,984 (77.7%) | 1,888,990 (260.8%) |
Employment Occupations by Sex in Area Code 727
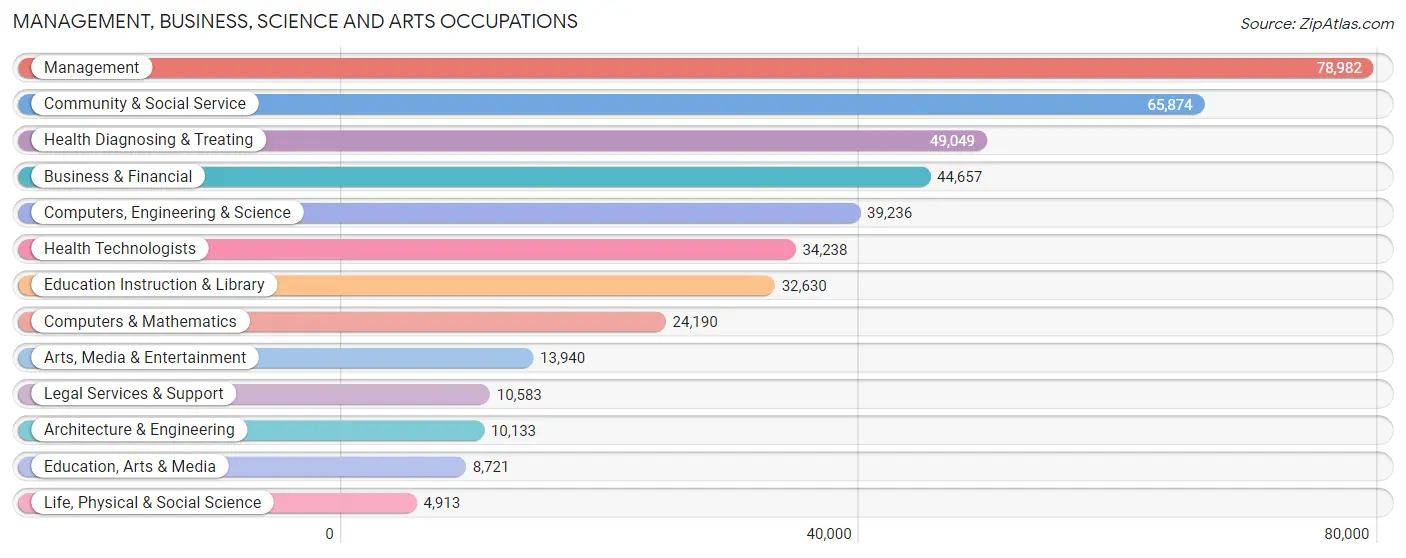
Management, Business, Science and Arts Occupations
The most common Management, Business, Science and Arts occupations in Area Code 727 are Management (78,982 | 12.1%), Community & Social Service (65,874 | 10.1%), Health Diagnosing & Treating (49,049 | 7.5%), Business & Financial (44,657 | 6.8%), and Computers, Engineering & Science (39,236 | 6.0%).
Management, Business, Science and Arts Occupations by Sex
Within the Management, Business, Science and Arts occupations in Area Code 727, the most male-oriented occupations are Architecture & Engineering (83.0%), Computers & Mathematics (74.7%), and Computers, Engineering & Science (73.5%), while the most female-oriented occupations are Education Instruction & Library (74.1%), Health Diagnosing & Treating (72.3%), and Health Technologists (71.2%).
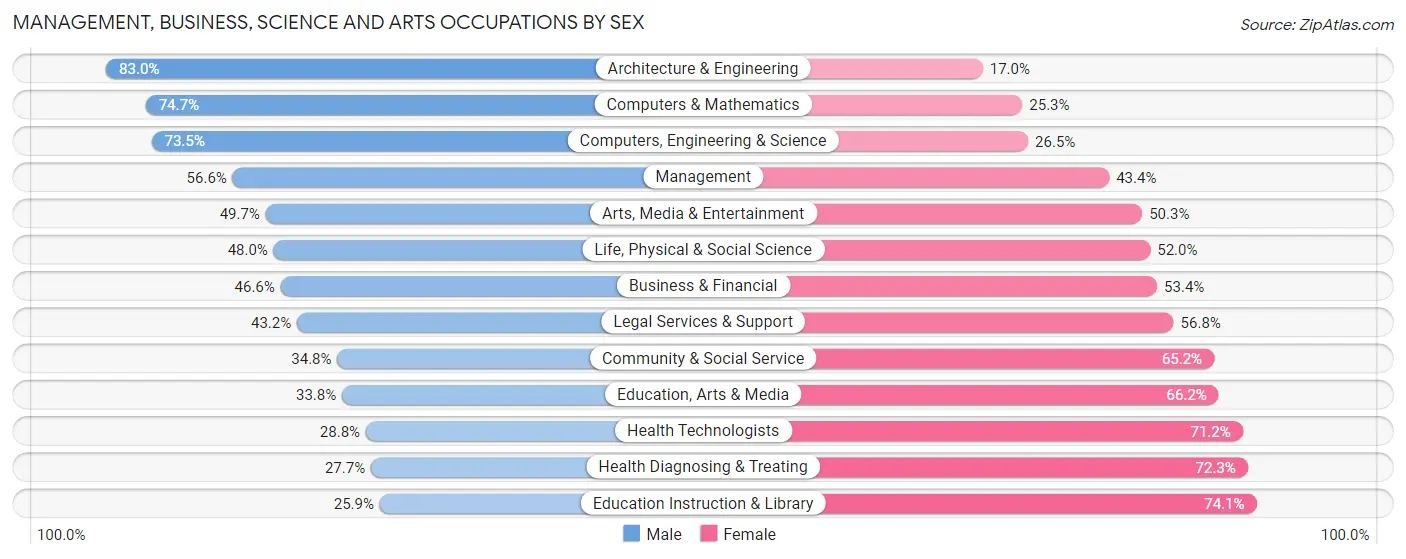
| Occupation | Male | Female |
| Management | 44,707 (56.6%) | 34,275 (43.4%) |
| Business & Financial | 20,812 (46.6%) | 23,845 (53.4%) |
| Computers, Engineering & Science | 28,843 (73.5%) | 10,393 (26.5%) |
| Computers & Mathematics | 18,075 (74.7%) | 6,115 (25.3%) |
| Architecture & Engineering | 8,408 (83.0%) | 1,725 (17.0%) |
| Life, Physical & Social Science | 2,360 (48.0%) | 2,553 (52.0%) |
| Community & Social Service | 22,896 (34.8%) | 42,978 (65.2%) |
| Education, Arts & Media | 2,946 (33.8%) | 5,775 (66.2%) |
| Legal Services & Support | 4,568 (43.2%) | 6,015 (56.8%) |
| Education Instruction & Library | 8,453 (25.9%) | 24,177 (74.1%) |
| Arts, Media & Entertainment | 6,929 (49.7%) | 7,011 (50.3%) |
| Health Diagnosing & Treating | 13,606 (27.7%) | 35,443 (72.3%) |
| Health Technologists | 9,860 (28.8%) | 24,378 (71.2%) |
| Total (Category) | 130,864 (47.1%) | 146,934 (52.9%) |
| Total (Overall) | 334,304 (51.0%) | 320,636 (49.0%) |
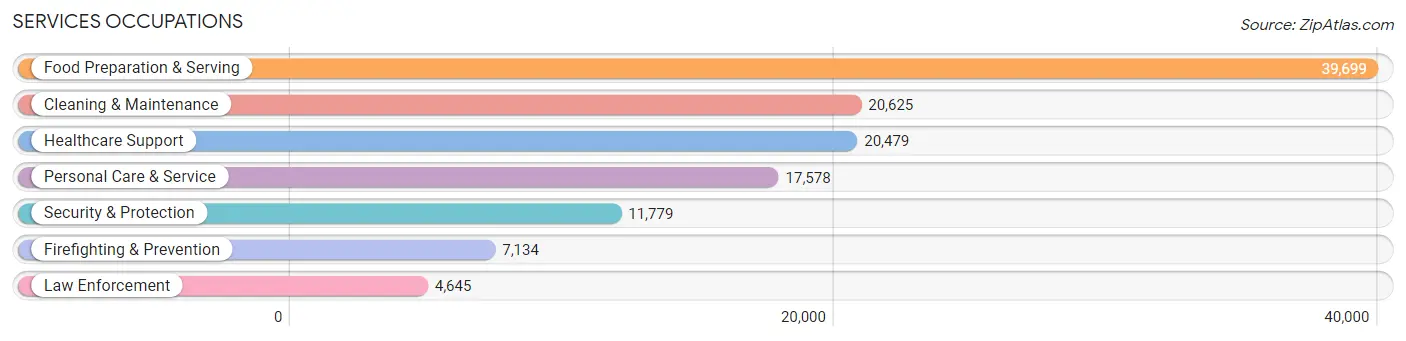
Services Occupations
The most common Services occupations in Area Code 727 are Food Preparation & Serving (39,699 | 6.1%), Cleaning & Maintenance (20,625 | 3.2%), Healthcare Support (20,479 | 3.1%), Personal Care & Service (17,578 | 2.7%), and Security & Protection (11,779 | 1.8%).
Services Occupations by Sex
Within the Services occupations in Area Code 727, the most male-oriented occupations are Firefighting & Prevention (78.4%), Security & Protection (78.1%), and Law Enforcement (77.6%), while the most female-oriented occupations are Healthcare Support (85.2%), Personal Care & Service (71.1%), and Food Preparation & Serving (50.9%).
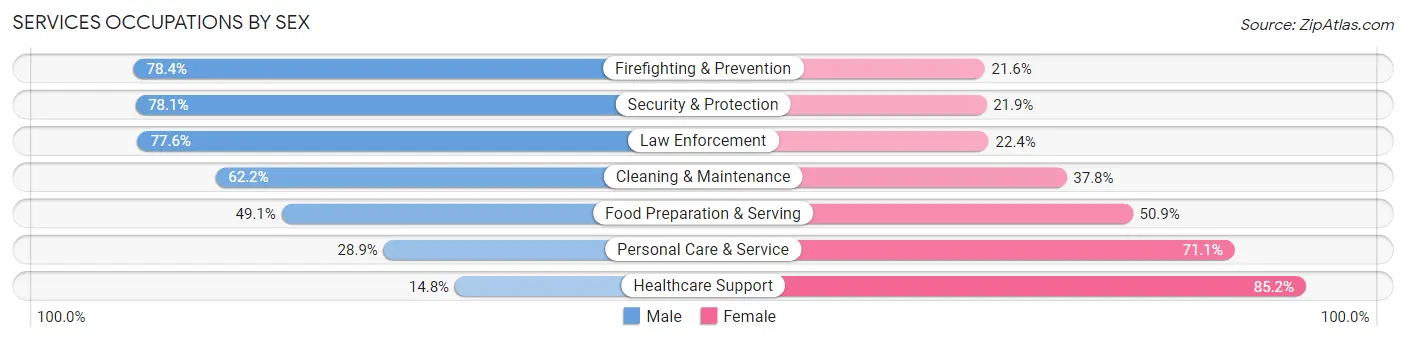
| Occupation | Male | Female |
| Healthcare Support | 3,028 (14.8%) | 17,451 (85.2%) |
| Security & Protection | 9,198 (78.1%) | 2,581 (21.9%) |
| Firefighting & Prevention | 5,593 (78.4%) | 1,541 (21.6%) |
| Law Enforcement | 3,605 (77.6%) | 1,040 (22.4%) |
| Food Preparation & Serving | 19,495 (49.1%) | 20,204 (50.9%) |
| Cleaning & Maintenance | 12,832 (62.2%) | 7,793 (37.8%) |
| Personal Care & Service | 5,080 (28.9%) | 12,498 (71.1%) |
| Total (Category) | 49,633 (45.1%) | 60,527 (54.9%) |
| Total (Overall) | 334,304 (51.0%) | 320,636 (49.0%) |
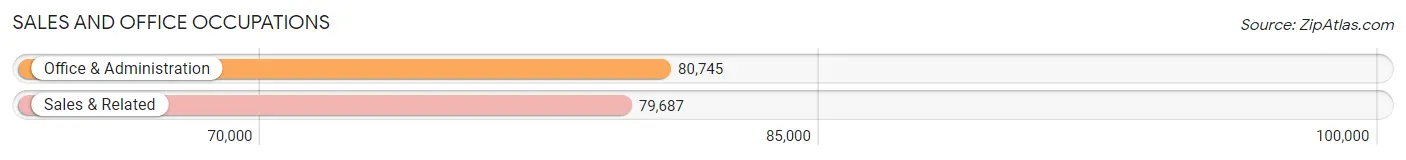
Sales and Office Occupations
The most common Sales and Office occupations in Area Code 727 are Office & Administration (80,745 | 12.3%), and Sales & Related (79,687 | 12.2%).
Sales and Office Occupations by Sex
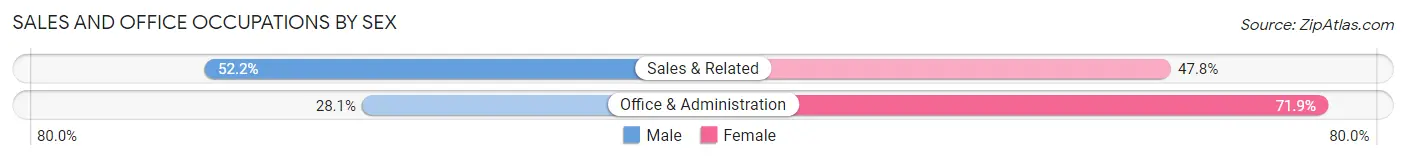
| Occupation | Male | Female |
| Sales & Related | 41,612 (52.2%) | 38,075 (47.8%) |
| Office & Administration | 22,715 (28.1%) | 58,030 (71.9%) |
| Total (Category) | 64,327 (40.1%) | 96,105 (59.9%) |
| Total (Overall) | 334,304 (51.0%) | 320,636 (49.0%) |
Natural Resources, Construction and Maintenance Occupations
The most common Natural Resources, Construction and Maintenance occupations in Area Code 727 are Construction & Extraction (25,923 | 4.0%), Installation, Maintenance & Repair (20,009 | 3.1%), and Farming, Fishing & Forestry (1,343 | 0.2%).
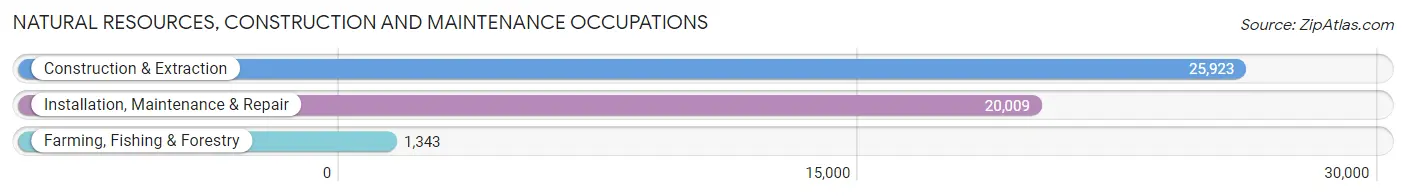
Natural Resources, Construction and Maintenance Occupations by Sex
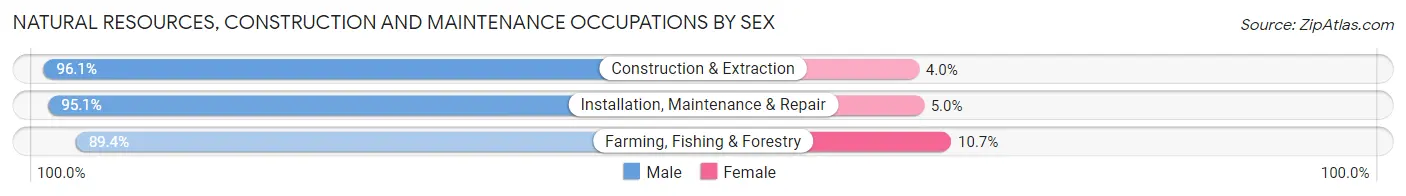
| Occupation | Male | Female |
| Farming, Fishing & Forestry | 1,200 (89.3%) | 143 (10.6%) |
| Construction & Extraction | 24,900 (96.1%) | 1,023 (4.0%) |
| Installation, Maintenance & Repair | 19,019 (95.1%) | 990 (5.0%) |
| Total (Category) | 45,119 (95.4%) | 2,156 (4.6%) |
| Total (Overall) | 334,304 (51.0%) | 320,636 (49.0%) |
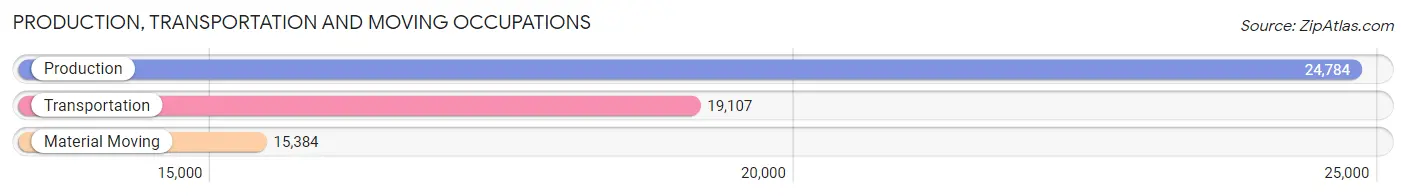
Production, Transportation and Moving Occupations
The most common Production, Transportation and Moving occupations in Area Code 727 are Production (24,784 | 3.8%), Transportation (19,107 | 2.9%), and Material Moving (15,384 | 2.4%).
Production, Transportation and Moving Occupations by Sex
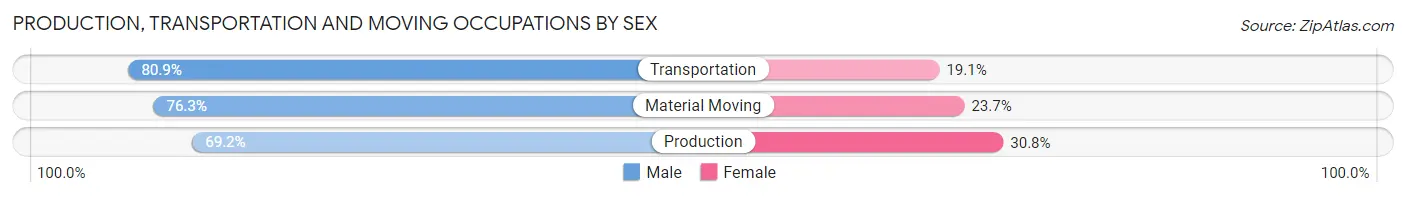
| Occupation | Male | Female |
| Production | 17,153 (69.2%) | 7,631 (30.8%) |
| Transportation | 15,464 (80.9%) | 3,643 (19.1%) |
| Material Moving | 11,744 (76.3%) | 3,640 (23.7%) |
| Total (Category) | 44,361 (74.8%) | 14,914 (25.2%) |
| Total (Overall) | 334,304 (51.0%) | 320,636 (49.0%) |
Employment Industries by Sex in Area Code 727
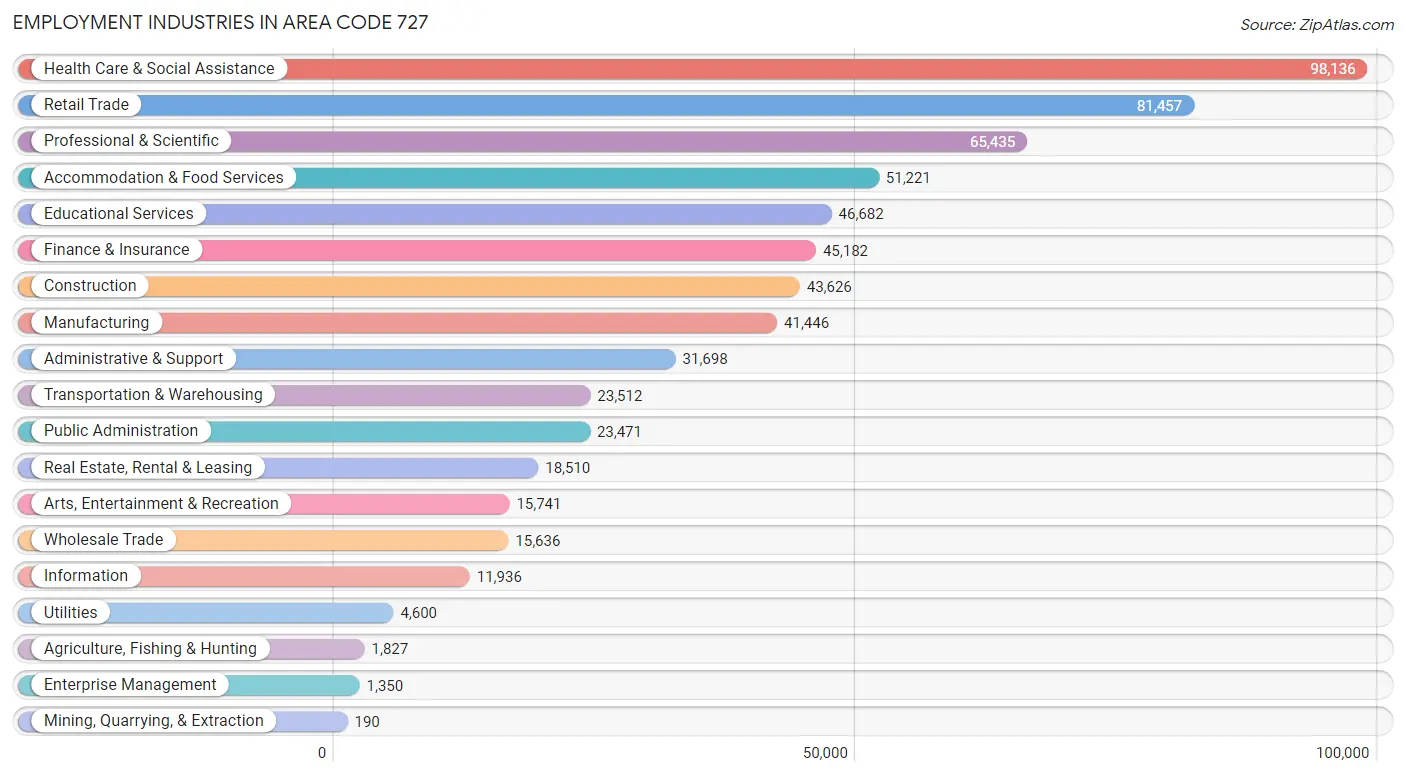
Employment Industries in Area Code 727
The major employment industries in Area Code 727 include Health Care & Social Assistance (98,136 | 15.0%), Retail Trade (81,457 | 12.4%), Professional & Scientific (65,435 | 10.0%), Accommodation & Food Services (51,221 | 7.8%), and Educational Services (46,682 | 7.1%).
Employment Industries by Sex in Area Code 727
The Area Code 727 industries that see more men than women are Construction (86.5%), Mining, Quarrying, & Extraction (84.2%), and Agriculture, Fishing & Hunting (73.8%), whereas the industries that tend to have a higher number of women are Health Care & Social Assistance (75.8%), Educational Services (69.9%), and Enterprise Management (57.6%).
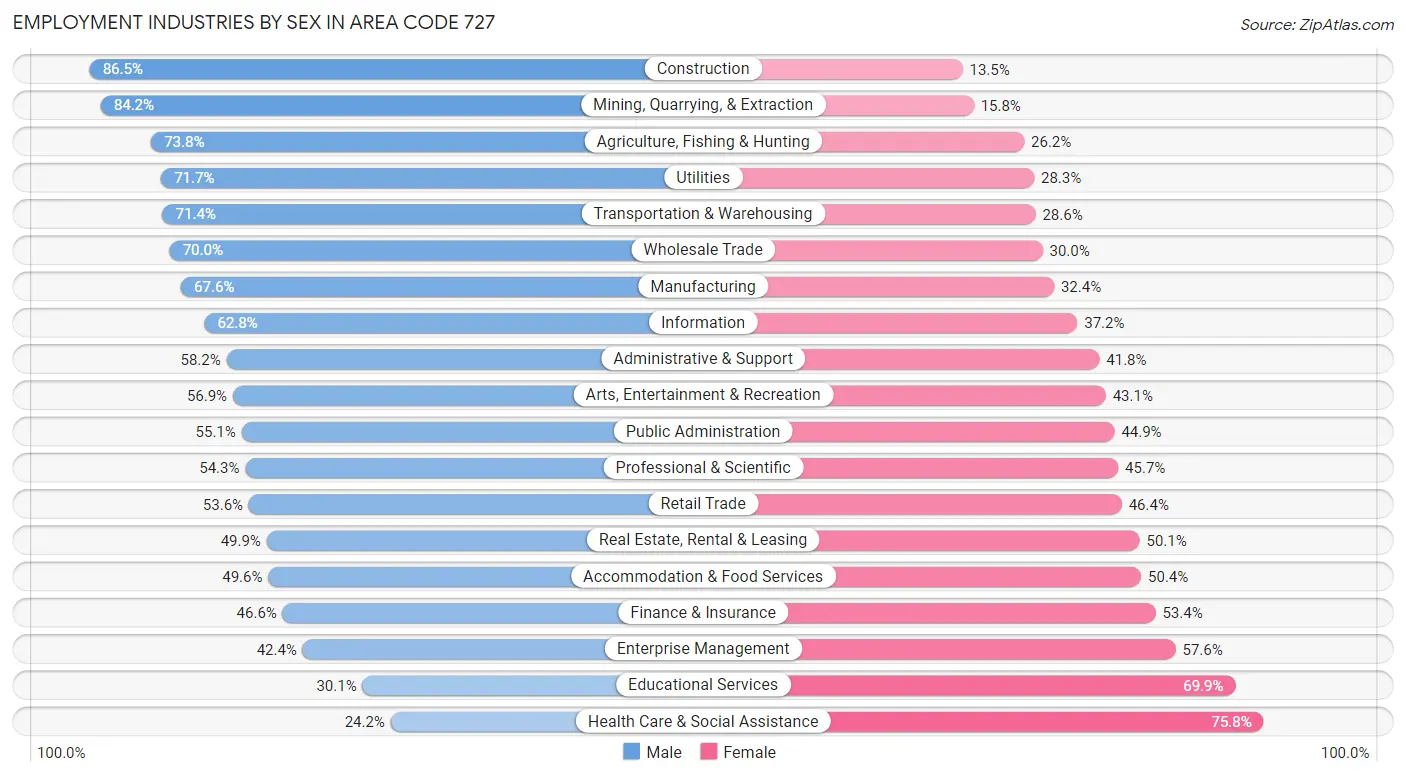
| Industry | Male | Female |
| Agriculture, Fishing & Hunting | 1,348 (73.8%) | 479 (26.2%) |
| Mining, Quarrying, & Extraction | 160 (84.2%) | 30 (15.8%) |
| Construction | 37,746 (86.5%) | 5,880 (13.5%) |
| Manufacturing | 28,015 (67.6%) | 13,431 (32.4%) |
| Wholesale Trade | 10,939 (70.0%) | 4,697 (30.0%) |
| Retail Trade | 43,633 (53.6%) | 37,824 (46.4%) |
| Transportation & Warehousing | 16,793 (71.4%) | 6,719 (28.6%) |
| Utilities | 3,299 (71.7%) | 1,301 (28.3%) |
| Information | 7,492 (62.8%) | 4,444 (37.2%) |
| Finance & Insurance | 21,048 (46.6%) | 24,134 (53.4%) |
| Real Estate, Rental & Leasing | 9,234 (49.9%) | 9,276 (50.1%) |
| Professional & Scientific | 35,538 (54.3%) | 29,897 (45.7%) |
| Enterprise Management | 573 (42.4%) | 777 (57.6%) |
| Administrative & Support | 18,448 (58.2%) | 13,250 (41.8%) |
| Educational Services | 14,032 (30.1%) | 32,650 (69.9%) |
| Health Care & Social Assistance | 23,773 (24.2%) | 74,363 (75.8%) |
| Arts, Entertainment & Recreation | 8,953 (56.9%) | 6,788 (43.1%) |
| Accommodation & Food Services | 25,383 (49.6%) | 25,838 (50.4%) |
| Public Administration | 12,929 (55.1%) | 10,542 (44.9%) |
| Total | 334,304 (51.0%) | 320,636 (49.0%) |
Education in Area Code 727
School Enrollment in Area Code 727
The most common levels of schooling among the 260,936 students in Area Code 727 are college / undergraduate (59,457 | 22.8%), high school (56,006 | 21.5%), and middle school (50,715 | 19.4%).
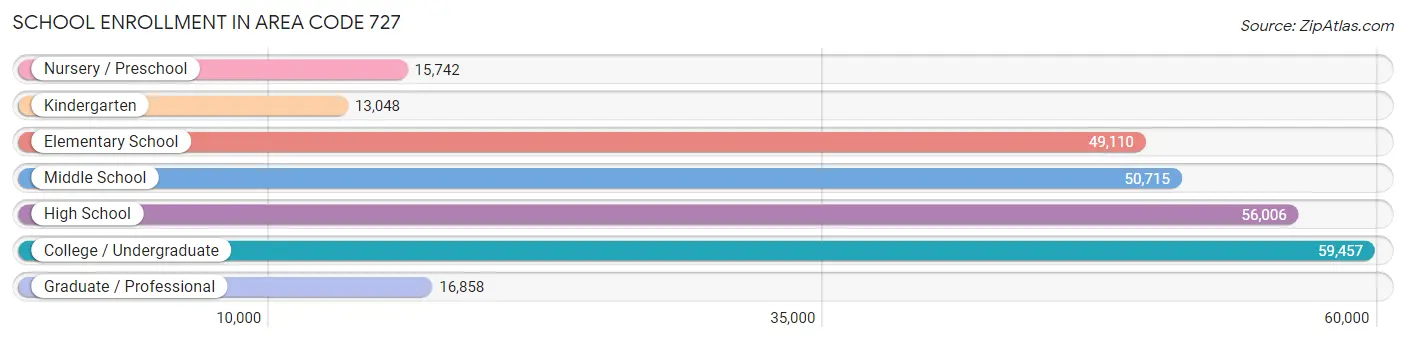
| School Level | # Students | % Students |
| Nursery / Preschool | 15,742 | 6.0% |
| Kindergarten | 13,048 | 5.0% |
| Elementary School | 49,110 | 18.8% |
| Middle School | 50,715 | 19.4% |
| High School | 56,006 | 21.5% |
| College / Undergraduate | 59,457 | 22.8% |
| Graduate / Professional | 16,858 | 6.5% |
| Total | 260,936 | 100.0% |
School Enrollment by Age by Funding Source in Area Code 727
Out of a total of 260,936 students who are enrolled in schools in Area Code 727, 55,446 (21.2%) attend a private institution, while the remaining 205,490 (78.7%) are enrolled in public schools. The age group of 3 to 4 year olds has the highest likelihood of being enrolled in private schools, with 6,578 (52.8% in the age bracket) enrolled. Conversely, the age group of 15 to 17 year olds has the lowest likelihood of being enrolled in a private school, with 34,160 (83.9% in the age bracket) attending a public institution.
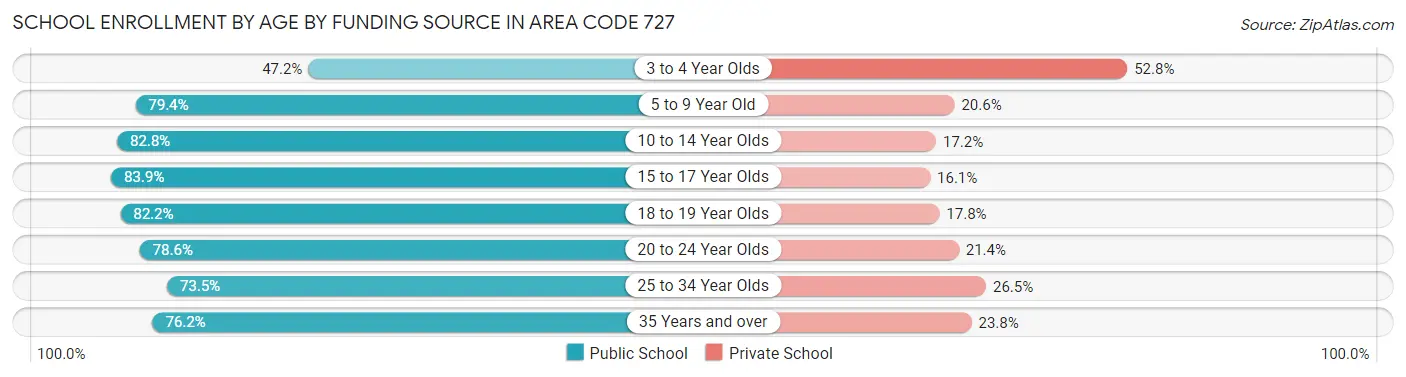
| Age Bracket | Public School | Private School |
| 3 to 4 Year Olds | 5,876 (47.2%) | 6,578 (52.8%) |
| 5 to 9 Year Old | 46,813 (79.4%) | 12,178 (20.6%) |
| 10 to 14 Year Olds | 51,819 (82.8%) | 10,769 (17.2%) |
| 15 to 17 Year Olds | 34,160 (83.9%) | 6,555 (16.1%) |
| 18 to 19 Year Olds | 14,195 (82.2%) | 3,080 (17.8%) |
| 20 to 24 Year Olds | 20,979 (78.6%) | 5,726 (21.4%) |
| 25 to 34 Year Olds | 13,679 (73.5%) | 4,937 (26.5%) |
| 35 Years and over | 17,972 (76.2%) | 5,620 (23.8%) |
| Total | 205,490 (78.7%) | 55,446 (21.2%) |
Educational Attainment by Field of Study in Area Code 727
Business (91,500 | 23.8%), education (45,721 | 11.9%), science & technology (41,447 | 10.8%), social sciences (30,185 | 7.9%), and engineering (24,602 | 6.4%) are the most common fields of study among 383,697 individuals in Area Code 727 who have obtained a bachelor's degree or higher.
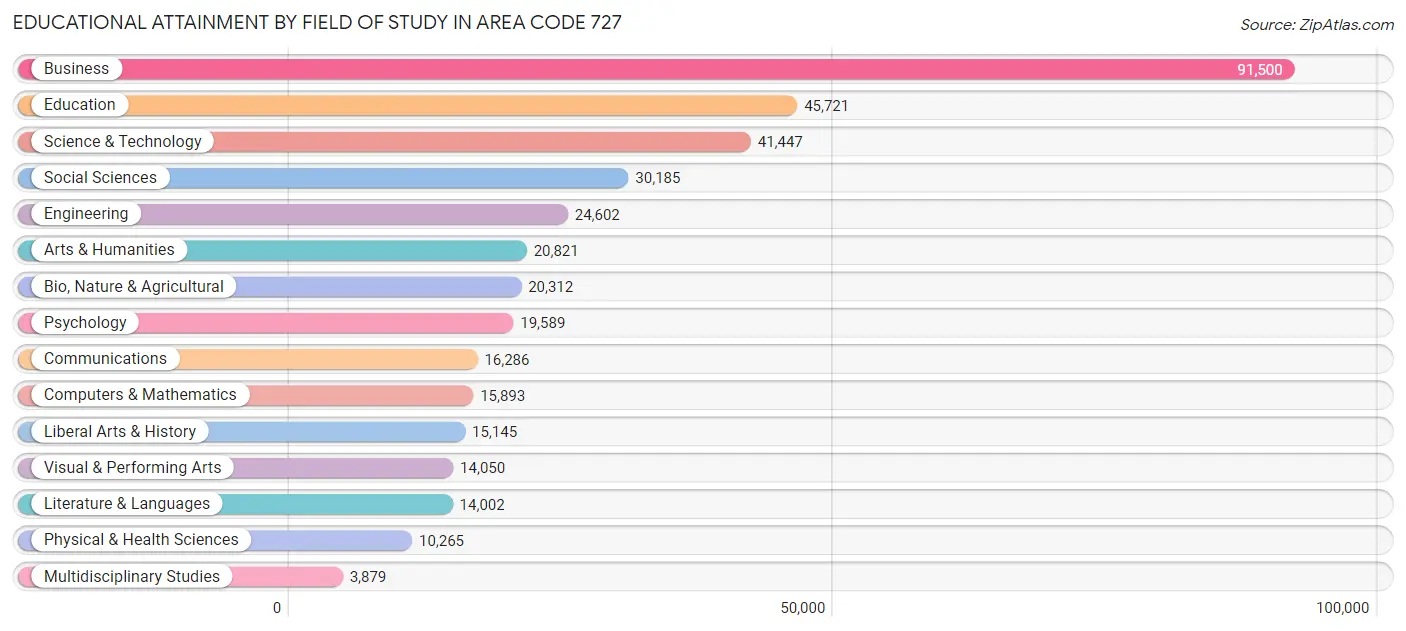
| Field of Study | # Graduates | % Graduates |
| Computers & Mathematics | 15,893 | 4.1% |
| Bio, Nature & Agricultural | 20,312 | 5.3% |
| Physical & Health Sciences | 10,265 | 2.7% |
| Psychology | 19,589 | 5.1% |
| Social Sciences | 30,185 | 7.9% |
| Engineering | 24,602 | 6.4% |
| Multidisciplinary Studies | 3,879 | 1.0% |
| Science & Technology | 41,447 | 10.8% |
| Business | 91,500 | 23.8% |
| Education | 45,721 | 11.9% |
| Literature & Languages | 14,002 | 3.6% |
| Liberal Arts & History | 15,145 | 4.0% |
| Visual & Performing Arts | 14,050 | 3.7% |
| Communications | 16,286 | 4.2% |
| Arts & Humanities | 20,821 | 5.4% |
| Total | 383,697 | 100.0% |
Transportation & Commute in Area Code 727
Vehicle Availability by Sex in Area Code 727
The most prevalent vehicle ownership categories in Area Code 727 are males with 2 vehicles (158,260, accounting for 47.9%) and females with 2 vehicles (141,374, making up 50.5%).
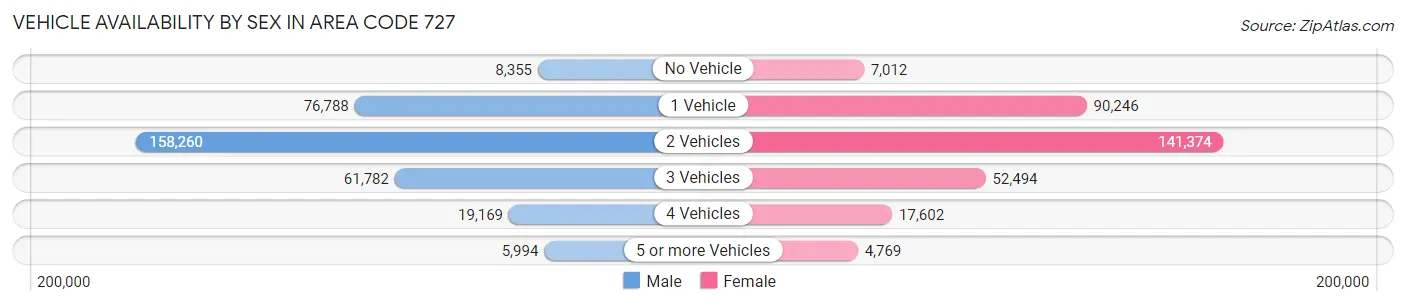
| Vehicles Available | Male | Female |
| No Vehicle | 8,355 (2.5%) | 7,012 (2.2%) |
| 1 Vehicle | 76,788 (23.2%) | 90,246 (28.8%) |
| 2 Vehicles | 158,260 (47.9%) | 141,374 (45.1%) |
| 3 Vehicles | 61,782 (18.7%) | 52,494 (16.7%) |
| 4 Vehicles | 19,169 (5.8%) | 17,602 (5.6%) |
| 5 or more Vehicles | 5,994 (1.8%) | 4,769 (1.5%) |
| Total | 330,348 (100.0%) | 313,497 (100.0%) |
Commute Time in Area Code 727
The most frequently occuring commute durations in Area Code 727 are 15 to 19 minutes (94,702 commuters, 17.3%), 20 to 24 minutes (84,300 commuters, 15.4%), and 30 to 34 minutes (77,488 commuters, 14.1%).
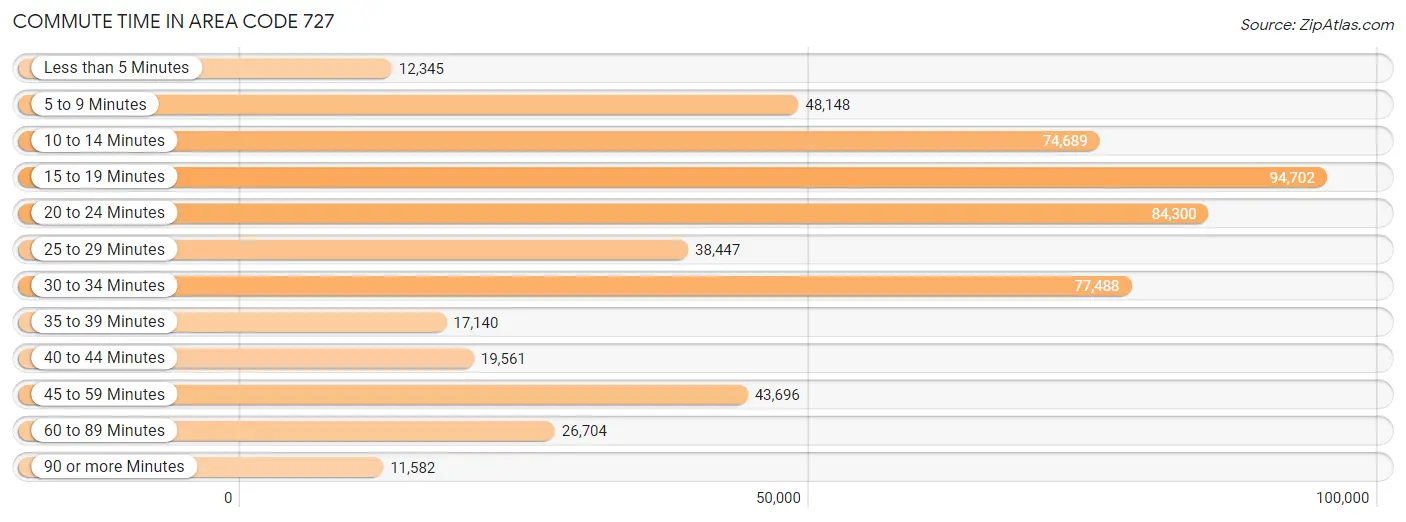
| Commute Time | # Commuters | % Commuters |
| Less than 5 Minutes | 12,345 | 2.2% |
| 5 to 9 Minutes | 48,148 | 8.8% |
| 10 to 14 Minutes | 74,689 | 13.6% |
| 15 to 19 Minutes | 94,702 | 17.3% |
| 20 to 24 Minutes | 84,300 | 15.4% |
| 25 to 29 Minutes | 38,447 | 7.0% |
| 30 to 34 Minutes | 77,488 | 14.1% |
| 35 to 39 Minutes | 17,140 | 3.1% |
| 40 to 44 Minutes | 19,561 | 3.6% |
| 45 to 59 Minutes | 43,696 | 8.0% |
| 60 to 89 Minutes | 26,704 | 4.9% |
| 90 or more Minutes | 11,582 | 2.1% |
Commute Time by Sex in Area Code 727
The most common commute times in Area Code 727 are 15 to 19 minutes (47,996 commuters, 16.9%) for males and 15 to 19 minutes (46,706 commuters, 17.7%) for females.
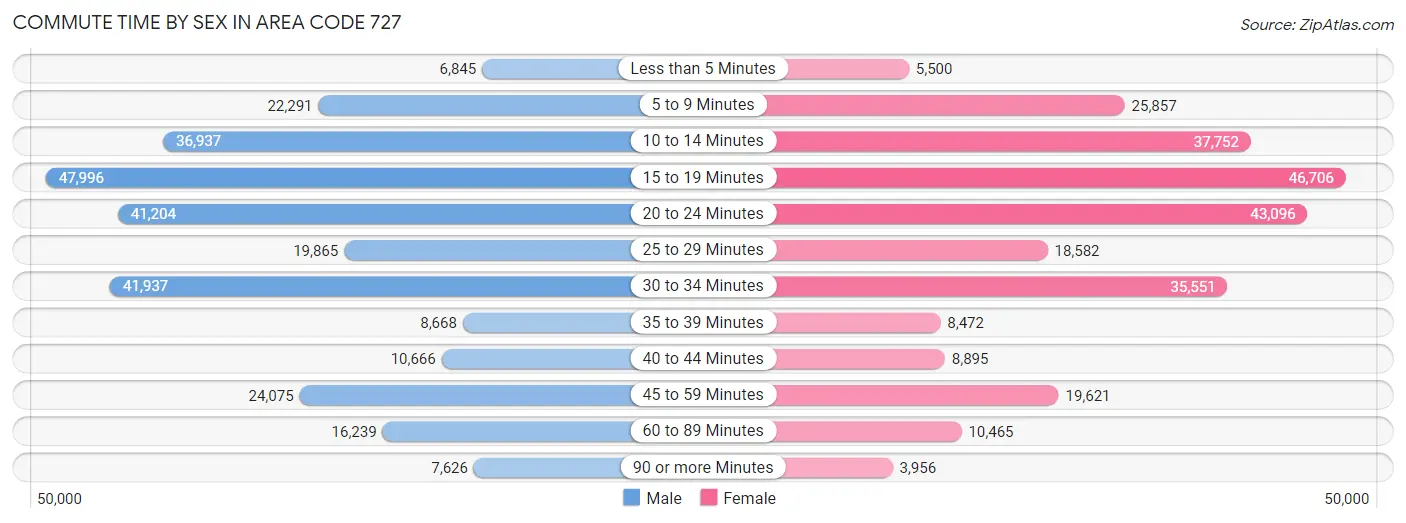
| Commute Time | Male | Female |
| Less than 5 Minutes | 6,845 (2.4%) | 5,500 (2.1%) |
| 5 to 9 Minutes | 22,291 (7.8%) | 25,857 (9.8%) |
| 10 to 14 Minutes | 36,937 (13.0%) | 37,752 (14.3%) |
| 15 to 19 Minutes | 47,996 (16.9%) | 46,706 (17.7%) |
| 20 to 24 Minutes | 41,204 (14.5%) | 43,096 (16.3%) |
| 25 to 29 Minutes | 19,865 (7.0%) | 18,582 (7.0%) |
| 30 to 34 Minutes | 41,937 (14.7%) | 35,551 (13.4%) |
| 35 to 39 Minutes | 8,668 (3.0%) | 8,472 (3.2%) |
| 40 to 44 Minutes | 10,666 (3.7%) | 8,895 (3.4%) |
| 45 to 59 Minutes | 24,075 (8.5%) | 19,621 (7.4%) |
| 60 to 89 Minutes | 16,239 (5.7%) | 10,465 (4.0%) |
| 90 or more Minutes | 7,626 (2.7%) | 3,956 (1.5%) |
Time of Departure to Work by Sex in Area Code 727
The most frequent times of departure to work in Area Code 727 are 7:00 AM to 7:29 AM (41,273, 14.5%) for males and 7:00 AM to 7:29 AM (39,199, 14.8%) for females.
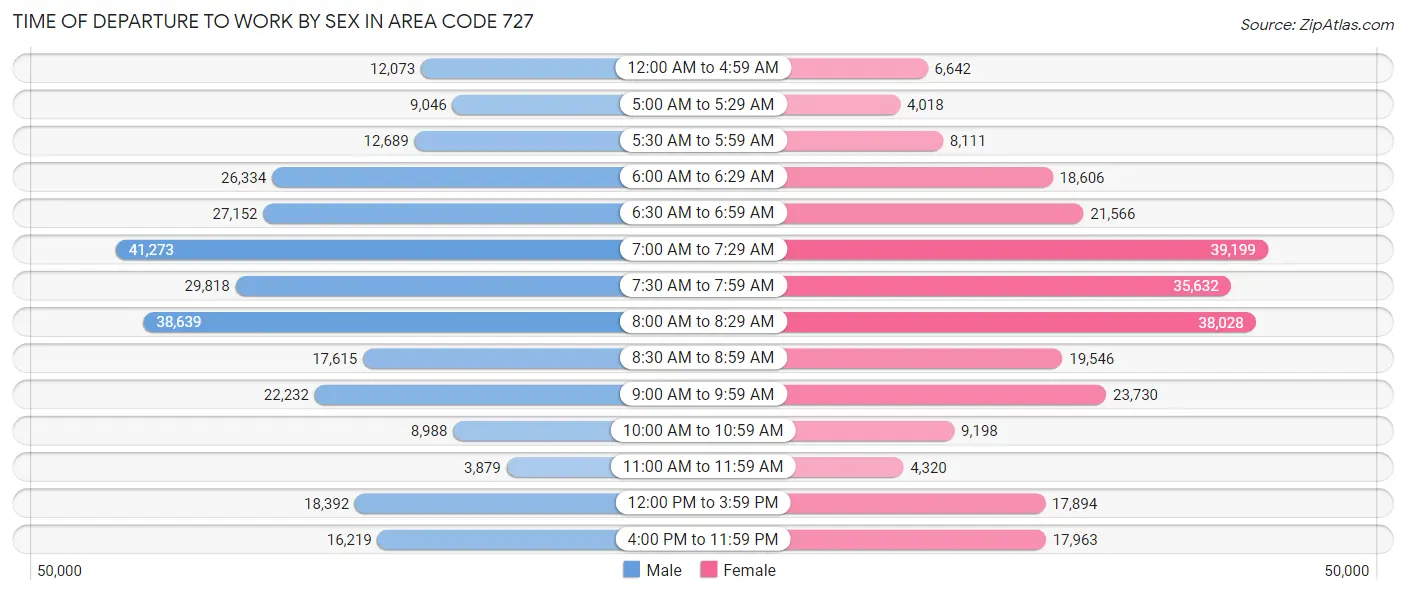
| Time of Departure | Male | Female |
| 12:00 AM to 4:59 AM | 12,073 (4.3%) | 6,642 (2.5%) |
| 5:00 AM to 5:29 AM | 9,046 (3.2%) | 4,018 (1.5%) |
| 5:30 AM to 5:59 AM | 12,689 (4.5%) | 8,111 (3.1%) |
| 6:00 AM to 6:29 AM | 26,334 (9.3%) | 18,606 (7.0%) |
| 6:30 AM to 6:59 AM | 27,152 (9.6%) | 21,566 (8.2%) |
| 7:00 AM to 7:29 AM | 41,273 (14.5%) | 39,199 (14.8%) |
| 7:30 AM to 7:59 AM | 29,818 (10.5%) | 35,632 (13.5%) |
| 8:00 AM to 8:29 AM | 38,639 (13.6%) | 38,028 (14.4%) |
| 8:30 AM to 8:59 AM | 17,615 (6.2%) | 19,546 (7.4%) |
| 9:00 AM to 9:59 AM | 22,232 (7.8%) | 23,730 (9.0%) |
| 10:00 AM to 10:59 AM | 8,988 (3.2%) | 9,198 (3.5%) |
| 11:00 AM to 11:59 AM | 3,879 (1.4%) | 4,320 (1.6%) |
| 12:00 PM to 3:59 PM | 18,392 (6.5%) | 17,894 (6.8%) |
| 4:00 PM to 11:59 PM | 16,219 (5.7%) | 17,963 (6.8%) |
| Total | 284,349 (100.0%) | 264,453 (100.0%) |
Housing Occupancy in Area Code 727
Occupancy by Ownership in Area Code 727
Of the total 598,330 dwellings in Area Code 727, owner-occupied units account for 410,243 (68.6%), while renter-occupied units make up 188,087 (31.4%).
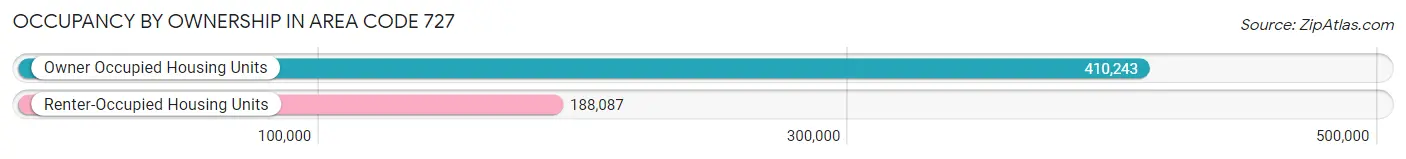
| Occupancy | # Housing Units | % Housing Units |
| Owner Occupied Housing Units | 410,243 | 68.6% |
| Renter-Occupied Housing Units | 188,087 | 31.4% |
| Total Occupied Housing Units | 598,330 | 100.0% |
Occupancy by Household Size in Area Code 727
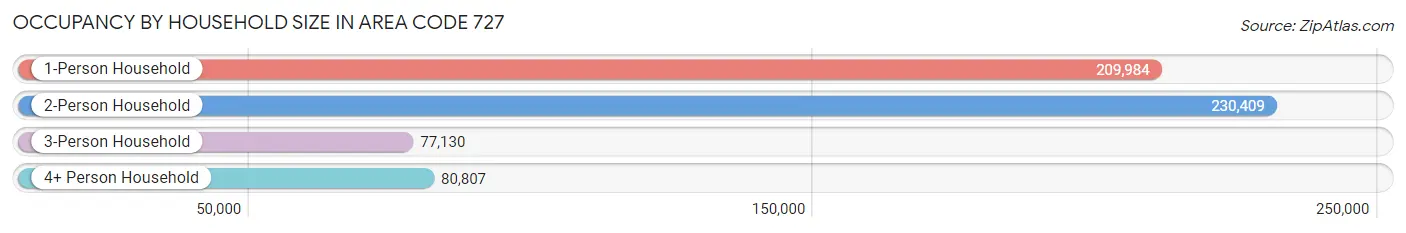
| Household Size | # Housing Units | % Housing Units |
| 1-Person Household | 209,984 | 35.1% |
| 2-Person Household | 230,409 | 38.5% |
| 3-Person Household | 77,130 | 12.9% |
| 4+ Person Household | 80,807 | 13.5% |
| Total Housing Units | 598,330 | 100.0% |
Occupancy by Ownership by Household Size in Area Code 727
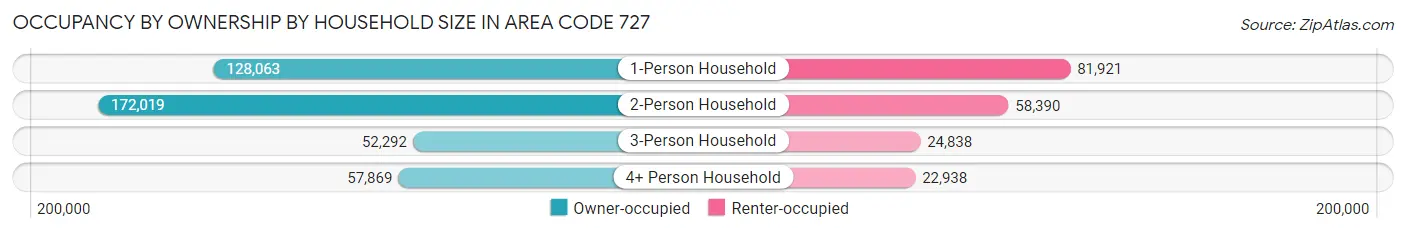
| Household Size | Owner-occupied | Renter-occupied |
| 1-Person Household | 128,063 (61.0%) | 81,921 (39.0%) |
| 2-Person Household | 172,019 (74.7%) | 58,390 (25.3%) |
| 3-Person Household | 52,292 (67.8%) | 24,838 (32.2%) |
| 4+ Person Household | 57,869 (71.6%) | 22,938 (28.4%) |
| Total Housing Units | 410,243 (68.6%) | 188,087 (31.4%) |
Occupancy by Educational Attainment in Area Code 727
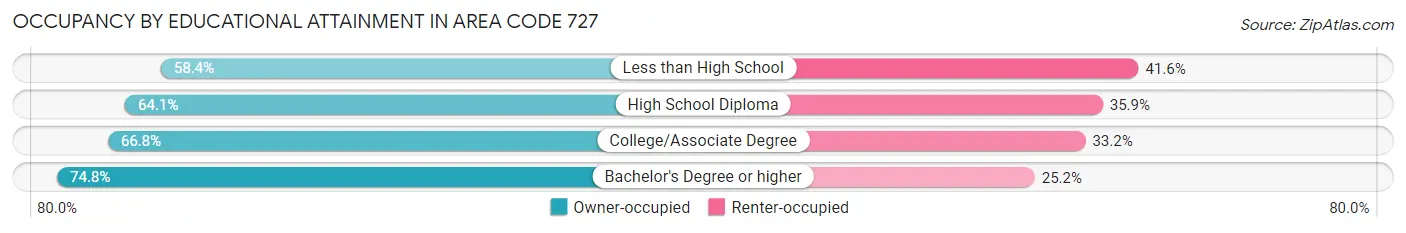
| Household Size | Owner-occupied | Renter-occupied |
| Less than High School | 21,914 (58.4%) | 15,625 (41.6%) |
| High School Diploma | 95,225 (64.1%) | 53,433 (35.9%) |
| College/Associate Degree | 127,496 (66.8%) | 63,362 (33.2%) |
| Bachelor's Degree or higher | 165,608 (74.8%) | 55,667 (25.2%) |
Occupancy by Age of Householder in Area Code 727
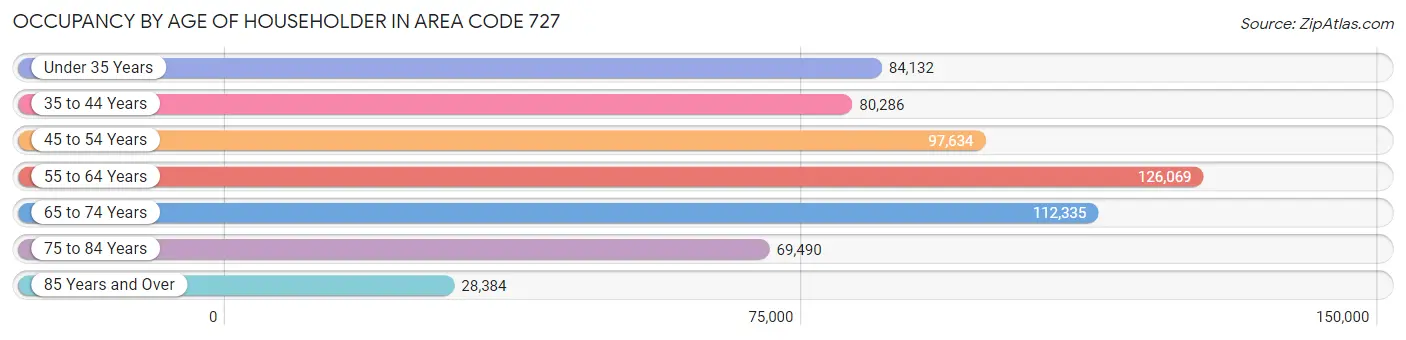
| Age Bracket | # Households | % Households |
| Under 35 Years | 84,132 | 14.1% |
| 35 to 44 Years | 80,286 | 13.4% |
| 45 to 54 Years | 97,634 | 16.3% |
| 55 to 64 Years | 126,069 | 21.1% |
| 65 to 74 Years | 112,335 | 18.8% |
| 75 to 84 Years | 69,490 | 11.6% |
| 85 Years and Over | 28,384 | 4.7% |
| Total | 598,330 | 100.0% |
Housing Finances in Area Code 727
Median Income by Occupancy in Area Code 727
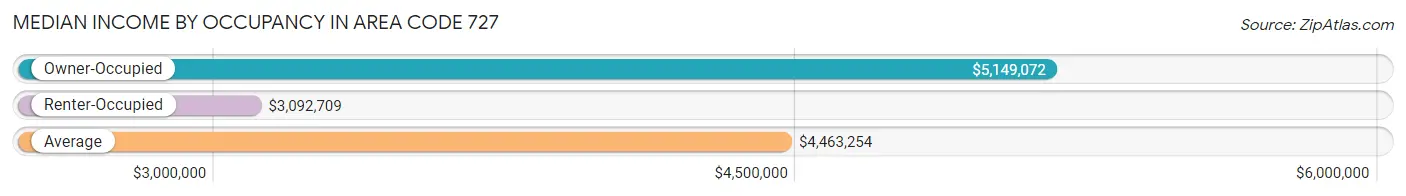
| Occupancy Type | # Households | Median Income |
| Owner-Occupied | 410,243 (68.6%) | $5,149,072 |
| Renter-Occupied | 188,087 (31.4%) | $3,092,709 |
| Average | 598,330 (100.0%) | $4,463,254 |
Occupancy by Householder Income Bracket in Area Code 727
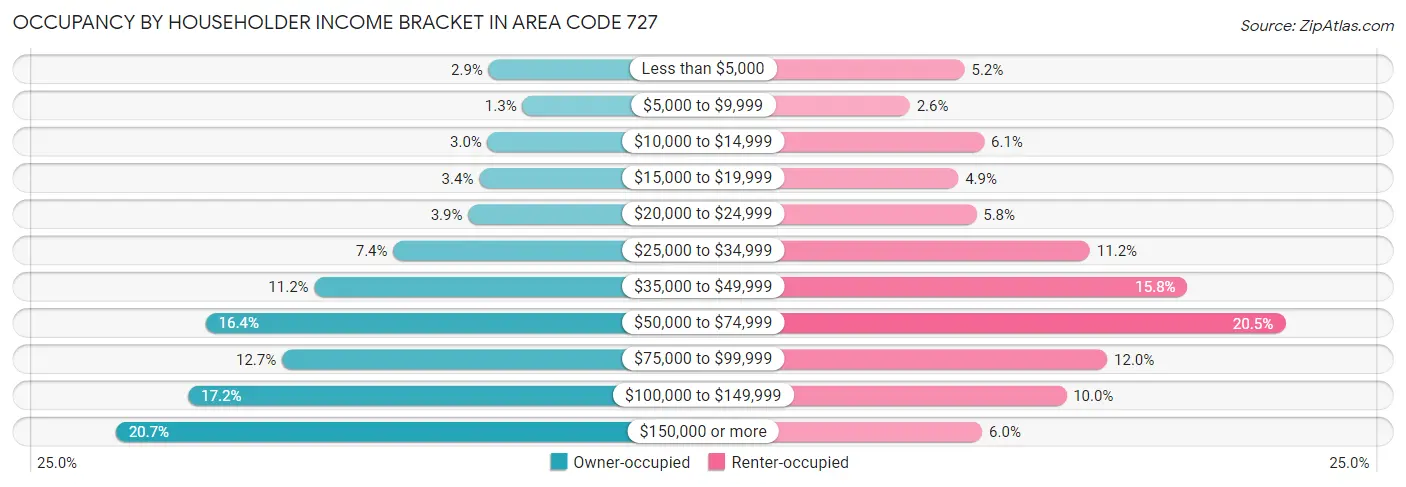
| Income Bracket | Owner-occupied | Renter-occupied |
| Less than $5,000 | 11,906 (2.9%) | 9,771 (5.2%) |
| $5,000 to $9,999 | 5,312 (1.3%) | 4,850 (2.6%) |
| $10,000 to $14,999 | 12,109 (2.9%) | 11,510 (6.1%) |
| $15,000 to $19,999 | 13,750 (3.4%) | 9,203 (4.9%) |
| $20,000 to $24,999 | 15,865 (3.9%) | 10,822 (5.8%) |
| $25,000 to $34,999 | 30,539 (7.4%) | 20,992 (11.2%) |
| $35,000 to $49,999 | 45,961 (11.2%) | 29,721 (15.8%) |
| $50,000 to $74,999 | 67,205 (16.4%) | 38,467 (20.4%) |
| $75,000 to $99,999 | 52,245 (12.7%) | 22,535 (12.0%) |
| $100,000 to $149,999 | 70,584 (17.2%) | 18,874 (10.0%) |
| $150,000 or more | 84,767 (20.7%) | 11,342 (6.0%) |
| Total | 410,243 (100.0%) | 188,087 (100.0%) |
Monthly Housing Cost Tiers in Area Code 727
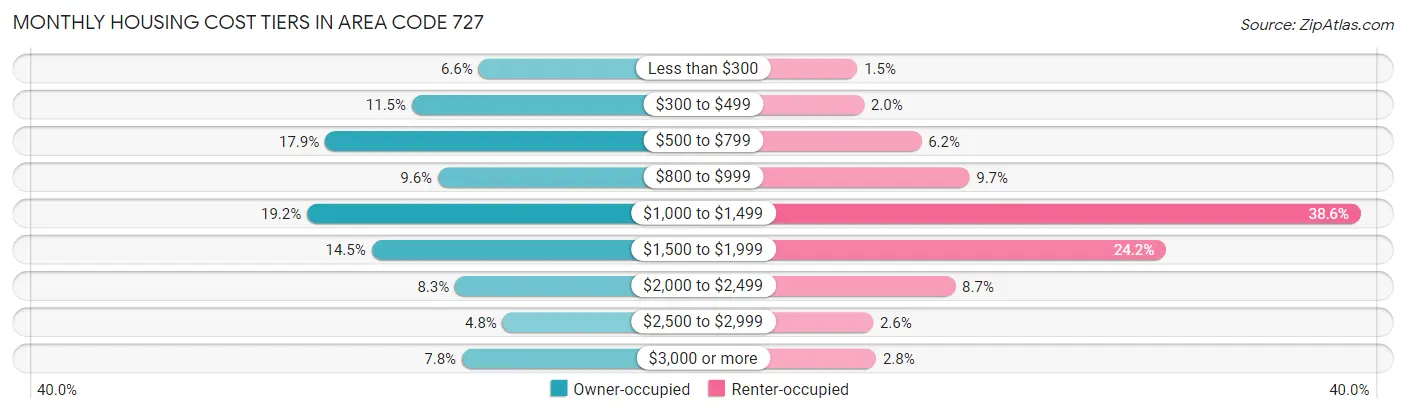
| Monthly Cost | Owner-occupied | Renter-occupied |
| Less than $300 | 26,956 (6.6%) | 2,739 (1.5%) |
| $300 to $499 | 47,083 (11.5%) | 3,670 (1.9%) |
| $500 to $799 | 73,299 (17.9%) | 11,598 (6.2%) |
| $800 to $999 | 39,211 (9.6%) | 18,268 (9.7%) |
| $1,000 to $1,499 | 78,767 (19.2%) | 72,512 (38.6%) |
| $1,500 to $1,999 | 59,273 (14.4%) | 45,519 (24.2%) |
| $2,000 to $2,499 | 34,063 (8.3%) | 16,303 (8.7%) |
| $2,500 to $2,999 | 19,634 (4.8%) | 4,923 (2.6%) |
| $3,000 or more | 31,957 (7.8%) | 5,346 (2.8%) |
| Total | 410,243 (100.0%) | 188,087 (100.0%) |
Physical Housing Characteristics in Area Code 727
Housing Structures in Area Code 727
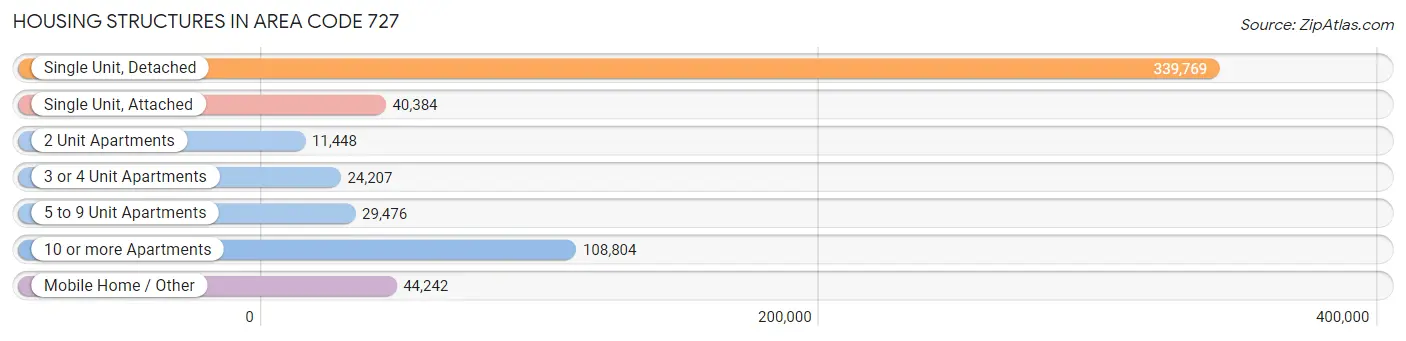
| Structure Type | # Housing Units | % Housing Units |
| Single Unit, Detached | 339,769 | 56.8% |
| Single Unit, Attached | 40,384 | 6.8% |
| 2 Unit Apartments | 11,448 | 1.9% |
| 3 or 4 Unit Apartments | 24,207 | 4.1% |
| 5 to 9 Unit Apartments | 29,476 | 4.9% |
| 10 or more Apartments | 108,804 | 18.2% |
| Mobile Home / Other | 44,242 | 7.4% |
| Total | 598,330 | 100.0% |
Housing Structures by Occupancy in Area Code 727
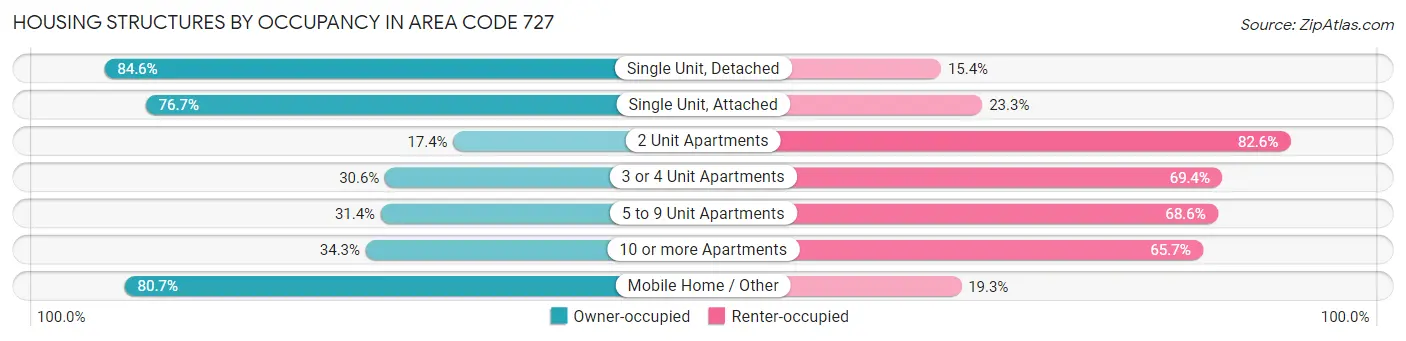
| Structure Type | Owner-occupied | Renter-occupied |
| Single Unit, Detached | 287,591 (84.6%) | 52,178 (15.4%) |
| Single Unit, Attached | 30,969 (76.7%) | 9,415 (23.3%) |
| 2 Unit Apartments | 1,995 (17.4%) | 9,453 (82.6%) |
| 3 or 4 Unit Apartments | 7,401 (30.6%) | 16,806 (69.4%) |
| 5 to 9 Unit Apartments | 9,252 (31.4%) | 20,224 (68.6%) |
| 10 or more Apartments | 37,314 (34.3%) | 71,490 (65.7%) |
| Mobile Home / Other | 35,721 (80.7%) | 8,521 (19.3%) |
| Total | 410,243 (68.6%) | 188,087 (31.4%) |
Housing Structures by Number of Rooms in Area Code 727
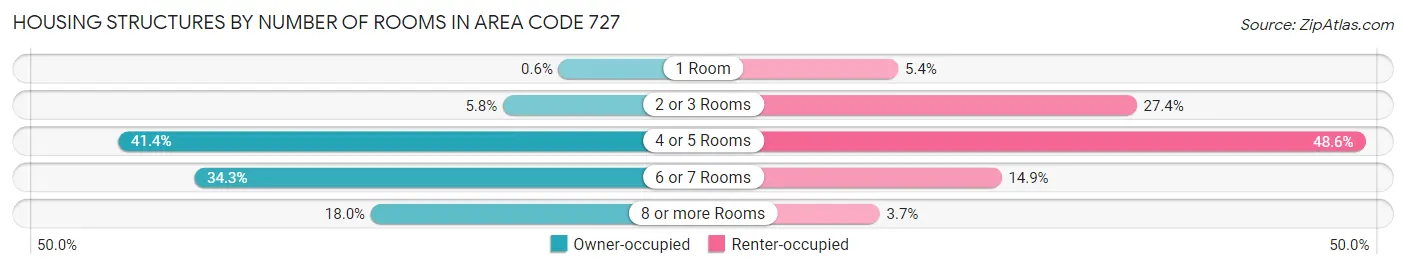
| Number of Rooms | Owner-occupied | Renter-occupied |
| 1 Room | 2,460 (0.6%) | 10,110 (5.4%) |
| 2 or 3 Rooms | 23,604 (5.8%) | 51,585 (27.4%) |
| 4 or 5 Rooms | 169,630 (41.3%) | 91,391 (48.6%) |
| 6 or 7 Rooms | 140,808 (34.3%) | 28,095 (14.9%) |
| 8 or more Rooms | 73,741 (18.0%) | 6,906 (3.7%) |
| Total | 410,243 (100.0%) | 188,087 (100.0%) |
Housing Structure by Heating Type in Area Code 727
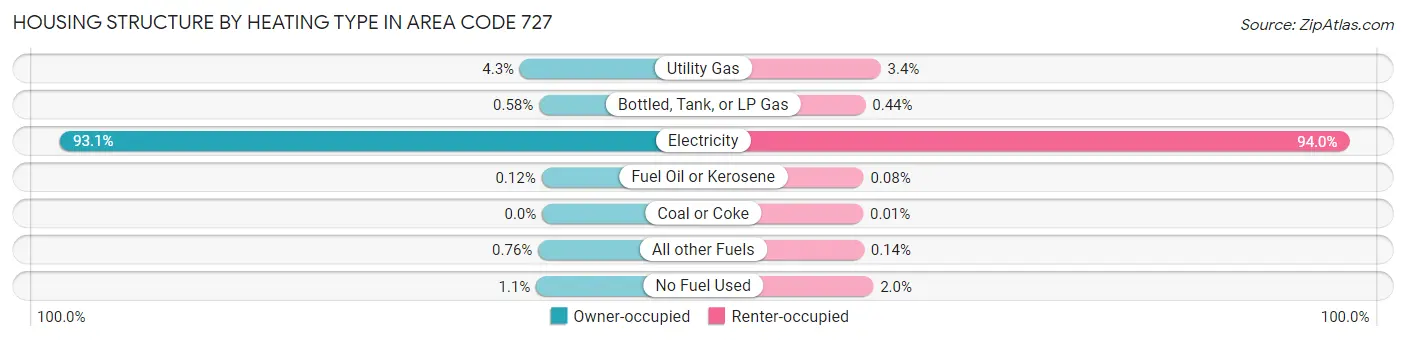
| Heating Type | Owner-occupied | Renter-occupied |
| Utility Gas | 17,561 (4.3%) | 6,393 (3.4%) |
| Bottled, Tank, or LP Gas | 2,387 (0.6%) | 823 (0.4%) |
| Electricity | 382,018 (93.1%) | 176,740 (94.0%) |
| Fuel Oil or Kerosene | 497 (0.1%) | 144 (0.1%) |
| Coal or Coke | 6 (0.0%) | 18 (0.0%) |
| All other Fuels | 3,116 (0.8%) | 264 (0.1%) |
| No Fuel Used | 4,658 (1.1%) | 3,705 (2.0%) |
| Total | 410,243 (100.0%) | 188,087 (100.0%) |
Household Vehicle Usage in Area Code 727
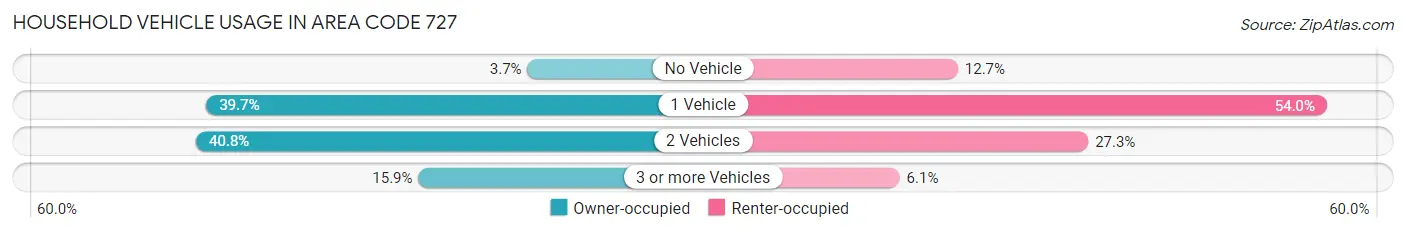
| Vehicles per Household | Owner-occupied | Renter-occupied |
| No Vehicle | 15,040 (3.7%) | 23,784 (12.7%) |
| 1 Vehicle | 162,663 (39.7%) | 101,521 (54.0%) |
| 2 Vehicles | 167,362 (40.8%) | 51,260 (27.3%) |
| 3 or more Vehicles | 65,178 (15.9%) | 11,522 (6.1%) |
| Total | 410,243 (100.0%) | 188,087 (100.0%) |
Real Estate & Mortgages in Area Code 727
Real Estate and Mortgage Overview in Area Code 727
| Characteristic | Without Mortgage | With Mortgage |
| Housing Units | 190,063 | 220,180 |
| Median Property Value | $16,781,100 | $22,020,400 |
| Median Household Income | $3,712,630 | $59,963 |
| Monthly Housing Costs | $39,583 | $29,780 |
| Real Estate Taxes | $128,166 | $6,743 |
Property Value by Mortgage Status in Area Code 727
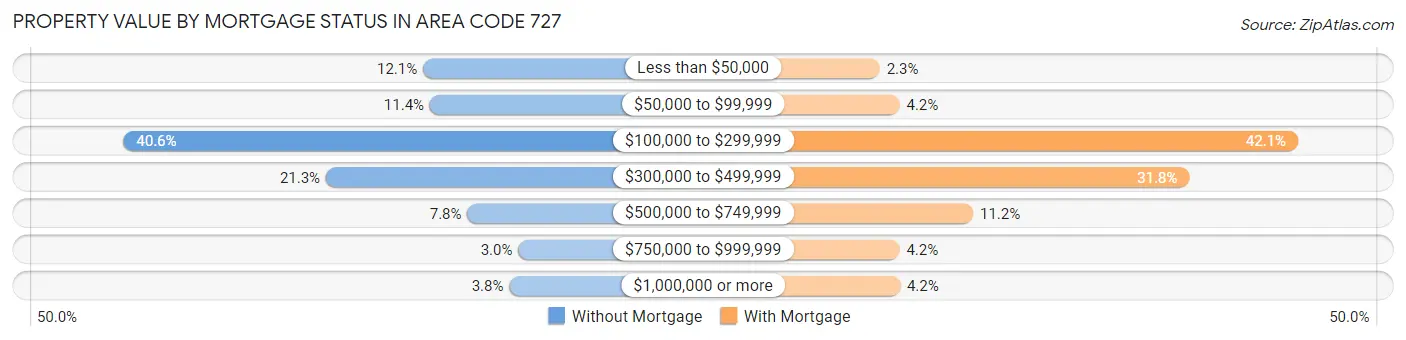
| Property Value | Without Mortgage | With Mortgage |
| Less than $50,000 | 22,907 (12.0%) | 5,074 (2.3%) |
| $50,000 to $99,999 | 21,668 (11.4%) | 9,219 (4.2%) |
| $100,000 to $299,999 | 77,155 (40.6%) | 92,752 (42.1%) |
| $300,000 to $499,999 | 40,486 (21.3%) | 69,999 (31.8%) |
| $500,000 to $749,999 | 14,875 (7.8%) | 24,630 (11.2%) |
| $750,000 to $999,999 | 5,673 (3.0%) | 9,197 (4.2%) |
| $1,000,000 or more | 7,299 (3.8%) | 9,309 (4.2%) |
| Total | 190,063 (100.0%) | 220,180 (100.0%) |
Household Income by Mortgage Status in Area Code 727
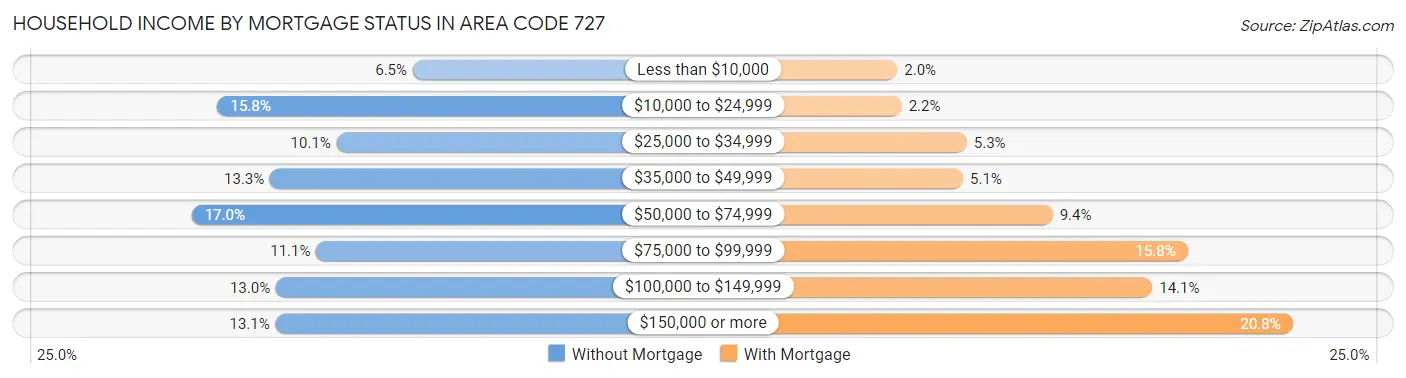
| Household Income | Without Mortgage | With Mortgage |
| Less than $10,000 | 12,382 (6.5%) | 4,374 (2.0%) |
| $10,000 to $24,999 | 30,045 (15.8%) | 4,836 (2.2%) |
| $25,000 to $34,999 | 19,267 (10.1%) | 11,679 (5.3%) |
| $35,000 to $49,999 | 25,288 (13.3%) | 11,272 (5.1%) |
| $50,000 to $74,999 | 32,389 (17.0%) | 20,673 (9.4%) |
| $75,000 to $99,999 | 21,123 (11.1%) | 34,816 (15.8%) |
| $100,000 to $149,999 | 24,765 (13.0%) | 31,122 (14.1%) |
| $150,000 or more | 24,804 (13.1%) | 45,819 (20.8%) |
| Total | 190,063 (100.0%) | 220,180 (100.0%) |
Property Value to Household Income Ratio in Area Code 727
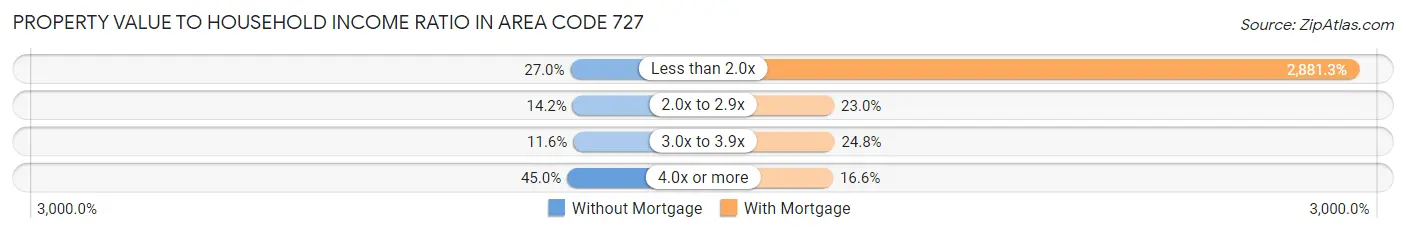
| Value-to-Income Ratio | Without Mortgage | With Mortgage |
| Less than 2.0x | 51,359 (27.0%) | 6,344,026 (2,881.3%) |
| 2.0x to 2.9x | 27,027 (14.2%) | 50,628 (23.0%) |
| 3.0x to 3.9x | 22,090 (11.6%) | 54,568 (24.8%) |
| 4.0x or more | 85,537 (45.0%) | 36,648 (16.6%) |
| Total | 190,063 (100.0%) | 220,180 (100.0%) |
Real Estate Taxes by Mortgage Status in Area Code 727
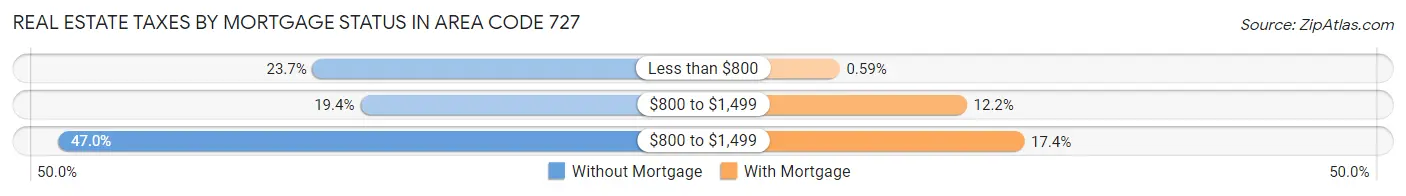
| Property Taxes | Without Mortgage | With Mortgage |
| Less than $800 | 45,050 (23.7%) | 1,292 (0.6%) |
| $800 to $1,499 | 36,770 (19.4%) | 26,855 (12.2%) |
| $800 to $1,499 | 89,237 (46.9%) | 38,401 (17.4%) |
| Total | 190,063 (100.0%) | 220,180 (100.0%) |
Health & Disability in Area Code 727
Health Insurance Coverage by Age in Area Code 727
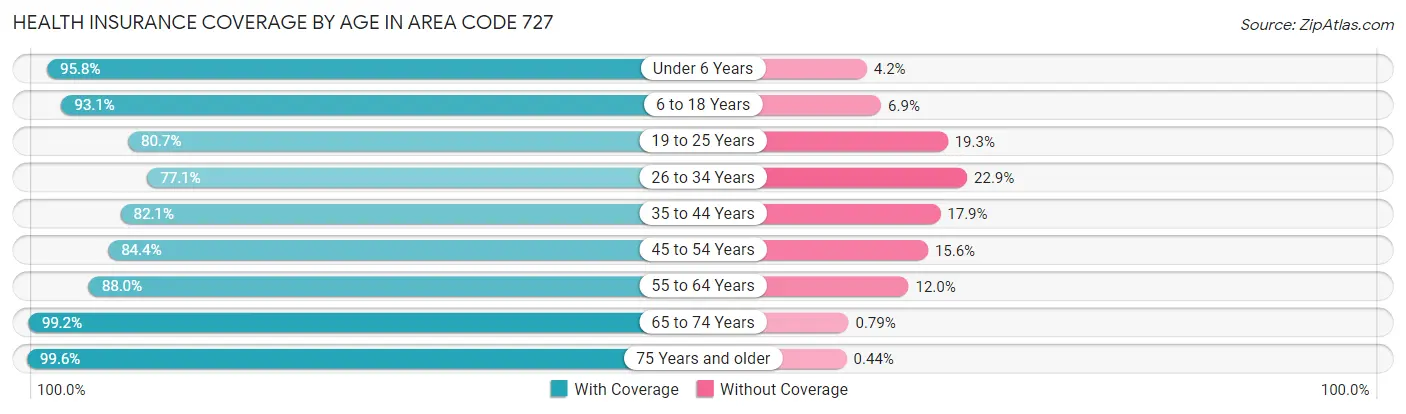
| Age Bracket | With Coverage | Without Coverage |
| Under 6 Years | 68,666 (95.8%) | 3,019 (4.2%) |
| 6 to 18 Years | 157,961 (93.1%) | 11,661 (6.9%) |
| 19 to 25 Years | 75,716 (80.7%) | 18,097 (19.3%) |
| 26 to 34 Years | 116,167 (77.1%) | 34,503 (22.9%) |
| 35 to 44 Years | 129,586 (82.1%) | 28,263 (17.9%) |
| 45 to 54 Years | 150,541 (84.4%) | 27,819 (15.6%) |
| 55 to 64 Years | 188,115 (88.0%) | 25,616 (12.0%) |
| 65 to 74 Years | 177,335 (99.2%) | 1,413 (0.8%) |
| 75 Years and older | 148,484 (99.6%) | 660 (0.4%) |
| Total | 1,212,571 (88.9%) | 151,051 (11.1%) |
Health Insurance Coverage by Citizenship Status in Area Code 727
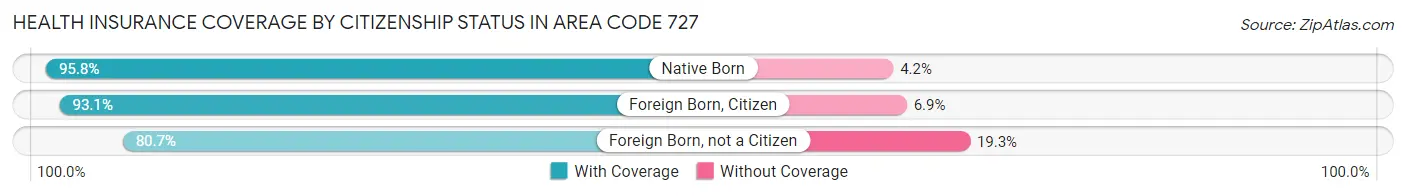
| Citizenship Status | With Coverage | Without Coverage |
| Native Born | 68,666 (95.8%) | 3,019 (4.2%) |
| Foreign Born, Citizen | 157,961 (93.1%) | 11,661 (6.9%) |
| Foreign Born, not a Citizen | 75,716 (80.7%) | 18,097 (19.3%) |
Health Insurance Coverage by Household Income in Area Code 727
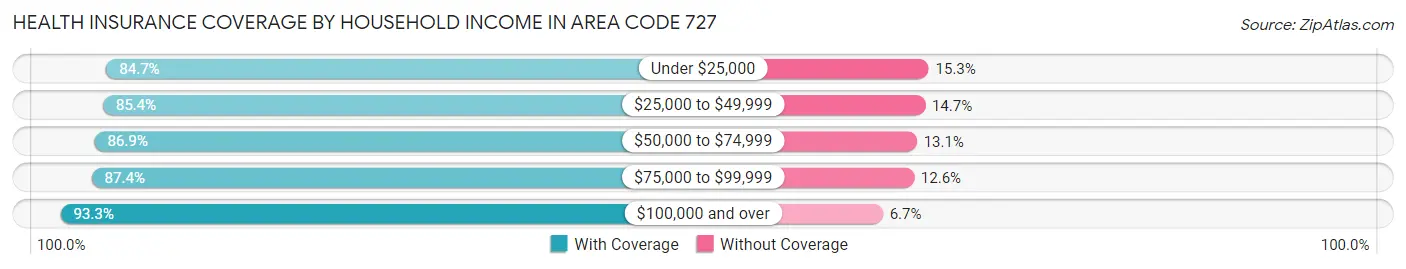
| Household Income | With Coverage | Without Coverage |
| Under $25,000 | 136,740 (84.7%) | 24,755 (15.3%) |
| $25,000 to $49,999 | 204,565 (85.4%) | 35,117 (14.6%) |
| $50,000 to $74,999 | 203,490 (86.9%) | 30,670 (13.1%) |
| $75,000 to $99,999 | 162,021 (87.4%) | 23,297 (12.6%) |
| $100,000 and over | 496,899 (93.3%) | 35,852 (6.7%) |
Public vs Private Health Insurance Coverage by Age in Area Code 727
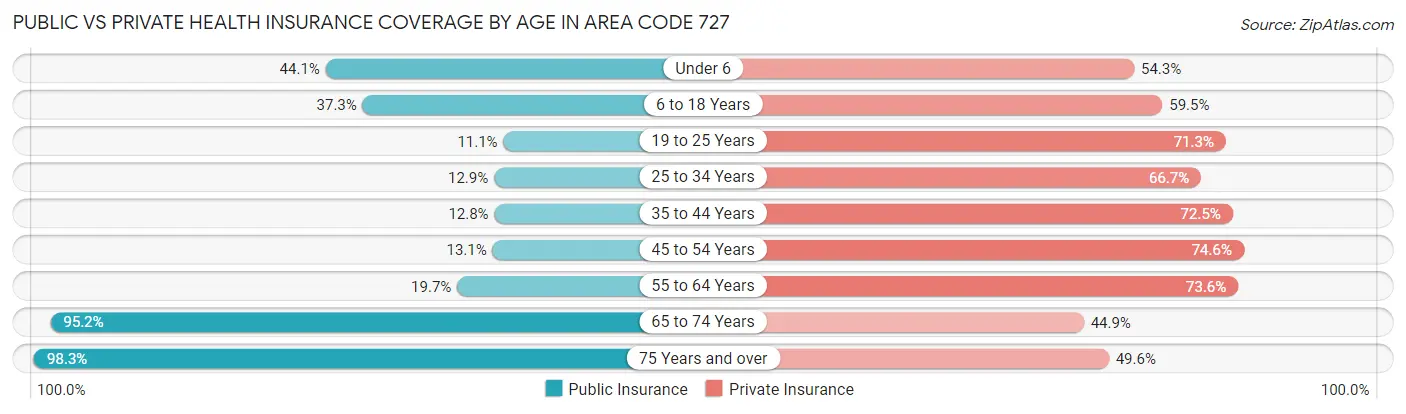
| Age Bracket | Public Insurance | Private Insurance |
| Under 6 | 31,631 (44.1%) | 38,892 (54.2%) |
| 6 to 18 Years | 63,208 (37.3%) | 100,914 (59.5%) |
| 19 to 25 Years | 10,429 (11.1%) | 66,854 (71.3%) |
| 25 to 34 Years | 19,380 (12.9%) | 100,473 (66.7%) |
| 35 to 44 Years | 20,187 (12.8%) | 114,500 (72.5%) |
| 45 to 54 Years | 23,439 (13.1%) | 133,061 (74.6%) |
| 55 to 64 Years | 42,127 (19.7%) | 157,221 (73.6%) |
| 65 to 74 Years | 170,180 (95.2%) | 80,265 (44.9%) |
| 75 Years and over | 146,562 (98.3%) | 73,908 (49.5%) |
| Total | 527,143 (38.7%) | 866,088 (63.5%) |
Disability Status by Sex by Age in Area Code 727
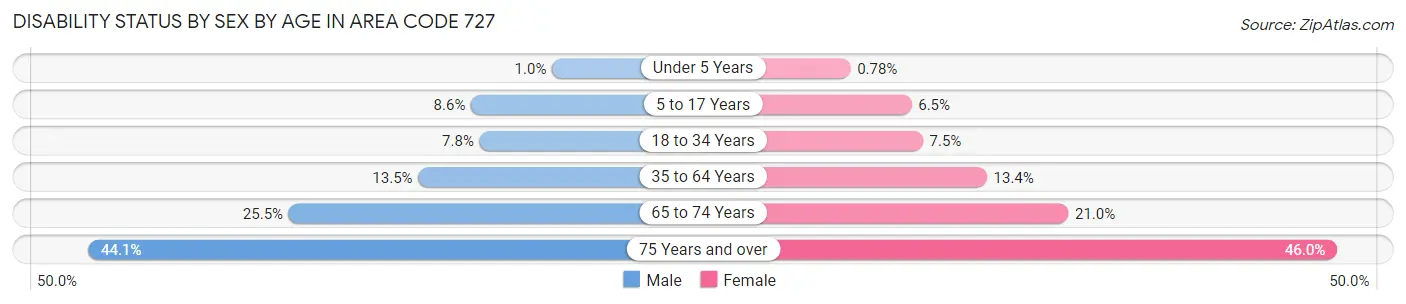
| Age Bracket | Male | Female |
| Under 5 Years | 309 (1.0%) | 233 (0.8%) |
| 5 to 17 Years | 7,424 (8.6%) | 5,326 (6.5%) |
| 18 to 34 Years | 9,856 (7.8%) | 9,709 (7.5%) |
| 35 to 64 Years | 36,155 (13.5%) | 37,810 (13.4%) |
| 65 to 74 Years | 21,117 (25.5%) | 20,125 (21.0%) |
| 75 Years and over | 27,945 (44.1%) | 39,433 (46.0%) |
Disability Class by Sex by Age in Area Code 727
Disability Class: Hearing Difficulty
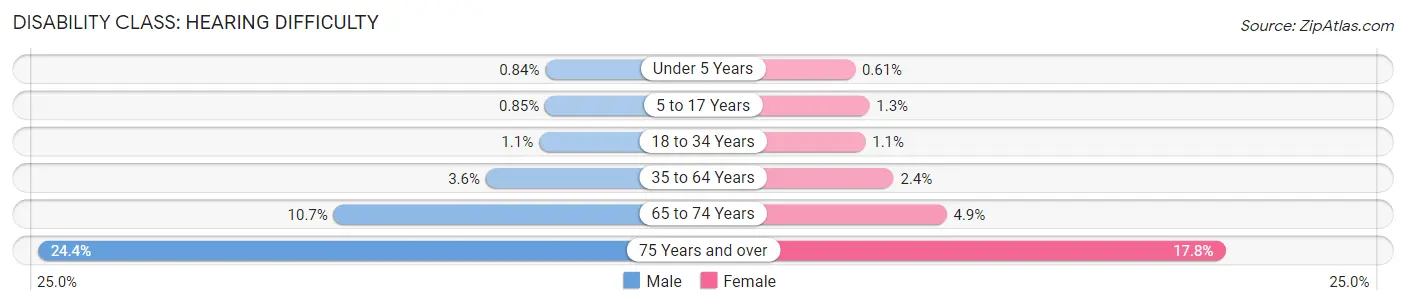
| Age Bracket | Male | Female |
| Under 5 Years | 252 (0.8%) | 181 (0.6%) |
| 5 to 17 Years | 737 (0.9%) | 1,057 (1.3%) |
| 18 to 34 Years | 1,440 (1.1%) | 1,405 (1.1%) |
| 35 to 64 Years | 9,679 (3.6%) | 6,749 (2.4%) |
| 65 to 74 Years | 8,836 (10.7%) | 4,658 (4.9%) |
| 75 Years and over | 15,457 (24.4%) | 15,257 (17.8%) |
Disability Class: Vision Difficulty
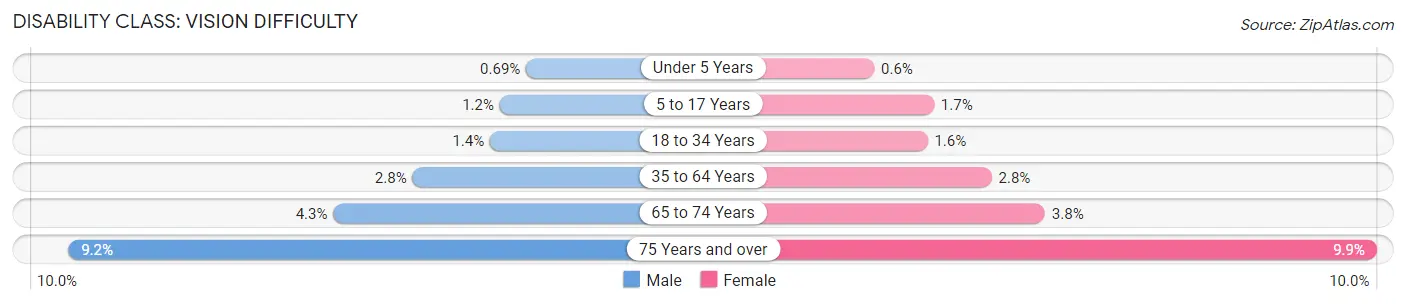
| Age Bracket | Male | Female |
| Under 5 Years | 208 (0.7%) | 178 (0.6%) |
| 5 to 17 Years | 1,027 (1.2%) | 1,411 (1.7%) |
| 18 to 34 Years | 1,733 (1.4%) | 2,053 (1.6%) |
| 35 to 64 Years | 7,511 (2.8%) | 7,828 (2.8%) |
| 65 to 74 Years | 3,537 (4.3%) | 3,613 (3.8%) |
| 75 Years and over | 5,823 (9.2%) | 8,521 (9.9%) |
Disability Class: Cognitive Difficulty
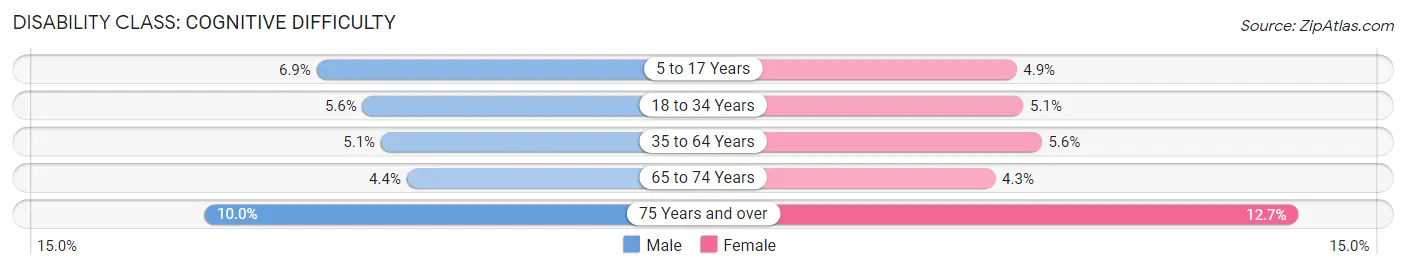
| Age Bracket | Male | Female |
| 5 to 17 Years | 5,968 (6.9%) | 4,018 (4.9%) |
| 18 to 34 Years | 7,103 (5.6%) | 6,530 (5.1%) |
| 35 to 64 Years | 13,645 (5.1%) | 15,637 (5.6%) |
| 65 to 74 Years | 3,616 (4.4%) | 4,097 (4.3%) |
| 75 Years and over | 6,339 (10.0%) | 10,900 (12.7%) |
Disability Class: Ambulatory Difficulty
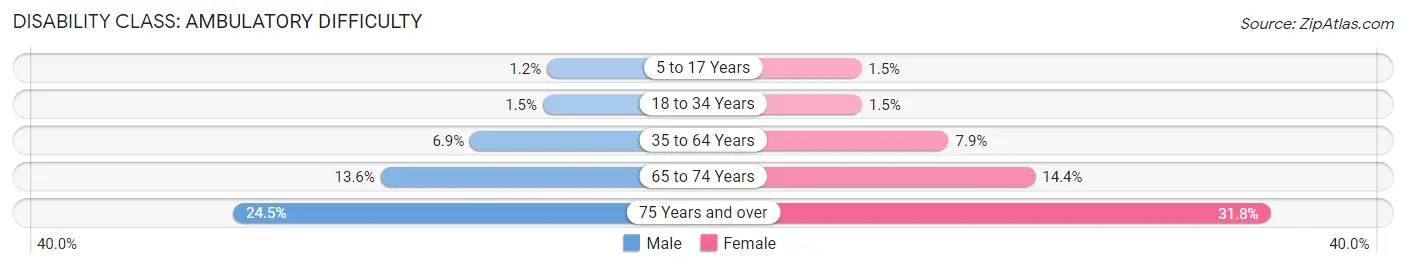
| Age Bracket | Male | Female |
| 5 to 17 Years | 1,047 (1.2%) | 1,202 (1.5%) |
| 18 to 34 Years | 1,930 (1.5%) | 1,947 (1.5%) |
| 35 to 64 Years | 18,634 (6.9%) | 22,297 (7.9%) |
| 65 to 74 Years | 11,248 (13.6%) | 13,775 (14.4%) |
| 75 Years and over | 15,536 (24.5%) | 27,295 (31.8%) |
Disability Class: Self-Care Difficulty
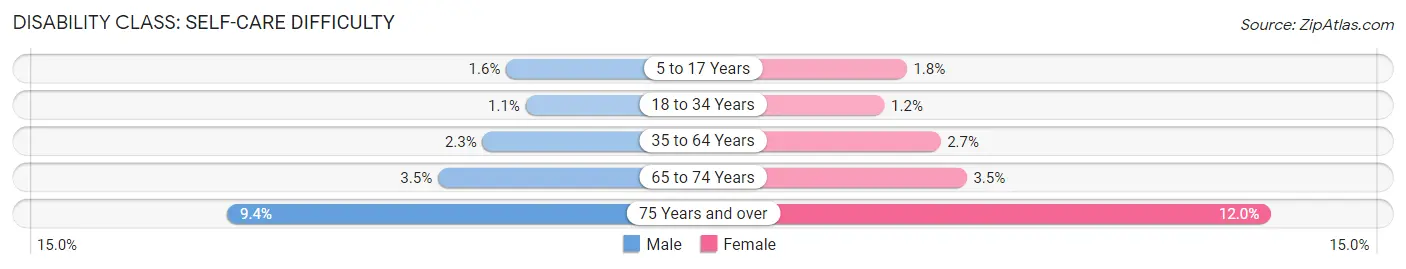
| Age Bracket | Male | Female |
| 5 to 17 Years | 1,382 (1.6%) | 1,485 (1.8%) |
| 18 to 34 Years | 1,329 (1.1%) | 1,527 (1.2%) |
| 35 to 64 Years | 6,033 (2.2%) | 7,702 (2.7%) |
| 65 to 74 Years | 2,895 (3.5%) | 3,329 (3.5%) |
| 75 Years and over | 5,930 (9.4%) | 10,250 (11.9%) |
Technology Access in Area Code 727
Computing Device Access in Area Code 727
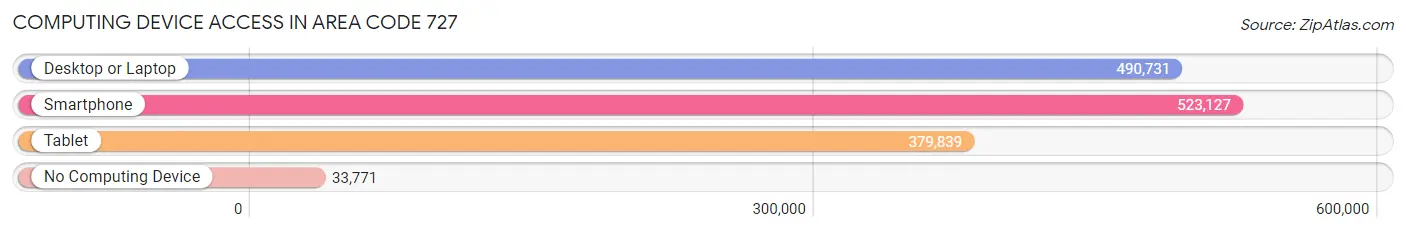
| Device Type | # Households | % Households |
| Desktop or Laptop | 490,731 | 82.0% |
| Smartphone | 523,127 | 87.4% |
| Tablet | 379,839 | 63.5% |
| No Computing Device | 33,771 | 5.6% |
| Total | 598,330 | 100.0% |
Internet Access in Area Code 727
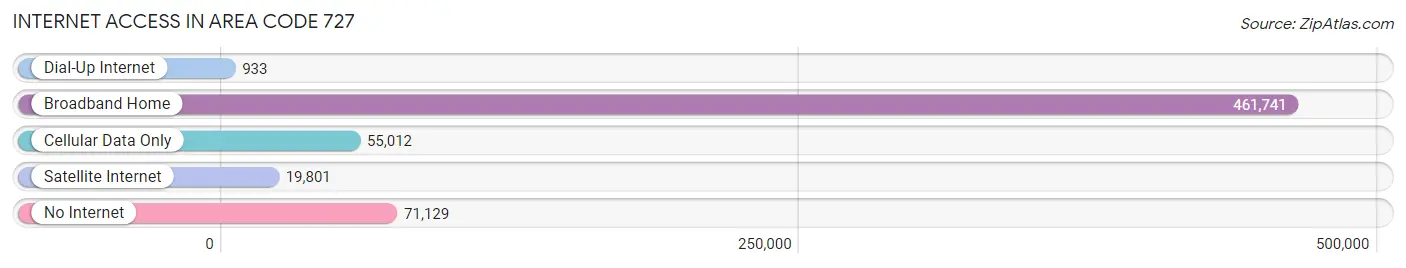
| Internet Type | # Households | % Households |
| Dial-Up Internet | 933 | 0.2% |
| Broadband Home | 461,741 | 77.2% |
| Cellular Data Only | 55,012 | 9.2% |
| Satellite Internet | 19,801 | 3.3% |
| No Internet | 71,129 | 11.9% |
| Total | 598,330 | 100.0% |
Area Code 727 Summary
Geography
Area code 727 is located in the state of Florida and covers the Tampa Bay area, including the cities of Clearwater, St. Petersburg, and Tampa. It also covers parts of Pasco, Pinellas, and Hillsborough counties.
Social
Area code 727 is home to a diverse population of people from all walks of life. The area is known for its vibrant nightlife, with a variety of bars, clubs, and restaurants. It is also home to a number of cultural attractions, including the Salvador Dali Museum, the Florida Aquarium, and the Tampa Bay History Center.
Economics
Area code 727 is a major economic hub in the state of Florida. The area is home to a number of large corporations, including Raymond James Financial, Jabil Circuit, and Tech Data Corporation. It is also home to a number of smaller businesses, including restaurants, retail stores, and service providers.
Demographics
Area code 727 is home to a diverse population of people from all walks of life. According to the 2010 census, the population of the area was 1,945,890, with a median age of 38.7 years. The area is also home to a large Hispanic population, with nearly 20% of the population identifying as Hispanic or Latino.
Common Questions
What is Per Capita Income in Area Code 727?
Per Capita income in Area Code 727 is $46,277.
What is the Median Family Income in Area Code 727?
Median Family Income in Area Code 727 is $94,058.
What is the Median Household income in Area Code 727?
Median Household Income in Area Code 727 is $71,988.
What is Income or Wage Gap in Area Code 727?
Income or Wage Gap in Area Code 727 is 20.7%.
Women in Area Code 727 earn 79.3 cents for every dollar earned by a man.
What is Family Income Deficit in Area Code 727?
Family Income Deficit in Area Code 727 is $10,358.
Families that are below poverty line in Area Code 727 earn $10,358 less on average than the poverty threshold level.
What is Inequality or Gini Index in Area Code 727?
Inequality or Gini Index in Area Code 727 is 29.13.
What is the Total Population of Area Code 727?
Total Population of Area Code 727 is 1,382,951.
What is the Total Male Population of Area Code 727?
Total Male Population of Area Code 727 is 669,824.
What is the Total Female Population of Area Code 727?
Total Female Population of Area Code 727 is 713,127.
What is the Ratio of Males per 100 Females in Area Code 727?
There are 93.93 Males per 100 Females in Area Code 727.
What is the Ratio of Females per 100 Males in Area Code 727?
There are 106.46 Females per 100 Males in Area Code 727.
What is the Median Population Age in Area Code 727?
Median Population Age in Area Code 727 is 48.5 Years.
What is the Average Family Size in Area Code 727
Average Family Size in Area Code 727 is 2.9 People.
What is the Average Household Size in Area Code 727
Average Household Size in Area Code 727 is 2.3 People.
How Large is the Labor Force in Area Code 727?
There are 687,533 People in the Labor Forcein in Area Code 727.
What is the Percentage of People in the Labor Force in Area Code 727?
58.2% of People are in the Labor Force in Area Code 727.
What is the Unemployment Rate in Area Code 727?
Unemployment Rate in Area Code 727 is 4.7%.