Area Code 848 Map & Demographics
Area Code 848 Map
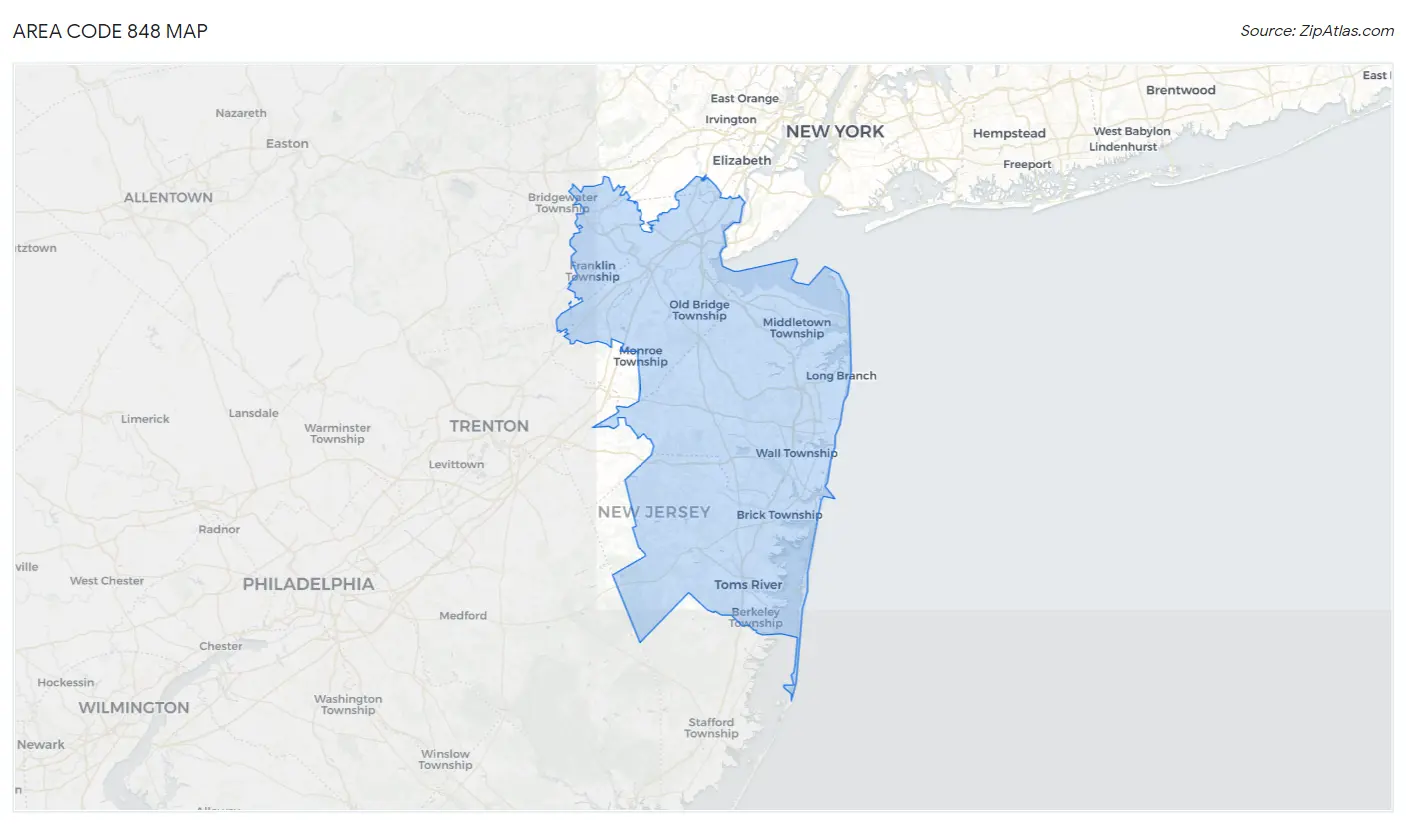
Area Code 848 Overview
$49,842
PER CAPITA INCOME
$120,079
AVG FAMILY INCOME
$98,093
AVG HOUSEHOLD INCOME
33.4%
WAGE / INCOME GAP [ % ]
66.6¢/ $1
WAGE / INCOME GAP [ $ ]
$10,530
FAMILY INCOME DEFICIT
19.72
INEQUALITY / GINI INDEX
1,247,396
TOTAL POPULATION
615,443
MALE POPULATION
631,953
FEMALE POPULATION
97.39
MALES / 100 FEMALES
102.68
FEMALES / 100 MALES
40.8
MEDIAN AGE
3.2
AVG FAMILY SIZE
2.6
AVG HOUSEHOLD SIZE
635,099
LABOR FORCE [ PEOPLE ]
64.5%
PERCENT IN LABOR FORCE
5.9%
UNEMPLOYMENT RATE
Income in Area Code 848
Income Overview in Area Code 848
Per Capita Income in Area Code 848 is $49,842, while median incomes of families and households are $120,079 and $98,093 respectively.
| Characteristic | Number | Measure |
| Per Capita Income | 1,247,396 | $49,842 |
| Median Family Income | 300,262 | $120,079 |
| Mean Family Income | 300,262 | $6,618,390 |
| Median Household Income | 456,120 | $98,093 |
| Mean Household Income | 456,120 | $5,659,649 |
| Income Deficit | 300,262 | $10,530 |
| Wage / Income Gap (%) | 1,247,396 | 33.44% |
| Wage / Income Gap ($) | 1,247,396 | 66.56¢ per $1 |
| Gini / Inequality Index | 1,247,396 | 19.72 |
Earnings by Sex in Area Code 848
Average Earnings in Area Code 848 are $51,773, $64,258 for men and $41,589 for women, a difference of 35.3%.
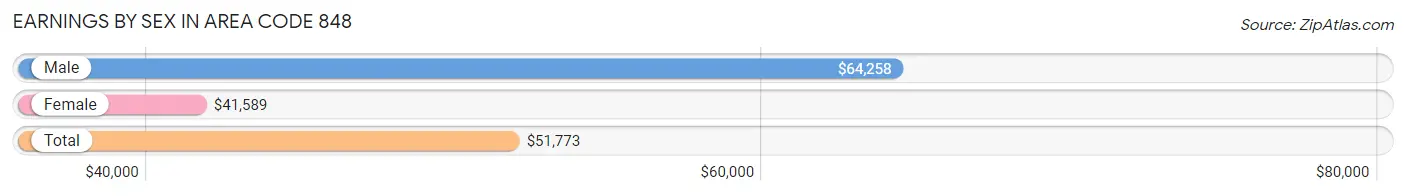
| Sex | Number | Average Earnings |
| Male | 340,551 (52.7%) | $64,258 |
| Female | 305,890 (47.3%) | $41,589 |
| Total | 646,441 (100.0%) | $51,773 |
Earnings by Sex by Income Bracket in Area Code 848
The most common earnings brackets in Area Code 848 are $100,000+ for men (95,042 | 27.9%) and $100,000+ for women (41,412 | 13.5%).
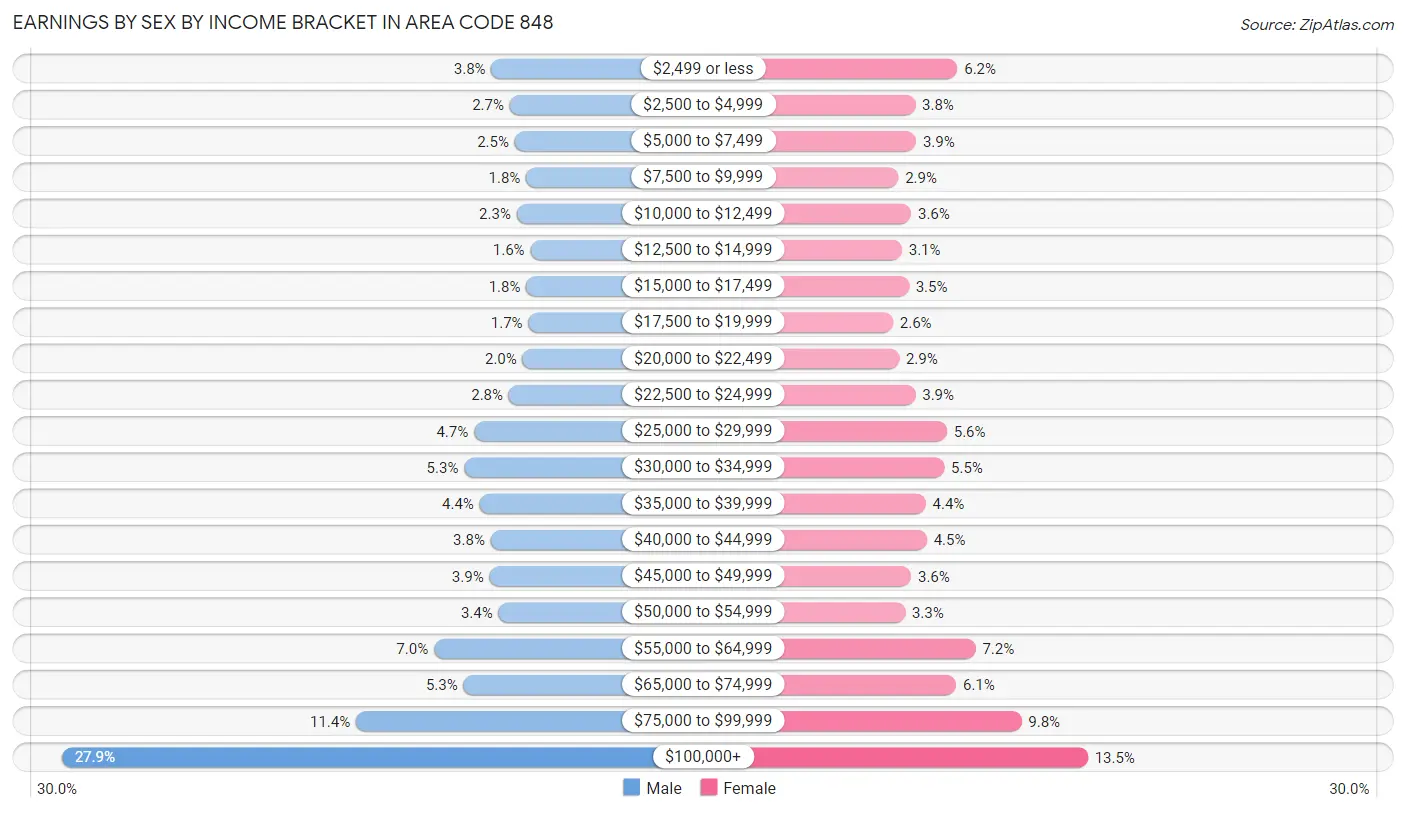
| Income | Male | Female |
| $2,499 or less | 12,820 (3.8%) | 18,997 (6.2%) |
| $2,500 to $4,999 | 9,293 (2.7%) | 11,754 (3.8%) |
| $5,000 to $7,499 | 8,338 (2.5%) | 11,907 (3.9%) |
| $7,500 to $9,999 | 6,176 (1.8%) | 8,847 (2.9%) |
| $10,000 to $12,499 | 7,974 (2.3%) | 11,033 (3.6%) |
| $12,500 to $14,999 | 5,347 (1.6%) | 9,457 (3.1%) |
| $15,000 to $17,499 | 6,120 (1.8%) | 10,636 (3.5%) |
| $17,500 to $19,999 | 5,720 (1.7%) | 7,934 (2.6%) |
| $20,000 to $22,499 | 6,850 (2.0%) | 8,964 (2.9%) |
| $22,500 to $24,999 | 9,451 (2.8%) | 11,773 (3.8%) |
| $25,000 to $29,999 | 16,132 (4.7%) | 17,205 (5.6%) |
| $30,000 to $34,999 | 18,006 (5.3%) | 16,726 (5.5%) |
| $35,000 to $39,999 | 15,049 (4.4%) | 13,542 (4.4%) |
| $40,000 to $44,999 | 12,952 (3.8%) | 13,733 (4.5%) |
| $45,000 to $49,999 | 13,171 (3.9%) | 11,054 (3.6%) |
| $50,000 to $54,999 | 11,432 (3.4%) | 10,006 (3.3%) |
| $55,000 to $64,999 | 23,789 (7.0%) | 22,115 (7.2%) |
| $65,000 to $74,999 | 18,159 (5.3%) | 18,792 (6.1%) |
| $75,000 to $99,999 | 38,730 (11.4%) | 30,003 (9.8%) |
| $100,000+ | 95,042 (27.9%) | 41,412 (13.5%) |
| Total | 340,551 (100.0%) | 305,890 (100.0%) |
Earnings by Sex by Educational Attainment in Area Code 848
Average earnings in Area Code 848 are $3,223,693 for men and $2,135,007 for women, a difference of 33.8%. Men with an educational attainment of graduate degree enjoy the highest average annual earnings of $4,626,991, while those with less than high school education earn the least with $1,338,392. Women with an educational attainment of graduate degree earn the most with the average annual earnings of $3,274,315, while those with less than high school education have the smallest earnings of $901,849.
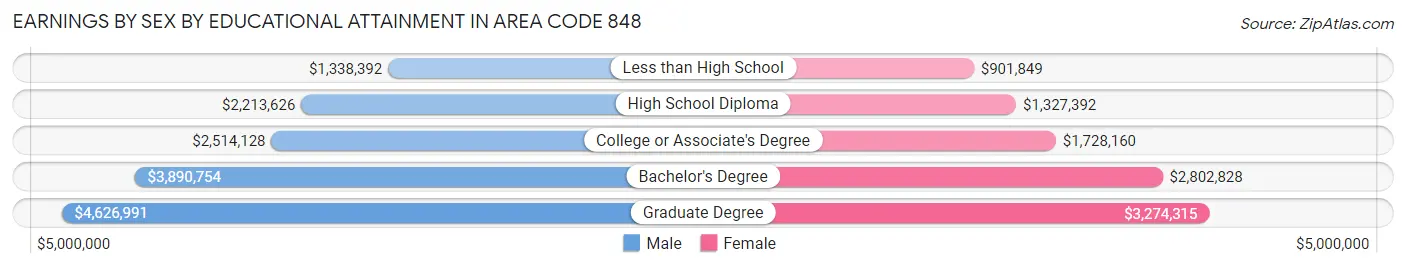
| Educational Attainment | Male Income | Female Income |
| Less than High School | $1,338,392 | $901,849 |
| High School Diploma | $2,213,626 | $1,327,392 |
| College or Associate's Degree | $2,514,128 | $1,728,160 |
| Bachelor's Degree | $3,890,754 | $2,802,828 |
| Graduate Degree | $4,626,991 | $3,274,315 |
| Total | $3,223,693 | $2,135,007 |
Family Income in Area Code 848
Family Income Brackets in Area Code 848
According to the Area Code 848 family income data, there are 3,093,299 families falling into the $200,000+ income range, which is the most common income bracket and makes up 1,030.2% of all families. Conversely, the $10,000 to $14,999 income bracket is the least frequent group with only 235,706 families (78.5%) belonging to this category.
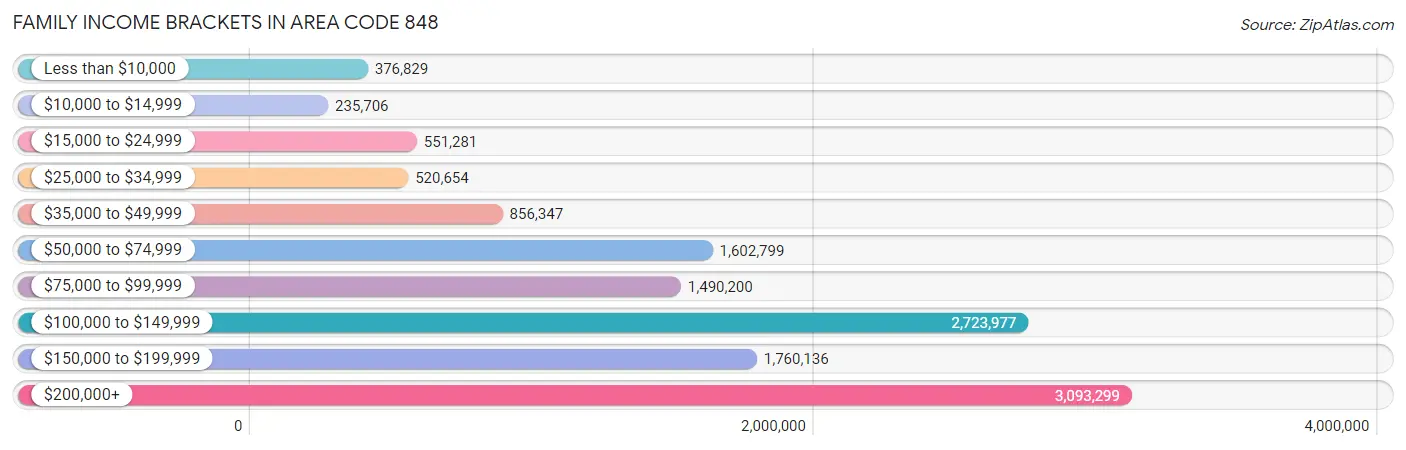
| Income Bracket | # Families | % Families |
| Less than $10,000 | 376,829 | 125.5% |
| $10,000 to $14,999 | 235,706 | 78.5% |
| $15,000 to $24,999 | 551,281 | 183.6% |
| $25,000 to $34,999 | 520,654 | 173.4% |
| $35,000 to $49,999 | 856,347 | 285.2% |
| $50,000 to $74,999 | 1,602,799 | 533.8% |
| $75,000 to $99,999 | 1,490,200 | 496.3% |
| $100,000 to $149,999 | 2,723,977 | 907.2% |
| $150,000 to $199,999 | 1,760,136 | 586.2% |
| $200,000+ | 3,093,299 | 1,030.2% |
Family Income by Famaliy Size in Area Code 848
6-person families (8,856 | 2.9%) account for the highest median family income in Area Code 848 with $171,908 per family, while 2-person families (123,741 | 41.2%) have the highest median income of $50,577 per family member.
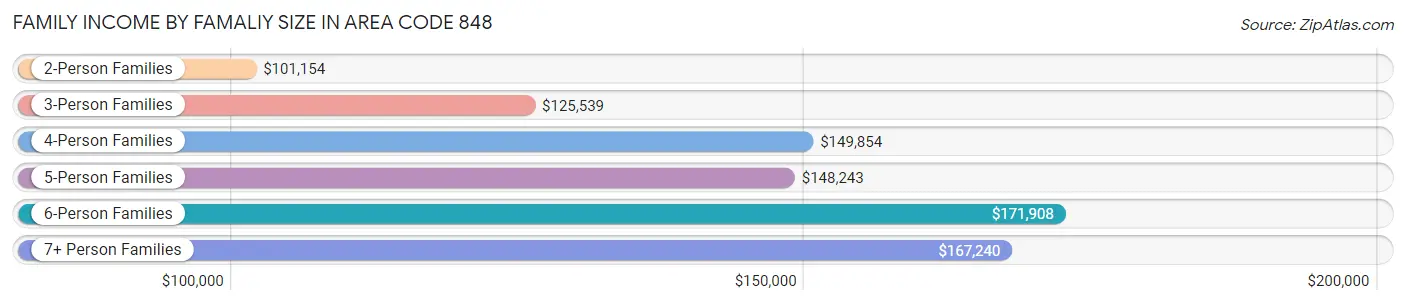
| Income Bracket | # Families | Median Income |
| 2-Person Families | 123,741 (41.2%) | $101,154 |
| 3-Person Families | 70,062 (23.3%) | $125,539 |
| 4-Person Families | 60,651 (20.2%) | $149,854 |
| 5-Person Families | 25,690 (8.6%) | $148,243 |
| 6-Person Families | 8,856 (2.9%) | $171,908 |
| 7+ Person Families | 11,262 (3.7%) | $167,240 |
| Total | 300,262 (100.0%) | $120,079 |
Family Income by Number of Earners in Area Code 848
The median family income in Area Code 848 is $120,079, with families comprising 3+ earners (45,524) having the highest median family income of $179,168, while families with no earners (38,336) have the lowest median family income of $61,353, accounting for 15.2% and 12.8% of families, respectively.
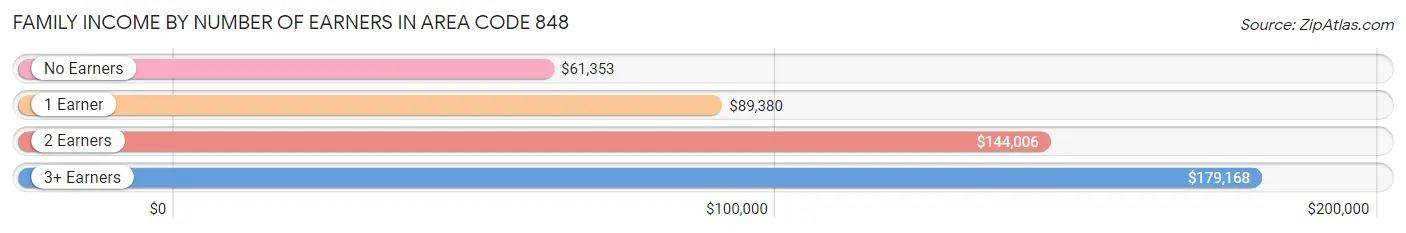
| Number of Earners | # Families | Median Income |
| No Earners | 38,336 (12.8%) | $61,353 |
| 1 Earner | 92,200 (30.7%) | $89,380 |
| 2 Earners | 124,202 (41.4%) | $144,006 |
| 3+ Earners | 45,524 (15.2%) | $179,168 |
| Total | 300,262 (100.0%) | $120,079 |
Household Income in Area Code 848
Household Income Brackets in Area Code 848
With 3,647,592 households falling in the category, the $200,000+ income range is the most frequent in Area Code 848, accounting for 799.7% of all households. In contrast, only 624,428 households (136.9%) fall into the $10,000 to $14,999 income bracket, making it the least populous group.
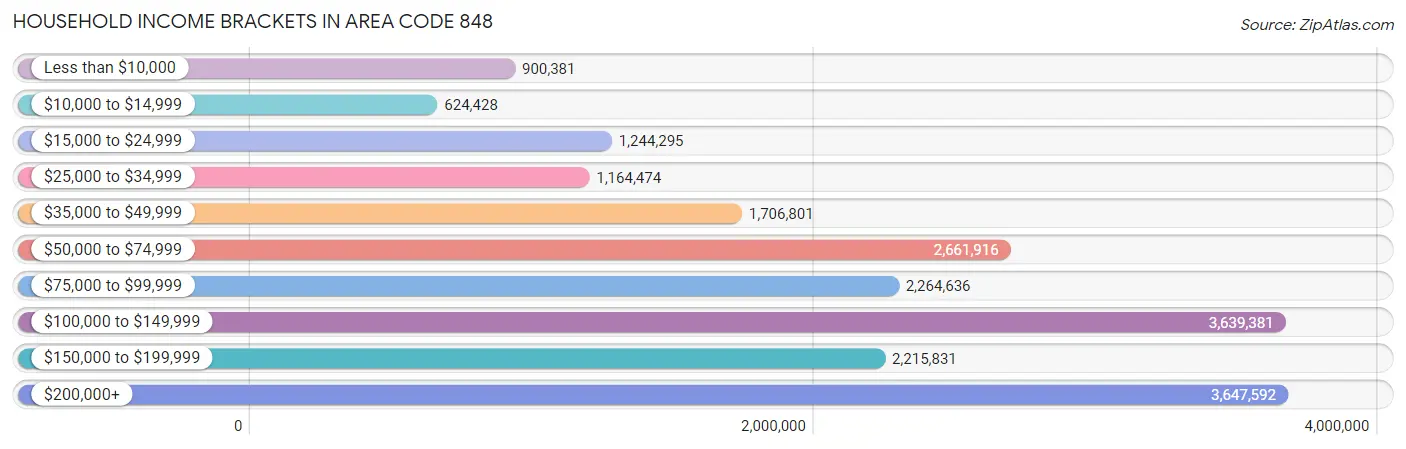
| Income Bracket | # Households | % Households |
| Less than $10,000 | 900,381 | 197.4% |
| $10,000 to $14,999 | 624,428 | 136.9% |
| $15,000 to $24,999 | 1,244,295 | 272.8% |
| $25,000 to $34,999 | 1,164,474 | 255.3% |
| $35,000 to $49,999 | 1,706,801 | 374.2% |
| $50,000 to $74,999 | 2,661,916 | 583.6% |
| $75,000 to $99,999 | 2,264,636 | 496.5% |
| $100,000 to $149,999 | 3,639,381 | 797.9% |
| $150,000 to $199,999 | 2,215,831 | 485.8% |
| $200,000+ | 3,647,592 | 799.7% |
Household Income by Householder Age in Area Code 848
The median household income in Area Code 848 is $98,093, with the highest median household income of $120,499 found in the 45 to 64 years age bracket for the primary householder. A total of 174,313 households (38.2%) fall into this category. Meanwhile, the 65+ years age bracket for the primary householder has the lowest median household income of $66,630, with 132,477 households (29.0%) in this group.
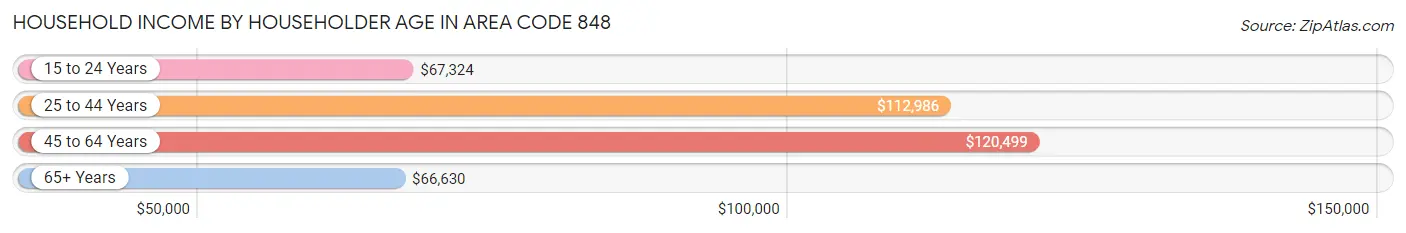
| Income Bracket | # Households | Median Income |
| 15 to 24 Years | 9,438 (2.1%) | $67,324 |
| 25 to 44 Years | 139,892 (30.7%) | $112,986 |
| 45 to 64 Years | 174,313 (38.2%) | $120,499 |
| 65+ Years | 132,477 (29.0%) | $66,630 |
| Total | 456,120 (100.0%) | $98,093 |
Poverty in Area Code 848
Income Below Poverty by Sex and Age in Area Code 848
With 10.9% poverty level for males and 13.1% for females among the residents of Area Code 848, under 5 year old males and under 5 year old females are the most vulnerable to poverty, with 8,093 males (19.6%) and 7,295 females (18.7%) in their respective age groups living below the poverty level.
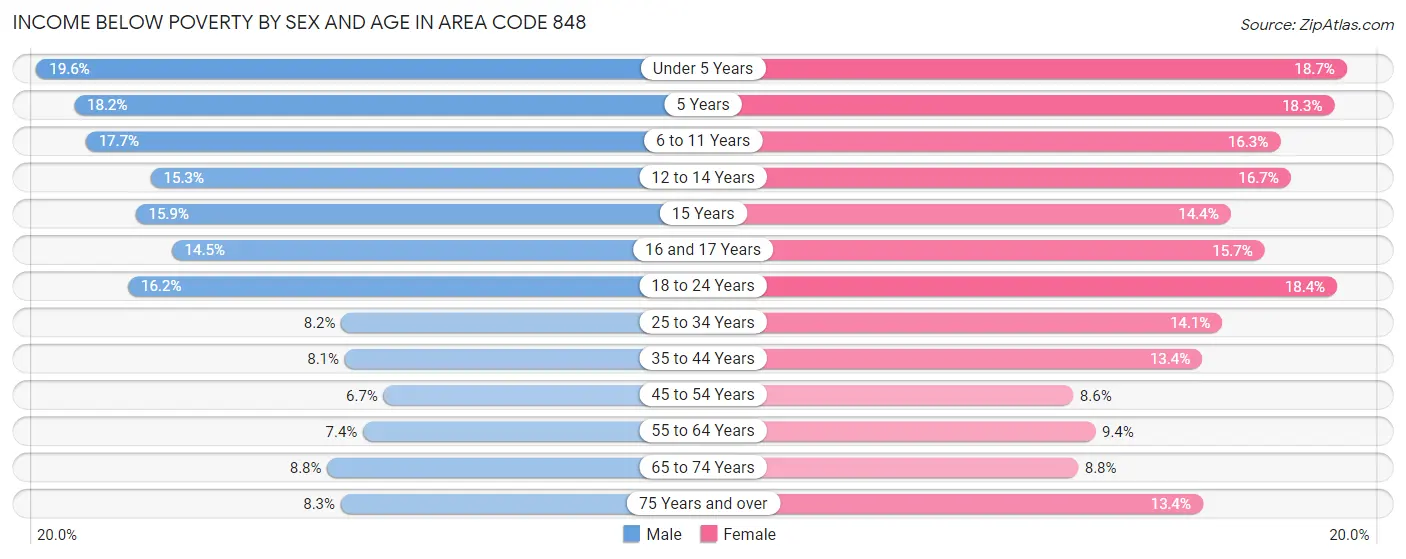
| Age Bracket | Male | Female |
| Under 5 Years | 8,093 (19.6%) | 7,295 (18.7%) |
| 5 Years | 1,516 (18.2%) | 1,419 (18.3%) |
| 6 to 11 Years | 9,024 (17.7%) | 8,035 (16.3%) |
| 12 to 14 Years | 3,745 (15.3%) | 4,009 (16.7%) |
| 15 Years | 1,314 (15.9%) | 1,028 (14.4%) |
| 16 and 17 Years | 2,327 (14.5%) | 2,609 (15.7%) |
| 18 to 24 Years | 8,230 (16.2%) | 8,859 (18.4%) |
| 25 to 34 Years | 6,638 (8.2%) | 11,069 (14.1%) |
| 35 to 44 Years | 6,364 (8.1%) | 10,054 (13.4%) |
| 45 to 54 Years | 5,041 (6.7%) | 6,486 (8.6%) |
| 55 to 64 Years | 5,629 (7.4%) | 7,527 (9.4%) |
| 65 to 74 Years | 4,556 (8.8%) | 5,528 (8.8%) |
| 75 Years and over | 2,836 (8.3%) | 7,326 (13.4%) |
| Total | 65,313 (10.9%) | 81,244 (13.1%) |
Income Above Poverty by Sex and Age in Area Code 848
According to the poverty statistics in Area Code 848, males aged 45 to 54 years and females aged 45 to 54 years are the age groups that are most secure financially, with 93.3% of males and 91.4% of females in these age groups living above the poverty line.
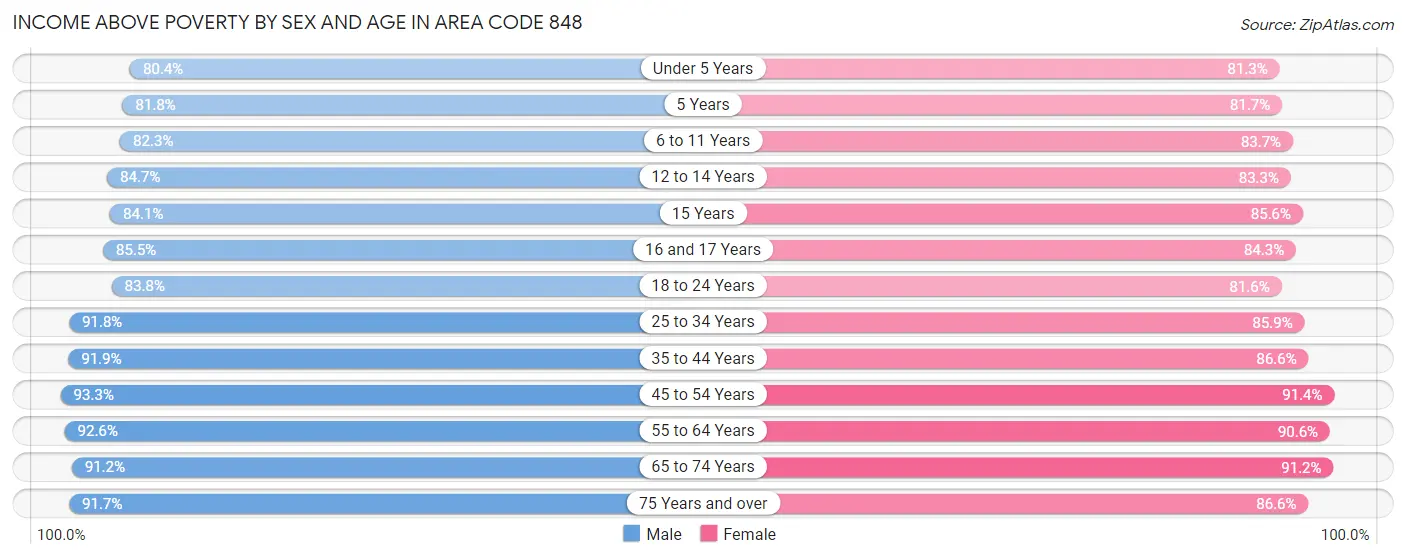
| Age Bracket | Male | Female |
| Under 5 Years | 33,285 (80.4%) | 31,630 (81.3%) |
| 5 Years | 6,833 (81.8%) | 6,344 (81.7%) |
| 6 to 11 Years | 41,869 (82.3%) | 41,360 (83.7%) |
| 12 to 14 Years | 20,693 (84.7%) | 20,052 (83.3%) |
| 15 Years | 6,961 (84.1%) | 6,097 (85.6%) |
| 16 and 17 Years | 13,673 (85.5%) | 14,018 (84.3%) |
| 18 to 24 Years | 42,704 (83.8%) | 39,328 (81.6%) |
| 25 to 34 Years | 73,888 (91.8%) | 67,337 (85.9%) |
| 35 to 44 Years | 72,087 (91.9%) | 65,144 (86.6%) |
| 45 to 54 Years | 70,579 (93.3%) | 69,114 (91.4%) |
| 55 to 64 Years | 70,142 (92.6%) | 72,574 (90.6%) |
| 65 to 74 Years | 47,427 (91.2%) | 57,560 (91.2%) |
| 75 Years and over | 31,510 (91.7%) | 47,360 (86.6%) |
| Total | 531,651 (89.1%) | 537,918 (86.9%) |
Income Below Poverty Among Married-Couple Families in Area Code 848
The poverty statistics for married-couple families in Area Code 848 show that 5.1% or 11,375 of the total 224,034 families live below the poverty line. Families with 5 or more children have the highest poverty rate of 29.5%, comprising of 2,015 families. On the other hand, families with no children have the lowest poverty rate of 3.4%, which includes 4,184 families.
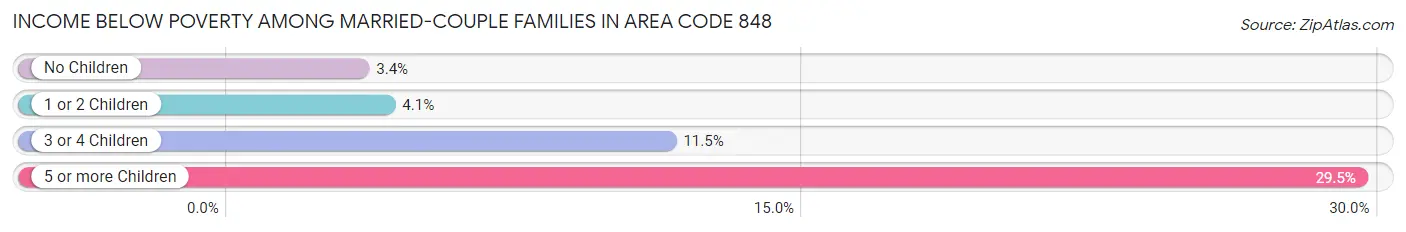
| Children | Above Poverty | Below Poverty |
| No Children | 117,924 (96.6%) | 4,184 (3.4%) |
| 1 or 2 Children | 74,599 (95.9%) | 3,195 (4.1%) |
| 3 or 4 Children | 15,321 (88.5%) | 1,981 (11.5%) |
| 5 or more Children | 4,815 (70.5%) | 2,015 (29.5%) |
| Total | 212,659 (94.9%) | 11,375 (5.1%) |
Income Below Poverty Among Single-Parent Households in Area Code 848
According to the poverty data in Area Code 848, 10.2% or 2,153 single-father households and 22.2% or 12,219 single-mother households are living below the poverty line. Among single-father households, those with 5 or more children have the highest poverty rate, with 124 households (77.0%) experiencing poverty. Likewise, among single-mother households, those with 5 or more children have the highest poverty rate, with 256 households (75.5%) falling below the poverty line.
| Children | Single Father | Single Mother |
| No Children | 764 (6.9%) | 2,399 (9.5%) |
| 1 or 2 Children | 754 (8.8%) | 7,508 (29.5%) |
| 3 or 4 Children | 511 (36.4%) | 2,056 (51.1%) |
| 5 or more Children | 124 (77.0%) | 256 (75.5%) |
| Total | 2,153 (10.2%) | 12,219 (22.2%) |
Income Below Poverty Among Married-Couple vs Single-Parent Households in Area Code 848
The poverty data for Area Code 848 shows that 11,375 of the married-couple family households (5.1%) and 14,372 of the single-parent households (18.9%) are living below the poverty level. Within the married-couple family households, those with 5 or more children have the highest poverty rate, with 2,015 households (29.5%) falling below the poverty line. Among the single-parent households, those with 5 or more children have the highest poverty rate, with 380 household (76.0%) living below poverty.
| Children | Married-Couple Families | Single-Parent Households |
| No Children | 4,184 (3.4%) | 3,163 (8.7%) |
| 1 or 2 Children | 3,195 (4.1%) | 8,262 (24.3%) |
| 3 or 4 Children | 1,981 (11.5%) | 2,567 (47.3%) |
| 5 or more Children | 2,015 (29.5%) | 380 (76.0%) |
| Total | 11,375 (5.1%) | 14,372 (18.9%) |
Race in Area Code 848
The most populous races in Area Code 848 are White / Caucasian (801,372 | 64.2%), Hispanic or Latino (254,526 | 20.4%), and Black / African American (129,185 | 10.4%).
| Race | # Population | % Population |
| Asian | 112,925 | 9.0% |
| Black / African American | 129,185 | 10.4% |
| Hawaiian / Pacific | 124 | 0.0% |
| Hispanic or Latino | 254,526 | 20.4% |
| Native / Alaskan | 8,438 | 0.7% |
| White / Caucasian | 801,372 | 64.2% |
| Two or more Races | 88,742 | 7.1% |
| Some other Race | 106,610 | 8.6% |
| Total | 1,247,396 | 100.0% |
Ancestry in Area Code 848
The most populous ancestries reported in Area Code 848 are Italian (177,709 | 14.2%), Irish (144,591 | 11.6%), German (96,381 | 7.7%), Polish (67,339 | 5.4%), and Thai (64,474 | 5.2%), together accounting for 44.1% of all Area Code 848 residents.
| Ancestry | # Population | % Population |
| Afghan | 199 | 0.0% |
| African | 4,851 | 0.4% |
| Alaska Native | 35 | 0.0% |
| Albanian | 1,615 | 0.1% |
| Aleut | 4 | 0.0% |
| Alsatian | 32 | 0.0% |
| American | 62,410 | 5.0% |
| Apache | 189 | 0.0% |
| Arab | 14,329 | 1.1% |
| Argentinean | 2,515 | 0.2% |
| Armenian | 1,005 | 0.1% |
| Assyrian / Chaldean / Syriac | 183 | 0.0% |
| Australian | 150 | 0.0% |
| Austrian | 4,169 | 0.3% |
| Bahamian | 100 | 0.0% |
| Barbadian | 490 | 0.0% |
| Basque | 48 | 0.0% |
| Belgian | 581 | 0.1% |
| Belizean | 104 | 0.0% |
| Bhutanese | 1,828 | 0.2% |
| Blackfeet | 138 | 0.0% |
| Bolivian | 262 | 0.0% |
| Brazilian | 17,655 | 1.4% |
| British | 3,431 | 0.3% |
| British West Indian | 1,021 | 0.1% |
| Bulgarian | 339 | 0.0% |
| Burmese | 6,767 | 0.5% |
| Cambodian | 151 | 0.0% |
| Canadian | 1,779 | 0.1% |
| Cape Verdean | 118 | 0.0% |
| Carpatho Rusyn | 93 | 0.0% |
| Celtic | 75 | 0.0% |
| Central American | 29,308 | 2.4% |
| Central American Indian | 3,342 | 0.3% |
| Cherokee | 1,089 | 0.1% |
| Cheyenne | 8 | 0.0% |
| Chickasaw | 4 | 0.0% |
| Chilean | 1,012 | 0.1% |
| Chippewa | 55 | 0.0% |
| Choctaw | 136 | 0.0% |
| Colombian | 9,551 | 0.8% |
| Comanche | 9 | 0.0% |
| Costa Rican | 4,079 | 0.3% |
| Cree | 92 | 0.0% |
| Creek | 28 | 0.0% |
| Croatian | 1,094 | 0.1% |
| Cuban | 8,128 | 0.6% |
| Cypriot | 118 | 0.0% |
| Czech | 3,371 | 0.3% |
| Czechoslovakian | 1,412 | 0.1% |
| Danish | 2,582 | 0.2% |
| Delaware | 342 | 0.0% |
| Dominican | 50,568 | 4.1% |
| Dutch | 7,044 | 0.6% |
| Dutch West Indian | 85 | 0.0% |
| Eastern European | 8,700 | 0.7% |
| Ecuadorian | 21,441 | 1.7% |
| Egyptian | 6,306 | 0.5% |
| English | 47,539 | 3.8% |
| Estonian | 229 | 0.0% |
| Ethiopian | 192 | 0.0% |
| European | 14,960 | 1.2% |
| Filipino | 1,454 | 0.1% |
| Finnish | 608 | 0.1% |
| French | 10,599 | 0.9% |
| French American Indian | 36 | 0.0% |
| French Canadian | 2,435 | 0.2% |
| German | 96,381 | 7.7% |
| German Russian | 11 | 0.0% |
| Ghanaian | 2,104 | 0.2% |
| Greek | 7,454 | 0.6% |
| Guamanian / Chamorro | 21 | 0.0% |
| Guatemalan | 5,998 | 0.5% |
| Guyanese | 2,136 | 0.2% |
| Haitian | 5,268 | 0.4% |
| Hmong | 5 | 0.0% |
| Honduran | 6,726 | 0.5% |
| Hopi | 17 | 0.0% |
| Hungarian | 17,937 | 1.4% |
| Icelander | 40 | 0.0% |
| Indian (Asian) | 19,994 | 1.6% |
| Indonesian | 130 | 0.0% |
| Inupiat | 2 | 0.0% |
| Iranian | 867 | 0.1% |
| Iraqi | 257 | 0.0% |
| Irish | 144,591 | 11.6% |
| Iroquois | 91 | 0.0% |
| Israeli | 2,028 | 0.2% |
| Italian | 177,709 | 14.2% |
| Jamaican | 6,476 | 0.5% |
| Japanese | 139 | 0.0% |
| Jordanian | 408 | 0.0% |
| Kenyan | 356 | 0.0% |
| Korean | 15,622 | 1.3% |
| Laotian | 406 | 0.0% |
| Latvian | 1,111 | 0.1% |
| Lebanese | 1,820 | 0.2% |
| Liberian | 94 | 0.0% |
| Lithuanian | 5,010 | 0.4% |
| Lumbee | 58 | 0.0% |
| Macedonian | 665 | 0.1% |
| Malaysian | 107 | 0.0% |
| Maltese | 237 | 0.0% |
| Mexican | 48,428 | 3.9% |
| Mexican American Indian | 3,376 | 0.3% |
| Mongolian | 89 | 0.0% |
| Moroccan | 852 | 0.1% |
| Native Hawaiian | 251 | 0.0% |
| Navajo | 52 | 0.0% |
| New Zealander | 39 | 0.0% |
| Nicaraguan | 1,417 | 0.1% |
| Nigerian | 5,046 | 0.4% |
| Northern European | 418 | 0.0% |
| Norwegian | 4,787 | 0.4% |
| Okinawan | 52 | 0.0% |
| Pakistani | 419 | 0.0% |
| Palestinian | 475 | 0.0% |
| Panamanian | 1,224 | 0.1% |
| Paraguayan | 422 | 0.0% |
| Pennsylvania German | 153 | 0.0% |
| Peruvian | 9,420 | 0.8% |
| Polish | 67,339 | 5.4% |
| Portuguese | 15,241 | 1.2% |
| Pueblo | 18 | 0.0% |
| Puerto Rican | 55,579 | 4.5% |
| Romanian | 3,270 | 0.3% |
| Russian | 21,760 | 1.7% |
| Salvadoran | 9,812 | 0.8% |
| Samoan | 46 | 0.0% |
| Scandinavian | 937 | 0.1% |
| Scotch-Irish | 3,307 | 0.3% |
| Scottish | 9,967 | 0.8% |
| Seminole | 22 | 0.0% |
| Senegalese | 34 | 0.0% |
| Serbian | 134 | 0.0% |
| Shoshone | 6 | 0.0% |
| Sierra Leonean | 236 | 0.0% |
| Sioux | 62 | 0.0% |
| Slavic | 1,096 | 0.1% |
| Slovak | 4,374 | 0.4% |
| Slovene | 276 | 0.0% |
| South African | 276 | 0.0% |
| South American | 47,200 | 3.8% |
| South American Indian | 758 | 0.1% |
| Soviet Union | 12 | 0.0% |
| Spaniard | 5,272 | 0.4% |
| Spanish | 1,942 | 0.2% |
| Spanish American | 27 | 0.0% |
| Spanish American Indian | 12 | 0.0% |
| Sri Lankan | 2,742 | 0.2% |
| Subsaharan African | 14,579 | 1.2% |
| Sudanese | 75 | 0.0% |
| Swedish | 5,134 | 0.4% |
| Swiss | 1,064 | 0.1% |
| Syrian | 2,161 | 0.2% |
| Thai | 64,474 | 5.2% |
| Tlingit-Haida | 12 | 0.0% |
| Tongan | 7 | 0.0% |
| Trinidadian and Tobagonian | 1,346 | 0.1% |
| Turkish | 2,296 | 0.2% |
| U.S. Virgin Islander | 289 | 0.0% |
| Ugandan | 117 | 0.0% |
| Ukrainian | 9,082 | 0.7% |
| Uruguayan | 698 | 0.1% |
| Venezuelan | 1,718 | 0.1% |
| Vietnamese | 689 | 0.1% |
| Welsh | 2,579 | 0.2% |
| West Indian | 1,867 | 0.2% |
| Yugoslavian | 346 | 0.0% |
| Zimbabwean | 15 | 0.0% | View All 170 Rows |
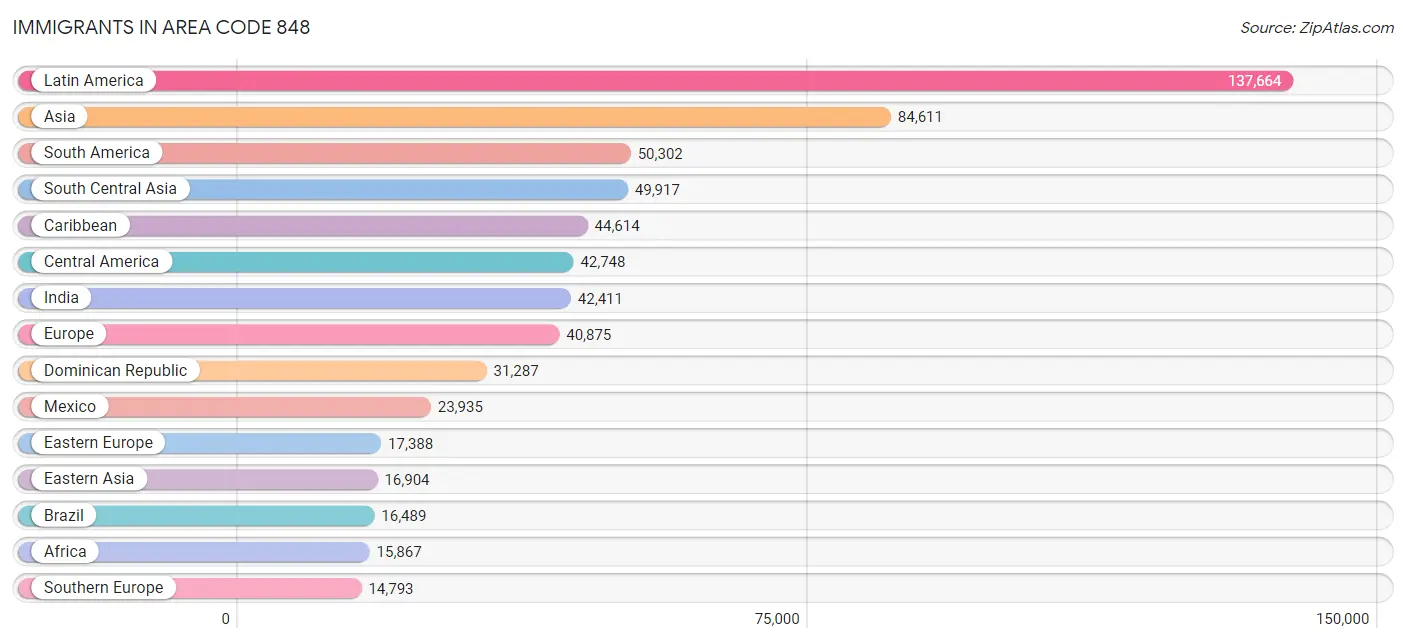
Immigrants in Area Code 848
The most numerous immigrant groups reported in Area Code 848 came from Latin America (137,664 | 11.0%), Asia (84,611 | 6.8%), South America (50,302 | 4.0%), South Central Asia (49,917 | 4.0%), and Caribbean (44,614 | 3.6%), together accounting for 29.4% of all Area Code 848 residents.
| Immigration Origin | # Population | % Population |
| Afghanistan | 93 | 0.0% |
| Africa | 15,867 | 1.3% |
| Albania | 253 | 0.0% |
| Argentina | 1,360 | 0.1% |
| Armenia | 85 | 0.0% |
| Asia | 84,611 | 6.8% |
| Australia | 283 | 0.0% |
| Austria | 367 | 0.0% |
| Azores | 72 | 0.0% |
| Bahamas | 83 | 0.0% |
| Bangladesh | 1,023 | 0.1% |
| Barbados | 374 | 0.0% |
| Belarus | 935 | 0.1% |
| Belgium | 125 | 0.0% |
| Belize | 153 | 0.0% |
| Bolivia | 59 | 0.0% |
| Bosnia and Herzegovina | 61 | 0.0% |
| Brazil | 16,489 | 1.3% |
| Bulgaria | 495 | 0.0% |
| Cabo Verde | 35 | 0.0% |
| Cambodia | 58 | 0.0% |
| Cameroon | 120 | 0.0% |
| Canada | 2,835 | 0.2% |
| Caribbean | 44,614 | 3.6% |
| Central America | 42,748 | 3.4% |
| Chile | 384 | 0.0% |
| China | 12,214 | 1.0% |
| Colombia | 5,841 | 0.5% |
| Congo | 77 | 0.0% |
| Costa Rica | 2,317 | 0.2% |
| Croatia | 168 | 0.0% |
| Cuba | 2,946 | 0.2% |
| Czechoslovakia | 642 | 0.1% |
| Denmark | 160 | 0.0% |
| Dominica | 243 | 0.0% |
| Dominican Republic | 31,287 | 2.5% |
| Eastern Africa | 1,277 | 0.1% |
| Eastern Asia | 16,904 | 1.4% |
| Eastern Europe | 17,388 | 1.4% |
| Ecuador | 14,212 | 1.1% |
| Egypt | 3,698 | 0.3% |
| El Salvador | 5,748 | 0.5% |
| England | 1,198 | 0.1% |
| Eritrea | 6 | 0.0% |
| Ethiopia | 66 | 0.0% |
| Europe | 40,875 | 3.3% |
| Fiji | 74 | 0.0% |
| France | 668 | 0.1% |
| Germany | 2,236 | 0.2% |
| Ghana | 2,417 | 0.2% |
| Greece | 1,124 | 0.1% |
| Grenada | 296 | 0.0% |
| Guatemala | 4,614 | 0.4% |
| Guyana | 2,299 | 0.2% |
| Haiti | 3,315 | 0.3% |
| Honduras | 4,572 | 0.4% |
| Hong Kong | 1,452 | 0.1% |
| Hungary | 733 | 0.1% |
| India | 42,411 | 3.4% |
| Indonesia | 405 | 0.0% |
| Iran | 728 | 0.1% |
| Iraq | 313 | 0.0% |
| Ireland | 917 | 0.1% |
| Israel | 2,235 | 0.2% |
| Italy | 4,238 | 0.3% |
| Jamaica | 3,594 | 0.3% |
| Japan | 627 | 0.1% |
| Jordan | 364 | 0.0% |
| Kazakhstan | 176 | 0.0% |
| Kenya | 597 | 0.1% |
| Korea | 4,063 | 0.3% |
| Kuwait | 178 | 0.0% |
| Laos | 70 | 0.0% |
| Latin America | 137,664 | 11.0% |
| Latvia | 822 | 0.1% |
| Lebanon | 393 | 0.0% |
| Liberia | 266 | 0.0% |
| Lithuania | 353 | 0.0% |
| Malaysia | 161 | 0.0% |
| Mexico | 23,935 | 1.9% |
| Middle Africa | 592 | 0.1% |
| Moldova | 503 | 0.0% |
| Morocco | 339 | 0.0% |
| Nepal | 366 | 0.0% |
| Netherlands | 231 | 0.0% |
| Nicaragua | 847 | 0.1% |
| Nigeria | 4,238 | 0.3% |
| North Macedonia | 466 | 0.0% |
| Northern Africa | 4,333 | 0.4% |
| Northern Europe | 4,791 | 0.4% |
| Norway | 156 | 0.0% |
| Oceania | 406 | 0.0% |
| Pakistan | 3,743 | 0.3% |
| Panama | 562 | 0.1% |
| Peru | 6,783 | 0.5% |
| Philippines | 8,616 | 0.7% |
| Poland | 5,000 | 0.4% |
| Portugal | 7,349 | 0.6% |
| Romania | 712 | 0.1% |
| Russia | 2,506 | 0.2% |
| Saudi Arabia | 205 | 0.0% |
| Scotland | 450 | 0.0% |
| Senegal | 19 | 0.0% |
| Serbia | 53 | 0.0% |
| Sierra Leone | 449 | 0.0% |
| Singapore | 115 | 0.0% |
| Somalia | 11 | 0.0% |
| South Africa | 375 | 0.0% |
| South America | 50,302 | 4.0% |
| South Central Asia | 49,917 | 4.0% |
| South Eastern Asia | 11,337 | 0.9% |
| Southern Europe | 14,793 | 1.2% |
| Spain | 2,008 | 0.2% |
| Sri Lanka | 608 | 0.1% |
| St. Vincent and the Grenadines | 240 | 0.0% |
| Sudan | 182 | 0.0% |
| Sweden | 199 | 0.0% |
| Switzerland | 209 | 0.0% |
| Syria | 287 | 0.0% |
| Taiwan | 2,002 | 0.2% |
| Thailand | 205 | 0.0% |
| Trinidad and Tobago | 1,390 | 0.1% |
| Turkey | 1,287 | 0.1% |
| Uganda | 184 | 0.0% |
| Ukraine | 3,117 | 0.3% |
| Uruguay | 672 | 0.1% |
| Uzbekistan | 428 | 0.0% |
| Venezuela | 1,423 | 0.1% |
| Vietnam | 1,563 | 0.1% |
| West Indies | 43 | 0.0% |
| Western Africa | 8,320 | 0.7% |
| Western Asia | 6,354 | 0.5% |
| Western Europe | 3,836 | 0.3% |
| Yemen | 113 | 0.0% |
| Zaire | 79 | 0.0% |
| Zimbabwe | 41 | 0.0% | View All 136 Rows |
Sex and Age in Area Code 848
Sex and Age in Area Code 848
The most populous age groups in Area Code 848 are 5 to 9 Years (42,813 | 7.0%) for men and 5 to 9 Years (41,192 | 6.5%) for women.
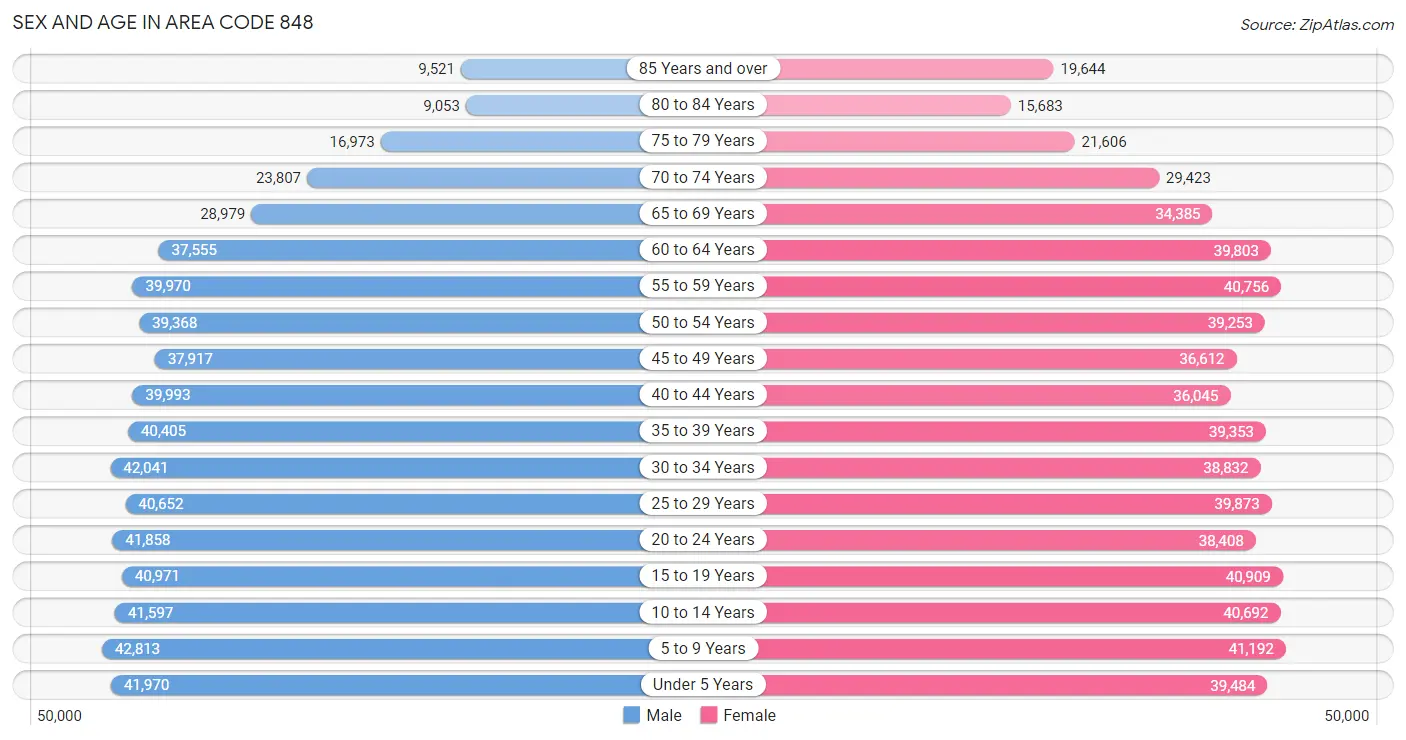
| Age Bracket | Male | Female |
| Under 5 Years | 41,970 (6.8%) | 39,484 (6.2%) |
| 5 to 9 Years | 42,813 (7.0%) | 41,192 (6.5%) |
| 10 to 14 Years | 41,597 (6.8%) | 40,692 (6.4%) |
| 15 to 19 Years | 40,971 (6.7%) | 40,909 (6.5%) |
| 20 to 24 Years | 41,858 (6.8%) | 38,408 (6.1%) |
| 25 to 29 Years | 40,652 (6.6%) | 39,873 (6.3%) |
| 30 to 34 Years | 42,041 (6.8%) | 38,832 (6.1%) |
| 35 to 39 Years | 40,405 (6.6%) | 39,353 (6.2%) |
| 40 to 44 Years | 39,993 (6.5%) | 36,045 (5.7%) |
| 45 to 49 Years | 37,917 (6.2%) | 36,612 (5.8%) |
| 50 to 54 Years | 39,368 (6.4%) | 39,253 (6.2%) |
| 55 to 59 Years | 39,970 (6.5%) | 40,756 (6.5%) |
| 60 to 64 Years | 37,555 (6.1%) | 39,803 (6.3%) |
| 65 to 69 Years | 28,979 (4.7%) | 34,385 (5.4%) |
| 70 to 74 Years | 23,807 (3.9%) | 29,423 (4.7%) |
| 75 to 79 Years | 16,973 (2.8%) | 21,606 (3.4%) |
| 80 to 84 Years | 9,053 (1.5%) | 15,683 (2.5%) |
| 85 Years and over | 9,521 (1.5%) | 19,644 (3.1%) |
| Total | 615,443 (100.0%) | 631,953 (100.0%) |
Families and Households in Area Code 848
Median Family Size in Area Code 848
The median family size in Area Code 848 is 3.21 persons per family, with married-couple families (224,034 | 74.6%) accounting for the largest median family size of 3.30704 persons per family. On the other hand, single male/father families (21,177 | 7.0%) represent the smallest median family size with 2.82 persons per family.
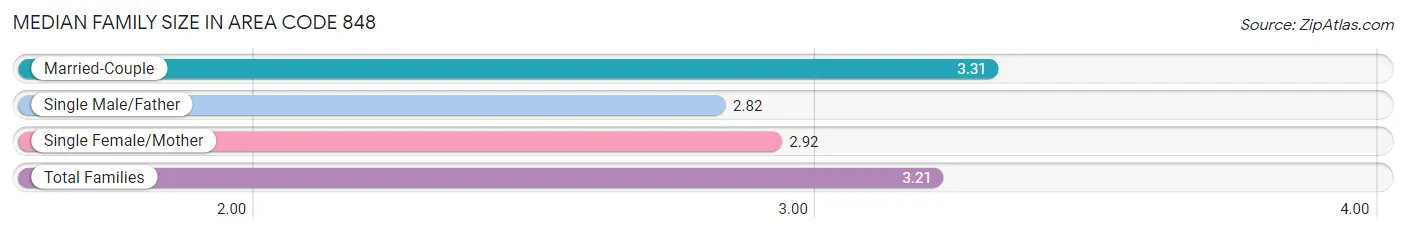
| Family Type | # Families | Family Size |
| Married-Couple | 224,034 (74.6%) | 3.31 |
| Single Male/Father | 21,177 (7.0%) | 2.82 |
| Single Female/Mother | 55,051 (18.3%) | 2.92 |
| Total Families | 300,262 (100.0%) | 3.21 |
Median Household Size in Area Code 848
The median household size in Area Code 848 is 2.61 persons per household, with married-couple households (224,034 | 49.1%) accounting for the largest median household size of 3.3359 persons per household. non-family households (155,858 | 34.2%) represent the smallest median household size with 1.24 persons per household.
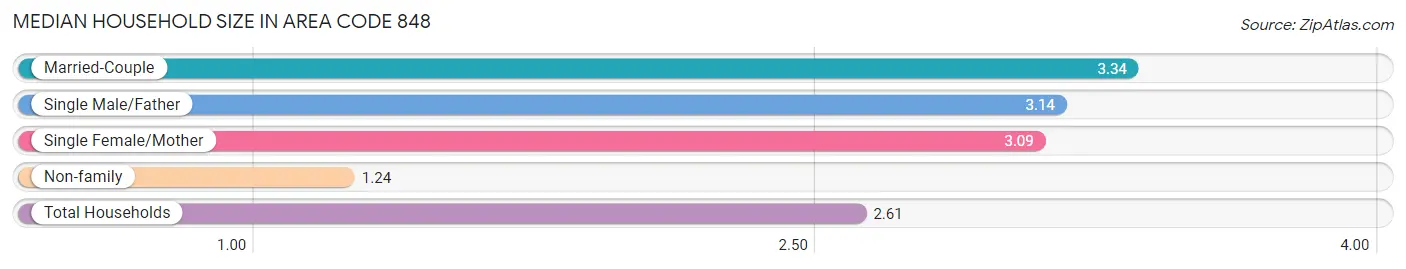
| Household Type | # Households | Household Size |
| Married-Couple | 224,034 (49.1%) | 3.34 |
| Single Male/Father | 21,177 (4.6%) | 3.14 |
| Single Female/Mother | 55,051 (12.1%) | 3.09 |
| Non-family | 155,858 (34.2%) | 1.24 |
| Total Households | 456,120 (100.0%) | 2.61 |
Household Size by Marriage Status in Area Code 848
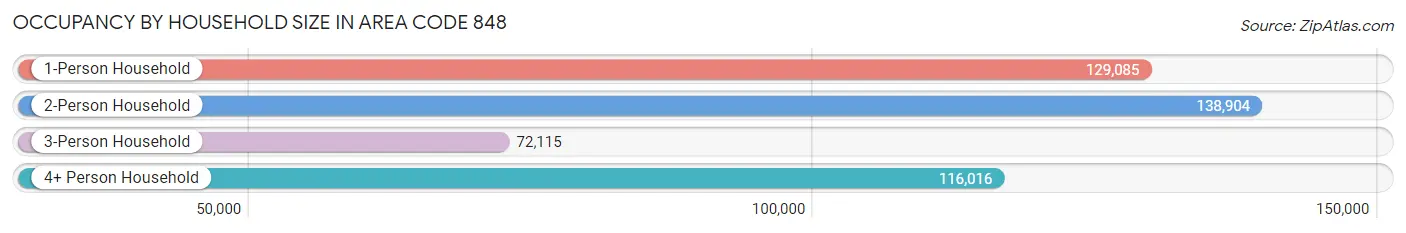
Out of a total of 456,120 households in Area Code 848, 300,262 (65.8%) are family households, while 155,858 (34.2%) are nonfamily households. The most numerous type of family households are 2-person households, comprising 116,593, and the most common type of nonfamily households are 1-person households, comprising 129,085.
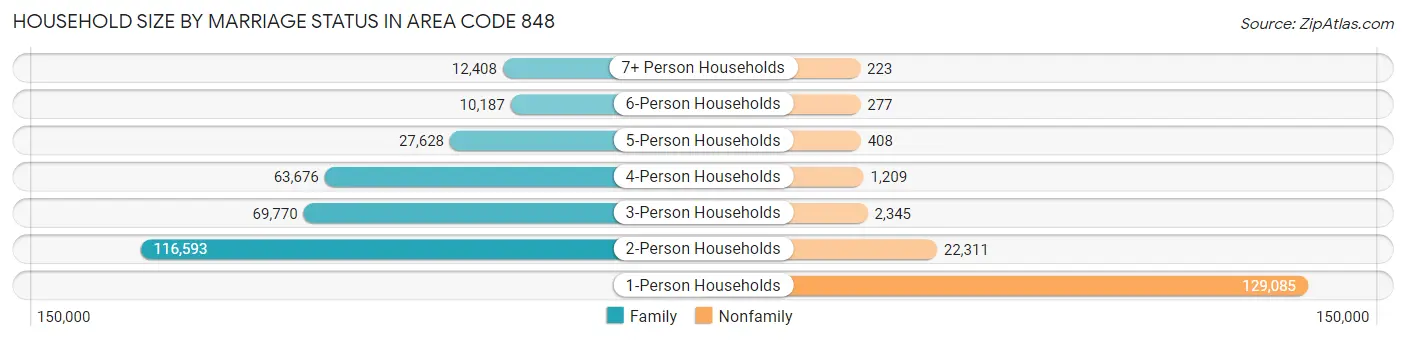
| Household Size | Family Households | Nonfamily Households |
| 1-Person Households | - | 129,085 (28.3%) |
| 2-Person Households | 116,593 (25.6%) | 22,311 (4.9%) |
| 3-Person Households | 69,770 (15.3%) | 2,345 (0.5%) |
| 4-Person Households | 63,676 (14.0%) | 1,209 (0.3%) |
| 5-Person Households | 27,628 (6.1%) | 408 (0.1%) |
| 6-Person Households | 10,187 (2.2%) | 277 (0.1%) |
| 7+ Person Households | 12,408 (2.7%) | 223 (0.1%) |
| Total | 300,262 (65.8%) | 155,858 (34.2%) |
Female Fertility in Area Code 848
Fertility by Age in Area Code 848
Average fertility rate in Area Code 848 is 51.2 births per 1,000 women. Women in the age bracket of 20 to 34 years have the highest fertility rate with 74.8 births per 1,000 women. Women in the age bracket of 20 to 34 years acount for 63.6% of all women with births.
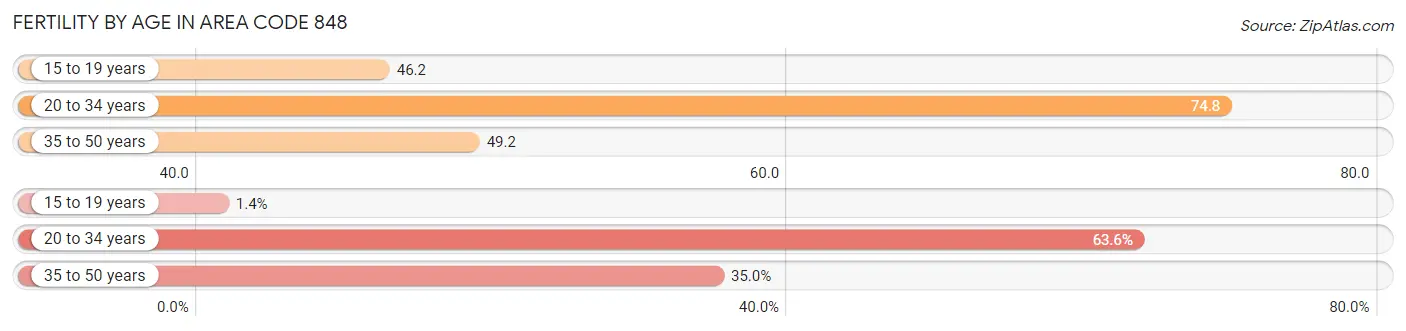
| Age Bracket | Women with Births | Births / 1,000 Women |
| 15 to 19 years | 237 (1.4%) | 46.2 |
| 20 to 34 years | 10,709 (63.6%) | 74.8 |
| 35 to 50 years | 5,899 (35.0%) | 49.2 |
| Total | 16,845 (100.0%) | 51.2 |
Fertility by Age by Marriage Status in Area Code 848
71.3% of women with births (16,845) in Area Code 848 are married. The highest percentage of unmarried women with births falls into 15 to 19 years age bracket with 100.0% of them unmarried at the time of birth, while the lowest percentage of unmarried women with births belong to 35 to 50 years age bracket with 34.5% of them unmarried.
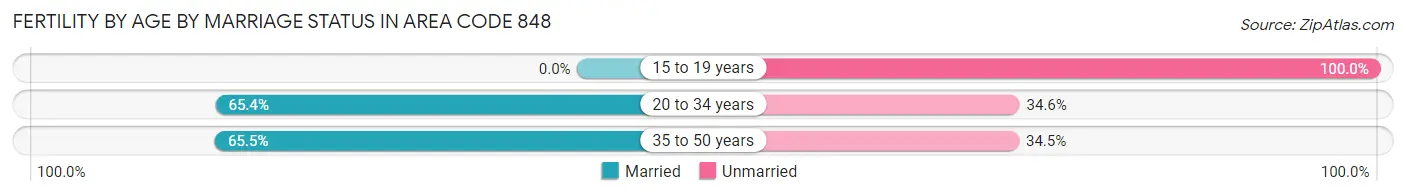
| Age Bracket | Married | Unmarried |
| 15 to 19 years | 0 (0.0%) | 237 (100.0%) |
| 20 to 34 years | 7,004 (65.4%) | 3,705 (34.6%) |
| 35 to 50 years | 3,864 (65.5%) | 2,035 (34.5%) |
| Total | 12,016 (71.3%) | 4,829 (28.7%) |
Fertility by Education in Area Code 848
Average fertility rate in Area Code 848 is 51.2 births per 1,000 women. Women with the education attainment of graduate degree have the highest fertility rate of 98.6 births per 1,000 women, while women with the education attainment of less than high school have the lowest fertility at 42.0 births per 1,000 women. Women with the education attainment of graduate degree represent 23.9% of all women with births.
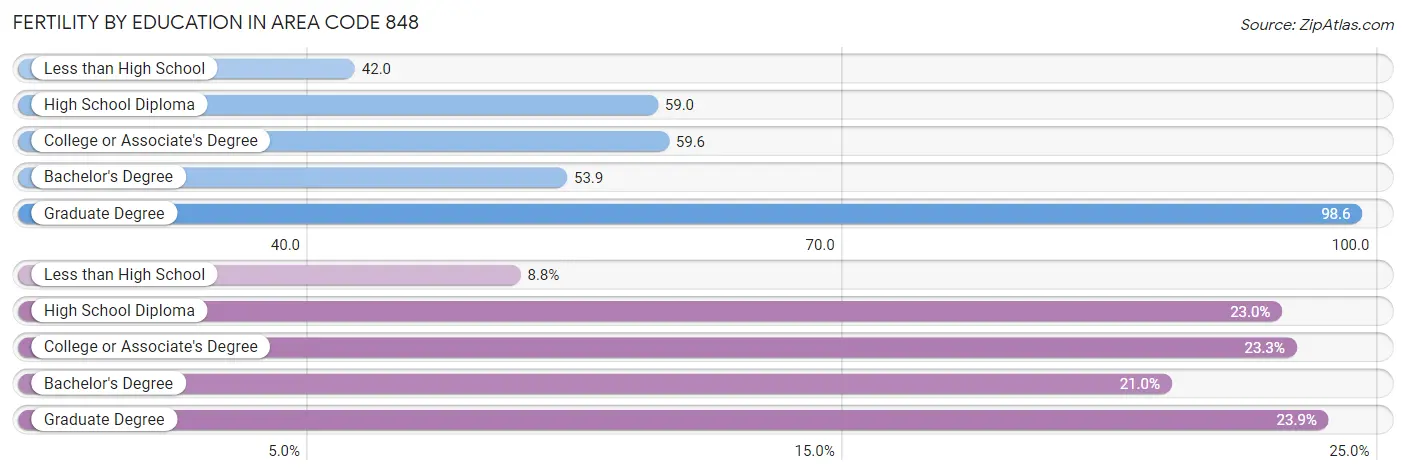
| Educational Attainment | Women with Births | Births / 1,000 Women |
| Less than High School | 1,477 (8.8%) | 42.0 |
| High School Diploma | 3,881 (23.0%) | 59.0 |
| College or Associate's Degree | 3,926 (23.3%) | 59.6 |
| Bachelor's Degree | 3,533 (21.0%) | 53.9 |
| Graduate Degree | 4,028 (23.9%) | 98.6 |
| Total | 16,845 (100.0%) | 51.2 |
Fertility by Education by Marriage Status in Area Code 848
28.7% of women with births in Area Code 848 are unmarried. Women with the educational attainment of graduate degree are most likely to be married with 70.9% of them married at childbirth, while women with the educational attainment of less than high school are least likely to be married with 69.3% of them unmarried at childbirth.
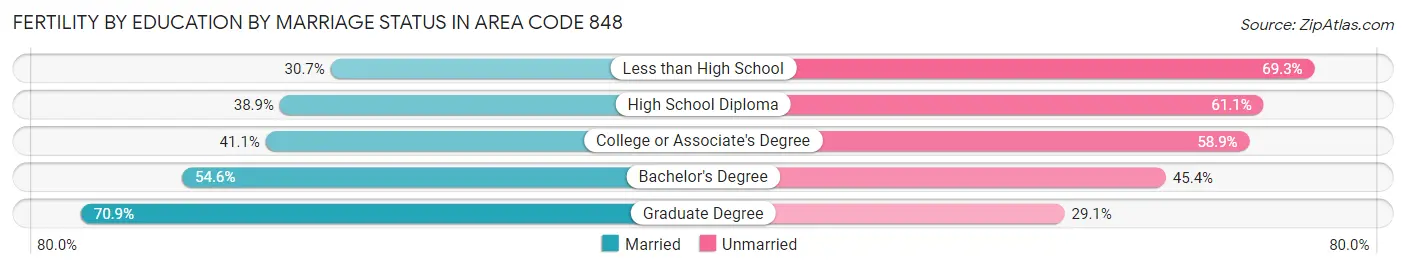
| Educational Attainment | Married | Unmarried |
| Less than High School | 453 (30.7%) | 1,024 (69.3%) |
| High School Diploma | 1,508 (38.9%) | 2,373 (61.1%) |
| College or Associate's Degree | 1,615 (41.1%) | 2,311 (58.9%) |
| Bachelor's Degree | 1,929 (54.6%) | 1,604 (45.4%) |
| Graduate Degree | 2,857 (70.9%) | 1,171 (29.1%) |
| Total | 12,016 (71.3%) | 4,829 (28.7%) |
Employment Characteristics in Area Code 848
Employment by Class of Employer in Area Code 848
Among the 572,647 employed individuals in Area Code 848, private company employees (401,336 | 70.1%), local government employees (44,908 | 7.8%), and not-for-profit organizations (43,747 | 7.6%) make up the most common classes of employment.
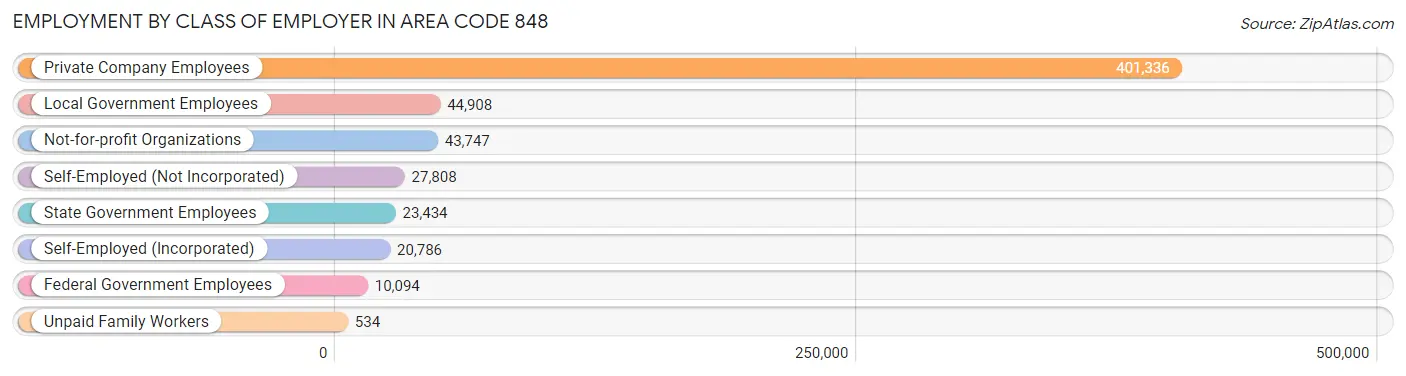
| Employer Class | # Employees | % Employees |
| Private Company Employees | 401,336 | 70.1% |
| Self-Employed (Incorporated) | 20,786 | 3.6% |
| Self-Employed (Not Incorporated) | 27,808 | 4.9% |
| Not-for-profit Organizations | 43,747 | 7.6% |
| Local Government Employees | 44,908 | 7.8% |
| State Government Employees | 23,434 | 4.1% |
| Federal Government Employees | 10,094 | 1.8% |
| Unpaid Family Workers | 534 | 0.1% |
| Total | 572,647 | 100.0% |
Employment Status by Age in Area Code 848
According to the labor force statistics for Area Code 848, out of the total population over 16 years of age (984,234), 64.5% or 635,126 individuals are in the labor force, with 5.9% or 37,409 of them unemployed. The age group with the highest labor force participation rate is 25 to 29 years, with 85.9% or 69,139 individuals in the labor force. Within the labor force, the 16 to 19 years age range has the highest percentage of unemployed individuals, with 586.5% or 134,684 of them being unemployed.
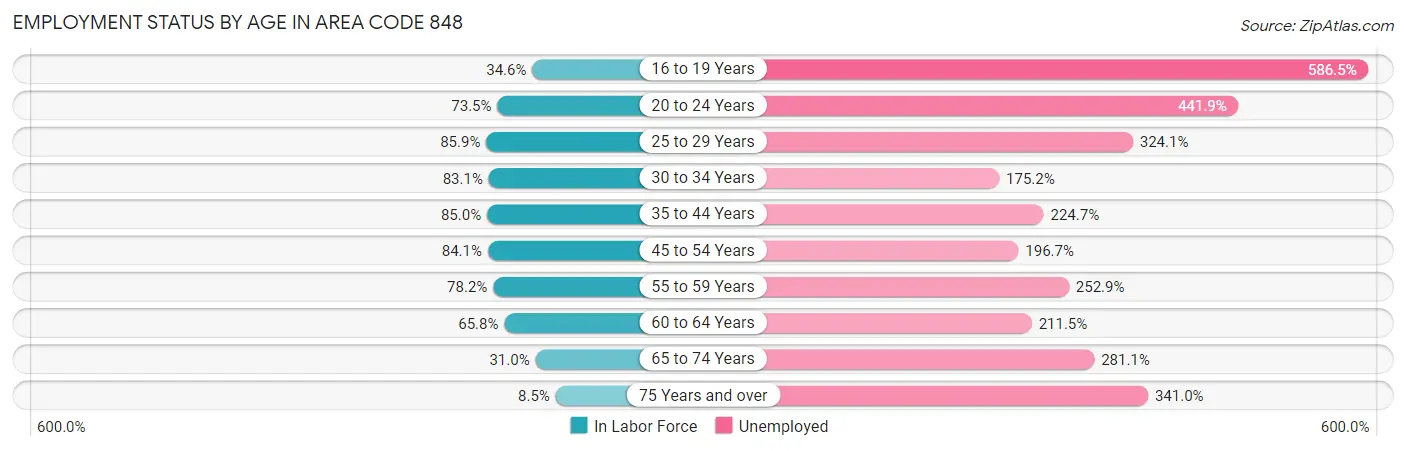
| Age Bracket | In Labor Force | Unemployed |
| 16 to 19 Years | 22,966 (34.5%) | 134,684 (586.5%) |
| 20 to 24 Years | 58,977 (73.5%) | 260,628 (441.9%) |
| 25 to 29 Years | 69,142 (85.9%) | 224,079 (324.1%) |
| 30 to 34 Years | 67,211 (83.1%) | 117,759 (175.2%) |
| 35 to 44 Years | 132,473 (85.0%) | 297,667 (224.7%) |
| 45 to 54 Years | 128,837 (84.1%) | 253,409 (196.7%) |
| 55 to 59 Years | 63,111 (78.2%) | 159,610 (252.9%) |
| 60 to 64 Years | 50,907 (65.8%) | 107,673 (211.5%) |
| 65 to 74 Years | 36,168 (31.0%) | 101,665 (281.1%) |
| 75 Years and over | 7,872 (8.5%) | 26,837 (341.0%) |
| Total | 635,099 (64.5%) | 37,415 (5.9%) |
Employment Status by Educational Attainment in Area Code 848
According to labor force statistics for Area Code 848, 81.2% of individuals (510,409) out of the total population between 25 and 64 years of age (628,428) are in the labor force, with 225.7% or 1,151,993 of them being unemployed. The group with the highest labor force participation rate are those with the educational attainment of bachelor's degree or higher, with 87.7% or 235,129 individuals in the labor force. Within the labor force, individuals with high school diploma education have the highest percentage of unemployment, with 316.0% or 368,554 of them being unemployed.
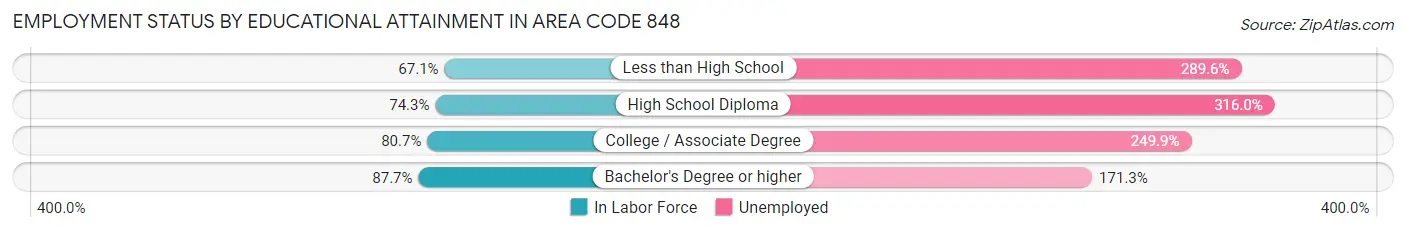
| Educational Attainment | In Labor Force | Unemployed |
| Less than High School | 40,670 (67.1%) | 175,602 (289.6%) |
| High School Diploma | 116,636 (74.3%) | 496,237 (316.0%) |
| College / Associate Degree | 115,163 (80.7%) | 356,710 (249.9%) |
| Bachelor's Degree or higher | 235,127 (87.7%) | 459,108 (171.3%) |
| Total | 510,441 (81.2%) | 1,418,362 (225.7%) |
Employment Occupations by Sex in Area Code 848
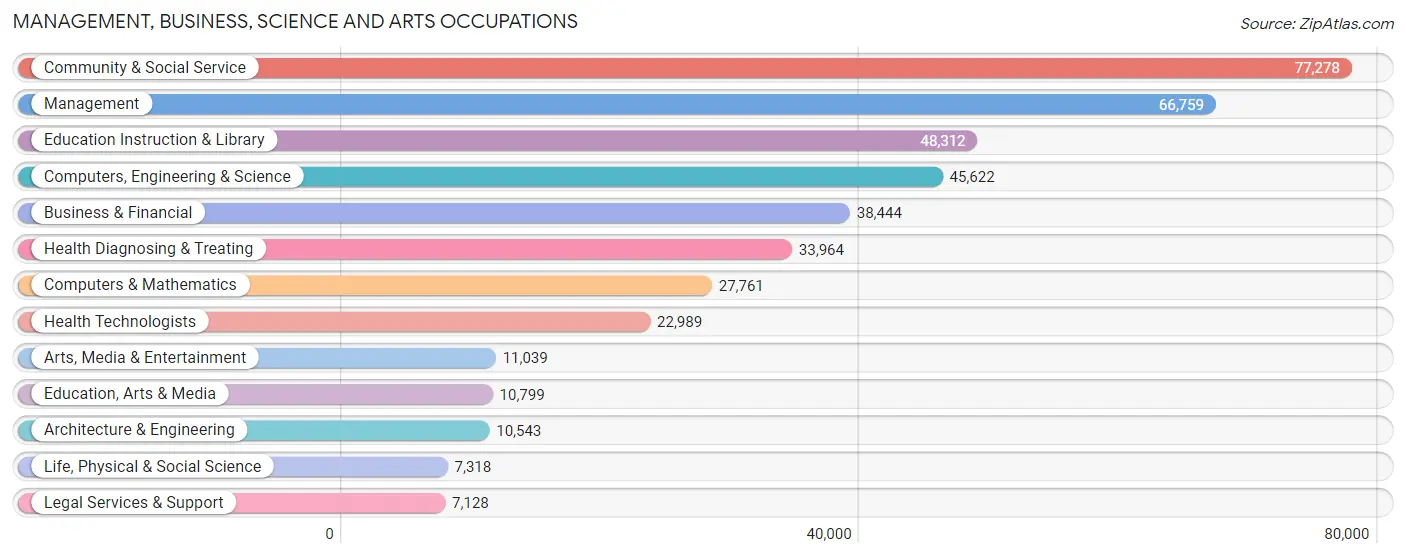
Management, Business, Science and Arts Occupations
The most common Management, Business, Science and Arts occupations in Area Code 848 are Community & Social Service (77,278 | 13.2%), Management (66,759 | 11.4%), Education Instruction & Library (48,312 | 8.2%), Computers, Engineering & Science (45,622 | 7.8%), and Business & Financial (38,444 | 6.6%).
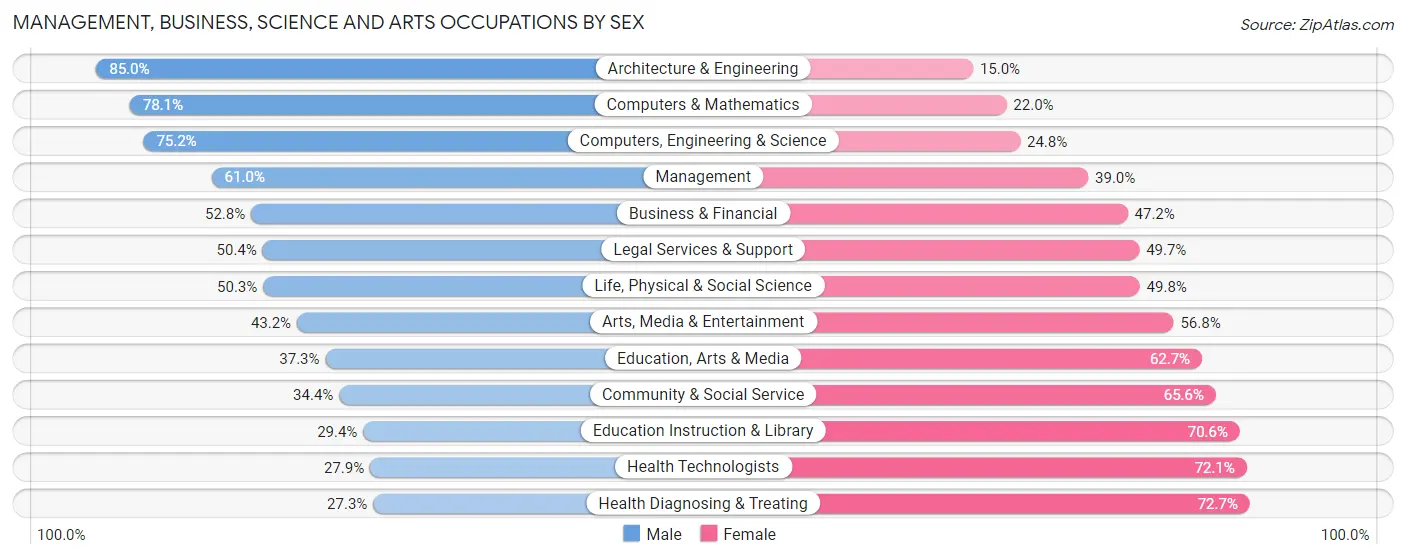
Management, Business, Science and Arts Occupations by Sex
Within the Management, Business, Science and Arts occupations in Area Code 848, the most male-oriented occupations are Architecture & Engineering (85.0%), Computers & Mathematics (78.0%), and Computers, Engineering & Science (75.2%), while the most female-oriented occupations are Health Diagnosing & Treating (72.7%), Health Technologists (72.1%), and Education Instruction & Library (70.6%).
| Occupation | Male | Female |
| Management | 40,720 (61.0%) | 26,039 (39.0%) |
| Business & Financial | 20,284 (52.8%) | 18,160 (47.2%) |
| Computers, Engineering & Science | 34,309 (75.2%) | 11,313 (24.8%) |
| Computers & Mathematics | 21,667 (78.0%) | 6,094 (22.0%) |
| Architecture & Engineering | 8,965 (85.0%) | 1,578 (15.0%) |
| Life, Physical & Social Science | 3,677 (50.2%) | 3,641 (49.7%) |
| Community & Social Service | 26,572 (34.4%) | 50,706 (65.6%) |
| Education, Arts & Media | 4,024 (37.3%) | 6,775 (62.7%) |
| Legal Services & Support | 3,589 (50.3%) | 3,539 (49.6%) |
| Education Instruction & Library | 14,191 (29.4%) | 34,121 (70.6%) |
| Arts, Media & Entertainment | 4,768 (43.2%) | 6,271 (56.8%) |
| Health Diagnosing & Treating | 9,270 (27.3%) | 24,694 (72.7%) |
| Health Technologists | 6,421 (27.9%) | 16,568 (72.1%) |
| Total (Category) | 131,155 (50.0%) | 130,912 (49.9%) |
| Total (Overall) | 311,120 (53.0%) | 276,161 (47.0%) |
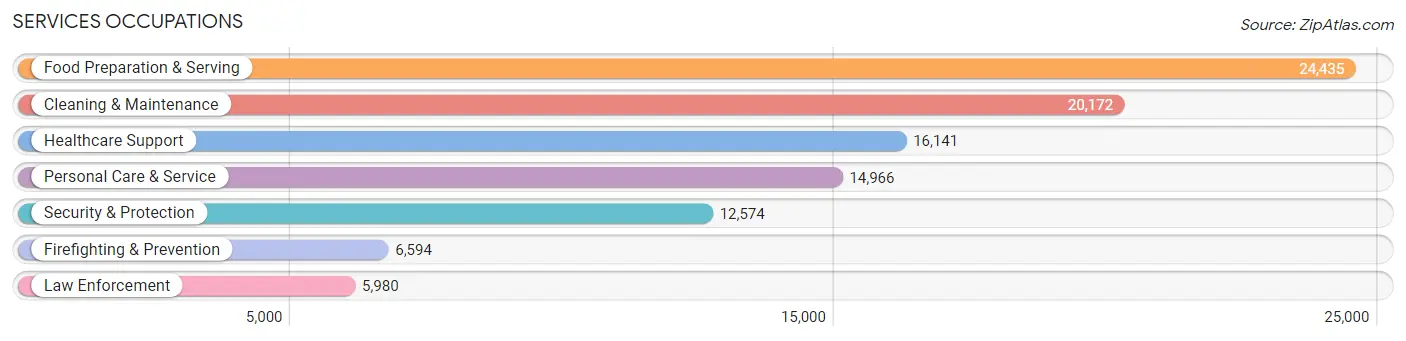
Services Occupations
The most common Services occupations in Area Code 848 are Food Preparation & Serving (24,435 | 4.2%), Cleaning & Maintenance (20,172 | 3.4%), Healthcare Support (16,141 | 2.8%), Personal Care & Service (14,966 | 2.5%), and Security & Protection (12,574 | 2.1%).
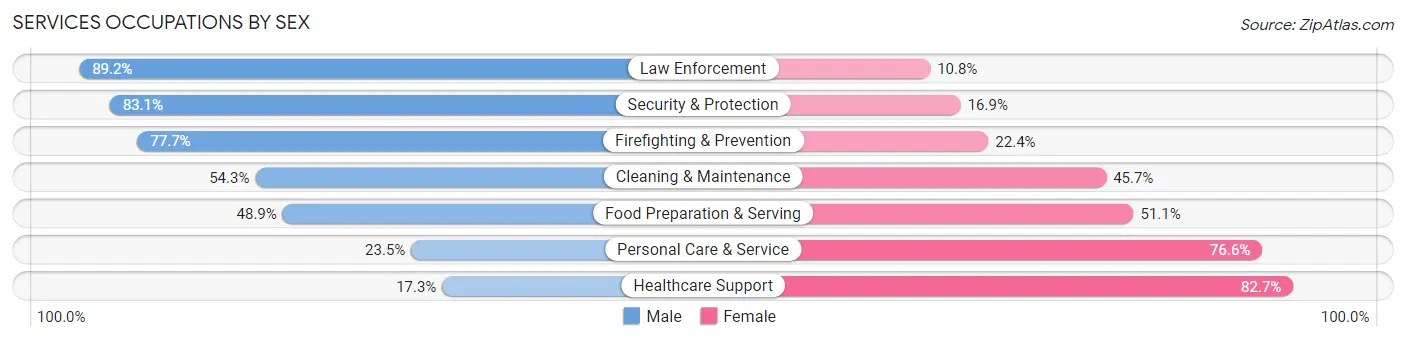
Services Occupations by Sex
Within the Services occupations in Area Code 848, the most male-oriented occupations are Law Enforcement (89.2%), Security & Protection (83.1%), and Firefighting & Prevention (77.6%), while the most female-oriented occupations are Healthcare Support (82.7%), Personal Care & Service (76.5%), and Food Preparation & Serving (51.1%).
| Occupation | Male | Female |
| Healthcare Support | 2,794 (17.3%) | 13,347 (82.7%) |
| Security & Protection | 10,453 (83.1%) | 2,121 (16.9%) |
| Firefighting & Prevention | 5,120 (77.6%) | 1,474 (22.4%) |
| Law Enforcement | 5,333 (89.2%) | 647 (10.8%) |
| Food Preparation & Serving | 11,951 (48.9%) | 12,484 (51.1%) |
| Cleaning & Maintenance | 10,959 (54.3%) | 9,213 (45.7%) |
| Personal Care & Service | 3,510 (23.4%) | 11,456 (76.5%) |
| Total (Category) | 39,667 (44.9%) | 48,621 (55.1%) |
| Total (Overall) | 311,120 (53.0%) | 276,161 (47.0%) |
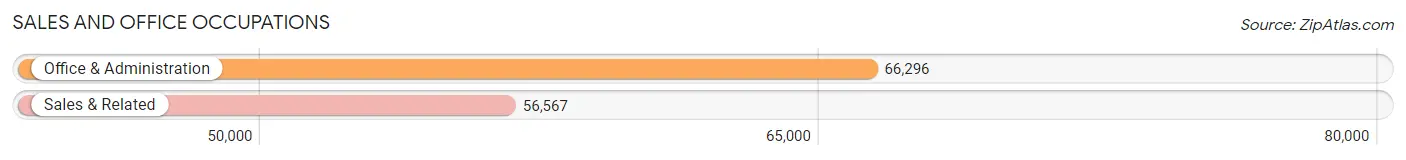
Sales and Office Occupations
The most common Sales and Office occupations in Area Code 848 are Office & Administration (66,296 | 11.3%), and Sales & Related (56,567 | 9.6%).
Sales and Office Occupations by Sex
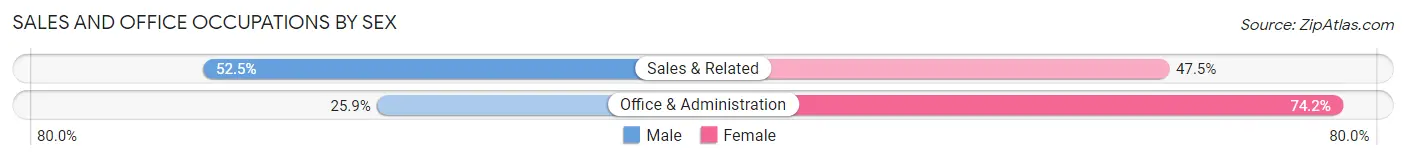
| Occupation | Male | Female |
| Sales & Related | 29,714 (52.5%) | 26,853 (47.5%) |
| Office & Administration | 17,140 (25.9%) | 49,156 (74.2%) |
| Total (Category) | 46,854 (38.1%) | 76,009 (61.9%) |
| Total (Overall) | 311,120 (53.0%) | 276,161 (47.0%) |
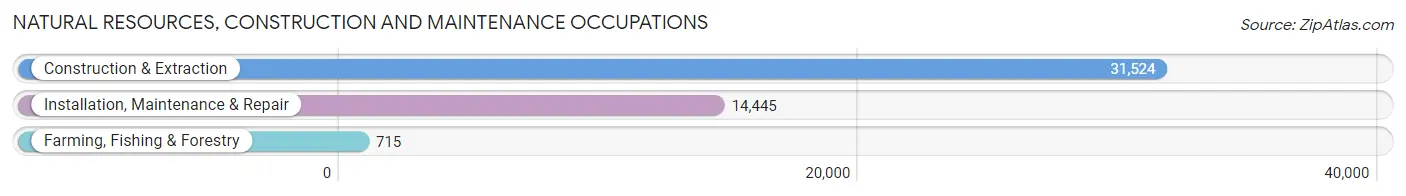
Natural Resources, Construction and Maintenance Occupations
The most common Natural Resources, Construction and Maintenance occupations in Area Code 848 are Construction & Extraction (31,524 | 5.4%), Installation, Maintenance & Repair (14,445 | 2.5%), and Farming, Fishing & Forestry (715 | 0.1%).
Natural Resources, Construction and Maintenance Occupations by Sex
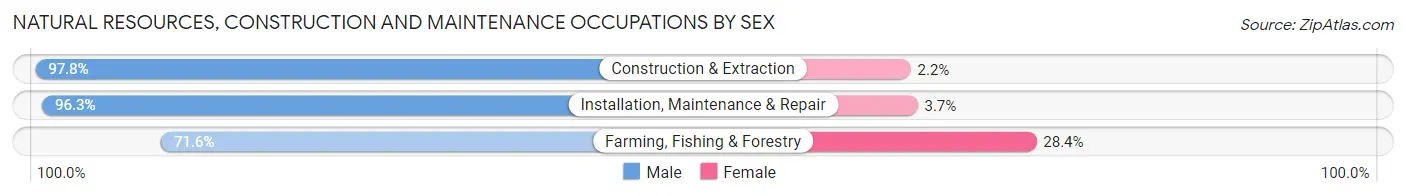
| Occupation | Male | Female |
| Farming, Fishing & Forestry | 512 (71.6%) | 203 (28.4%) |
| Construction & Extraction | 30,822 (97.8%) | 702 (2.2%) |
| Installation, Maintenance & Repair | 13,917 (96.3%) | 528 (3.7%) |
| Total (Category) | 45,251 (96.9%) | 1,433 (3.1%) |
| Total (Overall) | 311,120 (53.0%) | 276,161 (47.0%) |
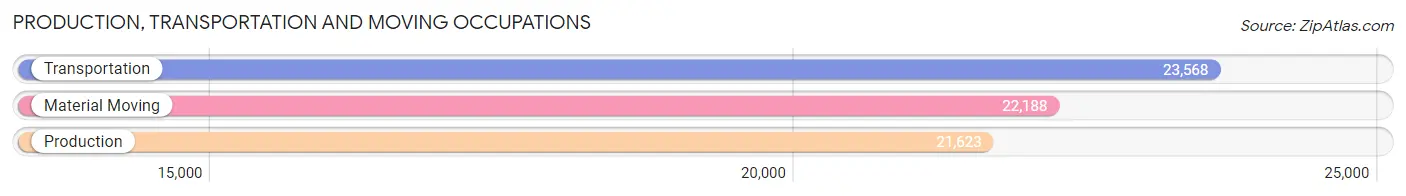
Production, Transportation and Moving Occupations
The most common Production, Transportation and Moving occupations in Area Code 848 are Transportation (23,568 | 4.0%), Material Moving (22,188 | 3.8%), and Production (21,623 | 3.7%).
Production, Transportation and Moving Occupations by Sex
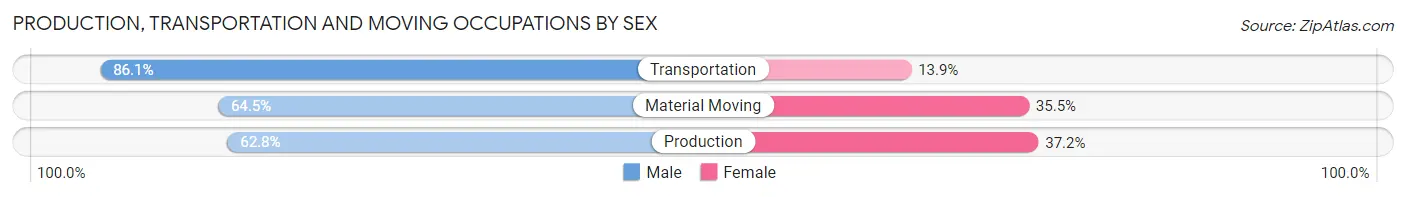
| Occupation | Male | Female |
| Production | 13,580 (62.8%) | 8,043 (37.2%) |
| Transportation | 20,297 (86.1%) | 3,271 (13.9%) |
| Material Moving | 14,316 (64.5%) | 7,872 (35.5%) |
| Total (Category) | 48,193 (71.5%) | 19,186 (28.5%) |
| Total (Overall) | 311,120 (53.0%) | 276,161 (47.0%) |
Employment Industries by Sex in Area Code 848
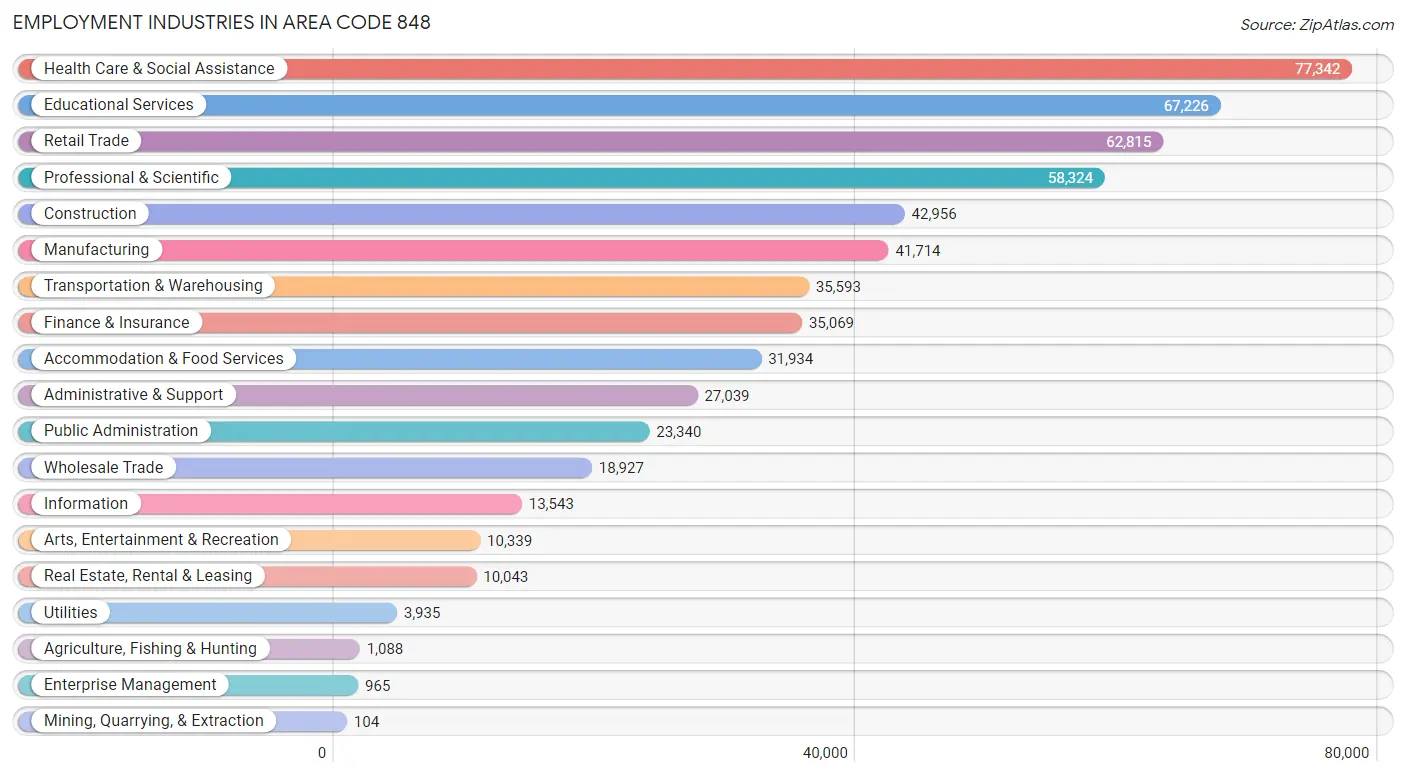
Employment Industries in Area Code 848
The major employment industries in Area Code 848 include Health Care & Social Assistance (77,342 | 13.2%), Educational Services (67,226 | 11.5%), Retail Trade (62,815 | 10.7%), Professional & Scientific (58,324 | 9.9%), and Construction (42,956 | 7.3%).
Employment Industries by Sex in Area Code 848
The Area Code 848 industries that see more men than women are Mining, Quarrying, & Extraction (100.0%), Construction (91.0%), and Agriculture, Fishing & Hunting (74.8%), whereas the industries that tend to have a higher number of women are Health Care & Social Assistance (76.2%), Educational Services (65.8%), and Enterprise Management (63.4%).
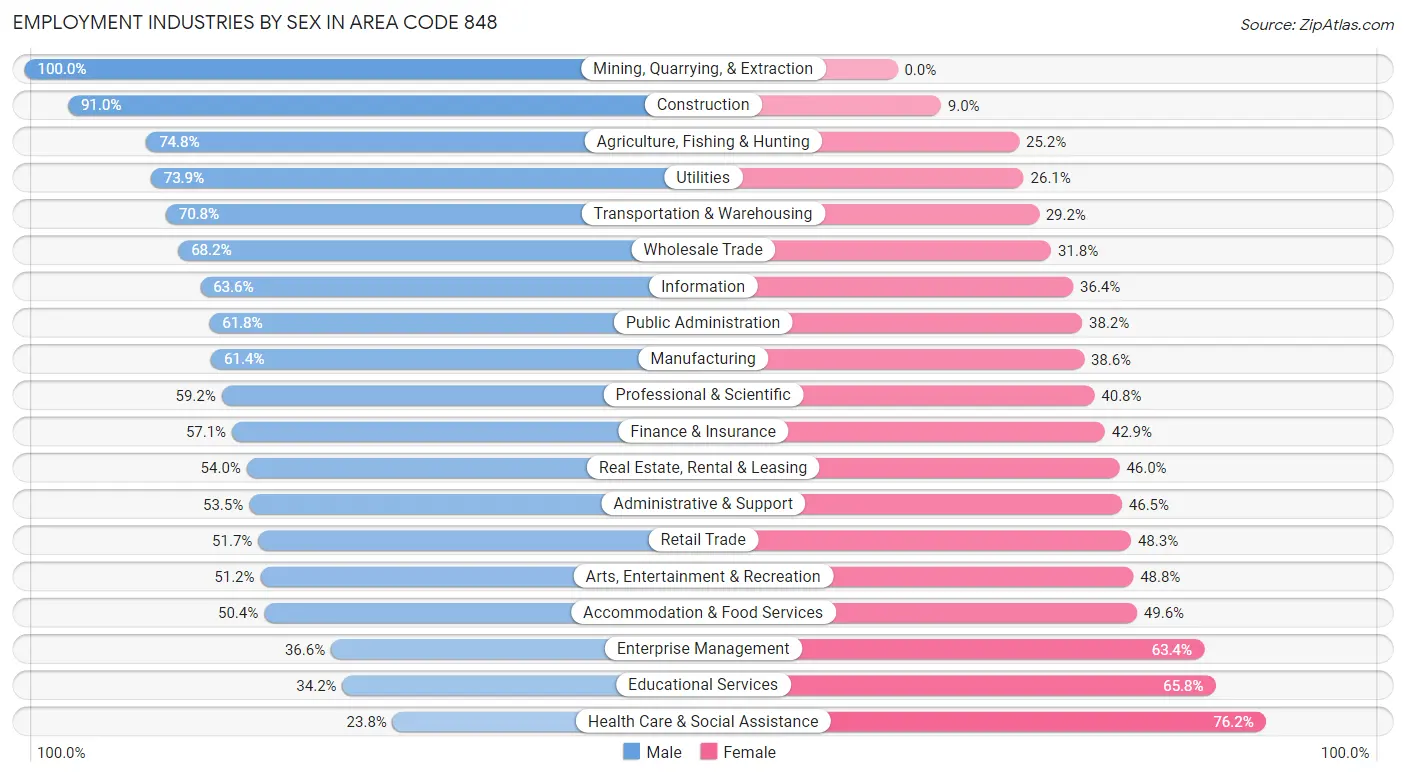
| Industry | Male | Female |
| Agriculture, Fishing & Hunting | 814 (74.8%) | 274 (25.2%) |
| Mining, Quarrying, & Extraction | 104 (100.0%) | 0 (0.0%) |
| Construction | 39,094 (91.0%) | 3,862 (9.0%) |
| Manufacturing | 25,607 (61.4%) | 16,107 (38.6%) |
| Wholesale Trade | 12,906 (68.2%) | 6,021 (31.8%) |
| Retail Trade | 32,450 (51.7%) | 30,365 (48.3%) |
| Transportation & Warehousing | 25,187 (70.8%) | 10,406 (29.2%) |
| Utilities | 2,907 (73.9%) | 1,028 (26.1%) |
| Information | 8,619 (63.6%) | 4,924 (36.4%) |
| Finance & Insurance | 20,019 (57.1%) | 15,050 (42.9%) |
| Real Estate, Rental & Leasing | 5,427 (54.0%) | 4,616 (46.0%) |
| Professional & Scientific | 34,549 (59.2%) | 23,775 (40.8%) |
| Enterprise Management | 353 (36.6%) | 612 (63.4%) |
| Administrative & Support | 14,476 (53.5%) | 12,563 (46.5%) |
| Educational Services | 23,004 (34.2%) | 44,222 (65.8%) |
| Health Care & Social Assistance | 18,423 (23.8%) | 58,919 (76.2%) |
| Arts, Entertainment & Recreation | 5,294 (51.2%) | 5,045 (48.8%) |
| Accommodation & Food Services | 16,103 (50.4%) | 15,831 (49.6%) |
| Public Administration | 14,416 (61.8%) | 8,924 (38.2%) |
| Total | 311,120 (53.0%) | 276,161 (47.0%) |
Education in Area Code 848
School Enrollment in Area Code 848
The most common levels of schooling among the 327,342 students in Area Code 848 are college / undergraduate (69,535 | 21.2%), elementary school (67,141 | 20.5%), and high school (65,294 | 20.0%).
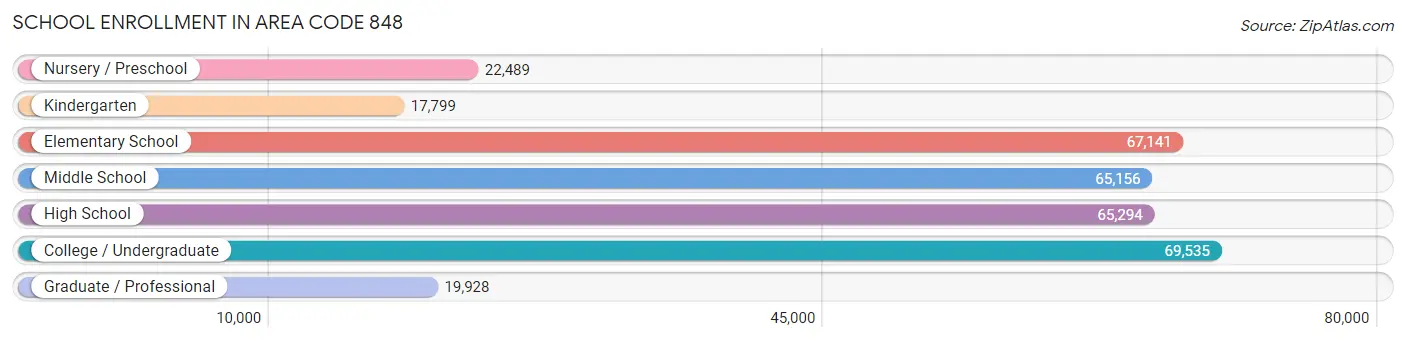
| School Level | # Students | % Students |
| Nursery / Preschool | 22,489 | 6.9% |
| Kindergarten | 17,799 | 5.4% |
| Elementary School | 67,141 | 20.5% |
| Middle School | 65,156 | 19.9% |
| High School | 65,294 | 20.0% |
| College / Undergraduate | 69,535 | 21.2% |
| Graduate / Professional | 19,928 | 6.1% |
| Total | 327,342 | 100.0% |
School Enrollment by Age by Funding Source in Area Code 848
Out of a total of 327,342 students who are enrolled in schools in Area Code 848, 103,795 (31.7%) attend a private institution, while the remaining 223,547 (68.3%) are enrolled in public schools. The age group of 3 to 4 year olds has the highest likelihood of being enrolled in private schools, with 10,755 (53.7% in the age bracket) enrolled. Conversely, the age group of 15 to 17 year olds has the lowest likelihood of being enrolled in a private school, with 35,938 (76.7% in the age bracket) attending a public institution.
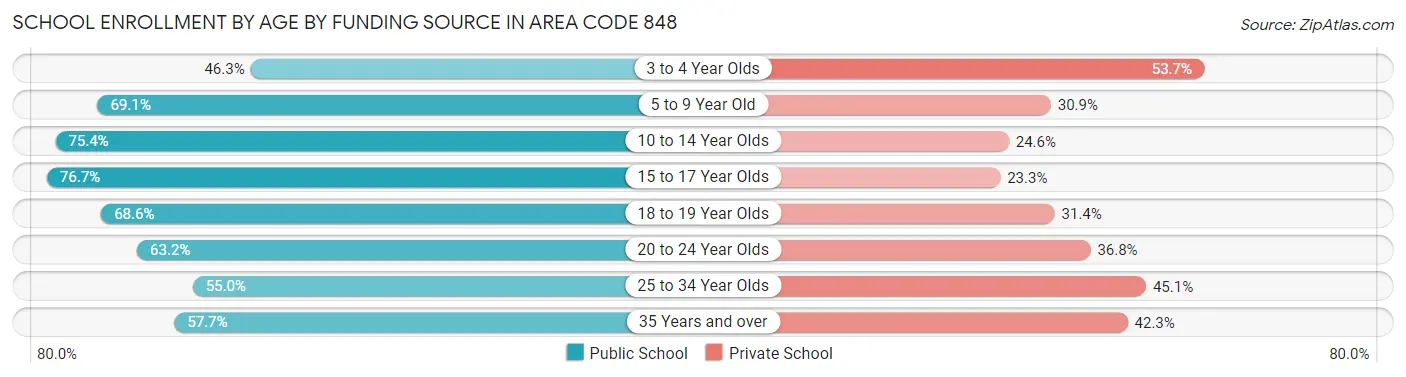
| Age Bracket | Public School | Private School |
| 3 to 4 Year Olds | 9,286 (46.3%) | 10,755 (53.7%) |
| 5 to 9 Year Old | 55,672 (69.1%) | 24,866 (30.9%) |
| 10 to 14 Year Olds | 61,039 (75.4%) | 19,911 (24.6%) |
| 15 to 17 Year Olds | 35,938 (76.7%) | 10,935 (23.3%) |
| 18 to 19 Year Olds | 19,092 (68.6%) | 8,748 (31.4%) |
| 20 to 24 Year Olds | 23,159 (63.2%) | 13,466 (36.8%) |
| 25 to 34 Year Olds | 10,809 (54.9%) | 8,860 (45.1%) |
| 35 Years and over | 8,541 (57.7%) | 6,265 (42.3%) |
| Total | 223,547 (68.3%) | 103,795 (31.7%) |
Educational Attainment by Field of Study in Area Code 848
Business (70,949 | 20.0%), education (39,523 | 11.2%), science & technology (30,115 | 8.5%), engineering (29,852 | 8.4%), and social sciences (28,081 | 7.9%) are the most common fields of study among 354,357 individuals in Area Code 848 who have obtained a bachelor's degree or higher.
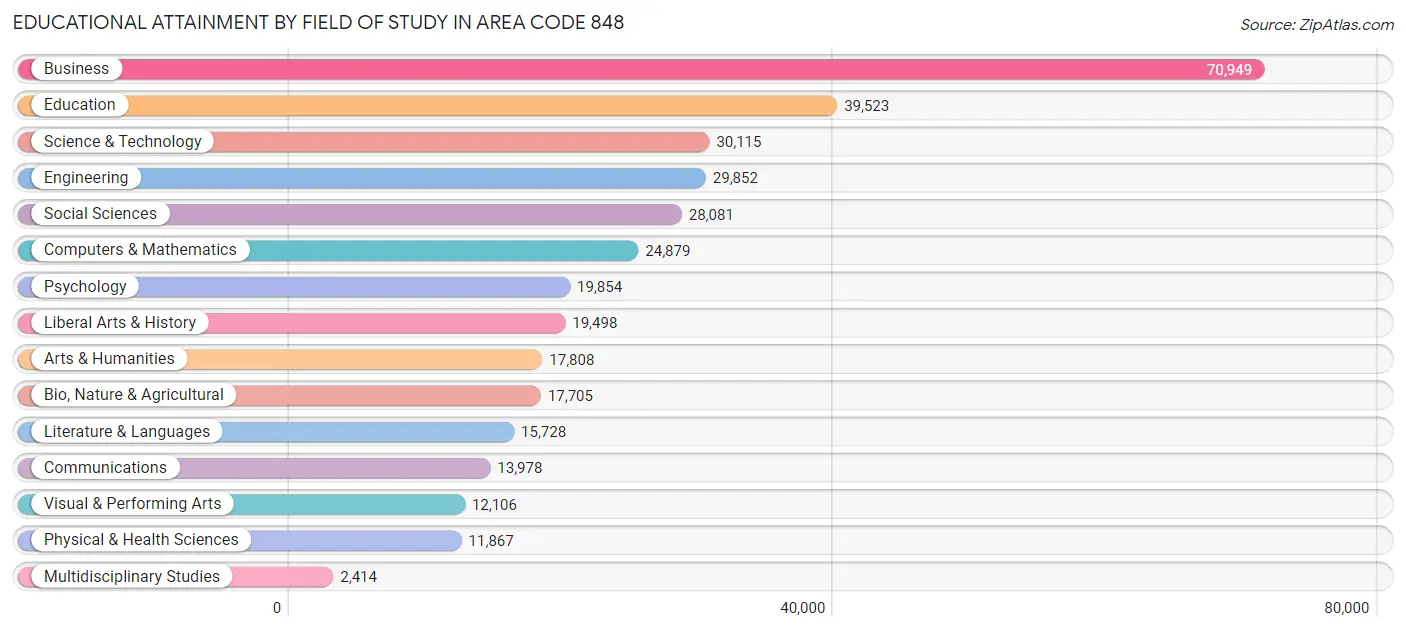
| Field of Study | # Graduates | % Graduates |
| Computers & Mathematics | 24,879 | 7.0% |
| Bio, Nature & Agricultural | 17,705 | 5.0% |
| Physical & Health Sciences | 11,867 | 3.4% |
| Psychology | 19,854 | 5.6% |
| Social Sciences | 28,081 | 7.9% |
| Engineering | 29,852 | 8.4% |
| Multidisciplinary Studies | 2,414 | 0.7% |
| Science & Technology | 30,115 | 8.5% |
| Business | 70,949 | 20.0% |
| Education | 39,523 | 11.2% |
| Literature & Languages | 15,728 | 4.4% |
| Liberal Arts & History | 19,498 | 5.5% |
| Visual & Performing Arts | 12,106 | 3.4% |
| Communications | 13,978 | 3.9% |
| Arts & Humanities | 17,808 | 5.0% |
| Total | 354,357 | 100.0% |
Transportation & Commute in Area Code 848
Vehicle Availability by Sex in Area Code 848
The most prevalent vehicle ownership categories in Area Code 848 are males with 2 vehicles (126,555, accounting for 41.7%) and females with 2 vehicles (107,594, making up 47.8%).
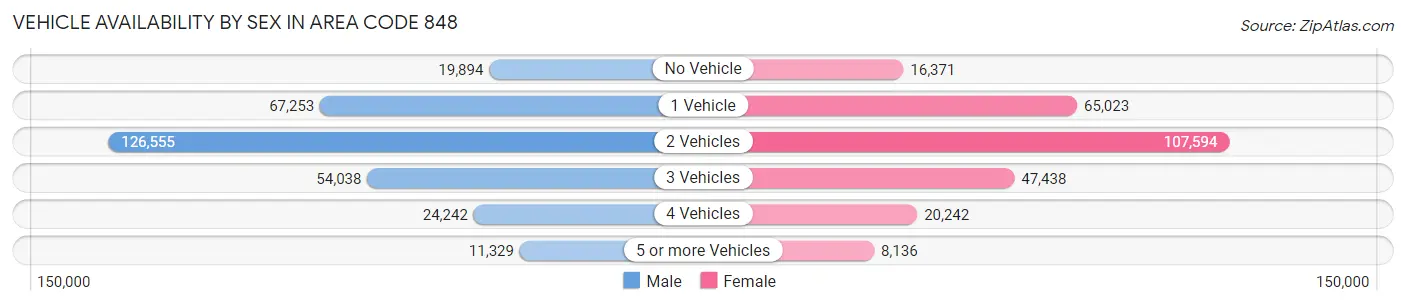
| Vehicles Available | Male | Female |
| No Vehicle | 19,894 (6.6%) | 16,371 (6.2%) |
| 1 Vehicle | 67,253 (22.2%) | 65,023 (24.6%) |
| 2 Vehicles | 126,555 (41.7%) | 107,594 (40.6%) |
| 3 Vehicles | 54,038 (17.8%) | 47,438 (17.9%) |
| 4 Vehicles | 24,242 (8.0%) | 20,242 (7.6%) |
| 5 or more Vehicles | 11,329 (3.7%) | 8,136 (3.1%) |
| Total | 303,311 (100.0%) | 264,804 (100.0%) |
Commute Time in Area Code 848
The most frequently occuring commute durations in Area Code 848 are 15 to 19 minutes (68,562 commuters, 13.6%), 30 to 34 minutes (64,867 commuters, 12.9%), and 10 to 14 minutes (64,198 commuters, 12.8%).
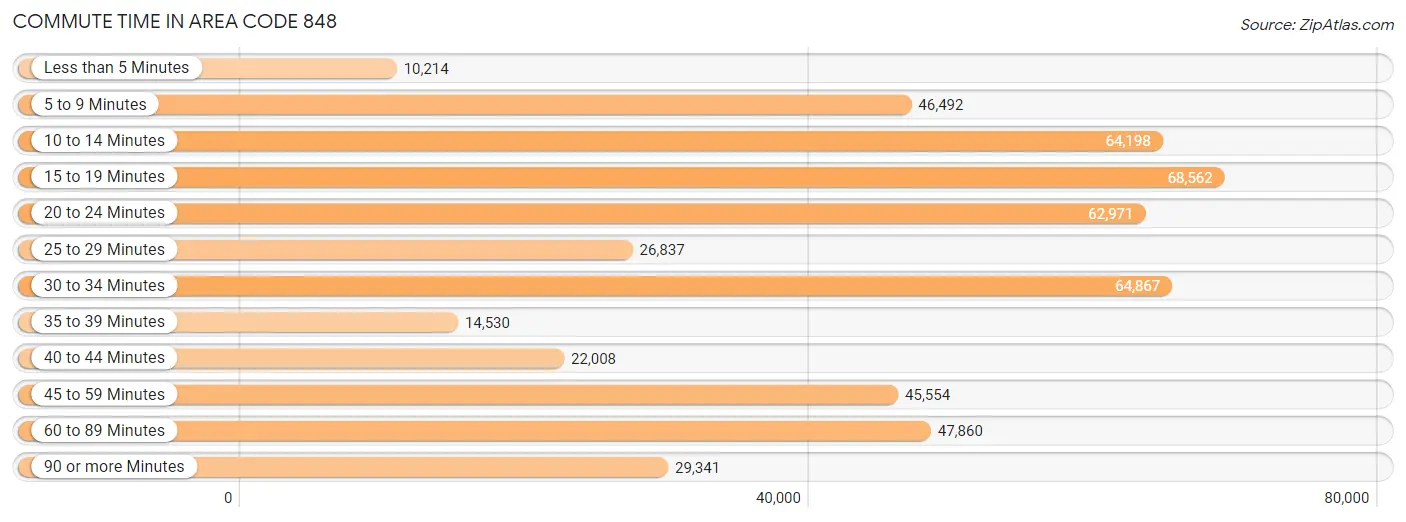
| Commute Time | # Commuters | % Commuters |
| Less than 5 Minutes | 10,214 | 2.0% |
| 5 to 9 Minutes | 46,492 | 9.2% |
| 10 to 14 Minutes | 64,198 | 12.8% |
| 15 to 19 Minutes | 68,562 | 13.6% |
| 20 to 24 Minutes | 62,971 | 12.5% |
| 25 to 29 Minutes | 26,837 | 5.3% |
| 30 to 34 Minutes | 64,867 | 12.9% |
| 35 to 39 Minutes | 14,530 | 2.9% |
| 40 to 44 Minutes | 22,008 | 4.4% |
| 45 to 59 Minutes | 45,554 | 9.0% |
| 60 to 89 Minutes | 47,860 | 9.5% |
| 90 or more Minutes | 29,341 | 5.8% |
Commute Time by Sex in Area Code 848
The most common commute times in Area Code 848 are 30 to 34 minutes (35,159 commuters, 13.0%) for males and 15 to 19 minutes (34,505 commuters, 14.8%) for females.
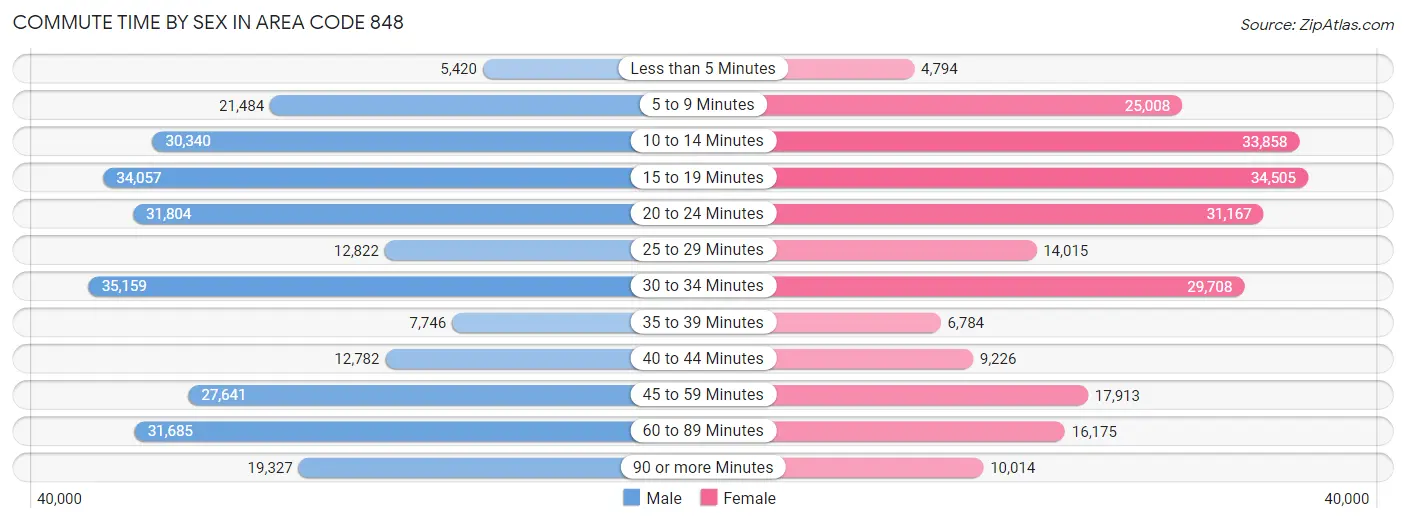
| Commute Time | Male | Female |
| Less than 5 Minutes | 5,420 (2.0%) | 4,794 (2.1%) |
| 5 to 9 Minutes | 21,484 (8.0%) | 25,008 (10.7%) |
| 10 to 14 Minutes | 30,340 (11.2%) | 33,858 (14.5%) |
| 15 to 19 Minutes | 34,057 (12.6%) | 34,505 (14.8%) |
| 20 to 24 Minutes | 31,804 (11.8%) | 31,167 (13.4%) |
| 25 to 29 Minutes | 12,822 (4.7%) | 14,015 (6.0%) |
| 30 to 34 Minutes | 35,159 (13.0%) | 29,708 (12.7%) |
| 35 to 39 Minutes | 7,746 (2.9%) | 6,784 (2.9%) |
| 40 to 44 Minutes | 12,782 (4.7%) | 9,226 (4.0%) |
| 45 to 59 Minutes | 27,641 (10.2%) | 17,913 (7.7%) |
| 60 to 89 Minutes | 31,685 (11.7%) | 16,175 (6.9%) |
| 90 or more Minutes | 19,327 (7.1%) | 10,014 (4.3%) |
Time of Departure to Work by Sex in Area Code 848
The most frequent times of departure to work in Area Code 848 are 7:00 AM to 7:29 AM (42,139, 15.6%) for males and 8:00 AM to 8:29 AM (34,498, 14.8%) for females.
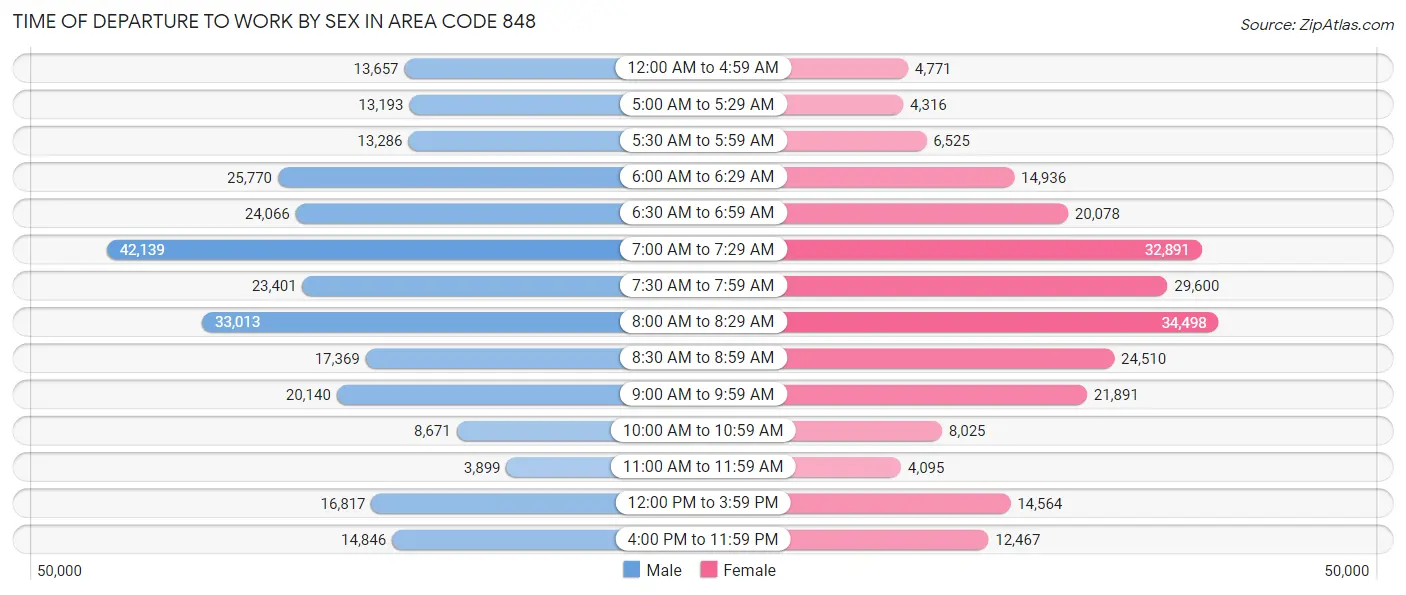
| Time of Departure | Male | Female |
| 12:00 AM to 4:59 AM | 13,657 (5.1%) | 4,771 (2.1%) |
| 5:00 AM to 5:29 AM | 13,193 (4.9%) | 4,316 (1.8%) |
| 5:30 AM to 5:59 AM | 13,286 (4.9%) | 6,525 (2.8%) |
| 6:00 AM to 6:29 AM | 25,770 (9.5%) | 14,936 (6.4%) |
| 6:30 AM to 6:59 AM | 24,066 (8.9%) | 20,078 (8.6%) |
| 7:00 AM to 7:29 AM | 42,139 (15.6%) | 32,891 (14.1%) |
| 7:30 AM to 7:59 AM | 23,401 (8.7%) | 29,600 (12.7%) |
| 8:00 AM to 8:29 AM | 33,013 (12.2%) | 34,498 (14.8%) |
| 8:30 AM to 8:59 AM | 17,369 (6.4%) | 24,510 (10.5%) |
| 9:00 AM to 9:59 AM | 20,140 (7.4%) | 21,891 (9.4%) |
| 10:00 AM to 10:59 AM | 8,671 (3.2%) | 8,025 (3.4%) |
| 11:00 AM to 11:59 AM | 3,899 (1.4%) | 4,095 (1.8%) |
| 12:00 PM to 3:59 PM | 16,817 (6.2%) | 14,564 (6.2%) |
| 4:00 PM to 11:59 PM | 14,846 (5.5%) | 12,467 (5.3%) |
| Total | 270,267 (100.0%) | 233,167 (100.0%) |
Housing Occupancy in Area Code 848
Occupancy by Ownership in Area Code 848
Of the total 456,120 dwellings in Area Code 848, owner-occupied units account for 280,804 (61.6%), while renter-occupied units make up 175,316 (38.4%).
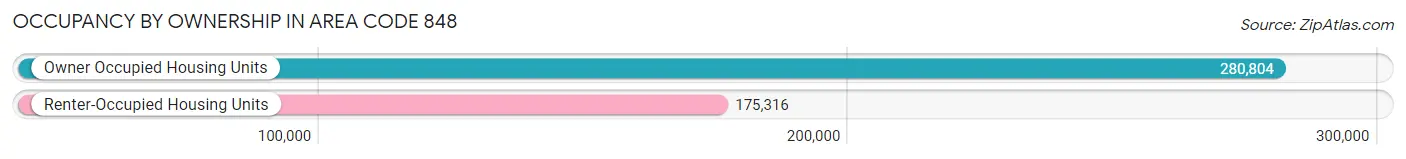
| Occupancy | # Housing Units | % Housing Units |
| Owner Occupied Housing Units | 280,804 | 61.6% |
| Renter-Occupied Housing Units | 175,316 | 38.4% |
| Total Occupied Housing Units | 456,120 | 100.0% |
Occupancy by Household Size in Area Code 848
| Household Size | # Housing Units | % Housing Units |
| 1-Person Household | 129,085 | 28.3% |
| 2-Person Household | 138,904 | 30.4% |
| 3-Person Household | 72,115 | 15.8% |
| 4+ Person Household | 116,016 | 25.4% |
| Total Housing Units | 456,120 | 100.0% |
Occupancy by Ownership by Household Size in Area Code 848
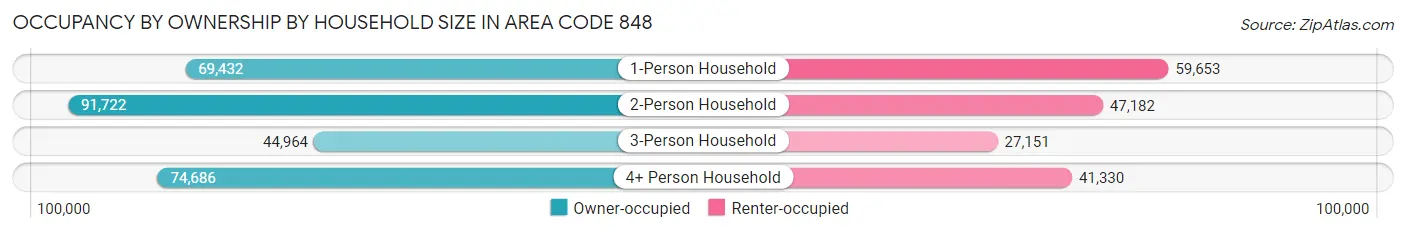
| Household Size | Owner-occupied | Renter-occupied |
| 1-Person Household | 69,432 (53.8%) | 59,653 (46.2%) |
| 2-Person Household | 91,722 (66.0%) | 47,182 (34.0%) |
| 3-Person Household | 44,964 (62.4%) | 27,151 (37.7%) |
| 4+ Person Household | 74,686 (64.4%) | 41,330 (35.6%) |
| Total Housing Units | 280,804 (61.6%) | 175,316 (38.4%) |
Occupancy by Educational Attainment in Area Code 848
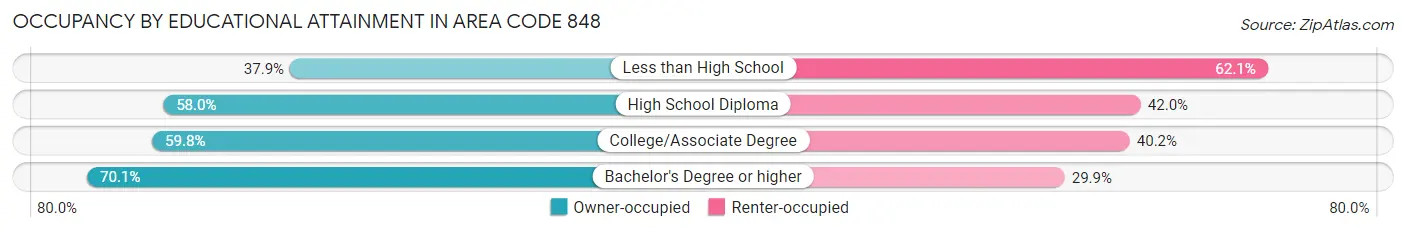
| Household Size | Owner-occupied | Renter-occupied |
| Less than High School | 16,424 (37.9%) | 26,893 (62.1%) |
| High School Diploma | 65,509 (58.0%) | 47,416 (42.0%) |
| College/Associate Degree | 65,321 (59.8%) | 43,978 (40.2%) |
| Bachelor's Degree or higher | 133,550 (70.1%) | 57,029 (29.9%) |
Occupancy by Age of Householder in Area Code 848
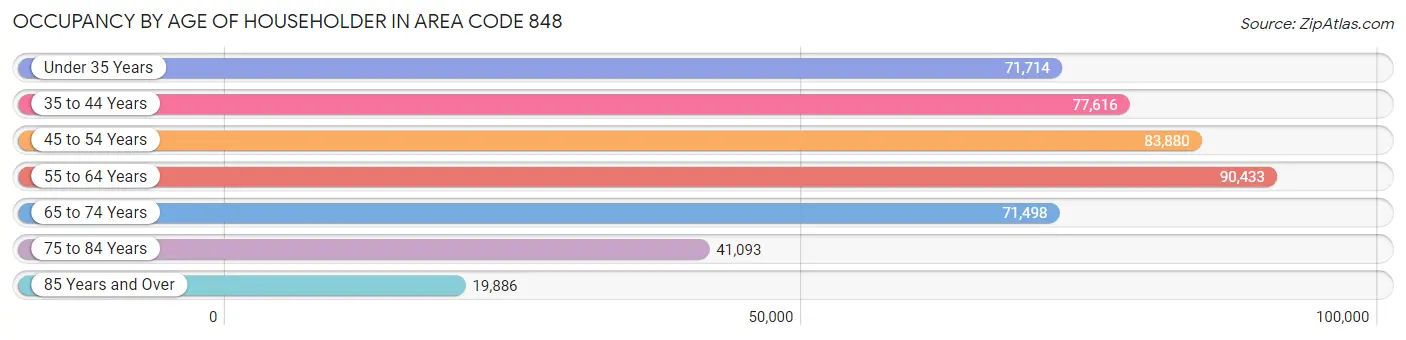
| Age Bracket | # Households | % Households |
| Under 35 Years | 71,714 | 15.7% |
| 35 to 44 Years | 77,616 | 17.0% |
| 45 to 54 Years | 83,880 | 18.4% |
| 55 to 64 Years | 90,433 | 19.8% |
| 65 to 74 Years | 71,498 | 15.7% |
| 75 to 84 Years | 41,093 | 9.0% |
| 85 Years and Over | 19,886 | 4.4% |
| Total | 456,120 | 100.0% |
Housing Finances in Area Code 848
Median Income by Occupancy in Area Code 848
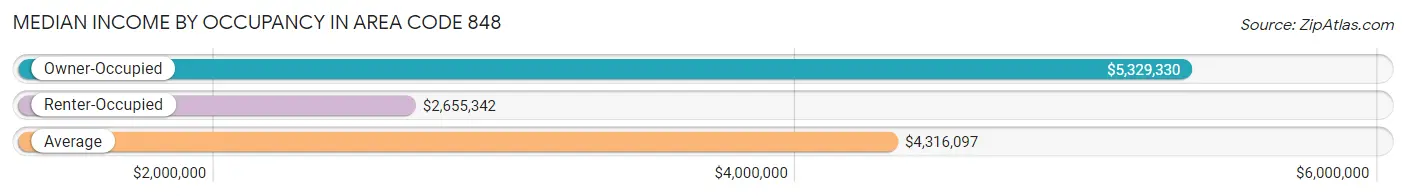
| Occupancy Type | # Households | Median Income |
| Owner-Occupied | 280,804 (61.6%) | $5,329,330 |
| Renter-Occupied | 175,316 (38.4%) | $2,655,342 |
| Average | 456,120 (100.0%) | $4,316,097 |
Occupancy by Householder Income Bracket in Area Code 848
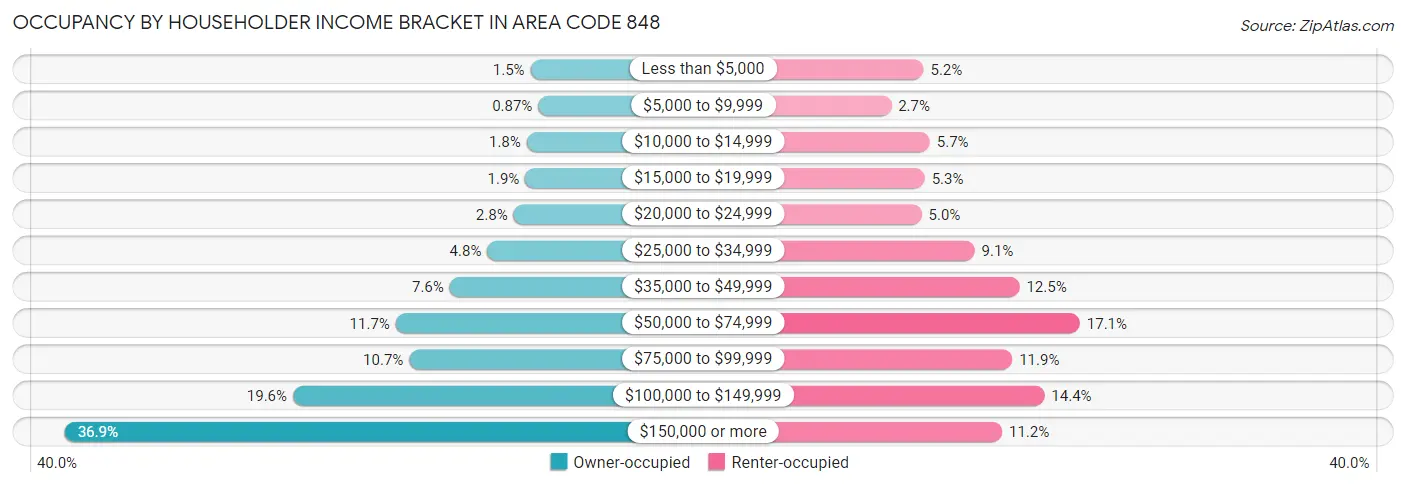
| Income Bracket | Owner-occupied | Renter-occupied |
| Less than $5,000 | 4,094 (1.5%) | 9,073 (5.2%) |
| $5,000 to $9,999 | 2,442 (0.9%) | 4,772 (2.7%) |
| $10,000 to $14,999 | 4,916 (1.8%) | 9,924 (5.7%) |
| $15,000 to $19,999 | 5,227 (1.9%) | 9,231 (5.3%) |
| $20,000 to $24,999 | 7,731 (2.8%) | 8,826 (5.0%) |
| $25,000 to $34,999 | 13,329 (4.8%) | 15,901 (9.1%) |
| $35,000 to $49,999 | 21,405 (7.6%) | 21,891 (12.5%) |
| $50,000 to $74,999 | 32,935 (11.7%) | 29,965 (17.1%) |
| $75,000 to $99,999 | 30,047 (10.7%) | 20,939 (11.9%) |
| $100,000 to $149,999 | 54,936 (19.6%) | 25,234 (14.4%) |
| $150,000 or more | 103,742 (36.9%) | 19,560 (11.2%) |
| Total | 280,804 (100.0%) | 175,316 (100.0%) |
Monthly Housing Cost Tiers in Area Code 848
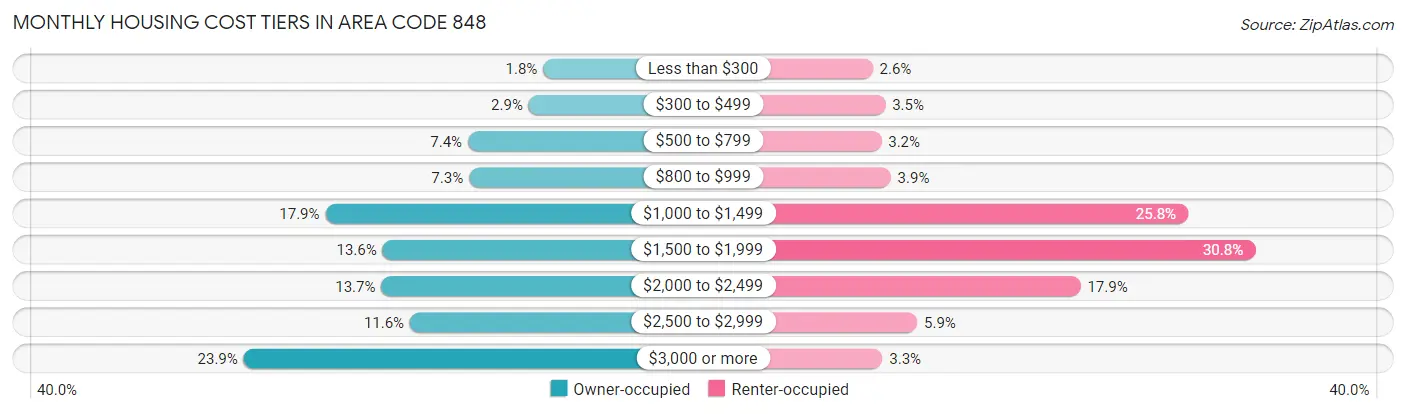
| Monthly Cost | Owner-occupied | Renter-occupied |
| Less than $300 | 5,078 (1.8%) | 4,542 (2.6%) |
| $300 to $499 | 8,055 (2.9%) | 6,169 (3.5%) |
| $500 to $799 | 20,626 (7.3%) | 5,658 (3.2%) |
| $800 to $999 | 20,413 (7.3%) | 6,870 (3.9%) |
| $1,000 to $1,499 | 50,131 (17.8%) | 45,247 (25.8%) |
| $1,500 to $1,999 | 38,297 (13.6%) | 53,915 (30.7%) |
| $2,000 to $2,499 | 38,548 (13.7%) | 31,381 (17.9%) |
| $2,500 to $2,999 | 32,641 (11.6%) | 10,294 (5.9%) |
| $3,000 or more | 67,015 (23.9%) | 5,806 (3.3%) |
| Total | 280,804 (100.0%) | 175,316 (100.0%) |
Physical Housing Characteristics in Area Code 848
Housing Structures in Area Code 848
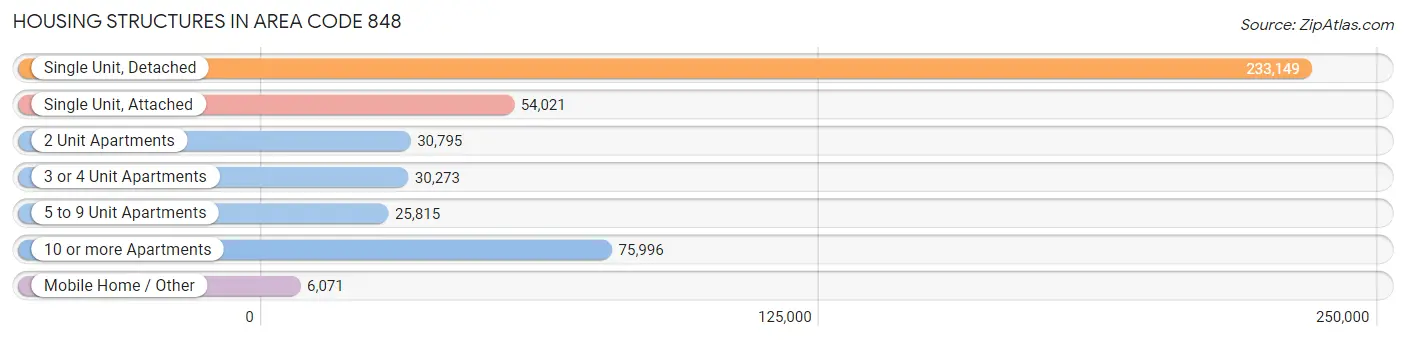
| Structure Type | # Housing Units | % Housing Units |
| Single Unit, Detached | 233,149 | 51.1% |
| Single Unit, Attached | 54,021 | 11.8% |
| 2 Unit Apartments | 30,795 | 6.8% |
| 3 or 4 Unit Apartments | 30,273 | 6.6% |
| 5 to 9 Unit Apartments | 25,815 | 5.7% |
| 10 or more Apartments | 75,996 | 16.7% |
| Mobile Home / Other | 6,071 | 1.3% |
| Total | 456,120 | 100.0% |
Housing Structures by Occupancy in Area Code 848
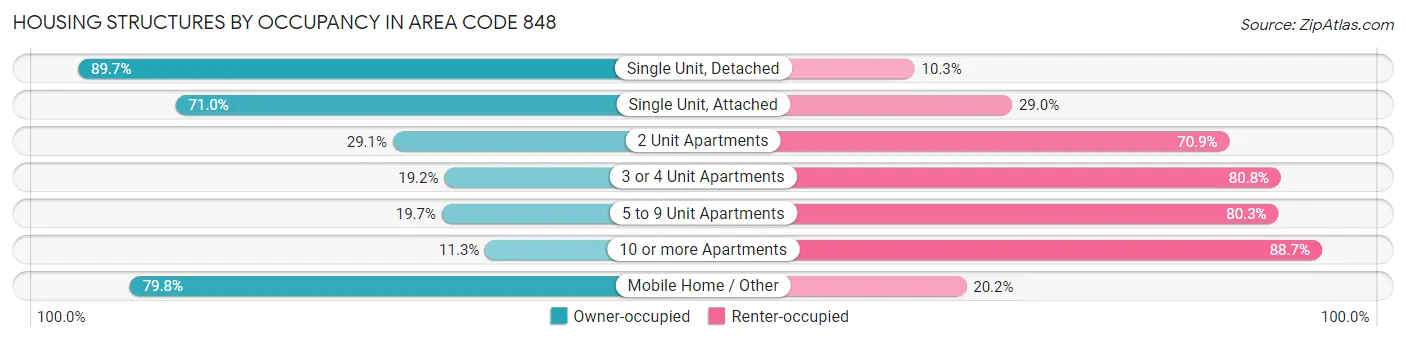
| Structure Type | Owner-occupied | Renter-occupied |
| Single Unit, Detached | 209,164 (89.7%) | 23,985 (10.3%) |
| Single Unit, Attached | 38,335 (71.0%) | 15,686 (29.0%) |
| 2 Unit Apartments | 8,965 (29.1%) | 21,830 (70.9%) |
| 3 or 4 Unit Apartments | 5,810 (19.2%) | 24,463 (80.8%) |
| 5 to 9 Unit Apartments | 5,078 (19.7%) | 20,737 (80.3%) |
| 10 or more Apartments | 8,610 (11.3%) | 67,386 (88.7%) |
| Mobile Home / Other | 4,842 (79.8%) | 1,229 (20.2%) |
| Total | 280,804 (61.6%) | 175,316 (38.4%) |
Housing Structures by Number of Rooms in Area Code 848
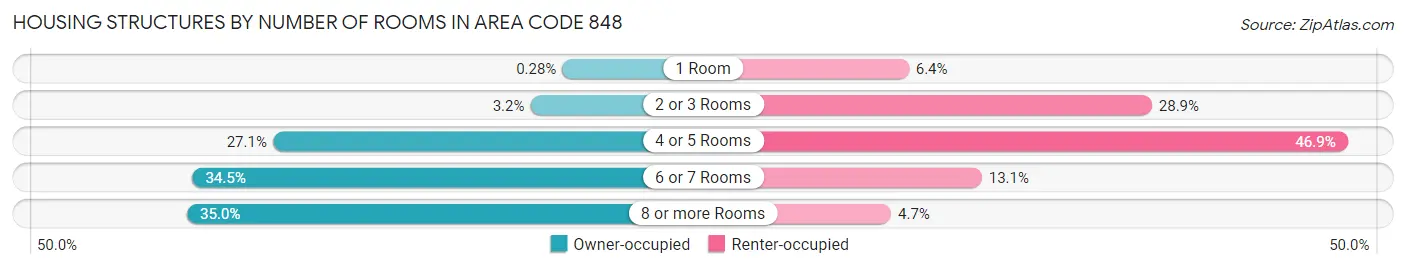
| Number of Rooms | Owner-occupied | Renter-occupied |
| 1 Room | 797 (0.3%) | 11,160 (6.4%) |
| 2 or 3 Rooms | 9,080 (3.2%) | 50,577 (28.8%) |
| 4 or 5 Rooms | 75,945 (27.1%) | 82,287 (46.9%) |
| 6 or 7 Rooms | 96,781 (34.5%) | 22,998 (13.1%) |
| 8 or more Rooms | 98,201 (35.0%) | 8,294 (4.7%) |
| Total | 280,804 (100.0%) | 175,316 (100.0%) |
Housing Structure by Heating Type in Area Code 848
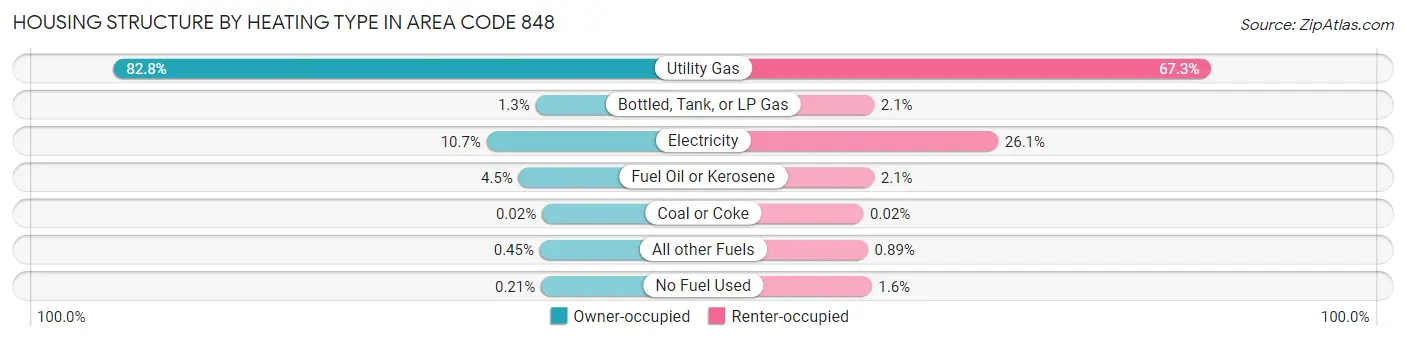
| Heating Type | Owner-occupied | Renter-occupied |
| Utility Gas | 232,603 (82.8%) | 117,931 (67.3%) |
| Bottled, Tank, or LP Gas | 3,536 (1.3%) | 3,645 (2.1%) |
| Electricity | 30,075 (10.7%) | 45,675 (26.1%) |
| Fuel Oil or Kerosene | 12,695 (4.5%) | 3,647 (2.1%) |
| Coal or Coke | 51 (0.0%) | 43 (0.0%) |
| All other Fuels | 1,257 (0.4%) | 1,556 (0.9%) |
| No Fuel Used | 587 (0.2%) | 2,819 (1.6%) |
| Total | 280,804 (100.0%) | 175,316 (100.0%) |
Household Vehicle Usage in Area Code 848
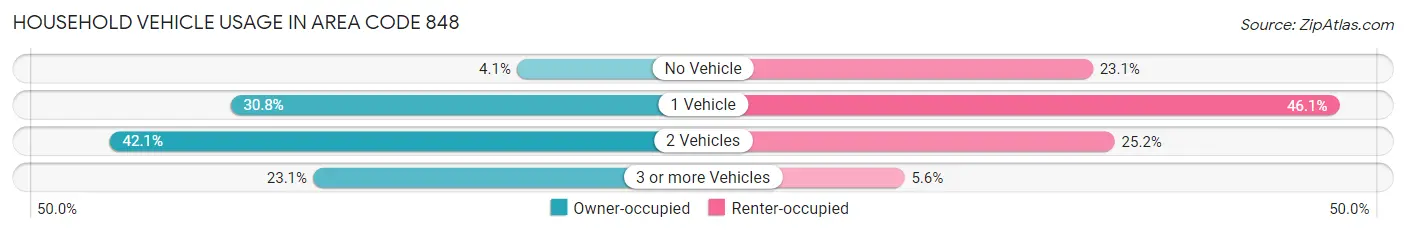
| Vehicles per Household | Owner-occupied | Renter-occupied |
| No Vehicle | 11,402 (4.1%) | 40,546 (23.1%) |
| 1 Vehicle | 86,439 (30.8%) | 80,885 (46.1%) |
| 2 Vehicles | 118,117 (42.1%) | 44,141 (25.2%) |
| 3 or more Vehicles | 64,846 (23.1%) | 9,744 (5.6%) |
| Total | 280,804 (100.0%) | 175,316 (100.0%) |
Real Estate & Mortgages in Area Code 848
Real Estate and Mortgage Overview in Area Code 848
| Characteristic | Without Mortgage | With Mortgage |
| Housing Units | 104,871 | 175,933 |
| Median Property Value | $18,368,500 | $19,962,100 |
| Median Household Income | $3,795,202 | $79,130 |
| Monthly Housing Costs | $50,133 | $65,813 |
| Real Estate Taxes | $361,959 | $3,166 |
Property Value by Mortgage Status in Area Code 848
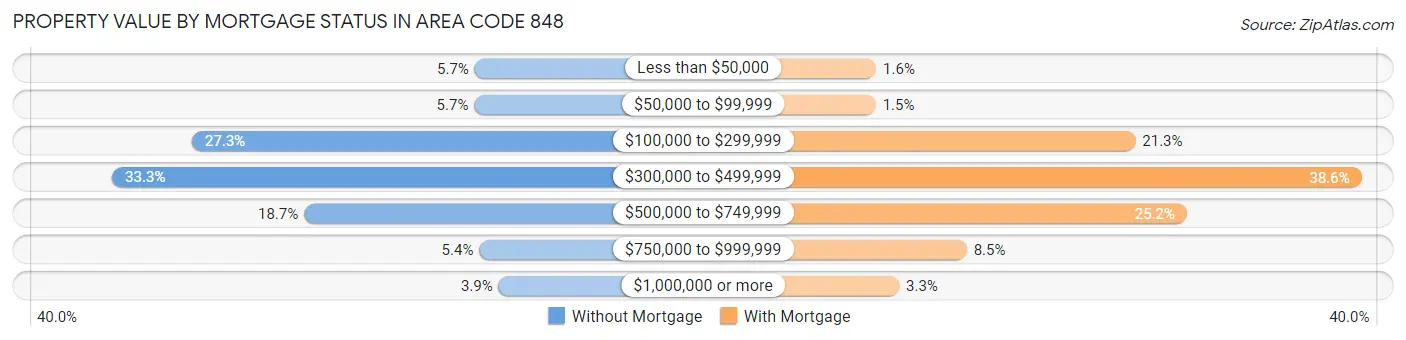
| Property Value | Without Mortgage | With Mortgage |
| Less than $50,000 | 5,987 (5.7%) | 2,758 (1.6%) |
| $50,000 to $99,999 | 6,021 (5.7%) | 2,702 (1.5%) |
| $100,000 to $299,999 | 28,578 (27.3%) | 37,506 (21.3%) |
| $300,000 to $499,999 | 34,957 (33.3%) | 67,816 (38.6%) |
| $500,000 to $749,999 | 19,624 (18.7%) | 44,412 (25.2%) |
| $750,000 to $999,999 | 5,620 (5.4%) | 14,896 (8.5%) |
| $1,000,000 or more | 4,084 (3.9%) | 5,843 (3.3%) |
| Total | 104,871 (100.0%) | 175,933 (100.0%) |
Household Income by Mortgage Status in Area Code 848
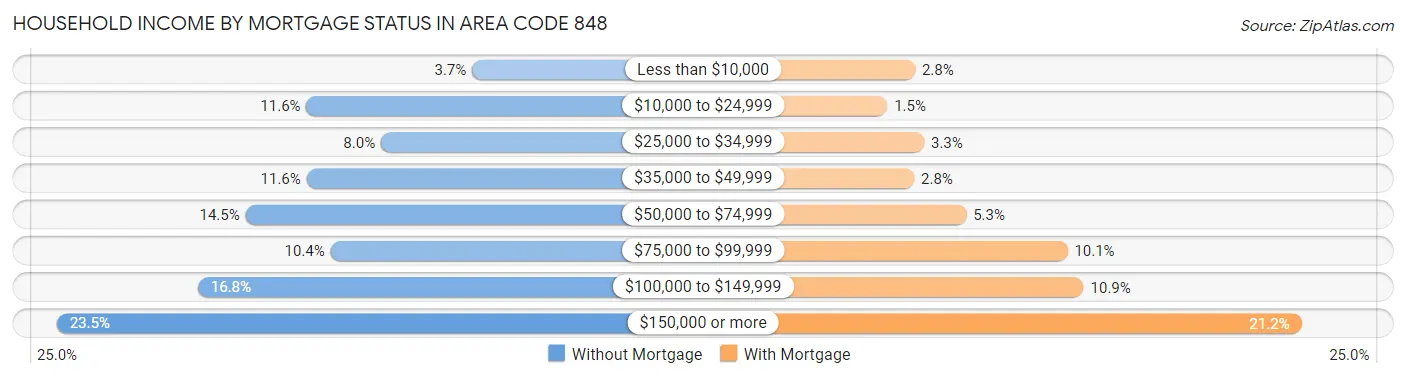
| Household Income | Without Mortgage | With Mortgage |
| Less than $10,000 | 3,873 (3.7%) | 4,971 (2.8%) |
| $10,000 to $24,999 | 12,139 (11.6%) | 2,663 (1.5%) |
| $25,000 to $34,999 | 8,424 (8.0%) | 5,735 (3.3%) |
| $35,000 to $49,999 | 12,138 (11.6%) | 4,905 (2.8%) |
| $50,000 to $74,999 | 15,190 (14.5%) | 9,267 (5.3%) |
| $75,000 to $99,999 | 10,933 (10.4%) | 17,745 (10.1%) |
| $100,000 to $149,999 | 17,562 (16.8%) | 19,114 (10.9%) |
| $150,000 or more | 24,612 (23.5%) | 37,374 (21.2%) |
| Total | 104,871 (100.0%) | 175,933 (100.0%) |
Property Value to Household Income Ratio in Area Code 848
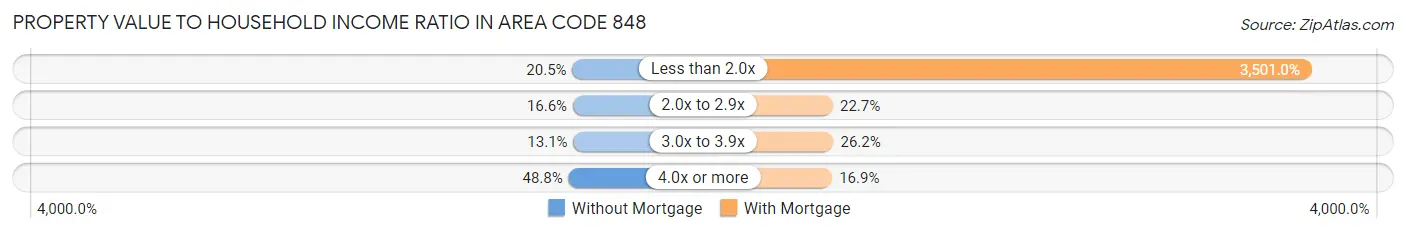
| Value-to-Income Ratio | Without Mortgage | With Mortgage |
| Less than 2.0x | 21,453 (20.5%) | 6,159,404 (3,501.0%) |
| 2.0x to 2.9x | 17,367 (16.6%) | 39,841 (22.7%) |
| 3.0x to 3.9x | 13,696 (13.1%) | 46,082 (26.2%) |
| 4.0x or more | 51,150 (48.8%) | 29,664 (16.9%) |
| Total | 104,871 (100.0%) | 175,933 (100.0%) |
Real Estate Taxes by Mortgage Status in Area Code 848
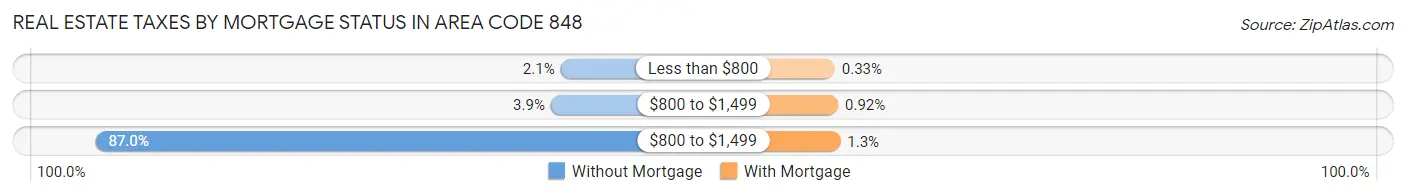
| Property Taxes | Without Mortgage | With Mortgage |
| Less than $800 | 2,219 (2.1%) | 586 (0.3%) |
| $800 to $1,499 | 4,087 (3.9%) | 1,615 (0.9%) |
| $800 to $1,499 | 91,270 (87.0%) | 2,337 (1.3%) |
| Total | 104,871 (100.0%) | 175,933 (100.0%) |
Health & Disability in Area Code 848
Health Insurance Coverage by Age in Area Code 848
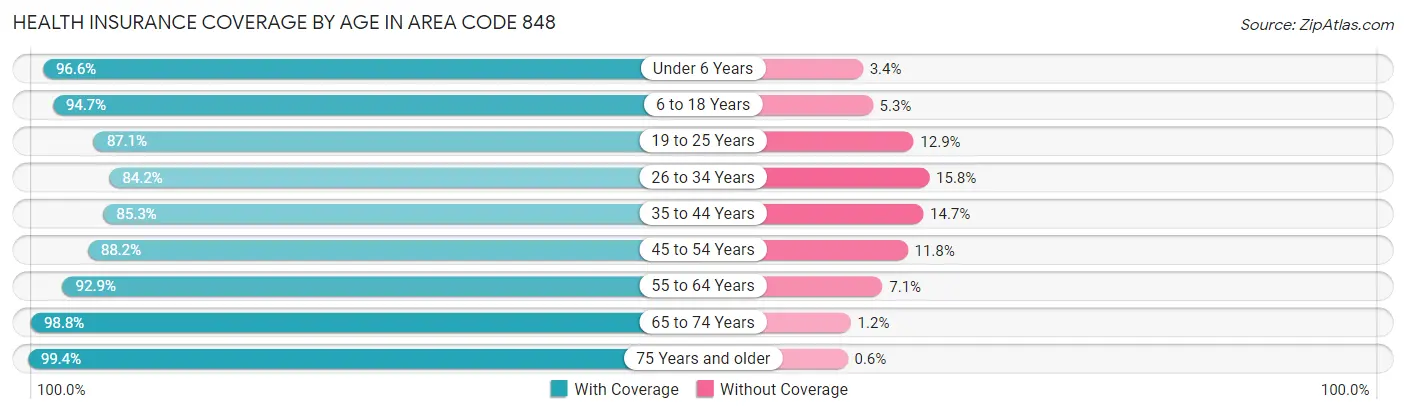
| Age Bracket | With Coverage | Without Coverage |
| Under 6 Years | 94,403 (96.6%) | 3,351 (3.4%) |
| 6 to 18 Years | 203,480 (94.7%) | 11,342 (5.3%) |
| 19 to 25 Years | 96,858 (87.1%) | 14,329 (12.9%) |
| 26 to 34 Years | 120,877 (84.2%) | 22,714 (15.8%) |
| 35 to 44 Years | 130,966 (85.3%) | 22,572 (14.7%) |
| 45 to 54 Years | 133,331 (88.2%) | 17,819 (11.8%) |
| 55 to 64 Years | 144,800 (92.9%) | 11,072 (7.1%) |
| 65 to 74 Years | 113,705 (98.8%) | 1,366 (1.2%) |
| 75 Years and older | 88,500 (99.4%) | 532 (0.6%) |
| Total | 1,126,920 (91.5%) | 105,097 (8.5%) |
Health Insurance Coverage by Citizenship Status in Area Code 848
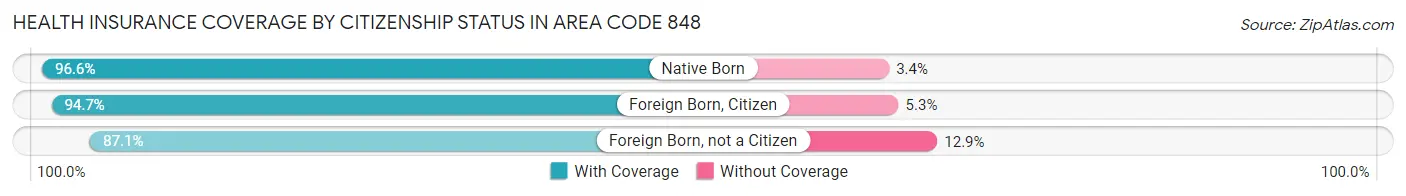
| Citizenship Status | With Coverage | Without Coverage |
| Native Born | 94,403 (96.6%) | 3,351 (3.4%) |
| Foreign Born, Citizen | 203,480 (94.7%) | 11,342 (5.3%) |
| Foreign Born, not a Citizen | 96,858 (87.1%) | 14,329 (12.9%) |
Health Insurance Coverage by Household Income in Area Code 848
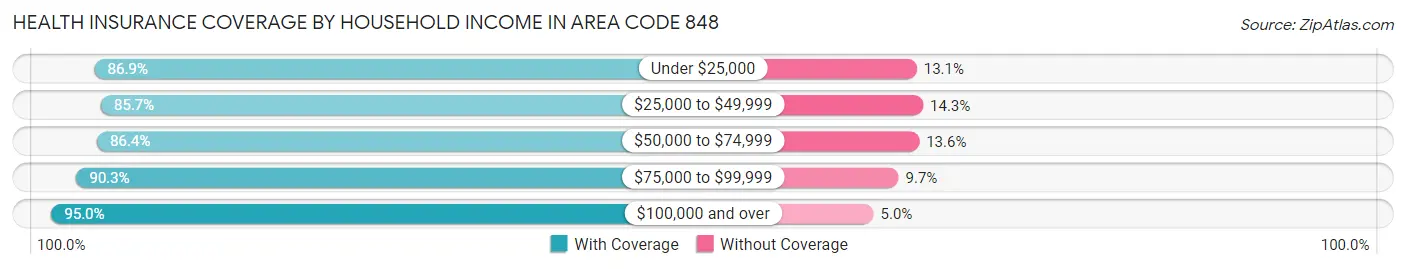
| Household Income | With Coverage | Without Coverage |
| Under $25,000 | 102,514 (86.9%) | 15,483 (13.1%) |
| $25,000 to $49,999 | 136,412 (85.7%) | 22,758 (14.3%) |
| $50,000 to $74,999 | 132,563 (86.4%) | 20,817 (13.6%) |
| $75,000 to $99,999 | 121,622 (90.3%) | 13,058 (9.7%) |
| $100,000 and over | 615,644 (95.0%) | 32,555 (5.0%) |
Public vs Private Health Insurance Coverage by Age in Area Code 848
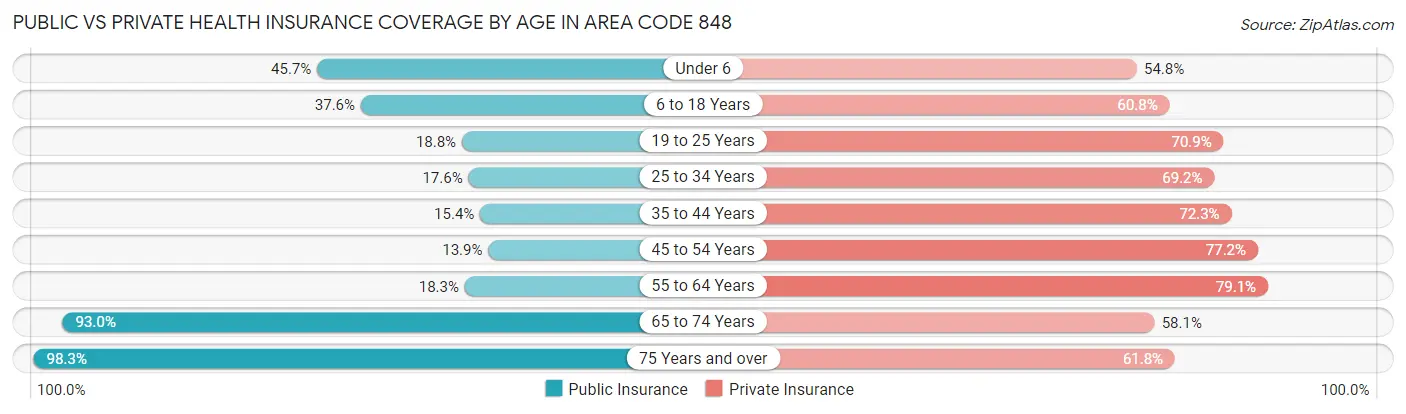
| Age Bracket | Public Insurance | Private Insurance |
| Under 6 | 44,688 (45.7%) | 53,578 (54.8%) |
| 6 to 18 Years | 80,749 (37.6%) | 130,666 (60.8%) |
| 19 to 25 Years | 20,924 (18.8%) | 78,779 (70.9%) |
| 25 to 34 Years | 25,286 (17.6%) | 99,288 (69.2%) |
| 35 to 44 Years | 23,705 (15.4%) | 111,042 (72.3%) |
| 45 to 54 Years | 21,058 (13.9%) | 116,717 (77.2%) |
| 55 to 64 Years | 28,514 (18.3%) | 123,282 (79.1%) |
| 65 to 74 Years | 106,972 (93.0%) | 66,846 (58.1%) |
| 75 Years and over | 87,547 (98.3%) | 55,051 (61.8%) |
| Total | 439,443 (35.7%) | 835,249 (67.8%) |
Disability Status by Sex by Age in Area Code 848
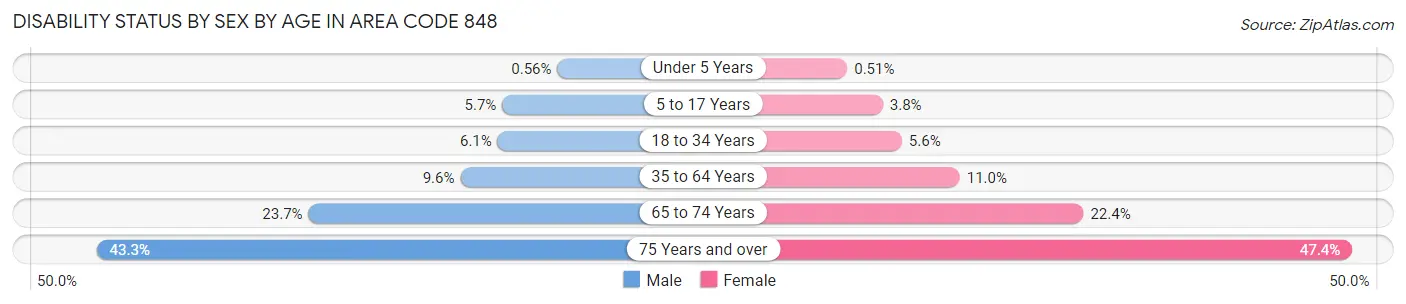
| Age Bracket | Male | Female |
| Under 5 Years | 235 (0.6%) | 200 (0.5%) |
| 5 to 17 Years | 6,175 (5.7%) | 4,024 (3.8%) |
| 18 to 34 Years | 8,396 (6.1%) | 7,469 (5.6%) |
| 35 to 64 Years | 21,946 (9.6%) | 25,280 (11.0%) |
| 65 to 74 Years | 12,300 (23.7%) | 14,150 (22.4%) |
| 75 Years and over | 14,875 (43.3%) | 25,902 (47.4%) |
Disability Class by Sex by Age in Area Code 848
Disability Class: Hearing Difficulty
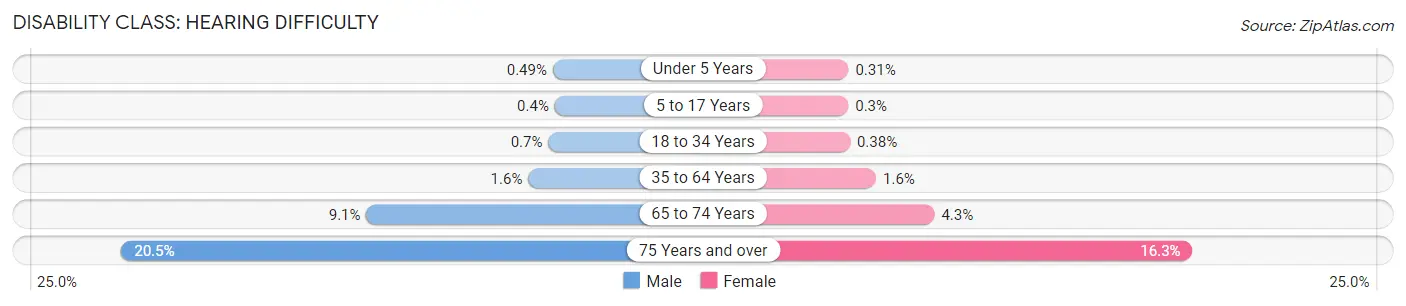
| Age Bracket | Male | Female |
| Under 5 Years | 206 (0.5%) | 124 (0.3%) |
| 5 to 17 Years | 439 (0.4%) | 320 (0.3%) |
| 18 to 34 Years | 958 (0.7%) | 504 (0.4%) |
| 35 to 64 Years | 3,735 (1.6%) | 3,663 (1.6%) |
| 65 to 74 Years | 4,752 (9.1%) | 2,711 (4.3%) |
| 75 Years and over | 7,045 (20.5%) | 8,899 (16.3%) |
Disability Class: Vision Difficulty
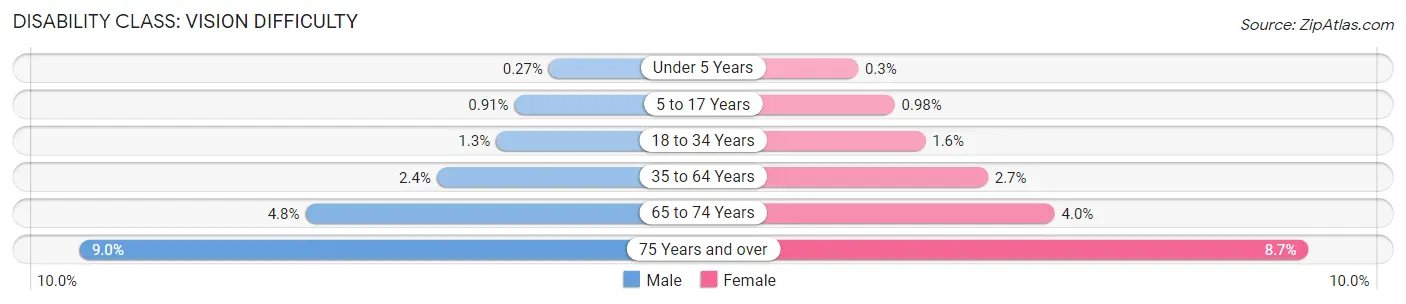
| Age Bracket | Male | Female |
| Under 5 Years | 115 (0.3%) | 119 (0.3%) |
| 5 to 17 Years | 991 (0.9%) | 1,037 (1.0%) |
| 18 to 34 Years | 1,715 (1.3%) | 2,068 (1.5%) |
| 35 to 64 Years | 5,393 (2.4%) | 6,250 (2.7%) |
| 65 to 74 Years | 2,488 (4.8%) | 2,489 (4.0%) |
| 75 Years and over | 3,088 (9.0%) | 4,736 (8.7%) |
Disability Class: Cognitive Difficulty
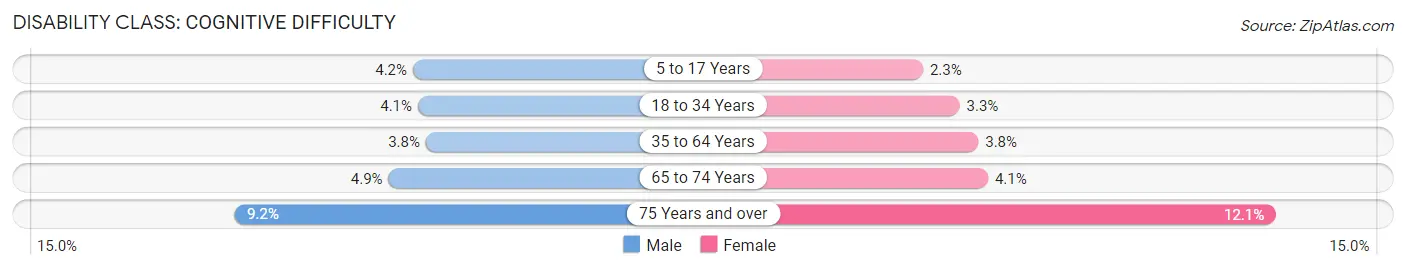
| Age Bracket | Male | Female |
| 5 to 17 Years | 4,552 (4.2%) | 2,393 (2.3%) |
| 18 to 34 Years | 5,577 (4.1%) | 4,384 (3.3%) |
| 35 to 64 Years | 8,788 (3.8%) | 8,769 (3.8%) |
| 65 to 74 Years | 2,529 (4.9%) | 2,565 (4.1%) |
| 75 Years and over | 3,150 (9.2%) | 6,609 (12.1%) |
Disability Class: Ambulatory Difficulty
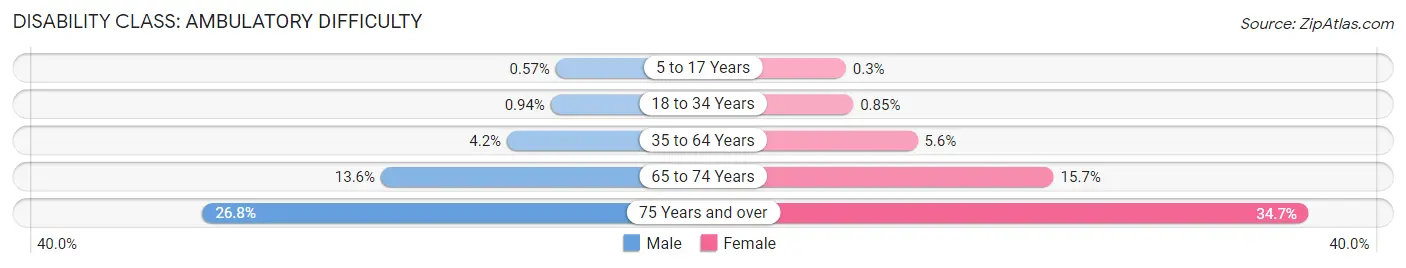
| Age Bracket | Male | Female |
| 5 to 17 Years | 616 (0.6%) | 315 (0.3%) |
| 18 to 34 Years | 1,293 (0.9%) | 1,131 (0.9%) |
| 35 to 64 Years | 9,631 (4.2%) | 12,977 (5.6%) |
| 65 to 74 Years | 7,043 (13.6%) | 9,925 (15.7%) |
| 75 Years and over | 9,203 (26.8%) | 18,953 (34.7%) |
Disability Class: Self-Care Difficulty
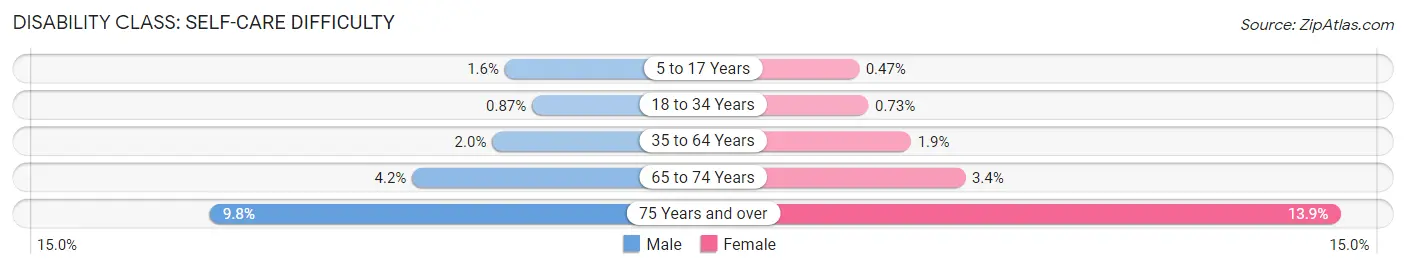
| Age Bracket | Male | Female |
| 5 to 17 Years | 1,777 (1.6%) | 498 (0.5%) |
| 18 to 34 Years | 1,198 (0.9%) | 974 (0.7%) |
| 35 to 64 Years | 4,556 (2.0%) | 4,432 (1.9%) |
| 65 to 74 Years | 2,190 (4.2%) | 2,166 (3.4%) |
| 75 Years and over | 3,379 (9.8%) | 7,586 (13.9%) |
Technology Access in Area Code 848
Computing Device Access in Area Code 848
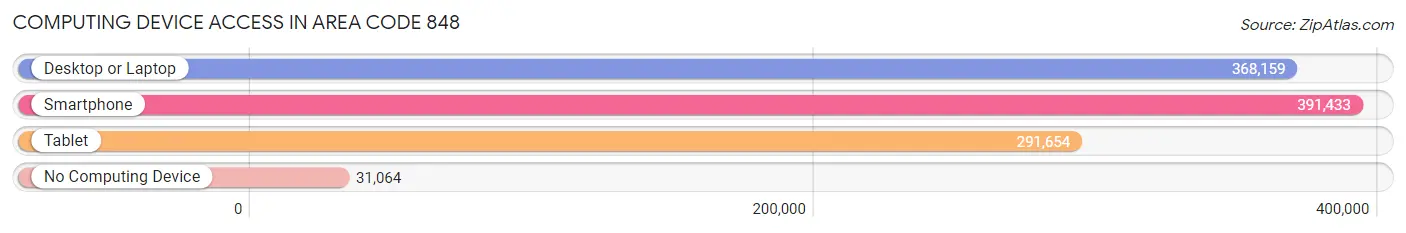
| Device Type | # Households | % Households |
| Desktop or Laptop | 368,159 | 80.7% |
| Smartphone | 391,433 | 85.8% |
| Tablet | 291,654 | 63.9% |
| No Computing Device | 31,064 | 6.8% |
| Total | 456,120 | 100.0% |
Internet Access in Area Code 848
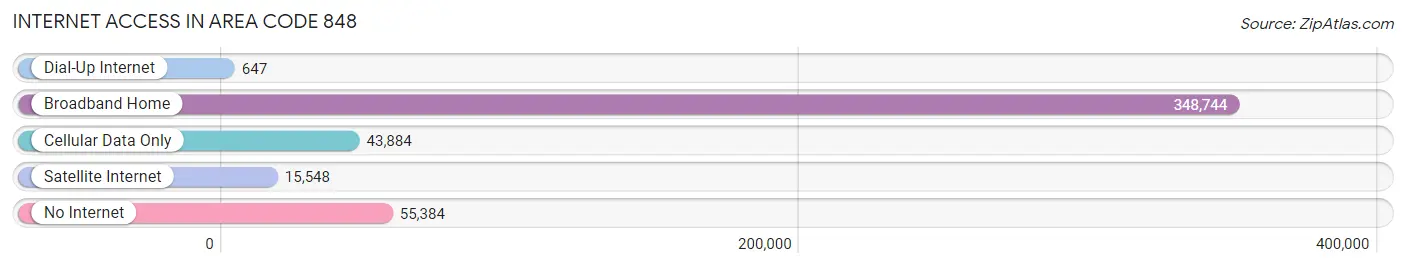
| Internet Type | # Households | % Households |
| Dial-Up Internet | 647 | 0.1% |
| Broadband Home | 348,744 | 76.5% |
| Cellular Data Only | 43,884 | 9.6% |
| Satellite Internet | 15,548 | 3.4% |
| No Internet | 55,384 | 12.1% |
| Total | 456,120 | 100.0% |
Area Code 848 Summary
Geography
Area code 848 is a telephone area code in the North American Numbering Plan (NANP) for the state of New Jersey. It serves the central and eastern parts of the state, including the cities of Asbury Park, Freehold, Long Branch, and Toms River.
Social
Area code 848 is home to a diverse population of people from all walks of life. The area is known for its vibrant arts and culture scene, with many galleries, museums, and performance venues. The area is also home to a number of universities and colleges, including Rutgers University and Monmouth University.
Economics
Area code 848 is a major economic hub in New Jersey. The area is home to a number of large corporations, including Johnson & Johnson, Merck, and Prudential Financial. The area is also home to a number of small businesses, including restaurants, retail stores, and professional services.
Demographics
Area code 848 is home to a population of over 1.2 million people. The area is predominantly white, with a large Hispanic population. The median household income is around $70,000, and the median home value is around $250,000. The area is also home to a large number of college students, making it a vibrant and diverse community.
Common Questions
What is Per Capita Income in Area Code 848?
Per Capita income in Area Code 848 is $49,842.
What is the Median Family Income in Area Code 848?
Median Family Income in Area Code 848 is $120,079.
What is the Median Household income in Area Code 848?
Median Household Income in Area Code 848 is $98,093.
What is Income or Wage Gap in Area Code 848?
Income or Wage Gap in Area Code 848 is 33.4%.
Women in Area Code 848 earn 66.6 cents for every dollar earned by a man.
What is Family Income Deficit in Area Code 848?
Family Income Deficit in Area Code 848 is $10,530.
Families that are below poverty line in Area Code 848 earn $10,530 less on average than the poverty threshold level.
What is Inequality or Gini Index in Area Code 848?
Inequality or Gini Index in Area Code 848 is 19.72.
What is the Total Population of Area Code 848?
Total Population of Area Code 848 is 1,247,396.
What is the Total Male Population of Area Code 848?
Total Male Population of Area Code 848 is 615,443.
What is the Total Female Population of Area Code 848?
Total Female Population of Area Code 848 is 631,953.
What is the Ratio of Males per 100 Females in Area Code 848?
There are 97.39 Males per 100 Females in Area Code 848.
What is the Ratio of Females per 100 Males in Area Code 848?
There are 102.68 Females per 100 Males in Area Code 848.
What is the Median Population Age in Area Code 848?
Median Population Age in Area Code 848 is 40.8 Years.
What is the Average Family Size in Area Code 848
Average Family Size in Area Code 848 is 3.2 People.
What is the Average Household Size in Area Code 848
Average Household Size in Area Code 848 is 2.6 People.
How Large is the Labor Force in Area Code 848?
There are 635,099 People in the Labor Forcein in Area Code 848.
What is the Percentage of People in the Labor Force in Area Code 848?
64.5% of People are in the Labor Force in Area Code 848.
What is the Unemployment Rate in Area Code 848?
Unemployment Rate in Area Code 848 is 5.9%.