Area Code 602 Map & Demographics
Area Code 602 Map
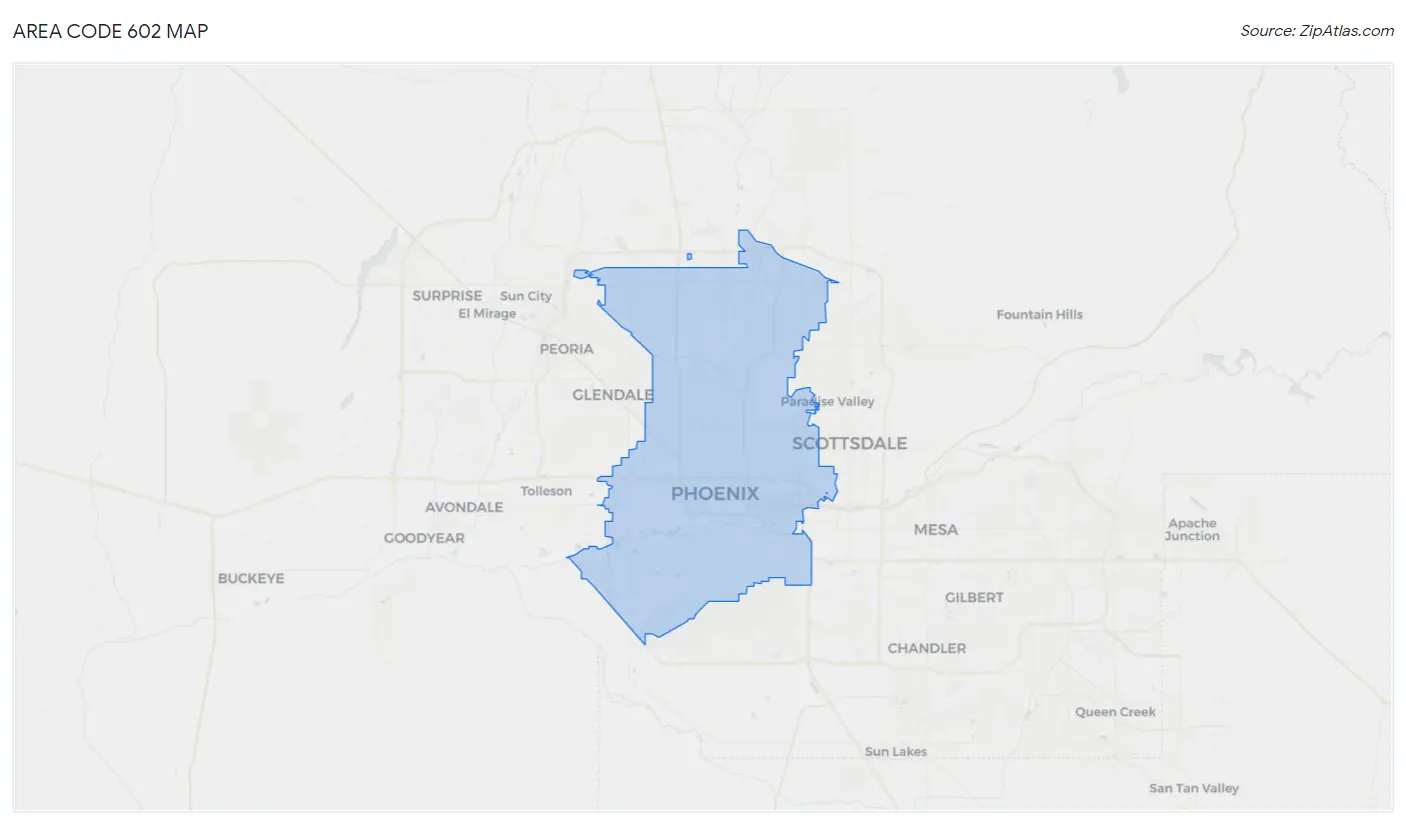
Area Code 602 Overview
$42,705
PER CAPITA INCOME
$92,445
AVG FAMILY INCOME
$78,257
AVG HOUSEHOLD INCOME
19.5%
WAGE / INCOME GAP [ % ]
80.5¢/ $1
WAGE / INCOME GAP [ $ ]
$11,928
FAMILY INCOME DEFICIT
23.12
INEQUALITY / GINI INDEX
1,833,033
TOTAL POPULATION
925,658
MALE POPULATION
907,375
FEMALE POPULATION
102.01
MALES / 100 FEMALES
98.02
FEMALES / 100 MALES
36.4
MEDIAN AGE
3.2
AVG FAMILY SIZE
2.6
AVG HOUSEHOLD SIZE
974,798
LABOR FORCE [ PEOPLE ]
66.5%
PERCENT IN LABOR FORCE
5.3%
UNEMPLOYMENT RATE
Income in Area Code 602
Income Overview in Area Code 602
Per Capita Income in Area Code 602 is $42,705, while median incomes of families and households are $92,445 and $78,257 respectively.
| Characteristic | Number | Measure |
| Per Capita Income | 1,833,033 | $42,705 |
| Median Family Income | 418,558 | $92,445 |
| Mean Family Income | 418,558 | $6,246,892 |
| Median Household Income | 702,142 | $78,257 |
| Mean Household Income | 702,142 | $5,402,831 |
| Income Deficit | 418,558 | $11,928 |
| Wage / Income Gap (%) | 1,833,033 | 19.48% |
| Wage / Income Gap ($) | 1,833,033 | 80.53¢ per $1 |
| Gini / Inequality Index | 1,833,033 | 23.12 |
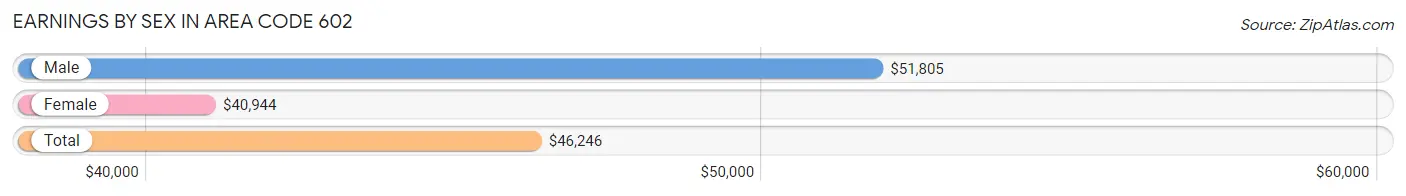
Earnings by Sex in Area Code 602
Average Earnings in Area Code 602 are $46,246, $51,805 for men and $40,944 for women, a difference of 21.0%.
| Sex | Number | Average Earnings |
| Male | 555,164 (54.3%) | $51,805 |
| Female | 466,837 (45.7%) | $40,944 |
| Total | 1,022,001 (100.0%) | $46,246 |
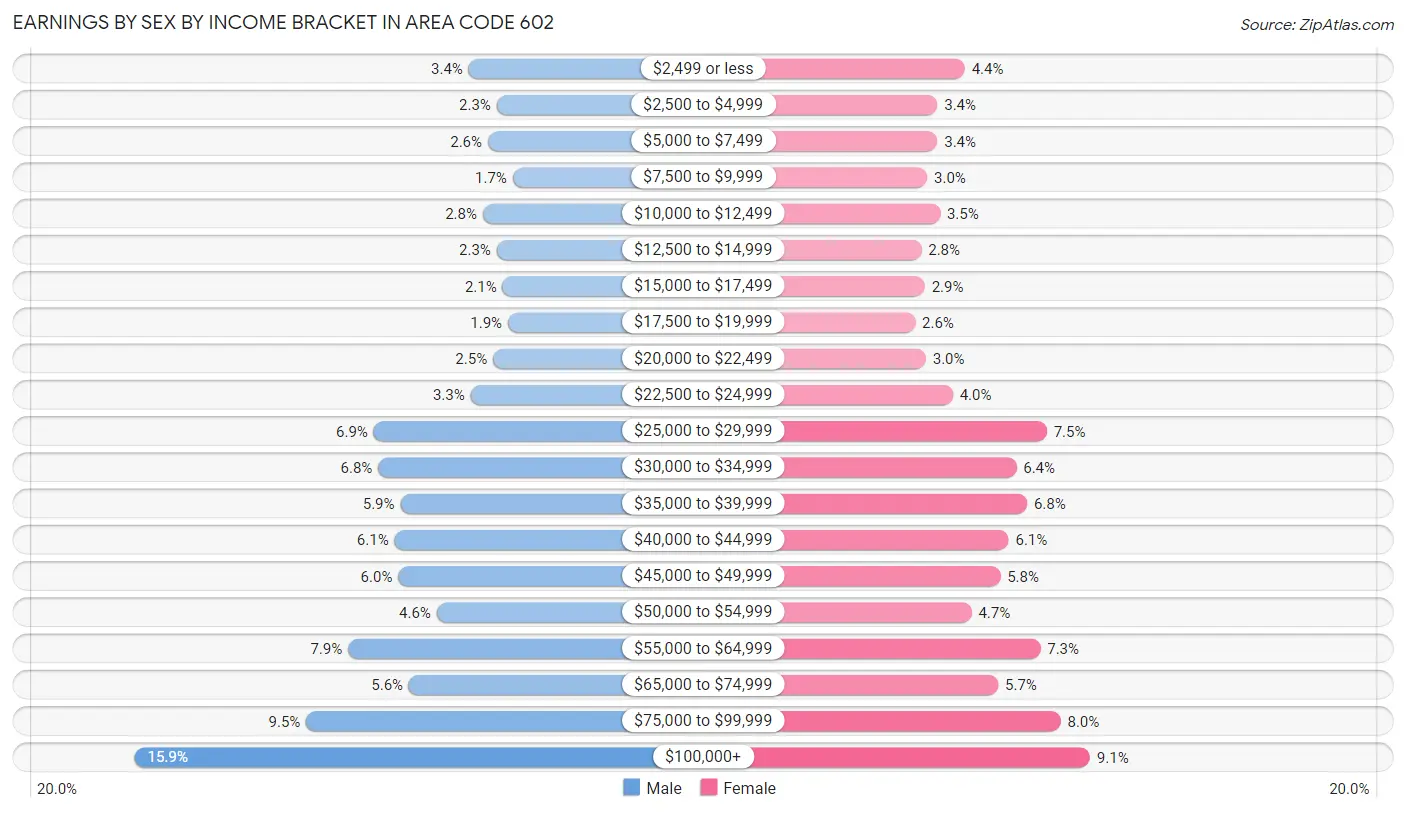
Earnings by Sex by Income Bracket in Area Code 602
The most common earnings brackets in Area Code 602 are $100,000+ for men (88,179 | 15.9%) and $100,000+ for women (42,514 | 9.1%).
| Income | Male | Female |
| $2,499 or less | 18,629 (3.4%) | 20,631 (4.4%) |
| $2,500 to $4,999 | 12,851 (2.3%) | 15,803 (3.4%) |
| $5,000 to $7,499 | 14,656 (2.6%) | 15,837 (3.4%) |
| $7,500 to $9,999 | 9,496 (1.7%) | 14,030 (3.0%) |
| $10,000 to $12,499 | 15,696 (2.8%) | 16,282 (3.5%) |
| $12,500 to $14,999 | 12,846 (2.3%) | 13,034 (2.8%) |
| $15,000 to $17,499 | 11,603 (2.1%) | 13,640 (2.9%) |
| $17,500 to $19,999 | 10,500 (1.9%) | 11,972 (2.6%) |
| $20,000 to $22,499 | 13,597 (2.5%) | 13,819 (3.0%) |
| $22,500 to $24,999 | 18,267 (3.3%) | 18,541 (4.0%) |
| $25,000 to $29,999 | 38,419 (6.9%) | 34,953 (7.5%) |
| $30,000 to $34,999 | 37,470 (6.8%) | 29,622 (6.4%) |
| $35,000 to $39,999 | 32,886 (5.9%) | 31,508 (6.8%) |
| $40,000 to $44,999 | 34,091 (6.1%) | 28,278 (6.1%) |
| $45,000 to $49,999 | 33,307 (6.0%) | 26,846 (5.8%) |
| $50,000 to $54,999 | 25,335 (4.6%) | 21,814 (4.7%) |
| $55,000 to $64,999 | 43,771 (7.9%) | 33,826 (7.2%) |
| $65,000 to $74,999 | 31,110 (5.6%) | 26,484 (5.7%) |
| $75,000 to $99,999 | 52,455 (9.5%) | 37,403 (8.0%) |
| $100,000+ | 88,179 (15.9%) | 42,514 (9.1%) |
| Total | 555,164 (100.0%) | 466,837 (100.0%) |
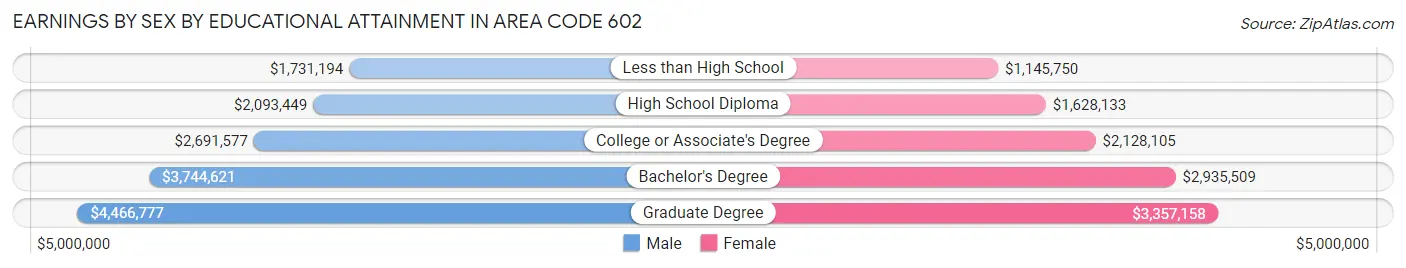
Earnings by Sex by Educational Attainment in Area Code 602
Average earnings in Area Code 602 are $3,011,666 for men and $2,395,526 for women, a difference of 20.5%. Men with an educational attainment of graduate degree enjoy the highest average annual earnings of $4,466,777, while those with less than high school education earn the least with $1,731,194. Women with an educational attainment of graduate degree earn the most with the average annual earnings of $3,357,158, while those with less than high school education have the smallest earnings of $1,145,750.
| Educational Attainment | Male Income | Female Income |
| Less than High School | $1,731,194 | $1,145,750 |
| High School Diploma | $2,093,449 | $1,628,133 |
| College or Associate's Degree | $2,691,577 | $2,128,105 |
| Bachelor's Degree | $3,744,621 | $2,935,509 |
| Graduate Degree | $4,466,777 | $3,357,158 |
| Total | $3,011,666 | $2,395,526 |
Family Income in Area Code 602
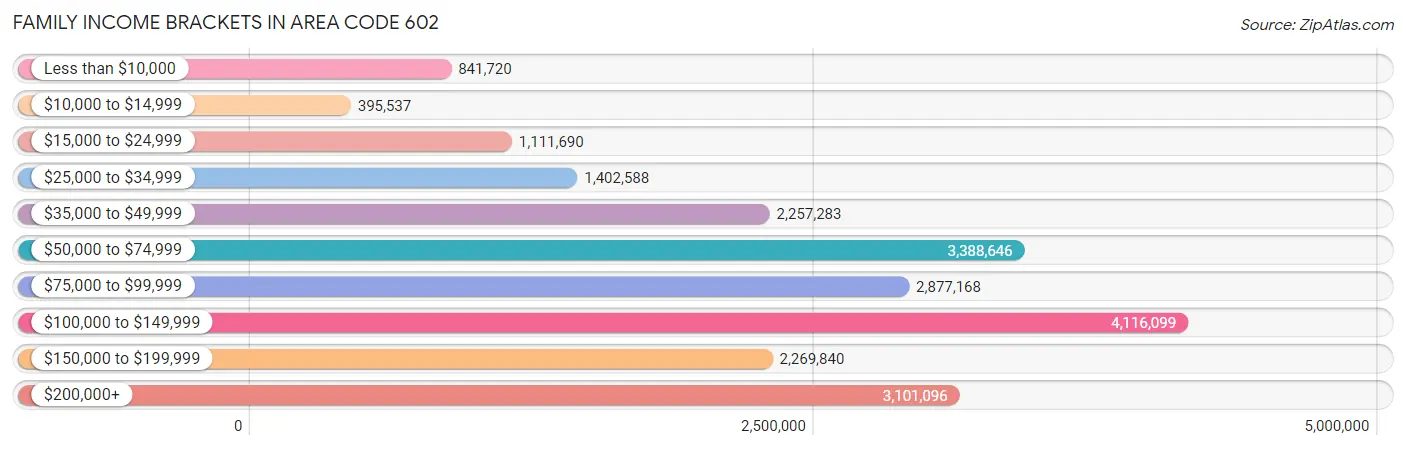
Family Income Brackets in Area Code 602
According to the Area Code 602 family income data, there are 4,116,099 families falling into the $100,000 to $149,999 income range, which is the most common income bracket and makes up 983.4% of all families. Conversely, the $10,000 to $14,999 income bracket is the least frequent group with only 395,537 families (94.5%) belonging to this category.
| Income Bracket | # Families | % Families |
| Less than $10,000 | 841,720 | 201.1% |
| $10,000 to $14,999 | 395,537 | 94.5% |
| $15,000 to $24,999 | 1,111,690 | 265.6% |
| $25,000 to $34,999 | 1,402,588 | 335.1% |
| $35,000 to $49,999 | 2,257,283 | 539.3% |
| $50,000 to $74,999 | 3,388,646 | 809.6% |
| $75,000 to $99,999 | 2,877,168 | 687.4% |
| $100,000 to $149,999 | 4,116,099 | 983.4% |
| $150,000 to $199,999 | 2,269,840 | 542.3% |
| $200,000+ | 3,101,096 | 740.9% |
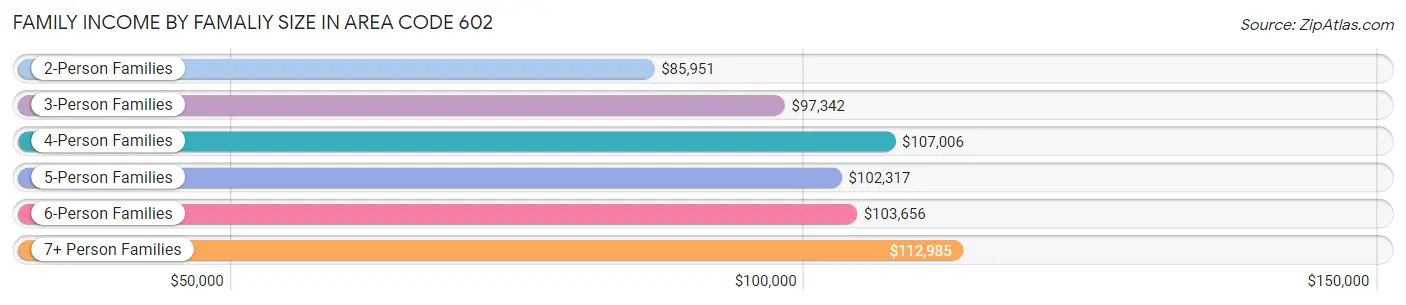
Family Income by Famaliy Size in Area Code 602
7+ person families (13,112 | 3.1%) account for the highest median family income in Area Code 602 with $112,985 per family, while 2-person families (183,695 | 43.9%) have the highest median income of $42,975 per family member.
| Income Bracket | # Families | Median Income |
| 2-Person Families | 183,695 (43.9%) | $85,951 |
| 3-Person Families | 92,493 (22.1%) | $97,342 |
| 4-Person Families | 72,696 (17.4%) | $107,006 |
| 5-Person Families | 38,225 (9.1%) | $102,317 |
| 6-Person Families | 18,337 (4.4%) | $103,656 |
| 7+ Person Families | 13,112 (3.1%) | $112,985 |
| Total | 418,558 (100.0%) | $92,445 |
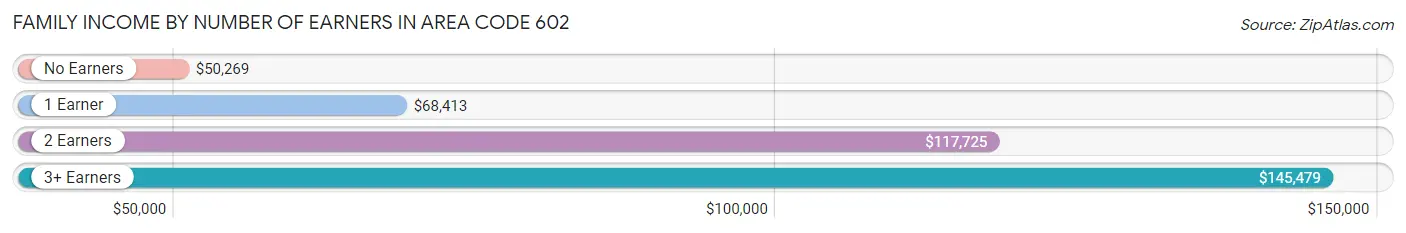
Family Income by Number of Earners in Area Code 602
The median family income in Area Code 602 is $92,445, with families comprising 3+ earners (51,358) having the highest median family income of $145,479, while families with no earners (50,563) have the lowest median family income of $50,269, accounting for 12.3% and 12.1% of families, respectively.
| Number of Earners | # Families | Median Income |
| No Earners | 50,563 (12.1%) | $50,269 |
| 1 Earner | 141,490 (33.8%) | $68,413 |
| 2 Earners | 175,147 (41.8%) | $117,725 |
| 3+ Earners | 51,358 (12.3%) | $145,479 |
| Total | 418,558 (100.0%) | $92,445 |
Household Income in Area Code 602
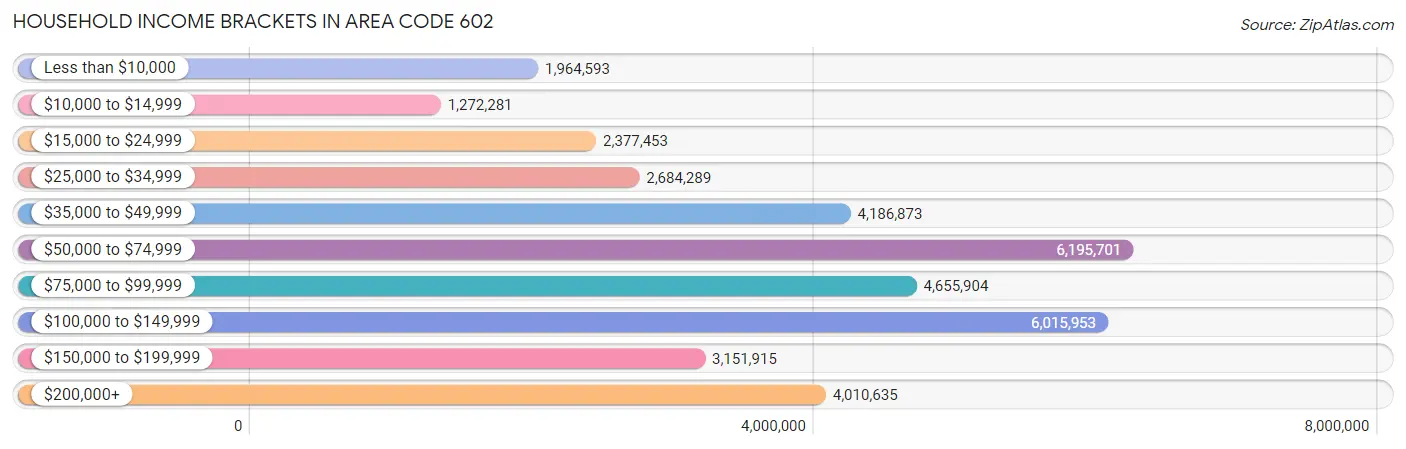
Household Income Brackets in Area Code 602
With 6,195,701 households falling in the category, the $50,000 to $74,999 income range is the most frequent in Area Code 602, accounting for 882.4% of all households. In contrast, only 1,272,281 households (181.2%) fall into the $10,000 to $14,999 income bracket, making it the least populous group.
| Income Bracket | # Households | % Households |
| Less than $10,000 | 1,964,593 | 279.8% |
| $10,000 to $14,999 | 1,272,281 | 181.2% |
| $15,000 to $24,999 | 2,377,453 | 338.6% |
| $25,000 to $34,999 | 2,684,289 | 382.3% |
| $35,000 to $49,999 | 4,186,873 | 596.3% |
| $50,000 to $74,999 | 6,195,701 | 882.4% |
| $75,000 to $99,999 | 4,655,904 | 663.1% |
| $100,000 to $149,999 | 6,015,953 | 856.8% |
| $150,000 to $199,999 | 3,151,915 | 448.9% |
| $200,000+ | 4,010,635 | 571.2% |
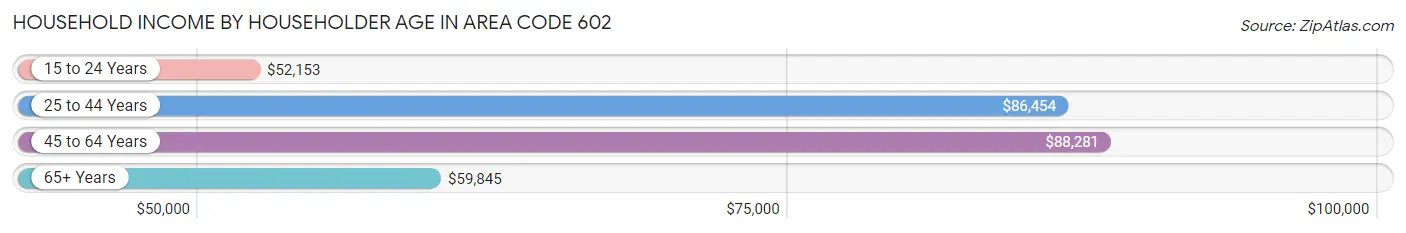
Household Income by Householder Age in Area Code 602
The median household income in Area Code 602 is $78,257, with the highest median household income of $88,281 found in the 45 to 64 years age bracket for the primary householder. A total of 243,079 households (34.6%) fall into this category. Meanwhile, the 15 to 24 years age bracket for the primary householder has the lowest median household income of $52,153, with 43,883 households (6.2%) in this group.
| Income Bracket | # Households | Median Income |
| 15 to 24 Years | 43,883 (6.2%) | $52,153 |
| 25 to 44 Years | 276,244 (39.3%) | $86,454 |
| 45 to 64 Years | 243,079 (34.6%) | $88,281 |
| 65+ Years | 138,936 (19.8%) | $59,845 |
| Total | 702,142 (100.0%) | $78,257 |
Poverty in Area Code 602
Income Below Poverty by Sex and Age in Area Code 602
With 14.4% poverty level for males and 16.7% for females among the residents of Area Code 602, 6 to 11 year old males and 5 year old females are the most vulnerable to poverty, with 16,938 males (24.1%) and 2,855 females (26.0%) in their respective age groups living below the poverty level.
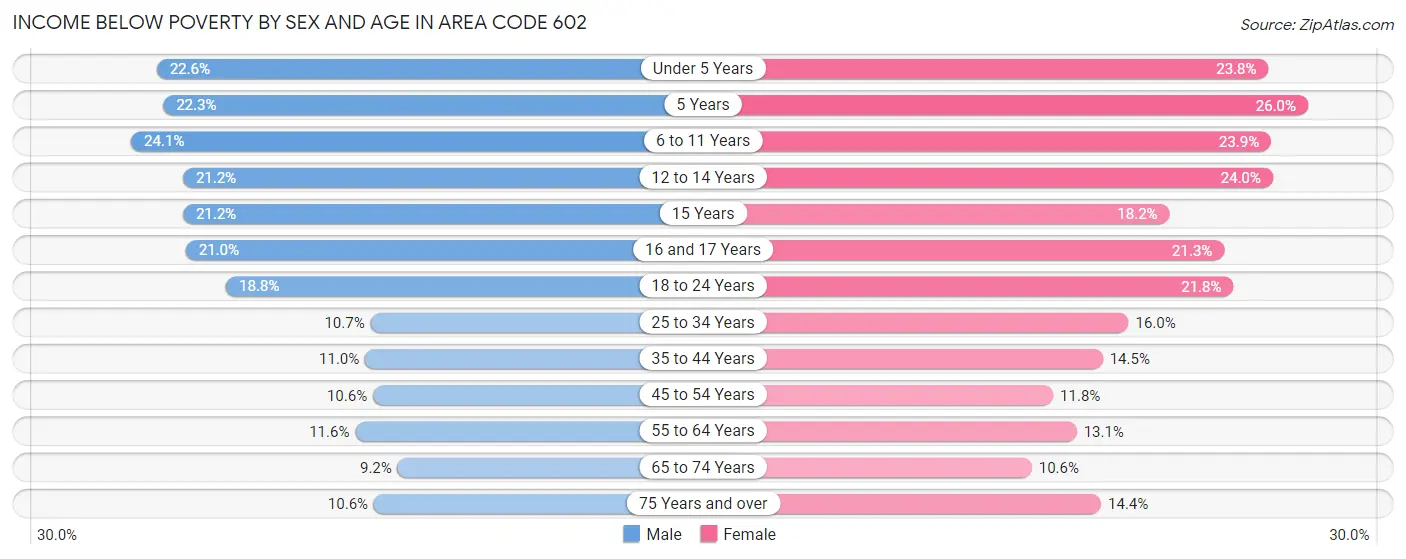
| Age Bracket | Male | Female |
| Under 5 Years | 12,412 (22.6%) | 12,865 (23.7%) |
| 5 Years | 2,497 (22.3%) | 2,855 (26.0%) |
| 6 to 11 Years | 16,938 (24.1%) | 15,225 (23.9%) |
| 12 to 14 Years | 7,609 (21.2%) | 8,410 (24.0%) |
| 15 Years | 2,814 (21.2%) | 2,124 (18.2%) |
| 16 and 17 Years | 5,260 (21.0%) | 4,966 (21.3%) |
| 18 to 24 Years | 18,495 (18.8%) | 20,270 (21.8%) |
| 25 to 34 Years | 17,394 (10.7%) | 24,266 (16.0%) |
| 35 to 44 Years | 13,963 (11.0%) | 17,040 (14.5%) |
| 45 to 54 Years | 11,842 (10.6%) | 12,970 (11.8%) |
| 55 to 64 Years | 11,453 (11.6%) | 13,405 (13.1%) |
| 65 to 74 Years | 5,724 (9.2%) | 7,477 (10.6%) |
| 75 Years and over | 3,924 (10.5%) | 7,188 (14.4%) |
| Total | 130,325 (14.4%) | 149,061 (16.7%) |
Income Above Poverty by Sex and Age in Area Code 602
According to the poverty statistics in Area Code 602, males aged 65 to 74 years and females aged 65 to 74 years are the age groups that are most secure financially, with 90.8% of males and 89.4% of females in these age groups living above the poverty line.
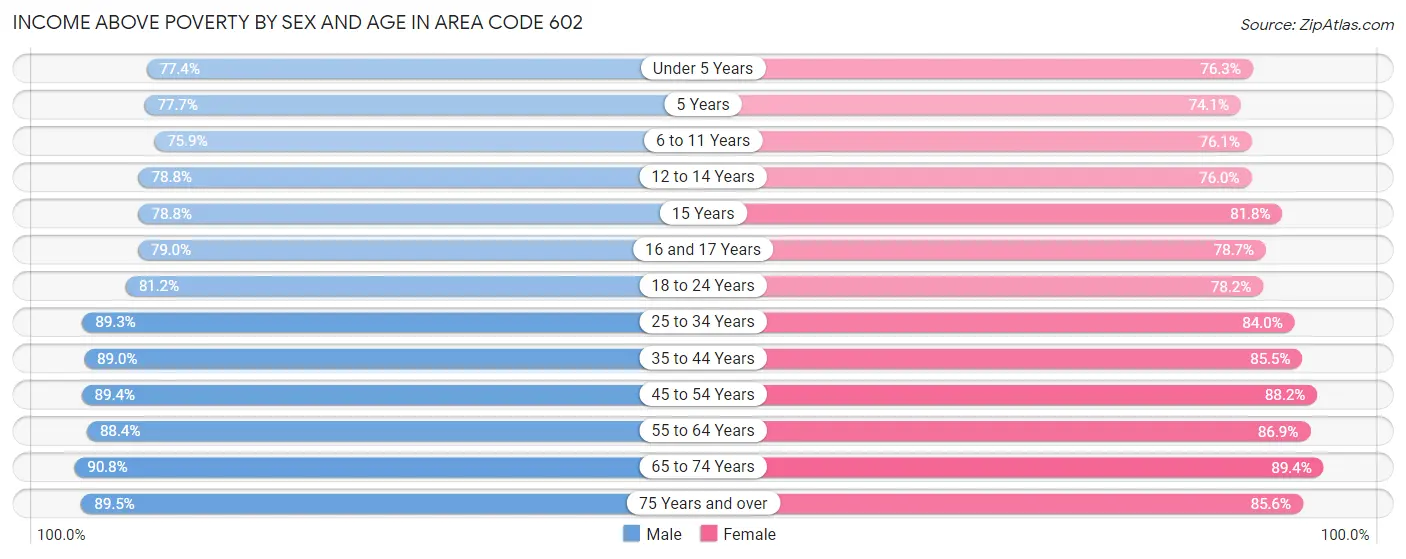
| Age Bracket | Male | Female |
| Under 5 Years | 42,401 (77.4%) | 41,295 (76.2%) |
| 5 Years | 8,710 (77.7%) | 8,146 (74.1%) |
| 6 to 11 Years | 53,432 (75.9%) | 48,490 (76.1%) |
| 12 to 14 Years | 28,309 (78.8%) | 26,637 (76.0%) |
| 15 Years | 10,471 (78.8%) | 9,518 (81.8%) |
| 16 and 17 Years | 19,758 (79.0%) | 18,363 (78.7%) |
| 18 to 24 Years | 79,994 (81.2%) | 72,726 (78.2%) |
| 25 to 34 Years | 144,491 (89.3%) | 127,658 (84.0%) |
| 35 to 44 Years | 112,554 (89.0%) | 100,207 (85.5%) |
| 45 to 54 Years | 99,830 (89.4%) | 97,237 (88.2%) |
| 55 to 64 Years | 87,364 (88.4%) | 89,112 (86.9%) |
| 65 to 74 Years | 56,278 (90.8%) | 63,176 (89.4%) |
| 75 Years and over | 33,286 (89.4%) | 42,574 (85.6%) |
| Total | 776,878 (85.6%) | 745,139 (83.3%) |
Income Below Poverty Among Married-Couple Families in Area Code 602
The poverty statistics for married-couple families in Area Code 602 show that 6.3% or 17,153 of the total 272,536 families live below the poverty line. Families with 5 or more children have the highest poverty rate of 26.0%, comprising of 885 families. On the other hand, families with no children have the lowest poverty rate of 3.5%, which includes 5,377 families.
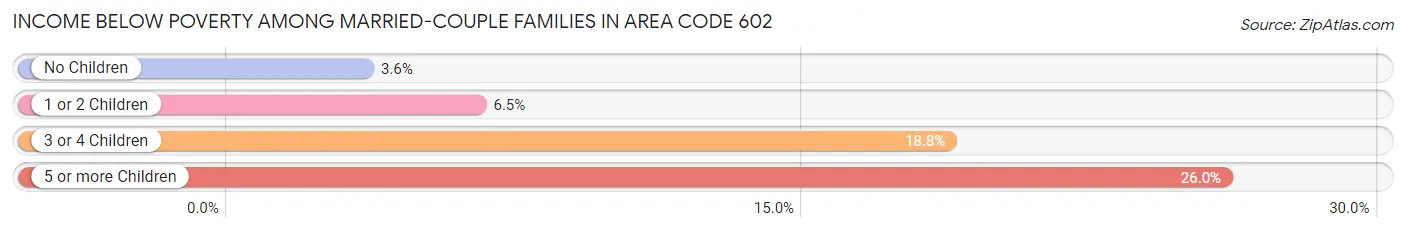
| Children | Above Poverty | Below Poverty |
| No Children | 146,226 (96.5%) | 5,377 (3.5%) |
| 1 or 2 Children | 85,058 (93.5%) | 5,903 (6.5%) |
| 3 or 4 Children | 21,577 (81.2%) | 4,988 (18.8%) |
| 5 or more Children | 2,522 (74.0%) | 885 (26.0%) |
| Total | 255,383 (93.7%) | 17,153 (6.3%) |
Income Below Poverty Among Single-Parent Households in Area Code 602
According to the poverty data in Area Code 602, 14.0% or 6,703 single-father households and 23.9% or 23,467 single-mother households are living below the poverty line. Among single-father households, those with 5 or more children have the highest poverty rate, with 274 households (45.3%) experiencing poverty. Likewise, among single-mother households, those with 5 or more children have the highest poverty rate, with 1,449 households (72.1%) falling below the poverty line.
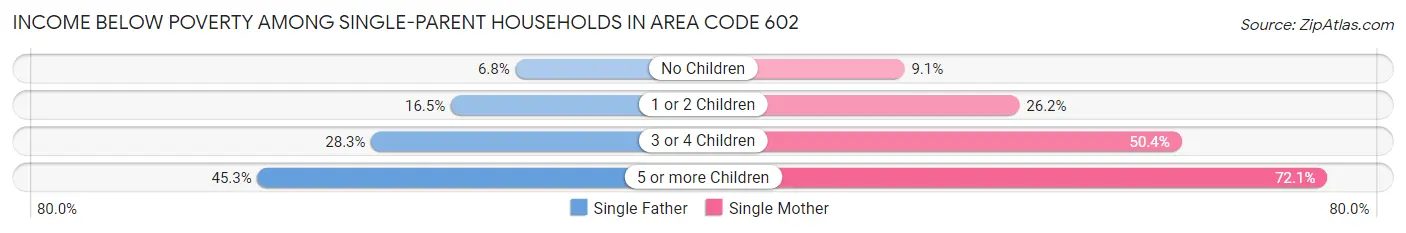
| Children | Single Father | Single Mother |
| No Children | 1,375 (6.8%) | 3,181 (9.1%) |
| 1 or 2 Children | 3,727 (16.5%) | 12,793 (26.2%) |
| 3 or 4 Children | 1,327 (28.3%) | 6,044 (50.3%) |
| 5 or more Children | 274 (45.3%) | 1,449 (72.1%) |
| Total | 6,703 (14.0%) | 23,467 (23.9%) |
Income Below Poverty Among Married-Couple vs Single-Parent Households in Area Code 602
The poverty data for Area Code 602 shows that 17,153 of the married-couple family households (6.3%) and 30,170 of the single-parent households (20.7%) are living below the poverty level. Within the married-couple family households, those with 5 or more children have the highest poverty rate, with 885 households (26.0%) falling below the poverty line. Among the single-parent households, those with 5 or more children have the highest poverty rate, with 1,723 household (65.9%) living below poverty.
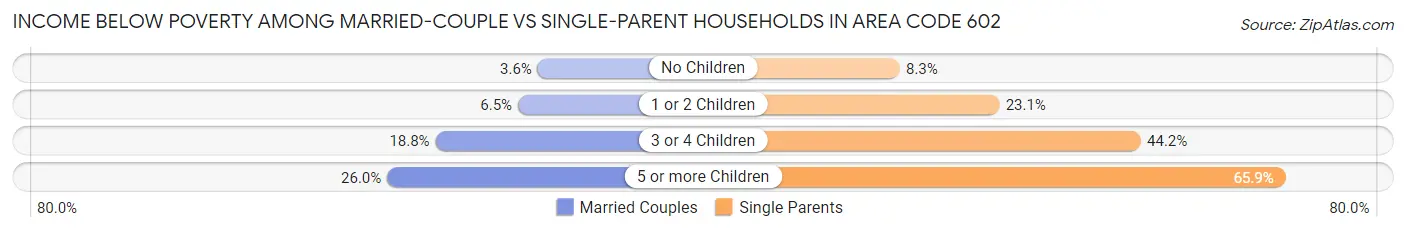
| Children | Married-Couple Families | Single-Parent Households |
| No Children | 5,377 (3.5%) | 4,556 (8.3%) |
| 1 or 2 Children | 5,903 (6.5%) | 16,520 (23.1%) |
| 3 or 4 Children | 4,988 (18.8%) | 7,371 (44.2%) |
| 5 or more Children | 885 (26.0%) | 1,723 (65.9%) |
| Total | 17,153 (6.3%) | 30,170 (20.7%) |
Race in Area Code 602
The most populous races in Area Code 602 are White / Caucasian (1,105,800 | 60.3%), Hispanic or Latino (718,532 | 39.2%), and Two or more Races (297,366 | 16.2%).
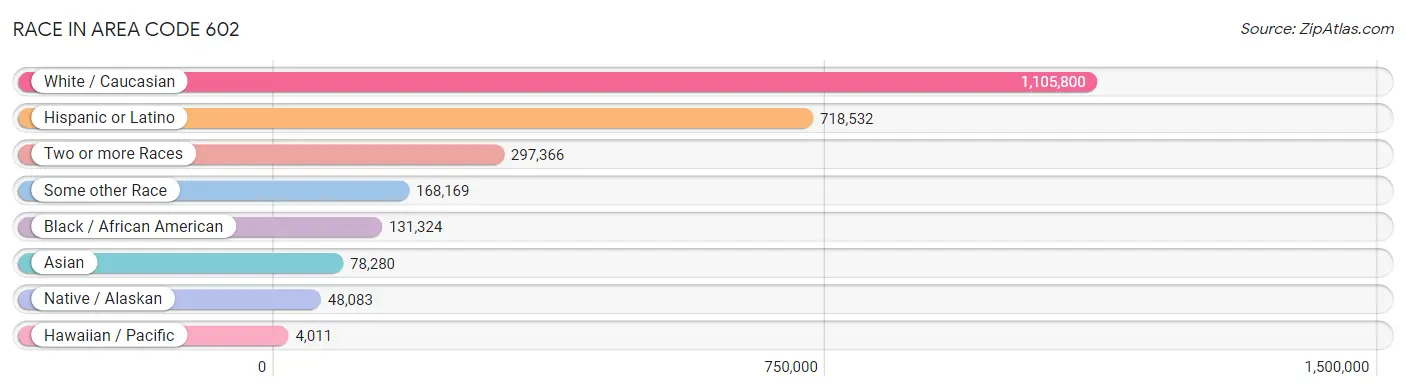
| Race | # Population | % Population |
| Asian | 78,280 | 4.3% |
| Black / African American | 131,324 | 7.2% |
| Hawaiian / Pacific | 4,011 | 0.2% |
| Hispanic or Latino | 718,532 | 39.2% |
| Native / Alaskan | 48,083 | 2.6% |
| White / Caucasian | 1,105,800 | 60.3% |
| Two or more Races | 297,366 | 16.2% |
| Some other Race | 168,169 | 9.2% |
| Total | 1,833,033 | 100.0% |
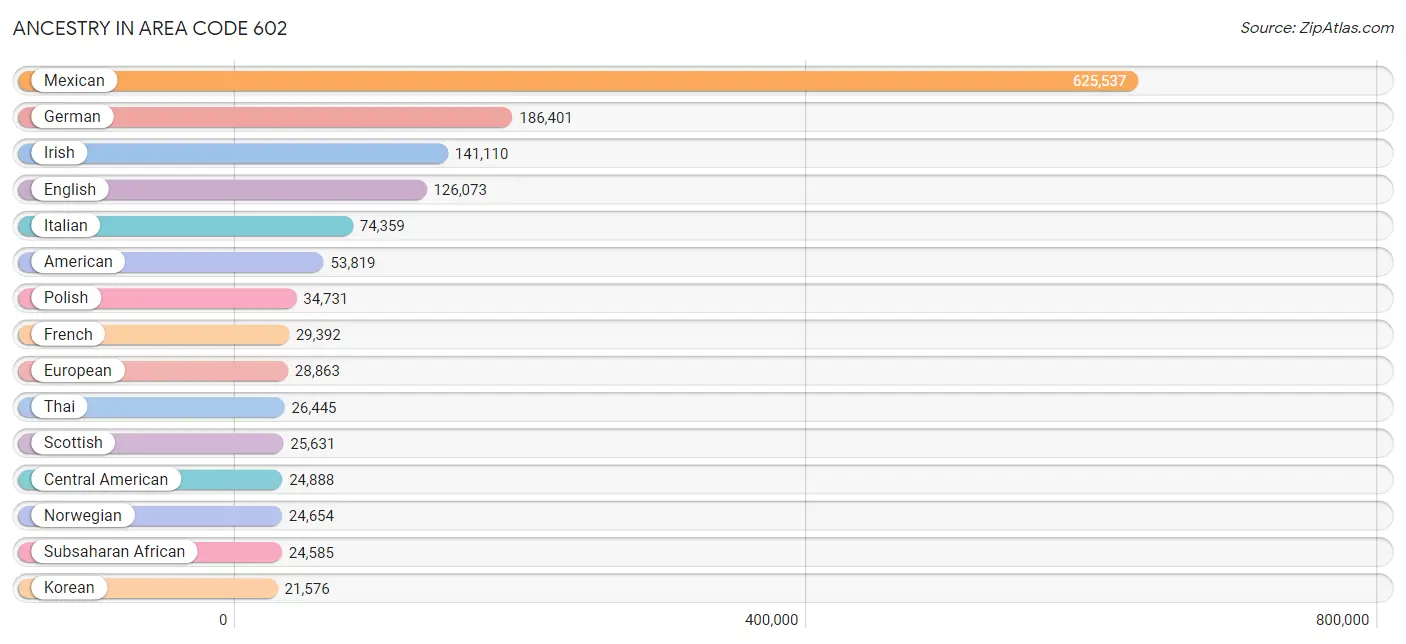
Ancestry in Area Code 602
The most populous ancestries reported in Area Code 602 are Mexican (625,537 | 34.1%), German (186,401 | 10.2%), Irish (141,110 | 7.7%), English (126,073 | 6.9%), and Italian (74,359 | 4.1%), together accounting for 62.9% of all Area Code 602 residents.
| Ancestry | # Population | % Population |
| Afghan | 1,521 | 0.1% |
| African | 11,212 | 0.6% |
| Alaska Native | 189 | 0.0% |
| Alaskan Athabascan | 149 | 0.0% |
| Albanian | 571 | 0.0% |
| Aleut | 170 | 0.0% |
| Alsatian | 8 | 0.0% |
| American | 53,819 | 2.9% |
| Apache | 2,971 | 0.2% |
| Arab | 12,782 | 0.7% |
| Argentinean | 730 | 0.0% |
| Armenian | 1,531 | 0.1% |
| Assyrian / Chaldean / Syriac | 1,443 | 0.1% |
| Australian | 484 | 0.0% |
| Austrian | 2,615 | 0.1% |
| Bahamian | 243 | 0.0% |
| Bangladeshi | 91 | 0.0% |
| Barbadian | 401 | 0.0% |
| Basque | 478 | 0.0% |
| Belgian | 1,343 | 0.1% |
| Belizean | 347 | 0.0% |
| Bhutanese | 7,775 | 0.4% |
| Blackfeet | 1,818 | 0.1% |
| Bolivian | 311 | 0.0% |
| Brazilian | 1,715 | 0.1% |
| British | 9,713 | 0.5% |
| British West Indian | 139 | 0.0% |
| Bulgarian | 1,038 | 0.1% |
| Burmese | 5,604 | 0.3% |
| Cajun | 147 | 0.0% |
| Cambodian | 153 | 0.0% |
| Canadian | 4,415 | 0.2% |
| Cape Verdean | 86 | 0.0% |
| Carpatho Rusyn | 39 | 0.0% |
| Celtic | 297 | 0.0% |
| Central American | 24,888 | 1.4% |
| Central American Indian | 2,682 | 0.2% |
| Cherokee | 4,763 | 0.3% |
| Cheyenne | 77 | 0.0% |
| Chickasaw | 277 | 0.0% |
| Chilean | 710 | 0.0% |
| Chippewa | 487 | 0.0% |
| Choctaw | 1,156 | 0.1% |
| Colombian | 3,773 | 0.2% |
| Colville | 167 | 0.0% |
| Comanche | 115 | 0.0% |
| Costa Rican | 1,001 | 0.1% |
| Cree | 40 | 0.0% |
| Creek | 294 | 0.0% |
| Croatian | 2,775 | 0.2% |
| Crow | 16 | 0.0% |
| Cuban | 7,742 | 0.4% |
| Cypriot | 125 | 0.0% |
| Czech | 7,061 | 0.4% |
| Czechoslovakian | 1,927 | 0.1% |
| Danish | 7,535 | 0.4% |
| Delaware | 233 | 0.0% |
| Dominican | 1,910 | 0.1% |
| Dutch | 14,990 | 0.8% |
| Eastern European | 4,872 | 0.3% |
| Ecuadorian | 1,173 | 0.1% |
| Egyptian | 1,074 | 0.1% |
| English | 126,073 | 6.9% |
| Estonian | 204 | 0.0% |
| Ethiopian | 2,782 | 0.2% |
| European | 28,863 | 1.6% |
| Fijian | 720 | 0.0% |
| Filipino | 1,200 | 0.1% |
| Finnish | 3,797 | 0.2% |
| French | 29,392 | 1.6% |
| French American Indian | 200 | 0.0% |
| French Canadian | 5,238 | 0.3% |
| German | 186,401 | 10.2% |
| German Russian | 53 | 0.0% |
| Ghanaian | 247 | 0.0% |
| Greek | 6,931 | 0.4% |
| Guamanian / Chamorro | 1,277 | 0.1% |
| Guatemalan | 12,040 | 0.7% |
| Guyanese | 218 | 0.0% |
| Haitian | 816 | 0.0% |
| Honduran | 2,873 | 0.2% |
| Hopi | 1,806 | 0.1% |
| Houma | 192 | 0.0% |
| Hungarian | 5,780 | 0.3% |
| Icelander | 198 | 0.0% |
| Indian (Asian) | 17,749 | 1.0% |
| Indonesian | 2,692 | 0.2% |
| Inupiat | 397 | 0.0% |
| Iranian | 2,826 | 0.2% |
| Iraqi | 2,560 | 0.1% |
| Irish | 141,110 | 7.7% |
| Iroquois | 376 | 0.0% |
| Israeli | 594 | 0.0% |
| Italian | 74,359 | 4.1% |
| Jamaican | 2,717 | 0.2% |
| Japanese | 1,004 | 0.1% |
| Jordanian | 705 | 0.0% |
| Kenyan | 597 | 0.0% |
| Kiowa | 295 | 0.0% |
| Korean | 21,576 | 1.2% |
| Laotian | 843 | 0.1% |
| Latvian | 530 | 0.0% |
| Lebanese | 3,428 | 0.2% |
| Liberian | 712 | 0.0% |
| Lithuanian | 3,214 | 0.2% |
| Lumbee | 103 | 0.0% |
| Luxembourger | 298 | 0.0% |
| Macedonian | 372 | 0.0% |
| Malaysian | 1,228 | 0.1% |
| Maltese | 59 | 0.0% |
| Menominee | 27 | 0.0% |
| Mexican | 625,537 | 34.1% |
| Mexican American Indian | 4,438 | 0.2% |
| Mongolian | 188 | 0.0% |
| Moroccan | 402 | 0.0% |
| Native Hawaiian | 2,651 | 0.1% |
| Navajo | 21,167 | 1.1% |
| New Zealander | 121 | 0.0% |
| Nicaraguan | 1,485 | 0.1% |
| Nigerian | 2,233 | 0.1% |
| Northern European | 2,597 | 0.1% |
| Norwegian | 24,654 | 1.3% |
| Okinawan | 31 | 0.0% |
| Osage | 43 | 0.0% |
| Ottawa | 11 | 0.0% |
| Paiute | 71 | 0.0% |
| Pakistani | 1,518 | 0.1% |
| Palestinian | 573 | 0.0% |
| Panamanian | 778 | 0.0% |
| Paraguayan | 23 | 0.0% |
| Pennsylvania German | 331 | 0.0% |
| Peruvian | 1,853 | 0.1% |
| Pima | 7,027 | 0.4% |
| Polish | 34,731 | 1.9% |
| Portuguese | 4,136 | 0.2% |
| Potawatomi | 198 | 0.0% |
| Pueblo | 902 | 0.1% |
| Puerto Rican | 13,954 | 0.8% |
| Puget Sound Salish | 15 | 0.0% |
| Romanian | 4,126 | 0.2% |
| Russian | 11,916 | 0.6% |
| Salvadoran | 6,578 | 0.4% |
| Samoan | 1,242 | 0.1% |
| Scandinavian | 6,314 | 0.3% |
| Scotch-Irish | 10,689 | 0.6% |
| Scottish | 25,631 | 1.4% |
| Seminole | 19 | 0.0% |
| Senegalese | 219 | 0.0% |
| Serbian | 2,561 | 0.1% |
| Shoshone | 245 | 0.0% |
| Sierra Leonean | 190 | 0.0% |
| Sioux | 1,248 | 0.1% |
| Slavic | 680 | 0.0% |
| Slovak | 2,396 | 0.1% |
| Slovene | 571 | 0.0% |
| Somali | 2,233 | 0.1% |
| South African | 489 | 0.0% |
| South American | 9,745 | 0.5% |
| South American Indian | 363 | 0.0% |
| Soviet Union | 50 | 0.0% |
| Spaniard | 8,449 | 0.5% |
| Spanish | 7,388 | 0.4% |
| Spanish American | 296 | 0.0% |
| Spanish American Indian | 76 | 0.0% |
| Sri Lankan | 11,263 | 0.6% |
| Subsaharan African | 24,585 | 1.3% |
| Sudanese | 848 | 0.1% |
| Swedish | 18,618 | 1.0% |
| Swiss | 3,434 | 0.2% |
| Syrian | 714 | 0.0% |
| Thai | 26,445 | 1.4% |
| Tlingit-Haida | 317 | 0.0% |
| Tohono O'Odham | 3,354 | 0.2% |
| Tongan | 639 | 0.0% |
| Trinidadian and Tobagonian | 287 | 0.0% |
| Tsimshian | 36 | 0.0% |
| Turkish | 891 | 0.1% |
| U.S. Virgin Islander | 71 | 0.0% |
| Ugandan | 51 | 0.0% |
| Ukrainian | 3,983 | 0.2% |
| Uruguayan | 57 | 0.0% |
| Ute | 84 | 0.0% |
| Venezuelan | 1,074 | 0.1% |
| Vietnamese | 1,305 | 0.1% |
| Welsh | 8,042 | 0.4% |
| West Indian | 579 | 0.0% |
| Yakama | 21 | 0.0% |
| Yaqui | 5,022 | 0.3% |
| Yugoslavian | 2,183 | 0.1% |
| Yuman | 663 | 0.0% |
| Yup'ik | 54 | 0.0% |
| Zimbabwean | 92 | 0.0% | View All 192 Rows |
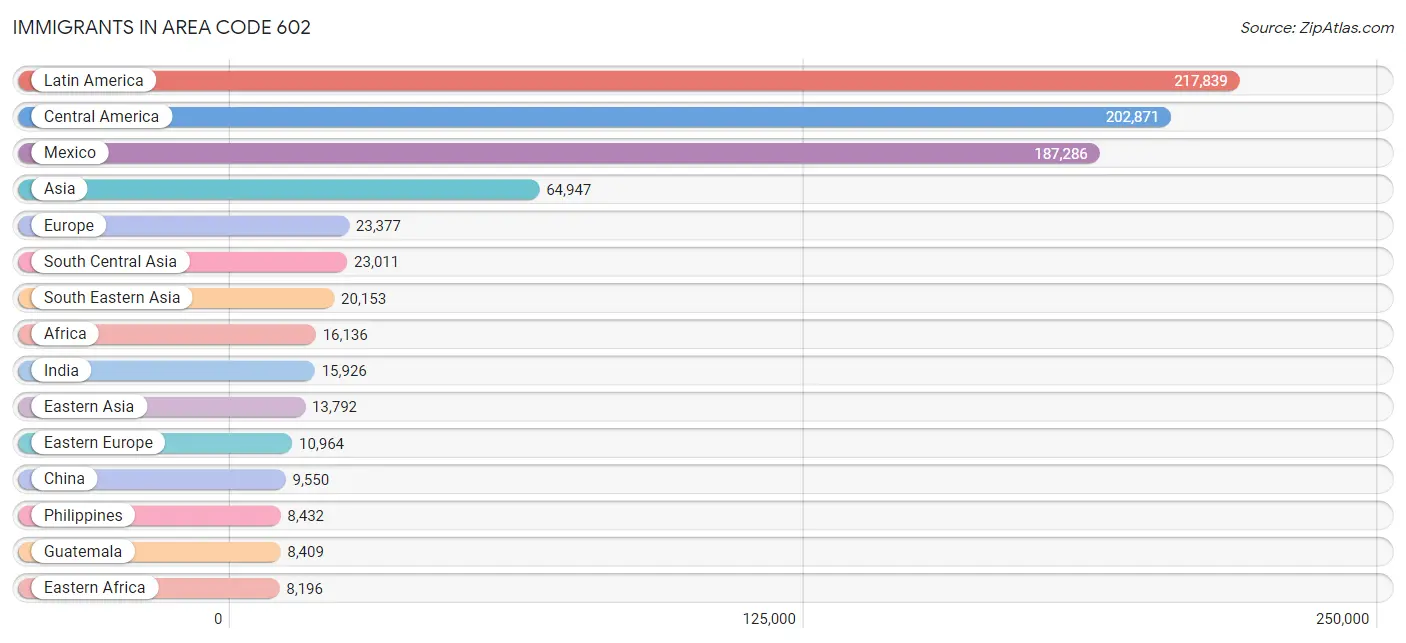
Immigrants in Area Code 602
The most numerous immigrant groups reported in Area Code 602 came from Latin America (217,839 | 11.9%), Central America (202,871 | 11.1%), Mexico (187,286 | 10.2%), Asia (64,947 | 3.5%), and Europe (23,377 | 1.3%), together accounting for 38.0% of all Area Code 602 residents.
| Immigration Origin | # Population | % Population |
| Afghanistan | 1,307 | 0.1% |
| Africa | 16,136 | 0.9% |
| Albania | 390 | 0.0% |
| Argentina | 518 | 0.0% |
| Armenia | 118 | 0.0% |
| Asia | 64,947 | 3.5% |
| Australia | 251 | 0.0% |
| Austria | 203 | 0.0% |
| Bahamas | 223 | 0.0% |
| Bangladesh | 1,269 | 0.1% |
| Barbados | 380 | 0.0% |
| Belarus | 67 | 0.0% |
| Belgium | 98 | 0.0% |
| Belize | 110 | 0.0% |
| Bolivia | 62 | 0.0% |
| Bosnia and Herzegovina | 1,304 | 0.1% |
| Brazil | 900 | 0.1% |
| Bulgaria | 834 | 0.1% |
| Cambodia | 631 | 0.0% |
| Cameroon | 193 | 0.0% |
| Canada | 7,005 | 0.4% |
| Caribbean | 7,923 | 0.4% |
| Central America | 202,871 | 11.1% |
| Chile | 458 | 0.0% |
| China | 9,550 | 0.5% |
| Colombia | 2,086 | 0.1% |
| Congo | 639 | 0.0% |
| Costa Rica | 369 | 0.0% |
| Croatia | 600 | 0.0% |
| Cuba | 4,854 | 0.3% |
| Czechoslovakia | 296 | 0.0% |
| Denmark | 102 | 0.0% |
| Dominica | 20 | 0.0% |
| Dominican Republic | 556 | 0.0% |
| Eastern Africa | 8,196 | 0.4% |
| Eastern Asia | 13,792 | 0.7% |
| Eastern Europe | 10,964 | 0.6% |
| Ecuador | 543 | 0.0% |
| Egypt | 664 | 0.0% |
| El Salvador | 3,724 | 0.2% |
| England | 2,202 | 0.1% |
| Eritrea | 858 | 0.1% |
| Ethiopia | 2,307 | 0.1% |
| Europe | 23,377 | 1.3% |
| Fiji | 113 | 0.0% |
| France | 867 | 0.1% |
| Germany | 3,127 | 0.2% |
| Ghana | 261 | 0.0% |
| Greece | 277 | 0.0% |
| Grenada | 13 | 0.0% |
| Guatemala | 8,409 | 0.5% |
| Guyana | 198 | 0.0% |
| Haiti | 608 | 0.0% |
| Honduras | 1,667 | 0.1% |
| Hong Kong | 861 | 0.1% |
| Hungary | 500 | 0.0% |
| India | 15,926 | 0.9% |
| Indonesia | 781 | 0.0% |
| Iran | 2,080 | 0.1% |
| Iraq | 3,253 | 0.2% |
| Ireland | 368 | 0.0% |
| Israel | 364 | 0.0% |
| Italy | 986 | 0.1% |
| Jamaica | 934 | 0.1% |
| Japan | 1,404 | 0.1% |
| Jordan | 553 | 0.0% |
| Kazakhstan | 50 | 0.0% |
| Kenya | 1,276 | 0.1% |
| Korea | 2,774 | 0.2% |
| Kuwait | 286 | 0.0% |
| Laos | 401 | 0.0% |
| Latin America | 217,839 | 11.9% |
| Latvia | 86 | 0.0% |
| Lebanon | 481 | 0.0% |
| Liberia | 547 | 0.0% |
| Lithuania | 193 | 0.0% |
| Malaysia | 626 | 0.0% |
| Mexico | 187,286 | 10.2% |
| Micronesia | 96 | 0.0% |
| Middle Africa | 2,086 | 0.1% |
| Moldova | 89 | 0.0% |
| Morocco | 227 | 0.0% |
| Nepal | 582 | 0.0% |
| Netherlands | 446 | 0.0% |
| Nicaragua | 1,028 | 0.1% |
| Nigeria | 1,172 | 0.1% |
| North Macedonia | 12 | 0.0% |
| Northern Africa | 1,358 | 0.1% |
| Northern Europe | 5,310 | 0.3% |
| Norway | 80 | 0.0% |
| Oceania | 1,487 | 0.1% |
| Pakistan | 832 | 0.1% |
| Panama | 278 | 0.0% |
| Peru | 1,093 | 0.1% |
| Philippines | 8,432 | 0.5% |
| Poland | 1,098 | 0.1% |
| Portugal | 167 | 0.0% |
| Romania | 2,065 | 0.1% |
| Russia | 1,105 | 0.1% |
| Saudi Arabia | 707 | 0.0% |
| Scotland | 177 | 0.0% |
| Senegal | 141 | 0.0% |
| Serbia | 565 | 0.0% |
| Sierra Leone | 234 | 0.0% |
| Singapore | 249 | 0.0% |
| Somalia | 1,076 | 0.1% |
| South Africa | 562 | 0.0% |
| South America | 7,045 | 0.4% |
| South Central Asia | 23,011 | 1.3% |
| South Eastern Asia | 20,153 | 1.1% |
| Southern Europe | 2,141 | 0.1% |
| Spain | 711 | 0.0% |
| Sri Lanka | 186 | 0.0% |
| Sudan | 389 | 0.0% |
| Sweden | 403 | 0.0% |
| Switzerland | 134 | 0.0% |
| Syria | 705 | 0.0% |
| Taiwan | 1,918 | 0.1% |
| Thailand | 1,113 | 0.1% |
| Trinidad and Tobago | 290 | 0.0% |
| Turkey | 336 | 0.0% |
| Uganda | 211 | 0.0% |
| Ukraine | 818 | 0.0% |
| Uruguay | 76 | 0.0% |
| Uzbekistan | 373 | 0.0% |
| Venezuela | 1,021 | 0.1% |
| Vietnam | 6,087 | 0.3% |
| Western Africa | 2,661 | 0.2% |
| Western Asia | 7,504 | 0.4% |
| Western Europe | 4,883 | 0.3% |
| Yemen | 136 | 0.0% |
| Zaire | 1,213 | 0.1% |
| Zimbabwe | 195 | 0.0% | View All 133 Rows |
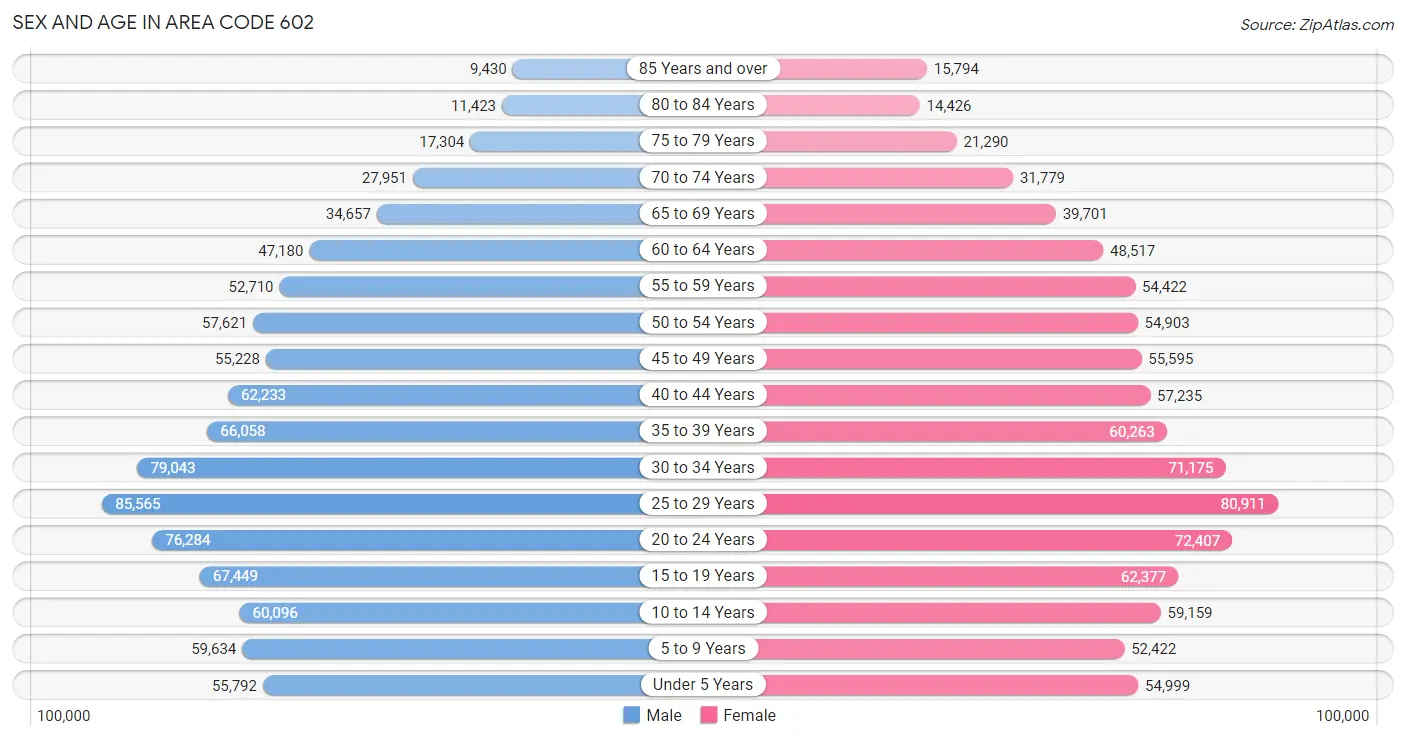
Sex and Age in Area Code 602
Sex and Age in Area Code 602
The most populous age groups in Area Code 602 are 25 to 29 Years (85,565 | 9.2%) for men and 25 to 29 Years (80,911 | 8.9%) for women.
| Age Bracket | Male | Female |
| Under 5 Years | 55,792 (6.0%) | 54,999 (6.1%) |
| 5 to 9 Years | 59,634 (6.4%) | 52,422 (5.8%) |
| 10 to 14 Years | 60,096 (6.5%) | 59,159 (6.5%) |
| 15 to 19 Years | 67,449 (7.3%) | 62,377 (6.9%) |
| 20 to 24 Years | 76,284 (8.2%) | 72,407 (8.0%) |
| 25 to 29 Years | 85,565 (9.2%) | 80,911 (8.9%) |
| 30 to 34 Years | 79,043 (8.5%) | 71,175 (7.8%) |
| 35 to 39 Years | 66,058 (7.1%) | 60,263 (6.6%) |
| 40 to 44 Years | 62,233 (6.7%) | 57,235 (6.3%) |
| 45 to 49 Years | 55,228 (6.0%) | 55,595 (6.1%) |
| 50 to 54 Years | 57,621 (6.2%) | 54,903 (6.0%) |
| 55 to 59 Years | 52,710 (5.7%) | 54,422 (6.0%) |
| 60 to 64 Years | 47,180 (5.1%) | 48,517 (5.3%) |
| 65 to 69 Years | 34,657 (3.7%) | 39,701 (4.4%) |
| 70 to 74 Years | 27,951 (3.0%) | 31,779 (3.5%) |
| 75 to 79 Years | 17,304 (1.9%) | 21,290 (2.4%) |
| 80 to 84 Years | 11,423 (1.2%) | 14,426 (1.6%) |
| 85 Years and over | 9,430 (1.0%) | 15,794 (1.7%) |
| Total | 925,658 (100.0%) | 907,375 (100.0%) |
Families and Households in Area Code 602
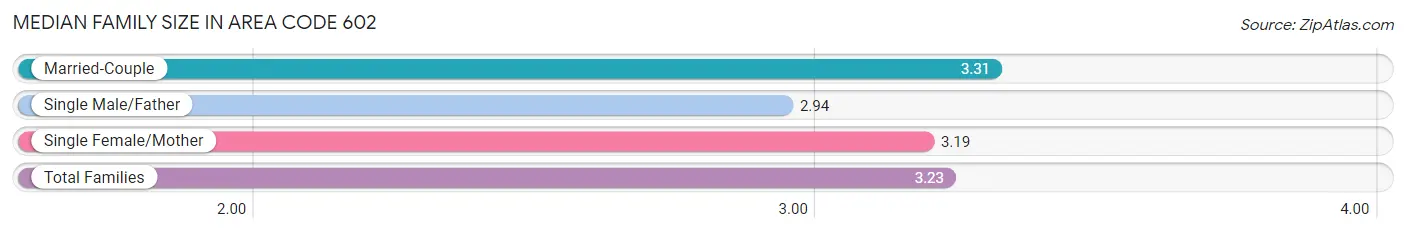
Median Family Size in Area Code 602
The median family size in Area Code 602 is 3.23 persons per family, with married-couple families (272,536 | 65.1%) accounting for the largest median family size of 3.31326 persons per family. On the other hand, single male/father families (48,037 | 11.5%) represent the smallest median family size with 2.94 persons per family.
| Family Type | # Families | Family Size |
| Married-Couple | 272,536 (65.1%) | 3.31 |
| Single Male/Father | 48,037 (11.5%) | 2.94 |
| Single Female/Mother | 97,985 (23.4%) | 3.19 |
| Total Families | 418,558 (100.0%) | 3.23 |
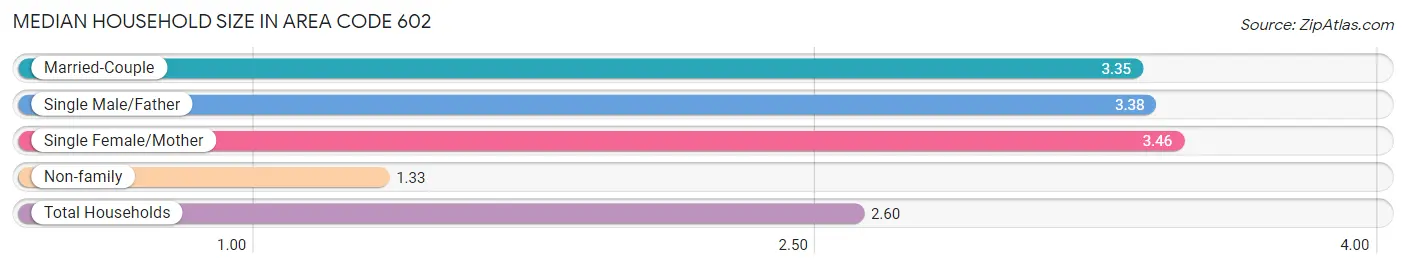
Median Household Size in Area Code 602
The median household size in Area Code 602 is 2.60 persons per household, with single female/mother households (97,985 | 14.0%) accounting for the largest median household size of 3.45711 persons per household. non-family households (283,584 | 40.4%) represent the smallest median household size with 1.33 persons per household.
| Household Type | # Households | Household Size |
| Married-Couple | 272,536 (38.8%) | 3.35 |
| Single Male/Father | 48,037 (6.8%) | 3.38 |
| Single Female/Mother | 97,985 (14.0%) | 3.46 |
| Non-family | 283,584 (40.4%) | 1.33 |
| Total Households | 702,142 (100.0%) | 2.60 |
Household Size by Marriage Status in Area Code 602
Out of a total of 702,142 households in Area Code 602, 418,558 (59.6%) are family households, while 283,584 (40.4%) are nonfamily households. The most numerous type of family households are 2-person households, comprising 165,690, and the most common type of nonfamily households are 1-person households, comprising 208,634.
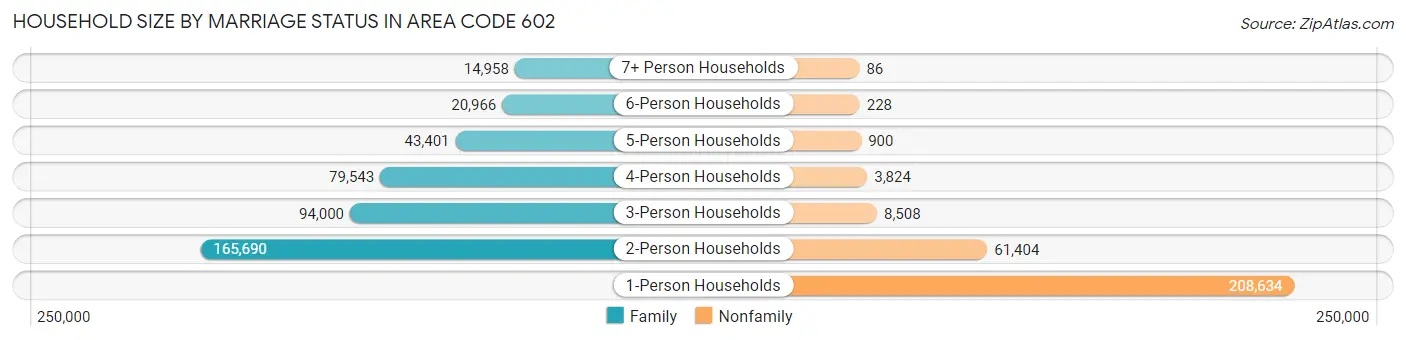
| Household Size | Family Households | Nonfamily Households |
| 1-Person Households | - | 208,634 (29.7%) |
| 2-Person Households | 165,690 (23.6%) | 61,404 (8.7%) |
| 3-Person Households | 94,000 (13.4%) | 8,508 (1.2%) |
| 4-Person Households | 79,543 (11.3%) | 3,824 (0.5%) |
| 5-Person Households | 43,401 (6.2%) | 900 (0.1%) |
| 6-Person Households | 20,966 (3.0%) | 228 (0.0%) |
| 7+ Person Households | 14,958 (2.1%) | 86 (0.0%) |
| Total | 418,558 (59.6%) | 283,584 (40.4%) |
Female Fertility in Area Code 602
Fertility by Age in Area Code 602
Average fertility rate in Area Code 602 is 51.1 births per 1,000 women. Women in the age bracket of 20 to 34 years have the highest fertility rate with 86.7 births per 1,000 women. Women in the age bracket of 20 to 34 years acount for 71.8% of all women with births.
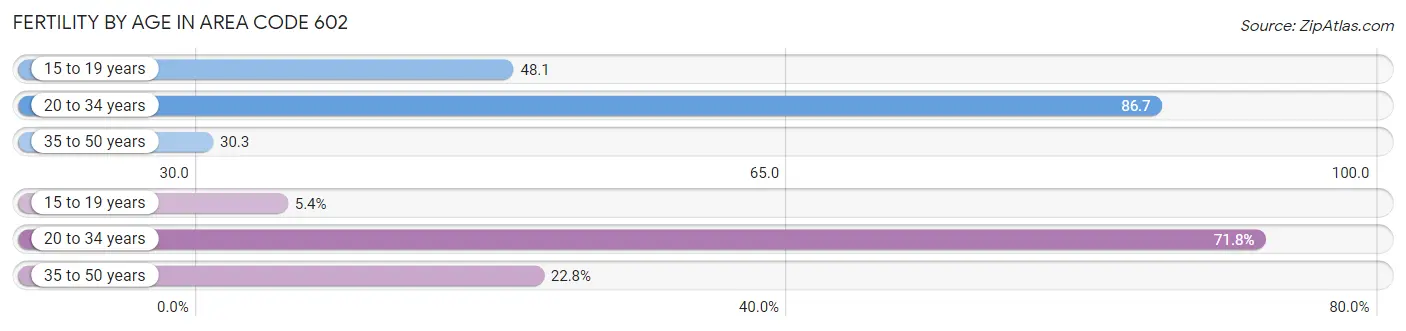
| Age Bracket | Women with Births | Births / 1,000 Women |
| 15 to 19 years | 1,313 (5.4%) | 48.1 |
| 20 to 34 years | 17,433 (71.8%) | 86.7 |
| 35 to 50 years | 5,532 (22.8%) | 30.3 |
| Total | 24,278 (100.0%) | 51.1 |
Fertility by Age by Marriage Status in Area Code 602
61.7% of women with births (24,278) in Area Code 602 are married. The highest percentage of unmarried women with births falls into 15 to 19 years age bracket with 98.9% of them unmarried at the time of birth, while the lowest percentage of unmarried women with births belong to 35 to 50 years age bracket with 32.0% of them unmarried.

| Age Bracket | Married | Unmarried |
| 15 to 19 years | 15 (1.1%) | 1,298 (98.9%) |
| 20 to 34 years | 10,466 (60.0%) | 6,967 (40.0%) |
| 35 to 50 years | 3,764 (68.0%) | 1,768 (32.0%) |
| Total | 14,972 (61.7%) | 9,306 (38.3%) |
Fertility by Education in Area Code 602
Average fertility rate in Area Code 602 is 51.1 births per 1,000 women. Women with the education attainment of graduate degree have the highest fertility rate of 64.5 births per 1,000 women, while women with the education attainment of college or associate's degree have the lowest fertility at 53.5 births per 1,000 women. Women with the education attainment of college or associate's degree represent 29.5% of all women with births.
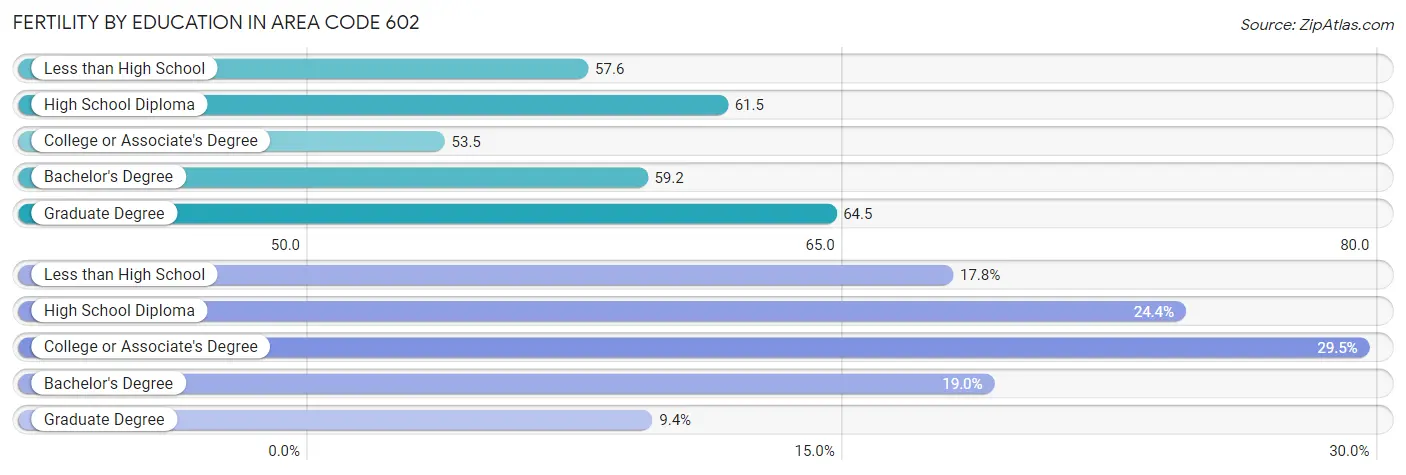
| Educational Attainment | Women with Births | Births / 1,000 Women |
| Less than High School | 4,323 (17.8%) | 57.6 |
| High School Diploma | 5,912 (24.3%) | 61.5 |
| College or Associate's Degree | 7,165 (29.5%) | 53.5 |
| Bachelor's Degree | 4,606 (19.0%) | 59.2 |
| Graduate Degree | 2,272 (9.4%) | 64.5 |
| Total | 24,278 (100.0%) | 51.1 |
Fertility by Education by Marriage Status in Area Code 602
38.3% of women with births in Area Code 602 are unmarried. Women with the educational attainment of graduate degree are most likely to be married with 70.7% of them married at childbirth, while women with the educational attainment of less than high school are least likely to be married with 65.4% of them unmarried at childbirth.
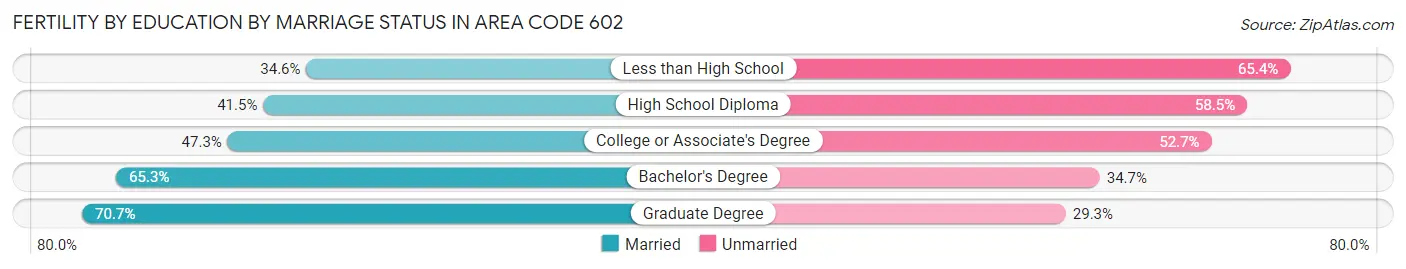
| Educational Attainment | Married | Unmarried |
| Less than High School | 1,495 (34.6%) | 2,828 (65.4%) |
| High School Diploma | 2,455 (41.5%) | 3,457 (58.5%) |
| College or Associate's Degree | 3,387 (47.3%) | 3,778 (52.7%) |
| Bachelor's Degree | 3,006 (65.3%) | 1,600 (34.7%) |
| Graduate Degree | 1,607 (70.7%) | 665 (29.3%) |
| Total | 14,972 (61.7%) | 9,306 (38.3%) |
Employment Characteristics in Area Code 602
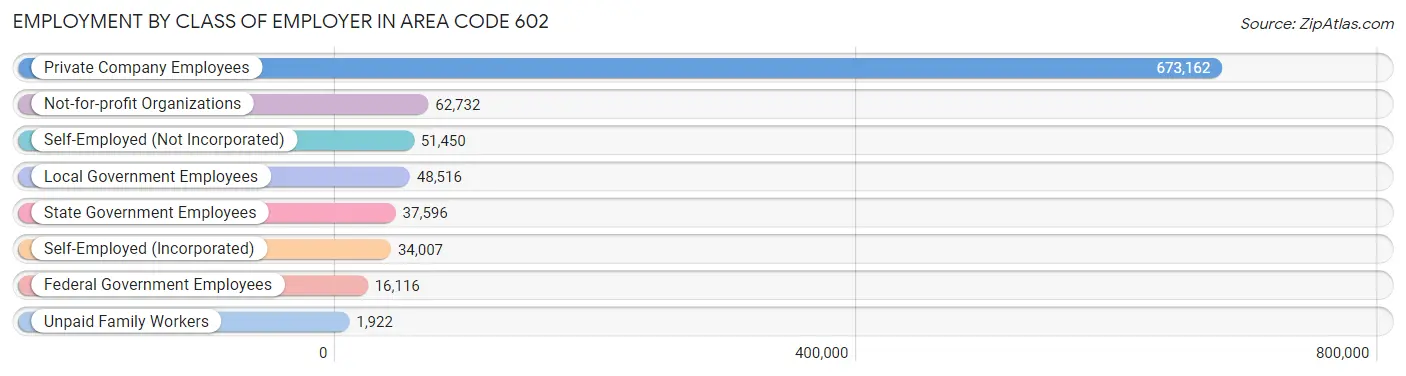
Employment by Class of Employer in Area Code 602
Among the 925,501 employed individuals in Area Code 602, private company employees (673,162 | 72.7%), not-for-profit organizations (62,732 | 6.8%), and self-employed (not incorporated) (51,450 | 5.6%) make up the most common classes of employment.
| Employer Class | # Employees | % Employees |
| Private Company Employees | 673,162 | 72.7% |
| Self-Employed (Incorporated) | 34,007 | 3.7% |
| Self-Employed (Not Incorporated) | 51,450 | 5.6% |
| Not-for-profit Organizations | 62,732 | 6.8% |
| Local Government Employees | 48,516 | 5.2% |
| State Government Employees | 37,596 | 4.1% |
| Federal Government Employees | 16,116 | 1.7% |
| Unpaid Family Workers | 1,922 | 0.2% |
| Total | 925,501 | 100.0% |
Employment Status by Age in Area Code 602
According to the labor force statistics for Area Code 602, out of the total population over 16 years of age (1,465,861), 66.5% or 974,798 individuals are in the labor force, with 5.3% or 51,567 of them unemployed. The age group with the highest labor force participation rate is 25 to 29 years, with 83.8% or 139,474 individuals in the labor force. Within the labor force, the 16 to 19 years age range has the highest percentage of unemployed individuals, with 816.3% or 335,548 of them being unemployed.
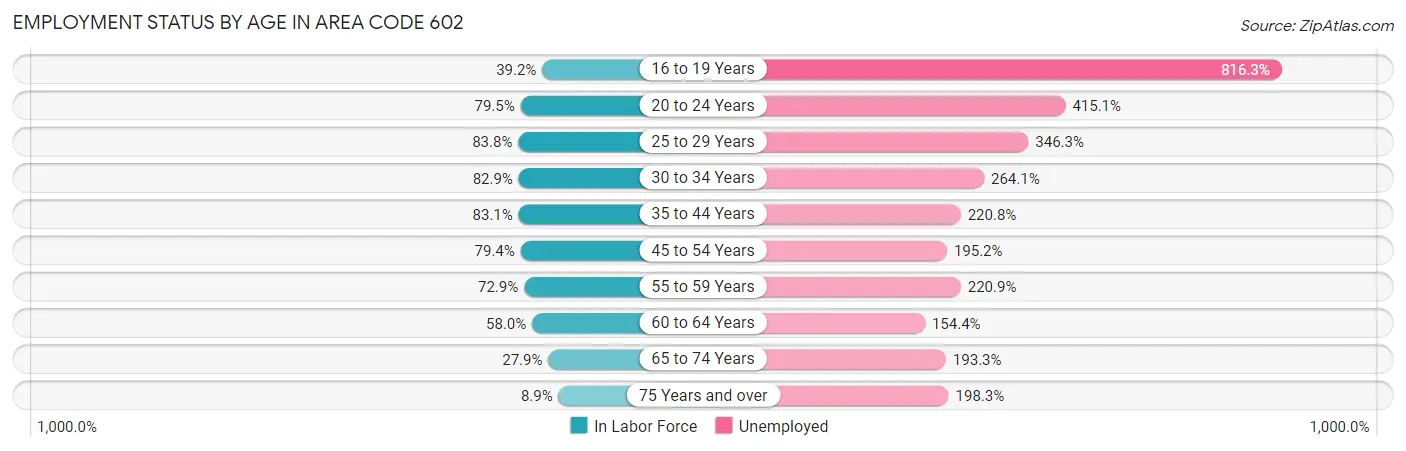
| Age Bracket | In Labor Force | Unemployed |
| 16 to 19 Years | 41,109 (39.2%) | 335,548 (816.3%) |
| 20 to 24 Years | 118,226 (79.5%) | 490,748 (415.1%) |
| 25 to 29 Years | 139,472 (83.8%) | 482,998 (346.3%) |
| 30 to 34 Years | 124,539 (82.9%) | 328,926 (264.1%) |
| 35 to 44 Years | 204,118 (83.1%) | 450,715 (220.8%) |
| 45 to 54 Years | 177,277 (79.4%) | 346,033 (195.2%) |
| 55 to 59 Years | 78,132 (72.9%) | 172,591 (220.9%) |
| 60 to 64 Years | 55,504 (58.0%) | 85,698 (154.4%) |
| 65 to 74 Years | 37,470 (27.9%) | 72,418 (193.3%) |
| 75 Years and over | 7,962 (8.9%) | 15,789 (198.3%) |
| Total | 974,798 (66.5%) | 51,533 (5.3%) |
Employment Status by Educational Attainment in Area Code 602
According to labor force statistics for Area Code 602, 78.7% of individuals (778,470) out of the total population between 25 and 64 years of age (988,659) are in the labor force, with 235.5% or 1,833,297 of them being unemployed. The group with the highest labor force participation rate are those with the educational attainment of bachelor's degree or higher, with 87.2% or 291,043 individuals in the labor force. Within the labor force, individuals with less than high school education have the highest percentage of unemployment, with 347.4% or 322,867 of them being unemployed.
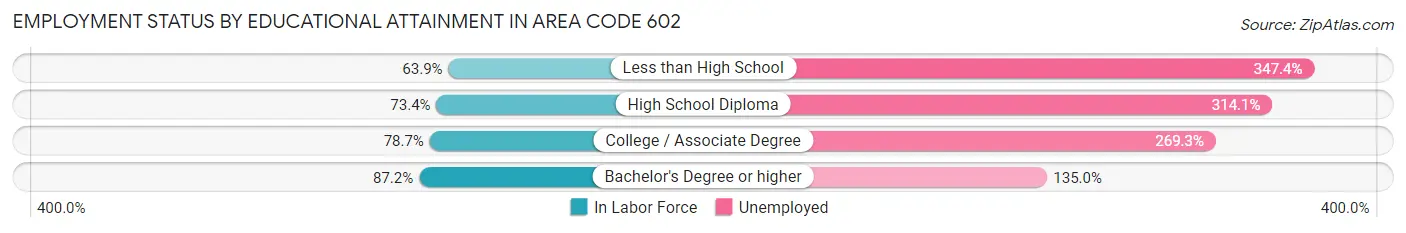
| Educational Attainment | In Labor Force | Unemployed |
| Less than High School | 92,934 (63.9%) | 505,429 (347.4%) |
| High School Diploma | 160,567 (73.4%) | 687,131 (314.1%) |
| College / Associate Degree | 228,677 (78.7%) | 782,290 (269.3%) |
| Bachelor's Degree or higher | 291,035 (87.2%) | 450,789 (135.0%) |
| Total | 778,436 (78.7%) | 2,328,292 (235.5%) |
Employment Occupations by Sex in Area Code 602
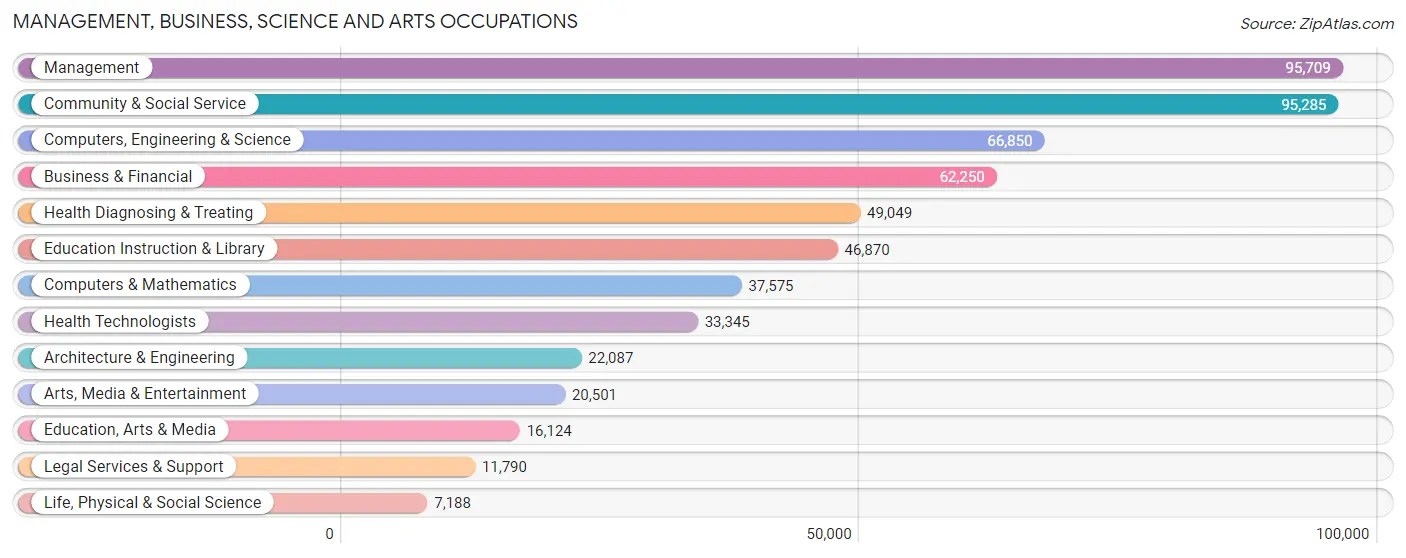
Management, Business, Science and Arts Occupations
The most common Management, Business, Science and Arts occupations in Area Code 602 are Management (95,709 | 10.2%), Community & Social Service (95,285 | 10.1%), Computers, Engineering & Science (66,850 | 7.1%), Business & Financial (62,250 | 6.6%), and Health Diagnosing & Treating (49,049 | 5.2%).
Management, Business, Science and Arts Occupations by Sex
Within the Management, Business, Science and Arts occupations in Area Code 602, the most male-oriented occupations are Architecture & Engineering (84.3%), Computers, Engineering & Science (75.8%), and Computers & Mathematics (74.6%), while the most female-oriented occupations are Health Technologists (71.7%), Health Diagnosing & Treating (70.1%), and Education Instruction & Library (68.2%).
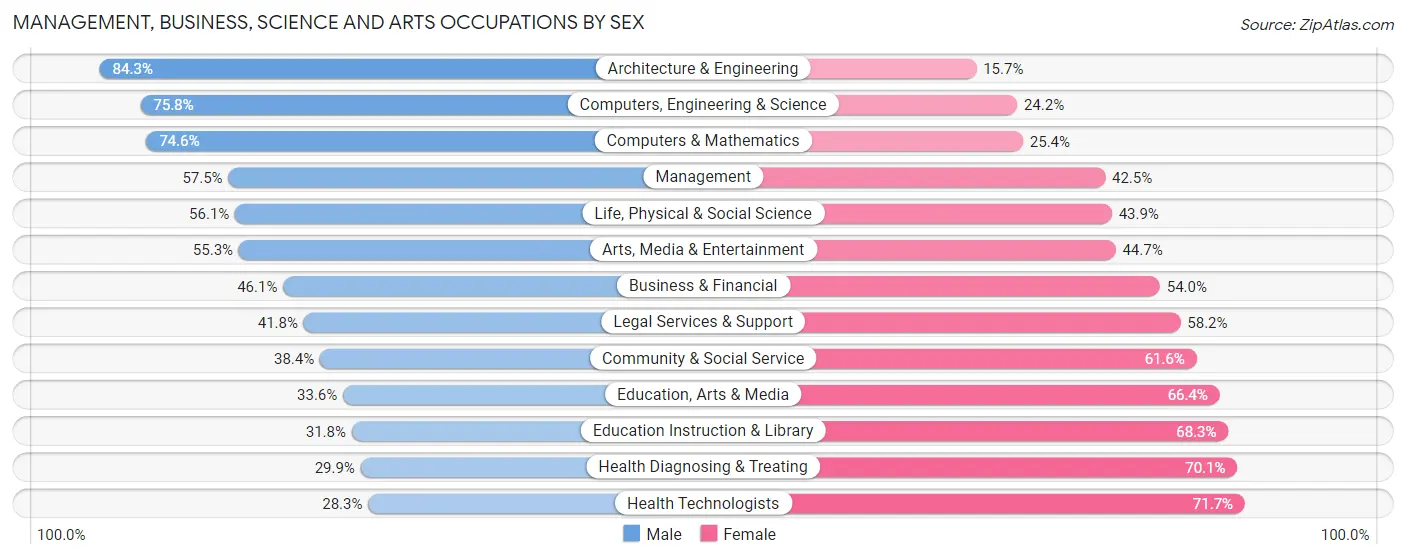
| Occupation | Male | Female |
| Management | 55,013 (57.5%) | 40,696 (42.5%) |
| Business & Financial | 28,666 (46.1%) | 33,584 (53.9%) |
| Computers, Engineering & Science | 50,698 (75.8%) | 16,152 (24.2%) |
| Computers & Mathematics | 28,038 (74.6%) | 9,537 (25.4%) |
| Architecture & Engineering | 18,629 (84.3%) | 3,458 (15.7%) |
| Life, Physical & Social Science | 4,031 (56.1%) | 3,157 (43.9%) |
| Community & Social Service | 36,551 (38.4%) | 58,734 (61.6%) |
| Education, Arts & Media | 5,412 (33.6%) | 10,712 (66.4%) |
| Legal Services & Support | 4,924 (41.8%) | 6,866 (58.2%) |
| Education Instruction & Library | 14,880 (31.8%) | 31,990 (68.2%) |
| Arts, Media & Entertainment | 11,335 (55.3%) | 9,166 (44.7%) |
| Health Diagnosing & Treating | 14,660 (29.9%) | 34,389 (70.1%) |
| Health Technologists | 9,436 (28.3%) | 23,909 (71.7%) |
| Total (Category) | 185,588 (50.3%) | 183,555 (49.7%) |
| Total (Overall) | 513,522 (54.5%) | 428,010 (45.5%) |
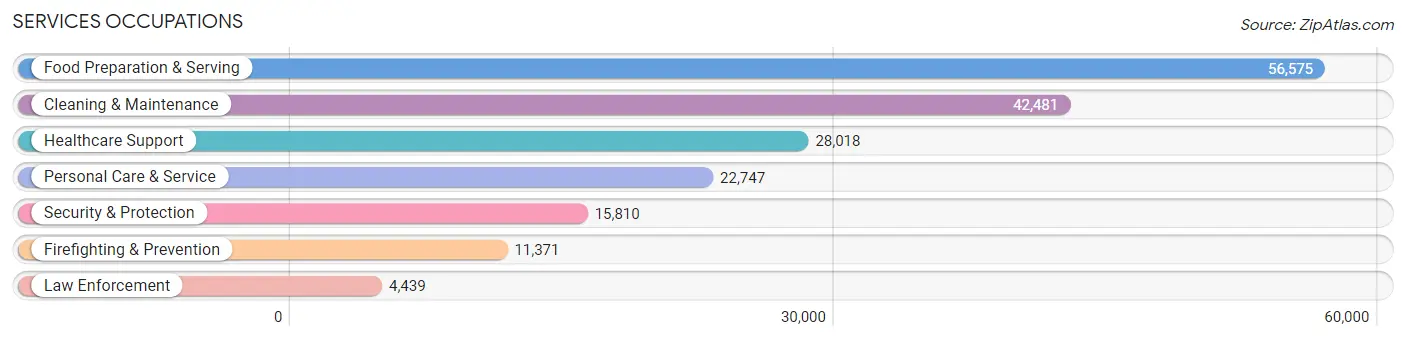
Services Occupations
The most common Services occupations in Area Code 602 are Food Preparation & Serving (56,575 | 6.0%), Cleaning & Maintenance (42,481 | 4.5%), Healthcare Support (28,018 | 3.0%), Personal Care & Service (22,747 | 2.4%), and Security & Protection (15,810 | 1.7%).
Services Occupations by Sex
Within the Services occupations in Area Code 602, the most male-oriented occupations are Law Enforcement (70.6%), Security & Protection (69.7%), and Firefighting & Prevention (69.3%), while the most female-oriented occupations are Healthcare Support (78.6%), Personal Care & Service (71.8%), and Food Preparation & Serving (48.9%).
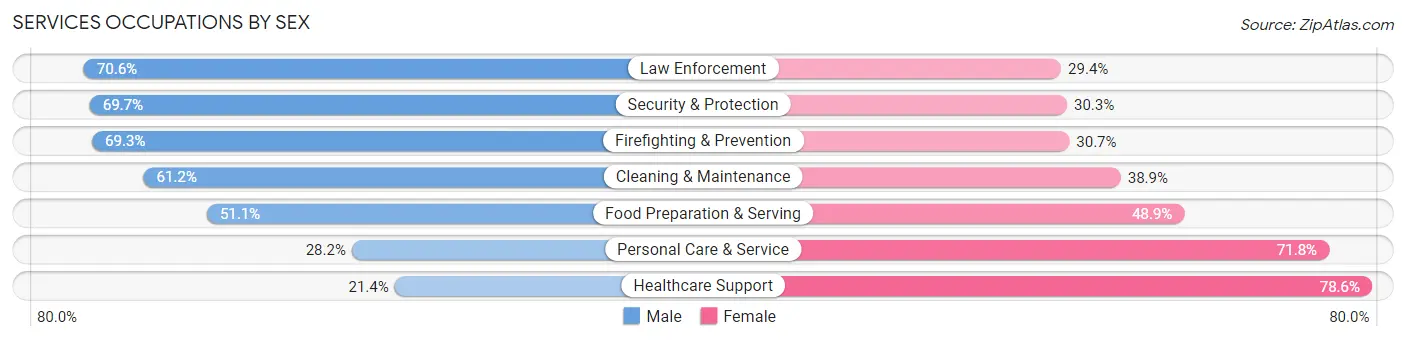
| Occupation | Male | Female |
| Healthcare Support | 5,994 (21.4%) | 22,024 (78.6%) |
| Security & Protection | 11,014 (69.7%) | 4,796 (30.3%) |
| Firefighting & Prevention | 7,880 (69.3%) | 3,491 (30.7%) |
| Law Enforcement | 3,134 (70.6%) | 1,305 (29.4%) |
| Food Preparation & Serving | 28,917 (51.1%) | 27,658 (48.9%) |
| Cleaning & Maintenance | 25,977 (61.2%) | 16,504 (38.9%) |
| Personal Care & Service | 6,409 (28.2%) | 16,338 (71.8%) |
| Total (Category) | 78,311 (47.3%) | 87,320 (52.7%) |
| Total (Overall) | 513,522 (54.5%) | 428,010 (45.5%) |
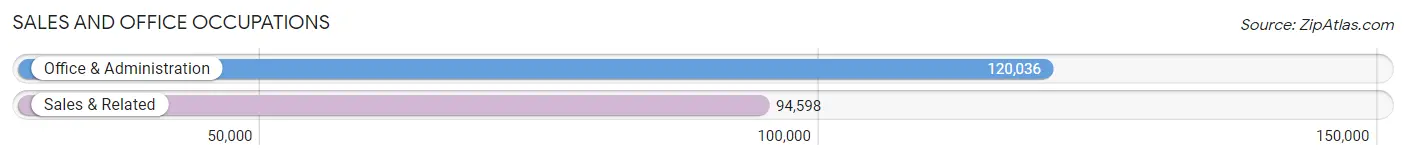
Sales and Office Occupations
The most common Sales and Office occupations in Area Code 602 are Office & Administration (120,036 | 12.8%), and Sales & Related (94,598 | 10.1%).
Sales and Office Occupations by Sex
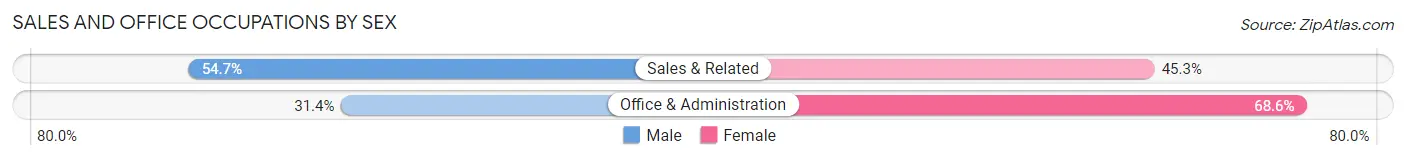
| Occupation | Male | Female |
| Sales & Related | 51,780 (54.7%) | 42,818 (45.3%) |
| Office & Administration | 37,726 (31.4%) | 82,310 (68.6%) |
| Total (Category) | 89,506 (41.7%) | 125,128 (58.3%) |
| Total (Overall) | 513,522 (54.5%) | 428,010 (45.5%) |
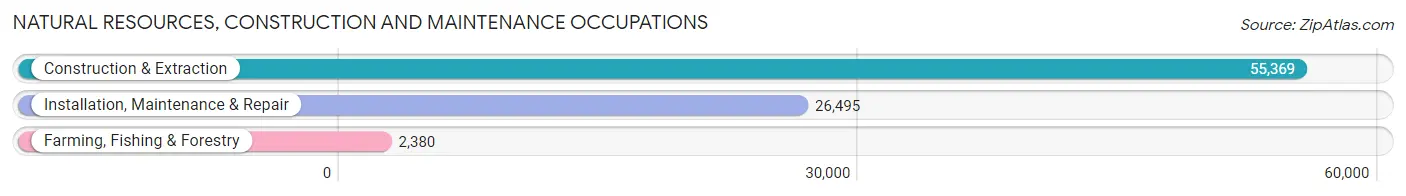
Natural Resources, Construction and Maintenance Occupations
The most common Natural Resources, Construction and Maintenance occupations in Area Code 602 are Construction & Extraction (55,369 | 5.9%), Installation, Maintenance & Repair (26,495 | 2.8%), and Farming, Fishing & Forestry (2,380 | 0.3%).
Natural Resources, Construction and Maintenance Occupations by Sex
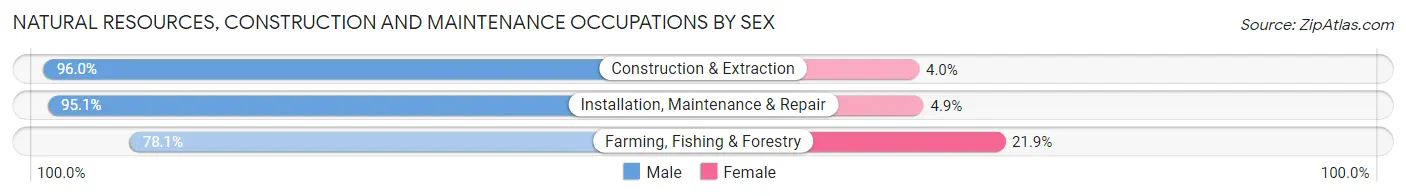
| Occupation | Male | Female |
| Farming, Fishing & Forestry | 1,859 (78.1%) | 521 (21.9%) |
| Construction & Extraction | 53,165 (96.0%) | 2,204 (4.0%) |
| Installation, Maintenance & Repair | 25,194 (95.1%) | 1,301 (4.9%) |
| Total (Category) | 80,218 (95.2%) | 4,026 (4.8%) |
| Total (Overall) | 513,522 (54.5%) | 428,010 (45.5%) |
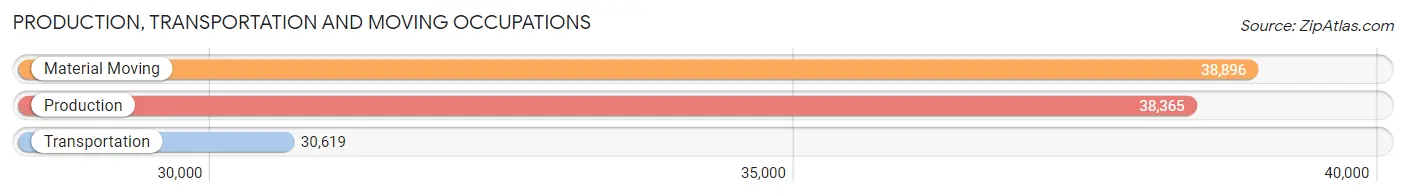
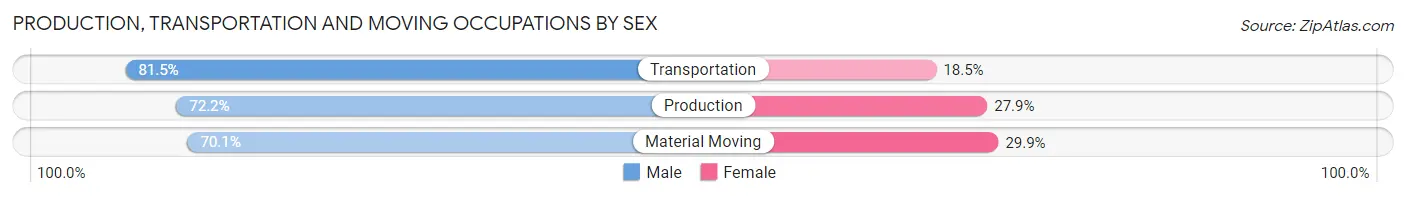
Production, Transportation and Moving Occupations
The most common Production, Transportation and Moving occupations in Area Code 602 are Material Moving (38,896 | 4.1%), Production (38,365 | 4.1%), and Transportation (30,619 | 3.3%).
Production, Transportation and Moving Occupations by Sex
| Occupation | Male | Female |
| Production | 27,680 (72.2%) | 10,685 (27.9%) |
| Transportation | 24,950 (81.5%) | 5,669 (18.5%) |
| Material Moving | 27,269 (70.1%) | 11,627 (29.9%) |
| Total (Category) | 79,899 (74.1%) | 27,981 (25.9%) |
| Total (Overall) | 513,522 (54.5%) | 428,010 (45.5%) |
Employment Industries by Sex in Area Code 602
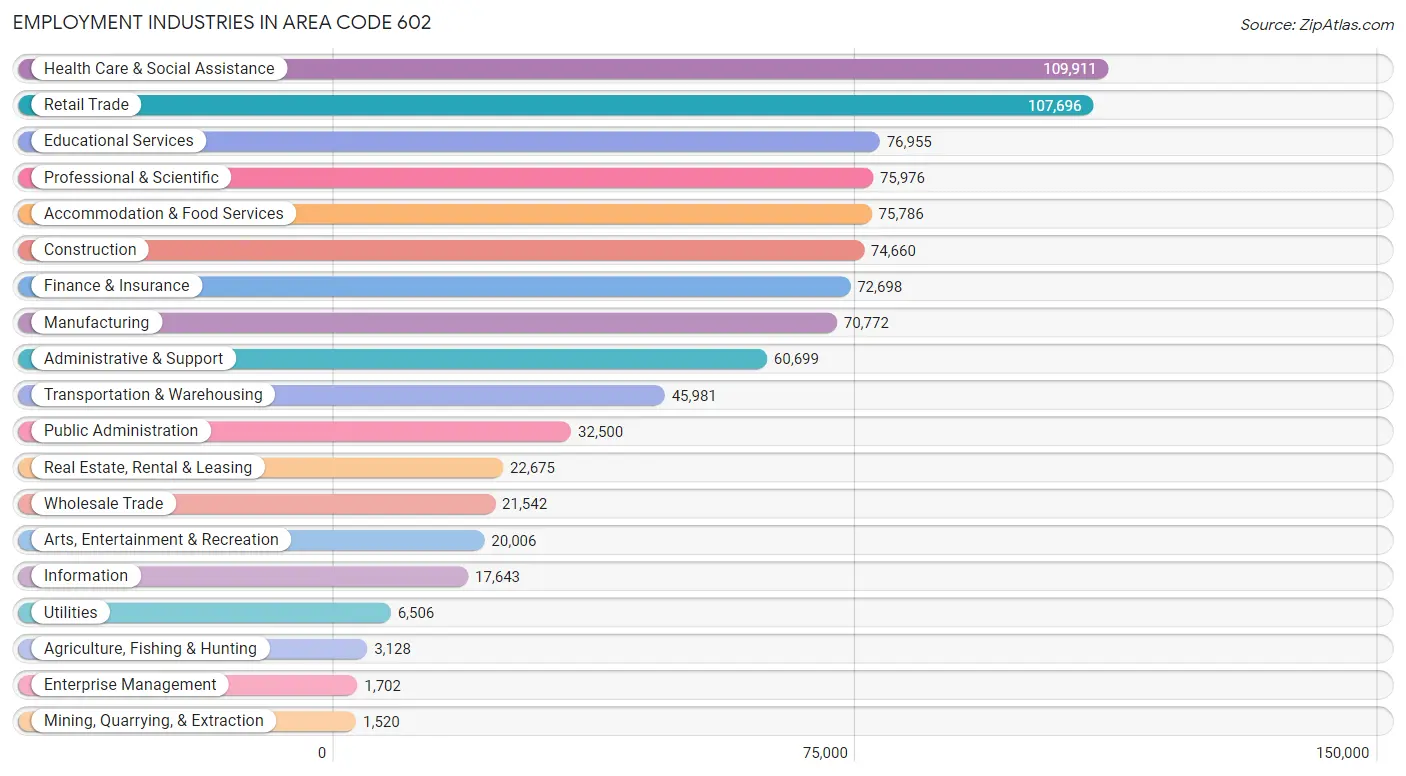
Employment Industries in Area Code 602
The major employment industries in Area Code 602 include Health Care & Social Assistance (109,911 | 11.7%), Retail Trade (107,696 | 11.4%), Educational Services (76,955 | 8.2%), Professional & Scientific (75,976 | 8.1%), and Accommodation & Food Services (75,786 | 8.1%).
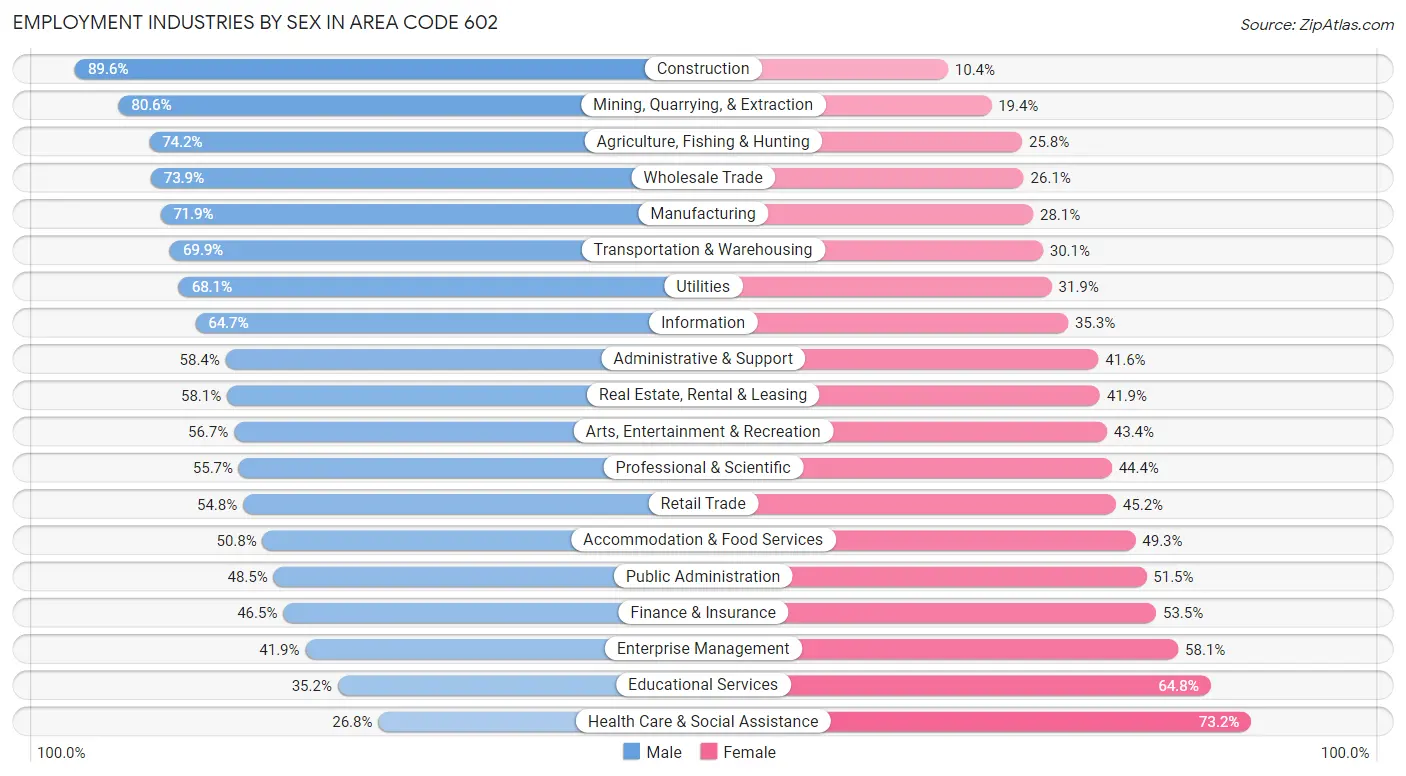
Employment Industries by Sex in Area Code 602
The Area Code 602 industries that see more men than women are Construction (89.6%), Mining, Quarrying, & Extraction (80.6%), and Agriculture, Fishing & Hunting (74.2%), whereas the industries that tend to have a higher number of women are Health Care & Social Assistance (73.2%), Educational Services (64.8%), and Enterprise Management (58.1%).
| Industry | Male | Female |
| Agriculture, Fishing & Hunting | 2,321 (74.2%) | 807 (25.8%) |
| Mining, Quarrying, & Extraction | 1,225 (80.6%) | 295 (19.4%) |
| Construction | 66,864 (89.6%) | 7,796 (10.4%) |
| Manufacturing | 50,903 (71.9%) | 19,869 (28.1%) |
| Wholesale Trade | 15,912 (73.9%) | 5,630 (26.1%) |
| Retail Trade | 58,994 (54.8%) | 48,702 (45.2%) |
| Transportation & Warehousing | 32,147 (69.9%) | 13,834 (30.1%) |
| Utilities | 4,429 (68.1%) | 2,077 (31.9%) |
| Information | 11,410 (64.7%) | 6,233 (35.3%) |
| Finance & Insurance | 33,784 (46.5%) | 38,914 (53.5%) |
| Real Estate, Rental & Leasing | 13,175 (58.1%) | 9,500 (41.9%) |
| Professional & Scientific | 42,283 (55.6%) | 33,693 (44.4%) |
| Enterprise Management | 713 (41.9%) | 989 (58.1%) |
| Administrative & Support | 35,448 (58.4%) | 25,251 (41.6%) |
| Educational Services | 27,082 (35.2%) | 49,873 (64.8%) |
| Health Care & Social Assistance | 29,442 (26.8%) | 80,469 (73.2%) |
| Arts, Entertainment & Recreation | 11,333 (56.7%) | 8,673 (43.3%) |
| Accommodation & Food Services | 38,460 (50.7%) | 37,326 (49.2%) |
| Public Administration | 15,754 (48.5%) | 16,746 (51.5%) |
| Total | 513,522 (54.5%) | 428,010 (45.5%) |
Education in Area Code 602
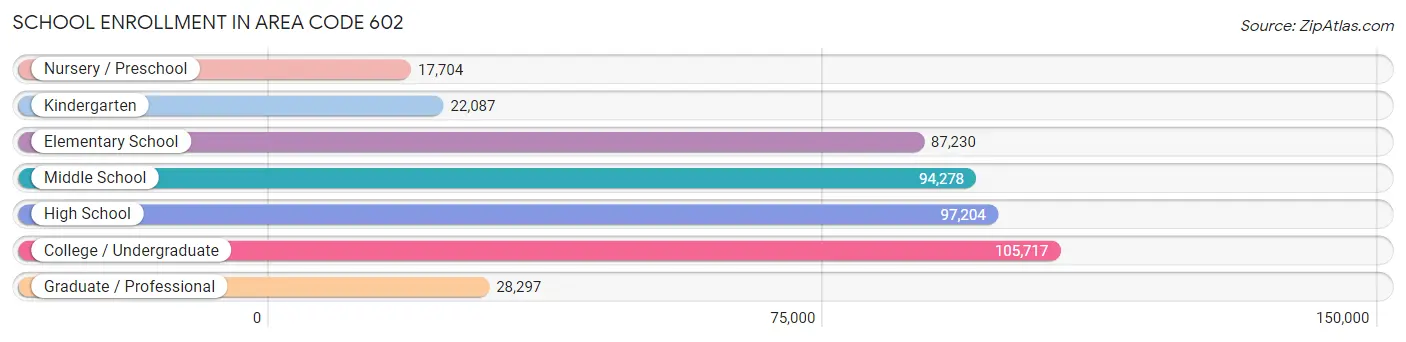
School Enrollment in Area Code 602
The most common levels of schooling among the 452,517 students in Area Code 602 are college / undergraduate (105,717 | 23.4%), high school (97,204 | 21.5%), and middle school (94,278 | 20.8%).
| School Level | # Students | % Students |
| Nursery / Preschool | 17,704 | 3.9% |
| Kindergarten | 22,087 | 4.9% |
| Elementary School | 87,230 | 19.3% |
| Middle School | 94,278 | 20.8% |
| High School | 97,204 | 21.5% |
| College / Undergraduate | 105,717 | 23.4% |
| Graduate / Professional | 28,297 | 6.2% |
| Total | 452,517 | 100.0% |
School Enrollment by Age by Funding Source in Area Code 602
Out of a total of 452,517 students who are enrolled in schools in Area Code 602, 59,090 (13.1%) attend a private institution, while the remaining 393,427 (86.9%) are enrolled in public schools. The age group of 3 to 4 year olds has the highest likelihood of being enrolled in private schools, with 5,537 (37.6% in the age bracket) enrolled. Conversely, the age group of 15 to 17 year olds has the lowest likelihood of being enrolled in a private school, with 64,681 (92.8% in the age bracket) attending a public institution.
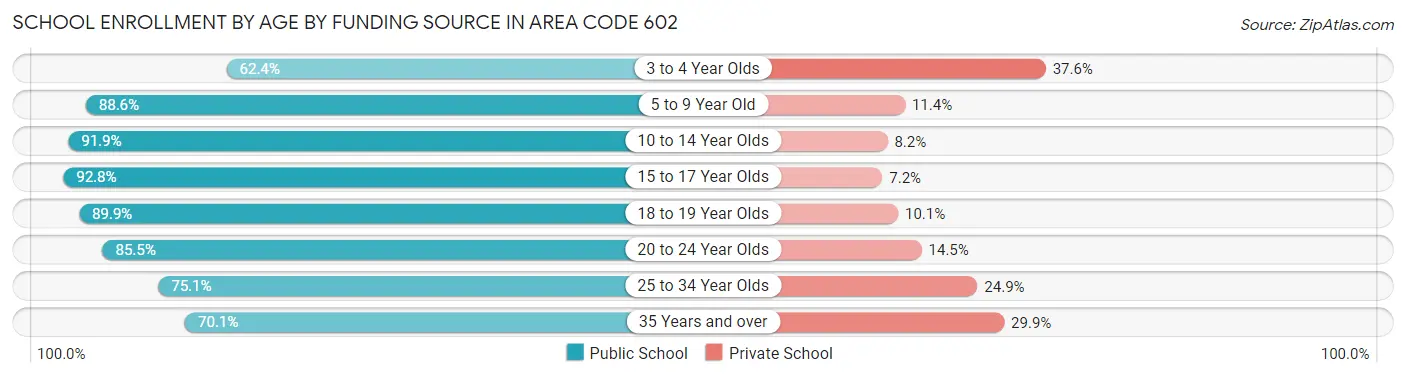
| Age Bracket | Public School | Private School |
| 3 to 4 Year Olds | 9,176 (62.4%) | 5,537 (37.6%) |
| 5 to 9 Year Old | 90,551 (88.6%) | 11,679 (11.4%) |
| 10 to 14 Year Olds | 106,925 (91.8%) | 9,487 (8.2%) |
| 15 to 17 Year Olds | 64,681 (92.8%) | 5,023 (7.2%) |
| 18 to 19 Year Olds | 33,959 (89.9%) | 3,827 (10.1%) |
| 20 to 24 Year Olds | 44,960 (85.5%) | 7,635 (14.5%) |
| 25 to 34 Year Olds | 26,398 (75.1%) | 8,758 (24.9%) |
| 35 Years and over | 16,772 (70.1%) | 7,149 (29.9%) |
| Total | 393,427 (86.9%) | 59,090 (13.1%) |
Educational Attainment by Field of Study in Area Code 602
Business (95,008 | 21.6%), education (43,344 | 9.9%), science & technology (41,328 | 9.4%), engineering (36,389 | 8.3%), and social sciences (34,514 | 7.9%) are the most common fields of study among 439,781 individuals in Area Code 602 who have obtained a bachelor's degree or higher.
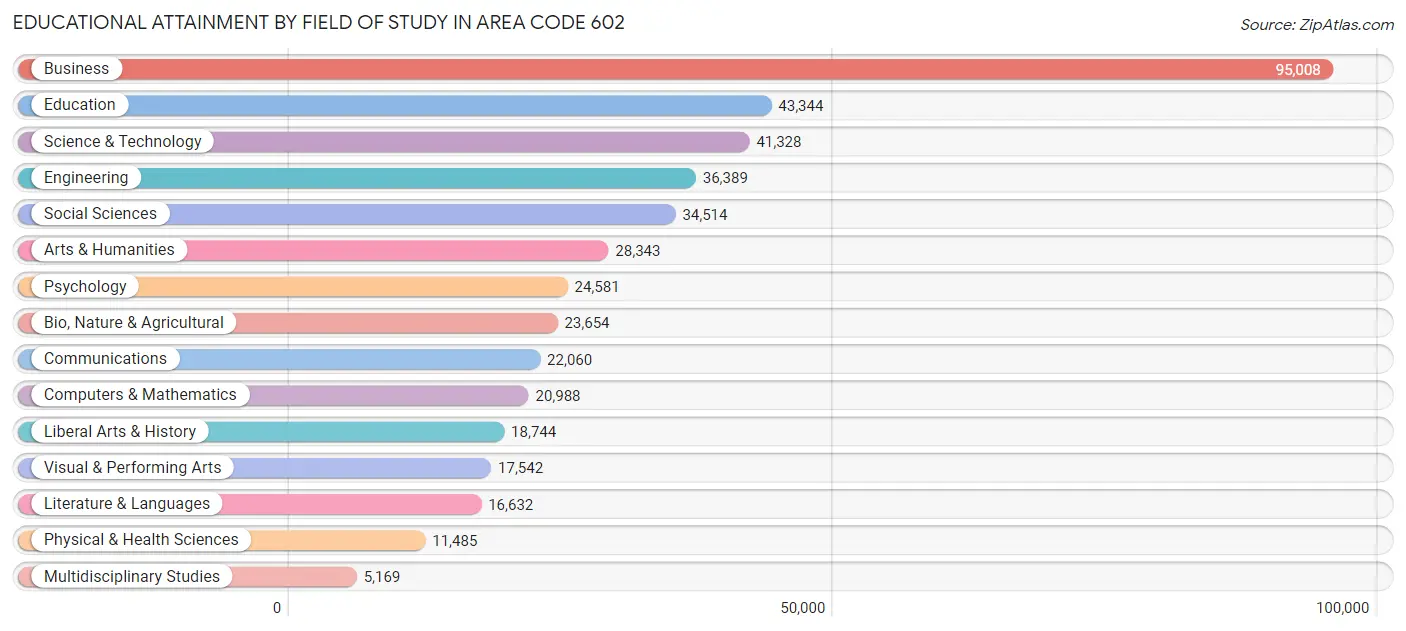
| Field of Study | # Graduates | % Graduates |
| Computers & Mathematics | 20,988 | 4.8% |
| Bio, Nature & Agricultural | 23,654 | 5.4% |
| Physical & Health Sciences | 11,485 | 2.6% |
| Psychology | 24,581 | 5.6% |
| Social Sciences | 34,514 | 7.9% |
| Engineering | 36,389 | 8.3% |
| Multidisciplinary Studies | 5,169 | 1.2% |
| Science & Technology | 41,328 | 9.4% |
| Business | 95,008 | 21.6% |
| Education | 43,344 | 9.9% |
| Literature & Languages | 16,632 | 3.8% |
| Liberal Arts & History | 18,744 | 4.3% |
| Visual & Performing Arts | 17,542 | 4.0% |
| Communications | 22,060 | 5.0% |
| Arts & Humanities | 28,343 | 6.4% |
| Total | 439,781 | 100.0% |
Transportation & Commute in Area Code 602
Vehicle Availability by Sex in Area Code 602
The most prevalent vehicle ownership categories in Area Code 602 are males with 2 vehicles (207,890, accounting for 41.3%) and females with 2 vehicles (168,551, making up 49.8%).
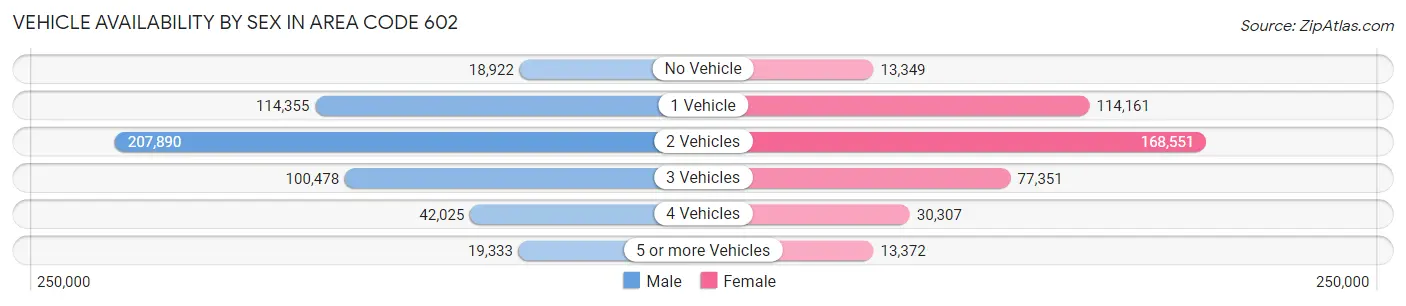
| Vehicles Available | Male | Female |
| No Vehicle | 18,922 (3.8%) | 13,349 (3.2%) |
| 1 Vehicle | 114,355 (22.7%) | 114,161 (27.4%) |
| 2 Vehicles | 207,890 (41.3%) | 168,551 (40.4%) |
| 3 Vehicles | 100,478 (20.0%) | 77,351 (18.5%) |
| 4 Vehicles | 42,025 (8.4%) | 30,307 (7.3%) |
| 5 or more Vehicles | 19,333 (3.8%) | 13,372 (3.2%) |
| Total | 503,003 (100.0%) | 417,091 (100.0%) |
Commute Time in Area Code 602
The most frequently occuring commute durations in Area Code 602 are 20 to 24 minutes (146,773 commuters, 18.7%), 15 to 19 minutes (127,607 commuters, 16.3%), and 30 to 34 minutes (122,981 commuters, 15.7%).
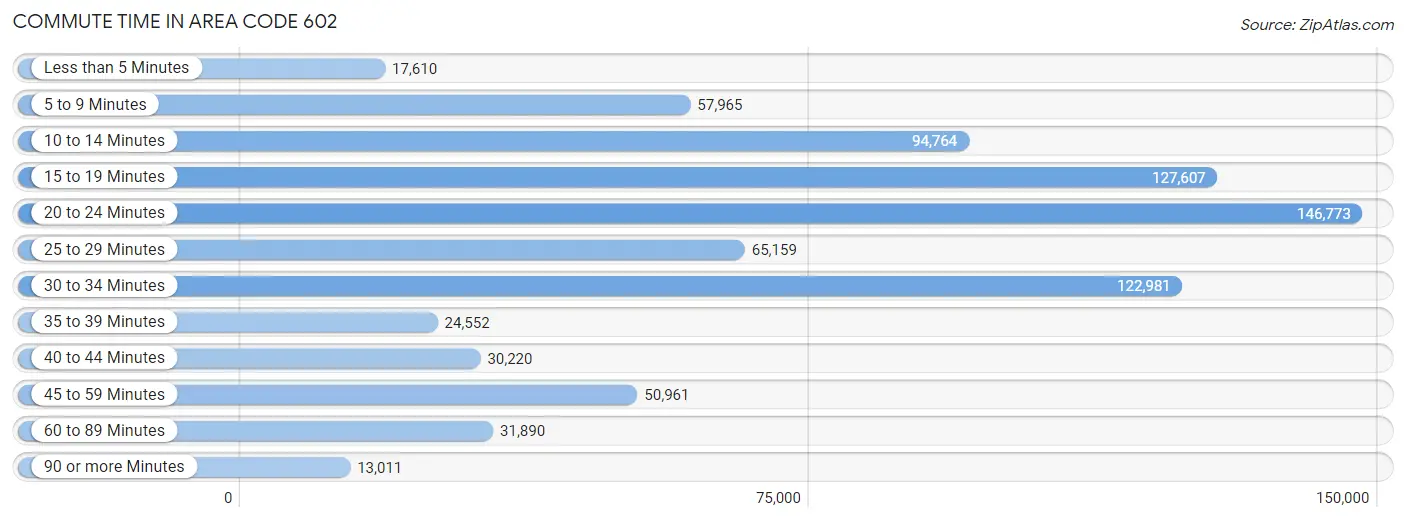
| Commute Time | # Commuters | % Commuters |
| Less than 5 Minutes | 17,610 | 2.2% |
| 5 to 9 Minutes | 57,965 | 7.4% |
| 10 to 14 Minutes | 94,764 | 12.1% |
| 15 to 19 Minutes | 127,607 | 16.3% |
| 20 to 24 Minutes | 146,773 | 18.7% |
| 25 to 29 Minutes | 65,159 | 8.3% |
| 30 to 34 Minutes | 122,981 | 15.7% |
| 35 to 39 Minutes | 24,552 | 3.1% |
| 40 to 44 Minutes | 30,220 | 3.9% |
| 45 to 59 Minutes | 50,961 | 6.5% |
| 60 to 89 Minutes | 31,890 | 4.1% |
| 90 or more Minutes | 13,011 | 1.7% |
Commute Time by Sex in Area Code 602
The most common commute times in Area Code 602 are 20 to 24 minutes (82,188 commuters, 18.8%) for males and 20 to 24 minutes (64,585 commuters, 18.6%) for females.
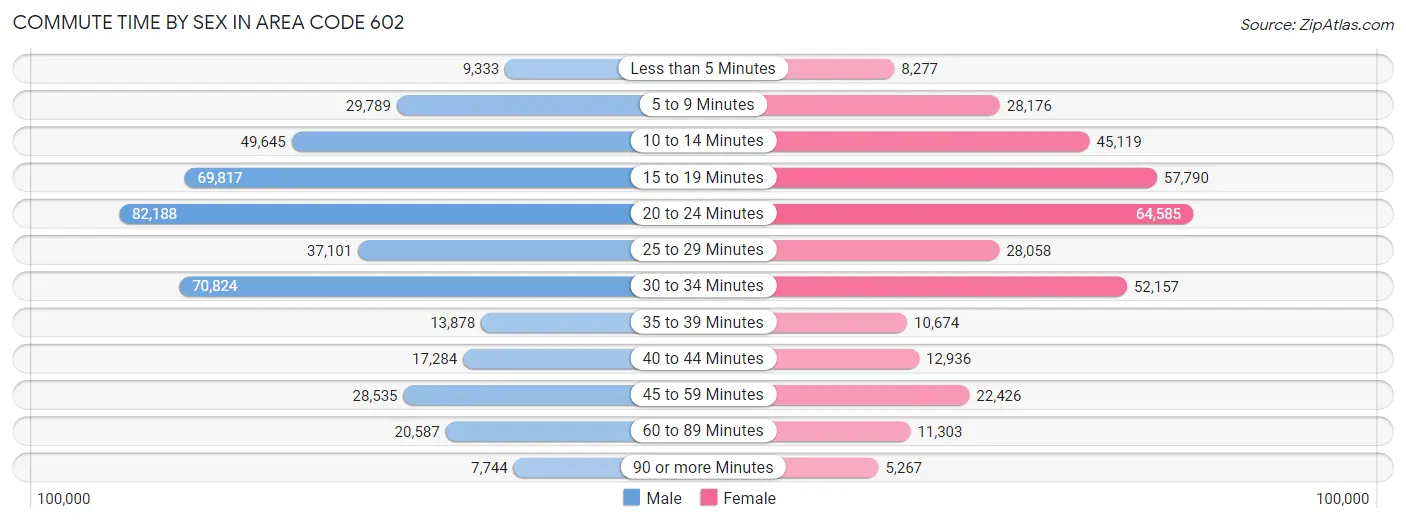
| Commute Time | Male | Female |
| Less than 5 Minutes | 9,333 (2.1%) | 8,277 (2.4%) |
| 5 to 9 Minutes | 29,789 (6.8%) | 28,176 (8.1%) |
| 10 to 14 Minutes | 49,645 (11.4%) | 45,119 (13.0%) |
| 15 to 19 Minutes | 69,817 (16.0%) | 57,790 (16.7%) |
| 20 to 24 Minutes | 82,188 (18.8%) | 64,585 (18.6%) |
| 25 to 29 Minutes | 37,101 (8.5%) | 28,058 (8.1%) |
| 30 to 34 Minutes | 70,824 (16.2%) | 52,157 (15.0%) |
| 35 to 39 Minutes | 13,878 (3.2%) | 10,674 (3.1%) |
| 40 to 44 Minutes | 17,284 (4.0%) | 12,936 (3.7%) |
| 45 to 59 Minutes | 28,535 (6.5%) | 22,426 (6.5%) |
| 60 to 89 Minutes | 20,587 (4.7%) | 11,303 (3.3%) |
| 90 or more Minutes | 7,744 (1.8%) | 5,267 (1.5%) |
Time of Departure to Work by Sex in Area Code 602
The most frequent times of departure to work in Area Code 602 are 7:00 AM to 7:29 AM (51,880, 11.9%) for males and 7:00 AM to 7:29 AM (51,731, 14.9%) for females.
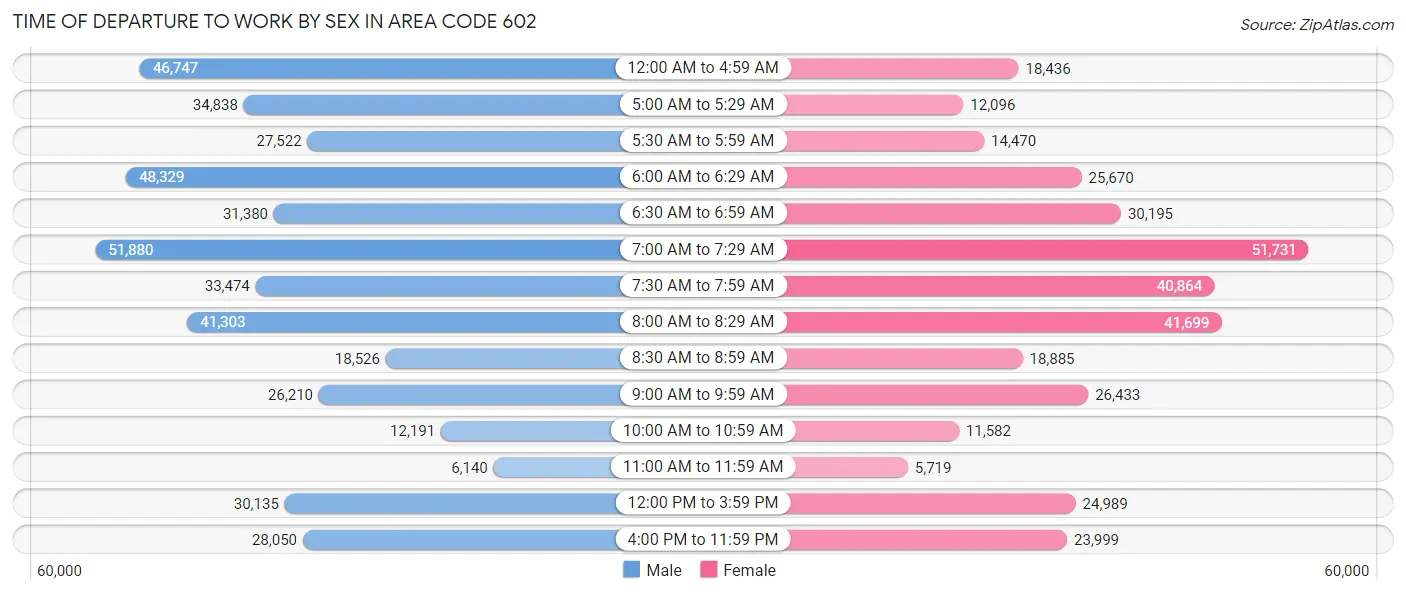
| Time of Departure | Male | Female |
| 12:00 AM to 4:59 AM | 46,747 (10.7%) | 18,436 (5.3%) |
| 5:00 AM to 5:29 AM | 34,838 (8.0%) | 12,096 (3.5%) |
| 5:30 AM to 5:59 AM | 27,522 (6.3%) | 14,470 (4.2%) |
| 6:00 AM to 6:29 AM | 48,329 (11.1%) | 25,670 (7.4%) |
| 6:30 AM to 6:59 AM | 31,380 (7.2%) | 30,195 (8.7%) |
| 7:00 AM to 7:29 AM | 51,880 (11.9%) | 51,731 (14.9%) |
| 7:30 AM to 7:59 AM | 33,474 (7.7%) | 40,864 (11.8%) |
| 8:00 AM to 8:29 AM | 41,303 (9.5%) | 41,699 (12.0%) |
| 8:30 AM to 8:59 AM | 18,526 (4.2%) | 18,885 (5.4%) |
| 9:00 AM to 9:59 AM | 26,210 (6.0%) | 26,433 (7.6%) |
| 10:00 AM to 10:59 AM | 12,191 (2.8%) | 11,582 (3.3%) |
| 11:00 AM to 11:59 AM | 6,140 (1.4%) | 5,719 (1.7%) |
| 12:00 PM to 3:59 PM | 30,135 (6.9%) | 24,989 (7.2%) |
| 4:00 PM to 11:59 PM | 28,050 (6.4%) | 23,999 (6.9%) |
| Total | 436,725 (100.0%) | 346,768 (100.0%) |
Housing Occupancy in Area Code 602
Occupancy by Ownership in Area Code 602
Of the total 702,142 dwellings in Area Code 602, owner-occupied units account for 375,336 (53.5%), while renter-occupied units make up 326,806 (46.5%).
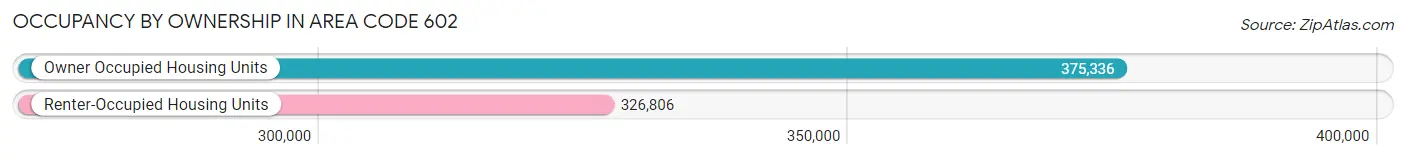
| Occupancy | # Housing Units | % Housing Units |
| Owner Occupied Housing Units | 375,336 | 53.5% |
| Renter-Occupied Housing Units | 326,806 | 46.5% |
| Total Occupied Housing Units | 702,142 | 100.0% |
Occupancy by Household Size in Area Code 602
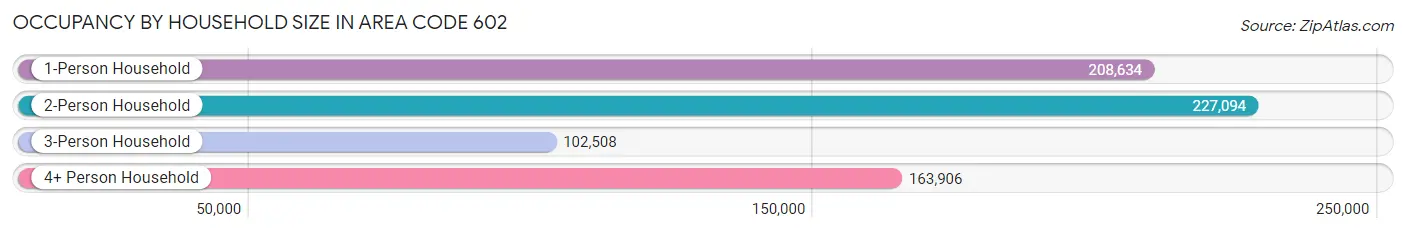
| Household Size | # Housing Units | % Housing Units |
| 1-Person Household | 208,634 | 29.7% |
| 2-Person Household | 227,094 | 32.3% |
| 3-Person Household | 102,508 | 14.6% |
| 4+ Person Household | 163,906 | 23.3% |
| Total Housing Units | 702,142 | 100.0% |
Occupancy by Ownership by Household Size in Area Code 602
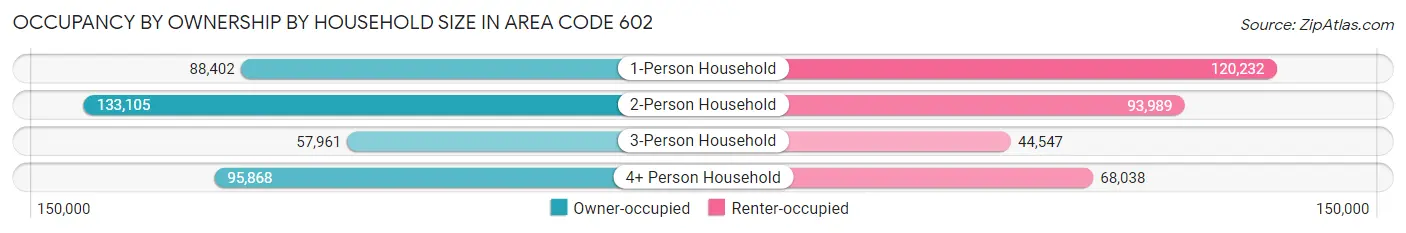
| Household Size | Owner-occupied | Renter-occupied |
| 1-Person Household | 88,402 (42.4%) | 120,232 (57.6%) |
| 2-Person Household | 133,105 (58.6%) | 93,989 (41.4%) |
| 3-Person Household | 57,961 (56.5%) | 44,547 (43.5%) |
| 4+ Person Household | 95,868 (58.5%) | 68,038 (41.5%) |
| Total Housing Units | 375,336 (53.5%) | 326,806 (46.5%) |
Occupancy by Educational Attainment in Area Code 602
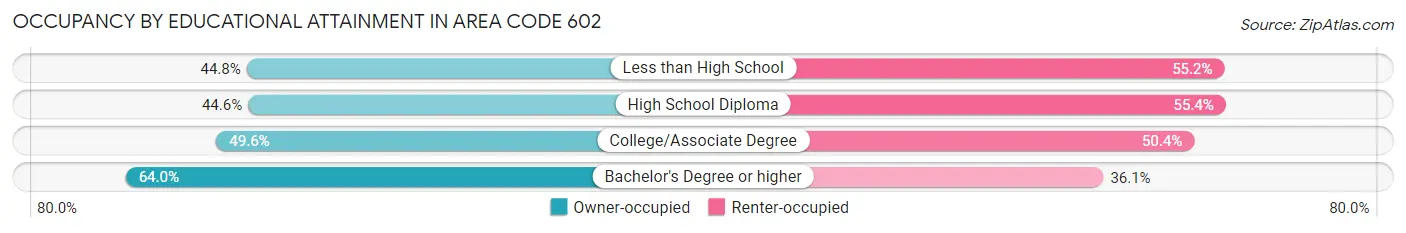
| Household Size | Owner-occupied | Renter-occupied |
| Less than High School | 37,070 (44.8%) | 45,683 (55.2%) |
| High School Diploma | 58,541 (44.6%) | 72,794 (55.4%) |
| College/Associate Degree | 111,662 (49.6%) | 113,586 (50.4%) |
| Bachelor's Degree or higher | 168,063 (63.9%) | 94,743 (36.0%) |
Occupancy by Age of Householder in Area Code 602
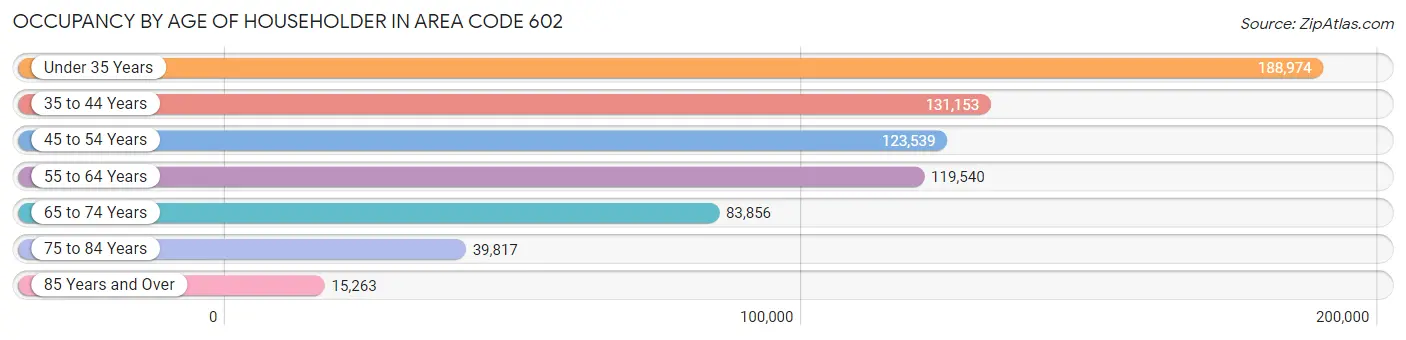
| Age Bracket | # Households | % Households |
| Under 35 Years | 188,974 | 26.9% |
| 35 to 44 Years | 131,153 | 18.7% |
| 45 to 54 Years | 123,539 | 17.6% |
| 55 to 64 Years | 119,540 | 17.0% |
| 65 to 74 Years | 83,856 | 11.9% |
| 75 to 84 Years | 39,817 | 5.7% |
| 85 Years and Over | 15,263 | 2.2% |
| Total | 702,142 | 100.0% |
Housing Finances in Area Code 602
Median Income by Occupancy in Area Code 602
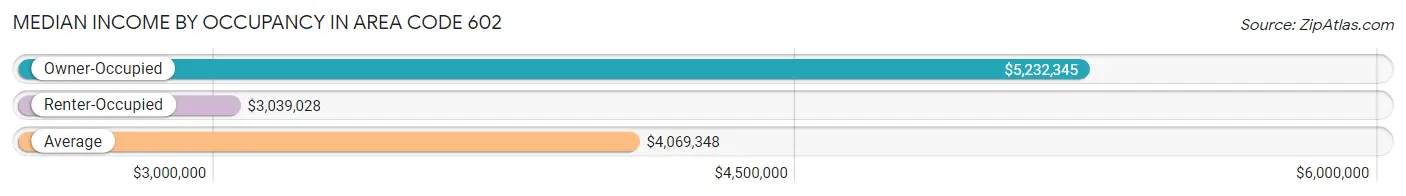
| Occupancy Type | # Households | Median Income |
| Owner-Occupied | 375,336 (53.5%) | $5,232,345 |
| Renter-Occupied | 326,806 (46.5%) | $3,039,028 |
| Average | 702,142 (100.0%) | $4,069,348 |
Occupancy by Householder Income Bracket in Area Code 602
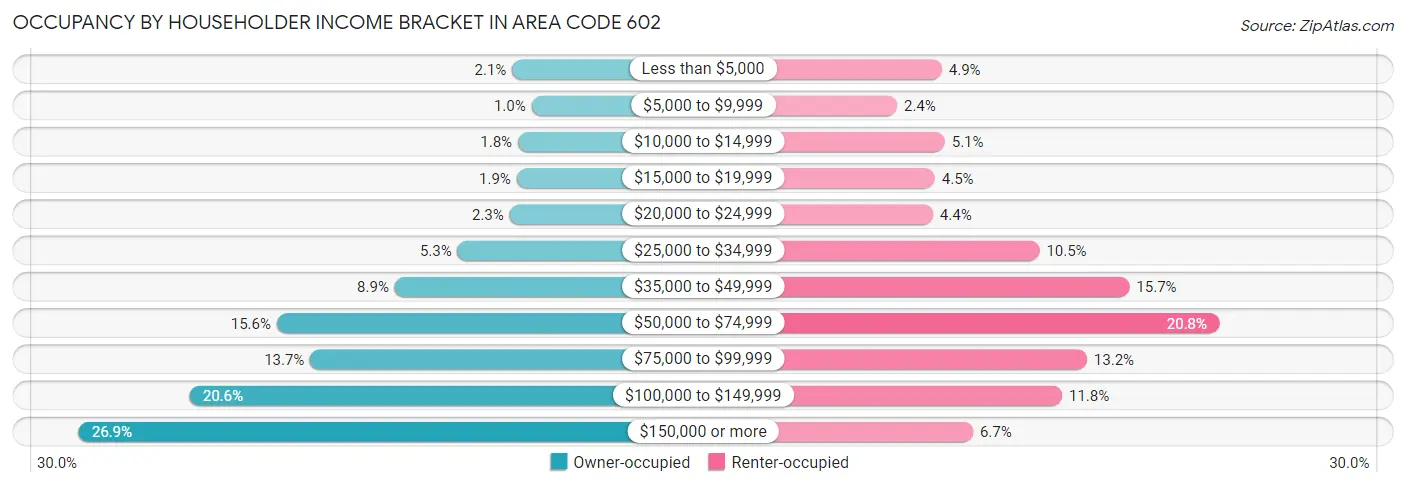
| Income Bracket | Owner-occupied | Renter-occupied |
| Less than $5,000 | 8,040 (2.1%) | 16,096 (4.9%) |
| $5,000 to $9,999 | 3,879 (1.0%) | 7,751 (2.4%) |
| $10,000 to $14,999 | 6,805 (1.8%) | 16,672 (5.1%) |
| $15,000 to $19,999 | 7,064 (1.9%) | 14,804 (4.5%) |
| $20,000 to $24,999 | 8,578 (2.3%) | 14,453 (4.4%) |
| $25,000 to $34,999 | 19,754 (5.3%) | 34,349 (10.5%) |
| $35,000 to $49,999 | 33,217 (8.8%) | 51,145 (15.7%) |
| $50,000 to $74,999 | 58,528 (15.6%) | 67,855 (20.8%) |
| $75,000 to $99,999 | 51,336 (13.7%) | 43,214 (13.2%) |
| $100,000 to $149,999 | 77,159 (20.6%) | 38,548 (11.8%) |
| $150,000 or more | 100,976 (26.9%) | 21,919 (6.7%) |
| Total | 375,336 (100.0%) | 326,806 (100.0%) |
Monthly Housing Cost Tiers in Area Code 602
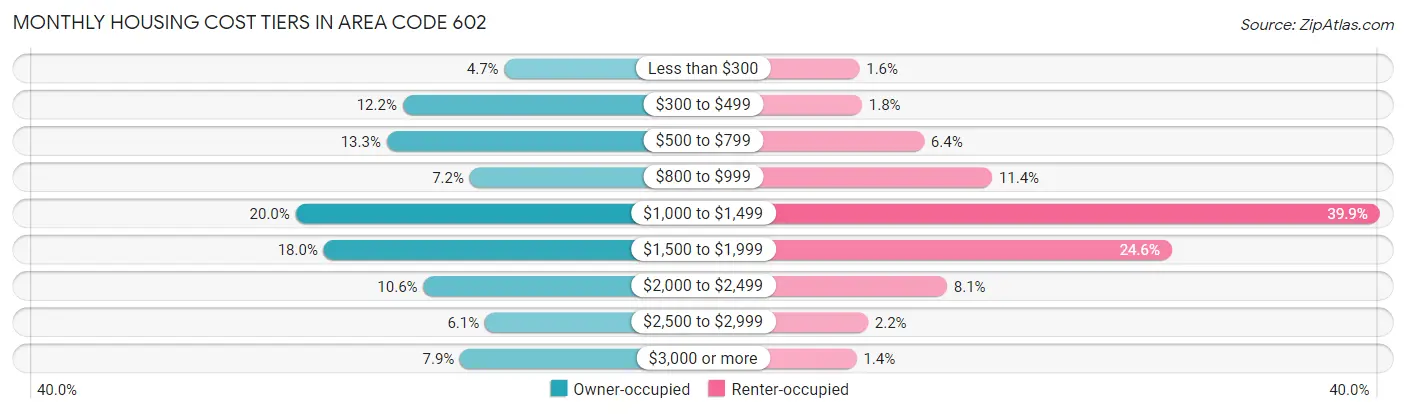
| Monthly Cost | Owner-occupied | Renter-occupied |
| Less than $300 | 17,472 (4.7%) | 5,249 (1.6%) |
| $300 to $499 | 45,599 (12.1%) | 5,880 (1.8%) |
| $500 to $799 | 50,047 (13.3%) | 20,830 (6.4%) |
| $800 to $999 | 27,049 (7.2%) | 37,195 (11.4%) |
| $1,000 to $1,499 | 75,225 (20.0%) | 130,495 (39.9%) |
| $1,500 to $1,999 | 67,462 (18.0%) | 80,462 (24.6%) |
| $2,000 to $2,499 | 39,880 (10.6%) | 26,335 (8.1%) |
| $2,500 to $2,999 | 22,863 (6.1%) | 7,321 (2.2%) |
| $3,000 or more | 29,739 (7.9%) | 4,588 (1.4%) |
| Total | 375,336 (100.0%) | 326,806 (100.0%) |
Physical Housing Characteristics in Area Code 602
Housing Structures in Area Code 602
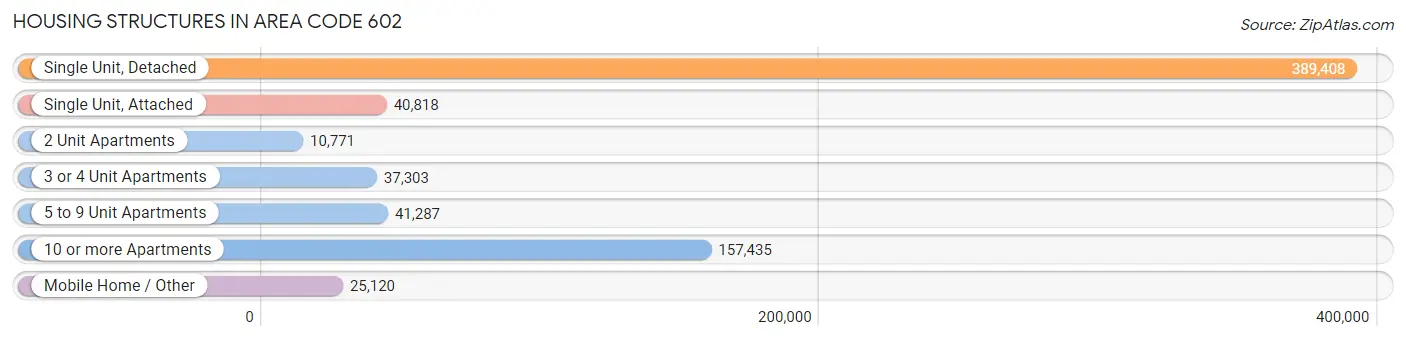
| Structure Type | # Housing Units | % Housing Units |
| Single Unit, Detached | 389,408 | 55.5% |
| Single Unit, Attached | 40,818 | 5.8% |
| 2 Unit Apartments | 10,771 | 1.5% |
| 3 or 4 Unit Apartments | 37,303 | 5.3% |
| 5 to 9 Unit Apartments | 41,287 | 5.9% |
| 10 or more Apartments | 157,435 | 22.4% |
| Mobile Home / Other | 25,120 | 3.6% |
| Total | 702,142 | 100.0% |
Housing Structures by Occupancy in Area Code 602
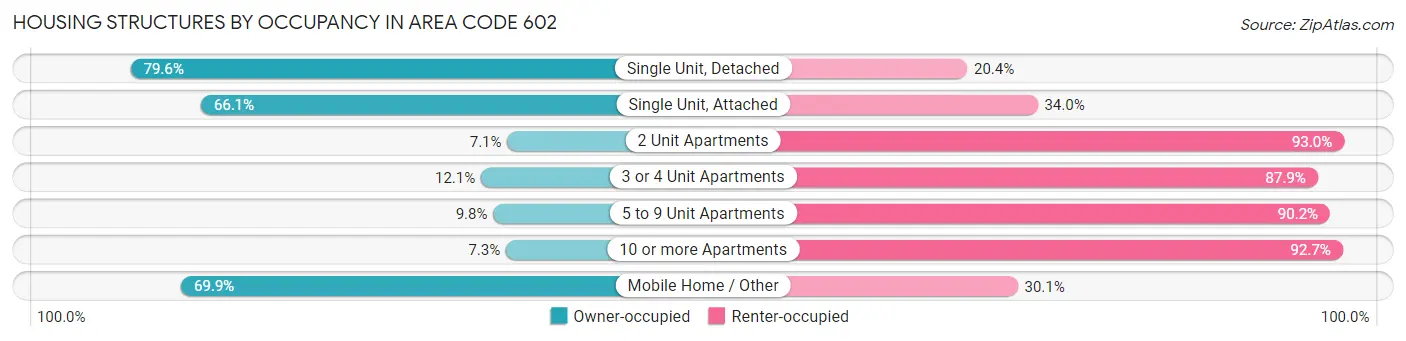
| Structure Type | Owner-occupied | Renter-occupied |
| Single Unit, Detached | 310,010 (79.6%) | 79,398 (20.4%) |
| Single Unit, Attached | 26,961 (66.0%) | 13,857 (34.0%) |
| 2 Unit Apartments | 759 (7.0%) | 10,012 (92.9%) |
| 3 or 4 Unit Apartments | 4,522 (12.1%) | 32,781 (87.9%) |
| 5 to 9 Unit Apartments | 4,031 (9.8%) | 37,256 (90.2%) |
| 10 or more Apartments | 11,496 (7.3%) | 145,939 (92.7%) |
| Mobile Home / Other | 17,557 (69.9%) | 7,563 (30.1%) |
| Total | 375,336 (53.5%) | 326,806 (46.5%) |
Housing Structures by Number of Rooms in Area Code 602
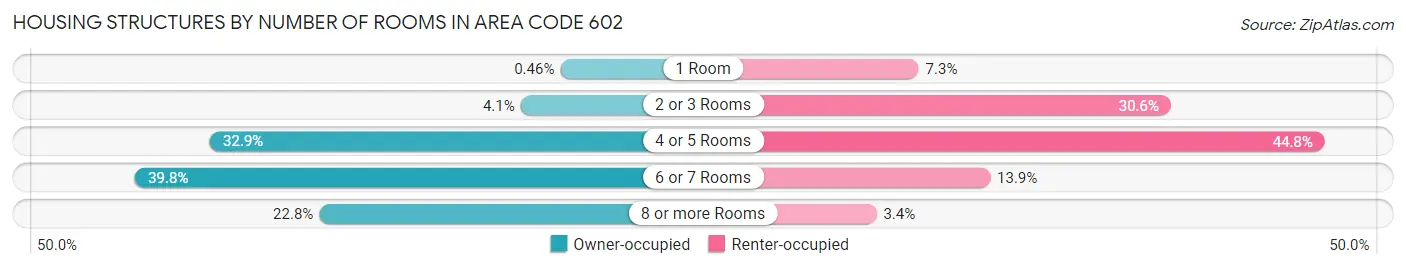
| Number of Rooms | Owner-occupied | Renter-occupied |
| 1 Room | 1,739 (0.5%) | 23,790 (7.3%) |
| 2 or 3 Rooms | 15,487 (4.1%) | 100,010 (30.6%) |
| 4 or 5 Rooms | 123,329 (32.9%) | 146,550 (44.8%) |
| 6 or 7 Rooms | 149,345 (39.8%) | 45,397 (13.9%) |
| 8 or more Rooms | 85,436 (22.8%) | 11,059 (3.4%) |
| Total | 375,336 (100.0%) | 326,806 (100.0%) |
Housing Structure by Heating Type in Area Code 602
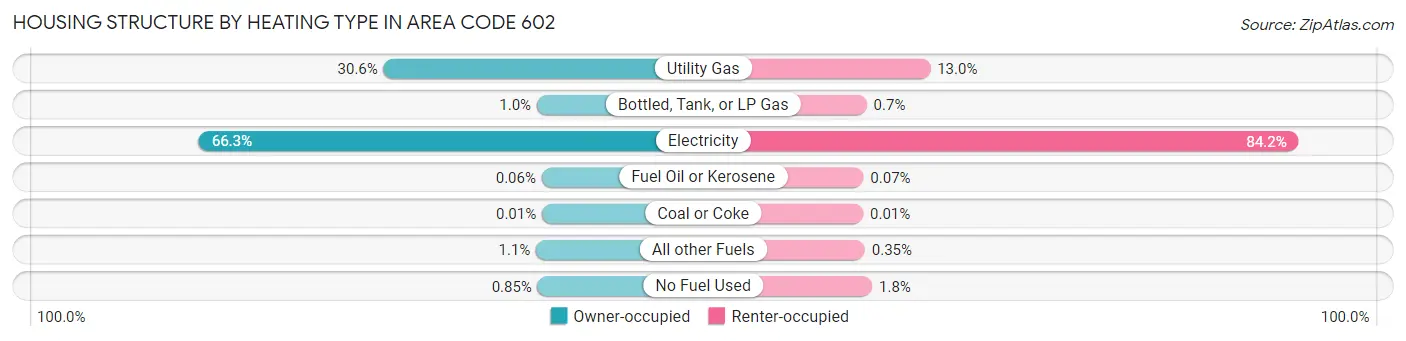
| Heating Type | Owner-occupied | Renter-occupied |
| Utility Gas | 114,911 (30.6%) | 42,425 (13.0%) |
| Bottled, Tank, or LP Gas | 3,755 (1.0%) | 2,272 (0.7%) |
| Electricity | 248,951 (66.3%) | 275,005 (84.2%) |
| Fuel Oil or Kerosene | 215 (0.1%) | 231 (0.1%) |
| Coal or Coke | 25 (0.0%) | 23 (0.0%) |
| All other Fuels | 4,282 (1.1%) | 1,133 (0.4%) |
| No Fuel Used | 3,197 (0.9%) | 5,717 (1.8%) |
| Total | 375,336 (100.0%) | 326,806 (100.0%) |
Household Vehicle Usage in Area Code 602
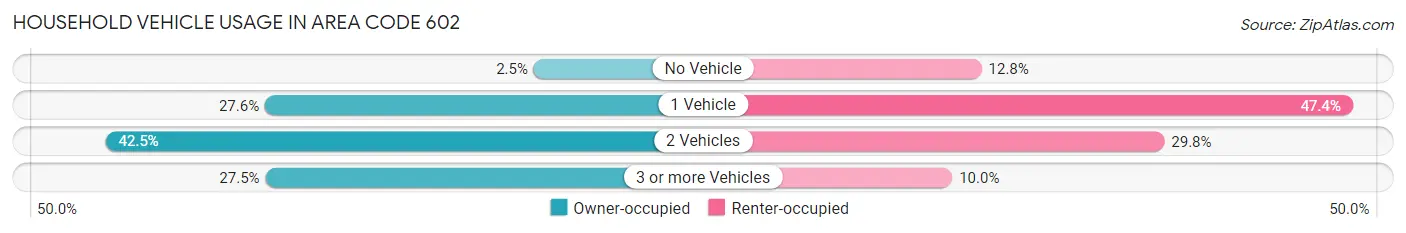
| Vehicles per Household | Owner-occupied | Renter-occupied |
| No Vehicle | 9,287 (2.5%) | 41,712 (12.8%) |
| 1 Vehicle | 103,425 (27.6%) | 154,896 (47.4%) |
| 2 Vehicles | 159,316 (42.4%) | 97,448 (29.8%) |
| 3 or more Vehicles | 103,308 (27.5%) | 32,750 (10.0%) |
| Total | 375,336 (100.0%) | 326,806 (100.0%) |
Real Estate & Mortgages in Area Code 602
Real Estate and Mortgage Overview in Area Code 602
| Characteristic | Without Mortgage | With Mortgage |
| Housing Units | 125,404 | 249,932 |
| Median Property Value | $19,169,800 | $21,335,400 |
| Median Household Income | $3,946,150 | $77,467 |
| Monthly Housing Costs | $27,892 | $29,166 |
| Real Estate Taxes | $97,901 | $7,177 |
Property Value by Mortgage Status in Area Code 602
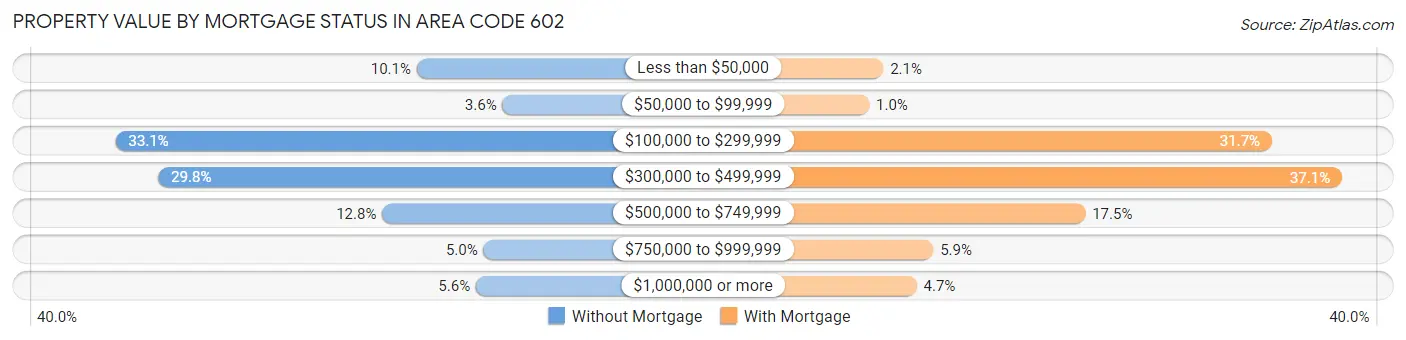
| Property Value | Without Mortgage | With Mortgage |
| Less than $50,000 | 12,685 (10.1%) | 5,272 (2.1%) |
| $50,000 to $99,999 | 4,504 (3.6%) | 2,568 (1.0%) |
| $100,000 to $299,999 | 41,481 (33.1%) | 79,276 (31.7%) |
| $300,000 to $499,999 | 37,402 (29.8%) | 92,654 (37.1%) |
| $500,000 to $749,999 | 15,985 (12.8%) | 43,743 (17.5%) |
| $750,000 to $999,999 | 6,310 (5.0%) | 14,791 (5.9%) |
| $1,000,000 or more | 7,037 (5.6%) | 11,628 (4.6%) |
| Total | 125,404 (100.0%) | 249,932 (100.0%) |
Household Income by Mortgage Status in Area Code 602
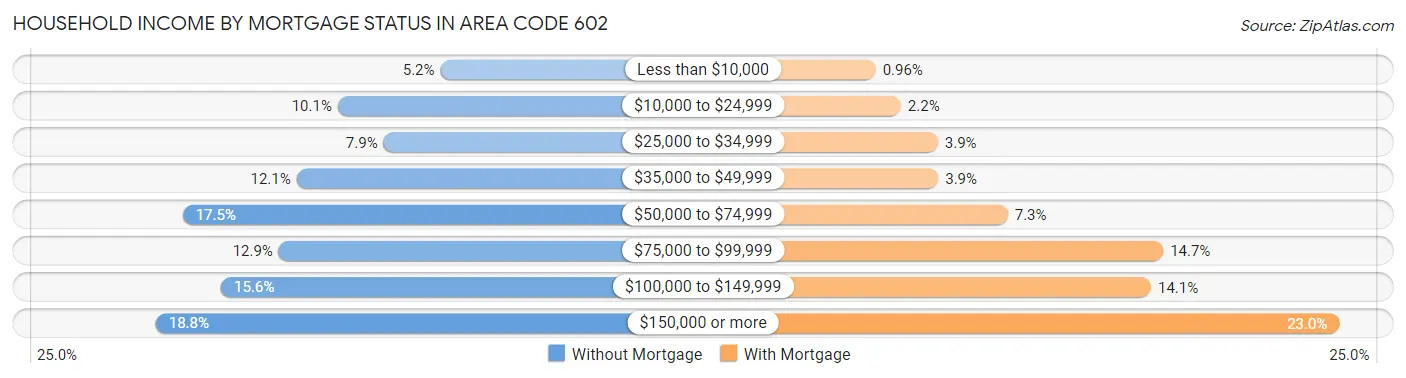
| Household Income | Without Mortgage | With Mortgage |
| Less than $10,000 | 6,521 (5.2%) | 2,406 (1.0%) |
| $10,000 to $24,999 | 12,653 (10.1%) | 5,398 (2.2%) |
| $25,000 to $34,999 | 9,915 (7.9%) | 9,794 (3.9%) |
| $35,000 to $49,999 | 15,106 (12.0%) | 9,839 (3.9%) |
| $50,000 to $74,999 | 21,913 (17.5%) | 18,111 (7.2%) |
| $75,000 to $99,999 | 16,179 (12.9%) | 36,615 (14.6%) |
| $100,000 to $149,999 | 19,608 (15.6%) | 35,157 (14.1%) |
| $150,000 or more | 23,509 (18.8%) | 57,551 (23.0%) |
| Total | 125,404 (100.0%) | 249,932 (100.0%) |
Property Value to Household Income Ratio in Area Code 602
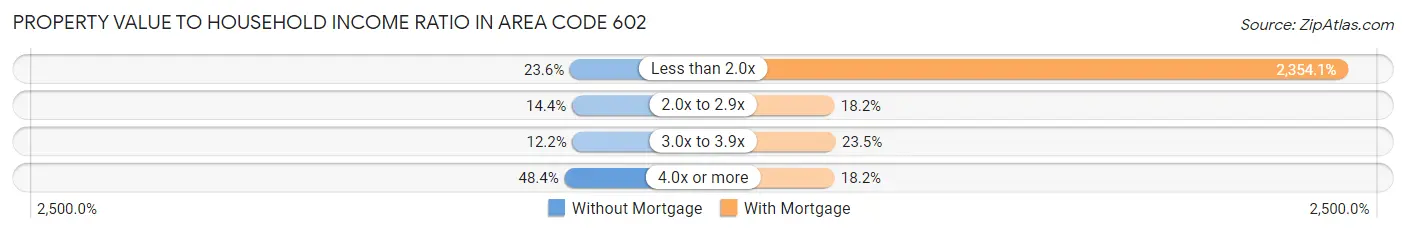
| Value-to-Income Ratio | Without Mortgage | With Mortgage |
| Less than 2.0x | 29,531 (23.5%) | 5,883,694 (2,354.1%) |
| 2.0x to 2.9x | 17,995 (14.3%) | 45,369 (18.1%) |
| 3.0x to 3.9x | 15,336 (12.2%) | 58,786 (23.5%) |
| 4.0x or more | 60,691 (48.4%) | 45,404 (18.2%) |
| Total | 125,404 (100.0%) | 249,932 (100.0%) |
Real Estate Taxes by Mortgage Status in Area Code 602
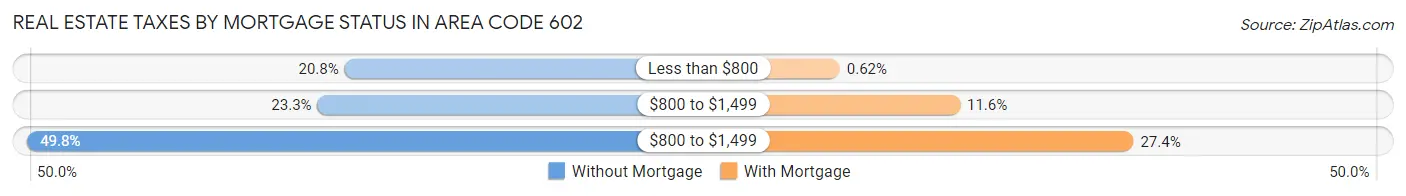
| Property Taxes | Without Mortgage | With Mortgage |
| Less than $800 | 26,062 (20.8%) | 1,560 (0.6%) |
| $800 to $1,499 | 29,166 (23.3%) | 28,993 (11.6%) |
| $800 to $1,499 | 62,404 (49.8%) | 68,575 (27.4%) |
| Total | 125,404 (100.0%) | 249,932 (100.0%) |
Health & Disability in Area Code 602
Health Insurance Coverage by Age in Area Code 602
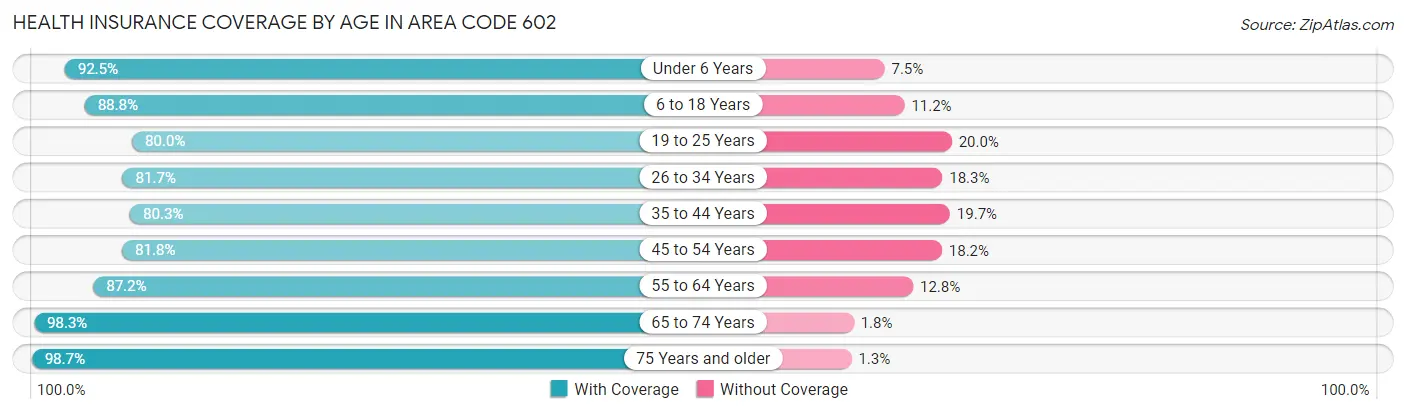
| Age Bracket | With Coverage | Without Coverage |
| Under 6 Years | 123,365 (92.5%) | 10,002 (7.5%) |
| 6 to 18 Years | 275,419 (88.8%) | 34,804 (11.2%) |
| 19 to 25 Years | 169,550 (80.0%) | 42,478 (20.0%) |
| 26 to 34 Years | 226,379 (81.7%) | 50,590 (18.3%) |
| 35 to 44 Years | 195,652 (80.3%) | 47,978 (19.7%) |
| 45 to 54 Years | 181,473 (81.8%) | 40,352 (18.2%) |
| 55 to 64 Years | 175,514 (87.2%) | 25,820 (12.8%) |
| 65 to 74 Years | 130,337 (98.3%) | 2,318 (1.8%) |
| 75 Years and older | 85,809 (98.7%) | 1,163 (1.3%) |
| Total | 1,563,498 (86.0%) | 255,505 (14.1%) |
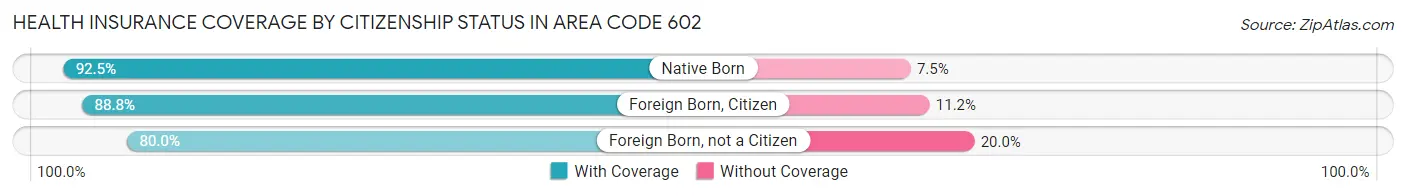
Health Insurance Coverage by Citizenship Status in Area Code 602
| Citizenship Status | With Coverage | Without Coverage |
| Native Born | 123,365 (92.5%) | 10,002 (7.5%) |
| Foreign Born, Citizen | 275,419 (88.8%) | 34,804 (11.2%) |
| Foreign Born, not a Citizen | 169,550 (80.0%) | 42,478 (20.0%) |
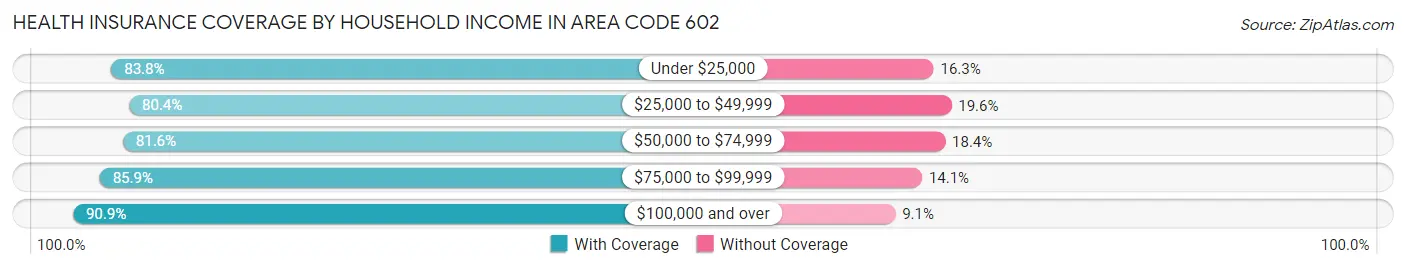
Health Insurance Coverage by Household Income in Area Code 602
| Household Income | With Coverage | Without Coverage |
| Under $25,000 | 168,344 (83.8%) | 32,660 (16.3%) |
| $25,000 to $49,999 | 254,190 (80.4%) | 61,859 (19.6%) |
| $50,000 to $74,999 | 256,751 (81.6%) | 57,974 (18.4%) |
| $75,000 to $99,999 | 218,631 (85.9%) | 35,824 (14.1%) |
| $100,000 and over | 647,649 (90.9%) | 64,602 (9.1%) |
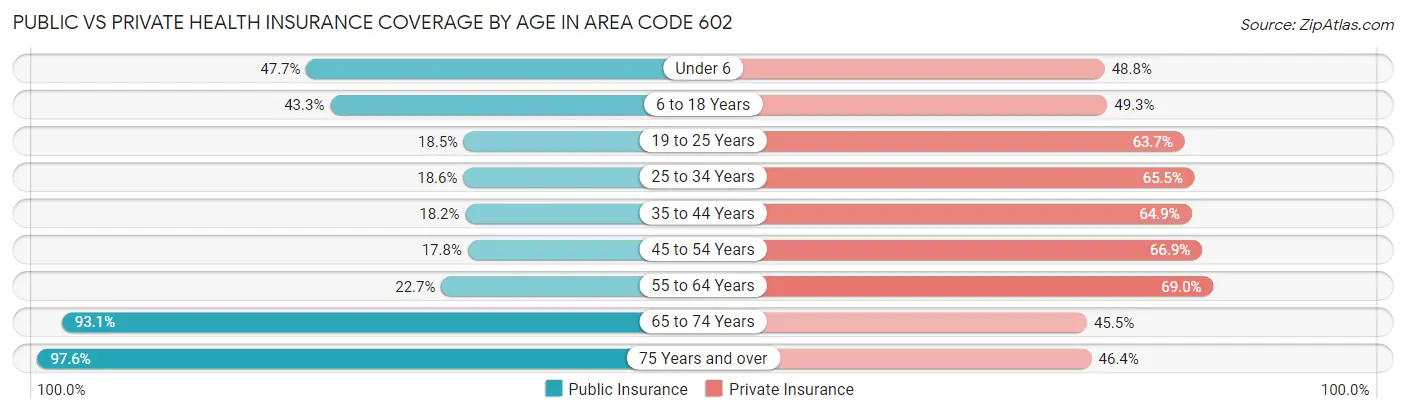
Public vs Private Health Insurance Coverage by Age in Area Code 602
| Age Bracket | Public Insurance | Private Insurance |
| Under 6 | 63,610 (47.7%) | 65,102 (48.8%) |
| 6 to 18 Years | 134,231 (43.3%) | 152,912 (49.3%) |
| 19 to 25 Years | 39,139 (18.5%) | 134,962 (63.6%) |
| 25 to 34 Years | 51,446 (18.6%) | 181,465 (65.5%) |
| 35 to 44 Years | 44,315 (18.2%) | 158,138 (64.9%) |
| 45 to 54 Years | 39,375 (17.7%) | 148,350 (66.9%) |
| 55 to 64 Years | 45,621 (22.7%) | 138,862 (69.0%) |
| 65 to 74 Years | 123,482 (93.1%) | 60,403 (45.5%) |
| 75 Years and over | 84,897 (97.6%) | 40,325 (46.4%) |
| Total | 626,116 (34.4%) | 1,080,519 (59.4%) |
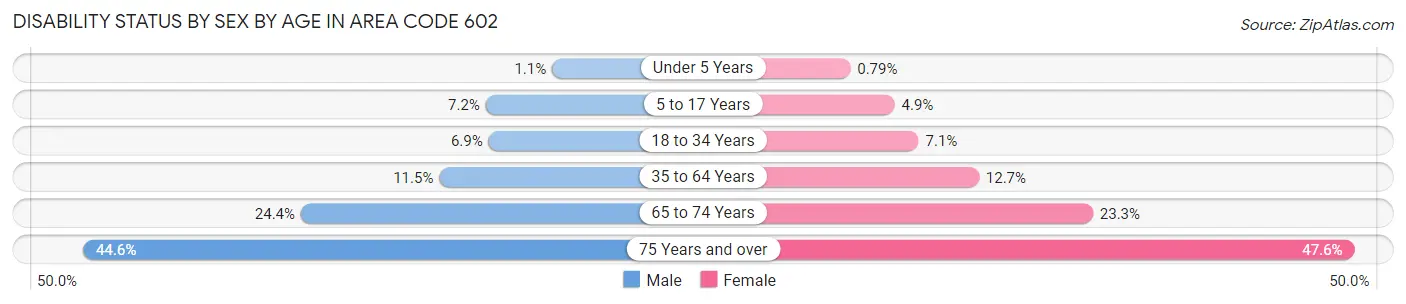
Disability Status by Sex by Age in Area Code 602
| Age Bracket | Male | Female |
| Under 5 Years | 584 (1.1%) | 433 (0.8%) |
| 5 to 17 Years | 11,399 (7.2%) | 7,177 (4.9%) |
| 18 to 34 Years | 18,445 (6.9%) | 17,925 (7.1%) |
| 35 to 64 Years | 38,814 (11.5%) | 41,963 (12.7%) |
| 65 to 74 Years | 15,101 (24.4%) | 16,464 (23.3%) |
| 75 Years and over | 16,589 (44.6%) | 23,670 (47.6%) |
Disability Class by Sex by Age in Area Code 602
Disability Class: Hearing Difficulty
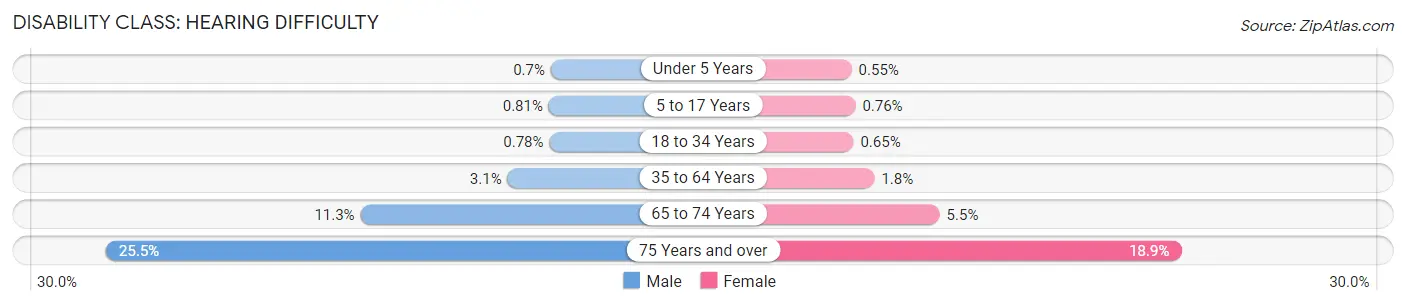
| Age Bracket | Male | Female |
| Under 5 Years | 390 (0.7%) | 303 (0.5%) |
| 5 to 17 Years | 1,278 (0.8%) | 1,114 (0.8%) |
| 18 to 34 Years | 2,083 (0.8%) | 1,644 (0.6%) |
| 35 to 64 Years | 10,476 (3.1%) | 6,020 (1.8%) |
| 65 to 74 Years | 7,006 (11.3%) | 3,849 (5.4%) |
| 75 Years and over | 9,479 (25.5%) | 9,406 (18.9%) |
Disability Class: Vision Difficulty
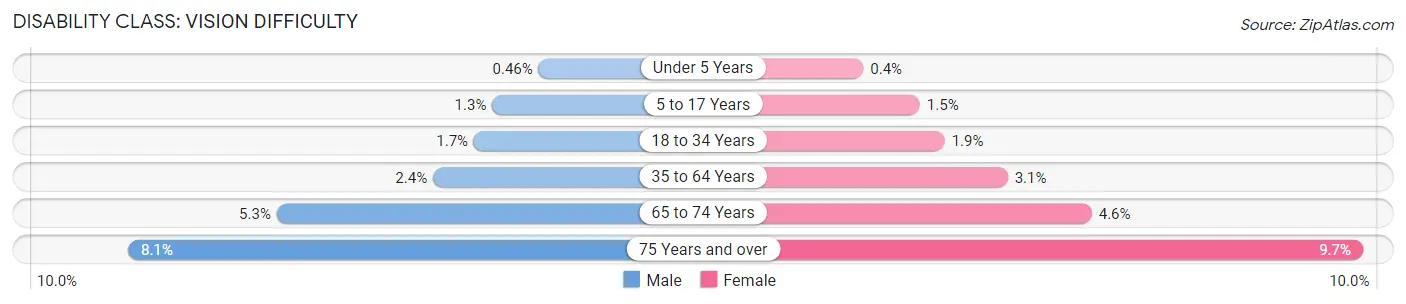
| Age Bracket | Male | Female |
| Under 5 Years | 259 (0.5%) | 219 (0.4%) |
| 5 to 17 Years | 2,084 (1.3%) | 2,119 (1.5%) |
| 18 to 34 Years | 4,421 (1.7%) | 4,805 (1.9%) |
| 35 to 64 Years | 8,144 (2.4%) | 10,153 (3.1%) |
| 65 to 74 Years | 3,301 (5.3%) | 3,280 (4.6%) |
| 75 Years and over | 3,007 (8.1%) | 4,814 (9.7%) |
Disability Class: Cognitive Difficulty
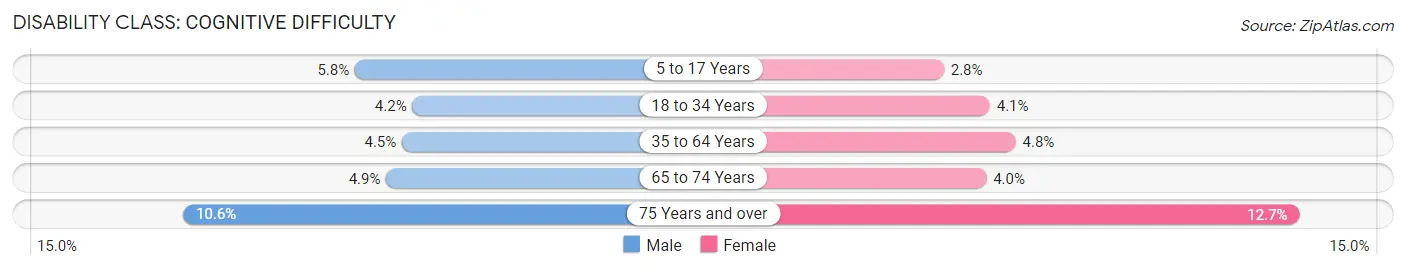
| Age Bracket | Male | Female |
| 5 to 17 Years | 9,157 (5.8%) | 4,163 (2.8%) |
| 18 to 34 Years | 11,160 (4.2%) | 10,351 (4.1%) |
| 35 to 64 Years | 15,114 (4.5%) | 15,982 (4.8%) |
| 65 to 74 Years | 3,059 (4.9%) | 2,842 (4.0%) |
| 75 Years and over | 3,939 (10.6%) | 6,341 (12.7%) |
Disability Class: Ambulatory Difficulty
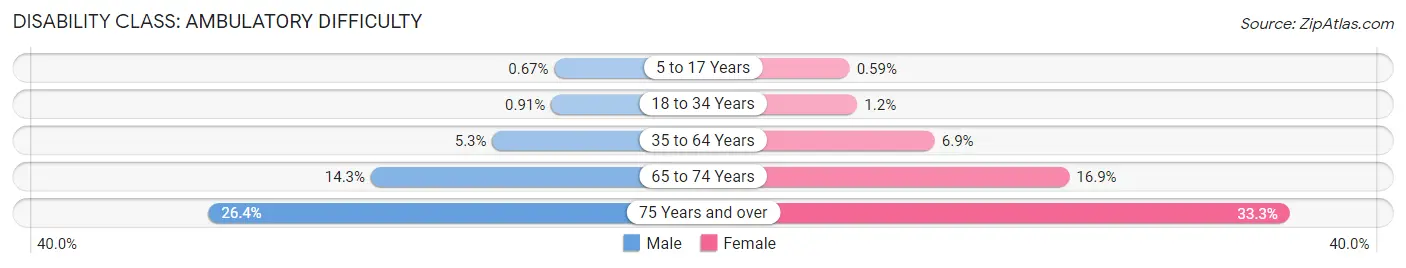
| Age Bracket | Male | Female |
| 5 to 17 Years | 1,056 (0.7%) | 872 (0.6%) |
| 18 to 34 Years | 2,406 (0.9%) | 2,905 (1.2%) |
| 35 to 64 Years | 17,742 (5.3%) | 22,808 (6.9%) |
| 65 to 74 Years | 8,859 (14.3%) | 11,939 (16.9%) |
| 75 Years and over | 9,805 (26.4%) | 16,548 (33.3%) |
Disability Class: Self-Care Difficulty
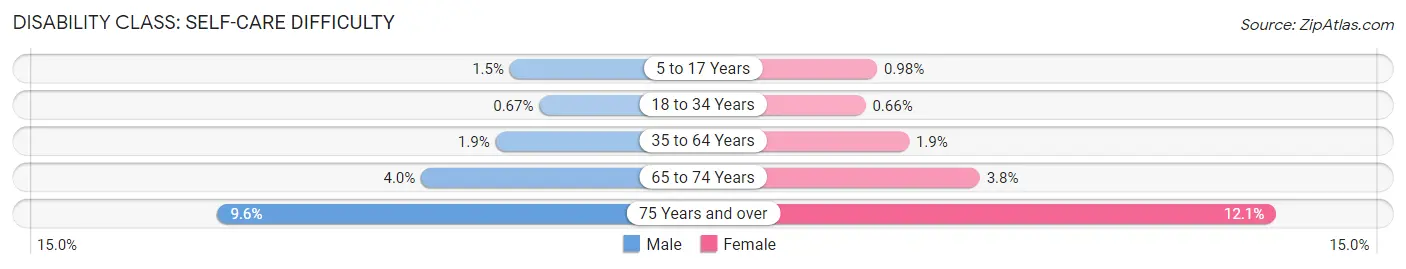
| Age Bracket | Male | Female |
| 5 to 17 Years | 2,361 (1.5%) | 1,443 (1.0%) |
| 18 to 34 Years | 1,791 (0.7%) | 1,664 (0.7%) |
| 35 to 64 Years | 6,380 (1.9%) | 6,169 (1.9%) |
| 65 to 74 Years | 2,458 (4.0%) | 2,715 (3.8%) |
| 75 Years and over | 3,585 (9.6%) | 6,017 (12.1%) |
Technology Access in Area Code 602
Computing Device Access in Area Code 602
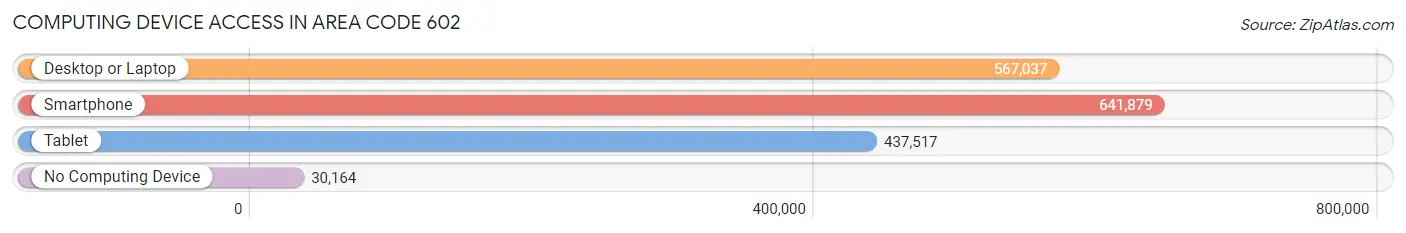
| Device Type | # Households | % Households |
| Desktop or Laptop | 567,037 | 80.8% |
| Smartphone | 641,879 | 91.4% |
| Tablet | 437,517 | 62.3% |
| No Computing Device | 30,164 | 4.3% |
| Total | 702,142 | 100.0% |
Internet Access in Area Code 602
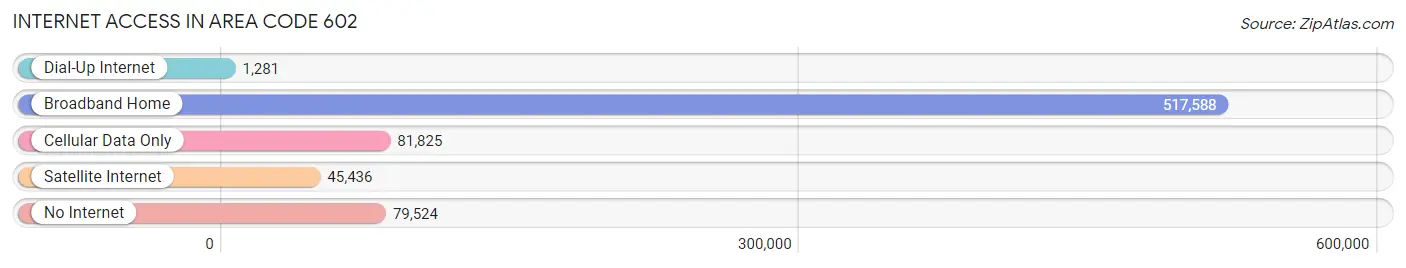
| Internet Type | # Households | % Households |
| Dial-Up Internet | 1,281 | 0.2% |
| Broadband Home | 517,588 | 73.7% |
| Cellular Data Only | 81,825 | 11.7% |
| Satellite Internet | 45,436 | 6.5% |
| No Internet | 79,524 | 11.3% |
| Total | 702,142 | 100.0% |
Area Code 602 Summary
Geography
Area code 602 is located in the state of Arizona. It covers the entire Phoenix metropolitan area, including the cities of Phoenix, Scottsdale, Glendale, and Tempe. It also covers parts of the surrounding counties of Maricopa, Gila, Yavapai, and Pinal.
Social
Area code 602 is home to a diverse population of people from all walks of life. The area is known for its vibrant nightlife, cultural attractions, and outdoor activities. It is also home to a number of professional sports teams, including the Arizona Diamondbacks, Phoenix Suns, and Arizona Cardinals.
Economics
Area code 602 is a major economic hub in the state of Arizona. It is home to a number of Fortune 500 companies, including Avnet, PetSmart, and US Airways. The area is also home to a number of universities and colleges, including Arizona State University and the University of Phoenix.
Demographics
Area code 602 is home to a population of over 4 million people. The population is diverse, with a mix of ethnicities, including Hispanic, African American, Asian, and Native American. The median household income is around $50,000, and the median age is 33.
Common Questions
What is Per Capita Income in Area Code 602?
Per Capita income in Area Code 602 is $42,705.
What is the Median Family Income in Area Code 602?
Median Family Income in Area Code 602 is $92,445.
What is the Median Household income in Area Code 602?
Median Household Income in Area Code 602 is $78,257.
What is Income or Wage Gap in Area Code 602?
Income or Wage Gap in Area Code 602 is 19.5%.
Women in Area Code 602 earn 80.5 cents for every dollar earned by a man.
What is Family Income Deficit in Area Code 602?
Family Income Deficit in Area Code 602 is $11,928.
Families that are below poverty line in Area Code 602 earn $11,928 less on average than the poverty threshold level.
What is Inequality or Gini Index in Area Code 602?
Inequality or Gini Index in Area Code 602 is 23.12.
What is the Total Population of Area Code 602?
Total Population of Area Code 602 is 1,833,033.
What is the Total Male Population of Area Code 602?
Total Male Population of Area Code 602 is 925,658.
What is the Total Female Population of Area Code 602?
Total Female Population of Area Code 602 is 907,375.
What is the Ratio of Males per 100 Females in Area Code 602?
There are 102.01 Males per 100 Females in Area Code 602.
What is the Ratio of Females per 100 Males in Area Code 602?
There are 98.02 Females per 100 Males in Area Code 602.
What is the Median Population Age in Area Code 602?
Median Population Age in Area Code 602 is 36.4 Years.
What is the Average Family Size in Area Code 602
Average Family Size in Area Code 602 is 3.2 People.
What is the Average Household Size in Area Code 602
Average Household Size in Area Code 602 is 2.6 People.
How Large is the Labor Force in Area Code 602?
There are 974,798 People in the Labor Forcein in Area Code 602.
What is the Percentage of People in the Labor Force in Area Code 602?
66.5% of People are in the Labor Force in Area Code 602.
What is the Unemployment Rate in Area Code 602?
Unemployment Rate in Area Code 602 is 5.3%.