Area Code 775 Map & Demographics
Area Code 775 Map
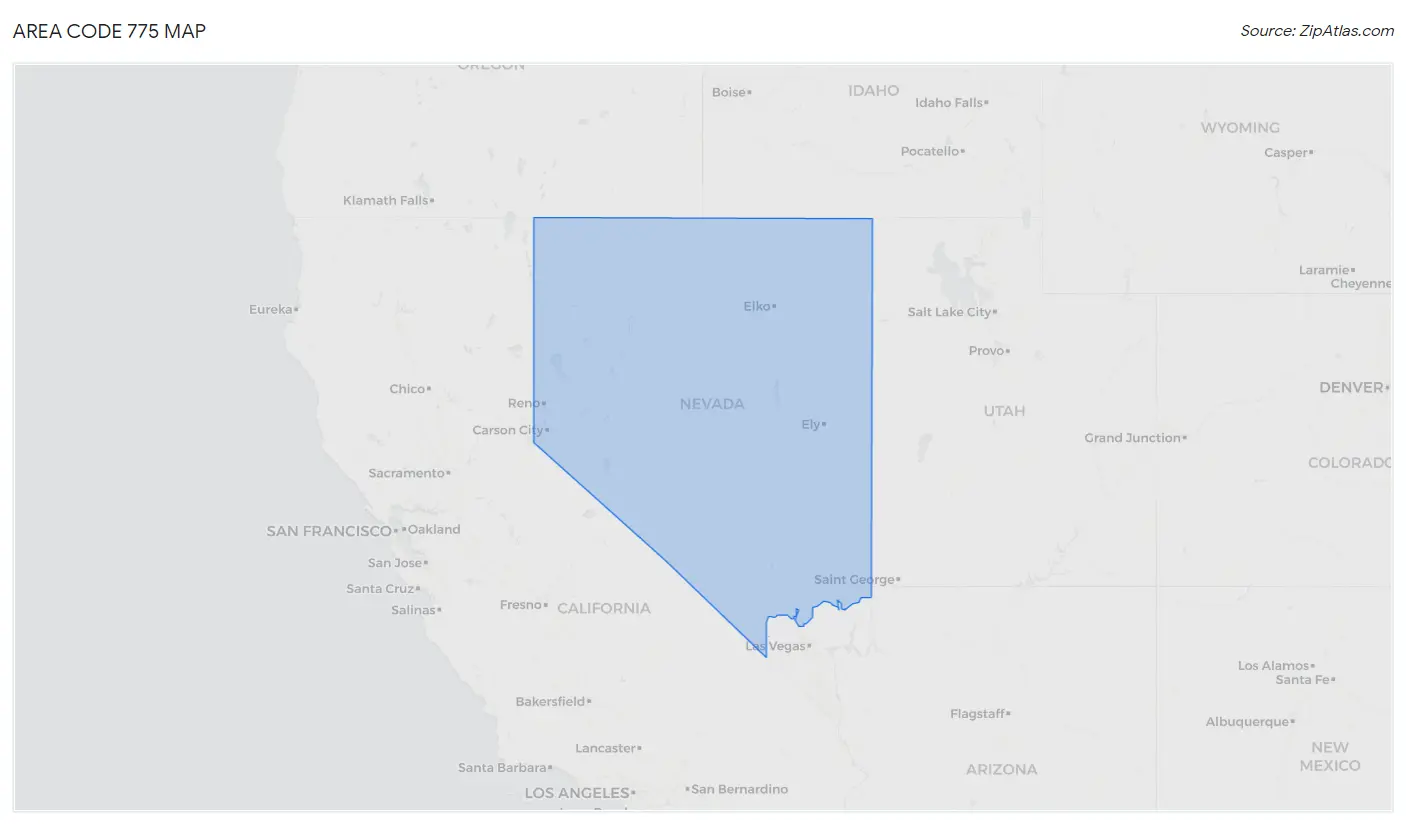
Area Code 775 Overview
$41,718
PER CAPITA INCOME
$92,867
AVG FAMILY INCOME
$79,570
AVG HOUSEHOLD INCOME
31.2%
WAGE / INCOME GAP [ % ]
68.8¢/ $1
WAGE / INCOME GAP [ $ ]
$9,884
FAMILY INCOME DEFICIT
36.92
INEQUALITY / GINI INDEX
855,628
TOTAL POPULATION
438,785
MALE POPULATION
416,843
FEMALE POPULATION
105.26
MALES / 100 FEMALES
95.00
FEMALES / 100 MALES
47.6
MEDIAN AGE
2.9
AVG FAMILY SIZE
2.4
AVG HOUSEHOLD SIZE
375,828
LABOR FORCE [ PEOPLE ]
53.8%
PERCENT IN LABOR FORCE
7.8%
UNEMPLOYMENT RATE
Income in Area Code 775
Income Overview in Area Code 775
Per Capita Income in Area Code 775 is $41,718, while median incomes of families and households are $92,867 and $79,570 respectively.
| Characteristic | Number | Measure |
| Per Capita Income | 855,628 | $41,718 |
| Median Family Income | 215,418 | $92,867 |
| Mean Family Income | 215,418 | $9,511,306 |
| Median Household Income | 338,566 | $79,570 |
| Mean Household Income | 338,566 | $8,590,875 |
| Income Deficit | 215,418 | $9,884 |
| Wage / Income Gap (%) | 855,628 | 31.23% |
| Wage / Income Gap ($) | 855,628 | 68.77¢ per $1 |
| Gini / Inequality Index | 855,628 | 36.92 |
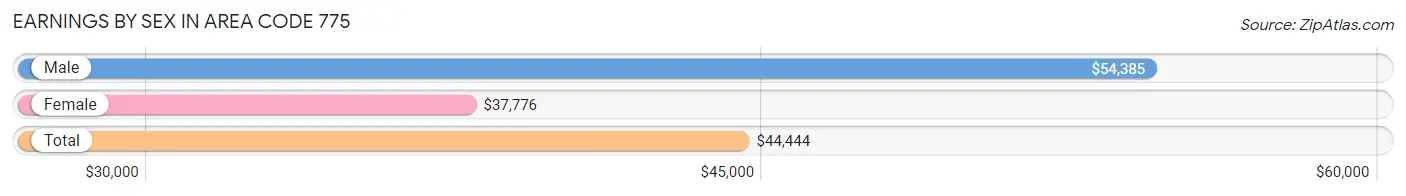
Earnings by Sex in Area Code 775
Average Earnings in Area Code 775 are $44,444, $54,385 for men and $37,776 for women, a difference of 30.5%.
| Sex | Number | Average Earnings |
| Male | 245,659 (54.9%) | $54,385 |
| Female | 201,688 (45.1%) | $37,776 |
| Total | 447,347 (100.0%) | $44,444 |
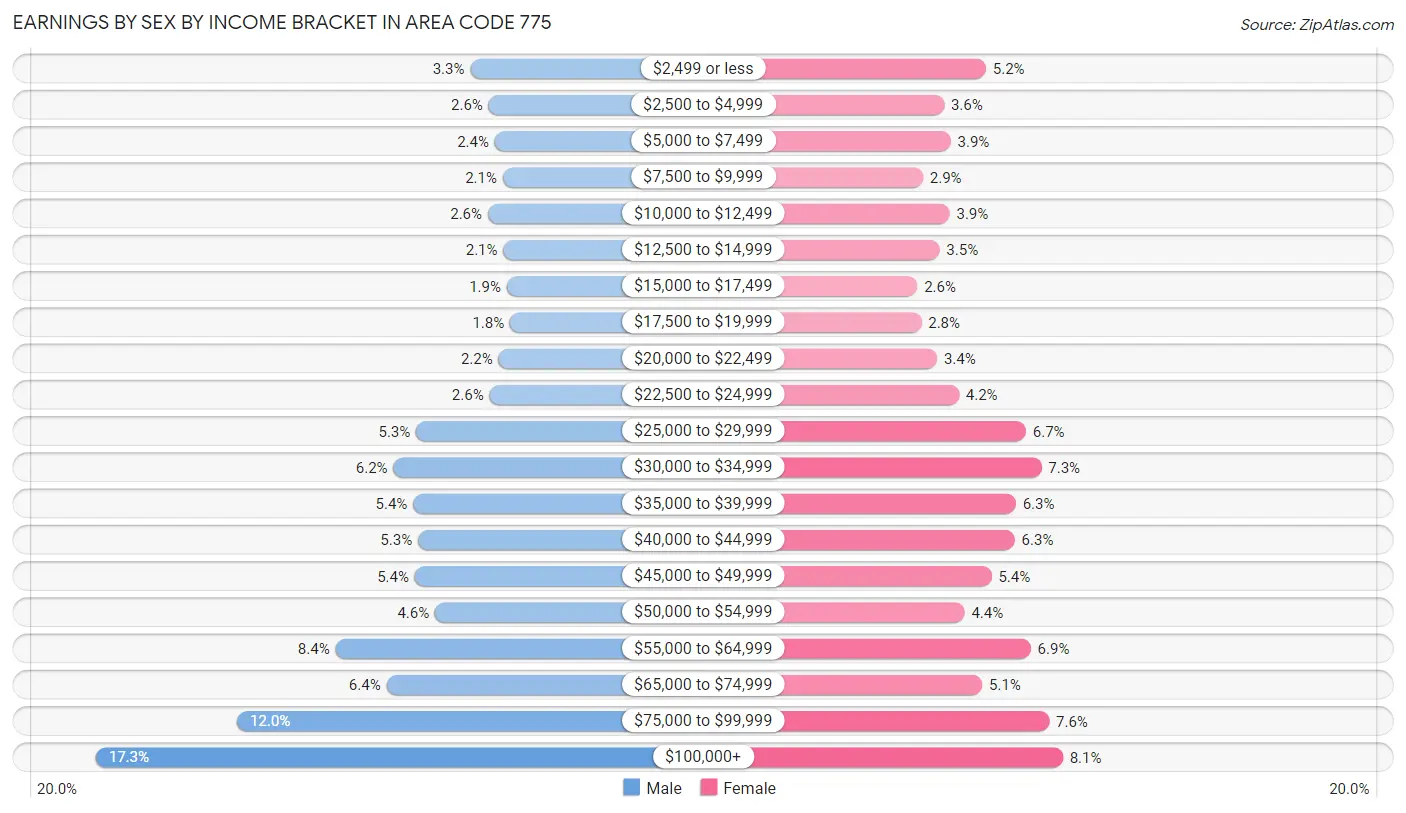
Earnings by Sex by Income Bracket in Area Code 775
The most common earnings brackets in Area Code 775 are $100,000+ for men (42,581 | 17.3%) and $100,000+ for women (16,314 | 8.1%).
| Income | Male | Female |
| $2,499 or less | 8,108 (3.3%) | 10,498 (5.2%) |
| $2,500 to $4,999 | 6,405 (2.6%) | 7,341 (3.6%) |
| $5,000 to $7,499 | 5,854 (2.4%) | 7,847 (3.9%) |
| $7,500 to $9,999 | 5,108 (2.1%) | 5,745 (2.9%) |
| $10,000 to $12,499 | 6,486 (2.6%) | 7,757 (3.8%) |
| $12,500 to $14,999 | 5,066 (2.1%) | 7,000 (3.5%) |
| $15,000 to $17,499 | 4,731 (1.9%) | 5,327 (2.6%) |
| $17,500 to $19,999 | 4,440 (1.8%) | 5,633 (2.8%) |
| $20,000 to $22,499 | 5,499 (2.2%) | 6,825 (3.4%) |
| $22,500 to $24,999 | 6,349 (2.6%) | 8,476 (4.2%) |
| $25,000 to $29,999 | 13,090 (5.3%) | 13,534 (6.7%) |
| $30,000 to $34,999 | 15,179 (6.2%) | 14,709 (7.3%) |
| $35,000 to $39,999 | 13,368 (5.4%) | 12,776 (6.3%) |
| $40,000 to $44,999 | 12,924 (5.3%) | 12,694 (6.3%) |
| $45,000 to $49,999 | 13,225 (5.4%) | 10,927 (5.4%) |
| $50,000 to $54,999 | 11,350 (4.6%) | 8,885 (4.4%) |
| $55,000 to $64,999 | 20,508 (8.4%) | 13,897 (6.9%) |
| $65,000 to $74,999 | 15,822 (6.4%) | 10,220 (5.1%) |
| $75,000 to $99,999 | 29,566 (12.0%) | 15,283 (7.6%) |
| $100,000+ | 42,581 (17.3%) | 16,314 (8.1%) |
| Total | 245,659 (100.0%) | 201,688 (100.0%) |
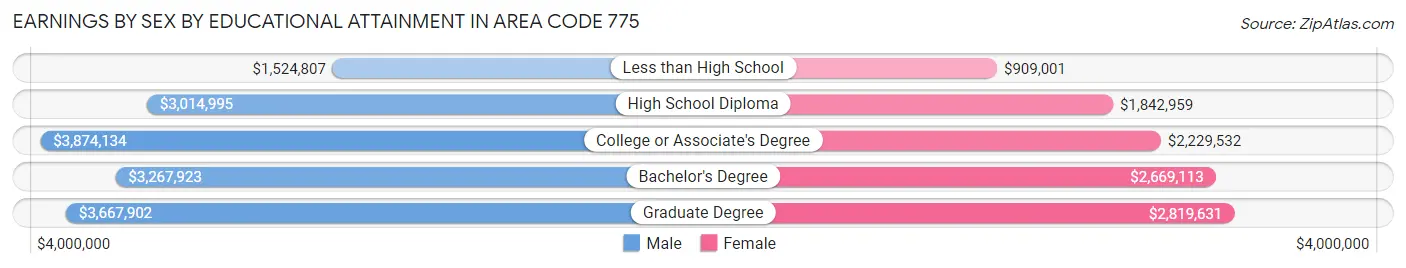
Earnings by Sex by Educational Attainment in Area Code 775
Average earnings in Area Code 775 are $4,382,352 for men and $2,809,034 for women, a difference of 35.9%. Men with an educational attainment of college or associate's degree enjoy the highest average annual earnings of $3,874,134, while those with less than high school education earn the least with $1,524,807. Women with an educational attainment of graduate degree earn the most with the average annual earnings of $2,819,631, while those with less than high school education have the smallest earnings of $909,001.
| Educational Attainment | Male Income | Female Income |
| Less than High School | $1,524,807 | $909,001 |
| High School Diploma | $3,014,995 | $1,842,959 |
| College or Associate's Degree | $3,874,134 | $2,229,532 |
| Bachelor's Degree | $3,267,923 | $2,669,113 |
| Graduate Degree | $3,667,902 | $2,819,631 |
| Total | $4,382,352 | $2,809,034 |
Family Income in Area Code 775
Family Income Brackets in Area Code 775
According to the Area Code 775 family income data, there are 4,408,314 families falling into the $100,000 to $149,999 income range, which is the most common income bracket and makes up 2,046.4% of all families. Conversely, the $10,000 to $14,999 income bracket is the least frequent group with only 346,177 families (160.7%) belonging to this category.
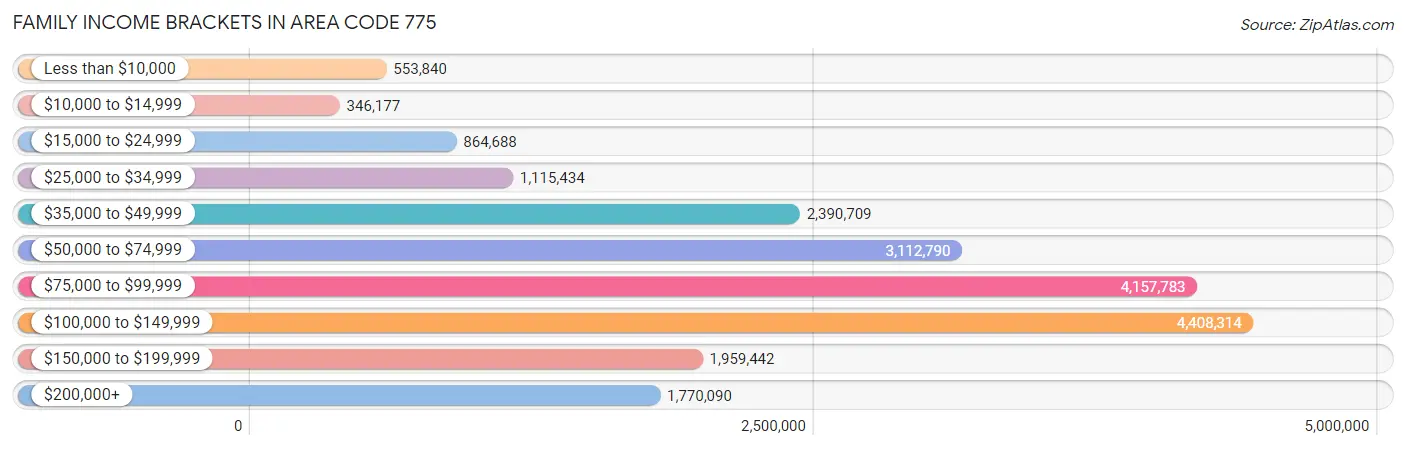
| Income Bracket | # Families | % Families |
| Less than $10,000 | 553,840 | 257.1% |
| $10,000 to $14,999 | 346,177 | 160.7% |
| $15,000 to $24,999 | 864,688 | 401.4% |
| $25,000 to $34,999 | 1,115,434 | 517.8% |
| $35,000 to $49,999 | 2,390,709 | 1,109.8% |
| $50,000 to $74,999 | 3,112,790 | 1,445.0% |
| $75,000 to $99,999 | 4,157,783 | 1,930.1% |
| $100,000 to $149,999 | 4,408,314 | 2,046.4% |
| $150,000 to $199,999 | 1,959,442 | 909.6% |
| $200,000+ | 1,770,090 | 821.7% |
Family Income by Famaliy Size in Area Code 775
7+ person families (3,509 | 1.6%) account for the highest median family income in Area Code 775 with $139,425 per family, while 2-person families (108,987 | 50.6%) have the highest median income of $43,636 per family member.
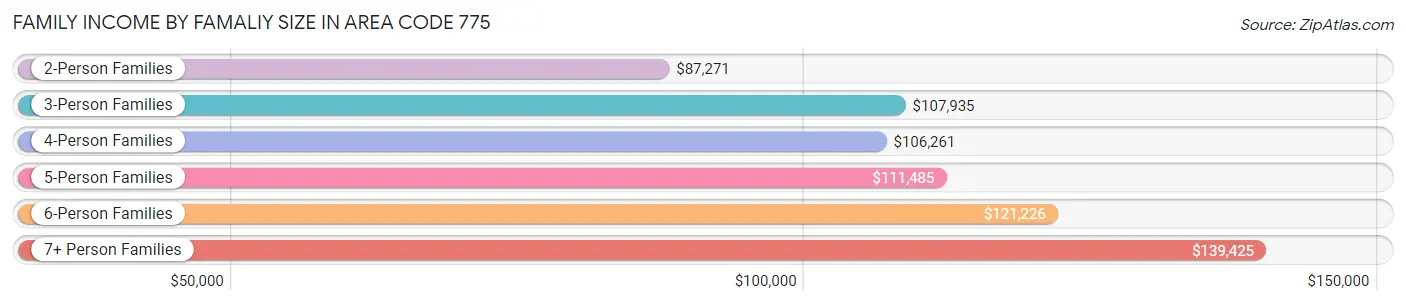
| Income Bracket | # Families | Median Income |
| 2-Person Families | 108,987 (50.6%) | $87,271 |
| 3-Person Families | 44,833 (20.8%) | $107,935 |
| 4-Person Families | 36,057 (16.7%) | $106,261 |
| 5-Person Families | 16,508 (7.7%) | $111,485 |
| 6-Person Families | 5,524 (2.6%) | $121,226 |
| 7+ Person Families | 3,509 (1.6%) | $139,425 |
| Total | 215,418 (100.0%) | $92,867 |
Family Income by Number of Earners in Area Code 775
The median family income in Area Code 775 is $92,867, with families comprising 3+ earners (23,436) having the highest median family income of $149,746, while families with no earners (39,692) have the lowest median family income of $64,094, accounting for 10.9% and 18.4% of families, respectively.
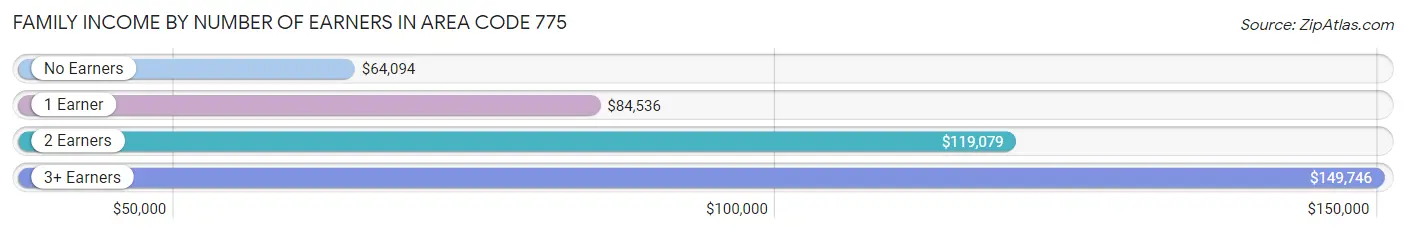
| Number of Earners | # Families | Median Income |
| No Earners | 39,692 (18.4%) | $64,094 |
| 1 Earner | 69,296 (32.2%) | $84,536 |
| 2 Earners | 82,994 (38.5%) | $119,079 |
| 3+ Earners | 23,436 (10.9%) | $149,746 |
| Total | 215,418 (100.0%) | $92,867 |
Household Income in Area Code 775
Household Income Brackets in Area Code 775
With 5,718,380 households falling in the category, the $100,000 to $149,999 income range is the most frequent in Area Code 775, accounting for 1,689.0% of all households. In contrast, only 1,513,051 households (446.9%) fall into the $10,000 to $14,999 income bracket, making it the least populous group.
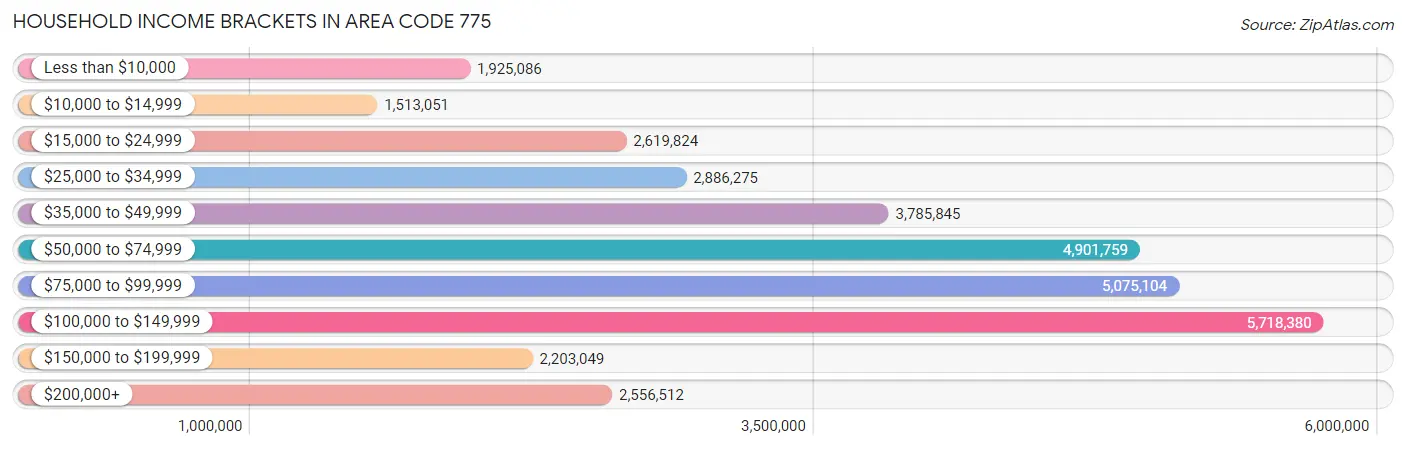
| Income Bracket | # Households | % Households |
| Less than $10,000 | 1,925,086 | 568.6% |
| $10,000 to $14,999 | 1,513,051 | 446.9% |
| $15,000 to $24,999 | 2,619,824 | 773.8% |
| $25,000 to $34,999 | 2,886,275 | 852.5% |
| $35,000 to $49,999 | 3,785,845 | 1,118.2% |
| $50,000 to $74,999 | 4,901,759 | 1,447.8% |
| $75,000 to $99,999 | 5,075,104 | 1,499.0% |
| $100,000 to $149,999 | 5,718,380 | 1,689.0% |
| $150,000 to $199,999 | 2,203,049 | 650.7% |
| $200,000+ | 2,556,512 | 755.1% |
Household Income by Householder Age in Area Code 775
The median household income in Area Code 775 is $79,570, with the highest median household income of $91,505 found in the 45 to 64 years age bracket for the primary householder. A total of 117,600 households (34.7%) fall into this category. Meanwhile, the 15 to 24 years age bracket for the primary householder has the lowest median household income of $56,914, with 13,702 households (4.1%) in this group.
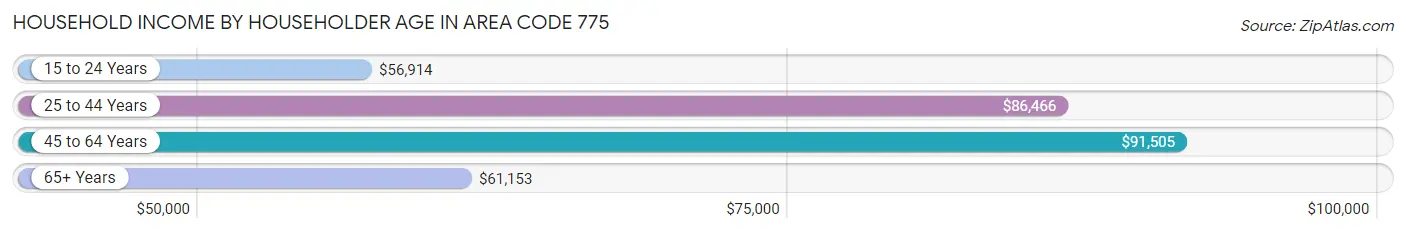
| Income Bracket | # Households | Median Income |
| 15 to 24 Years | 13,702 (4.1%) | $56,914 |
| 25 to 44 Years | 104,358 (30.8%) | $86,466 |
| 45 to 64 Years | 117,600 (34.7%) | $91,505 |
| 65+ Years | 102,906 (30.4%) | $61,153 |
| Total | 338,566 (100.0%) | $79,570 |
Poverty in Area Code 775
Income Below Poverty by Sex and Age in Area Code 775
With 10.0% poverty level for males and 11.9% for females among the residents of Area Code 775, 5 year old males and 18 to 24 year old females are the most vulnerable to poverty, with 818 males (17.2%) and 6,620 females (20.7%) in their respective age groups living below the poverty level.
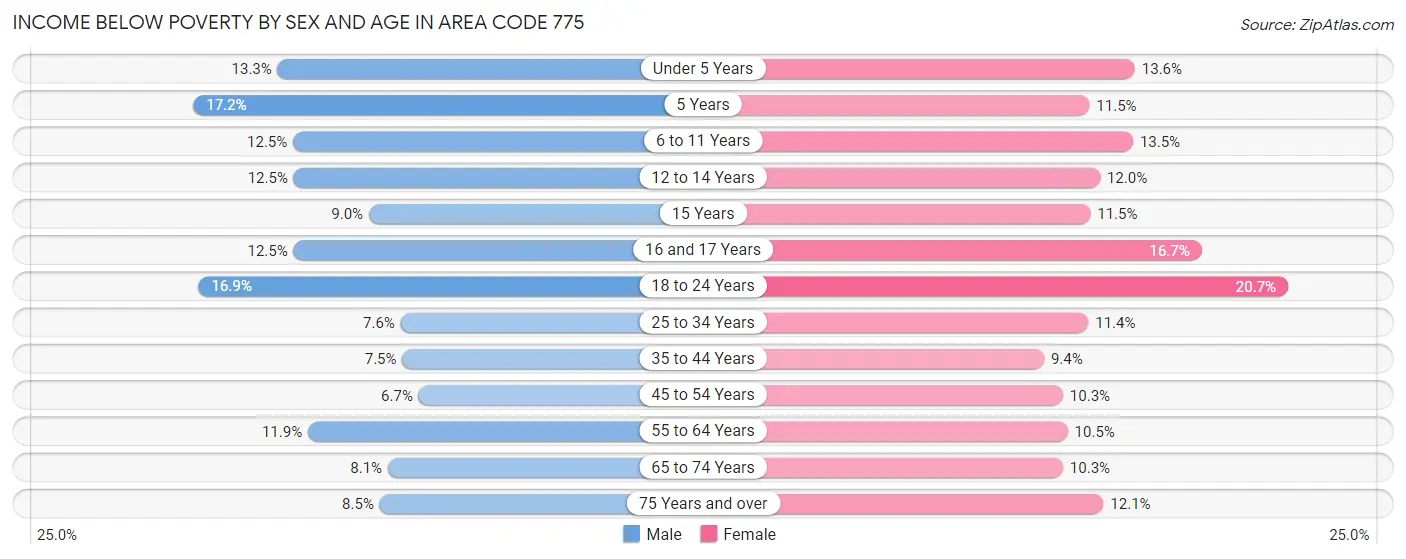
| Age Bracket | Male | Female |
| Under 5 Years | 2,952 (13.3%) | 2,966 (13.6%) |
| 5 Years | 818 (17.2%) | 587 (11.5%) |
| 6 to 11 Years | 3,817 (12.5%) | 3,774 (13.5%) |
| 12 to 14 Years | 1,938 (12.5%) | 1,766 (12.0%) |
| 15 Years | 473 (9.0%) | 560 (11.5%) |
| 16 and 17 Years | 1,312 (12.5%) | 1,711 (16.7%) |
| 18 to 24 Years | 5,900 (16.9%) | 6,620 (20.7%) |
| 25 to 34 Years | 4,500 (7.5%) | 6,243 (11.4%) |
| 35 to 44 Years | 4,003 (7.5%) | 4,605 (9.4%) |
| 45 to 54 Years | 3,439 (6.7%) | 4,985 (10.3%) |
| 55 to 64 Years | 6,891 (11.8%) | 6,067 (10.5%) |
| 65 to 74 Years | 4,109 (8.1%) | 5,342 (10.3%) |
| 75 Years and over | 2,564 (8.5%) | 4,005 (12.1%) |
| Total | 42,716 (10.0%) | 49,231 (11.9%) |
Income Above Poverty by Sex and Age in Area Code 775
According to the poverty statistics in Area Code 775, males aged 45 to 54 years and females aged 35 to 44 years are the age groups that are most secure financially, with 93.3% of males and 90.6% of females in these age groups living above the poverty line.
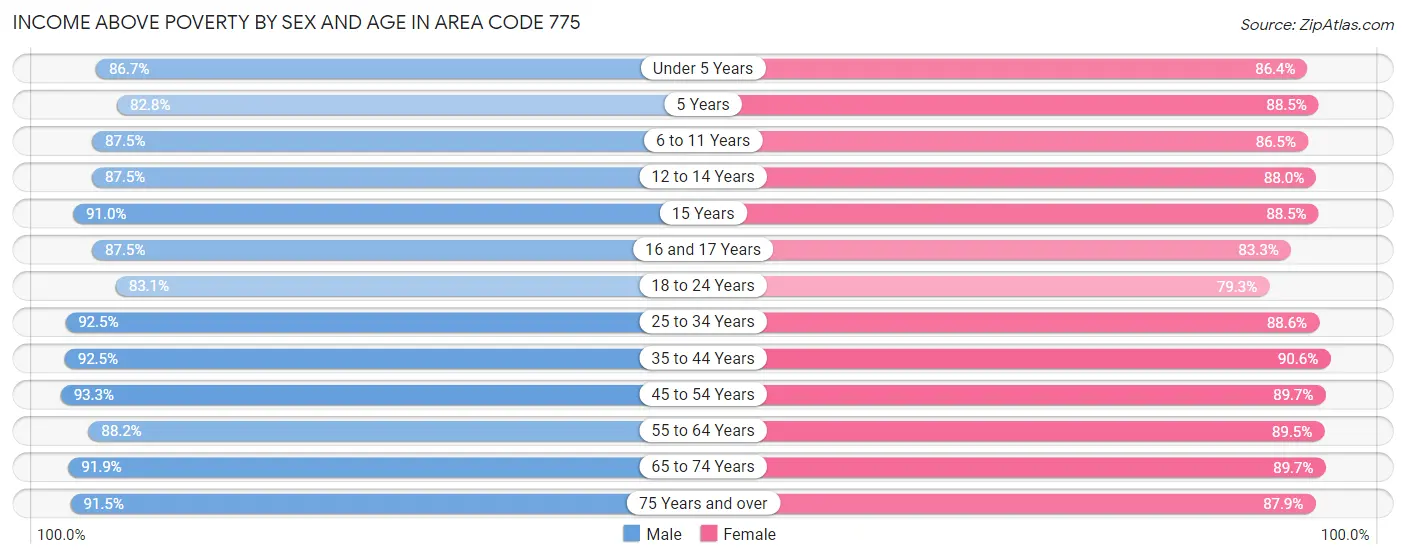
| Age Bracket | Male | Female |
| Under 5 Years | 19,305 (86.7%) | 18,841 (86.4%) |
| 5 Years | 3,945 (82.8%) | 4,522 (88.5%) |
| 6 to 11 Years | 26,623 (87.5%) | 24,156 (86.5%) |
| 12 to 14 Years | 13,550 (87.5%) | 12,973 (88.0%) |
| 15 Years | 4,770 (91.0%) | 4,298 (88.5%) |
| 16 and 17 Years | 9,165 (87.5%) | 8,541 (83.3%) |
| 18 to 24 Years | 28,945 (83.1%) | 25,365 (79.3%) |
| 25 to 34 Years | 55,065 (92.4%) | 48,305 (88.6%) |
| 35 to 44 Years | 49,570 (92.5%) | 44,491 (90.6%) |
| 45 to 54 Years | 47,777 (93.3%) | 43,620 (89.7%) |
| 55 to 64 Years | 51,265 (88.1%) | 51,832 (89.5%) |
| 65 to 74 Years | 46,361 (91.9%) | 46,716 (89.7%) |
| 75 Years and over | 27,536 (91.5%) | 28,976 (87.9%) |
| Total | 383,877 (90.0%) | 362,636 (88.0%) |
Income Below Poverty Among Married-Couple Families in Area Code 775
The poverty statistics for married-couple families in Area Code 775 show that 4.0% or 6,378 of the total 160,220 families live below the poverty line. Families with 5 or more children have the highest poverty rate of 19.4%, comprising of 187 families. On the other hand, families with 1 or 2 children have the lowest poverty rate of 3.2%, which includes 1,460 families.
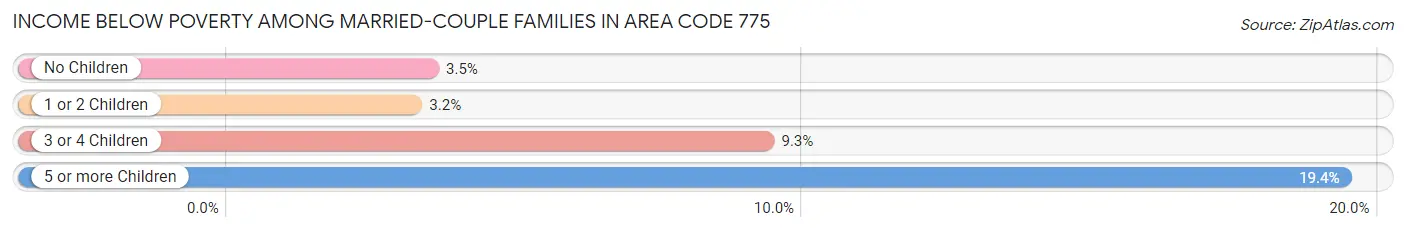
| Children | Above Poverty | Below Poverty |
| No Children | 97,564 (96.5%) | 3,542 (3.5%) |
| 1 or 2 Children | 43,953 (96.8%) | 1,460 (3.2%) |
| 3 or 4 Children | 11,547 (90.7%) | 1,189 (9.3%) |
| 5 or more Children | 778 (80.6%) | 187 (19.4%) |
| Total | 153,842 (96.0%) | 6,378 (4.0%) |
Income Below Poverty Among Single-Parent Households in Area Code 775
According to the poverty data in Area Code 775, 10.6% or 2,217 single-father households and 18.2% or 6,250 single-mother households are living below the poverty line. Among single-father households, those with 5 or more children have the highest poverty rate, with 66 households (29.3%) experiencing poverty. Likewise, among single-mother households, those with 5 or more children have the highest poverty rate, with 265 households (57.4%) falling below the poverty line.
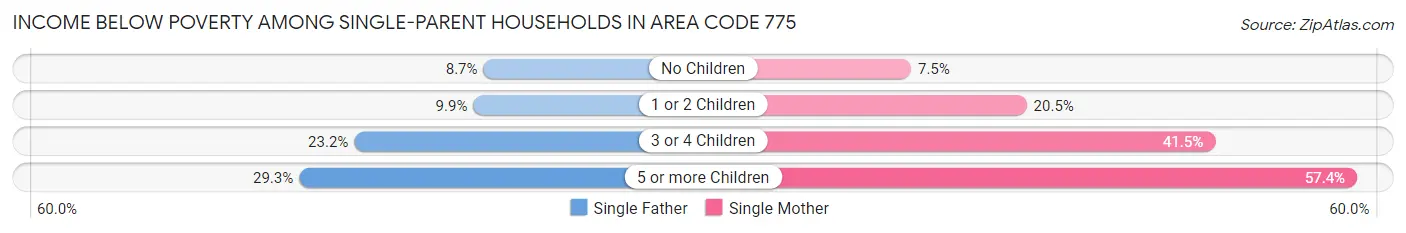
| Children | Single Father | Single Mother |
| No Children | 773 (8.7%) | 976 (7.5%) |
| 1 or 2 Children | 1,010 (9.9%) | 3,552 (20.4%) |
| 3 or 4 Children | 368 (23.2%) | 1,457 (41.5%) |
| 5 or more Children | 66 (29.3%) | 265 (57.4%) |
| Total | 2,217 (10.6%) | 6,250 (18.2%) |
Income Below Poverty Among Married-Couple vs Single-Parent Households in Area Code 775
The poverty data for Area Code 775 shows that 6,378 of the married-couple family households (4.0%) and 8,467 of the single-parent households (15.3%) are living below the poverty level. Within the married-couple family households, those with 5 or more children have the highest poverty rate, with 187 households (19.4%) falling below the poverty line. Among the single-parent households, those with 5 or more children have the highest poverty rate, with 331 household (48.2%) living below poverty.
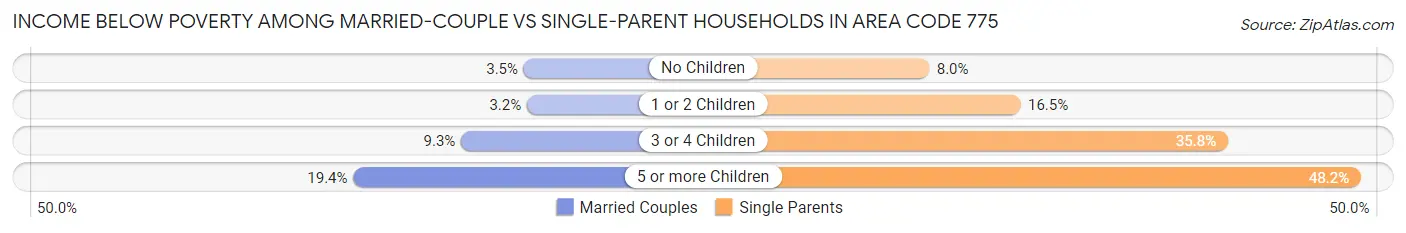
| Children | Married-Couple Families | Single-Parent Households |
| No Children | 3,542 (3.5%) | 1,749 (8.0%) |
| 1 or 2 Children | 1,460 (3.2%) | 4,562 (16.5%) |
| 3 or 4 Children | 1,189 (9.3%) | 1,825 (35.8%) |
| 5 or more Children | 187 (19.4%) | 331 (48.2%) |
| Total | 6,378 (4.0%) | 8,467 (15.3%) |
Race in Area Code 775
The most populous races in Area Code 775 are White / Caucasian (616,112 | 72.0%), Hispanic or Latino (197,449 | 23.1%), and Two or more Races (91,214 | 10.7%).
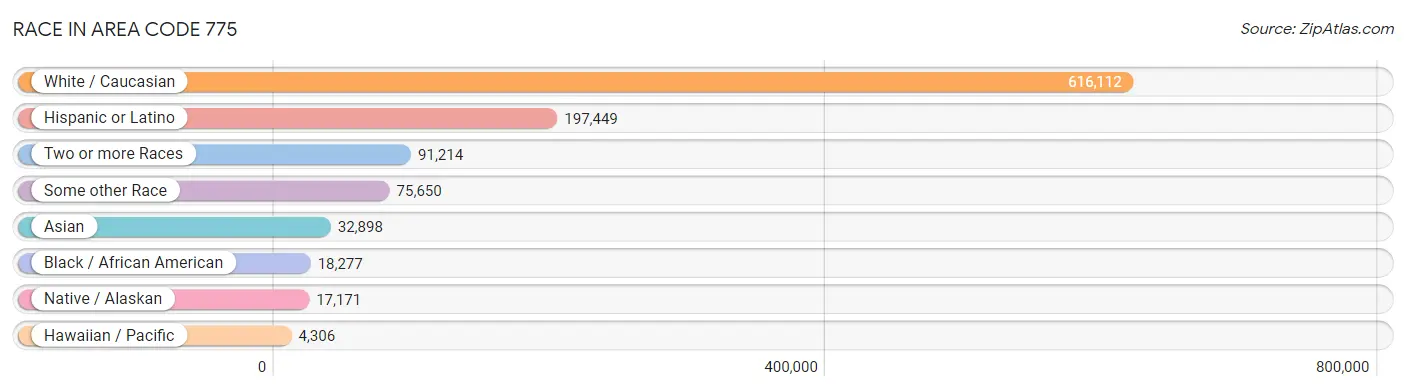
| Race | # Population | % Population |
| Asian | 32,898 | 3.8% |
| Black / African American | 18,277 | 2.1% |
| Hawaiian / Pacific | 4,306 | 0.5% |
| Hispanic or Latino | 197,449 | 23.1% |
| Native / Alaskan | 17,171 | 2.0% |
| White / Caucasian | 616,112 | 72.0% |
| Two or more Races | 91,214 | 10.7% |
| Some other Race | 75,650 | 8.8% |
| Total | 855,628 | 100.0% |
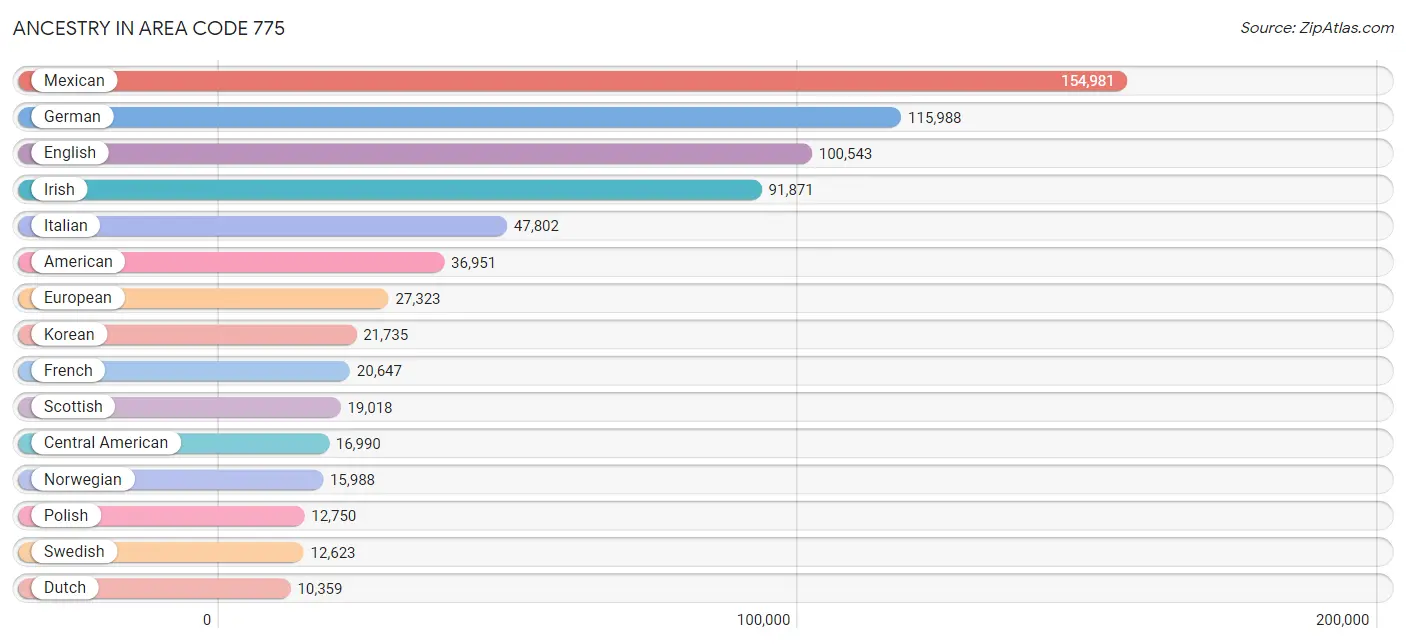
Ancestry in Area Code 775
The most populous ancestries reported in Area Code 775 are Mexican (154,981 | 18.1%), German (115,988 | 13.6%), English (100,543 | 11.7%), Irish (91,871 | 10.7%), and Italian (47,802 | 5.6%), together accounting for 59.7% of all Area Code 775 residents.
| Ancestry | # Population | % Population |
| Afghan | 20 | 0.0% |
| African | 1,897 | 0.2% |
| Alaska Native | 112 | 0.0% |
| Alaskan Athabascan | 167 | 0.0% |
| Albanian | 23 | 0.0% |
| Aleut | 170 | 0.0% |
| Alsatian | 14 | 0.0% |
| American | 36,951 | 4.3% |
| Apache | 715 | 0.1% |
| Arab | 2,032 | 0.2% |
| Arapaho | 72 | 0.0% |
| Argentinean | 398 | 0.1% |
| Armenian | 1,067 | 0.1% |
| Assyrian / Chaldean / Syriac | 76 | 0.0% |
| Australian | 322 | 0.0% |
| Austrian | 1,920 | 0.2% |
| Bahamian | 14 | 0.0% |
| Bangladeshi | 47 | 0.0% |
| Barbadian | 3 | 0.0% |
| Basque | 3,462 | 0.4% |
| Belgian | 625 | 0.1% |
| Belizean | 37 | 0.0% |
| Bhutanese | 4,541 | 0.5% |
| Blackfeet | 962 | 0.1% |
| Bolivian | 214 | 0.0% |
| Brazilian | 430 | 0.1% |
| British | 4,249 | 0.5% |
| Bulgarian | 165 | 0.0% |
| Burmese | 2,608 | 0.3% |
| Cajun | 76 | 0.0% |
| Cambodian | 33 | 0.0% |
| Canadian | 2,116 | 0.3% |
| Carpatho Rusyn | 29 | 0.0% |
| Celtic | 194 | 0.0% |
| Central American | 16,990 | 2.0% |
| Central American Indian | 579 | 0.1% |
| Cherokee | 3,292 | 0.4% |
| Cheyenne | 73 | 0.0% |
| Chickasaw | 407 | 0.1% |
| Chilean | 244 | 0.0% |
| Chinese | 10 | 0.0% |
| Chippewa | 385 | 0.0% |
| Choctaw | 847 | 0.1% |
| Colombian | 1,563 | 0.2% |
| Colville | 95 | 0.0% |
| Comanche | 12 | 0.0% |
| Costa Rican | 689 | 0.1% |
| Cree | 80 | 0.0% |
| Creek | 142 | 0.0% |
| Croatian | 1,419 | 0.2% |
| Crow | 202 | 0.0% |
| Cuban | 2,446 | 0.3% |
| Czech | 3,096 | 0.4% |
| Czechoslovakian | 656 | 0.1% |
| Danish | 7,436 | 0.9% |
| Delaware | 110 | 0.0% |
| Dominican | 264 | 0.0% |
| Dutch | 10,359 | 1.2% |
| Dutch West Indian | 24 | 0.0% |
| Eastern European | 2,315 | 0.3% |
| Ecuadorian | 172 | 0.0% |
| Egyptian | 117 | 0.0% |
| English | 100,543 | 11.7% |
| Estonian | 96 | 0.0% |
| Ethiopian | 624 | 0.1% |
| European | 27,323 | 3.2% |
| Fijian | 188 | 0.0% |
| Filipino | 248 | 0.0% |
| Finnish | 2,159 | 0.3% |
| French | 20,647 | 2.4% |
| French American Indian | 72 | 0.0% |
| French Canadian | 4,202 | 0.5% |
| German | 115,988 | 13.6% |
| German Russian | 92 | 0.0% |
| Ghanaian | 121 | 0.0% |
| Greek | 2,877 | 0.3% |
| Guamanian / Chamorro | 613 | 0.1% |
| Guatemalan | 6,092 | 0.7% |
| Haitian | 299 | 0.0% |
| Honduran | 882 | 0.1% |
| Hopi | 98 | 0.0% |
| Houma | 84 | 0.0% |
| Hungarian | 2,704 | 0.3% |
| Icelander | 200 | 0.0% |
| Indian (Asian) | 7,135 | 0.8% |
| Indonesian | 3 | 0.0% |
| Inupiat | 47 | 0.0% |
| Iranian | 1,014 | 0.1% |
| Iraqi | 85 | 0.0% |
| Irish | 91,871 | 10.7% |
| Iroquois | 247 | 0.0% |
| Israeli | 72 | 0.0% |
| Italian | 47,802 | 5.6% |
| Jamaican | 276 | 0.0% |
| Japanese | 389 | 0.1% |
| Kenyan | 166 | 0.0% |
| Kiowa | 5 | 0.0% |
| Korean | 21,735 | 2.5% |
| Laotian | 504 | 0.1% |
| Latvian | 158 | 0.0% |
| Lebanese | 895 | 0.1% |
| Liberian | 100 | 0.0% |
| Lithuanian | 1,339 | 0.2% |
| Lumbee | 60 | 0.0% |
| Luxembourger | 141 | 0.0% |
| Macedonian | 76 | 0.0% |
| Malaysian | 113 | 0.0% |
| Maltese | 66 | 0.0% |
| Marshallese | 29 | 0.0% |
| Menominee | 6 | 0.0% |
| Mexican | 154,981 | 18.1% |
| Mexican American Indian | 2,193 | 0.3% |
| Mongolian | 53 | 0.0% |
| Moroccan | 70 | 0.0% |
| Native Hawaiian | 3,616 | 0.4% |
| Navajo | 919 | 0.1% |
| New Zealander | 134 | 0.0% |
| Nicaraguan | 1,124 | 0.1% |
| Nigerian | 857 | 0.1% |
| Northern European | 3,870 | 0.4% |
| Norwegian | 15,988 | 1.9% |
| Okinawan | 9 | 0.0% |
| Osage | 155 | 0.0% |
| Paiute | 4,881 | 0.6% |
| Pakistani | 1,278 | 0.2% |
| Palestinian | 55 | 0.0% |
| Panamanian | 143 | 0.0% |
| Paraguayan | 48 | 0.0% |
| Pennsylvania German | 148 | 0.0% |
| Peruvian | 965 | 0.1% |
| Pima | 179 | 0.0% |
| Polish | 12,750 | 1.5% |
| Portuguese | 7,726 | 0.9% |
| Potawatomi | 168 | 0.0% |
| Pueblo | 48 | 0.0% |
| Puerto Rican | 4,707 | 0.5% |
| Puget Sound Salish | 17 | 0.0% |
| Romanian | 1,129 | 0.1% |
| Russian | 5,304 | 0.6% |
| Salvadoran | 7,884 | 0.9% |
| Samoan | 1,248 | 0.2% |
| Scandinavian | 5,039 | 0.6% |
| Scotch-Irish | 6,862 | 0.8% |
| Scottish | 19,018 | 2.2% |
| Seminole | 168 | 0.0% |
| Serbian | 539 | 0.1% |
| Shoshone | 2,454 | 0.3% |
| Sioux | 708 | 0.1% |
| Slavic | 623 | 0.1% |
| Slovak | 655 | 0.1% |
| Slovene | 372 | 0.0% |
| Somali | 75 | 0.0% |
| South African | 80 | 0.0% |
| South American | 4,302 | 0.5% |
| South American Indian | 120 | 0.0% |
| Spaniard | 4,204 | 0.5% |
| Spanish | 4,990 | 0.6% |
| Spanish American | 169 | 0.0% |
| Sri Lankan | 3,229 | 0.4% |
| Subsaharan African | 4,197 | 0.5% |
| Sudanese | 39 | 0.0% |
| Swedish | 12,623 | 1.5% |
| Swiss | 3,306 | 0.4% |
| Syrian | 86 | 0.0% |
| Taiwanese | 35 | 0.0% |
| Thai | 4,924 | 0.6% |
| Tlingit-Haida | 122 | 0.0% |
| Tohono O'Odham | 20 | 0.0% |
| Tongan | 1,122 | 0.1% |
| Trinidadian and Tobagonian | 146 | 0.0% |
| Tsimshian | 37 | 0.0% |
| Turkish | 176 | 0.0% |
| Ugandan | 9 | 0.0% |
| Ukrainian | 1,848 | 0.2% |
| Uruguayan | 418 | 0.1% |
| Ute | 59 | 0.0% |
| Venezuelan | 104 | 0.0% |
| Vietnamese | 404 | 0.1% |
| Welsh | 5,318 | 0.6% |
| West Indian | 97 | 0.0% |
| Yakama | 3 | 0.0% |
| Yaqui | 137 | 0.0% |
| Yugoslavian | 930 | 0.1% |
| Yuman | 55 | 0.0% |
| Zimbabwean | 31 | 0.0% | View All 185 Rows |
Immigrants in Area Code 775
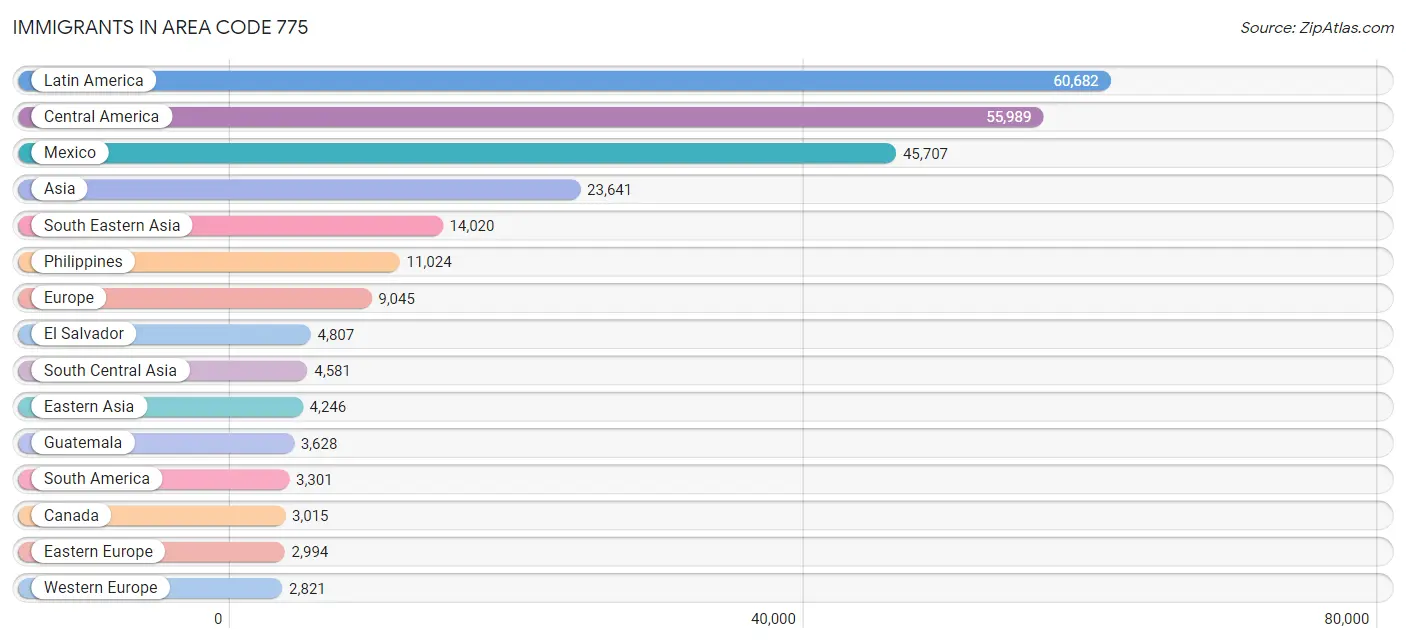
The most numerous immigrant groups reported in Area Code 775 came from Latin America (60,682 | 7.1%), Central America (55,989 | 6.5%), Mexico (45,707 | 5.3%), Asia (23,641 | 2.8%), and South Eastern Asia (14,020 | 1.6%), together accounting for 23.4% of all Area Code 775 residents.
| Immigration Origin | # Population | % Population |
| Afghanistan | 28 | 0.0% |
| Africa | 2,360 | 0.3% |
| Argentina | 258 | 0.0% |
| Armenia | 153 | 0.0% |
| Asia | 23,641 | 2.8% |
| Australia | 224 | 0.0% |
| Austria | 151 | 0.0% |
| Azores | 10 | 0.0% |
| Bahamas | 4 | 0.0% |
| Bangladesh | 969 | 0.1% |
| Barbados | 11 | 0.0% |
| Belarus | 101 | 0.0% |
| Belgium | 10 | 0.0% |
| Belize | 24 | 0.0% |
| Bolivia | 75 | 0.0% |
| Bosnia and Herzegovina | 108 | 0.0% |
| Brazil | 460 | 0.1% |
| Bulgaria | 60 | 0.0% |
| Cambodia | 263 | 0.0% |
| Cameroon | 256 | 0.0% |
| Canada | 3,015 | 0.4% |
| Caribbean | 1,392 | 0.2% |
| Central America | 55,989 | 6.5% |
| Chile | 181 | 0.0% |
| China | 2,343 | 0.3% |
| Colombia | 998 | 0.1% |
| Costa Rica | 407 | 0.1% |
| Croatia | 117 | 0.0% |
| Cuba | 809 | 0.1% |
| Czechoslovakia | 254 | 0.0% |
| Denmark | 165 | 0.0% |
| Dominican Republic | 93 | 0.0% |
| Eastern Africa | 811 | 0.1% |
| Eastern Asia | 4,246 | 0.5% |
| Eastern Europe | 2,994 | 0.4% |
| Ecuador | 106 | 0.0% |
| Egypt | 41 | 0.0% |
| El Salvador | 4,807 | 0.6% |
| England | 1,079 | 0.1% |
| Eritrea | 63 | 0.0% |
| Ethiopia | 396 | 0.1% |
| Europe | 9,045 | 1.1% |
| Fiji | 78 | 0.0% |
| France | 392 | 0.1% |
| Germany | 1,901 | 0.2% |
| Ghana | 260 | 0.0% |
| Greece | 73 | 0.0% |
| Guatemala | 3,628 | 0.4% |
| Guyana | 25 | 0.0% |
| Haiti | 179 | 0.0% |
| Honduras | 682 | 0.1% |
| Hong Kong | 256 | 0.0% |
| Hungary | 199 | 0.0% |
| India | 2,202 | 0.3% |
| Indonesia | 268 | 0.0% |
| Iran | 774 | 0.1% |
| Iraq | 60 | 0.0% |
| Ireland | 317 | 0.0% |
| Israel | 163 | 0.0% |
| Italy | 188 | 0.0% |
| Jamaica | 185 | 0.0% |
| Japan | 682 | 0.1% |
| Kazakhstan | 22 | 0.0% |
| Kenya | 167 | 0.0% |
| Korea | 1,221 | 0.1% |
| Kuwait | 41 | 0.0% |
| Laos | 26 | 0.0% |
| Latin America | 60,682 | 7.1% |
| Latvia | 44 | 0.0% |
| Lebanon | 107 | 0.0% |
| Liberia | 20 | 0.0% |
| Lithuania | 77 | 0.0% |
| Malaysia | 92 | 0.0% |
| Mexico | 45,707 | 5.3% |
| Micronesia | 204 | 0.0% |
| Middle Africa | 269 | 0.0% |
| Moldova | 30 | 0.0% |
| Morocco | 25 | 0.0% |
| Nepal | 52 | 0.0% |
| Netherlands | 257 | 0.0% |
| Nicaragua | 578 | 0.1% |
| Nigeria | 368 | 0.0% |
| North Macedonia | 10 | 0.0% |
| Northern Africa | 140 | 0.0% |
| Northern Europe | 2,612 | 0.3% |
| Norway | 97 | 0.0% |
| Oceania | 1,180 | 0.1% |
| Pakistan | 299 | 0.0% |
| Panama | 156 | 0.0% |
| Peru | 617 | 0.1% |
| Philippines | 11,024 | 1.3% |
| Poland | 637 | 0.1% |
| Portugal | 109 | 0.0% |
| Romania | 579 | 0.1% |
| Russia | 276 | 0.0% |
| Saudi Arabia | 47 | 0.0% |
| Scotland | 103 | 0.0% |
| Senegal | 277 | 0.0% |
| Serbia | 130 | 0.0% |
| Singapore | 154 | 0.0% |
| Somalia | 76 | 0.0% |
| South Africa | 121 | 0.0% |
| South America | 3,301 | 0.4% |
| South Central Asia | 4,581 | 0.5% |
| South Eastern Asia | 14,020 | 1.6% |
| Southern Europe | 594 | 0.1% |
| Spain | 161 | 0.0% |
| Sri Lanka | 18 | 0.0% |
| Sudan | 16 | 0.0% |
| Sweden | 118 | 0.0% |
| Switzerland | 110 | 0.0% |
| Syria | 71 | 0.0% |
| Taiwan | 430 | 0.1% |
| Thailand | 586 | 0.1% |
| Trinidad and Tobago | 111 | 0.0% |
| Turkey | 30 | 0.0% |
| Uganda | 9 | 0.0% |
| Ukraine | 270 | 0.0% |
| Uruguay | 343 | 0.0% |
| Uzbekistan | 36 | 0.0% |
| Venezuela | 148 | 0.0% |
| Vietnam | 1,604 | 0.2% |
| Western Africa | 1,002 | 0.1% |
| Western Asia | 772 | 0.1% |
| Western Europe | 2,821 | 0.3% |
| Zimbabwe | 40 | 0.0% | View All 126 Rows |
Sex and Age in Area Code 775
Sex and Age in Area Code 775
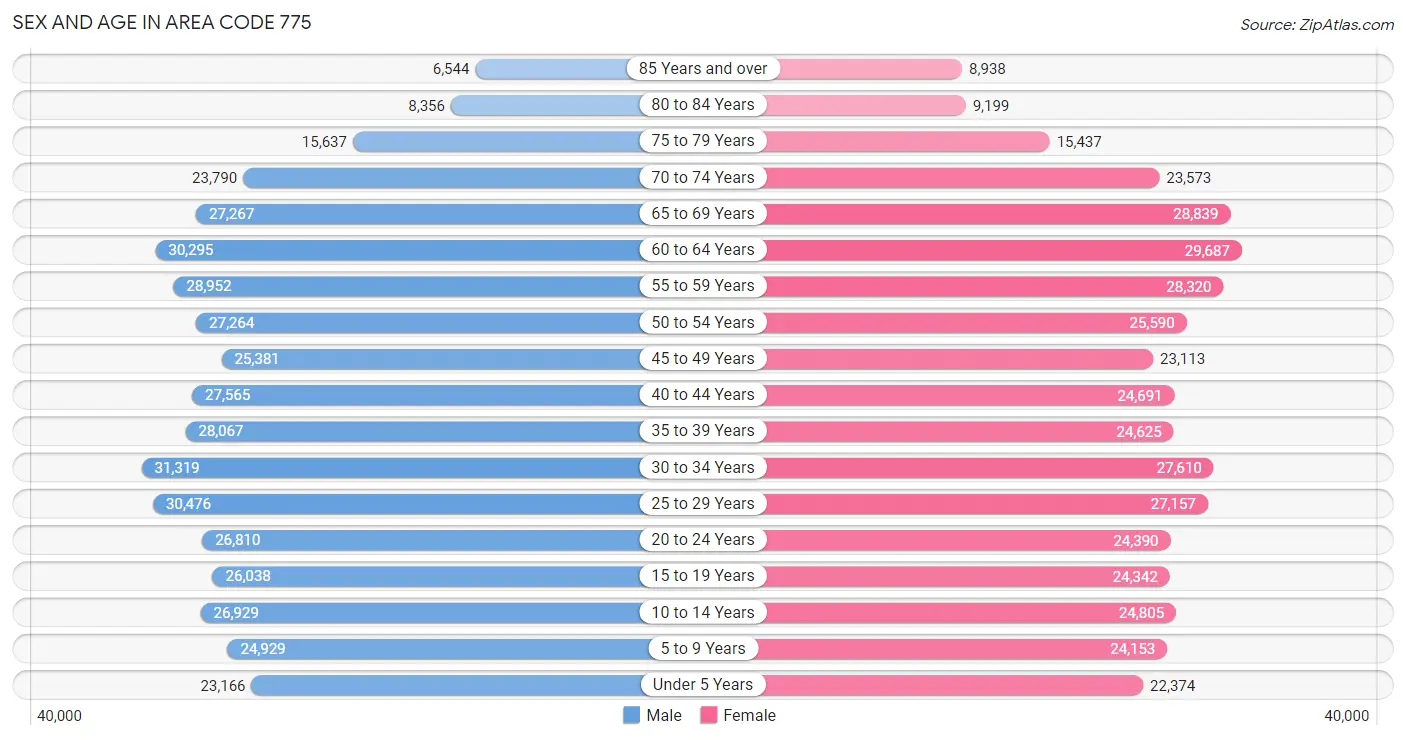
The most populous age groups in Area Code 775 are 30 to 34 Years (31,319 | 7.1%) for men and 60 to 64 Years (29,687 | 7.1%) for women.
| Age Bracket | Male | Female |
| Under 5 Years | 23,166 (5.3%) | 22,374 (5.4%) |
| 5 to 9 Years | 24,929 (5.7%) | 24,153 (5.8%) |
| 10 to 14 Years | 26,929 (6.1%) | 24,805 (5.9%) |
| 15 to 19 Years | 26,038 (5.9%) | 24,342 (5.8%) |
| 20 to 24 Years | 26,810 (6.1%) | 24,390 (5.9%) |
| 25 to 29 Years | 30,476 (7.0%) | 27,157 (6.5%) |
| 30 to 34 Years | 31,319 (7.1%) | 27,610 (6.6%) |
| 35 to 39 Years | 28,067 (6.4%) | 24,625 (5.9%) |
| 40 to 44 Years | 27,565 (6.3%) | 24,691 (5.9%) |
| 45 to 49 Years | 25,381 (5.8%) | 23,113 (5.5%) |
| 50 to 54 Years | 27,264 (6.2%) | 25,590 (6.1%) |
| 55 to 59 Years | 28,952 (6.6%) | 28,320 (6.8%) |
| 60 to 64 Years | 30,295 (6.9%) | 29,687 (7.1%) |
| 65 to 69 Years | 27,267 (6.2%) | 28,839 (6.9%) |
| 70 to 74 Years | 23,790 (5.4%) | 23,573 (5.7%) |
| 75 to 79 Years | 15,637 (3.6%) | 15,437 (3.7%) |
| 80 to 84 Years | 8,356 (1.9%) | 9,199 (2.2%) |
| 85 Years and over | 6,544 (1.5%) | 8,938 (2.1%) |
| Total | 438,785 (100.0%) | 416,843 (100.0%) |
Families and Households in Area Code 775
Median Family Size in Area Code 775
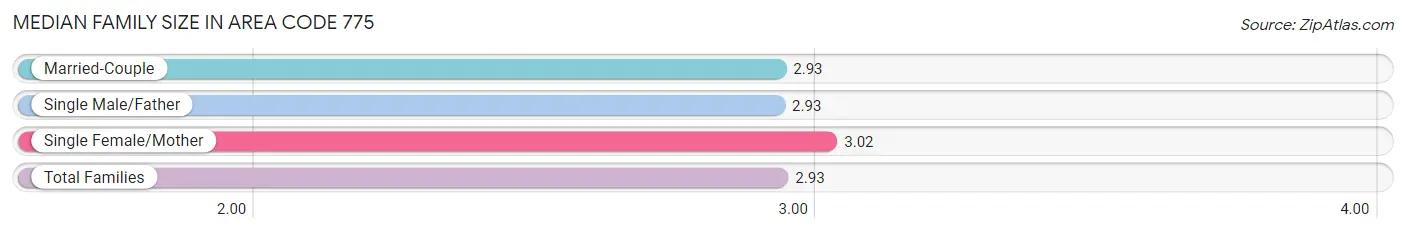
The median family size in Area Code 775 is 2.93 persons per family, with single female/mother families (34,294 | 15.9%) accounting for the largest median family size of 3.01986 persons per family. On the other hand, single male/father families (20,904 | 9.7%) represent the smallest median family size with 2.93 persons per family.
| Family Type | # Families | Family Size |
| Married-Couple | 160,220 (74.4%) | 2.93 |
| Single Male/Father | 20,904 (9.7%) | 2.93 |
| Single Female/Mother | 34,294 (15.9%) | 3.02 |
| Total Families | 215,418 (100.0%) | 2.93 |
Median Household Size in Area Code 775
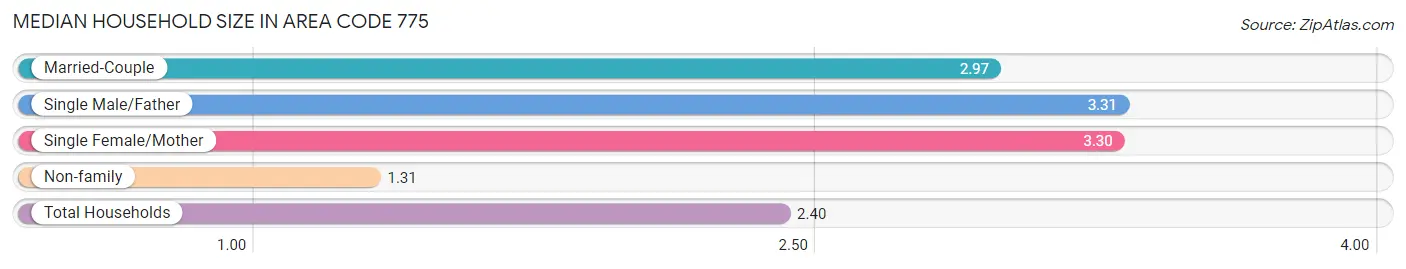
The median household size in Area Code 775 is 2.40 persons per household, with single male/father households (20,904 | 6.2%) accounting for the largest median household size of 3.3094 persons per household. non-family households (123,148 | 36.4%) represent the smallest median household size with 1.31 persons per household.
| Household Type | # Households | Household Size |
| Married-Couple | 160,220 (47.3%) | 2.97 |
| Single Male/Father | 20,904 (6.2%) | 3.31 |
| Single Female/Mother | 34,294 (10.1%) | 3.30 |
| Non-family | 123,148 (36.4%) | 1.31 |
| Total Households | 338,566 (100.0%) | 2.40 |
Household Size by Marriage Status in Area Code 775
Out of a total of 338,566 households in Area Code 775, 215,418 (63.6%) are family households, while 123,148 (36.4%) are nonfamily households. The most numerous type of family households are 2-person households, comprising 100,270, and the most common type of nonfamily households are 1-person households, comprising 93,463.
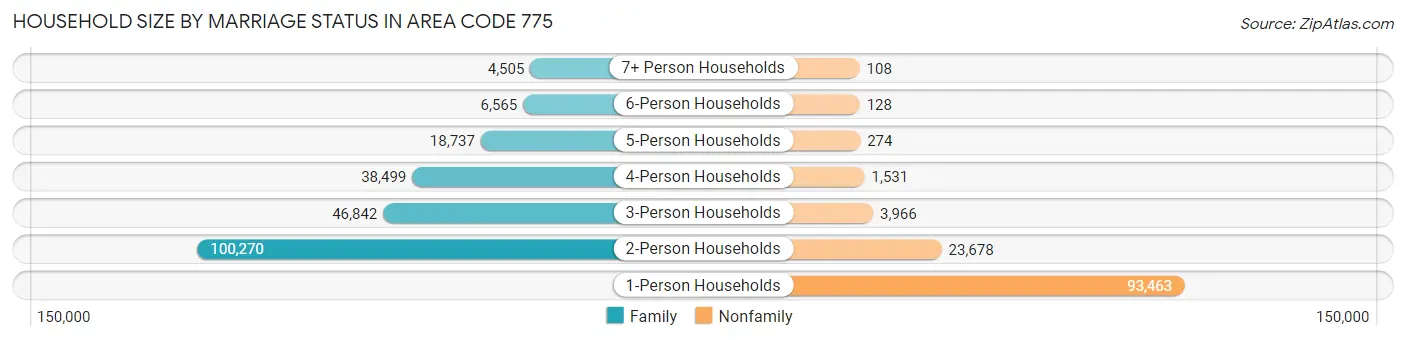
| Household Size | Family Households | Nonfamily Households |
| 1-Person Households | - | 93,463 (27.6%) |
| 2-Person Households | 100,270 (29.6%) | 23,678 (7.0%) |
| 3-Person Households | 46,842 (13.8%) | 3,966 (1.2%) |
| 4-Person Households | 38,499 (11.4%) | 1,531 (0.4%) |
| 5-Person Households | 18,737 (5.5%) | 274 (0.1%) |
| 6-Person Households | 6,565 (1.9%) | 128 (0.0%) |
| 7+ Person Households | 4,505 (1.3%) | 108 (0.0%) |
| Total | 215,418 (63.6%) | 123,148 (36.4%) |
Female Fertility in Area Code 775
Fertility by Age in Area Code 775
Average fertility rate in Area Code 775 is 63.9 births per 1,000 women. Women in the age bracket of 20 to 34 years have the highest fertility rate with 109.4 births per 1,000 women. Women in the age bracket of 20 to 34 years acount for 69.6% of all women with births.
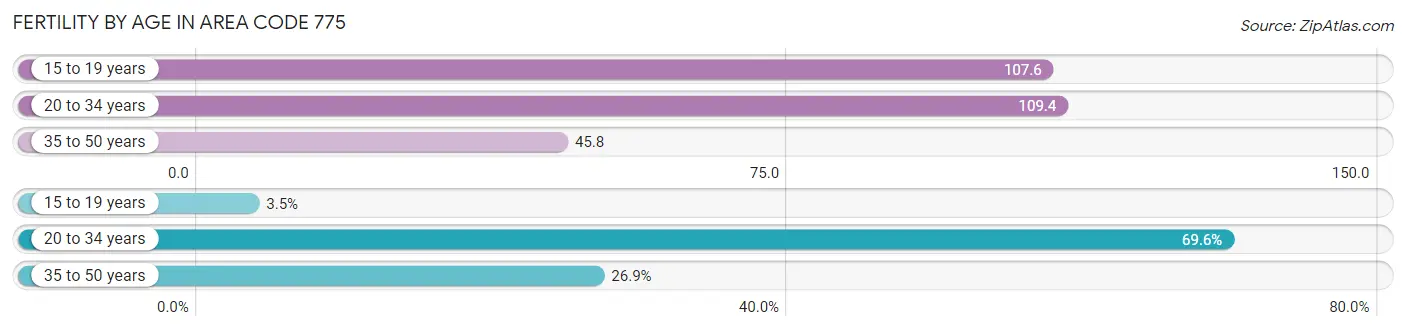
| Age Bracket | Women with Births | Births / 1,000 Women |
| 15 to 19 years | 332 (3.5%) | 107.6 |
| 20 to 34 years | 6,633 (69.6%) | 109.4 |
| 35 to 50 years | 2,563 (26.9%) | 45.8 |
| Total | 9,528 (100.0%) | 63.9 |
Fertility by Age by Marriage Status in Area Code 775
55.0% of women with births (9,528) in Area Code 775 are married. The highest percentage of unmarried women with births falls into 15 to 19 years age bracket with 100.0% of them unmarried at the time of birth, while the lowest percentage of unmarried women with births belong to 20 to 34 years age bracket with 48.6% of them unmarried.
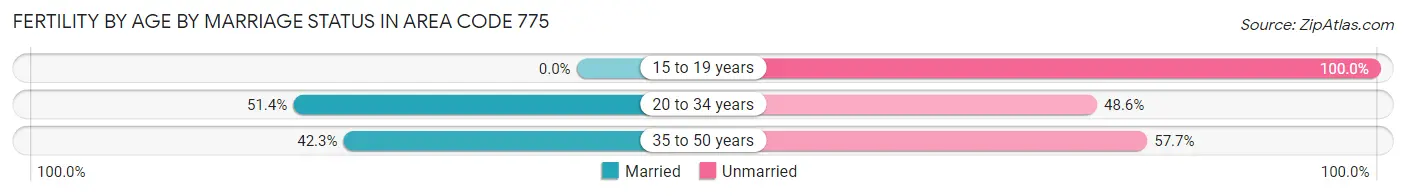
| Age Bracket | Married | Unmarried |
| 15 to 19 years | 0 (0.0%) | 332 (100.0%) |
| 20 to 34 years | 3,407 (51.4%) | 3,226 (48.6%) |
| 35 to 50 years | 1,083 (42.3%) | 1,480 (57.7%) |
| Total | 5,237 (55.0%) | 4,291 (45.0%) |
Fertility by Education in Area Code 775
Average fertility rate in Area Code 775 is 63.9 births per 1,000 women. Women with the education attainment of graduate degree have the highest fertility rate of 129.2 births per 1,000 women, while women with the education attainment of less than high school have the lowest fertility at 72.9 births per 1,000 women. Women with the education attainment of college or associate's degree represent 32.0% of all women with births.
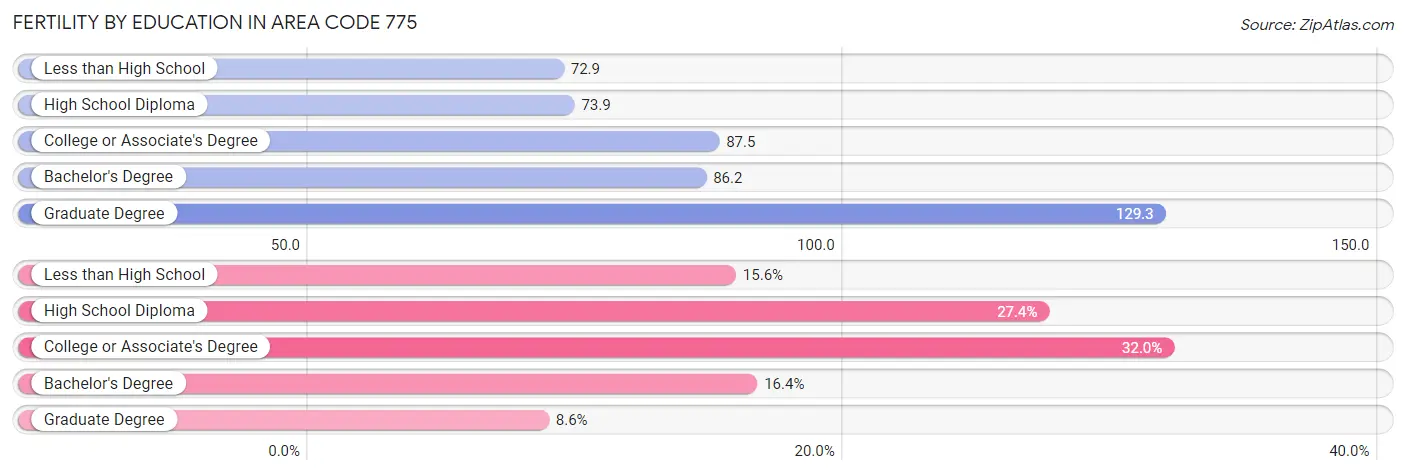
| Educational Attainment | Women with Births | Births / 1,000 Women |
| Less than High School | 1,487 (15.6%) | 72.9 |
| High School Diploma | 2,606 (27.4%) | 73.9 |
| College or Associate's Degree | 3,052 (32.0%) | 87.5 |
| Bachelor's Degree | 1,564 (16.4%) | 86.2 |
| Graduate Degree | 819 (8.6%) | 129.2 |
| Total | 9,528 (100.0%) | 63.9 |
Fertility by Education by Marriage Status in Area Code 775
45.0% of women with births in Area Code 775 are unmarried. Women with the educational attainment of graduate degree are most likely to be married with 55.9% of them married at childbirth, while women with the educational attainment of less than high school are least likely to be married with 70.8% of them unmarried at childbirth.
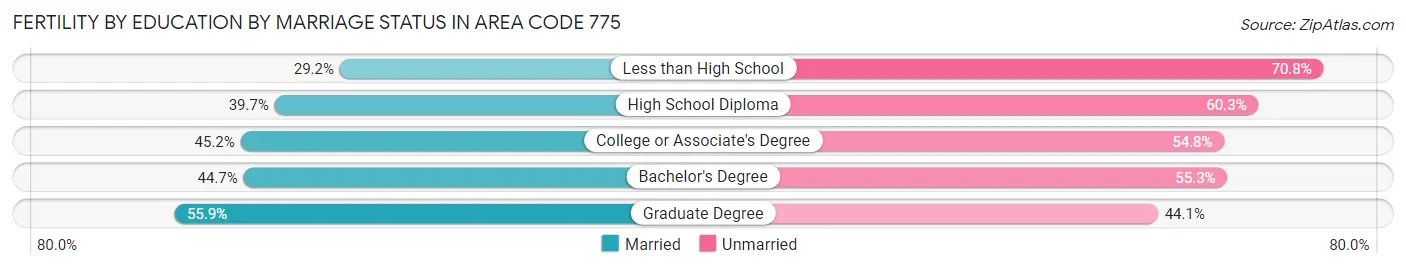
| Educational Attainment | Married | Unmarried |
| Less than High School | 434 (29.2%) | 1,053 (70.8%) |
| High School Diploma | 1,034 (39.7%) | 1,572 (60.3%) |
| College or Associate's Degree | 1,379 (45.2%) | 1,673 (54.8%) |
| Bachelor's Degree | 699 (44.7%) | 865 (55.3%) |
| Graduate Degree | 458 (55.9%) | 361 (44.1%) |
| Total | 5,237 (55.0%) | 4,291 (45.0%) |
Employment Characteristics in Area Code 775
Employment by Class of Employer in Area Code 775
Among the 398,043 employed individuals in Area Code 775, private company employees (278,886 | 70.1%), local government employees (28,774 | 7.2%), and state government employees (21,696 | 5.4%) make up the most common classes of employment.
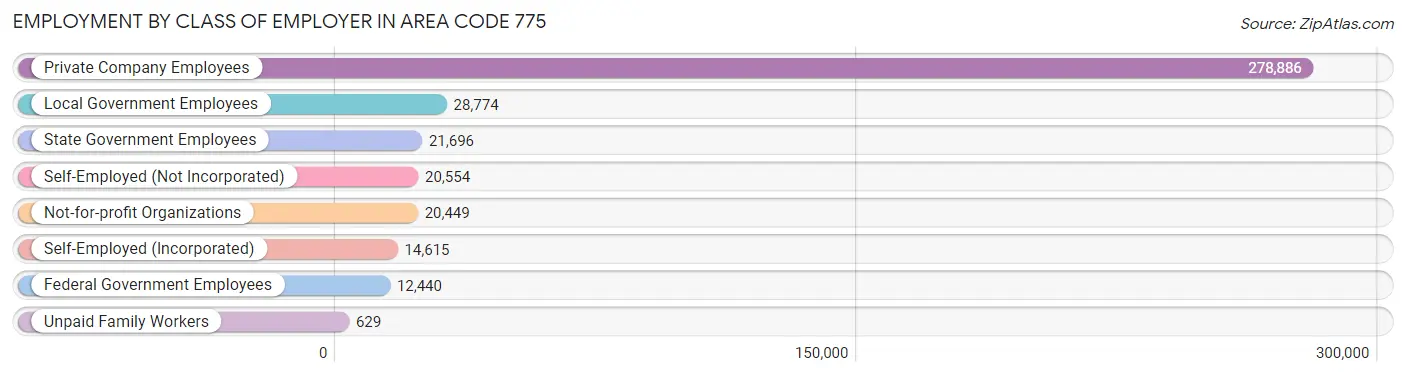
| Employer Class | # Employees | % Employees |
| Private Company Employees | 278,886 | 70.1% |
| Self-Employed (Incorporated) | 14,615 | 3.7% |
| Self-Employed (Not Incorporated) | 20,554 | 5.2% |
| Not-for-profit Organizations | 20,449 | 5.1% |
| Local Government Employees | 28,774 | 7.2% |
| State Government Employees | 21,696 | 5.4% |
| Federal Government Employees | 12,440 | 3.1% |
| Unpaid Family Workers | 629 | 0.2% |
| Total | 398,043 | 100.0% |
Employment Status by Age in Area Code 775
According to the labor force statistics for Area Code 775, out of the total population over 16 years of age (699,133), 53.8% or 375,854 individuals are in the labor force, with 7.8% or 29,354 of them unemployed. The age group with the highest labor force participation rate is 25 to 29 years, with 82.7% or 47,674 individuals in the labor force. Within the labor force, the 16 to 19 years age range has the highest percentage of unemployed individuals, with 834.0% or 152,130 of them being unemployed.
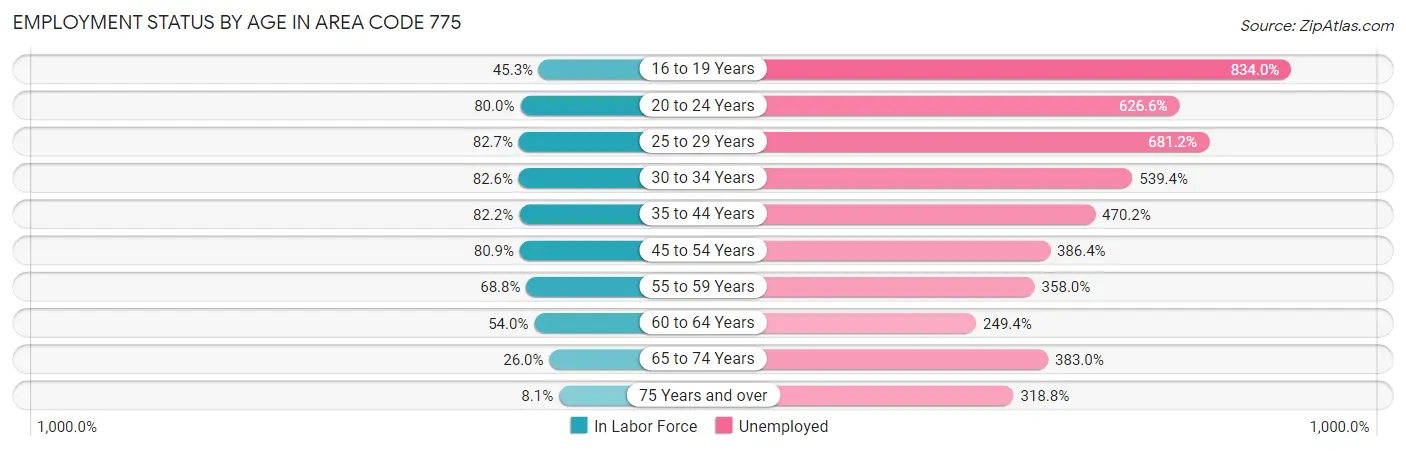
| Age Bracket | In Labor Force | Unemployed |
| 16 to 19 Years | 18,240 (45.3%) | 152,130 (834.0%) |
| 20 to 24 Years | 40,968 (80.0%) | 256,718 (626.6%) |
| 25 to 29 Years | 47,676 (82.7%) | 324,755 (681.2%) |
| 30 to 34 Years | 48,691 (82.6%) | 262,650 (539.4%) |
| 35 to 44 Years | 86,218 (82.2%) | 405,383 (470.2%) |
| 45 to 54 Years | 82,001 (80.9%) | 316,852 (386.4%) |
| 55 to 59 Years | 39,425 (68.8%) | 141,145 (358.0%) |
| 60 to 64 Years | 32,407 (54.0%) | 80,826 (249.4%) |
| 65 to 74 Years | 26,921 (26.0%) | 103,115 (383.0%) |
| 75 Years and over | 5,204 (8.1%) | 16,597 (318.8%) |
| Total | 375,828 (53.8%) | 29,353 (7.8%) |
Employment Status by Educational Attainment in Area Code 775
According to labor force statistics for Area Code 775, 72.5% of individuals (318,949) out of the total population between 25 and 64 years of age (440,112) are in the labor force, with 578.9% or 1,846,396 of them being unemployed. The group with the highest labor force participation rate are those with the educational attainment of bachelor's degree or higher, with 83.4% or 96,437 individuals in the labor force. Within the labor force, individuals with less than high school education have the highest percentage of unemployment, with 788.8% or 275,165 of them being unemployed.
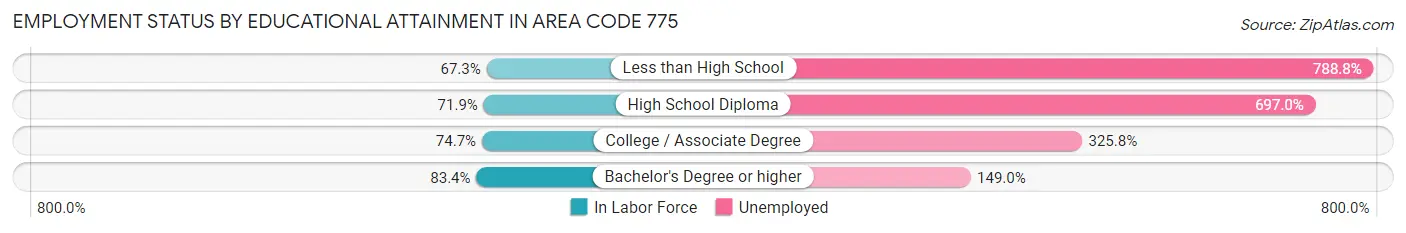
| Educational Attainment | In Labor Force | Unemployed |
| Less than High School | 34,883 (67.3%) | 408,985 (788.8%) |
| High School Diploma | 88,076 (71.9%) | 854,034 (697.0%) |
| College / Associate Degree | 112,155 (74.7%) | 489,212 (325.8%) |
| Bachelor's Degree or higher | 96,441 (83.4%) | 172,208 (149.0%) |
| Total | 318,931 (72.5%) | 2,547,808 (578.9%) |
Employment Occupations by Sex in Area Code 775
Management, Business, Science and Arts Occupations
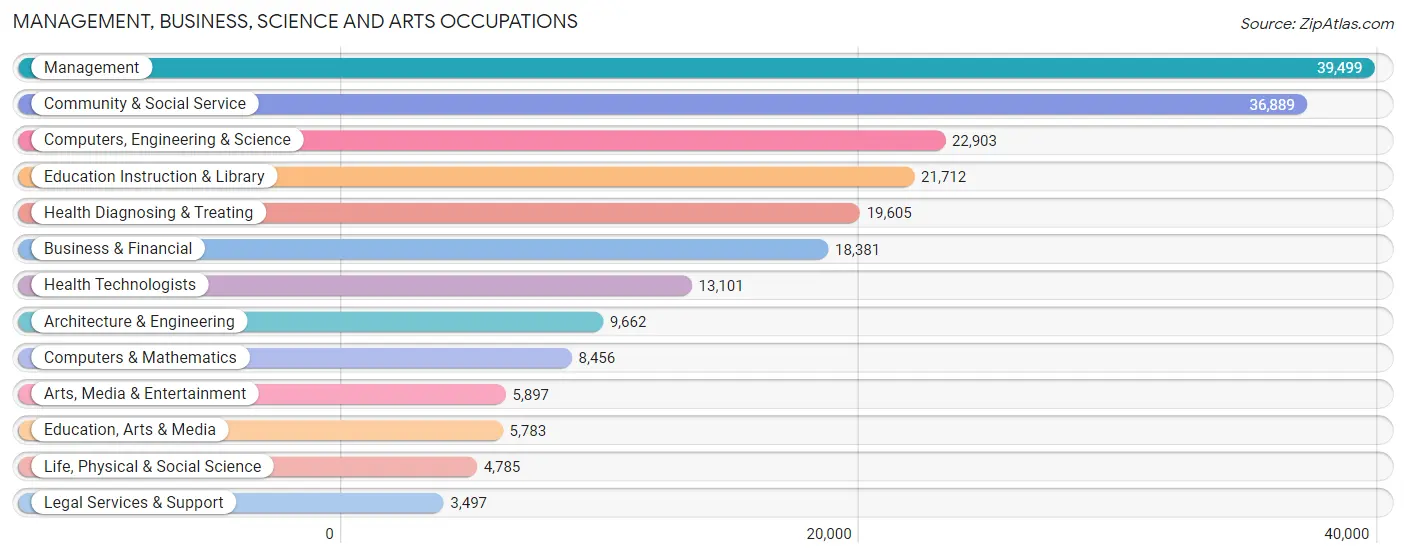
The most common Management, Business, Science and Arts occupations in Area Code 775 are Management (39,499 | 9.8%), Community & Social Service (36,889 | 9.1%), Computers, Engineering & Science (22,903 | 5.7%), Education Instruction & Library (21,712 | 5.4%), and Health Diagnosing & Treating (19,605 | 4.9%).
Management, Business, Science and Arts Occupations by Sex
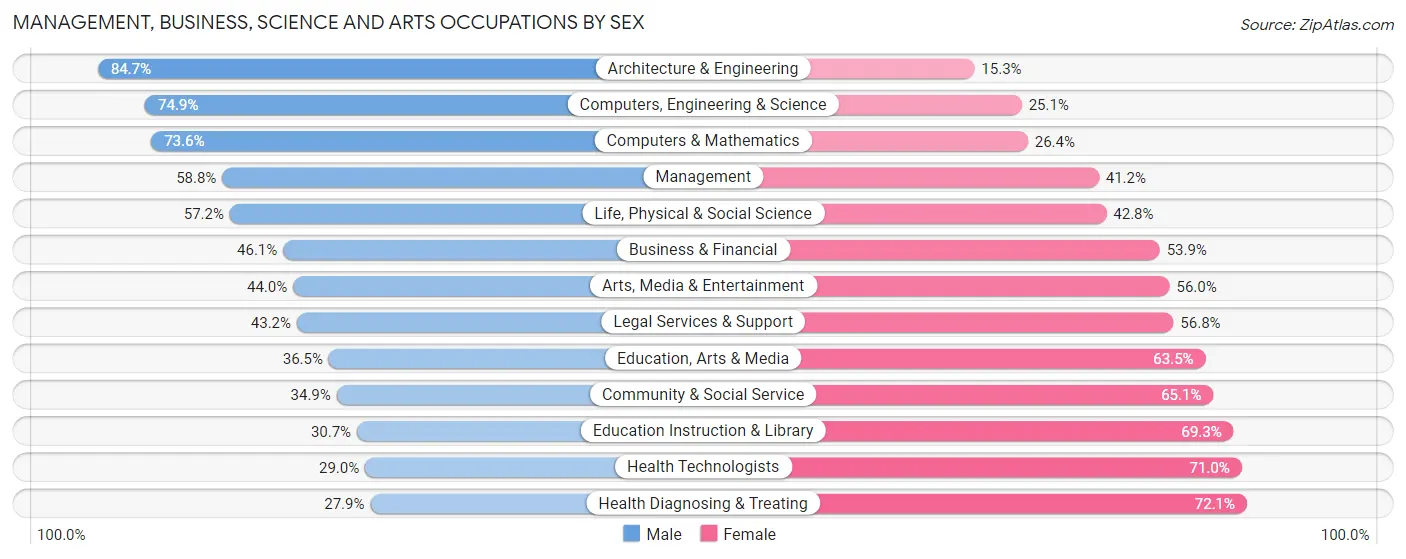
Within the Management, Business, Science and Arts occupations in Area Code 775, the most male-oriented occupations are Architecture & Engineering (84.7%), Computers, Engineering & Science (74.9%), and Computers & Mathematics (73.6%), while the most female-oriented occupations are Health Diagnosing & Treating (72.1%), Health Technologists (71.0%), and Education Instruction & Library (69.3%).
| Occupation | Male | Female |
| Management | 23,217 (58.8%) | 16,282 (41.2%) |
| Business & Financial | 8,468 (46.1%) | 9,913 (53.9%) |
| Computers, Engineering & Science | 17,145 (74.9%) | 5,758 (25.1%) |
| Computers & Mathematics | 6,222 (73.6%) | 2,234 (26.4%) |
| Architecture & Engineering | 8,186 (84.7%) | 1,476 (15.3%) |
| Life, Physical & Social Science | 2,737 (57.2%) | 2,048 (42.8%) |
| Community & Social Service | 12,878 (34.9%) | 24,011 (65.1%) |
| Education, Arts & Media | 2,113 (36.5%) | 3,670 (63.5%) |
| Legal Services & Support | 1,511 (43.2%) | 1,986 (56.8%) |
| Education Instruction & Library | 6,659 (30.7%) | 15,053 (69.3%) |
| Arts, Media & Entertainment | 2,595 (44.0%) | 3,302 (56.0%) |
| Health Diagnosing & Treating | 5,467 (27.9%) | 14,138 (72.1%) |
| Health Technologists | 3,797 (29.0%) | 9,304 (71.0%) |
| Total (Category) | 67,175 (48.9%) | 70,102 (51.1%) |
| Total (Overall) | 221,560 (54.9%) | 182,115 (45.1%) |
Services Occupations
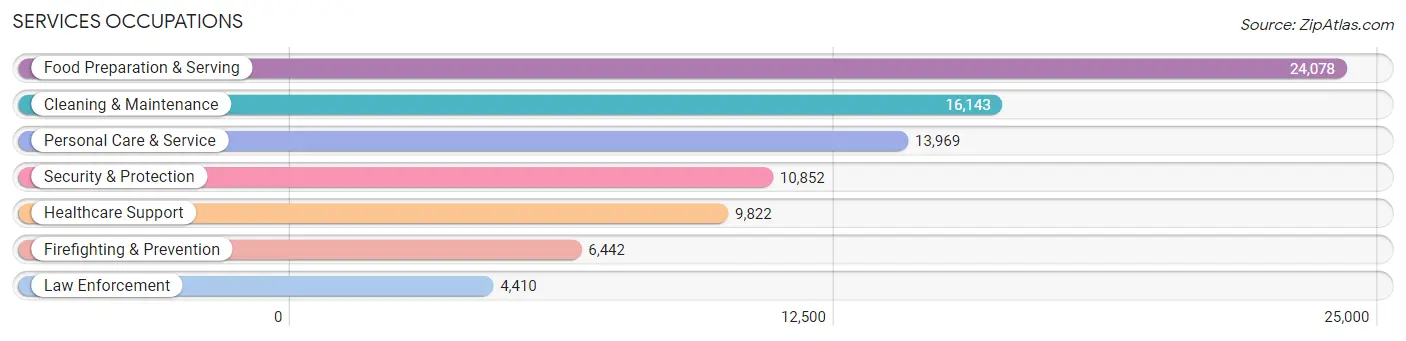
The most common Services occupations in Area Code 775 are Food Preparation & Serving (24,078 | 6.0%), Cleaning & Maintenance (16,143 | 4.0%), Personal Care & Service (13,969 | 3.5%), Security & Protection (10,852 | 2.7%), and Healthcare Support (9,822 | 2.4%).
Services Occupations by Sex
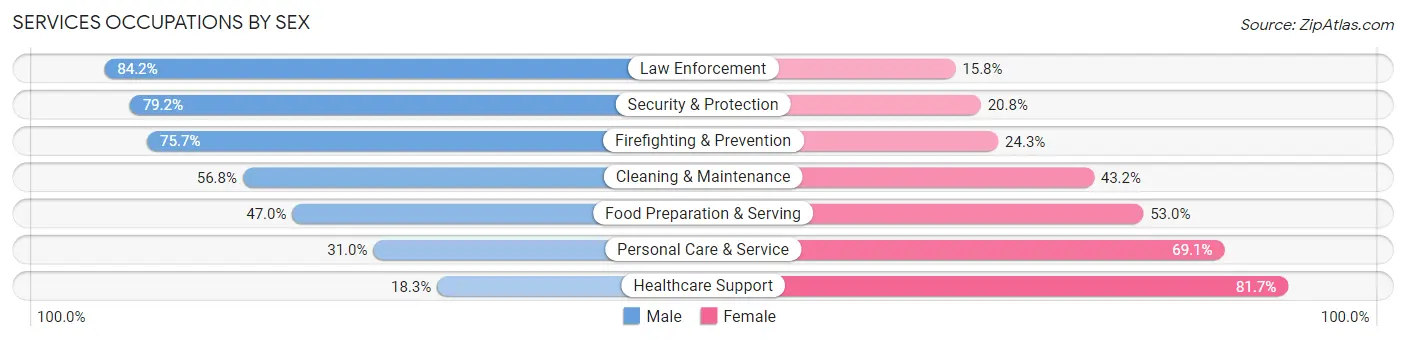
Within the Services occupations in Area Code 775, the most male-oriented occupations are Law Enforcement (84.2%), Security & Protection (79.2%), and Firefighting & Prevention (75.7%), while the most female-oriented occupations are Healthcare Support (81.7%), Personal Care & Service (69.1%), and Food Preparation & Serving (53.0%).
| Occupation | Male | Female |
| Healthcare Support | 1,800 (18.3%) | 8,022 (81.7%) |
| Security & Protection | 8,591 (79.2%) | 2,261 (20.8%) |
| Firefighting & Prevention | 4,878 (75.7%) | 1,564 (24.3%) |
| Law Enforcement | 3,713 (84.2%) | 697 (15.8%) |
| Food Preparation & Serving | 11,314 (47.0%) | 12,764 (53.0%) |
| Cleaning & Maintenance | 9,167 (56.8%) | 6,976 (43.2%) |
| Personal Care & Service | 4,323 (30.9%) | 9,646 (69.1%) |
| Total (Category) | 35,195 (47.0%) | 39,669 (53.0%) |
| Total (Overall) | 221,560 (54.9%) | 182,115 (45.1%) |
Sales and Office Occupations
The most common Sales and Office occupations in Area Code 775 are Office & Administration (47,821 | 11.8%), and Sales & Related (38,575 | 9.6%).
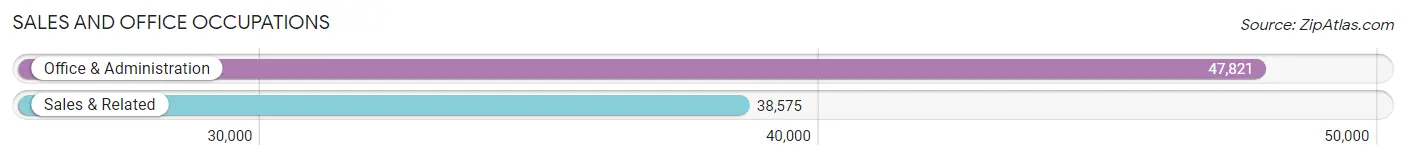
Sales and Office Occupations by Sex
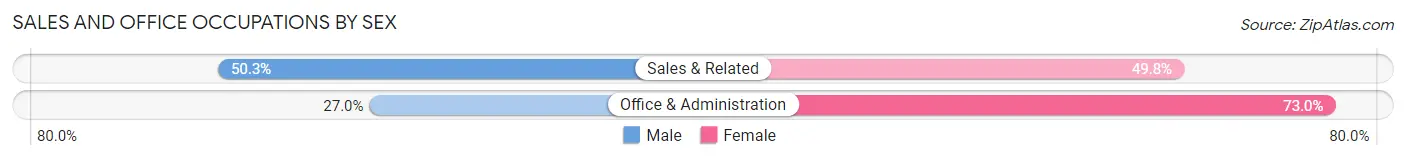
| Occupation | Male | Female |
| Sales & Related | 19,385 (50.2%) | 19,190 (49.7%) |
| Office & Administration | 12,892 (27.0%) | 34,929 (73.0%) |
| Total (Category) | 32,277 (37.4%) | 54,119 (62.6%) |
| Total (Overall) | 221,560 (54.9%) | 182,115 (45.1%) |
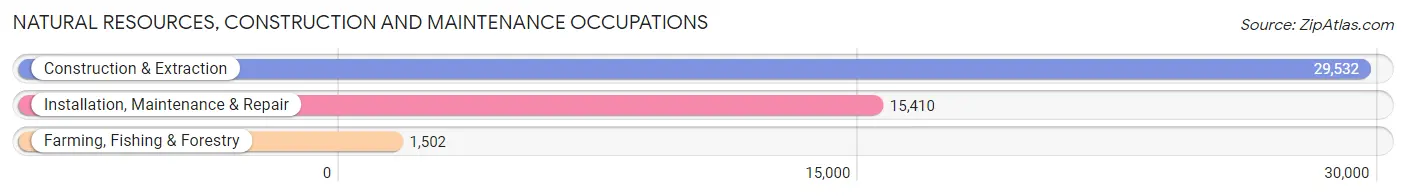
Natural Resources, Construction and Maintenance Occupations
The most common Natural Resources, Construction and Maintenance occupations in Area Code 775 are Construction & Extraction (29,532 | 7.3%), Installation, Maintenance & Repair (15,410 | 3.8%), and Farming, Fishing & Forestry (1,502 | 0.4%).
Natural Resources, Construction and Maintenance Occupations by Sex
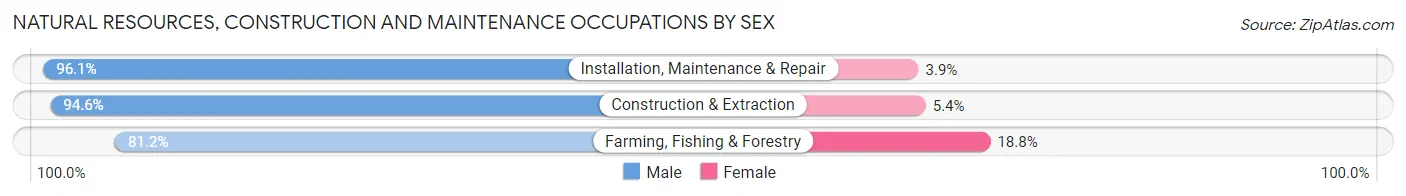
| Occupation | Male | Female |
| Farming, Fishing & Forestry | 1,219 (81.2%) | 283 (18.8%) |
| Construction & Extraction | 27,943 (94.6%) | 1,589 (5.4%) |
| Installation, Maintenance & Repair | 14,810 (96.1%) | 600 (3.9%) |
| Total (Category) | 43,972 (94.7%) | 2,472 (5.3%) |
| Total (Overall) | 221,560 (54.9%) | 182,115 (45.1%) |
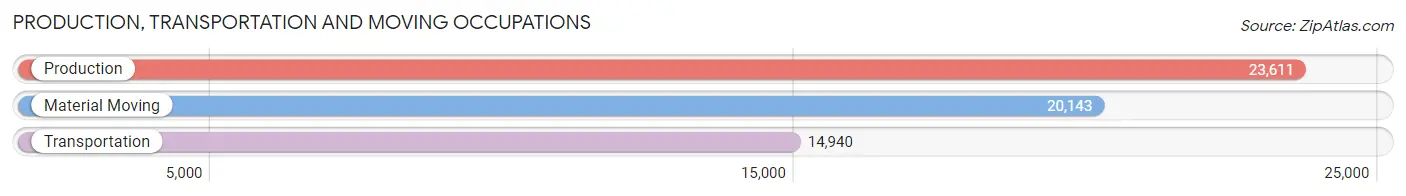
Production, Transportation and Moving Occupations
The most common Production, Transportation and Moving occupations in Area Code 775 are Production (23,611 | 5.9%), Material Moving (20,143 | 5.0%), and Transportation (14,940 | 3.7%).
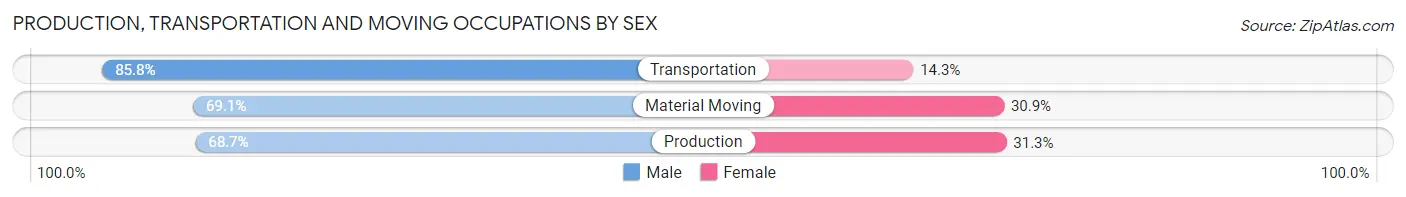
Production, Transportation and Moving Occupations by Sex
| Occupation | Male | Female |
| Production | 16,212 (68.7%) | 7,399 (31.3%) |
| Transportation | 12,811 (85.8%) | 2,129 (14.2%) |
| Material Moving | 13,918 (69.1%) | 6,225 (30.9%) |
| Total (Category) | 42,941 (73.2%) | 15,753 (26.8%) |
| Total (Overall) | 221,560 (54.9%) | 182,115 (45.1%) |
Employment Industries by Sex in Area Code 775
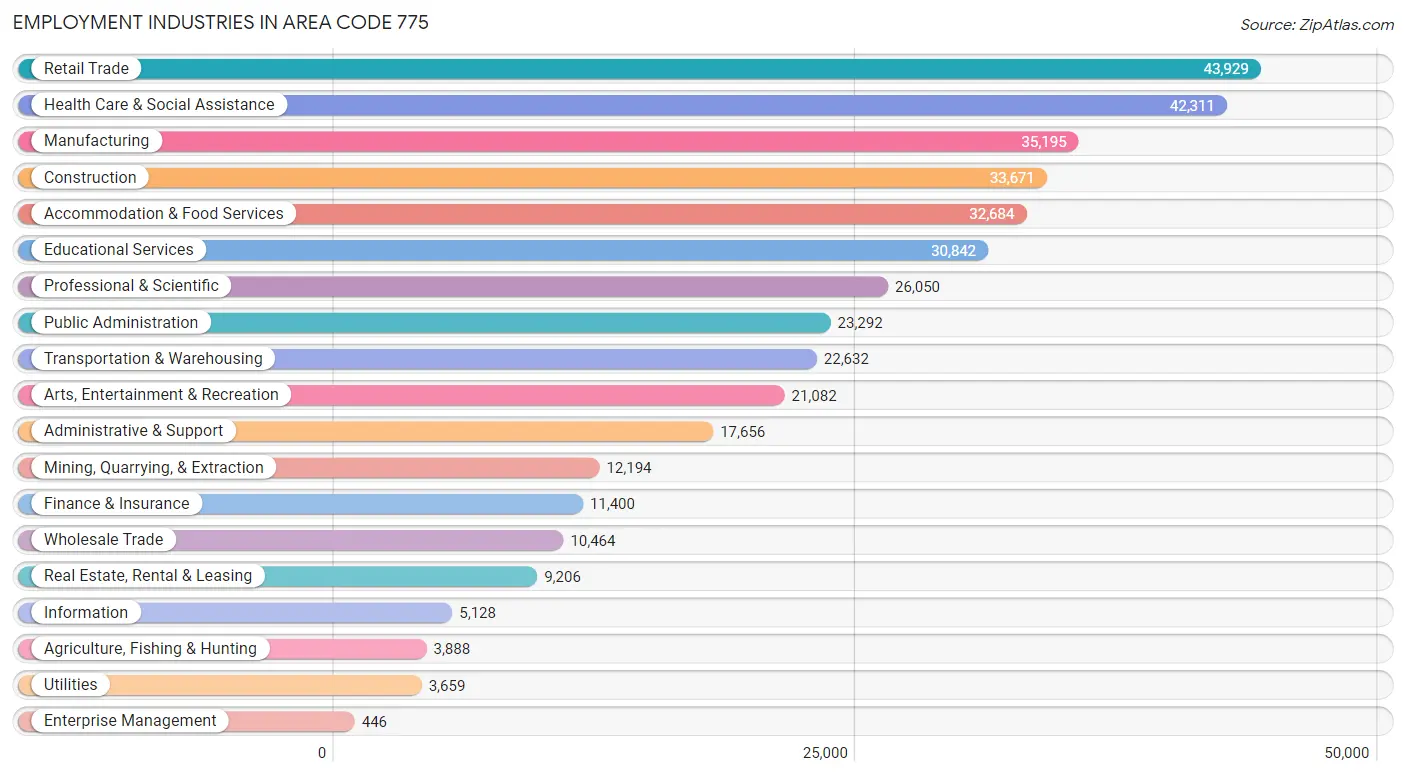
Employment Industries in Area Code 775
The major employment industries in Area Code 775 include Retail Trade (43,929 | 10.9%), Health Care & Social Assistance (42,311 | 10.5%), Manufacturing (35,195 | 8.7%), Construction (33,671 | 8.3%), and Accommodation & Food Services (32,684 | 8.1%).
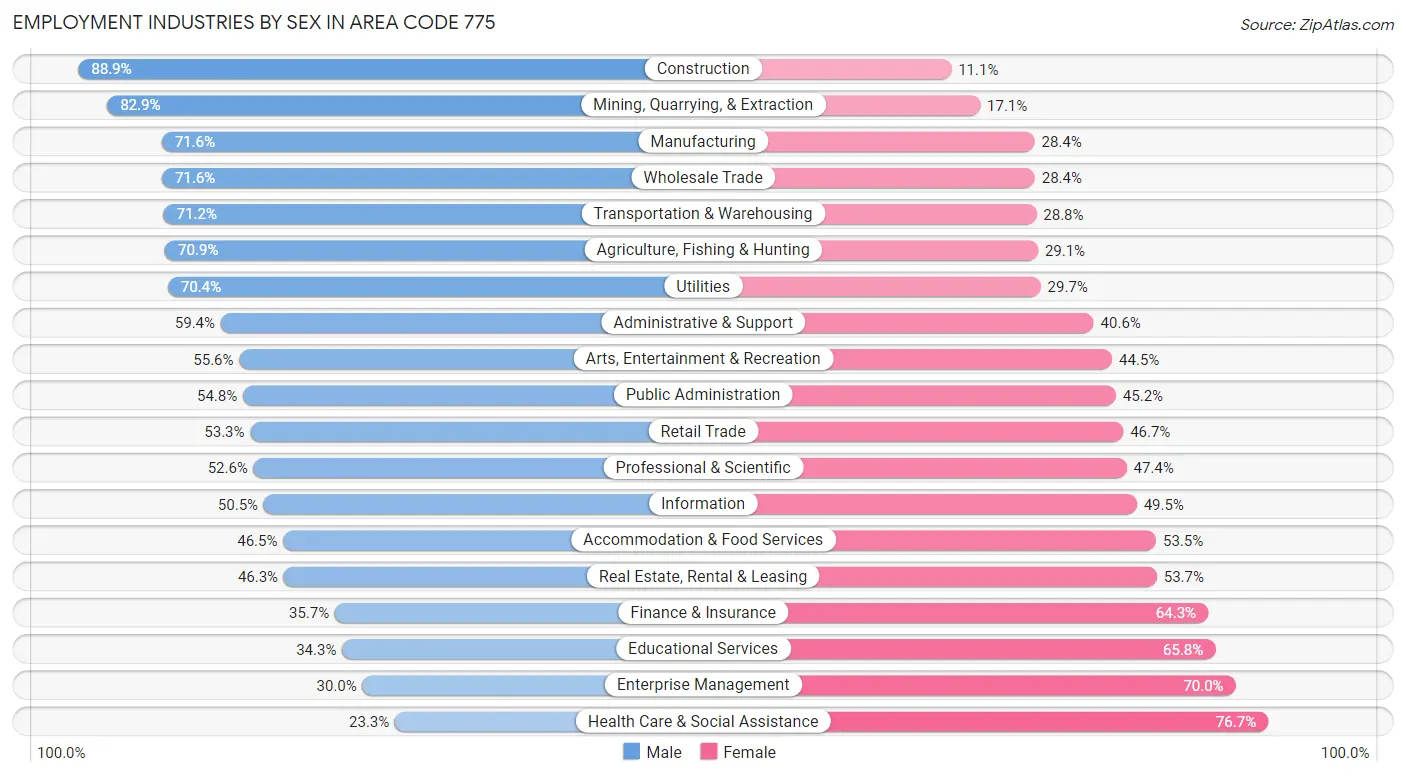
Employment Industries by Sex in Area Code 775
The Area Code 775 industries that see more men than women are Construction (88.9%), Mining, Quarrying, & Extraction (82.9%), and Manufacturing (71.6%), whereas the industries that tend to have a higher number of women are Health Care & Social Assistance (76.7%), Enterprise Management (70.0%), and Educational Services (65.7%).
| Industry | Male | Female |
| Agriculture, Fishing & Hunting | 2,757 (70.9%) | 1,131 (29.1%) |
| Mining, Quarrying, & Extraction | 10,107 (82.9%) | 2,087 (17.1%) |
| Construction | 29,919 (88.9%) | 3,752 (11.1%) |
| Manufacturing | 25,202 (71.6%) | 9,993 (28.4%) |
| Wholesale Trade | 7,488 (71.6%) | 2,976 (28.4%) |
| Retail Trade | 23,399 (53.3%) | 20,530 (46.7%) |
| Transportation & Warehousing | 16,122 (71.2%) | 6,510 (28.8%) |
| Utilities | 2,574 (70.4%) | 1,085 (29.6%) |
| Information | 2,588 (50.5%) | 2,540 (49.5%) |
| Finance & Insurance | 4,074 (35.7%) | 7,326 (64.3%) |
| Real Estate, Rental & Leasing | 4,264 (46.3%) | 4,942 (53.7%) |
| Professional & Scientific | 13,697 (52.6%) | 12,353 (47.4%) |
| Enterprise Management | 134 (30.0%) | 312 (70.0%) |
| Administrative & Support | 10,484 (59.4%) | 7,172 (40.6%) |
| Educational Services | 10,562 (34.3%) | 20,280 (65.7%) |
| Health Care & Social Assistance | 9,861 (23.3%) | 32,450 (76.7%) |
| Arts, Entertainment & Recreation | 11,712 (55.5%) | 9,370 (44.5%) |
| Accommodation & Food Services | 15,185 (46.5%) | 17,499 (53.5%) |
| Public Administration | 12,759 (54.8%) | 10,533 (45.2%) |
| Total | 221,560 (54.9%) | 182,115 (45.1%) |
Education in Area Code 775
School Enrollment in Area Code 775
The most common levels of schooling among the 187,701 students in Area Code 775 are high school (41,798 | 22.3%), middle school (40,723 | 21.7%), and elementary school (38,785 | 20.7%).
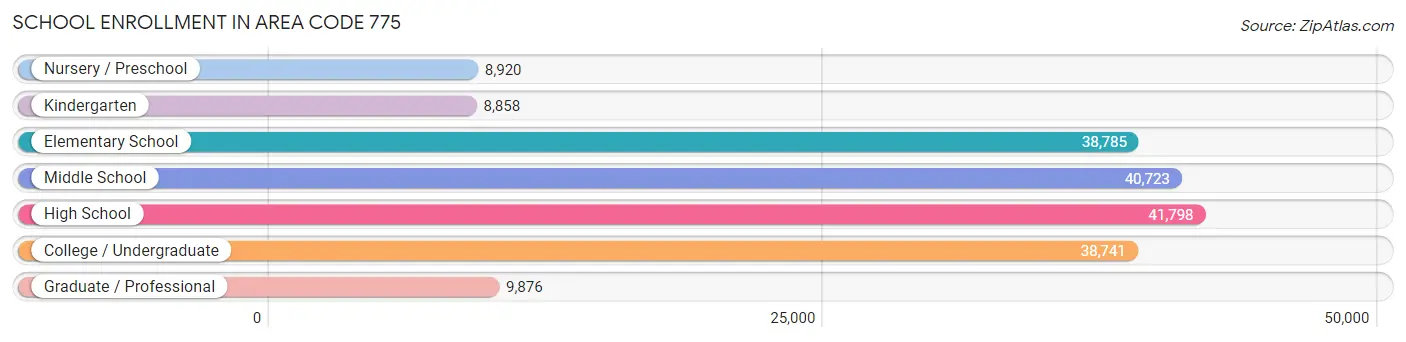
| School Level | # Students | % Students |
| Nursery / Preschool | 8,920 | 4.8% |
| Kindergarten | 8,858 | 4.7% |
| Elementary School | 38,785 | 20.7% |
| Middle School | 40,723 | 21.7% |
| High School | 41,798 | 22.3% |
| College / Undergraduate | 38,741 | 20.6% |
| Graduate / Professional | 9,876 | 5.3% |
| Total | 187,701 | 100.0% |
School Enrollment by Age by Funding Source in Area Code 775
Out of a total of 187,701 students who are enrolled in schools in Area Code 775, 21,852 (11.6%) attend a private institution, while the remaining 165,849 (88.4%) are enrolled in public schools. The age group of 3 to 4 year olds has the highest likelihood of being enrolled in private schools, with 2,769 (38.5% in the age bracket) enrolled. Conversely, the age group of 15 to 17 year olds has the lowest likelihood of being enrolled in a private school, with 27,449 (93.1% in the age bracket) attending a public institution.
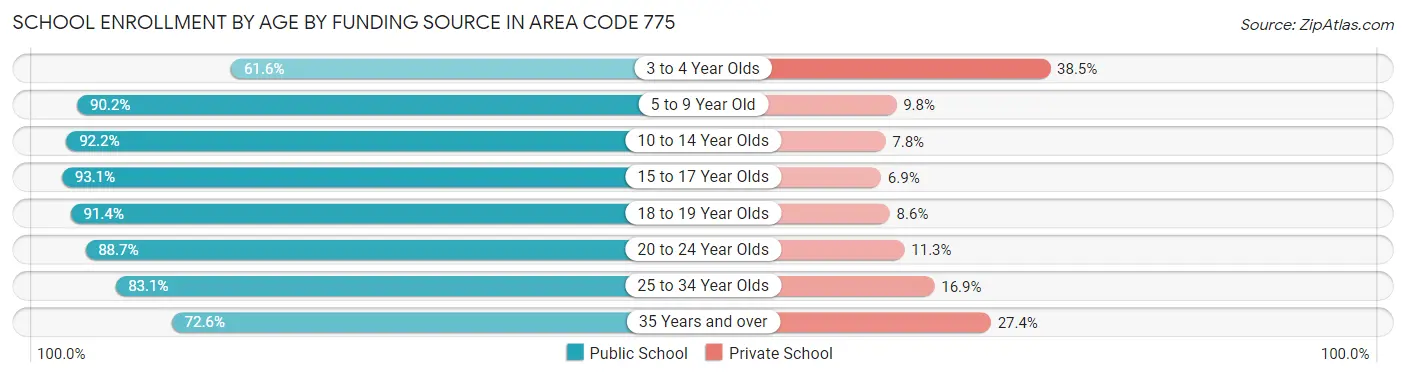
| Age Bracket | Public School | Private School |
| 3 to 4 Year Olds | 4,432 (61.6%) | 2,769 (38.5%) |
| 5 to 9 Year Old | 40,881 (90.2%) | 4,433 (9.8%) |
| 10 to 14 Year Olds | 46,314 (92.2%) | 3,897 (7.8%) |
| 15 to 17 Year Olds | 27,449 (93.1%) | 2,047 (6.9%) |
| 18 to 19 Year Olds | 11,618 (91.4%) | 1,089 (8.6%) |
| 20 to 24 Year Olds | 15,163 (88.7%) | 1,931 (11.3%) |
| 25 to 34 Year Olds | 10,730 (83.1%) | 2,179 (16.9%) |
| 35 Years and over | 9,271 (72.6%) | 3,498 (27.4%) |
| Total | 165,849 (88.4%) | 21,852 (11.6%) |
Educational Attainment by Field of Study in Area Code 775
Business (32,028 | 18.3%), education (21,093 | 12.0%), science & technology (16,774 | 9.6%), bio, nature & agricultural (15,023 | 8.6%), and engineering (14,462 | 8.3%) are the most common fields of study among 175,145 individuals in Area Code 775 who have obtained a bachelor's degree or higher.
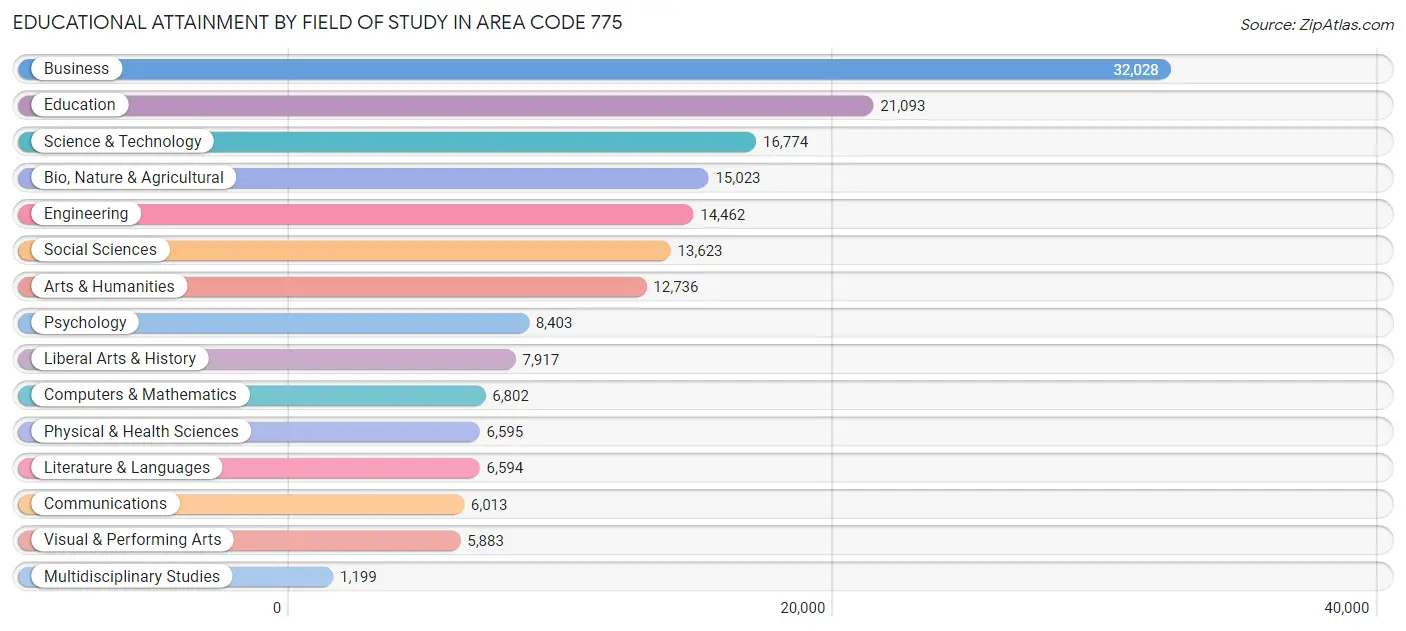
| Field of Study | # Graduates | % Graduates |
| Computers & Mathematics | 6,802 | 3.9% |
| Bio, Nature & Agricultural | 15,023 | 8.6% |
| Physical & Health Sciences | 6,595 | 3.8% |
| Psychology | 8,403 | 4.8% |
| Social Sciences | 13,623 | 7.8% |
| Engineering | 14,462 | 8.3% |
| Multidisciplinary Studies | 1,199 | 0.7% |
| Science & Technology | 16,774 | 9.6% |
| Business | 32,028 | 18.3% |
| Education | 21,093 | 12.0% |
| Literature & Languages | 6,594 | 3.8% |
| Liberal Arts & History | 7,917 | 4.5% |
| Visual & Performing Arts | 5,883 | 3.4% |
| Communications | 6,013 | 3.4% |
| Arts & Humanities | 12,736 | 7.3% |
| Total | 175,145 | 100.0% |
Transportation & Commute in Area Code 775
Vehicle Availability by Sex in Area Code 775
The most prevalent vehicle ownership categories in Area Code 775 are males with 2 vehicles (81,618, accounting for 37.4%) and females with 2 vehicles (66,196, making up 45.9%).
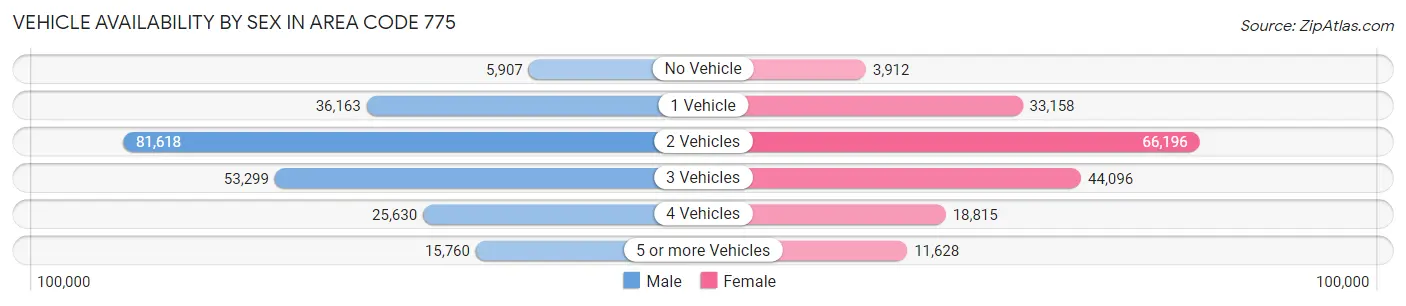
| Vehicles Available | Male | Female |
| No Vehicle | 5,907 (2.7%) | 3,912 (2.2%) |
| 1 Vehicle | 36,163 (16.6%) | 33,158 (18.6%) |
| 2 Vehicles | 81,618 (37.4%) | 66,196 (37.2%) |
| 3 Vehicles | 53,299 (24.4%) | 44,096 (24.8%) |
| 4 Vehicles | 25,630 (11.7%) | 18,815 (10.6%) |
| 5 or more Vehicles | 15,760 (7.2%) | 11,628 (6.5%) |
| Total | 218,377 (100.0%) | 177,805 (100.0%) |
Commute Time in Area Code 775
The most frequently occuring commute durations in Area Code 775 are 15 to 19 minutes (63,557 commuters, 17.4%), 10 to 14 minutes (59,389 commuters, 16.3%), and 20 to 24 minutes (50,747 commuters, 13.9%).
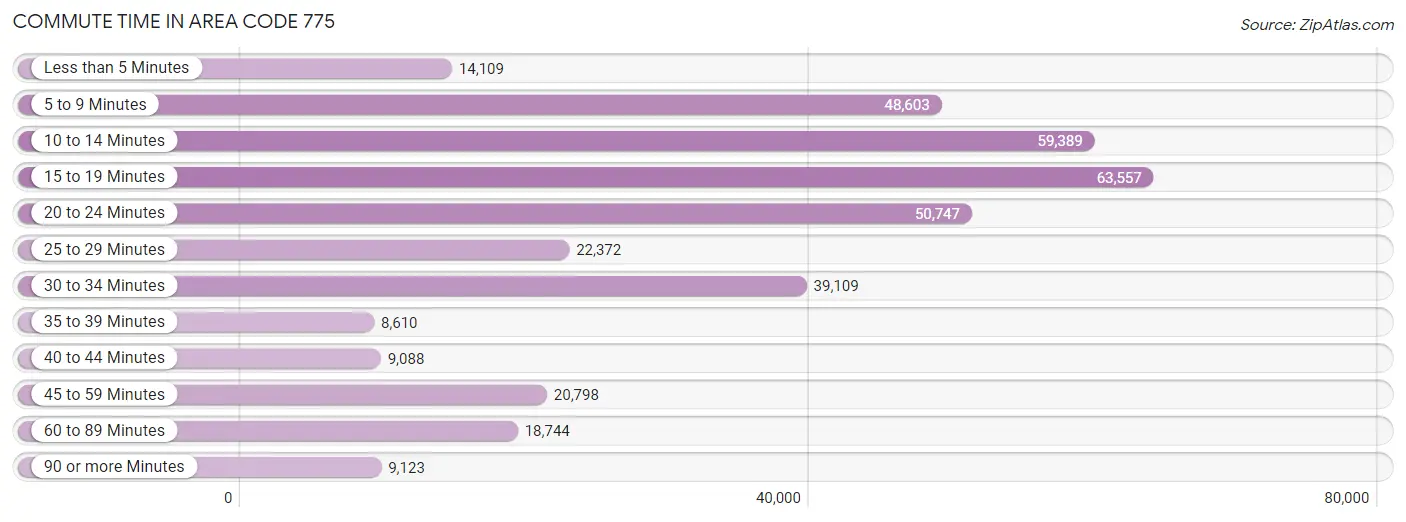
| Commute Time | # Commuters | % Commuters |
| Less than 5 Minutes | 14,109 | 3.9% |
| 5 to 9 Minutes | 48,603 | 13.3% |
| 10 to 14 Minutes | 59,389 | 16.3% |
| 15 to 19 Minutes | 63,557 | 17.4% |
| 20 to 24 Minutes | 50,747 | 13.9% |
| 25 to 29 Minutes | 22,372 | 6.1% |
| 30 to 34 Minutes | 39,109 | 10.7% |
| 35 to 39 Minutes | 8,610 | 2.4% |
| 40 to 44 Minutes | 9,088 | 2.5% |
| 45 to 59 Minutes | 20,798 | 5.7% |
| 60 to 89 Minutes | 18,744 | 5.1% |
| 90 or more Minutes | 9,123 | 2.5% |
Commute Time by Sex in Area Code 775
The most common commute times in Area Code 775 are 15 to 19 minutes (33,754 commuters, 16.7%) for males and 15 to 19 minutes (29,803 commuters, 18.4%) for females.
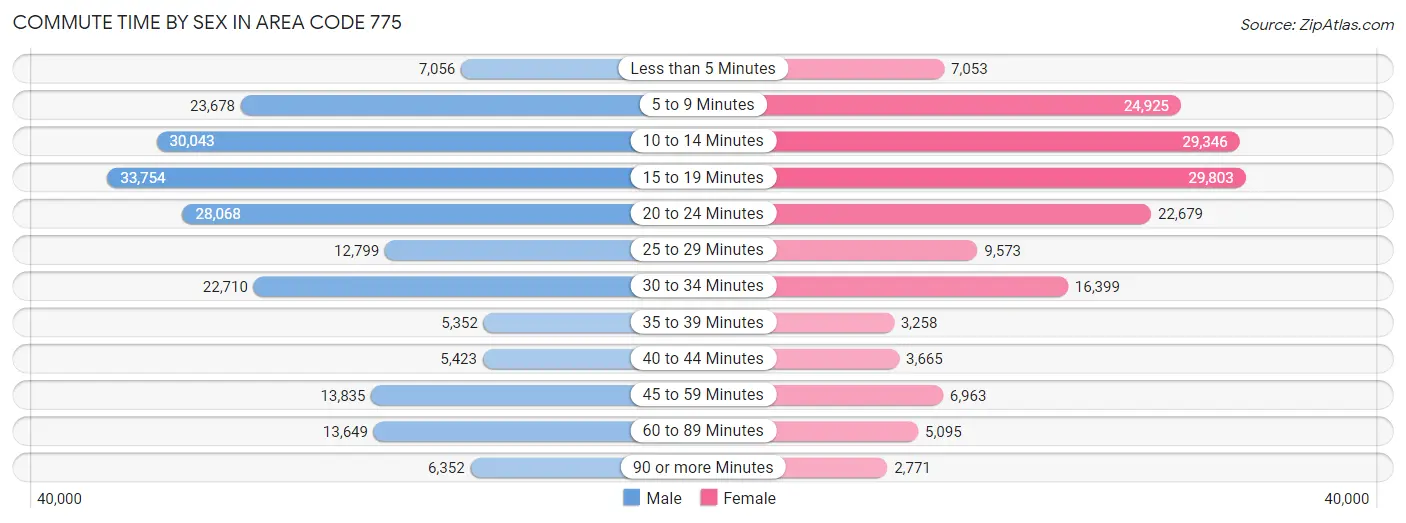
| Commute Time | Male | Female |
| Less than 5 Minutes | 7,056 (3.5%) | 7,053 (4.4%) |
| 5 to 9 Minutes | 23,678 (11.7%) | 24,925 (15.4%) |
| 10 to 14 Minutes | 30,043 (14.8%) | 29,346 (18.2%) |
| 15 to 19 Minutes | 33,754 (16.7%) | 29,803 (18.4%) |
| 20 to 24 Minutes | 28,068 (13.9%) | 22,679 (14.0%) |
| 25 to 29 Minutes | 12,799 (6.3%) | 9,573 (5.9%) |
| 30 to 34 Minutes | 22,710 (11.2%) | 16,399 (10.2%) |
| 35 to 39 Minutes | 5,352 (2.6%) | 3,258 (2.0%) |
| 40 to 44 Minutes | 5,423 (2.7%) | 3,665 (2.3%) |
| 45 to 59 Minutes | 13,835 (6.8%) | 6,963 (4.3%) |
| 60 to 89 Minutes | 13,649 (6.7%) | 5,095 (3.2%) |
| 90 or more Minutes | 6,352 (3.1%) | 2,771 (1.7%) |
Time of Departure to Work by Sex in Area Code 775
The most frequent times of departure to work in Area Code 775 are 12:00 AM to 4:59 AM (23,278, 11.5%) for males and 7:30 AM to 7:59 AM (23,167, 14.3%) for females.
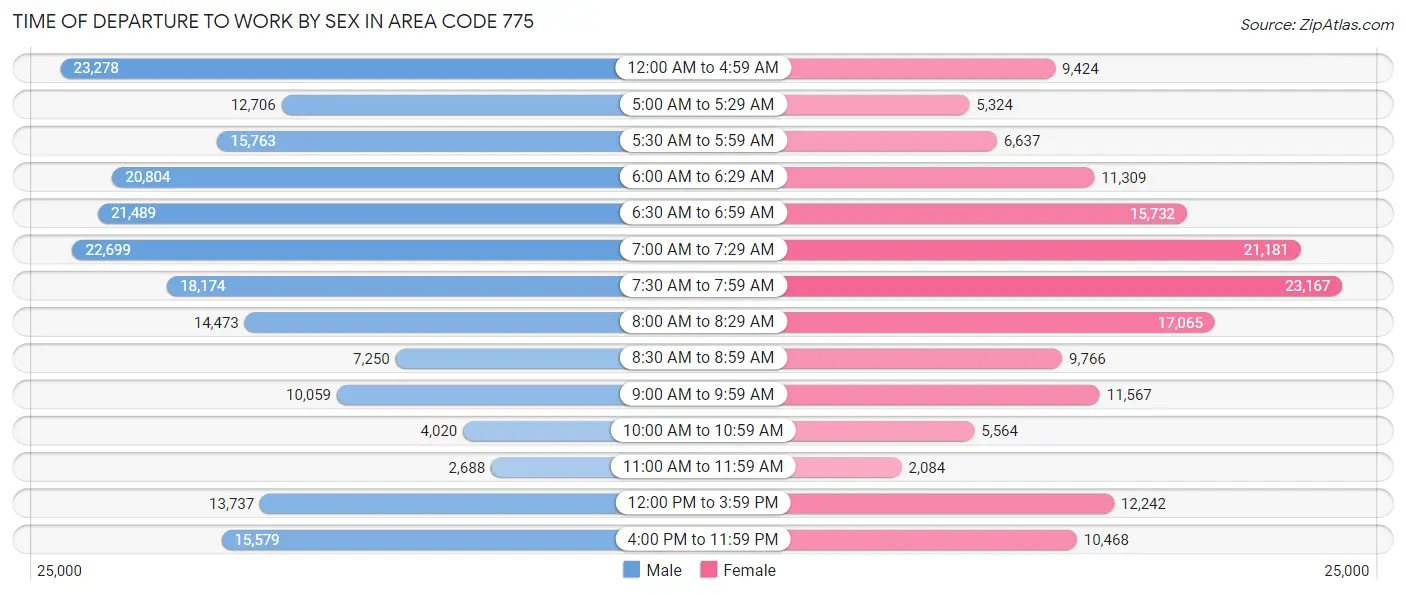
| Time of Departure | Male | Female |
| 12:00 AM to 4:59 AM | 23,278 (11.5%) | 9,424 (5.8%) |
| 5:00 AM to 5:29 AM | 12,706 (6.3%) | 5,324 (3.3%) |
| 5:30 AM to 5:59 AM | 15,763 (7.8%) | 6,637 (4.1%) |
| 6:00 AM to 6:29 AM | 20,804 (10.3%) | 11,309 (7.0%) |
| 6:30 AM to 6:59 AM | 21,489 (10.6%) | 15,732 (9.7%) |
| 7:00 AM to 7:29 AM | 22,699 (11.2%) | 21,181 (13.1%) |
| 7:30 AM to 7:59 AM | 18,174 (9.0%) | 23,167 (14.3%) |
| 8:00 AM to 8:29 AM | 14,473 (7.1%) | 17,065 (10.6%) |
| 8:30 AM to 8:59 AM | 7,250 (3.6%) | 9,766 (6.0%) |
| 9:00 AM to 9:59 AM | 10,059 (5.0%) | 11,567 (7.2%) |
| 10:00 AM to 10:59 AM | 4,020 (2.0%) | 5,564 (3.4%) |
| 11:00 AM to 11:59 AM | 2,688 (1.3%) | 2,084 (1.3%) |
| 12:00 PM to 3:59 PM | 13,737 (6.8%) | 12,242 (7.6%) |
| 4:00 PM to 11:59 PM | 15,579 (7.7%) | 10,468 (6.5%) |
| Total | 202,719 (100.0%) | 161,530 (100.0%) |
Housing Occupancy in Area Code 775
Occupancy by Ownership in Area Code 775
Of the total 338,566 dwellings in Area Code 775, owner-occupied units account for 218,170 (64.4%), while renter-occupied units make up 120,396 (35.6%).
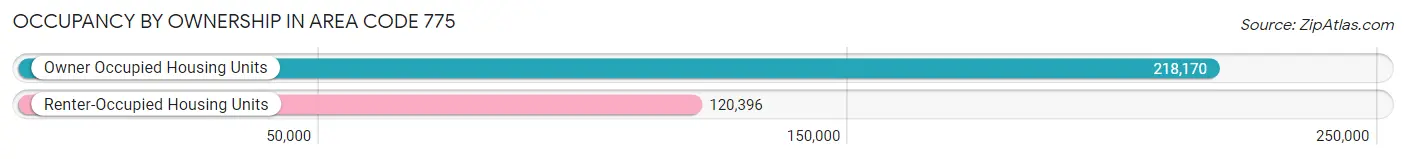
| Occupancy | # Housing Units | % Housing Units |
| Owner Occupied Housing Units | 218,170 | 64.4% |
| Renter-Occupied Housing Units | 120,396 | 35.6% |
| Total Occupied Housing Units | 338,566 | 100.0% |
Occupancy by Household Size in Area Code 775
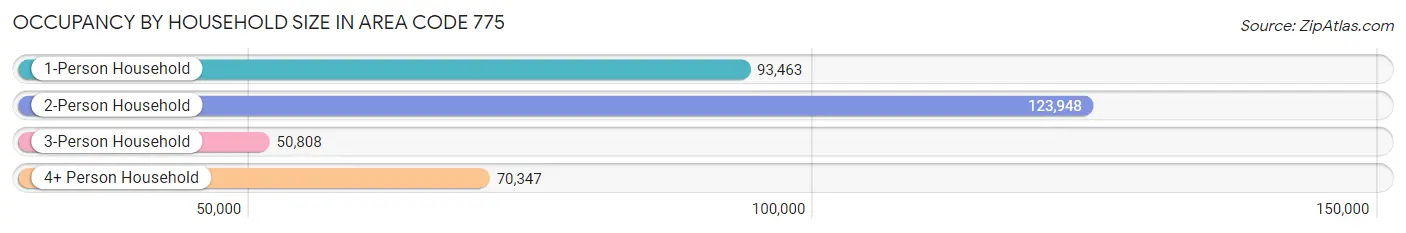
| Household Size | # Housing Units | % Housing Units |
| 1-Person Household | 93,463 | 27.6% |
| 2-Person Household | 123,948 | 36.6% |
| 3-Person Household | 50,808 | 15.0% |
| 4+ Person Household | 70,347 | 20.8% |
| Total Housing Units | 338,566 | 100.0% |
Occupancy by Ownership by Household Size in Area Code 775
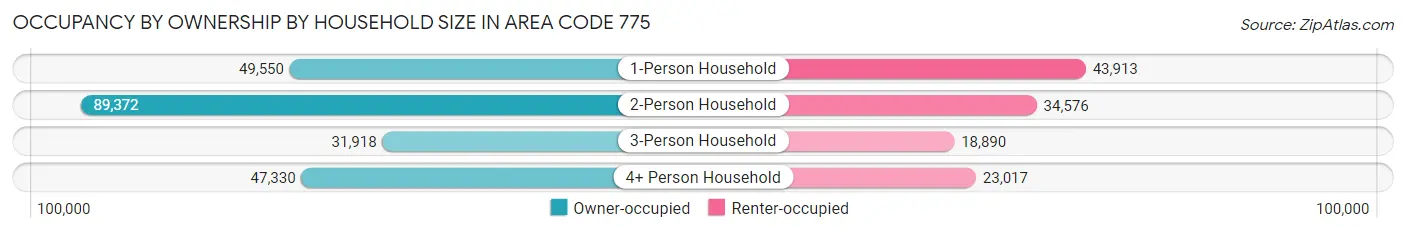
| Household Size | Owner-occupied | Renter-occupied |
| 1-Person Household | 49,550 (53.0%) | 43,913 (47.0%) |
| 2-Person Household | 89,372 (72.1%) | 34,576 (27.9%) |
| 3-Person Household | 31,918 (62.8%) | 18,890 (37.2%) |
| 4+ Person Household | 47,330 (67.3%) | 23,017 (32.7%) |
| Total Housing Units | 218,170 (64.4%) | 120,396 (35.6%) |
Occupancy by Educational Attainment in Area Code 775
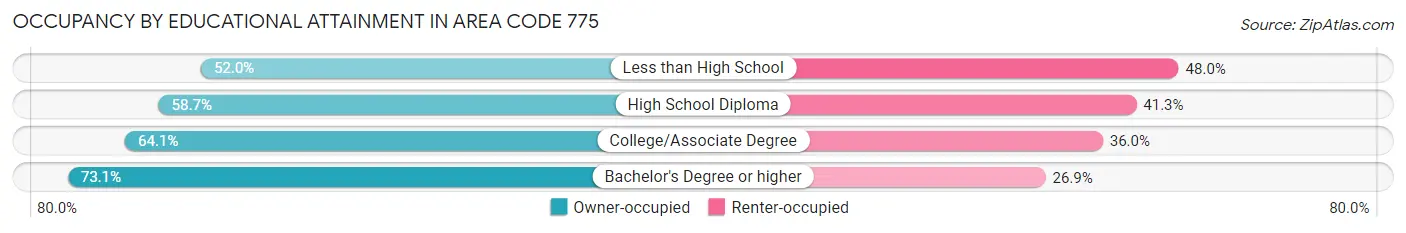
| Household Size | Owner-occupied | Renter-occupied |
| Less than High School | 15,625 (52.0%) | 14,412 (48.0%) |
| High School Diploma | 46,790 (58.7%) | 32,886 (41.3%) |
| College/Associate Degree | 81,916 (64.0%) | 45,977 (35.9%) |
| Bachelor's Degree or higher | 73,839 (73.1%) | 27,121 (26.9%) |
Occupancy by Age of Householder in Area Code 775
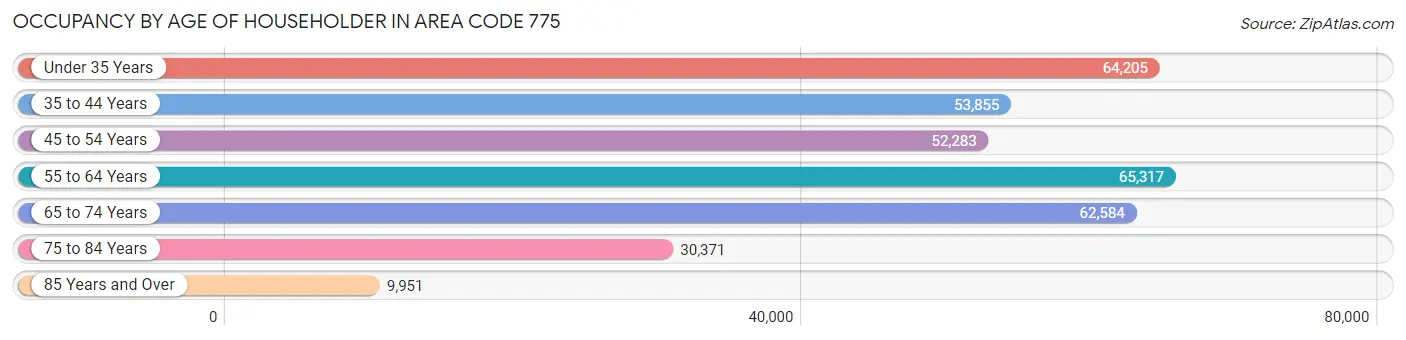
| Age Bracket | # Households | % Households |
| Under 35 Years | 64,205 | 19.0% |
| 35 to 44 Years | 53,855 | 15.9% |
| 45 to 54 Years | 52,283 | 15.4% |
| 55 to 64 Years | 65,317 | 19.3% |
| 65 to 74 Years | 62,584 | 18.5% |
| 75 to 84 Years | 30,371 | 9.0% |
| 85 Years and Over | 9,951 | 2.9% |
| Total | 338,566 | 100.0% |
Housing Finances in Area Code 775
Median Income by Occupancy in Area Code 775
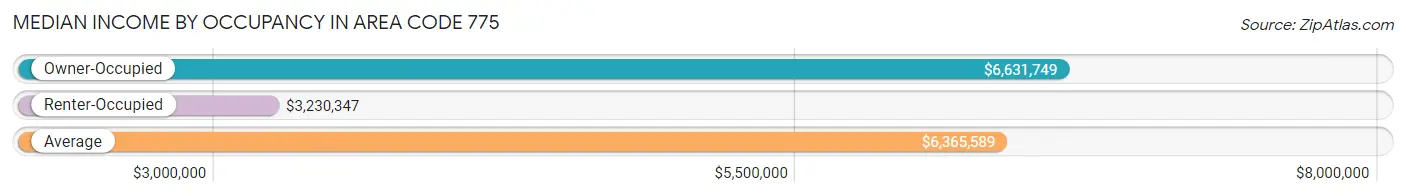
| Occupancy Type | # Households | Median Income |
| Owner-Occupied | 218,170 (64.4%) | $6,631,749 |
| Renter-Occupied | 120,396 (35.6%) | $3,230,347 |
| Average | 338,566 (100.0%) | $6,365,589 |
Occupancy by Householder Income Bracket in Area Code 775
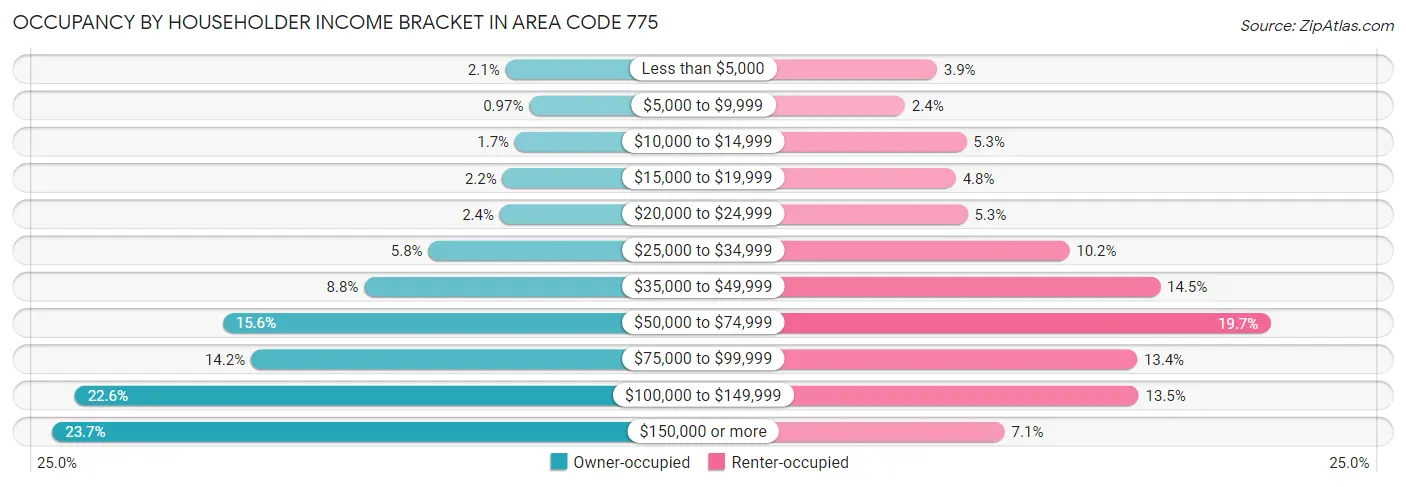
| Income Bracket | Owner-occupied | Renter-occupied |
| Less than $5,000 | 4,576 (2.1%) | 4,663 (3.9%) |
| $5,000 to $9,999 | 2,116 (1.0%) | 2,835 (2.4%) |
| $10,000 to $14,999 | 3,607 (1.7%) | 6,343 (5.3%) |
| $15,000 to $19,999 | 4,887 (2.2%) | 5,739 (4.8%) |
| $20,000 to $24,999 | 5,176 (2.4%) | 6,422 (5.3%) |
| $25,000 to $34,999 | 12,590 (5.8%) | 12,260 (10.2%) |
| $35,000 to $49,999 | 19,257 (8.8%) | 17,459 (14.5%) |
| $50,000 to $74,999 | 33,957 (15.6%) | 23,764 (19.7%) |
| $75,000 to $99,999 | 31,019 (14.2%) | 16,129 (13.4%) |
| $100,000 to $149,999 | 49,333 (22.6%) | 16,228 (13.5%) |
| $150,000 or more | 51,652 (23.7%) | 8,554 (7.1%) |
| Total | 218,170 (100.0%) | 120,396 (100.0%) |
Monthly Housing Cost Tiers in Area Code 775
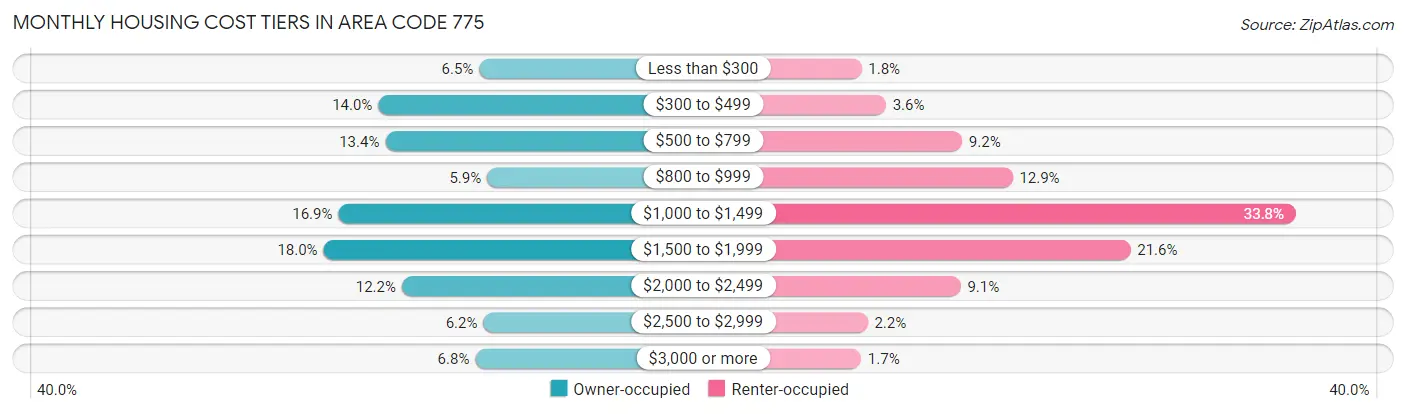
| Monthly Cost | Owner-occupied | Renter-occupied |
| Less than $300 | 14,218 (6.5%) | 2,116 (1.8%) |
| $300 to $499 | 30,453 (14.0%) | 4,287 (3.6%) |
| $500 to $799 | 29,330 (13.4%) | 11,041 (9.2%) |
| $800 to $999 | 12,952 (5.9%) | 15,517 (12.9%) |
| $1,000 to $1,499 | 36,873 (16.9%) | 40,645 (33.8%) |
| $1,500 to $1,999 | 39,247 (18.0%) | 25,964 (21.6%) |
| $2,000 to $2,499 | 26,662 (12.2%) | 10,902 (9.1%) |
| $2,500 to $2,999 | 13,579 (6.2%) | 2,658 (2.2%) |
| $3,000 or more | 14,856 (6.8%) | 2,078 (1.7%) |
| Total | 218,170 (100.0%) | 120,396 (100.0%) |
Physical Housing Characteristics in Area Code 775
Housing Structures in Area Code 775
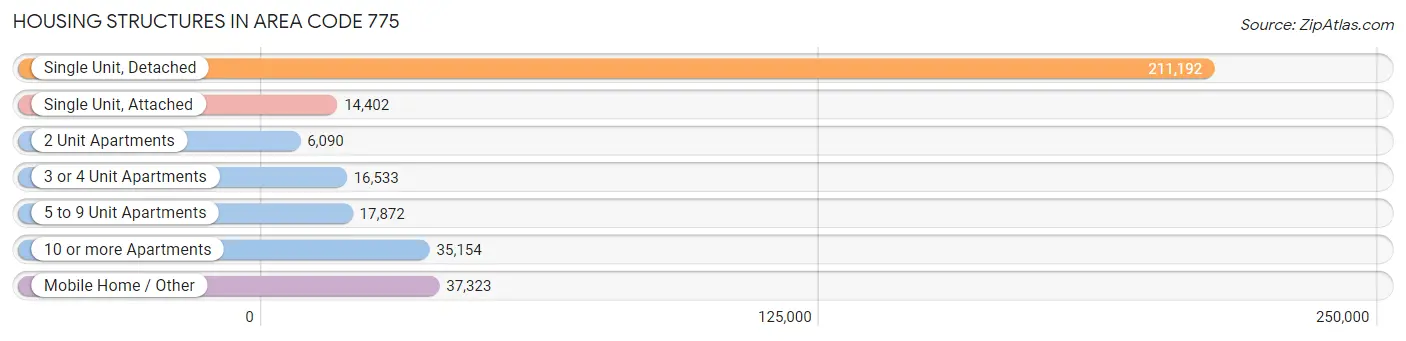
| Structure Type | # Housing Units | % Housing Units |
| Single Unit, Detached | 211,192 | 62.4% |
| Single Unit, Attached | 14,402 | 4.3% |
| 2 Unit Apartments | 6,090 | 1.8% |
| 3 or 4 Unit Apartments | 16,533 | 4.9% |
| 5 to 9 Unit Apartments | 17,872 | 5.3% |
| 10 or more Apartments | 35,154 | 10.4% |
| Mobile Home / Other | 37,323 | 11.0% |
| Total | 338,566 | 100.0% |
Housing Structures by Occupancy in Area Code 775
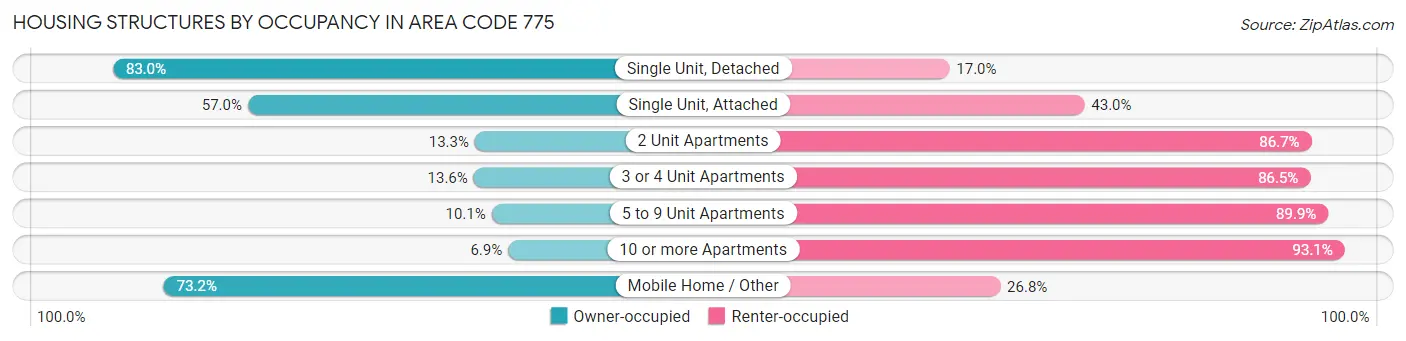
| Structure Type | Owner-occupied | Renter-occupied |
| Single Unit, Detached | 175,336 (83.0%) | 35,856 (17.0%) |
| Single Unit, Attached | 8,213 (57.0%) | 6,189 (43.0%) |
| 2 Unit Apartments | 811 (13.3%) | 5,279 (86.7%) |
| 3 or 4 Unit Apartments | 2,240 (13.6%) | 14,293 (86.5%) |
| 5 to 9 Unit Apartments | 1,804 (10.1%) | 16,068 (89.9%) |
| 10 or more Apartments | 2,432 (6.9%) | 32,722 (93.1%) |
| Mobile Home / Other | 27,334 (73.2%) | 9,989 (26.8%) |
| Total | 218,170 (64.4%) | 120,396 (35.6%) |
Housing Structures by Number of Rooms in Area Code 775
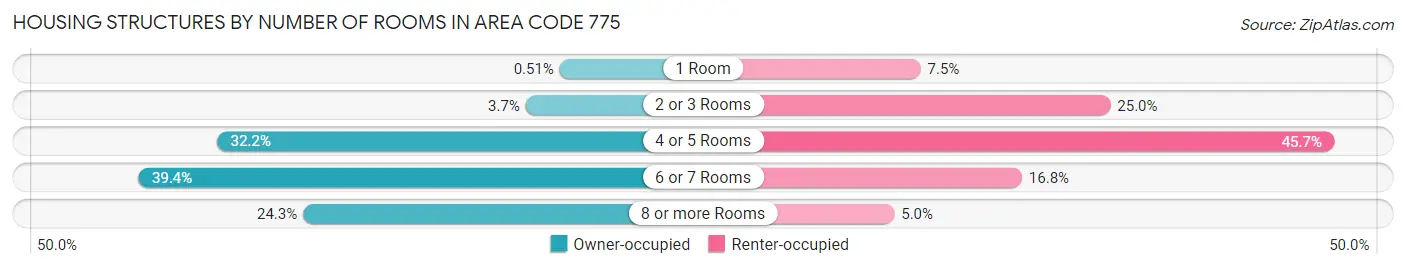
| Number of Rooms | Owner-occupied | Renter-occupied |
| 1 Room | 1,113 (0.5%) | 8,981 (7.5%) |
| 2 or 3 Rooms | 7,988 (3.7%) | 30,117 (25.0%) |
| 4 or 5 Rooms | 70,146 (32.2%) | 54,982 (45.7%) |
| 6 or 7 Rooms | 86,017 (39.4%) | 20,265 (16.8%) |
| 8 or more Rooms | 52,906 (24.2%) | 6,051 (5.0%) |
| Total | 218,170 (100.0%) | 120,396 (100.0%) |
Housing Structure by Heating Type in Area Code 775
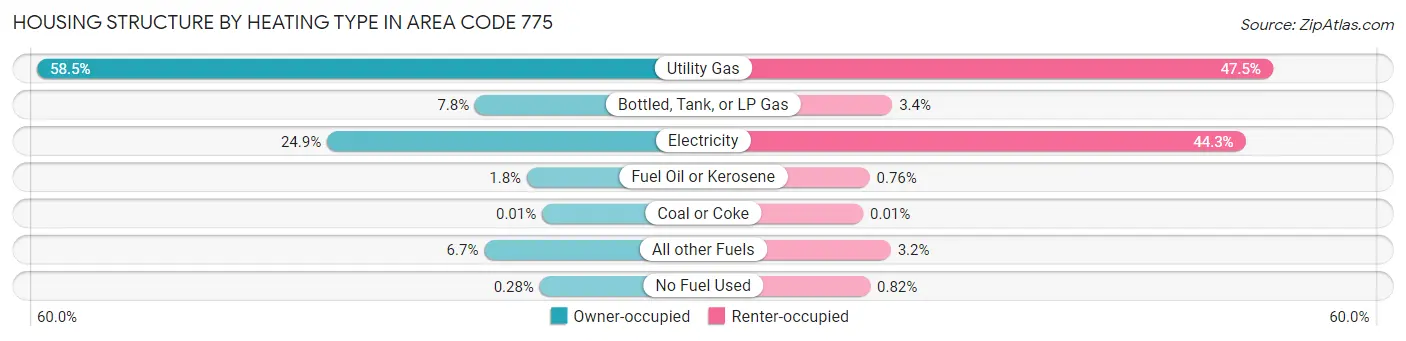
| Heating Type | Owner-occupied | Renter-occupied |
| Utility Gas | 127,712 (58.5%) | 57,178 (47.5%) |
| Bottled, Tank, or LP Gas | 16,950 (7.8%) | 4,066 (3.4%) |
| Electricity | 54,406 (24.9%) | 53,374 (44.3%) |
| Fuel Oil or Kerosene | 3,832 (1.8%) | 919 (0.8%) |
| Coal or Coke | 13 (0.0%) | 11 (0.0%) |
| All other Fuels | 14,637 (6.7%) | 3,861 (3.2%) |
| No Fuel Used | 620 (0.3%) | 987 (0.8%) |
| Total | 218,170 (100.0%) | 120,396 (100.0%) |
Household Vehicle Usage in Area Code 775
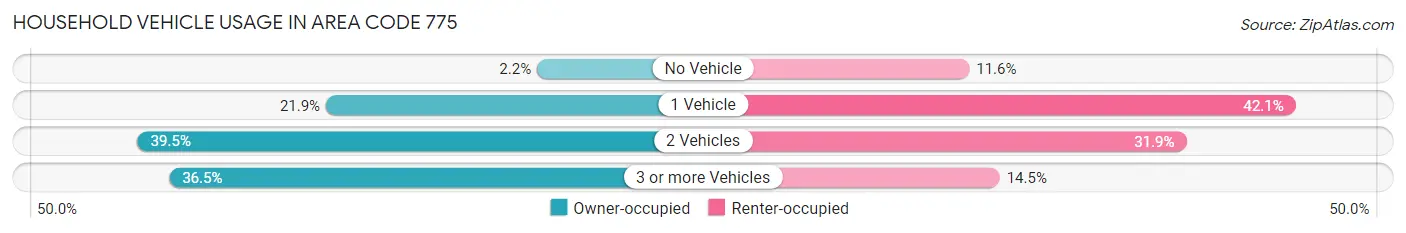
| Vehicles per Household | Owner-occupied | Renter-occupied |
| No Vehicle | 4,733 (2.2%) | 13,982 (11.6%) |
| 1 Vehicle | 47,713 (21.9%) | 50,641 (42.1%) |
| 2 Vehicles | 86,098 (39.5%) | 38,372 (31.9%) |
| 3 or more Vehicles | 79,626 (36.5%) | 17,401 (14.4%) |
| Total | 218,170 (100.0%) | 120,396 (100.0%) |
Real Estate & Mortgages in Area Code 775
Real Estate and Mortgage Overview in Area Code 775
| Characteristic | Without Mortgage | With Mortgage |
| Housing Units | 82,012 | 136,158 |
| Median Property Value | $26,637,102 | $25,230,300 |
| Median Household Income | $5,603,301 | $38,152 |
| Monthly Housing Costs | $38,298 | $14,392 |
| Real Estate Taxes | $147,779 | $3,957 |
Property Value by Mortgage Status in Area Code 775
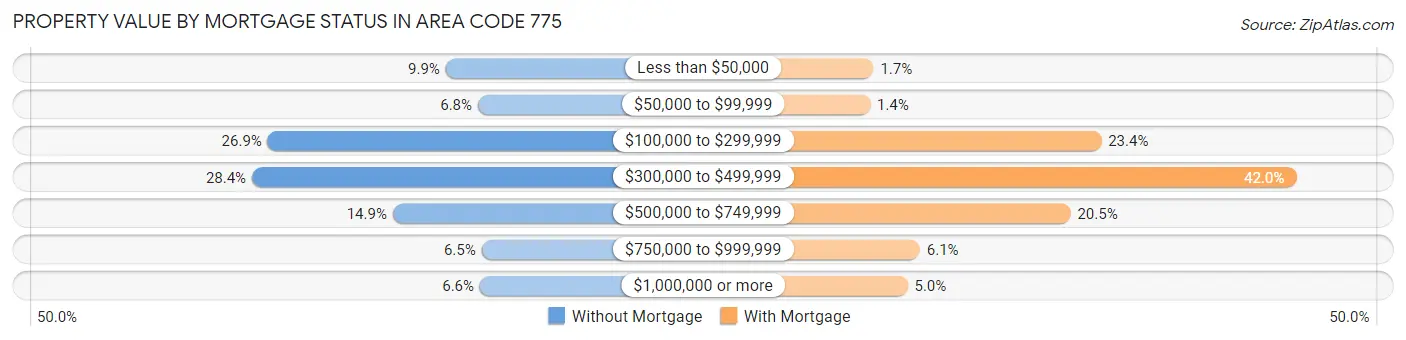
| Property Value | Without Mortgage | With Mortgage |
| Less than $50,000 | 8,123 (9.9%) | 2,322 (1.7%) |
| $50,000 to $99,999 | 5,602 (6.8%) | 1,875 (1.4%) |
| $100,000 to $299,999 | 22,024 (26.9%) | 31,865 (23.4%) |
| $300,000 to $499,999 | 23,253 (28.3%) | 57,150 (42.0%) |
| $500,000 to $749,999 | 12,252 (14.9%) | 27,876 (20.5%) |
| $750,000 to $999,999 | 5,315 (6.5%) | 8,331 (6.1%) |
| $1,000,000 or more | 5,443 (6.6%) | 6,739 (5.0%) |
| Total | 82,012 (100.0%) | 136,158 (100.0%) |
Household Income by Mortgage Status in Area Code 775
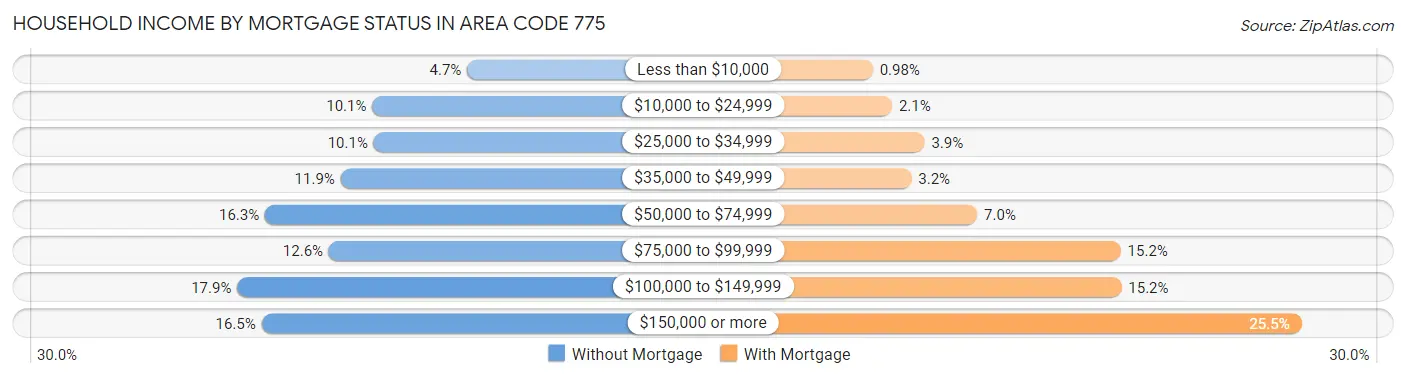
| Household Income | Without Mortgage | With Mortgage |
| Less than $10,000 | 3,860 (4.7%) | 1,334 (1.0%) |
| $10,000 to $24,999 | 8,311 (10.1%) | 2,832 (2.1%) |
| $25,000 to $34,999 | 8,241 (10.1%) | 5,359 (3.9%) |
| $35,000 to $49,999 | 9,789 (11.9%) | 4,349 (3.2%) |
| $50,000 to $74,999 | 13,333 (16.3%) | 9,468 (7.0%) |
| $75,000 to $99,999 | 10,338 (12.6%) | 20,624 (15.1%) |
| $100,000 to $149,999 | 14,640 (17.8%) | 20,681 (15.2%) |
| $150,000 or more | 13,500 (16.5%) | 34,693 (25.5%) |
| Total | 82,012 (100.0%) | 136,158 (100.0%) |
Property Value to Household Income Ratio in Area Code 775
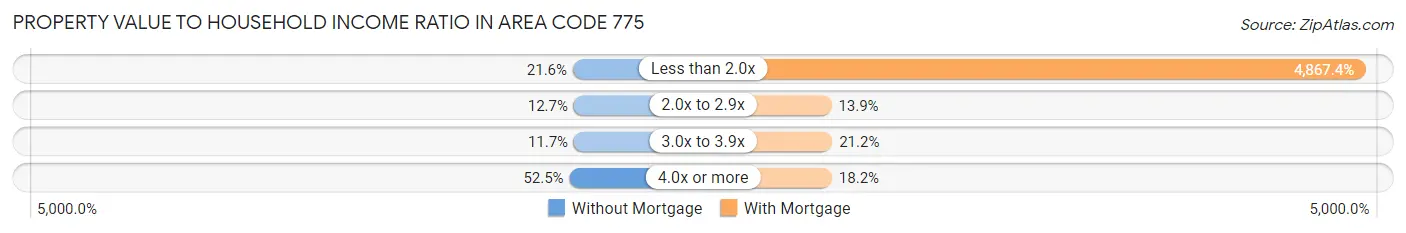
| Value-to-Income Ratio | Without Mortgage | With Mortgage |
| Less than 2.0x | 17,708 (21.6%) | 6,627,358 (4,867.4%) |
| 2.0x to 2.9x | 10,375 (12.7%) | 18,972 (13.9%) |
| 3.0x to 3.9x | 9,588 (11.7%) | 28,813 (21.2%) |
| 4.0x or more | 43,079 (52.5%) | 24,781 (18.2%) |
| Total | 82,012 (100.0%) | 136,158 (100.0%) |
Real Estate Taxes by Mortgage Status in Area Code 775
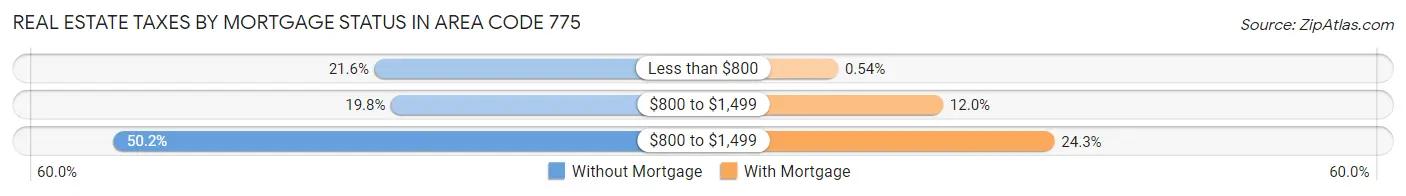
| Property Taxes | Without Mortgage | With Mortgage |
| Less than $800 | 17,736 (21.6%) | 738 (0.5%) |
| $800 to $1,499 | 16,250 (19.8%) | 16,389 (12.0%) |
| $800 to $1,499 | 41,177 (50.2%) | 33,035 (24.3%) |
| Total | 82,012 (100.0%) | 136,158 (100.0%) |
Health & Disability in Area Code 775
Health Insurance Coverage by Age in Area Code 775
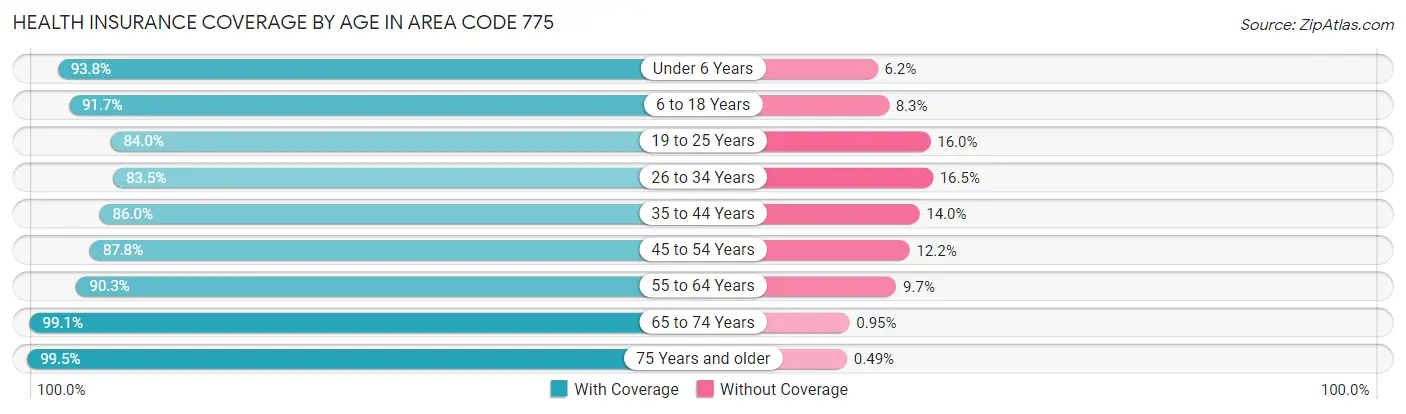
| Age Bracket | With Coverage | Without Coverage |
| Under 6 Years | 52,125 (93.8%) | 3,433 (6.2%) |
| 6 to 18 Years | 120,549 (91.7%) | 10,877 (8.3%) |
| 19 to 25 Years | 59,327 (84.0%) | 11,322 (16.0%) |
| 26 to 34 Years | 84,835 (83.5%) | 16,754 (16.5%) |
| 35 to 44 Years | 88,017 (86.0%) | 14,305 (14.0%) |
| 45 to 54 Years | 87,510 (87.8%) | 12,112 (12.2%) |
| 55 to 64 Years | 104,827 (90.3%) | 11,228 (9.7%) |
| 65 to 74 Years | 101,557 (99.1%) | 971 (0.9%) |
| 75 Years and older | 62,769 (99.5%) | 312 (0.5%) |
| Total | 761,516 (90.3%) | 81,314 (9.7%) |
Health Insurance Coverage by Citizenship Status in Area Code 775
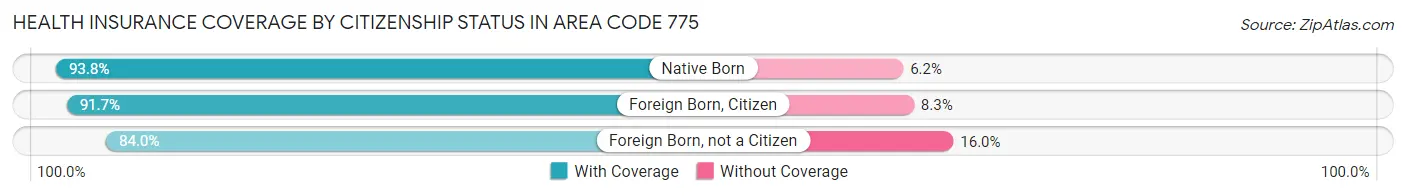
| Citizenship Status | With Coverage | Without Coverage |
| Native Born | 52,125 (93.8%) | 3,433 (6.2%) |
| Foreign Born, Citizen | 120,549 (91.7%) | 10,877 (8.3%) |
| Foreign Born, not a Citizen | 59,327 (84.0%) | 11,322 (16.0%) |
Health Insurance Coverage by Household Income in Area Code 775
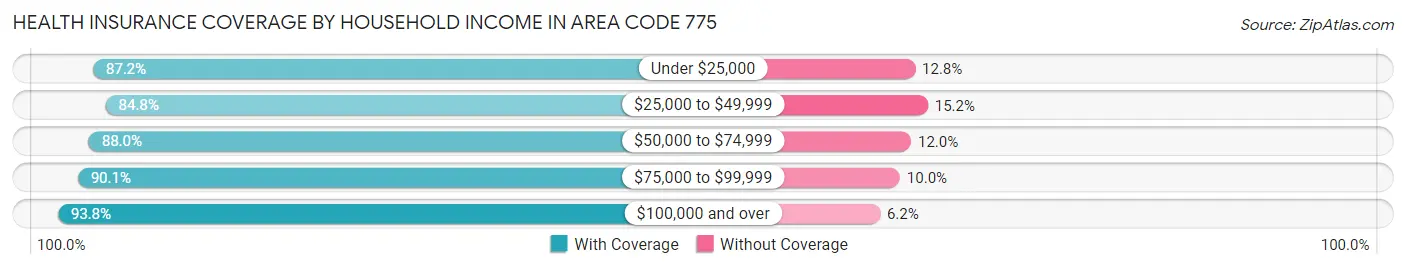
| Household Income | With Coverage | Without Coverage |
| Under $25,000 | 66,685 (87.2%) | 9,788 (12.8%) |
| $25,000 to $49,999 | 107,099 (84.8%) | 19,169 (15.2%) |
| $50,000 to $74,999 | 117,604 (88.0%) | 16,104 (12.0%) |
| $75,000 to $99,999 | 112,779 (90.0%) | 12,461 (10.0%) |
| $100,000 and over | 352,552 (93.8%) | 23,388 (6.2%) |
Public vs Private Health Insurance Coverage by Age in Area Code 775
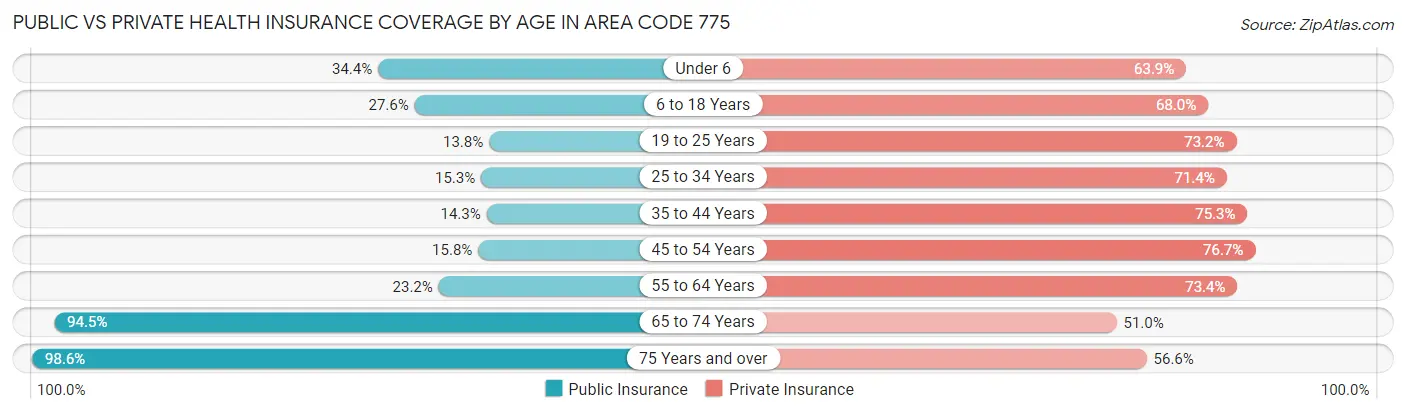
| Age Bracket | Public Insurance | Private Insurance |
| Under 6 | 19,106 (34.4%) | 35,503 (63.9%) |
| 6 to 18 Years | 36,296 (27.6%) | 89,343 (68.0%) |
| 19 to 25 Years | 9,743 (13.8%) | 51,726 (73.2%) |
| 25 to 34 Years | 15,516 (15.3%) | 72,570 (71.4%) |
| 35 to 44 Years | 14,586 (14.2%) | 77,020 (75.3%) |
| 45 to 54 Years | 15,755 (15.8%) | 76,434 (76.7%) |
| 55 to 64 Years | 26,866 (23.2%) | 85,184 (73.4%) |
| 65 to 74 Years | 96,924 (94.5%) | 52,285 (51.0%) |
| 75 Years and over | 62,221 (98.6%) | 35,692 (56.6%) |
| Total | 297,013 (35.2%) | 575,757 (68.3%) |
Disability Status by Sex by Age in Area Code 775
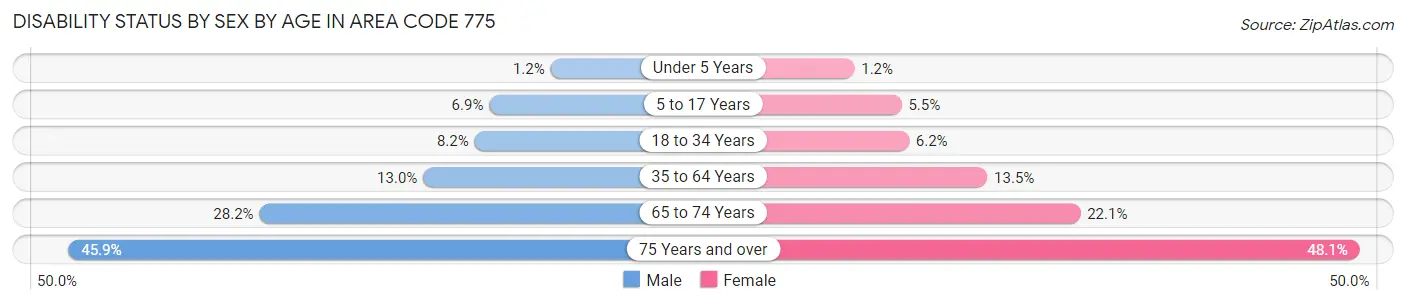
| Age Bracket | Male | Female |
| Under 5 Years | 276 (1.2%) | 259 (1.2%) |
| 5 to 17 Years | 4,649 (6.9%) | 3,548 (5.5%) |
| 18 to 34 Years | 7,779 (8.2%) | 5,459 (6.2%) |
| 35 to 64 Years | 21,133 (13.0%) | 20,991 (13.5%) |
| 65 to 74 Years | 14,236 (28.2%) | 11,519 (22.1%) |
| 75 Years and over | 13,828 (45.9%) | 15,851 (48.1%) |
Disability Class by Sex by Age in Area Code 775
Disability Class: Hearing Difficulty
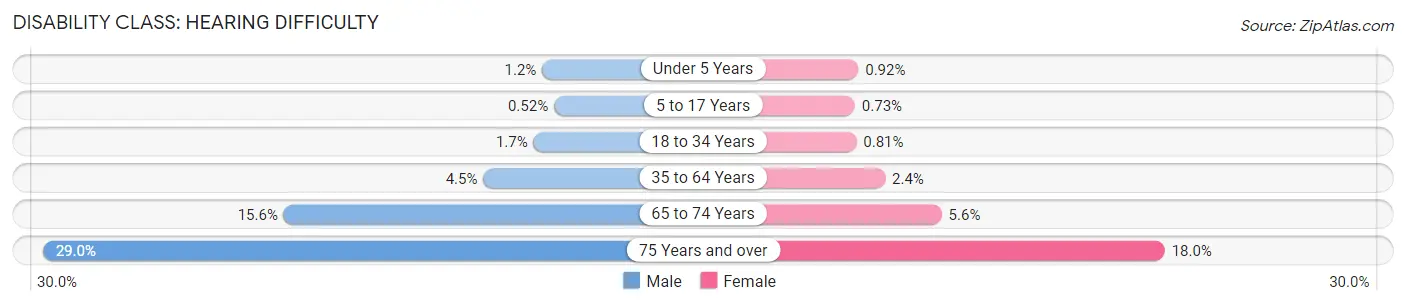
| Age Bracket | Male | Female |
| Under 5 Years | 273 (1.2%) | 206 (0.9%) |
| 5 to 17 Years | 351 (0.5%) | 469 (0.7%) |
| 18 to 34 Years | 1,571 (1.7%) | 708 (0.8%) |
| 35 to 64 Years | 7,249 (4.5%) | 3,744 (2.4%) |
| 65 to 74 Years | 7,857 (15.6%) | 2,896 (5.6%) |
| 75 Years and over | 8,727 (29.0%) | 5,930 (18.0%) |
Disability Class: Vision Difficulty
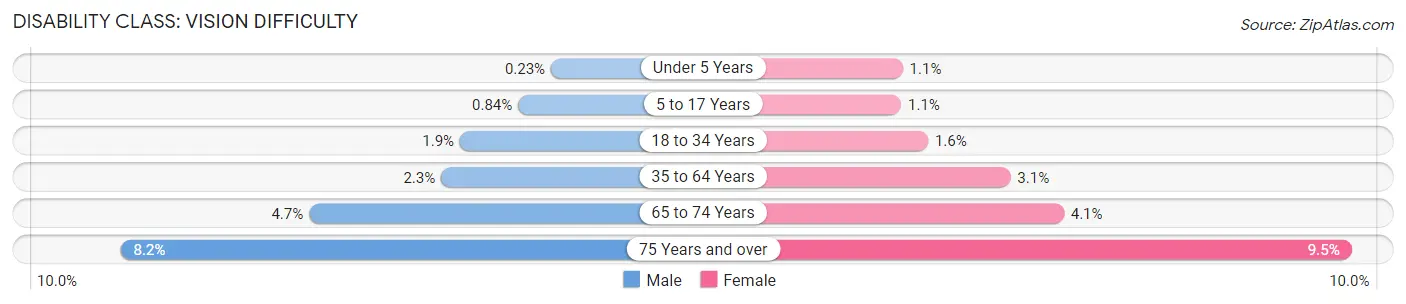
| Age Bracket | Male | Female |
| Under 5 Years | 53 (0.2%) | 253 (1.1%) |
| 5 to 17 Years | 566 (0.8%) | 702 (1.1%) |
| 18 to 34 Years | 1,813 (1.9%) | 1,408 (1.6%) |
| 35 to 64 Years | 3,682 (2.3%) | 4,873 (3.1%) |
| 65 to 74 Years | 2,383 (4.7%) | 2,146 (4.1%) |
| 75 Years and over | 2,475 (8.2%) | 3,120 (9.5%) |
Disability Class: Cognitive Difficulty
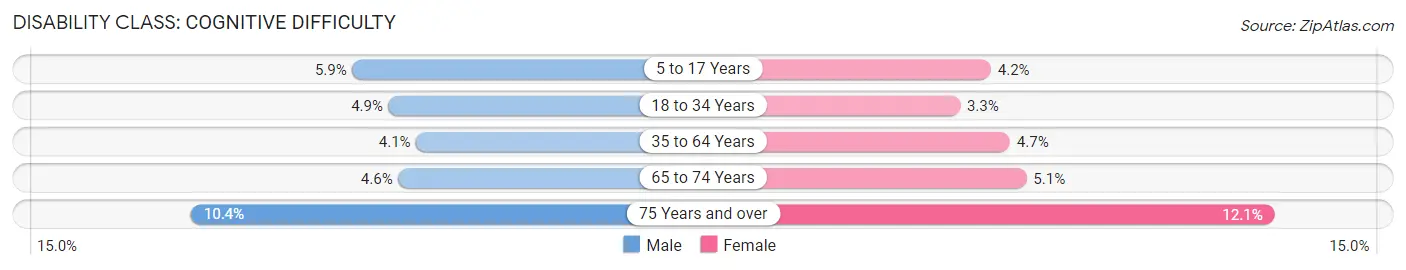
| Age Bracket | Male | Female |
| 5 to 17 Years | 3,963 (5.9%) | 2,657 (4.2%) |
| 18 to 34 Years | 4,585 (4.9%) | 2,888 (3.3%) |
| 35 to 64 Years | 6,651 (4.1%) | 7,283 (4.7%) |
| 65 to 74 Years | 2,315 (4.6%) | 2,677 (5.1%) |
| 75 Years and over | 3,121 (10.4%) | 3,973 (12.0%) |
Disability Class: Ambulatory Difficulty
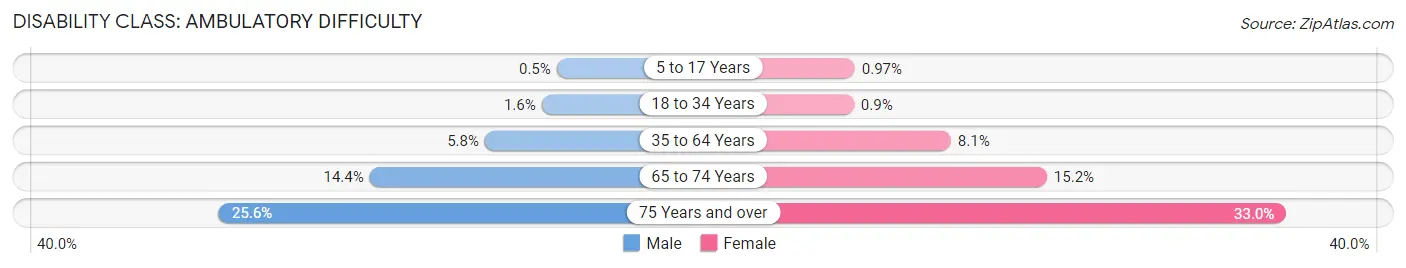
| Age Bracket | Male | Female |
| 5 to 17 Years | 341 (0.5%) | 620 (1.0%) |
| 18 to 34 Years | 1,524 (1.6%) | 787 (0.9%) |
| 35 to 64 Years | 9,471 (5.8%) | 12,608 (8.1%) |
| 65 to 74 Years | 7,264 (14.4%) | 7,928 (15.2%) |
| 75 Years and over | 7,696 (25.6%) | 10,880 (33.0%) |
Disability Class: Self-Care Difficulty
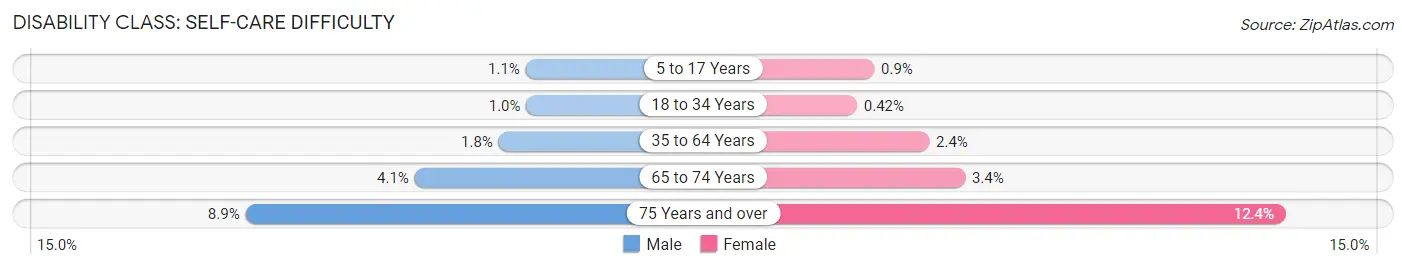
| Age Bracket | Male | Female |
| 5 to 17 Years | 707 (1.1%) | 575 (0.9%) |
| 18 to 34 Years | 975 (1.0%) | 367 (0.4%) |
| 35 to 64 Years | 2,916 (1.8%) | 3,780 (2.4%) |
| 65 to 74 Years | 2,088 (4.1%) | 1,788 (3.4%) |
| 75 Years and over | 2,663 (8.8%) | 4,075 (12.4%) |
Technology Access in Area Code 775
Computing Device Access in Area Code 775
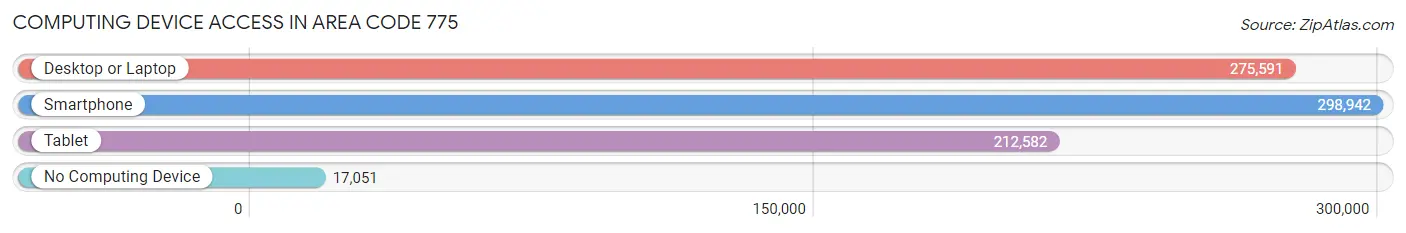
| Device Type | # Households | % Households |
| Desktop or Laptop | 275,591 | 81.4% |
| Smartphone | 298,942 | 88.3% |
| Tablet | 212,582 | 62.8% |
| No Computing Device | 17,051 | 5.0% |
| Total | 338,566 | 100.0% |
Internet Access in Area Code 775
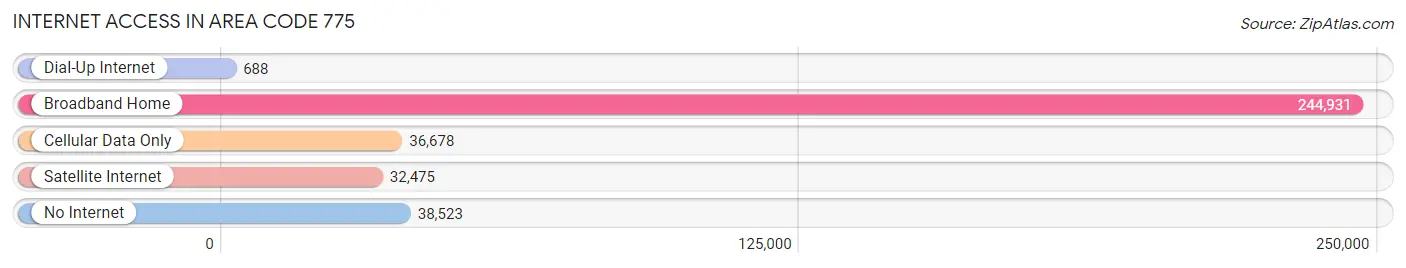
| Internet Type | # Households | % Households |
| Dial-Up Internet | 688 | 0.2% |
| Broadband Home | 244,931 | 72.3% |
| Cellular Data Only | 36,678 | 10.8% |
| Satellite Internet | 32,475 | 9.6% |
| No Internet | 38,523 | 11.4% |
| Total | 338,566 | 100.0% |
Area Code 775 Summary
Geography
Area code 775 is located in the state of Nevada. It covers the entire state, including the cities of Reno, Las Vegas, and Carson City. It also covers the counties of Washoe, Douglas, Elko, and Humboldt.
Social
Area code 775 is home to a diverse population of people from all walks of life. The area is known for its vibrant nightlife, entertainment, and outdoor activities. It is also home to a number of universities and colleges, making it a great place for students to pursue their education.
Economics
Area code 775 is a major economic hub in Nevada. It is home to a number of large businesses, including casinos, hotels, and other tourist attractions. The area also has a thriving tech industry, with many startups and established companies based in the area.
Demographics
Area code 775 is home to a diverse population of people from all backgrounds. The population is largely made up of people of Hispanic or Latino origin, followed by White, African American, and Asian. The median household income in the area is slightly higher than the national average.
Common Questions
What is Per Capita Income in Area Code 775?
Per Capita income in Area Code 775 is $41,718.
What is the Median Family Income in Area Code 775?
Median Family Income in Area Code 775 is $92,867.
What is the Median Household income in Area Code 775?
Median Household Income in Area Code 775 is $79,570.
What is Income or Wage Gap in Area Code 775?
Income or Wage Gap in Area Code 775 is 31.2%.
Women in Area Code 775 earn 68.8 cents for every dollar earned by a man.
What is Family Income Deficit in Area Code 775?
Family Income Deficit in Area Code 775 is $9,884.
Families that are below poverty line in Area Code 775 earn $9,884 less on average than the poverty threshold level.
What is Inequality or Gini Index in Area Code 775?
Inequality or Gini Index in Area Code 775 is 36.92.
What is the Total Population of Area Code 775?
Total Population of Area Code 775 is 855,628.
What is the Total Male Population of Area Code 775?
Total Male Population of Area Code 775 is 438,785.
What is the Total Female Population of Area Code 775?
Total Female Population of Area Code 775 is 416,843.
What is the Ratio of Males per 100 Females in Area Code 775?
There are 105.26 Males per 100 Females in Area Code 775.
What is the Ratio of Females per 100 Males in Area Code 775?
There are 95.00 Females per 100 Males in Area Code 775.
What is the Median Population Age in Area Code 775?
Median Population Age in Area Code 775 is 47.6 Years.
What is the Average Family Size in Area Code 775
Average Family Size in Area Code 775 is 2.9 People.
What is the Average Household Size in Area Code 775
Average Household Size in Area Code 775 is 2.4 People.
How Large is the Labor Force in Area Code 775?
There are 375,828 People in the Labor Forcein in Area Code 775.
What is the Percentage of People in the Labor Force in Area Code 775?
53.8% of People are in the Labor Force in Area Code 775.
What is the Unemployment Rate in Area Code 775?
Unemployment Rate in Area Code 775 is 7.8%.