Area Code 806 Map & Demographics
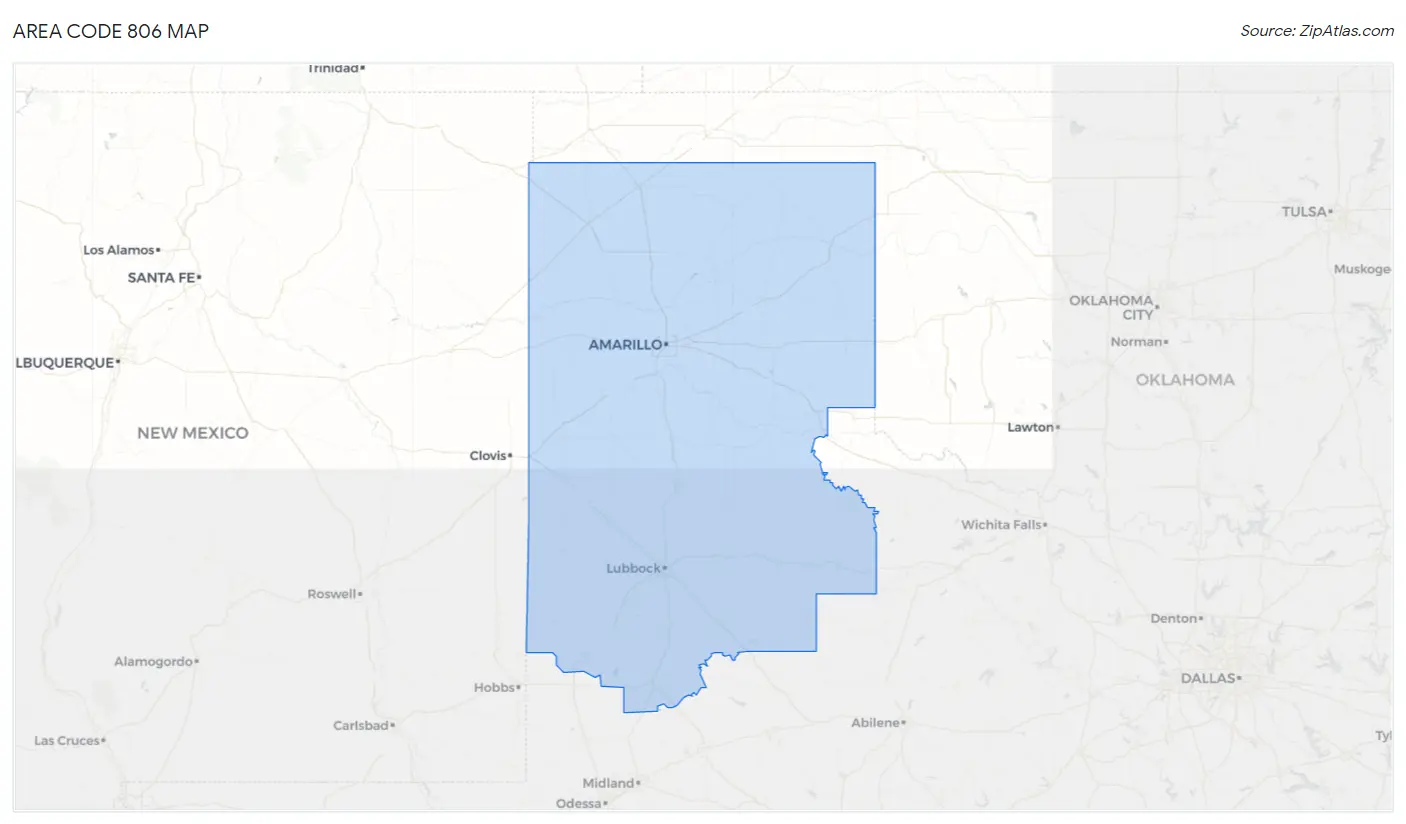
Area Code 806 Map
Area Code 806 Overview
$31,163
PER CAPITA INCOME
$75,928
AVG FAMILY INCOME
$62,614
AVG HOUSEHOLD INCOME
35.3%
WAGE / INCOME GAP [ % ]
64.7¢/ $1
WAGE / INCOME GAP [ $ ]
$11,470
FAMILY INCOME DEFICIT
66.55
INEQUALITY / GINI INDEX
880,517
TOTAL POPULATION
445,291
MALE POPULATION
435,226
FEMALE POPULATION
102.31
MALES / 100 FEMALES
97.74
FEMALES / 100 MALES
38.9
MEDIAN AGE
3.3
AVG FAMILY SIZE
2.8
AVG HOUSEHOLD SIZE
407,482
LABOR FORCE [ PEOPLE ]
59.7%
PERCENT IN LABOR FORCE
4.7%
UNEMPLOYMENT RATE
Income in Area Code 806
Income Overview in Area Code 806
Per Capita Income in Area Code 806 is $31,163, while median incomes of families and households are $75,928 and $62,614 respectively.
| Characteristic | Number | Measure |
| Per Capita Income | 880,517 | $31,163 |
| Median Family Income | 211,872 | $75,928 |
| Mean Family Income | 211,872 | $14,091,219 |
| Median Household Income | 327,024 | $62,614 |
| Mean Household Income | 327,024 | $12,350,161 |
| Income Deficit | 211,872 | $11,470 |
| Wage / Income Gap (%) | 880,517 | 35.29% |
| Wage / Income Gap ($) | 880,517 | 64.71¢ per $1 |
| Gini / Inequality Index | 880,517 | 66.55 |
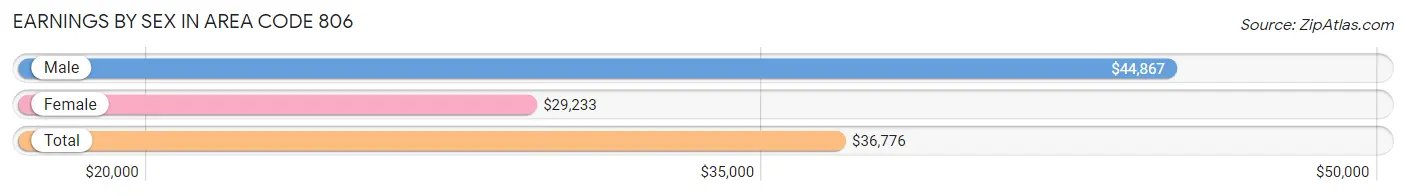
Earnings by Sex in Area Code 806
Average Earnings in Area Code 806 are $36,776, $44,867 for men and $29,233 for women, a difference of 34.8%.
| Sex | Number | Average Earnings |
| Male | 244,943 (54.0%) | $44,867 |
| Female | 208,331 (46.0%) | $29,233 |
| Total | 453,274 (100.0%) | $36,776 |
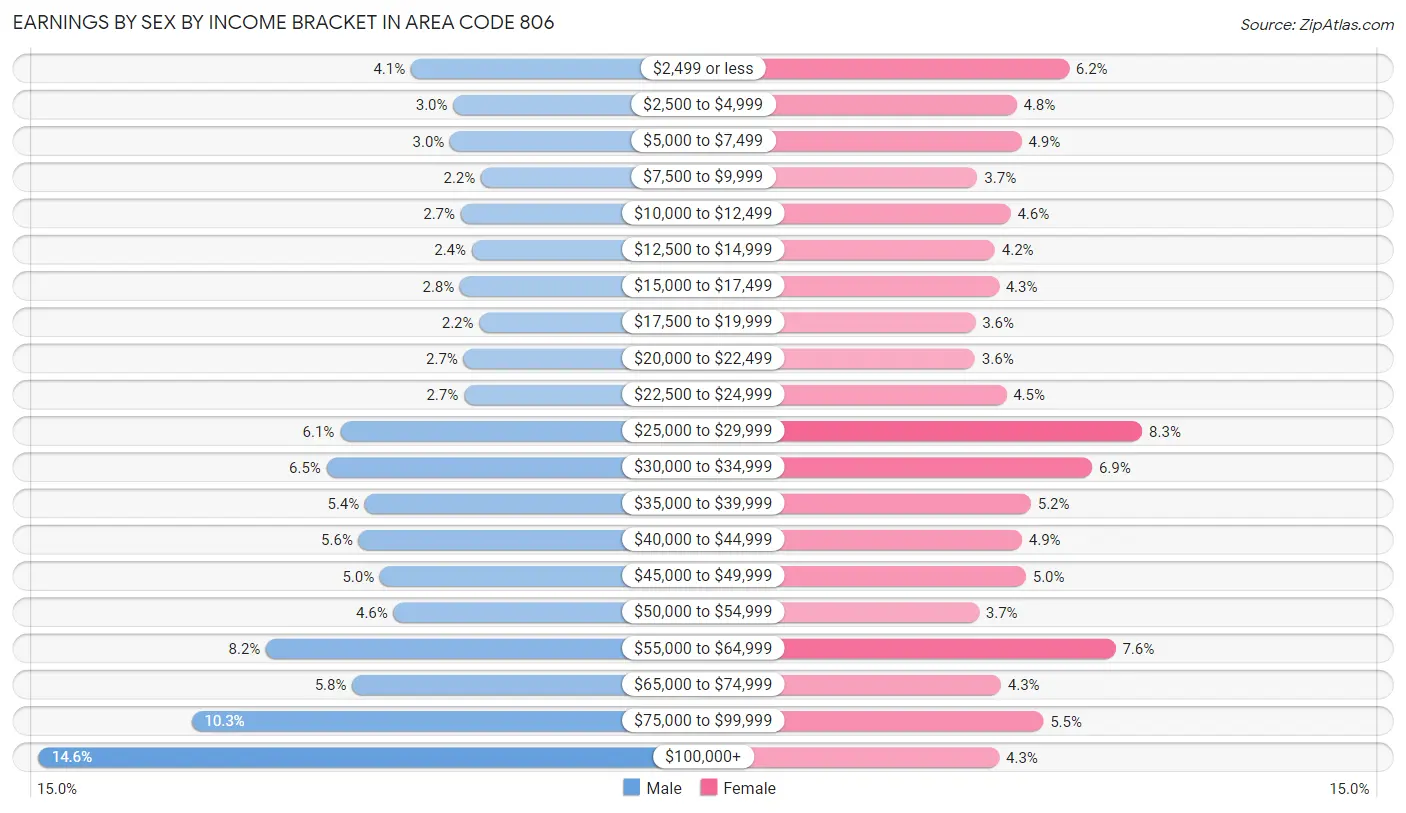
Earnings by Sex by Income Bracket in Area Code 806
The most common earnings brackets in Area Code 806 are $100,000+ for men (35,766 | 14.6%) and $25,000 to $29,999 for women (17,297 | 8.3%).
| Income | Male | Female |
| $2,499 or less | 10,143 (4.1%) | 12,995 (6.2%) |
| $2,500 to $4,999 | 7,234 (2.9%) | 9,940 (4.8%) |
| $5,000 to $7,499 | 7,456 (3.0%) | 10,234 (4.9%) |
| $7,500 to $9,999 | 5,314 (2.2%) | 7,649 (3.7%) |
| $10,000 to $12,499 | 6,700 (2.7%) | 9,576 (4.6%) |
| $12,500 to $14,999 | 5,957 (2.4%) | 8,667 (4.2%) |
| $15,000 to $17,499 | 6,751 (2.8%) | 8,893 (4.3%) |
| $17,500 to $19,999 | 5,430 (2.2%) | 7,520 (3.6%) |
| $20,000 to $22,499 | 6,516 (2.7%) | 7,497 (3.6%) |
| $22,500 to $24,999 | 6,496 (2.6%) | 9,329 (4.5%) |
| $25,000 to $29,999 | 15,011 (6.1%) | 17,297 (8.3%) |
| $30,000 to $34,999 | 15,957 (6.5%) | 14,346 (6.9%) |
| $35,000 to $39,999 | 13,290 (5.4%) | 10,772 (5.2%) |
| $40,000 to $44,999 | 13,751 (5.6%) | 10,241 (4.9%) |
| $45,000 to $49,999 | 12,280 (5.0%) | 10,475 (5.0%) |
| $50,000 to $54,999 | 11,349 (4.6%) | 7,727 (3.7%) |
| $55,000 to $64,999 | 20,102 (8.2%) | 15,733 (7.5%) |
| $65,000 to $74,999 | 14,185 (5.8%) | 9,015 (4.3%) |
| $75,000 to $99,999 | 25,255 (10.3%) | 11,509 (5.5%) |
| $100,000+ | 35,766 (14.6%) | 8,916 (4.3%) |
| Total | 244,943 (100.0%) | 208,331 (100.0%) |
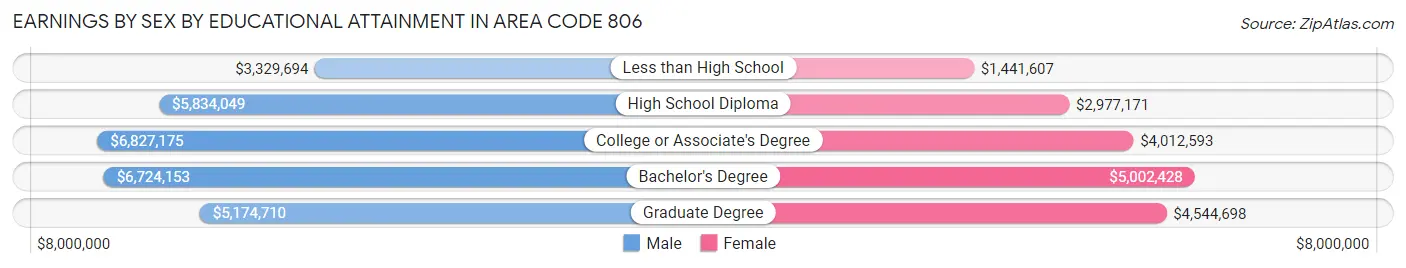
Earnings by Sex by Educational Attainment in Area Code 806
Average earnings in Area Code 806 are $7,082,121 for men and $4,390,437 for women, a difference of 38.0%. Men with an educational attainment of college or associate's degree enjoy the highest average annual earnings of $6,827,175, while those with less than high school education earn the least with $3,329,694. Women with an educational attainment of bachelor's degree earn the most with the average annual earnings of $5,002,428, while those with less than high school education have the smallest earnings of $1,441,607.
| Educational Attainment | Male Income | Female Income |
| Less than High School | $3,329,694 | $1,441,607 |
| High School Diploma | $5,834,049 | $2,977,171 |
| College or Associate's Degree | $6,827,175 | $4,012,593 |
| Bachelor's Degree | $6,724,153 | $5,002,428 |
| Graduate Degree | $5,174,710 | $4,544,698 |
| Total | $7,082,121 | $4,390,437 |
Family Income in Area Code 806
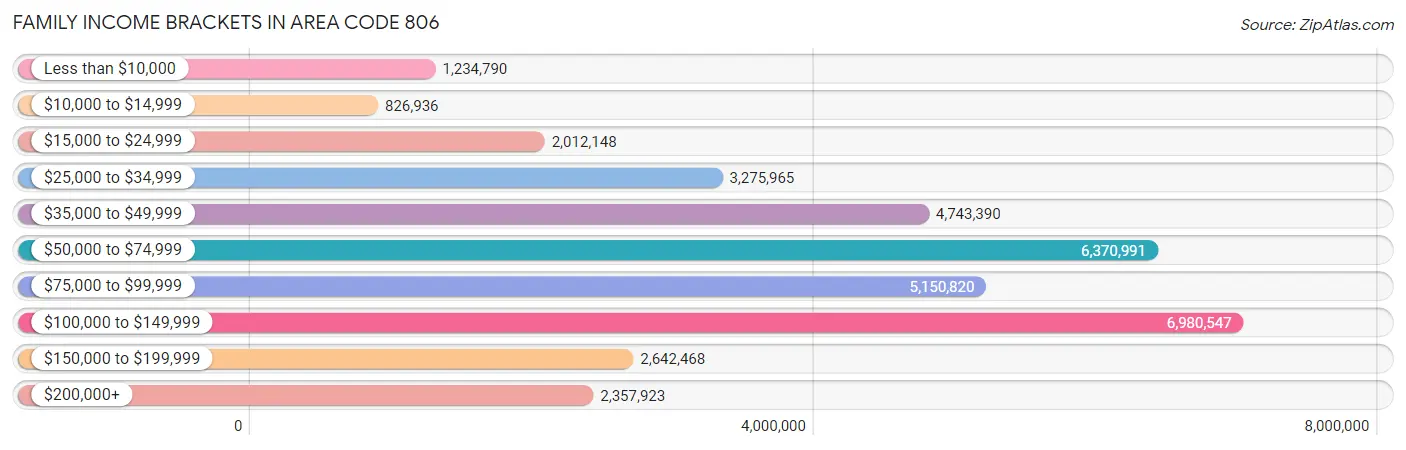
Family Income Brackets in Area Code 806
According to the Area Code 806 family income data, there are 6,980,547 families falling into the $100,000 to $149,999 income range, which is the most common income bracket and makes up 3,294.7% of all families. Conversely, the $10,000 to $14,999 income bracket is the least frequent group with only 826,936 families (390.3%) belonging to this category.
| Income Bracket | # Families | % Families |
| Less than $10,000 | 1,234,790 | 582.8% |
| $10,000 to $14,999 | 826,936 | 390.3% |
| $15,000 to $24,999 | 2,012,148 | 949.7% |
| $25,000 to $34,999 | 3,275,965 | 1,546.2% |
| $35,000 to $49,999 | 4,743,390 | 2,238.8% |
| $50,000 to $74,999 | 6,370,991 | 3,007.0% |
| $75,000 to $99,999 | 5,150,820 | 2,431.1% |
| $100,000 to $149,999 | 6,980,547 | 3,294.7% |
| $150,000 to $199,999 | 2,642,468 | 1,247.2% |
| $200,000+ | 2,357,923 | 1,112.9% |
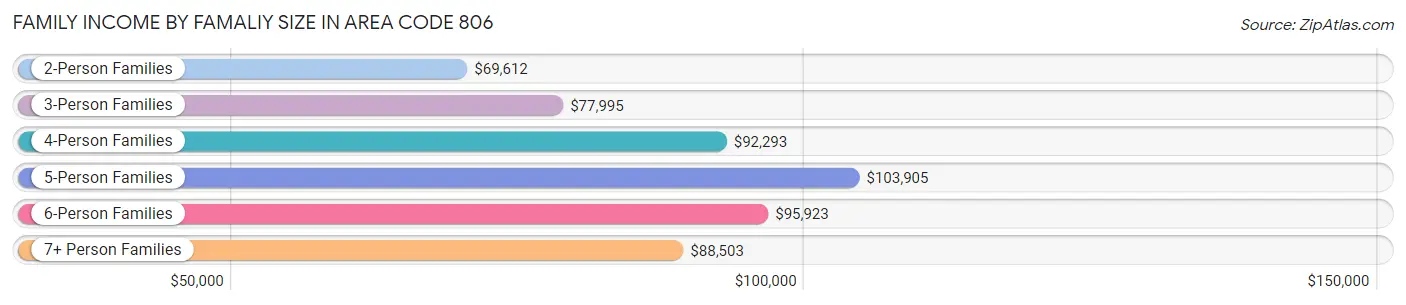
Family Income by Famaliy Size in Area Code 806
5-person families (19,876 | 9.4%) account for the highest median family income in Area Code 806 with $103,905 per family, while 2-person families (97,297 | 45.9%) have the highest median income of $34,806 per family member.
| Income Bracket | # Families | Median Income |
| 2-Person Families | 97,297 (45.9%) | $69,612 |
| 3-Person Families | 43,914 (20.7%) | $77,995 |
| 4-Person Families | 39,630 (18.7%) | $92,293 |
| 5-Person Families | 19,876 (9.4%) | $103,905 |
| 6-Person Families | 7,312 (3.5%) | $95,923 |
| 7+ Person Families | 3,843 (1.8%) | $88,503 |
| Total | 211,872 (100.0%) | $75,928 |
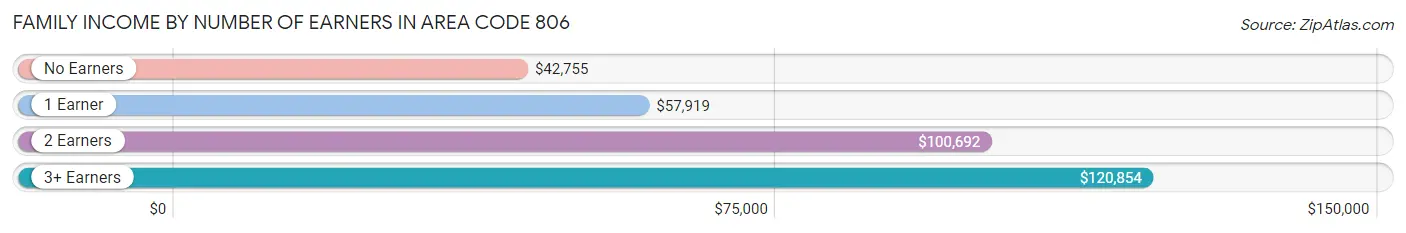
Family Income by Number of Earners in Area Code 806
The median family income in Area Code 806 is $75,928, with families comprising 3+ earners (21,891) having the highest median family income of $120,854, while families with no earners (27,005) have the lowest median family income of $42,755, accounting for 10.3% and 12.8% of families, respectively.
| Number of Earners | # Families | Median Income |
| No Earners | 27,005 (12.8%) | $42,755 |
| 1 Earner | 72,695 (34.3%) | $57,919 |
| 2 Earners | 90,281 (42.6%) | $100,692 |
| 3+ Earners | 21,891 (10.3%) | $120,854 |
| Total | 211,872 (100.0%) | $75,928 |
Household Income in Area Code 806
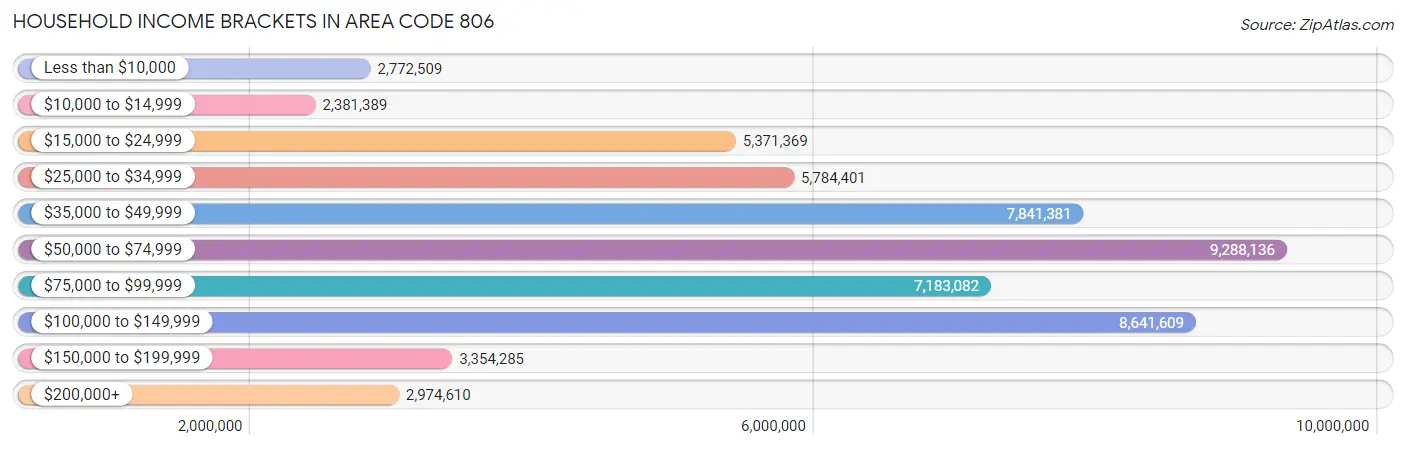
Household Income Brackets in Area Code 806
With 9,288,136 households falling in the category, the $50,000 to $74,999 income range is the most frequent in Area Code 806, accounting for 2,840.2% of all households. In contrast, only 2,381,389 households (728.2%) fall into the $10,000 to $14,999 income bracket, making it the least populous group.
| Income Bracket | # Households | % Households |
| Less than $10,000 | 2,772,509 | 847.8% |
| $10,000 to $14,999 | 2,381,389 | 728.2% |
| $15,000 to $24,999 | 5,371,369 | 1,642.5% |
| $25,000 to $34,999 | 5,784,401 | 1,768.8% |
| $35,000 to $49,999 | 7,841,381 | 2,397.8% |
| $50,000 to $74,999 | 9,288,136 | 2,840.2% |
| $75,000 to $99,999 | 7,183,082 | 2,196.5% |
| $100,000 to $149,999 | 8,641,609 | 2,642.5% |
| $150,000 to $199,999 | 3,354,285 | 1,025.7% |
| $200,000+ | 2,974,610 | 909.6% |
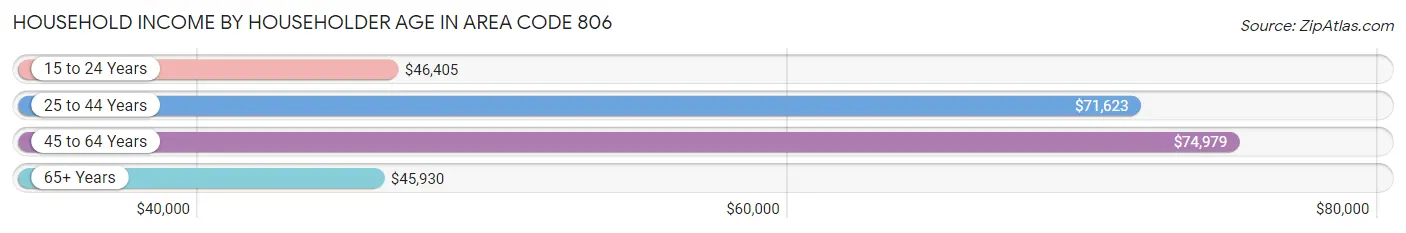
Household Income by Householder Age in Area Code 806
The median household income in Area Code 806 is $62,614, with the highest median household income of $74,979 found in the 45 to 64 years age bracket for the primary householder. A total of 105,412 households (32.2%) fall into this category. Meanwhile, the 65+ years age bracket for the primary householder has the lowest median household income of $45,930, with 79,281 households (24.2%) in this group.
| Income Bracket | # Households | Median Income |
| 15 to 24 Years | 28,423 (8.7%) | $46,405 |
| 25 to 44 Years | 113,908 (34.8%) | $71,623 |
| 45 to 64 Years | 105,412 (32.2%) | $74,979 |
| 65+ Years | 79,281 (24.2%) | $45,930 |
| Total | 327,024 (100.0%) | $62,614 |
Poverty in Area Code 806
Income Below Poverty by Sex and Age in Area Code 806
With 14.3% poverty level for males and 17.3% for females among the residents of Area Code 806, 18 to 24 year old males and 18 to 24 year old females are the most vulnerable to poverty, with 13,374 males (27.2%) and 14,815 females (31.9%) in their respective age groups living below the poverty level.
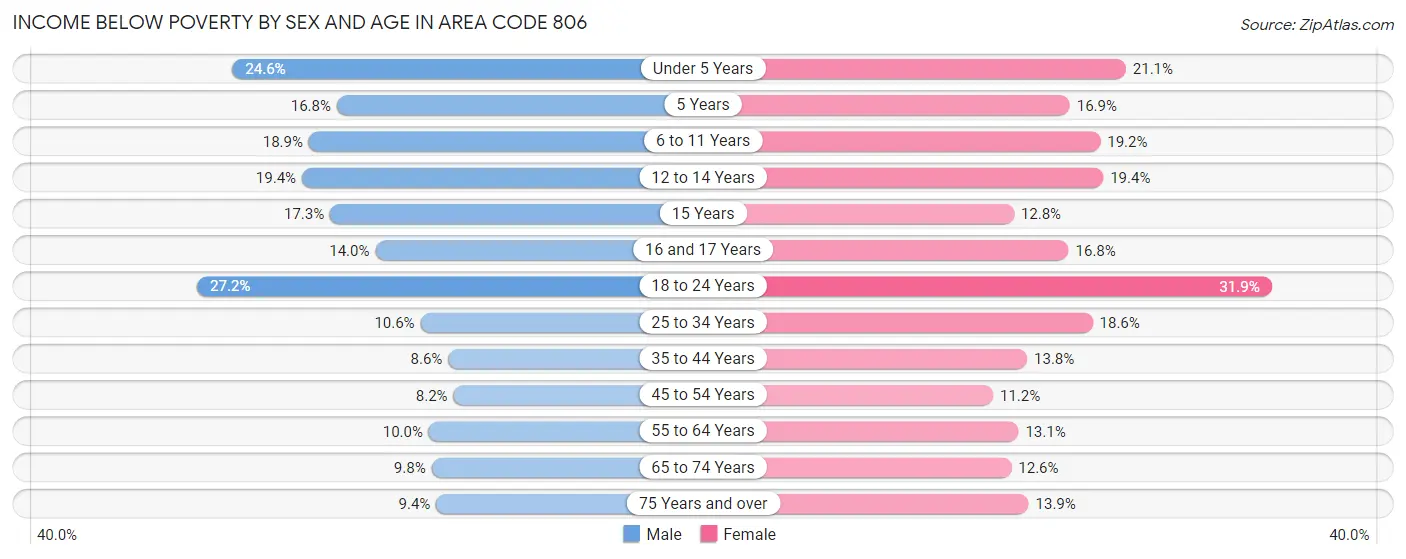
| Age Bracket | Male | Female |
| Under 5 Years | 7,148 (24.6%) | 5,791 (21.1%) |
| 5 Years | 902 (16.8%) | 1,016 (16.9%) |
| 6 to 11 Years | 7,435 (18.9%) | 7,005 (19.2%) |
| 12 to 14 Years | 3,801 (19.4%) | 3,721 (19.4%) |
| 15 Years | 1,070 (17.3%) | 840 (12.8%) |
| 16 and 17 Years | 1,778 (14.0%) | 2,011 (16.8%) |
| 18 to 24 Years | 13,374 (27.2%) | 14,815 (31.9%) |
| 25 to 34 Years | 6,183 (10.6%) | 10,629 (18.6%) |
| 35 to 44 Years | 4,661 (8.6%) | 7,384 (13.8%) |
| 45 to 54 Years | 3,593 (8.2%) | 5,111 (11.2%) |
| 55 to 64 Years | 4,642 (10.0%) | 6,332 (13.1%) |
| 65 to 74 Years | 3,310 (9.8%) | 4,742 (12.6%) |
| 75 Years and over | 1,934 (9.4%) | 4,002 (13.9%) |
| Total | 59,831 (14.3%) | 73,399 (17.3%) |
Income Above Poverty by Sex and Age in Area Code 806
According to the poverty statistics in Area Code 806, males aged 45 to 54 years and females aged 45 to 54 years are the age groups that are most secure financially, with 91.8% of males and 88.8% of females in these age groups living above the poverty line.
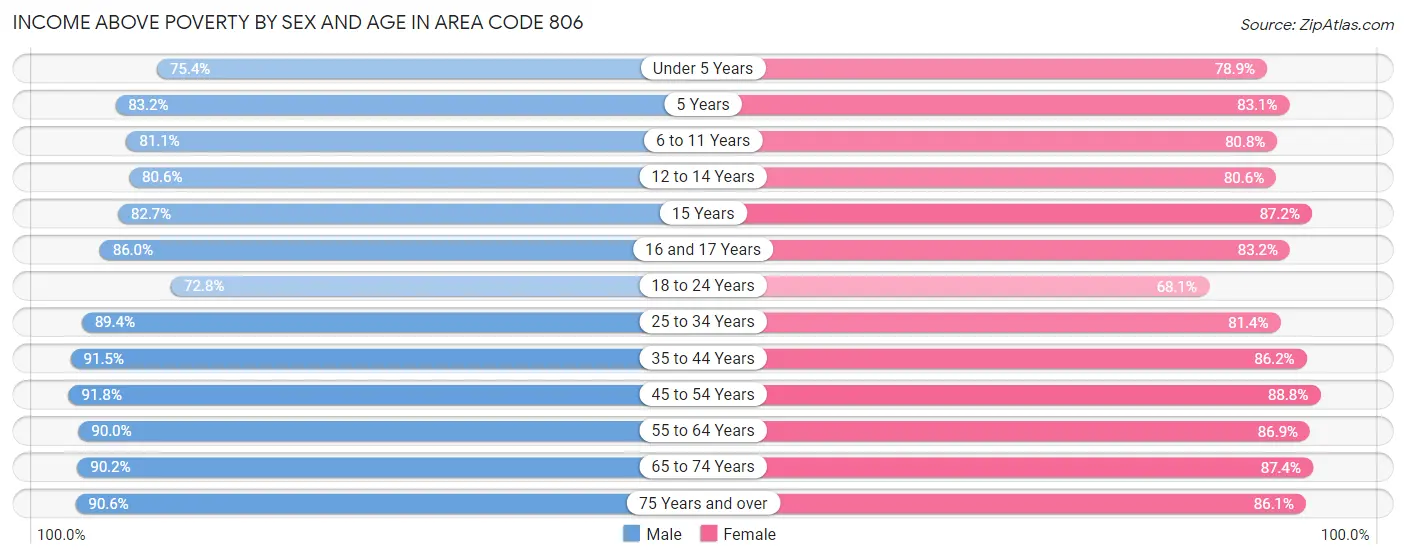
| Age Bracket | Male | Female |
| Under 5 Years | 21,945 (75.4%) | 21,670 (78.9%) |
| 5 Years | 4,462 (83.2%) | 4,984 (83.1%) |
| 6 to 11 Years | 31,894 (81.1%) | 29,489 (80.8%) |
| 12 to 14 Years | 15,779 (80.6%) | 15,449 (80.6%) |
| 15 Years | 5,109 (82.7%) | 5,734 (87.2%) |
| 16 and 17 Years | 10,960 (86.0%) | 9,931 (83.2%) |
| 18 to 24 Years | 35,808 (72.8%) | 31,623 (68.1%) |
| 25 to 34 Years | 52,086 (89.4%) | 46,451 (81.4%) |
| 35 to 44 Years | 49,874 (91.4%) | 46,281 (86.2%) |
| 45 to 54 Years | 40,421 (91.8%) | 40,394 (88.8%) |
| 55 to 64 Years | 41,841 (90.0%) | 41,947 (86.9%) |
| 65 to 74 Years | 30,497 (90.2%) | 32,933 (87.4%) |
| 75 Years and over | 18,551 (90.6%) | 24,849 (86.1%) |
| Total | 359,227 (85.7%) | 351,735 (82.7%) |
Income Below Poverty Among Married-Couple Families in Area Code 806
The poverty statistics for married-couple families in Area Code 806 show that 5.9% or 9,113 of the total 153,833 families live below the poverty line. Families with 5 or more children have the highest poverty rate of 31.1%, comprising of 480 families. On the other hand, families with no children have the lowest poverty rate of 5.0%, which includes 4,245 families.
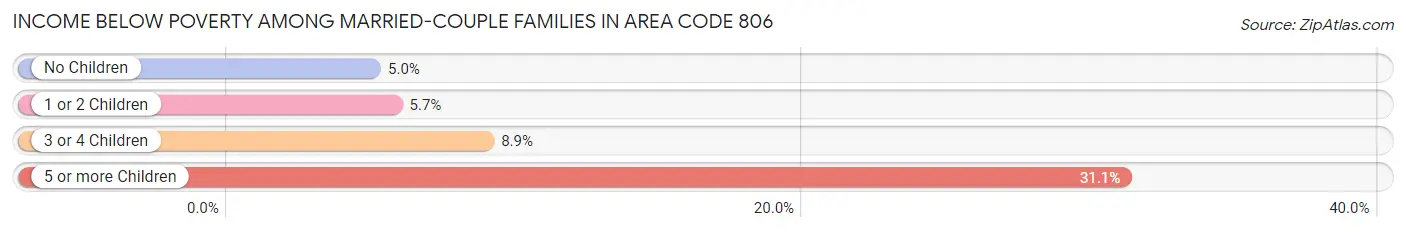
| Children | Above Poverty | Below Poverty |
| No Children | 81,066 (95.0%) | 4,245 (5.0%) |
| 1 or 2 Children | 46,937 (94.3%) | 2,855 (5.7%) |
| 3 or 4 Children | 15,655 (91.1%) | 1,533 (8.9%) |
| 5 or more Children | 1,062 (68.9%) | 480 (31.1%) |
| Total | 144,720 (94.1%) | 9,113 (5.9%) |
Income Below Poverty Among Single-Parent Households in Area Code 806
According to the poverty data in Area Code 806, 14.5% or 2,401 single-father households and 31.1% or 12,924 single-mother households are living below the poverty line. Among single-father households, those with 5 or more children have the highest poverty rate, with 76 households (35.3%) experiencing poverty. Likewise, among single-mother households, those with 5 or more children have the highest poverty rate, with 566 households (81.6%) falling below the poverty line.
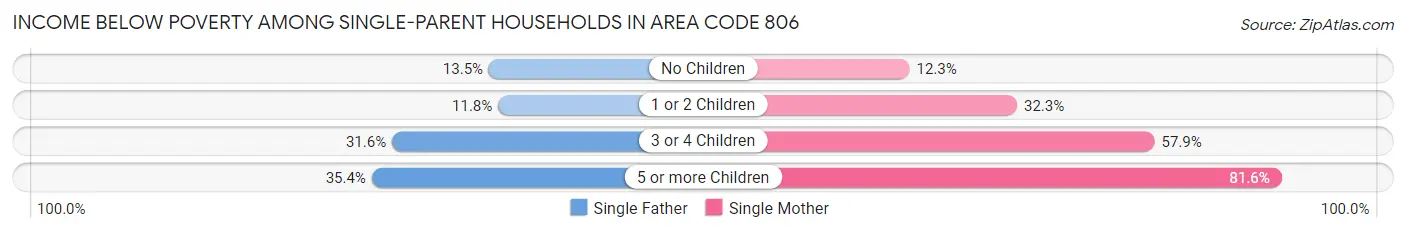
| Children | Single Father | Single Mother |
| No Children | 876 (13.5%) | 1,541 (12.3%) |
| 1 or 2 Children | 983 (11.8%) | 7,016 (32.3%) |
| 3 or 4 Children | 466 (31.6%) | 3,801 (57.9%) |
| 5 or more Children | 76 (35.3%) | 566 (81.6%) |
| Total | 2,401 (14.5%) | 12,924 (31.1%) |
Income Below Poverty Among Married-Couple vs Single-Parent Households in Area Code 806
The poverty data for Area Code 806 shows that 9,113 of the married-couple family households (5.9%) and 15,325 of the single-parent households (26.4%) are living below the poverty level. Within the married-couple family households, those with 5 or more children have the highest poverty rate, with 480 households (31.1%) falling below the poverty line. Among the single-parent households, those with 5 or more children have the highest poverty rate, with 642 household (70.6%) living below poverty.
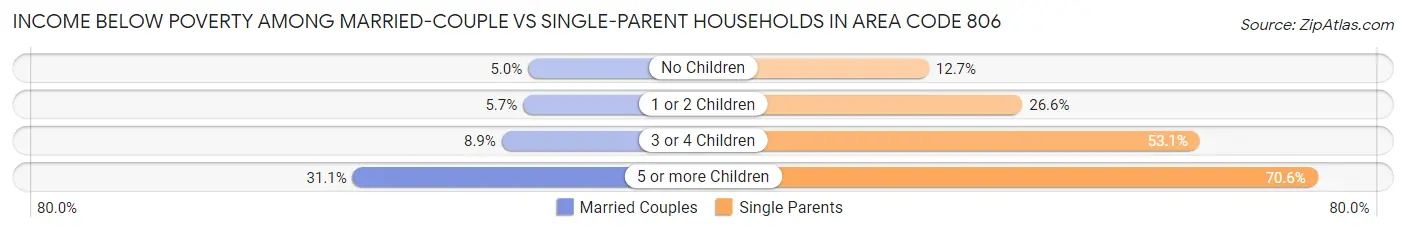
| Children | Married-Couple Families | Single-Parent Households |
| No Children | 4,245 (5.0%) | 2,417 (12.7%) |
| 1 or 2 Children | 2,855 (5.7%) | 7,999 (26.6%) |
| 3 or 4 Children | 1,533 (8.9%) | 4,267 (53.1%) |
| 5 or more Children | 480 (31.1%) | 642 (70.6%) |
| Total | 9,113 (5.9%) | 15,325 (26.4%) |
Race in Area Code 806
The most populous races in Area Code 806 are White / Caucasian (631,386 | 71.7%), Hispanic or Latino (349,179 | 39.7%), and Two or more Races (118,515 | 13.5%).
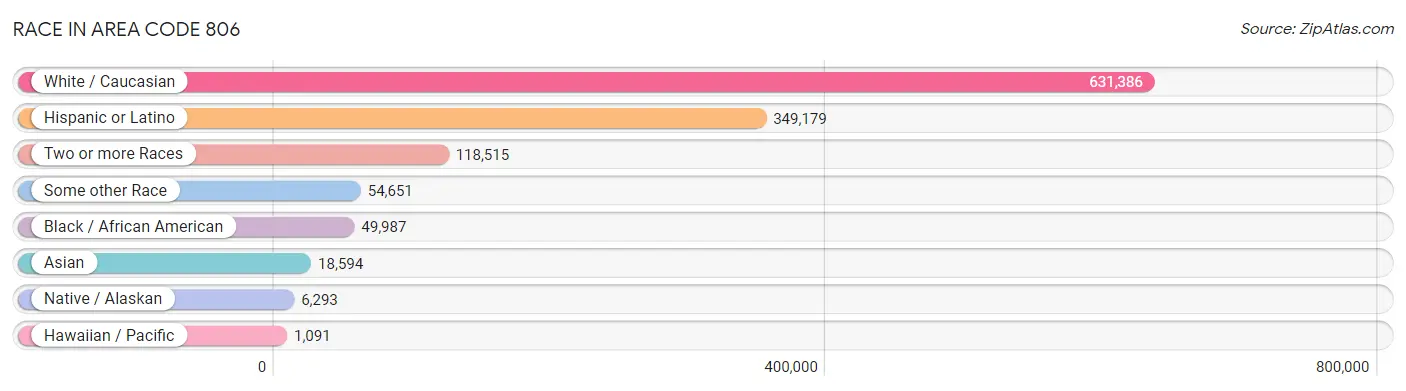
| Race | # Population | % Population |
| Asian | 18,594 | 2.1% |
| Black / African American | 49,987 | 5.7% |
| Hawaiian / Pacific | 1,091 | 0.1% |
| Hispanic or Latino | 349,179 | 39.7% |
| Native / Alaskan | 6,293 | 0.7% |
| White / Caucasian | 631,386 | 71.7% |
| Two or more Races | 118,515 | 13.5% |
| Some other Race | 54,651 | 6.2% |
| Total | 880,517 | 100.0% |
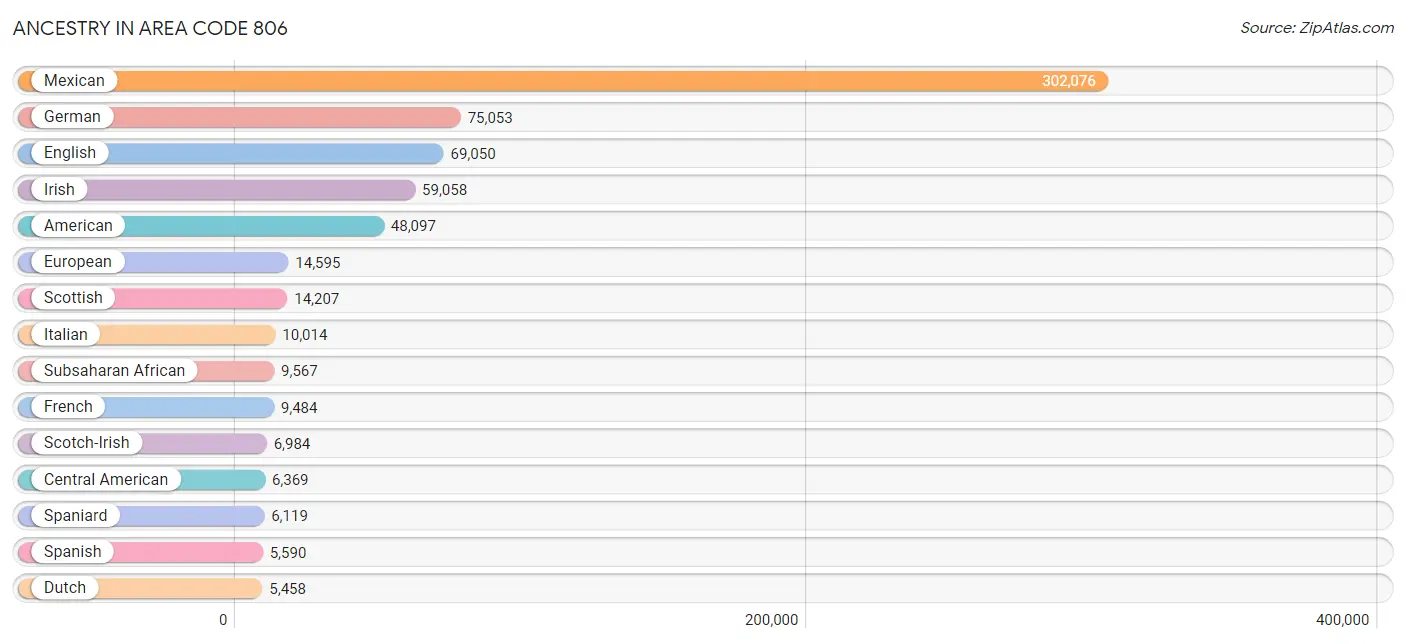
Ancestry in Area Code 806
The most populous ancestries reported in Area Code 806 are Mexican (302,076 | 34.3%), German (75,053 | 8.5%), English (69,050 | 7.8%), Irish (59,058 | 6.7%), and American (48,097 | 5.5%), together accounting for 62.8% of all Area Code 806 residents.
| Ancestry | # Population | % Population |
| Afghan | 68 | 0.0% |
| African | 4,957 | 0.6% |
| Alaska Native | 5 | 0.0% |
| Albanian | 95 | 0.0% |
| Aleut | 29 | 0.0% |
| Alsatian | 14 | 0.0% |
| American | 48,097 | 5.5% |
| Apache | 1,191 | 0.1% |
| Arab | 1,769 | 0.2% |
| Arapaho | 26 | 0.0% |
| Argentinean | 273 | 0.0% |
| Armenian | 97 | 0.0% |
| Australian | 90 | 0.0% |
| Austrian | 645 | 0.1% |
| Bahamian | 12 | 0.0% |
| Bangladeshi | 82 | 0.0% |
| Barbadian | 9 | 0.0% |
| Basque | 104 | 0.0% |
| Belgian | 123 | 0.0% |
| Belizean | 10 | 0.0% |
| Bermudan | 7 | 0.0% |
| Bhutanese | 804 | 0.1% |
| Blackfeet | 559 | 0.1% |
| Bolivian | 198 | 0.0% |
| Brazilian | 276 | 0.0% |
| British | 4,249 | 0.5% |
| British West Indian | 26 | 0.0% |
| Bulgarian | 65 | 0.0% |
| Burmese | 1,523 | 0.2% |
| Cajun | 146 | 0.0% |
| Cambodian | 9 | 0.0% |
| Canadian | 1,104 | 0.1% |
| Cape Verdean | 17 | 0.0% |
| Celtic | 185 | 0.0% |
| Central American | 6,369 | 0.7% |
| Central American Indian | 531 | 0.1% |
| Cherokee | 3,612 | 0.4% |
| Cheyenne | 48 | 0.0% |
| Chickasaw | 467 | 0.1% |
| Chilean | 112 | 0.0% |
| Chippewa | 52 | 0.0% |
| Choctaw | 1,388 | 0.2% |
| Colombian | 750 | 0.1% |
| Comanche | 482 | 0.1% |
| Costa Rican | 34 | 0.0% |
| Cree | 13 | 0.0% |
| Creek | 446 | 0.1% |
| Croatian | 178 | 0.0% |
| Crow | 42 | 0.0% |
| Cuban | 1,838 | 0.2% |
| Czech | 2,076 | 0.2% |
| Czechoslovakian | 429 | 0.1% |
| Danish | 941 | 0.1% |
| Delaware | 24 | 0.0% |
| Dominican | 386 | 0.0% |
| Dutch | 5,458 | 0.6% |
| Dutch West Indian | 1,056 | 0.1% |
| Eastern European | 650 | 0.1% |
| Ecuadorian | 416 | 0.1% |
| Egyptian | 167 | 0.0% |
| English | 69,050 | 7.8% |
| Ethiopian | 978 | 0.1% |
| European | 14,595 | 1.7% |
| Fijian | 34 | 0.0% |
| Filipino | 50 | 0.0% |
| Finnish | 152 | 0.0% |
| French | 9,484 | 1.1% |
| French American Indian | 29 | 0.0% |
| French Canadian | 896 | 0.1% |
| German | 75,053 | 8.5% |
| German Russian | 88 | 0.0% |
| Ghanaian | 329 | 0.0% |
| Greek | 729 | 0.1% |
| Guamanian / Chamorro | 362 | 0.0% |
| Guatemalan | 2,406 | 0.3% |
| Guyanese | 3 | 0.0% |
| Haitian | 348 | 0.0% |
| Honduran | 1,404 | 0.2% |
| Hopi | 12 | 0.0% |
| Hungarian | 471 | 0.1% |
| Icelander | 29 | 0.0% |
| Indian (Asian) | 2,916 | 0.3% |
| Indonesian | 3,128 | 0.4% |
| Inupiat | 21 | 0.0% |
| Iranian | 596 | 0.1% |
| Iraqi | 160 | 0.0% |
| Irish | 59,058 | 6.7% |
| Iroquois | 75 | 0.0% |
| Israeli | 75 | 0.0% |
| Italian | 10,014 | 1.1% |
| Jamaican | 411 | 0.1% |
| Japanese | 265 | 0.0% |
| Jordanian | 50 | 0.0% |
| Kenyan | 129 | 0.0% |
| Korean | 3,895 | 0.4% |
| Laotian | 254 | 0.0% |
| Latvian | 20 | 0.0% |
| Lebanese | 626 | 0.1% |
| Liberian | 19 | 0.0% |
| Lithuanian | 176 | 0.0% |
| Lumbee | 3 | 0.0% |
| Luxembourger | 25 | 0.0% |
| Macedonian | 1 | 0.0% |
| Malaysian | 1,997 | 0.2% |
| Menominee | 31 | 0.0% |
| Mexican | 302,076 | 34.3% |
| Mexican American Indian | 1,144 | 0.1% |
| Moroccan | 12 | 0.0% |
| Native Hawaiian | 960 | 0.1% |
| Navajo | 696 | 0.1% |
| New Zealander | 63 | 0.0% |
| Nicaraguan | 94 | 0.0% |
| Nigerian | 655 | 0.1% |
| Northern European | 691 | 0.1% |
| Norwegian | 4,238 | 0.5% |
| Osage | 87 | 0.0% |
| Pakistani | 746 | 0.1% |
| Palestinian | 1 | 0.0% |
| Panamanian | 130 | 0.0% |
| Paraguayan | 27 | 0.0% |
| Pennsylvania German | 559 | 0.1% |
| Peruvian | 691 | 0.1% |
| Polish | 4,386 | 0.5% |
| Portuguese | 668 | 0.1% |
| Potawatomi | 66 | 0.0% |
| Pueblo | 144 | 0.0% |
| Puerto Rican | 3,138 | 0.4% |
| Romanian | 158 | 0.0% |
| Russian | 1,148 | 0.1% |
| Salvadoran | 2,282 | 0.3% |
| Samoan | 485 | 0.1% |
| Scandinavian | 1,601 | 0.2% |
| Scotch-Irish | 6,984 | 0.8% |
| Scottish | 14,207 | 1.6% |
| Seminole | 66 | 0.0% |
| Serbian | 204 | 0.0% |
| Shoshone | 8 | 0.0% |
| Sierra Leonean | 62 | 0.0% |
| Sioux | 237 | 0.0% |
| Slavic | 108 | 0.0% |
| Slovak | 153 | 0.0% |
| Slovene | 173 | 0.0% |
| Somali | 421 | 0.1% |
| South African | 123 | 0.0% |
| South American | 2,829 | 0.3% |
| South American Indian | 52 | 0.0% |
| Spaniard | 6,119 | 0.7% |
| Spanish | 5,590 | 0.6% |
| Spanish American | 484 | 0.1% |
| Spanish American Indian | 6 | 0.0% |
| Sri Lankan | 3,025 | 0.3% |
| Subsaharan African | 9,567 | 1.1% |
| Sudanese | 439 | 0.1% |
| Swedish | 3,737 | 0.4% |
| Swiss | 1,342 | 0.2% |
| Syrian | 96 | 0.0% |
| Thai | 2,361 | 0.3% |
| Tlingit-Haida | 24 | 0.0% |
| Tohono O'Odham | 14 | 0.0% |
| Tongan | 25 | 0.0% |
| Trinidadian and Tobagonian | 115 | 0.0% |
| Turkish | 335 | 0.0% |
| U.S. Virgin Islander | 16 | 0.0% |
| Ugandan | 46 | 0.0% |
| Ukrainian | 405 | 0.1% |
| Uruguayan | 44 | 0.0% |
| Ute | 10 | 0.0% |
| Venezuelan | 318 | 0.0% |
| Vietnamese | 161 | 0.0% |
| Welsh | 4,120 | 0.5% |
| West Indian | 118 | 0.0% |
| Yaqui | 153 | 0.0% |
| Yugoslavian | 162 | 0.0% |
| Yup'ik | 21 | 0.0% | View All 174 Rows |
Immigrants in Area Code 806
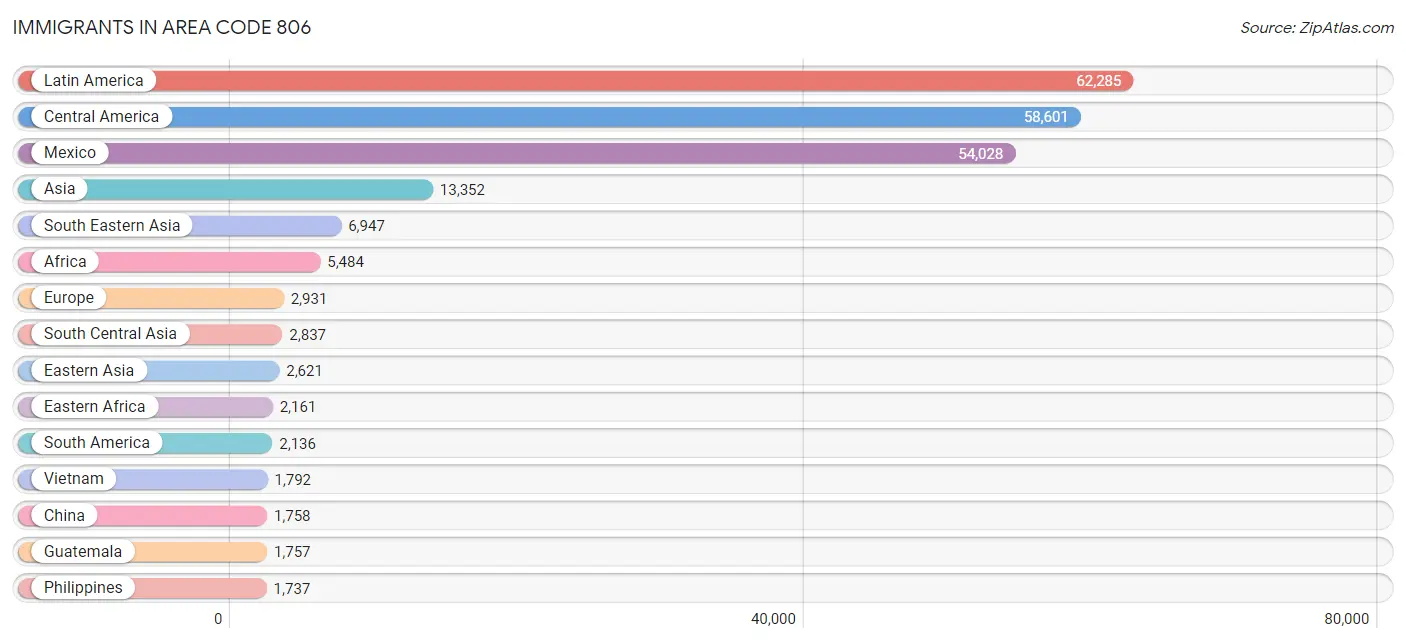
The most numerous immigrant groups reported in Area Code 806 came from Latin America (62,285 | 7.1%), Central America (58,601 | 6.7%), Mexico (54,028 | 6.1%), Asia (13,352 | 1.5%), and South Eastern Asia (6,947 | 0.8%), together accounting for 22.2% of all Area Code 806 residents.
| Immigration Origin | # Population | % Population |
| Afghanistan | 51 | 0.0% |
| Africa | 5,484 | 0.6% |
| Argentina | 79 | 0.0% |
| Asia | 13,352 | 1.5% |
| Australia | 51 | 0.0% |
| Austria | 22 | 0.0% |
| Bahamas | 12 | 0.0% |
| Bangladesh | 138 | 0.0% |
| Belarus | 78 | 0.0% |
| Belgium | 57 | 0.0% |
| Belize | 27 | 0.0% |
| Bolivia | 182 | 0.0% |
| Bosnia and Herzegovina | 105 | 0.0% |
| Brazil | 266 | 0.0% |
| Bulgaria | 15 | 0.0% |
| Cabo Verde | 17 | 0.0% |
| Cambodia | 37 | 0.0% |
| Cameroon | 397 | 0.1% |
| Canada | 1,074 | 0.1% |
| Caribbean | 1,548 | 0.2% |
| Central America | 58,601 | 6.7% |
| Chile | 59 | 0.0% |
| China | 1,758 | 0.2% |
| Colombia | 401 | 0.1% |
| Congo | 633 | 0.1% |
| Cuba | 1,125 | 0.1% |
| Denmark | 1 | 0.0% |
| Dominica | 82 | 0.0% |
| Dominican Republic | 67 | 0.0% |
| Eastern Africa | 2,161 | 0.3% |
| Eastern Asia | 2,621 | 0.3% |
| Eastern Europe | 1,153 | 0.1% |
| Ecuador | 214 | 0.0% |
| Egypt | 392 | 0.0% |
| El Salvador | 1,345 | 0.2% |
| England | 316 | 0.0% |
| Eritrea | 78 | 0.0% |
| Ethiopia | 629 | 0.1% |
| Europe | 2,931 | 0.3% |
| Fiji | 9 | 0.0% |
| France | 230 | 0.0% |
| Germany | 425 | 0.1% |
| Ghana | 181 | 0.0% |
| Greece | 76 | 0.0% |
| Guatemala | 1,757 | 0.2% |
| Guyana | 3 | 0.0% |
| Honduras | 1,253 | 0.1% |
| Hong Kong | 101 | 0.0% |
| Hungary | 66 | 0.0% |
| India | 1,474 | 0.2% |
| Indonesia | 69 | 0.0% |
| Iran | 654 | 0.1% |
| Iraq | 226 | 0.0% |
| Ireland | 67 | 0.0% |
| Israel | 47 | 0.0% |
| Italy | 23 | 0.0% |
| Jamaica | 115 | 0.0% |
| Japan | 167 | 0.0% |
| Jordan | 86 | 0.0% |
| Kenya | 434 | 0.1% |
| Korea | 696 | 0.1% |
| Kuwait | 42 | 0.0% |
| Laos | 692 | 0.1% |
| Latin America | 62,285 | 7.1% |
| Latvia | 9 | 0.0% |
| Lebanon | 96 | 0.0% |
| Liberia | 143 | 0.0% |
| Lithuania | 13 | 0.0% |
| Malaysia | 90 | 0.0% |
| Mexico | 54,028 | 6.1% |
| Micronesia | 18 | 0.0% |
| Middle Africa | 1,300 | 0.2% |
| Morocco | 10 | 0.0% |
| Nepal | 251 | 0.0% |
| Netherlands | 50 | 0.0% |
| Nicaragua | 81 | 0.0% |
| Nigeria | 552 | 0.1% |
| North Macedonia | 1 | 0.0% |
| Northern Africa | 731 | 0.1% |
| Northern Europe | 740 | 0.1% |
| Norway | 21 | 0.0% |
| Oceania | 253 | 0.0% |
| Pakistan | 140 | 0.0% |
| Panama | 110 | 0.0% |
| Peru | 450 | 0.1% |
| Philippines | 1,737 | 0.2% |
| Poland | 127 | 0.0% |
| Romania | 33 | 0.0% |
| Russia | 497 | 0.1% |
| Saudi Arabia | 45 | 0.0% |
| Serbia | 132 | 0.0% |
| Sierra Leone | 8 | 0.0% |
| Singapore | 6 | 0.0% |
| Somalia | 289 | 0.0% |
| South Africa | 198 | 0.0% |
| South America | 2,136 | 0.2% |
| South Central Asia | 2,837 | 0.3% |
| South Eastern Asia | 6,947 | 0.8% |
| Southern Europe | 254 | 0.0% |
| Spain | 155 | 0.0% |
| Sri Lanka | 129 | 0.0% |
| Sudan | 194 | 0.0% |
| Sweden | 72 | 0.0% |
| Syria | 96 | 0.0% |
| Taiwan | 120 | 0.0% |
| Thailand | 1,024 | 0.1% |
| Trinidad and Tobago | 135 | 0.0% |
| Turkey | 146 | 0.0% |
| Uganda | 64 | 0.0% |
| Ukraine | 36 | 0.0% |
| Uruguay | 11 | 0.0% |
| Venezuela | 452 | 0.1% |
| Vietnam | 1,792 | 0.2% |
| Western Africa | 901 | 0.1% |
| Western Asia | 938 | 0.1% |
| Western Europe | 784 | 0.1% |
| Yemen | 54 | 0.0% |
| Zaire | 253 | 0.0% |
| Zimbabwe | 35 | 0.0% | View All 119 Rows |
Sex and Age in Area Code 806
Sex and Age in Area Code 806
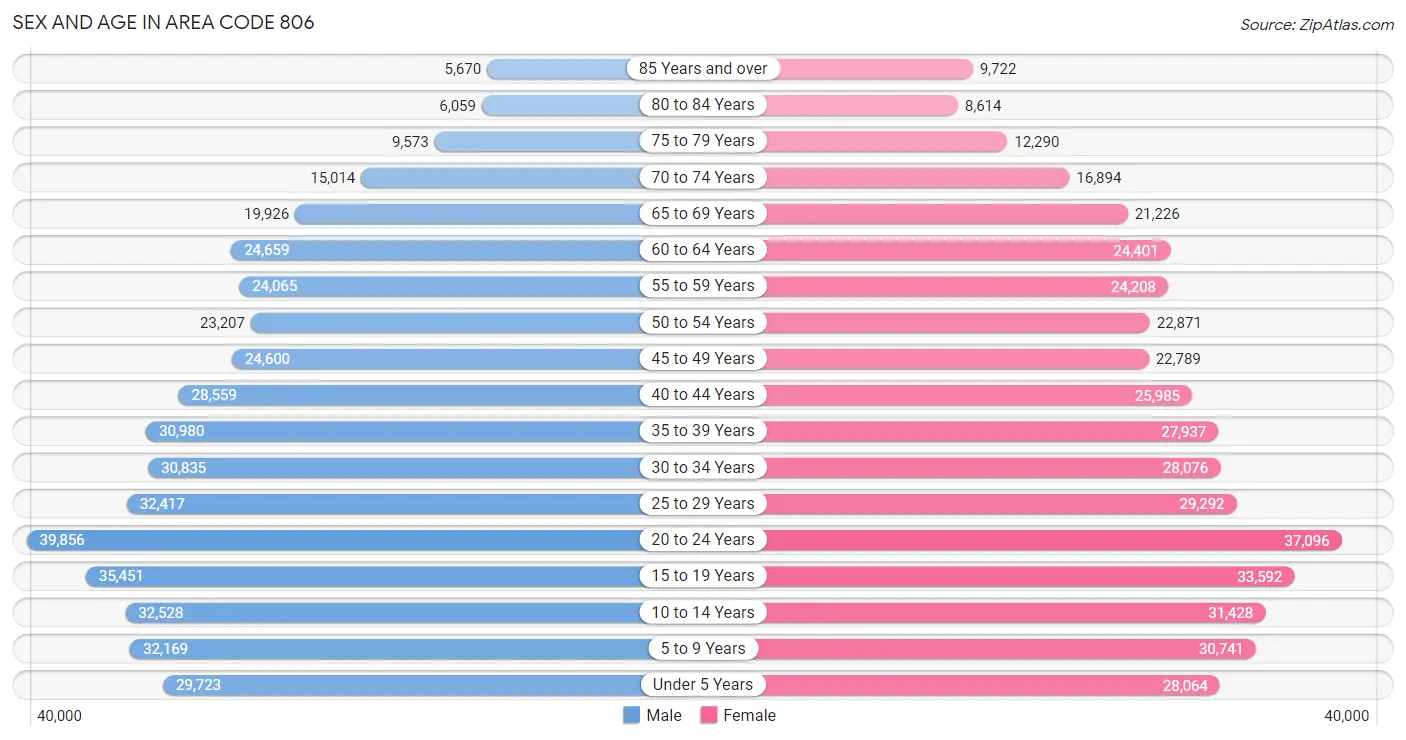
The most populous age groups in Area Code 806 are 20 to 24 Years (39,856 | 8.9%) for men and 20 to 24 Years (37,096 | 8.5%) for women.
| Age Bracket | Male | Female |
| Under 5 Years | 29,723 (6.7%) | 28,064 (6.5%) |
| 5 to 9 Years | 32,169 (7.2%) | 30,741 (7.1%) |
| 10 to 14 Years | 32,528 (7.3%) | 31,428 (7.2%) |
| 15 to 19 Years | 35,451 (8.0%) | 33,592 (7.7%) |
| 20 to 24 Years | 39,856 (8.9%) | 37,096 (8.5%) |
| 25 to 29 Years | 32,417 (7.3%) | 29,292 (6.7%) |
| 30 to 34 Years | 30,835 (6.9%) | 28,076 (6.5%) |
| 35 to 39 Years | 30,980 (7.0%) | 27,937 (6.4%) |
| 40 to 44 Years | 28,559 (6.4%) | 25,985 (6.0%) |
| 45 to 49 Years | 24,600 (5.5%) | 22,789 (5.2%) |
| 50 to 54 Years | 23,207 (5.2%) | 22,871 (5.2%) |
| 55 to 59 Years | 24,065 (5.4%) | 24,208 (5.6%) |
| 60 to 64 Years | 24,659 (5.5%) | 24,401 (5.6%) |
| 65 to 69 Years | 19,926 (4.5%) | 21,226 (4.9%) |
| 70 to 74 Years | 15,014 (3.4%) | 16,894 (3.9%) |
| 75 to 79 Years | 9,573 (2.1%) | 12,290 (2.8%) |
| 80 to 84 Years | 6,059 (1.4%) | 8,614 (2.0%) |
| 85 Years and over | 5,670 (1.3%) | 9,722 (2.2%) |
| Total | 445,291 (100.0%) | 435,226 (100.0%) |
Families and Households in Area Code 806
Median Family Size in Area Code 806
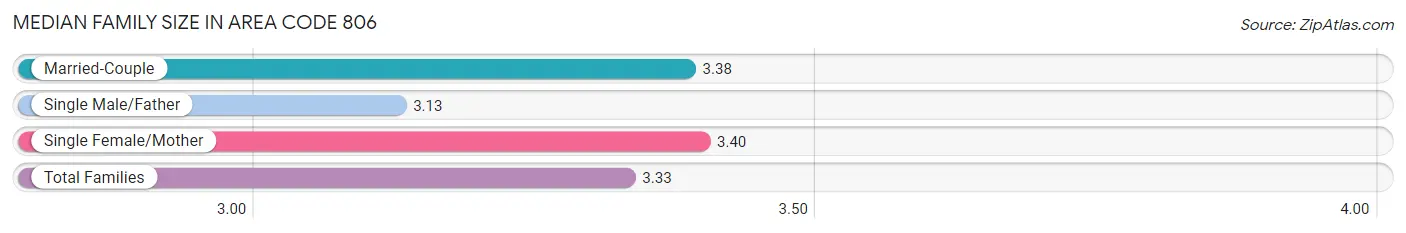
The median family size in Area Code 806 is 3.33 persons per family, with single female/mother families (41,540 | 19.6%) accounting for the largest median family size of 3.3965 persons per family. On the other hand, single male/father families (16,499 | 7.8%) represent the smallest median family size with 3.13 persons per family.
| Family Type | # Families | Family Size |
| Married-Couple | 153,833 (72.6%) | 3.38 |
| Single Male/Father | 16,499 (7.8%) | 3.13 |
| Single Female/Mother | 41,540 (19.6%) | 3.40 |
| Total Families | 211,872 (100.0%) | 3.33 |
Median Household Size in Area Code 806
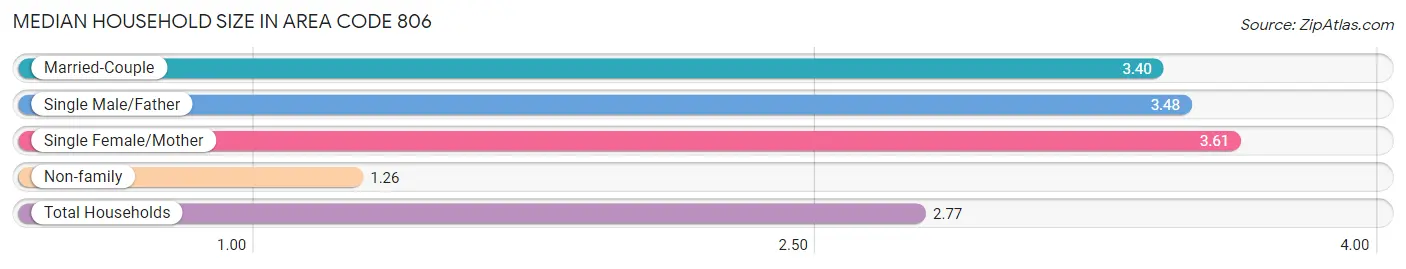
The median household size in Area Code 806 is 2.77 persons per household, with single female/mother households (41,540 | 12.7%) accounting for the largest median household size of 3.61014 persons per household. non-family households (115,152 | 35.2%) represent the smallest median household size with 1.26 persons per household.
| Household Type | # Households | Household Size |
| Married-Couple | 153,833 (47.0%) | 3.40 |
| Single Male/Father | 16,499 (5.1%) | 3.48 |
| Single Female/Mother | 41,540 (12.7%) | 3.61 |
| Non-family | 115,152 (35.2%) | 1.26 |
| Total Households | 327,024 (100.0%) | 2.77 |
Household Size by Marriage Status in Area Code 806
Out of a total of 327,024 households in Area Code 806, 211,872 (64.8%) are family households, while 115,152 (35.2%) are nonfamily households. The most numerous type of family households are 2-person households, comprising 91,604, and the most common type of nonfamily households are 1-person households, comprising 93,517.
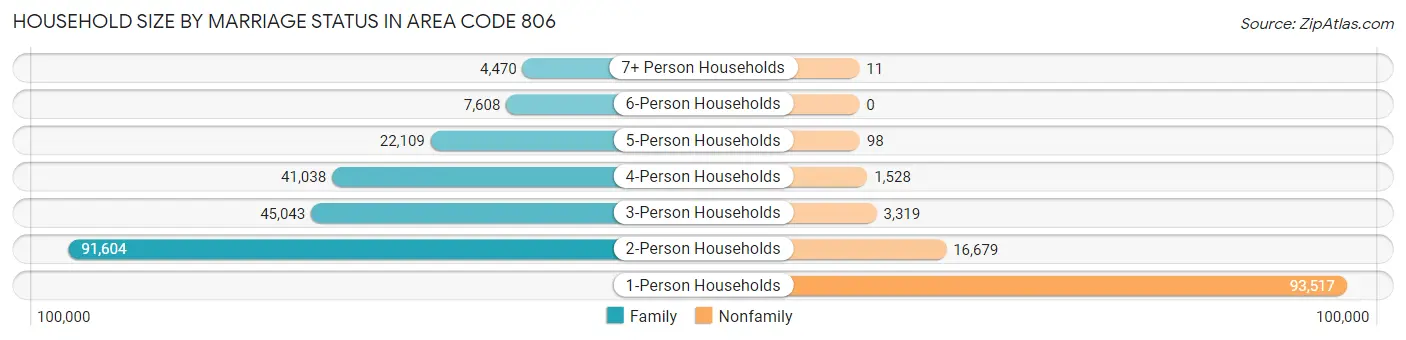
| Household Size | Family Households | Nonfamily Households |
| 1-Person Households | - | 93,517 (28.6%) |
| 2-Person Households | 91,604 (28.0%) | 16,679 (5.1%) |
| 3-Person Households | 45,043 (13.8%) | 3,319 (1.0%) |
| 4-Person Households | 41,038 (12.6%) | 1,528 (0.5%) |
| 5-Person Households | 22,109 (6.8%) | 98 (0.0%) |
| 6-Person Households | 7,608 (2.3%) | 0 (0.0%) |
| 7+ Person Households | 4,470 (1.4%) | 11 (0.0%) |
| Total | 211,872 (64.8%) | 115,152 (35.2%) |
Female Fertility in Area Code 806
Fertility by Age in Area Code 806
Average fertility rate in Area Code 806 is 71.9 births per 1,000 women. Women in the age bracket of 20 to 34 years have the highest fertility rate with 152.6 births per 1,000 women. Women in the age bracket of 20 to 34 years acount for 79.8% of all women with births.
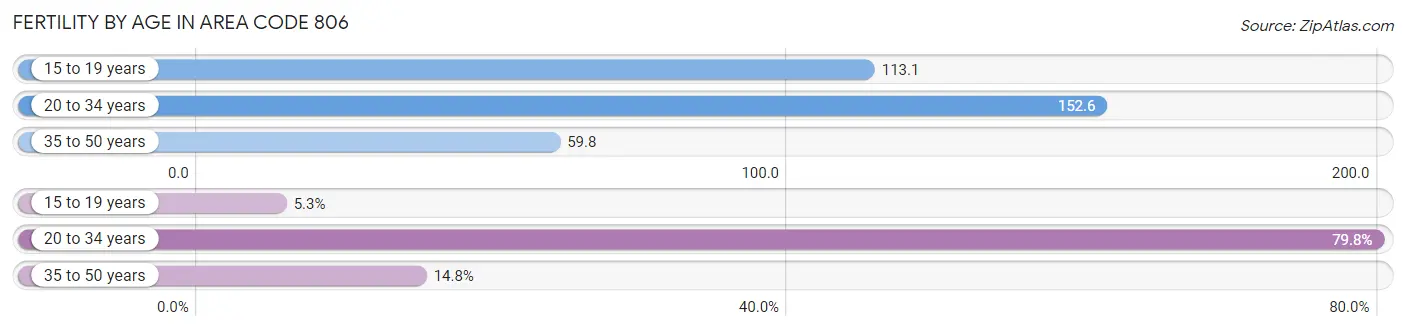
| Age Bracket | Women with Births | Births / 1,000 Women |
| 15 to 19 years | 617 (5.3%) | 113.1 |
| 20 to 34 years | 9,219 (79.8%) | 152.6 |
| 35 to 50 years | 1,714 (14.8%) | 59.8 |
| Total | 11,550 (100.0%) | 71.9 |
Fertility by Age by Marriage Status in Area Code 806
47.1% of women with births (11,550) in Area Code 806 are married. The highest percentage of unmarried women with births falls into 15 to 19 years age bracket with 100.0% of them unmarried at the time of birth, while the lowest percentage of unmarried women with births belong to 20 to 34 years age bracket with 52.7% of them unmarried.
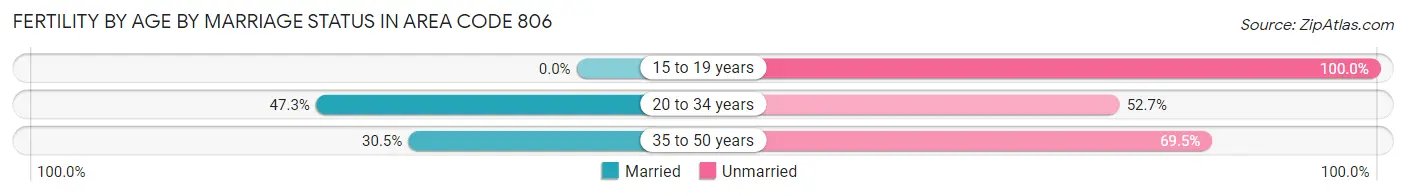
| Age Bracket | Married | Unmarried |
| 15 to 19 years | 0 (0.0%) | 617 (100.0%) |
| 20 to 34 years | 4,357 (47.3%) | 4,862 (52.7%) |
| 35 to 50 years | 523 (30.5%) | 1,191 (69.5%) |
| Total | 5,437 (47.1%) | 6,113 (52.9%) |
Fertility by Education in Area Code 806
Average fertility rate in Area Code 806 is 71.9 births per 1,000 women. Women with the education attainment of graduate degree have the highest fertility rate of 242.5 births per 1,000 women, while women with the education attainment of less than high school have the lowest fertility at 94.6 births per 1,000 women. Women with the education attainment of college or associate's degree represent 34.0% of all women with births.
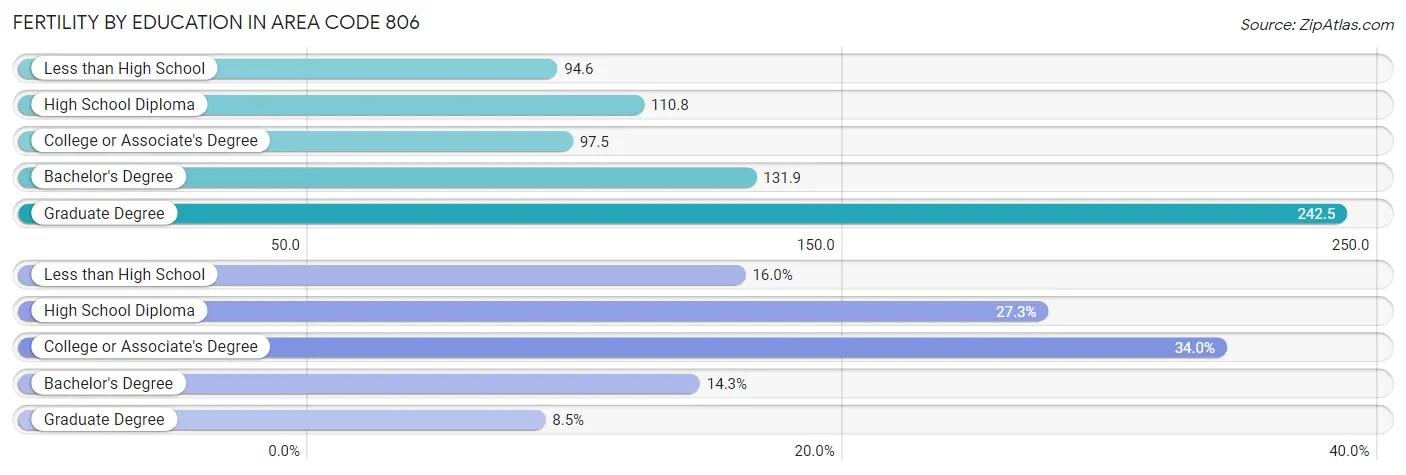
| Educational Attainment | Women with Births | Births / 1,000 Women |
| Less than High School | 1,844 (16.0%) | 94.6 |
| High School Diploma | 3,154 (27.3%) | 110.8 |
| College or Associate's Degree | 3,927 (34.0%) | 97.5 |
| Bachelor's Degree | 1,647 (14.3%) | 131.9 |
| Graduate Degree | 978 (8.5%) | 242.5 |
| Total | 11,550 (100.0%) | 71.9 |
Fertility by Education by Marriage Status in Area Code 806
52.9% of women with births in Area Code 806 are unmarried. Women with the educational attainment of bachelor's degree are most likely to be married with 33.5% of them married at childbirth, while women with the educational attainment of less than high school are least likely to be married with 85.0% of them unmarried at childbirth.
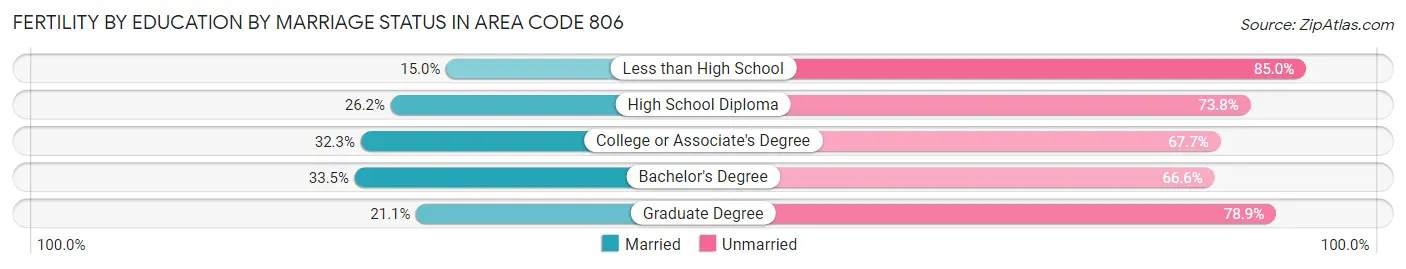
| Educational Attainment | Married | Unmarried |
| Less than High School | 277 (15.0%) | 1,567 (85.0%) |
| High School Diploma | 826 (26.2%) | 2,328 (73.8%) |
| College or Associate's Degree | 1,267 (32.3%) | 2,660 (67.7%) |
| Bachelor's Degree | 551 (33.5%) | 1,096 (66.5%) |
| Graduate Degree | 206 (21.1%) | 772 (78.9%) |
| Total | 5,437 (47.1%) | 6,113 (52.9%) |
Employment Characteristics in Area Code 806
Employment by Class of Employer in Area Code 806
Among the 405,747 employed individuals in Area Code 806, private company employees (270,950 | 66.8%), local government employees (35,418 | 8.7%), and self-employed (not incorporated) (27,928 | 6.9%) make up the most common classes of employment.
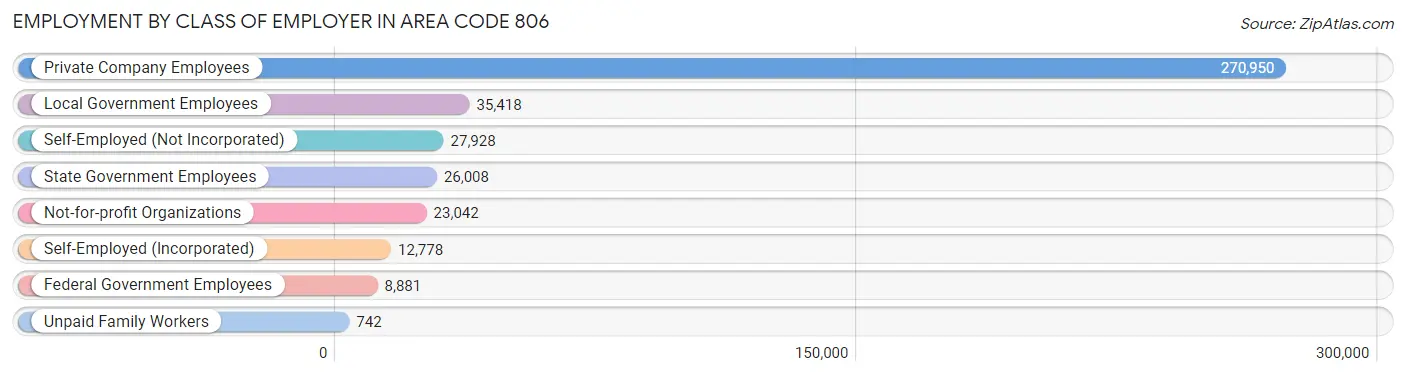
| Employer Class | # Employees | % Employees |
| Private Company Employees | 270,950 | 66.8% |
| Self-Employed (Incorporated) | 12,778 | 3.2% |
| Self-Employed (Not Incorporated) | 27,928 | 6.9% |
| Not-for-profit Organizations | 23,042 | 5.7% |
| Local Government Employees | 35,418 | 8.7% |
| State Government Employees | 26,008 | 6.4% |
| Federal Government Employees | 8,881 | 2.2% |
| Unpaid Family Workers | 742 | 0.2% |
| Total | 405,747 | 100.0% |
Employment Status by Age in Area Code 806
According to the labor force statistics for Area Code 806, out of the total population over 16 years of age (682,893), 59.7% or 407,482 individuals are in the labor force, with 4.7% or 19,111 of them unemployed. The age group with the highest labor force participation rate is 35 to 44 years, with 81.5% or 92,437 individuals in the labor force. Within the labor force, the 16 to 19 years age range has the highest percentage of unemployed individuals, with 1,618.9% or 361,743 of them being unemployed.
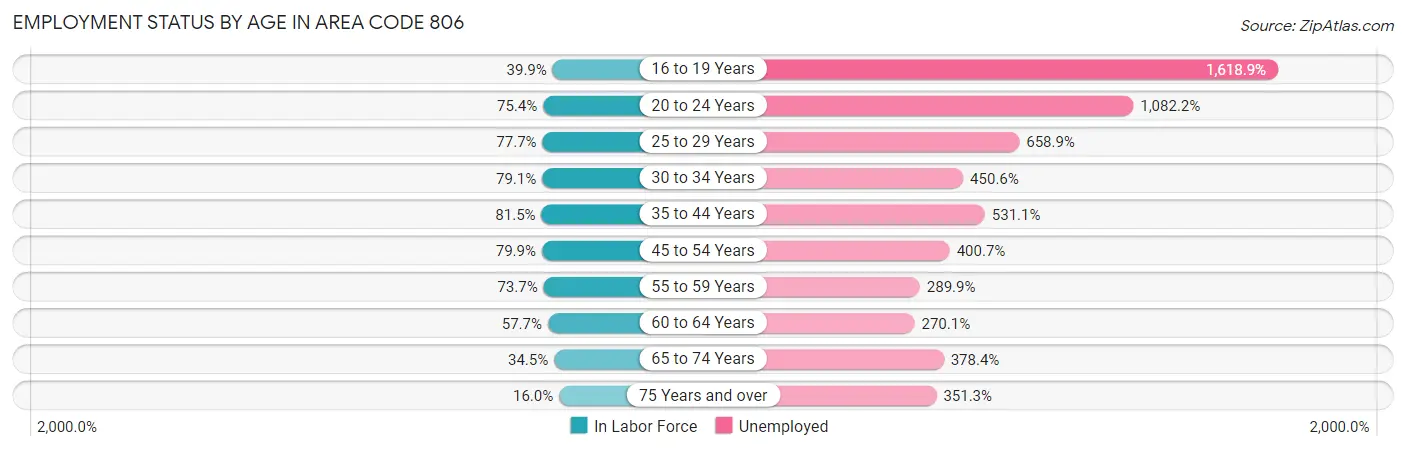
| Age Bracket | In Labor Force | Unemployed |
| 16 to 19 Years | 22,342 (39.9%) | 361,743 (1,618.9%) |
| 20 to 24 Years | 57,996 (75.4%) | 627,665 (1,082.2%) |
| 25 to 29 Years | 47,937 (77.7%) | 315,850 (658.9%) |
| 30 to 34 Years | 46,569 (79.0%) | 209,840 (450.6%) |
| 35 to 44 Years | 92,439 (81.5%) | 490,933 (531.1%) |
| 45 to 54 Years | 74,698 (79.9%) | 299,319 (400.7%) |
| 55 to 59 Years | 35,589 (73.7%) | 103,167 (289.9%) |
| 60 to 64 Years | 28,311 (57.7%) | 76,473 (270.1%) |
| 65 to 74 Years | 25,223 (34.5%) | 95,432 (378.4%) |
| 75 Years and over | 8,323 (16.0%) | 29,242 (351.3%) |
| Total | 407,482 (59.7%) | 19,093 (4.7%) |
Employment Status by Educational Attainment in Area Code 806
According to labor force statistics for Area Code 806, 74.4% of individuals (316,196) out of the total population between 25 and 64 years of age (424,881) are in the labor force, with 476.1% or 1,505,409 of them being unemployed. The group with the highest labor force participation rate are those with the educational attainment of bachelor's degree or higher, with 84.5% or 88,732 individuals in the labor force. Within the labor force, individuals with high school diploma education have the highest percentage of unemployment, with 664.0% or 592,175 of them being unemployed.
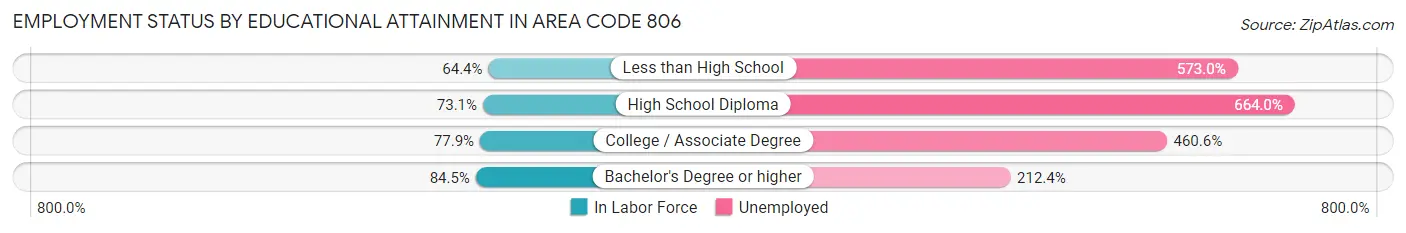
| Educational Attainment | In Labor Force | Unemployed |
| Less than High School | 41,498 (64.4%) | 369,138 (573.0%) |
| High School Diploma | 89,178 (73.1%) | 809,868 (664.0%) |
| College / Associate Degree | 103,951 (77.8%) | 615,048 (460.6%) |
| Bachelor's Degree or higher | 88,727 (84.5%) | 222,933 (212.4%) |
| Total | 316,178 (74.4%) | 2,022,858 (476.1%) |
Employment Occupations by Sex in Area Code 806
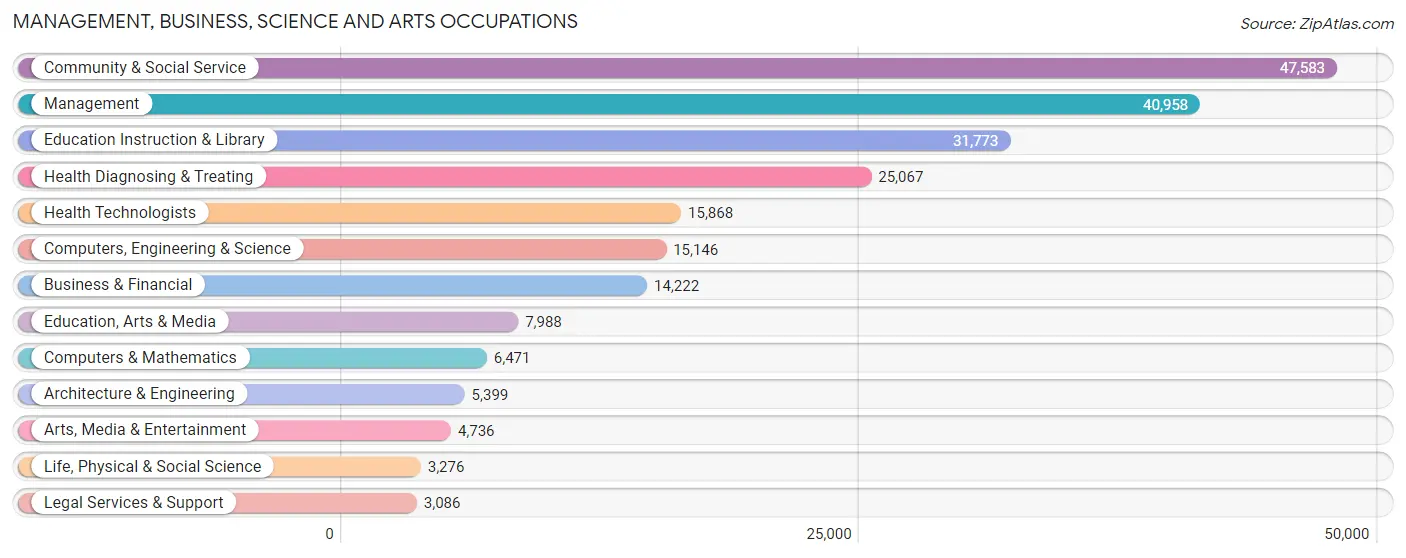
Management, Business, Science and Arts Occupations
The most common Management, Business, Science and Arts occupations in Area Code 806 are Community & Social Service (47,583 | 11.6%), Management (40,958 | 9.9%), Education Instruction & Library (31,773 | 7.7%), Health Diagnosing & Treating (25,067 | 6.1%), and Health Technologists (15,868 | 3.8%).
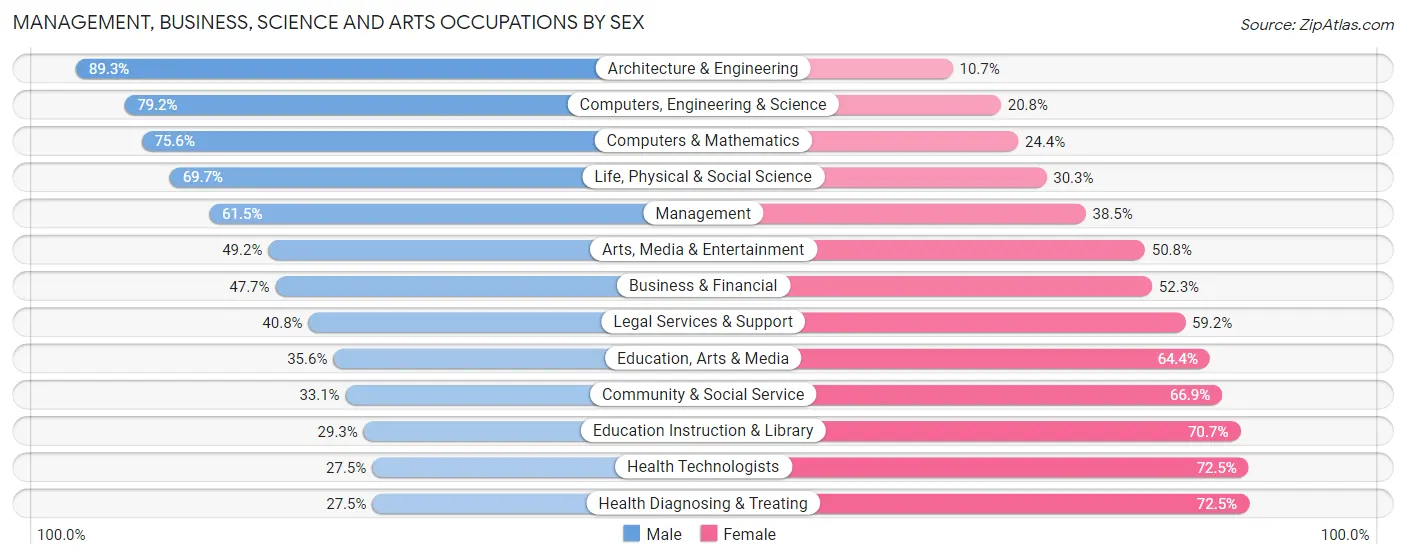
Management, Business, Science and Arts Occupations by Sex
Within the Management, Business, Science and Arts occupations in Area Code 806, the most male-oriented occupations are Architecture & Engineering (89.3%), Computers, Engineering & Science (79.2%), and Computers & Mathematics (75.6%), while the most female-oriented occupations are Health Diagnosing & Treating (72.5%), Health Technologists (72.5%), and Education Instruction & Library (70.7%).
| Occupation | Male | Female |
| Management | 25,197 (61.5%) | 15,761 (38.5%) |
| Business & Financial | 6,782 (47.7%) | 7,440 (52.3%) |
| Computers, Engineering & Science | 11,998 (79.2%) | 3,148 (20.8%) |
| Computers & Mathematics | 4,893 (75.6%) | 1,578 (24.4%) |
| Architecture & Engineering | 4,821 (89.3%) | 578 (10.7%) |
| Life, Physical & Social Science | 2,284 (69.7%) | 992 (30.3%) |
| Community & Social Service | 15,737 (33.1%) | 31,846 (66.9%) |
| Education, Arts & Media | 2,845 (35.6%) | 5,143 (64.4%) |
| Legal Services & Support | 1,259 (40.8%) | 1,827 (59.2%) |
| Education Instruction & Library | 9,304 (29.3%) | 22,469 (70.7%) |
| Arts, Media & Entertainment | 2,329 (49.2%) | 2,407 (50.8%) |
| Health Diagnosing & Treating | 6,885 (27.5%) | 18,182 (72.5%) |
| Health Technologists | 4,365 (27.5%) | 11,503 (72.5%) |
| Total (Category) | 66,599 (46.6%) | 76,377 (53.4%) |
| Total (Overall) | 224,250 (54.4%) | 187,705 (45.6%) |
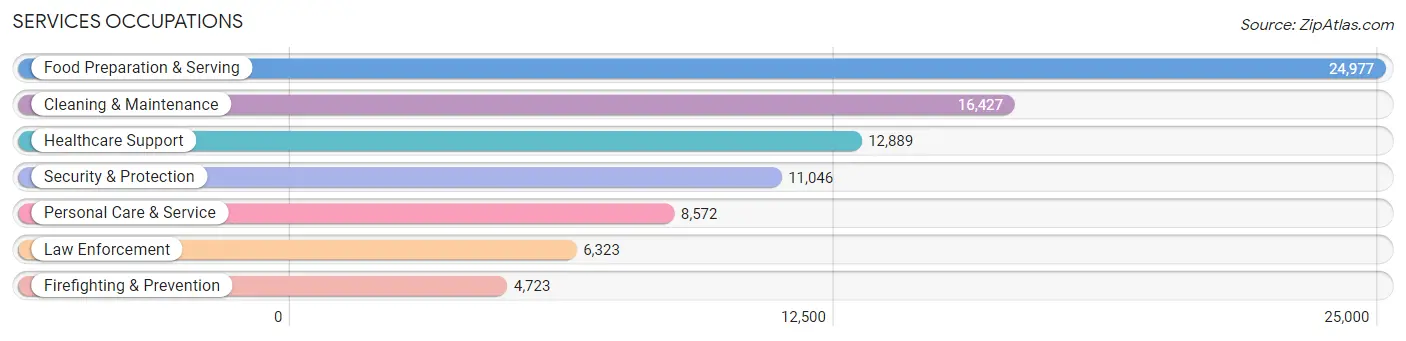
Services Occupations
The most common Services occupations in Area Code 806 are Food Preparation & Serving (24,977 | 6.1%), Cleaning & Maintenance (16,427 | 4.0%), Healthcare Support (12,889 | 3.1%), Security & Protection (11,046 | 2.7%), and Personal Care & Service (8,572 | 2.1%).
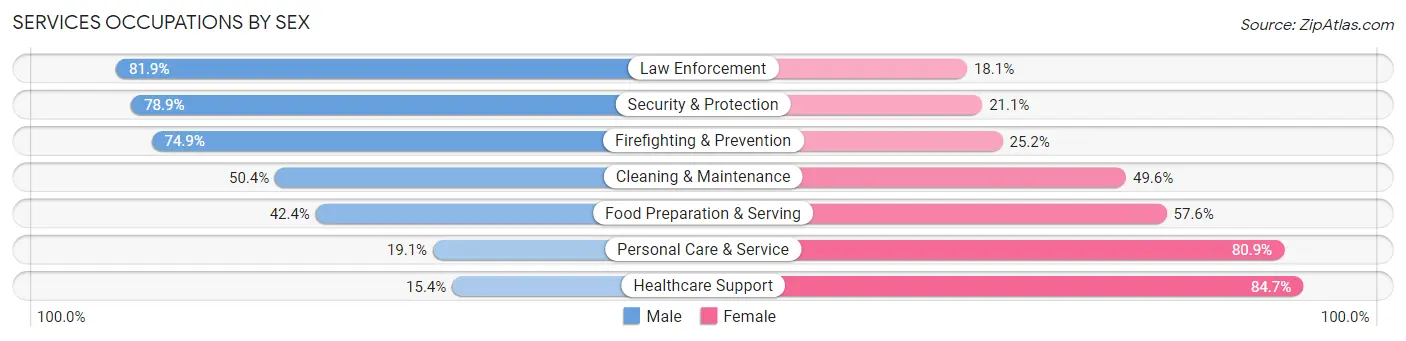
Services Occupations by Sex
Within the Services occupations in Area Code 806, the most male-oriented occupations are Law Enforcement (81.9%), Security & Protection (78.9%), and Firefighting & Prevention (74.9%), while the most female-oriented occupations are Healthcare Support (84.7%), Personal Care & Service (80.9%), and Food Preparation & Serving (57.6%).
| Occupation | Male | Female |
| Healthcare Support | 1,979 (15.3%) | 10,910 (84.7%) |
| Security & Protection | 8,713 (78.9%) | 2,333 (21.1%) |
| Firefighting & Prevention | 3,535 (74.9%) | 1,188 (25.2%) |
| Law Enforcement | 5,178 (81.9%) | 1,145 (18.1%) |
| Food Preparation & Serving | 10,581 (42.4%) | 14,396 (57.6%) |
| Cleaning & Maintenance | 8,280 (50.4%) | 8,147 (49.6%) |
| Personal Care & Service | 1,641 (19.1%) | 6,931 (80.9%) |
| Total (Category) | 31,194 (42.2%) | 42,717 (57.8%) |
| Total (Overall) | 224,250 (54.4%) | 187,705 (45.6%) |
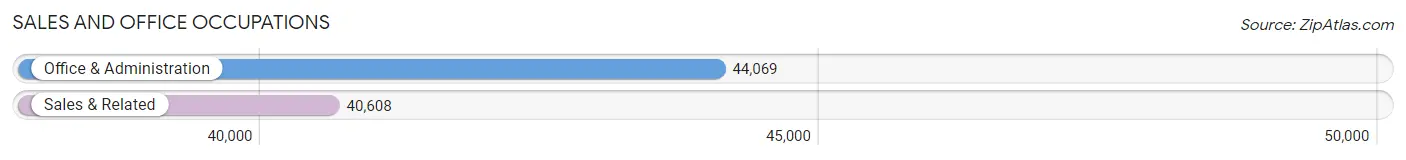
Sales and Office Occupations
The most common Sales and Office occupations in Area Code 806 are Office & Administration (44,069 | 10.7%), and Sales & Related (40,608 | 9.9%).
Sales and Office Occupations by Sex
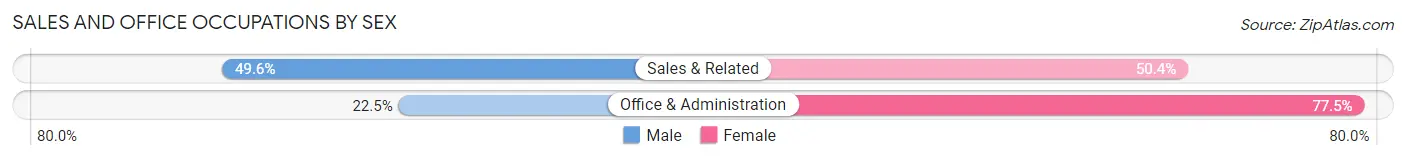
| Occupation | Male | Female |
| Sales & Related | 20,155 (49.6%) | 20,453 (50.4%) |
| Office & Administration | 9,908 (22.5%) | 34,161 (77.5%) |
| Total (Category) | 30,063 (35.5%) | 54,614 (64.5%) |
| Total (Overall) | 224,250 (54.4%) | 187,705 (45.6%) |
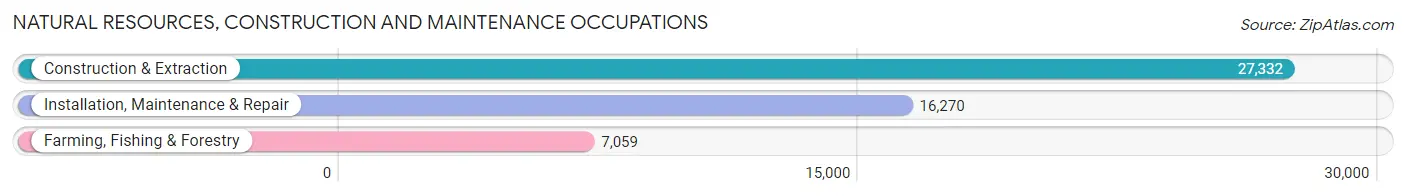
Natural Resources, Construction and Maintenance Occupations
The most common Natural Resources, Construction and Maintenance occupations in Area Code 806 are Construction & Extraction (27,332 | 6.6%), Installation, Maintenance & Repair (16,270 | 4.0%), and Farming, Fishing & Forestry (7,059 | 1.7%).
Natural Resources, Construction and Maintenance Occupations by Sex
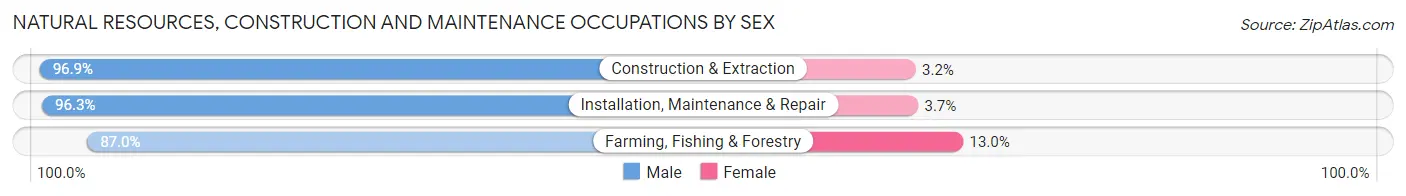
| Occupation | Male | Female |
| Farming, Fishing & Forestry | 6,139 (87.0%) | 920 (13.0%) |
| Construction & Extraction | 26,470 (96.9%) | 862 (3.2%) |
| Installation, Maintenance & Repair | 15,675 (96.3%) | 595 (3.7%) |
| Total (Category) | 48,284 (95.3%) | 2,377 (4.7%) |
| Total (Overall) | 224,250 (54.4%) | 187,705 (45.6%) |
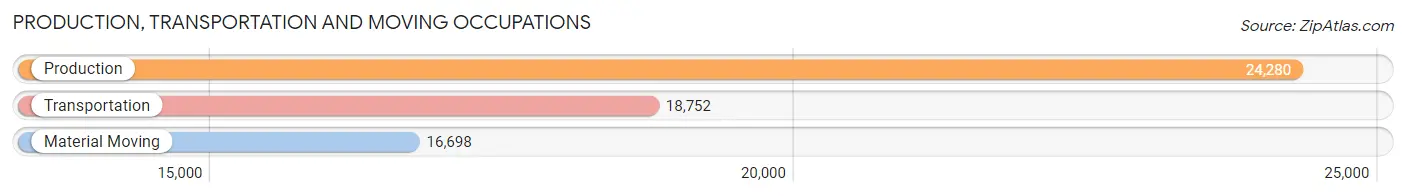
Production, Transportation and Moving Occupations
The most common Production, Transportation and Moving occupations in Area Code 806 are Production (24,280 | 5.9%), Transportation (18,752 | 4.5%), and Material Moving (16,698 | 4.1%).
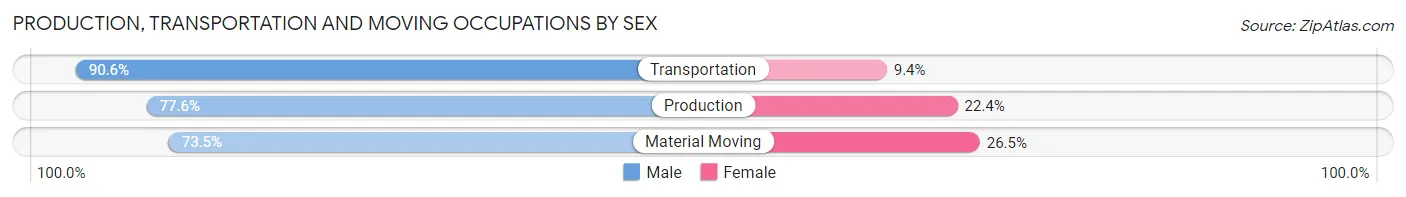
Production, Transportation and Moving Occupations by Sex
| Occupation | Male | Female |
| Production | 18,842 (77.6%) | 5,438 (22.4%) |
| Transportation | 16,990 (90.6%) | 1,762 (9.4%) |
| Material Moving | 12,278 (73.5%) | 4,420 (26.5%) |
| Total (Category) | 48,110 (80.5%) | 11,620 (19.5%) |
| Total (Overall) | 224,250 (54.4%) | 187,705 (45.6%) |
Employment Industries by Sex in Area Code 806
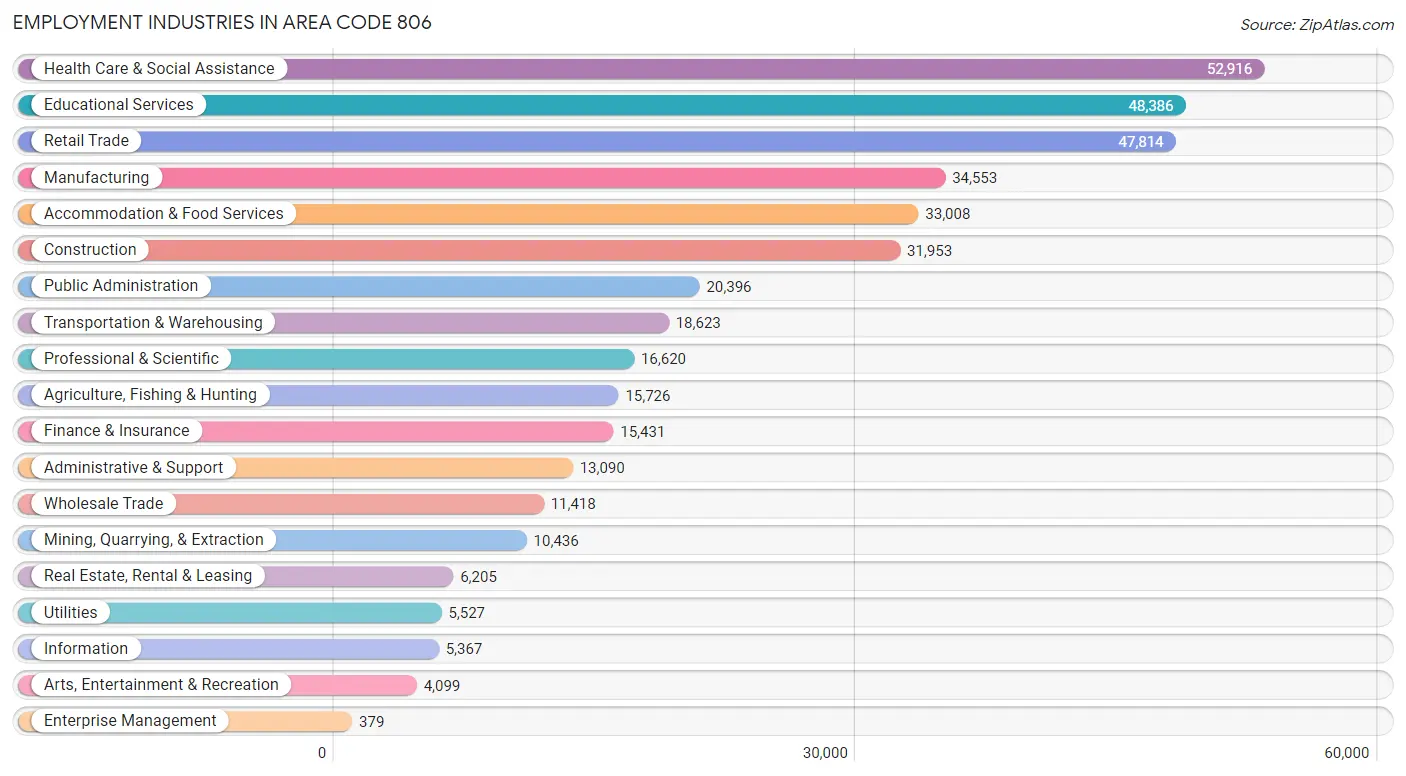
Employment Industries in Area Code 806
The major employment industries in Area Code 806 include Health Care & Social Assistance (52,916 | 12.9%), Educational Services (48,386 | 11.7%), Retail Trade (47,814 | 11.6%), Manufacturing (34,553 | 8.4%), and Accommodation & Food Services (33,008 | 8.0%).
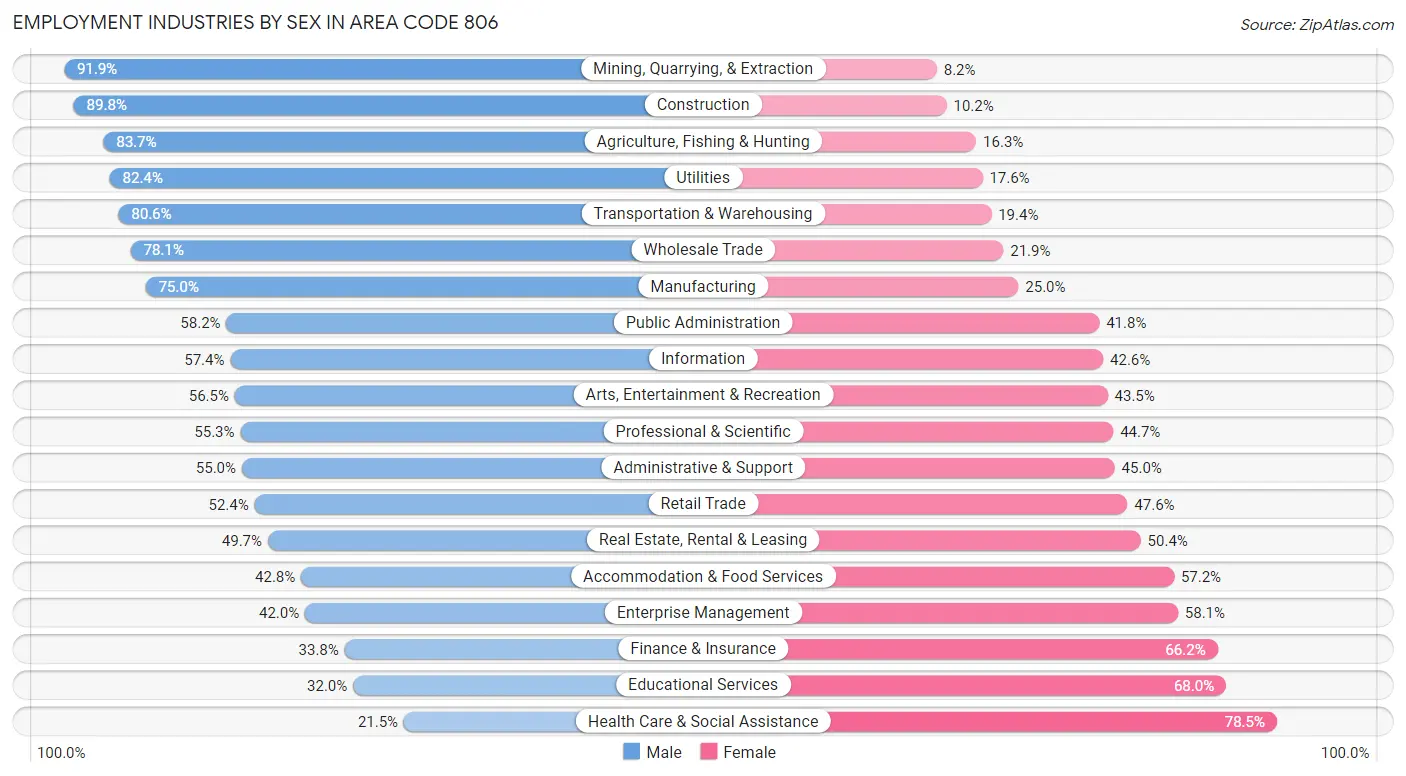
Employment Industries by Sex in Area Code 806
The Area Code 806 industries that see more men than women are Mining, Quarrying, & Extraction (91.8%), Construction (89.8%), and Agriculture, Fishing & Hunting (83.7%), whereas the industries that tend to have a higher number of women are Health Care & Social Assistance (78.5%), Educational Services (68.0%), and Finance & Insurance (66.2%).
| Industry | Male | Female |
| Agriculture, Fishing & Hunting | 13,163 (83.7%) | 2,563 (16.3%) |
| Mining, Quarrying, & Extraction | 9,585 (91.8%) | 851 (8.2%) |
| Construction | 28,707 (89.8%) | 3,246 (10.2%) |
| Manufacturing | 25,905 (75.0%) | 8,648 (25.0%) |
| Wholesale Trade | 8,915 (78.1%) | 2,503 (21.9%) |
| Retail Trade | 25,054 (52.4%) | 22,760 (47.6%) |
| Transportation & Warehousing | 15,006 (80.6%) | 3,617 (19.4%) |
| Utilities | 4,554 (82.4%) | 973 (17.6%) |
| Information | 3,082 (57.4%) | 2,285 (42.6%) |
| Finance & Insurance | 5,209 (33.8%) | 10,222 (66.2%) |
| Real Estate, Rental & Leasing | 3,081 (49.6%) | 3,124 (50.3%) |
| Professional & Scientific | 9,197 (55.3%) | 7,423 (44.7%) |
| Enterprise Management | 159 (41.9%) | 220 (58.1%) |
| Administrative & Support | 7,204 (55.0%) | 5,886 (45.0%) |
| Educational Services | 15,485 (32.0%) | 32,901 (68.0%) |
| Health Care & Social Assistance | 11,366 (21.5%) | 41,550 (78.5%) |
| Arts, Entertainment & Recreation | 2,316 (56.5%) | 1,783 (43.5%) |
| Accommodation & Food Services | 14,113 (42.8%) | 18,895 (57.2%) |
| Public Administration | 11,876 (58.2%) | 8,520 (41.8%) |
| Total | 224,250 (54.4%) | 187,705 (45.6%) |
Education in Area Code 806
School Enrollment in Area Code 806
The most common levels of schooling among the 244,775 students in Area Code 806 are college / undergraduate (57,991 | 23.7%), elementary school (50,900 | 20.8%), and middle school (49,591 | 20.3%).
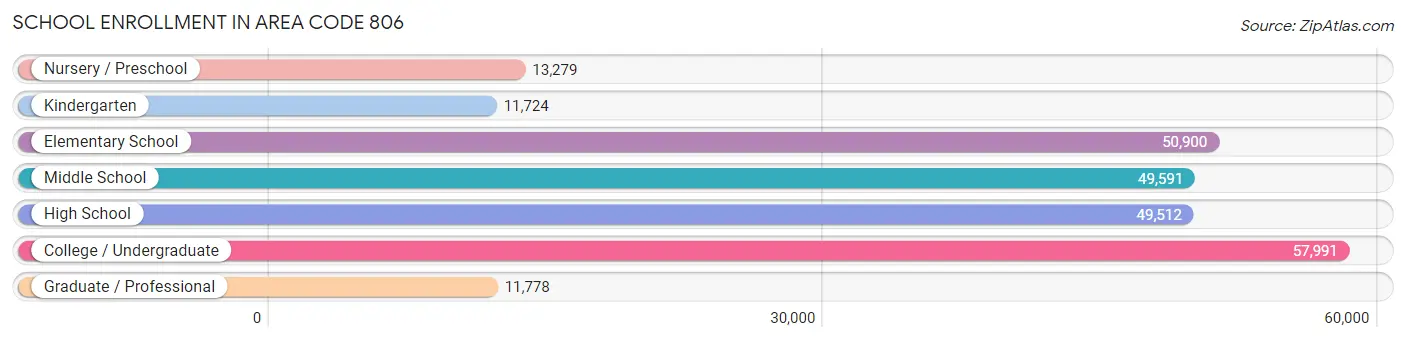
| School Level | # Students | % Students |
| Nursery / Preschool | 13,279 | 5.4% |
| Kindergarten | 11,724 | 4.8% |
| Elementary School | 50,900 | 20.8% |
| Middle School | 49,591 | 20.3% |
| High School | 49,512 | 20.2% |
| College / Undergraduate | 57,991 | 23.7% |
| Graduate / Professional | 11,778 | 4.8% |
| Total | 244,775 | 100.0% |
School Enrollment by Age by Funding Source in Area Code 806
Out of a total of 244,775 students who are enrolled in schools in Area Code 806, 22,848 (9.3%) attend a private institution, while the remaining 221,927 (90.7%) are enrolled in public schools. The age group of 3 to 4 year olds has the highest likelihood of being enrolled in private schools, with 2,979 (29.6% in the age bracket) enrolled. Conversely, the age group of 15 to 17 year olds has the lowest likelihood of being enrolled in a private school, with 33,707 (93.6% in the age bracket) attending a public institution.
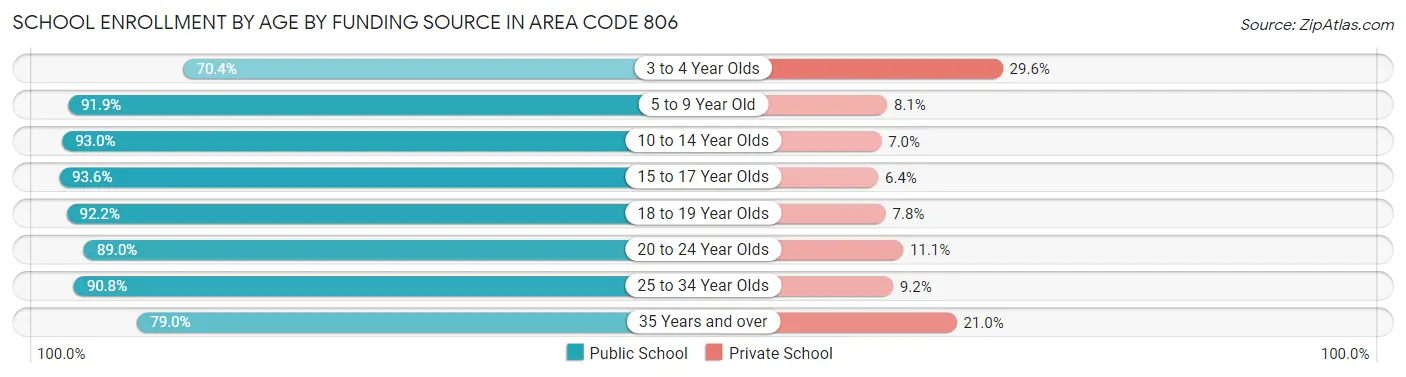
| Age Bracket | Public School | Private School |
| 3 to 4 Year Olds | 7,083 (70.4%) | 2,979 (29.6%) |
| 5 to 9 Year Old | 54,146 (91.9%) | 4,761 (8.1%) |
| 10 to 14 Year Olds | 57,246 (93.0%) | 4,316 (7.0%) |
| 15 to 17 Year Olds | 33,707 (93.6%) | 2,312 (6.4%) |
| 18 to 19 Year Olds | 20,889 (92.2%) | 1,772 (7.8%) |
| 20 to 24 Year Olds | 29,489 (88.9%) | 3,663 (11.1%) |
| 25 to 34 Year Olds | 12,712 (90.8%) | 1,283 (9.2%) |
| 35 Years and over | 6,649 (79.0%) | 1,768 (21.0%) |
| Total | 221,927 (90.7%) | 22,848 (9.3%) |
Educational Attainment by Field of Study in Area Code 806
Business (26,593 | 18.4%), education (25,559 | 17.7%), science & technology (15,593 | 10.8%), bio, nature & agricultural (15,589 | 10.8%), and arts & humanities (11,679 | 8.1%) are the most common fields of study among 144,331 individuals in Area Code 806 who have obtained a bachelor's degree or higher.
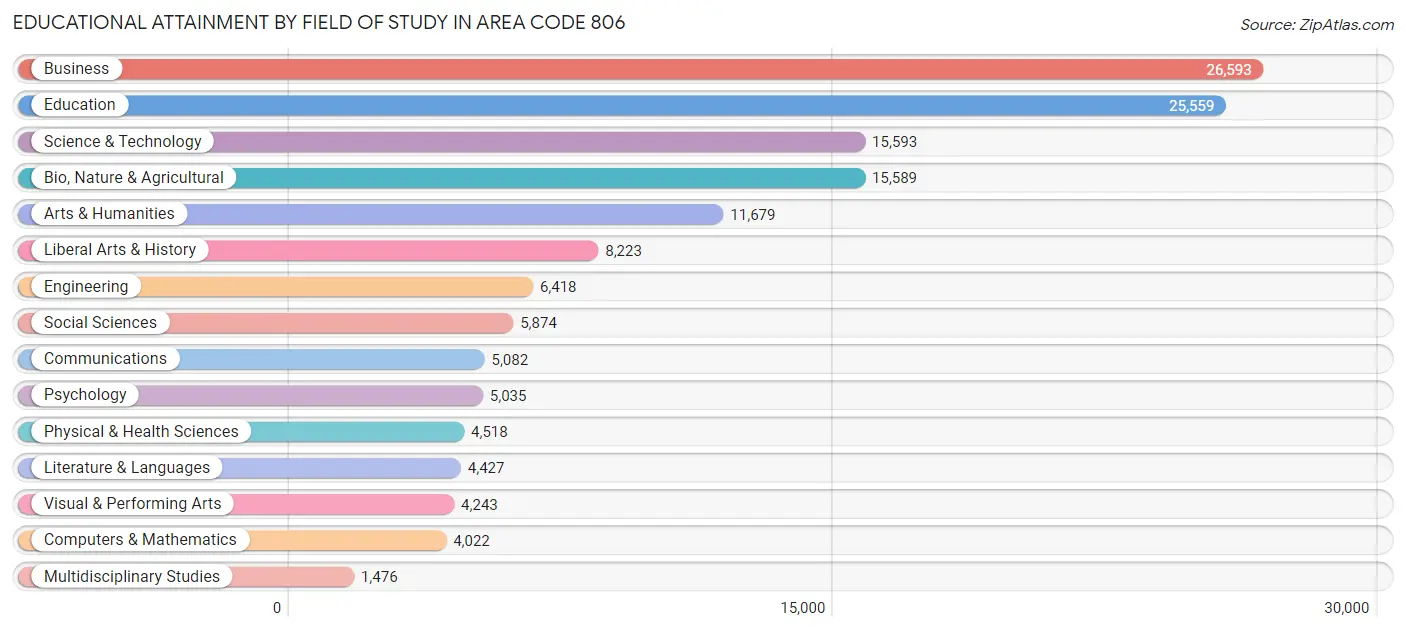
| Field of Study | # Graduates | % Graduates |
| Computers & Mathematics | 4,022 | 2.8% |
| Bio, Nature & Agricultural | 15,589 | 10.8% |
| Physical & Health Sciences | 4,518 | 3.1% |
| Psychology | 5,035 | 3.5% |
| Social Sciences | 5,874 | 4.1% |
| Engineering | 6,418 | 4.4% |
| Multidisciplinary Studies | 1,476 | 1.0% |
| Science & Technology | 15,593 | 10.8% |
| Business | 26,593 | 18.4% |
| Education | 25,559 | 17.7% |
| Literature & Languages | 4,427 | 3.1% |
| Liberal Arts & History | 8,223 | 5.7% |
| Visual & Performing Arts | 4,243 | 2.9% |
| Communications | 5,082 | 3.5% |
| Arts & Humanities | 11,679 | 8.1% |
| Total | 144,331 | 100.0% |
Transportation & Commute in Area Code 806
Vehicle Availability by Sex in Area Code 806
The most prevalent vehicle ownership categories in Area Code 806 are males with 2 vehicles (92,565, accounting for 41.9%) and females with 2 vehicles (74,483, making up 50.9%).
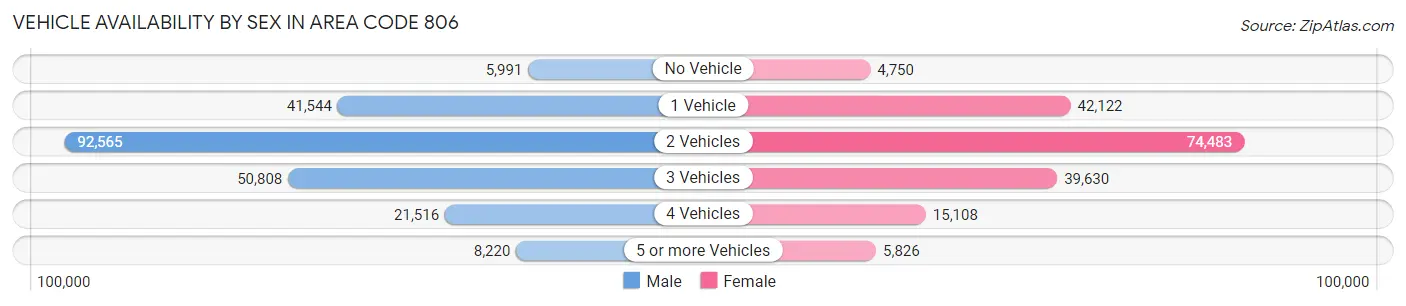
| Vehicles Available | Male | Female |
| No Vehicle | 5,991 (2.7%) | 4,750 (2.6%) |
| 1 Vehicle | 41,544 (18.8%) | 42,122 (23.2%) |
| 2 Vehicles | 92,565 (41.9%) | 74,483 (40.9%) |
| 3 Vehicles | 50,808 (23.0%) | 39,630 (21.8%) |
| 4 Vehicles | 21,516 (9.8%) | 15,108 (8.3%) |
| 5 or more Vehicles | 8,220 (3.7%) | 5,826 (3.2%) |
| Total | 220,644 (100.0%) | 181,919 (100.0%) |
Commute Time in Area Code 806
The most frequently occuring commute durations in Area Code 806 are 15 to 19 minutes (88,912 commuters, 23.0%), 10 to 14 minutes (78,598 commuters, 20.4%), and 5 to 9 minutes (70,758 commuters, 18.3%).
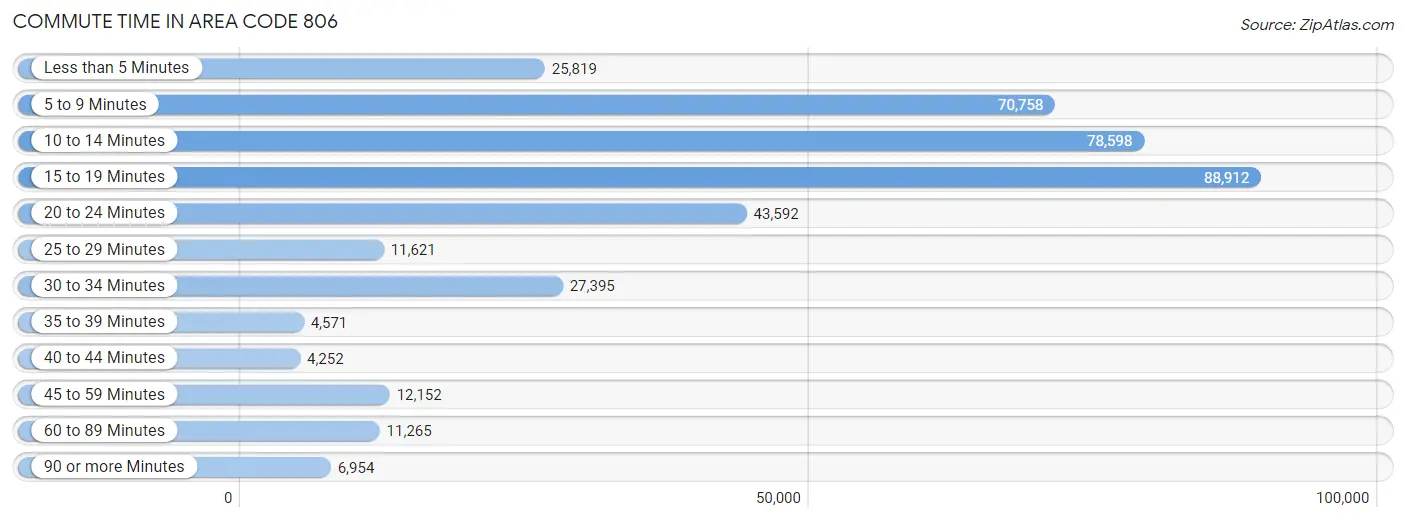
| Commute Time | # Commuters | % Commuters |
| Less than 5 Minutes | 25,819 | 6.7% |
| 5 to 9 Minutes | 70,758 | 18.3% |
| 10 to 14 Minutes | 78,598 | 20.4% |
| 15 to 19 Minutes | 88,912 | 23.0% |
| 20 to 24 Minutes | 43,592 | 11.3% |
| 25 to 29 Minutes | 11,621 | 3.0% |
| 30 to 34 Minutes | 27,395 | 7.1% |
| 35 to 39 Minutes | 4,571 | 1.2% |
| 40 to 44 Minutes | 4,252 | 1.1% |
| 45 to 59 Minutes | 12,152 | 3.2% |
| 60 to 89 Minutes | 11,265 | 2.9% |
| 90 or more Minutes | 6,954 | 1.8% |
Commute Time by Sex in Area Code 806
The most common commute times in Area Code 806 are 15 to 19 minutes (48,407 commuters, 22.9%) for males and 15 to 19 minutes (40,505 commuters, 23.3%) for females.
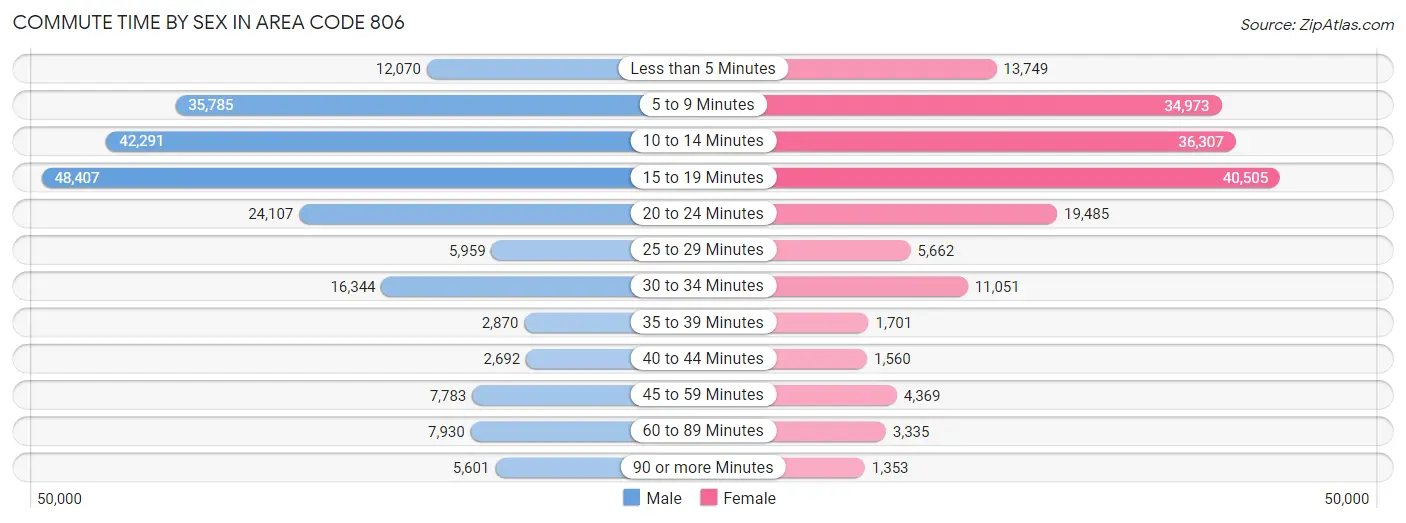
| Commute Time | Male | Female |
| Less than 5 Minutes | 12,070 (5.7%) | 13,749 (7.9%) |
| 5 to 9 Minutes | 35,785 (16.9%) | 34,973 (20.1%) |
| 10 to 14 Minutes | 42,291 (20.0%) | 36,307 (20.9%) |
| 15 to 19 Minutes | 48,407 (22.9%) | 40,505 (23.3%) |
| 20 to 24 Minutes | 24,107 (11.4%) | 19,485 (11.2%) |
| 25 to 29 Minutes | 5,959 (2.8%) | 5,662 (3.3%) |
| 30 to 34 Minutes | 16,344 (7.7%) | 11,051 (6.4%) |
| 35 to 39 Minutes | 2,870 (1.3%) | 1,701 (1.0%) |
| 40 to 44 Minutes | 2,692 (1.3%) | 1,560 (0.9%) |
| 45 to 59 Minutes | 7,783 (3.7%) | 4,369 (2.5%) |
| 60 to 89 Minutes | 7,930 (3.7%) | 3,335 (1.9%) |
| 90 or more Minutes | 5,601 (2.6%) | 1,353 (0.8%) |
Time of Departure to Work by Sex in Area Code 806
The most frequent times of departure to work in Area Code 806 are 7:00 AM to 7:29 AM (34,125, 16.1%) for males and 7:30 AM to 7:59 AM (35,999, 20.7%) for females.
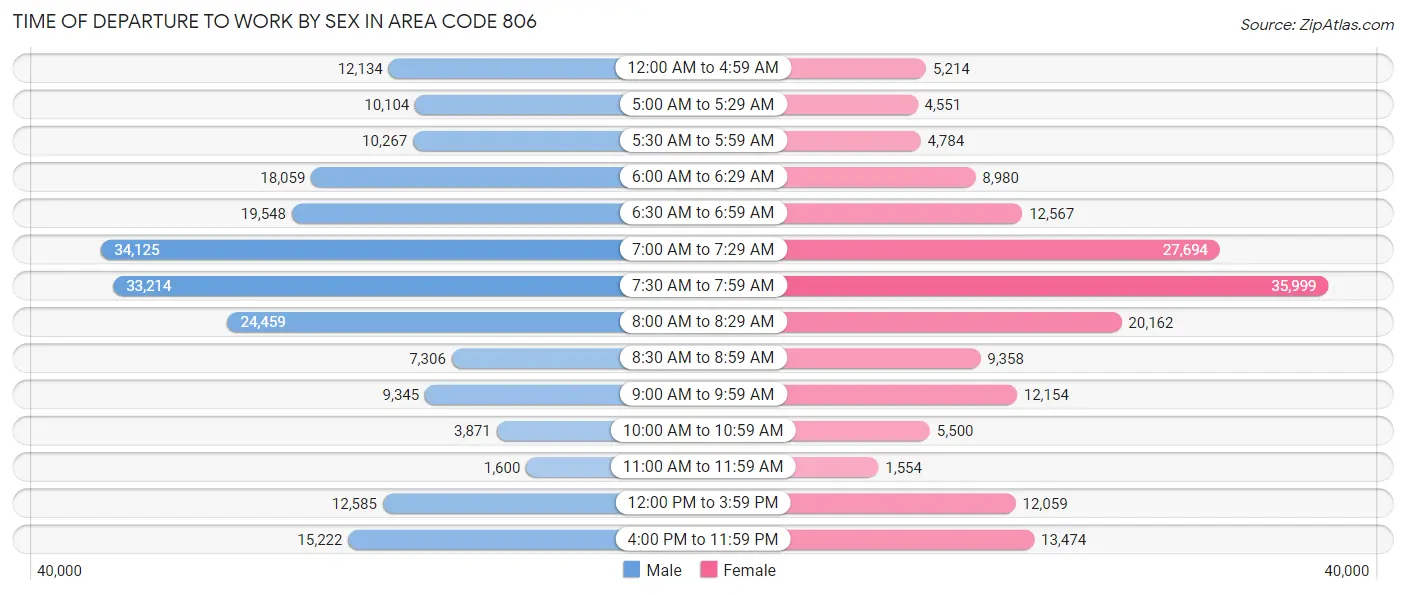
| Time of Departure | Male | Female |
| 12:00 AM to 4:59 AM | 12,134 (5.7%) | 5,214 (3.0%) |
| 5:00 AM to 5:29 AM | 10,104 (4.8%) | 4,551 (2.6%) |
| 5:30 AM to 5:59 AM | 10,267 (4.9%) | 4,784 (2.8%) |
| 6:00 AM to 6:29 AM | 18,059 (8.5%) | 8,980 (5.2%) |
| 6:30 AM to 6:59 AM | 19,548 (9.2%) | 12,567 (7.2%) |
| 7:00 AM to 7:29 AM | 34,125 (16.1%) | 27,694 (15.9%) |
| 7:30 AM to 7:59 AM | 33,214 (15.7%) | 35,999 (20.7%) |
| 8:00 AM to 8:29 AM | 24,459 (11.6%) | 20,162 (11.6%) |
| 8:30 AM to 8:59 AM | 7,306 (3.5%) | 9,358 (5.4%) |
| 9:00 AM to 9:59 AM | 9,345 (4.4%) | 12,154 (7.0%) |
| 10:00 AM to 10:59 AM | 3,871 (1.8%) | 5,500 (3.2%) |
| 11:00 AM to 11:59 AM | 1,600 (0.8%) | 1,554 (0.9%) |
| 12:00 PM to 3:59 PM | 12,585 (5.9%) | 12,059 (6.9%) |
| 4:00 PM to 11:59 PM | 15,222 (7.2%) | 13,474 (7.7%) |
| Total | 211,839 (100.0%) | 174,050 (100.0%) |
Housing Occupancy in Area Code 806
Occupancy by Ownership in Area Code 806
Of the total 327,024 dwellings in Area Code 806, owner-occupied units account for 205,516 (62.8%), while renter-occupied units make up 121,508 (37.2%).
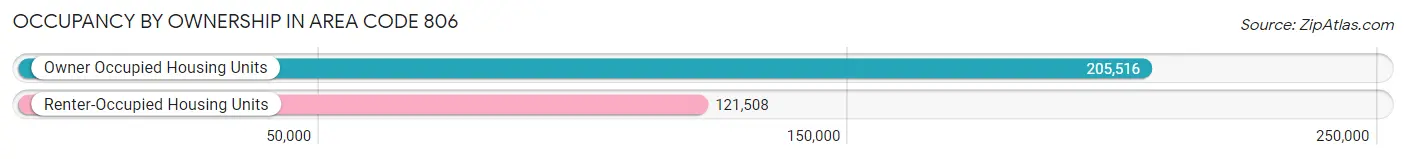
| Occupancy | # Housing Units | % Housing Units |
| Owner Occupied Housing Units | 205,516 | 62.8% |
| Renter-Occupied Housing Units | 121,508 | 37.2% |
| Total Occupied Housing Units | 327,024 | 100.0% |
Occupancy by Household Size in Area Code 806
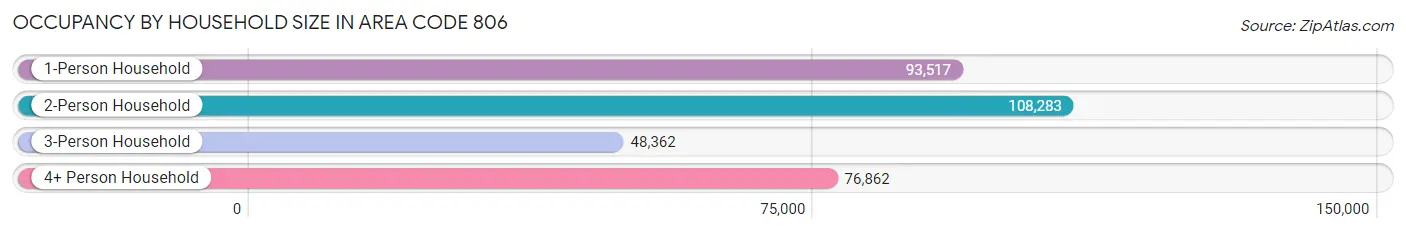
| Household Size | # Housing Units | % Housing Units |
| 1-Person Household | 93,517 | 28.6% |
| 2-Person Household | 108,283 | 33.1% |
| 3-Person Household | 48,362 | 14.8% |
| 4+ Person Household | 76,862 | 23.5% |
| Total Housing Units | 327,024 | 100.0% |
Occupancy by Ownership by Household Size in Area Code 806
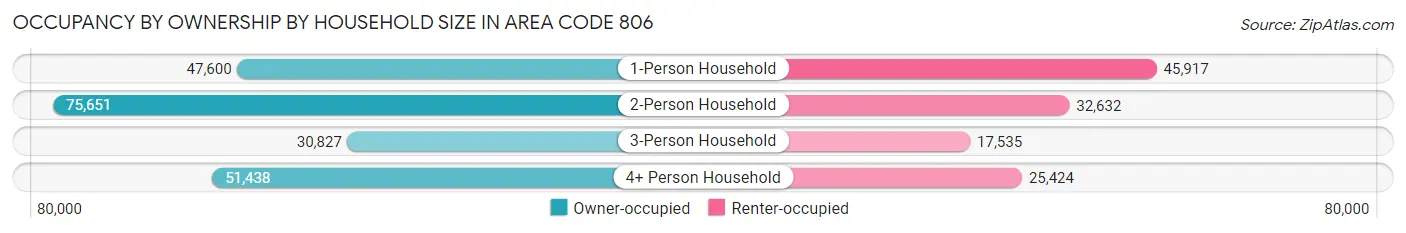
| Household Size | Owner-occupied | Renter-occupied |
| 1-Person Household | 47,600 (50.9%) | 45,917 (49.1%) |
| 2-Person Household | 75,651 (69.9%) | 32,632 (30.1%) |
| 3-Person Household | 30,827 (63.7%) | 17,535 (36.3%) |
| 4+ Person Household | 51,438 (66.9%) | 25,424 (33.1%) |
| Total Housing Units | 205,516 (62.8%) | 121,508 (37.2%) |
Occupancy by Educational Attainment in Area Code 806
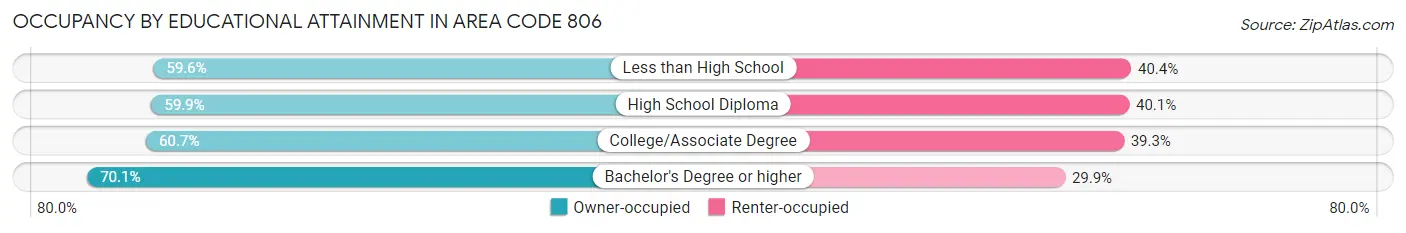
| Household Size | Owner-occupied | Renter-occupied |
| Less than High School | 26,963 (59.6%) | 18,302 (40.4%) |
| High School Diploma | 50,574 (59.9%) | 33,867 (40.1%) |
| College/Associate Degree | 66,912 (60.7%) | 43,242 (39.3%) |
| Bachelor's Degree or higher | 61,067 (70.1%) | 26,097 (29.9%) |
Occupancy by Age of Householder in Area Code 806
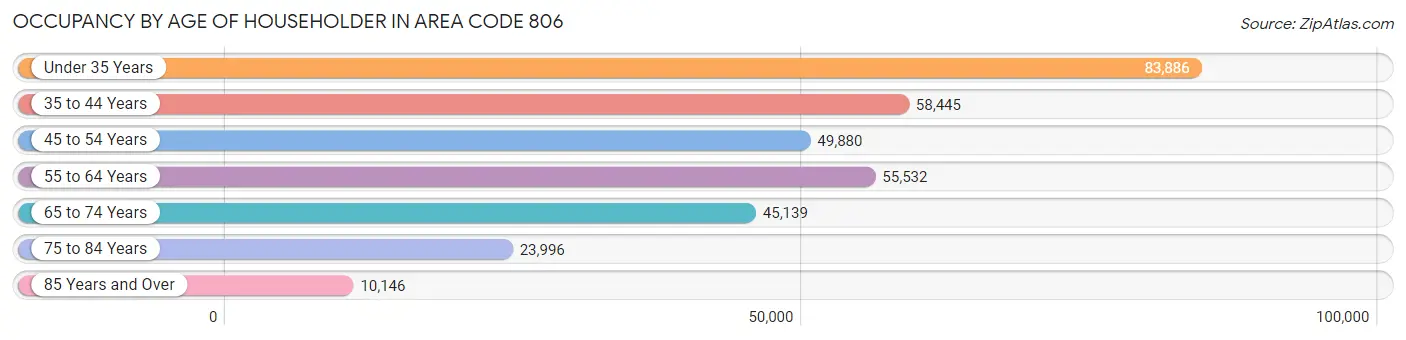
| Age Bracket | # Households | % Households |
| Under 35 Years | 83,886 | 25.7% |
| 35 to 44 Years | 58,445 | 17.9% |
| 45 to 54 Years | 49,880 | 15.2% |
| 55 to 64 Years | 55,532 | 17.0% |
| 65 to 74 Years | 45,139 | 13.8% |
| 75 to 84 Years | 23,996 | 7.3% |
| 85 Years and Over | 10,146 | 3.1% |
| Total | 327,024 | 100.0% |
Housing Finances in Area Code 806
Median Income by Occupancy in Area Code 806
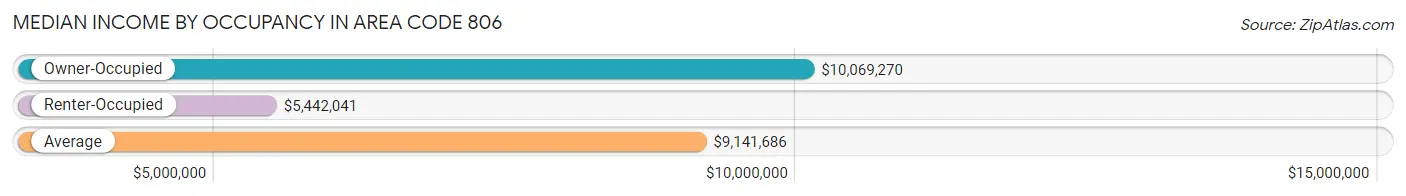
| Occupancy Type | # Households | Median Income |
| Owner-Occupied | 205,516 (62.8%) | $10,069,270 |
| Renter-Occupied | 121,508 (37.2%) | $5,442,041 |
| Average | 327,024 (100.0%) | $9,141,686 |
Occupancy by Householder Income Bracket in Area Code 806
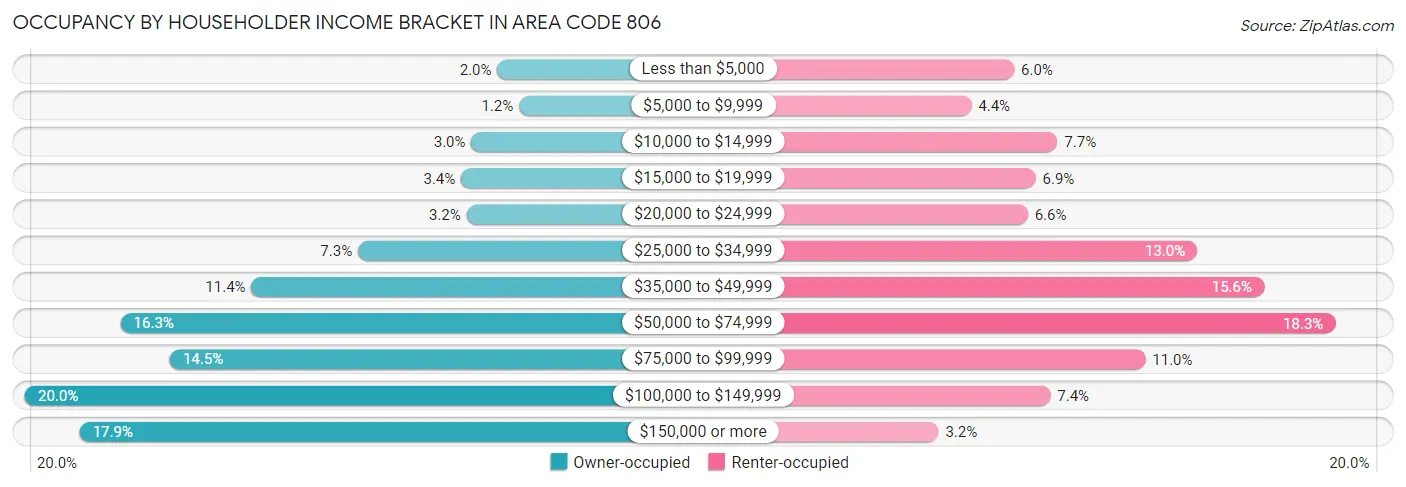
| Income Bracket | Owner-occupied | Renter-occupied |
| Less than $5,000 | 4,083 (2.0%) | 7,336 (6.0%) |
| $5,000 to $9,999 | 2,393 (1.2%) | 5,361 (4.4%) |
| $10,000 to $14,999 | 6,131 (3.0%) | 9,344 (7.7%) |
| $15,000 to $19,999 | 6,932 (3.4%) | 8,334 (6.9%) |
| $20,000 to $24,999 | 6,496 (3.2%) | 7,966 (6.6%) |
| $25,000 to $34,999 | 14,997 (7.3%) | 15,812 (13.0%) |
| $35,000 to $49,999 | 23,347 (11.4%) | 18,893 (15.5%) |
| $50,000 to $74,999 | 33,584 (16.3%) | 22,194 (18.3%) |
| $75,000 to $99,999 | 29,717 (14.5%) | 13,409 (11.0%) |
| $100,000 to $149,999 | 41,057 (20.0%) | 9,020 (7.4%) |
| $150,000 or more | 36,779 (17.9%) | 3,839 (3.2%) |
| Total | 205,516 (100.0%) | 121,508 (100.0%) |
Monthly Housing Cost Tiers in Area Code 806
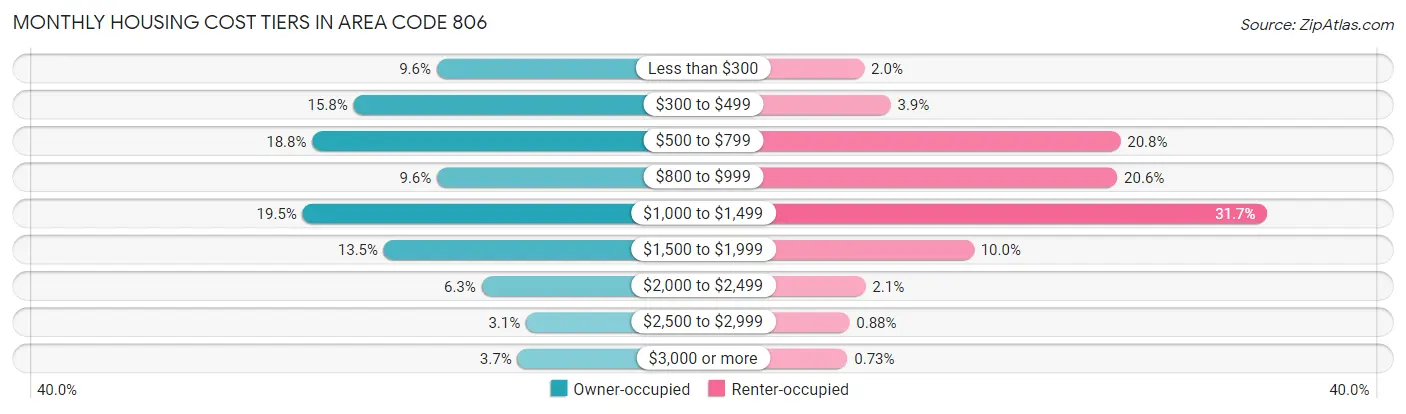
| Monthly Cost | Owner-occupied | Renter-occupied |
| Less than $300 | 19,802 (9.6%) | 2,397 (2.0%) |
| $300 to $499 | 32,405 (15.8%) | 4,754 (3.9%) |
| $500 to $799 | 38,652 (18.8%) | 25,306 (20.8%) |
| $800 to $999 | 19,779 (9.6%) | 25,031 (20.6%) |
| $1,000 to $1,499 | 40,117 (19.5%) | 38,467 (31.7%) |
| $1,500 to $1,999 | 27,821 (13.5%) | 12,196 (10.0%) |
| $2,000 to $2,499 | 13,020 (6.3%) | 2,507 (2.1%) |
| $2,500 to $2,999 | 6,316 (3.1%) | 1,071 (0.9%) |
| $3,000 or more | 7,604 (3.7%) | 886 (0.7%) |
| Total | 205,516 (100.0%) | 121,508 (100.0%) |
Physical Housing Characteristics in Area Code 806
Housing Structures in Area Code 806
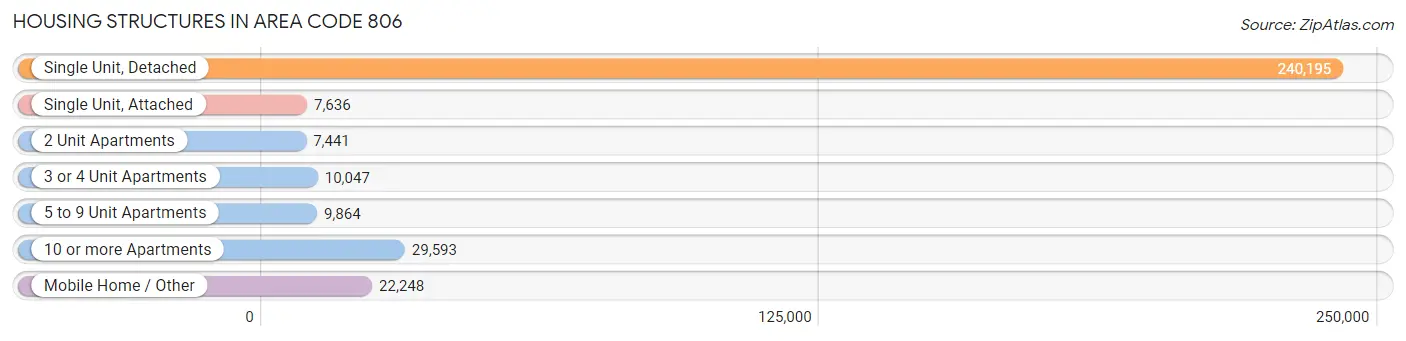
| Structure Type | # Housing Units | % Housing Units |
| Single Unit, Detached | 240,195 | 73.5% |
| Single Unit, Attached | 7,636 | 2.3% |
| 2 Unit Apartments | 7,441 | 2.3% |
| 3 or 4 Unit Apartments | 10,047 | 3.1% |
| 5 to 9 Unit Apartments | 9,864 | 3.0% |
| 10 or more Apartments | 29,593 | 9.0% |
| Mobile Home / Other | 22,248 | 6.8% |
| Total | 327,024 | 100.0% |
Housing Structures by Occupancy in Area Code 806
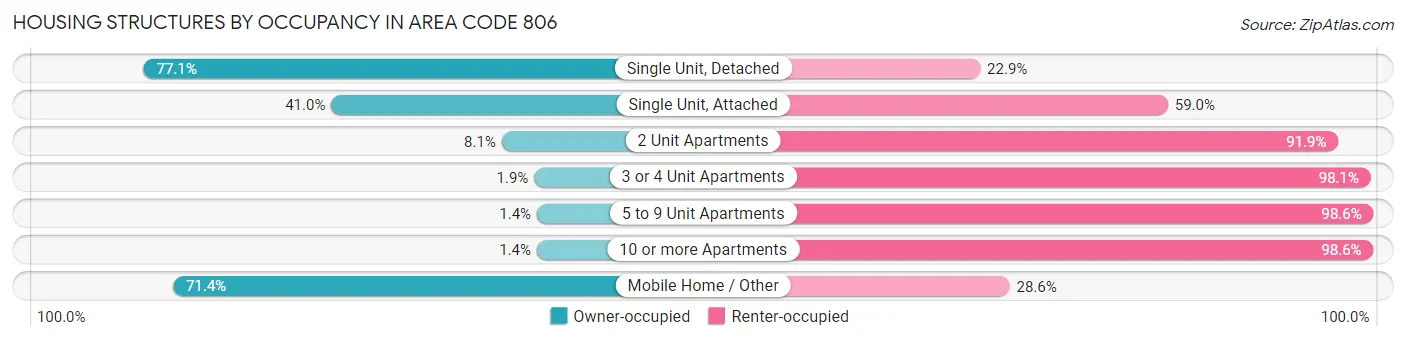
| Structure Type | Owner-occupied | Renter-occupied |
| Single Unit, Detached | 185,161 (77.1%) | 55,034 (22.9%) |
| Single Unit, Attached | 3,128 (41.0%) | 4,508 (59.0%) |
| 2 Unit Apartments | 606 (8.1%) | 6,835 (91.9%) |
| 3 or 4 Unit Apartments | 190 (1.9%) | 9,857 (98.1%) |
| 5 to 9 Unit Apartments | 134 (1.4%) | 9,730 (98.6%) |
| 10 or more Apartments | 406 (1.4%) | 29,187 (98.6%) |
| Mobile Home / Other | 15,891 (71.4%) | 6,357 (28.6%) |
| Total | 205,516 (62.8%) | 121,508 (37.2%) |
Housing Structures by Number of Rooms in Area Code 806
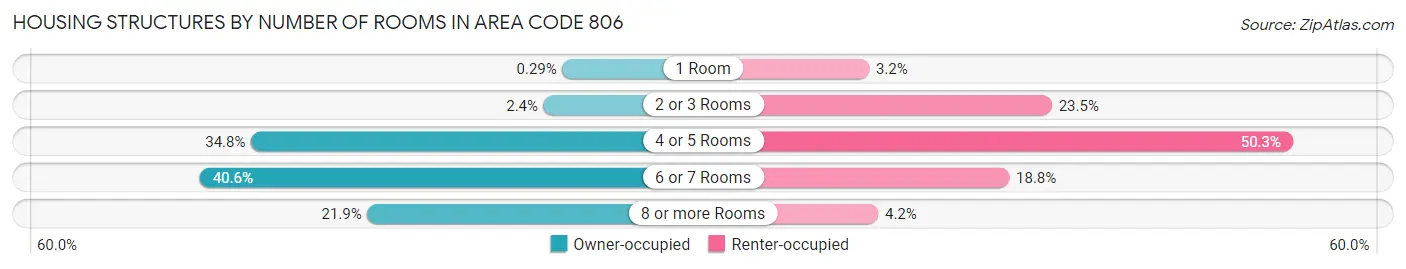
| Number of Rooms | Owner-occupied | Renter-occupied |
| 1 Room | 605 (0.3%) | 3,908 (3.2%) |
| 2 or 3 Rooms | 4,868 (2.4%) | 28,572 (23.5%) |
| 4 or 5 Rooms | 71,605 (34.8%) | 61,072 (50.3%) |
| 6 or 7 Rooms | 83,348 (40.6%) | 22,817 (18.8%) |
| 8 or more Rooms | 45,090 (21.9%) | 5,139 (4.2%) |
| Total | 205,516 (100.0%) | 121,508 (100.0%) |
Housing Structure by Heating Type in Area Code 806
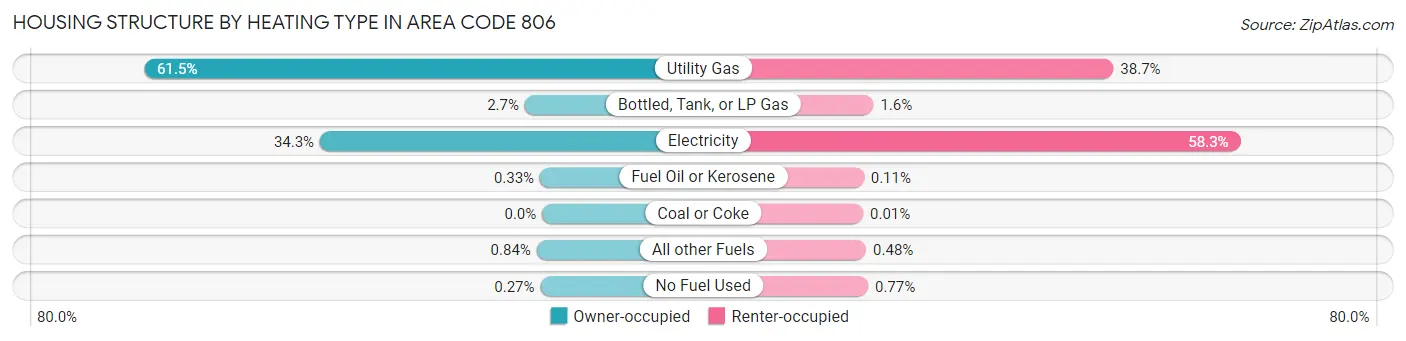
| Heating Type | Owner-occupied | Renter-occupied |
| Utility Gas | 126,470 (61.5%) | 47,018 (38.7%) |
| Bottled, Tank, or LP Gas | 5,513 (2.7%) | 1,952 (1.6%) |
| Electricity | 70,574 (34.3%) | 70,871 (58.3%) |
| Fuel Oil or Kerosene | 668 (0.3%) | 132 (0.1%) |
| Coal or Coke | 0 (0.0%) | 16 (0.0%) |
| All other Fuels | 1,736 (0.8%) | 581 (0.5%) |
| No Fuel Used | 555 (0.3%) | 938 (0.8%) |
| Total | 205,516 (100.0%) | 121,508 (100.0%) |
Household Vehicle Usage in Area Code 806
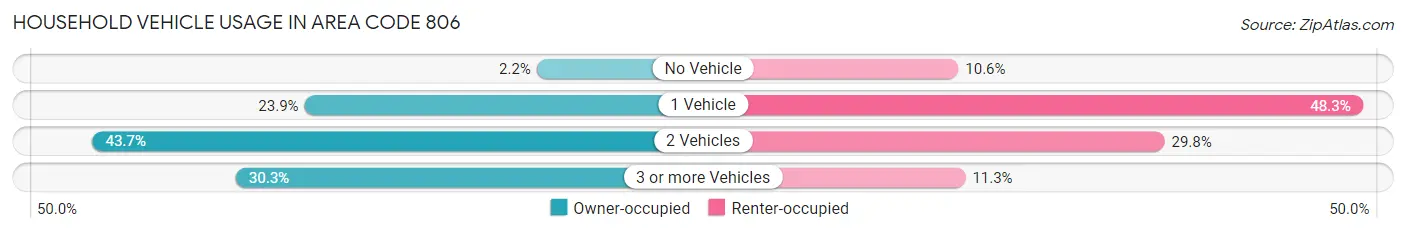
| Vehicles per Household | Owner-occupied | Renter-occupied |
| No Vehicle | 4,515 (2.2%) | 12,870 (10.6%) |
| 1 Vehicle | 49,068 (23.9%) | 58,703 (48.3%) |
| 2 Vehicles | 89,718 (43.6%) | 36,261 (29.8%) |
| 3 or more Vehicles | 62,215 (30.3%) | 13,674 (11.3%) |
| Total | 205,516 (100.0%) | 121,508 (100.0%) |
Real Estate & Mortgages in Area Code 806
Real Estate and Mortgage Overview in Area Code 806
| Characteristic | Without Mortgage | With Mortgage |
| Housing Units | 105,926 | 99,590 |
| Median Property Value | $14,301,800 | $17,588,900 |
| Median Household Income | $8,176,896 | $24,080 |
| Monthly Housing Costs | $67,190 | $7,294 |
| Real Estate Taxes | $191,686 | $3,299 |
Property Value by Mortgage Status in Area Code 806
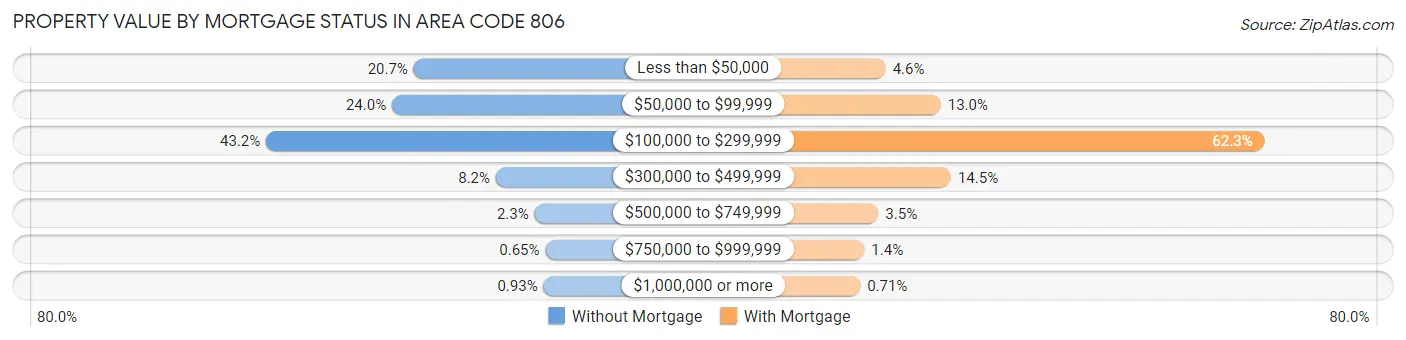
| Property Value | Without Mortgage | With Mortgage |
| Less than $50,000 | 21,940 (20.7%) | 4,586 (4.6%) |
| $50,000 to $99,999 | 25,447 (24.0%) | 12,938 (13.0%) |
| $100,000 to $299,999 | 45,763 (43.2%) | 62,074 (62.3%) |
| $300,000 to $499,999 | 8,677 (8.2%) | 14,483 (14.5%) |
| $500,000 to $749,999 | 2,428 (2.3%) | 3,462 (3.5%) |
| $750,000 to $999,999 | 691 (0.6%) | 1,341 (1.3%) |
| $1,000,000 or more | 980 (0.9%) | 706 (0.7%) |
| Total | 105,926 (100.0%) | 99,590 (100.0%) |
Household Income by Mortgage Status in Area Code 806
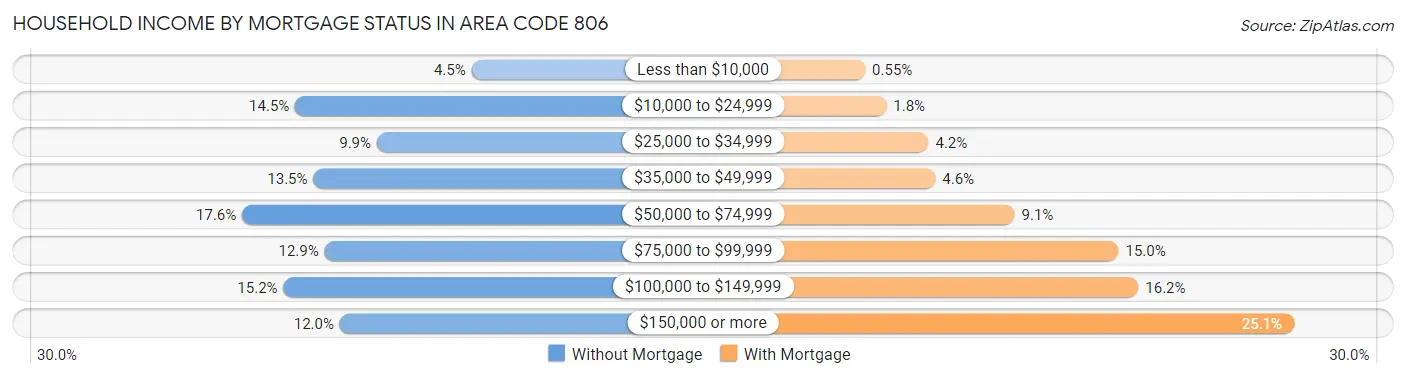
| Household Income | Without Mortgage | With Mortgage |
| Less than $10,000 | 4,727 (4.5%) | 544 (0.5%) |
| $10,000 to $24,999 | 15,405 (14.5%) | 1,749 (1.8%) |
| $25,000 to $34,999 | 10,451 (9.9%) | 4,154 (4.2%) |
| $35,000 to $49,999 | 14,296 (13.5%) | 4,546 (4.6%) |
| $50,000 to $74,999 | 18,616 (17.6%) | 9,051 (9.1%) |
| $75,000 to $99,999 | 13,620 (12.9%) | 14,968 (15.0%) |
| $100,000 to $149,999 | 16,112 (15.2%) | 16,097 (16.2%) |
| $150,000 or more | 12,699 (12.0%) | 24,945 (25.1%) |
| Total | 105,926 (100.0%) | 99,590 (100.0%) |
Property Value to Household Income Ratio in Area Code 806
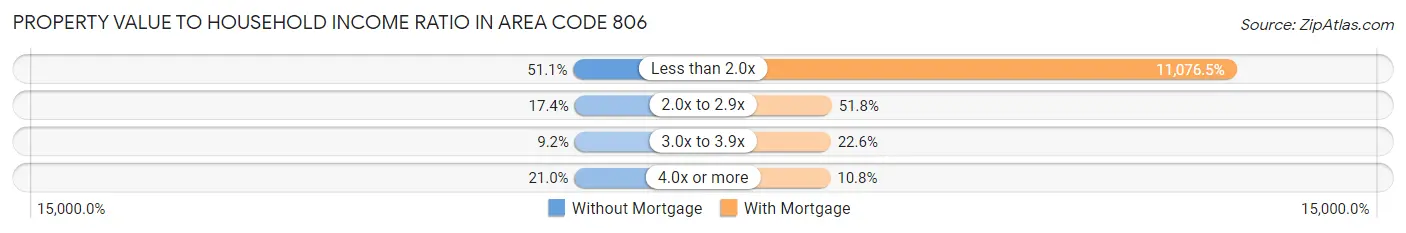
| Value-to-Income Ratio | Without Mortgage | With Mortgage |
| Less than 2.0x | 54,155 (51.1%) | 11,031,109 (11,076.5%) |
| 2.0x to 2.9x | 18,461 (17.4%) | 51,537 (51.7%) |
| 3.0x to 3.9x | 9,739 (9.2%) | 22,543 (22.6%) |
| 4.0x or more | 22,223 (21.0%) | 10,734 (10.8%) |
| Total | 105,926 (100.0%) | 99,590 (100.0%) |
Real Estate Taxes by Mortgage Status in Area Code 806
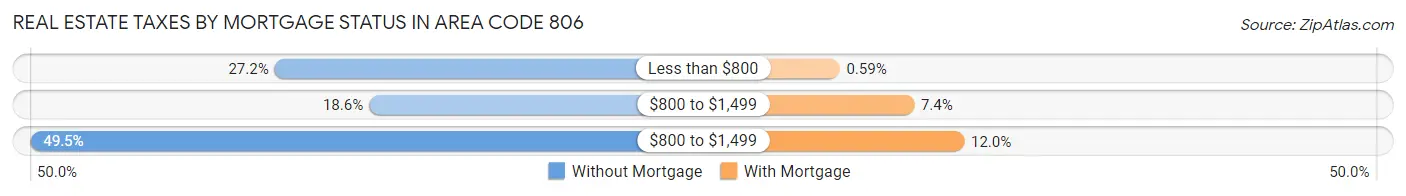
| Property Taxes | Without Mortgage | With Mortgage |
| Less than $800 | 28,794 (27.2%) | 588 (0.6%) |
| $800 to $1,499 | 19,644 (18.5%) | 7,356 (7.4%) |
| $800 to $1,499 | 52,406 (49.5%) | 11,913 (12.0%) |
| Total | 105,926 (100.0%) | 99,590 (100.0%) |
Health & Disability in Area Code 806
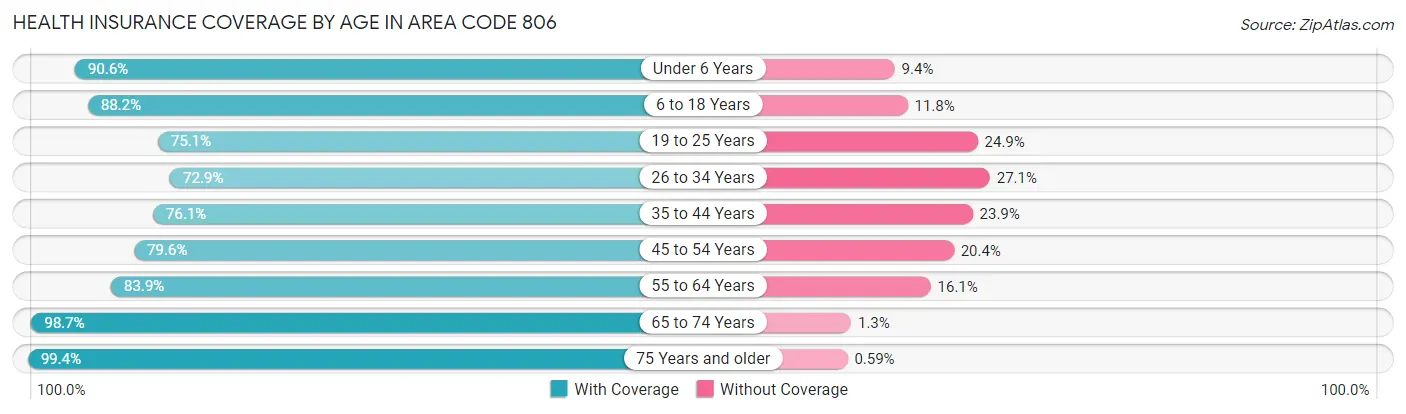
Health Insurance Coverage by Age in Area Code 806
| Age Bracket | With Coverage | Without Coverage |
| Under 6 Years | 62,659 (90.6%) | 6,496 (9.4%) |
| 6 to 18 Years | 147,776 (88.2%) | 19,744 (11.8%) |
| 19 to 25 Years | 76,795 (75.1%) | 25,402 (24.9%) |
| 26 to 34 Years | 76,060 (72.9%) | 28,311 (27.1%) |
| 35 to 44 Years | 82,110 (76.1%) | 25,833 (23.9%) |
| 45 to 54 Years | 71,252 (79.6%) | 18,264 (20.4%) |
| 55 to 64 Years | 79,503 (83.9%) | 15,259 (16.1%) |
| 65 to 74 Years | 70,584 (98.7%) | 898 (1.3%) |
| 75 Years and older | 49,047 (99.4%) | 289 (0.6%) |
| Total | 715,786 (83.6%) | 140,496 (16.4%) |
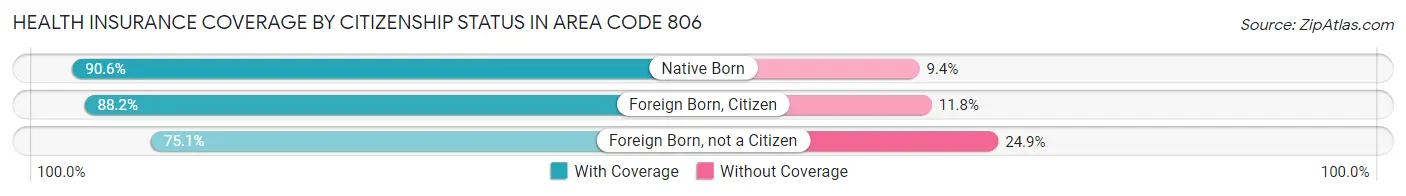
Health Insurance Coverage by Citizenship Status in Area Code 806
| Citizenship Status | With Coverage | Without Coverage |
| Native Born | 62,659 (90.6%) | 6,496 (9.4%) |
| Foreign Born, Citizen | 147,776 (88.2%) | 19,744 (11.8%) |
| Foreign Born, not a Citizen | 76,795 (75.1%) | 25,402 (24.9%) |
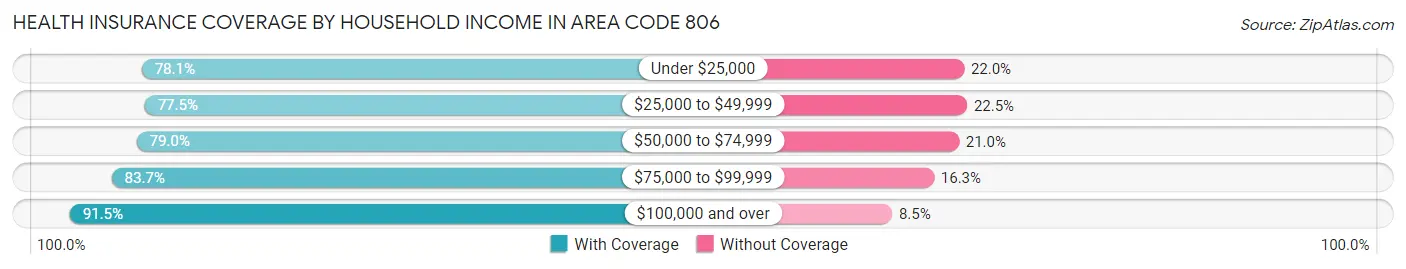
Health Insurance Coverage by Household Income in Area Code 806
| Household Income | With Coverage | Without Coverage |
| Under $25,000 | 91,034 (78.0%) | 25,608 (22.0%) |
| $25,000 to $49,999 | 127,432 (77.5%) | 37,023 (22.5%) |
| $50,000 to $74,999 | 117,881 (79.0%) | 31,293 (21.0%) |
| $75,000 to $99,999 | 106,594 (83.7%) | 20,772 (16.3%) |
| $100,000 and over | 261,682 (91.5%) | 24,213 (8.5%) |
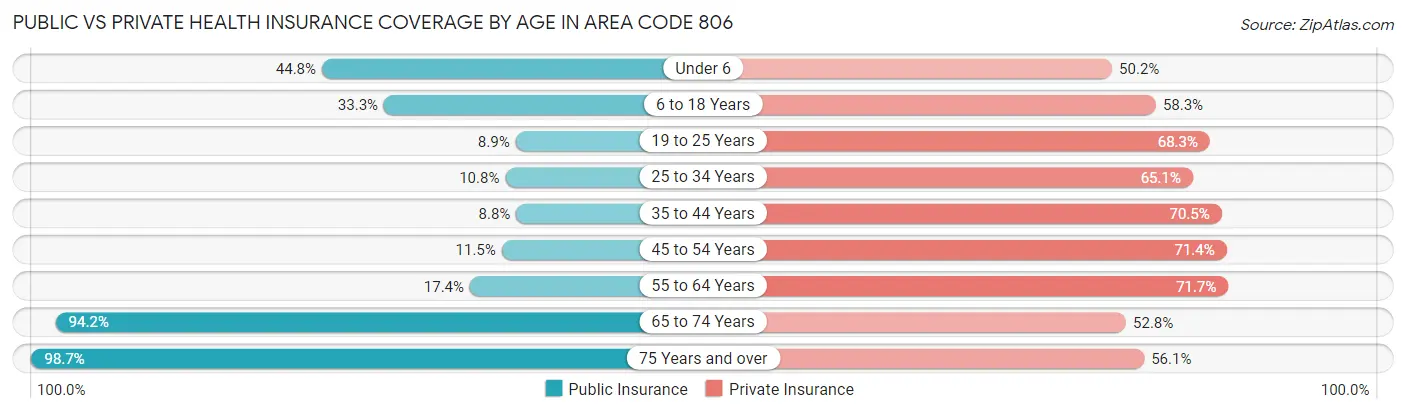
Public vs Private Health Insurance Coverage by Age in Area Code 806
| Age Bracket | Public Insurance | Private Insurance |
| Under 6 | 31,003 (44.8%) | 34,701 (50.2%) |
| 6 to 18 Years | 55,793 (33.3%) | 97,675 (58.3%) |
| 19 to 25 Years | 9,073 (8.9%) | 69,798 (68.3%) |
| 25 to 34 Years | 11,258 (10.8%) | 67,981 (65.1%) |
| 35 to 44 Years | 9,444 (8.7%) | 76,089 (70.5%) |
| 45 to 54 Years | 10,261 (11.5%) | 63,927 (71.4%) |
| 55 to 64 Years | 16,441 (17.3%) | 67,965 (71.7%) |
| 65 to 74 Years | 67,367 (94.2%) | 37,724 (52.8%) |
| 75 Years and over | 48,708 (98.7%) | 27,697 (56.1%) |
| Total | 259,348 (30.3%) | 543,557 (63.5%) |
Disability Status by Sex by Age in Area Code 806
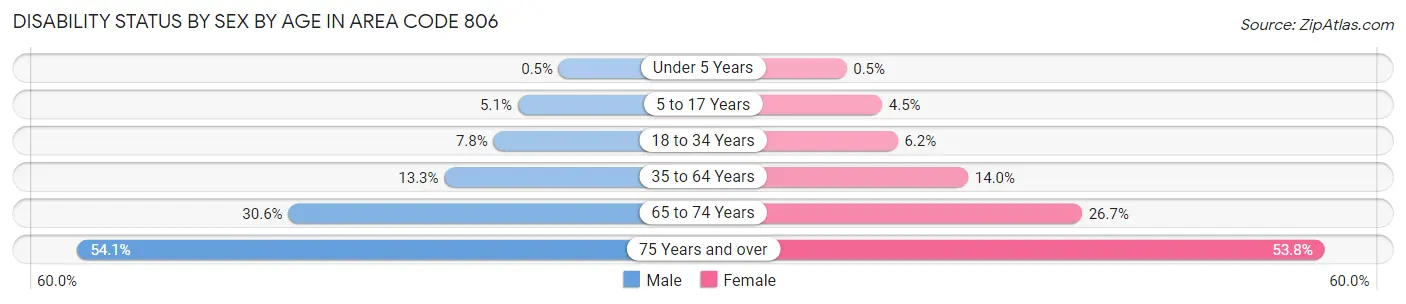
| Age Bracket | Male | Female |
| Under 5 Years | 149 (0.5%) | 141 (0.5%) |
| 5 to 17 Years | 4,240 (5.1%) | 3,597 (4.5%) |
| 18 to 34 Years | 8,723 (7.8%) | 6,758 (6.2%) |
| 35 to 64 Years | 19,192 (13.3%) | 20,696 (14.0%) |
| 65 to 74 Years | 10,353 (30.6%) | 10,068 (26.7%) |
| 75 Years and over | 11,084 (54.1%) | 15,511 (53.8%) |
Disability Class by Sex by Age in Area Code 806
Disability Class: Hearing Difficulty
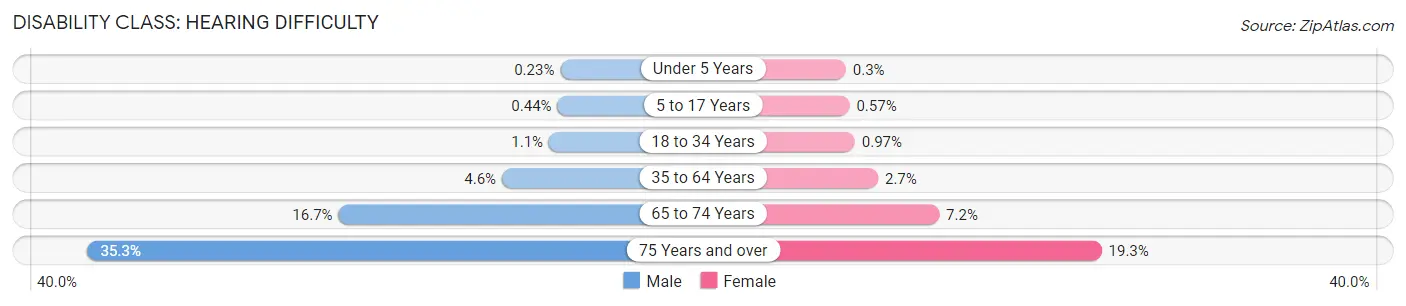
| Age Bracket | Male | Female |
| Under 5 Years | 69 (0.2%) | 83 (0.3%) |
| 5 to 17 Years | 371 (0.4%) | 458 (0.6%) |
| 18 to 34 Years | 1,201 (1.1%) | 1,053 (1.0%) |
| 35 to 64 Years | 6,601 (4.6%) | 3,961 (2.7%) |
| 65 to 74 Years | 5,646 (16.7%) | 2,723 (7.2%) |
| 75 Years and over | 7,237 (35.3%) | 5,566 (19.3%) |
Disability Class: Vision Difficulty
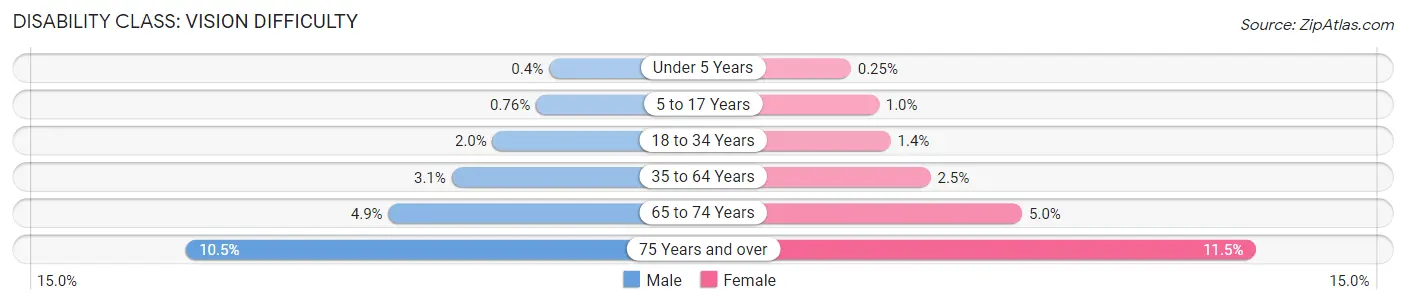
| Age Bracket | Male | Female |
| Under 5 Years | 120 (0.4%) | 70 (0.3%) |
| 5 to 17 Years | 633 (0.8%) | 831 (1.0%) |
| 18 to 34 Years | 2,207 (2.0%) | 1,481 (1.4%) |
| 35 to 64 Years | 4,505 (3.1%) | 3,634 (2.5%) |
| 65 to 74 Years | 1,648 (4.9%) | 1,891 (5.0%) |
| 75 Years and over | 2,151 (10.5%) | 3,320 (11.5%) |
Disability Class: Cognitive Difficulty
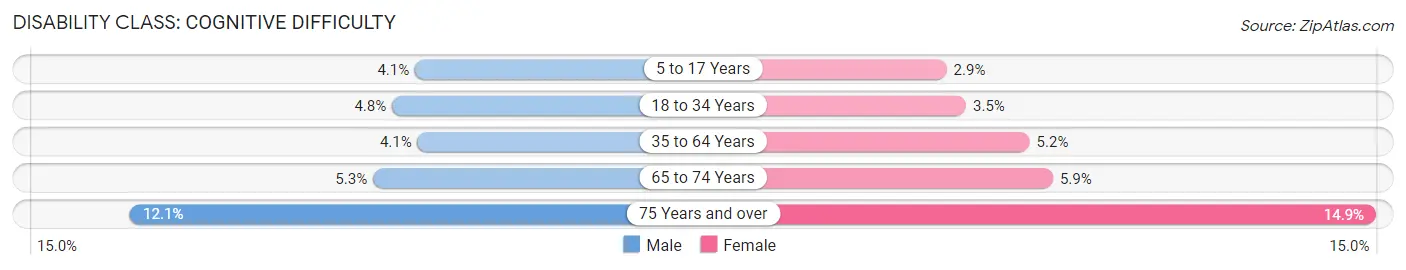
| Age Bracket | Male | Female |
| 5 to 17 Years | 3,451 (4.1%) | 2,358 (2.9%) |
| 18 to 34 Years | 5,355 (4.8%) | 3,769 (3.5%) |
| 35 to 64 Years | 5,875 (4.1%) | 7,707 (5.2%) |
| 65 to 74 Years | 1,792 (5.3%) | 2,214 (5.9%) |
| 75 Years and over | 2,471 (12.1%) | 4,291 (14.9%) |
Disability Class: Ambulatory Difficulty
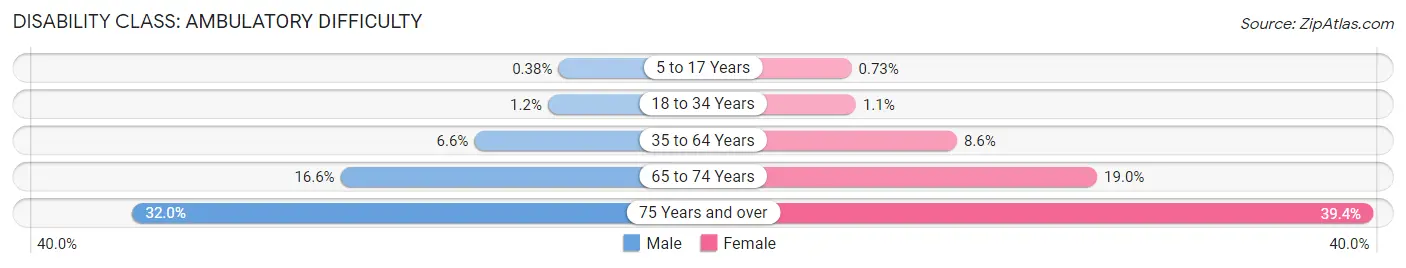
| Age Bracket | Male | Female |
| 5 to 17 Years | 319 (0.4%) | 586 (0.7%) |
| 18 to 34 Years | 1,298 (1.2%) | 1,149 (1.1%) |
| 35 to 64 Years | 9,594 (6.6%) | 12,599 (8.6%) |
| 65 to 74 Years | 5,594 (16.6%) | 7,144 (19.0%) |
| 75 Years and over | 6,552 (32.0%) | 11,377 (39.4%) |
Disability Class: Self-Care Difficulty
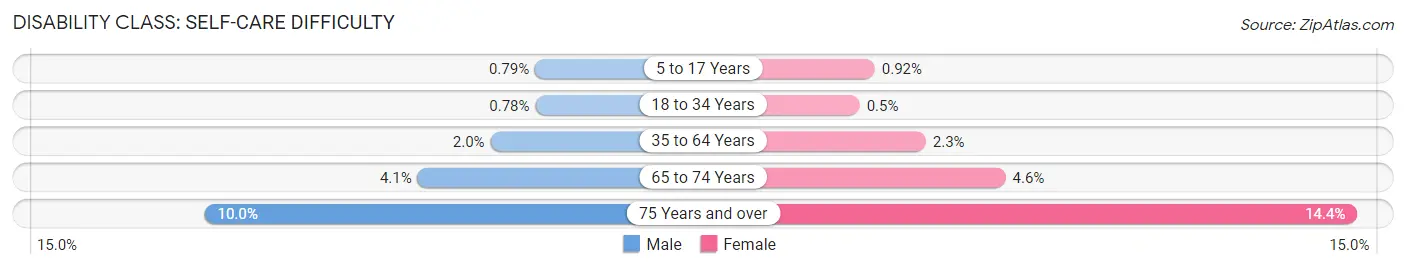
| Age Bracket | Male | Female |
| 5 to 17 Years | 658 (0.8%) | 740 (0.9%) |
| 18 to 34 Years | 880 (0.8%) | 542 (0.5%) |
| 35 to 64 Years | 2,941 (2.0%) | 3,451 (2.3%) |
| 65 to 74 Years | 1,373 (4.1%) | 1,717 (4.6%) |
| 75 Years and over | 2,046 (10.0%) | 4,139 (14.3%) |
Technology Access in Area Code 806
Computing Device Access in Area Code 806
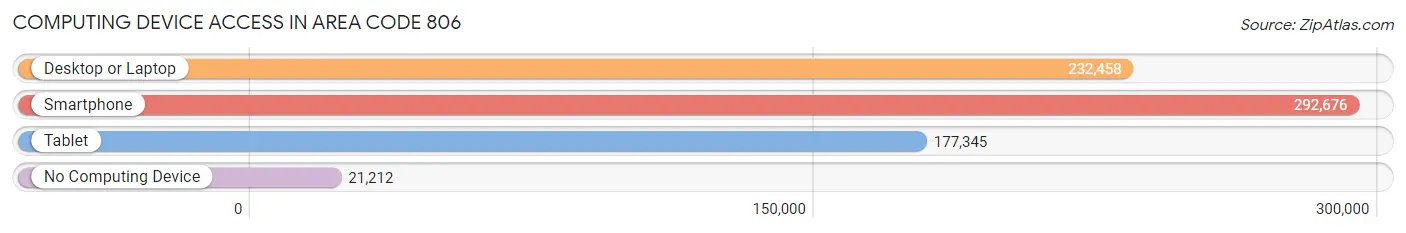
| Device Type | # Households | % Households |
| Desktop or Laptop | 232,458 | 71.1% |
| Smartphone | 292,676 | 89.5% |
| Tablet | 177,345 | 54.2% |
| No Computing Device | 21,212 | 6.5% |
| Total | 327,024 | 100.0% |
Internet Access in Area Code 806
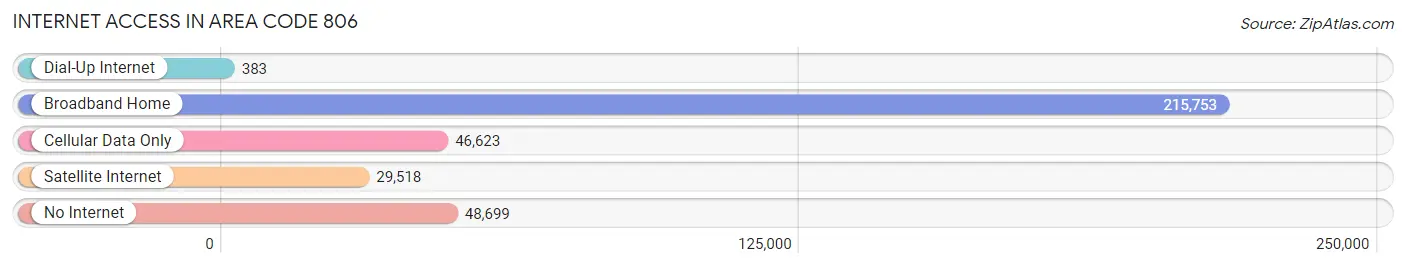
| Internet Type | # Households | % Households |
| Dial-Up Internet | 383 | 0.1% |
| Broadband Home | 215,753 | 66.0% |
| Cellular Data Only | 46,623 | 14.3% |
| Satellite Internet | 29,518 | 9.0% |
| No Internet | 48,699 | 14.9% |
| Total | 327,024 | 100.0% |
Area Code 806 Summary
Geography
Area code 806 is located in the Texas Panhandle region of the United States. It covers the entire Texas Panhandle, including the cities of Amarillo, Lubbock, and Abilene. It also covers parts of the Oklahoma Panhandle, including the cities of Guymon and Beaver.
Social
Area code 806 is home to a diverse population of people from all walks of life. The area is known for its friendly and welcoming atmosphere, and its residents are proud of their heritage and culture. The area is also home to a variety of outdoor activities, including camping, fishing, and hunting.
Economics
Area code 806 is an important economic hub for the Texas Panhandle region. The area is home to a variety of industries, including agriculture, oil and gas, and manufacturing. The area is also home to a number of universities and colleges, including Texas Tech University and West Texas A&M University.
Demographics
Area code 806 is home to a population of over 1.2 million people. The population is largely made up of Caucasians, with a smaller percentage of African Americans, Hispanics, and other ethnicities. The median household income in the area is around $45,000, and the unemployment rate is around 4%.
Common Questions
What is Per Capita Income in Area Code 806?
Per Capita income in Area Code 806 is $31,163.
What is the Median Family Income in Area Code 806?
Median Family Income in Area Code 806 is $75,928.
What is the Median Household income in Area Code 806?
Median Household Income in Area Code 806 is $62,614.
What is Income or Wage Gap in Area Code 806?
Income or Wage Gap in Area Code 806 is 35.3%.
Women in Area Code 806 earn 64.7 cents for every dollar earned by a man.
What is Family Income Deficit in Area Code 806?
Family Income Deficit in Area Code 806 is $11,470.
Families that are below poverty line in Area Code 806 earn $11,470 less on average than the poverty threshold level.
What is Inequality or Gini Index in Area Code 806?
Inequality or Gini Index in Area Code 806 is 66.55.
What is the Total Population of Area Code 806?
Total Population of Area Code 806 is 880,517.
What is the Total Male Population of Area Code 806?
Total Male Population of Area Code 806 is 445,291.
What is the Total Female Population of Area Code 806?
Total Female Population of Area Code 806 is 435,226.
What is the Ratio of Males per 100 Females in Area Code 806?
There are 102.31 Males per 100 Females in Area Code 806.
What is the Ratio of Females per 100 Males in Area Code 806?
There are 97.74 Females per 100 Males in Area Code 806.
What is the Median Population Age in Area Code 806?
Median Population Age in Area Code 806 is 38.9 Years.
What is the Average Family Size in Area Code 806
Average Family Size in Area Code 806 is 3.3 People.
What is the Average Household Size in Area Code 806
Average Household Size in Area Code 806 is 2.8 People.
How Large is the Labor Force in Area Code 806?
There are 407,482 People in the Labor Forcein in Area Code 806.
What is the Percentage of People in the Labor Force in Area Code 806?
59.7% of People are in the Labor Force in Area Code 806.
What is the Unemployment Rate in Area Code 806?
Unemployment Rate in Area Code 806 is 4.7%.