Area Code 708 Map & Demographics
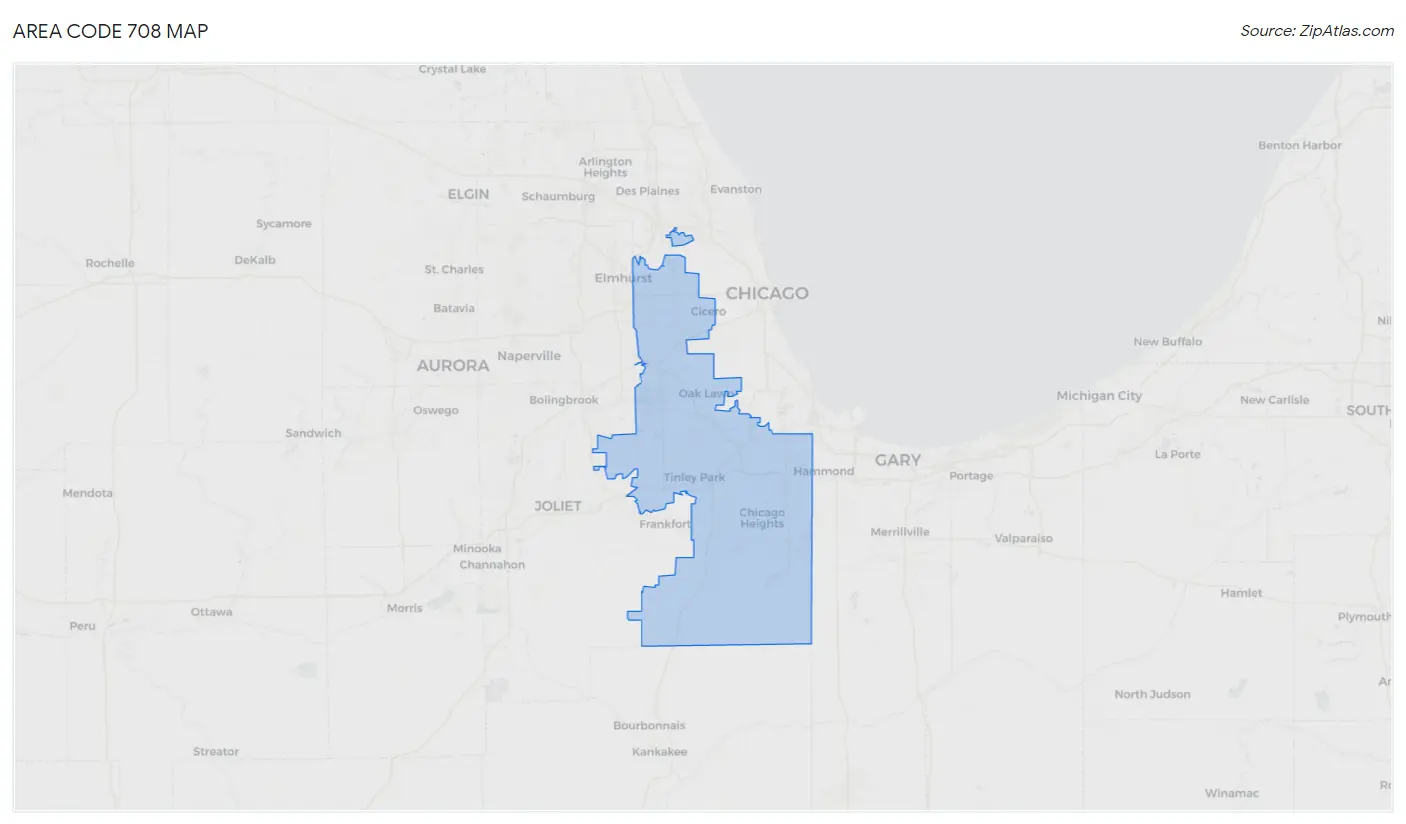
Area Code 708 Map
Area Code 708 Overview
$48,573
PER CAPITA INCOME
$114,220
AVG FAMILY INCOME
$93,022
AVG HOUSEHOLD INCOME
28.1%
WAGE / INCOME GAP [ % ]
71.9¢/ $1
WAGE / INCOME GAP [ $ ]
$10,745
FAMILY INCOME DEFICIT
40.63
INEQUALITY / GINI INDEX
2,199,693
TOTAL POPULATION
1,081,886
MALE POPULATION
1,117,807
FEMALE POPULATION
96.79
MALES / 100 FEMALES
103.32
FEMALES / 100 MALES
40.0
MEDIAN AGE
3.2
AVG FAMILY SIZE
2.6
AVG HOUSEHOLD SIZE
1,153,796
LABOR FORCE [ PEOPLE ]
65.6%
PERCENT IN LABOR FORCE
6.3%
UNEMPLOYMENT RATE
Income in Area Code 708
Income Overview in Area Code 708
Per Capita Income in Area Code 708 is $48,573, while median incomes of families and households are $114,220 and $93,022 respectively.
| Characteristic | Number | Measure |
| Per Capita Income | 2,199,693 | $48,573 |
| Median Family Income | 546,942 | $114,220 |
| Mean Family Income | 546,942 | $13,503,616 |
| Median Household Income | 828,711 | $93,022 |
| Mean Household Income | 828,711 | $11,297,867 |
| Income Deficit | 546,942 | $10,745 |
| Wage / Income Gap (%) | 2,199,693 | 28.09% |
| Wage / Income Gap ($) | 2,199,693 | 71.91¢ per $1 |
| Gini / Inequality Index | 2,199,693 | 40.63 |
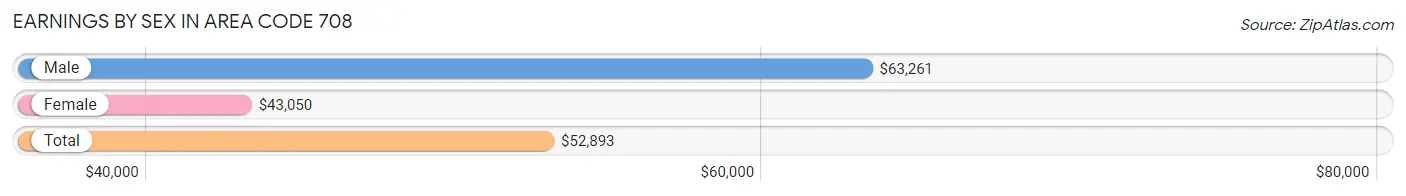
Earnings by Sex in Area Code 708
Average Earnings in Area Code 708 are $52,893, $63,261 for men and $43,050 for women, a difference of 32.0%.
| Sex | Number | Average Earnings |
| Male | 617,506 (52.9%) | $63,261 |
| Female | 550,332 (47.1%) | $43,050 |
| Total | 1,167,838 (100.0%) | $52,893 |
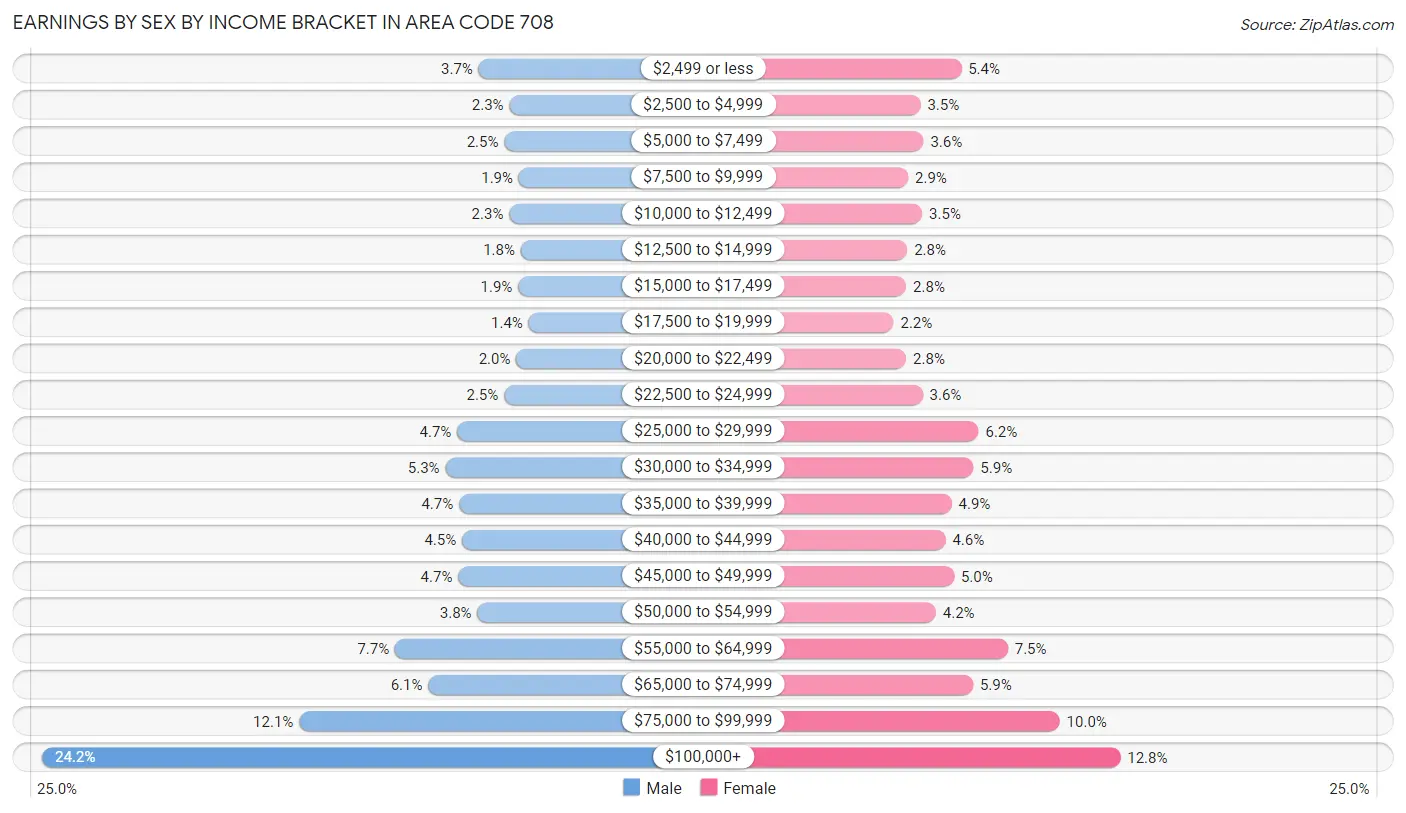
Earnings by Sex by Income Bracket in Area Code 708
The most common earnings brackets in Area Code 708 are $100,000+ for men (149,337 | 24.2%) and $100,000+ for women (70,481 | 12.8%).
| Income | Male | Female |
| $2,499 or less | 23,042 (3.7%) | 29,514 (5.4%) |
| $2,500 to $4,999 | 14,113 (2.3%) | 18,986 (3.5%) |
| $5,000 to $7,499 | 15,637 (2.5%) | 19,760 (3.6%) |
| $7,500 to $9,999 | 11,394 (1.8%) | 15,821 (2.9%) |
| $10,000 to $12,499 | 14,208 (2.3%) | 19,409 (3.5%) |
| $12,500 to $14,999 | 10,890 (1.8%) | 15,592 (2.8%) |
| $15,000 to $17,499 | 11,581 (1.9%) | 15,314 (2.8%) |
| $17,500 to $19,999 | 8,606 (1.4%) | 12,074 (2.2%) |
| $20,000 to $22,499 | 12,191 (2.0%) | 15,309 (2.8%) |
| $22,500 to $24,999 | 15,706 (2.5%) | 19,542 (3.5%) |
| $25,000 to $29,999 | 29,284 (4.7%) | 33,969 (6.2%) |
| $30,000 to $34,999 | 32,685 (5.3%) | 32,661 (5.9%) |
| $35,000 to $39,999 | 28,718 (4.6%) | 26,999 (4.9%) |
| $40,000 to $44,999 | 27,857 (4.5%) | 25,399 (4.6%) |
| $45,000 to $49,999 | 28,979 (4.7%) | 27,645 (5.0%) |
| $50,000 to $54,999 | 23,421 (3.8%) | 22,937 (4.2%) |
| $55,000 to $64,999 | 47,262 (7.6%) | 41,486 (7.5%) |
| $65,000 to $74,999 | 37,602 (6.1%) | 32,551 (5.9%) |
| $75,000 to $99,999 | 74,993 (12.1%) | 54,883 (10.0%) |
| $100,000+ | 149,337 (24.2%) | 70,481 (12.8%) |
| Total | 617,506 (100.0%) | 550,332 (100.0%) |
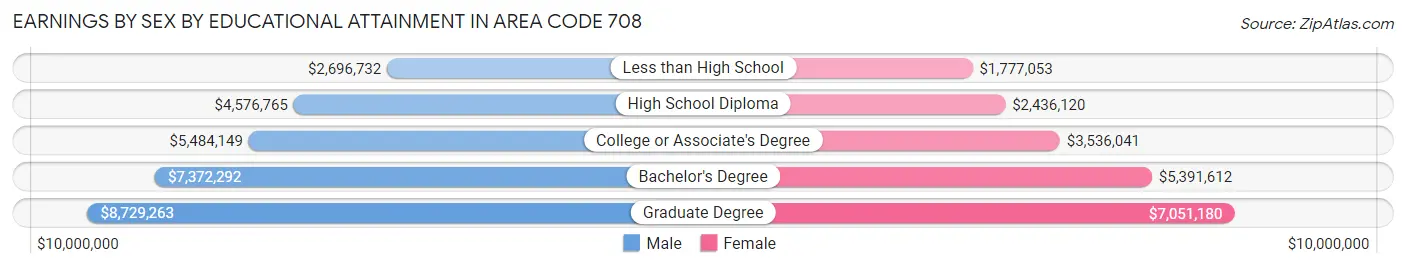
Earnings by Sex by Educational Attainment in Area Code 708
Average earnings in Area Code 708 are $6,644,759 for men and $4,547,957 for women, a difference of 31.6%. Men with an educational attainment of graduate degree enjoy the highest average annual earnings of $8,729,263, while those with less than high school education earn the least with $2,696,732. Women with an educational attainment of graduate degree earn the most with the average annual earnings of $7,051,180, while those with less than high school education have the smallest earnings of $1,777,053.
| Educational Attainment | Male Income | Female Income |
| Less than High School | $2,696,732 | $1,777,053 |
| High School Diploma | $4,576,765 | $2,436,120 |
| College or Associate's Degree | $5,484,149 | $3,536,041 |
| Bachelor's Degree | $7,372,292 | $5,391,612 |
| Graduate Degree | $8,729,263 | $7,051,180 |
| Total | $6,644,759 | $4,547,957 |
Family Income in Area Code 708
Family Income Brackets in Area Code 708
According to the Area Code 708 family income data, there are 10,484,878 families falling into the $100,000 to $149,999 income range, which is the most common income bracket and makes up 1,917.0% of all families. Conversely, the $10,000 to $14,999 income bracket is the least frequent group with only 596,167 families (109.0%) belonging to this category.
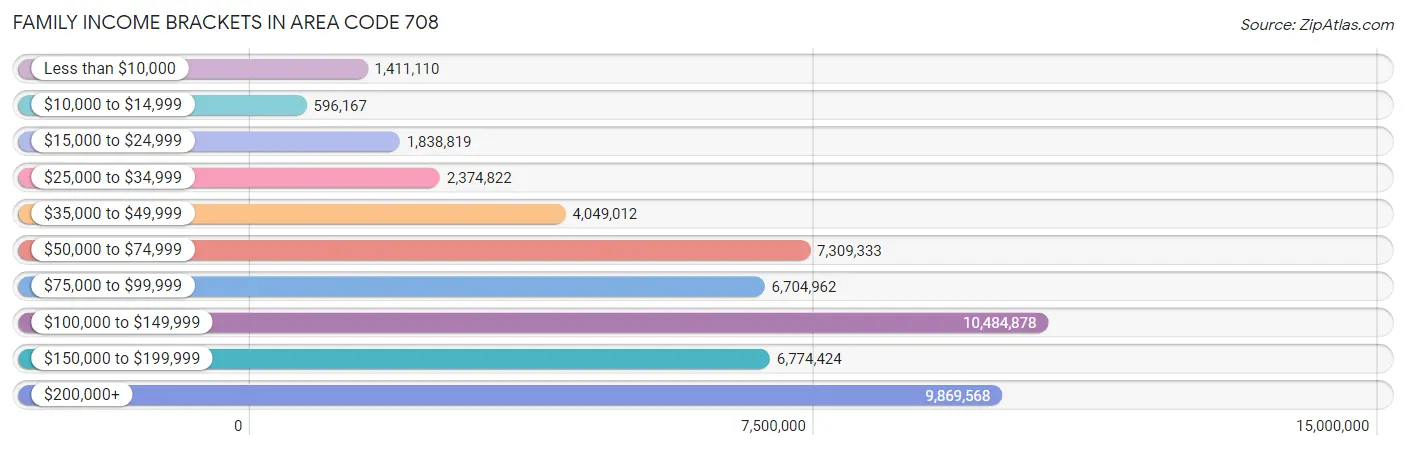
| Income Bracket | # Families | % Families |
| Less than $10,000 | 1,411,110 | 258.0% |
| $10,000 to $14,999 | 596,167 | 109.0% |
| $15,000 to $24,999 | 1,838,819 | 336.2% |
| $25,000 to $34,999 | 2,374,822 | 434.2% |
| $35,000 to $49,999 | 4,049,012 | 740.3% |
| $50,000 to $74,999 | 7,309,333 | 1,336.4% |
| $75,000 to $99,999 | 6,704,962 | 1,225.9% |
| $100,000 to $149,999 | 10,484,878 | 1,917.0% |
| $150,000 to $199,999 | 6,774,424 | 1,238.6% |
| $200,000+ | 9,869,568 | 1,804.5% |
Family Income by Famaliy Size in Area Code 708
7+ person families (10,325 | 1.9%) account for the highest median family income in Area Code 708 with $141,990 per family, while 2-person families (226,959 | 41.5%) have the highest median income of $47,682 per family member.
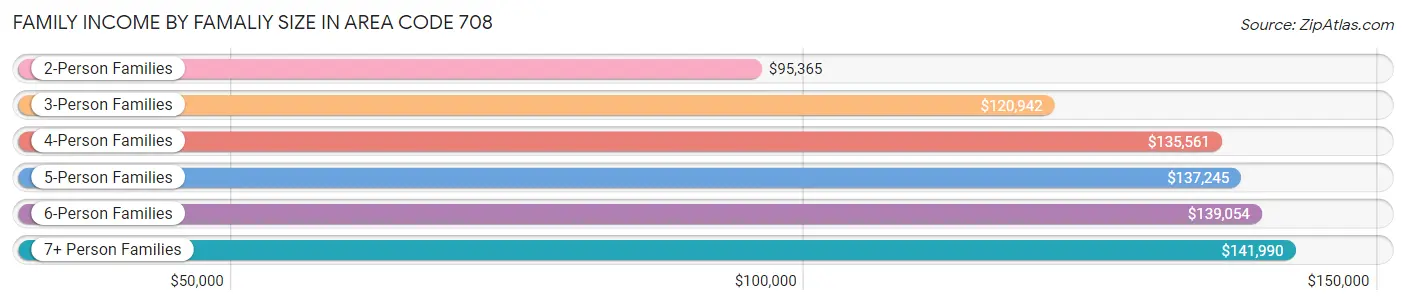
| Income Bracket | # Families | Median Income |
| 2-Person Families | 226,959 (41.5%) | $95,365 |
| 3-Person Families | 128,092 (23.4%) | $120,942 |
| 4-Person Families | 111,033 (20.3%) | $135,561 |
| 5-Person Families | 52,822 (9.7%) | $137,245 |
| 6-Person Families | 17,711 (3.2%) | $139,054 |
| 7+ Person Families | 10,325 (1.9%) | $141,990 |
| Total | 546,942 (100.0%) | $114,220 |
Family Income by Number of Earners in Area Code 708
The median family income in Area Code 708 is $114,220, with families comprising 3+ earners (81,245) having the highest median family income of $161,212, while families with no earners (67,230) have the lowest median family income of $58,228, accounting for 14.8% and 12.3% of families, respectively.
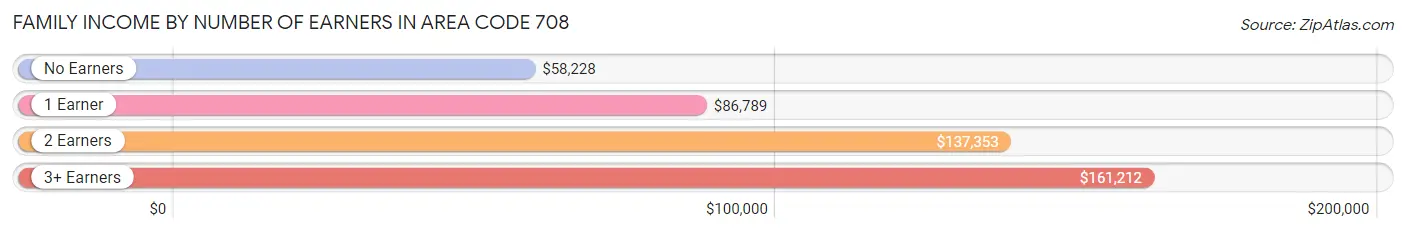
| Number of Earners | # Families | Median Income |
| No Earners | 67,230 (12.3%) | $58,228 |
| 1 Earner | 170,426 (31.2%) | $86,789 |
| 2 Earners | 228,041 (41.7%) | $137,353 |
| 3+ Earners | 81,245 (14.8%) | $161,212 |
| Total | 546,942 (100.0%) | $114,220 |
Household Income in Area Code 708
Household Income Brackets in Area Code 708
With 14,105,490 households falling in the category, the $100,000 to $149,999 income range is the most frequent in Area Code 708, accounting for 1,702.1% of all households. In contrast, only 2,024,541 households (244.3%) fall into the $10,000 to $14,999 income bracket, making it the least populous group.
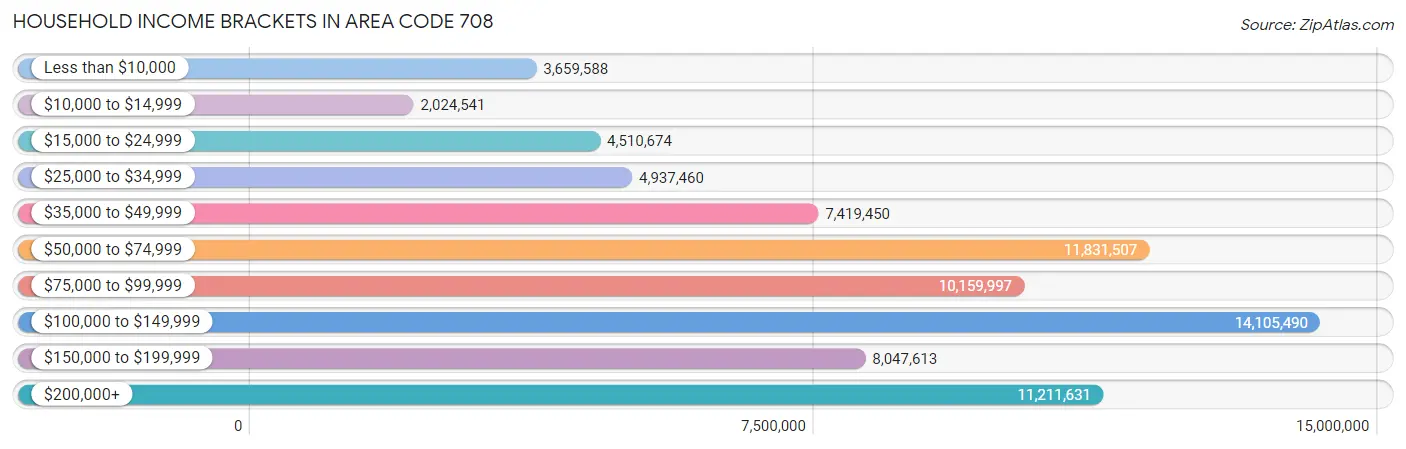
| Income Bracket | # Households | % Households |
| Less than $10,000 | 3,659,588 | 441.6% |
| $10,000 to $14,999 | 2,024,541 | 244.3% |
| $15,000 to $24,999 | 4,510,674 | 544.3% |
| $25,000 to $34,999 | 4,937,460 | 595.8% |
| $35,000 to $49,999 | 7,419,450 | 895.3% |
| $50,000 to $74,999 | 11,831,507 | 1,427.7% |
| $75,000 to $99,999 | 10,159,997 | 1,226.0% |
| $100,000 to $149,999 | 14,105,490 | 1,702.1% |
| $150,000 to $199,999 | 8,047,613 | 971.1% |
| $200,000+ | 11,211,631 | 1,352.9% |
Household Income by Householder Age in Area Code 708
The median household income in Area Code 708 is $93,022, with the highest median household income of $114,779 found in the 45 to 64 years age bracket for the primary householder. A total of 316,924 households (38.2%) fall into this category. Meanwhile, the 15 to 24 years age bracket for the primary householder has the lowest median household income of $54,392, with 17,184 households (2.1%) in this group.
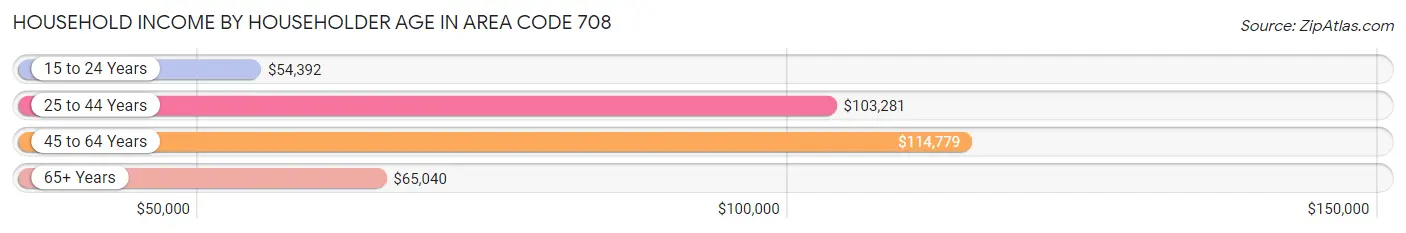
| Income Bracket | # Households | Median Income |
| 15 to 24 Years | 17,184 (2.1%) | $54,392 |
| 25 to 44 Years | 266,953 (32.2%) | $103,281 |
| 45 to 64 Years | 316,924 (38.2%) | $114,779 |
| 65+ Years | 227,650 (27.5%) | $65,040 |
| Total | 828,711 (100.0%) | $93,022 |
Poverty in Area Code 708
Income Below Poverty by Sex and Age in Area Code 708
With 9.1% poverty level for males and 11.4% for females among the residents of Area Code 708, 6 to 11 year old males and 15 year old females are the most vulnerable to poverty, with 12,390 males (14.2%) and 2,272 females (15.3%) in their respective age groups living below the poverty level.
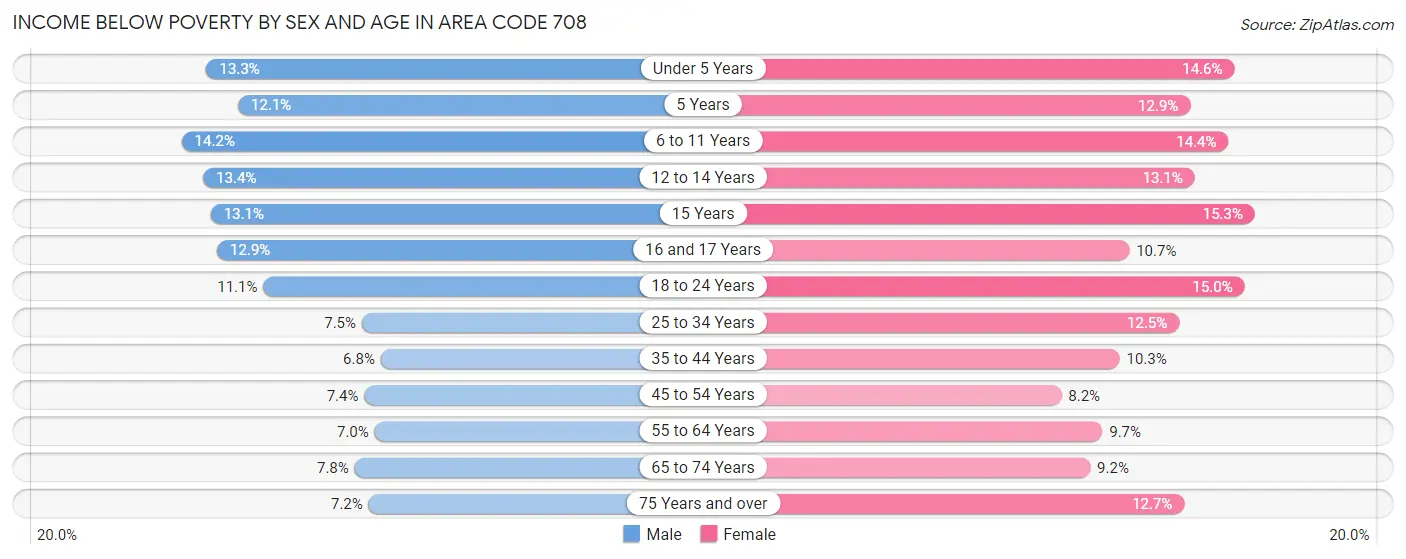
| Age Bracket | Male | Female |
| Under 5 Years | 8,055 (13.3%) | 8,685 (14.6%) |
| 5 Years | 1,514 (12.1%) | 1,570 (12.9%) |
| 6 to 11 Years | 12,390 (14.2%) | 11,600 (14.3%) |
| 12 to 14 Years | 6,436 (13.4%) | 5,601 (13.1%) |
| 15 Years | 2,080 (13.1%) | 2,272 (15.3%) |
| 16 and 17 Years | 4,029 (12.9%) | 3,197 (10.7%) |
| 18 to 24 Years | 10,070 (11.1%) | 12,717 (14.9%) |
| 25 to 34 Years | 10,726 (7.5%) | 17,803 (12.5%) |
| 35 to 44 Years | 9,936 (6.8%) | 15,166 (10.3%) |
| 45 to 54 Years | 10,466 (7.4%) | 11,659 (8.2%) |
| 55 to 64 Years | 9,638 (7.0%) | 14,354 (9.7%) |
| 65 to 74 Years | 7,417 (7.7%) | 10,232 (9.2%) |
| 75 Years and over | 4,137 (7.2%) | 11,086 (12.7%) |
| Total | 96,894 (9.1%) | 125,942 (11.4%) |
Income Above Poverty by Sex and Age in Area Code 708
According to the poverty statistics in Area Code 708, males aged 35 to 44 years and females aged 45 to 54 years are the age groups that are most secure financially, with 93.2% of males and 91.8% of females in these age groups living above the poverty line.
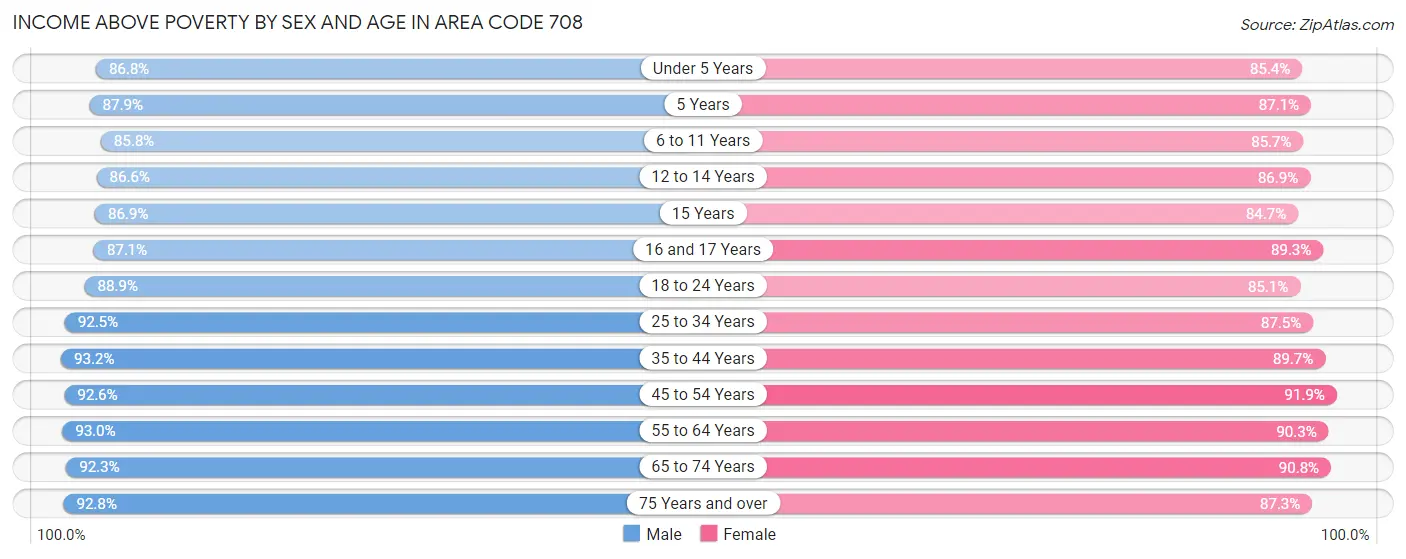
| Age Bracket | Male | Female |
| Under 5 Years | 52,749 (86.8%) | 50,932 (85.4%) |
| 5 Years | 11,016 (87.9%) | 10,576 (87.1%) |
| 6 to 11 Years | 75,061 (85.8%) | 69,250 (85.7%) |
| 12 to 14 Years | 41,718 (86.6%) | 37,162 (86.9%) |
| 15 Years | 13,804 (86.9%) | 12,551 (84.7%) |
| 16 and 17 Years | 27,306 (87.1%) | 26,757 (89.3%) |
| 18 to 24 Years | 80,333 (88.9%) | 72,332 (85.1%) |
| 25 to 34 Years | 132,594 (92.5%) | 124,391 (87.5%) |
| 35 to 44 Years | 136,554 (93.2%) | 132,004 (89.7%) |
| 45 to 54 Years | 131,179 (92.6%) | 131,348 (91.8%) |
| 55 to 64 Years | 127,786 (93.0%) | 134,149 (90.3%) |
| 65 to 74 Years | 88,235 (92.2%) | 100,777 (90.8%) |
| 75 Years and over | 53,058 (92.8%) | 76,142 (87.3%) |
| Total | 971,393 (90.9%) | 978,371 (88.6%) |
Income Below Poverty Among Married-Couple Families in Area Code 708
The poverty statistics for married-couple families in Area Code 708 show that 4.2% or 16,684 of the total 398,085 families live below the poverty line. Families with 5 or more children have the highest poverty rate of 21.9%, comprising of 438 families. On the other hand, families with no children have the lowest poverty rate of 3.3%, which includes 7,491 families.
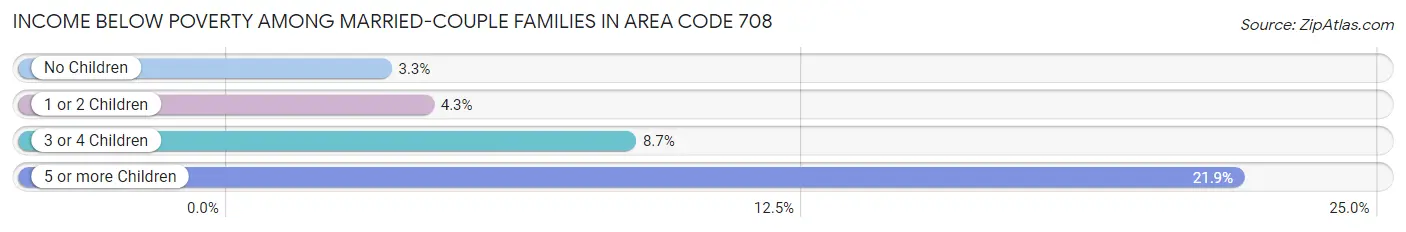
| Children | Above Poverty | Below Poverty |
| No Children | 216,458 (96.7%) | 7,491 (3.3%) |
| 1 or 2 Children | 133,907 (95.7%) | 5,961 (4.3%) |
| 3 or 4 Children | 29,475 (91.3%) | 2,794 (8.7%) |
| 5 or more Children | 1,561 (78.1%) | 438 (21.9%) |
| Total | 381,401 (95.8%) | 16,684 (4.2%) |
Income Below Poverty Among Single-Parent Households in Area Code 708
According to the poverty data in Area Code 708, 8.9% or 3,709 single-father households and 19.5% or 20,877 single-mother households are living below the poverty line. Among single-father households, those with 5 or more children have the highest poverty rate, with 91 households (39.4%) experiencing poverty. Likewise, among single-mother households, those with 5 or more children have the highest poverty rate, with 778 households (65.9%) falling below the poverty line.
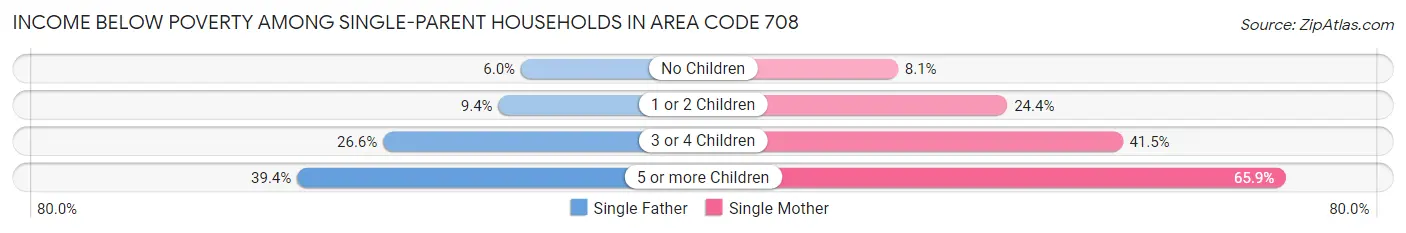
| Children | Single Father | Single Mother |
| No Children | 1,372 (6.0%) | 3,641 (8.1%) |
| 1 or 2 Children | 1,509 (9.4%) | 12,492 (24.4%) |
| 3 or 4 Children | 737 (26.6%) | 3,966 (41.5%) |
| 5 or more Children | 91 (39.4%) | 778 (65.9%) |
| Total | 3,709 (8.9%) | 20,877 (19.5%) |
Income Below Poverty Among Married-Couple vs Single-Parent Households in Area Code 708
The poverty data for Area Code 708 shows that 16,684 of the married-couple family households (4.2%) and 24,586 of the single-parent households (16.5%) are living below the poverty level. Within the married-couple family households, those with 5 or more children have the highest poverty rate, with 438 households (21.9%) falling below the poverty line. Among the single-parent households, those with 5 or more children have the highest poverty rate, with 869 household (61.6%) living below poverty.
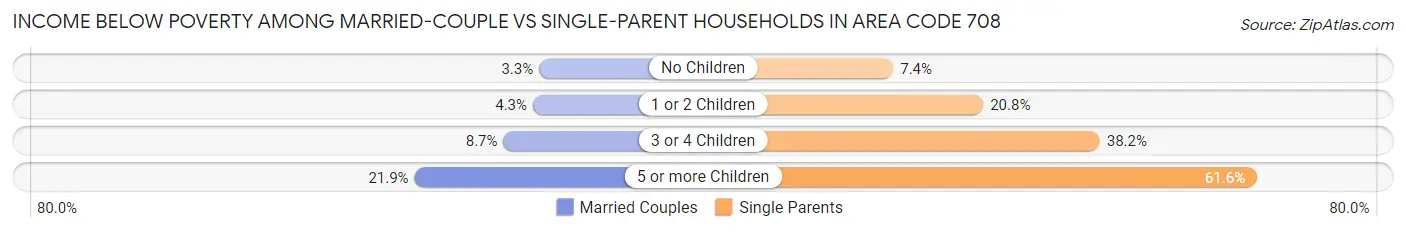
| Children | Married-Couple Families | Single-Parent Households |
| No Children | 7,491 (3.3%) | 5,013 (7.4%) |
| 1 or 2 Children | 5,961 (4.3%) | 14,001 (20.8%) |
| 3 or 4 Children | 2,794 (8.7%) | 4,703 (38.2%) |
| 5 or more Children | 438 (21.9%) | 869 (61.6%) |
| Total | 16,684 (4.2%) | 24,586 (16.5%) |
Race in Area Code 708
The most populous races in Area Code 708 are White / Caucasian (1,226,644 | 55.8%), Hispanic or Latino (581,843 | 26.5%), and Black / African American (370,255 | 16.8%).
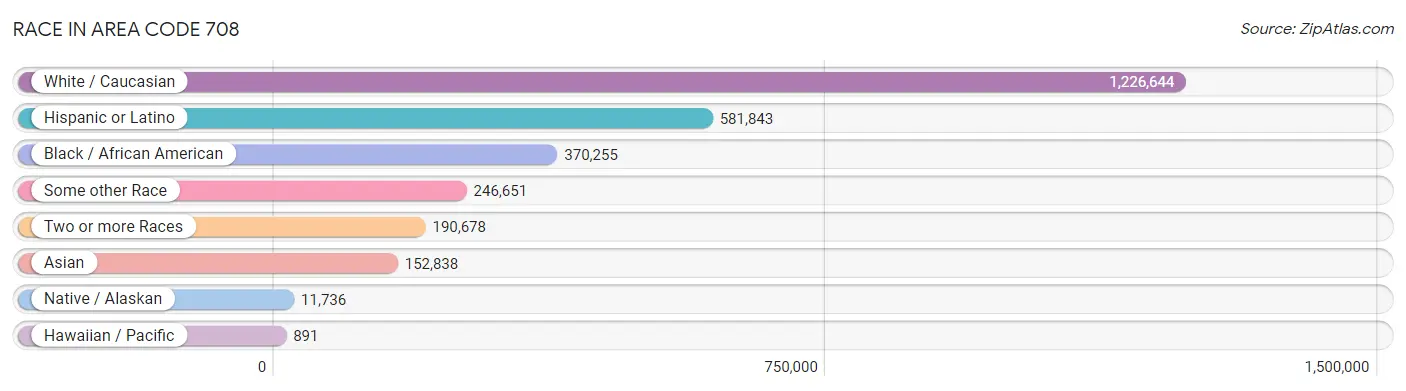
| Race | # Population | % Population |
| Asian | 152,838 | 7.0% |
| Black / African American | 370,255 | 16.8% |
| Hawaiian / Pacific | 891 | 0.0% |
| Hispanic or Latino | 581,843 | 26.5% |
| Native / Alaskan | 11,736 | 0.5% |
| White / Caucasian | 1,226,644 | 55.8% |
| Two or more Races | 190,678 | 8.7% |
| Some other Race | 246,651 | 11.2% |
| Total | 2,199,693 | 100.0% |
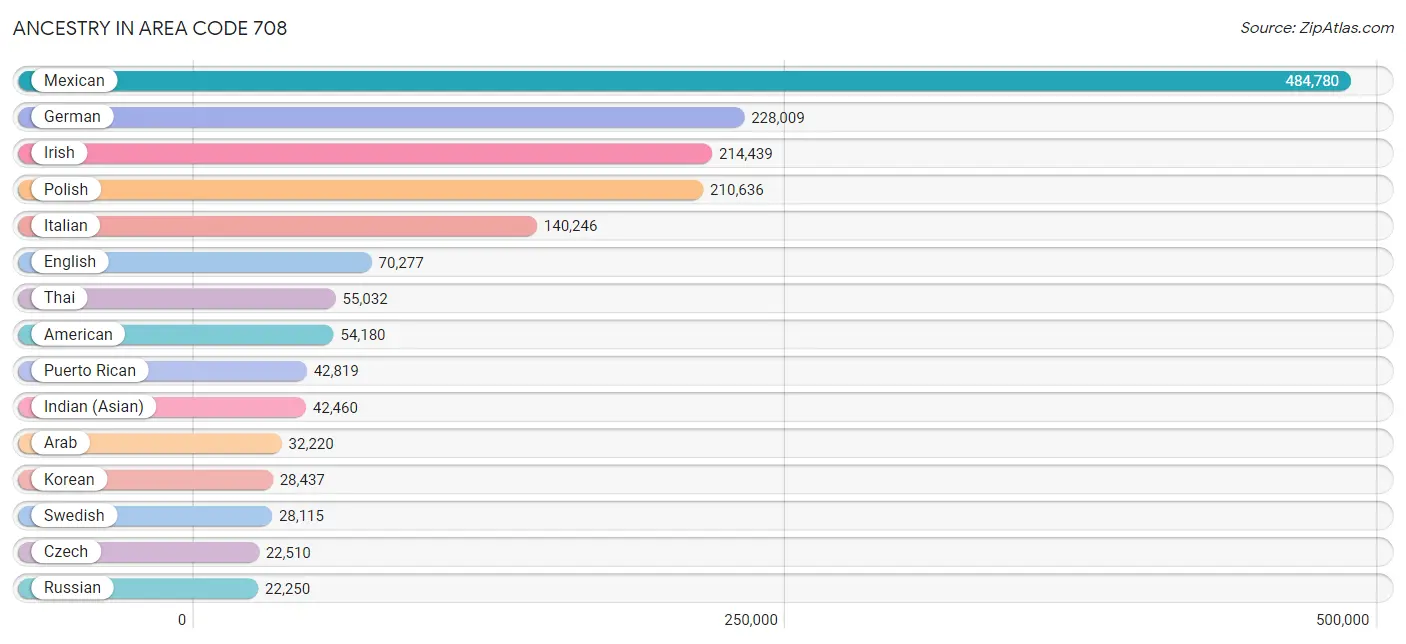
Ancestry in Area Code 708
The most populous ancestries reported in Area Code 708 are Mexican (484,780 | 22.0%), German (228,009 | 10.4%), Irish (214,439 | 9.8%), Polish (210,636 | 9.6%), and Italian (140,246 | 6.4%), together accounting for 58.1% of all Area Code 708 residents.
| Ancestry | # Population | % Population |
| Afghan | 55 | 0.0% |
| African | 11,514 | 0.5% |
| Alaska Native | 3 | 0.0% |
| Albanian | 2,335 | 0.1% |
| Alsatian | 83 | 0.0% |
| American | 54,180 | 2.5% |
| Apache | 284 | 0.0% |
| Arab | 32,220 | 1.5% |
| Argentinean | 1,153 | 0.1% |
| Armenian | 1,861 | 0.1% |
| Assyrian / Chaldean / Syriac | 2,294 | 0.1% |
| Australian | 173 | 0.0% |
| Austrian | 6,826 | 0.3% |
| Bahamian | 10 | 0.0% |
| Bangladeshi | 111 | 0.0% |
| Barbadian | 253 | 0.0% |
| Basque | 56 | 0.0% |
| Belgian | 2,558 | 0.1% |
| Belizean | 637 | 0.0% |
| Bermudan | 33 | 0.0% |
| Bhutanese | 7,158 | 0.3% |
| Blackfeet | 449 | 0.0% |
| Bolivian | 856 | 0.0% |
| Brazilian | 1,711 | 0.1% |
| British | 4,406 | 0.2% |
| British West Indian | 94 | 0.0% |
| Bulgarian | 5,845 | 0.3% |
| Burmese | 17,882 | 0.8% |
| Cajun | 48 | 0.0% |
| Cambodian | 1,748 | 0.1% |
| Canadian | 1,527 | 0.1% |
| Cape Verdean | 47 | 0.0% |
| Carpatho Rusyn | 17 | 0.0% |
| Celtic | 60 | 0.0% |
| Central American | 17,224 | 0.8% |
| Central American Indian | 2,494 | 0.1% |
| Cherokee | 3,652 | 0.2% |
| Cheyenne | 20 | 0.0% |
| Chickasaw | 100 | 0.0% |
| Chilean | 615 | 0.0% |
| Chinese | 18 | 0.0% |
| Chippewa | 769 | 0.0% |
| Choctaw | 469 | 0.0% |
| Colombian | 5,574 | 0.3% |
| Comanche | 57 | 0.0% |
| Costa Rican | 335 | 0.0% |
| Cree | 44 | 0.0% |
| Creek | 144 | 0.0% |
| Croatian | 9,026 | 0.4% |
| Crow | 32 | 0.0% |
| Cuban | 5,788 | 0.3% |
| Cypriot | 43 | 0.0% |
| Czech | 22,510 | 1.0% |
| Czechoslovakian | 2,847 | 0.1% |
| Danish | 5,027 | 0.2% |
| Delaware | 4 | 0.0% |
| Dominican | 1,180 | 0.1% |
| Dutch | 22,190 | 1.0% |
| Dutch West Indian | 43 | 0.0% |
| Eastern European | 8,595 | 0.4% |
| Ecuadorian | 5,464 | 0.3% |
| Egyptian | 2,080 | 0.1% |
| English | 70,277 | 3.2% |
| Estonian | 121 | 0.0% |
| Ethiopian | 1,095 | 0.1% |
| European | 18,786 | 0.9% |
| Fijian | 86 | 0.0% |
| Filipino | 1,631 | 0.1% |
| Finnish | 2,134 | 0.1% |
| French | 20,911 | 0.9% |
| French American Indian | 102 | 0.0% |
| French Canadian | 3,535 | 0.2% |
| German | 228,009 | 10.4% |
| German Russian | 102 | 0.0% |
| Ghanaian | 468 | 0.0% |
| Greek | 21,720 | 1.0% |
| Guamanian / Chamorro | 258 | 0.0% |
| Guatemalan | 9,028 | 0.4% |
| Guyanese | 188 | 0.0% |
| Haitian | 1,622 | 0.1% |
| Hmong | 65 | 0.0% |
| Honduran | 2,591 | 0.1% |
| Hungarian | 7,369 | 0.3% |
| Icelander | 68 | 0.0% |
| Indian (Asian) | 42,460 | 1.9% |
| Indonesian | 334 | 0.0% |
| Inupiat | 85 | 0.0% |
| Iranian | 2,605 | 0.1% |
| Iraqi | 1,142 | 0.1% |
| Irish | 214,439 | 9.8% |
| Iroquois | 234 | 0.0% |
| Israeli | 482 | 0.0% |
| Italian | 140,246 | 6.4% |
| Jamaican | 2,856 | 0.1% |
| Japanese | 441 | 0.0% |
| Jordanian | 4,109 | 0.2% |
| Kenyan | 274 | 0.0% |
| Korean | 28,437 | 1.3% |
| Laotian | 649 | 0.0% |
| Latvian | 1,151 | 0.1% |
| Lebanese | 2,148 | 0.1% |
| Liberian | 49 | 0.0% |
| Lithuanian | 22,149 | 1.0% |
| Lumbee | 17 | 0.0% |
| Luxembourger | 912 | 0.0% |
| Macedonian | 2,033 | 0.1% |
| Malaysian | 448 | 0.0% |
| Maltese | 29 | 0.0% |
| Menominee | 205 | 0.0% |
| Mexican | 484,780 | 22.0% |
| Mexican American Indian | 8,612 | 0.4% |
| Mongolian | 242 | 0.0% |
| Moroccan | 1,273 | 0.1% |
| Native Hawaiian | 908 | 0.0% |
| Navajo | 693 | 0.0% |
| New Zealander | 16 | 0.0% |
| Nicaraguan | 1,200 | 0.1% |
| Nigerian | 5,935 | 0.3% |
| Northern European | 1,206 | 0.1% |
| Norwegian | 14,876 | 0.7% |
| Okinawan | 95 | 0.0% |
| Osage | 27 | 0.0% |
| Ottawa | 33 | 0.0% |
| Paiute | 31 | 0.0% |
| Pakistani | 2,729 | 0.1% |
| Palestinian | 10,790 | 0.5% |
| Panamanian | 617 | 0.0% |
| Paraguayan | 10 | 0.0% |
| Pennsylvania German | 66 | 0.0% |
| Peruvian | 2,506 | 0.1% |
| Polish | 210,636 | 9.6% |
| Portuguese | 1,408 | 0.1% |
| Potawatomi | 77 | 0.0% |
| Pueblo | 10 | 0.0% |
| Puerto Rican | 42,819 | 1.9% |
| Romanian | 7,161 | 0.3% |
| Russian | 22,250 | 1.0% |
| Salvadoran | 3,310 | 0.2% |
| Samoan | 223 | 0.0% |
| Scandinavian | 3,107 | 0.1% |
| Scotch-Irish | 6,255 | 0.3% |
| Scottish | 13,646 | 0.6% |
| Seminole | 60 | 0.0% |
| Senegalese | 494 | 0.0% |
| Serbian | 7,623 | 0.4% |
| Shoshone | 3 | 0.0% |
| Sioux | 372 | 0.0% |
| Slavic | 779 | 0.0% |
| Slovak | 7,291 | 0.3% |
| Slovene | 1,838 | 0.1% |
| Somali | 134 | 0.0% |
| South African | 545 | 0.0% |
| South American | 18,049 | 0.8% |
| South American Indian | 169 | 0.0% |
| Soviet Union | 65 | 0.0% |
| Spaniard | 4,047 | 0.2% |
| Spanish | 2,212 | 0.1% |
| Spanish American Indian | 6 | 0.0% |
| Sri Lankan | 5,777 | 0.3% |
| Subsaharan African | 21,391 | 1.0% |
| Sudanese | 86 | 0.0% |
| Swedish | 28,115 | 1.3% |
| Swiss | 3,616 | 0.2% |
| Syrian | 1,700 | 0.1% |
| Taiwanese | 22 | 0.0% |
| Thai | 55,032 | 2.5% |
| Tlingit-Haida | 22 | 0.0% |
| Tongan | 55 | 0.0% |
| Trinidadian and Tobagonian | 295 | 0.0% |
| Turkish | 1,730 | 0.1% |
| U.S. Virgin Islander | 40 | 0.0% |
| Ugandan | 126 | 0.0% |
| Ukrainian | 14,452 | 0.7% |
| Uruguayan | 177 | 0.0% |
| Ute | 44 | 0.0% |
| Venezuelan | 1,610 | 0.1% |
| Vietnamese | 251 | 0.0% |
| Welsh | 4,148 | 0.2% |
| West Indian | 287 | 0.0% |
| Yakama | 18 | 0.0% |
| Yaqui | 46 | 0.0% |
| Yugoslavian | 1,864 | 0.1% |
| Yuman | 33 | 0.0% | View All 183 Rows |
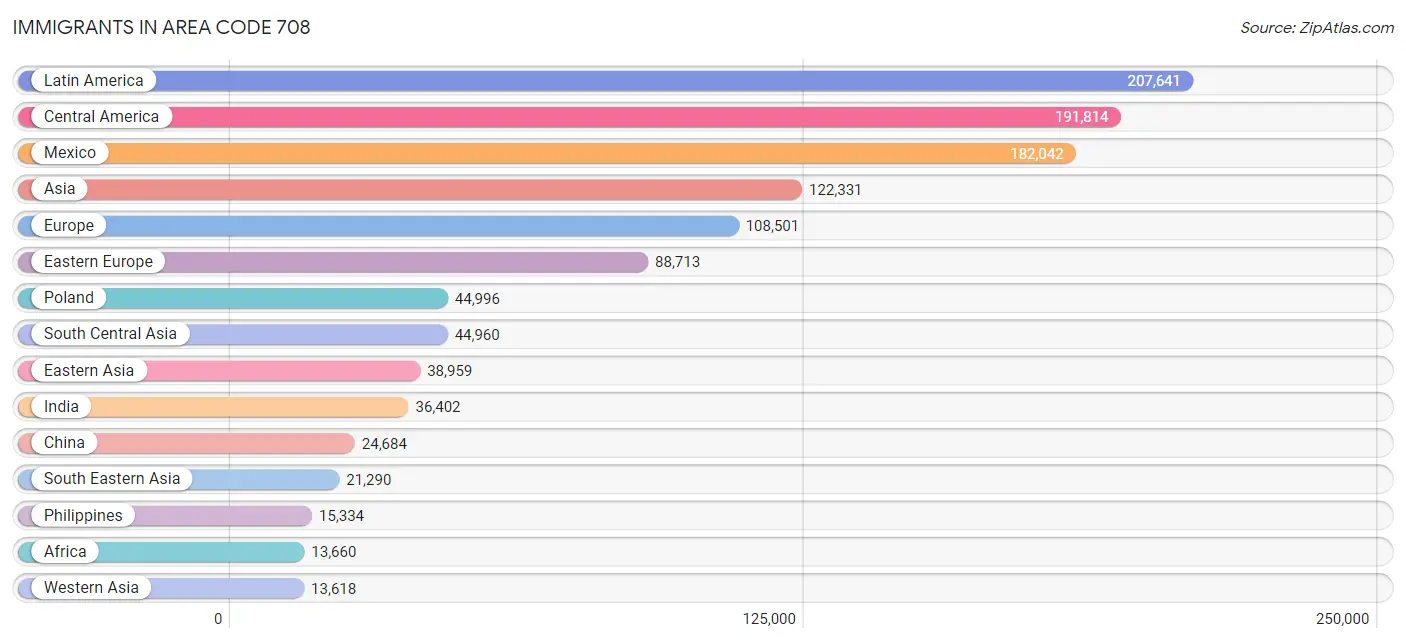
Immigrants in Area Code 708
The most numerous immigrant groups reported in Area Code 708 came from Latin America (207,641 | 9.4%), Central America (191,814 | 8.7%), Mexico (182,042 | 8.3%), Asia (122,331 | 5.6%), and Europe (108,501 | 4.9%), together accounting for 36.9% of all Area Code 708 residents.
| Immigration Origin | # Population | % Population |
| Afghanistan | 71 | 0.0% |
| Africa | 13,660 | 0.6% |
| Albania | 1,061 | 0.1% |
| Argentina | 751 | 0.0% |
| Armenia | 186 | 0.0% |
| Asia | 122,331 | 5.6% |
| Australia | 292 | 0.0% |
| Austria | 471 | 0.0% |
| Bahamas | 96 | 0.0% |
| Bangladesh | 303 | 0.0% |
| Barbados | 47 | 0.0% |
| Belarus | 2,568 | 0.1% |
| Belgium | 113 | 0.0% |
| Belize | 600 | 0.0% |
| Bolivia | 544 | 0.0% |
| Bosnia and Herzegovina | 1,777 | 0.1% |
| Brazil | 1,546 | 0.1% |
| Bulgaria | 4,914 | 0.2% |
| Cambodia | 551 | 0.0% |
| Cameroon | 224 | 0.0% |
| Canada | 2,837 | 0.1% |
| Caribbean | 3,838 | 0.2% |
| Central America | 191,814 | 8.7% |
| Chile | 402 | 0.0% |
| China | 24,684 | 1.1% |
| Colombia | 2,962 | 0.1% |
| Congo | 124 | 0.0% |
| Costa Rica | 118 | 0.0% |
| Croatia | 924 | 0.0% |
| Cuba | 1,339 | 0.1% |
| Czechoslovakia | 1,558 | 0.1% |
| Denmark | 171 | 0.0% |
| Dominica | 9 | 0.0% |
| Dominican Republic | 369 | 0.0% |
| Eastern Africa | 2,127 | 0.1% |
| Eastern Asia | 38,959 | 1.8% |
| Eastern Europe | 88,713 | 4.0% |
| Ecuador | 2,858 | 0.1% |
| Egypt | 1,700 | 0.1% |
| El Salvador | 1,932 | 0.1% |
| England | 1,231 | 0.1% |
| Eritrea | 160 | 0.0% |
| Ethiopia | 562 | 0.0% |
| Europe | 108,501 | 4.9% |
| Fiji | 15 | 0.0% |
| France | 704 | 0.0% |
| Germany | 3,331 | 0.2% |
| Ghana | 714 | 0.0% |
| Greece | 3,290 | 0.2% |
| Grenada | 5 | 0.0% |
| Guatemala | 4,762 | 0.2% |
| Guyana | 61 | 0.0% |
| Haiti | 569 | 0.0% |
| Honduras | 1,477 | 0.1% |
| Hong Kong | 1,440 | 0.1% |
| Hungary | 296 | 0.0% |
| India | 36,402 | 1.7% |
| Indonesia | 182 | 0.0% |
| Iran | 1,644 | 0.1% |
| Iraq | 1,415 | 0.1% |
| Ireland | 2,175 | 0.1% |
| Israel | 979 | 0.0% |
| Italy | 4,589 | 0.2% |
| Jamaica | 1,158 | 0.1% |
| Japan | 2,532 | 0.1% |
| Jordan | 4,042 | 0.2% |
| Kazakhstan | 625 | 0.0% |
| Kenya | 396 | 0.0% |
| Korea | 10,736 | 0.5% |
| Kuwait | 515 | 0.0% |
| Laos | 87 | 0.0% |
| Latin America | 207,641 | 9.4% |
| Latvia | 369 | 0.0% |
| Lebanon | 822 | 0.0% |
| Liberia | 51 | 0.0% |
| Lithuania | 4,467 | 0.2% |
| Malaysia | 420 | 0.0% |
| Mexico | 182,042 | 8.3% |
| Middle Africa | 471 | 0.0% |
| Moldova | 1,304 | 0.1% |
| Morocco | 1,015 | 0.1% |
| Nepal | 358 | 0.0% |
| Netherlands | 374 | 0.0% |
| Nicaragua | 548 | 0.0% |
| Nigeria | 4,454 | 0.2% |
| North Macedonia | 1,413 | 0.1% |
| Northern Africa | 3,698 | 0.2% |
| Northern Europe | 5,597 | 0.3% |
| Norway | 123 | 0.0% |
| Oceania | 458 | 0.0% |
| Pakistan | 3,980 | 0.2% |
| Panama | 326 | 0.0% |
| Peru | 1,432 | 0.1% |
| Philippines | 15,334 | 0.7% |
| Poland | 44,996 | 2.1% |
| Portugal | 178 | 0.0% |
| Romania | 3,320 | 0.2% |
| Russia | 3,667 | 0.2% |
| Saudi Arabia | 821 | 0.0% |
| Scotland | 229 | 0.0% |
| Senegal | 353 | 0.0% |
| Serbia | 2,508 | 0.1% |
| Singapore | 116 | 0.0% |
| Somalia | 83 | 0.0% |
| South Africa | 910 | 0.0% |
| South America | 11,989 | 0.5% |
| South Central Asia | 44,960 | 2.0% |
| South Eastern Asia | 21,290 | 1.0% |
| Southern Europe | 8,625 | 0.4% |
| Spain | 547 | 0.0% |
| Sri Lanka | 128 | 0.0% |
| St. Vincent and the Grenadines | 15 | 0.0% |
| Sudan | 146 | 0.0% |
| Sweden | 233 | 0.0% |
| Switzerland | 137 | 0.0% |
| Syria | 2,036 | 0.1% |
| Taiwan | 1,846 | 0.1% |
| Thailand | 1,107 | 0.1% |
| Trinidad and Tobago | 216 | 0.0% |
| Turkey | 1,382 | 0.1% |
| Uganda | 260 | 0.0% |
| Ukraine | 10,877 | 0.5% |
| Uruguay | 109 | 0.0% |
| Uzbekistan | 292 | 0.0% |
| Venezuela | 1,281 | 0.1% |
| Vietnam | 3,155 | 0.1% |
| West Indies | 15 | 0.0% |
| Western Africa | 5,929 | 0.3% |
| Western Asia | 13,618 | 0.6% |
| Western Europe | 5,154 | 0.2% |
| Yemen | 661 | 0.0% |
| Zaire | 45 | 0.0% |
| Zimbabwe | 48 | 0.0% | View All 133 Rows |
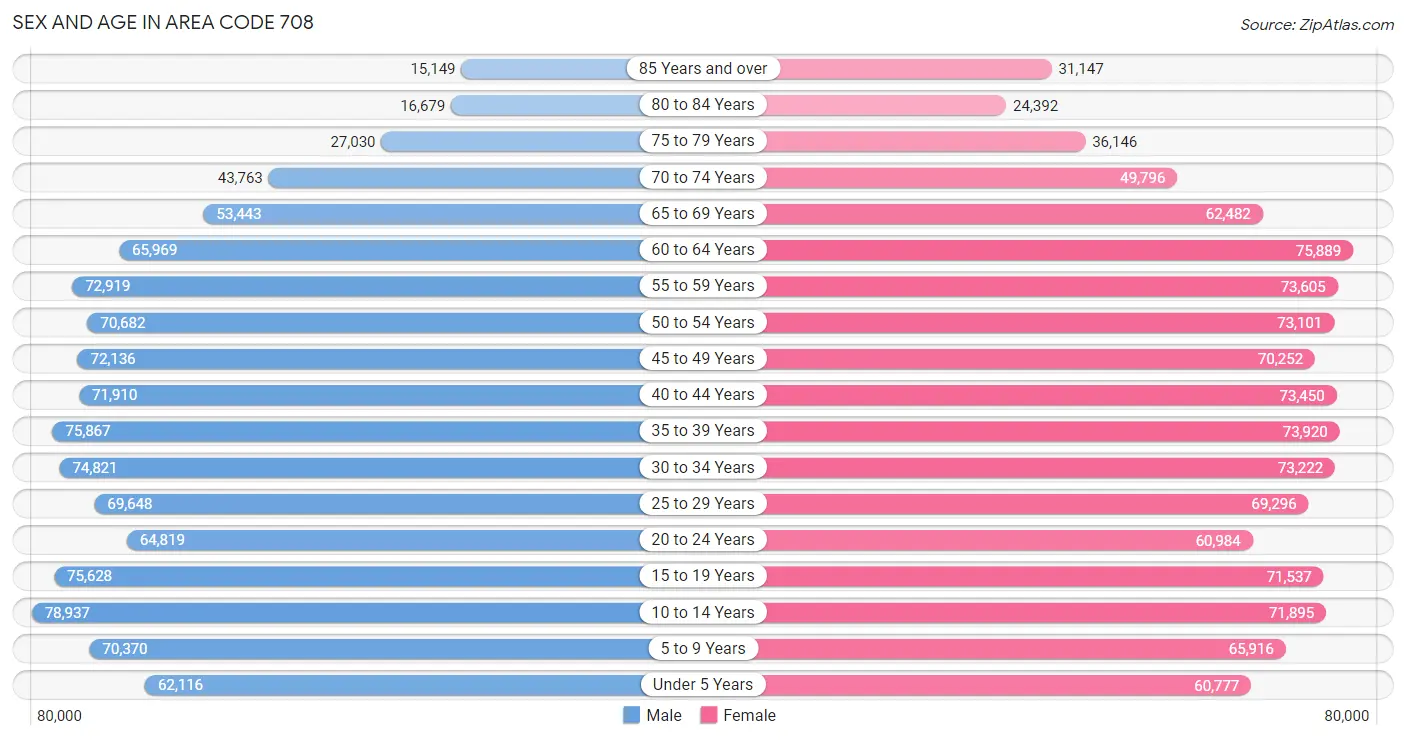
Sex and Age in Area Code 708
Sex and Age in Area Code 708
The most populous age groups in Area Code 708 are 10 to 14 Years (78,937 | 7.3%) for men and 60 to 64 Years (75,889 | 6.8%) for women.
| Age Bracket | Male | Female |
| Under 5 Years | 62,116 (5.7%) | 60,777 (5.4%) |
| 5 to 9 Years | 70,370 (6.5%) | 65,916 (5.9%) |
| 10 to 14 Years | 78,937 (7.3%) | 71,895 (6.4%) |
| 15 to 19 Years | 75,628 (7.0%) | 71,537 (6.4%) |
| 20 to 24 Years | 64,819 (6.0%) | 60,984 (5.5%) |
| 25 to 29 Years | 69,648 (6.4%) | 69,296 (6.2%) |
| 30 to 34 Years | 74,821 (6.9%) | 73,222 (6.6%) |
| 35 to 39 Years | 75,867 (7.0%) | 73,920 (6.6%) |
| 40 to 44 Years | 71,910 (6.7%) | 73,450 (6.6%) |
| 45 to 49 Years | 72,136 (6.7%) | 70,252 (6.3%) |
| 50 to 54 Years | 70,682 (6.5%) | 73,101 (6.5%) |
| 55 to 59 Years | 72,919 (6.7%) | 73,605 (6.6%) |
| 60 to 64 Years | 65,969 (6.1%) | 75,889 (6.8%) |
| 65 to 69 Years | 53,443 (4.9%) | 62,482 (5.6%) |
| 70 to 74 Years | 43,763 (4.1%) | 49,796 (4.4%) |
| 75 to 79 Years | 27,030 (2.5%) | 36,146 (3.2%) |
| 80 to 84 Years | 16,679 (1.5%) | 24,392 (2.2%) |
| 85 Years and over | 15,149 (1.4%) | 31,147 (2.8%) |
| Total | 1,081,886 (100.0%) | 1,117,807 (100.0%) |
Families and Households in Area Code 708
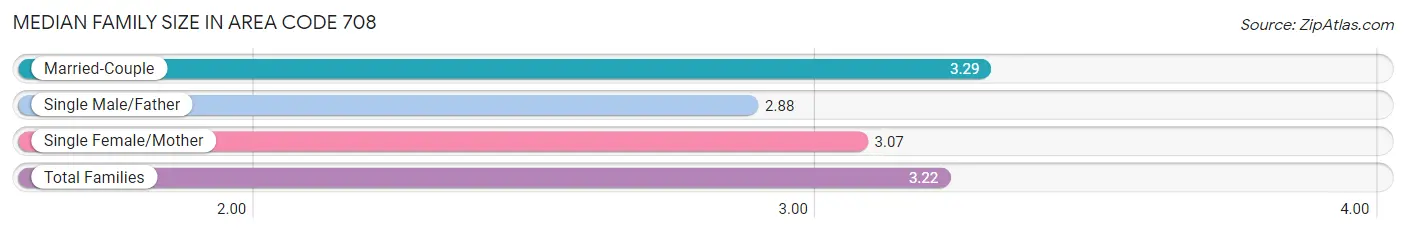
Median Family Size in Area Code 708
The median family size in Area Code 708 is 3.22 persons per family, with married-couple families (398,085 | 72.8%) accounting for the largest median family size of 3.29425 persons per family. On the other hand, single male/father families (41,754 | 7.6%) represent the smallest median family size with 2.88 persons per family.
| Family Type | # Families | Family Size |
| Married-Couple | 398,085 (72.8%) | 3.29 |
| Single Male/Father | 41,754 (7.6%) | 2.88 |
| Single Female/Mother | 107,103 (19.6%) | 3.07 |
| Total Families | 546,942 (100.0%) | 3.22 |
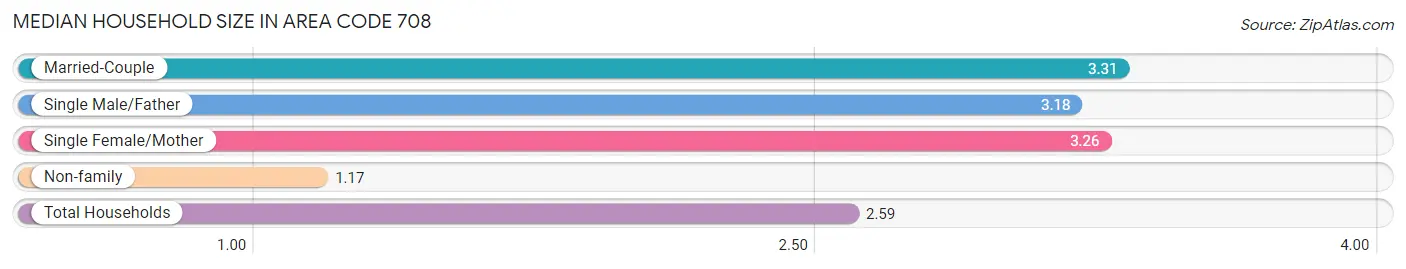
Median Household Size in Area Code 708
The median household size in Area Code 708 is 2.59 persons per household, with married-couple households (398,085 | 48.0%) accounting for the largest median household size of 3.31053 persons per household. non-family households (281,769 | 34.0%) represent the smallest median household size with 1.17 persons per household.
| Household Type | # Households | Household Size |
| Married-Couple | 398,085 (48.0%) | 3.31 |
| Single Male/Father | 41,754 (5.0%) | 3.18 |
| Single Female/Mother | 107,103 (12.9%) | 3.26 |
| Non-family | 281,769 (34.0%) | 1.17 |
| Total Households | 828,711 (100.0%) | 2.59 |
Household Size by Marriage Status in Area Code 708
Out of a total of 828,711 households in Area Code 708, 546,942 (66.0%) are family households, while 281,769 (34.0%) are nonfamily households. The most numerous type of family households are 2-person households, comprising 214,592, and the most common type of nonfamily households are 1-person households, comprising 242,012.
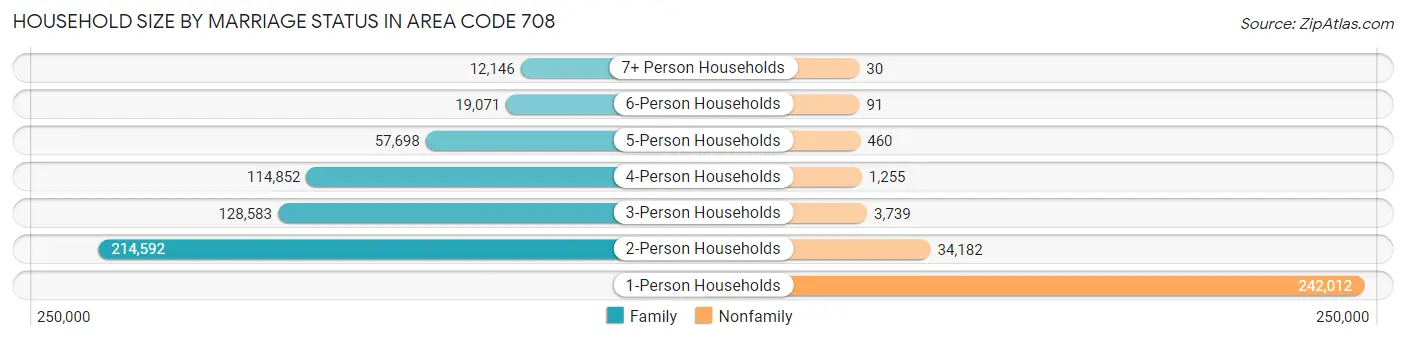
| Household Size | Family Households | Nonfamily Households |
| 1-Person Households | - | 242,012 (29.2%) |
| 2-Person Households | 214,592 (25.9%) | 34,182 (4.1%) |
| 3-Person Households | 128,583 (15.5%) | 3,739 (0.4%) |
| 4-Person Households | 114,852 (13.9%) | 1,255 (0.2%) |
| 5-Person Households | 57,698 (7.0%) | 460 (0.1%) |
| 6-Person Households | 19,071 (2.3%) | 91 (0.0%) |
| 7+ Person Households | 12,146 (1.5%) | 30 (0.0%) |
| Total | 546,942 (66.0%) | 281,769 (34.0%) |
Female Fertility in Area Code 708
Fertility by Age in Area Code 708
Average fertility rate in Area Code 708 is 52.7 births per 1,000 women. Women in the age bracket of 20 to 34 years have the highest fertility rate with 92.3 births per 1,000 women. Women in the age bracket of 20 to 34 years acount for 68.8% of all women with births.
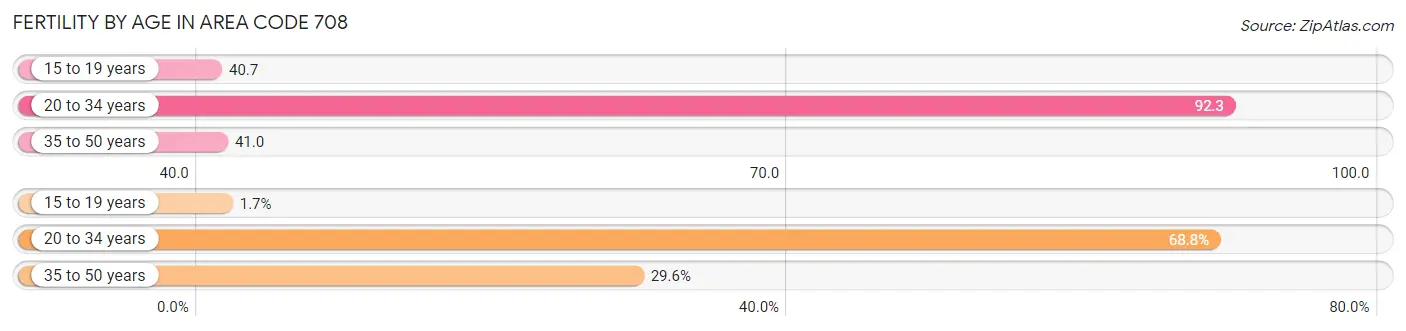
| Age Bracket | Women with Births | Births / 1,000 Women |
| 15 to 19 years | 422 (1.7%) | 40.7 |
| 20 to 34 years | 17,249 (68.8%) | 92.3 |
| 35 to 50 years | 7,420 (29.6%) | 41.0 |
| Total | 25,091 (100.0%) | 52.7 |
Fertility by Age by Marriage Status in Area Code 708
65.1% of women with births (25,091) in Area Code 708 are married. The highest percentage of unmarried women with births falls into 15 to 19 years age bracket with 100.0% of them unmarried at the time of birth, while the lowest percentage of unmarried women with births belong to 20 to 34 years age bracket with 39.2% of them unmarried.
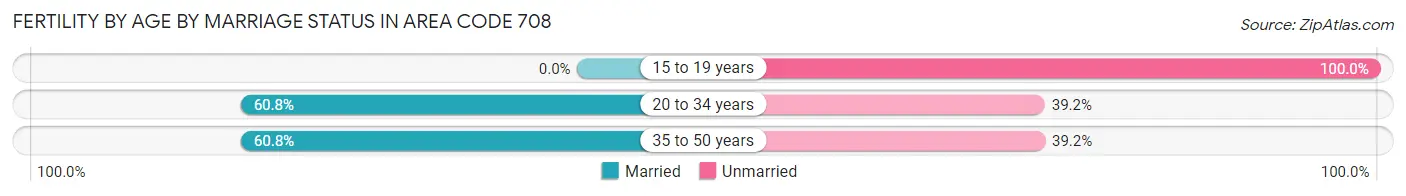
| Age Bracket | Married | Unmarried |
| 15 to 19 years | 0 (0.0%) | 422 (100.0%) |
| 20 to 34 years | 10,495 (60.8%) | 6,754 (39.2%) |
| 35 to 50 years | 4,511 (60.8%) | 2,909 (39.2%) |
| Total | 16,322 (65.0%) | 8,769 (34.9%) |
Fertility by Education in Area Code 708
Average fertility rate in Area Code 708 is 52.7 births per 1,000 women. Women with the education attainment of graduate degree have the highest fertility rate of 77.9 births per 1,000 women, while women with the education attainment of less than high school have the lowest fertility at 42.7 births per 1,000 women. Women with the education attainment of bachelor's degree represent 26.3% of all women with births.
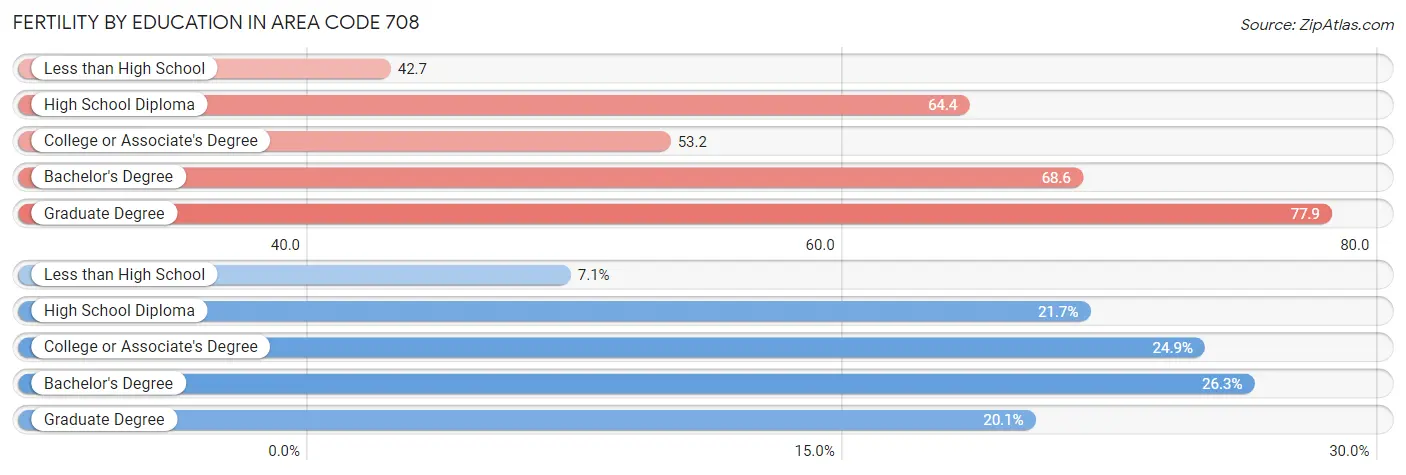
| Educational Attainment | Women with Births | Births / 1,000 Women |
| Less than High School | 1,775 (7.1%) | 42.7 |
| High School Diploma | 5,434 (21.7%) | 64.4 |
| College or Associate's Degree | 6,242 (24.9%) | 53.2 |
| Bachelor's Degree | 6,592 (26.3%) | 68.6 |
| Graduate Degree | 5,048 (20.1%) | 77.9 |
| Total | 25,091 (100.0%) | 52.7 |
Fertility by Education by Marriage Status in Area Code 708
34.9% of women with births in Area Code 708 are unmarried. Women with the educational attainment of bachelor's degree are most likely to be married with 62.6% of them married at childbirth, while women with the educational attainment of less than high school are least likely to be married with 68.2% of them unmarried at childbirth.
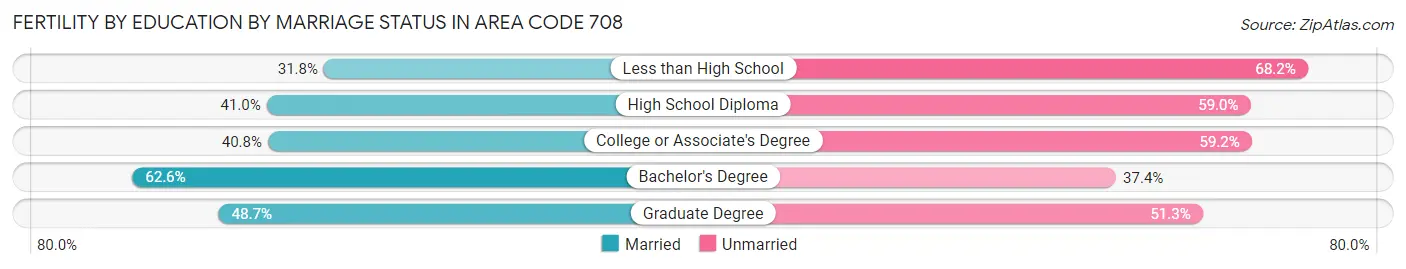
| Educational Attainment | Married | Unmarried |
| Less than High School | 564 (31.8%) | 1,211 (68.2%) |
| High School Diploma | 2,228 (41.0%) | 3,206 (59.0%) |
| College or Associate's Degree | 2,546 (40.8%) | 3,696 (59.2%) |
| Bachelor's Degree | 4,128 (62.6%) | 2,464 (37.4%) |
| Graduate Degree | 2,459 (48.7%) | 2,589 (51.3%) |
| Total | 16,322 (65.0%) | 8,769 (34.9%) |
Employment Characteristics in Area Code 708
Employment by Class of Employer in Area Code 708
Among the 1,049,930 employed individuals in Area Code 708, private company employees (725,062 | 69.1%), not-for-profit organizations (98,128 | 9.3%), and local government employees (78,785 | 7.5%) make up the most common classes of employment.
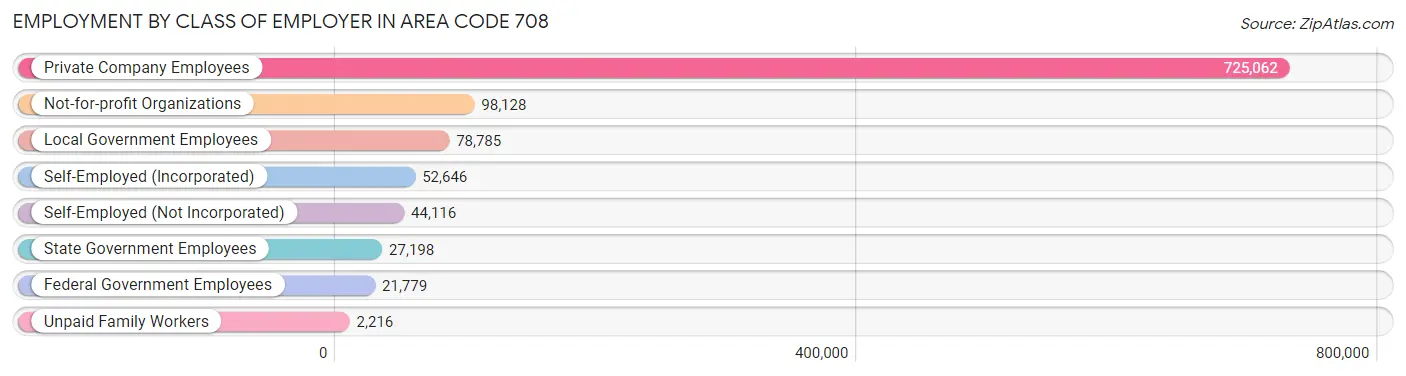
| Employer Class | # Employees | % Employees |
| Private Company Employees | 725,062 | 69.1% |
| Self-Employed (Incorporated) | 52,646 | 5.0% |
| Self-Employed (Not Incorporated) | 44,116 | 4.2% |
| Not-for-profit Organizations | 98,128 | 9.3% |
| Local Government Employees | 78,785 | 7.5% |
| State Government Employees | 27,198 | 2.6% |
| Federal Government Employees | 21,779 | 2.1% |
| Unpaid Family Workers | 2,216 | 0.2% |
| Total | 1,049,930 | 100.0% |
Employment Status by Age in Area Code 708
According to the labor force statistics for Area Code 708, out of the total population over 16 years of age (1,758,950), 65.6% or 1,153,871 individuals are in the labor force, with 6.3% or 73,155 of them unemployed. The age group with the highest labor force participation rate is 35 to 44 years, with 85.8% or 253,207 individuals in the labor force. Within the labor force, the 16 to 19 years age range has the highest percentage of unemployed individuals, with 1,779.1% or 797,090 of them being unemployed.
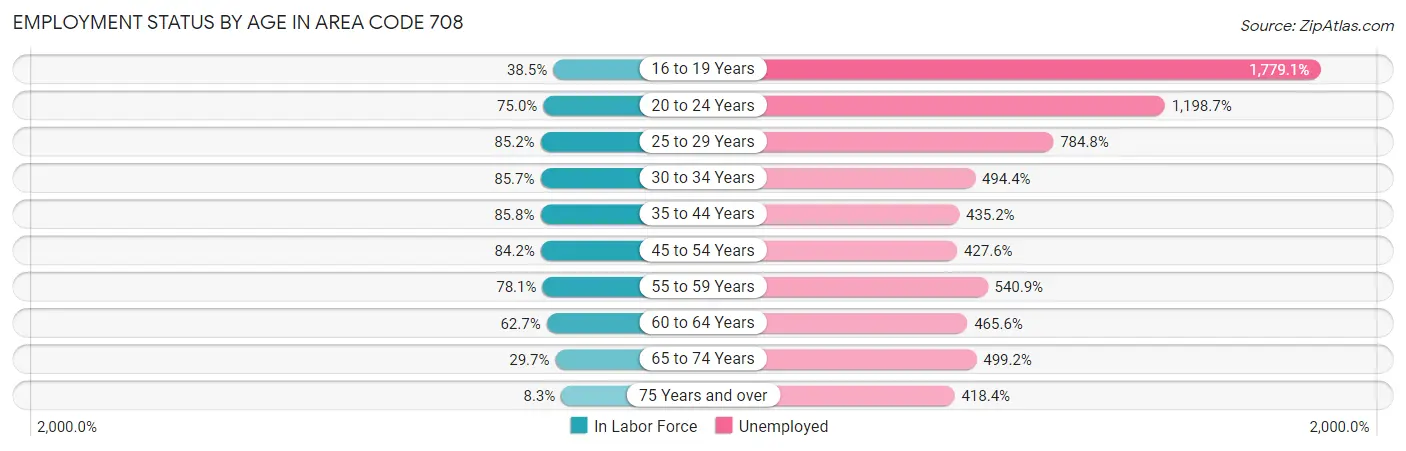
| Age Bracket | In Labor Force | Unemployed |
| 16 to 19 Years | 44,804 (38.5%) | 797,090 (1,779.1%) |
| 20 to 24 Years | 94,359 (75.0%) | 1,131,153 (1,198.7%) |
| 25 to 29 Years | 118,417 (85.2%) | 929,376 (784.8%) |
| 30 to 34 Years | 126,813 (85.7%) | 626,968 (494.4%) |
| 35 to 44 Years | 253,217 (85.8%) | 1,101,957 (435.2%) |
| 45 to 54 Years | 240,971 (84.2%) | 1,030,452 (427.6%) |
| 55 to 59 Years | 114,462 (78.1%) | 619,141 (540.9%) |
| 60 to 64 Years | 88,934 (62.7%) | 414,063 (465.6%) |
| 65 to 74 Years | 62,310 (29.7%) | 311,007 (499.2%) |
| 75 Years and over | 12,523 (8.3%) | 52,405 (418.4%) |
| Total | 1,153,796 (65.6%) | 73,209 (6.3%) |
Employment Status by Educational Attainment in Area Code 708
According to labor force statistics for Area Code 708, 81.3% of individuals (940,155) out of the total population between 25 and 64 years of age (1,156,687) are in the labor force, with 500.6% or 4,706,416 of them being unemployed. The group with the highest labor force participation rate are those with the educational attainment of bachelor's degree or higher, with 87.5% or 406,715 individuals in the labor force. Within the labor force, individuals with less than high school education have the highest percentage of unemployment, with 972.1% or 665,441 of them being unemployed.
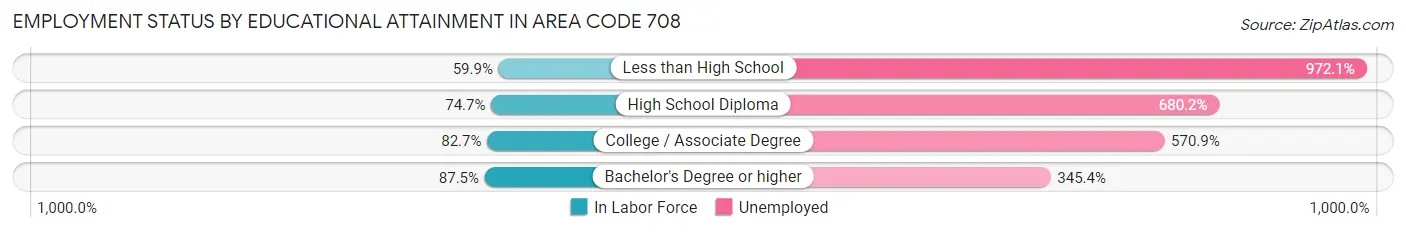
| Educational Attainment | In Labor Force | Unemployed |
| Less than High School | 68,453 (59.9%) | 1,110,556 (972.1%) |
| High School Diploma | 197,634 (74.7%) | 1,799,551 (680.2%) |
| College / Associate Degree | 258,664 (82.7%) | 1,786,683 (570.9%) |
| Bachelor's Degree or higher | 406,724 (87.5%) | 1,605,844 (345.4%) |
| Total | 940,128 (81.3%) | 5,790,375 (500.6%) |
Employment Occupations by Sex in Area Code 708
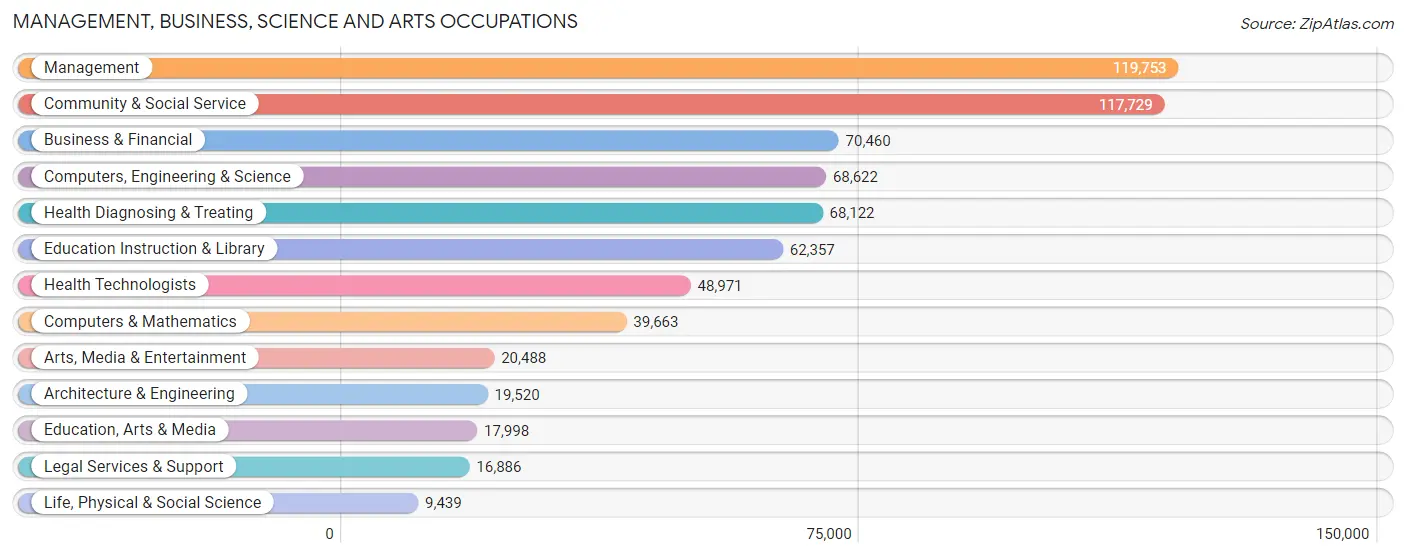
Management, Business, Science and Arts Occupations
The most common Management, Business, Science and Arts occupations in Area Code 708 are Management (119,753 | 11.2%), Community & Social Service (117,729 | 11.0%), Business & Financial (70,460 | 6.6%), Computers, Engineering & Science (68,622 | 6.4%), and Health Diagnosing & Treating (68,122 | 6.4%).
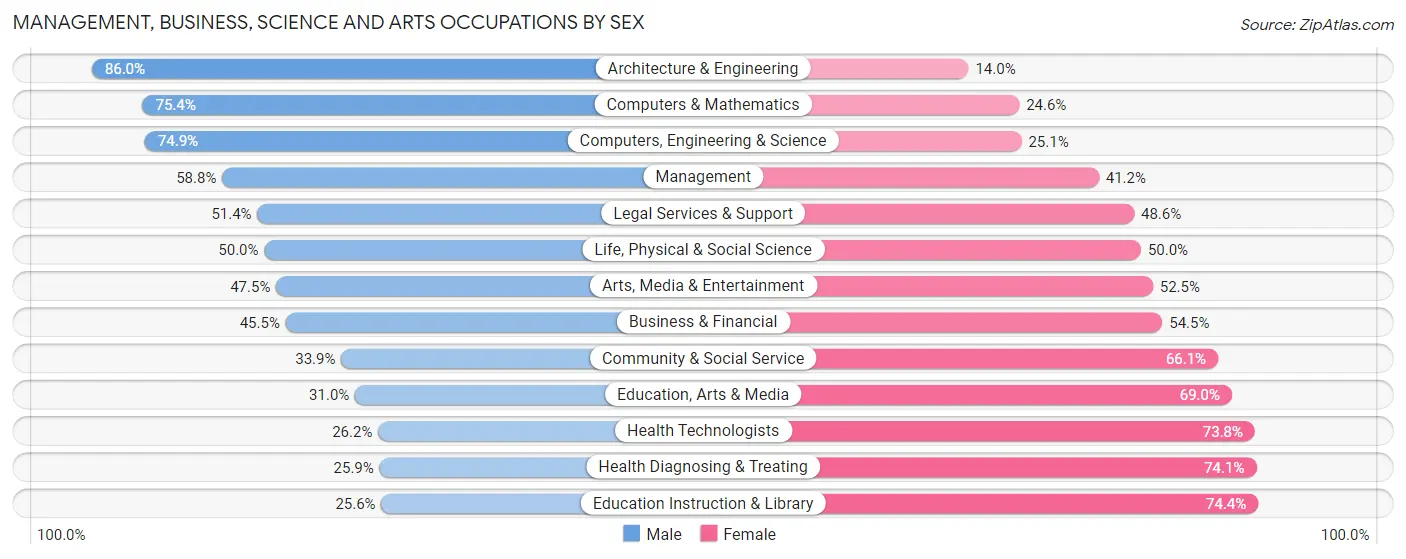
Management, Business, Science and Arts Occupations by Sex
Within the Management, Business, Science and Arts occupations in Area Code 708, the most male-oriented occupations are Architecture & Engineering (86.0%), Computers & Mathematics (75.4%), and Computers, Engineering & Science (74.9%), while the most female-oriented occupations are Education Instruction & Library (74.4%), Health Diagnosing & Treating (74.1%), and Health Technologists (73.8%).
| Occupation | Male | Female |
| Management | 70,376 (58.8%) | 49,377 (41.2%) |
| Business & Financial | 32,080 (45.5%) | 38,380 (54.5%) |
| Computers, Engineering & Science | 51,395 (74.9%) | 17,227 (25.1%) |
| Computers & Mathematics | 29,897 (75.4%) | 9,766 (24.6%) |
| Architecture & Engineering | 16,780 (86.0%) | 2,740 (14.0%) |
| Life, Physical & Social Science | 4,718 (50.0%) | 4,721 (50.0%) |
| Community & Social Service | 39,946 (33.9%) | 77,783 (66.1%) |
| Education, Arts & Media | 5,586 (31.0%) | 12,412 (69.0%) |
| Legal Services & Support | 8,685 (51.4%) | 8,201 (48.6%) |
| Education Instruction & Library | 15,941 (25.6%) | 46,416 (74.4%) |
| Arts, Media & Entertainment | 9,734 (47.5%) | 10,754 (52.5%) |
| Health Diagnosing & Treating | 17,671 (25.9%) | 50,451 (74.1%) |
| Health Technologists | 12,847 (26.2%) | 36,124 (73.8%) |
| Total (Category) | 211,468 (47.5%) | 233,218 (52.4%) |
| Total (Overall) | 569,934 (53.1%) | 502,347 (46.9%) |
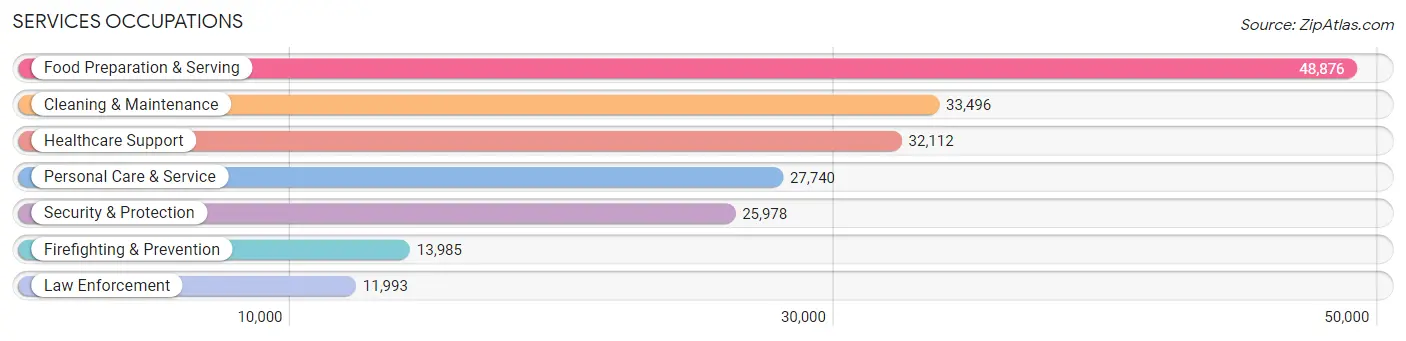
Services Occupations
The most common Services occupations in Area Code 708 are Food Preparation & Serving (48,876 | 4.6%), Cleaning & Maintenance (33,496 | 3.1%), Healthcare Support (32,112 | 3.0%), Personal Care & Service (27,740 | 2.6%), and Security & Protection (25,978 | 2.4%).
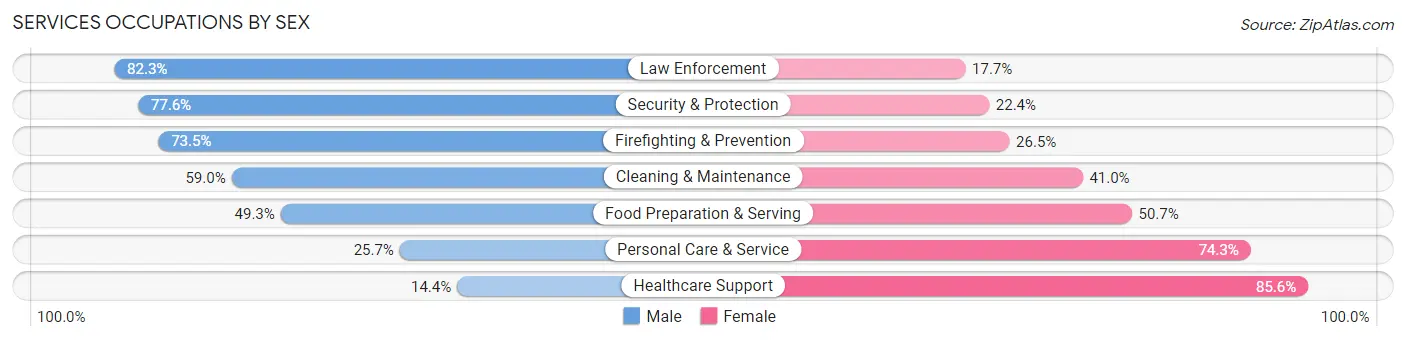
Services Occupations by Sex
Within the Services occupations in Area Code 708, the most male-oriented occupations are Law Enforcement (82.3%), Security & Protection (77.6%), and Firefighting & Prevention (73.5%), while the most female-oriented occupations are Healthcare Support (85.6%), Personal Care & Service (74.3%), and Food Preparation & Serving (50.7%).
| Occupation | Male | Female |
| Healthcare Support | 4,614 (14.4%) | 27,498 (85.6%) |
| Security & Protection | 20,149 (77.6%) | 5,829 (22.4%) |
| Firefighting & Prevention | 10,284 (73.5%) | 3,701 (26.5%) |
| Law Enforcement | 9,865 (82.3%) | 2,128 (17.7%) |
| Food Preparation & Serving | 24,100 (49.3%) | 24,776 (50.7%) |
| Cleaning & Maintenance | 19,773 (59.0%) | 13,723 (41.0%) |
| Personal Care & Service | 7,135 (25.7%) | 20,605 (74.3%) |
| Total (Category) | 75,771 (45.1%) | 92,431 (54.9%) |
| Total (Overall) | 569,934 (53.1%) | 502,347 (46.9%) |
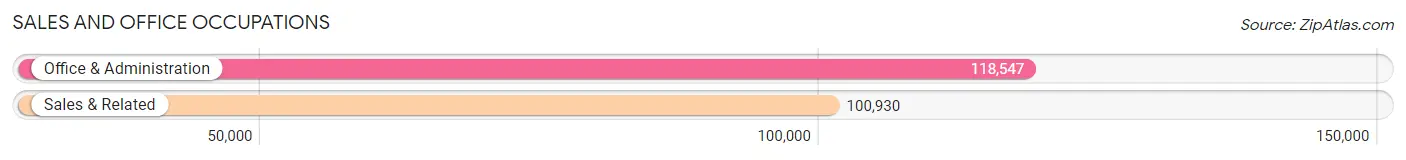
Sales and Office Occupations
The most common Sales and Office occupations in Area Code 708 are Office & Administration (118,547 | 11.1%), and Sales & Related (100,930 | 9.4%).
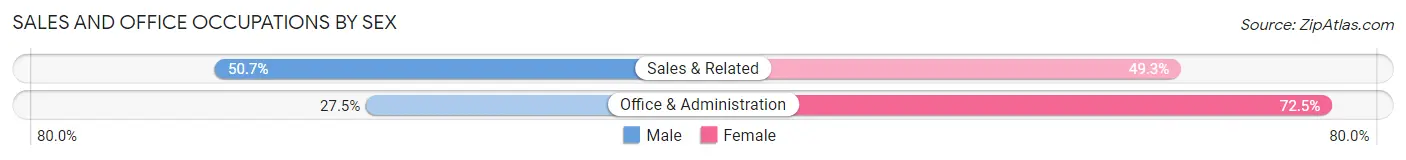
Sales and Office Occupations by Sex
| Occupation | Male | Female |
| Sales & Related | 51,165 (50.7%) | 49,765 (49.3%) |
| Office & Administration | 32,550 (27.5%) | 85,997 (72.5%) |
| Total (Category) | 83,715 (38.1%) | 135,762 (61.9%) |
| Total (Overall) | 569,934 (53.1%) | 502,347 (46.9%) |
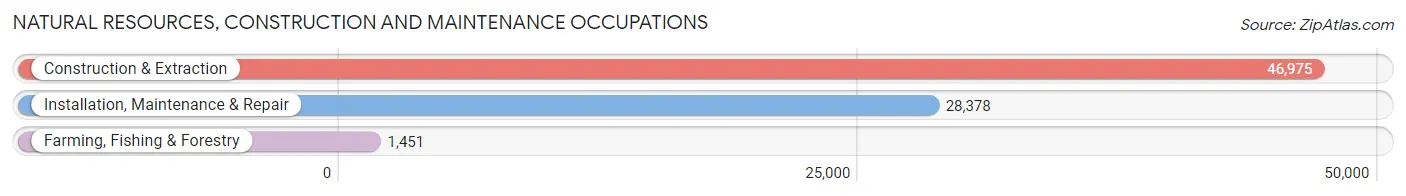
Natural Resources, Construction and Maintenance Occupations
The most common Natural Resources, Construction and Maintenance occupations in Area Code 708 are Construction & Extraction (46,975 | 4.4%), Installation, Maintenance & Repair (28,378 | 2.6%), and Farming, Fishing & Forestry (1,451 | 0.1%).
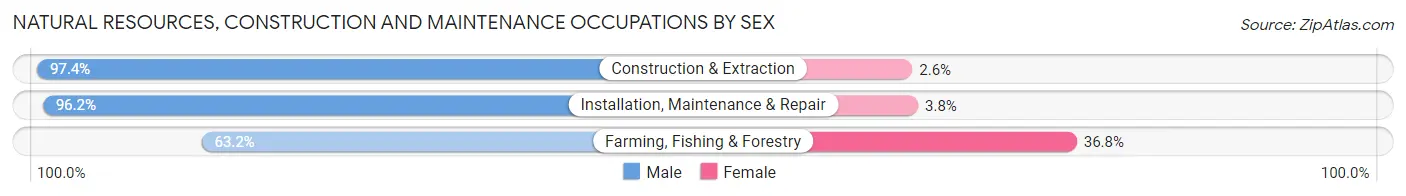
Natural Resources, Construction and Maintenance Occupations by Sex
| Occupation | Male | Female |
| Farming, Fishing & Forestry | 917 (63.2%) | 534 (36.8%) |
| Construction & Extraction | 45,765 (97.4%) | 1,210 (2.6%) |
| Installation, Maintenance & Repair | 27,305 (96.2%) | 1,073 (3.8%) |
| Total (Category) | 73,987 (96.3%) | 2,817 (3.7%) |
| Total (Overall) | 569,934 (53.1%) | 502,347 (46.9%) |
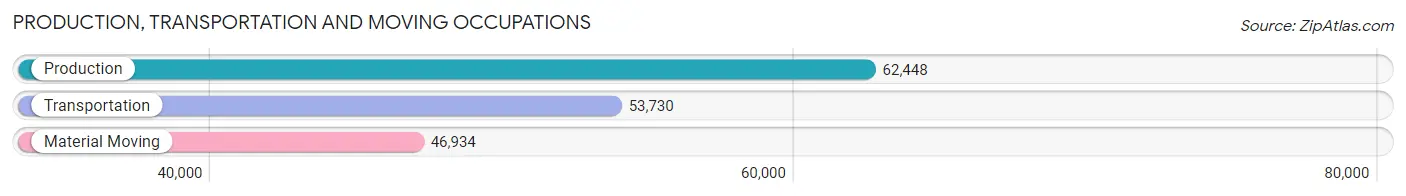
Production, Transportation and Moving Occupations
The most common Production, Transportation and Moving occupations in Area Code 708 are Production (62,448 | 5.8%), Transportation (53,730 | 5.0%), and Material Moving (46,934 | 4.4%).
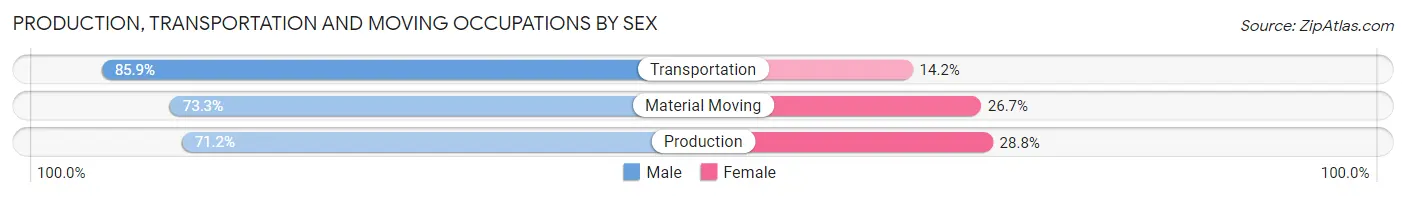
Production, Transportation and Moving Occupations by Sex
| Occupation | Male | Female |
| Production | 44,447 (71.2%) | 18,001 (28.8%) |
| Transportation | 46,126 (85.9%) | 7,604 (14.1%) |
| Material Moving | 34,420 (73.3%) | 12,514 (26.7%) |
| Total (Category) | 124,993 (76.6%) | 38,119 (23.4%) |
| Total (Overall) | 569,934 (53.1%) | 502,347 (46.9%) |
Employment Industries by Sex in Area Code 708
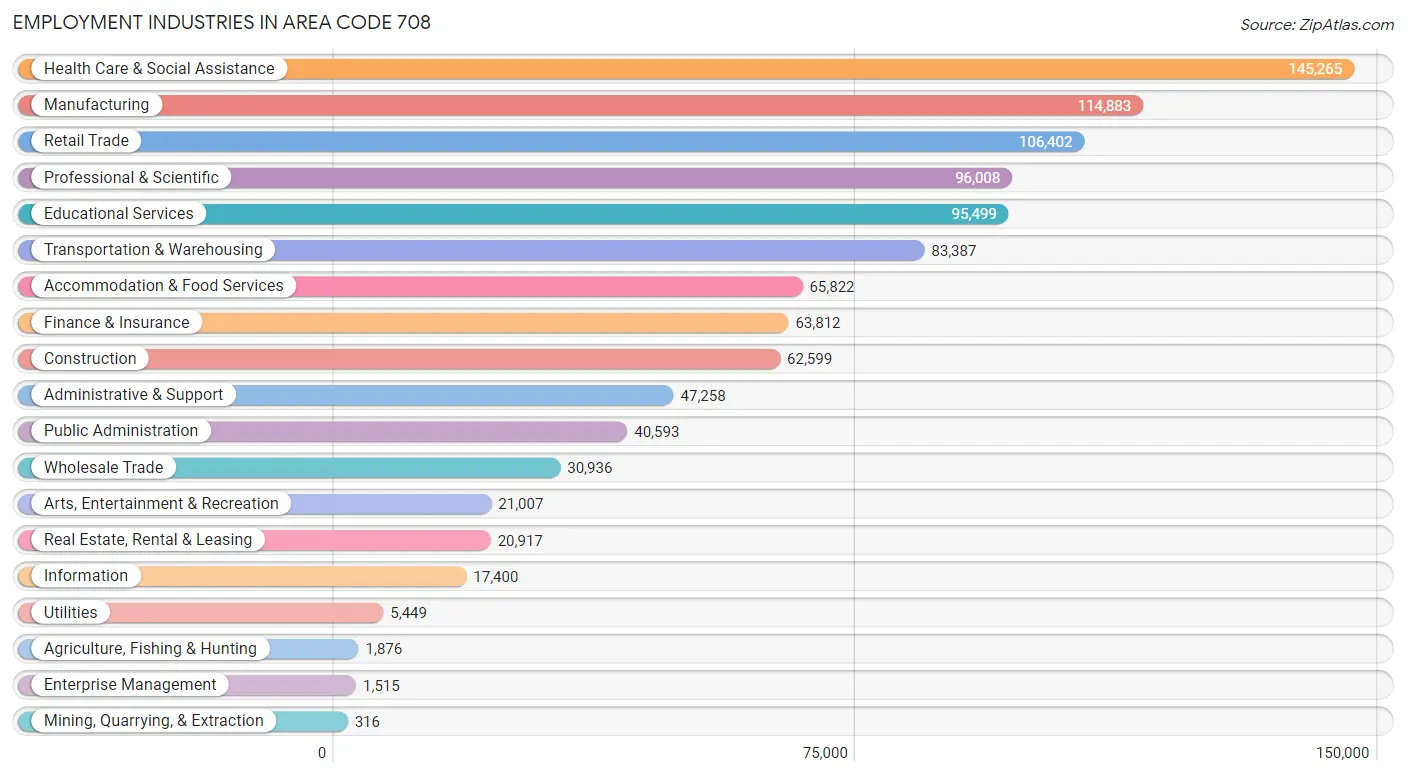
Employment Industries in Area Code 708
The major employment industries in Area Code 708 include Health Care & Social Assistance (145,265 | 13.6%), Manufacturing (114,883 | 10.7%), Retail Trade (106,402 | 9.9%), Professional & Scientific (96,008 | 8.9%), and Educational Services (95,499 | 8.9%).
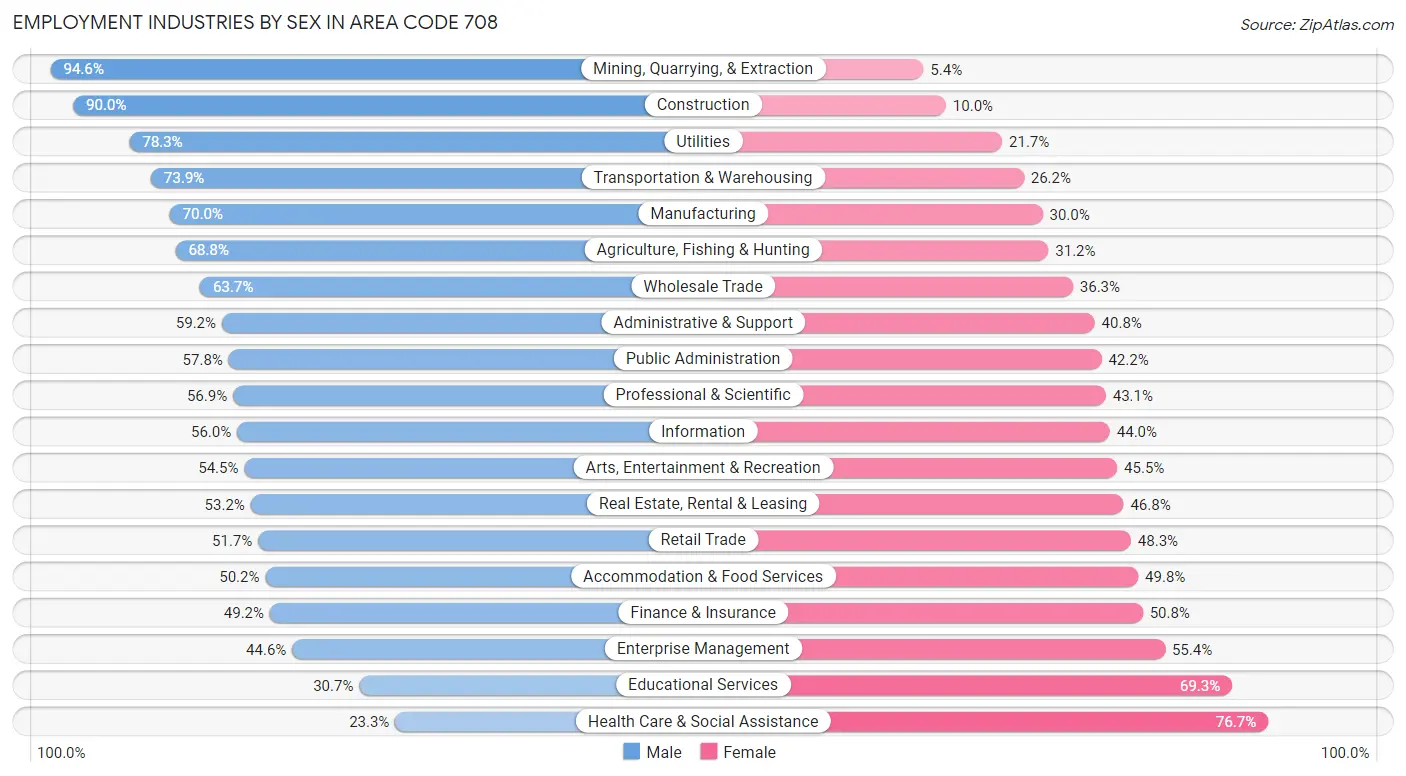
Employment Industries by Sex in Area Code 708
The Area Code 708 industries that see more men than women are Mining, Quarrying, & Extraction (94.6%), Construction (90.0%), and Utilities (78.3%), whereas the industries that tend to have a higher number of women are Health Care & Social Assistance (76.7%), Educational Services (69.3%), and Enterprise Management (55.4%).
| Industry | Male | Female |
| Agriculture, Fishing & Hunting | 1,290 (68.8%) | 586 (31.2%) |
| Mining, Quarrying, & Extraction | 299 (94.6%) | 17 (5.4%) |
| Construction | 56,320 (90.0%) | 6,279 (10.0%) |
| Manufacturing | 80,383 (70.0%) | 34,500 (30.0%) |
| Wholesale Trade | 19,702 (63.7%) | 11,234 (36.3%) |
| Retail Trade | 54,980 (51.7%) | 51,422 (48.3%) |
| Transportation & Warehousing | 61,584 (73.9%) | 21,803 (26.2%) |
| Utilities | 4,268 (78.3%) | 1,181 (21.7%) |
| Information | 9,749 (56.0%) | 7,651 (44.0%) |
| Finance & Insurance | 31,417 (49.2%) | 32,395 (50.8%) |
| Real Estate, Rental & Leasing | 11,129 (53.2%) | 9,788 (46.8%) |
| Professional & Scientific | 54,596 (56.9%) | 41,412 (43.1%) |
| Enterprise Management | 676 (44.6%) | 839 (55.4%) |
| Administrative & Support | 27,963 (59.2%) | 19,295 (40.8%) |
| Educational Services | 29,356 (30.7%) | 66,143 (69.3%) |
| Health Care & Social Assistance | 33,830 (23.3%) | 111,435 (76.7%) |
| Arts, Entertainment & Recreation | 11,453 (54.5%) | 9,554 (45.5%) |
| Accommodation & Food Services | 33,022 (50.2%) | 32,800 (49.8%) |
| Public Administration | 23,447 (57.8%) | 17,146 (42.2%) |
| Total | 569,934 (53.1%) | 502,347 (46.9%) |
Education in Area Code 708
School Enrollment in Area Code 708
The most common levels of schooling among the 545,942 students in Area Code 708 are high school (126,010 | 23.1%), middle school (118,009 | 21.6%), and elementary school (108,383 | 19.9%).
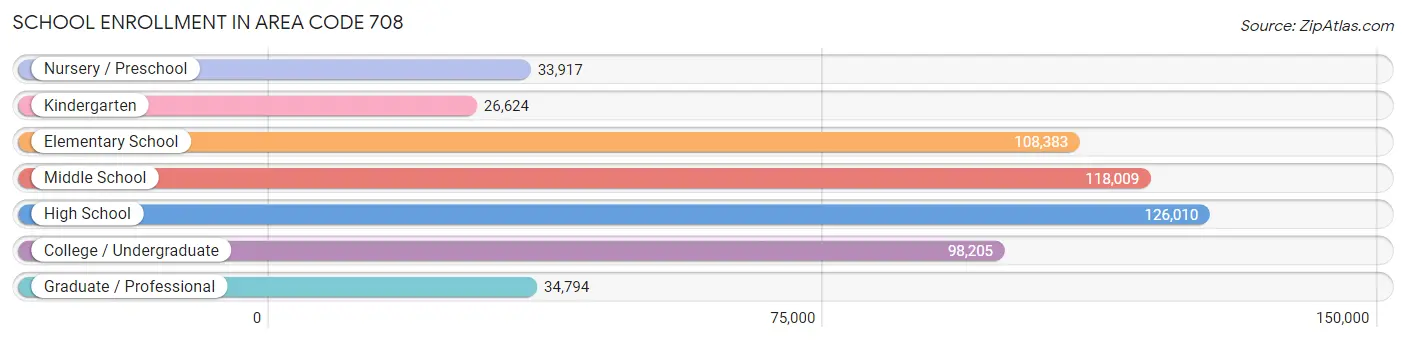
| School Level | # Students | % Students |
| Nursery / Preschool | 33,917 | 6.2% |
| Kindergarten | 26,624 | 4.9% |
| Elementary School | 108,383 | 19.9% |
| Middle School | 118,009 | 21.6% |
| High School | 126,010 | 23.1% |
| College / Undergraduate | 98,205 | 18.0% |
| Graduate / Professional | 34,794 | 6.4% |
| Total | 545,942 | 100.0% |
School Enrollment by Age by Funding Source in Area Code 708
Out of a total of 545,942 students who are enrolled in schools in Area Code 708, 105,242 (19.3%) attend a private institution, while the remaining 440,700 (80.7%) are enrolled in public schools. The age group of 25 to 34 year olds has the highest likelihood of being enrolled in private schools, with 13,598 (43.4% in the age bracket) enrolled. Conversely, the age group of 15 to 17 year olds has the lowest likelihood of being enrolled in a private school, with 81,596 (90.5% in the age bracket) attending a public institution.
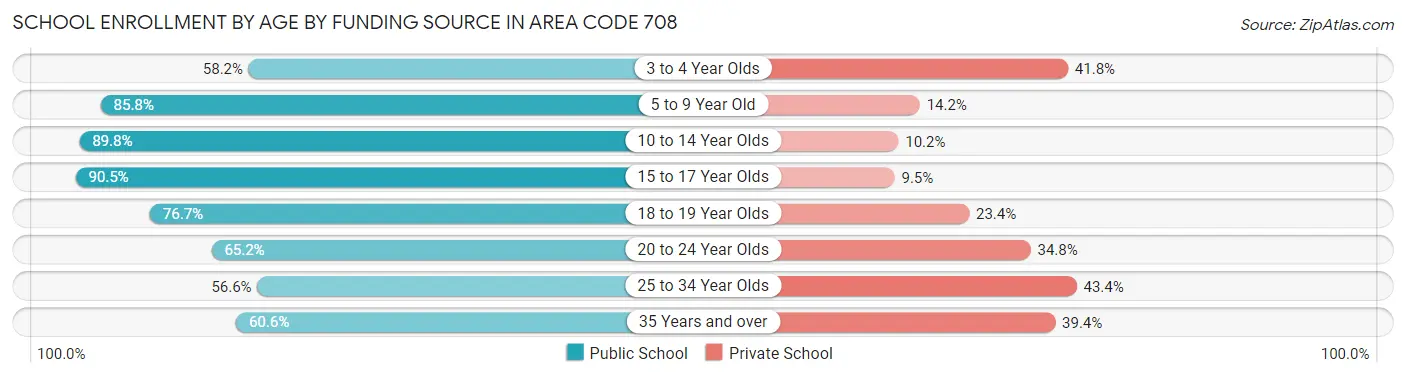
| Age Bracket | Public School | Private School |
| 3 to 4 Year Olds | 15,701 (58.2%) | 11,263 (41.8%) |
| 5 to 9 Year Old | 110,827 (85.8%) | 18,289 (14.2%) |
| 10 to 14 Year Olds | 132,361 (89.8%) | 15,006 (10.2%) |
| 15 to 17 Year Olds | 81,596 (90.5%) | 8,549 (9.5%) |
| 18 to 19 Year Olds | 32,243 (76.6%) | 9,824 (23.4%) |
| 20 to 24 Year Olds | 33,644 (65.2%) | 17,969 (34.8%) |
| 25 to 34 Year Olds | 17,756 (56.6%) | 13,598 (43.4%) |
| 35 Years and over | 16,560 (60.6%) | 10,756 (39.4%) |
| Total | 440,700 (80.7%) | 105,242 (19.3%) |
Educational Attainment by Field of Study in Area Code 708
Business (132,724 | 21.4%), education (67,226 | 10.9%), science & technology (64,022 | 10.3%), engineering (48,120 | 7.8%), and social sciences (47,941 | 7.7%) are the most common fields of study among 618,979 individuals in Area Code 708 who have obtained a bachelor's degree or higher.
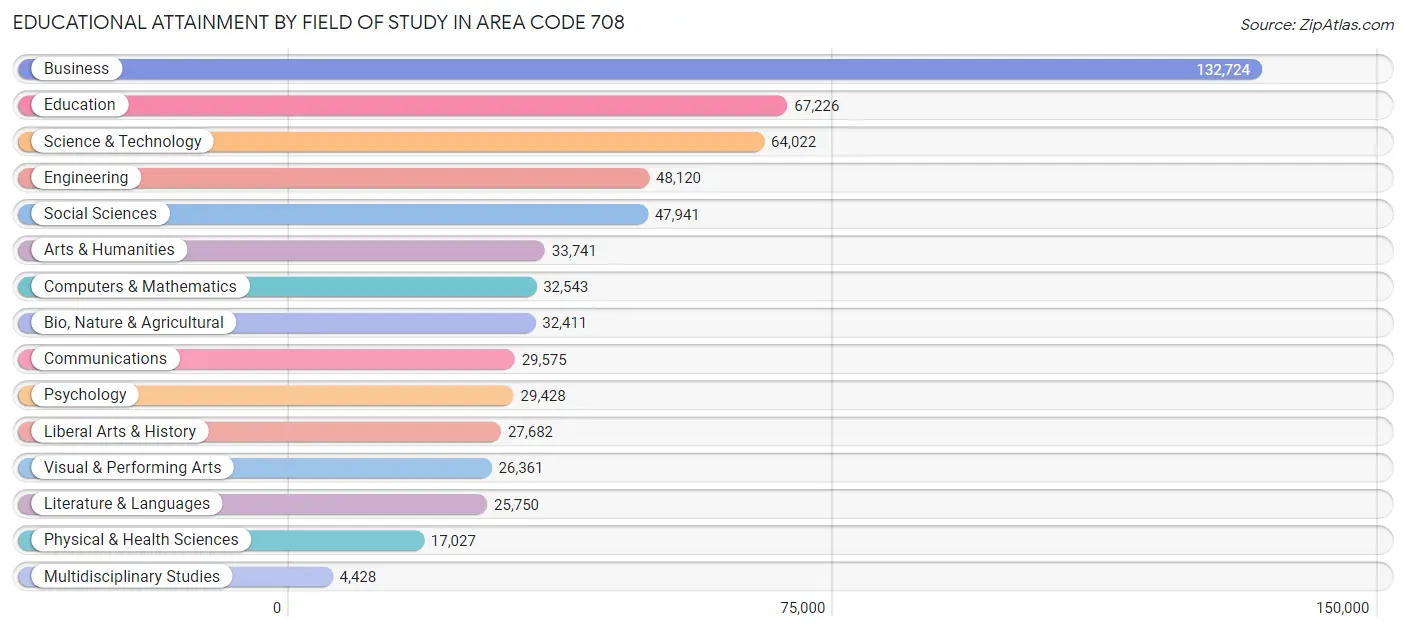
| Field of Study | # Graduates | % Graduates |
| Computers & Mathematics | 32,543 | 5.3% |
| Bio, Nature & Agricultural | 32,411 | 5.2% |
| Physical & Health Sciences | 17,027 | 2.8% |
| Psychology | 29,428 | 4.8% |
| Social Sciences | 47,941 | 7.7% |
| Engineering | 48,120 | 7.8% |
| Multidisciplinary Studies | 4,428 | 0.7% |
| Science & Technology | 64,022 | 10.3% |
| Business | 132,724 | 21.4% |
| Education | 67,226 | 10.9% |
| Literature & Languages | 25,750 | 4.2% |
| Liberal Arts & History | 27,682 | 4.5% |
| Visual & Performing Arts | 26,361 | 4.3% |
| Communications | 29,575 | 4.8% |
| Arts & Humanities | 33,741 | 5.4% |
| Total | 618,979 | 100.0% |
Transportation & Commute in Area Code 708
Vehicle Availability by Sex in Area Code 708
The most prevalent vehicle ownership categories in Area Code 708 are males with 2 vehicles (240,751, accounting for 43.0%) and females with 2 vehicles (197,852, making up 49.3%).
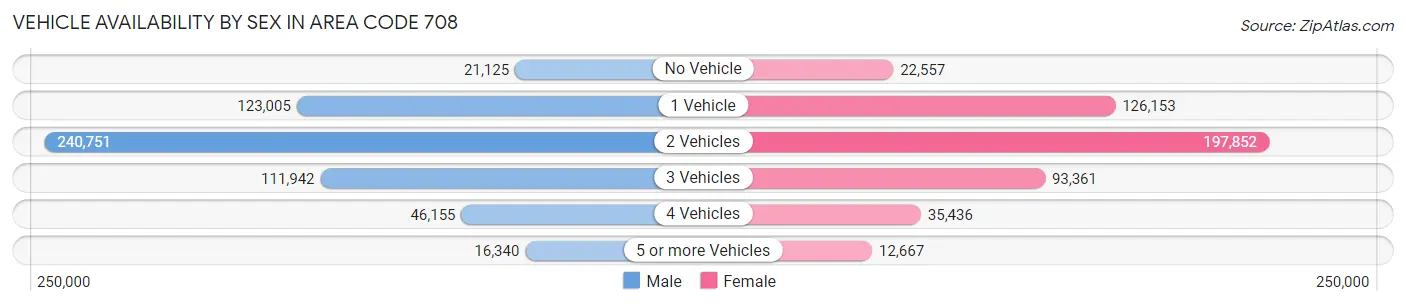
| Vehicles Available | Male | Female |
| No Vehicle | 21,125 (3.8%) | 22,557 (4.6%) |
| 1 Vehicle | 123,005 (22.0%) | 126,153 (25.9%) |
| 2 Vehicles | 240,751 (43.0%) | 197,852 (40.5%) |
| 3 Vehicles | 111,942 (20.0%) | 93,361 (19.1%) |
| 4 Vehicles | 46,155 (8.3%) | 35,436 (7.3%) |
| 5 or more Vehicles | 16,340 (2.9%) | 12,667 (2.6%) |
| Total | 559,318 (100.0%) | 488,026 (100.0%) |
Commute Time in Area Code 708
The most frequently occuring commute durations in Area Code 708 are 30 to 34 minutes (146,822 commuters, 15.9%), 20 to 24 minutes (117,054 commuters, 12.7%), and 45 to 59 minutes (111,034 commuters, 12.0%).
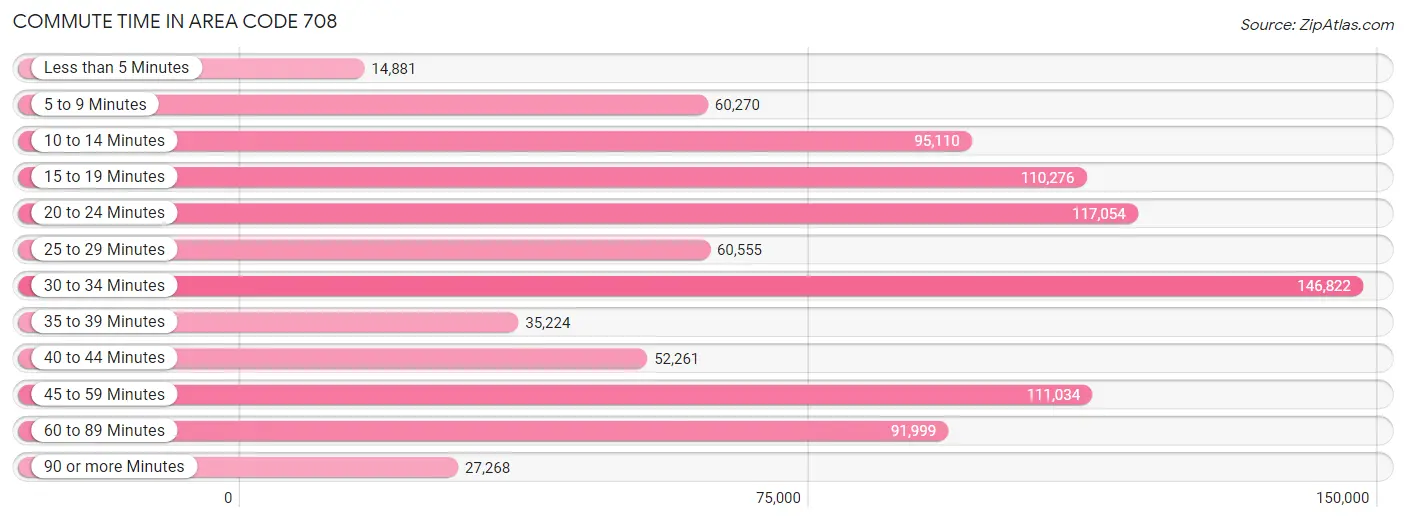
| Commute Time | # Commuters | % Commuters |
| Less than 5 Minutes | 14,881 | 1.6% |
| 5 to 9 Minutes | 60,270 | 6.5% |
| 10 to 14 Minutes | 95,110 | 10.3% |
| 15 to 19 Minutes | 110,276 | 11.9% |
| 20 to 24 Minutes | 117,054 | 12.7% |
| 25 to 29 Minutes | 60,555 | 6.6% |
| 30 to 34 Minutes | 146,822 | 15.9% |
| 35 to 39 Minutes | 35,224 | 3.8% |
| 40 to 44 Minutes | 52,261 | 5.7% |
| 45 to 59 Minutes | 111,034 | 12.0% |
| 60 to 89 Minutes | 91,999 | 10.0% |
| 90 or more Minutes | 27,268 | 3.0% |
Commute Time by Sex in Area Code 708
The most common commute times in Area Code 708 are 30 to 34 minutes (83,207 commuters, 16.7%) for males and 30 to 34 minutes (63,615 commuters, 15.0%) for females.
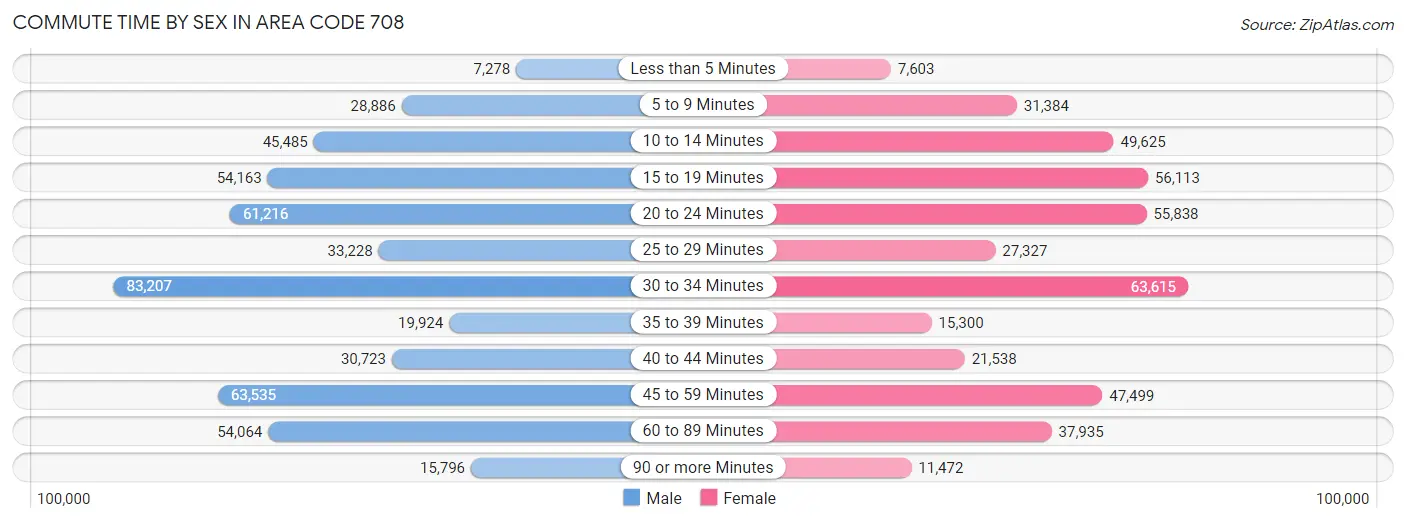
| Commute Time | Male | Female |
| Less than 5 Minutes | 7,278 (1.5%) | 7,603 (1.8%) |
| 5 to 9 Minutes | 28,886 (5.8%) | 31,384 (7.4%) |
| 10 to 14 Minutes | 45,485 (9.1%) | 49,625 (11.7%) |
| 15 to 19 Minutes | 54,163 (10.9%) | 56,113 (13.2%) |
| 20 to 24 Minutes | 61,216 (12.3%) | 55,838 (13.1%) |
| 25 to 29 Minutes | 33,228 (6.7%) | 27,327 (6.4%) |
| 30 to 34 Minutes | 83,207 (16.7%) | 63,615 (15.0%) |
| 35 to 39 Minutes | 19,924 (4.0%) | 15,300 (3.6%) |
| 40 to 44 Minutes | 30,723 (6.2%) | 21,538 (5.1%) |
| 45 to 59 Minutes | 63,535 (12.8%) | 47,499 (11.2%) |
| 60 to 89 Minutes | 54,064 (10.9%) | 37,935 (8.9%) |
| 90 or more Minutes | 15,796 (3.2%) | 11,472 (2.7%) |
Time of Departure to Work by Sex in Area Code 708
The most frequent times of departure to work in Area Code 708 are 7:00 AM to 7:29 AM (67,560, 13.6%) for males and 7:00 AM to 7:29 AM (66,948, 15.7%) for females.
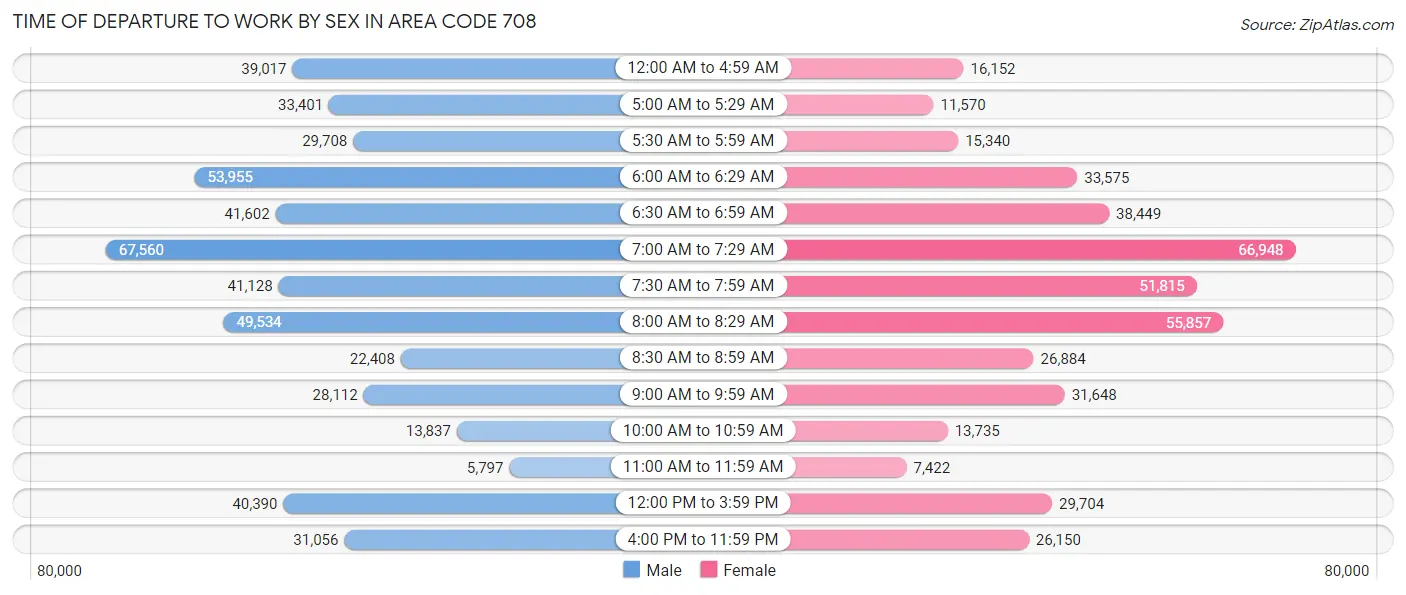
| Time of Departure | Male | Female |
| 12:00 AM to 4:59 AM | 39,017 (7.8%) | 16,152 (3.8%) |
| 5:00 AM to 5:29 AM | 33,401 (6.7%) | 11,570 (2.7%) |
| 5:30 AM to 5:59 AM | 29,708 (6.0%) | 15,340 (3.6%) |
| 6:00 AM to 6:29 AM | 53,955 (10.8%) | 33,575 (7.9%) |
| 6:30 AM to 6:59 AM | 41,602 (8.4%) | 38,449 (9.0%) |
| 7:00 AM to 7:29 AM | 67,560 (13.6%) | 66,948 (15.7%) |
| 7:30 AM to 7:59 AM | 41,128 (8.3%) | 51,815 (12.2%) |
| 8:00 AM to 8:29 AM | 49,534 (10.0%) | 55,857 (13.1%) |
| 8:30 AM to 8:59 AM | 22,408 (4.5%) | 26,884 (6.3%) |
| 9:00 AM to 9:59 AM | 28,112 (5.7%) | 31,648 (7.4%) |
| 10:00 AM to 10:59 AM | 13,837 (2.8%) | 13,735 (3.2%) |
| 11:00 AM to 11:59 AM | 5,797 (1.2%) | 7,422 (1.8%) |
| 12:00 PM to 3:59 PM | 40,390 (8.1%) | 29,704 (7.0%) |
| 4:00 PM to 11:59 PM | 31,056 (6.2%) | 26,150 (6.1%) |
| Total | 497,505 (100.0%) | 425,249 (100.0%) |
Housing Occupancy in Area Code 708
Occupancy by Ownership in Area Code 708
Of the total 828,711 dwellings in Area Code 708, owner-occupied units account for 569,263 (68.7%), while renter-occupied units make up 259,448 (31.3%).
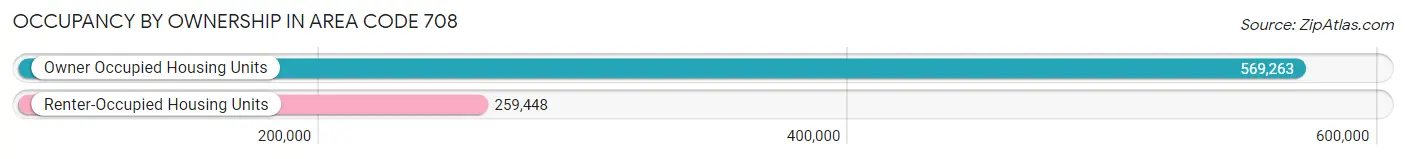
| Occupancy | # Housing Units | % Housing Units |
| Owner Occupied Housing Units | 569,263 | 68.7% |
| Renter-Occupied Housing Units | 259,448 | 31.3% |
| Total Occupied Housing Units | 828,711 | 100.0% |
Occupancy by Household Size in Area Code 708
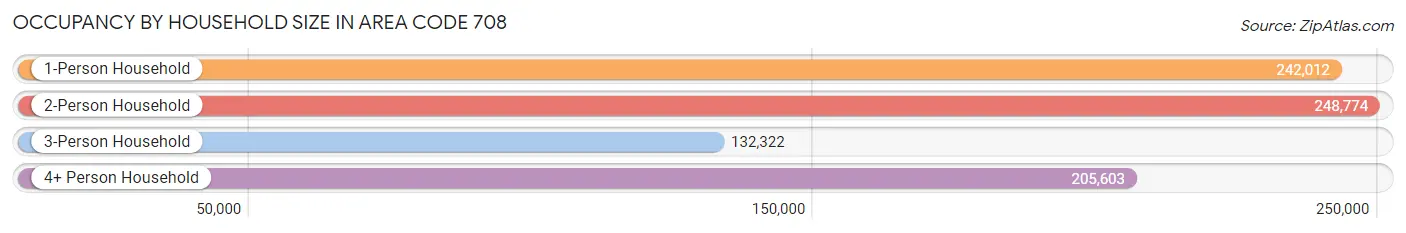
| Household Size | # Housing Units | % Housing Units |
| 1-Person Household | 242,012 | 29.2% |
| 2-Person Household | 248,774 | 30.0% |
| 3-Person Household | 132,322 | 16.0% |
| 4+ Person Household | 205,603 | 24.8% |
| Total Housing Units | 828,711 | 100.0% |
Occupancy by Ownership by Household Size in Area Code 708
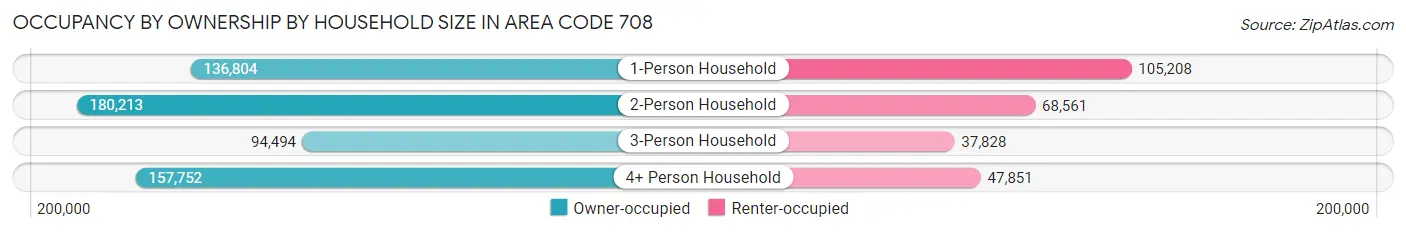
| Household Size | Owner-occupied | Renter-occupied |
| 1-Person Household | 136,804 (56.5%) | 105,208 (43.5%) |
| 2-Person Household | 180,213 (72.4%) | 68,561 (27.6%) |
| 3-Person Household | 94,494 (71.4%) | 37,828 (28.6%) |
| 4+ Person Household | 157,752 (76.7%) | 47,851 (23.3%) |
| Total Housing Units | 569,263 (68.7%) | 259,448 (31.3%) |
Occupancy by Educational Attainment in Area Code 708
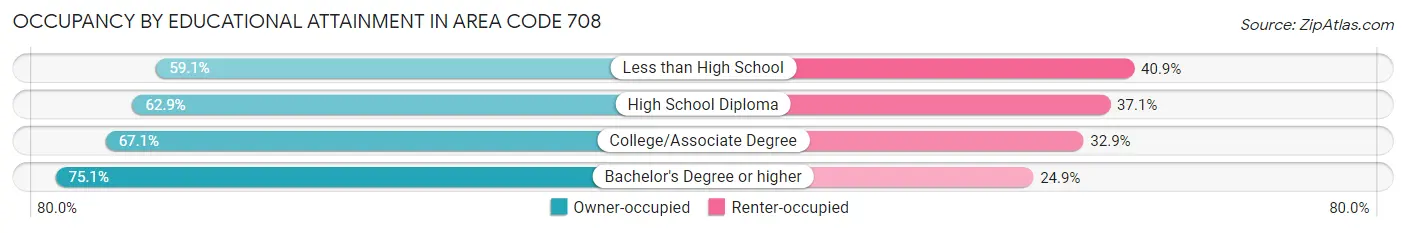
| Household Size | Owner-occupied | Renter-occupied |
| Less than High School | 46,023 (59.1%) | 31,859 (40.9%) |
| High School Diploma | 114,187 (62.9%) | 67,373 (37.1%) |
| College/Associate Degree | 155,382 (67.1%) | 76,074 (32.9%) |
| Bachelor's Degree or higher | 253,671 (75.1%) | 84,142 (24.9%) |
Occupancy by Age of Householder in Area Code 708
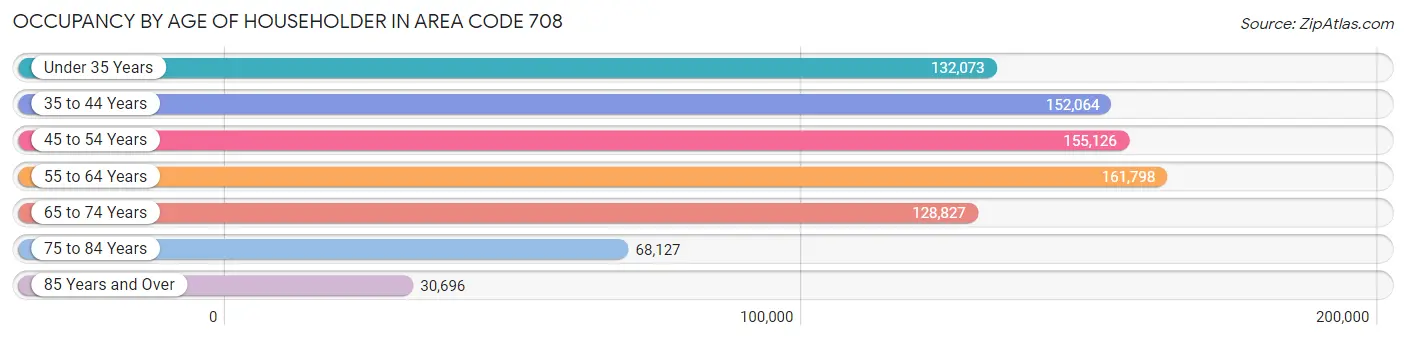
| Age Bracket | # Households | % Households |
| Under 35 Years | 132,073 | 15.9% |
| 35 to 44 Years | 152,064 | 18.3% |
| 45 to 54 Years | 155,126 | 18.7% |
| 55 to 64 Years | 161,798 | 19.5% |
| 65 to 74 Years | 128,827 | 15.5% |
| 75 to 84 Years | 68,127 | 8.2% |
| 85 Years and Over | 30,696 | 3.7% |
| Total | 828,711 | 100.0% |
Housing Finances in Area Code 708
Median Income by Occupancy in Area Code 708
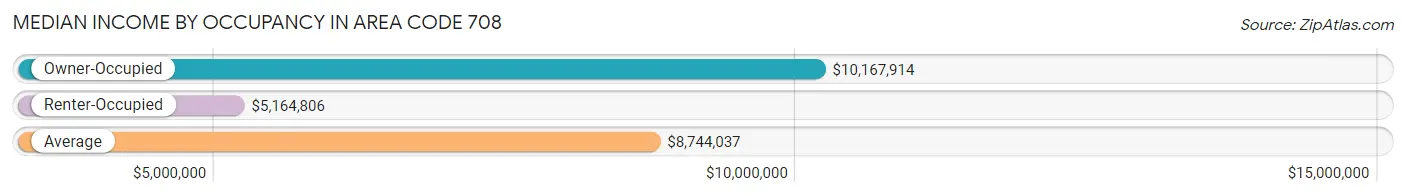
| Occupancy Type | # Households | Median Income |
| Owner-Occupied | 569,263 (68.7%) | $10,167,914 |
| Renter-Occupied | 259,448 (31.3%) | $5,164,806 |
| Average | 828,711 (100.0%) | $8,744,037 |
Occupancy by Householder Income Bracket in Area Code 708
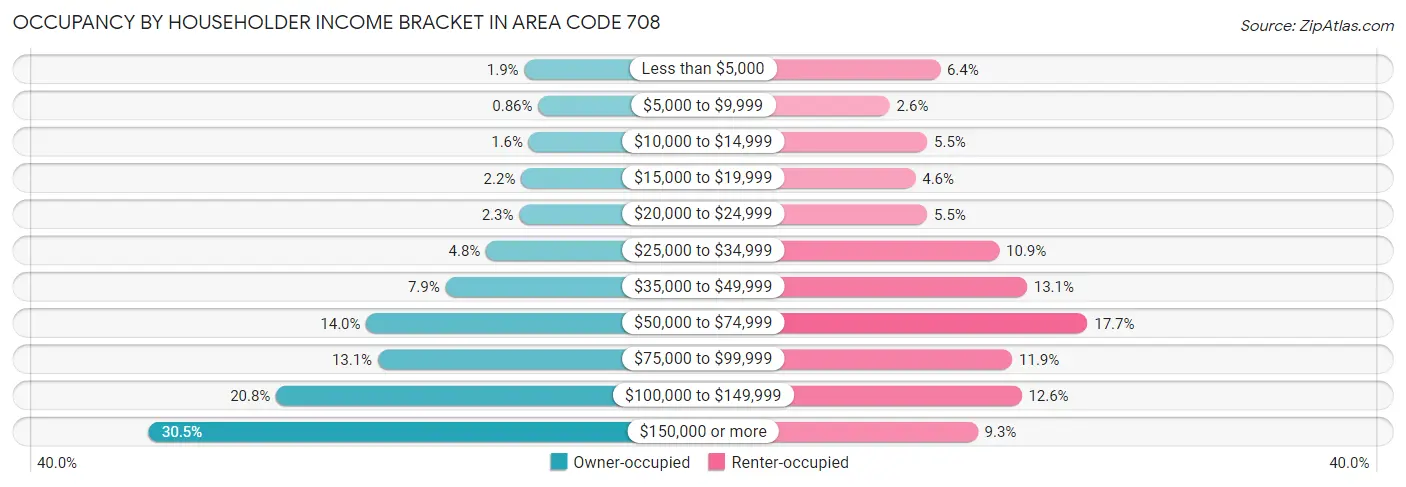
| Income Bracket | Owner-occupied | Renter-occupied |
| Less than $5,000 | 10,911 (1.9%) | 16,678 (6.4%) |
| $5,000 to $9,999 | 4,907 (0.9%) | 6,744 (2.6%) |
| $10,000 to $14,999 | 8,978 (1.6%) | 14,142 (5.4%) |
| $15,000 to $19,999 | 12,313 (2.2%) | 11,816 (4.5%) |
| $20,000 to $24,999 | 13,139 (2.3%) | 14,131 (5.4%) |
| $25,000 to $34,999 | 27,523 (4.8%) | 28,373 (10.9%) |
| $35,000 to $49,999 | 45,126 (7.9%) | 33,861 (13.1%) |
| $50,000 to $74,999 | 79,484 (14.0%) | 45,823 (17.7%) |
| $75,000 to $99,999 | 74,486 (13.1%) | 30,965 (11.9%) |
| $100,000 to $149,999 | 118,591 (20.8%) | 32,796 (12.6%) |
| $150,000 or more | 173,805 (30.5%) | 24,119 (9.3%) |
| Total | 569,263 (100.0%) | 259,448 (100.0%) |
Monthly Housing Cost Tiers in Area Code 708
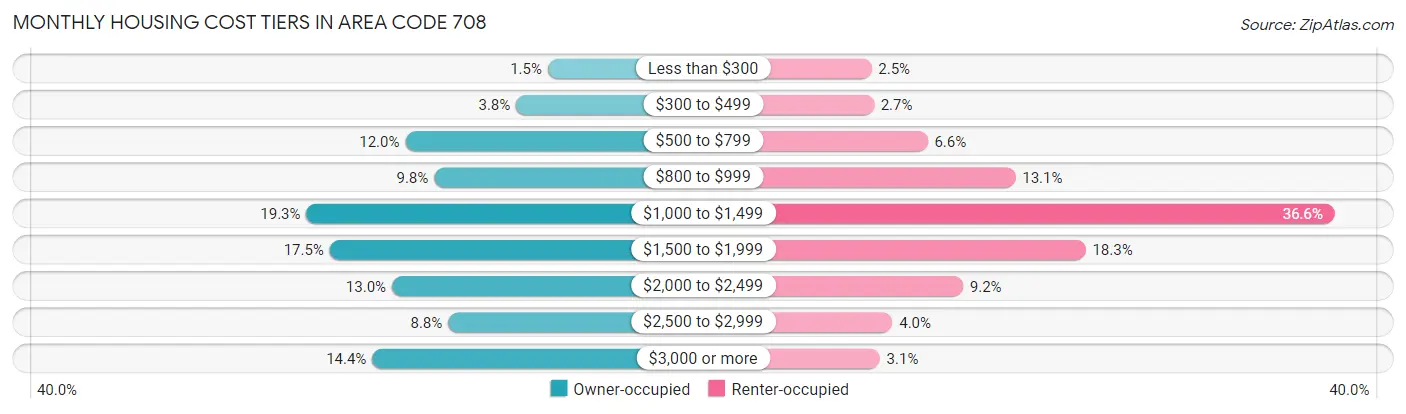
| Monthly Cost | Owner-occupied | Renter-occupied |
| Less than $300 | 8,380 (1.5%) | 6,495 (2.5%) |
| $300 to $499 | 21,648 (3.8%) | 6,922 (2.7%) |
| $500 to $799 | 68,072 (12.0%) | 17,193 (6.6%) |
| $800 to $999 | 55,991 (9.8%) | 33,976 (13.1%) |
| $1,000 to $1,499 | 109,567 (19.3%) | 95,030 (36.6%) |
| $1,500 to $1,999 | 99,770 (17.5%) | 47,396 (18.3%) |
| $2,000 to $2,499 | 73,719 (13.0%) | 23,965 (9.2%) |
| $2,500 to $2,999 | 50,134 (8.8%) | 10,487 (4.0%) |
| $3,000 or more | 81,982 (14.4%) | 8,066 (3.1%) |
| Total | 569,263 (100.0%) | 259,448 (100.0%) |
Physical Housing Characteristics in Area Code 708
Housing Structures in Area Code 708
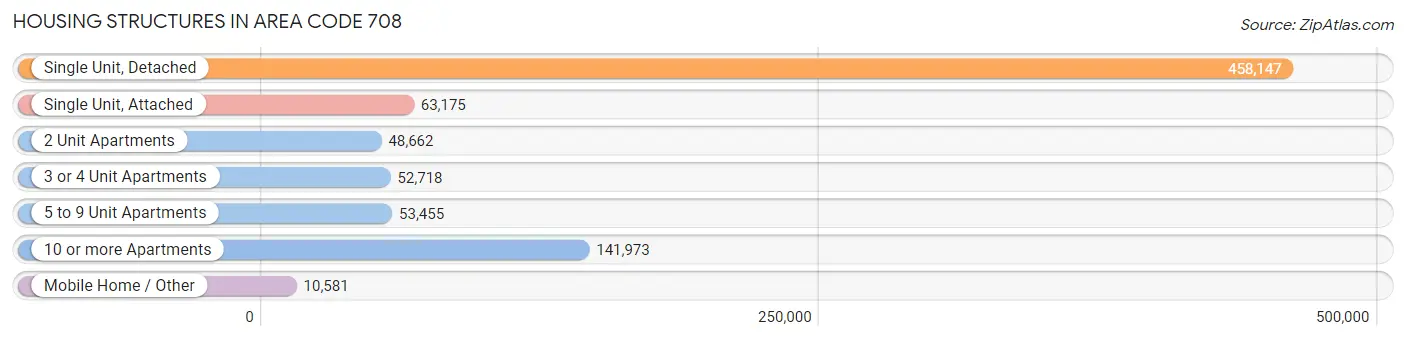
| Structure Type | # Housing Units | % Housing Units |
| Single Unit, Detached | 458,147 | 55.3% |
| Single Unit, Attached | 63,175 | 7.6% |
| 2 Unit Apartments | 48,662 | 5.9% |
| 3 or 4 Unit Apartments | 52,718 | 6.4% |
| 5 to 9 Unit Apartments | 53,455 | 6.5% |
| 10 or more Apartments | 141,973 | 17.1% |
| Mobile Home / Other | 10,581 | 1.3% |
| Total | 828,711 | 100.0% |
Housing Structures by Occupancy in Area Code 708
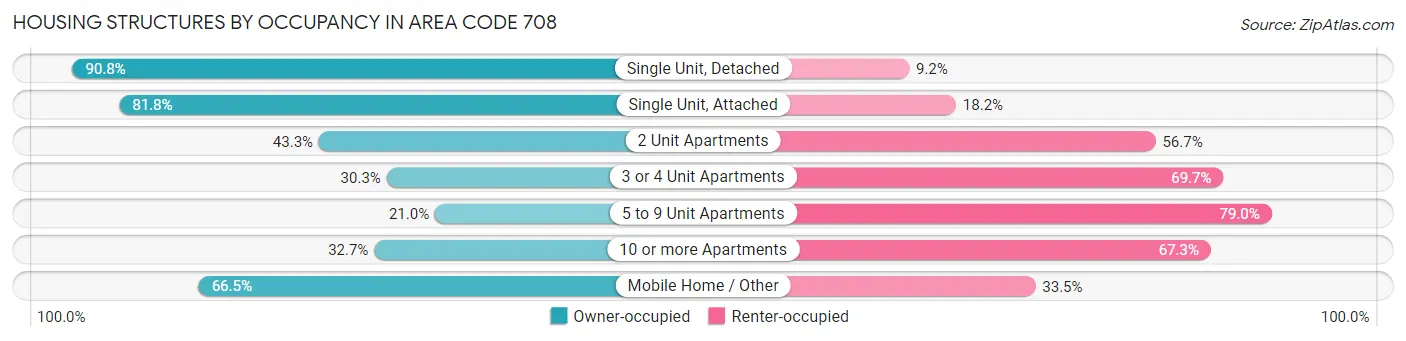
| Structure Type | Owner-occupied | Renter-occupied |
| Single Unit, Detached | 415,894 (90.8%) | 42,253 (9.2%) |
| Single Unit, Attached | 51,649 (81.8%) | 11,526 (18.2%) |
| 2 Unit Apartments | 21,084 (43.3%) | 27,578 (56.7%) |
| 3 or 4 Unit Apartments | 15,970 (30.3%) | 36,748 (69.7%) |
| 5 to 9 Unit Apartments | 11,217 (21.0%) | 42,238 (79.0%) |
| 10 or more Apartments | 46,417 (32.7%) | 95,556 (67.3%) |
| Mobile Home / Other | 7,032 (66.5%) | 3,549 (33.5%) |
| Total | 569,263 (68.7%) | 259,448 (31.3%) |
Housing Structures by Number of Rooms in Area Code 708
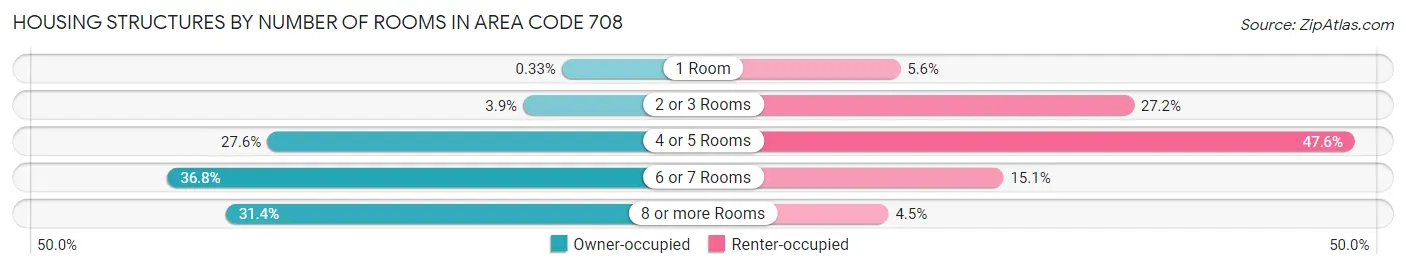
| Number of Rooms | Owner-occupied | Renter-occupied |
| 1 Room | 1,886 (0.3%) | 14,488 (5.6%) |
| 2 or 3 Rooms | 22,272 (3.9%) | 70,514 (27.2%) |
| 4 or 5 Rooms | 156,959 (27.6%) | 123,562 (47.6%) |
| 6 or 7 Rooms | 209,461 (36.8%) | 39,245 (15.1%) |
| 8 or more Rooms | 178,685 (31.4%) | 11,639 (4.5%) |
| Total | 569,263 (100.0%) | 259,448 (100.0%) |
Housing Structure by Heating Type in Area Code 708
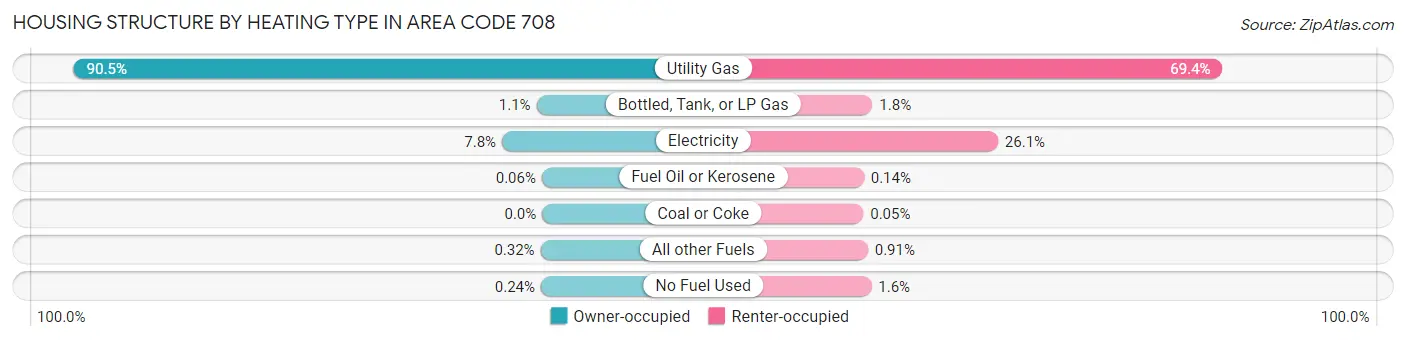
| Heating Type | Owner-occupied | Renter-occupied |
| Utility Gas | 515,314 (90.5%) | 180,164 (69.4%) |
| Bottled, Tank, or LP Gas | 6,182 (1.1%) | 4,685 (1.8%) |
| Electricity | 44,183 (7.8%) | 67,618 (26.1%) |
| Fuel Oil or Kerosene | 369 (0.1%) | 366 (0.1%) |
| Coal or Coke | 27 (0.0%) | 121 (0.1%) |
| All other Fuels | 1,809 (0.3%) | 2,354 (0.9%) |
| No Fuel Used | 1,379 (0.2%) | 4,140 (1.6%) |
| Total | 569,263 (100.0%) | 259,448 (100.0%) |
Household Vehicle Usage in Area Code 708
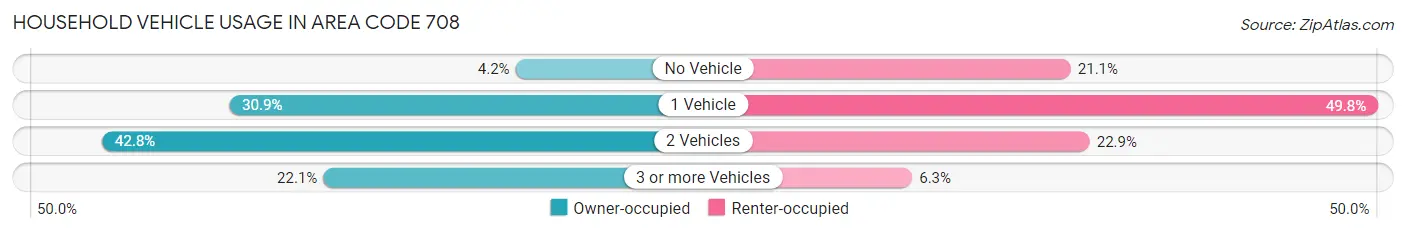
| Vehicles per Household | Owner-occupied | Renter-occupied |
| No Vehicle | 23,809 (4.2%) | 54,718 (21.1%) |
| 1 Vehicle | 175,928 (30.9%) | 129,113 (49.8%) |
| 2 Vehicles | 243,550 (42.8%) | 59,301 (22.9%) |
| 3 or more Vehicles | 125,976 (22.1%) | 16,316 (6.3%) |
| Total | 569,263 (100.0%) | 259,448 (100.0%) |
Real Estate & Mortgages in Area Code 708
Real Estate and Mortgage Overview in Area Code 708
| Characteristic | Without Mortgage | With Mortgage |
| Housing Units | 216,267 | 352,996 |
| Median Property Value | $27,493,400 | $29,161,000 |
| Median Household Income | $7,682,262 | $126,071 |
| Monthly Housing Costs | $85,618 | $79,488 |
| Real Estate Taxes | $566,840 | $7,065 |
Property Value by Mortgage Status in Area Code 708
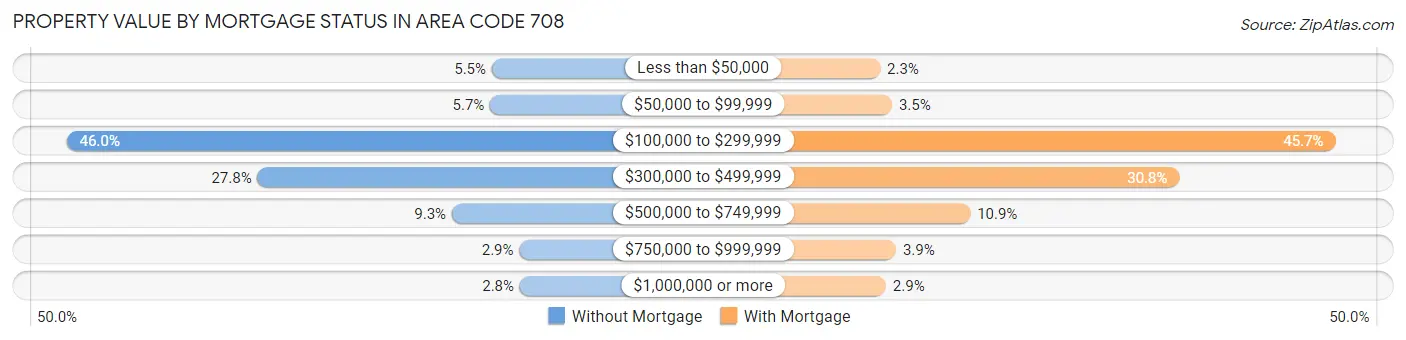
| Property Value | Without Mortgage | With Mortgage |
| Less than $50,000 | 11,899 (5.5%) | 8,264 (2.3%) |
| $50,000 to $99,999 | 12,244 (5.7%) | 12,253 (3.5%) |
| $100,000 to $299,999 | 99,486 (46.0%) | 161,314 (45.7%) |
| $300,000 to $499,999 | 60,172 (27.8%) | 108,836 (30.8%) |
| $500,000 to $749,999 | 20,113 (9.3%) | 38,557 (10.9%) |
| $750,000 to $999,999 | 6,229 (2.9%) | 13,583 (3.8%) |
| $1,000,000 or more | 6,124 (2.8%) | 10,189 (2.9%) |
| Total | 216,267 (100.0%) | 352,996 (100.0%) |
Household Income by Mortgage Status in Area Code 708
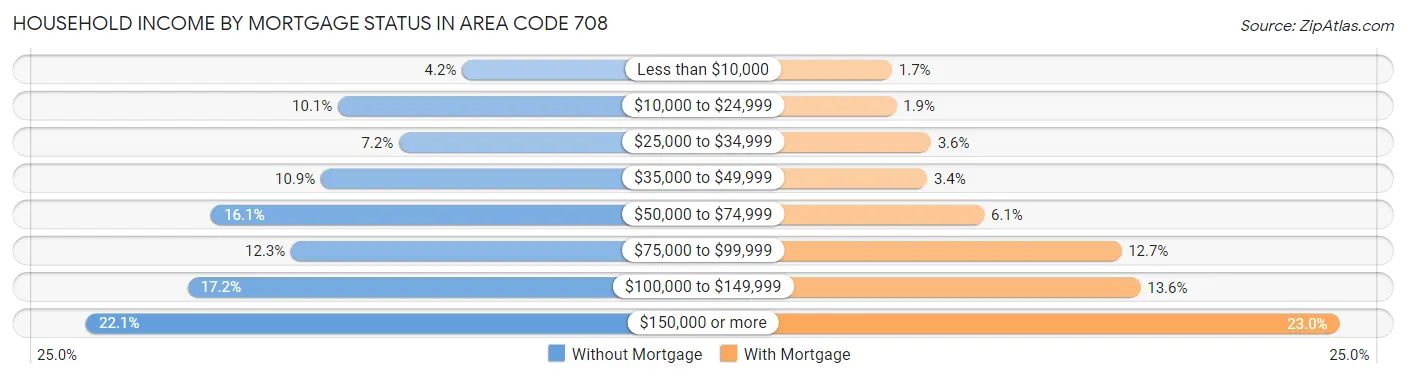
| Household Income | Without Mortgage | With Mortgage |
| Less than $10,000 | 8,986 (4.2%) | 6,122 (1.7%) |
| $10,000 to $24,999 | 21,787 (10.1%) | 6,832 (1.9%) |
| $25,000 to $34,999 | 15,504 (7.2%) | 12,643 (3.6%) |
| $35,000 to $49,999 | 23,521 (10.9%) | 12,019 (3.4%) |
| $50,000 to $74,999 | 34,835 (16.1%) | 21,605 (6.1%) |
| $75,000 to $99,999 | 26,631 (12.3%) | 44,649 (12.7%) |
| $100,000 to $149,999 | 37,269 (17.2%) | 47,855 (13.6%) |
| $150,000 or more | 47,734 (22.1%) | 81,322 (23.0%) |
| Total | 216,267 (100.0%) | 352,996 (100.0%) |
Property Value to Household Income Ratio in Area Code 708
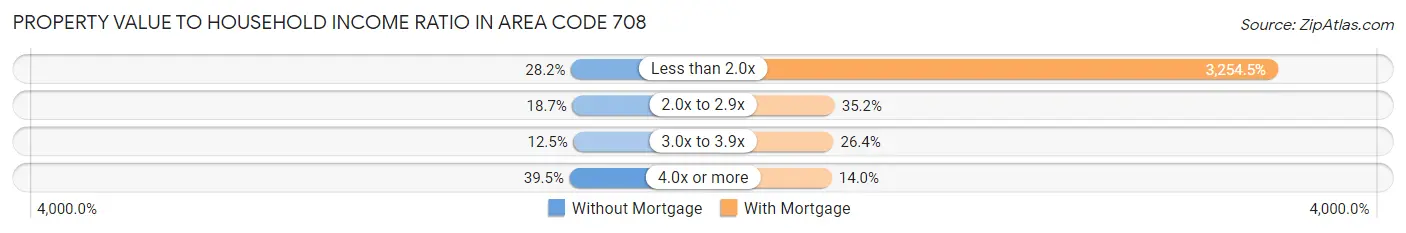
| Value-to-Income Ratio | Without Mortgage | With Mortgage |
| Less than 2.0x | 60,999 (28.2%) | 11,488,081 (3,254.4%) |
| 2.0x to 2.9x | 40,375 (18.7%) | 124,307 (35.2%) |
| 3.0x to 3.9x | 26,998 (12.5%) | 93,257 (26.4%) |
| 4.0x or more | 85,502 (39.5%) | 49,269 (14.0%) |
| Total | 216,267 (100.0%) | 352,996 (100.0%) |
Real Estate Taxes by Mortgage Status in Area Code 708
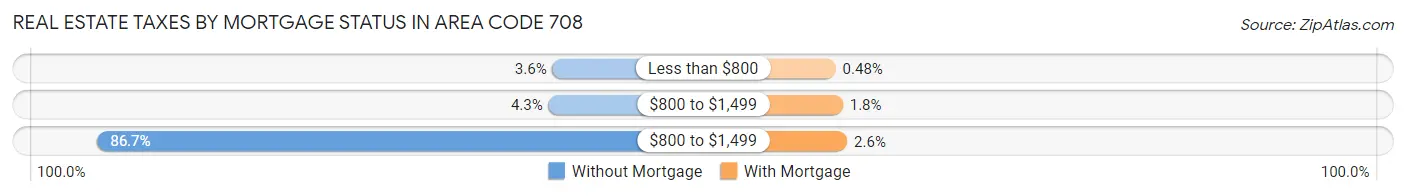
| Property Taxes | Without Mortgage | With Mortgage |
| Less than $800 | 7,735 (3.6%) | 1,696 (0.5%) |
| $800 to $1,499 | 9,301 (4.3%) | 6,290 (1.8%) |
| $800 to $1,499 | 187,523 (86.7%) | 9,119 (2.6%) |
| Total | 216,267 (100.0%) | 352,996 (100.0%) |
Health & Disability in Area Code 708
Health Insurance Coverage by Age in Area Code 708
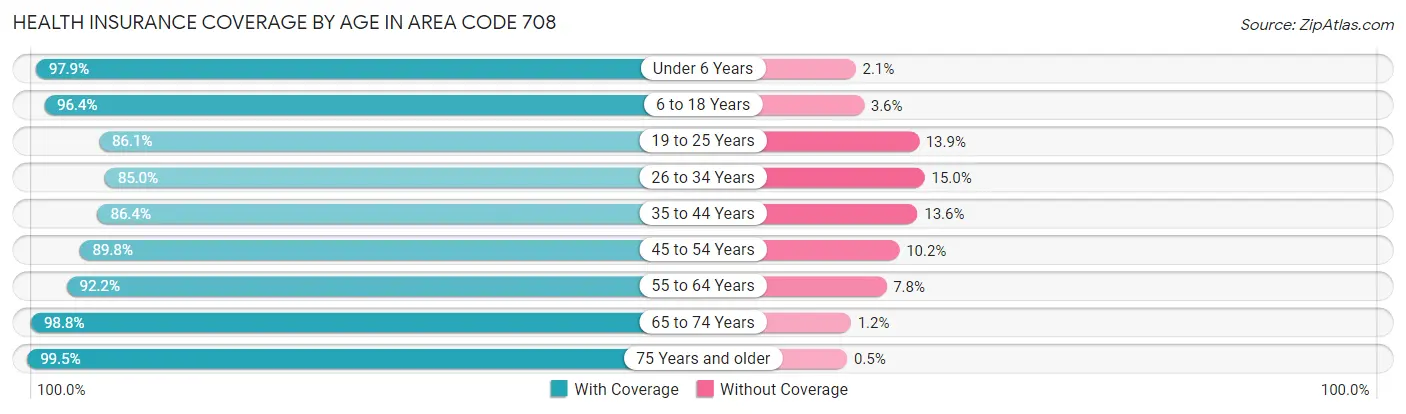
| Age Bracket | With Coverage | Without Coverage |
| Under 6 Years | 144,653 (97.9%) | 3,104 (2.1%) |
| 6 to 18 Years | 369,819 (96.4%) | 13,911 (3.6%) |
| 19 to 25 Years | 153,477 (86.1%) | 24,746 (13.9%) |
| 26 to 34 Years | 219,478 (85.0%) | 38,596 (15.0%) |
| 35 to 44 Years | 253,494 (86.4%) | 39,931 (13.6%) |
| 45 to 54 Years | 255,483 (89.8%) | 29,145 (10.2%) |
| 55 to 64 Years | 263,570 (92.2%) | 22,358 (7.8%) |
| 65 to 74 Years | 204,178 (98.8%) | 2,483 (1.2%) |
| 75 Years and older | 143,697 (99.5%) | 726 (0.5%) |
| Total | 2,007,849 (92.0%) | 175,000 (8.0%) |
Health Insurance Coverage by Citizenship Status in Area Code 708
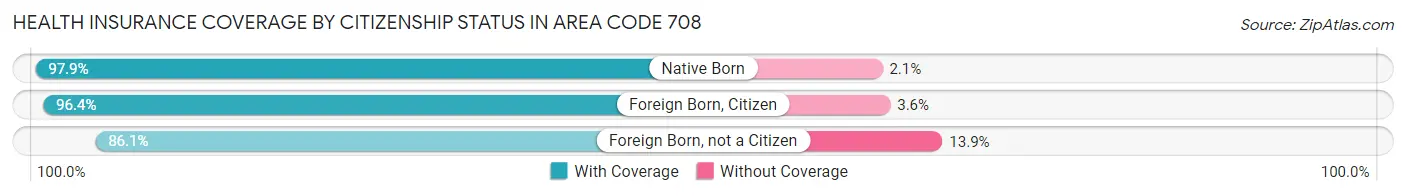
| Citizenship Status | With Coverage | Without Coverage |
| Native Born | 144,653 (97.9%) | 3,104 (2.1%) |
| Foreign Born, Citizen | 369,819 (96.4%) | 13,911 (3.6%) |
| Foreign Born, not a Citizen | 153,477 (86.1%) | 24,746 (13.9%) |
Health Insurance Coverage by Household Income in Area Code 708
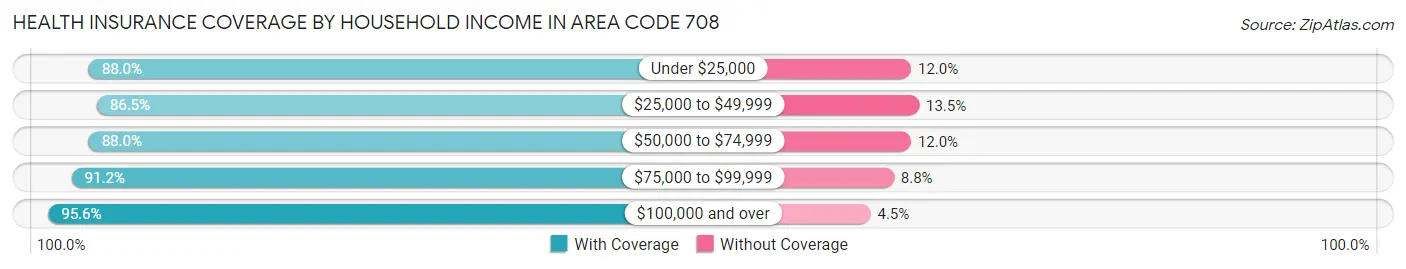
| Household Income | With Coverage | Without Coverage |
| Under $25,000 | 175,663 (88.0%) | 24,045 (12.0%) |
| $25,000 to $49,999 | 253,266 (86.5%) | 39,657 (13.5%) |
| $50,000 to $74,999 | 268,615 (88.0%) | 36,694 (12.0%) |
| $75,000 to $99,999 | 251,705 (91.2%) | 24,340 (8.8%) |
| $100,000 and over | 1,049,560 (95.6%) | 48,932 (4.4%) |
Public vs Private Health Insurance Coverage by Age in Area Code 708
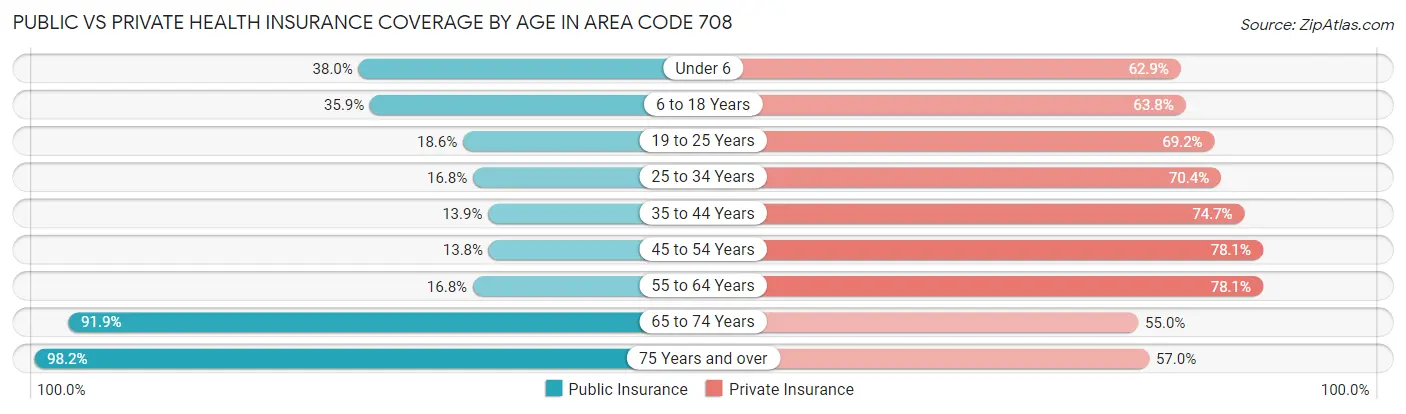
| Age Bracket | Public Insurance | Private Insurance |
| Under 6 | 56,151 (38.0%) | 92,946 (62.9%) |
| 6 to 18 Years | 137,663 (35.9%) | 244,868 (63.8%) |
| 19 to 25 Years | 33,185 (18.6%) | 123,259 (69.2%) |
| 25 to 34 Years | 43,256 (16.8%) | 181,649 (70.4%) |
| 35 to 44 Years | 40,917 (13.9%) | 219,289 (74.7%) |
| 45 to 54 Years | 39,370 (13.8%) | 222,401 (78.1%) |
| 55 to 64 Years | 47,994 (16.8%) | 223,429 (78.1%) |
| 65 to 74 Years | 189,932 (91.9%) | 113,684 (55.0%) |
| 75 Years and over | 141,855 (98.2%) | 82,346 (57.0%) |
| Total | 730,323 (33.5%) | 1,503,871 (68.9%) |
Disability Status by Sex by Age in Area Code 708
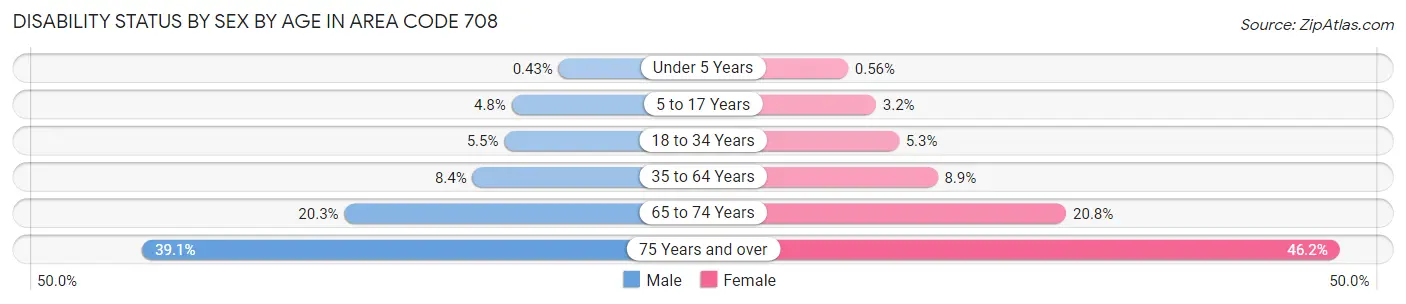
| Age Bracket | Male | Female |
| Under 5 Years | 266 (0.4%) | 342 (0.6%) |
| 5 to 17 Years | 9,432 (4.8%) | 5,767 (3.2%) |
| 18 to 34 Years | 12,927 (5.5%) | 12,138 (5.3%) |
| 35 to 64 Years | 35,861 (8.4%) | 38,949 (8.9%) |
| 65 to 74 Years | 19,434 (20.3%) | 23,114 (20.8%) |
| 75 Years and over | 22,363 (39.1%) | 40,293 (46.2%) |
Disability Class by Sex by Age in Area Code 708
Disability Class: Hearing Difficulty
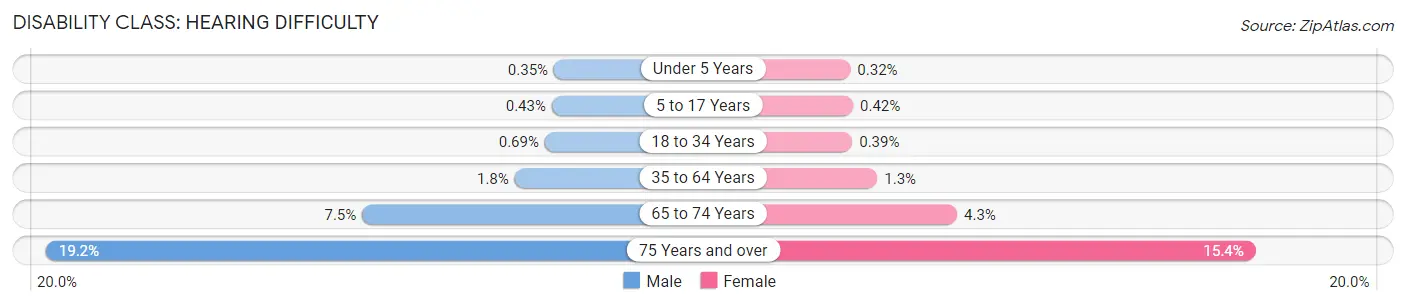
| Age Bracket | Male | Female |
| Under 5 Years | 218 (0.4%) | 193 (0.3%) |
| 5 to 17 Years | 851 (0.4%) | 773 (0.4%) |
| 18 to 34 Years | 1,630 (0.7%) | 908 (0.4%) |
| 35 to 64 Years | 7,687 (1.8%) | 5,793 (1.3%) |
| 65 to 74 Years | 7,142 (7.5%) | 4,750 (4.3%) |
| 75 Years and over | 10,987 (19.2%) | 13,400 (15.4%) |
Disability Class: Vision Difficulty
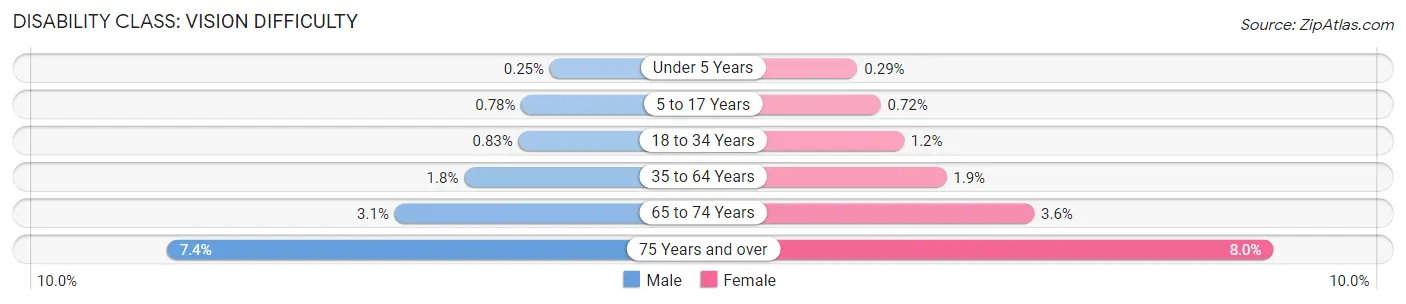
| Age Bracket | Male | Female |
| Under 5 Years | 153 (0.3%) | 174 (0.3%) |
| 5 to 17 Years | 1,531 (0.8%) | 1,315 (0.7%) |
| 18 to 34 Years | 1,953 (0.8%) | 2,653 (1.1%) |
| 35 to 64 Years | 7,845 (1.8%) | 8,526 (1.9%) |
| 65 to 74 Years | 2,997 (3.1%) | 3,960 (3.6%) |
| 75 Years and over | 4,212 (7.4%) | 6,984 (8.0%) |
Disability Class: Cognitive Difficulty
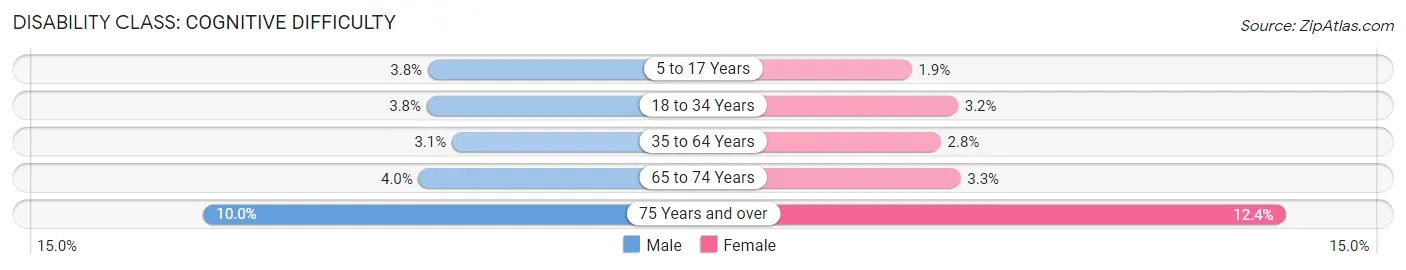
| Age Bracket | Male | Female |
| 5 to 17 Years | 7,413 (3.8%) | 3,541 (1.9%) |
| 18 to 34 Years | 8,962 (3.8%) | 7,418 (3.2%) |
| 35 to 64 Years | 13,189 (3.1%) | 12,067 (2.8%) |
| 65 to 74 Years | 3,859 (4.0%) | 3,666 (3.3%) |
| 75 Years and over | 5,731 (10.0%) | 10,773 (12.3%) |
Disability Class: Ambulatory Difficulty
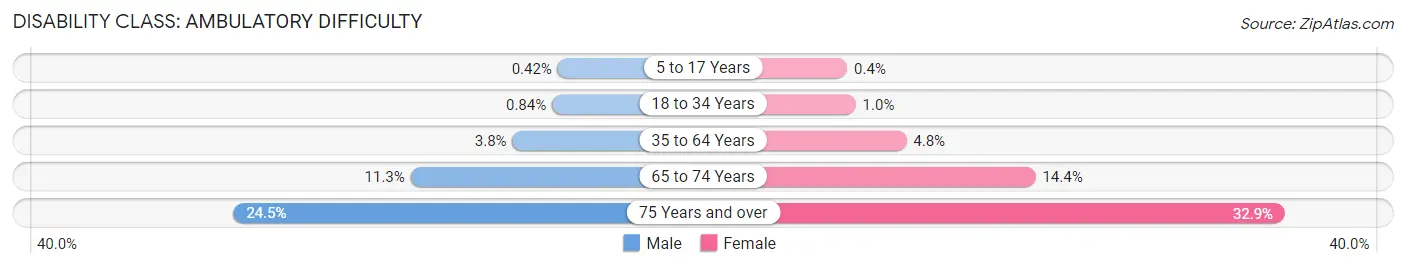
| Age Bracket | Male | Female |
| 5 to 17 Years | 825 (0.4%) | 739 (0.4%) |
| 18 to 34 Years | 1,991 (0.8%) | 2,361 (1.0%) |
| 35 to 64 Years | 16,078 (3.8%) | 21,016 (4.8%) |
| 65 to 74 Years | 10,847 (11.3%) | 15,966 (14.4%) |
| 75 Years and over | 14,019 (24.5%) | 28,701 (32.9%) |
Disability Class: Self-Care Difficulty
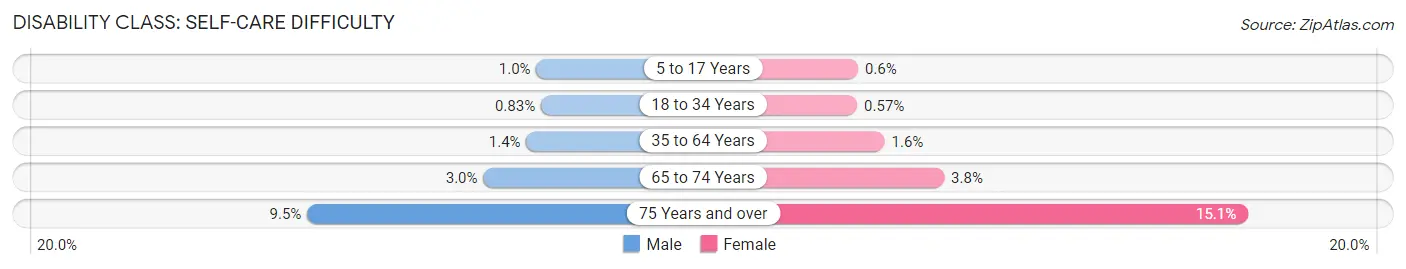
| Age Bracket | Male | Female |
| 5 to 17 Years | 1,969 (1.0%) | 1,099 (0.6%) |
| 18 to 34 Years | 1,953 (0.8%) | 1,300 (0.6%) |
| 35 to 64 Years | 5,842 (1.4%) | 6,991 (1.6%) |
| 65 to 74 Years | 2,843 (3.0%) | 4,213 (3.8%) |
| 75 Years and over | 5,442 (9.5%) | 13,153 (15.1%) |
Technology Access in Area Code 708
Computing Device Access in Area Code 708
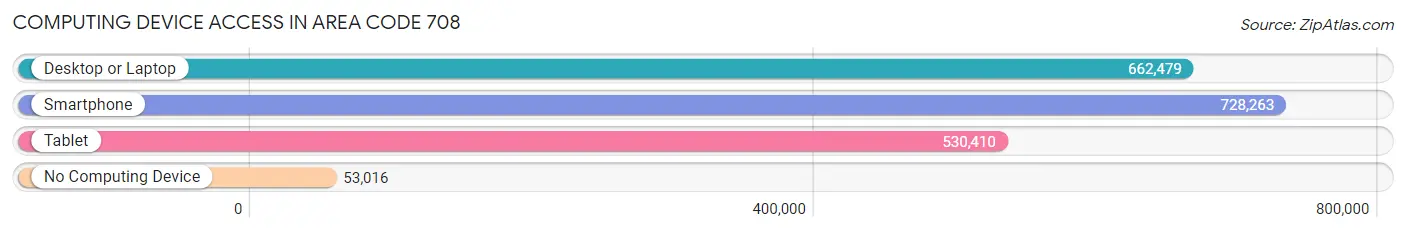
| Device Type | # Households | % Households |
| Desktop or Laptop | 662,479 | 79.9% |
| Smartphone | 728,263 | 87.9% |
| Tablet | 530,410 | 64.0% |
| No Computing Device | 53,016 | 6.4% |
| Total | 828,711 | 100.0% |
Internet Access in Area Code 708
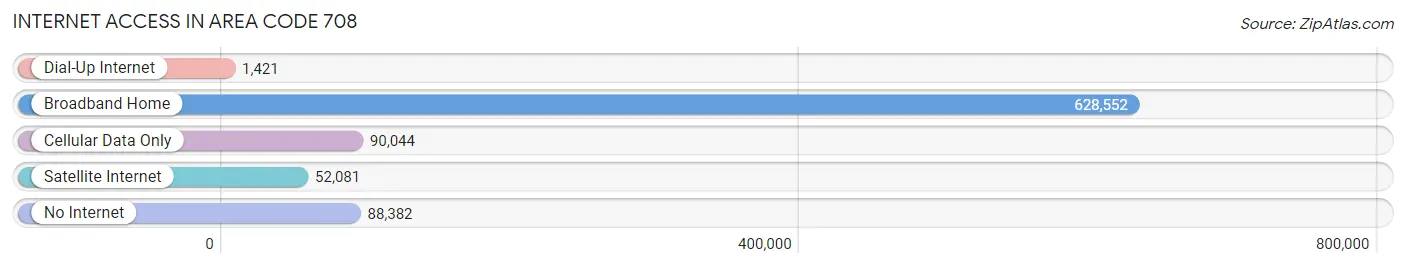
| Internet Type | # Households | % Households |
| Dial-Up Internet | 1,421 | 0.2% |
| Broadband Home | 628,552 | 75.8% |
| Cellular Data Only | 90,044 | 10.9% |
| Satellite Internet | 52,081 | 6.3% |
| No Internet | 88,382 | 10.7% |
| Total | 828,711 | 100.0% |
Area Code 708 Summary
Geography
Area code 708 is located in the state of Illinois and covers the Chicago metropolitan area, including the city of Chicago and its suburbs. It also covers parts of Cook, DuPage, Will, and Kankakee counties.
Social
Area code 708 is home to a diverse population of people from all walks of life. The area is known for its vibrant culture, with a variety of restaurants, bars, and entertainment venues.
Economics
Area code 708 is a major economic hub in the Midwest. It is home to many large corporations, including Boeing, McDonald's, and Walgreens. The area also has a thriving small business sector, with many entrepreneurs and startups.
Demographics
Area code 708 is home to a diverse population, with a mix of races, ethnicities, and religions. The population is predominantly white, with a large Hispanic population. The median household income is slightly above the national average.
Common Questions
What is Per Capita Income in Area Code 708?
Per Capita income in Area Code 708 is $48,573.
What is the Median Family Income in Area Code 708?
Median Family Income in Area Code 708 is $114,220.
What is the Median Household income in Area Code 708?
Median Household Income in Area Code 708 is $93,022.
What is Income or Wage Gap in Area Code 708?
Income or Wage Gap in Area Code 708 is 28.1%.
Women in Area Code 708 earn 71.9 cents for every dollar earned by a man.
What is Family Income Deficit in Area Code 708?
Family Income Deficit in Area Code 708 is $10,745.
Families that are below poverty line in Area Code 708 earn $10,745 less on average than the poverty threshold level.
What is Inequality or Gini Index in Area Code 708?
Inequality or Gini Index in Area Code 708 is 40.63.
What is the Total Population of Area Code 708?
Total Population of Area Code 708 is 2,199,693.
What is the Total Male Population of Area Code 708?
Total Male Population of Area Code 708 is 1,081,886.
What is the Total Female Population of Area Code 708?
Total Female Population of Area Code 708 is 1,117,807.
What is the Ratio of Males per 100 Females in Area Code 708?
There are 96.79 Males per 100 Females in Area Code 708.
What is the Ratio of Females per 100 Males in Area Code 708?
There are 103.32 Females per 100 Males in Area Code 708.
What is the Median Population Age in Area Code 708?
Median Population Age in Area Code 708 is 40.0 Years.
What is the Average Family Size in Area Code 708
Average Family Size in Area Code 708 is 3.2 People.
What is the Average Household Size in Area Code 708
Average Household Size in Area Code 708 is 2.6 People.
How Large is the Labor Force in Area Code 708?
There are 1,153,796 People in the Labor Forcein in Area Code 708.
What is the Percentage of People in the Labor Force in Area Code 708?
65.6% of People are in the Labor Force in Area Code 708.
What is the Unemployment Rate in Area Code 708?
Unemployment Rate in Area Code 708 is 6.3%.