Area Code 808 Map & Demographics
Area Code 808 Map
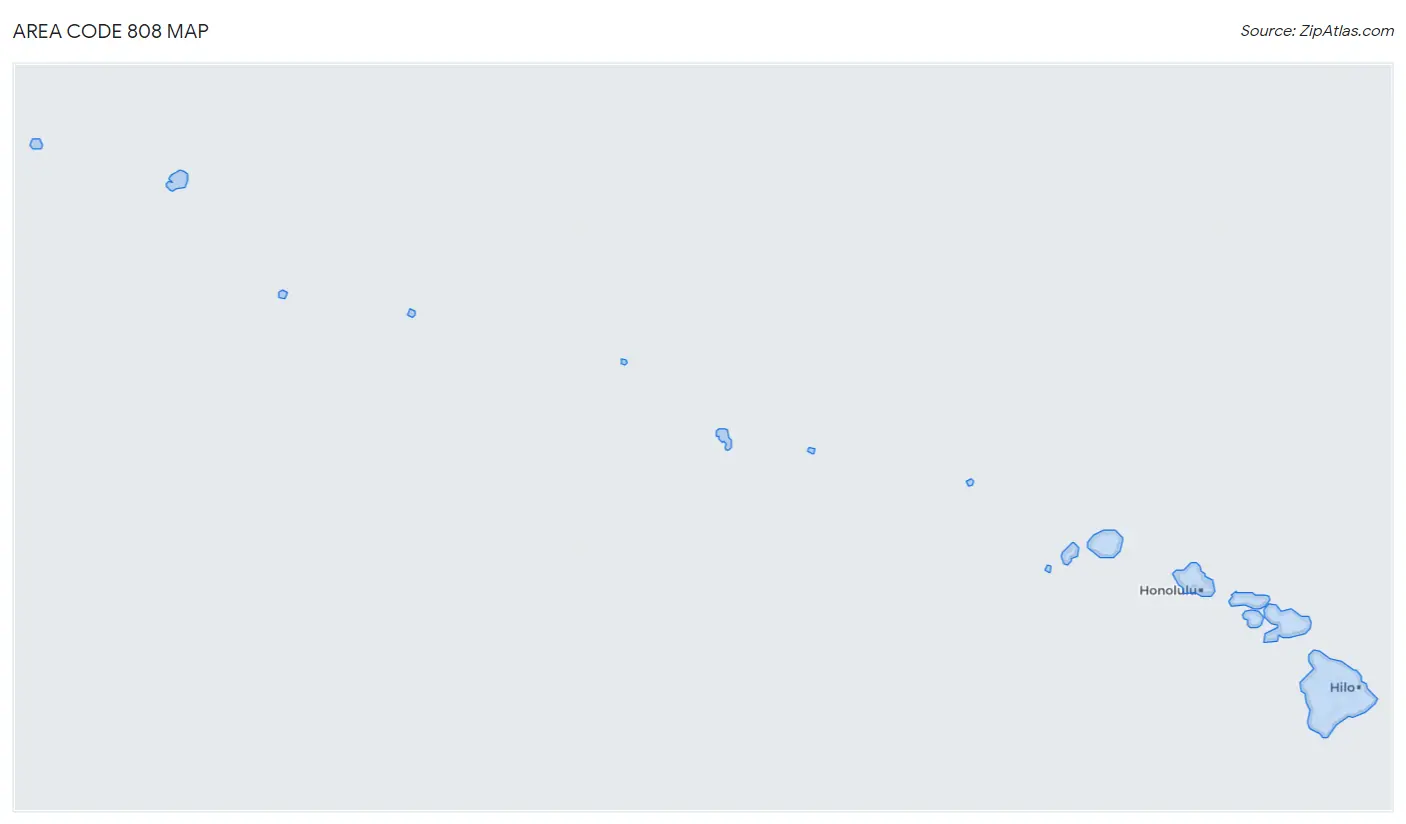
Area Code 808 Overview
$38,152
PER CAPITA INCOME
$103,238
AVG FAMILY INCOME
$87,967
AVG HOUSEHOLD INCOME
25.0%
WAGE / INCOME GAP [ % ]
75.0¢/ $1
WAGE / INCOME GAP [ $ ]
$11,067
FAMILY INCOME DEFICIT
36.99
INEQUALITY / GINI INDEX
1,450,589
TOTAL POPULATION
732,060
MALE POPULATION
718,529
FEMALE POPULATION
101.88
MALES / 100 FEMALES
98.15
FEMALES / 100 MALES
41.7
MEDIAN AGE
3.4
AVG FAMILY SIZE
2.9
AVG HOUSEHOLD SIZE
748,027
LABOR FORCE [ PEOPLE ]
63.6%
PERCENT IN LABOR FORCE
7.0%
UNEMPLOYMENT RATE
Income in Area Code 808
Income Overview in Area Code 808
Per Capita Income in Area Code 808 is $38,152, while median incomes of families and households are $103,238 and $87,967 respectively.
| Characteristic | Number | Measure |
| Per Capita Income | 1,450,589 | $38,152 |
| Median Family Income | 332,605 | $103,238 |
| Mean Family Income | 332,605 | $10,246,539 |
| Median Household Income | 483,906 | $87,967 |
| Mean Household Income | 483,906 | $9,323,217 |
| Income Deficit | 332,605 | $11,067 |
| Wage / Income Gap (%) | 1,450,589 | 25.02% |
| Wage / Income Gap ($) | 1,450,589 | 74.98¢ per $1 |
| Gini / Inequality Index | 1,450,589 | 36.99 |
Earnings by Sex in Area Code 808
Average Earnings in Area Code 808 are $42,112, $47,923 for men and $36,650 for women, a difference of 23.5%.
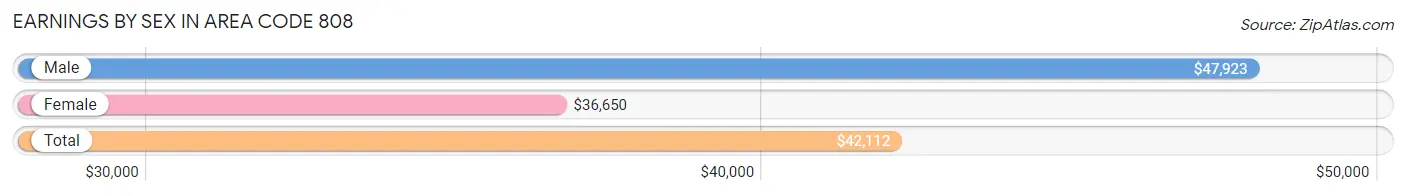
| Sex | Number | Average Earnings |
| Male | 418,304 (53.2%) | $47,923 |
| Female | 368,108 (46.8%) | $36,650 |
| Total | 786,412 (100.0%) | $42,112 |
Earnings by Sex by Income Bracket in Area Code 808
The most common earnings brackets in Area Code 808 are $100,000+ for men (79,626 | 19.0%) and $100,000+ for women (37,464 | 10.2%).
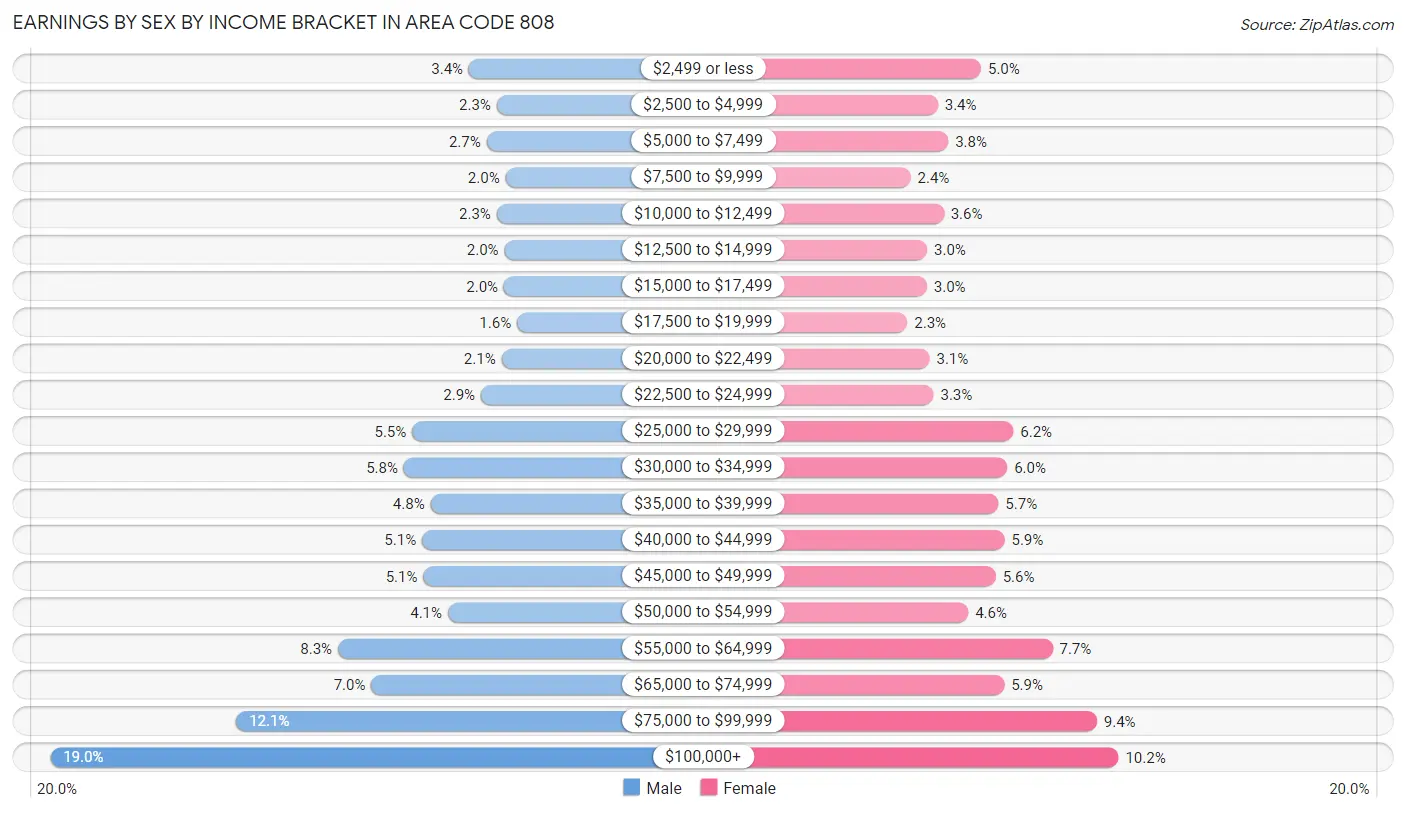
| Income | Male | Female |
| $2,499 or less | 14,028 (3.4%) | 18,507 (5.0%) |
| $2,500 to $4,999 | 9,654 (2.3%) | 12,543 (3.4%) |
| $5,000 to $7,499 | 11,261 (2.7%) | 13,977 (3.8%) |
| $7,500 to $9,999 | 8,280 (2.0%) | 8,809 (2.4%) |
| $10,000 to $12,499 | 9,679 (2.3%) | 13,359 (3.6%) |
| $12,500 to $14,999 | 8,436 (2.0%) | 11,085 (3.0%) |
| $15,000 to $17,499 | 8,515 (2.0%) | 11,048 (3.0%) |
| $17,500 to $19,999 | 6,479 (1.5%) | 8,367 (2.3%) |
| $20,000 to $22,499 | 8,892 (2.1%) | 11,402 (3.1%) |
| $22,500 to $24,999 | 12,114 (2.9%) | 11,971 (3.3%) |
| $25,000 to $29,999 | 22,911 (5.5%) | 22,960 (6.2%) |
| $30,000 to $34,999 | 24,205 (5.8%) | 22,121 (6.0%) |
| $35,000 to $39,999 | 20,035 (4.8%) | 20,899 (5.7%) |
| $40,000 to $44,999 | 21,369 (5.1%) | 21,757 (5.9%) |
| $45,000 to $49,999 | 21,155 (5.1%) | 20,526 (5.6%) |
| $50,000 to $54,999 | 17,301 (4.1%) | 16,731 (4.5%) |
| $55,000 to $64,999 | 34,558 (8.3%) | 28,365 (7.7%) |
| $65,000 to $74,999 | 29,317 (7.0%) | 21,707 (5.9%) |
| $75,000 to $99,999 | 50,489 (12.1%) | 34,510 (9.4%) |
| $100,000+ | 79,626 (19.0%) | 37,464 (10.2%) |
| Total | 418,304 (100.0%) | 368,108 (100.0%) |
Earnings by Sex by Educational Attainment in Area Code 808
Average earnings in Area Code 808 are $4,524,409 for men and $3,494,482 for women, a difference of 22.8%. Men with an educational attainment of graduate degree enjoy the highest average annual earnings of $5,112,677, while those with less than high school education earn the least with $1,783,008. Women with an educational attainment of graduate degree earn the most with the average annual earnings of $4,080,644, while those with less than high school education have the smallest earnings of $1,092,748.
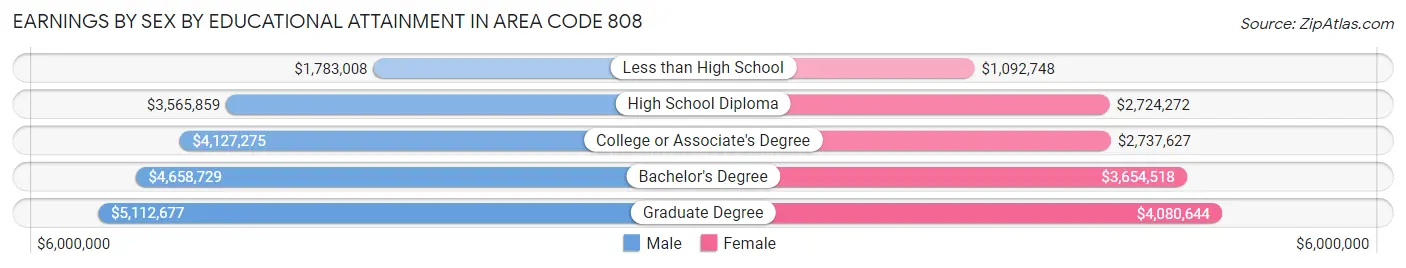
| Educational Attainment | Male Income | Female Income |
| Less than High School | $1,783,008 | $1,092,748 |
| High School Diploma | $3,565,859 | $2,724,272 |
| College or Associate's Degree | $4,127,275 | $2,737,627 |
| Bachelor's Degree | $4,658,729 | $3,654,518 |
| Graduate Degree | $5,112,677 | $4,080,644 |
| Total | $4,524,409 | $3,494,482 |
Family Income in Area Code 808
Family Income Brackets in Area Code 808
According to the Area Code 808 family income data, there are 6,489,456 families falling into the $100,000 to $149,999 income range, which is the most common income bracket and makes up 1,951.1% of all families. Conversely, the $10,000 to $14,999 income bracket is the least frequent group with only 508,886 families (153.0%) belonging to this category.
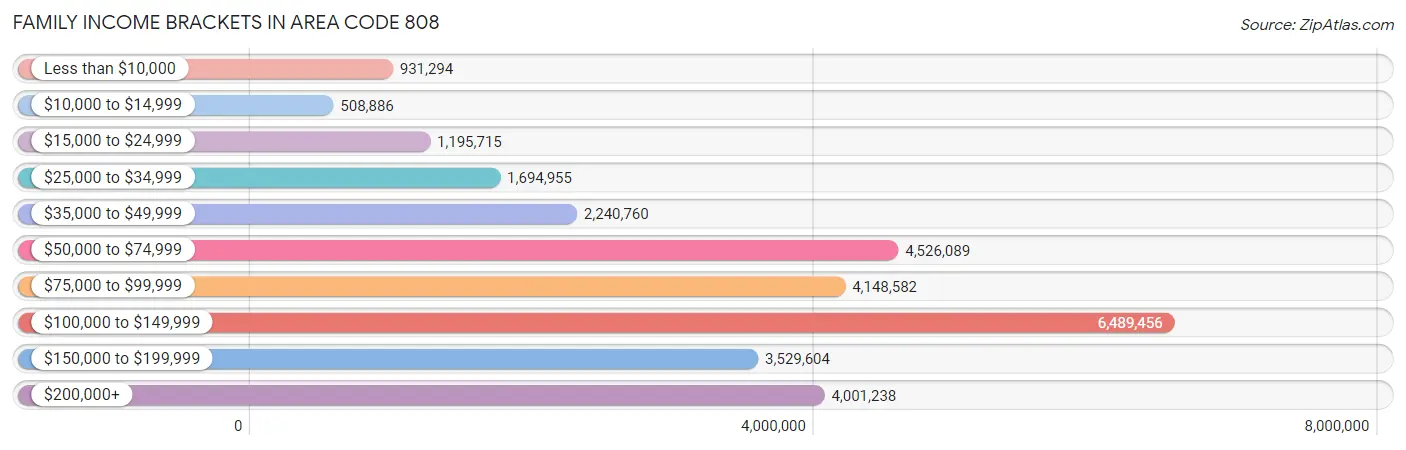
| Income Bracket | # Families | % Families |
| Less than $10,000 | 931,294 | 280.0% |
| $10,000 to $14,999 | 508,886 | 153.0% |
| $15,000 to $24,999 | 1,195,715 | 359.5% |
| $25,000 to $34,999 | 1,694,955 | 509.6% |
| $35,000 to $49,999 | 2,240,760 | 673.7% |
| $50,000 to $74,999 | 4,526,089 | 1,360.8% |
| $75,000 to $99,999 | 4,148,582 | 1,247.3% |
| $100,000 to $149,999 | 6,489,456 | 1,951.1% |
| $150,000 to $199,999 | 3,529,604 | 1,061.2% |
| $200,000+ | 4,001,238 | 1,203.0% |
Family Income by Famaliy Size in Area Code 808
7+ person families (15,172 | 4.6%) account for the highest median family income in Area Code 808 with $188,783 per family, while 2-person families (142,136 | 42.7%) have the highest median income of $44,403 per family member.
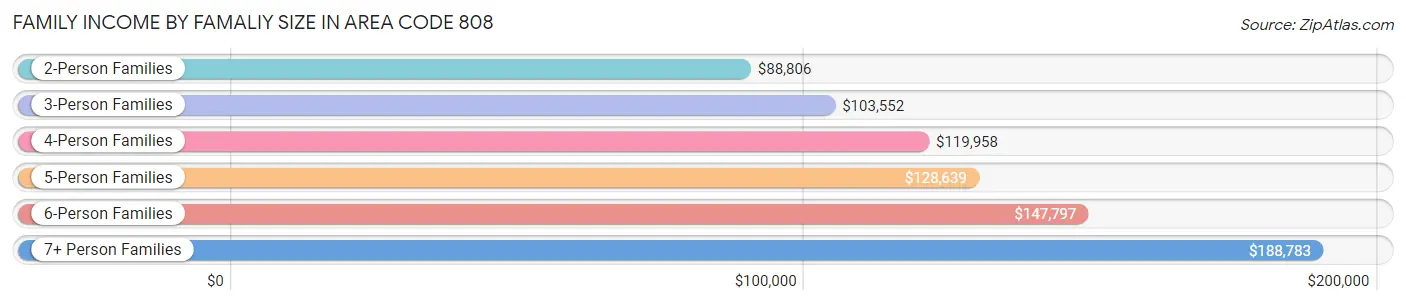
| Income Bracket | # Families | Median Income |
| 2-Person Families | 142,136 (42.7%) | $88,806 |
| 3-Person Families | 73,678 (22.2%) | $103,552 |
| 4-Person Families | 58,385 (17.5%) | $119,958 |
| 5-Person Families | 29,134 (8.8%) | $128,639 |
| 6-Person Families | 14,100 (4.2%) | $147,797 |
| 7+ Person Families | 15,172 (4.6%) | $188,783 |
| Total | 332,605 (100.0%) | $103,238 |
Family Income by Number of Earners in Area Code 808
The median family income in Area Code 808 is $103,238, with families comprising 3+ earners (56,499) having the highest median family income of $164,678, while families with no earners (44,418) have the lowest median family income of $59,308, accounting for 17.0% and 13.4% of families, respectively.
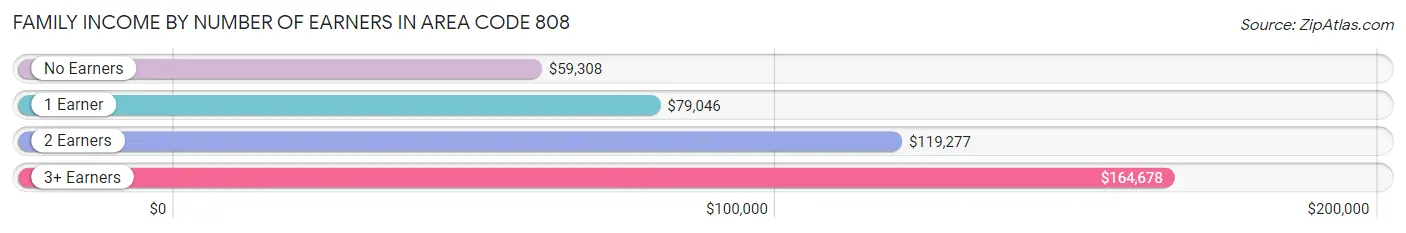
| Number of Earners | # Families | Median Income |
| No Earners | 44,418 (13.4%) | $59,308 |
| 1 Earner | 97,231 (29.2%) | $79,046 |
| 2 Earners | 134,457 (40.4%) | $119,277 |
| 3+ Earners | 56,499 (17.0%) | $164,678 |
| Total | 332,605 (100.0%) | $103,238 |
Household Income in Area Code 808
Household Income Brackets in Area Code 808
With 7,922,025 households falling in the category, the $100,000 to $149,999 income range is the most frequent in Area Code 808, accounting for 1,637.1% of all households. In contrast, only 1,469,139 households (303.6%) fall into the $10,000 to $14,999 income bracket, making it the least populous group.
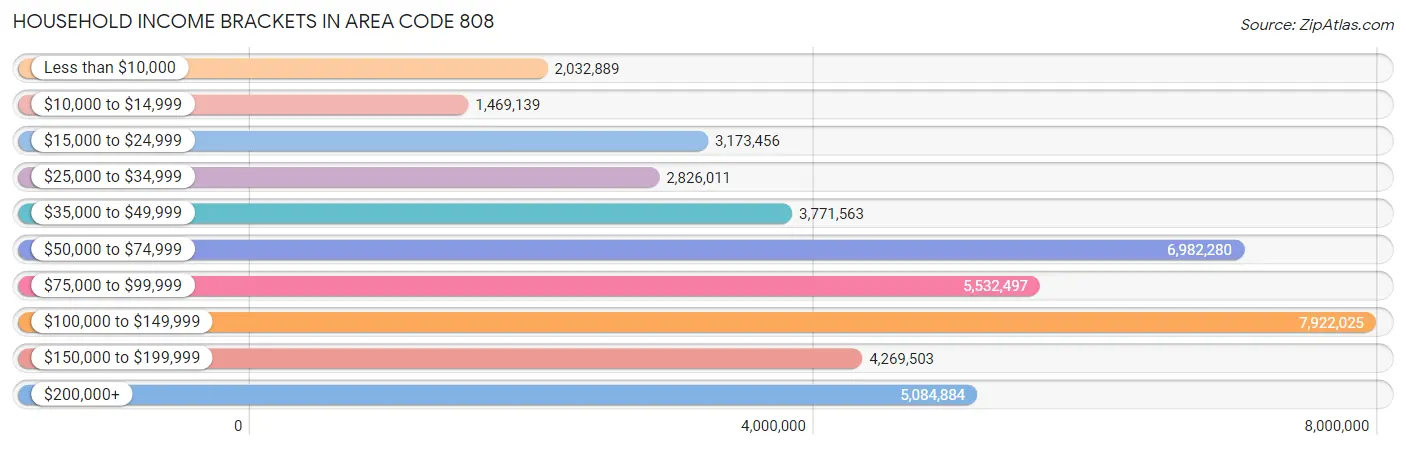
| Income Bracket | # Households | % Households |
| Less than $10,000 | 2,032,889 | 420.1% |
| $10,000 to $14,999 | 1,469,139 | 303.6% |
| $15,000 to $24,999 | 3,173,456 | 655.8% |
| $25,000 to $34,999 | 2,826,011 | 584.0% |
| $35,000 to $49,999 | 3,771,563 | 779.4% |
| $50,000 to $74,999 | 6,982,280 | 1,442.9% |
| $75,000 to $99,999 | 5,532,497 | 1,143.3% |
| $100,000 to $149,999 | 7,922,025 | 1,637.1% |
| $150,000 to $199,999 | 4,269,503 | 882.3% |
| $200,000+ | 5,084,884 | 1,050.8% |
Household Income by Householder Age in Area Code 808
The median household income in Area Code 808 is $87,967, with the highest median household income of $103,998 found in the 45 to 64 years age bracket for the primary householder. A total of 172,856 households (35.7%) fall into this category. Meanwhile, the 15 to 24 years age bracket for the primary householder has the lowest median household income of $62,332, with 14,018 households (2.9%) in this group.
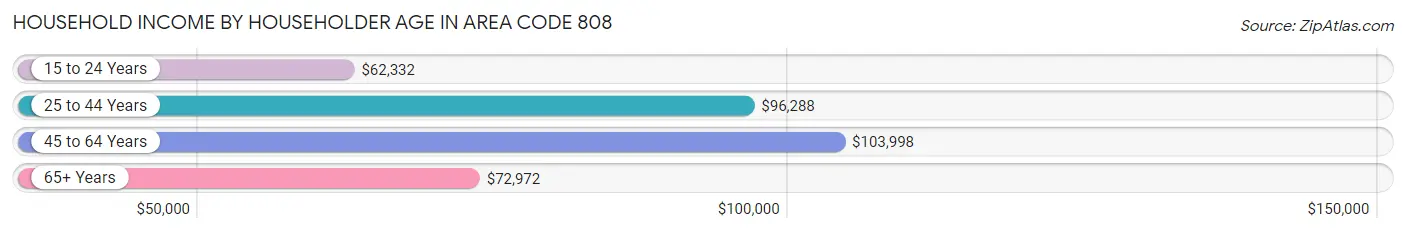
| Income Bracket | # Households | Median Income |
| 15 to 24 Years | 14,018 (2.9%) | $62,332 |
| 25 to 44 Years | 141,456 (29.2%) | $96,288 |
| 45 to 64 Years | 172,856 (35.7%) | $103,998 |
| 65+ Years | 155,576 (32.2%) | $72,972 |
| Total | 483,906 (100.0%) | $87,967 |
Poverty in Area Code 808
Income Below Poverty by Sex and Age in Area Code 808
With 9.0% poverty level for males and 10.2% for females among the residents of Area Code 808, 6 to 11 year old males and 16 and 17 year old females are the most vulnerable to poverty, with 6,944 males (13.1%) and 2,316 females (14.9%) in their respective age groups living below the poverty level.
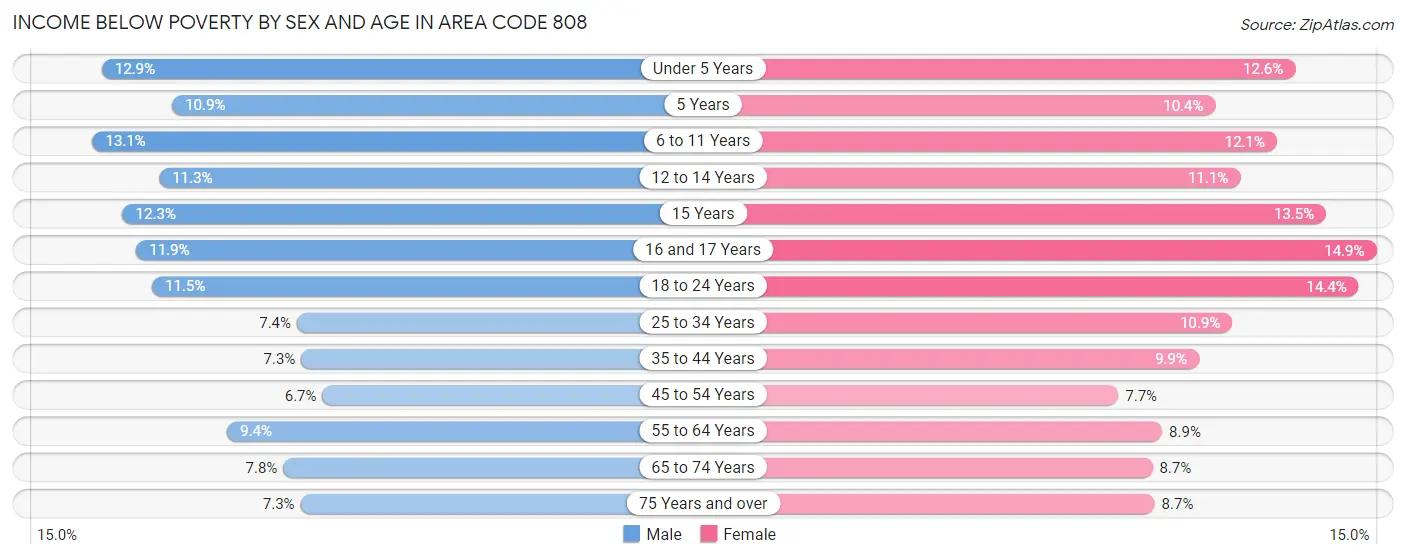
| Age Bracket | Male | Female |
| Under 5 Years | 5,403 (12.9%) | 4,988 (12.6%) |
| 5 Years | 887 (10.9%) | 760 (10.4%) |
| 6 to 11 Years | 6,944 (13.1%) | 6,001 (12.1%) |
| 12 to 14 Years | 2,959 (11.3%) | 2,720 (11.1%) |
| 15 Years | 1,067 (12.3%) | 1,040 (13.5%) |
| 16 and 17 Years | 1,892 (11.9%) | 2,316 (14.9%) |
| 18 to 24 Years | 6,389 (11.5%) | 7,381 (14.4%) |
| 25 to 34 Years | 7,391 (7.4%) | 10,207 (10.9%) |
| 35 to 44 Years | 7,002 (7.3%) | 9,141 (9.9%) |
| 45 to 54 Years | 5,796 (6.7%) | 6,547 (7.7%) |
| 55 to 64 Years | 8,425 (9.4%) | 8,153 (8.9%) |
| 65 to 74 Years | 5,945 (7.8%) | 7,009 (8.6%) |
| 75 Years and over | 3,613 (7.3%) | 5,965 (8.7%) |
| Total | 63,713 (9.0%) | 72,228 (10.2%) |
Income Above Poverty by Sex and Age in Area Code 808
According to the poverty statistics in Area Code 808, males aged 45 to 54 years and females aged 45 to 54 years are the age groups that are most secure financially, with 93.3% of males and 92.3% of females in these age groups living above the poverty line.
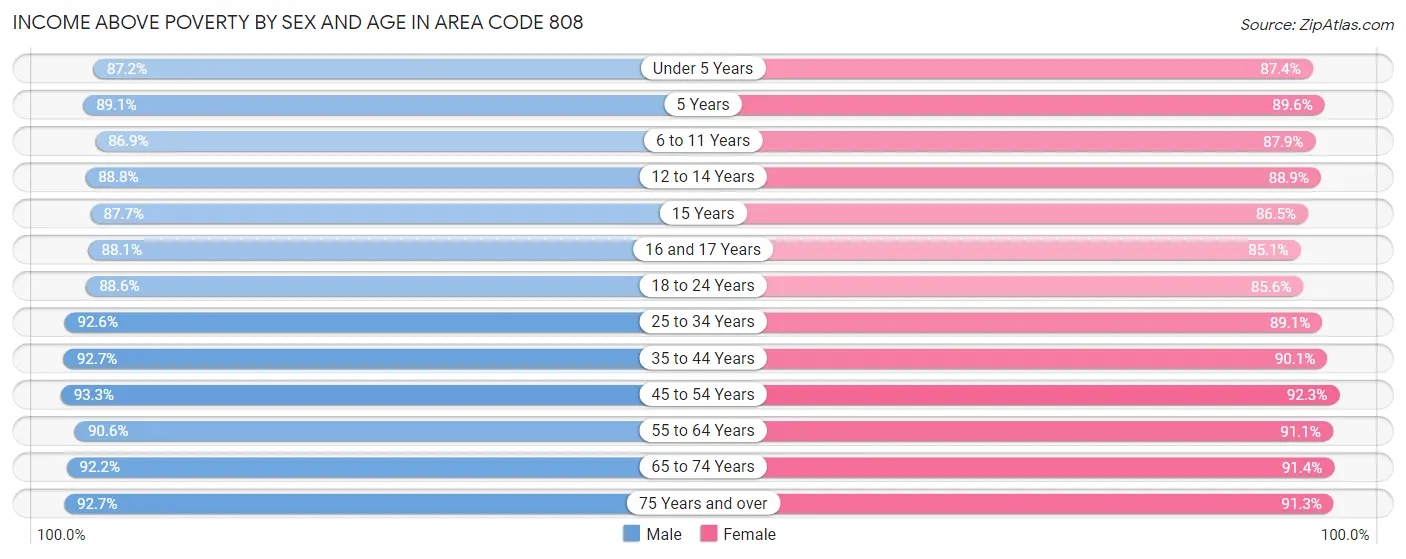
| Age Bracket | Male | Female |
| Under 5 Years | 36,656 (87.2%) | 34,542 (87.4%) |
| 5 Years | 7,260 (89.1%) | 6,545 (89.6%) |
| 6 to 11 Years | 46,010 (86.9%) | 43,569 (87.9%) |
| 12 to 14 Years | 23,345 (88.7%) | 21,816 (88.9%) |
| 15 Years | 7,632 (87.7%) | 6,676 (86.5%) |
| 16 and 17 Years | 14,014 (88.1%) | 13,246 (85.1%) |
| 18 to 24 Years | 49,388 (88.5%) | 43,915 (85.6%) |
| 25 to 34 Years | 92,169 (92.6%) | 83,717 (89.1%) |
| 35 to 44 Years | 88,979 (92.7%) | 82,788 (90.1%) |
| 45 to 54 Years | 80,595 (93.3%) | 78,480 (92.3%) |
| 55 to 64 Years | 81,593 (90.6%) | 83,250 (91.1%) |
| 65 to 74 Years | 70,258 (92.2%) | 74,003 (91.3%) |
| 75 Years and over | 45,729 (92.7%) | 62,520 (91.3%) |
| Total | 643,628 (91.0%) | 635,067 (89.8%) |
Income Below Poverty Among Married-Couple Families in Area Code 808
The poverty statistics for married-couple families in Area Code 808 show that 3.8% or 9,220 of the total 244,407 families live below the poverty line. Families with 5 or more children have the highest poverty rate of 22.8%, comprising of 577 families. On the other hand, families with 1 or 2 children have the lowest poverty rate of 3.0%, which includes 2,367 families.
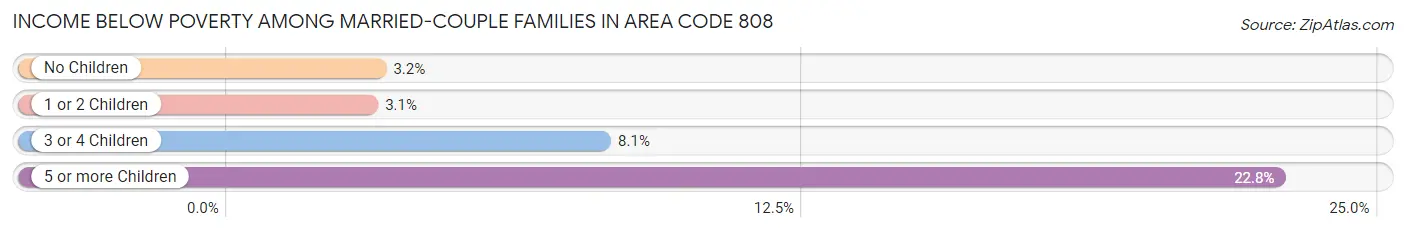
| Children | Above Poverty | Below Poverty |
| No Children | 139,766 (96.8%) | 4,661 (3.2%) |
| 1 or 2 Children | 75,200 (97.0%) | 2,367 (3.0%) |
| 3 or 4 Children | 18,268 (91.9%) | 1,615 (8.1%) |
| 5 or more Children | 1,953 (77.2%) | 577 (22.8%) |
| Total | 235,187 (96.2%) | 9,220 (3.8%) |
Income Below Poverty Among Single-Parent Households in Area Code 808
According to the poverty data in Area Code 808, 10.2% or 2,760 single-father households and 15.9% or 9,720 single-mother households are living below the poverty line. Among single-father households, those with 3 or 4 children have the highest poverty rate, with 455 households (19.2%) experiencing poverty. Likewise, among single-mother households, those with 5 or more children have the highest poverty rate, with 448 households (66.6%) falling below the poverty line.
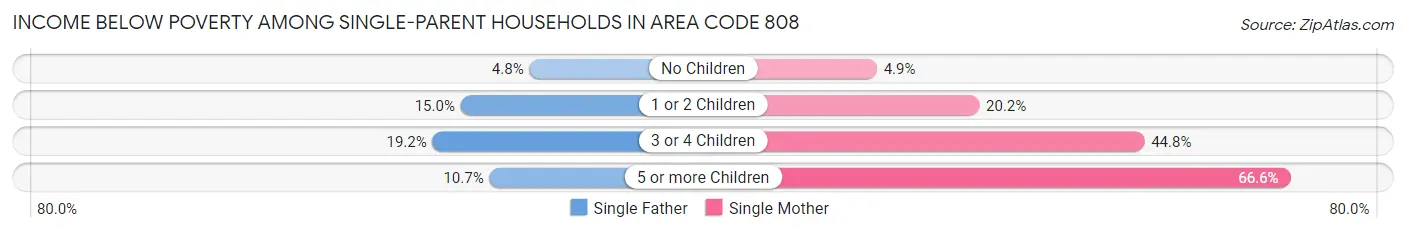
| Children | Single Father | Single Mother |
| No Children | 649 (4.8%) | 1,401 (4.9%) |
| 1 or 2 Children | 1,637 (15.0%) | 5,298 (20.2%) |
| 3 or 4 Children | 455 (19.2%) | 2,573 (44.8%) |
| 5 or more Children | 19 (10.7%) | 448 (66.6%) |
| Total | 2,760 (10.2%) | 9,720 (15.9%) |
Income Below Poverty Among Married-Couple vs Single-Parent Households in Area Code 808
The poverty data for Area Code 808 shows that 9,220 of the married-couple family households (3.8%) and 12,480 of the single-parent households (14.1%) are living below the poverty level. Within the married-couple family households, those with 5 or more children have the highest poverty rate, with 577 households (22.8%) falling below the poverty line. Among the single-parent households, those with 5 or more children have the highest poverty rate, with 467 household (54.9%) living below poverty.
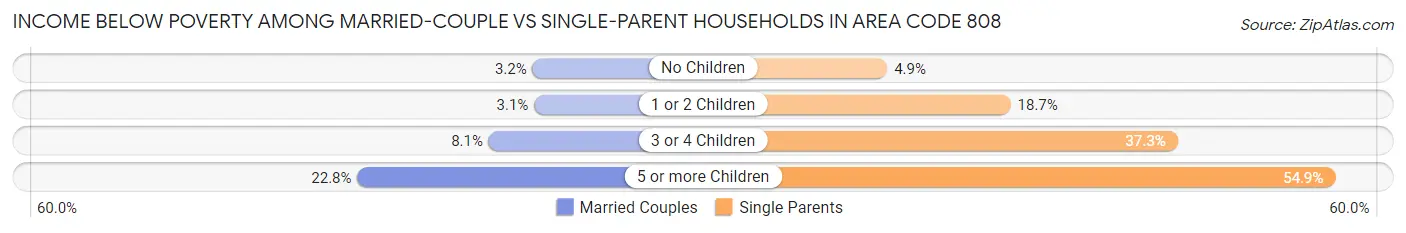
| Children | Married-Couple Families | Single-Parent Households |
| No Children | 4,661 (3.2%) | 2,050 (4.9%) |
| 1 or 2 Children | 2,367 (3.0%) | 6,935 (18.7%) |
| 3 or 4 Children | 1,615 (8.1%) | 3,028 (37.3%) |
| 5 or more Children | 577 (22.8%) | 467 (54.9%) |
| Total | 9,220 (3.8%) | 12,480 (14.1%) |
Race in Area Code 808
The most populous races in Area Code 808 are Asian (538,970 | 37.2%), Two or more Races (370,148 | 25.5%), and White / Caucasian (333,296 | 23.0%).
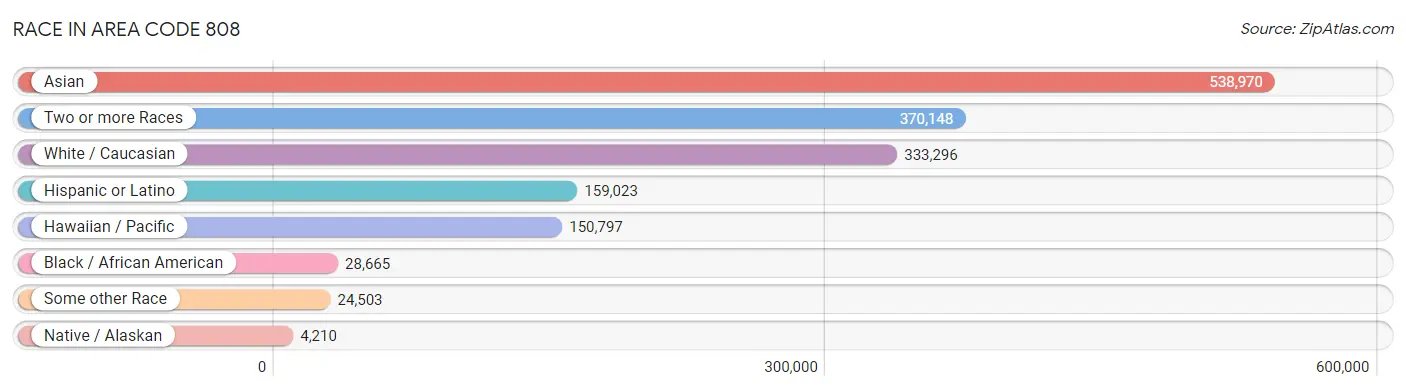
| Race | # Population | % Population |
| Asian | 538,970 | 37.2% |
| Black / African American | 28,665 | 2.0% |
| Hawaiian / Pacific | 150,797 | 10.4% |
| Hispanic or Latino | 159,023 | 11.0% |
| Native / Alaskan | 4,210 | 0.3% |
| White / Caucasian | 333,296 | 23.0% |
| Two or more Races | 370,148 | 25.5% |
| Some other Race | 24,503 | 1.7% |
| Total | 1,450,589 | 100.0% |
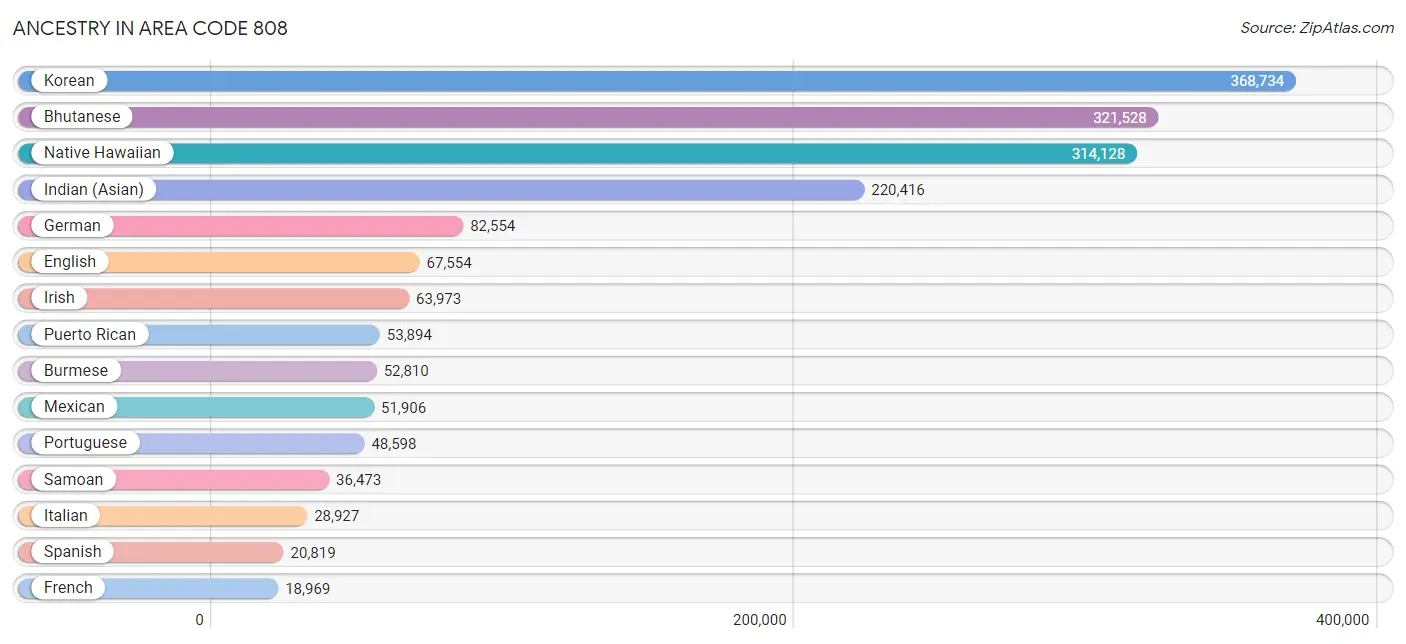
Ancestry in Area Code 808
The most populous ancestries reported in Area Code 808 are Korean (368,734 | 25.4%), Bhutanese (321,528 | 22.2%), Native Hawaiian (314,128 | 21.7%), Indian (Asian) (220,416 | 15.2%), and German (82,554 | 5.7%), together accounting for 90.1% of all Area Code 808 residents.
| Ancestry | # Population | % Population |
| Afghan | 90 | 0.0% |
| African | 2,411 | 0.2% |
| Alaska Native | 73 | 0.0% |
| Alaskan Athabascan | 160 | 0.0% |
| Albanian | 60 | 0.0% |
| Aleut | 53 | 0.0% |
| Alsatian | 36 | 0.0% |
| American | 18,350 | 1.3% |
| Apache | 1,358 | 0.1% |
| Arab | 2,371 | 0.2% |
| Argentinean | 805 | 0.1% |
| Armenian | 324 | 0.0% |
| Assyrian / Chaldean / Syriac | 20 | 0.0% |
| Australian | 765 | 0.1% |
| Austrian | 1,574 | 0.1% |
| Bangladeshi | 142 | 0.0% |
| Barbadian | 20 | 0.0% |
| Basque | 141 | 0.0% |
| Belgian | 676 | 0.1% |
| Belizean | 164 | 0.0% |
| Bermudan | 39 | 0.0% |
| Bhutanese | 321,528 | 22.2% |
| Blackfeet | 1,825 | 0.1% |
| Bolivian | 131 | 0.0% |
| Brazilian | 946 | 0.1% |
| British | 4,279 | 0.3% |
| British West Indian | 113 | 0.0% |
| Bulgarian | 483 | 0.0% |
| Burmese | 52,810 | 3.6% |
| Cajun | 27 | 0.0% |
| Cambodian | 293 | 0.0% |
| Canadian | 1,537 | 0.1% |
| Cape Verdean | 56 | 0.0% |
| Celtic | 67 | 0.0% |
| Central American | 5,460 | 0.4% |
| Central American Indian | 1,251 | 0.1% |
| Cherokee | 10,889 | 0.7% |
| Cheyenne | 260 | 0.0% |
| Chickasaw | 285 | 0.0% |
| Chilean | 551 | 0.0% |
| Chinese | 10,403 | 0.7% |
| Chippewa | 837 | 0.1% |
| Choctaw | 955 | 0.1% |
| Colombian | 1,620 | 0.1% |
| Colville | 47 | 0.0% |
| Comanche | 81 | 0.0% |
| Costa Rican | 250 | 0.0% |
| Cree | 43 | 0.0% |
| Creek | 211 | 0.0% |
| Croatian | 795 | 0.1% |
| Crow | 26 | 0.0% |
| Cuban | 1,993 | 0.1% |
| Czech | 2,043 | 0.1% |
| Czechoslovakian | 512 | 0.0% |
| Danish | 3,114 | 0.2% |
| Delaware | 92 | 0.0% |
| Dominican | 1,521 | 0.1% |
| Dutch | 6,607 | 0.5% |
| Eastern European | 1,533 | 0.1% |
| Ecuadorian | 470 | 0.0% |
| Egyptian | 315 | 0.0% |
| English | 67,554 | 4.7% |
| Estonian | 175 | 0.0% |
| Ethiopian | 92 | 0.0% |
| European | 15,063 | 1.0% |
| Fijian | 9,253 | 0.6% |
| Filipino | 2,167 | 0.2% |
| Finnish | 1,669 | 0.1% |
| French | 18,969 | 1.3% |
| French American Indian | 88 | 0.0% |
| French Canadian | 2,692 | 0.2% |
| German | 82,554 | 5.7% |
| German Russian | 17 | 0.0% |
| Ghanaian | 251 | 0.0% |
| Greek | 2,868 | 0.2% |
| Guamanian / Chamorro | 6,640 | 0.5% |
| Guatemalan | 1,592 | 0.1% |
| Guyanese | 96 | 0.0% |
| Haitian | 957 | 0.1% |
| Honduran | 776 | 0.1% |
| Hopi | 24 | 0.0% |
| Hungarian | 2,340 | 0.2% |
| Icelander | 307 | 0.0% |
| Indian (Asian) | 220,416 | 15.2% |
| Indonesian | 190 | 0.0% |
| Inupiat | 111 | 0.0% |
| Iranian | 1,029 | 0.1% |
| Iraqi | 16 | 0.0% |
| Irish | 63,973 | 4.4% |
| Iroquois | 736 | 0.1% |
| Israeli | 294 | 0.0% |
| Italian | 28,927 | 2.0% |
| Jamaican | 1,121 | 0.1% |
| Japanese | 869 | 0.1% |
| Jordanian | 23 | 0.0% |
| Kenyan | 81 | 0.0% |
| Kiowa | 5 | 0.0% |
| Korean | 368,734 | 25.4% |
| Laotian | 1,169 | 0.1% |
| Latvian | 244 | 0.0% |
| Lebanese | 849 | 0.1% |
| Liberian | 42 | 0.0% |
| Lithuanian | 946 | 0.1% |
| Lumbee | 207 | 0.0% |
| Luxembourger | 86 | 0.0% |
| Macedonian | 63 | 0.0% |
| Malaysian | 2,670 | 0.2% |
| Maltese | 23 | 0.0% |
| Marshallese | 4,393 | 0.3% |
| Menominee | 3 | 0.0% |
| Mexican | 51,906 | 3.6% |
| Mexican American Indian | 1,726 | 0.1% |
| Mongolian | 193 | 0.0% |
| Moroccan | 128 | 0.0% |
| Native Hawaiian | 314,128 | 21.7% |
| Navajo | 1,283 | 0.1% |
| Nepalese | 20 | 0.0% |
| New Zealander | 190 | 0.0% |
| Nicaraguan | 298 | 0.0% |
| Nigerian | 336 | 0.0% |
| Northern European | 1,739 | 0.1% |
| Norwegian | 10,112 | 0.7% |
| Okinawan | 94 | 0.0% |
| Osage | 64 | 0.0% |
| Ottawa | 24 | 0.0% |
| Paiute | 72 | 0.0% |
| Pakistani | 5,697 | 0.4% |
| Palestinian | 206 | 0.0% |
| Panamanian | 883 | 0.1% |
| Paraguayan | 38 | 0.0% |
| Pennsylvania German | 217 | 0.0% |
| Peruvian | 1,123 | 0.1% |
| Pima | 4 | 0.0% |
| Polish | 12,682 | 0.9% |
| Portuguese | 48,598 | 3.4% |
| Potawatomi | 98 | 0.0% |
| Pueblo | 547 | 0.0% |
| Puerto Rican | 53,894 | 3.7% |
| Puget Sound Salish | 9 | 0.0% |
| Romanian | 917 | 0.1% |
| Russian | 6,548 | 0.4% |
| Salvadoran | 1,650 | 0.1% |
| Samoan | 36,473 | 2.5% |
| Scandinavian | 3,266 | 0.2% |
| Scotch-Irish | 5,985 | 0.4% |
| Scottish | 12,888 | 0.9% |
| Seminole | 205 | 0.0% |
| Serbian | 480 | 0.0% |
| Shoshone | 146 | 0.0% |
| Sierra Leonean | 5 | 0.0% |
| Sioux | 758 | 0.1% |
| Slavic | 337 | 0.0% |
| Slovak | 585 | 0.0% |
| Slovene | 234 | 0.0% |
| South African | 400 | 0.0% |
| South American | 5,818 | 0.4% |
| South American Indian | 360 | 0.0% |
| Soviet Union | 19 | 0.0% |
| Spaniard | 11,658 | 0.8% |
| Spanish | 20,819 | 1.4% |
| Spanish American | 367 | 0.0% |
| Spanish American Indian | 63 | 0.0% |
| Sri Lankan | 17,032 | 1.2% |
| Subsaharan African | 4,165 | 0.3% |
| Sudanese | 23 | 0.0% |
| Swedish | 9,035 | 0.6% |
| Swiss | 2,342 | 0.2% |
| Syrian | 189 | 0.0% |
| Taiwanese | 42 | 0.0% |
| Thai | 5,578 | 0.4% |
| Tlingit-Haida | 365 | 0.0% |
| Tohono O'Odham | 71 | 0.0% |
| Tongan | 9,535 | 0.7% |
| Trinidadian and Tobagonian | 143 | 0.0% |
| Tsimshian | 22 | 0.0% |
| Turkish | 350 | 0.0% |
| Ukrainian | 2,079 | 0.1% |
| Uruguayan | 89 | 0.0% |
| Ute | 89 | 0.0% |
| Venezuelan | 925 | 0.1% |
| Vietnamese | 139 | 0.0% |
| Welsh | 4,265 | 0.3% |
| West Indian | 482 | 0.0% |
| Yaqui | 279 | 0.0% |
| Yugoslavian | 296 | 0.0% |
| Yuman | 3 | 0.0% |
| Yup'ik | 66 | 0.0% |
| Zimbabwean | 118 | 0.0% | View All 188 Rows |
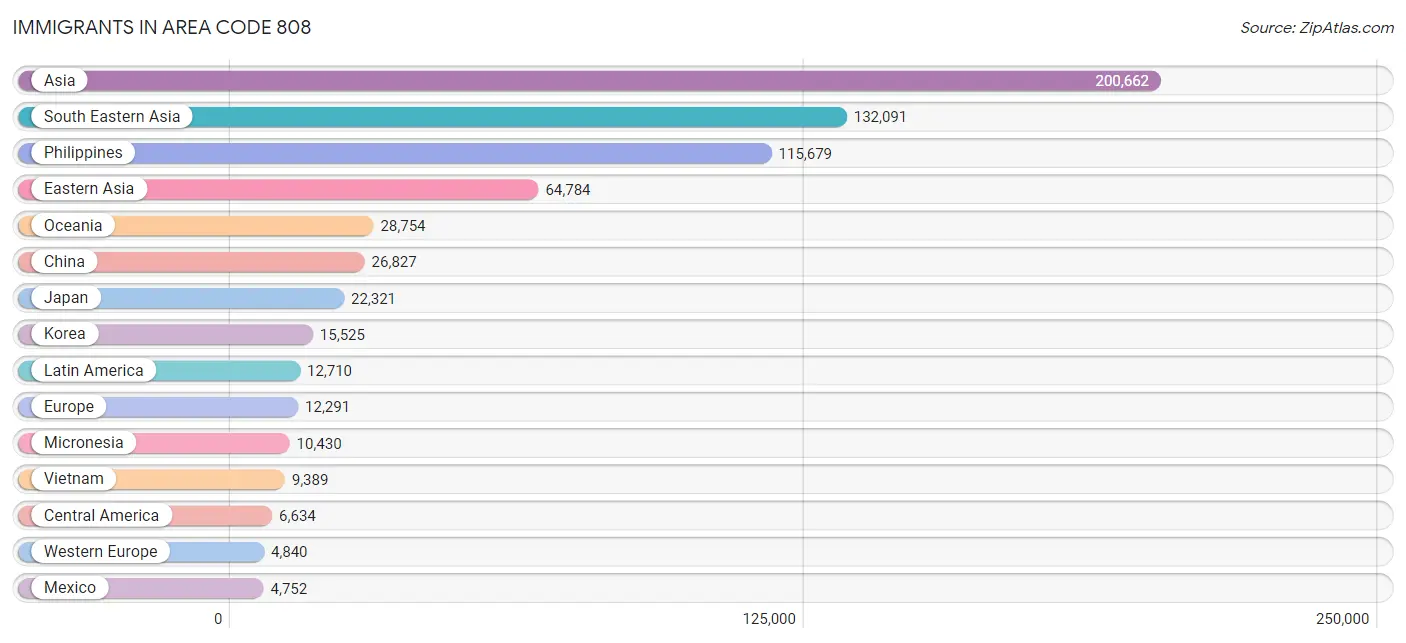
Immigrants in Area Code 808
The most numerous immigrant groups reported in Area Code 808 came from Asia (200,662 | 13.8%), South Eastern Asia (132,091 | 9.1%), Philippines (115,679 | 8.0%), Eastern Asia (64,784 | 4.5%), and Oceania (28,754 | 2.0%), together accounting for 37.4% of all Area Code 808 residents.
| Immigration Origin | # Population | % Population |
| Afghanistan | 49 | 0.0% |
| Africa | 2,290 | 0.2% |
| Albania | 4 | 0.0% |
| Argentina | 326 | 0.0% |
| Asia | 200,662 | 13.8% |
| Australia | 1,171 | 0.1% |
| Austria | 126 | 0.0% |
| Azores | 4 | 0.0% |
| Bahamas | 35 | 0.0% |
| Bangladesh | 80 | 0.0% |
| Barbados | 34 | 0.0% |
| Belarus | 77 | 0.0% |
| Belgium | 177 | 0.0% |
| Belize | 121 | 0.0% |
| Bolivia | 13 | 0.0% |
| Bosnia and Herzegovina | 99 | 0.0% |
| Brazil | 1,617 | 0.1% |
| Bulgaria | 476 | 0.0% |
| Cabo Verde | 19 | 0.0% |
| Cambodia | 331 | 0.0% |
| Cameroon | 101 | 0.0% |
| Canada | 4,635 | 0.3% |
| Caribbean | 1,942 | 0.1% |
| Central America | 6,634 | 0.5% |
| Chile | 363 | 0.0% |
| China | 26,827 | 1.8% |
| Colombia | 608 | 0.0% |
| Congo | 120 | 0.0% |
| Costa Rica | 72 | 0.0% |
| Croatia | 122 | 0.0% |
| Cuba | 180 | 0.0% |
| Czechoslovakia | 249 | 0.0% |
| Denmark | 183 | 0.0% |
| Dominica | 1 | 0.0% |
| Dominican Republic | 288 | 0.0% |
| Eastern Africa | 384 | 0.0% |
| Eastern Asia | 64,784 | 4.5% |
| Eastern Europe | 3,409 | 0.2% |
| Ecuador | 201 | 0.0% |
| Egypt | 190 | 0.0% |
| El Salvador | 282 | 0.0% |
| England | 893 | 0.1% |
| Eritrea | 31 | 0.0% |
| Ethiopia | 17 | 0.0% |
| Europe | 12,291 | 0.9% |
| Fiji | 393 | 0.0% |
| France | 979 | 0.1% |
| Germany | 2,843 | 0.2% |
| Ghana | 268 | 0.0% |
| Greece | 50 | 0.0% |
| Grenada | 99 | 0.0% |
| Guatemala | 726 | 0.1% |
| Guyana | 69 | 0.0% |
| Haiti | 378 | 0.0% |
| Honduras | 398 | 0.0% |
| Hong Kong | 4,291 | 0.3% |
| Hungary | 107 | 0.0% |
| India | 1,303 | 0.1% |
| Indonesia | 798 | 0.1% |
| Iran | 712 | 0.1% |
| Iraq | 33 | 0.0% |
| Ireland | 277 | 0.0% |
| Israel | 221 | 0.0% |
| Italy | 333 | 0.0% |
| Jamaica | 469 | 0.0% |
| Japan | 22,321 | 1.5% |
| Jordan | 25 | 0.0% |
| Kazakhstan | 61 | 0.0% |
| Kenya | 103 | 0.0% |
| Korea | 15,525 | 1.1% |
| Laos | 1,164 | 0.1% |
| Latin America | 12,710 | 0.9% |
| Latvia | 48 | 0.0% |
| Lebanon | 48 | 0.0% |
| Liberia | 35 | 0.0% |
| Lithuania | 83 | 0.0% |
| Malaysia | 1,009 | 0.1% |
| Mexico | 4,752 | 0.3% |
| Micronesia | 10,430 | 0.7% |
| Middle Africa | 238 | 0.0% |
| Moldova | 29 | 0.0% |
| Morocco | 9 | 0.0% |
| Nepal | 191 | 0.0% |
| Netherlands | 363 | 0.0% |
| Nicaragua | 131 | 0.0% |
| Nigeria | 55 | 0.0% |
| North Macedonia | 11 | 0.0% |
| Northern Africa | 303 | 0.0% |
| Northern Europe | 3,139 | 0.2% |
| Norway | 138 | 0.0% |
| Oceania | 28,754 | 2.0% |
| Pakistan | 82 | 0.0% |
| Panama | 152 | 0.0% |
| Peru | 314 | 0.0% |
| Philippines | 115,679 | 8.0% |
| Poland | 404 | 0.0% |
| Portugal | 182 | 0.0% |
| Romania | 286 | 0.0% |
| Russia | 734 | 0.1% |
| Saudi Arabia | 64 | 0.0% |
| Scotland | 19 | 0.0% |
| Serbia | 109 | 0.0% |
| Sierra Leone | 27 | 0.0% |
| Singapore | 305 | 0.0% |
| South Africa | 787 | 0.1% |
| South America | 4,134 | 0.3% |
| South Central Asia | 2,865 | 0.2% |
| South Eastern Asia | 132,091 | 9.1% |
| Southern Europe | 891 | 0.1% |
| Spain | 314 | 0.0% |
| Sri Lanka | 238 | 0.0% |
| Sudan | 45 | 0.0% |
| Sweden | 246 | 0.0% |
| Switzerland | 352 | 0.0% |
| Taiwan | 2,701 | 0.2% |
| Thailand | 3,276 | 0.2% |
| Trinidad and Tobago | 346 | 0.0% |
| Turkey | 215 | 0.0% |
| Ukraine | 331 | 0.0% |
| Uruguay | 82 | 0.0% |
| Uzbekistan | 34 | 0.0% |
| Venezuela | 504 | 0.0% |
| Vietnam | 9,389 | 0.6% |
| West Indies | 23 | 0.0% |
| Western Africa | 492 | 0.0% |
| Western Asia | 648 | 0.0% |
| Western Europe | 4,840 | 0.3% |
| Yemen | 3 | 0.0% |
| Zaire | 5 | 0.0% |
| Zimbabwe | 104 | 0.0% | View All 130 Rows |
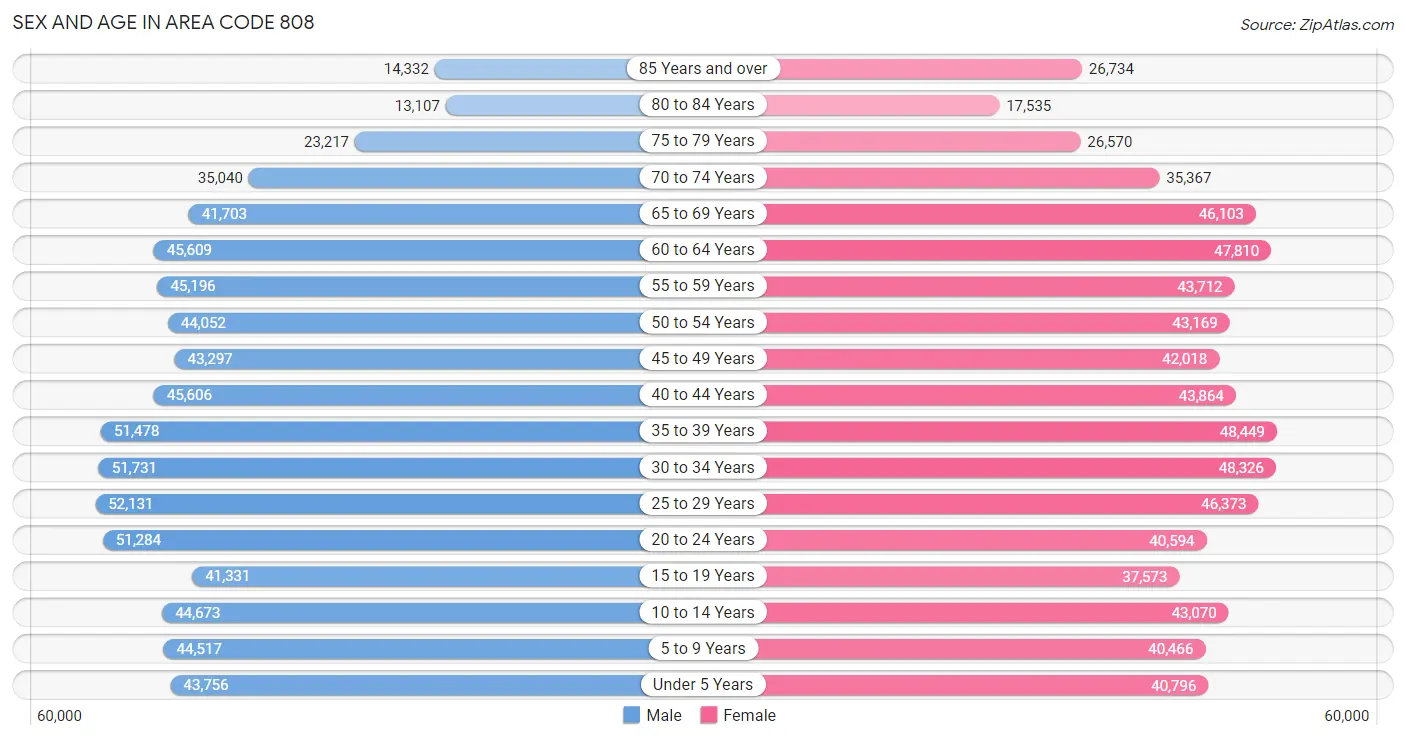
Sex and Age in Area Code 808
Sex and Age in Area Code 808
The most populous age groups in Area Code 808 are 25 to 29 Years (52,131 | 7.1%) for men and 35 to 39 Years (48,449 | 6.7%) for women.
| Age Bracket | Male | Female |
| Under 5 Years | 43,756 (6.0%) | 40,796 (5.7%) |
| 5 to 9 Years | 44,517 (6.1%) | 40,466 (5.6%) |
| 10 to 14 Years | 44,673 (6.1%) | 43,070 (6.0%) |
| 15 to 19 Years | 41,331 (5.7%) | 37,573 (5.2%) |
| 20 to 24 Years | 51,284 (7.0%) | 40,594 (5.7%) |
| 25 to 29 Years | 52,131 (7.1%) | 46,373 (6.5%) |
| 30 to 34 Years | 51,731 (7.1%) | 48,326 (6.7%) |
| 35 to 39 Years | 51,478 (7.0%) | 48,449 (6.7%) |
| 40 to 44 Years | 45,606 (6.2%) | 43,864 (6.1%) |
| 45 to 49 Years | 43,297 (5.9%) | 42,018 (5.9%) |
| 50 to 54 Years | 44,052 (6.0%) | 43,169 (6.0%) |
| 55 to 59 Years | 45,196 (6.2%) | 43,712 (6.1%) |
| 60 to 64 Years | 45,609 (6.2%) | 47,810 (6.7%) |
| 65 to 69 Years | 41,703 (5.7%) | 46,103 (6.4%) |
| 70 to 74 Years | 35,040 (4.8%) | 35,367 (4.9%) |
| 75 to 79 Years | 23,217 (3.2%) | 26,570 (3.7%) |
| 80 to 84 Years | 13,107 (1.8%) | 17,535 (2.4%) |
| 85 Years and over | 14,332 (2.0%) | 26,734 (3.7%) |
| Total | 732,060 (100.0%) | 718,529 (100.0%) |
Families and Households in Area Code 808
Median Family Size in Area Code 808
The median family size in Area Code 808 is 3.43 persons per family, with single female/mother families (61,141 | 18.4%) accounting for the largest median family size of 3.5788 persons per family. On the other hand, married-couple families (244,407 | 73.5%) represent the smallest median family size with 3.44 persons per family.
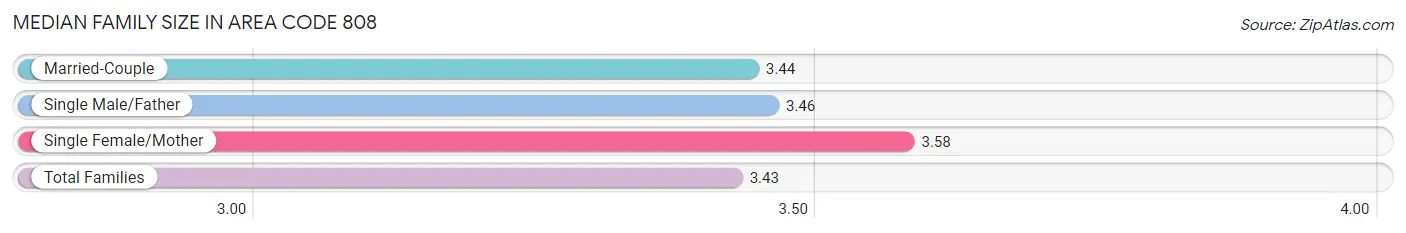
| Family Type | # Families | Family Size |
| Married-Couple | 244,407 (73.5%) | 3.44 |
| Single Male/Father | 27,057 (8.1%) | 3.46 |
| Single Female/Mother | 61,141 (18.4%) | 3.58 |
| Total Families | 332,605 (100.0%) | 3.43 |
Median Household Size in Area Code 808
The median household size in Area Code 808 is 2.91 persons per household, with single female/mother households (61,141 | 12.6%) accounting for the largest median household size of 3.93119 persons per household. non-family households (151,301 | 31.3%) represent the smallest median household size with 1.35 persons per household.
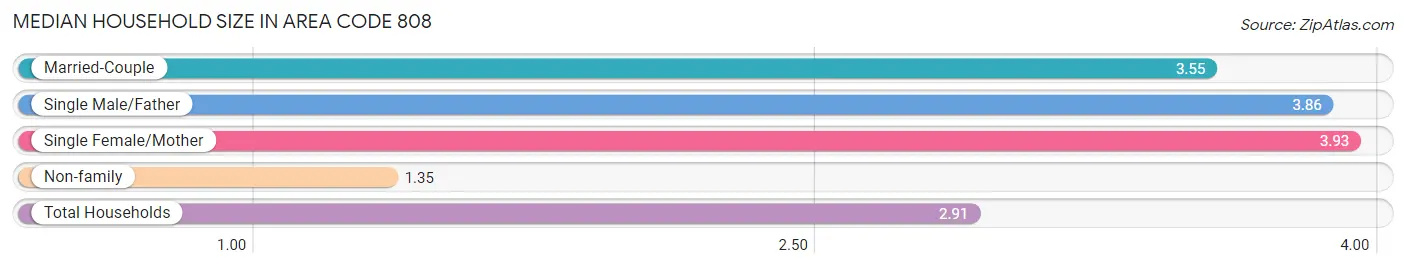
| Household Type | # Households | Household Size |
| Married-Couple | 244,407 (50.5%) | 3.55 |
| Single Male/Father | 27,057 (5.6%) | 3.86 |
| Single Female/Mother | 61,141 (12.6%) | 3.93 |
| Non-family | 151,301 (31.3%) | 1.35 |
| Total Households | 483,906 (100.0%) | 2.91 |
Household Size by Marriage Status in Area Code 808
Out of a total of 483,906 households in Area Code 808, 332,605 (68.7%) are family households, while 151,301 (31.3%) are nonfamily households. The most numerous type of family households are 2-person households, comprising 130,163, and the most common type of nonfamily households are 1-person households, comprising 118,744.
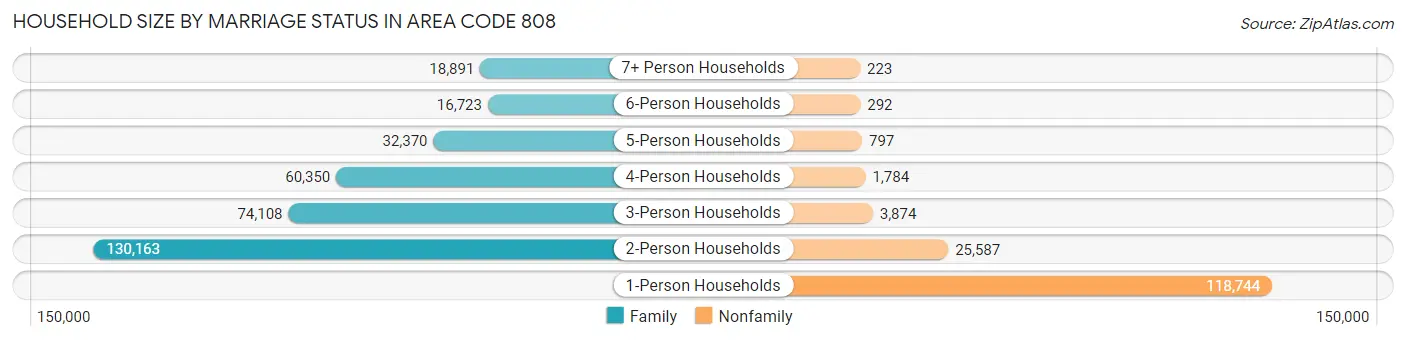
| Household Size | Family Households | Nonfamily Households |
| 1-Person Households | - | 118,744 (24.5%) |
| 2-Person Households | 130,163 (26.9%) | 25,587 (5.3%) |
| 3-Person Households | 74,108 (15.3%) | 3,874 (0.8%) |
| 4-Person Households | 60,350 (12.5%) | 1,784 (0.4%) |
| 5-Person Households | 32,370 (6.7%) | 797 (0.2%) |
| 6-Person Households | 16,723 (3.5%) | 292 (0.1%) |
| 7+ Person Households | 18,891 (3.9%) | 223 (0.1%) |
| Total | 332,605 (68.7%) | 151,301 (31.3%) |
Female Fertility in Area Code 808
Fertility by Age in Area Code 808
Average fertility rate in Area Code 808 is 63.8 births per 1,000 women. Women in the age bracket of 20 to 34 years have the highest fertility rate with 97.9 births per 1,000 women. Women in the age bracket of 20 to 34 years acount for 61.8% of all women with births.
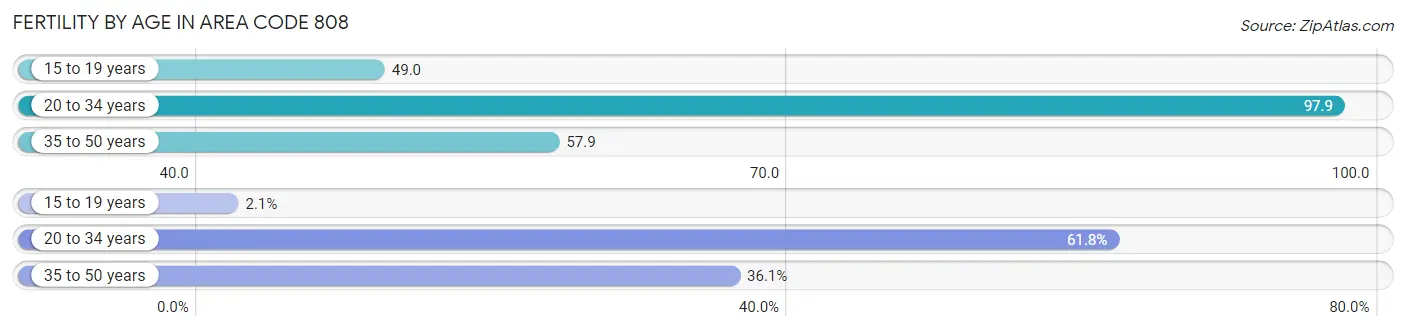
| Age Bracket | Women with Births | Births / 1,000 Women |
| 15 to 19 years | 374 (2.1%) | 49.0 |
| 20 to 34 years | 11,162 (61.8%) | 97.9 |
| 35 to 50 years | 6,519 (36.1%) | 57.9 |
| Total | 18,055 (100.0%) | 63.8 |
Fertility by Age by Marriage Status in Area Code 808
58.4% of women with births (18,055) in Area Code 808 are married. The highest percentage of unmarried women with births falls into 15 to 19 years age bracket with 96.8% of them unmarried at the time of birth, while the lowest percentage of unmarried women with births belong to 35 to 50 years age bracket with 31.7% of them unmarried.
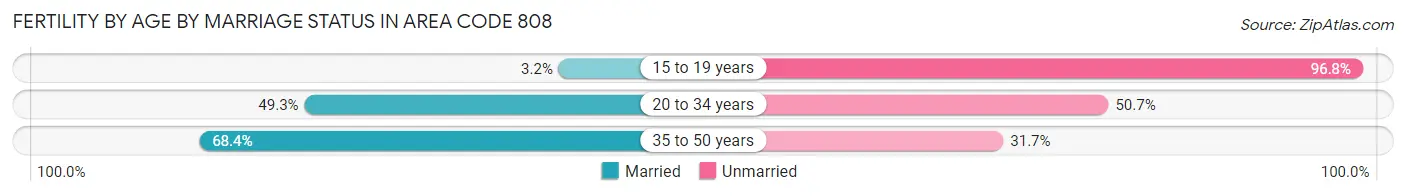
| Age Bracket | Married | Unmarried |
| 15 to 19 years | 12 (3.2%) | 362 (96.8%) |
| 20 to 34 years | 5,503 (49.3%) | 5,659 (50.7%) |
| 35 to 50 years | 4,456 (68.3%) | 2,063 (31.7%) |
| Total | 10,550 (58.4%) | 7,505 (41.6%) |
Fertility by Education in Area Code 808
Average fertility rate in Area Code 808 is 63.8 births per 1,000 women. Women with the education attainment of less than high school have the highest fertility rate of 108.4 births per 1,000 women, while women with the education attainment of bachelor's degree have the lowest fertility at 73.5 births per 1,000 women. Women with the education attainment of college or associate's degree represent 33.7% of all women with births.
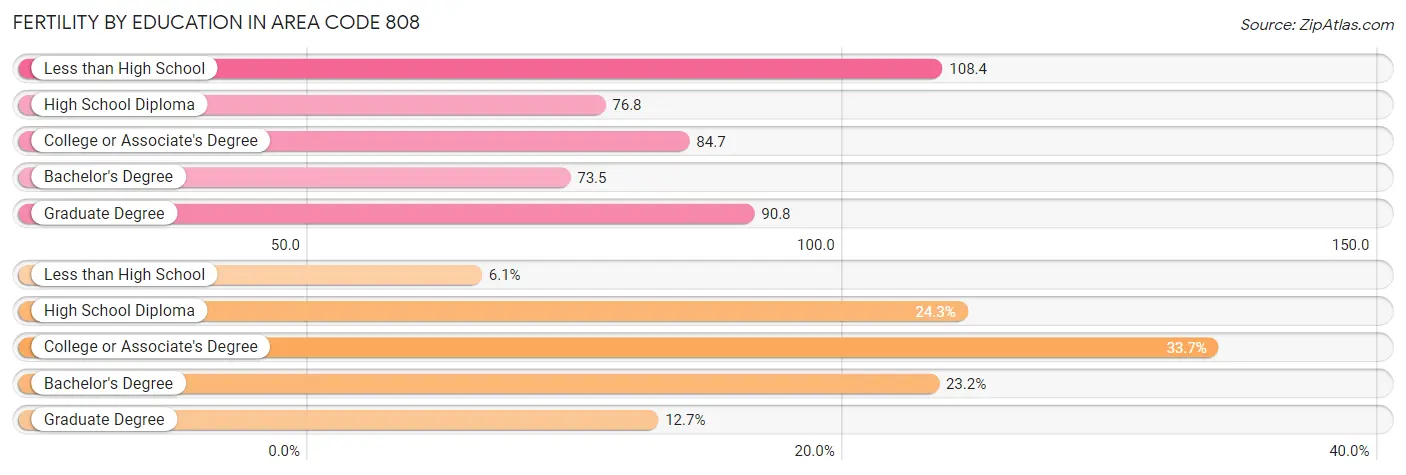
| Educational Attainment | Women with Births | Births / 1,000 Women |
| Less than High School | 1,100 (6.1%) | 108.4 |
| High School Diploma | 4,386 (24.3%) | 76.8 |
| College or Associate's Degree | 6,084 (33.7%) | 84.7 |
| Bachelor's Degree | 4,192 (23.2%) | 73.5 |
| Graduate Degree | 2,293 (12.7%) | 90.8 |
| Total | 18,055 (100.0%) | 63.8 |
Fertility by Education by Marriage Status in Area Code 808
41.6% of women with births in Area Code 808 are unmarried. Women with the educational attainment of graduate degree are most likely to be married with 67.0% of them married at childbirth, while women with the educational attainment of less than high school are least likely to be married with 80.2% of them unmarried at childbirth.
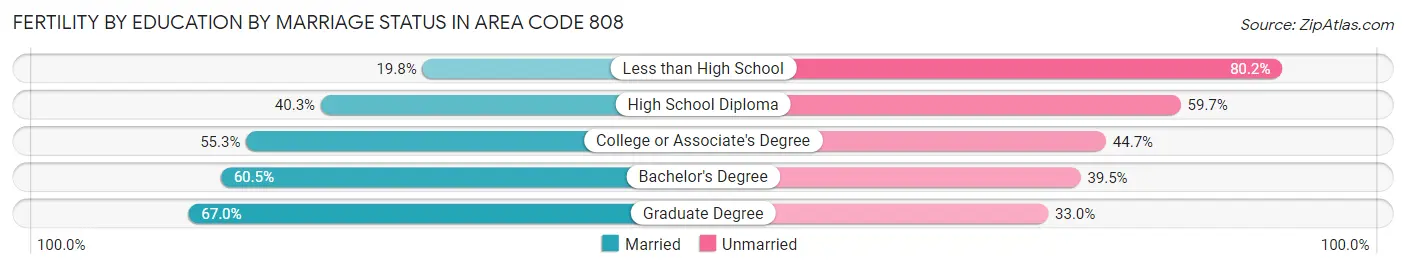
| Educational Attainment | Married | Unmarried |
| Less than High School | 218 (19.8%) | 882 (80.2%) |
| High School Diploma | 1,767 (40.3%) | 2,619 (59.7%) |
| College or Associate's Degree | 3,367 (55.3%) | 2,717 (44.7%) |
| Bachelor's Degree | 2,535 (60.5%) | 1,657 (39.5%) |
| Graduate Degree | 1,536 (67.0%) | 757 (33.0%) |
| Total | 10,550 (58.4%) | 7,505 (41.6%) |
Employment Characteristics in Area Code 808
Employment by Class of Employer in Area Code 808
Among the 704,432 employed individuals in Area Code 808, private company employees (387,018 | 54.9%), federal government employees (96,148 | 13.7%), and state government employees (62,085 | 8.8%) make up the most common classes of employment.
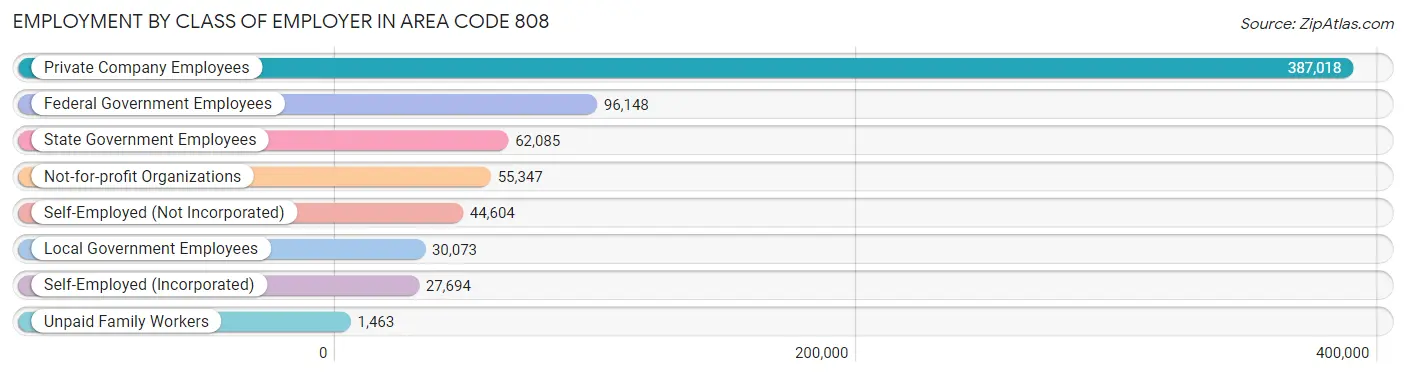
| Employer Class | # Employees | % Employees |
| Private Company Employees | 387,018 | 54.9% |
| Self-Employed (Incorporated) | 27,694 | 3.9% |
| Self-Employed (Not Incorporated) | 44,604 | 6.3% |
| Not-for-profit Organizations | 55,347 | 7.9% |
| Local Government Employees | 30,073 | 4.3% |
| State Government Employees | 62,085 | 8.8% |
| Federal Government Employees | 96,148 | 13.7% |
| Unpaid Family Workers | 1,463 | 0.2% |
| Total | 704,432 | 100.0% |
Employment Status by Age in Area Code 808
According to the labor force statistics for Area Code 808, out of the total population over 16 years of age (1,176,872), 63.6% or 748,020 individuals are in the labor force, with 7.0% or 52,137 of them unemployed. The age group with the highest labor force participation rate is 35 to 44 years, with 85.6% or 162,048 individuals in the labor force. Within the labor force, the 16 to 19 years age range has the highest percentage of unemployed individuals, with 1,272.4% or 357,659 of them being unemployed.
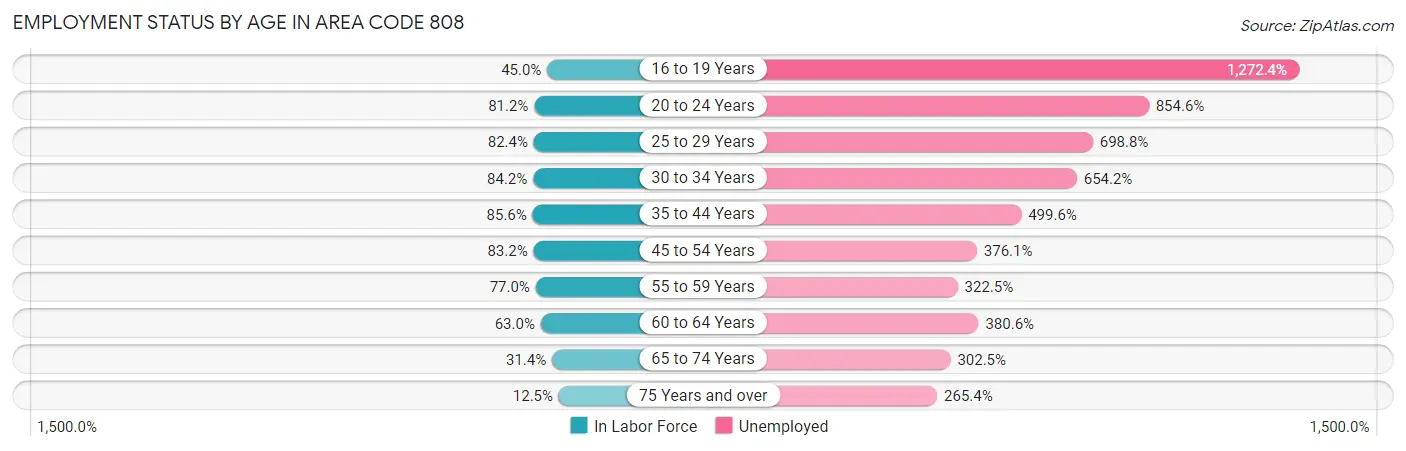
| Age Bracket | In Labor Force | Unemployed |
| 16 to 19 Years | 28,107 (45.0%) | 357,659 (1,272.4%) |
| 20 to 24 Years | 74,593 (81.2%) | 637,497 (854.6%) |
| 25 to 29 Years | 81,150 (82.4%) | 567,062 (698.8%) |
| 30 to 34 Years | 84,240 (84.2%) | 551,085 (654.2%) |
| 35 to 44 Years | 162,051 (85.6%) | 809,592 (499.6%) |
| 45 to 54 Years | 143,554 (83.2%) | 539,892 (376.1%) |
| 55 to 59 Years | 68,428 (77.0%) | 220,693 (322.5%) |
| 60 to 64 Years | 58,856 (63.0%) | 223,998 (380.6%) |
| 65 to 74 Years | 49,675 (31.4%) | 150,279 (302.5%) |
| 75 Years and over | 15,210 (12.5%) | 40,370 (265.4%) |
| Total | 748,027 (63.6%) | 52,139 (7.0%) |
Employment Status by Educational Attainment in Area Code 808
According to labor force statistics for Area Code 808, 80.6% of individuals (599,011) out of the total population between 25 and 64 years of age (742,821) are in the labor force, with 528.6% or 3,166,372 of them being unemployed. The group with the highest labor force participation rate are those with the educational attainment of bachelor's degree or higher, with 86.5% or 228,129 individuals in the labor force. Within the labor force, individuals with high school diploma education have the highest percentage of unemployment, with 597.8% or 911,167 of them being unemployed.
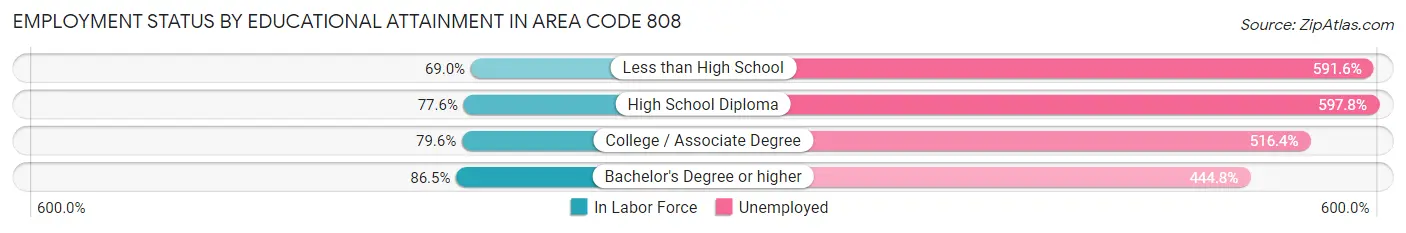
| Educational Attainment | In Labor Force | Unemployed |
| Less than High School | 28,722 (69.0%) | 246,106 (591.6%) |
| High School Diploma | 152,415 (77.6%) | 1,174,031 (597.8%) |
| College / Associate Degree | 191,804 (79.6%) | 1,244,705 (516.4%) |
| Bachelor's Degree or higher | 228,131 (86.5%) | 1,173,356 (444.8%) |
| Total | 598,985 (80.6%) | 3,926,552 (528.6%) |
Employment Occupations by Sex in Area Code 808
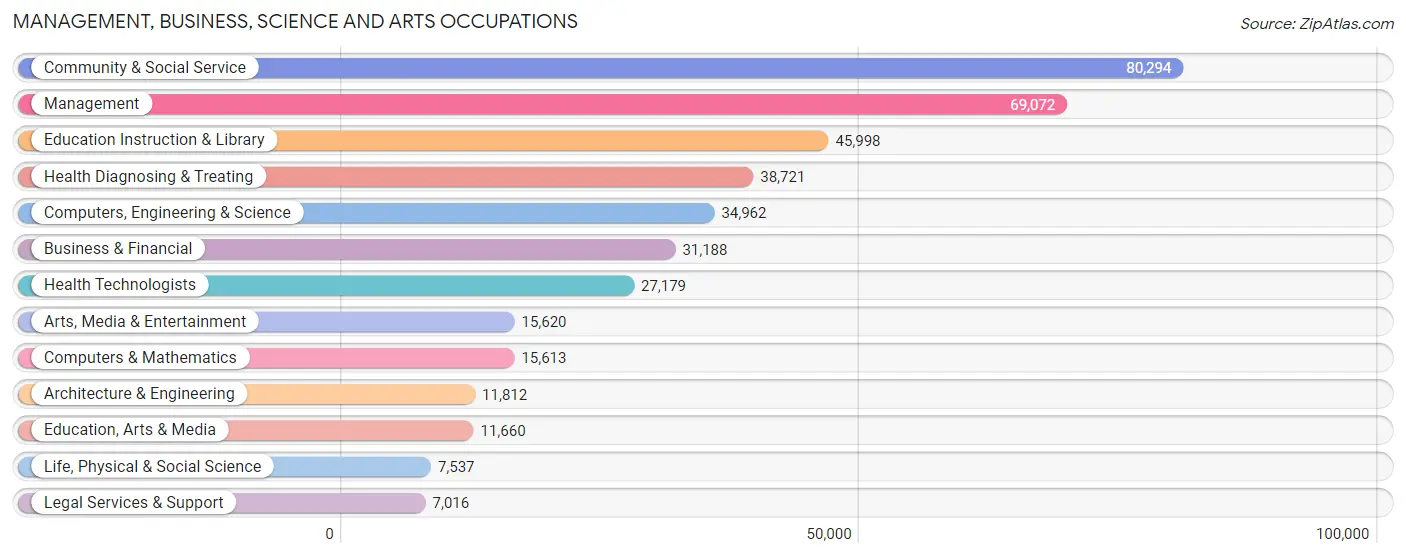
Management, Business, Science and Arts Occupations
The most common Management, Business, Science and Arts occupations in Area Code 808 are Community & Social Service (80,294 | 11.9%), Management (69,072 | 10.2%), Education Instruction & Library (45,998 | 6.8%), Health Diagnosing & Treating (38,721 | 5.7%), and Computers, Engineering & Science (34,962 | 5.2%).
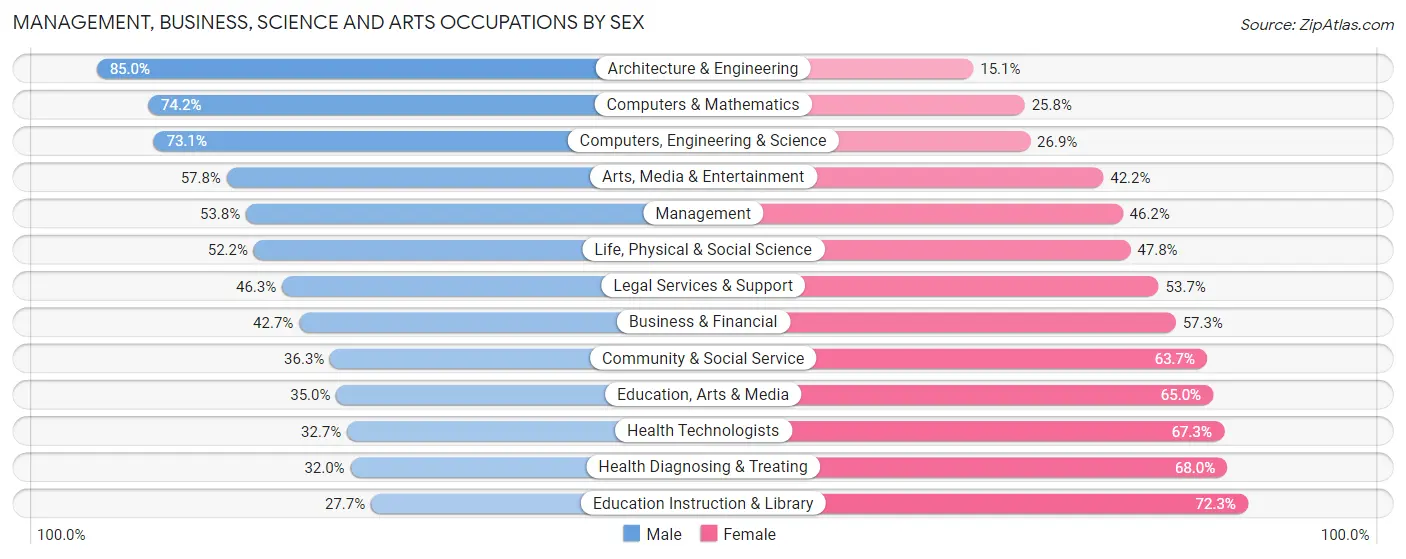
Management, Business, Science and Arts Occupations by Sex
Within the Management, Business, Science and Arts occupations in Area Code 808, the most male-oriented occupations are Architecture & Engineering (85.0%), Computers & Mathematics (74.2%), and Computers, Engineering & Science (73.1%), while the most female-oriented occupations are Education Instruction & Library (72.3%), Health Diagnosing & Treating (68.0%), and Health Technologists (67.3%).
| Occupation | Male | Female |
| Management | 37,171 (53.8%) | 31,901 (46.2%) |
| Business & Financial | 13,328 (42.7%) | 17,860 (57.3%) |
| Computers, Engineering & Science | 25,555 (73.1%) | 9,407 (26.9%) |
| Computers & Mathematics | 11,588 (74.2%) | 4,025 (25.8%) |
| Architecture & Engineering | 10,034 (85.0%) | 1,778 (15.0%) |
| Life, Physical & Social Science | 3,933 (52.2%) | 3,604 (47.8%) |
| Community & Social Service | 29,118 (36.3%) | 51,176 (63.7%) |
| Education, Arts & Media | 4,079 (35.0%) | 7,581 (65.0%) |
| Legal Services & Support | 3,248 (46.3%) | 3,768 (53.7%) |
| Education Instruction & Library | 12,757 (27.7%) | 33,241 (72.3%) |
| Arts, Media & Entertainment | 9,034 (57.8%) | 6,586 (42.2%) |
| Health Diagnosing & Treating | 12,402 (32.0%) | 26,319 (68.0%) |
| Health Technologists | 8,893 (32.7%) | 18,286 (67.3%) |
| Total (Category) | 117,574 (46.3%) | 136,663 (53.7%) |
| Total (Overall) | 345,520 (51.2%) | 329,551 (48.8%) |
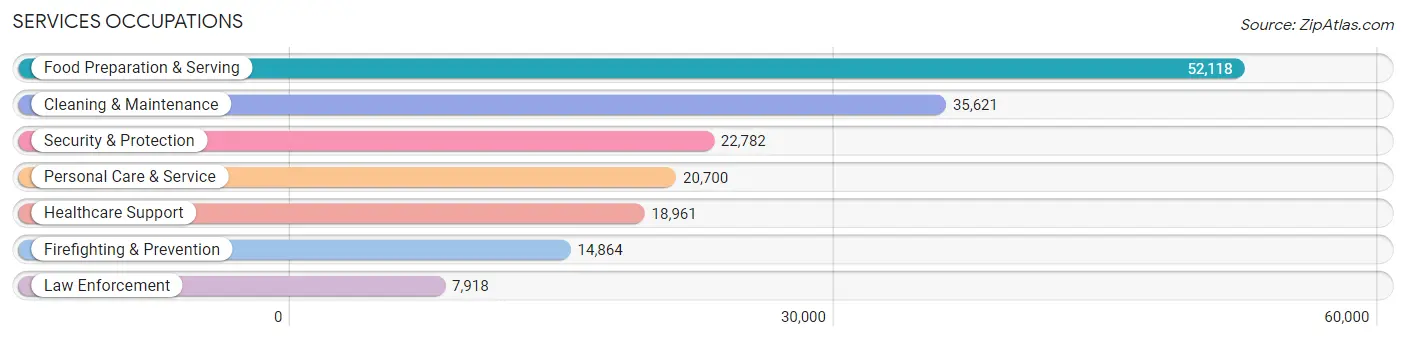
Services Occupations
The most common Services occupations in Area Code 808 are Food Preparation & Serving (52,118 | 7.7%), Cleaning & Maintenance (35,621 | 5.3%), Security & Protection (22,782 | 3.4%), Personal Care & Service (20,700 | 3.1%), and Healthcare Support (18,961 | 2.8%).
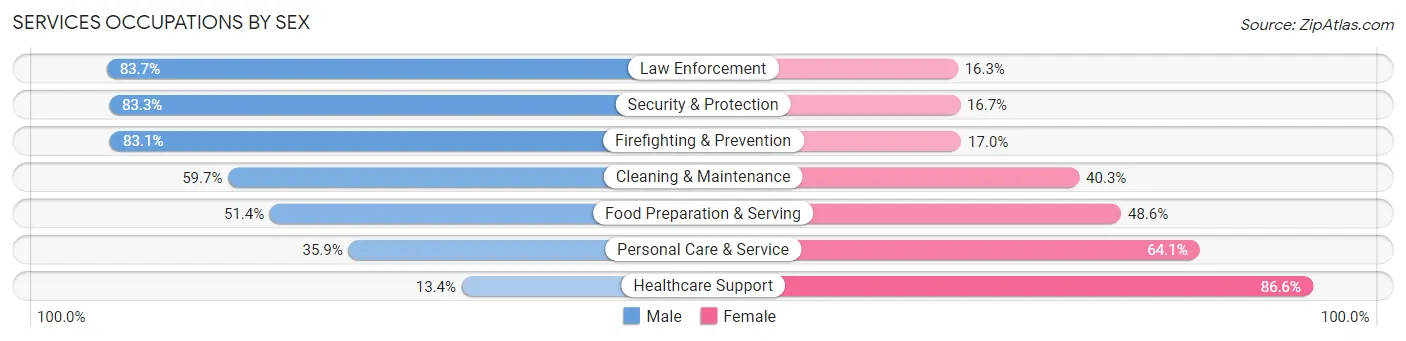
Services Occupations by Sex
Within the Services occupations in Area Code 808, the most male-oriented occupations are Law Enforcement (83.7%), Security & Protection (83.3%), and Firefighting & Prevention (83.1%), while the most female-oriented occupations are Healthcare Support (86.6%), Personal Care & Service (64.1%), and Food Preparation & Serving (48.6%).
| Occupation | Male | Female |
| Healthcare Support | 2,543 (13.4%) | 16,418 (86.6%) |
| Security & Protection | 18,975 (83.3%) | 3,807 (16.7%) |
| Firefighting & Prevention | 12,345 (83.1%) | 2,519 (17.0%) |
| Law Enforcement | 6,630 (83.7%) | 1,288 (16.3%) |
| Food Preparation & Serving | 26,782 (51.4%) | 25,336 (48.6%) |
| Cleaning & Maintenance | 21,257 (59.7%) | 14,364 (40.3%) |
| Personal Care & Service | 7,423 (35.9%) | 13,277 (64.1%) |
| Total (Category) | 76,980 (51.3%) | 73,202 (48.7%) |
| Total (Overall) | 345,520 (51.2%) | 329,551 (48.8%) |
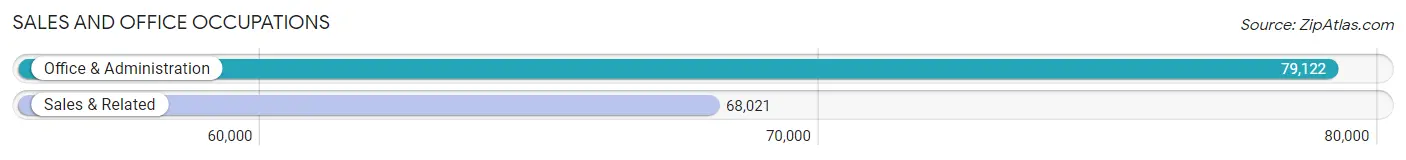
Sales and Office Occupations
The most common Sales and Office occupations in Area Code 808 are Office & Administration (79,122 | 11.7%), and Sales & Related (68,021 | 10.1%).
Sales and Office Occupations by Sex
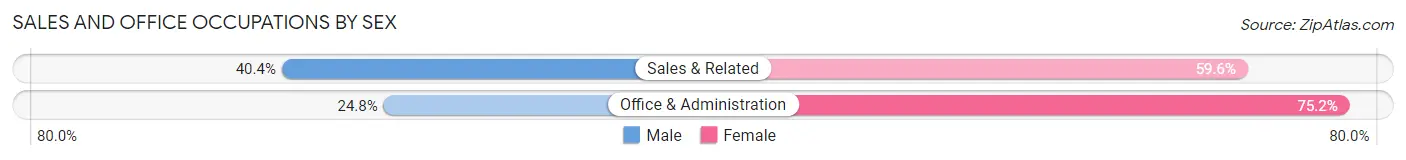
| Occupation | Male | Female |
| Sales & Related | 27,509 (40.4%) | 40,512 (59.6%) |
| Office & Administration | 19,606 (24.8%) | 59,516 (75.2%) |
| Total (Category) | 47,115 (32.0%) | 100,028 (68.0%) |
| Total (Overall) | 345,520 (51.2%) | 329,551 (48.8%) |
Natural Resources, Construction and Maintenance Occupations
The most common Natural Resources, Construction and Maintenance occupations in Area Code 808 are Construction & Extraction (35,825 | 5.3%), Installation, Maintenance & Repair (21,063 | 3.1%), and Farming, Fishing & Forestry (4,567 | 0.7%).
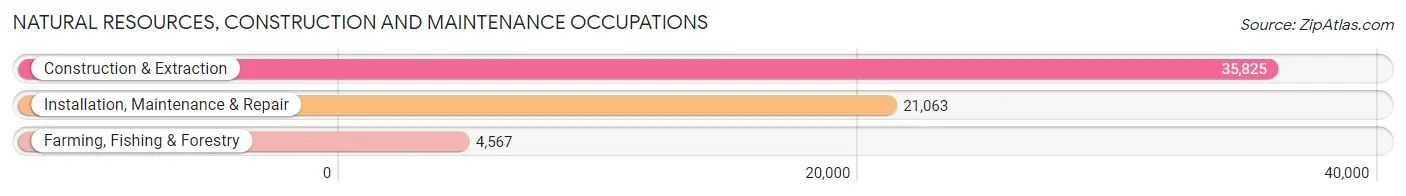
Natural Resources, Construction and Maintenance Occupations by Sex
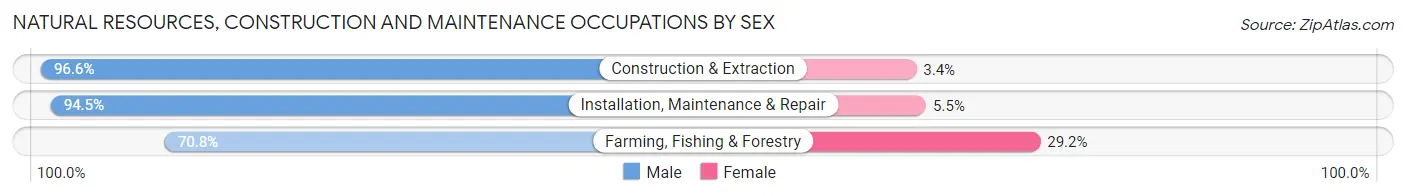
| Occupation | Male | Female |
| Farming, Fishing & Forestry | 3,233 (70.8%) | 1,334 (29.2%) |
| Construction & Extraction | 34,600 (96.6%) | 1,225 (3.4%) |
| Installation, Maintenance & Repair | 19,914 (94.5%) | 1,149 (5.5%) |
| Total (Category) | 57,747 (94.0%) | 3,708 (6.0%) |
| Total (Overall) | 345,520 (51.2%) | 329,551 (48.8%) |
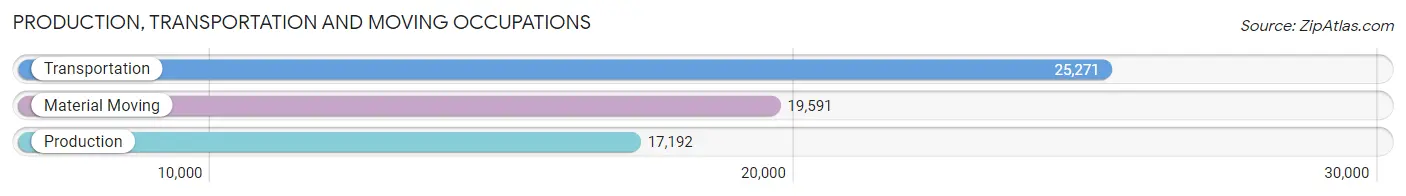
Production, Transportation and Moving Occupations
The most common Production, Transportation and Moving occupations in Area Code 808 are Transportation (25,271 | 3.7%), Material Moving (19,591 | 2.9%), and Production (17,192 | 2.5%).
Production, Transportation and Moving Occupations by Sex
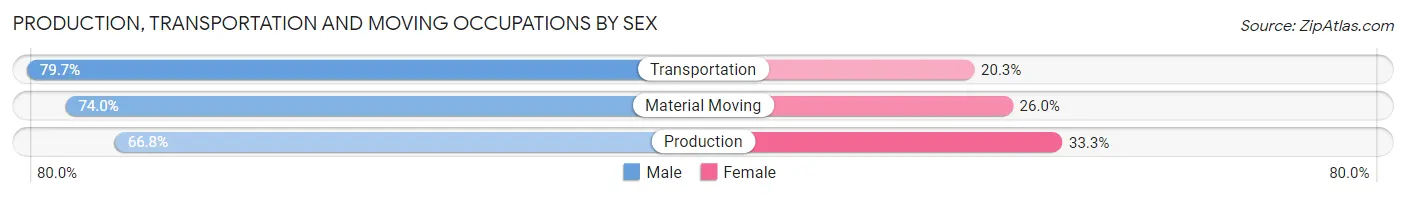
| Occupation | Male | Female |
| Production | 11,475 (66.7%) | 5,717 (33.3%) |
| Transportation | 20,132 (79.7%) | 5,139 (20.3%) |
| Material Moving | 14,497 (74.0%) | 5,094 (26.0%) |
| Total (Category) | 46,104 (74.3%) | 15,950 (25.7%) |
| Total (Overall) | 345,520 (51.2%) | 329,551 (48.8%) |
Employment Industries by Sex in Area Code 808
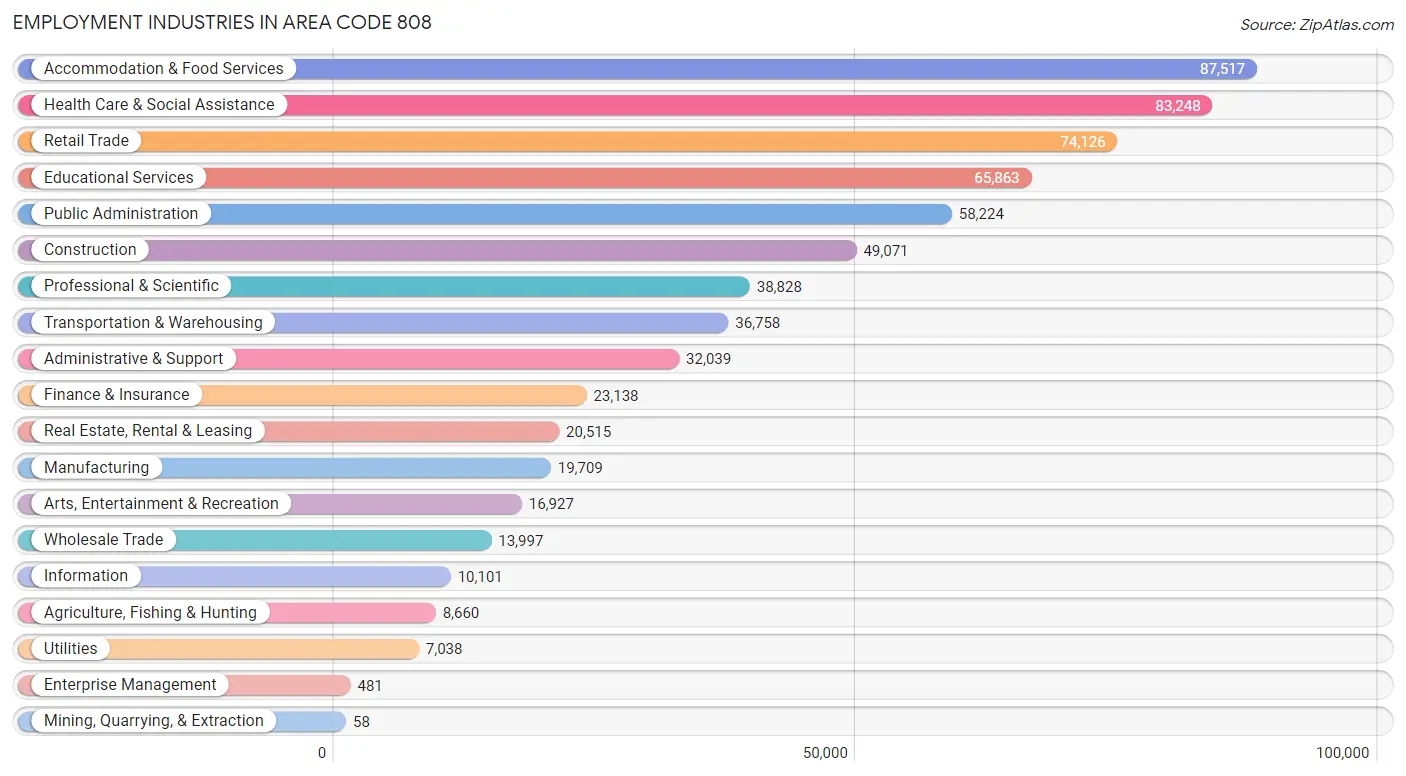
Employment Industries in Area Code 808
The major employment industries in Area Code 808 include Accommodation & Food Services (87,517 | 13.0%), Health Care & Social Assistance (83,248 | 12.3%), Retail Trade (74,126 | 11.0%), Educational Services (65,863 | 9.8%), and Public Administration (58,224 | 8.6%).
Employment Industries by Sex in Area Code 808
The Area Code 808 industries that see more men than women are Mining, Quarrying, & Extraction (96.6%), Construction (86.9%), and Utilities (75.2%), whereas the industries that tend to have a higher number of women are Health Care & Social Assistance (73.9%), Educational Services (65.7%), and Finance & Insurance (61.1%).
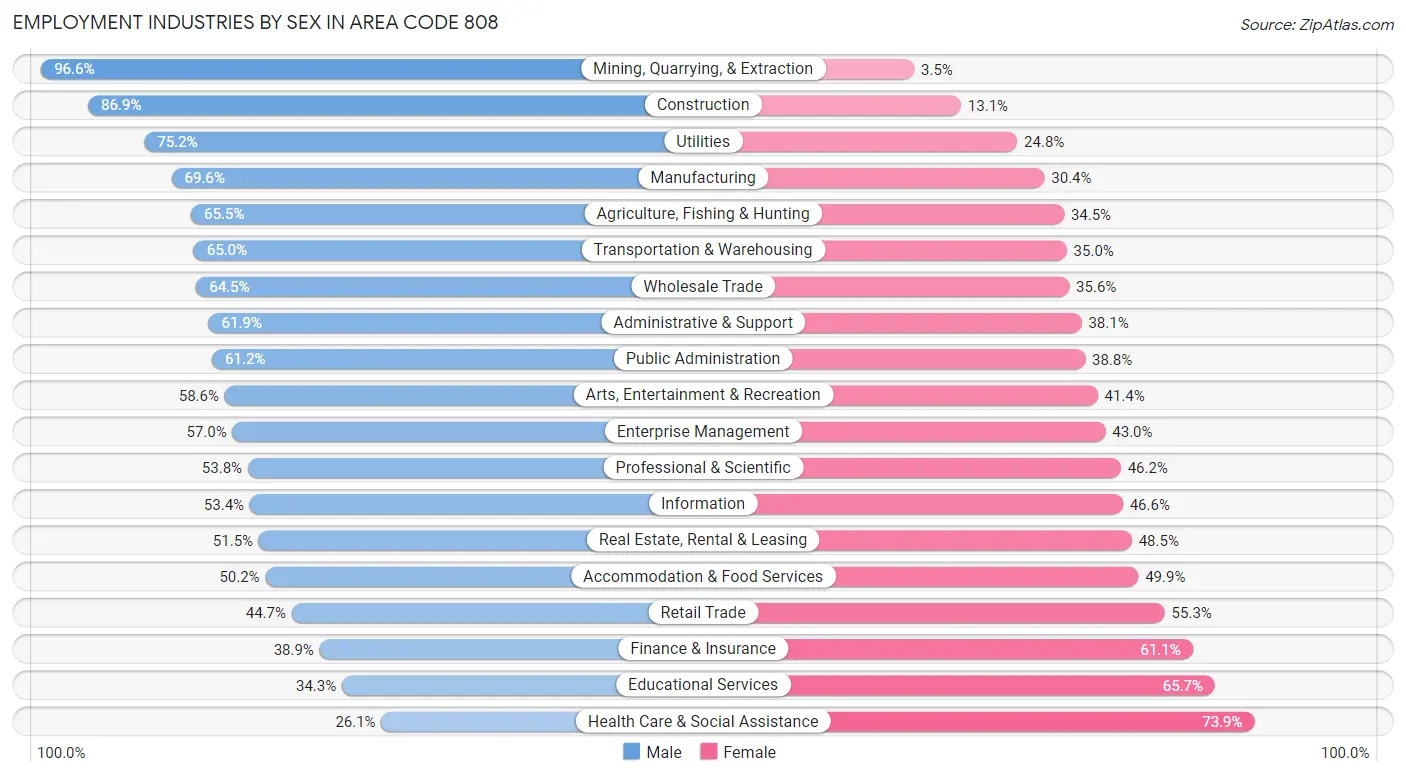
| Industry | Male | Female |
| Agriculture, Fishing & Hunting | 5,675 (65.5%) | 2,985 (34.5%) |
| Mining, Quarrying, & Extraction | 56 (96.6%) | 2 (3.5%) |
| Construction | 42,624 (86.9%) | 6,447 (13.1%) |
| Manufacturing | 13,713 (69.6%) | 5,996 (30.4%) |
| Wholesale Trade | 9,021 (64.4%) | 4,976 (35.5%) |
| Retail Trade | 33,128 (44.7%) | 40,998 (55.3%) |
| Transportation & Warehousing | 23,880 (65.0%) | 12,878 (35.0%) |
| Utilities | 5,294 (75.2%) | 1,744 (24.8%) |
| Information | 5,390 (53.4%) | 4,711 (46.6%) |
| Finance & Insurance | 9,005 (38.9%) | 14,133 (61.1%) |
| Real Estate, Rental & Leasing | 10,565 (51.5%) | 9,950 (48.5%) |
| Professional & Scientific | 20,883 (53.8%) | 17,945 (46.2%) |
| Enterprise Management | 274 (57.0%) | 207 (43.0%) |
| Administrative & Support | 19,833 (61.9%) | 12,206 (38.1%) |
| Educational Services | 22,591 (34.3%) | 43,272 (65.7%) |
| Health Care & Social Assistance | 21,759 (26.1%) | 61,489 (73.9%) |
| Arts, Entertainment & Recreation | 9,912 (58.6%) | 7,015 (41.4%) |
| Accommodation & Food Services | 43,892 (50.1%) | 43,625 (49.8%) |
| Public Administration | 35,614 (61.2%) | 22,610 (38.8%) |
| Total | 345,520 (51.2%) | 329,551 (48.8%) |
Education in Area Code 808
School Enrollment in Area Code 808
The most common levels of schooling among the 324,048 students in Area Code 808 are college / undergraduate (70,422 | 21.7%), middle school (66,507 | 20.5%), and elementary school (65,867 | 20.3%).
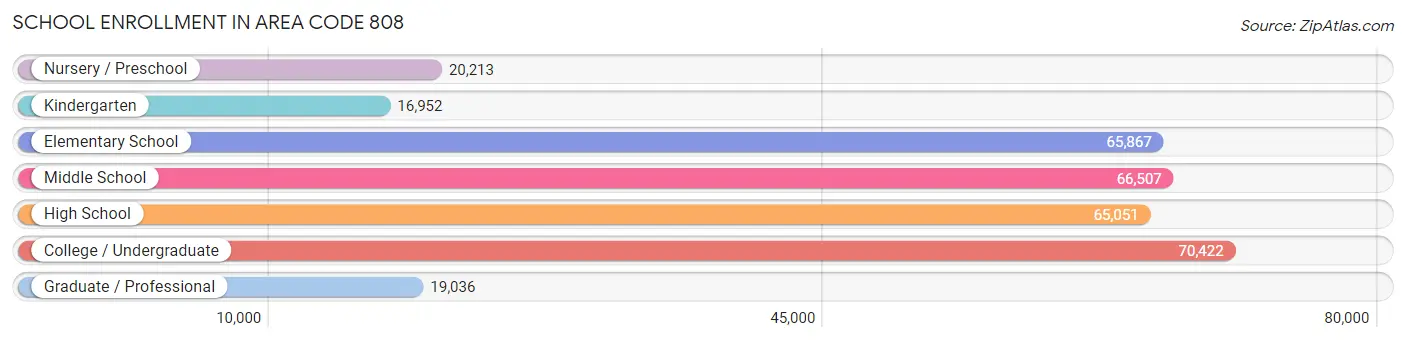
| School Level | # Students | % Students |
| Nursery / Preschool | 20,213 | 6.2% |
| Kindergarten | 16,952 | 5.2% |
| Elementary School | 65,867 | 20.3% |
| Middle School | 66,507 | 20.5% |
| High School | 65,051 | 20.1% |
| College / Undergraduate | 70,422 | 21.7% |
| Graduate / Professional | 19,036 | 5.9% |
| Total | 324,048 | 100.0% |
School Enrollment by Age by Funding Source in Area Code 808
Out of a total of 324,048 students who are enrolled in schools in Area Code 808, 77,019 (23.8%) attend a private institution, while the remaining 247,029 (76.2%) are enrolled in public schools. The age group of 3 to 4 year olds has the highest likelihood of being enrolled in private schools, with 10,012 (62.5% in the age bracket) enrolled. Conversely, the age group of 10 to 14 year olds has the lowest likelihood of being enrolled in a private school, with 67,794 (80.3% in the age bracket) attending a public institution.
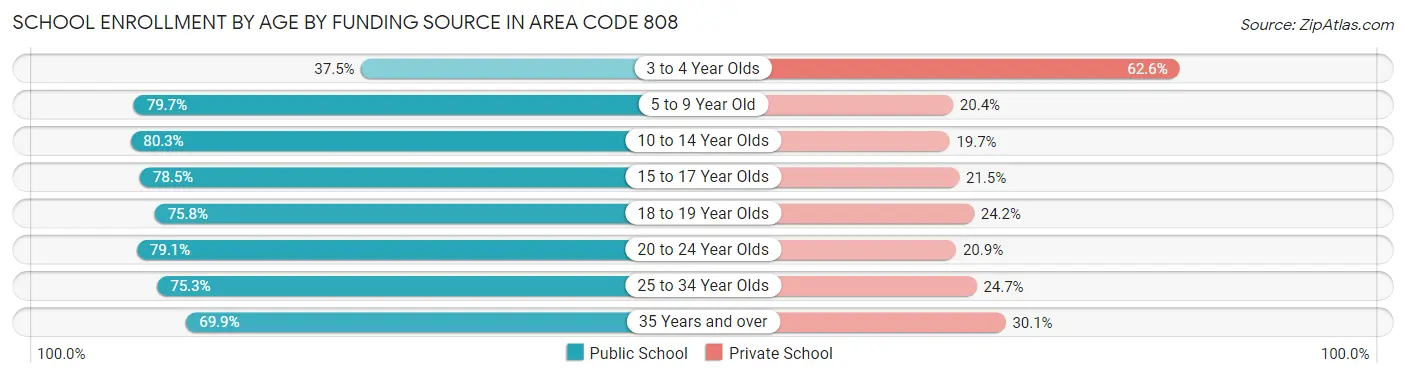
| Age Bracket | Public School | Private School |
| 3 to 4 Year Olds | 5,994 (37.4%) | 10,012 (62.5%) |
| 5 to 9 Year Old | 63,503 (79.6%) | 16,229 (20.3%) |
| 10 to 14 Year Olds | 67,794 (80.3%) | 16,628 (19.7%) |
| 15 to 17 Year Olds | 36,005 (78.5%) | 9,856 (21.5%) |
| 18 to 19 Year Olds | 14,534 (75.8%) | 4,651 (24.2%) |
| 20 to 24 Year Olds | 23,654 (79.1%) | 6,256 (20.9%) |
| 25 to 34 Year Olds | 18,723 (75.3%) | 6,151 (24.7%) |
| 35 Years and over | 16,809 (69.9%) | 7,249 (30.1%) |
| Total | 247,029 (76.2%) | 77,019 (23.8%) |
Educational Attainment by Field of Study in Area Code 808
Business (70,142 | 18.5%), social sciences (40,699 | 10.7%), education (39,971 | 10.5%), science & technology (37,564 | 9.9%), and bio, nature & agricultural (27,264 | 7.2%) are the most common fields of study among 379,881 individuals in Area Code 808 who have obtained a bachelor's degree or higher.
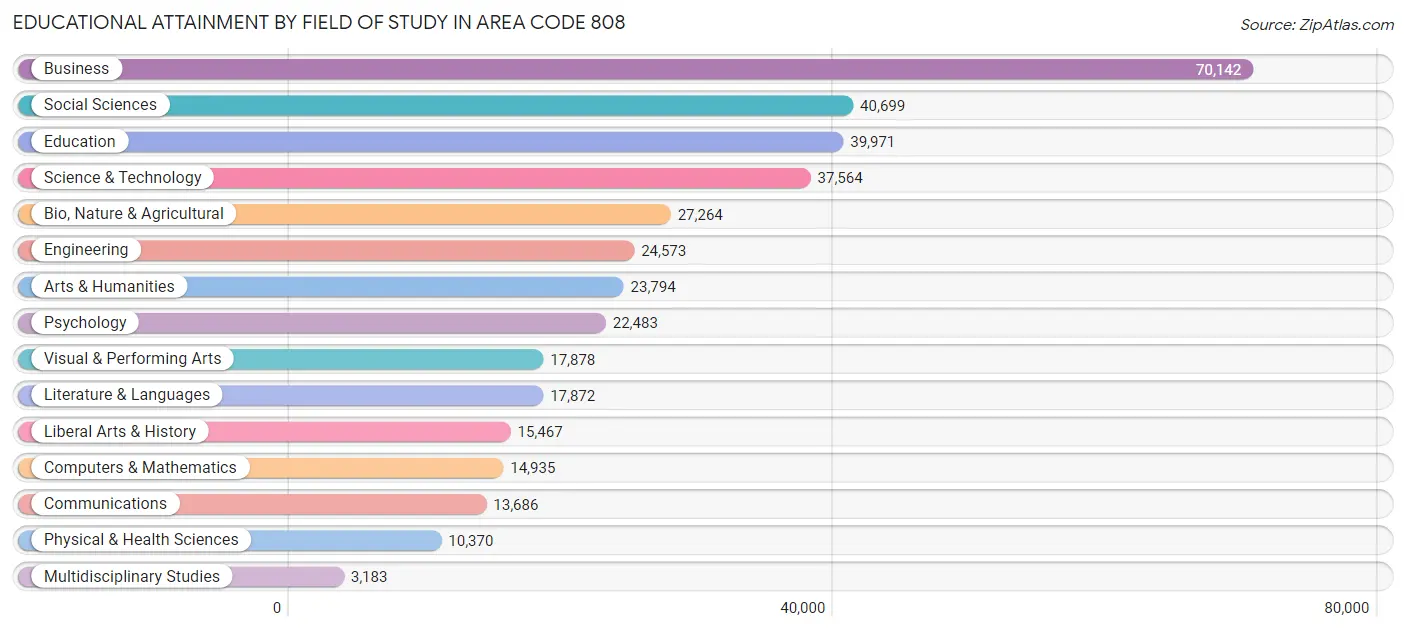
| Field of Study | # Graduates | % Graduates |
| Computers & Mathematics | 14,935 | 3.9% |
| Bio, Nature & Agricultural | 27,264 | 7.2% |
| Physical & Health Sciences | 10,370 | 2.7% |
| Psychology | 22,483 | 5.9% |
| Social Sciences | 40,699 | 10.7% |
| Engineering | 24,573 | 6.5% |
| Multidisciplinary Studies | 3,183 | 0.8% |
| Science & Technology | 37,564 | 9.9% |
| Business | 70,142 | 18.5% |
| Education | 39,971 | 10.5% |
| Literature & Languages | 17,872 | 4.7% |
| Liberal Arts & History | 15,467 | 4.1% |
| Visual & Performing Arts | 17,878 | 4.7% |
| Communications | 13,686 | 3.6% |
| Arts & Humanities | 23,794 | 6.3% |
| Total | 379,881 | 100.0% |
Transportation & Commute in Area Code 808
Vehicle Availability by Sex in Area Code 808
The most prevalent vehicle ownership categories in Area Code 808 are males with 2 vehicles (128,828, accounting for 35.4%) and females with 2 vehicles (110,256, making up 40.1%).
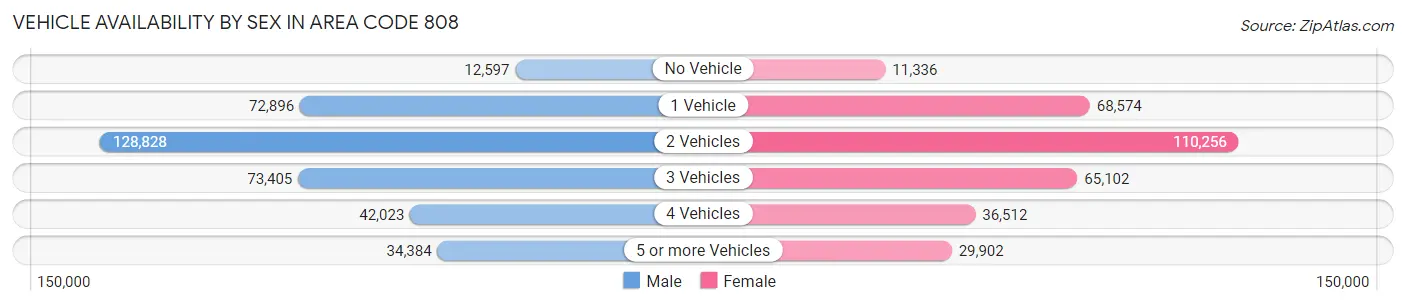
| Vehicles Available | Male | Female |
| No Vehicle | 12,597 (3.5%) | 11,336 (3.5%) |
| 1 Vehicle | 72,896 (20.0%) | 68,574 (21.3%) |
| 2 Vehicles | 128,828 (35.4%) | 110,256 (34.3%) |
| 3 Vehicles | 73,405 (20.2%) | 65,102 (20.2%) |
| 4 Vehicles | 42,023 (11.5%) | 36,512 (11.4%) |
| 5 or more Vehicles | 34,384 (9.4%) | 29,902 (9.3%) |
| Total | 364,133 (100.0%) | 321,682 (100.0%) |
Commute Time in Area Code 808
The most frequently occuring commute durations in Area Code 808 are 30 to 34 minutes (112,555 commuters, 17.4%), 15 to 19 minutes (97,261 commuters, 15.0%), and 20 to 24 minutes (89,967 commuters, 13.9%).
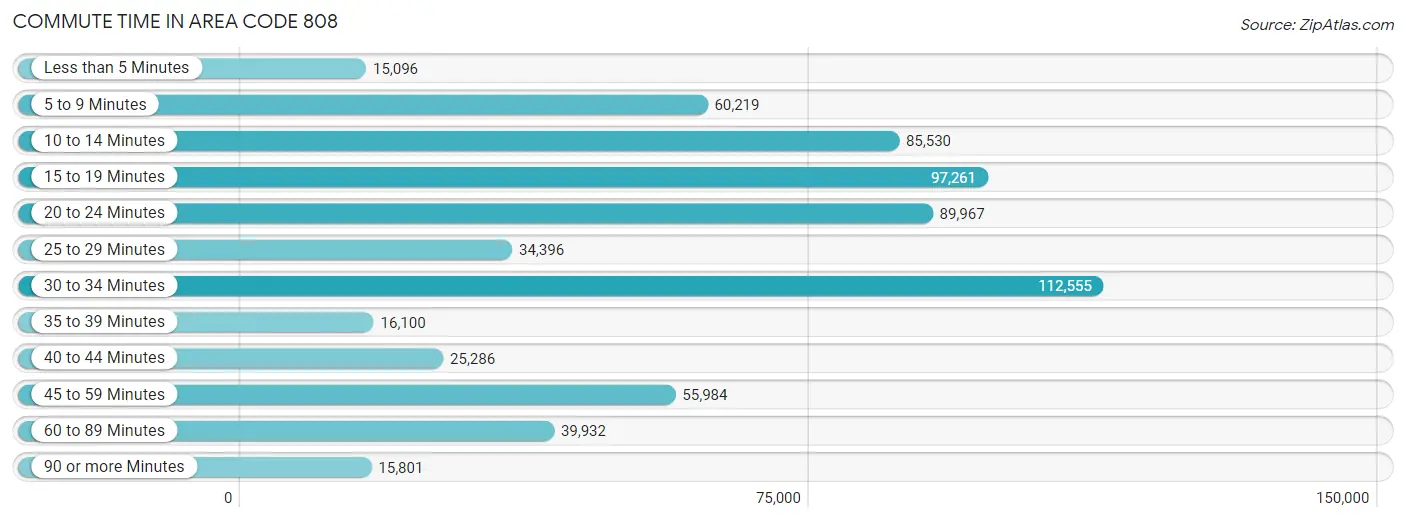
| Commute Time | # Commuters | % Commuters |
| Less than 5 Minutes | 15,096 | 2.3% |
| 5 to 9 Minutes | 60,219 | 9.3% |
| 10 to 14 Minutes | 85,530 | 13.2% |
| 15 to 19 Minutes | 97,261 | 15.0% |
| 20 to 24 Minutes | 89,967 | 13.9% |
| 25 to 29 Minutes | 34,396 | 5.3% |
| 30 to 34 Minutes | 112,555 | 17.4% |
| 35 to 39 Minutes | 16,100 | 2.5% |
| 40 to 44 Minutes | 25,286 | 3.9% |
| 45 to 59 Minutes | 55,984 | 8.6% |
| 60 to 89 Minutes | 39,932 | 6.2% |
| 90 or more Minutes | 15,801 | 2.4% |
Commute Time by Sex in Area Code 808
The most common commute times in Area Code 808 are 30 to 34 minutes (63,975 commuters, 18.1%) for males and 30 to 34 minutes (48,580 commuters, 16.5%) for females.
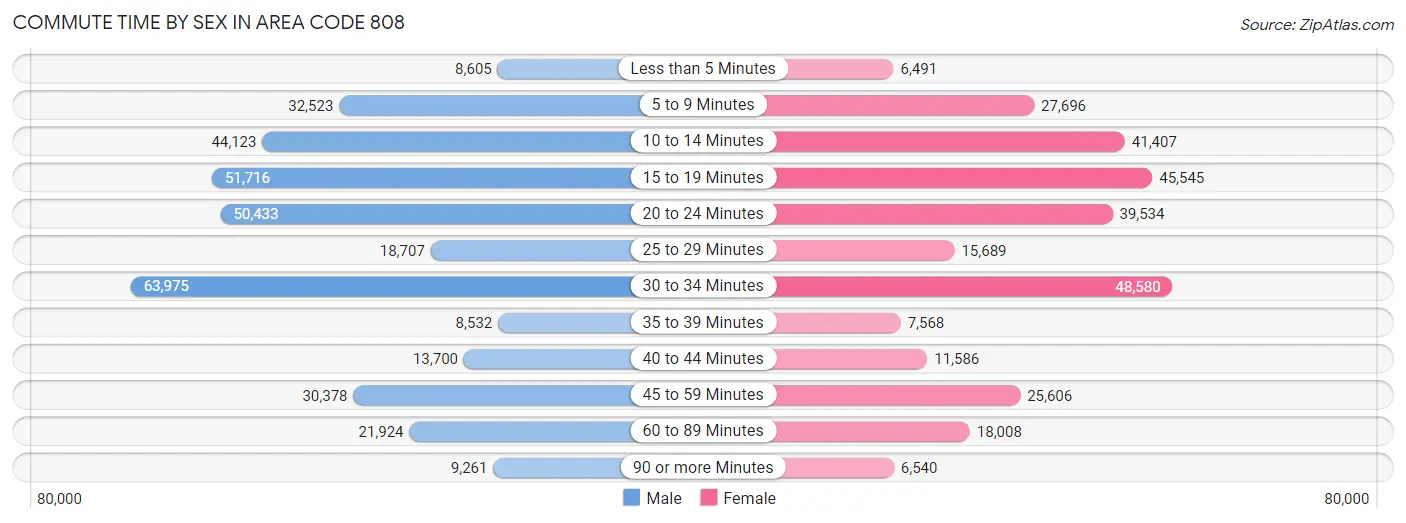
| Commute Time | Male | Female |
| Less than 5 Minutes | 8,605 (2.4%) | 6,491 (2.2%) |
| 5 to 9 Minutes | 32,523 (9.2%) | 27,696 (9.4%) |
| 10 to 14 Minutes | 44,123 (12.5%) | 41,407 (14.1%) |
| 15 to 19 Minutes | 51,716 (14.6%) | 45,545 (15.5%) |
| 20 to 24 Minutes | 50,433 (14.2%) | 39,534 (13.4%) |
| 25 to 29 Minutes | 18,707 (5.3%) | 15,689 (5.3%) |
| 30 to 34 Minutes | 63,975 (18.1%) | 48,580 (16.5%) |
| 35 to 39 Minutes | 8,532 (2.4%) | 7,568 (2.6%) |
| 40 to 44 Minutes | 13,700 (3.9%) | 11,586 (3.9%) |
| 45 to 59 Minutes | 30,378 (8.6%) | 25,606 (8.7%) |
| 60 to 89 Minutes | 21,924 (6.2%) | 18,008 (6.1%) |
| 90 or more Minutes | 9,261 (2.6%) | 6,540 (2.2%) |
Time of Departure to Work by Sex in Area Code 808
The most frequent times of departure to work in Area Code 808 are 7:00 AM to 7:29 AM (46,195, 13.1%) for males and 7:00 AM to 7:29 AM (47,077, 16.0%) for females.
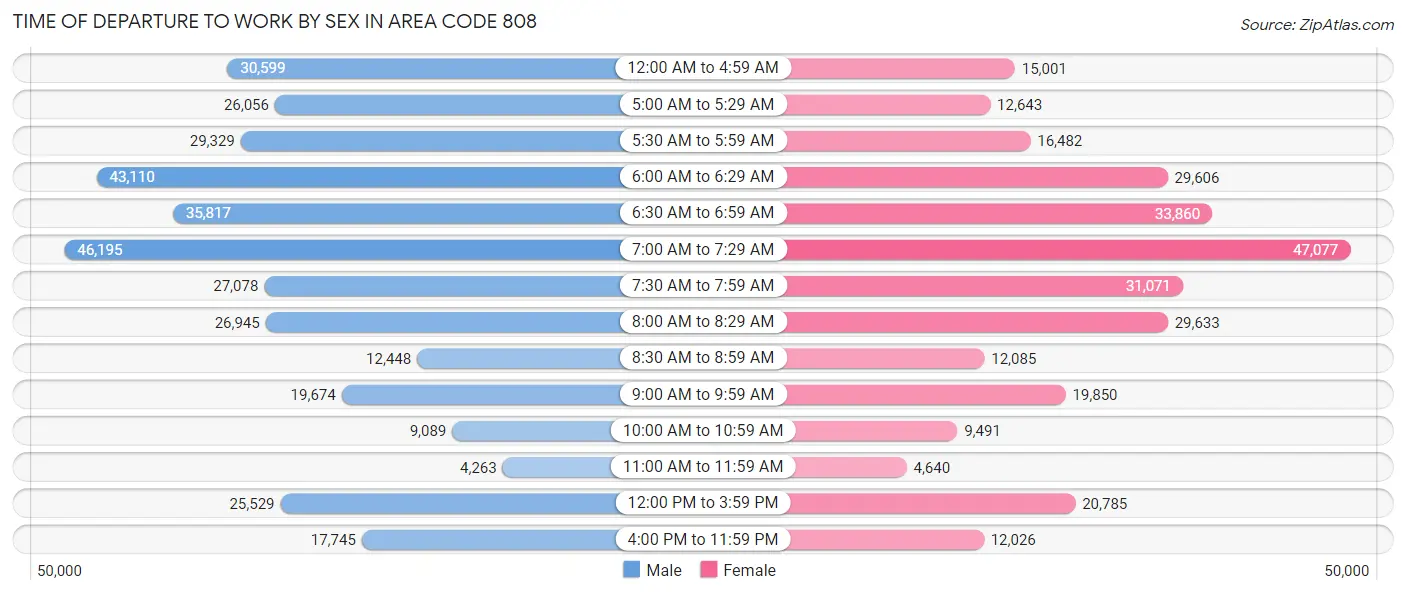
| Time of Departure | Male | Female |
| 12:00 AM to 4:59 AM | 30,599 (8.6%) | 15,001 (5.1%) |
| 5:00 AM to 5:29 AM | 26,056 (7.4%) | 12,643 (4.3%) |
| 5:30 AM to 5:59 AM | 29,329 (8.3%) | 16,482 (5.6%) |
| 6:00 AM to 6:29 AM | 43,110 (12.2%) | 29,606 (10.1%) |
| 6:30 AM to 6:59 AM | 35,817 (10.1%) | 33,860 (11.5%) |
| 7:00 AM to 7:29 AM | 46,195 (13.1%) | 47,077 (16.0%) |
| 7:30 AM to 7:59 AM | 27,078 (7.6%) | 31,071 (10.6%) |
| 8:00 AM to 8:29 AM | 26,945 (7.6%) | 29,633 (10.1%) |
| 8:30 AM to 8:59 AM | 12,448 (3.5%) | 12,085 (4.1%) |
| 9:00 AM to 9:59 AM | 19,674 (5.6%) | 19,850 (6.8%) |
| 10:00 AM to 10:59 AM | 9,089 (2.6%) | 9,491 (3.2%) |
| 11:00 AM to 11:59 AM | 4,263 (1.2%) | 4,640 (1.6%) |
| 12:00 PM to 3:59 PM | 25,529 (7.2%) | 20,785 (7.1%) |
| 4:00 PM to 11:59 PM | 17,745 (5.0%) | 12,026 (4.1%) |
| Total | 353,877 (100.0%) | 294,250 (100.0%) |
Housing Occupancy in Area Code 808
Occupancy by Ownership in Area Code 808
Of the total 483,906 dwellings in Area Code 808, owner-occupied units account for 298,816 (61.8%), while renter-occupied units make up 185,090 (38.3%).
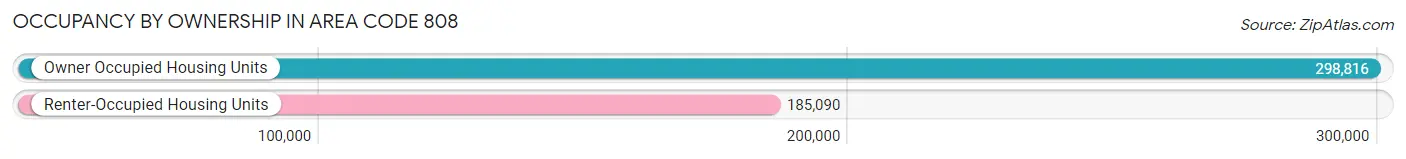
| Occupancy | # Housing Units | % Housing Units |
| Owner Occupied Housing Units | 298,816 | 61.8% |
| Renter-Occupied Housing Units | 185,090 | 38.3% |
| Total Occupied Housing Units | 483,906 | 100.0% |
Occupancy by Household Size in Area Code 808
| Household Size | # Housing Units | % Housing Units |
| 1-Person Household | 118,744 | 24.5% |
| 2-Person Household | 155,750 | 32.2% |
| 3-Person Household | 77,982 | 16.1% |
| 4+ Person Household | 131,430 | 27.2% |
| Total Housing Units | 483,906 | 100.0% |
Occupancy by Ownership by Household Size in Area Code 808
| Household Size | Owner-occupied | Renter-occupied |
| 1-Person Household | 63,268 (53.3%) | 55,476 (46.7%) |
| 2-Person Household | 102,600 (65.9%) | 53,150 (34.1%) |
| 3-Person Household | 48,875 (62.7%) | 29,107 (37.3%) |
| 4+ Person Household | 84,073 (64.0%) | 47,357 (36.0%) |
| Total Housing Units | 298,816 (61.8%) | 185,090 (38.3%) |
Occupancy by Educational Attainment in Area Code 808
| Household Size | Owner-occupied | Renter-occupied |
| Less than High School | 13,641 (51.2%) | 12,977 (48.7%) |
| High School Diploma | 58,093 (54.6%) | 48,316 (45.4%) |
| College/Associate Degree | 94,652 (58.6%) | 66,801 (41.4%) |
| Bachelor's Degree or higher | 132,430 (69.9%) | 56,996 (30.1%) |
Occupancy by Age of Householder in Area Code 808
| Age Bracket | # Households | % Households |
| Under 35 Years | 75,270 | 15.5% |
| 35 to 44 Years | 80,204 | 16.6% |
| 45 to 54 Years | 80,404 | 16.6% |
| 55 to 64 Years | 92,452 | 19.1% |
| 65 to 74 Years | 89,741 | 18.5% |
| 75 to 84 Years | 44,490 | 9.2% |
| 85 Years and Over | 21,345 | 4.4% |
| Total | 483,906 | 100.0% |
Housing Finances in Area Code 808
Median Income by Occupancy in Area Code 808
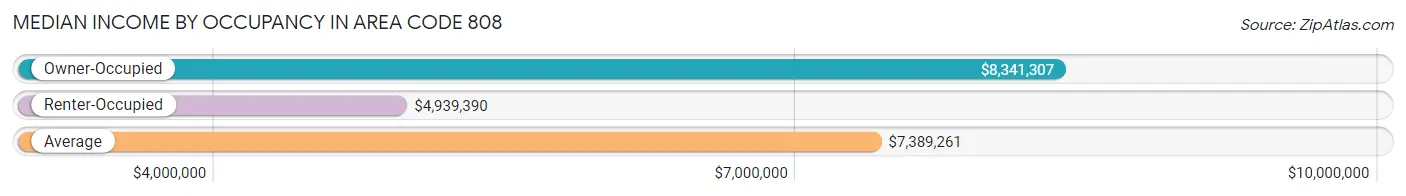
| Occupancy Type | # Households | Median Income |
| Owner-Occupied | 298,816 (61.8%) | $8,341,307 |
| Renter-Occupied | 185,090 (38.3%) | $4,939,390 |
| Average | 483,906 (100.0%) | $7,389,261 |
Occupancy by Householder Income Bracket in Area Code 808
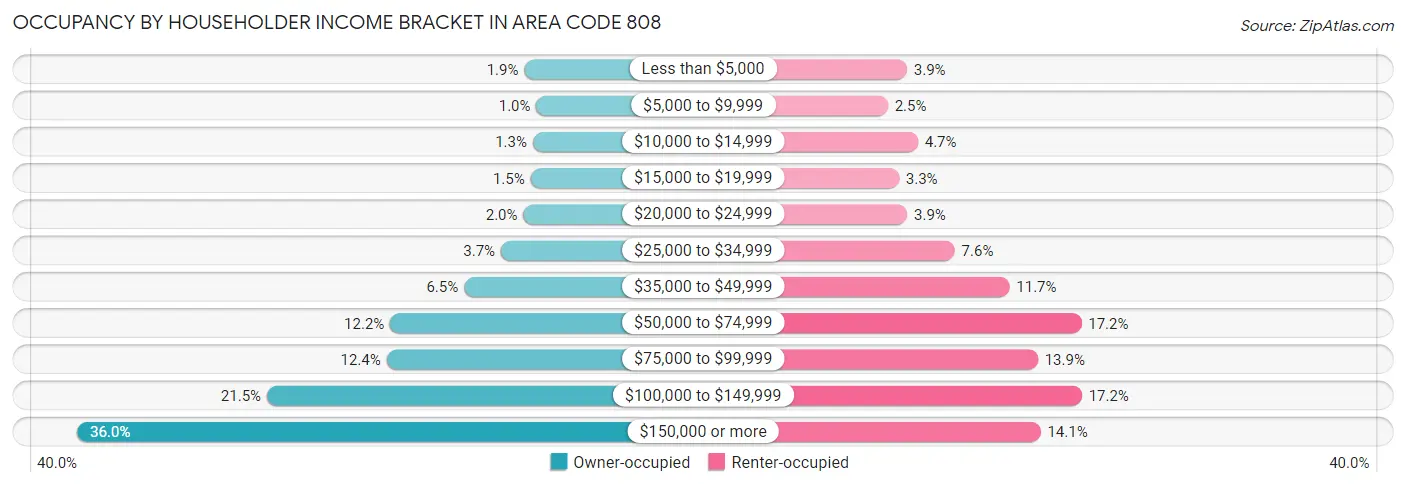
| Income Bracket | Owner-occupied | Renter-occupied |
| Less than $5,000 | 5,765 (1.9%) | 7,238 (3.9%) |
| $5,000 to $9,999 | 3,016 (1.0%) | 4,527 (2.5%) |
| $10,000 to $14,999 | 3,830 (1.3%) | 8,773 (4.7%) |
| $15,000 to $19,999 | 4,324 (1.5%) | 6,100 (3.3%) |
| $20,000 to $24,999 | 5,985 (2.0%) | 7,274 (3.9%) |
| $25,000 to $34,999 | 11,093 (3.7%) | 13,981 (7.5%) |
| $35,000 to $49,999 | 19,481 (6.5%) | 21,699 (11.7%) |
| $50,000 to $74,999 | 36,298 (12.1%) | 31,844 (17.2%) |
| $75,000 to $99,999 | 37,099 (12.4%) | 25,694 (13.9%) |
| $100,000 to $149,999 | 64,360 (21.5%) | 31,887 (17.2%) |
| $150,000 or more | 107,565 (36.0%) | 26,073 (14.1%) |
| Total | 298,816 (100.0%) | 185,090 (100.0%) |
Monthly Housing Cost Tiers in Area Code 808
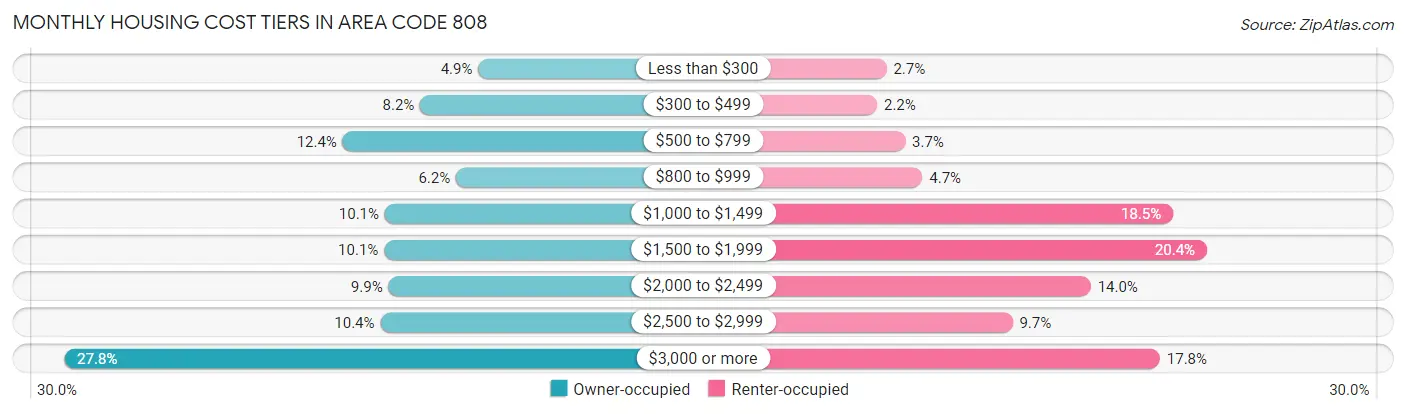
| Monthly Cost | Owner-occupied | Renter-occupied |
| Less than $300 | 14,752 (4.9%) | 5,020 (2.7%) |
| $300 to $499 | 24,339 (8.2%) | 4,054 (2.2%) |
| $500 to $799 | 37,155 (12.4%) | 6,923 (3.7%) |
| $800 to $999 | 18,446 (6.2%) | 8,672 (4.7%) |
| $1,000 to $1,499 | 30,172 (10.1%) | 34,324 (18.5%) |
| $1,500 to $1,999 | 30,296 (10.1%) | 37,783 (20.4%) |
| $2,000 to $2,499 | 29,597 (9.9%) | 25,902 (14.0%) |
| $2,500 to $2,999 | 30,940 (10.3%) | 17,907 (9.7%) |
| $3,000 or more | 83,119 (27.8%) | 32,969 (17.8%) |
| Total | 298,816 (100.0%) | 185,090 (100.0%) |
Physical Housing Characteristics in Area Code 808
Housing Structures in Area Code 808
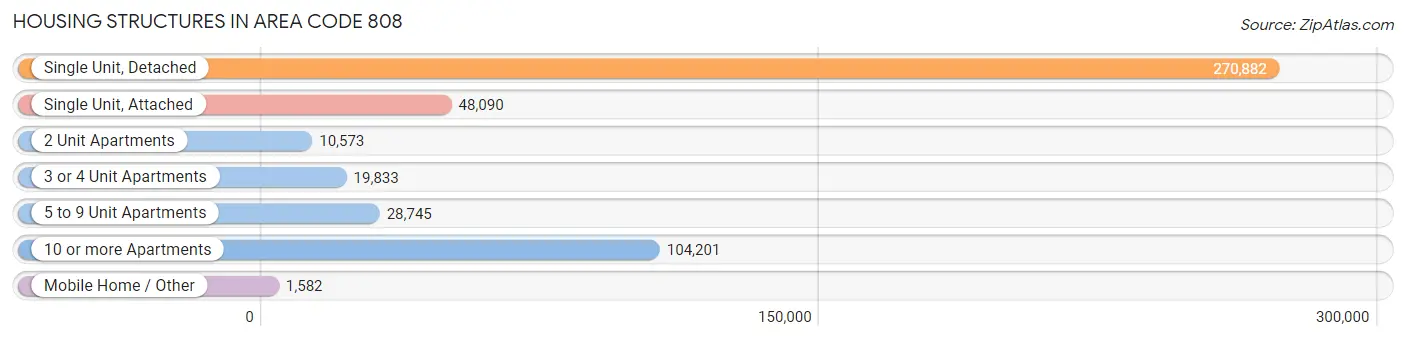
| Structure Type | # Housing Units | % Housing Units |
| Single Unit, Detached | 270,882 | 56.0% |
| Single Unit, Attached | 48,090 | 9.9% |
| 2 Unit Apartments | 10,573 | 2.2% |
| 3 or 4 Unit Apartments | 19,833 | 4.1% |
| 5 to 9 Unit Apartments | 28,745 | 5.9% |
| 10 or more Apartments | 104,201 | 21.5% |
| Mobile Home / Other | 1,582 | 0.3% |
| Total | 483,906 | 100.0% |
Housing Structures by Occupancy in Area Code 808
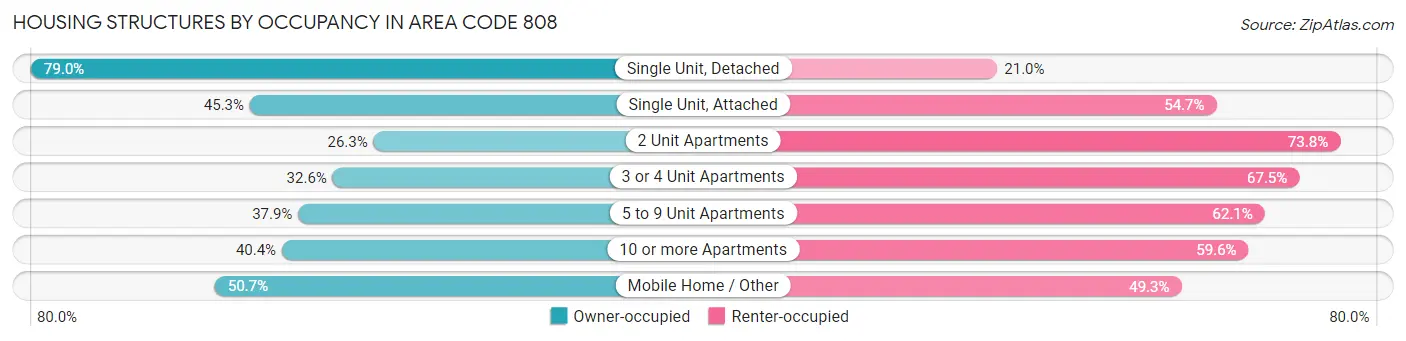
| Structure Type | Owner-occupied | Renter-occupied |
| Single Unit, Detached | 214,062 (79.0%) | 56,820 (21.0%) |
| Single Unit, Attached | 21,785 (45.3%) | 26,305 (54.7%) |
| 2 Unit Apartments | 2,775 (26.3%) | 7,798 (73.8%) |
| 3 or 4 Unit Apartments | 6,456 (32.6%) | 13,377 (67.4%) |
| 5 to 9 Unit Apartments | 10,883 (37.9%) | 17,862 (62.1%) |
| 10 or more Apartments | 42,053 (40.4%) | 62,148 (59.6%) |
| Mobile Home / Other | 802 (50.7%) | 780 (49.3%) |
| Total | 298,816 (61.8%) | 185,090 (38.3%) |
Housing Structures by Number of Rooms in Area Code 808
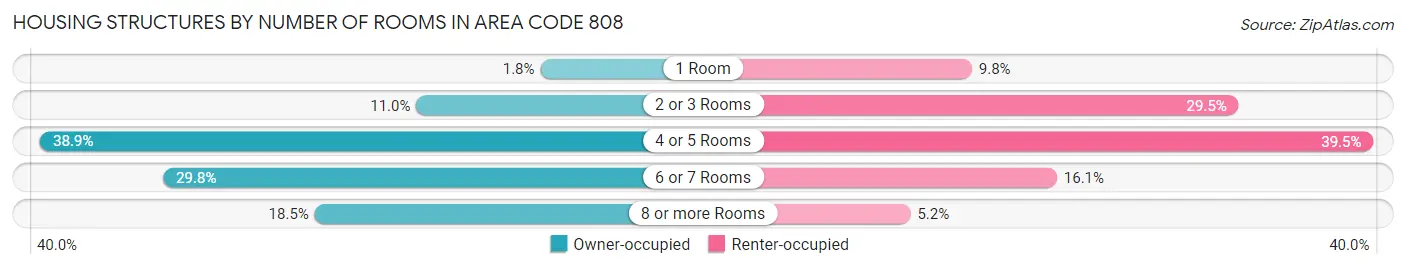
| Number of Rooms | Owner-occupied | Renter-occupied |
| 1 Room | 5,494 (1.8%) | 18,069 (9.8%) |
| 2 or 3 Rooms | 32,929 (11.0%) | 54,595 (29.5%) |
| 4 or 5 Rooms | 116,080 (38.9%) | 73,045 (39.5%) |
| 6 or 7 Rooms | 88,916 (29.8%) | 29,714 (16.1%) |
| 8 or more Rooms | 55,397 (18.5%) | 9,667 (5.2%) |
| Total | 298,816 (100.0%) | 185,090 (100.0%) |
Housing Structure by Heating Type in Area Code 808
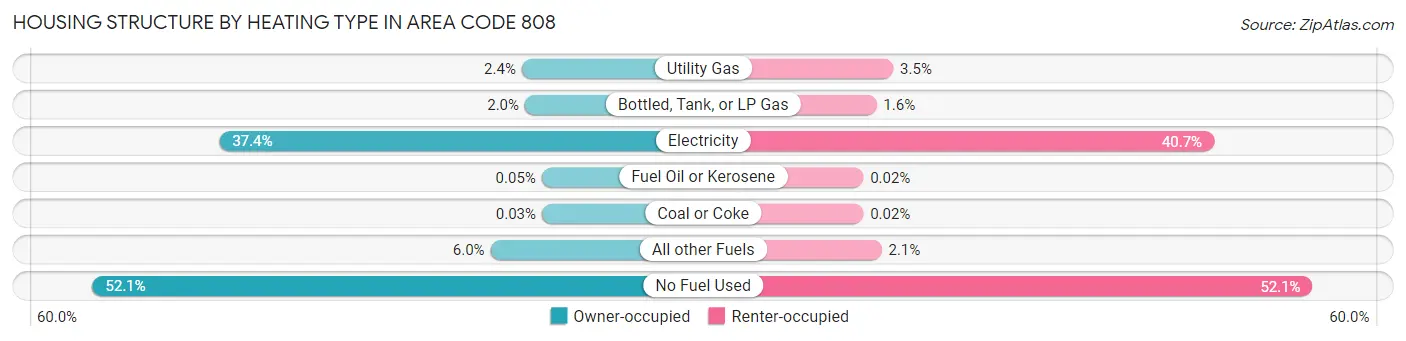
| Heating Type | Owner-occupied | Renter-occupied |
| Utility Gas | 7,062 (2.4%) | 6,460 (3.5%) |
| Bottled, Tank, or LP Gas | 5,981 (2.0%) | 2,869 (1.5%) |
| Electricity | 111,848 (37.4%) | 75,298 (40.7%) |
| Fuel Oil or Kerosene | 138 (0.1%) | 44 (0.0%) |
| Coal or Coke | 83 (0.0%) | 31 (0.0%) |
| All other Fuels | 17,905 (6.0%) | 3,955 (2.1%) |
| No Fuel Used | 155,799 (52.1%) | 96,433 (52.1%) |
| Total | 298,816 (100.0%) | 185,090 (100.0%) |
Household Vehicle Usage in Area Code 808
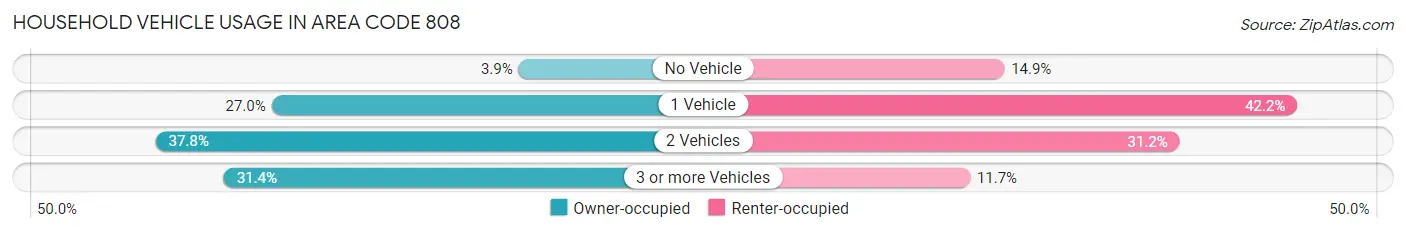
| Vehicles per Household | Owner-occupied | Renter-occupied |
| No Vehicle | 11,628 (3.9%) | 27,514 (14.9%) |
| 1 Vehicle | 80,517 (27.0%) | 78,148 (42.2%) |
| 2 Vehicles | 112,848 (37.8%) | 57,828 (31.2%) |
| 3 or more Vehicles | 93,823 (31.4%) | 21,600 (11.7%) |
| Total | 298,816 (100.0%) | 185,090 (100.0%) |
Real Estate & Mortgages in Area Code 808
Real Estate and Mortgage Overview in Area Code 808
| Characteristic | Without Mortgage | With Mortgage |
| Housing Units | 107,239 | 191,577 |
| Median Property Value | $54,411,600 | $57,274,401 |
| Median Household Income | $5,928,688 | $80,017 |
| Monthly Housing Costs | $44,521 | $82,432 |
| Real Estate Taxes | $129,126 | $10,618 |
Property Value by Mortgage Status in Area Code 808
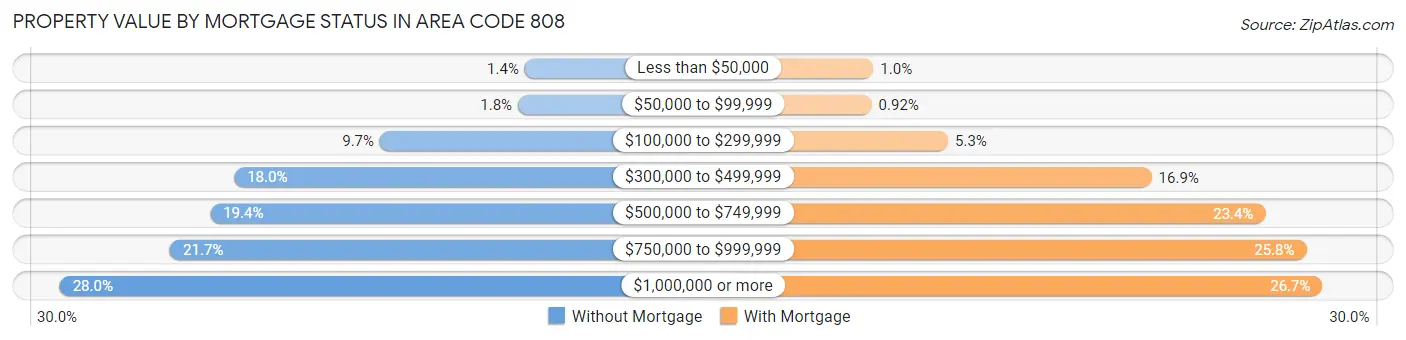
| Property Value | Without Mortgage | With Mortgage |
| Less than $50,000 | 1,520 (1.4%) | 1,948 (1.0%) |
| $50,000 to $99,999 | 1,938 (1.8%) | 1,763 (0.9%) |
| $100,000 to $299,999 | 10,403 (9.7%) | 10,141 (5.3%) |
| $300,000 to $499,999 | 19,320 (18.0%) | 32,413 (16.9%) |
| $500,000 to $749,999 | 20,797 (19.4%) | 44,857 (23.4%) |
| $750,000 to $999,999 | 23,247 (21.7%) | 49,356 (25.8%) |
| $1,000,000 or more | 30,014 (28.0%) | 51,099 (26.7%) |
| Total | 107,239 (100.0%) | 191,577 (100.0%) |
Household Income by Mortgage Status in Area Code 808
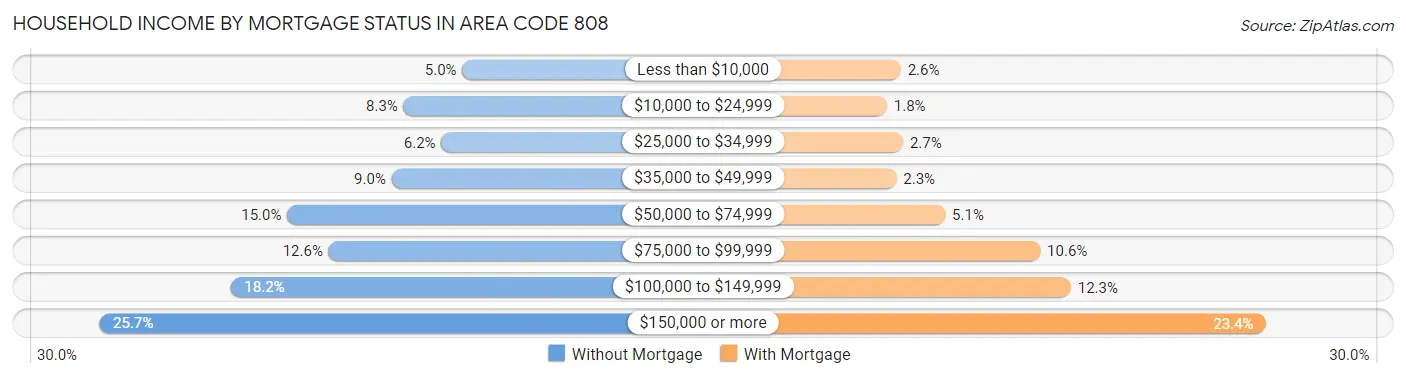
| Household Income | Without Mortgage | With Mortgage |
| Less than $10,000 | 5,345 (5.0%) | 4,938 (2.6%) |
| $10,000 to $24,999 | 8,941 (8.3%) | 3,436 (1.8%) |
| $25,000 to $34,999 | 6,623 (6.2%) | 5,198 (2.7%) |
| $35,000 to $49,999 | 9,675 (9.0%) | 4,470 (2.3%) |
| $50,000 to $74,999 | 16,080 (15.0%) | 9,806 (5.1%) |
| $75,000 to $99,999 | 13,536 (12.6%) | 20,218 (10.5%) |
| $100,000 to $149,999 | 19,491 (18.2%) | 23,563 (12.3%) |
| $150,000 or more | 27,548 (25.7%) | 44,869 (23.4%) |
| Total | 107,239 (100.0%) | 191,577 (100.0%) |
Property Value to Household Income Ratio in Area Code 808
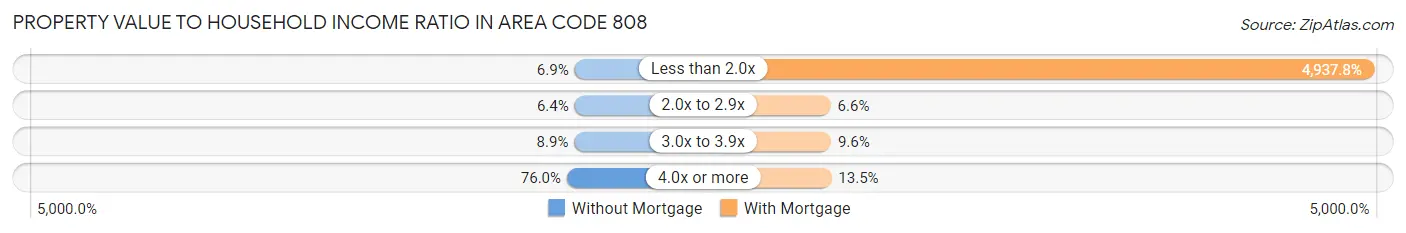
| Value-to-Income Ratio | Without Mortgage | With Mortgage |
| Less than 2.0x | 7,398 (6.9%) | 9,459,618 (4,937.8%) |
| 2.0x to 2.9x | 6,893 (6.4%) | 12,612 (6.6%) |
| 3.0x to 3.9x | 9,568 (8.9%) | 18,468 (9.6%) |
| 4.0x or more | 81,541 (76.0%) | 25,865 (13.5%) |
| Total | 107,239 (100.0%) | 191,577 (100.0%) |
Real Estate Taxes by Mortgage Status in Area Code 808
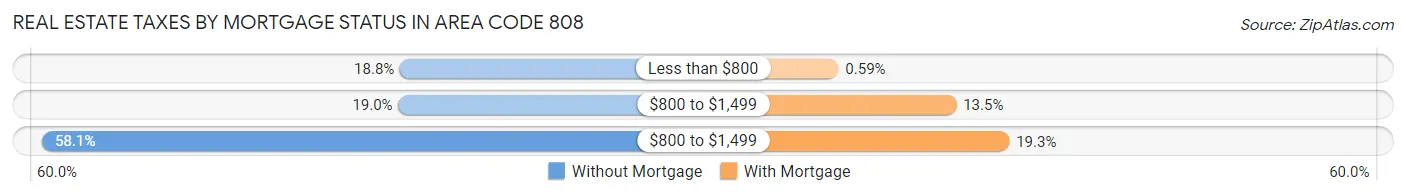
| Property Taxes | Without Mortgage | With Mortgage |
| Less than $800 | 20,209 (18.8%) | 1,129 (0.6%) |
| $800 to $1,499 | 20,410 (19.0%) | 25,858 (13.5%) |
| $800 to $1,499 | 62,293 (58.1%) | 36,995 (19.3%) |
| Total | 107,239 (100.0%) | 191,577 (100.0%) |
Health & Disability in Area Code 808
Health Insurance Coverage by Age in Area Code 808
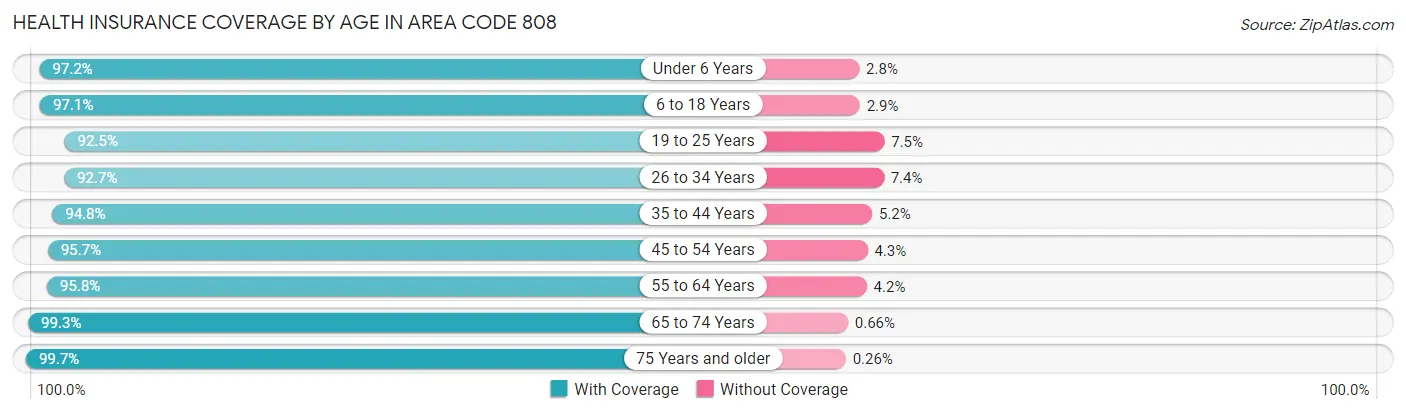
| Age Bracket | With Coverage | Without Coverage |
| Under 6 Years | 97,557 (97.2%) | 2,778 (2.8%) |
| 6 to 18 Years | 213,668 (97.1%) | 6,334 (2.9%) |
| 19 to 25 Years | 97,010 (92.5%) | 7,821 (7.5%) |
| 26 to 34 Years | 149,714 (92.6%) | 11,879 (7.3%) |
| 35 to 44 Years | 169,554 (94.8%) | 9,237 (5.2%) |
| 45 to 54 Years | 161,598 (95.7%) | 7,303 (4.3%) |
| 55 to 64 Years | 173,714 (95.8%) | 7,551 (4.2%) |
| 65 to 74 Years | 156,183 (99.3%) | 1,032 (0.7%) |
| 75 Years and older | 117,524 (99.7%) | 303 (0.3%) |
| Total | 1,336,522 (96.1%) | 54,238 (3.9%) |
Health Insurance Coverage by Citizenship Status in Area Code 808
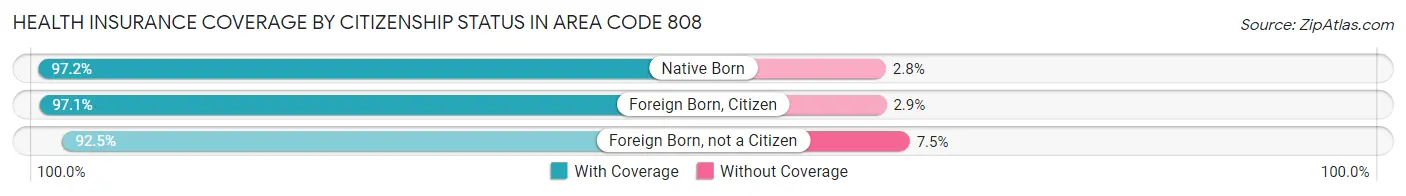
| Citizenship Status | With Coverage | Without Coverage |
| Native Born | 97,557 (97.2%) | 2,778 (2.8%) |
| Foreign Born, Citizen | 213,668 (97.1%) | 6,334 (2.9%) |
| Foreign Born, not a Citizen | 97,010 (92.5%) | 7,821 (7.5%) |
Health Insurance Coverage by Household Income in Area Code 808
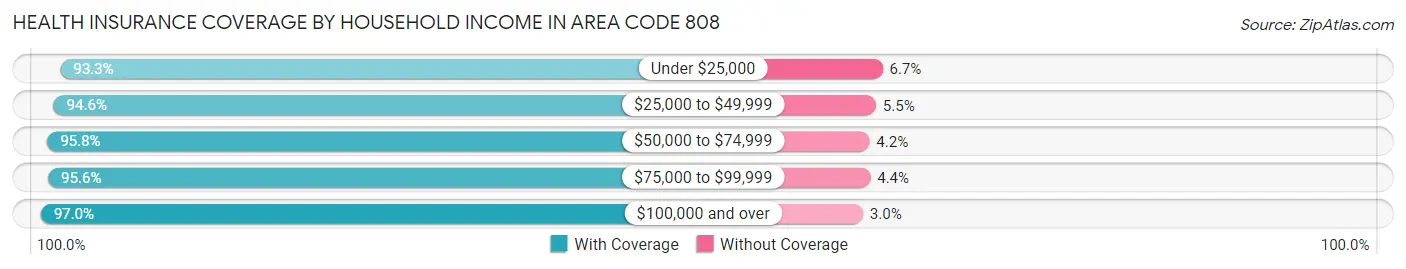
| Household Income | With Coverage | Without Coverage |
| Under $25,000 | 91,292 (93.3%) | 6,545 (6.7%) |
| $25,000 to $49,999 | 131,697 (94.6%) | 7,589 (5.4%) |
| $50,000 to $74,999 | 150,353 (95.8%) | 6,661 (4.2%) |
| $75,000 to $99,999 | 156,528 (95.6%) | 7,200 (4.4%) |
| $100,000 and over | 793,078 (97.0%) | 24,726 (3.0%) |
Public vs Private Health Insurance Coverage by Age in Area Code 808
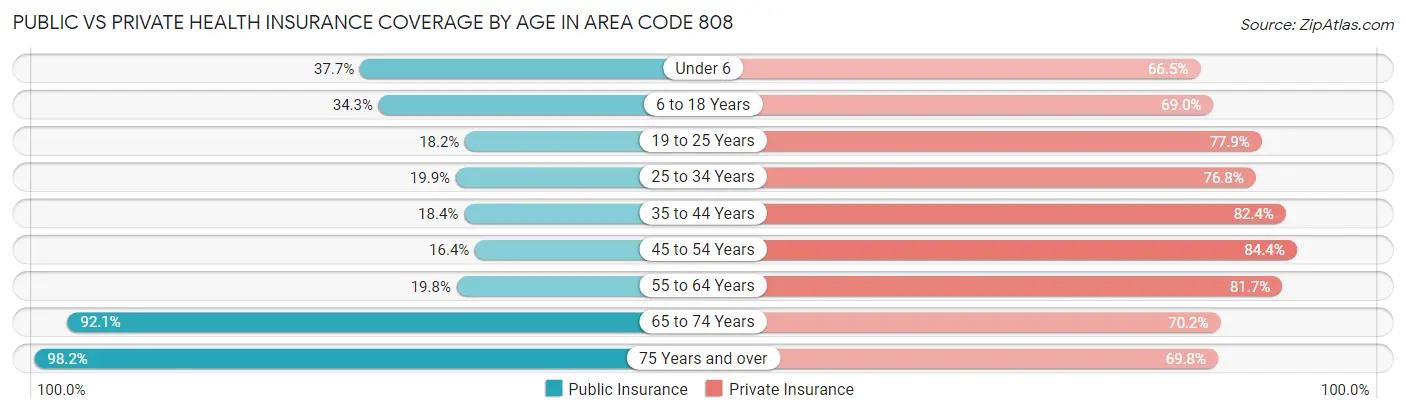
| Age Bracket | Public Insurance | Private Insurance |
| Under 6 | 37,852 (37.7%) | 66,729 (66.5%) |
| 6 to 18 Years | 75,380 (34.3%) | 151,727 (69.0%) |
| 19 to 25 Years | 19,099 (18.2%) | 81,700 (77.9%) |
| 25 to 34 Years | 32,215 (19.9%) | 124,086 (76.8%) |
| 35 to 44 Years | 32,911 (18.4%) | 147,307 (82.4%) |
| 45 to 54 Years | 27,656 (16.4%) | 142,587 (84.4%) |
| 55 to 64 Years | 35,865 (19.8%) | 148,093 (81.7%) |
| 65 to 74 Years | 144,728 (92.1%) | 110,421 (70.2%) |
| 75 Years and over | 115,671 (98.2%) | 82,247 (69.8%) |
| Total | 521,377 (37.5%) | 1,054,897 (75.8%) |
Disability Status by Sex by Age in Area Code 808
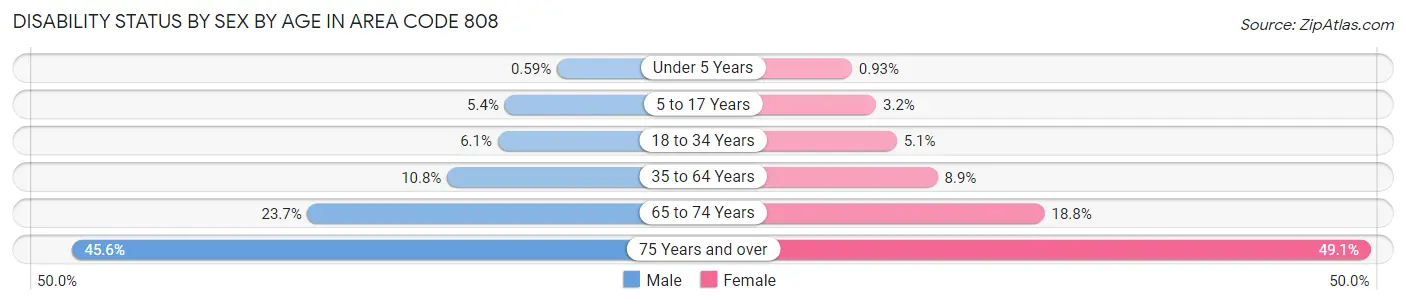
| Age Bracket | Male | Female |
| Under 5 Years | 257 (0.6%) | 378 (0.9%) |
| 5 to 17 Years | 6,195 (5.4%) | 3,400 (3.2%) |
| 18 to 34 Years | 8,398 (6.1%) | 7,322 (5.1%) |
| 35 to 64 Years | 28,285 (10.8%) | 23,696 (8.9%) |
| 65 to 74 Years | 18,091 (23.7%) | 15,249 (18.8%) |
| 75 Years and over | 22,522 (45.6%) | 33,623 (49.1%) |
Disability Class by Sex by Age in Area Code 808
Disability Class: Hearing Difficulty
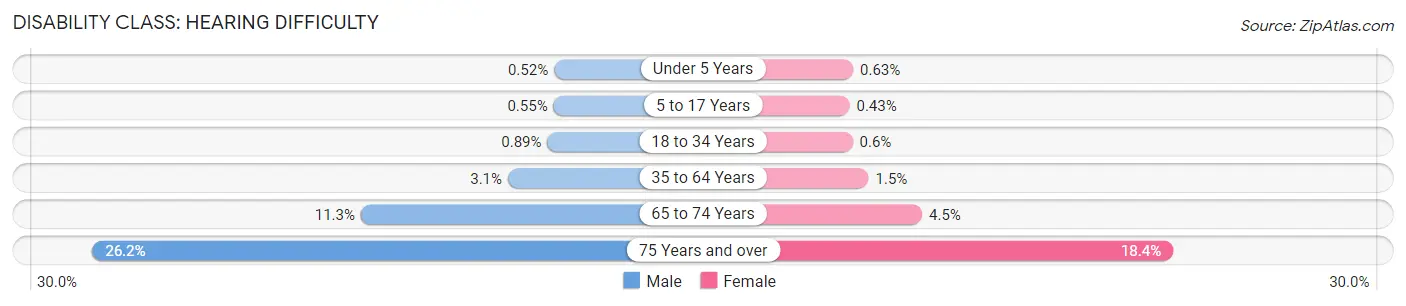
| Age Bracket | Male | Female |
| Under 5 Years | 229 (0.5%) | 257 (0.6%) |
| 5 to 17 Years | 622 (0.5%) | 457 (0.4%) |
| 18 to 34 Years | 1,229 (0.9%) | 857 (0.6%) |
| 35 to 64 Years | 8,107 (3.1%) | 3,964 (1.5%) |
| 65 to 74 Years | 8,597 (11.3%) | 3,618 (4.5%) |
| 75 Years and over | 12,943 (26.2%) | 12,627 (18.4%) |
Disability Class: Vision Difficulty
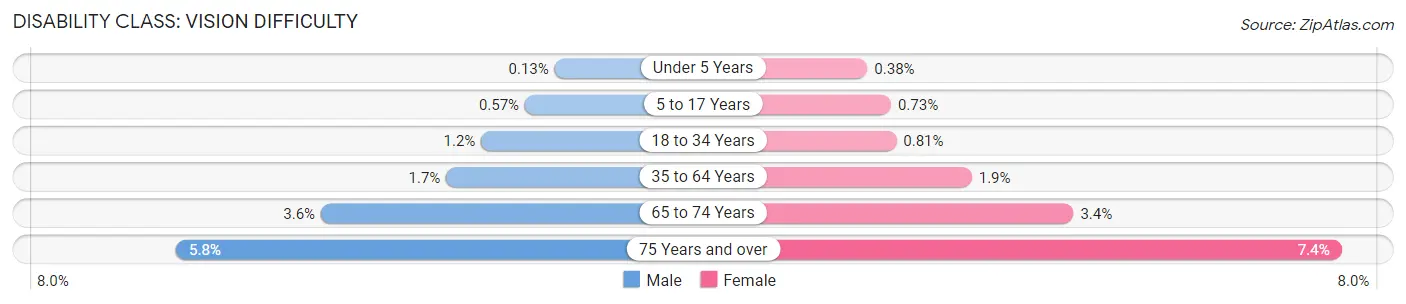
| Age Bracket | Male | Female |
| Under 5 Years | 57 (0.1%) | 154 (0.4%) |
| 5 to 17 Years | 646 (0.6%) | 782 (0.7%) |
| 18 to 34 Years | 1,684 (1.2%) | 1,164 (0.8%) |
| 35 to 64 Years | 4,577 (1.7%) | 5,148 (1.9%) |
| 65 to 74 Years | 2,740 (3.6%) | 2,784 (3.4%) |
| 75 Years and over | 2,838 (5.8%) | 5,082 (7.4%) |
Disability Class: Cognitive Difficulty
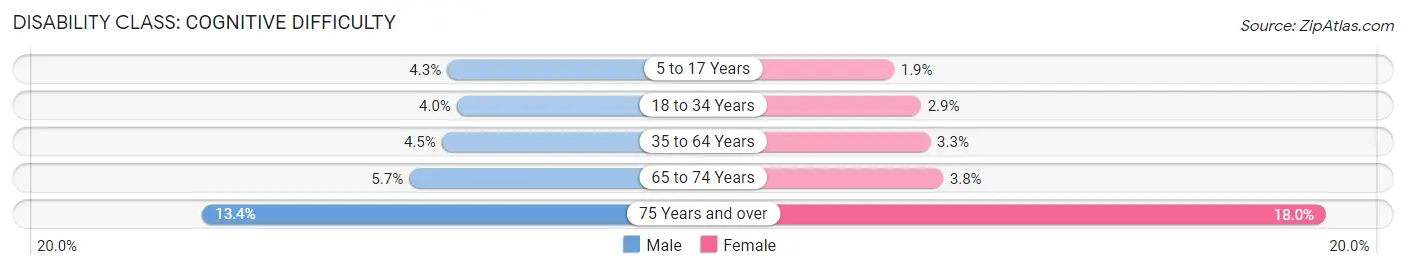
| Age Bracket | Male | Female |
| 5 to 17 Years | 4,915 (4.3%) | 2,064 (1.9%) |
| 18 to 34 Years | 5,469 (4.0%) | 4,202 (2.9%) |
| 35 to 64 Years | 11,863 (4.5%) | 8,754 (3.3%) |
| 65 to 74 Years | 4,370 (5.7%) | 3,039 (3.7%) |
| 75 Years and over | 6,612 (13.4%) | 12,309 (18.0%) |
Disability Class: Ambulatory Difficulty
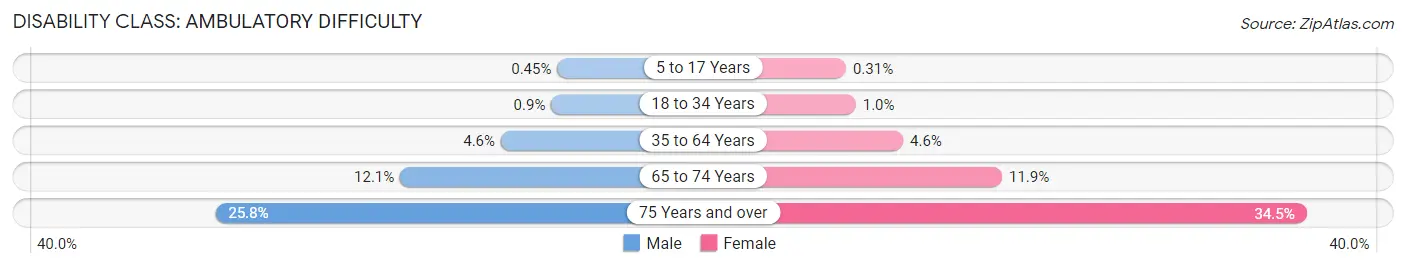
| Age Bracket | Male | Female |
| 5 to 17 Years | 512 (0.4%) | 332 (0.3%) |
| 18 to 34 Years | 1,250 (0.9%) | 1,487 (1.0%) |
| 35 to 64 Years | 12,163 (4.6%) | 12,125 (4.5%) |
| 65 to 74 Years | 9,233 (12.1%) | 9,642 (11.9%) |
| 75 Years and over | 12,748 (25.8%) | 23,628 (34.5%) |
Disability Class: Self-Care Difficulty
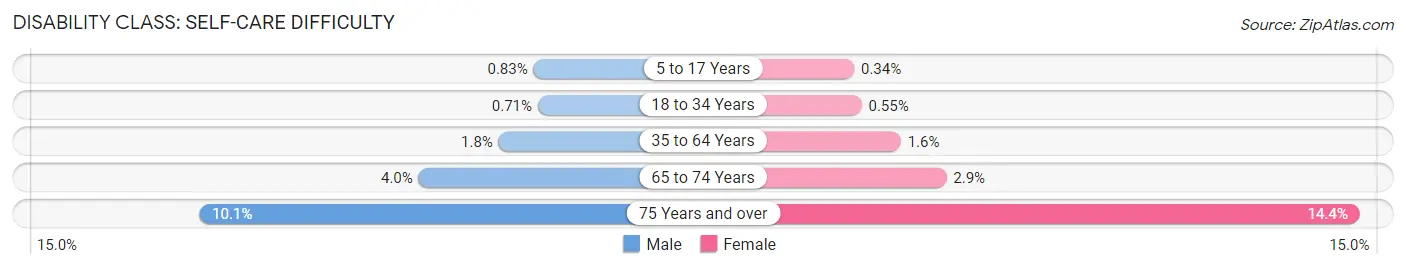
| Age Bracket | Male | Female |
| 5 to 17 Years | 941 (0.8%) | 362 (0.3%) |
| 18 to 34 Years | 977 (0.7%) | 784 (0.5%) |
| 35 to 64 Years | 4,725 (1.8%) | 4,362 (1.6%) |
| 65 to 74 Years | 3,073 (4.0%) | 2,359 (2.9%) |
| 75 Years and over | 5,005 (10.1%) | 9,878 (14.4%) |
Technology Access in Area Code 808
Computing Device Access in Area Code 808
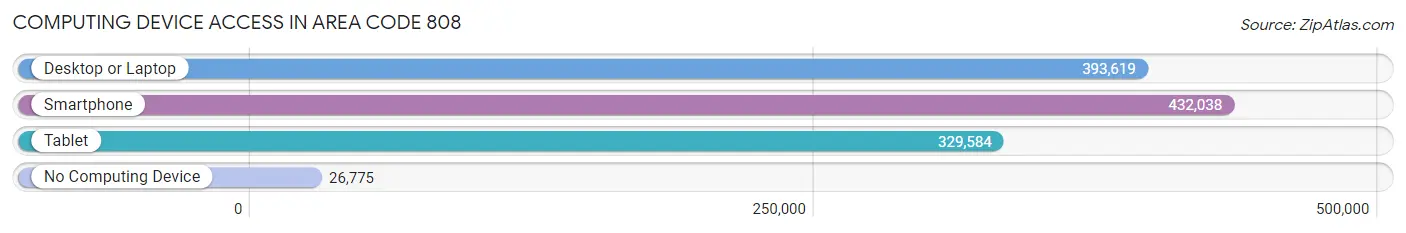
| Device Type | # Households | % Households |
| Desktop or Laptop | 393,619 | 81.3% |
| Smartphone | 432,038 | 89.3% |
| Tablet | 329,584 | 68.1% |
| No Computing Device | 26,775 | 5.5% |
| Total | 483,906 | 100.0% |
Internet Access in Area Code 808
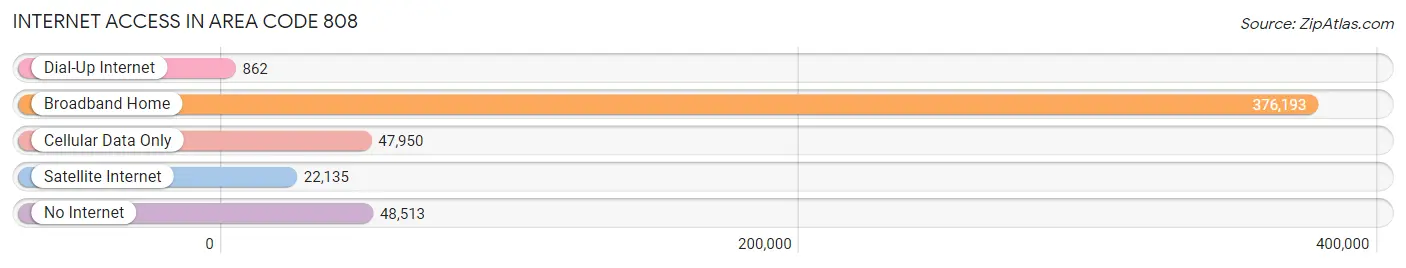
| Internet Type | # Households | % Households |
| Dial-Up Internet | 862 | 0.2% |
| Broadband Home | 376,193 | 77.7% |
| Cellular Data Only | 47,950 | 9.9% |
| Satellite Internet | 22,135 | 4.6% |
| No Internet | 48,513 | 10.0% |
| Total | 483,906 | 100.0% |
Area Code 808 Summary
Geography
Area code 808 is the telephone area code for the state of Hawaii. It covers the entire state, including the islands of Oahu, Maui, Kauai, Molokai, Lanai, and the Big Island.
Social
Area code 808 is associated with the Hawaiian culture and lifestyle. It is a reminder of the beauty and uniqueness of the islands and the people who live there. It is also a reminder of the strong sense of community and family that is so important to the Hawaiian people.
Economics
Area code 808 is a major economic driver for the state of Hawaii. It is home to many of the state's major industries, including tourism, agriculture, and technology. It is also home to many of the state's major employers, such as the University of Hawaii, the US Navy, and the US Air Force.
Demographics
Area code 808 is home to a diverse population. According to the US Census Bureau, the population of the area code is approximately 1.5 million people. The population is made up of a mix of ethnicities, including Native Hawaiian, Asian, Pacific Islander, and White. The median age of the population is 42.1 years old.
Common Questions
What is Per Capita Income in Area Code 808?
Per Capita income in Area Code 808 is $38,152.
What is the Median Family Income in Area Code 808?
Median Family Income in Area Code 808 is $103,238.
What is the Median Household income in Area Code 808?
Median Household Income in Area Code 808 is $87,967.
What is Income or Wage Gap in Area Code 808?
Income or Wage Gap in Area Code 808 is 25.0%.
Women in Area Code 808 earn 75.0 cents for every dollar earned by a man.
What is Family Income Deficit in Area Code 808?
Family Income Deficit in Area Code 808 is $11,067.
Families that are below poverty line in Area Code 808 earn $11,067 less on average than the poverty threshold level.
What is Inequality or Gini Index in Area Code 808?
Inequality or Gini Index in Area Code 808 is 36.99.
What is the Total Population of Area Code 808?
Total Population of Area Code 808 is 1,450,589.
What is the Total Male Population of Area Code 808?
Total Male Population of Area Code 808 is 732,060.
What is the Total Female Population of Area Code 808?
Total Female Population of Area Code 808 is 718,529.
What is the Ratio of Males per 100 Females in Area Code 808?
There are 101.88 Males per 100 Females in Area Code 808.
What is the Ratio of Females per 100 Males in Area Code 808?
There are 98.15 Females per 100 Males in Area Code 808.
What is the Median Population Age in Area Code 808?
Median Population Age in Area Code 808 is 41.7 Years.
What is the Average Family Size in Area Code 808
Average Family Size in Area Code 808 is 3.4 People.
What is the Average Household Size in Area Code 808
Average Household Size in Area Code 808 is 2.9 People.
How Large is the Labor Force in Area Code 808?
There are 748,027 People in the Labor Forcein in Area Code 808.
What is the Percentage of People in the Labor Force in Area Code 808?
63.6% of People are in the Labor Force in Area Code 808.
What is the Unemployment Rate in Area Code 808?
Unemployment Rate in Area Code 808 is 7.0%.