Area Code 231 Map & Demographics
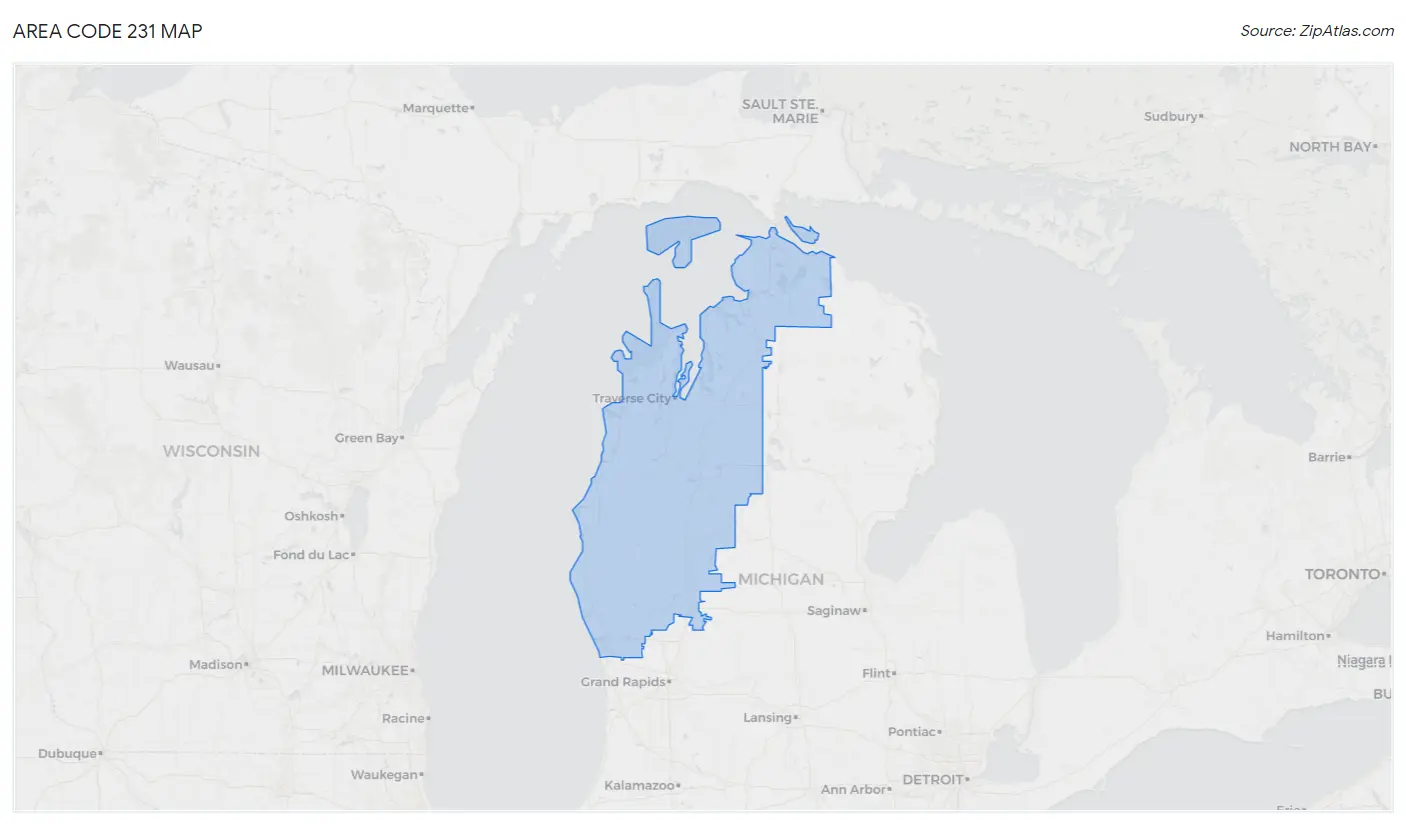
Area Code 231 Map
Area Code 231 Overview
$34,005
PER CAPITA INCOME
$76,979
AVG FAMILY INCOME
$63,803
AVG HOUSEHOLD INCOME
29.6%
WAGE / INCOME GAP [ % ]
70.4¢/ $1
WAGE / INCOME GAP [ $ ]
$10,519
FAMILY INCOME DEFICIT
52.72
INEQUALITY / GINI INDEX
709,676
TOTAL POPULATION
358,051
MALE POPULATION
351,625
FEMALE POPULATION
101.83
MALES / 100 FEMALES
98.21
FEMALES / 100 MALES
47.4
MEDIAN AGE
3.0
AVG FAMILY SIZE
2.4
AVG HOUSEHOLD SIZE
317,936
LABOR FORCE [ PEOPLE ]
54.6%
PERCENT IN LABOR FORCE
5.7%
UNEMPLOYMENT RATE
Income in Area Code 231
Income Overview in Area Code 231
Per Capita Income in Area Code 231 is $34,005, while median incomes of families and households are $76,979 and $63,803 respectively.
| Characteristic | Number | Measure |
| Per Capita Income | 709,676 | $34,005 |
| Median Family Income | 186,517 | $76,979 |
| Mean Family Income | 186,517 | $11,743,636 |
| Median Household Income | 283,317 | $63,803 |
| Mean Household Income | 283,317 | $10,232,763 |
| Income Deficit | 186,517 | $10,519 |
| Wage / Income Gap (%) | 709,676 | 29.57% |
| Wage / Income Gap ($) | 709,676 | 70.43¢ per $1 |
| Gini / Inequality Index | 709,676 | 52.72 |
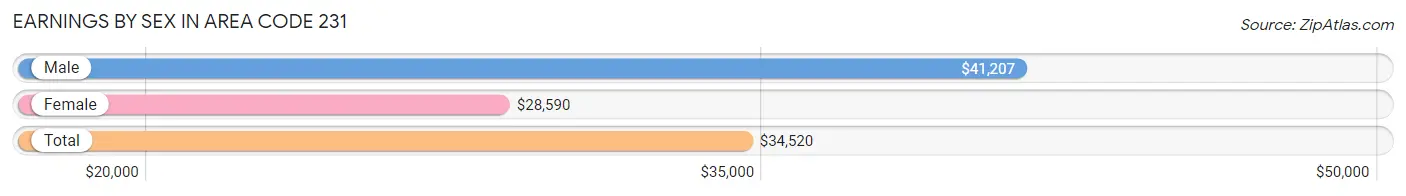
Earnings by Sex in Area Code 231
Average Earnings in Area Code 231 are $34,520, $41,207 for men and $28,590 for women, a difference of 30.6%.
| Sex | Number | Average Earnings |
| Male | 188,884 (52.9%) | $41,207 |
| Female | 168,339 (47.1%) | $28,590 |
| Total | 357,223 (100.0%) | $34,520 |
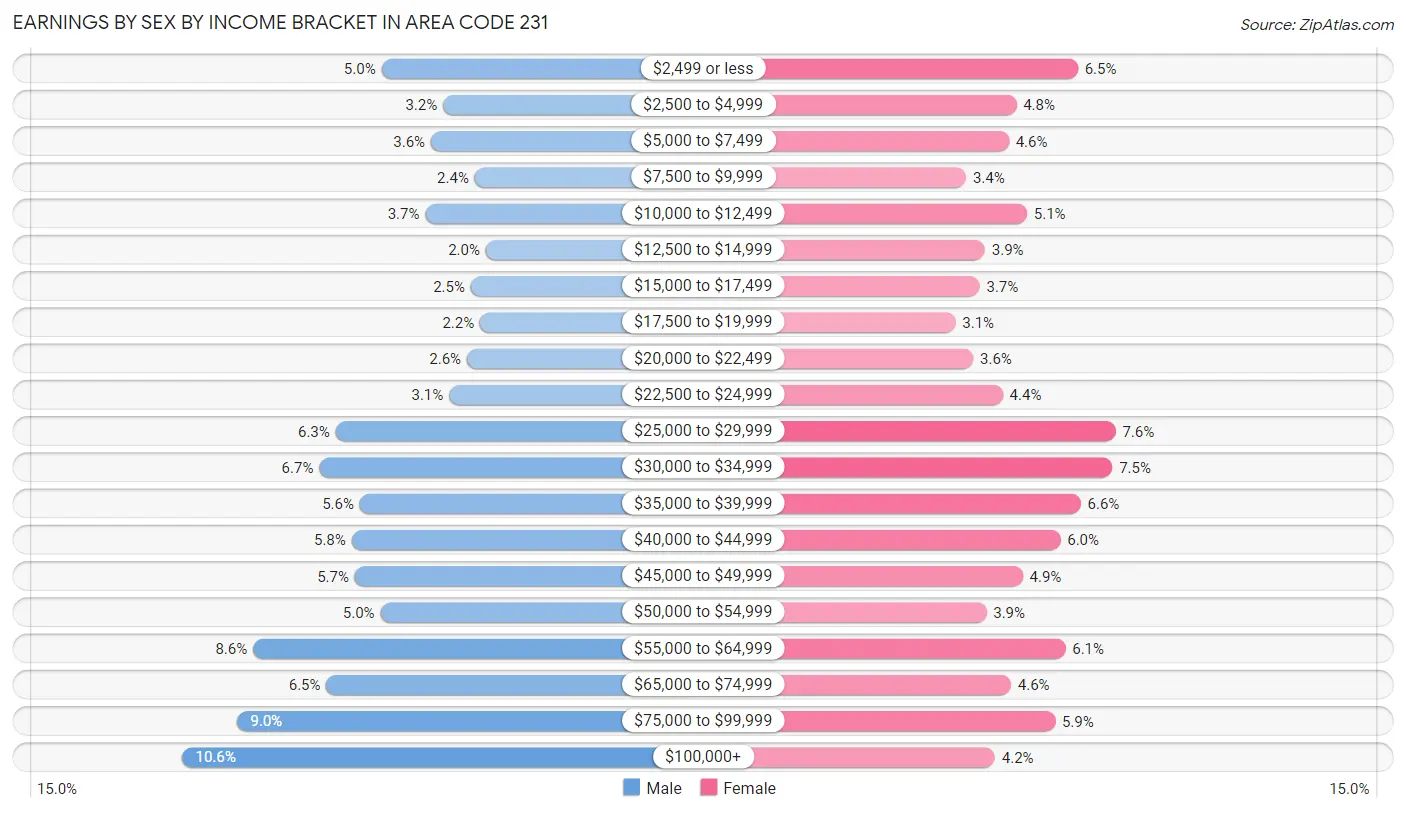
Earnings by Sex by Income Bracket in Area Code 231
The most common earnings brackets in Area Code 231 are $100,000+ for men (19,953 | 10.6%) and $25,000 to $29,999 for women (12,713 | 7.5%).
| Income | Male | Female |
| $2,499 or less | 9,394 (5.0%) | 10,919 (6.5%) |
| $2,500 to $4,999 | 6,122 (3.2%) | 8,021 (4.8%) |
| $5,000 to $7,499 | 6,765 (3.6%) | 7,663 (4.5%) |
| $7,500 to $9,999 | 4,437 (2.4%) | 5,634 (3.4%) |
| $10,000 to $12,499 | 7,070 (3.7%) | 8,516 (5.1%) |
| $12,500 to $14,999 | 3,845 (2.0%) | 6,528 (3.9%) |
| $15,000 to $17,499 | 4,639 (2.5%) | 6,278 (3.7%) |
| $17,500 to $19,999 | 4,162 (2.2%) | 5,142 (3.0%) |
| $20,000 to $22,499 | 4,857 (2.6%) | 5,981 (3.5%) |
| $22,500 to $24,999 | 5,801 (3.1%) | 7,373 (4.4%) |
| $25,000 to $29,999 | 11,817 (6.3%) | 12,713 (7.5%) |
| $30,000 to $34,999 | 12,696 (6.7%) | 12,555 (7.5%) |
| $35,000 to $39,999 | 10,540 (5.6%) | 11,062 (6.6%) |
| $40,000 to $44,999 | 10,982 (5.8%) | 10,102 (6.0%) |
| $45,000 to $49,999 | 10,810 (5.7%) | 8,309 (4.9%) |
| $50,000 to $54,999 | 9,435 (5.0%) | 6,594 (3.9%) |
| $55,000 to $64,999 | 16,205 (8.6%) | 10,340 (6.1%) |
| $65,000 to $74,999 | 12,324 (6.5%) | 7,762 (4.6%) |
| $75,000 to $99,999 | 17,030 (9.0%) | 9,852 (5.9%) |
| $100,000+ | 19,953 (10.6%) | 6,995 (4.2%) |
| Total | 188,884 (100.0%) | 168,339 (100.0%) |
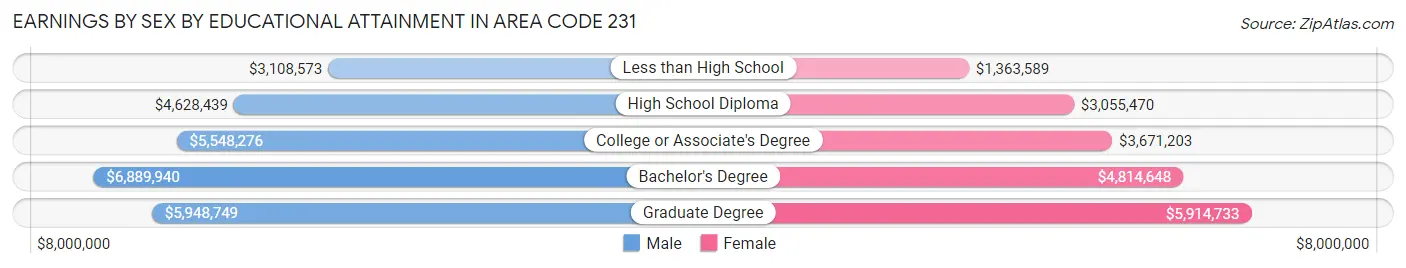
Earnings by Sex by Educational Attainment in Area Code 231
Average earnings in Area Code 231 are $5,690,118 for men and $3,881,901 for women, a difference of 31.8%. Men with an educational attainment of bachelor's degree enjoy the highest average annual earnings of $6,889,940, while those with less than high school education earn the least with $3,108,573. Women with an educational attainment of graduate degree earn the most with the average annual earnings of $5,914,733, while those with less than high school education have the smallest earnings of $1,363,589.
| Educational Attainment | Male Income | Female Income |
| Less than High School | $3,108,573 | $1,363,589 |
| High School Diploma | $4,628,439 | $3,055,470 |
| College or Associate's Degree | $5,548,276 | $3,671,203 |
| Bachelor's Degree | $6,889,940 | $4,814,648 |
| Graduate Degree | $5,948,749 | $5,914,733 |
| Total | $5,690,118 | $3,881,901 |
Family Income in Area Code 231
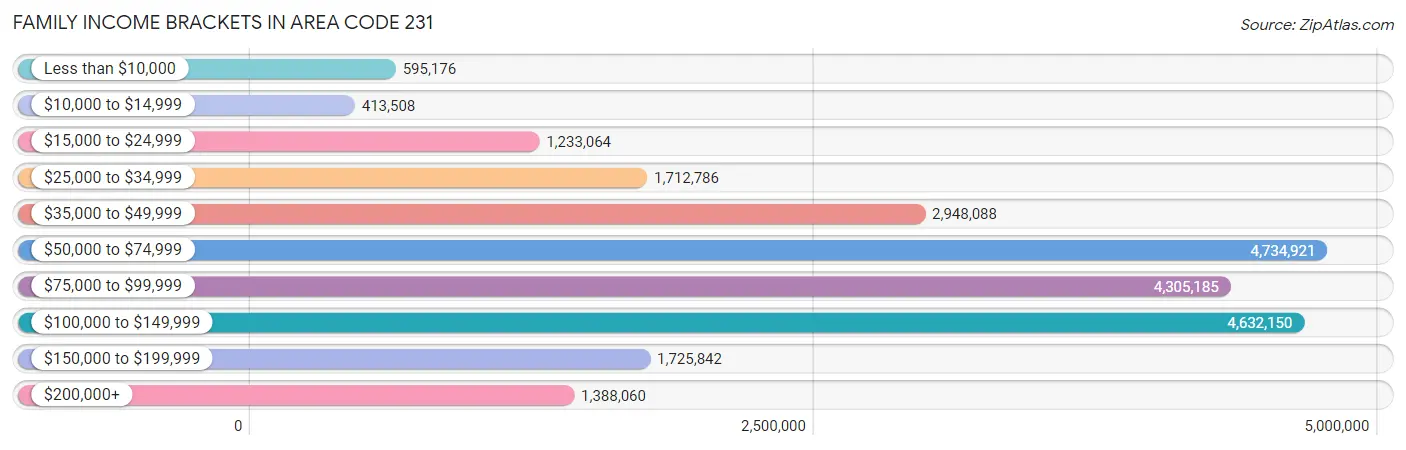
Family Income Brackets in Area Code 231
According to the Area Code 231 family income data, there are 4,734,921 families falling into the $50,000 to $74,999 income range, which is the most common income bracket and makes up 2,538.6% of all families. Conversely, the $10,000 to $14,999 income bracket is the least frequent group with only 413,508 families (221.7%) belonging to this category.
| Income Bracket | # Families | % Families |
| Less than $10,000 | 595,176 | 319.1% |
| $10,000 to $14,999 | 413,508 | 221.7% |
| $15,000 to $24,999 | 1,233,064 | 661.1% |
| $25,000 to $34,999 | 1,712,786 | 918.3% |
| $35,000 to $49,999 | 2,948,088 | 1,580.6% |
| $50,000 to $74,999 | 4,734,921 | 2,538.6% |
| $75,000 to $99,999 | 4,305,185 | 2,308.2% |
| $100,000 to $149,999 | 4,632,150 | 2,483.5% |
| $150,000 to $199,999 | 1,725,842 | 925.3% |
| $200,000+ | 1,388,060 | 744.2% |
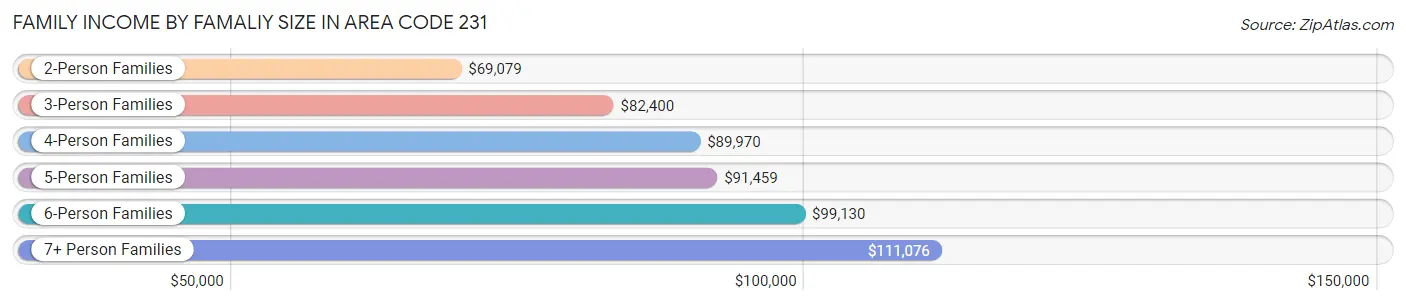
Family Income by Famaliy Size in Area Code 231
7+ person families (2,829 | 1.5%) account for the highest median family income in Area Code 231 with $111,076 per family, while 2-person families (102,560 | 55.0%) have the highest median income of $34,540 per family member.
| Income Bracket | # Families | Median Income |
| 2-Person Families | 102,560 (55.0%) | $69,079 |
| 3-Person Families | 36,394 (19.5%) | $82,400 |
| 4-Person Families | 27,677 (14.8%) | $89,970 |
| 5-Person Families | 12,312 (6.6%) | $91,459 |
| 6-Person Families | 4,745 (2.5%) | $99,130 |
| 7+ Person Families | 2,829 (1.5%) | $111,076 |
| Total | 186,517 (100.0%) | $76,979 |
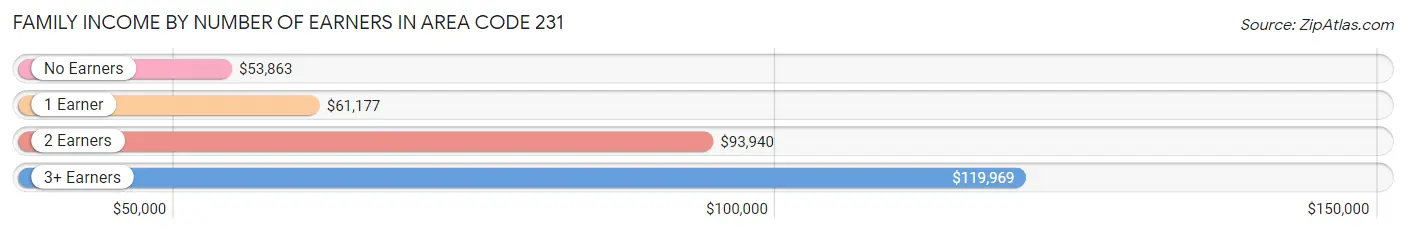
Family Income by Number of Earners in Area Code 231
The median family income in Area Code 231 is $76,979, with families comprising 3+ earners (20,643) having the highest median family income of $119,969, while families with no earners (40,305) have the lowest median family income of $53,863, accounting for 11.1% and 21.6% of families, respectively.
| Number of Earners | # Families | Median Income |
| No Earners | 40,305 (21.6%) | $53,863 |
| 1 Earner | 56,956 (30.5%) | $61,177 |
| 2 Earners | 68,613 (36.8%) | $93,940 |
| 3+ Earners | 20,643 (11.1%) | $119,969 |
| Total | 186,517 (100.0%) | $76,979 |
Household Income in Area Code 231
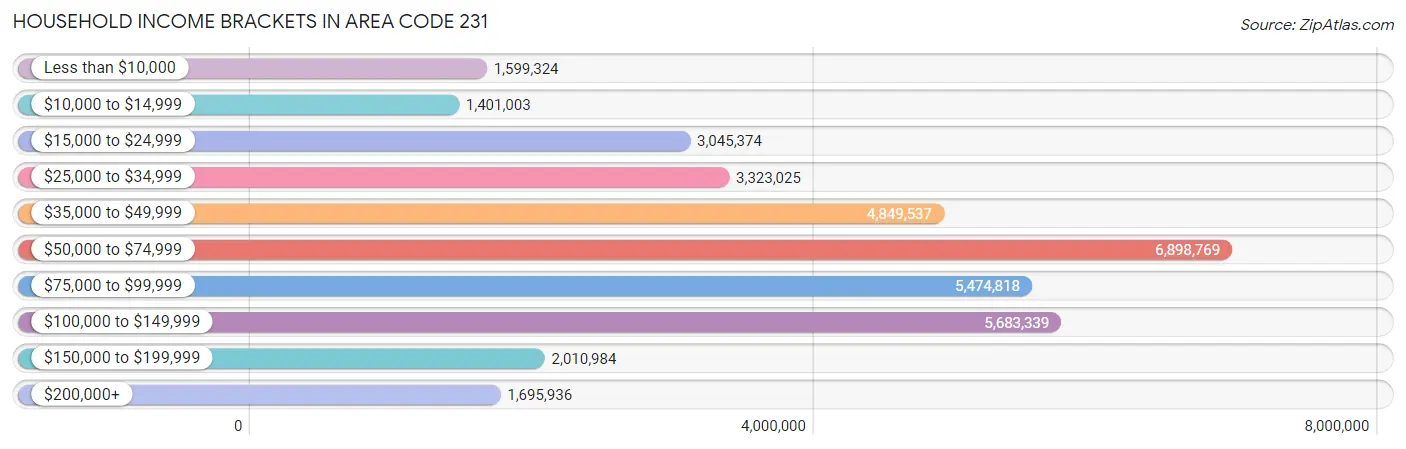
Household Income Brackets in Area Code 231
With 6,898,769 households falling in the category, the $50,000 to $74,999 income range is the most frequent in Area Code 231, accounting for 2,435.0% of all households. In contrast, only 1,401,003 households (494.5%) fall into the $10,000 to $14,999 income bracket, making it the least populous group.
| Income Bracket | # Households | % Households |
| Less than $10,000 | 1,599,324 | 564.5% |
| $10,000 to $14,999 | 1,401,003 | 494.5% |
| $15,000 to $24,999 | 3,045,374 | 1,074.9% |
| $25,000 to $34,999 | 3,323,025 | 1,172.9% |
| $35,000 to $49,999 | 4,849,537 | 1,711.7% |
| $50,000 to $74,999 | 6,898,769 | 2,435.0% |
| $75,000 to $99,999 | 5,474,818 | 1,932.4% |
| $100,000 to $149,999 | 5,683,339 | 2,006.0% |
| $150,000 to $199,999 | 2,010,984 | 709.8% |
| $200,000+ | 1,695,936 | 598.6% |
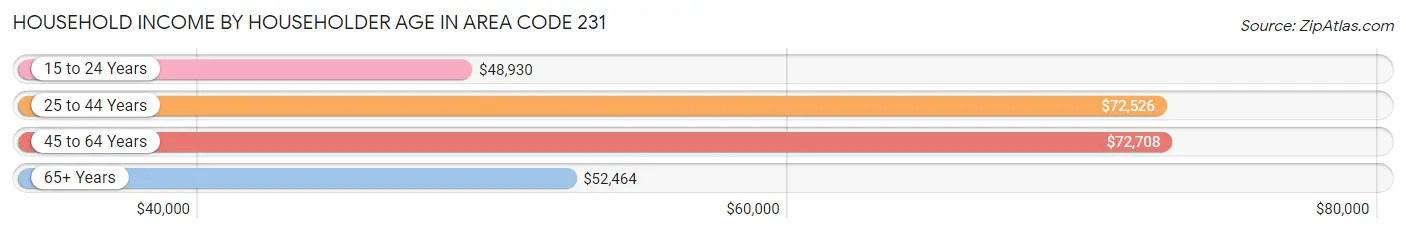
Household Income by Householder Age in Area Code 231
The median household income in Area Code 231 is $63,803, with the highest median household income of $72,708 found in the 45 to 64 years age bracket for the primary householder. A total of 105,668 households (37.3%) fall into this category. Meanwhile, the 15 to 24 years age bracket for the primary householder has the lowest median household income of $48,930, with 9,007 households (3.2%) in this group.
| Income Bracket | # Households | Median Income |
| 15 to 24 Years | 9,007 (3.2%) | $48,930 |
| 25 to 44 Years | 73,155 (25.8%) | $72,526 |
| 45 to 64 Years | 105,668 (37.3%) | $72,708 |
| 65+ Years | 95,487 (33.7%) | $52,464 |
| Total | 283,317 (100.0%) | $63,803 |
Poverty in Area Code 231
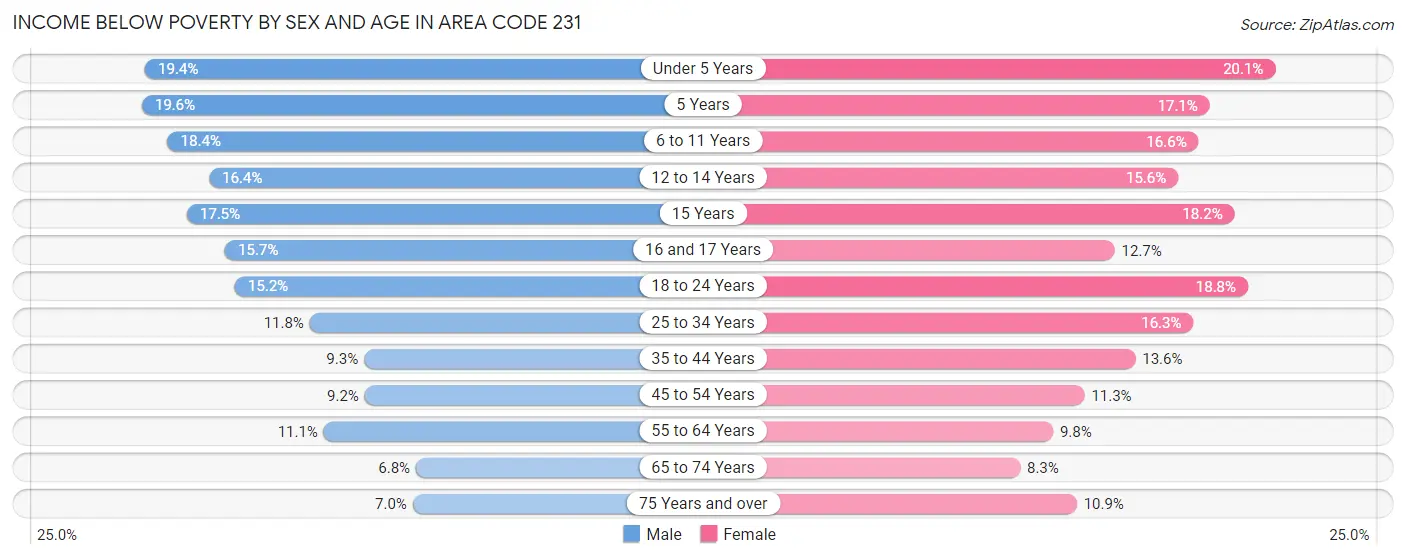
Income Below Poverty by Sex and Age in Area Code 231
With 11.6% poverty level for males and 13.1% for females among the residents of Area Code 231, 5 year old males and under 5 year old females are the most vulnerable to poverty, with 796 males (19.6%) and 3,410 females (20.1%) in their respective age groups living below the poverty level.
| Age Bracket | Male | Female |
| Under 5 Years | 3,489 (19.4%) | 3,410 (20.1%) |
| 5 Years | 796 (19.6%) | 681 (17.1%) |
| 6 to 11 Years | 4,435 (18.4%) | 3,760 (16.6%) |
| 12 to 14 Years | 2,073 (16.4%) | 1,839 (15.6%) |
| 15 Years | 888 (17.5%) | 853 (18.2%) |
| 16 and 17 Years | 1,332 (15.7%) | 1,039 (12.7%) |
| 18 to 24 Years | 4,237 (15.2%) | 4,705 (18.8%) |
| 25 to 34 Years | 4,787 (11.8%) | 6,409 (16.3%) |
| 35 to 44 Years | 3,707 (9.2%) | 5,312 (13.6%) |
| 45 to 54 Years | 3,897 (9.2%) | 4,585 (11.3%) |
| 55 to 64 Years | 5,919 (11.1%) | 5,371 (9.8%) |
| 65 to 74 Years | 3,096 (6.8%) | 3,851 (8.3%) |
| 75 Years and over | 1,804 (7.0%) | 3,510 (10.9%) |
| Total | 40,460 (11.6%) | 45,325 (13.1%) |
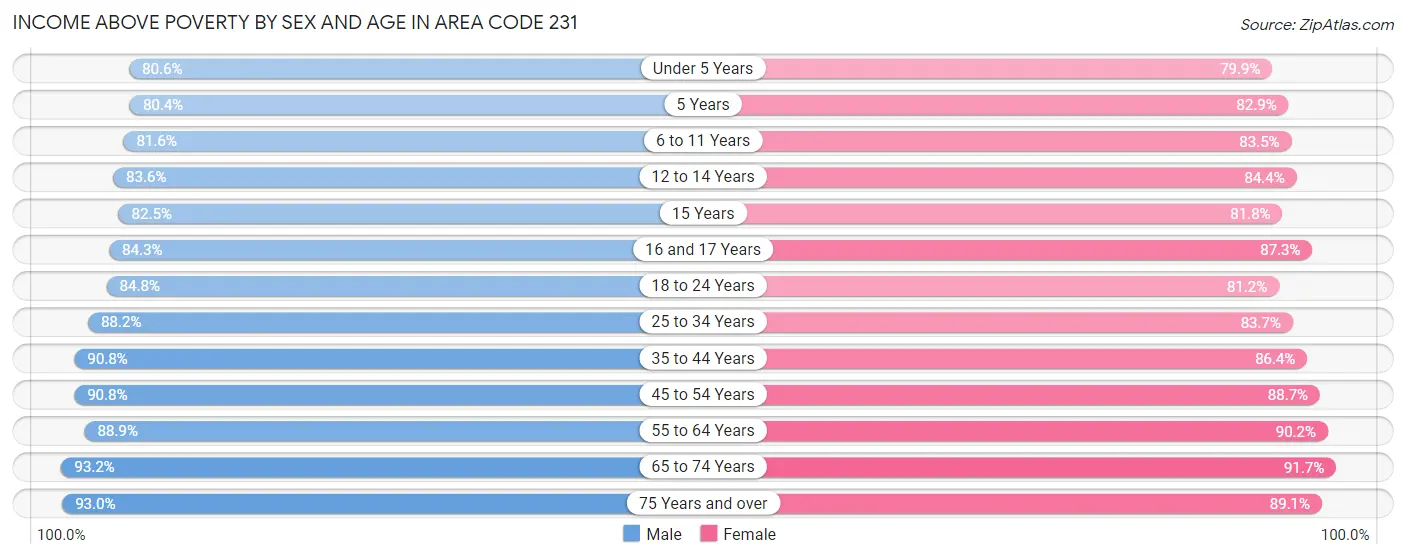
Income Above Poverty by Sex and Age in Area Code 231
According to the poverty statistics in Area Code 231, males aged 65 to 74 years and females aged 65 to 74 years are the age groups that are most secure financially, with 93.2% of males and 91.7% of females in these age groups living above the poverty line.
| Age Bracket | Male | Female |
| Under 5 Years | 14,485 (80.6%) | 13,547 (79.9%) |
| 5 Years | 3,274 (80.4%) | 3,308 (82.9%) |
| 6 to 11 Years | 19,726 (81.6%) | 18,954 (83.5%) |
| 12 to 14 Years | 10,536 (83.6%) | 9,949 (84.4%) |
| 15 Years | 4,196 (82.5%) | 3,829 (81.8%) |
| 16 and 17 Years | 7,154 (84.3%) | 7,171 (87.3%) |
| 18 to 24 Years | 23,562 (84.8%) | 20,266 (81.2%) |
| 25 to 34 Years | 35,892 (88.2%) | 32,877 (83.7%) |
| 35 to 44 Years | 36,389 (90.7%) | 33,684 (86.4%) |
| 45 to 54 Years | 38,391 (90.8%) | 36,127 (88.7%) |
| 55 to 64 Years | 47,321 (88.9%) | 49,419 (90.2%) |
| 65 to 74 Years | 42,158 (93.2%) | 42,711 (91.7%) |
| 75 Years and over | 24,011 (93.0%) | 28,704 (89.1%) |
| Total | 307,095 (88.4%) | 300,546 (86.9%) |
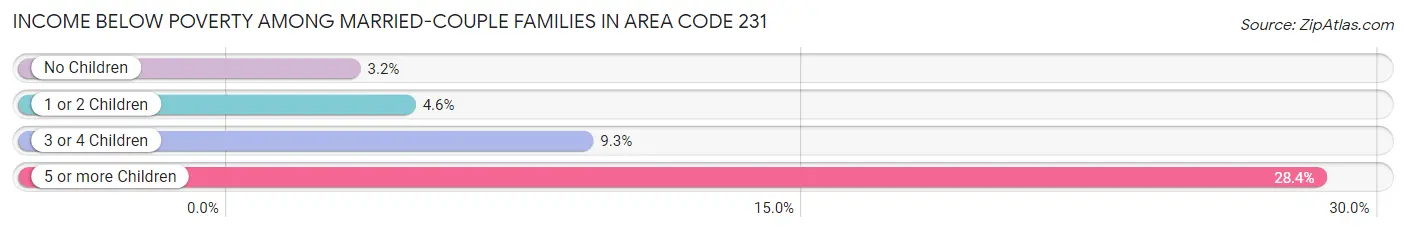
Income Below Poverty Among Married-Couple Families in Area Code 231
The poverty statistics for married-couple families in Area Code 231 show that 4.2% or 6,124 of the total 144,433 families live below the poverty line. Families with 5 or more children have the highest poverty rate of 28.4%, comprising of 403 families. On the other hand, families with no children have the lowest poverty rate of 3.2%, which includes 3,109 families.
| Children | Above Poverty | Below Poverty |
| No Children | 94,042 (96.8%) | 3,109 (3.2%) |
| 1 or 2 Children | 33,801 (95.4%) | 1,645 (4.6%) |
| 3 or 4 Children | 9,451 (90.7%) | 967 (9.3%) |
| 5 or more Children | 1,015 (71.6%) | 403 (28.4%) |
| Total | 138,309 (95.8%) | 6,124 (4.2%) |
Income Below Poverty Among Single-Parent Households in Area Code 231
According to the poverty data in Area Code 231, 11.4% or 1,577 single-father households and 26.1% or 7,369 single-mother households are living below the poverty line. Among single-father households, those with 5 or more children have the highest poverty rate, with 57 households (57.0%) experiencing poverty. Likewise, among single-mother households, those with 5 or more children have the highest poverty rate, with 216 households (90.8%) falling below the poverty line.
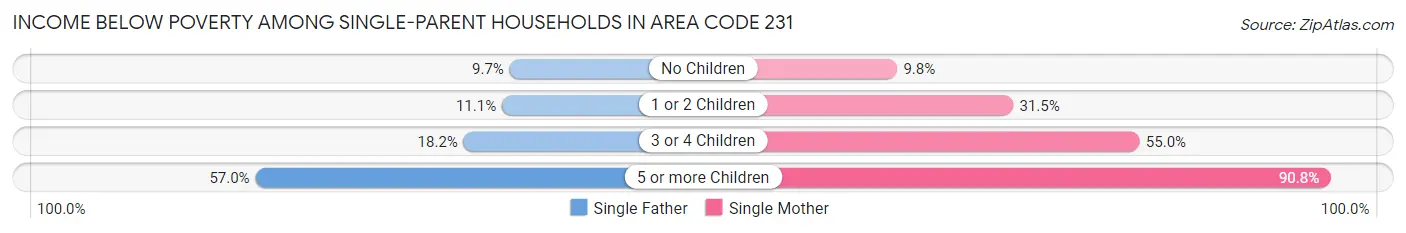
| Children | Single Father | Single Mother |
| No Children | 564 (9.7%) | 1,047 (9.8%) |
| 1 or 2 Children | 762 (11.1%) | 4,559 (31.5%) |
| 3 or 4 Children | 194 (18.2%) | 1,547 (55.0%) |
| 5 or more Children | 57 (57.0%) | 216 (90.8%) |
| Total | 1,577 (11.4%) | 7,369 (26.1%) |
Income Below Poverty Among Married-Couple vs Single-Parent Households in Area Code 231
The poverty data for Area Code 231 shows that 6,124 of the married-couple family households (4.2%) and 8,946 of the single-parent households (21.3%) are living below the poverty level. Within the married-couple family households, those with 5 or more children have the highest poverty rate, with 403 households (28.4%) falling below the poverty line. Among the single-parent households, those with 5 or more children have the highest poverty rate, with 273 household (80.8%) living below poverty.
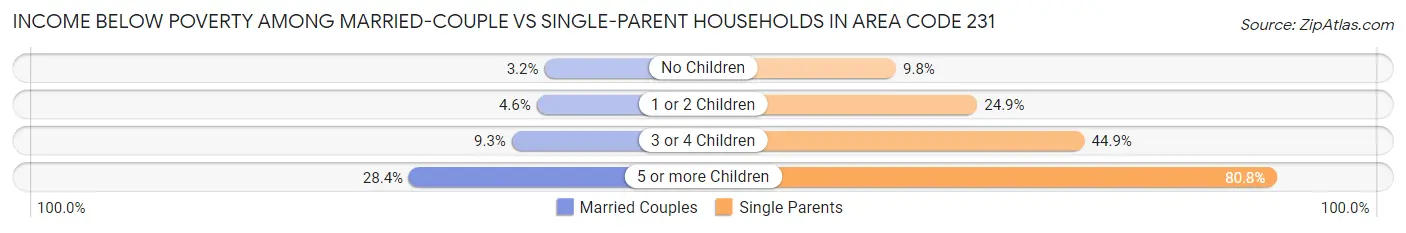
| Children | Married-Couple Families | Single-Parent Households |
| No Children | 3,109 (3.2%) | 1,611 (9.8%) |
| 1 or 2 Children | 1,645 (4.6%) | 5,321 (24.9%) |
| 3 or 4 Children | 967 (9.3%) | 1,741 (44.9%) |
| 5 or more Children | 403 (28.4%) | 273 (80.8%) |
| Total | 6,124 (4.2%) | 8,946 (21.3%) |
Race in Area Code 231
The most populous races in Area Code 231 are White / Caucasian (628,547 | 88.6%), Two or more Races (33,851 | 4.8%), and Hispanic or Latino (30,525 | 4.3%).
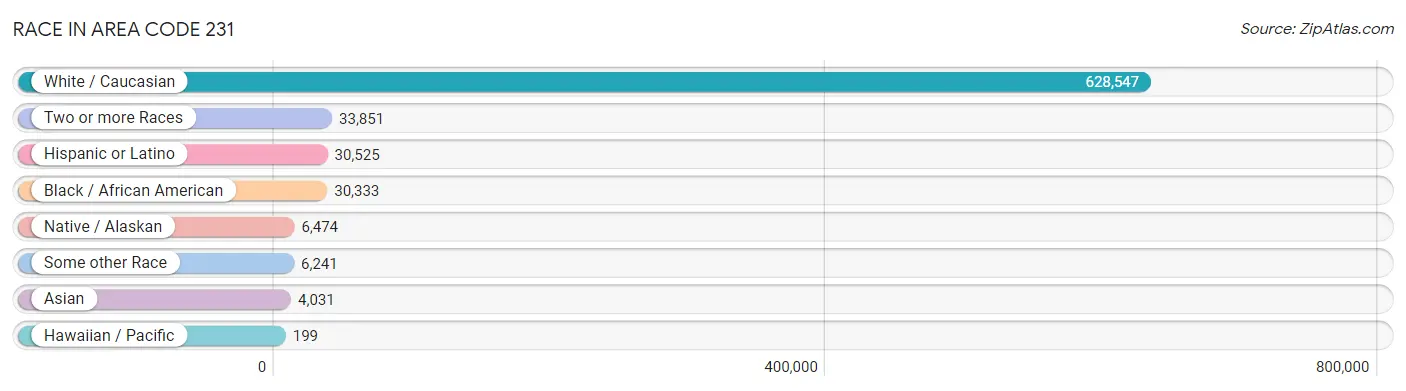
| Race | # Population | % Population |
| Asian | 4,031 | 0.6% |
| Black / African American | 30,333 | 4.3% |
| Hawaiian / Pacific | 199 | 0.0% |
| Hispanic or Latino | 30,525 | 4.3% |
| Native / Alaskan | 6,474 | 0.9% |
| White / Caucasian | 628,547 | 88.6% |
| Two or more Races | 33,851 | 4.8% |
| Some other Race | 6,241 | 0.9% |
| Total | 709,676 | 100.0% |
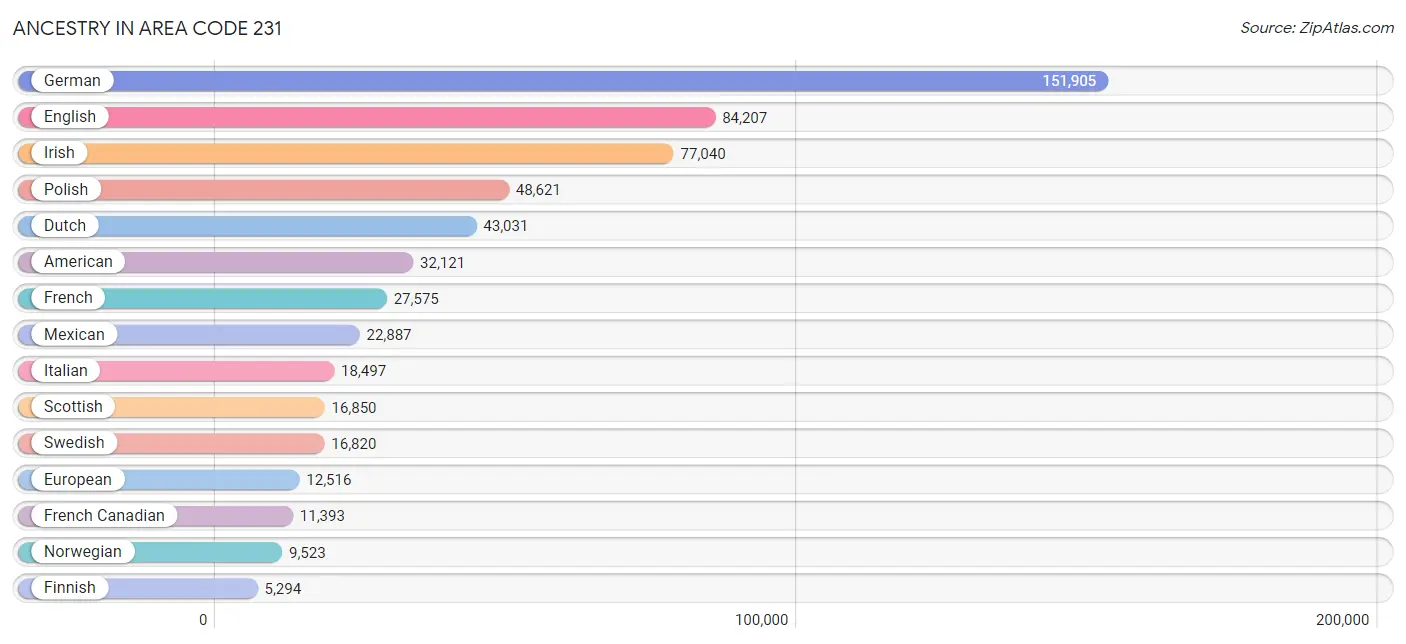
Ancestry in Area Code 231
The most populous ancestries reported in Area Code 231 are German (151,905 | 21.4%), English (84,207 | 11.9%), Irish (77,040 | 10.9%), Polish (48,621 | 6.9%), and Dutch (43,031 | 6.1%), together accounting for 57.0% of all Area Code 231 residents.
| Ancestry | # Population | % Population |
| Afghan | 29 | 0.0% |
| African | 1,181 | 0.2% |
| Alaska Native | 41 | 0.0% |
| Alaskan Athabascan | 4 | 0.0% |
| Albanian | 118 | 0.0% |
| Alsatian | 1 | 0.0% |
| American | 32,121 | 4.5% |
| Apache | 181 | 0.0% |
| Arab | 1,543 | 0.2% |
| Argentinean | 120 | 0.0% |
| Armenian | 272 | 0.0% |
| Assyrian / Chaldean / Syriac | 225 | 0.0% |
| Australian | 123 | 0.0% |
| Austrian | 1,396 | 0.2% |
| Bahamian | 16 | 0.0% |
| Bangladeshi | 72 | 0.0% |
| Basque | 25 | 0.0% |
| Belgian | 2,028 | 0.3% |
| Belizean | 17 | 0.0% |
| Bhutanese | 659 | 0.1% |
| Blackfeet | 543 | 0.1% |
| Bolivian | 21 | 0.0% |
| Brazilian | 147 | 0.0% |
| British | 3,191 | 0.4% |
| British West Indian | 7 | 0.0% |
| Bulgarian | 231 | 0.0% |
| Burmese | 1,573 | 0.2% |
| Cajun | 10 | 0.0% |
| Cambodian | 72 | 0.0% |
| Canadian | 1,965 | 0.3% |
| Celtic | 107 | 0.0% |
| Central American | 1,469 | 0.2% |
| Central American Indian | 320 | 0.1% |
| Cherokee | 1,314 | 0.2% |
| Cheyenne | 3 | 0.0% |
| Chickasaw | 20 | 0.0% |
| Chilean | 43 | 0.0% |
| Chinese | 1 | 0.0% |
| Chippewa | 4,955 | 0.7% |
| Choctaw | 75 | 0.0% |
| Colombian | 109 | 0.0% |
| Colville | 16 | 0.0% |
| Comanche | 18 | 0.0% |
| Costa Rican | 112 | 0.0% |
| Cree | 29 | 0.0% |
| Creek | 77 | 0.0% |
| Croatian | 689 | 0.1% |
| Crow | 18 | 0.0% |
| Cuban | 616 | 0.1% |
| Cypriot | 9 | 0.0% |
| Czech | 4,197 | 0.6% |
| Czechoslovakian | 1,129 | 0.2% |
| Danish | 4,672 | 0.7% |
| Dominican | 418 | 0.1% |
| Dutch | 43,031 | 6.1% |
| Dutch West Indian | 2 | 0.0% |
| Eastern European | 2,084 | 0.3% |
| Ecuadorian | 37 | 0.0% |
| Egyptian | 53 | 0.0% |
| English | 84,207 | 11.9% |
| Estonian | 32 | 0.0% |
| Ethiopian | 80 | 0.0% |
| European | 12,516 | 1.8% |
| Fijian | 1 | 0.0% |
| Filipino | 42 | 0.0% |
| Finnish | 5,294 | 0.7% |
| French | 27,575 | 3.9% |
| French American Indian | 287 | 0.0% |
| French Canadian | 11,393 | 1.6% |
| German | 151,905 | 21.4% |
| German Russian | 6 | 0.0% |
| Ghanaian | 16 | 0.0% |
| Greek | 1,488 | 0.2% |
| Guamanian / Chamorro | 77 | 0.0% |
| Guatemalan | 718 | 0.1% |
| Guyanese | 3 | 0.0% |
| Haitian | 80 | 0.0% |
| Honduran | 124 | 0.0% |
| Hungarian | 4,624 | 0.6% |
| Icelander | 42 | 0.0% |
| Indian (Asian) | 1,031 | 0.2% |
| Indonesian | 22 | 0.0% |
| Inupiat | 23 | 0.0% |
| Iranian | 60 | 0.0% |
| Iraqi | 230 | 0.0% |
| Irish | 77,040 | 10.9% |
| Iroquois | 308 | 0.0% |
| Israeli | 30 | 0.0% |
| Italian | 18,497 | 2.6% |
| Jamaican | 635 | 0.1% |
| Japanese | 16 | 0.0% |
| Jordanian | 20 | 0.0% |
| Kenyan | 22 | 0.0% |
| Kiowa | 3 | 0.0% |
| Korean | 1,721 | 0.2% |
| Laotian | 51 | 0.0% |
| Latvian | 209 | 0.0% |
| Lebanese | 663 | 0.1% |
| Liberian | 18 | 0.0% |
| Lithuanian | 2,404 | 0.3% |
| Lumbee | 46 | 0.0% |
| Luxembourger | 63 | 0.0% |
| Macedonian | 63 | 0.0% |
| Malaysian | 84 | 0.0% |
| Maltese | 140 | 0.0% |
| Menominee | 6 | 0.0% |
| Mexican | 22,887 | 3.2% |
| Mexican American Indian | 100 | 0.0% |
| Mongolian | 19 | 0.0% |
| Moroccan | 39 | 0.0% |
| Native Hawaiian | 240 | 0.0% |
| Navajo | 164 | 0.0% |
| Nicaraguan | 74 | 0.0% |
| Nigerian | 64 | 0.0% |
| Northern European | 1,210 | 0.2% |
| Norwegian | 9,523 | 1.3% |
| Okinawan | 11 | 0.0% |
| Osage | 6 | 0.0% |
| Ottawa | 2,940 | 0.4% |
| Pakistani | 136 | 0.0% |
| Palestinian | 49 | 0.0% |
| Panamanian | 98 | 0.0% |
| Paraguayan | 4 | 0.0% |
| Pennsylvania German | 493 | 0.1% |
| Peruvian | 95 | 0.0% |
| Pima | 4 | 0.0% |
| Polish | 48,621 | 6.9% |
| Portuguese | 321 | 0.1% |
| Potawatomi | 541 | 0.1% |
| Pueblo | 20 | 0.0% |
| Puerto Rican | 2,264 | 0.3% |
| Romanian | 581 | 0.1% |
| Russian | 2,052 | 0.3% |
| Salvadoran | 343 | 0.1% |
| Samoan | 355 | 0.1% |
| Scandinavian | 2,841 | 0.4% |
| Scotch-Irish | 4,987 | 0.7% |
| Scottish | 16,850 | 2.4% |
| Seminole | 102 | 0.0% |
| Serbian | 199 | 0.0% |
| Shoshone | 2 | 0.0% |
| Sioux | 342 | 0.1% |
| Slavic | 452 | 0.1% |
| Slovak | 1,376 | 0.2% |
| Slovene | 303 | 0.0% |
| South African | 4 | 0.0% |
| South American | 493 | 0.1% |
| South American Indian | 62 | 0.0% |
| Spaniard | 537 | 0.1% |
| Spanish | 367 | 0.1% |
| Spanish American | 60 | 0.0% |
| Sri Lankan | 399 | 0.1% |
| Subsaharan African | 1,463 | 0.2% |
| Swedish | 16,820 | 2.4% |
| Swiss | 2,213 | 0.3% |
| Syrian | 229 | 0.0% |
| Thai | 1,002 | 0.1% |
| Tlingit-Haida | 45 | 0.0% |
| Tohono O'Odham | 3 | 0.0% |
| Tongan | 8 | 0.0% |
| Trinidadian and Tobagonian | 43 | 0.0% |
| Turkish | 91 | 0.0% |
| Ukrainian | 1,993 | 0.3% |
| Ute | 1 | 0.0% |
| Venezuelan | 29 | 0.0% |
| Vietnamese | 95 | 0.0% |
| Welsh | 3,421 | 0.5% |
| West Indian | 18 | 0.0% |
| Yaqui | 6 | 0.0% |
| Yugoslavian | 488 | 0.1% |
| Yup'ik | 43 | 0.0% |
| Zimbabwean | 39 | 0.0% | View All 172 Rows |
Immigrants in Area Code 231
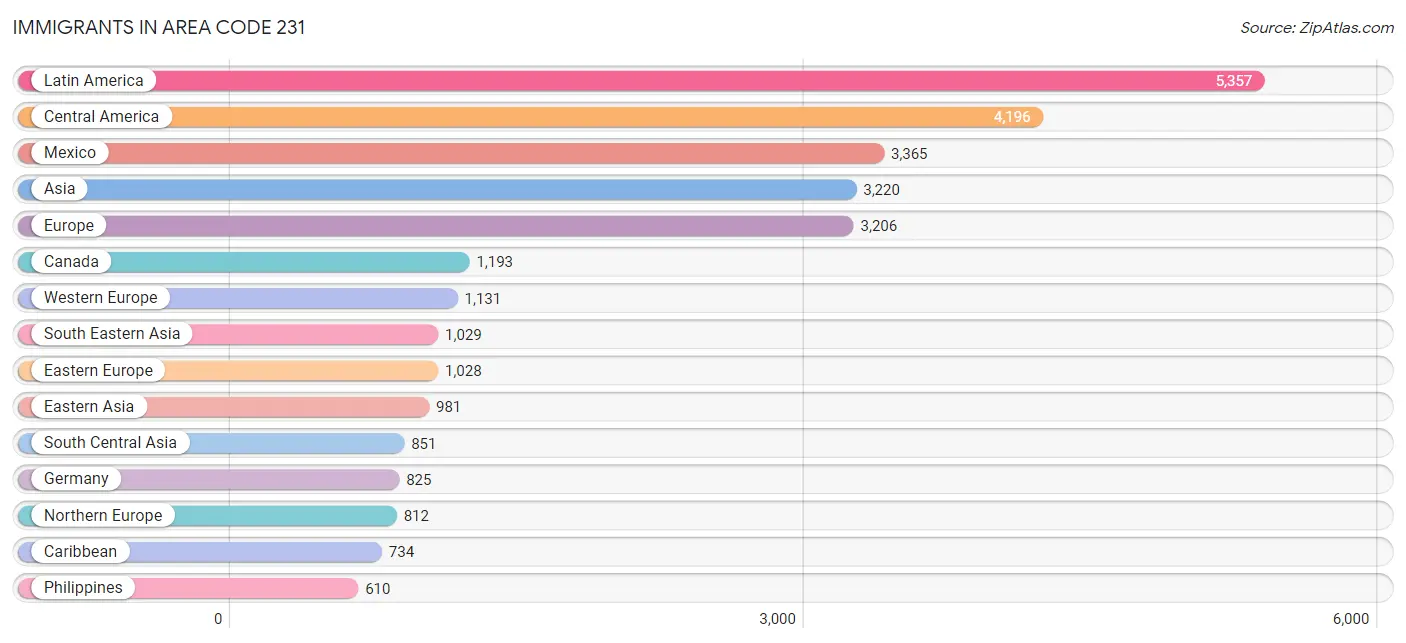
The most numerous immigrant groups reported in Area Code 231 came from Latin America (5,357 | 0.7%), Central America (4,196 | 0.6%), Mexico (3,365 | 0.5%), Asia (3,220 | 0.4%), and Europe (3,206 | 0.4%), together accounting for 2.7% of all Area Code 231 residents.
| Immigration Origin | # Population | % Population |
| Afghanistan | 9 | 0.0% |
| Africa | 405 | 0.1% |
| Albania | 11 | 0.0% |
| Argentina | 66 | 0.0% |
| Asia | 3,220 | 0.4% |
| Australia | 64 | 0.0% |
| Austria | 62 | 0.0% |
| Bahamas | 13 | 0.0% |
| Bangladesh | 90 | 0.0% |
| Belarus | 27 | 0.0% |
| Belgium | 26 | 0.0% |
| Bolivia | 10 | 0.0% |
| Bosnia and Herzegovina | 34 | 0.0% |
| Brazil | 128 | 0.0% |
| Bulgaria | 51 | 0.0% |
| Cambodia | 6 | 0.0% |
| Cameroon | 28 | 0.0% |
| Canada | 1,193 | 0.2% |
| Caribbean | 734 | 0.1% |
| Central America | 4,196 | 0.6% |
| Chile | 31 | 0.0% |
| China | 297 | 0.0% |
| Colombia | 63 | 0.0% |
| Congo | 3 | 0.0% |
| Costa Rica | 82 | 0.0% |
| Croatia | 7 | 0.0% |
| Cuba | 133 | 0.0% |
| Czechoslovakia | 50 | 0.0% |
| Denmark | 21 | 0.0% |
| Dominican Republic | 45 | 0.0% |
| Eastern Africa | 198 | 0.0% |
| Eastern Asia | 981 | 0.1% |
| Eastern Europe | 1,028 | 0.1% |
| Ecuador | 47 | 0.0% |
| Egypt | 21 | 0.0% |
| El Salvador | 97 | 0.0% |
| England | 300 | 0.0% |
| Ethiopia | 99 | 0.0% |
| Europe | 3,206 | 0.4% |
| France | 84 | 0.0% |
| Germany | 825 | 0.1% |
| Ghana | 12 | 0.0% |
| Greece | 62 | 0.0% |
| Guatemala | 504 | 0.1% |
| Guyana | 11 | 0.0% |
| Haiti | 19 | 0.0% |
| Honduras | 62 | 0.0% |
| Hong Kong | 38 | 0.0% |
| Hungary | 13 | 0.0% |
| India | 579 | 0.1% |
| Indonesia | 54 | 0.0% |
| Iran | 41 | 0.0% |
| Iraq | 183 | 0.0% |
| Ireland | 60 | 0.0% |
| Israel | 17 | 0.0% |
| Italy | 96 | 0.0% |
| Jamaica | 474 | 0.1% |
| Japan | 93 | 0.0% |
| Jordan | 19 | 0.0% |
| Kazakhstan | 4 | 0.0% |
| Kenya | 56 | 0.0% |
| Korea | 591 | 0.1% |
| Laos | 47 | 0.0% |
| Latin America | 5,357 | 0.7% |
| Latvia | 48 | 0.0% |
| Lebanon | 43 | 0.0% |
| Liberia | 4 | 0.0% |
| Lithuania | 23 | 0.0% |
| Malaysia | 27 | 0.0% |
| Mexico | 3,365 | 0.5% |
| Middle Africa | 101 | 0.0% |
| Morocco | 13 | 0.0% |
| Nepal | 16 | 0.0% |
| Netherlands | 131 | 0.0% |
| Nicaragua | 19 | 0.0% |
| Nigeria | 14 | 0.0% |
| North Macedonia | 10 | 0.0% |
| Northern Africa | 49 | 0.0% |
| Northern Europe | 812 | 0.1% |
| Norway | 19 | 0.0% |
| Oceania | 81 | 0.0% |
| Pakistan | 3 | 0.0% |
| Panama | 67 | 0.0% |
| Peru | 24 | 0.0% |
| Philippines | 610 | 0.1% |
| Poland | 159 | 0.0% |
| Romania | 100 | 0.0% |
| Russia | 68 | 0.0% |
| Saudi Arabia | 31 | 0.0% |
| Scotland | 68 | 0.0% |
| Serbia | 32 | 0.0% |
| Sierra Leone | 1 | 0.0% |
| Singapore | 36 | 0.0% |
| South Africa | 25 | 0.0% |
| South America | 427 | 0.1% |
| South Central Asia | 851 | 0.1% |
| South Eastern Asia | 1,029 | 0.1% |
| Southern Europe | 235 | 0.0% |
| Spain | 74 | 0.0% |
| Sri Lanka | 100 | 0.0% |
| Sweden | 77 | 0.0% |
| Switzerland | 2 | 0.0% |
| Syria | 18 | 0.0% |
| Taiwan | 26 | 0.0% |
| Thailand | 100 | 0.0% |
| Trinidad and Tobago | 27 | 0.0% |
| Turkey | 26 | 0.0% |
| Ukraine | 373 | 0.1% |
| Uzbekistan | 1 | 0.0% |
| Venezuela | 35 | 0.0% |
| Vietnam | 127 | 0.0% |
| Western Africa | 31 | 0.0% |
| Western Asia | 351 | 0.1% |
| Western Europe | 1,131 | 0.2% |
| Yemen | 9 | 0.0% |
| Zaire | 57 | 0.0% |
| Zimbabwe | 36 | 0.0% | View All 117 Rows |
Sex and Age in Area Code 231
Sex and Age in Area Code 231
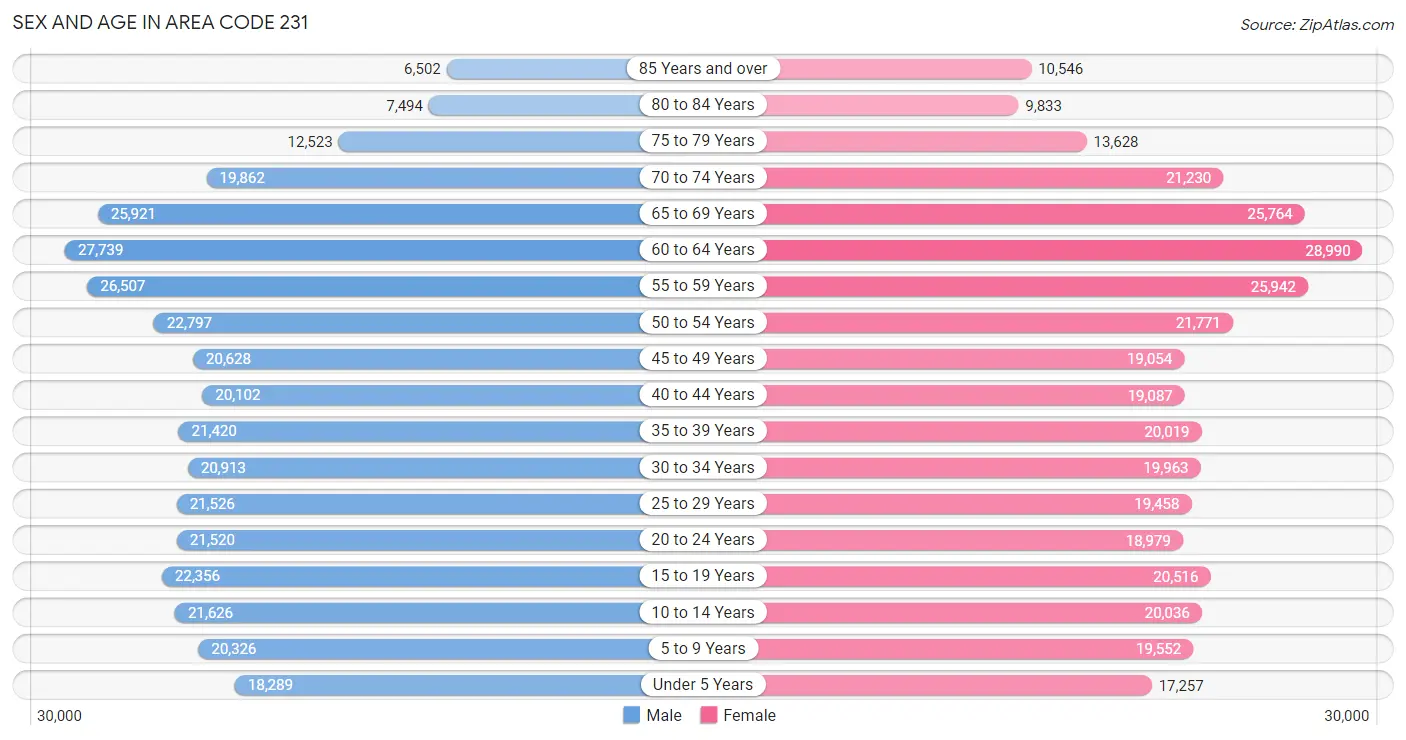
The most populous age groups in Area Code 231 are 60 to 64 Years (27,739 | 7.7%) for men and 60 to 64 Years (28,990 | 8.2%) for women.
| Age Bracket | Male | Female |
| Under 5 Years | 18,289 (5.1%) | 17,257 (4.9%) |
| 5 to 9 Years | 20,326 (5.7%) | 19,552 (5.6%) |
| 10 to 14 Years | 21,626 (6.0%) | 20,036 (5.7%) |
| 15 to 19 Years | 22,356 (6.2%) | 20,516 (5.8%) |
| 20 to 24 Years | 21,520 (6.0%) | 18,979 (5.4%) |
| 25 to 29 Years | 21,526 (6.0%) | 19,458 (5.5%) |
| 30 to 34 Years | 20,913 (5.8%) | 19,963 (5.7%) |
| 35 to 39 Years | 21,420 (6.0%) | 20,019 (5.7%) |
| 40 to 44 Years | 20,102 (5.6%) | 19,087 (5.4%) |
| 45 to 49 Years | 20,628 (5.8%) | 19,054 (5.4%) |
| 50 to 54 Years | 22,797 (6.4%) | 21,771 (6.2%) |
| 55 to 59 Years | 26,507 (7.4%) | 25,942 (7.4%) |
| 60 to 64 Years | 27,739 (7.7%) | 28,990 (8.2%) |
| 65 to 69 Years | 25,921 (7.2%) | 25,764 (7.3%) |
| 70 to 74 Years | 19,862 (5.6%) | 21,230 (6.0%) |
| 75 to 79 Years | 12,523 (3.5%) | 13,628 (3.9%) |
| 80 to 84 Years | 7,494 (2.1%) | 9,833 (2.8%) |
| 85 Years and over | 6,502 (1.8%) | 10,546 (3.0%) |
| Total | 358,051 (100.0%) | 351,625 (100.0%) |
Families and Households in Area Code 231
Median Family Size in Area Code 231
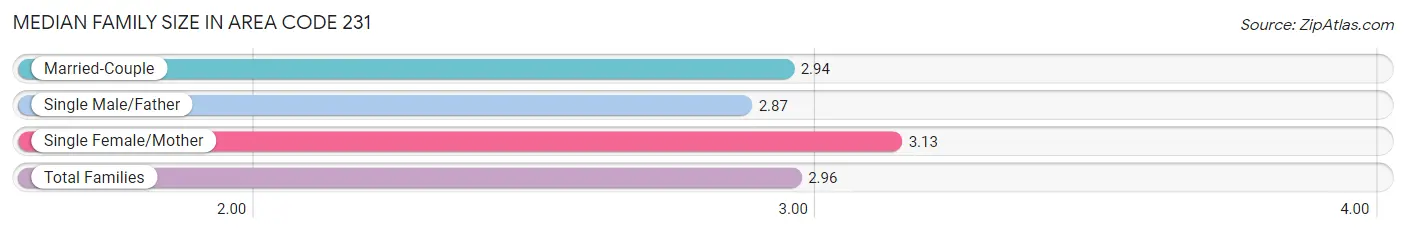
The median family size in Area Code 231 is 2.96 persons per family, with single female/mother families (28,196 | 15.1%) accounting for the largest median family size of 3.13471 persons per family. On the other hand, single male/father families (13,888 | 7.4%) represent the smallest median family size with 2.87 persons per family.
| Family Type | # Families | Family Size |
| Married-Couple | 144,433 (77.4%) | 2.94 |
| Single Male/Father | 13,888 (7.4%) | 2.87 |
| Single Female/Mother | 28,196 (15.1%) | 3.13 |
| Total Families | 186,517 (100.0%) | 2.96 |
Median Household Size in Area Code 231
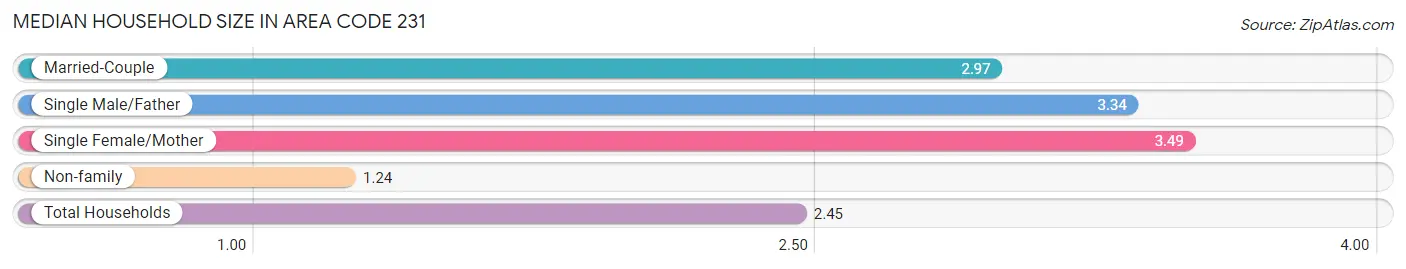
The median household size in Area Code 231 is 2.45 persons per household, with single female/mother households (28,196 | 10.0%) accounting for the largest median household size of 3.48869 persons per household. non-family households (96,800 | 34.2%) represent the smallest median household size with 1.24 persons per household.
| Household Type | # Households | Household Size |
| Married-Couple | 144,433 (51.0%) | 2.97 |
| Single Male/Father | 13,888 (4.9%) | 3.34 |
| Single Female/Mother | 28,196 (10.0%) | 3.49 |
| Non-family | 96,800 (34.2%) | 1.24 |
| Total Households | 283,317 (100.0%) | 2.45 |
Household Size by Marriage Status in Area Code 231
Out of a total of 283,317 households in Area Code 231, 186,517 (65.8%) are family households, while 96,800 (34.2%) are nonfamily households. The most numerous type of family households are 2-person households, comprising 96,441, and the most common type of nonfamily households are 1-person households, comprising 77,610.
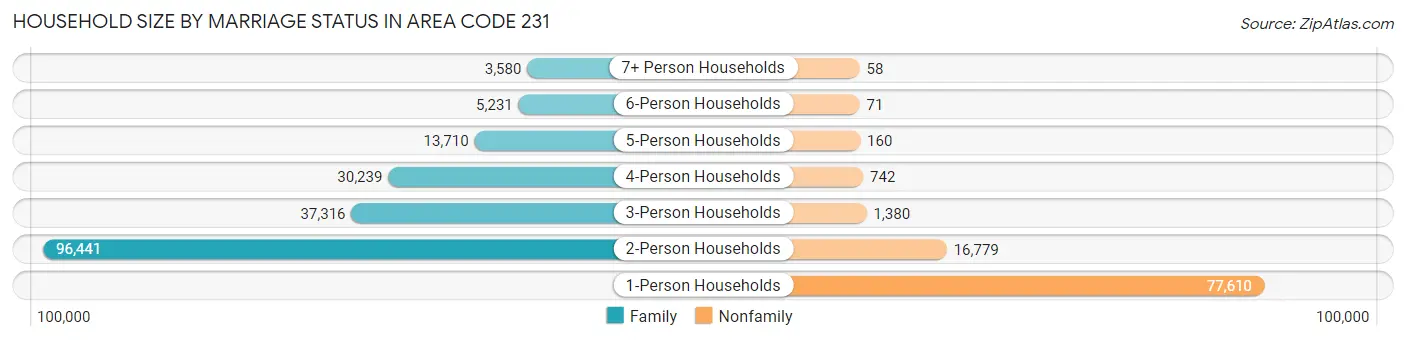
| Household Size | Family Households | Nonfamily Households |
| 1-Person Households | - | 77,610 (27.4%) |
| 2-Person Households | 96,441 (34.0%) | 16,779 (5.9%) |
| 3-Person Households | 37,316 (13.2%) | 1,380 (0.5%) |
| 4-Person Households | 30,239 (10.7%) | 742 (0.3%) |
| 5-Person Households | 13,710 (4.8%) | 160 (0.1%) |
| 6-Person Households | 5,231 (1.8%) | 71 (0.0%) |
| 7+ Person Households | 3,580 (1.3%) | 58 (0.0%) |
| Total | 186,517 (65.8%) | 96,800 (34.2%) |
Female Fertility in Area Code 231
Fertility by Age in Area Code 231
Average fertility rate in Area Code 231 is 59.1 births per 1,000 women. Women in the age bracket of 20 to 34 years have the highest fertility rate with 118.8 births per 1,000 women. Women in the age bracket of 20 to 34 years acount for 77.4% of all women with births.
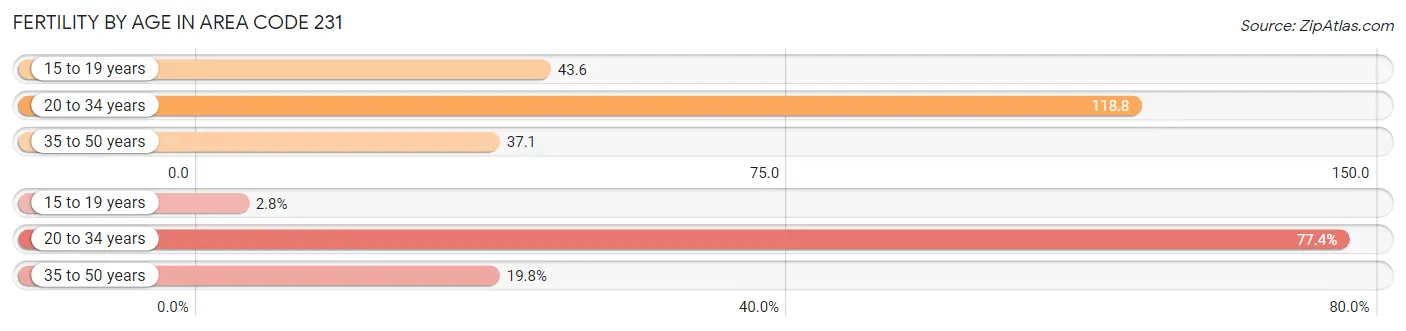
| Age Bracket | Women with Births | Births / 1,000 Women |
| 15 to 19 years | 187 (2.8%) | 43.6 |
| 20 to 34 years | 5,239 (77.4%) | 118.8 |
| 35 to 50 years | 1,340 (19.8%) | 37.1 |
| Total | 6,766 (100.0%) | 59.1 |
Fertility by Age by Marriage Status in Area Code 231
62.5% of women with births (6,766) in Area Code 231 are married. The highest percentage of unmarried women with births falls into 15 to 19 years age bracket with 100.0% of them unmarried at the time of birth, while the lowest percentage of unmarried women with births belong to 20 to 34 years age bracket with 40.6% of them unmarried.
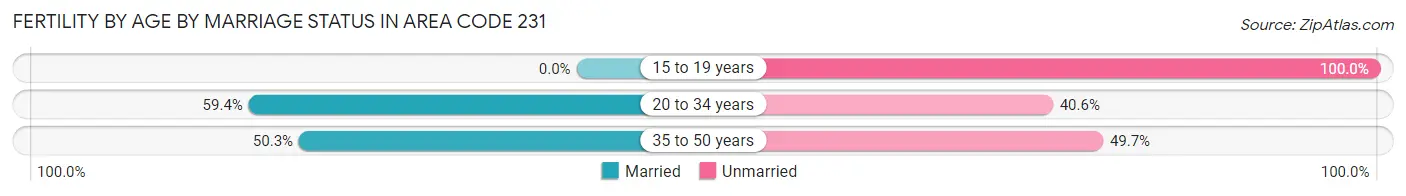
| Age Bracket | Married | Unmarried |
| 15 to 19 years | 0 (0.0%) | 187 (100.0%) |
| 20 to 34 years | 3,112 (59.4%) | 2,127 (40.6%) |
| 35 to 50 years | 674 (50.3%) | 666 (49.7%) |
| Total | 4,226 (62.5%) | 2,540 (37.5%) |
Fertility by Education in Area Code 231
Average fertility rate in Area Code 231 is 59.1 births per 1,000 women. Women with the education attainment of graduate degree have the highest fertility rate of 154.1 births per 1,000 women, while women with the education attainment of less than high school have the lowest fertility at 66.0 births per 1,000 women. Women with the education attainment of college or associate's degree represent 38.8% of all women with births.
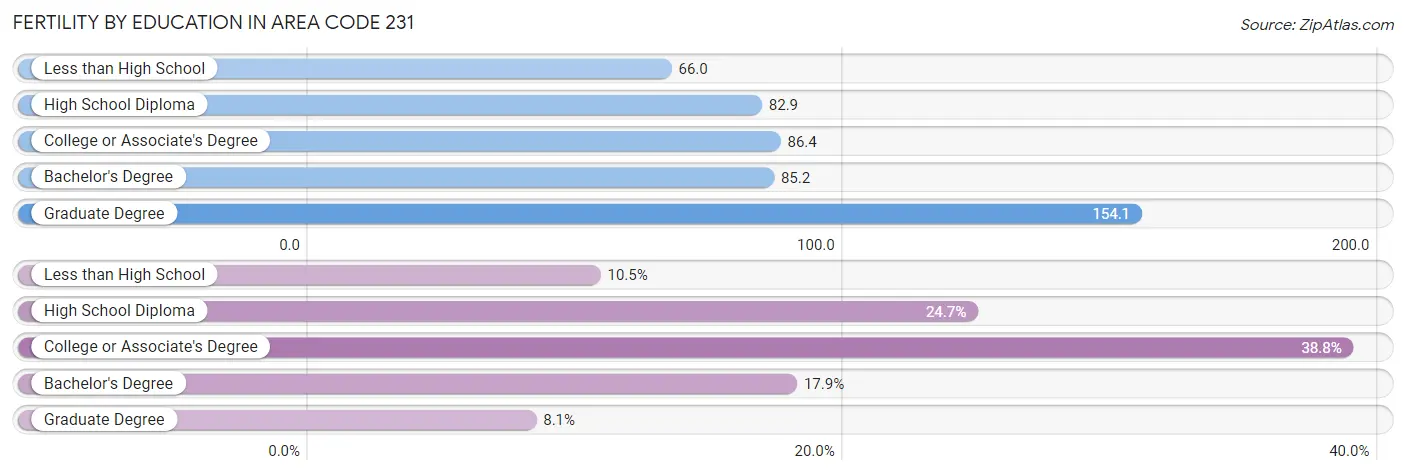
| Educational Attainment | Women with Births | Births / 1,000 Women |
| Less than High School | 713 (10.5%) | 66.0 |
| High School Diploma | 1,670 (24.7%) | 82.9 |
| College or Associate's Degree | 2,622 (38.8%) | 86.4 |
| Bachelor's Degree | 1,211 (17.9%) | 85.2 |
| Graduate Degree | 550 (8.1%) | 154.1 |
| Total | 6,766 (100.0%) | 59.1 |
Fertility by Education by Marriage Status in Area Code 231
37.5% of women with births in Area Code 231 are unmarried. Women with the educational attainment of graduate degree are most likely to be married with 59.1% of them married at childbirth, while women with the educational attainment of less than high school are least likely to be married with 89.1% of them unmarried at childbirth.
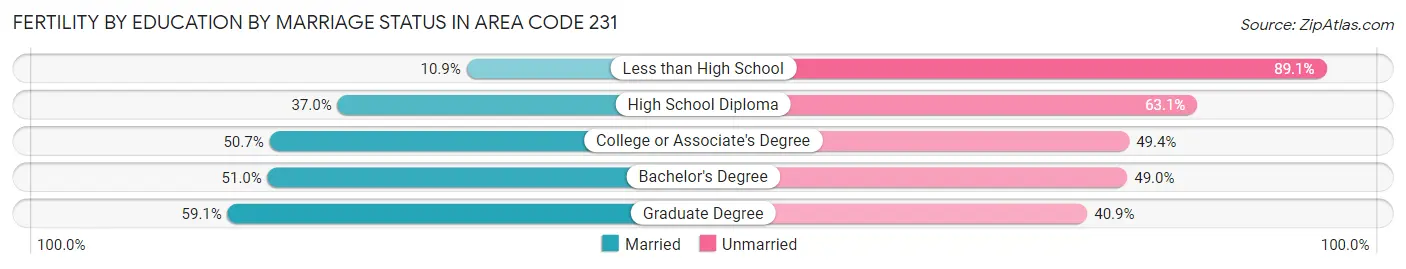
| Educational Attainment | Married | Unmarried |
| Less than High School | 78 (10.9%) | 635 (89.1%) |
| High School Diploma | 617 (36.9%) | 1,053 (63.0%) |
| College or Associate's Degree | 1,328 (50.6%) | 1,294 (49.3%) |
| Bachelor's Degree | 618 (51.0%) | 593 (49.0%) |
| Graduate Degree | 325 (59.1%) | 225 (40.9%) |
| Total | 4,226 (62.5%) | 2,540 (37.5%) |
Employment Characteristics in Area Code 231
Employment by Class of Employer in Area Code 231
Among the 309,779 employed individuals in Area Code 231, private company employees (211,240 | 68.2%), not-for-profit organizations (28,704 | 9.3%), and local government employees (22,164 | 7.1%) make up the most common classes of employment.
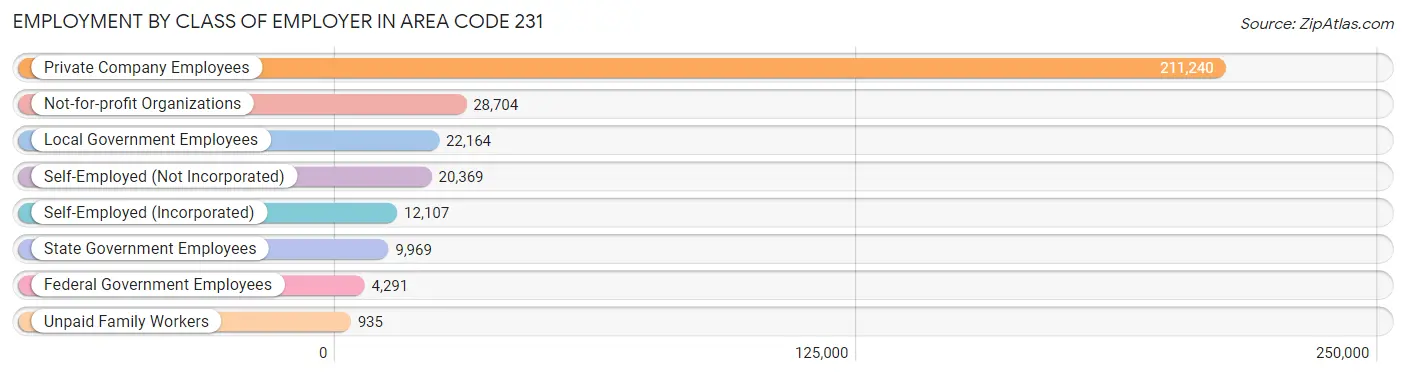
| Employer Class | # Employees | % Employees |
| Private Company Employees | 211,240 | 68.2% |
| Self-Employed (Incorporated) | 12,107 | 3.9% |
| Self-Employed (Not Incorporated) | 20,369 | 6.6% |
| Not-for-profit Organizations | 28,704 | 9.3% |
| Local Government Employees | 22,164 | 7.1% |
| State Government Employees | 9,969 | 3.2% |
| Federal Government Employees | 4,291 | 1.4% |
| Unpaid Family Workers | 935 | 0.3% |
| Total | 309,779 | 100.0% |
Employment Status by Age in Area Code 231
According to the labor force statistics for Area Code 231, out of the total population over 16 years of age (582,792), 54.5% or 317,913 individuals are in the labor force, with 5.7% or 18,057 of them unemployed. The age group with the highest labor force participation rate is 25 to 29 years, with 82.9% or 33,984 individuals in the labor force. Within the labor force, the 16 to 19 years age range has the highest percentage of unemployed individuals, with 1,848.7% or 276,917 of them being unemployed.
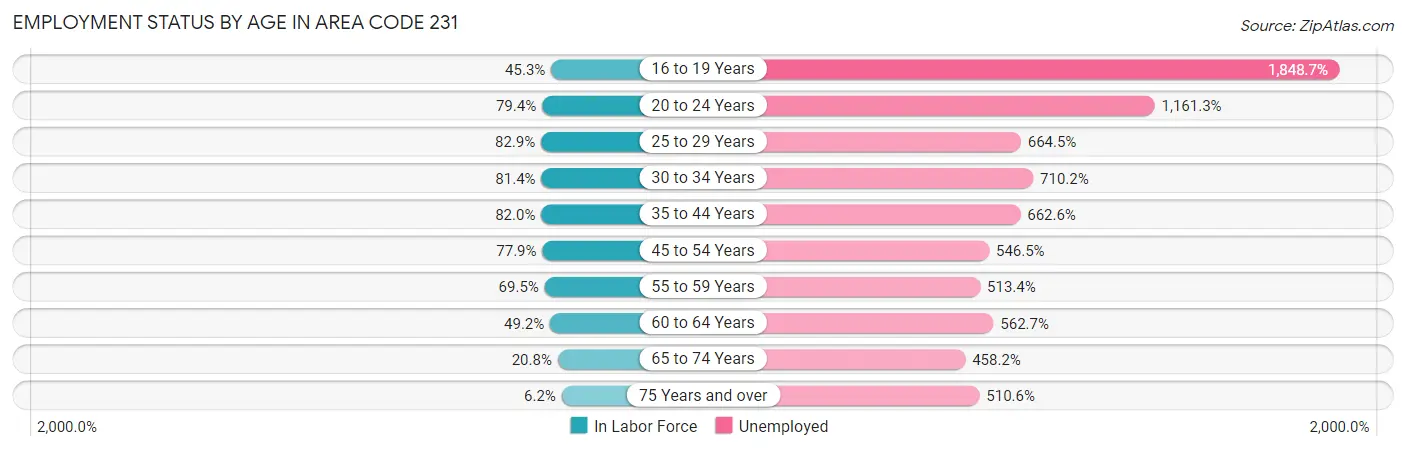
| Age Bracket | In Labor Force | Unemployed |
| 16 to 19 Years | 14,979 (45.3%) | 276,917 (1,848.7%) |
| 20 to 24 Years | 32,136 (79.3%) | 373,195 (1,161.3%) |
| 25 to 29 Years | 33,986 (82.9%) | 225,824 (664.5%) |
| 30 to 34 Years | 33,259 (81.4%) | 236,191 (710.2%) |
| 35 to 44 Years | 66,121 (82.0%) | 438,131 (662.6%) |
| 45 to 54 Years | 65,662 (77.9%) | 358,854 (546.5%) |
| 55 to 59 Years | 36,432 (69.5%) | 187,037 (513.4%) |
| 60 to 64 Years | 27,909 (49.2%) | 157,055 (562.7%) |
| 65 to 74 Years | 19,251 (20.7%) | 88,208 (458.2%) |
| 75 Years and over | 3,739 (6.2%) | 19,102 (510.6%) |
| Total | 317,936 (54.5%) | 18,048 (5.7%) |
Employment Status by Educational Attainment in Area Code 231
According to labor force statistics for Area Code 231, 72.6% of individuals (258,288) out of the total population between 25 and 64 years of age (355,916) are in the labor force, with 624.9% or 1,614,042 of them being unemployed. The group with the highest labor force participation rate are those with the educational attainment of bachelor's degree or higher, with 81.0% or 71,992 individuals in the labor force. Within the labor force, individuals with less than high school education have the highest percentage of unemployment, with 978.5% or 151,599 of them being unemployed.
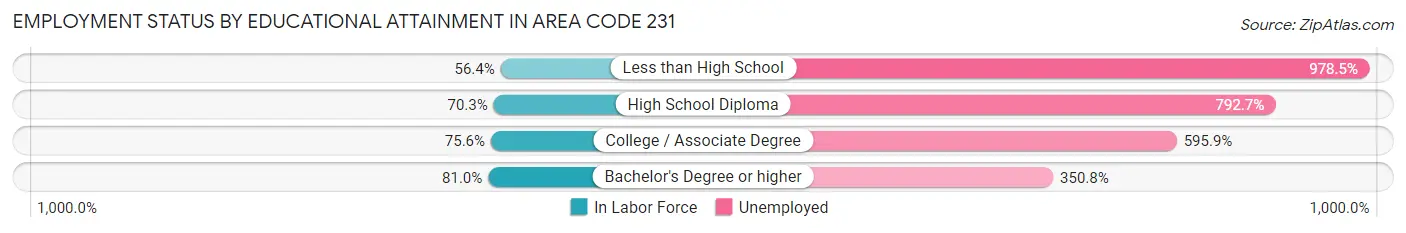
| Educational Attainment | In Labor Force | Unemployed |
| Less than High School | 15,494 (56.4%) | 268,696 (978.5%) |
| High School Diploma | 81,211 (70.3%) | 916,337 (792.7%) |
| College / Associate Degree | 93,699 (75.6%) | 738,797 (595.9%) |
| Bachelor's Degree or higher | 71,993 (81.0%) | 311,788 (350.8%) |
| Total | 258,293 (72.6%) | 2,224,119 (624.9%) |
Employment Occupations by Sex in Area Code 231
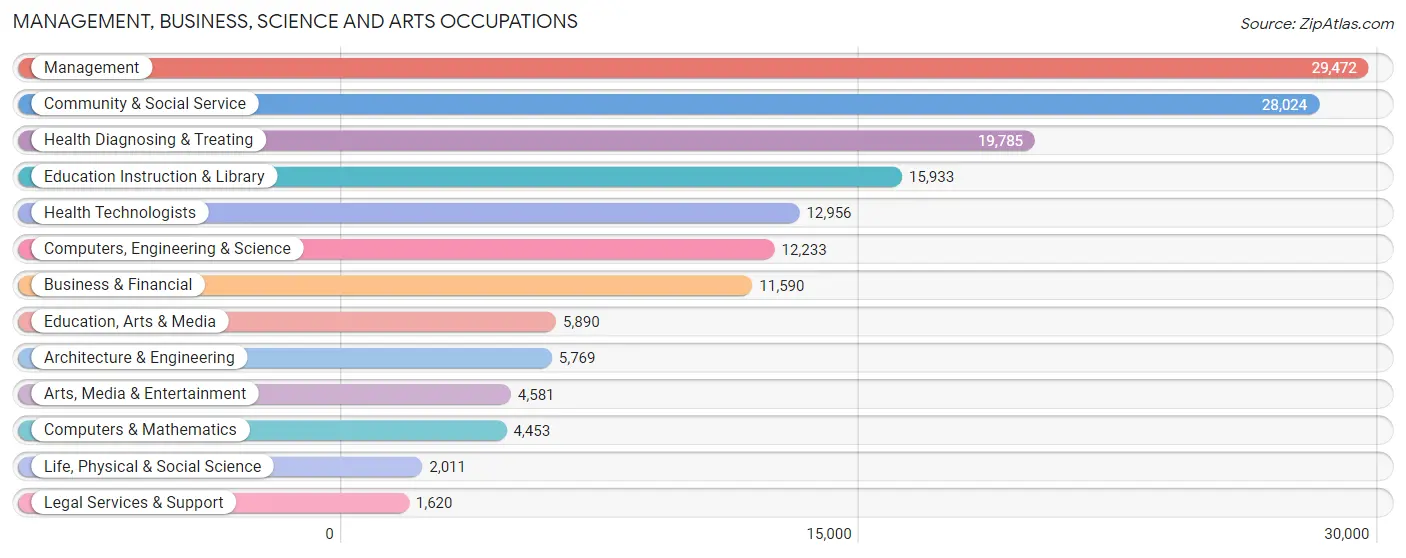
Management, Business, Science and Arts Occupations
The most common Management, Business, Science and Arts occupations in Area Code 231 are Management (29,472 | 9.3%), Community & Social Service (28,024 | 8.9%), Health Diagnosing & Treating (19,785 | 6.3%), Education Instruction & Library (15,933 | 5.1%), and Health Technologists (12,956 | 4.1%).
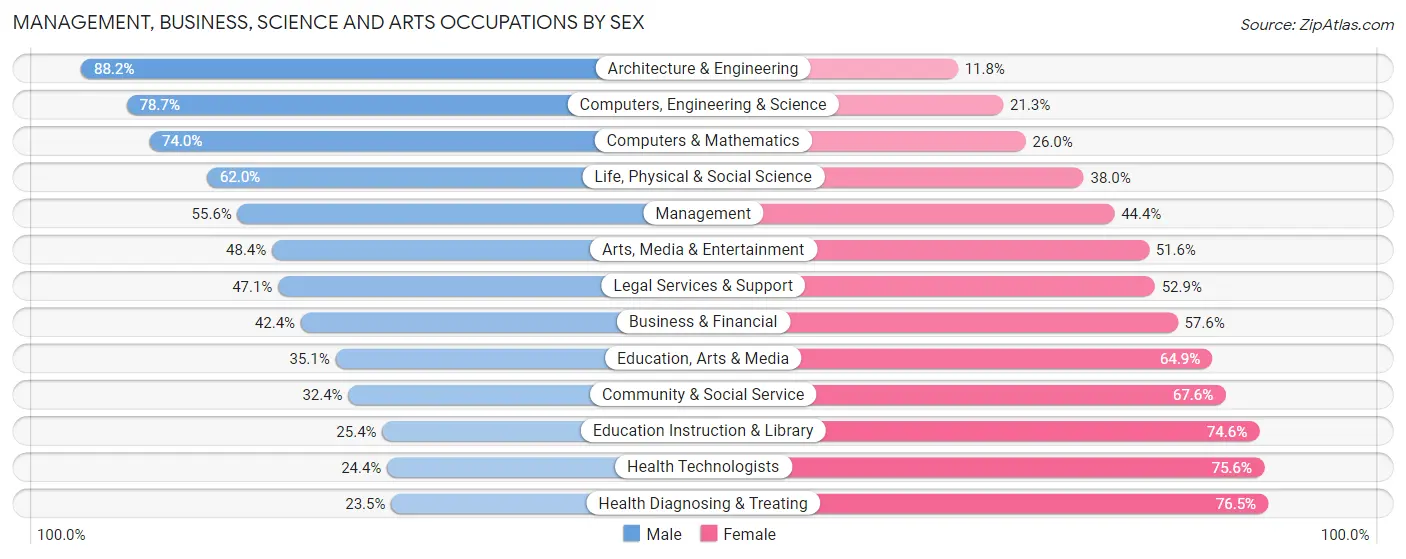
Management, Business, Science and Arts Occupations by Sex
Within the Management, Business, Science and Arts occupations in Area Code 231, the most male-oriented occupations are Architecture & Engineering (88.2%), Computers, Engineering & Science (78.7%), and Computers & Mathematics (74.0%), while the most female-oriented occupations are Health Diagnosing & Treating (76.5%), Health Technologists (75.6%), and Education Instruction & Library (74.6%).
| Occupation | Male | Female |
| Management | 16,375 (55.6%) | 13,097 (44.4%) |
| Business & Financial | 4,909 (42.4%) | 6,681 (57.6%) |
| Computers, Engineering & Science | 9,632 (78.7%) | 2,601 (21.3%) |
| Computers & Mathematics | 3,297 (74.0%) | 1,156 (26.0%) |
| Architecture & Engineering | 5,089 (88.2%) | 680 (11.8%) |
| Life, Physical & Social Science | 1,246 (62.0%) | 765 (38.0%) |
| Community & Social Service | 9,090 (32.4%) | 18,934 (67.6%) |
| Education, Arts & Media | 2,070 (35.1%) | 3,820 (64.9%) |
| Legal Services & Support | 763 (47.1%) | 857 (52.9%) |
| Education Instruction & Library | 4,041 (25.4%) | 11,892 (74.6%) |
| Arts, Media & Entertainment | 2,216 (48.4%) | 2,365 (51.6%) |
| Health Diagnosing & Treating | 4,649 (23.5%) | 15,136 (76.5%) |
| Health Technologists | 3,156 (24.4%) | 9,800 (75.6%) |
| Total (Category) | 44,655 (44.2%) | 56,449 (55.8%) |
| Total (Overall) | 166,910 (52.9%) | 148,810 (47.1%) |
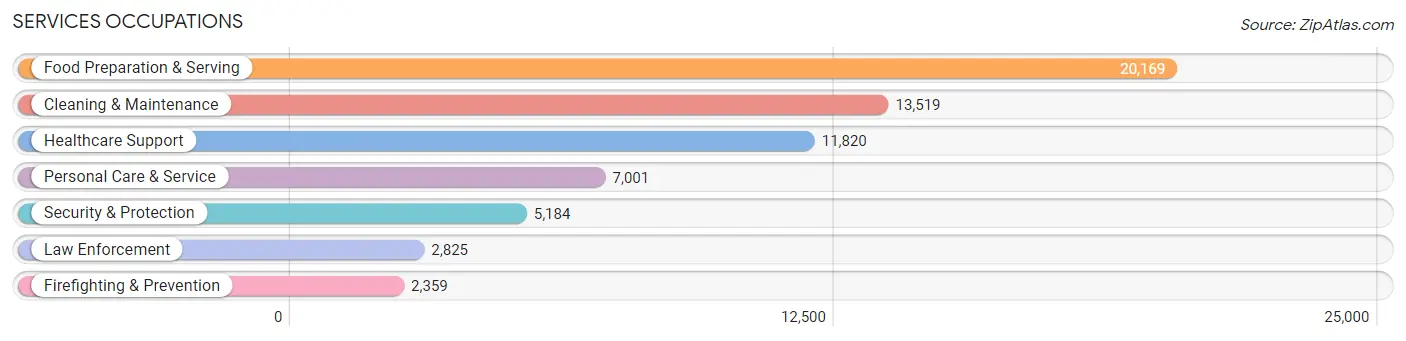
Services Occupations
The most common Services occupations in Area Code 231 are Food Preparation & Serving (20,169 | 6.4%), Cleaning & Maintenance (13,519 | 4.3%), Healthcare Support (11,820 | 3.7%), Personal Care & Service (7,001 | 2.2%), and Security & Protection (5,184 | 1.6%).
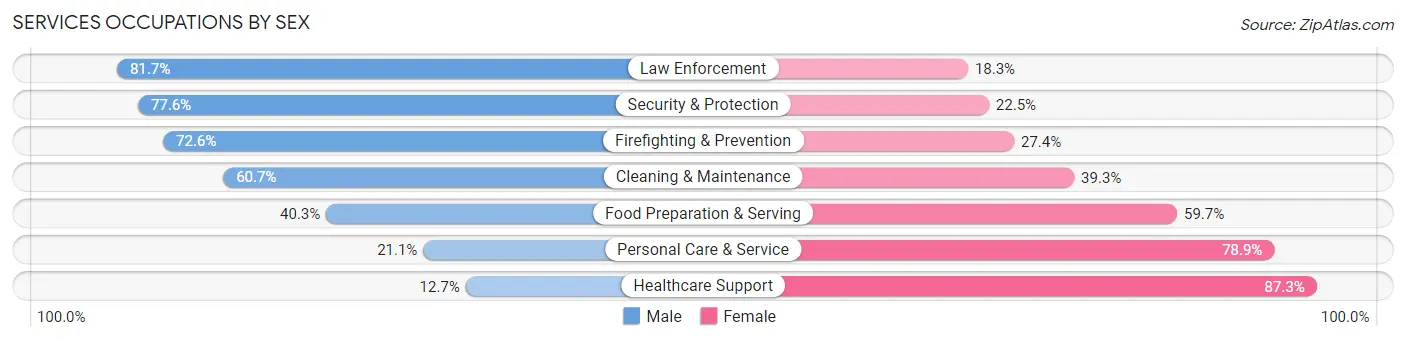
Services Occupations by Sex
Within the Services occupations in Area Code 231, the most male-oriented occupations are Law Enforcement (81.7%), Security & Protection (77.5%), and Firefighting & Prevention (72.6%), while the most female-oriented occupations are Healthcare Support (87.3%), Personal Care & Service (78.9%), and Food Preparation & Serving (59.7%).
| Occupation | Male | Female |
| Healthcare Support | 1,496 (12.7%) | 10,324 (87.3%) |
| Security & Protection | 4,020 (77.5%) | 1,164 (22.5%) |
| Firefighting & Prevention | 1,712 (72.6%) | 647 (27.4%) |
| Law Enforcement | 2,308 (81.7%) | 517 (18.3%) |
| Food Preparation & Serving | 8,127 (40.3%) | 12,042 (59.7%) |
| Cleaning & Maintenance | 8,202 (60.7%) | 5,317 (39.3%) |
| Personal Care & Service | 1,475 (21.1%) | 5,526 (78.9%) |
| Total (Category) | 23,320 (40.4%) | 34,373 (59.6%) |
| Total (Overall) | 166,910 (52.9%) | 148,810 (47.1%) |
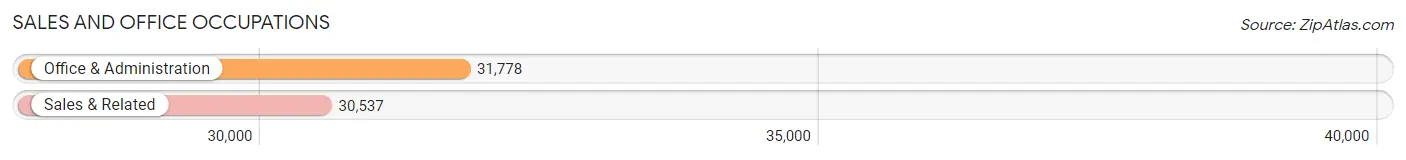
Sales and Office Occupations
The most common Sales and Office occupations in Area Code 231 are Office & Administration (31,778 | 10.1%), and Sales & Related (30,537 | 9.7%).
Sales and Office Occupations by Sex
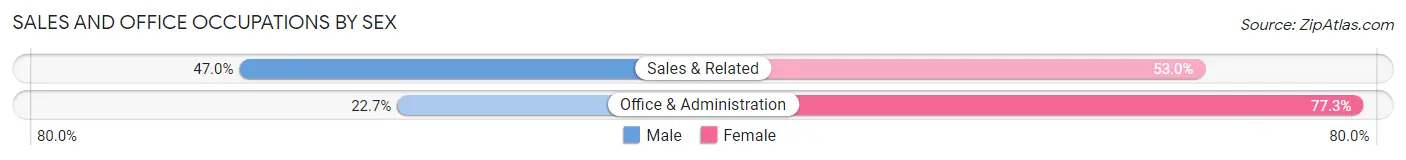
| Occupation | Male | Female |
| Sales & Related | 14,342 (47.0%) | 16,195 (53.0%) |
| Office & Administration | 7,207 (22.7%) | 24,571 (77.3%) |
| Total (Category) | 21,549 (34.6%) | 40,766 (65.4%) |
| Total (Overall) | 166,910 (52.9%) | 148,810 (47.1%) |
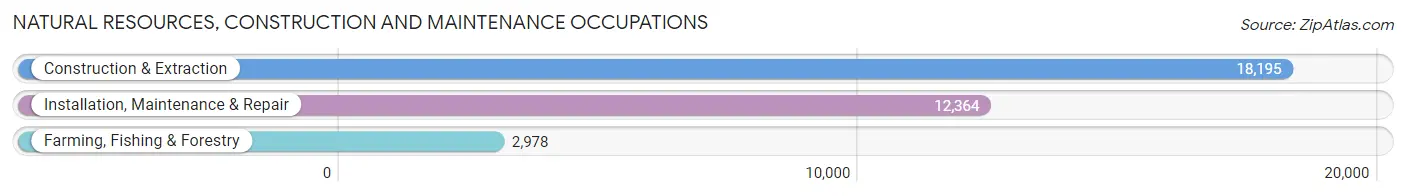
Natural Resources, Construction and Maintenance Occupations
The most common Natural Resources, Construction and Maintenance occupations in Area Code 231 are Construction & Extraction (18,195 | 5.8%), Installation, Maintenance & Repair (12,364 | 3.9%), and Farming, Fishing & Forestry (2,978 | 0.9%).
Natural Resources, Construction and Maintenance Occupations by Sex
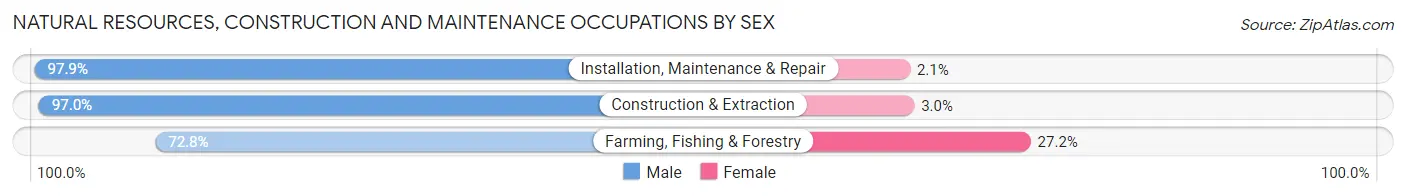
| Occupation | Male | Female |
| Farming, Fishing & Forestry | 2,168 (72.8%) | 810 (27.2%) |
| Construction & Extraction | 17,652 (97.0%) | 543 (3.0%) |
| Installation, Maintenance & Repair | 12,105 (97.9%) | 259 (2.1%) |
| Total (Category) | 31,925 (95.2%) | 1,612 (4.8%) |
| Total (Overall) | 166,910 (52.9%) | 148,810 (47.1%) |
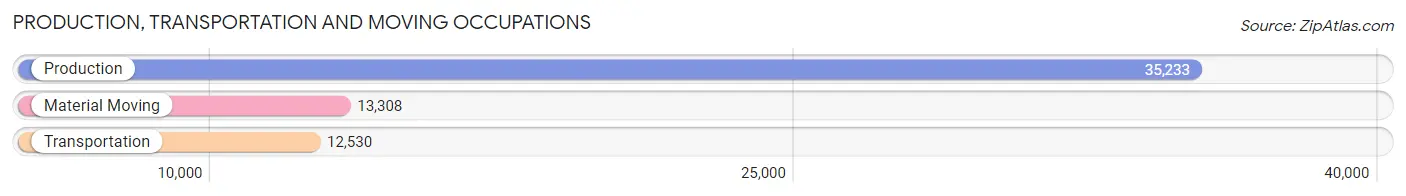
Production, Transportation and Moving Occupations
The most common Production, Transportation and Moving occupations in Area Code 231 are Production (35,233 | 11.2%), Material Moving (13,308 | 4.2%), and Transportation (12,530 | 4.0%).
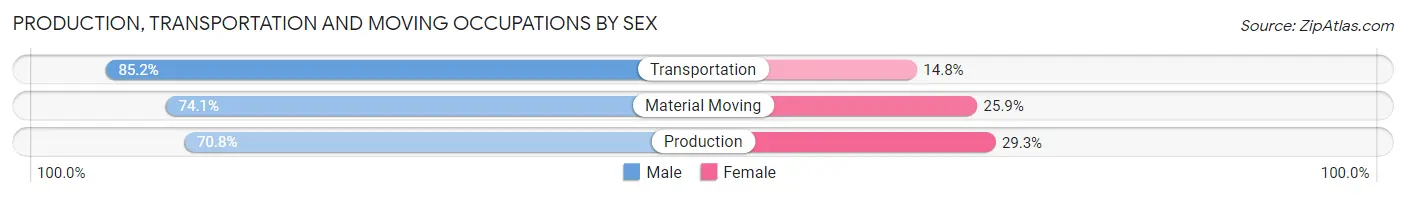
Production, Transportation and Moving Occupations by Sex
| Occupation | Male | Female |
| Production | 24,926 (70.8%) | 10,307 (29.2%) |
| Transportation | 10,671 (85.2%) | 1,859 (14.8%) |
| Material Moving | 9,864 (74.1%) | 3,444 (25.9%) |
| Total (Category) | 45,461 (74.4%) | 15,610 (25.6%) |
| Total (Overall) | 166,910 (52.9%) | 148,810 (47.1%) |
Employment Industries by Sex in Area Code 231
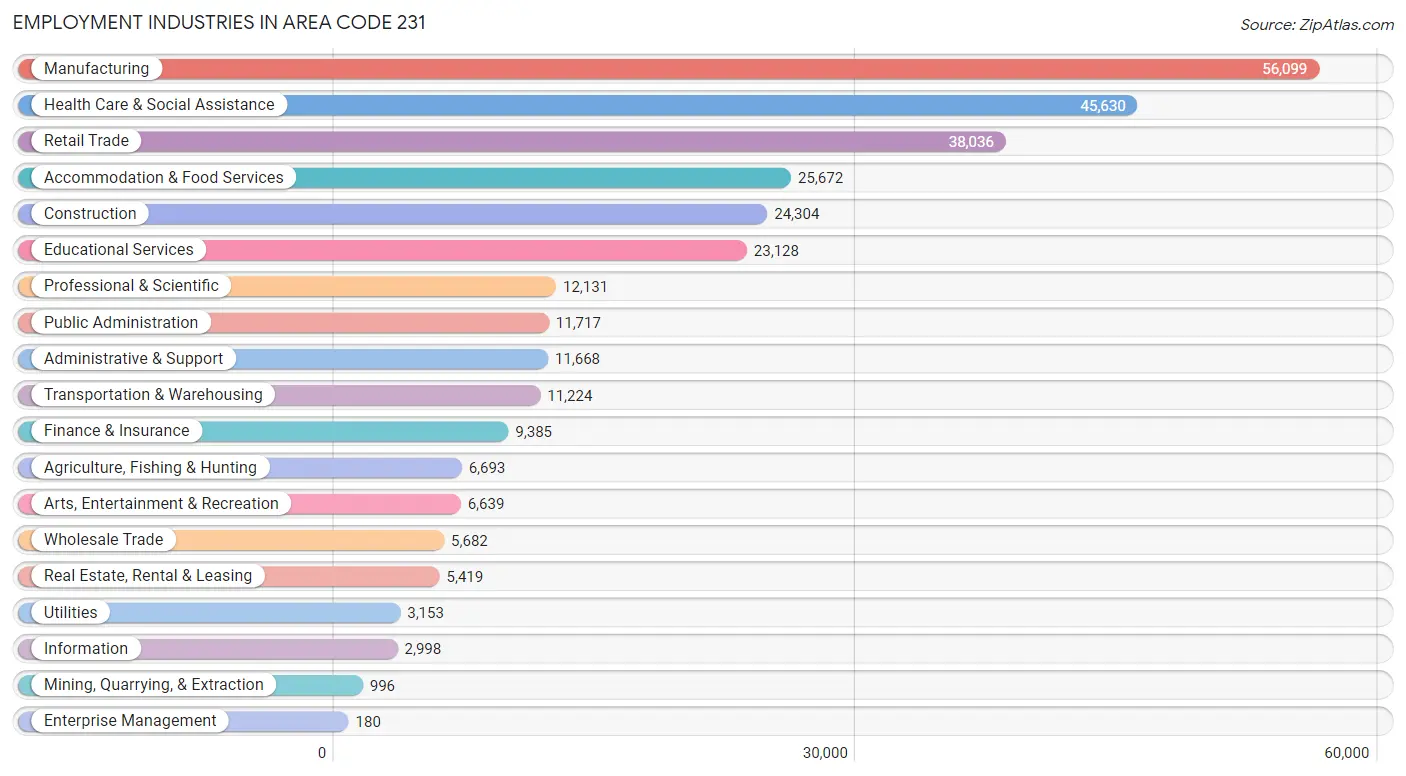
Employment Industries in Area Code 231
The major employment industries in Area Code 231 include Manufacturing (56,099 | 17.8%), Health Care & Social Assistance (45,630 | 14.4%), Retail Trade (38,036 | 12.0%), Accommodation & Food Services (25,672 | 8.1%), and Construction (24,304 | 7.7%).
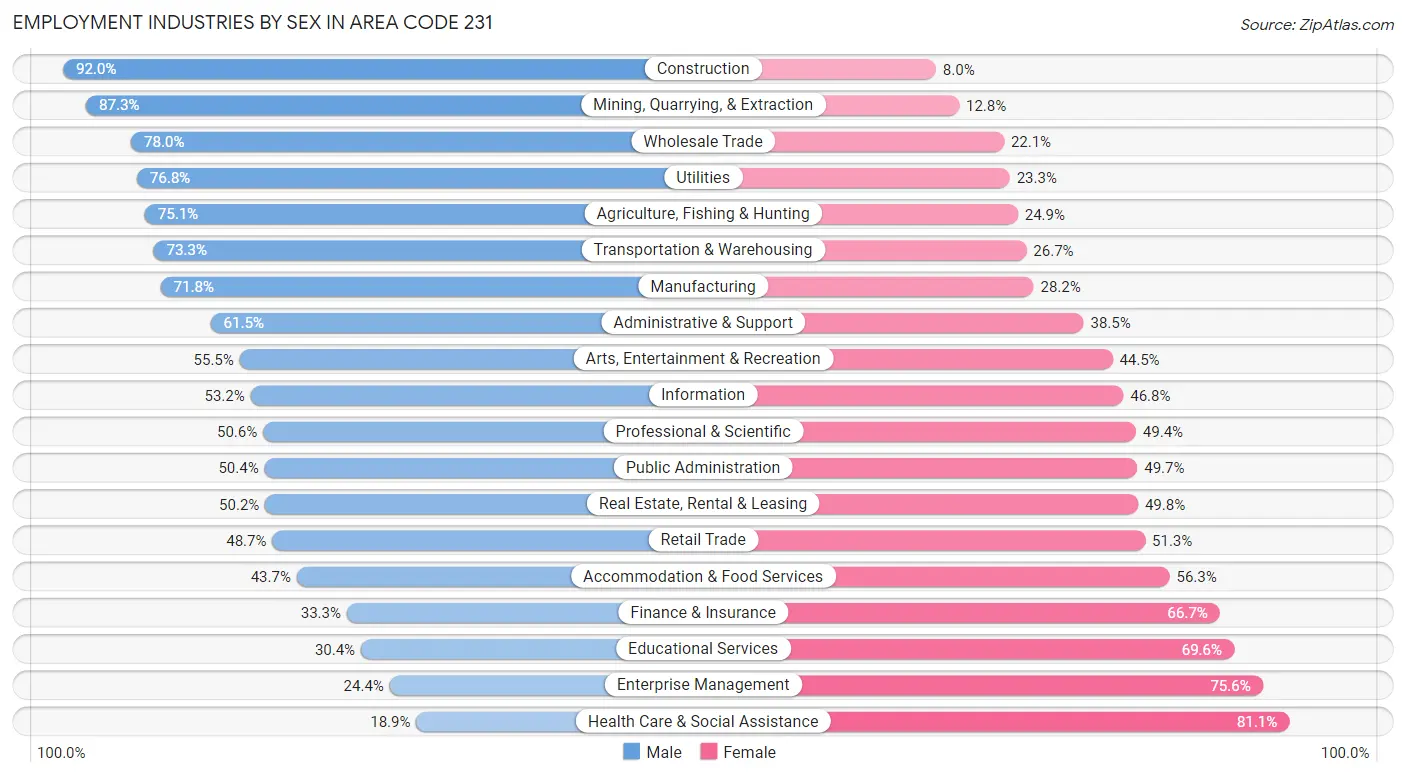
Employment Industries by Sex in Area Code 231
The Area Code 231 industries that see more men than women are Construction (92.0%), Mining, Quarrying, & Extraction (87.3%), and Wholesale Trade (77.9%), whereas the industries that tend to have a higher number of women are Health Care & Social Assistance (81.1%), Enterprise Management (75.6%), and Educational Services (69.6%).
| Industry | Male | Female |
| Agriculture, Fishing & Hunting | 5,026 (75.1%) | 1,667 (24.9%) |
| Mining, Quarrying, & Extraction | 869 (87.3%) | 127 (12.8%) |
| Construction | 22,368 (92.0%) | 1,936 (8.0%) |
| Manufacturing | 40,296 (71.8%) | 15,803 (28.2%) |
| Wholesale Trade | 4,429 (77.9%) | 1,253 (22.1%) |
| Retail Trade | 18,536 (48.7%) | 19,500 (51.3%) |
| Transportation & Warehousing | 8,227 (73.3%) | 2,997 (26.7%) |
| Utilities | 2,420 (76.7%) | 733 (23.3%) |
| Information | 1,596 (53.2%) | 1,402 (46.8%) |
| Finance & Insurance | 3,126 (33.3%) | 6,259 (66.7%) |
| Real Estate, Rental & Leasing | 2,721 (50.2%) | 2,698 (49.8%) |
| Professional & Scientific | 6,143 (50.6%) | 5,988 (49.4%) |
| Enterprise Management | 44 (24.4%) | 136 (75.6%) |
| Administrative & Support | 7,173 (61.5%) | 4,495 (38.5%) |
| Educational Services | 7,026 (30.4%) | 16,102 (69.6%) |
| Health Care & Social Assistance | 8,640 (18.9%) | 36,990 (81.1%) |
| Arts, Entertainment & Recreation | 3,684 (55.5%) | 2,955 (44.5%) |
| Accommodation & Food Services | 11,212 (43.7%) | 14,460 (56.3%) |
| Public Administration | 5,899 (50.3%) | 5,818 (49.6%) |
| Total | 166,910 (52.9%) | 148,810 (47.1%) |
Education in Area Code 231
School Enrollment in Area Code 231
The most common levels of schooling among the 143,623 students in Area Code 231 are high school (34,772 | 24.2%), middle school (32,060 | 22.3%), and elementary school (31,136 | 21.7%).
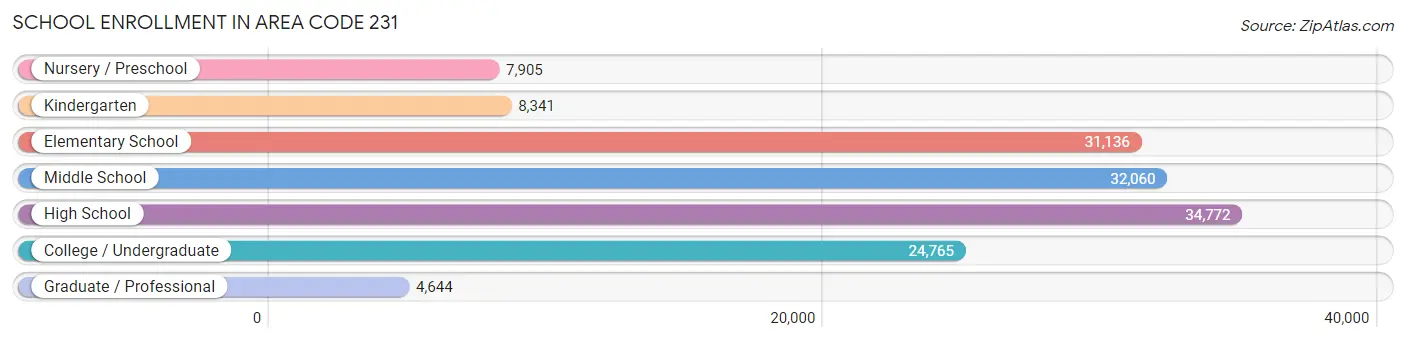
| School Level | # Students | % Students |
| Nursery / Preschool | 7,905 | 5.5% |
| Kindergarten | 8,341 | 5.8% |
| Elementary School | 31,136 | 21.7% |
| Middle School | 32,060 | 22.3% |
| High School | 34,772 | 24.2% |
| College / Undergraduate | 24,765 | 17.2% |
| Graduate / Professional | 4,644 | 3.2% |
| Total | 143,623 | 100.0% |
School Enrollment by Age by Funding Source in Area Code 231
Out of a total of 143,623 students who are enrolled in schools in Area Code 231, 19,599 (13.7%) attend a private institution, while the remaining 124,024 (86.4%) are enrolled in public schools. The age group of 35 years and over has the highest likelihood of being enrolled in private schools, with 1,544 (24.9% in the age bracket) enrolled. Conversely, the age group of 15 to 17 year olds has the lowest likelihood of being enrolled in a private school, with 23,231 (91.6% in the age bracket) attending a public institution.
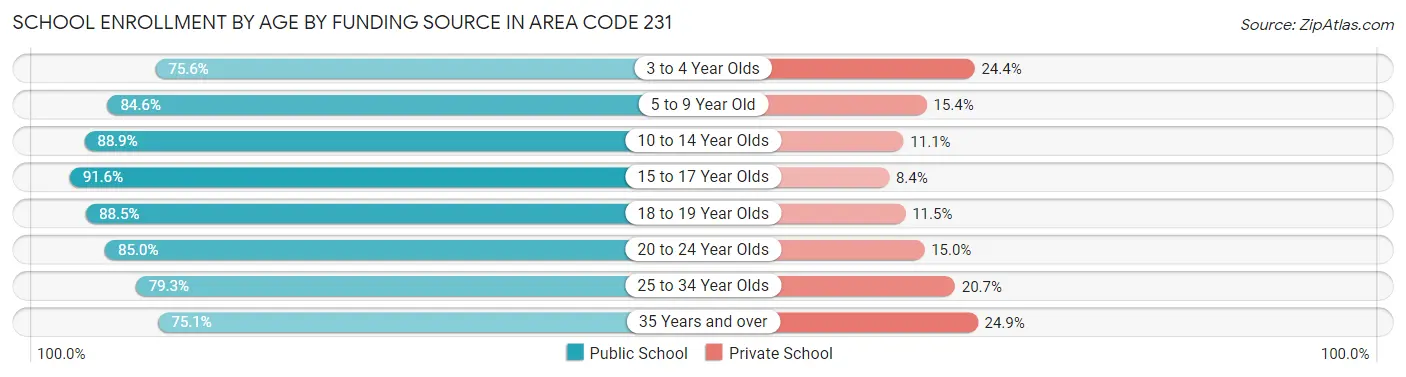
| Age Bracket | Public School | Private School |
| 3 to 4 Year Olds | 4,468 (75.6%) | 1,440 (24.4%) |
| 5 to 9 Year Old | 31,337 (84.6%) | 5,720 (15.4%) |
| 10 to 14 Year Olds | 35,621 (88.9%) | 4,462 (11.1%) |
| 15 to 17 Year Olds | 23,231 (91.6%) | 2,138 (8.4%) |
| 18 to 19 Year Olds | 9,567 (88.5%) | 1,239 (11.5%) |
| 20 to 24 Year Olds | 10,593 (85.0%) | 1,869 (15.0%) |
| 25 to 34 Year Olds | 4,556 (79.3%) | 1,189 (20.7%) |
| 35 Years and over | 4,649 (75.1%) | 1,544 (24.9%) |
| Total | 124,024 (86.4%) | 19,599 (13.7%) |
Educational Attainment by Field of Study in Area Code 231
Business (27,132 | 18.8%), education (25,790 | 17.8%), science & technology (17,227 | 11.9%), arts & humanities (11,327 | 7.8%), and bio, nature & agricultural (9,851 | 6.8%) are the most common fields of study among 144,454 individuals in Area Code 231 who have obtained a bachelor's degree or higher.
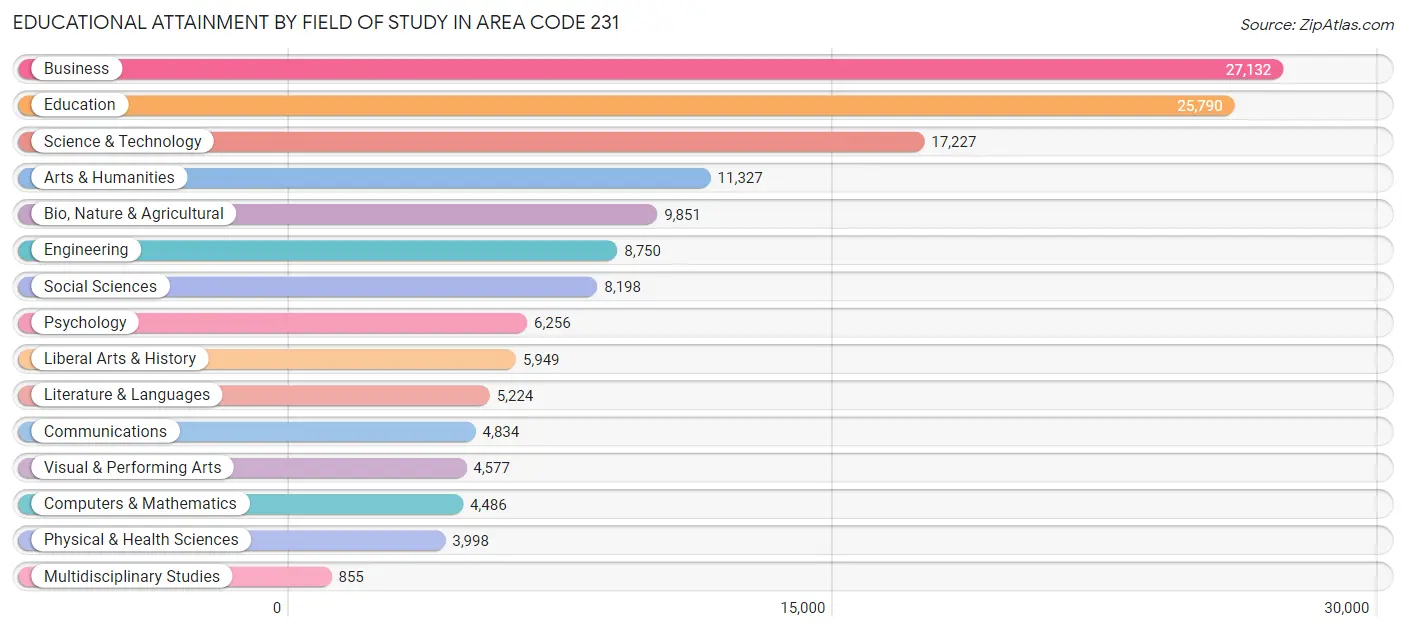
| Field of Study | # Graduates | % Graduates |
| Computers & Mathematics | 4,486 | 3.1% |
| Bio, Nature & Agricultural | 9,851 | 6.8% |
| Physical & Health Sciences | 3,998 | 2.8% |
| Psychology | 6,256 | 4.3% |
| Social Sciences | 8,198 | 5.7% |
| Engineering | 8,750 | 6.1% |
| Multidisciplinary Studies | 855 | 0.6% |
| Science & Technology | 17,227 | 11.9% |
| Business | 27,132 | 18.8% |
| Education | 25,790 | 17.8% |
| Literature & Languages | 5,224 | 3.6% |
| Liberal Arts & History | 5,949 | 4.1% |
| Visual & Performing Arts | 4,577 | 3.2% |
| Communications | 4,834 | 3.4% |
| Arts & Humanities | 11,327 | 7.8% |
| Total | 144,454 | 100.0% |
Transportation & Commute in Area Code 231
Vehicle Availability by Sex in Area Code 231
The most prevalent vehicle ownership categories in Area Code 231 are males with 2 vehicles (70,294, accounting for 43.1%) and females with 2 vehicles (61,248, making up 48.7%).
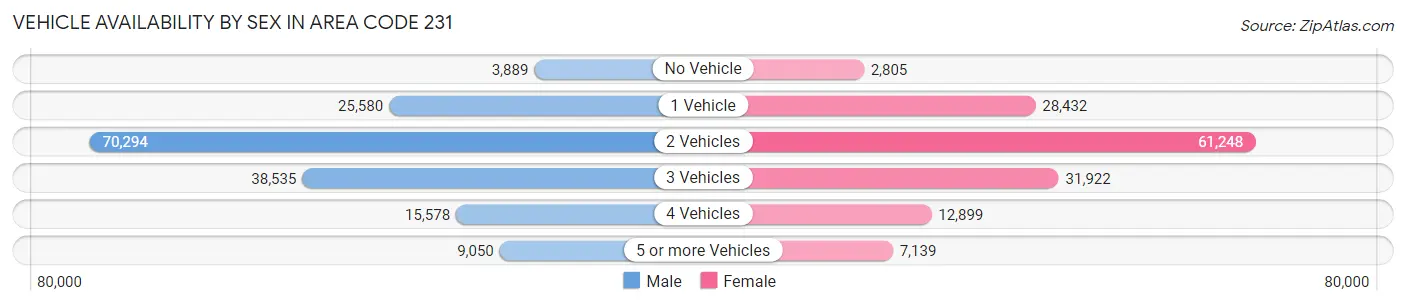
| Vehicles Available | Male | Female |
| No Vehicle | 3,889 (2.4%) | 2,805 (1.9%) |
| 1 Vehicle | 25,580 (15.7%) | 28,432 (19.7%) |
| 2 Vehicles | 70,294 (43.1%) | 61,248 (42.4%) |
| 3 Vehicles | 38,535 (23.6%) | 31,922 (22.1%) |
| 4 Vehicles | 15,578 (9.6%) | 12,899 (8.9%) |
| 5 or more Vehicles | 9,050 (5.6%) | 7,139 (4.9%) |
| Total | 162,926 (100.0%) | 144,445 (100.0%) |
Commute Time in Area Code 231
The most frequently occuring commute durations in Area Code 231 are 15 to 19 minutes (48,013 commuters, 16.8%), 10 to 14 minutes (44,526 commuters, 15.5%), and 20 to 24 minutes (40,290 commuters, 14.1%).
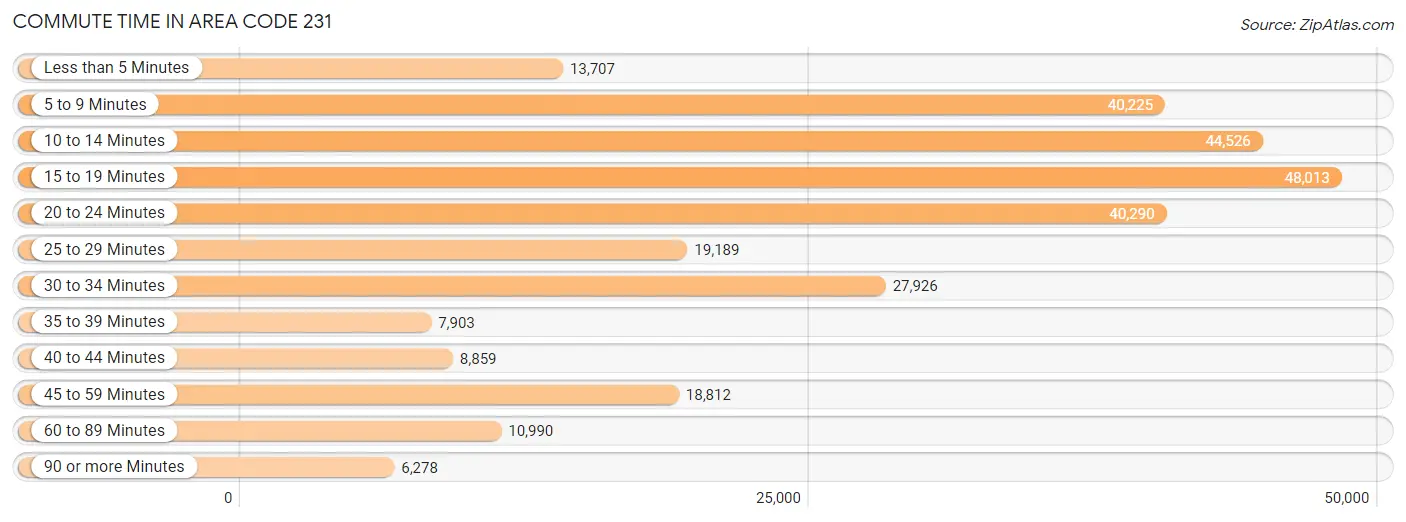
| Commute Time | # Commuters | % Commuters |
| Less than 5 Minutes | 13,707 | 4.8% |
| 5 to 9 Minutes | 40,225 | 14.0% |
| 10 to 14 Minutes | 44,526 | 15.5% |
| 15 to 19 Minutes | 48,013 | 16.8% |
| 20 to 24 Minutes | 40,290 | 14.1% |
| 25 to 29 Minutes | 19,189 | 6.7% |
| 30 to 34 Minutes | 27,926 | 9.7% |
| 35 to 39 Minutes | 7,903 | 2.8% |
| 40 to 44 Minutes | 8,859 | 3.1% |
| 45 to 59 Minutes | 18,812 | 6.6% |
| 60 to 89 Minutes | 10,990 | 3.8% |
| 90 or more Minutes | 6,278 | 2.2% |
Commute Time by Sex in Area Code 231
The most common commute times in Area Code 231 are 15 to 19 minutes (23,522 commuters, 15.4%) for males and 15 to 19 minutes (24,491 commuters, 18.3%) for females.
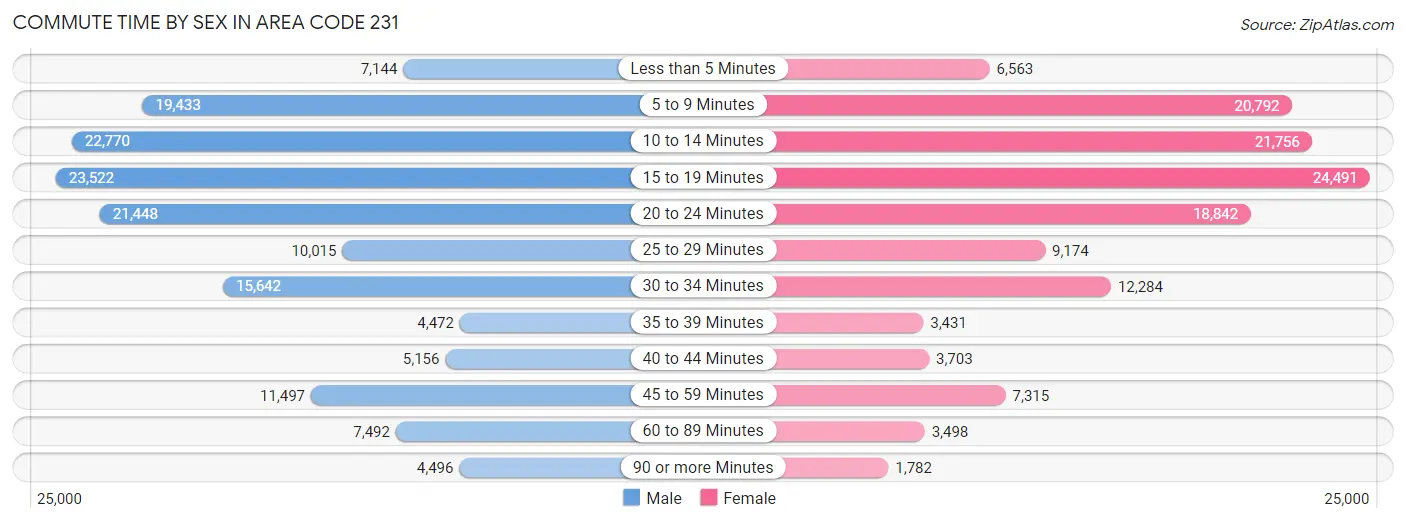
| Commute Time | Male | Female |
| Less than 5 Minutes | 7,144 (4.7%) | 6,563 (4.9%) |
| 5 to 9 Minutes | 19,433 (12.7%) | 20,792 (15.6%) |
| 10 to 14 Minutes | 22,770 (14.9%) | 21,756 (16.3%) |
| 15 to 19 Minutes | 23,522 (15.4%) | 24,491 (18.3%) |
| 20 to 24 Minutes | 21,448 (14.0%) | 18,842 (14.1%) |
| 25 to 29 Minutes | 10,015 (6.5%) | 9,174 (6.9%) |
| 30 to 34 Minutes | 15,642 (10.2%) | 12,284 (9.2%) |
| 35 to 39 Minutes | 4,472 (2.9%) | 3,431 (2.6%) |
| 40 to 44 Minutes | 5,156 (3.4%) | 3,703 (2.8%) |
| 45 to 59 Minutes | 11,497 (7.5%) | 7,315 (5.5%) |
| 60 to 89 Minutes | 7,492 (4.9%) | 3,498 (2.6%) |
| 90 or more Minutes | 4,496 (2.9%) | 1,782 (1.3%) |
Time of Departure to Work by Sex in Area Code 231
The most frequent times of departure to work in Area Code 231 are 7:00 AM to 7:29 AM (19,530, 12.8%) for males and 7:30 AM to 7:59 AM (22,090, 16.5%) for females.
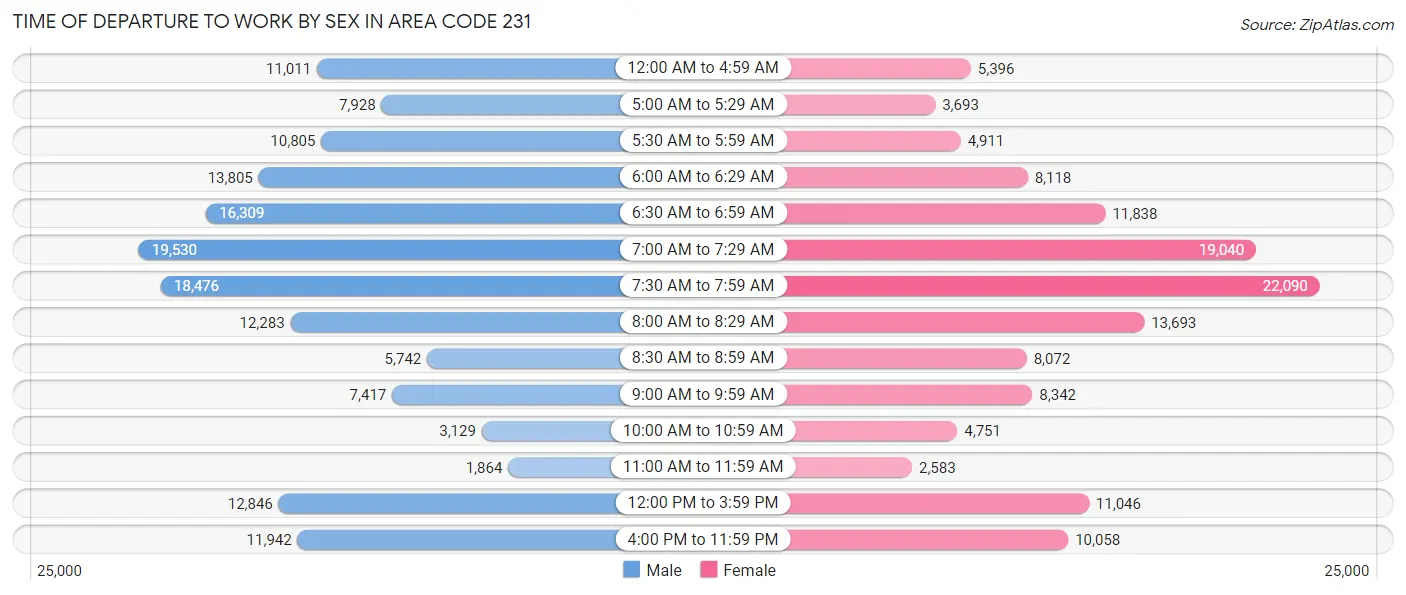
| Time of Departure | Male | Female |
| 12:00 AM to 4:59 AM | 11,011 (7.2%) | 5,396 (4.0%) |
| 5:00 AM to 5:29 AM | 7,928 (5.2%) | 3,693 (2.8%) |
| 5:30 AM to 5:59 AM | 10,805 (7.1%) | 4,911 (3.7%) |
| 6:00 AM to 6:29 AM | 13,805 (9.0%) | 8,118 (6.1%) |
| 6:30 AM to 6:59 AM | 16,309 (10.6%) | 11,838 (8.9%) |
| 7:00 AM to 7:29 AM | 19,530 (12.8%) | 19,040 (14.2%) |
| 7:30 AM to 7:59 AM | 18,476 (12.1%) | 22,090 (16.5%) |
| 8:00 AM to 8:29 AM | 12,283 (8.0%) | 13,693 (10.2%) |
| 8:30 AM to 8:59 AM | 5,742 (3.7%) | 8,072 (6.0%) |
| 9:00 AM to 9:59 AM | 7,417 (4.8%) | 8,342 (6.2%) |
| 10:00 AM to 10:59 AM | 3,129 (2.0%) | 4,751 (3.6%) |
| 11:00 AM to 11:59 AM | 1,864 (1.2%) | 2,583 (1.9%) |
| 12:00 PM to 3:59 PM | 12,846 (8.4%) | 11,046 (8.3%) |
| 4:00 PM to 11:59 PM | 11,942 (7.8%) | 10,058 (7.5%) |
| Total | 153,087 (100.0%) | 133,631 (100.0%) |
Housing Occupancy in Area Code 231
Occupancy by Ownership in Area Code 231
Of the total 283,317 dwellings in Area Code 231, owner-occupied units account for 227,406 (80.3%), while renter-occupied units make up 55,911 (19.7%).
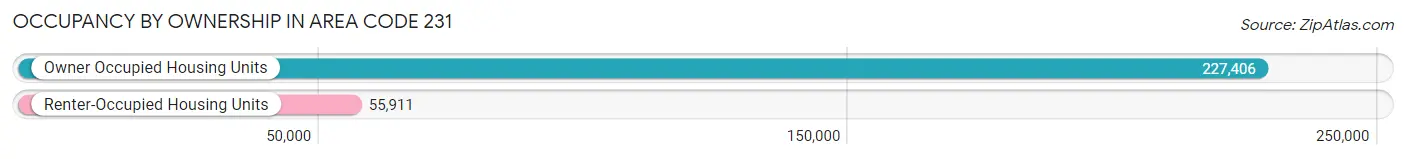
| Occupancy | # Housing Units | % Housing Units |
| Owner Occupied Housing Units | 227,406 | 80.3% |
| Renter-Occupied Housing Units | 55,911 | 19.7% |
| Total Occupied Housing Units | 283,317 | 100.0% |
Occupancy by Household Size in Area Code 231
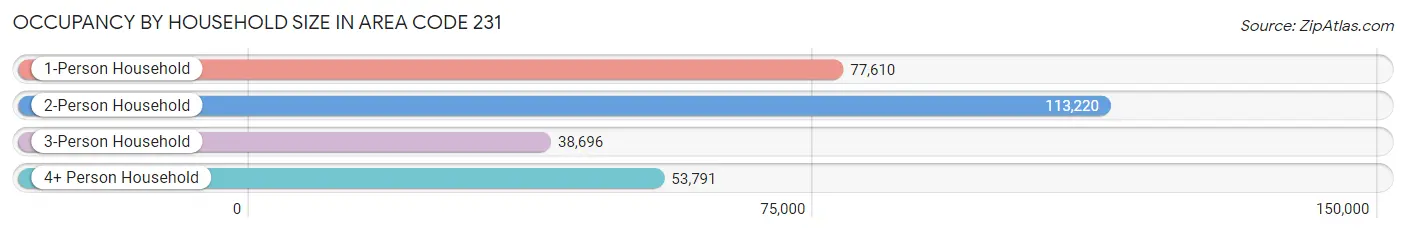
| Household Size | # Housing Units | % Housing Units |
| 1-Person Household | 77,610 | 27.4% |
| 2-Person Household | 113,220 | 40.0% |
| 3-Person Household | 38,696 | 13.7% |
| 4+ Person Household | 53,791 | 19.0% |
| Total Housing Units | 283,317 | 100.0% |
Occupancy by Ownership by Household Size in Area Code 231
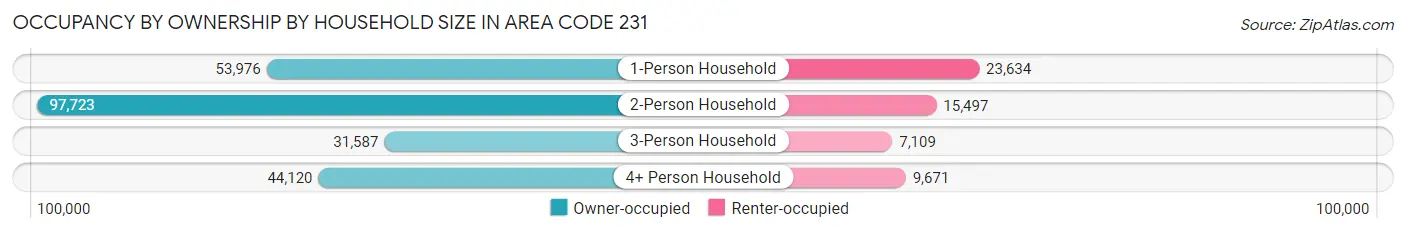
| Household Size | Owner-occupied | Renter-occupied |
| 1-Person Household | 53,976 (69.6%) | 23,634 (30.4%) |
| 2-Person Household | 97,723 (86.3%) | 15,497 (13.7%) |
| 3-Person Household | 31,587 (81.6%) | 7,109 (18.4%) |
| 4+ Person Household | 44,120 (82.0%) | 9,671 (18.0%) |
| Total Housing Units | 227,406 (80.3%) | 55,911 (19.7%) |
Occupancy by Educational Attainment in Area Code 231
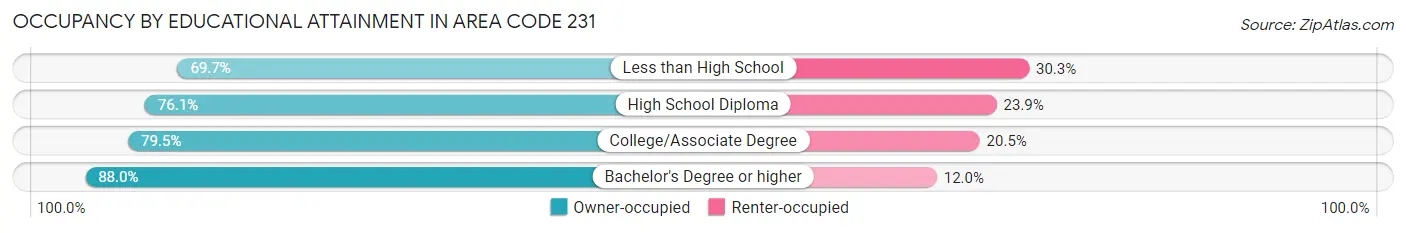
| Household Size | Owner-occupied | Renter-occupied |
| Less than High School | 12,337 (69.7%) | 5,366 (30.3%) |
| High School Diploma | 64,545 (76.1%) | 20,227 (23.9%) |
| College/Associate Degree | 80,176 (79.5%) | 20,703 (20.5%) |
| Bachelor's Degree or higher | 70,348 (88.0%) | 9,615 (12.0%) |
Occupancy by Age of Householder in Area Code 231
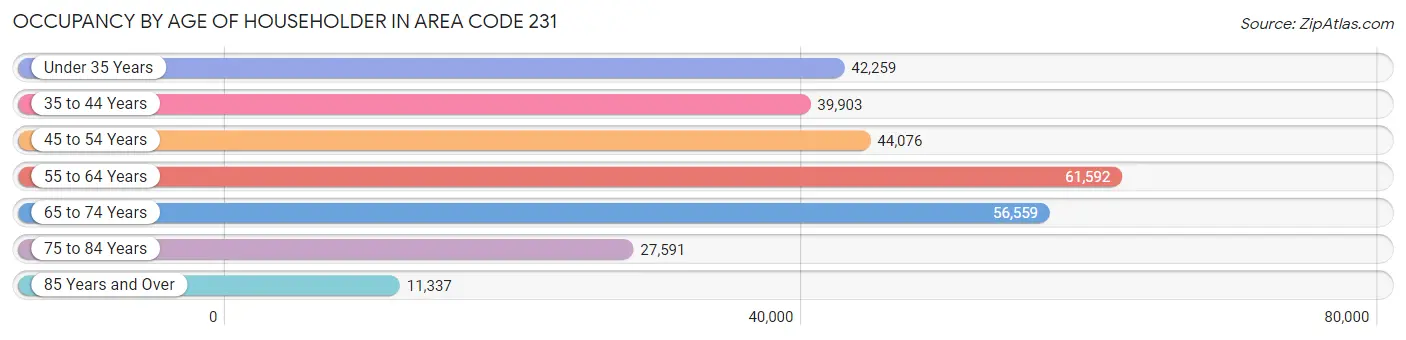
| Age Bracket | # Households | % Households |
| Under 35 Years | 42,259 | 14.9% |
| 35 to 44 Years | 39,903 | 14.1% |
| 45 to 54 Years | 44,076 | 15.6% |
| 55 to 64 Years | 61,592 | 21.7% |
| 65 to 74 Years | 56,559 | 20.0% |
| 75 to 84 Years | 27,591 | 9.7% |
| 85 Years and Over | 11,337 | 4.0% |
| Total | 283,317 | 100.0% |
Housing Finances in Area Code 231
Median Income by Occupancy in Area Code 231
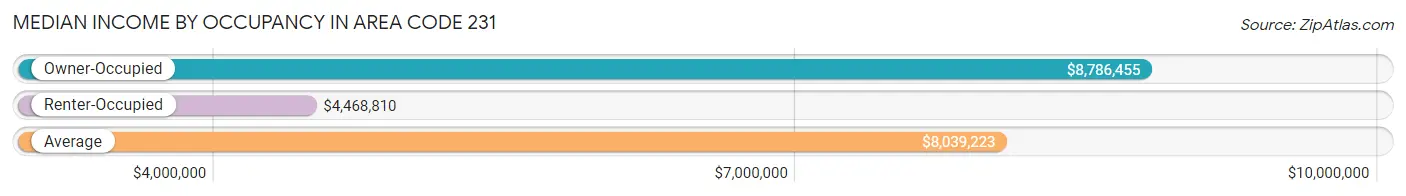
| Occupancy Type | # Households | Median Income |
| Owner-Occupied | 227,406 (80.3%) | $8,786,455 |
| Renter-Occupied | 55,911 (19.7%) | $4,468,810 |
| Average | 283,317 (100.0%) | $8,039,223 |
Occupancy by Householder Income Bracket in Area Code 231
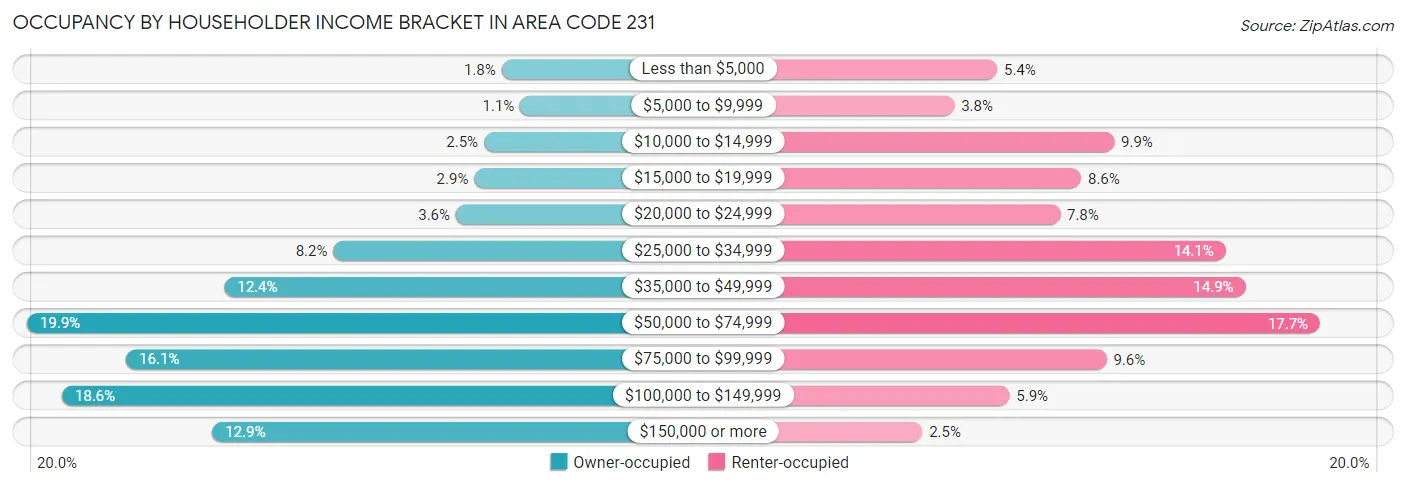
| Income Bracket | Owner-occupied | Renter-occupied |
| Less than $5,000 | 4,154 (1.8%) | 3,016 (5.4%) |
| $5,000 to $9,999 | 2,537 (1.1%) | 2,105 (3.8%) |
| $10,000 to $14,999 | 5,694 (2.5%) | 5,509 (9.9%) |
| $15,000 to $19,999 | 6,528 (2.9%) | 4,805 (8.6%) |
| $20,000 to $24,999 | 8,124 (3.6%) | 4,357 (7.8%) |
| $25,000 to $34,999 | 18,739 (8.2%) | 7,883 (14.1%) |
| $35,000 to $49,999 | 28,186 (12.4%) | 8,303 (14.8%) |
| $50,000 to $74,999 | 45,284 (19.9%) | 9,891 (17.7%) |
| $75,000 to $99,999 | 36,691 (16.1%) | 5,346 (9.6%) |
| $100,000 to $149,999 | 42,258 (18.6%) | 3,276 (5.9%) |
| $150,000 or more | 29,211 (12.9%) | 1,420 (2.5%) |
| Total | 227,406 (100.0%) | 55,911 (100.0%) |
Monthly Housing Cost Tiers in Area Code 231
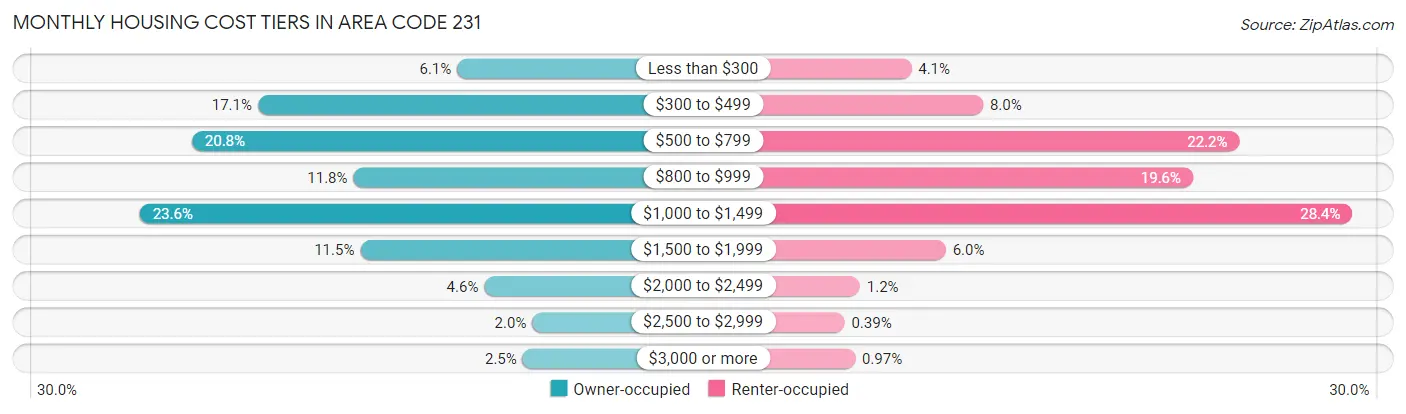
| Monthly Cost | Owner-occupied | Renter-occupied |
| Less than $300 | 13,895 (6.1%) | 2,282 (4.1%) |
| $300 to $499 | 38,925 (17.1%) | 4,493 (8.0%) |
| $500 to $799 | 47,205 (20.8%) | 12,413 (22.2%) |
| $800 to $999 | 26,928 (11.8%) | 10,977 (19.6%) |
| $1,000 to $1,499 | 53,759 (23.6%) | 15,902 (28.4%) |
| $1,500 to $1,999 | 26,061 (11.5%) | 3,345 (6.0%) |
| $2,000 to $2,499 | 10,494 (4.6%) | 695 (1.2%) |
| $2,500 to $2,999 | 4,468 (2.0%) | 219 (0.4%) |
| $3,000 or more | 5,671 (2.5%) | 542 (1.0%) |
| Total | 227,406 (100.0%) | 55,911 (100.0%) |
Physical Housing Characteristics in Area Code 231
Housing Structures in Area Code 231
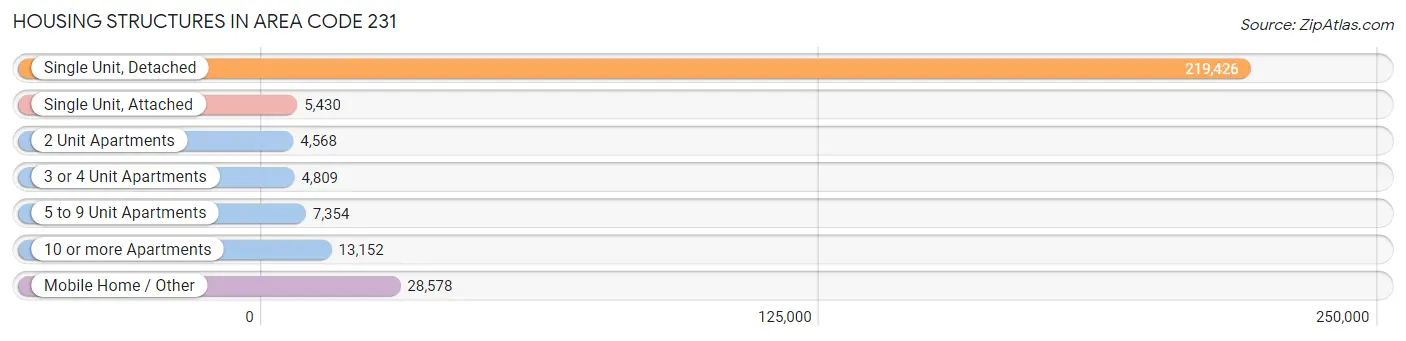
| Structure Type | # Housing Units | % Housing Units |
| Single Unit, Detached | 219,426 | 77.4% |
| Single Unit, Attached | 5,430 | 1.9% |
| 2 Unit Apartments | 4,568 | 1.6% |
| 3 or 4 Unit Apartments | 4,809 | 1.7% |
| 5 to 9 Unit Apartments | 7,354 | 2.6% |
| 10 or more Apartments | 13,152 | 4.6% |
| Mobile Home / Other | 28,578 | 10.1% |
| Total | 283,317 | 100.0% |
Housing Structures by Occupancy in Area Code 231
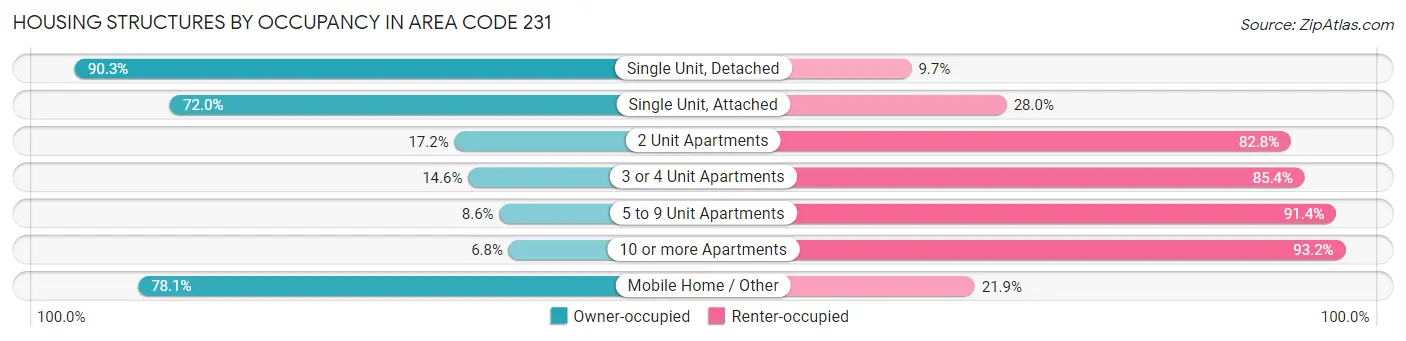
| Structure Type | Owner-occupied | Renter-occupied |
| Single Unit, Detached | 198,164 (90.3%) | 21,262 (9.7%) |
| Single Unit, Attached | 3,908 (72.0%) | 1,522 (28.0%) |
| 2 Unit Apartments | 787 (17.2%) | 3,781 (82.8%) |
| 3 or 4 Unit Apartments | 701 (14.6%) | 4,108 (85.4%) |
| 5 to 9 Unit Apartments | 631 (8.6%) | 6,723 (91.4%) |
| 10 or more Apartments | 890 (6.8%) | 12,262 (93.2%) |
| Mobile Home / Other | 22,325 (78.1%) | 6,253 (21.9%) |
| Total | 227,406 (80.3%) | 55,911 (19.7%) |
Housing Structures by Number of Rooms in Area Code 231
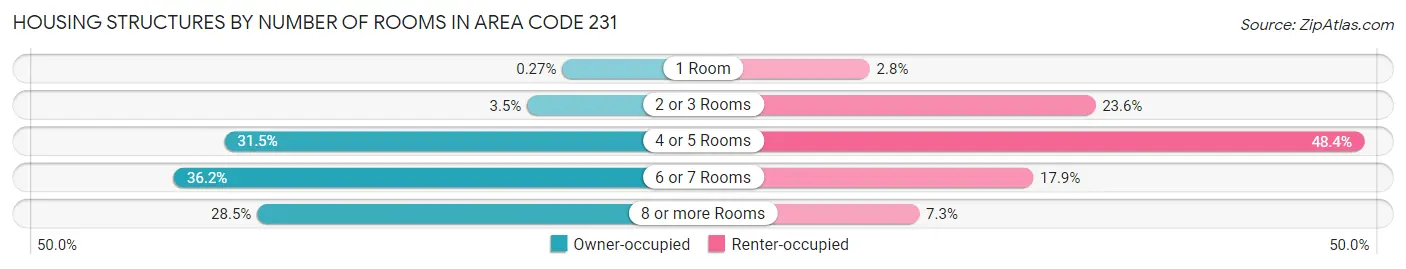
| Number of Rooms | Owner-occupied | Renter-occupied |
| 1 Room | 611 (0.3%) | 1,538 (2.8%) |
| 2 or 3 Rooms | 8,011 (3.5%) | 13,200 (23.6%) |
| 4 or 5 Rooms | 71,687 (31.5%) | 27,083 (48.4%) |
| 6 or 7 Rooms | 82,307 (36.2%) | 9,991 (17.9%) |
| 8 or more Rooms | 64,790 (28.5%) | 4,099 (7.3%) |
| Total | 227,406 (100.0%) | 55,911 (100.0%) |
Housing Structure by Heating Type in Area Code 231
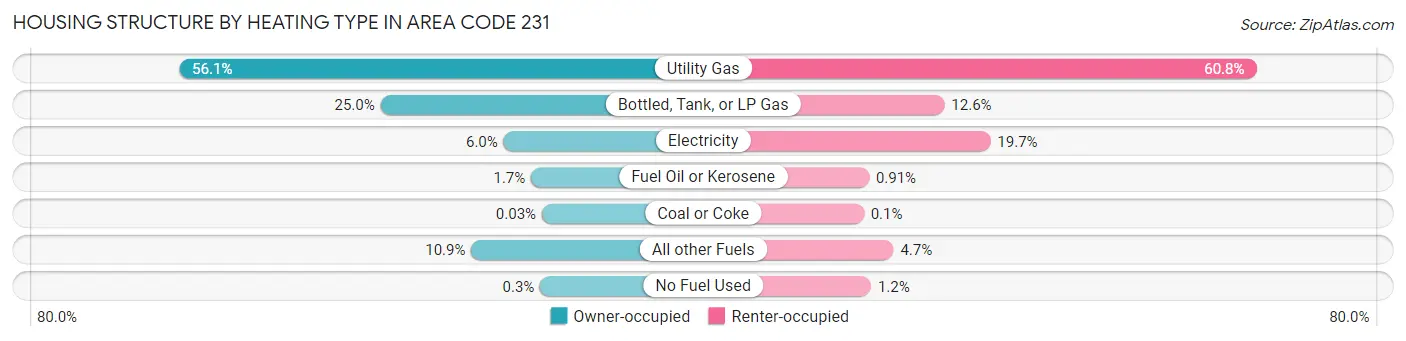
| Heating Type | Owner-occupied | Renter-occupied |
| Utility Gas | 127,565 (56.1%) | 33,988 (60.8%) |
| Bottled, Tank, or LP Gas | 56,798 (25.0%) | 7,033 (12.6%) |
| Electricity | 13,524 (5.9%) | 11,011 (19.7%) |
| Fuel Oil or Kerosene | 3,875 (1.7%) | 506 (0.9%) |
| Coal or Coke | 75 (0.0%) | 56 (0.1%) |
| All other Fuels | 24,888 (10.9%) | 2,634 (4.7%) |
| No Fuel Used | 681 (0.3%) | 683 (1.2%) |
| Total | 227,406 (100.0%) | 55,911 (100.0%) |
Household Vehicle Usage in Area Code 231
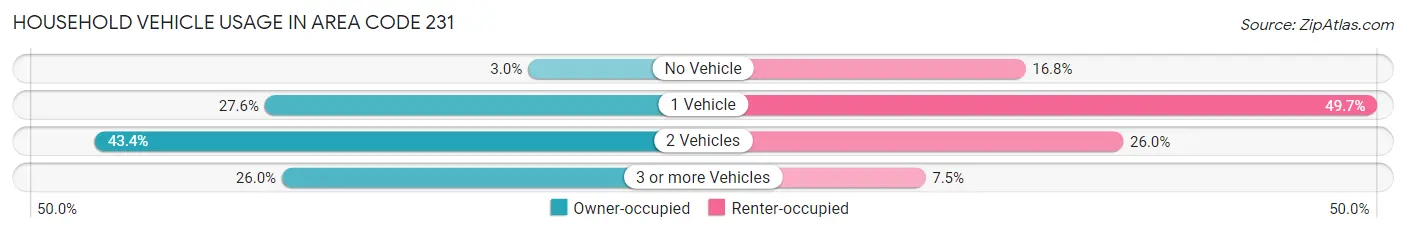
| Vehicles per Household | Owner-occupied | Renter-occupied |
| No Vehicle | 6,840 (3.0%) | 9,413 (16.8%) |
| 1 Vehicle | 62,722 (27.6%) | 27,786 (49.7%) |
| 2 Vehicles | 98,773 (43.4%) | 14,521 (26.0%) |
| 3 or more Vehicles | 59,071 (26.0%) | 4,191 (7.5%) |
| Total | 227,406 (100.0%) | 55,911 (100.0%) |
Real Estate & Mortgages in Area Code 231
Real Estate and Mortgage Overview in Area Code 231
| Characteristic | Without Mortgage | With Mortgage |
| Housing Units | 99,722 | 127,684 |
| Median Property Value | $23,553,000 | $24,625,300 |
| Median Household Income | $6,983,603 | $19,803 |
| Monthly Housing Costs | $62,612 | $5,429 |
| Real Estate Taxes | $238,271 | $4,895 |
Property Value by Mortgage Status in Area Code 231
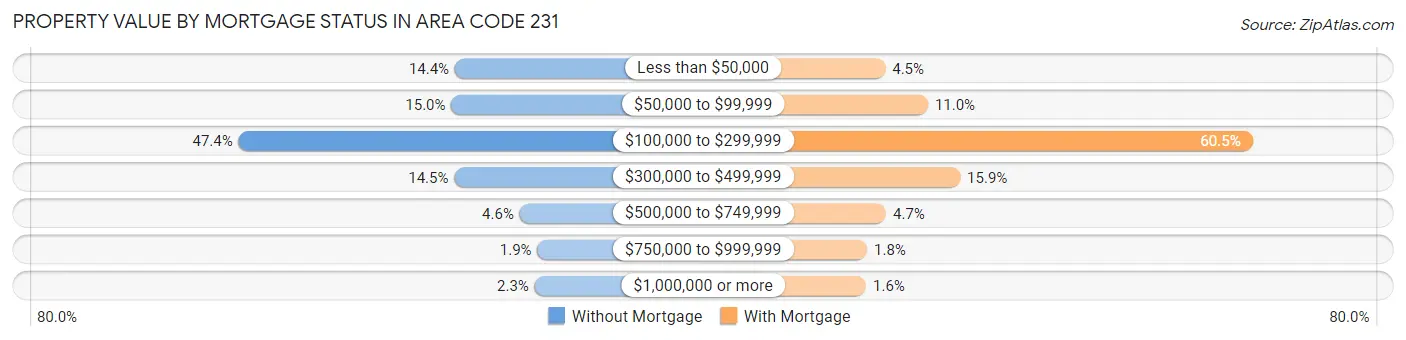
| Property Value | Without Mortgage | With Mortgage |
| Less than $50,000 | 14,378 (14.4%) | 5,789 (4.5%) |
| $50,000 to $99,999 | 14,930 (15.0%) | 14,087 (11.0%) |
| $100,000 to $299,999 | 47,265 (47.4%) | 77,218 (60.5%) |
| $300,000 to $499,999 | 14,484 (14.5%) | 20,359 (15.9%) |
| $500,000 to $749,999 | 4,542 (4.5%) | 5,933 (4.6%) |
| $750,000 to $999,999 | 1,859 (1.9%) | 2,242 (1.8%) |
| $1,000,000 or more | 2,264 (2.3%) | 2,056 (1.6%) |
| Total | 99,722 (100.0%) | 127,684 (100.0%) |
Household Income by Mortgage Status in Area Code 231
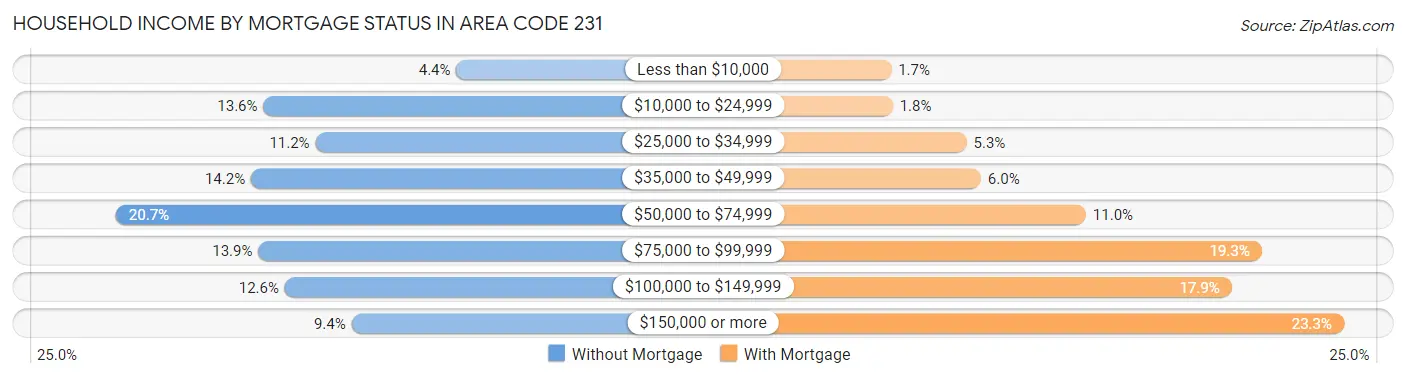
| Household Income | Without Mortgage | With Mortgage |
| Less than $10,000 | 4,429 (4.4%) | 2,177 (1.7%) |
| $10,000 to $24,999 | 13,593 (13.6%) | 2,262 (1.8%) |
| $25,000 to $34,999 | 11,122 (11.2%) | 6,753 (5.3%) |
| $35,000 to $49,999 | 14,181 (14.2%) | 7,617 (6.0%) |
| $50,000 to $74,999 | 20,590 (20.6%) | 14,005 (11.0%) |
| $75,000 to $99,999 | 13,829 (13.9%) | 24,694 (19.3%) |
| $100,000 to $149,999 | 12,570 (12.6%) | 22,862 (17.9%) |
| $150,000 or more | 9,408 (9.4%) | 29,688 (23.3%) |
| Total | 99,722 (100.0%) | 127,684 (100.0%) |
Property Value to Household Income Ratio in Area Code 231
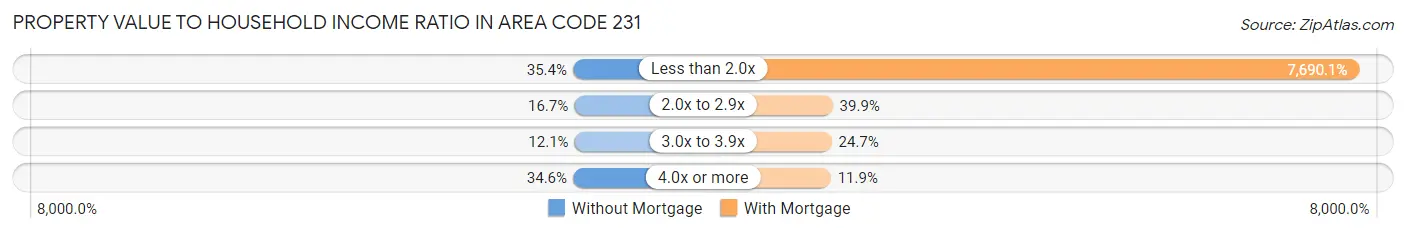
| Value-to-Income Ratio | Without Mortgage | With Mortgage |
| Less than 2.0x | 35,317 (35.4%) | 9,819,062 (7,690.1%) |
| 2.0x to 2.9x | 16,604 (16.7%) | 50,998 (39.9%) |
| 3.0x to 3.9x | 12,090 (12.1%) | 31,587 (24.7%) |
| 4.0x or more | 34,481 (34.6%) | 15,218 (11.9%) |
| Total | 99,722 (100.0%) | 127,684 (100.0%) |
Real Estate Taxes by Mortgage Status in Area Code 231
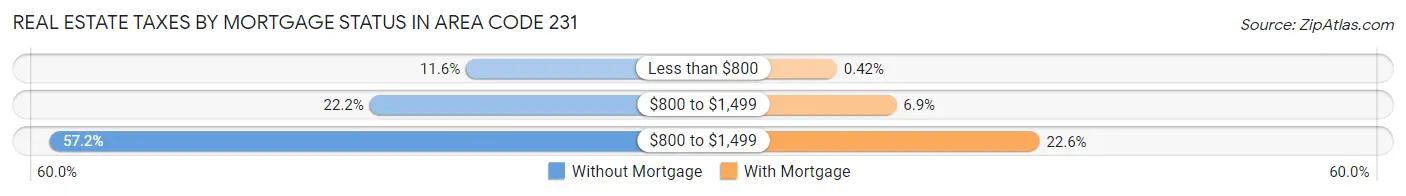
| Property Taxes | Without Mortgage | With Mortgage |
| Less than $800 | 11,597 (11.6%) | 537 (0.4%) |
| $800 to $1,499 | 22,132 (22.2%) | 8,855 (6.9%) |
| $800 to $1,499 | 57,049 (57.2%) | 28,878 (22.6%) |
| Total | 99,722 (100.0%) | 127,684 (100.0%) |
Health & Disability in Area Code 231
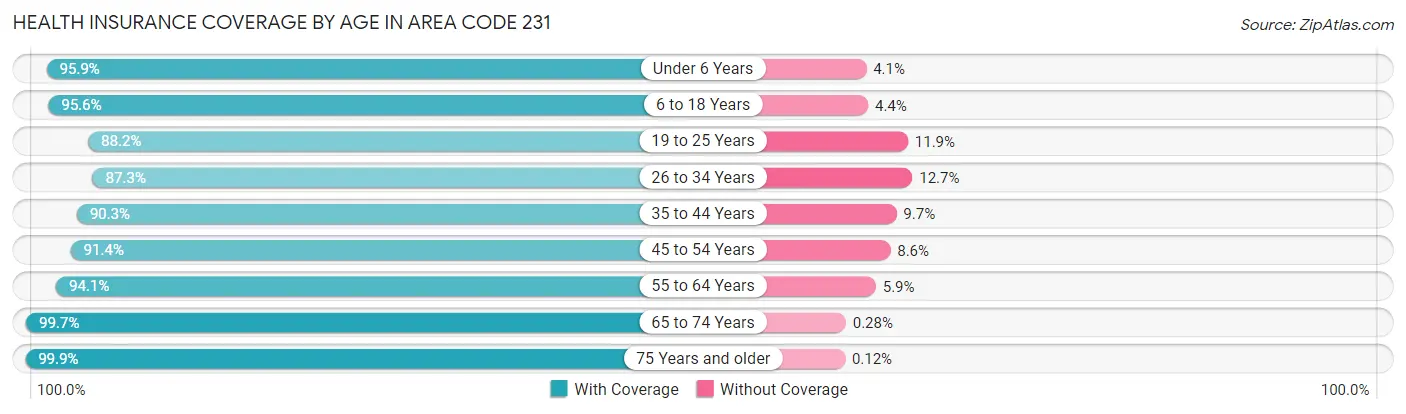
Health Insurance Coverage by Age in Area Code 231
| Age Bracket | With Coverage | Without Coverage |
| Under 6 Years | 41,989 (95.9%) | 1,785 (4.1%) |
| 6 to 18 Years | 103,887 (95.6%) | 4,811 (4.4%) |
| 19 to 25 Years | 48,485 (88.1%) | 6,519 (11.8%) |
| 26 to 34 Years | 62,821 (87.3%) | 9,125 (12.7%) |
| 35 to 44 Years | 71,322 (90.3%) | 7,679 (9.7%) |
| 45 to 54 Years | 75,850 (91.4%) | 7,118 (8.6%) |
| 55 to 64 Years | 101,694 (94.1%) | 6,336 (5.9%) |
| 65 to 74 Years | 91,558 (99.7%) | 258 (0.3%) |
| 75 Years and older | 57,962 (99.9%) | 67 (0.1%) |
| Total | 655,568 (93.8%) | 43,698 (6.2%) |
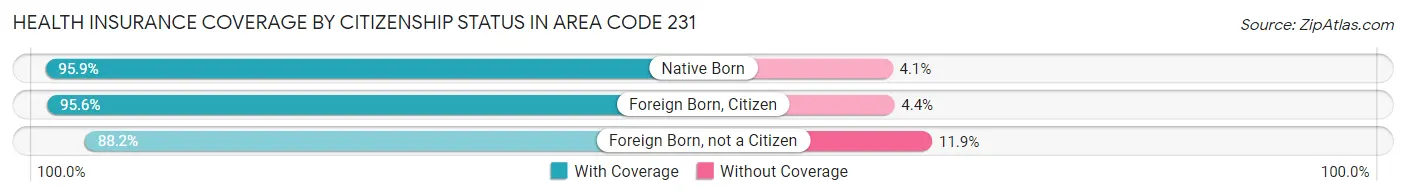
Health Insurance Coverage by Citizenship Status in Area Code 231
| Citizenship Status | With Coverage | Without Coverage |
| Native Born | 41,989 (95.9%) | 1,785 (4.1%) |
| Foreign Born, Citizen | 103,887 (95.6%) | 4,811 (4.4%) |
| Foreign Born, not a Citizen | 48,485 (88.1%) | 6,519 (11.8%) |
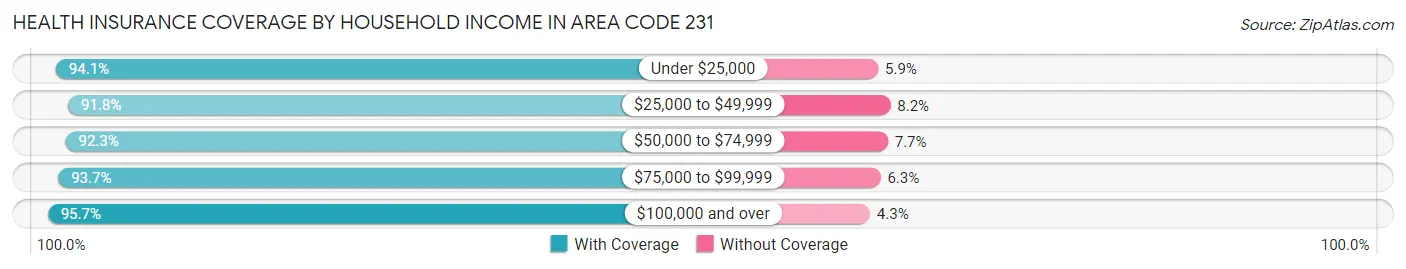
Health Insurance Coverage by Household Income in Area Code 231
| Household Income | With Coverage | Without Coverage |
| Under $25,000 | 72,568 (94.1%) | 4,527 (5.9%) |
| $25,000 to $49,999 | 118,799 (91.8%) | 10,561 (8.2%) |
| $50,000 to $74,999 | 125,113 (92.3%) | 10,415 (7.7%) |
| $75,000 to $99,999 | 108,726 (93.7%) | 7,326 (6.3%) |
| $100,000 and over | 223,885 (95.7%) | 10,138 (4.3%) |
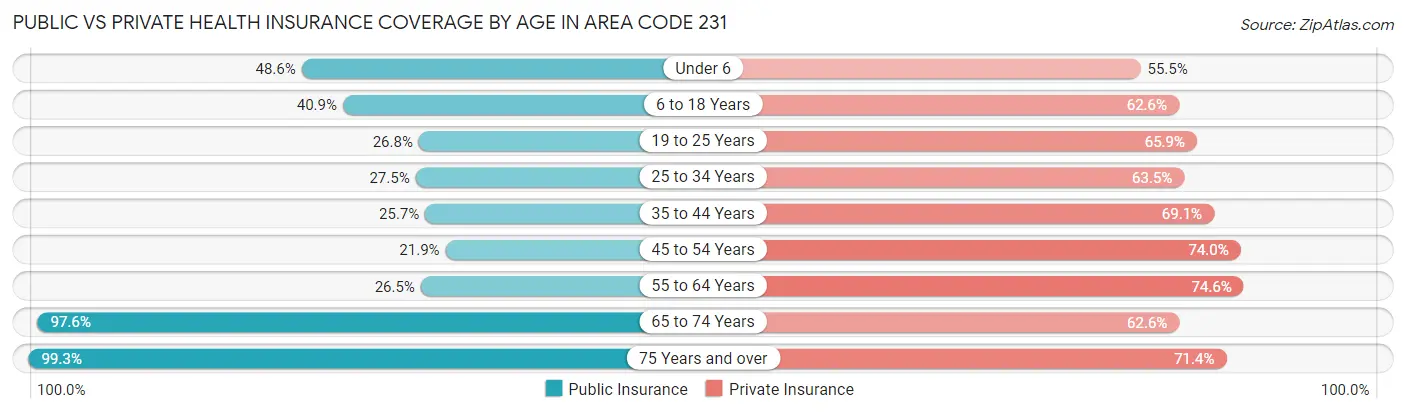
Public vs Private Health Insurance Coverage by Age in Area Code 231
| Age Bracket | Public Insurance | Private Insurance |
| Under 6 | 21,275 (48.6%) | 24,271 (55.4%) |
| 6 to 18 Years | 44,489 (40.9%) | 67,990 (62.5%) |
| 19 to 25 Years | 14,763 (26.8%) | 36,240 (65.9%) |
| 25 to 34 Years | 19,752 (27.5%) | 45,713 (63.5%) |
| 35 to 44 Years | 20,274 (25.7%) | 54,555 (69.1%) |
| 45 to 54 Years | 18,165 (21.9%) | 61,408 (74.0%) |
| 55 to 64 Years | 28,606 (26.5%) | 80,568 (74.6%) |
| 65 to 74 Years | 89,602 (97.6%) | 57,485 (62.6%) |
| 75 Years and over | 57,607 (99.3%) | 41,403 (71.4%) |
| Total | 314,533 (45.0%) | 469,633 (67.2%) |
Disability Status by Sex by Age in Area Code 231
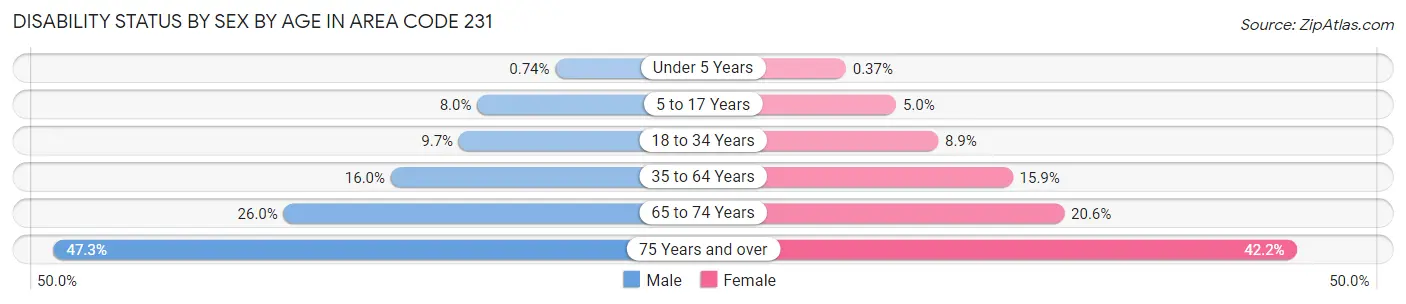
| Age Bracket | Male | Female |
| Under 5 Years | 135 (0.7%) | 64 (0.4%) |
| 5 to 17 Years | 4,435 (8.0%) | 2,645 (5.0%) |
| 18 to 34 Years | 6,797 (9.7%) | 5,866 (8.9%) |
| 35 to 64 Years | 21,692 (16.0%) | 21,318 (15.9%) |
| 65 to 74 Years | 11,746 (26.0%) | 9,604 (20.6%) |
| 75 Years and over | 12,214 (47.3%) | 13,591 (42.2%) |
Disability Class by Sex by Age in Area Code 231
Disability Class: Hearing Difficulty
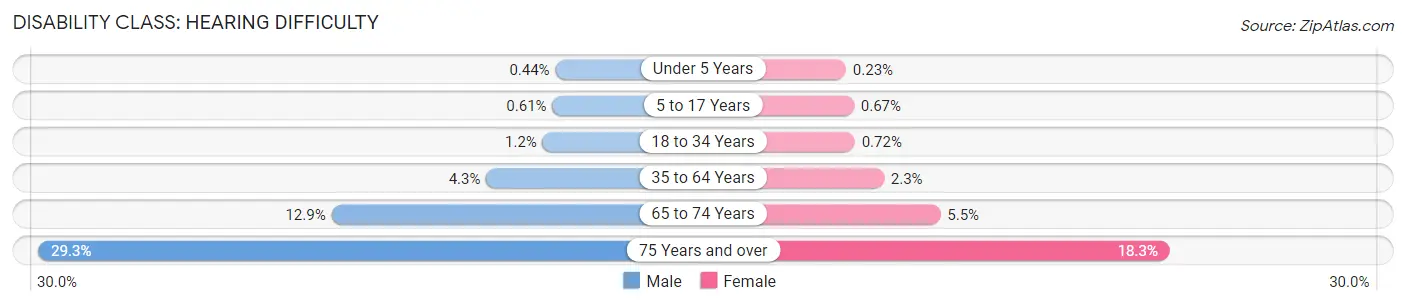
| Age Bracket | Male | Female |
| Under 5 Years | 80 (0.4%) | 39 (0.2%) |
| 5 to 17 Years | 340 (0.6%) | 350 (0.7%) |
| 18 to 34 Years | 808 (1.1%) | 475 (0.7%) |
| 35 to 64 Years | 5,812 (4.3%) | 3,154 (2.3%) |
| 65 to 74 Years | 5,844 (12.9%) | 2,556 (5.5%) |
| 75 Years and over | 7,551 (29.2%) | 5,881 (18.3%) |
Disability Class: Vision Difficulty
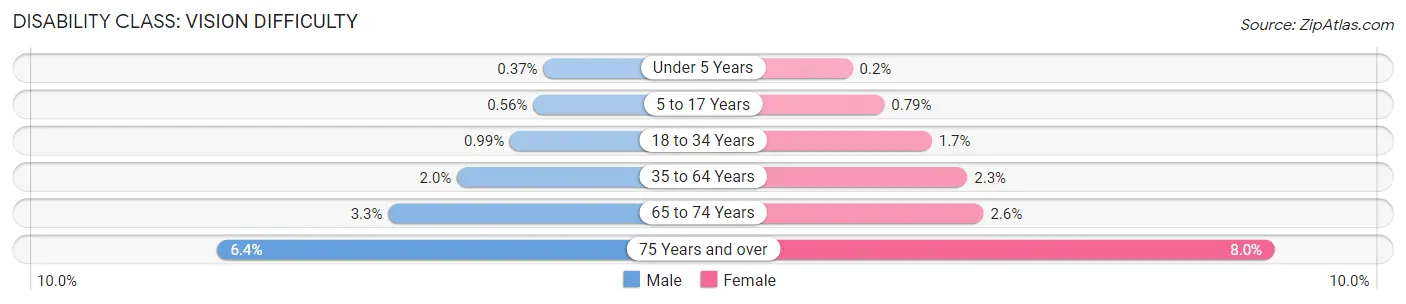
| Age Bracket | Male | Female |
| Under 5 Years | 68 (0.4%) | 34 (0.2%) |
| 5 to 17 Years | 310 (0.6%) | 415 (0.8%) |
| 18 to 34 Years | 693 (1.0%) | 1,095 (1.7%) |
| 35 to 64 Years | 2,665 (2.0%) | 3,128 (2.3%) |
| 65 to 74 Years | 1,472 (3.3%) | 1,224 (2.6%) |
| 75 Years and over | 1,657 (6.4%) | 2,582 (8.0%) |
Disability Class: Cognitive Difficulty
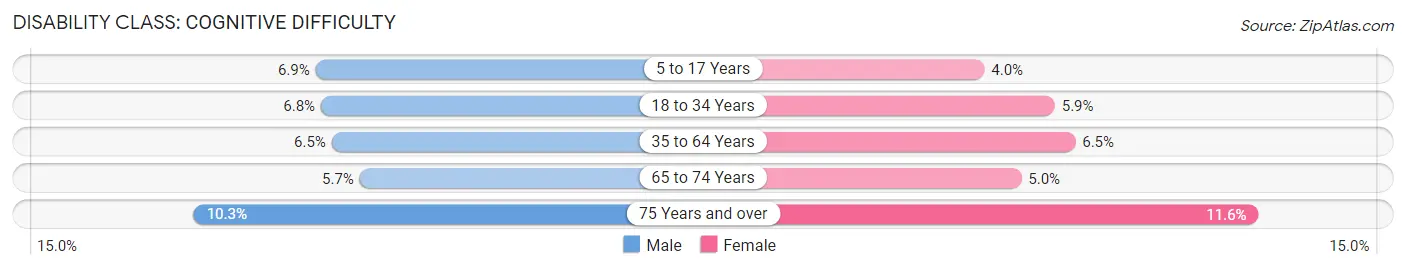
| Age Bracket | Male | Female |
| 5 to 17 Years | 3,831 (6.9%) | 2,086 (4.0%) |
| 18 to 34 Years | 4,732 (6.8%) | 3,895 (5.9%) |
| 35 to 64 Years | 8,734 (6.5%) | 8,736 (6.5%) |
| 65 to 74 Years | 2,567 (5.7%) | 2,330 (5.0%) |
| 75 Years and over | 2,657 (10.3%) | 3,737 (11.6%) |
Disability Class: Ambulatory Difficulty
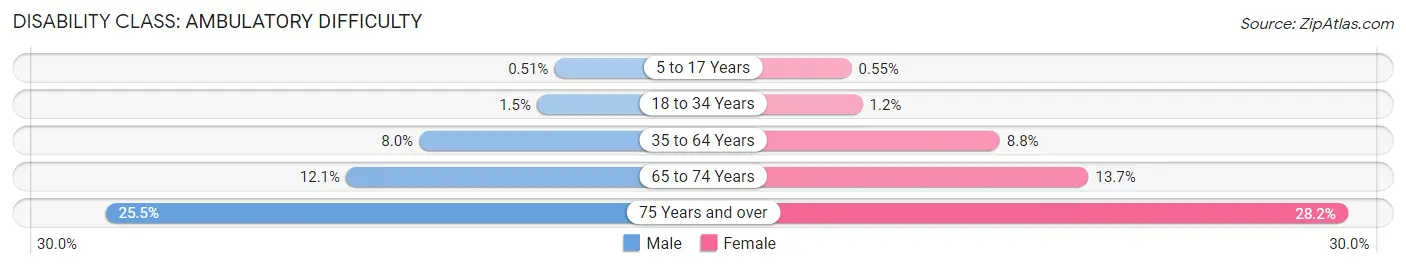
| Age Bracket | Male | Female |
| 5 to 17 Years | 281 (0.5%) | 287 (0.5%) |
| 18 to 34 Years | 1,040 (1.5%) | 763 (1.2%) |
| 35 to 64 Years | 10,896 (8.0%) | 11,839 (8.8%) |
| 65 to 74 Years | 5,478 (12.1%) | 6,397 (13.7%) |
| 75 Years and over | 6,579 (25.5%) | 9,073 (28.2%) |
Disability Class: Self-Care Difficulty
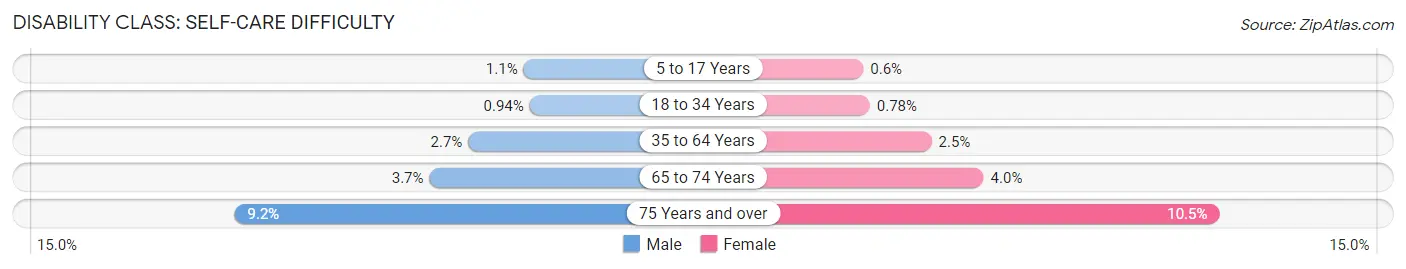
| Age Bracket | Male | Female |
| 5 to 17 Years | 616 (1.1%) | 316 (0.6%) |
| 18 to 34 Years | 661 (0.9%) | 513 (0.8%) |
| 35 to 64 Years | 3,590 (2.6%) | 3,364 (2.5%) |
| 65 to 74 Years | 1,689 (3.7%) | 1,841 (4.0%) |
| 75 Years and over | 2,365 (9.2%) | 3,387 (10.5%) |
Technology Access in Area Code 231
Computing Device Access in Area Code 231
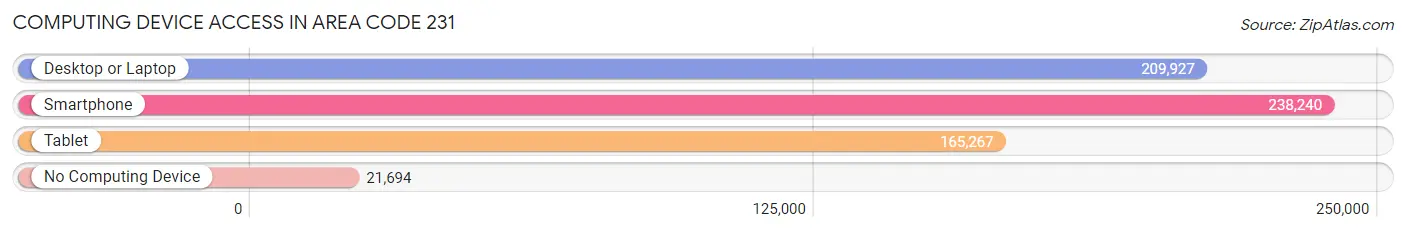
| Device Type | # Households | % Households |
| Desktop or Laptop | 209,927 | 74.1% |
| Smartphone | 238,240 | 84.1% |
| Tablet | 165,267 | 58.3% |
| No Computing Device | 21,694 | 7.7% |
| Total | 283,317 | 100.0% |
Internet Access in Area Code 231
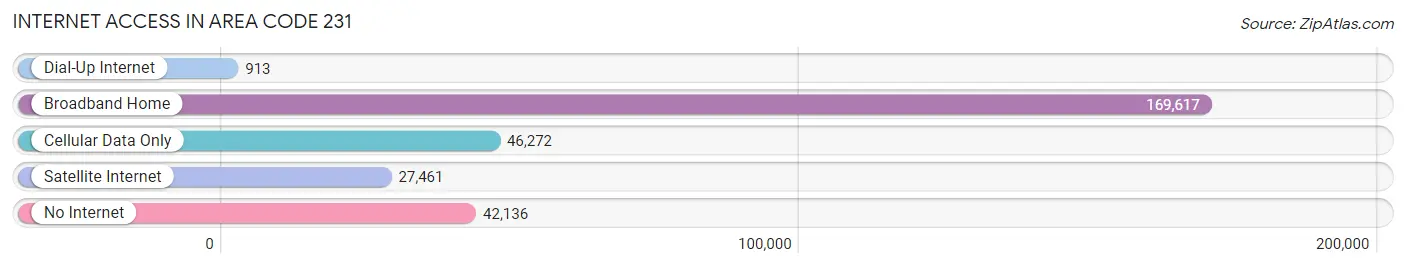
| Internet Type | # Households | % Households |
| Dial-Up Internet | 913 | 0.3% |
| Broadband Home | 169,617 | 59.9% |
| Cellular Data Only | 46,272 | 16.3% |
| Satellite Internet | 27,461 | 9.7% |
| No Internet | 42,136 | 14.9% |
| Total | 283,317 | 100.0% |
Area Code 231 Summary
Geography
Area code 231 is a telephone area code in the North American Numbering Plan (NANP) for the western Lower Peninsula of the U.S. state of Michigan. It serves the counties of Mason, Lake, Oceana, Newaygo, Muskegon, and Manistee.
Social
Area code 231 is home to a variety of communities, from small rural towns to larger cities. The area is known for its natural beauty, with many lakes, rivers, and forests. It is also home to a number of popular tourist destinations, such as the Sleeping Bear Dunes National Lakeshore and the Muskegon State Park.
Economics
Area code 231 is an important economic hub for the state of Michigan. It is home to a number of major industries, including manufacturing, agriculture, and tourism. The area is also home to a number of universities and colleges, including Grand Valley State University and Muskegon Community College.
Demographics
Area code 231 is home to a diverse population. According to the 2010 census, the population of the area was 545,811. The population is predominantly white, with African Americans making up the largest minority group. The median household income in the area is $45,811, and the median age is 38.5.
Common Questions
What is Per Capita Income in Area Code 231?
Per Capita income in Area Code 231 is $34,005.
What is the Median Family Income in Area Code 231?
Median Family Income in Area Code 231 is $76,979.
What is the Median Household income in Area Code 231?
Median Household Income in Area Code 231 is $63,803.
What is Income or Wage Gap in Area Code 231?
Income or Wage Gap in Area Code 231 is 29.6%.
Women in Area Code 231 earn 70.4 cents for every dollar earned by a man.
What is Family Income Deficit in Area Code 231?
Family Income Deficit in Area Code 231 is $10,519.
Families that are below poverty line in Area Code 231 earn $10,519 less on average than the poverty threshold level.
What is Inequality or Gini Index in Area Code 231?
Inequality or Gini Index in Area Code 231 is 52.72.
What is the Total Population of Area Code 231?
Total Population of Area Code 231 is 709,676.
What is the Total Male Population of Area Code 231?
Total Male Population of Area Code 231 is 358,051.
What is the Total Female Population of Area Code 231?
Total Female Population of Area Code 231 is 351,625.
What is the Ratio of Males per 100 Females in Area Code 231?
There are 101.83 Males per 100 Females in Area Code 231.
What is the Ratio of Females per 100 Males in Area Code 231?
There are 98.21 Females per 100 Males in Area Code 231.
What is the Median Population Age in Area Code 231?
Median Population Age in Area Code 231 is 47.4 Years.
What is the Average Family Size in Area Code 231
Average Family Size in Area Code 231 is 3.0 People.
What is the Average Household Size in Area Code 231
Average Household Size in Area Code 231 is 2.4 People.
How Large is the Labor Force in Area Code 231?
There are 317,936 People in the Labor Forcein in Area Code 231.
What is the Percentage of People in the Labor Force in Area Code 231?
54.6% of People are in the Labor Force in Area Code 231.
What is the Unemployment Rate in Area Code 231?
Unemployment Rate in Area Code 231 is 5.7%.