Area Code 248 Map & Demographics
Area Code 248 Map
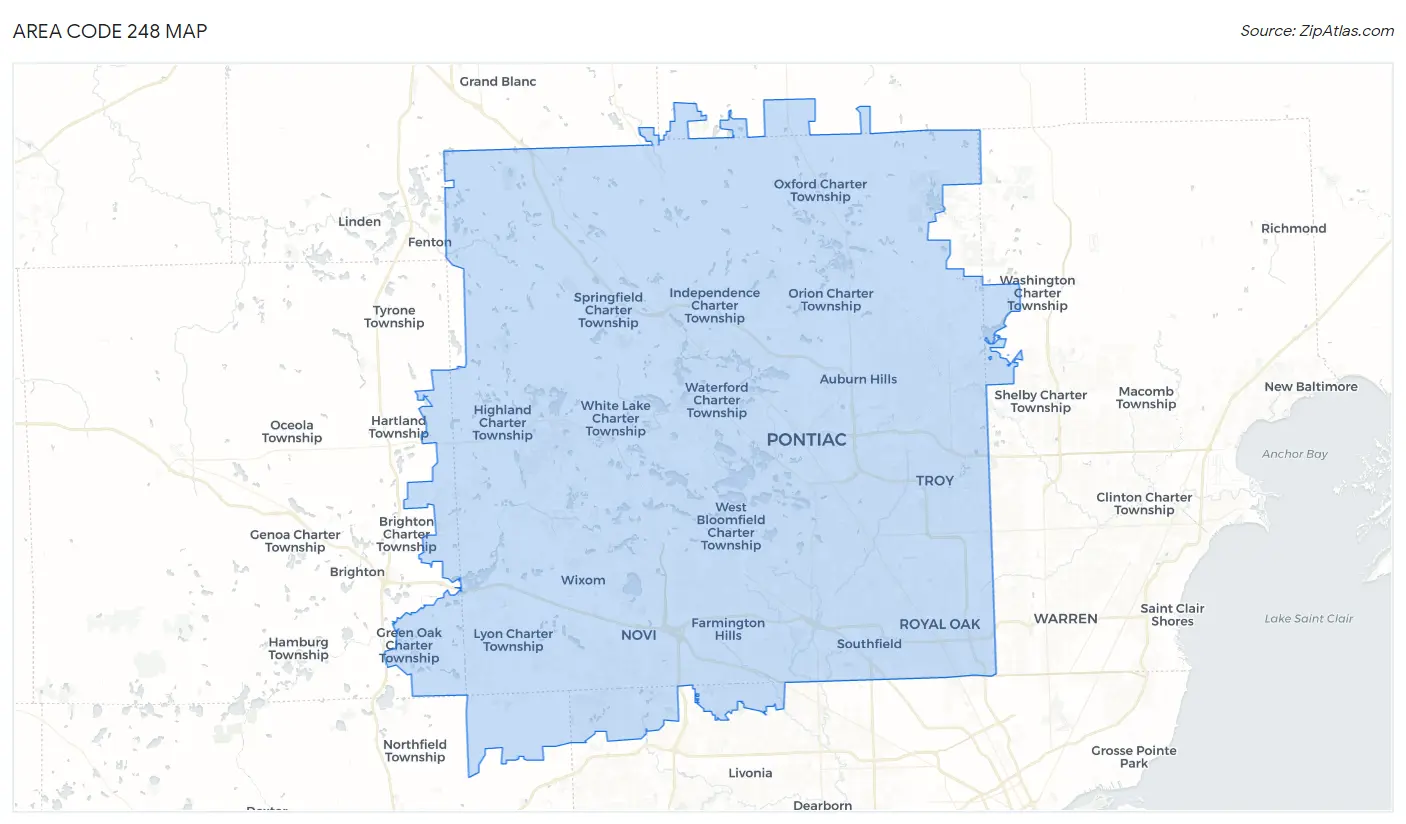
Area Code 248 Overview
$51,862
PER CAPITA INCOME
$121,286
AVG FAMILY INCOME
$98,629
AVG HOUSEHOLD INCOME
34.5%
WAGE / INCOME GAP [ % ]
65.5¢/ $1
WAGE / INCOME GAP [ $ ]
$10,431
FAMILY INCOME DEFICIT
35.07
INEQUALITY / GINI INDEX
1,679,831
TOTAL POPULATION
824,924
MALE POPULATION
854,907
FEMALE POPULATION
96.49
MALES / 100 FEMALES
103.63
FEMALES / 100 MALES
41.3
MEDIAN AGE
3.1
AVG FAMILY SIZE
2.4
AVG HOUSEHOLD SIZE
898,432
LABOR FORCE [ PEOPLE ]
65.4%
PERCENT IN LABOR FORCE
5.3%
UNEMPLOYMENT RATE
Income in Area Code 248
Income Overview in Area Code 248
Per Capita Income in Area Code 248 is $51,862, while median incomes of families and households are $121,286 and $98,629 respectively.
| Characteristic | Number | Measure |
| Per Capita Income | 1,679,831 | $51,862 |
| Median Family Income | 424,455 | $121,286 |
| Mean Family Income | 424,455 | $12,161,918 |
| Median Household Income | 692,495 | $98,629 |
| Mean Household Income | 692,495 | $10,224,074 |
| Income Deficit | 424,455 | $10,431 |
| Wage / Income Gap (%) | 1,679,831 | 34.48% |
| Wage / Income Gap ($) | 1,679,831 | 65.52¢ per $1 |
| Gini / Inequality Index | 1,679,831 | 35.07 |
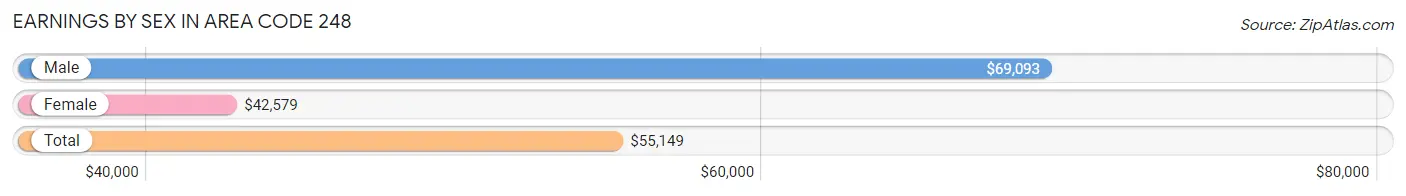
Earnings by Sex in Area Code 248
Average Earnings in Area Code 248 are $55,149, $69,093 for men and $42,579 for women, a difference of 38.4%.
| Sex | Number | Average Earnings |
| Male | 492,004 (53.0%) | $69,093 |
| Female | 436,539 (47.0%) | $42,579 |
| Total | 928,543 (100.0%) | $55,149 |
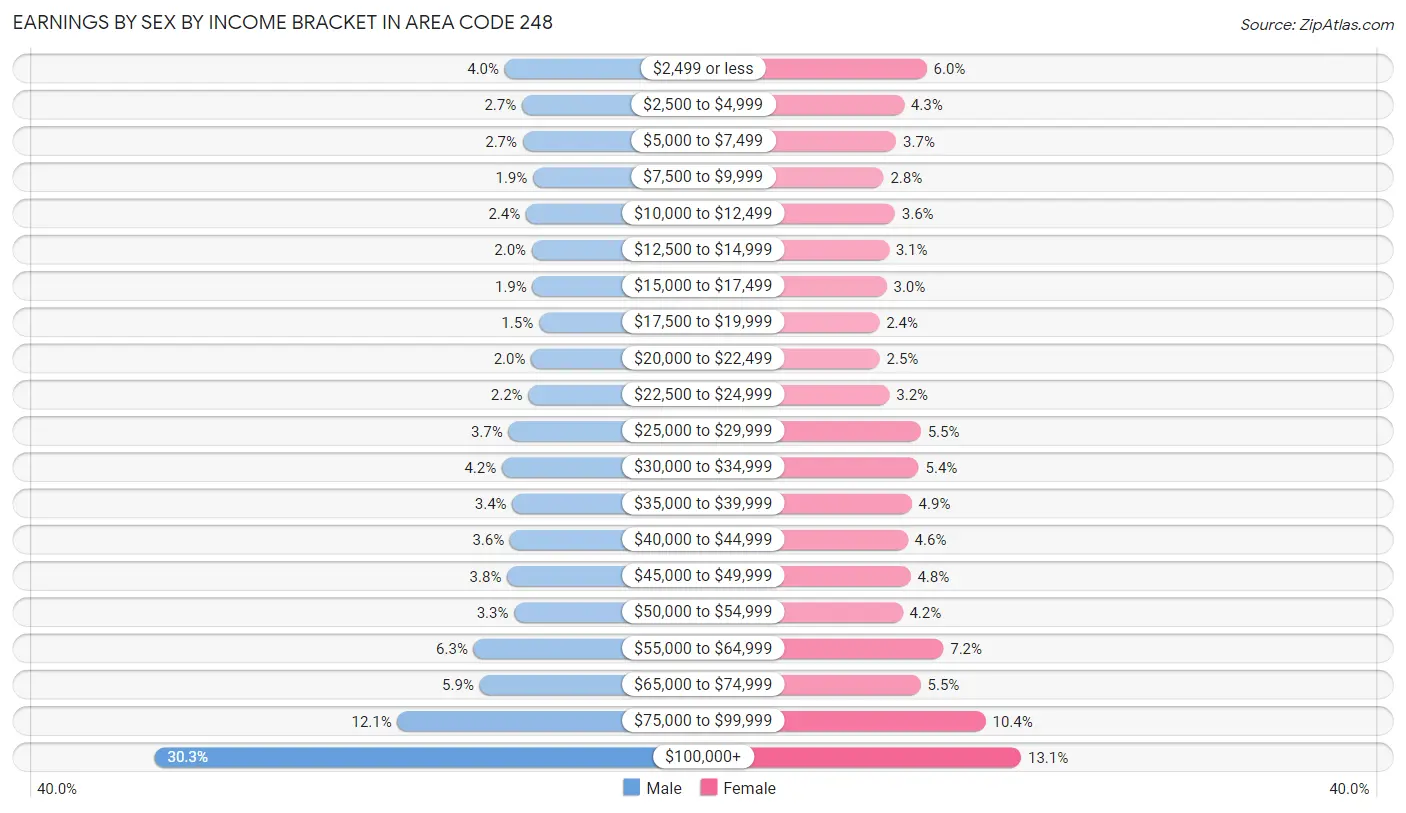
Earnings by Sex by Income Bracket in Area Code 248
The most common earnings brackets in Area Code 248 are $100,000+ for men (148,893 | 30.3%) and $100,000+ for women (57,029 | 13.1%).
| Income | Male | Female |
| $2,499 or less | 19,733 (4.0%) | 26,111 (6.0%) |
| $2,500 to $4,999 | 13,379 (2.7%) | 18,692 (4.3%) |
| $5,000 to $7,499 | 13,110 (2.7%) | 16,164 (3.7%) |
| $7,500 to $9,999 | 9,280 (1.9%) | 11,990 (2.8%) |
| $10,000 to $12,499 | 11,900 (2.4%) | 15,694 (3.6%) |
| $12,500 to $14,999 | 9,718 (2.0%) | 13,716 (3.1%) |
| $15,000 to $17,499 | 9,491 (1.9%) | 13,030 (3.0%) |
| $17,500 to $19,999 | 7,156 (1.5%) | 10,589 (2.4%) |
| $20,000 to $22,499 | 9,991 (2.0%) | 10,723 (2.5%) |
| $22,500 to $24,999 | 10,999 (2.2%) | 13,908 (3.2%) |
| $25,000 to $29,999 | 18,373 (3.7%) | 24,177 (5.5%) |
| $30,000 to $34,999 | 20,739 (4.2%) | 23,487 (5.4%) |
| $35,000 to $39,999 | 16,904 (3.4%) | 21,233 (4.9%) |
| $40,000 to $44,999 | 17,790 (3.6%) | 19,907 (4.6%) |
| $45,000 to $49,999 | 18,826 (3.8%) | 20,805 (4.8%) |
| $50,000 to $54,999 | 16,244 (3.3%) | 18,192 (4.2%) |
| $55,000 to $64,999 | 31,183 (6.3%) | 31,549 (7.2%) |
| $65,000 to $74,999 | 28,993 (5.9%) | 24,158 (5.5%) |
| $75,000 to $99,999 | 59,302 (12.0%) | 45,385 (10.4%) |
| $100,000+ | 148,893 (30.3%) | 57,029 (13.1%) |
| Total | 492,004 (100.0%) | 436,539 (100.0%) |
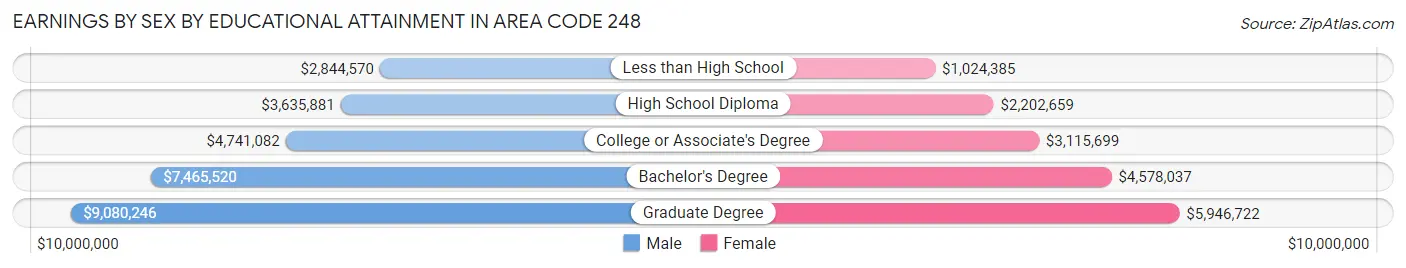
Earnings by Sex by Educational Attainment in Area Code 248
Average earnings in Area Code 248 are $6,342,608 for men and $4,013,108 for women, a difference of 36.7%. Men with an educational attainment of graduate degree enjoy the highest average annual earnings of $9,080,246, while those with less than high school education earn the least with $2,844,570. Women with an educational attainment of graduate degree earn the most with the average annual earnings of $5,946,722, while those with less than high school education have the smallest earnings of $1,024,385.
| Educational Attainment | Male Income | Female Income |
| Less than High School | $2,844,570 | $1,024,385 |
| High School Diploma | $3,635,881 | $2,202,659 |
| College or Associate's Degree | $4,741,082 | $3,115,699 |
| Bachelor's Degree | $7,465,520 | $4,578,037 |
| Graduate Degree | $9,080,246 | $5,946,722 |
| Total | $6,342,608 | $4,013,108 |
Family Income in Area Code 248
Family Income Brackets in Area Code 248
According to the Area Code 248 family income data, there are 7,527,709 families falling into the $200,000+ income range, which is the most common income bracket and makes up 1,773.5% of all families. Conversely, the $10,000 to $14,999 income bracket is the least frequent group with only 460,534 families (108.5%) belonging to this category.
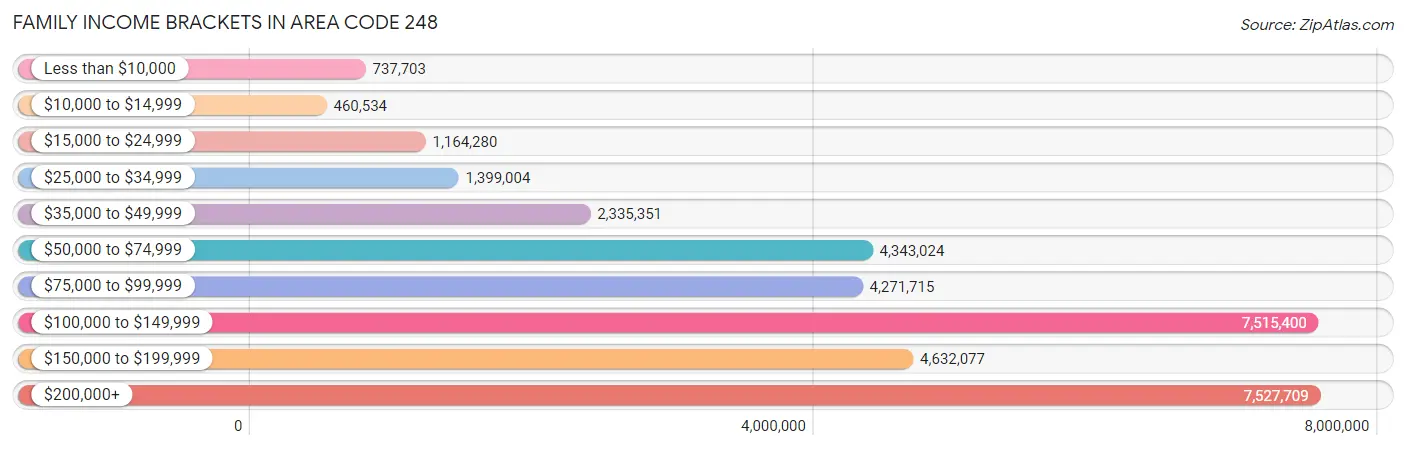
| Income Bracket | # Families | % Families |
| Less than $10,000 | 737,703 | 173.8% |
| $10,000 to $14,999 | 460,534 | 108.5% |
| $15,000 to $24,999 | 1,164,280 | 274.3% |
| $25,000 to $34,999 | 1,399,004 | 329.6% |
| $35,000 to $49,999 | 2,335,351 | 550.2% |
| $50,000 to $74,999 | 4,343,024 | 1,023.2% |
| $75,000 to $99,999 | 4,271,715 | 1,006.4% |
| $100,000 to $149,999 | 7,515,400 | 1,770.6% |
| $150,000 to $199,999 | 4,632,077 | 1,091.3% |
| $200,000+ | 7,527,709 | 1,773.5% |
Family Income by Famaliy Size in Area Code 248
7+ person families (5,130 | 1.2%) account for the highest median family income in Area Code 248 with $154,442 per family, while 2-person families (203,502 | 47.9%) have the highest median income of $51,030 per family member.
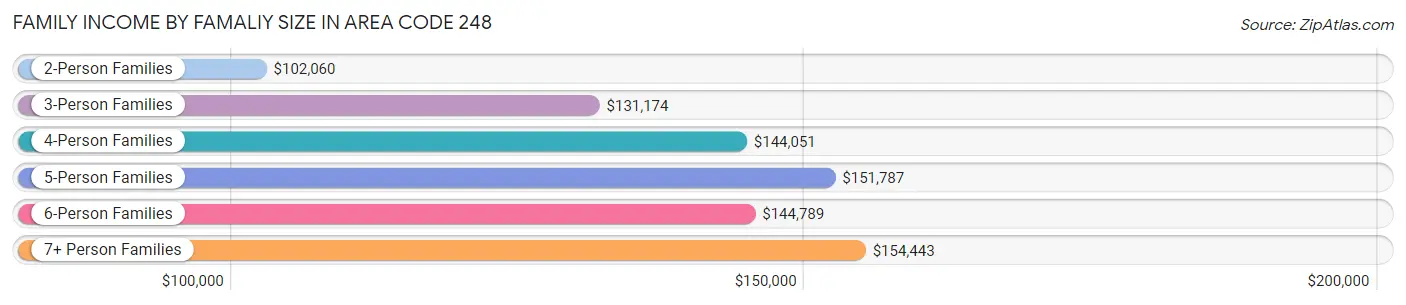
| Income Bracket | # Families | Median Income |
| 2-Person Families | 203,502 (47.9%) | $102,060 |
| 3-Person Families | 95,291 (22.5%) | $131,174 |
| 4-Person Families | 79,484 (18.7%) | $144,051 |
| 5-Person Families | 31,544 (7.4%) | $151,787 |
| 6-Person Families | 9,504 (2.2%) | $144,789 |
| 7+ Person Families | 5,130 (1.2%) | $154,442 |
| Total | 424,455 (100.0%) | $121,286 |
Family Income by Number of Earners in Area Code 248
The median family income in Area Code 248 is $121,286, with families comprising 3+ earners (52,457) having the highest median family income of $173,444, while families with no earners (58,721) have the lowest median family income of $65,022, accounting for 12.4% and 13.8% of families, respectively.
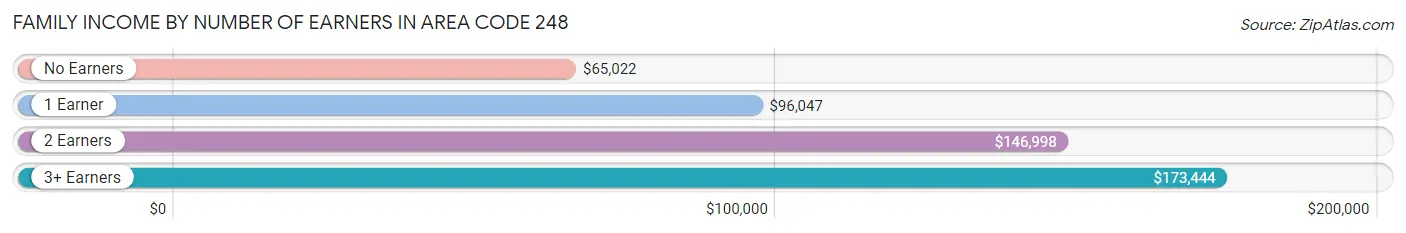
| Number of Earners | # Families | Median Income |
| No Earners | 58,721 (13.8%) | $65,022 |
| 1 Earner | 133,929 (31.6%) | $96,047 |
| 2 Earners | 179,348 (42.2%) | $146,998 |
| 3+ Earners | 52,457 (12.4%) | $173,444 |
| Total | 424,455 (100.0%) | $121,286 |
Household Income in Area Code 248
Household Income Brackets in Area Code 248
With 10,225,381 households falling in the category, the $100,000 to $149,999 income range is the most frequent in Area Code 248, accounting for 1,476.6% of all households. In contrast, only 1,707,000 households (246.5%) fall into the $10,000 to $14,999 income bracket, making it the least populous group.
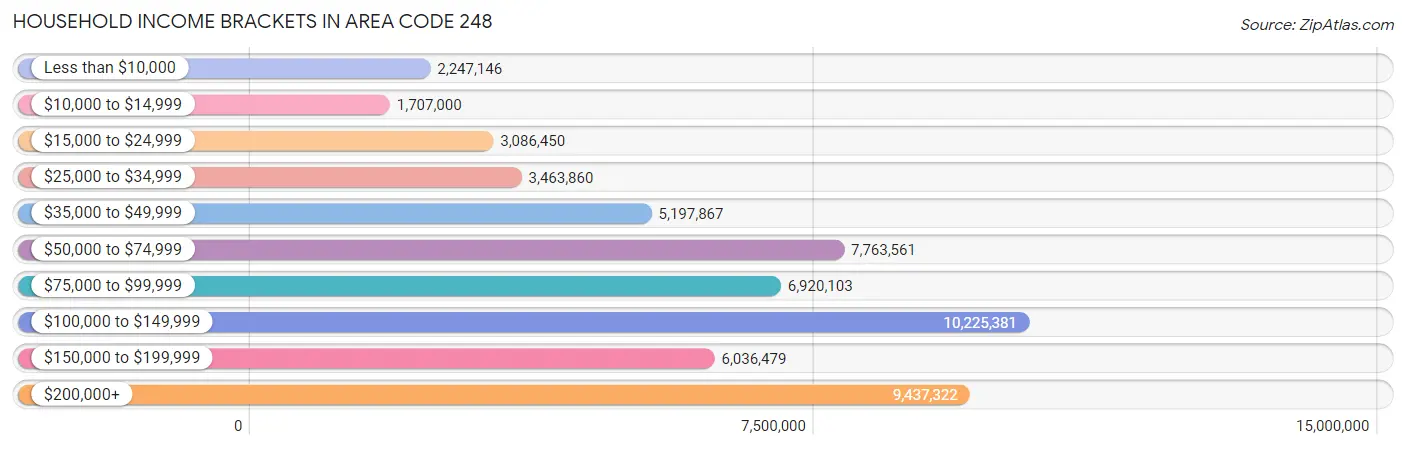
| Income Bracket | # Households | % Households |
| Less than $10,000 | 2,247,146 | 324.5% |
| $10,000 to $14,999 | 1,707,000 | 246.5% |
| $15,000 to $24,999 | 3,086,450 | 445.7% |
| $25,000 to $34,999 | 3,463,860 | 500.2% |
| $35,000 to $49,999 | 5,197,867 | 750.6% |
| $50,000 to $74,999 | 7,763,561 | 1,121.1% |
| $75,000 to $99,999 | 6,920,103 | 999.3% |
| $100,000 to $149,999 | 10,225,381 | 1,476.6% |
| $150,000 to $199,999 | 6,036,479 | 871.7% |
| $200,000+ | 9,437,322 | 1,362.8% |
Household Income by Householder Age in Area Code 248
The median household income in Area Code 248 is $98,629, with the highest median household income of $120,386 found in the 45 to 64 years age bracket for the primary householder. A total of 268,532 households (38.8%) fall into this category. Meanwhile, the 15 to 24 years age bracket for the primary householder has the lowest median household income of $57,506, with 18,400 households (2.7%) in this group.
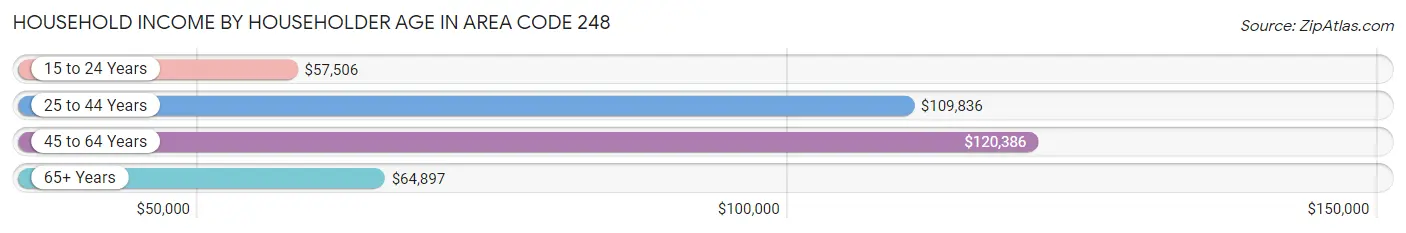
| Income Bracket | # Households | Median Income |
| 15 to 24 Years | 18,400 (2.7%) | $57,506 |
| 25 to 44 Years | 215,267 (31.1%) | $109,836 |
| 45 to 64 Years | 268,532 (38.8%) | $120,386 |
| 65+ Years | 190,296 (27.5%) | $64,897 |
| Total | 692,495 (100.0%) | $98,629 |
Poverty in Area Code 248
Income Below Poverty by Sex and Age in Area Code 248
With 8.4% poverty level for males and 10.6% for females among the residents of Area Code 248, under 5 year old males and 18 to 24 year old females are the most vulnerable to poverty, with 6,174 males (13.5%) and 9,118 females (14.1%) in their respective age groups living below the poverty level.
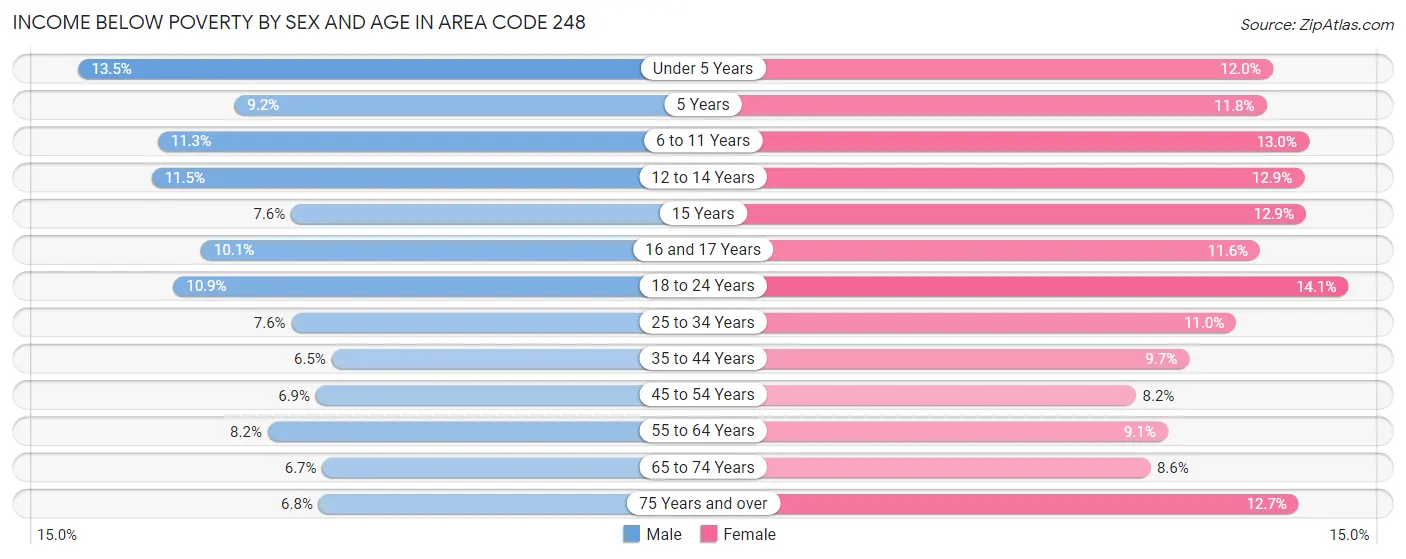
| Age Bracket | Male | Female |
| Under 5 Years | 6,174 (13.5%) | 5,074 (12.0%) |
| 5 Years | 928 (9.2%) | 1,092 (11.8%) |
| 6 to 11 Years | 6,431 (11.3%) | 7,345 (13.0%) |
| 12 to 14 Years | 3,580 (11.5%) | 3,799 (12.9%) |
| 15 Years | 839 (7.6%) | 1,335 (12.9%) |
| 16 and 17 Years | 2,132 (10.1%) | 2,440 (11.6%) |
| 18 to 24 Years | 7,429 (10.9%) | 9,118 (14.1%) |
| 25 to 34 Years | 8,755 (7.6%) | 12,135 (11.0%) |
| 35 to 44 Years | 6,741 (6.5%) | 10,034 (9.7%) |
| 45 to 54 Years | 7,527 (6.9%) | 9,361 (8.2%) |
| 55 to 64 Years | 9,504 (8.2%) | 11,048 (9.1%) |
| 65 to 74 Years | 5,437 (6.7%) | 8,097 (8.6%) |
| 75 Years and over | 3,141 (6.8%) | 8,647 (12.7%) |
| Total | 68,618 (8.4%) | 89,525 (10.6%) |
Income Above Poverty by Sex and Age in Area Code 248
According to the poverty statistics in Area Code 248, males aged 35 to 44 years and females aged 45 to 54 years are the age groups that are most secure financially, with 93.5% of males and 91.8% of females in these age groups living above the poverty line.
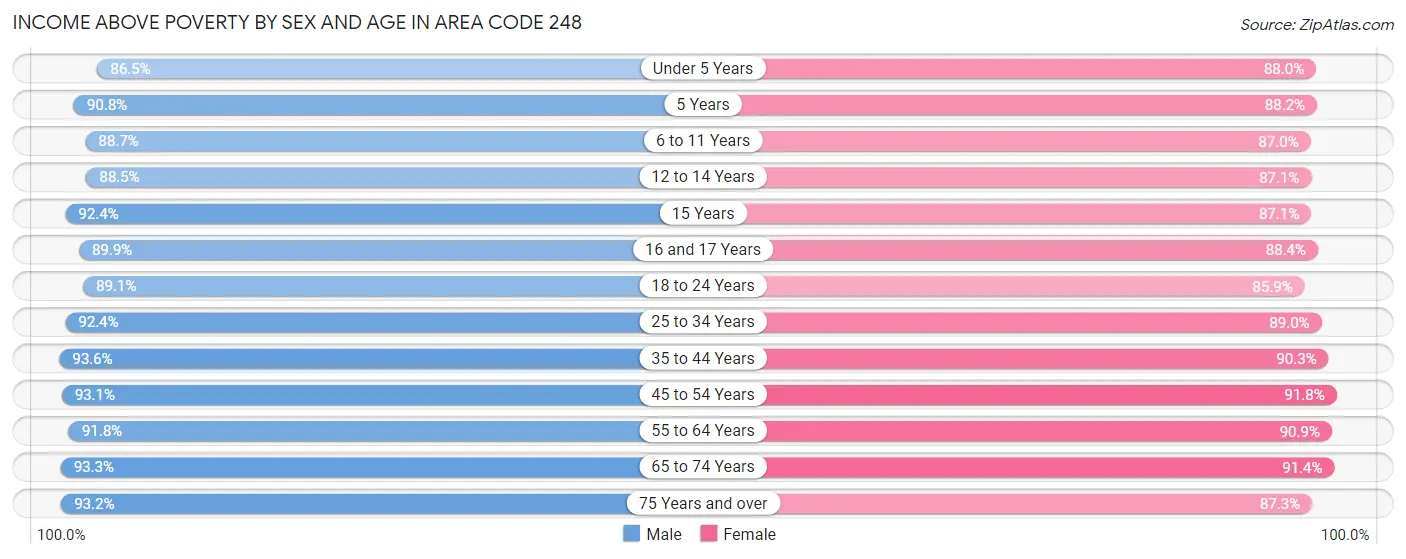
| Age Bracket | Male | Female |
| Under 5 Years | 39,556 (86.5%) | 37,246 (88.0%) |
| 5 Years | 9,206 (90.8%) | 8,147 (88.2%) |
| 6 to 11 Years | 50,512 (88.7%) | 49,136 (87.0%) |
| 12 to 14 Years | 27,658 (88.5%) | 25,722 (87.1%) |
| 15 Years | 10,230 (92.4%) | 8,996 (87.1%) |
| 16 and 17 Years | 19,001 (89.9%) | 18,518 (88.4%) |
| 18 to 24 Years | 60,952 (89.1%) | 55,549 (85.9%) |
| 25 to 34 Years | 106,966 (92.4%) | 98,382 (89.0%) |
| 35 to 44 Years | 97,728 (93.5%) | 93,767 (90.3%) |
| 45 to 54 Years | 101,701 (93.1%) | 105,081 (91.8%) |
| 55 to 64 Years | 106,022 (91.8%) | 110,774 (90.9%) |
| 65 to 74 Years | 75,635 (93.3%) | 86,263 (91.4%) |
| 75 Years and over | 42,966 (93.2%) | 59,316 (87.3%) |
| Total | 748,133 (91.6%) | 756,897 (89.4%) |
Income Below Poverty Among Married-Couple Families in Area Code 248
The poverty statistics for married-couple families in Area Code 248 show that 2.8% or 8,916 of the total 318,977 families live below the poverty line. Families with 5 or more children have the highest poverty rate of 21.1%, comprising of 415 families. On the other hand, families with no children have the lowest poverty rate of 2.3%, which includes 4,450 families.
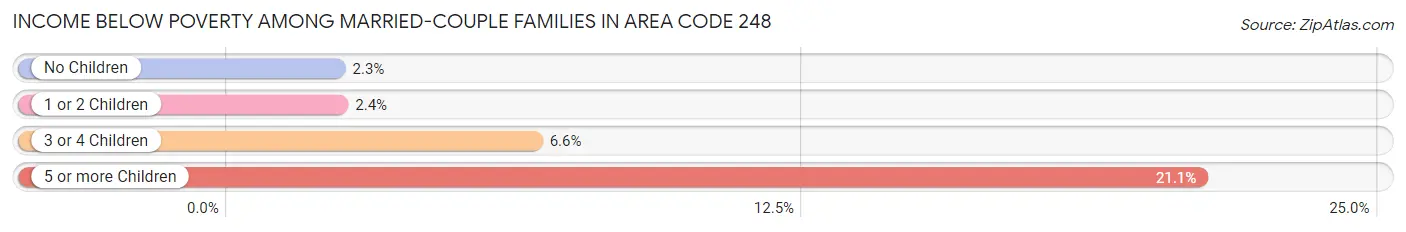
| Children | Above Poverty | Below Poverty |
| No Children | 185,416 (97.7%) | 4,450 (2.3%) |
| 1 or 2 Children | 101,039 (97.6%) | 2,484 (2.4%) |
| 3 or 4 Children | 22,055 (93.4%) | 1,567 (6.6%) |
| 5 or more Children | 1,551 (78.9%) | 415 (21.1%) |
| Total | 310,061 (97.2%) | 8,916 (2.8%) |
Income Below Poverty Among Single-Parent Households in Area Code 248
According to the poverty data in Area Code 248, 11.1% or 3,151 single-father households and 18.6% or 14,351 single-mother households are living below the poverty line. Among single-father households, those with 5 or more children have the highest poverty rate, with 27 households (52.9%) experiencing poverty. Likewise, among single-mother households, those with 5 or more children have the highest poverty rate, with 483 households (70.0%) falling below the poverty line.
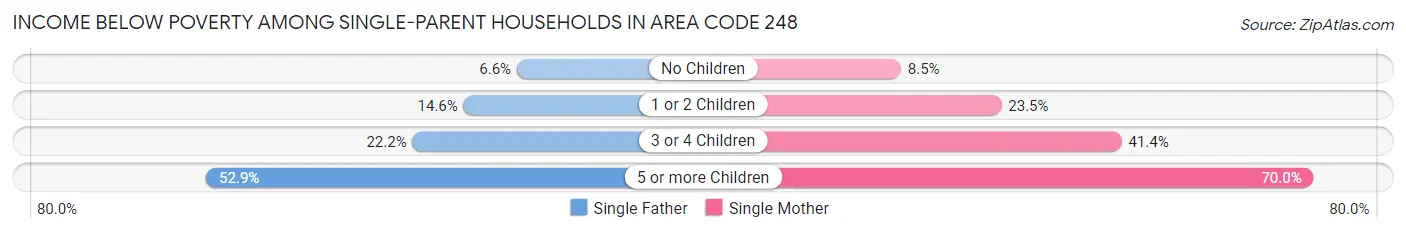
| Children | Single Father | Single Mother |
| No Children | 950 (6.6%) | 2,948 (8.5%) |
| 1 or 2 Children | 1,804 (14.6%) | 8,369 (23.5%) |
| 3 or 4 Children | 370 (22.2%) | 2,551 (41.4%) |
| 5 or more Children | 27 (52.9%) | 483 (70.0%) |
| Total | 3,151 (11.1%) | 14,351 (18.6%) |
Income Below Poverty Among Married-Couple vs Single-Parent Households in Area Code 248
The poverty data for Area Code 248 shows that 8,916 of the married-couple family households (2.8%) and 17,502 of the single-parent households (16.6%) are living below the poverty level. Within the married-couple family households, those with 5 or more children have the highest poverty rate, with 415 households (21.1%) falling below the poverty line. Among the single-parent households, those with 5 or more children have the highest poverty rate, with 510 household (68.8%) living below poverty.
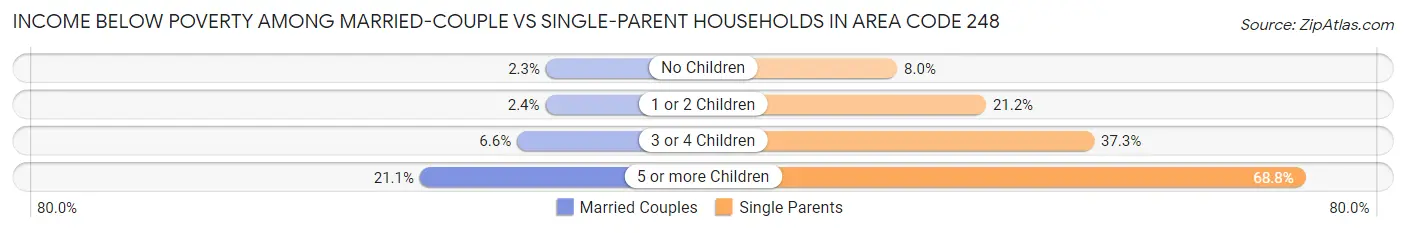
| Children | Married-Couple Families | Single-Parent Households |
| No Children | 4,450 (2.3%) | 3,898 (8.0%) |
| 1 or 2 Children | 2,484 (2.4%) | 10,173 (21.2%) |
| 3 or 4 Children | 1,567 (6.6%) | 2,921 (37.3%) |
| 5 or more Children | 415 (21.1%) | 510 (68.8%) |
| Total | 8,916 (2.8%) | 17,502 (16.6%) |
Race in Area Code 248
The most populous races in Area Code 248 are White / Caucasian (1,132,080 | 67.4%), Black / African American (317,216 | 18.9%), and Asian (117,585 | 7.0%).
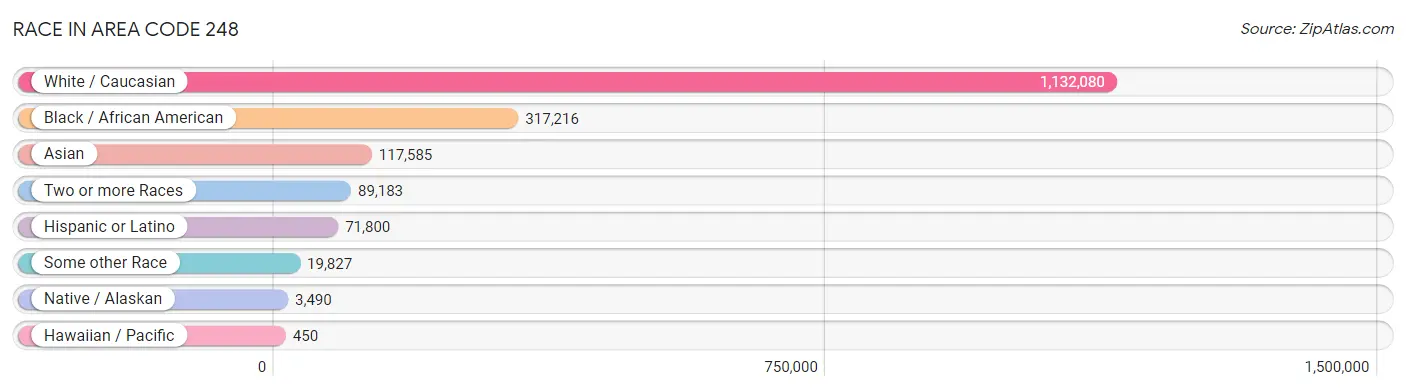
| Race | # Population | % Population |
| Asian | 117,585 | 7.0% |
| Black / African American | 317,216 | 18.9% |
| Hawaiian / Pacific | 450 | 0.0% |
| Hispanic or Latino | 71,800 | 4.3% |
| Native / Alaskan | 3,490 | 0.2% |
| White / Caucasian | 1,132,080 | 67.4% |
| Two or more Races | 89,183 | 5.3% |
| Some other Race | 19,827 | 1.2% |
| Total | 1,679,831 | 100.0% |
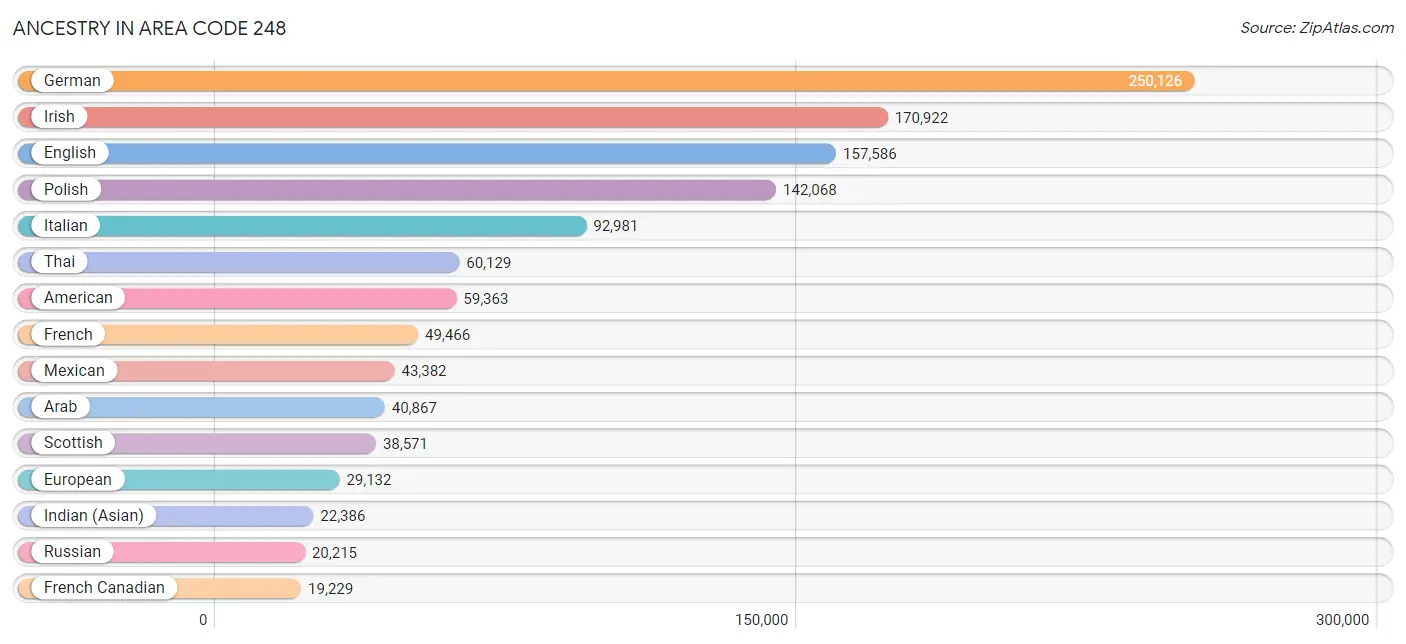
Ancestry in Area Code 248
The most populous ancestries reported in Area Code 248 are German (250,126 | 14.9%), Irish (170,922 | 10.2%), English (157,586 | 9.4%), Polish (142,068 | 8.5%), and Italian (92,981 | 5.5%), together accounting for 48.4% of all Area Code 248 residents.
| Ancestry | # Population | % Population |
| Afghan | 169 | 0.0% |
| African | 9,372 | 0.6% |
| Alaska Native | 62 | 0.0% |
| Alaskan Athabascan | 26 | 0.0% |
| Albanian | 7,888 | 0.5% |
| Alsatian | 38 | 0.0% |
| American | 59,363 | 3.5% |
| Apache | 297 | 0.0% |
| Arab | 40,867 | 2.4% |
| Arapaho | 37 | 0.0% |
| Argentinean | 959 | 0.1% |
| Armenian | 5,005 | 0.3% |
| Assyrian / Chaldean / Syriac | 15,944 | 0.9% |
| Australian | 794 | 0.1% |
| Austrian | 4,372 | 0.3% |
| Bahamian | 260 | 0.0% |
| Bangladeshi | 2,112 | 0.1% |
| Barbadian | 129 | 0.0% |
| Basque | 21 | 0.0% |
| Belgian | 6,133 | 0.4% |
| Belizean | 123 | 0.0% |
| Bermudan | 34 | 0.0% |
| Bhutanese | 10,148 | 0.6% |
| Blackfeet | 812 | 0.1% |
| Bolivian | 76 | 0.0% |
| Brazilian | 1,857 | 0.1% |
| British | 8,292 | 0.5% |
| British West Indian | 128 | 0.0% |
| Bulgarian | 682 | 0.0% |
| Burmese | 12,377 | 0.7% |
| Cajun | 56 | 0.0% |
| Cambodian | 60 | 0.0% |
| Canadian | 8,792 | 0.5% |
| Carpatho Rusyn | 143 | 0.0% |
| Celtic | 96 | 0.0% |
| Central American | 3,834 | 0.2% |
| Central American Indian | 272 | 0.0% |
| Cherokee | 3,902 | 0.2% |
| Chickasaw | 22 | 0.0% |
| Chilean | 340 | 0.0% |
| Chinese | 23 | 0.0% |
| Chippewa | 2,611 | 0.2% |
| Choctaw | 274 | 0.0% |
| Colombian | 1,627 | 0.1% |
| Comanche | 29 | 0.0% |
| Costa Rican | 185 | 0.0% |
| Cree | 32 | 0.0% |
| Creek | 159 | 0.0% |
| Croatian | 3,711 | 0.2% |
| Cuban | 1,816 | 0.1% |
| Cypriot | 411 | 0.0% |
| Czech | 5,666 | 0.3% |
| Czechoslovakian | 2,021 | 0.1% |
| Danish | 4,309 | 0.3% |
| Delaware | 17 | 0.0% |
| Dominican | 1,011 | 0.1% |
| Dutch | 18,174 | 1.1% |
| Dutch West Indian | 52 | 0.0% |
| Eastern European | 9,155 | 0.5% |
| Ecuadorian | 383 | 0.0% |
| Egyptian | 2,080 | 0.1% |
| English | 157,586 | 9.4% |
| Estonian | 229 | 0.0% |
| Ethiopian | 105 | 0.0% |
| European | 29,132 | 1.7% |
| Filipino | 795 | 0.1% |
| Finnish | 12,598 | 0.7% |
| French | 49,466 | 2.9% |
| French American Indian | 260 | 0.0% |
| French Canadian | 19,229 | 1.1% |
| German | 250,126 | 14.9% |
| German Russian | 81 | 0.0% |
| Ghanaian | 362 | 0.0% |
| Greek | 10,671 | 0.6% |
| Guamanian / Chamorro | 324 | 0.0% |
| Guatemalan | 738 | 0.0% |
| Guyanese | 106 | 0.0% |
| Haitian | 474 | 0.0% |
| Hmong | 1 | 0.0% |
| Honduran | 915 | 0.1% |
| Hopi | 34 | 0.0% |
| Hungarian | 15,073 | 0.9% |
| Icelander | 113 | 0.0% |
| Indian (Asian) | 22,386 | 1.3% |
| Inupiat | 2 | 0.0% |
| Iranian | 1,450 | 0.1% |
| Iraqi | 11,993 | 0.7% |
| Irish | 170,922 | 10.2% |
| Iroquois | 383 | 0.0% |
| Israeli | 1,488 | 0.1% |
| Italian | 92,981 | 5.5% |
| Jamaican | 2,861 | 0.2% |
| Japanese | 261 | 0.0% |
| Jordanian | 1,134 | 0.1% |
| Kenyan | 65 | 0.0% |
| Korean | 11,672 | 0.7% |
| Laotian | 282 | 0.0% |
| Latvian | 792 | 0.1% |
| Lebanese | 11,108 | 0.7% |
| Liberian | 462 | 0.0% |
| Lithuanian | 6,196 | 0.4% |
| Lumbee | 202 | 0.0% |
| Luxembourger | 119 | 0.0% |
| Macedonian | 3,201 | 0.2% |
| Malaysian | 772 | 0.1% |
| Maltese | 4,333 | 0.3% |
| Menominee | 6 | 0.0% |
| Mexican | 43,382 | 2.6% |
| Mexican American Indian | 786 | 0.1% |
| Mongolian | 199 | 0.0% |
| Moroccan | 561 | 0.0% |
| Native Hawaiian | 434 | 0.0% |
| Navajo | 97 | 0.0% |
| New Zealander | 222 | 0.0% |
| Nicaraguan | 294 | 0.0% |
| Nigerian | 3,088 | 0.2% |
| Northern European | 1,715 | 0.1% |
| Norwegian | 10,069 | 0.6% |
| Okinawan | 27 | 0.0% |
| Osage | 7 | 0.0% |
| Ottawa | 192 | 0.0% |
| Pakistani | 1,259 | 0.1% |
| Palestinian | 1,404 | 0.1% |
| Panamanian | 479 | 0.0% |
| Paraguayan | 38 | 0.0% |
| Pennsylvania German | 306 | 0.0% |
| Peruvian | 740 | 0.0% |
| Polish | 142,068 | 8.5% |
| Portuguese | 1,619 | 0.1% |
| Potawatomi | 183 | 0.0% |
| Puerto Rican | 9,741 | 0.6% |
| Puget Sound Salish | 23 | 0.0% |
| Romanian | 7,775 | 0.5% |
| Russian | 20,215 | 1.2% |
| Salvadoran | 1,169 | 0.1% |
| Samoan | 58 | 0.0% |
| Scandinavian | 4,390 | 0.3% |
| Scotch-Irish | 11,869 | 0.7% |
| Scottish | 38,571 | 2.3% |
| Seminole | 26 | 0.0% |
| Senegalese | 168 | 0.0% |
| Serbian | 1,780 | 0.1% |
| Sierra Leonean | 48 | 0.0% |
| Sioux | 280 | 0.0% |
| Slavic | 1,034 | 0.1% |
| Slovak | 4,473 | 0.3% |
| Slovene | 1,115 | 0.1% |
| South African | 653 | 0.0% |
| South American | 4,702 | 0.3% |
| South American Indian | 151 | 0.0% |
| Soviet Union | 211 | 0.0% |
| Spaniard | 1,617 | 0.1% |
| Spanish | 2,855 | 0.2% |
| Spanish American | 29 | 0.0% |
| Spanish American Indian | 12 | 0.0% |
| Sri Lankan | 4,144 | 0.3% |
| Subsaharan African | 16,068 | 1.0% |
| Sudanese | 384 | 0.0% |
| Swedish | 14,550 | 0.9% |
| Swiss | 2,763 | 0.2% |
| Syrian | 3,161 | 0.2% |
| Thai | 60,129 | 3.6% |
| Tlingit-Haida | 9 | 0.0% |
| Tongan | 1 | 0.0% |
| Trinidadian and Tobagonian | 419 | 0.0% |
| Turkish | 581 | 0.0% |
| Ugandan | 37 | 0.0% |
| Ukrainian | 12,307 | 0.7% |
| Uruguayan | 24 | 0.0% |
| Venezuelan | 471 | 0.0% |
| Vietnamese | 1,237 | 0.1% |
| Welsh | 7,131 | 0.4% |
| West Indian | 151 | 0.0% |
| Yaqui | 10 | 0.0% |
| Yugoslavian | 1,809 | 0.1% |
| Zimbabwean | 13 | 0.0% | View All 176 Rows |
Immigrants in Area Code 248
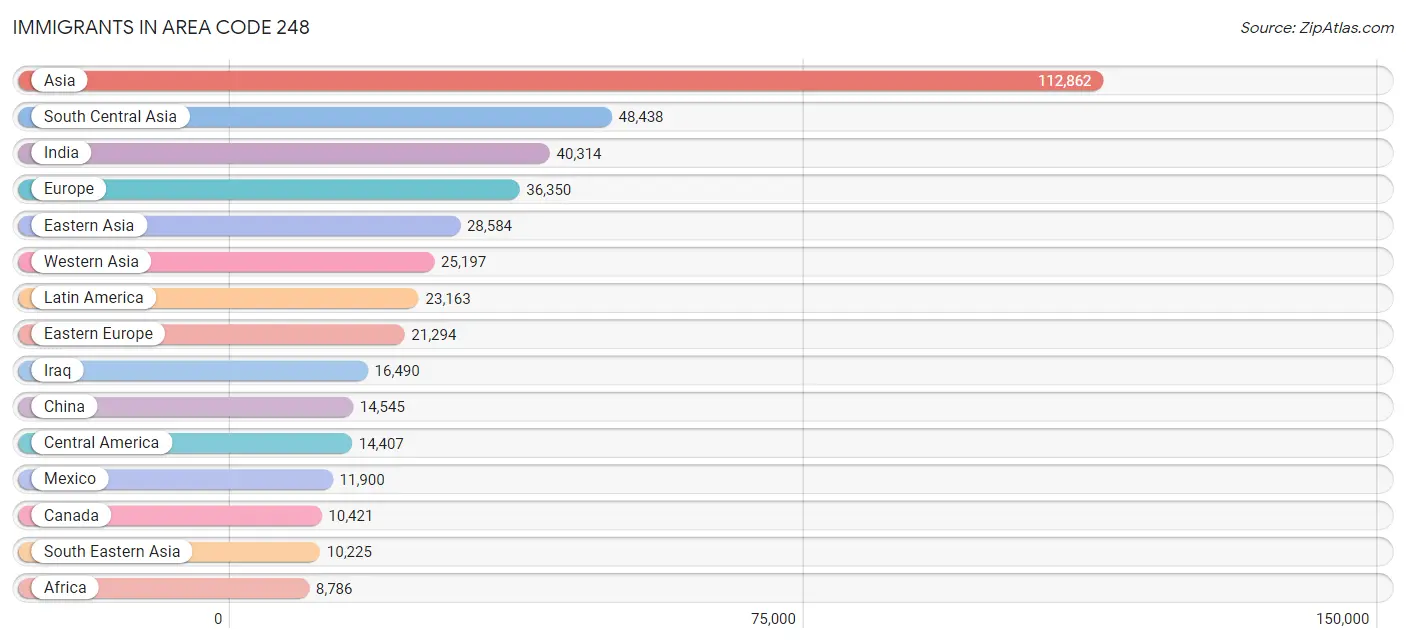
The most numerous immigrant groups reported in Area Code 248 came from Asia (112,862 | 6.7%), South Central Asia (48,438 | 2.9%), India (40,314 | 2.4%), Europe (36,350 | 2.2%), and Eastern Asia (28,584 | 1.7%), together accounting for 15.9% of all Area Code 248 residents.
| Immigration Origin | # Population | % Population |
| Afghanistan | 327 | 0.0% |
| Africa | 8,786 | 0.5% |
| Albania | 3,624 | 0.2% |
| Argentina | 544 | 0.0% |
| Armenia | 297 | 0.0% |
| Asia | 112,862 | 6.7% |
| Australia | 515 | 0.0% |
| Austria | 301 | 0.0% |
| Bahamas | 232 | 0.0% |
| Bangladesh | 1,298 | 0.1% |
| Barbados | 27 | 0.0% |
| Belarus | 348 | 0.0% |
| Belgium | 367 | 0.0% |
| Belize | 58 | 0.0% |
| Bolivia | 34 | 0.0% |
| Bosnia and Herzegovina | 394 | 0.0% |
| Brazil | 2,848 | 0.2% |
| Bulgaria | 414 | 0.0% |
| Cambodia | 194 | 0.0% |
| Cameroon | 463 | 0.0% |
| Canada | 10,421 | 0.6% |
| Caribbean | 3,085 | 0.2% |
| Central America | 14,407 | 0.9% |
| Chile | 217 | 0.0% |
| China | 14,545 | 0.9% |
| Colombia | 1,052 | 0.1% |
| Congo | 8 | 0.0% |
| Costa Rica | 245 | 0.0% |
| Croatia | 192 | 0.0% |
| Cuba | 512 | 0.0% |
| Czechoslovakia | 448 | 0.0% |
| Denmark | 111 | 0.0% |
| Dominica | 23 | 0.0% |
| Dominican Republic | 317 | 0.0% |
| Eastern Africa | 965 | 0.1% |
| Eastern Asia | 28,584 | 1.7% |
| Eastern Europe | 21,294 | 1.3% |
| Ecuador | 187 | 0.0% |
| Egypt | 1,580 | 0.1% |
| El Salvador | 519 | 0.0% |
| England | 1,873 | 0.1% |
| Eritrea | 27 | 0.0% |
| Ethiopia | 208 | 0.0% |
| Europe | 36,350 | 2.2% |
| Fiji | 7 | 0.0% |
| France | 978 | 0.1% |
| Germany | 4,604 | 0.3% |
| Ghana | 540 | 0.0% |
| Greece | 644 | 0.0% |
| Guatemala | 417 | 0.0% |
| Guyana | 9 | 0.0% |
| Haiti | 217 | 0.0% |
| Honduras | 971 | 0.1% |
| Hong Kong | 591 | 0.0% |
| Hungary | 211 | 0.0% |
| India | 40,314 | 2.4% |
| Indonesia | 228 | 0.0% |
| Iran | 1,405 | 0.1% |
| Iraq | 16,490 | 1.0% |
| Ireland | 242 | 0.0% |
| Israel | 732 | 0.0% |
| Italy | 2,255 | 0.1% |
| Jamaica | 1,361 | 0.1% |
| Japan | 6,468 | 0.4% |
| Jordan | 759 | 0.1% |
| Kazakhstan | 215 | 0.0% |
| Kenya | 196 | 0.0% |
| Korea | 7,555 | 0.4% |
| Kuwait | 215 | 0.0% |
| Laos | 639 | 0.0% |
| Latin America | 23,163 | 1.4% |
| Latvia | 155 | 0.0% |
| Lebanon | 2,871 | 0.2% |
| Liberia | 207 | 0.0% |
| Lithuania | 238 | 0.0% |
| Malaysia | 237 | 0.0% |
| Mexico | 11,900 | 0.7% |
| Middle Africa | 620 | 0.0% |
| Moldova | 152 | 0.0% |
| Morocco | 254 | 0.0% |
| Nepal | 659 | 0.0% |
| Netherlands | 199 | 0.0% |
| Nicaragua | 159 | 0.0% |
| Nigeria | 2,132 | 0.1% |
| North Macedonia | 1,056 | 0.1% |
| Northern Africa | 2,706 | 0.2% |
| Northern Europe | 4,702 | 0.3% |
| Norway | 42 | 0.0% |
| Oceania | 786 | 0.1% |
| Pakistan | 3,356 | 0.2% |
| Panama | 138 | 0.0% |
| Peru | 354 | 0.0% |
| Philippines | 5,319 | 0.3% |
| Poland | 3,055 | 0.2% |
| Portugal | 138 | 0.0% |
| Romania | 2,855 | 0.2% |
| Russia | 2,753 | 0.2% |
| Saudi Arabia | 509 | 0.0% |
| Scotland | 448 | 0.0% |
| Senegal | 319 | 0.0% |
| Serbia | 295 | 0.0% |
| Sierra Leone | 87 | 0.0% |
| Singapore | 188 | 0.0% |
| South Africa | 719 | 0.0% |
| South America | 5,671 | 0.3% |
| South Central Asia | 48,438 | 2.9% |
| South Eastern Asia | 10,225 | 0.6% |
| Southern Europe | 3,765 | 0.2% |
| Spain | 433 | 0.0% |
| Sri Lanka | 499 | 0.0% |
| St. Vincent and the Grenadines | 25 | 0.0% |
| Sudan | 305 | 0.0% |
| Sweden | 158 | 0.0% |
| Switzerland | 74 | 0.0% |
| Syria | 1,646 | 0.1% |
| Taiwan | 1,737 | 0.1% |
| Thailand | 948 | 0.1% |
| Trinidad and Tobago | 357 | 0.0% |
| Turkey | 384 | 0.0% |
| Uganda | 125 | 0.0% |
| Ukraine | 3,219 | 0.2% |
| Uruguay | 19 | 0.0% |
| Uzbekistan | 304 | 0.0% |
| Venezuela | 341 | 0.0% |
| Vietnam | 2,222 | 0.1% |
| Western Africa | 3,498 | 0.2% |
| Western Asia | 25,197 | 1.5% |
| Western Europe | 6,530 | 0.4% |
| Yemen | 109 | 0.0% |
| Zaire | 14 | 0.0% |
| Zimbabwe | 49 | 0.0% | View All 131 Rows |
Sex and Age in Area Code 248
Sex and Age in Area Code 248
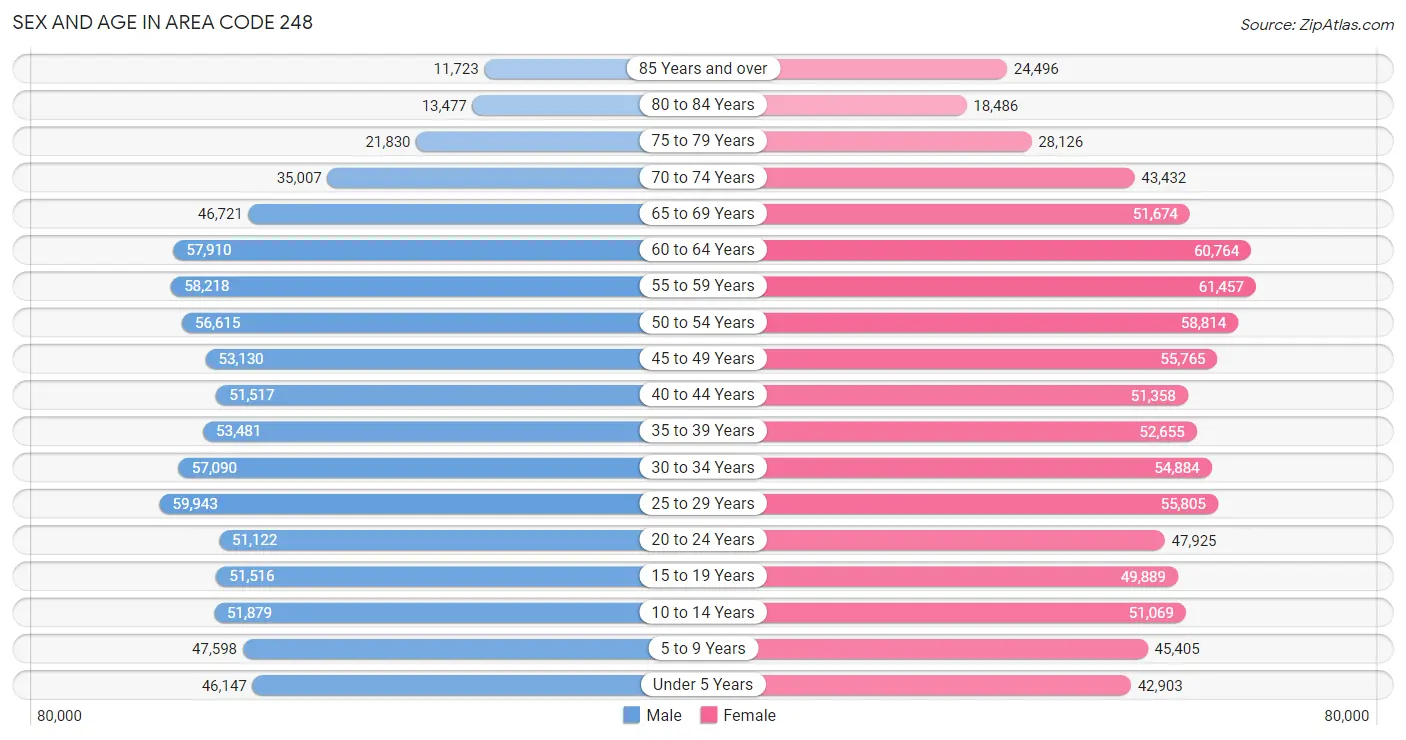
The most populous age groups in Area Code 248 are 25 to 29 Years (59,943 | 7.3%) for men and 55 to 59 Years (61,457 | 7.2%) for women.
| Age Bracket | Male | Female |
| Under 5 Years | 46,147 (5.6%) | 42,903 (5.0%) |
| 5 to 9 Years | 47,598 (5.8%) | 45,405 (5.3%) |
| 10 to 14 Years | 51,879 (6.3%) | 51,069 (6.0%) |
| 15 to 19 Years | 51,516 (6.2%) | 49,889 (5.8%) |
| 20 to 24 Years | 51,122 (6.2%) | 47,925 (5.6%) |
| 25 to 29 Years | 59,943 (7.3%) | 55,805 (6.5%) |
| 30 to 34 Years | 57,090 (6.9%) | 54,884 (6.4%) |
| 35 to 39 Years | 53,481 (6.5%) | 52,655 (6.2%) |
| 40 to 44 Years | 51,517 (6.2%) | 51,358 (6.0%) |
| 45 to 49 Years | 53,130 (6.4%) | 55,765 (6.5%) |
| 50 to 54 Years | 56,615 (6.9%) | 58,814 (6.9%) |
| 55 to 59 Years | 58,218 (7.1%) | 61,457 (7.2%) |
| 60 to 64 Years | 57,910 (7.0%) | 60,764 (7.1%) |
| 65 to 69 Years | 46,721 (5.7%) | 51,674 (6.0%) |
| 70 to 74 Years | 35,007 (4.2%) | 43,432 (5.1%) |
| 75 to 79 Years | 21,830 (2.6%) | 28,126 (3.3%) |
| 80 to 84 Years | 13,477 (1.6%) | 18,486 (2.2%) |
| 85 Years and over | 11,723 (1.4%) | 24,496 (2.9%) |
| Total | 824,924 (100.0%) | 854,907 (100.0%) |
Families and Households in Area Code 248
Median Family Size in Area Code 248
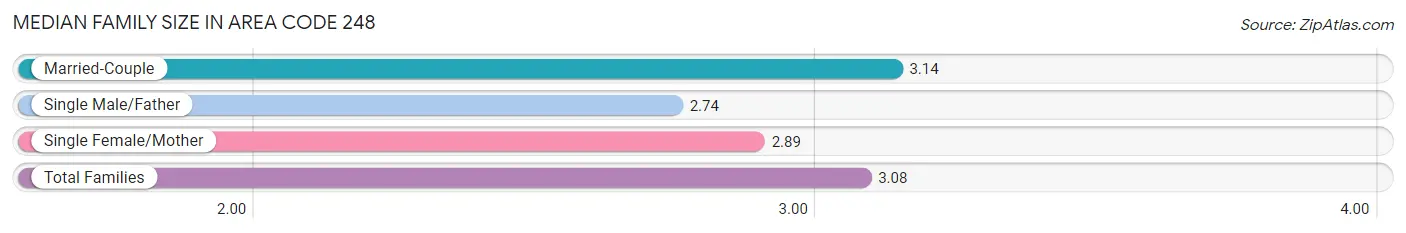
The median family size in Area Code 248 is 3.08 persons per family, with married-couple families (318,977 | 75.1%) accounting for the largest median family size of 3.13604 persons per family. On the other hand, single male/father families (28,396 | 6.7%) represent the smallest median family size with 2.74 persons per family.
| Family Type | # Families | Family Size |
| Married-Couple | 318,977 (75.1%) | 3.14 |
| Single Male/Father | 28,396 (6.7%) | 2.74 |
| Single Female/Mother | 77,082 (18.2%) | 2.89 |
| Total Families | 424,455 (100.0%) | 3.08 |
Median Household Size in Area Code 248
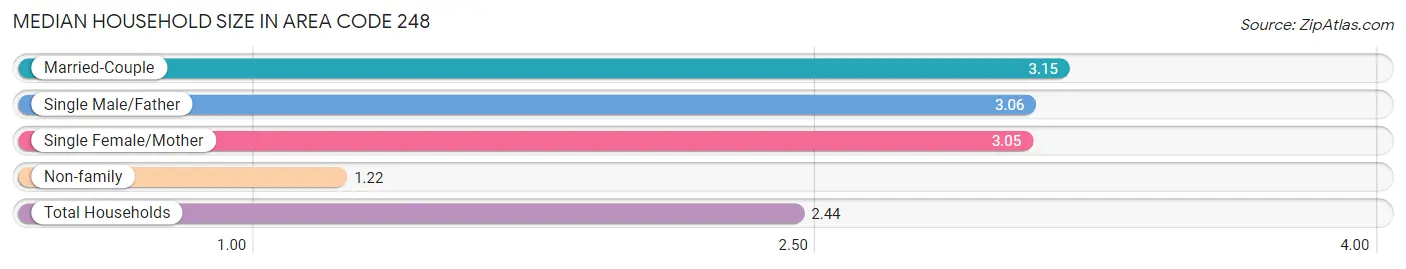
The median household size in Area Code 248 is 2.44 persons per household, with married-couple households (318,977 | 46.1%) accounting for the largest median household size of 3.15123 persons per household. non-family households (268,040 | 38.7%) represent the smallest median household size with 1.22 persons per household.
| Household Type | # Households | Household Size |
| Married-Couple | 318,977 (46.1%) | 3.15 |
| Single Male/Father | 28,396 (4.1%) | 3.06 |
| Single Female/Mother | 77,082 (11.1%) | 3.05 |
| Non-family | 268,040 (38.7%) | 1.22 |
| Total Households | 692,495 (100.0%) | 2.44 |
Household Size by Marriage Status in Area Code 248
Out of a total of 692,495 households in Area Code 248, 424,455 (61.3%) are family households, while 268,040 (38.7%) are nonfamily households. The most numerous type of family households are 2-person households, comprising 193,624, and the most common type of nonfamily households are 1-person households, comprising 223,990.
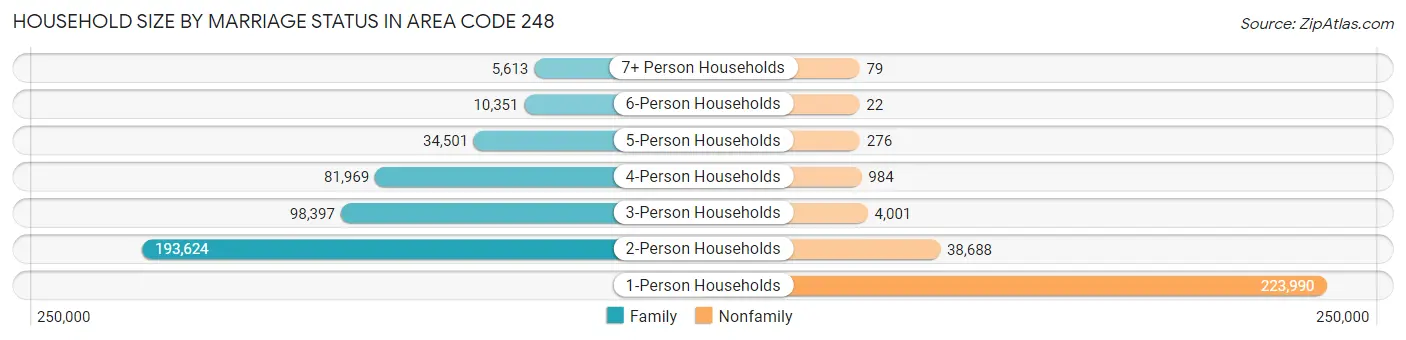
| Household Size | Family Households | Nonfamily Households |
| 1-Person Households | - | 223,990 (32.4%) |
| 2-Person Households | 193,624 (28.0%) | 38,688 (5.6%) |
| 3-Person Households | 98,397 (14.2%) | 4,001 (0.6%) |
| 4-Person Households | 81,969 (11.8%) | 984 (0.1%) |
| 5-Person Households | 34,501 (5.0%) | 276 (0.0%) |
| 6-Person Households | 10,351 (1.5%) | 22 (0.0%) |
| 7+ Person Households | 5,613 (0.8%) | 79 (0.0%) |
| Total | 424,455 (61.3%) | 268,040 (38.7%) |
Female Fertility in Area Code 248
Fertility by Age in Area Code 248
Average fertility rate in Area Code 248 is 46.5 births per 1,000 women. Women in the age bracket of 20 to 34 years have the highest fertility rate with 75.6 births per 1,000 women. Women in the age bracket of 20 to 34 years acount for 64.8% of all women with births.
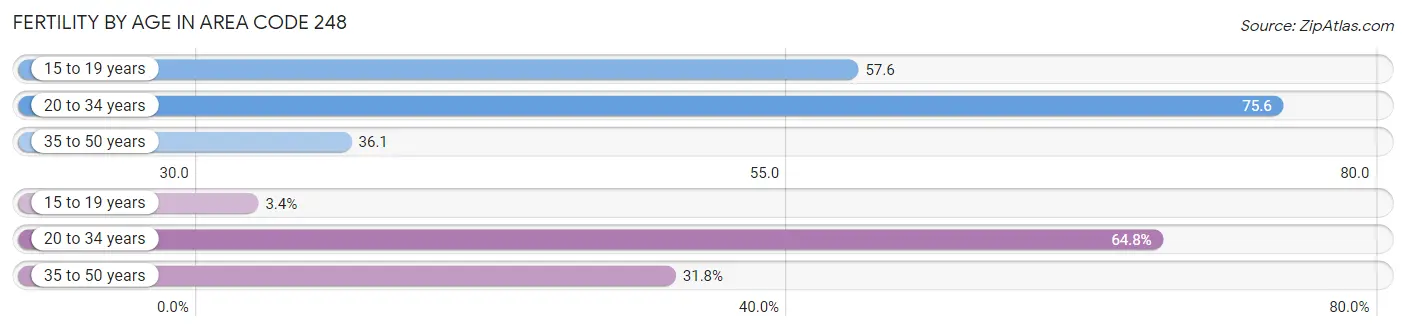
| Age Bracket | Women with Births | Births / 1,000 Women |
| 15 to 19 years | 628 (3.4%) | 57.6 |
| 20 to 34 years | 11,915 (64.8%) | 75.6 |
| 35 to 50 years | 5,834 (31.8%) | 36.1 |
| Total | 18,377 (100.0%) | 46.5 |
Fertility by Age by Marriage Status in Area Code 248
72.0% of women with births (18,377) in Area Code 248 are married. The highest percentage of unmarried women with births falls into 15 to 19 years age bracket with 98.4% of them unmarried at the time of birth, while the lowest percentage of unmarried women with births belong to 20 to 34 years age bracket with 33.3% of them unmarried.
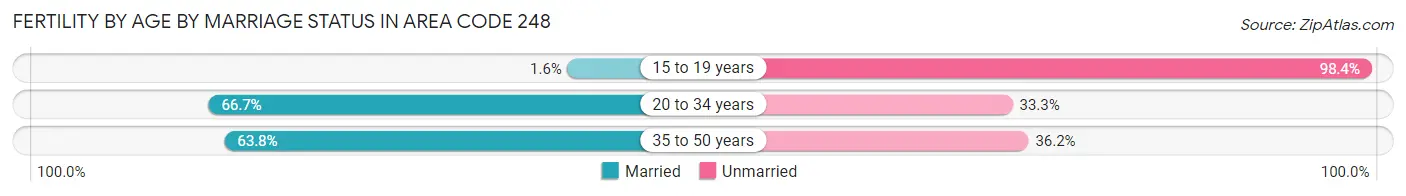
| Age Bracket | Married | Unmarried |
| 15 to 19 years | 10 (1.6%) | 618 (98.4%) |
| 20 to 34 years | 7,945 (66.7%) | 3,970 (33.3%) |
| 35 to 50 years | 3,722 (63.8%) | 2,112 (36.2%) |
| Total | 13,234 (72.0%) | 5,143 (28.0%) |
Fertility by Education in Area Code 248
Average fertility rate in Area Code 248 is 46.5 births per 1,000 women. Women with the education attainment of graduate degree have the highest fertility rate of 74.9 births per 1,000 women, while women with the education attainment of less than high school have the lowest fertility at 45.7 births per 1,000 women. Women with the education attainment of bachelor's degree represent 27.6% of all women with births.
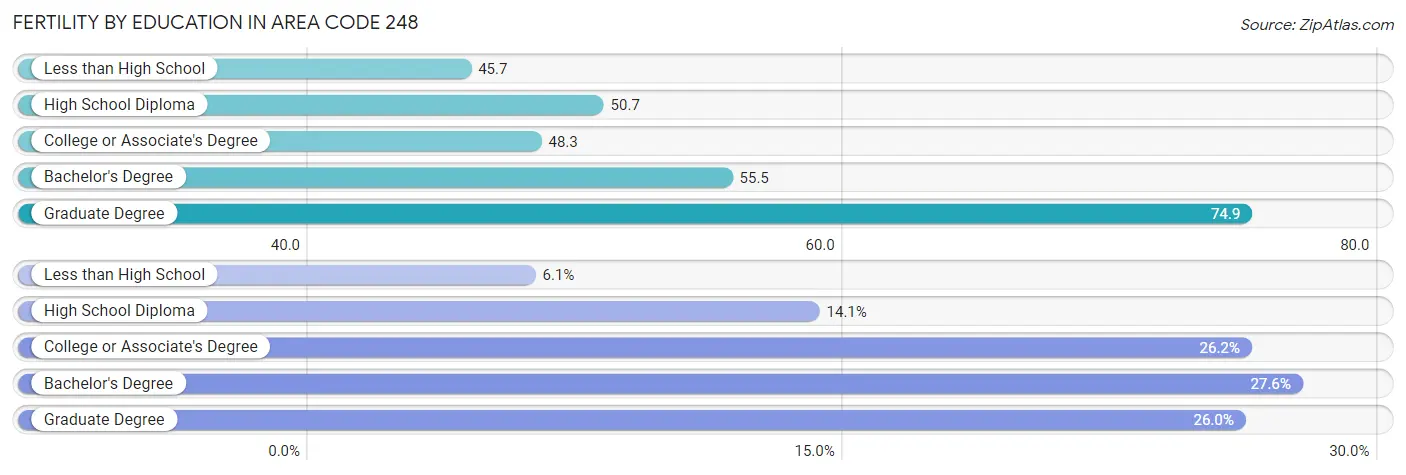
| Educational Attainment | Women with Births | Births / 1,000 Women |
| Less than High School | 1,118 (6.1%) | 45.7 |
| High School Diploma | 2,583 (14.1%) | 50.7 |
| College or Associate's Degree | 4,815 (26.2%) | 48.3 |
| Bachelor's Degree | 5,077 (27.6%) | 55.5 |
| Graduate Degree | 4,784 (26.0%) | 74.9 |
| Total | 18,377 (100.0%) | 46.5 |
Fertility by Education by Marriage Status in Area Code 248
28.0% of women with births in Area Code 248 are unmarried. Women with the educational attainment of bachelor's degree are most likely to be married with 70.1% of them married at childbirth, while women with the educational attainment of less than high school are least likely to be married with 86.4% of them unmarried at childbirth.
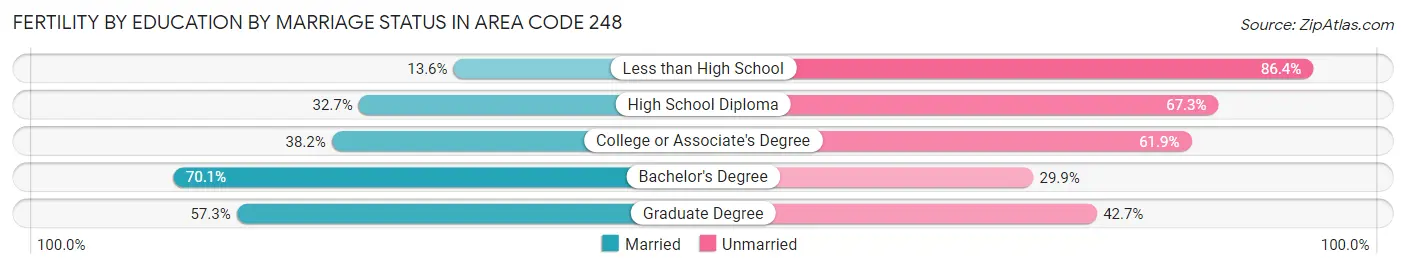
| Educational Attainment | Married | Unmarried |
| Less than High School | 152 (13.6%) | 966 (86.4%) |
| High School Diploma | 845 (32.7%) | 1,738 (67.3%) |
| College or Associate's Degree | 1,837 (38.2%) | 2,978 (61.9%) |
| Bachelor's Degree | 3,560 (70.1%) | 1,517 (29.9%) |
| Graduate Degree | 2,741 (57.3%) | 2,043 (42.7%) |
| Total | 13,234 (72.0%) | 5,143 (28.0%) |
Employment Characteristics in Area Code 248
Employment by Class of Employer in Area Code 248
Among the 824,623 employed individuals in Area Code 248, private company employees (603,766 | 73.2%), not-for-profit organizations (70,695 | 8.6%), and local government employees (42,309 | 5.1%) make up the most common classes of employment.
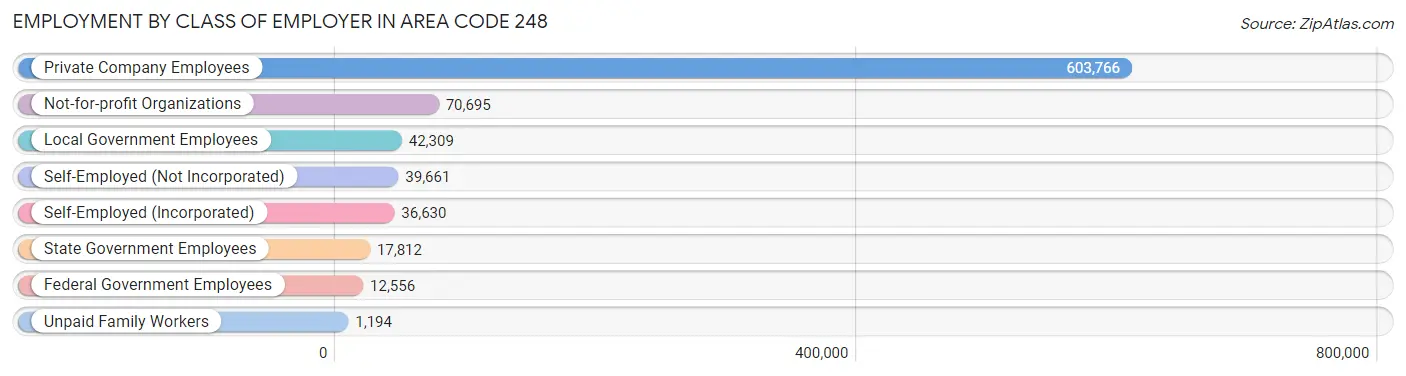
| Employer Class | # Employees | % Employees |
| Private Company Employees | 603,766 | 73.2% |
| Self-Employed (Incorporated) | 36,630 | 4.4% |
| Self-Employed (Not Incorporated) | 39,661 | 4.8% |
| Not-for-profit Organizations | 70,695 | 8.6% |
| Local Government Employees | 42,309 | 5.1% |
| State Government Employees | 17,812 | 2.2% |
| Federal Government Employees | 12,556 | 1.5% |
| Unpaid Family Workers | 1,194 | 0.1% |
| Total | 824,623 | 100.0% |
Employment Status by Age in Area Code 248
According to the labor force statistics for Area Code 248, out of the total population over 16 years of age (1,373,386), 65.4% or 898,469 individuals are in the labor force, with 5.3% or 47,799 of them unemployed. The age group with the highest labor force participation rate is 25 to 29 years, with 86.4% or 100,053 individuals in the labor force. Within the labor force, the 16 to 19 years age range has the highest percentage of unemployed individuals, with 1,197.1% or 414,951 of them being unemployed.
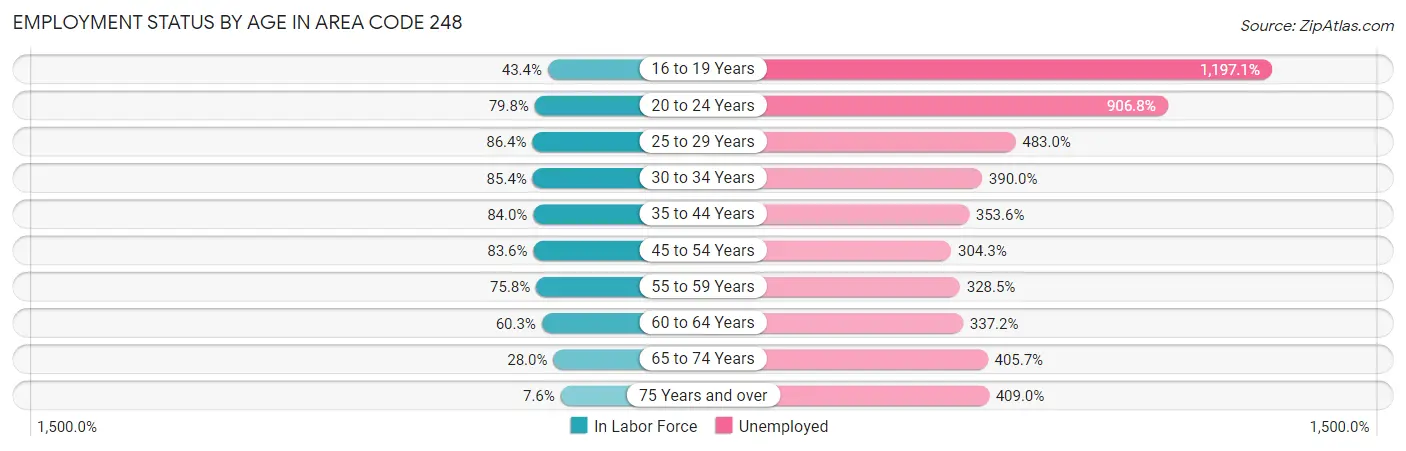
| Age Bracket | In Labor Force | Unemployed |
| 16 to 19 Years | 34,666 (43.3%) | 414,951 (1,197.1%) |
| 20 to 24 Years | 79,037 (79.8%) | 716,735 (906.8%) |
| 25 to 29 Years | 100,053 (86.4%) | 483,256 (483.0%) |
| 30 to 34 Years | 95,640 (85.4%) | 372,984 (390.0%) |
| 35 to 44 Years | 175,531 (84.0%) | 620,663 (353.6%) |
| 45 to 54 Years | 187,626 (83.6%) | 570,943 (304.3%) |
| 55 to 59 Years | 90,764 (75.8%) | 298,153 (328.5%) |
| 60 to 64 Years | 71,563 (60.3%) | 241,300 (337.2%) |
| 65 to 74 Years | 49,424 (28.0%) | 200,517 (405.7%) |
| 75 Years and over | 9,013 (7.6%) | 36,867 (409.0%) |
| Total | 898,432 (65.4%) | 47,774 (5.3%) |
Employment Status by Educational Attainment in Area Code 248
According to labor force statistics for Area Code 248, 80.3% of individuals (722,403) out of the total population between 25 and 64 years of age (899,406) are in the labor force, with 348.0% or 2,513,962 of them being unemployed. The group with the highest labor force participation rate are those with the educational attainment of bachelor's degree or higher, with 86.5% or 378,713 individuals in the labor force. Within the labor force, individuals with less than high school education have the highest percentage of unemployment, with 679.2% or 173,427 of them being unemployed.
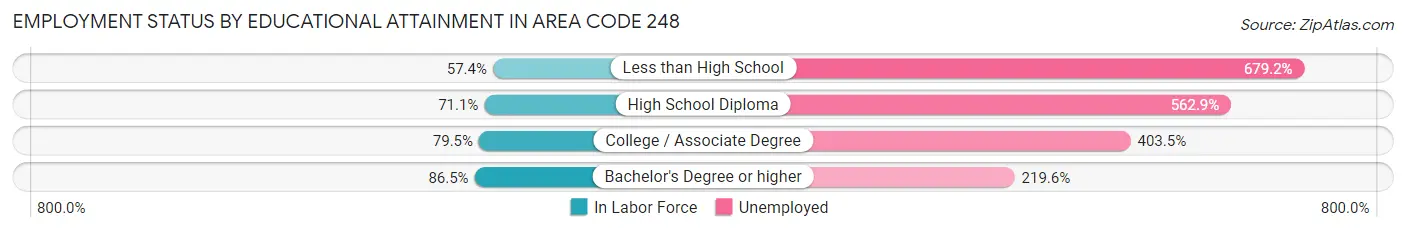
| Educational Attainment | In Labor Force | Unemployed |
| Less than High School | 25,532 (57.4%) | 302,027 (679.2%) |
| High School Diploma | 116,046 (71.1%) | 919,233 (562.9%) |
| College / Associate Degree | 201,726 (79.5%) | 1,023,538 (403.5%) |
| Bachelor's Degree or higher | 378,709 (86.5%) | 961,782 (219.6%) |
| Total | 722,434 (80.3%) | 3,129,933 (348.0%) |
Employment Occupations by Sex in Area Code 248
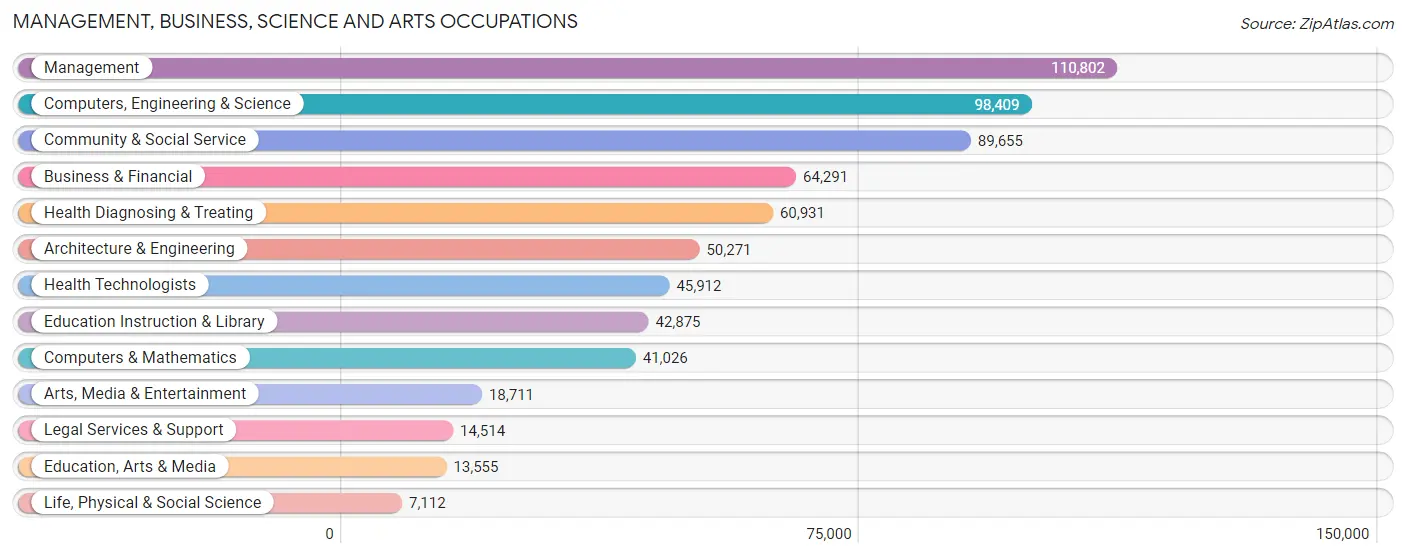
Management, Business, Science and Arts Occupations
The most common Management, Business, Science and Arts occupations in Area Code 248 are Management (110,802 | 13.1%), Computers, Engineering & Science (98,409 | 11.7%), Community & Social Service (89,655 | 10.6%), Business & Financial (64,291 | 7.6%), and Health Diagnosing & Treating (60,931 | 7.2%).
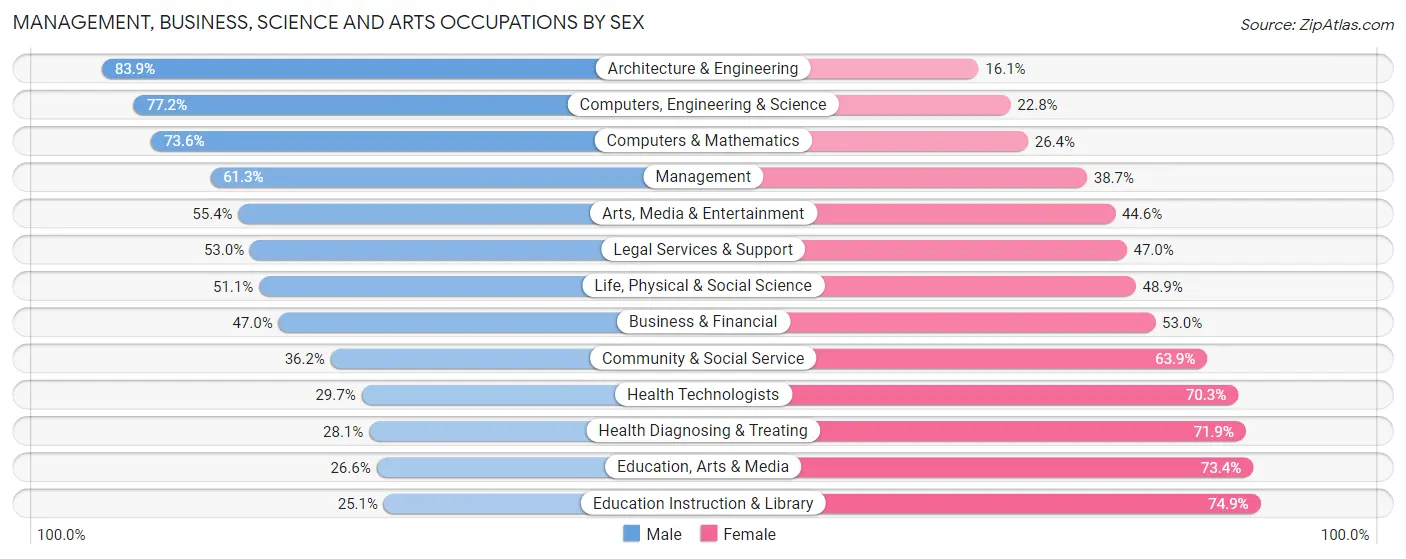
Management, Business, Science and Arts Occupations by Sex
Within the Management, Business, Science and Arts occupations in Area Code 248, the most male-oriented occupations are Architecture & Engineering (83.9%), Computers, Engineering & Science (77.2%), and Computers & Mathematics (73.6%), while the most female-oriented occupations are Education Instruction & Library (74.9%), Education, Arts & Media (73.4%), and Health Diagnosing & Treating (71.9%).
| Occupation | Male | Female |
| Management | 67,897 (61.3%) | 42,905 (38.7%) |
| Business & Financial | 30,241 (47.0%) | 34,050 (53.0%) |
| Computers, Engineering & Science | 75,985 (77.2%) | 22,424 (22.8%) |
| Computers & Mathematics | 30,181 (73.6%) | 10,845 (26.4%) |
| Architecture & Engineering | 42,170 (83.9%) | 8,101 (16.1%) |
| Life, Physical & Social Science | 3,634 (51.1%) | 3,478 (48.9%) |
| Community & Social Service | 32,409 (36.1%) | 57,246 (63.8%) |
| Education, Arts & Media | 3,606 (26.6%) | 9,949 (73.4%) |
| Legal Services & Support | 7,690 (53.0%) | 6,824 (47.0%) |
| Education Instruction & Library | 10,748 (25.1%) | 32,127 (74.9%) |
| Arts, Media & Entertainment | 10,365 (55.4%) | 8,346 (44.6%) |
| Health Diagnosing & Treating | 17,140 (28.1%) | 43,791 (71.9%) |
| Health Technologists | 13,648 (29.7%) | 32,264 (70.3%) |
| Total (Category) | 223,672 (52.7%) | 200,416 (47.3%) |
| Total (Overall) | 448,958 (53.2%) | 394,965 (46.8%) |
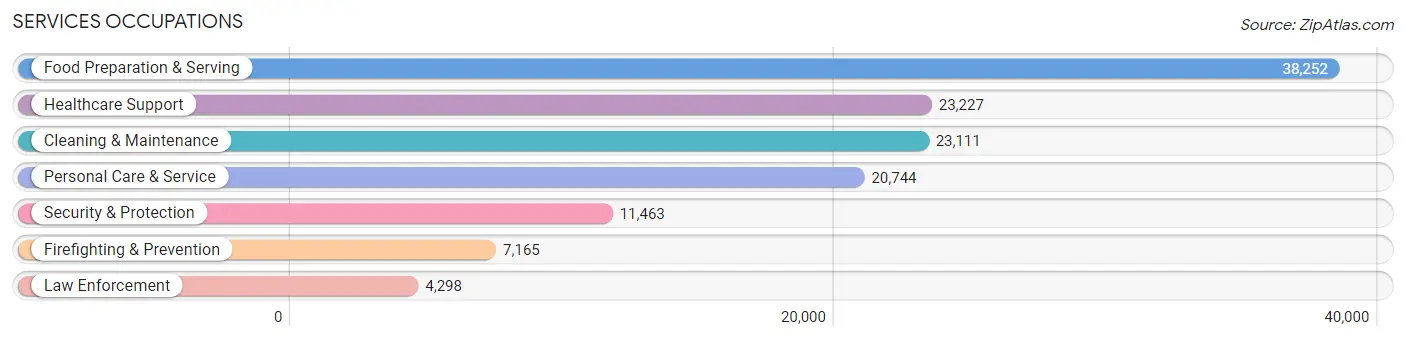
Services Occupations
The most common Services occupations in Area Code 248 are Food Preparation & Serving (38,252 | 4.5%), Healthcare Support (23,227 | 2.8%), Cleaning & Maintenance (23,111 | 2.7%), Personal Care & Service (20,744 | 2.5%), and Security & Protection (11,463 | 1.4%).
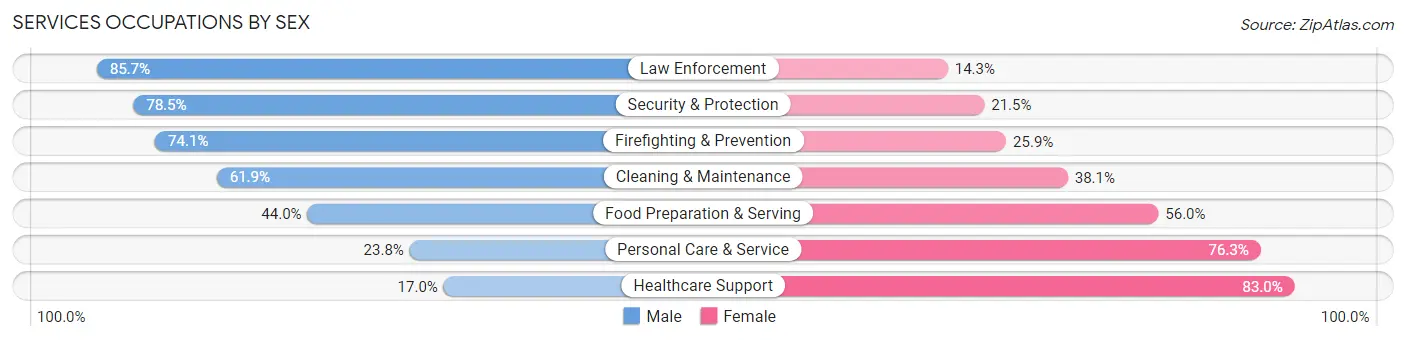
Services Occupations by Sex
Within the Services occupations in Area Code 248, the most male-oriented occupations are Law Enforcement (85.7%), Security & Protection (78.5%), and Firefighting & Prevention (74.1%), while the most female-oriented occupations are Healthcare Support (83.0%), Personal Care & Service (76.2%), and Food Preparation & Serving (56.0%).
| Occupation | Male | Female |
| Healthcare Support | 3,954 (17.0%) | 19,273 (83.0%) |
| Security & Protection | 8,995 (78.5%) | 2,468 (21.5%) |
| Firefighting & Prevention | 5,312 (74.1%) | 1,853 (25.9%) |
| Law Enforcement | 3,683 (85.7%) | 615 (14.3%) |
| Food Preparation & Serving | 16,830 (44.0%) | 21,422 (56.0%) |
| Cleaning & Maintenance | 14,313 (61.9%) | 8,798 (38.1%) |
| Personal Care & Service | 4,926 (23.7%) | 15,818 (76.2%) |
| Total (Category) | 49,018 (42.0%) | 67,779 (58.0%) |
| Total (Overall) | 448,958 (53.2%) | 394,965 (46.8%) |
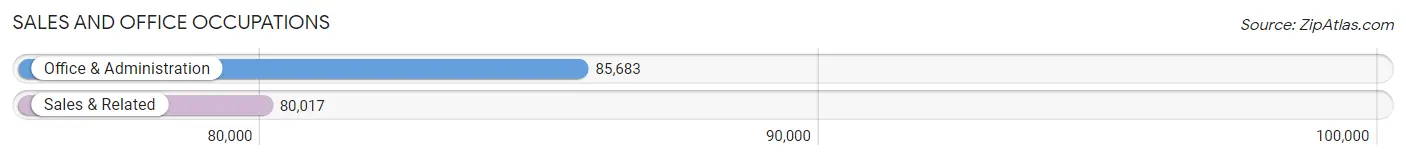
Sales and Office Occupations
The most common Sales and Office occupations in Area Code 248 are Office & Administration (85,683 | 10.2%), and Sales & Related (80,017 | 9.5%).
Sales and Office Occupations by Sex
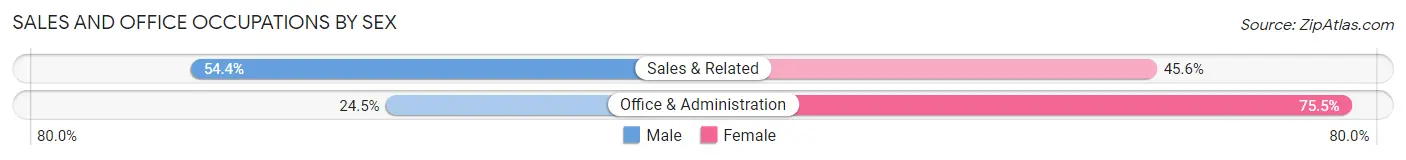
| Occupation | Male | Female |
| Sales & Related | 43,564 (54.4%) | 36,453 (45.6%) |
| Office & Administration | 20,985 (24.5%) | 64,698 (75.5%) |
| Total (Category) | 64,549 (39.0%) | 101,151 (61.0%) |
| Total (Overall) | 448,958 (53.2%) | 394,965 (46.8%) |
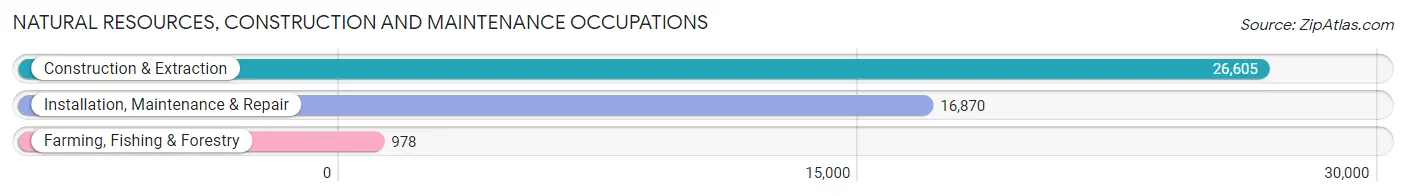
Natural Resources, Construction and Maintenance Occupations
The most common Natural Resources, Construction and Maintenance occupations in Area Code 248 are Construction & Extraction (26,605 | 3.2%), Installation, Maintenance & Repair (16,870 | 2.0%), and Farming, Fishing & Forestry (978 | 0.1%).
Natural Resources, Construction and Maintenance Occupations by Sex
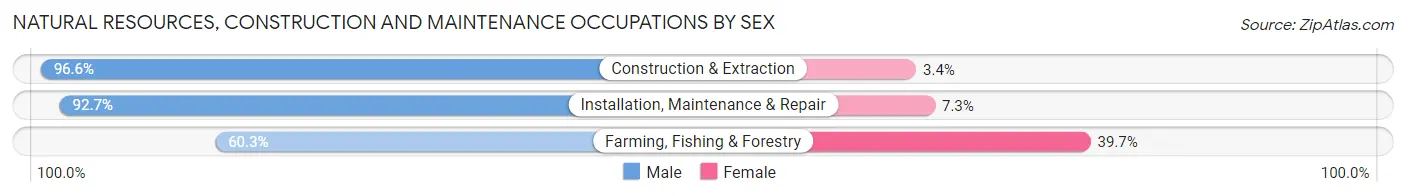
| Occupation | Male | Female |
| Farming, Fishing & Forestry | 590 (60.3%) | 388 (39.7%) |
| Construction & Extraction | 25,711 (96.6%) | 894 (3.4%) |
| Installation, Maintenance & Repair | 15,639 (92.7%) | 1,231 (7.3%) |
| Total (Category) | 41,940 (94.4%) | 2,513 (5.7%) |
| Total (Overall) | 448,958 (53.2%) | 394,965 (46.8%) |
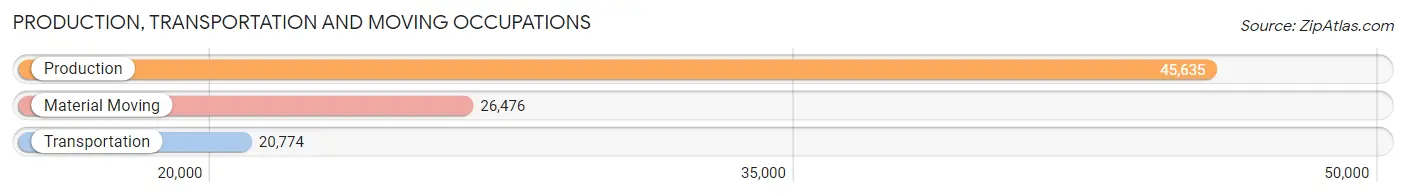
Production, Transportation and Moving Occupations
The most common Production, Transportation and Moving occupations in Area Code 248 are Production (45,635 | 5.4%), Material Moving (26,476 | 3.1%), and Transportation (20,774 | 2.5%).
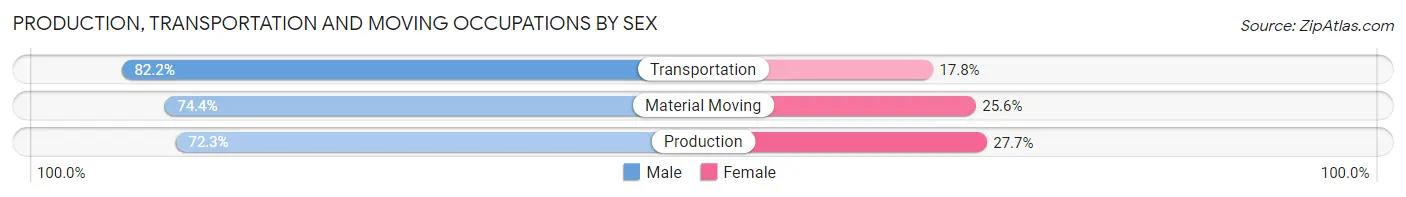
Production, Transportation and Moving Occupations by Sex
| Occupation | Male | Female |
| Production | 33,011 (72.3%) | 12,624 (27.7%) |
| Transportation | 17,081 (82.2%) | 3,693 (17.8%) |
| Material Moving | 19,687 (74.4%) | 6,789 (25.6%) |
| Total (Category) | 69,779 (75.1%) | 23,106 (24.9%) |
| Total (Overall) | 448,958 (53.2%) | 394,965 (46.8%) |
Employment Industries by Sex in Area Code 248
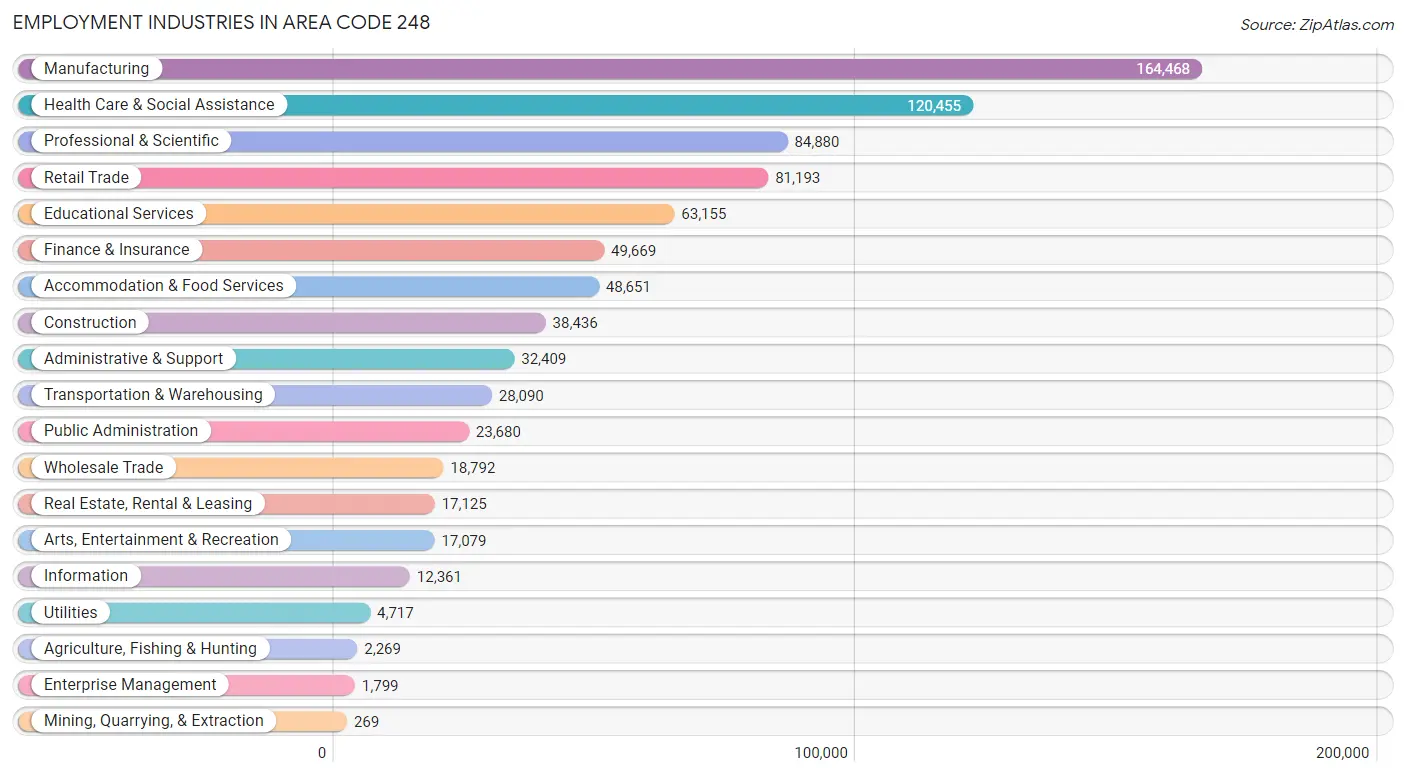
Employment Industries in Area Code 248
The major employment industries in Area Code 248 include Manufacturing (164,468 | 19.5%), Health Care & Social Assistance (120,455 | 14.3%), Professional & Scientific (84,880 | 10.1%), Retail Trade (81,193 | 9.6%), and Educational Services (63,155 | 7.5%).
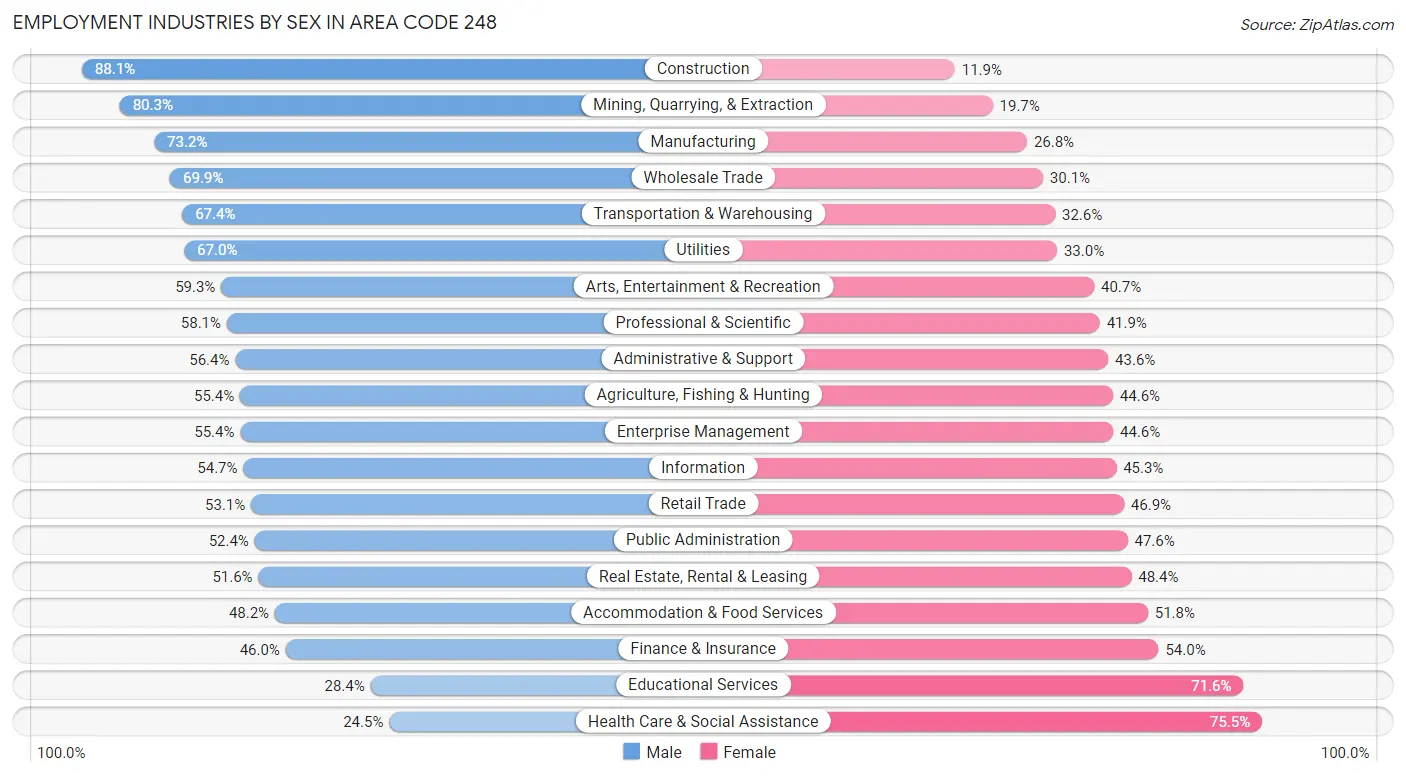
Employment Industries by Sex in Area Code 248
The Area Code 248 industries that see more men than women are Construction (88.1%), Mining, Quarrying, & Extraction (80.3%), and Manufacturing (73.2%), whereas the industries that tend to have a higher number of women are Health Care & Social Assistance (75.5%), Educational Services (71.6%), and Finance & Insurance (54.0%).
| Industry | Male | Female |
| Agriculture, Fishing & Hunting | 1,257 (55.4%) | 1,012 (44.6%) |
| Mining, Quarrying, & Extraction | 216 (80.3%) | 53 (19.7%) |
| Construction | 33,875 (88.1%) | 4,561 (11.9%) |
| Manufacturing | 120,382 (73.2%) | 44,086 (26.8%) |
| Wholesale Trade | 13,134 (69.9%) | 5,658 (30.1%) |
| Retail Trade | 43,126 (53.1%) | 38,067 (46.9%) |
| Transportation & Warehousing | 18,924 (67.4%) | 9,166 (32.6%) |
| Utilities | 3,159 (67.0%) | 1,558 (33.0%) |
| Information | 6,764 (54.7%) | 5,597 (45.3%) |
| Finance & Insurance | 22,829 (46.0%) | 26,840 (54.0%) |
| Real Estate, Rental & Leasing | 8,836 (51.6%) | 8,289 (48.4%) |
| Professional & Scientific | 49,338 (58.1%) | 35,542 (41.9%) |
| Enterprise Management | 996 (55.4%) | 803 (44.6%) |
| Administrative & Support | 18,272 (56.4%) | 14,137 (43.6%) |
| Educational Services | 17,938 (28.4%) | 45,217 (71.6%) |
| Health Care & Social Assistance | 29,551 (24.5%) | 90,904 (75.5%) |
| Arts, Entertainment & Recreation | 10,130 (59.3%) | 6,949 (40.7%) |
| Accommodation & Food Services | 23,438 (48.2%) | 25,213 (51.8%) |
| Public Administration | 12,401 (52.4%) | 11,279 (47.6%) |
| Total | 448,958 (53.2%) | 394,965 (46.8%) |
Education in Area Code 248
School Enrollment in Area Code 248
The most common levels of schooling among the 381,405 students in Area Code 248 are high school (86,751 | 22.8%), middle school (79,084 | 20.7%), and college / undergraduate (73,108 | 19.2%).
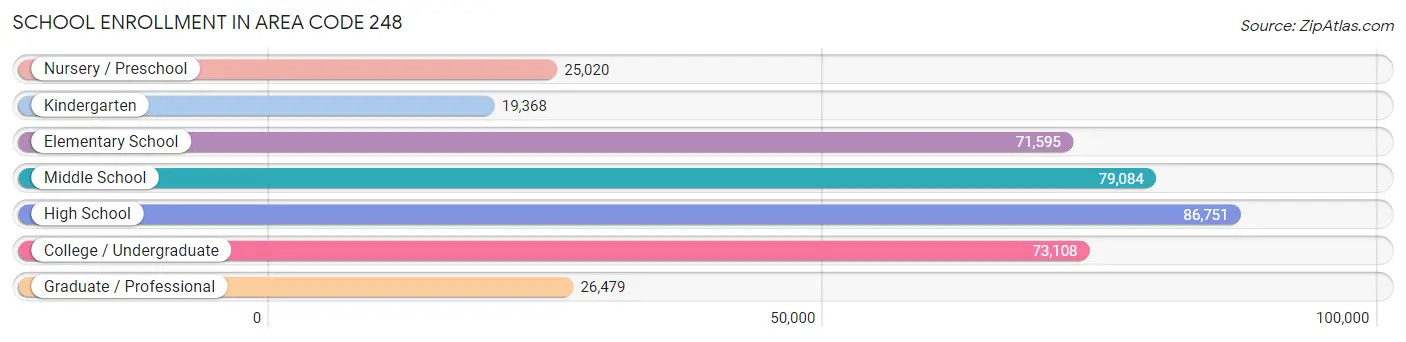
| School Level | # Students | % Students |
| Nursery / Preschool | 25,020 | 6.6% |
| Kindergarten | 19,368 | 5.1% |
| Elementary School | 71,595 | 18.8% |
| Middle School | 79,084 | 20.7% |
| High School | 86,751 | 22.8% |
| College / Undergraduate | 73,108 | 19.2% |
| Graduate / Professional | 26,479 | 6.9% |
| Total | 381,405 | 100.0% |
School Enrollment by Age by Funding Source in Area Code 248
Out of a total of 381,405 students who are enrolled in schools in Area Code 248, 63,192 (16.6%) attend a private institution, while the remaining 318,213 (83.4%) are enrolled in public schools. The age group of 3 to 4 year olds has the highest likelihood of being enrolled in private schools, with 9,529 (49.1% in the age bracket) enrolled. Conversely, the age group of 10 to 14 year olds has the lowest likelihood of being enrolled in a private school, with 88,203 (88.0% in the age bracket) attending a public institution.
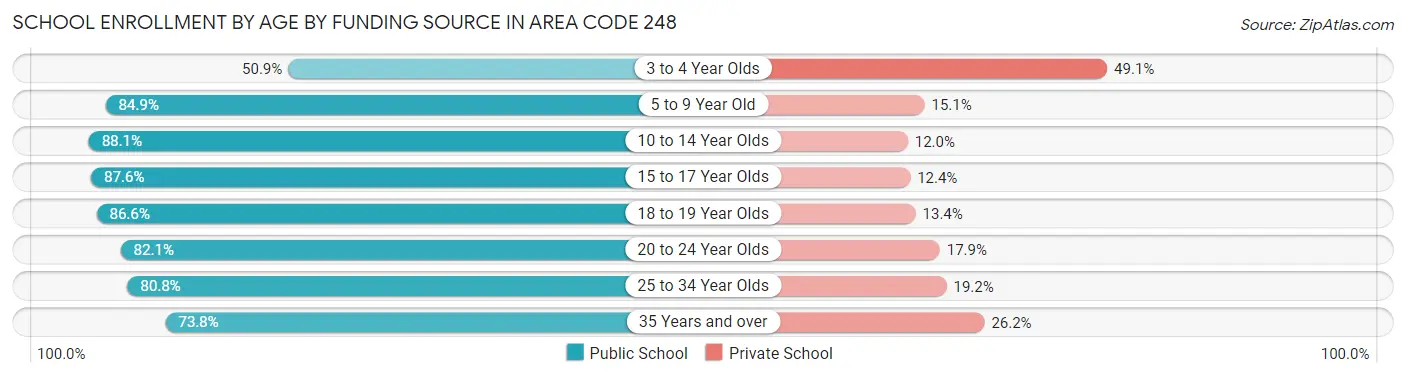
| Age Bracket | Public School | Private School |
| 3 to 4 Year Olds | 9,886 (50.9%) | 9,529 (49.1%) |
| 5 to 9 Year Old | 74,730 (84.9%) | 13,256 (15.1%) |
| 10 to 14 Year Olds | 88,203 (88.0%) | 11,975 (11.9%) |
| 15 to 17 Year Olds | 54,060 (87.6%) | 7,646 (12.4%) |
| 18 to 19 Year Olds | 23,941 (86.6%) | 3,706 (13.4%) |
| 20 to 24 Year Olds | 32,754 (82.1%) | 7,142 (17.9%) |
| 25 to 34 Year Olds | 20,025 (80.8%) | 4,746 (19.2%) |
| 35 Years and over | 14,613 (73.8%) | 5,193 (26.2%) |
| Total | 318,213 (83.4%) | 63,192 (16.6%) |
Educational Attainment by Field of Study in Area Code 248
Business (125,804 | 21.5%), engineering (89,155 | 15.2%), science & technology (58,500 | 10.0%), education (56,479 | 9.6%), and social sciences (35,450 | 6.0%) are the most common fields of study among 585,889 individuals in Area Code 248 who have obtained a bachelor's degree or higher.
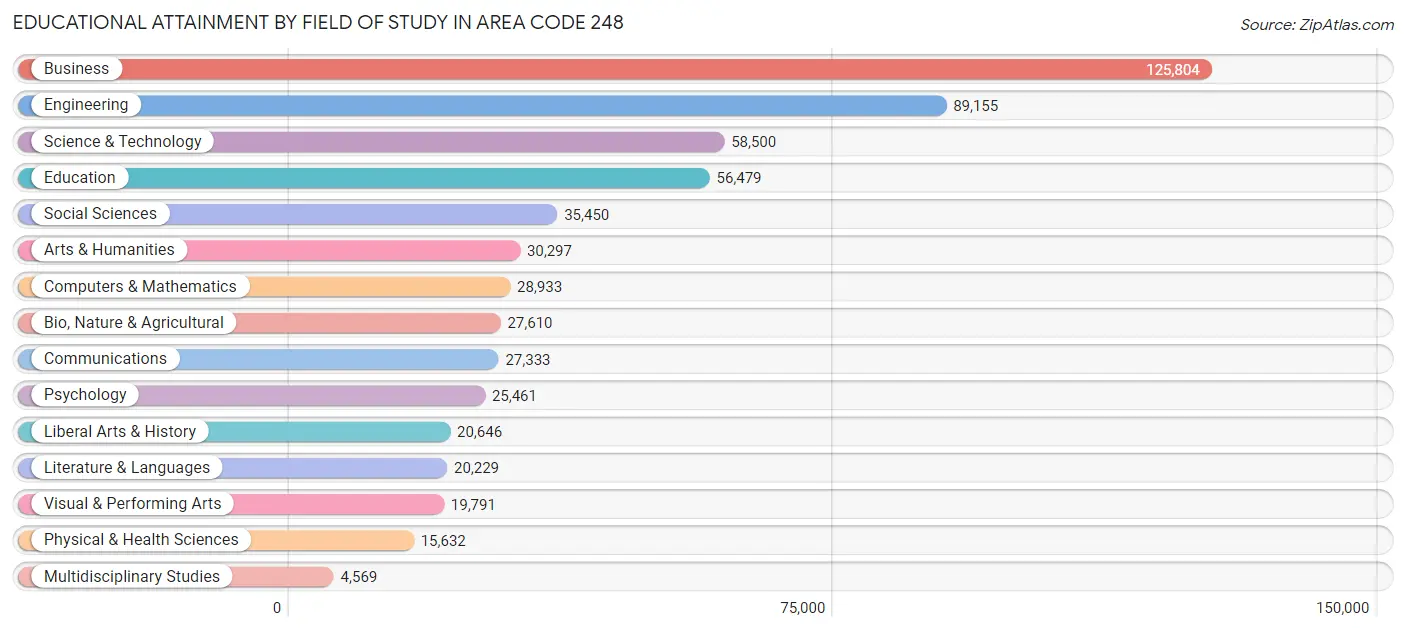
| Field of Study | # Graduates | % Graduates |
| Computers & Mathematics | 28,933 | 4.9% |
| Bio, Nature & Agricultural | 27,610 | 4.7% |
| Physical & Health Sciences | 15,632 | 2.7% |
| Psychology | 25,461 | 4.3% |
| Social Sciences | 35,450 | 6.0% |
| Engineering | 89,155 | 15.2% |
| Multidisciplinary Studies | 4,569 | 0.8% |
| Science & Technology | 58,500 | 10.0% |
| Business | 125,804 | 21.5% |
| Education | 56,479 | 9.6% |
| Literature & Languages | 20,229 | 3.5% |
| Liberal Arts & History | 20,646 | 3.5% |
| Visual & Performing Arts | 19,791 | 3.4% |
| Communications | 27,333 | 4.7% |
| Arts & Humanities | 30,297 | 5.2% |
| Total | 585,889 | 100.0% |
Transportation & Commute in Area Code 248
Vehicle Availability by Sex in Area Code 248
The most prevalent vehicle ownership categories in Area Code 248 are males with 2 vehicles (199,864, accounting for 45.4%) and females with 2 vehicles (166,887, making up 52.3%).
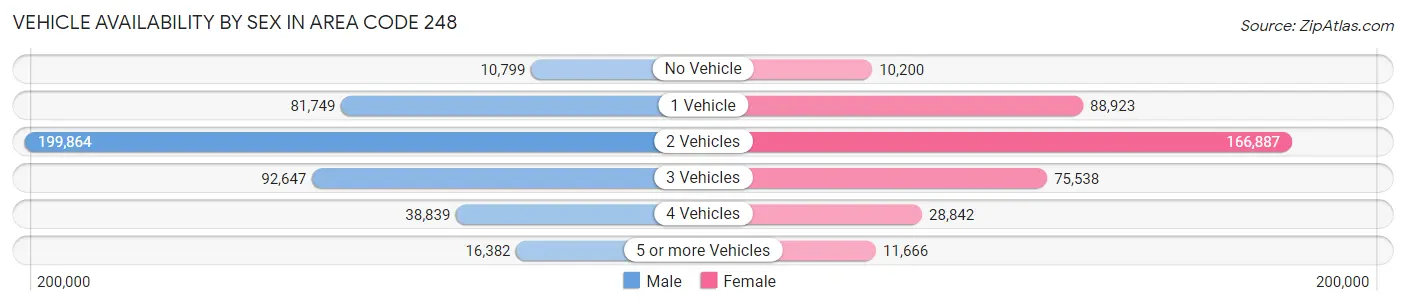
| Vehicles Available | Male | Female |
| No Vehicle | 10,799 (2.5%) | 10,200 (2.7%) |
| 1 Vehicle | 81,749 (18.6%) | 88,923 (23.3%) |
| 2 Vehicles | 199,864 (45.4%) | 166,887 (43.7%) |
| 3 Vehicles | 92,647 (21.0%) | 75,538 (19.8%) |
| 4 Vehicles | 38,839 (8.8%) | 28,842 (7.5%) |
| 5 or more Vehicles | 16,382 (3.7%) | 11,666 (3.0%) |
| Total | 440,280 (100.0%) | 382,056 (100.0%) |
Commute Time in Area Code 248
The most frequently occuring commute durations in Area Code 248 are 30 to 34 minutes (114,115 commuters, 16.3%), 20 to 24 minutes (109,079 commuters, 15.5%), and 15 to 19 minutes (105,463 commuters, 15.0%).
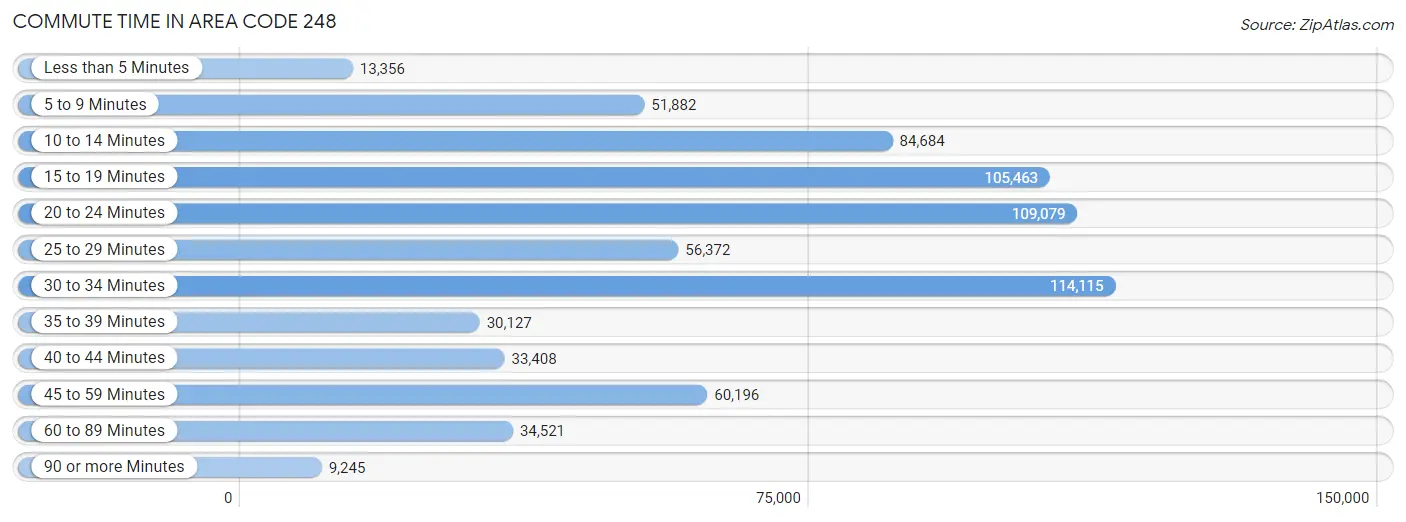
| Commute Time | # Commuters | % Commuters |
| Less than 5 Minutes | 13,356 | 1.9% |
| 5 to 9 Minutes | 51,882 | 7.4% |
| 10 to 14 Minutes | 84,684 | 12.1% |
| 15 to 19 Minutes | 105,463 | 15.0% |
| 20 to 24 Minutes | 109,079 | 15.5% |
| 25 to 29 Minutes | 56,372 | 8.0% |
| 30 to 34 Minutes | 114,115 | 16.3% |
| 35 to 39 Minutes | 30,127 | 4.3% |
| 40 to 44 Minutes | 33,408 | 4.8% |
| 45 to 59 Minutes | 60,196 | 8.6% |
| 60 to 89 Minutes | 34,521 | 4.9% |
| 90 or more Minutes | 9,245 | 1.3% |
Commute Time by Sex in Area Code 248
The most common commute times in Area Code 248 are 30 to 34 minutes (64,918 commuters, 17.2%) for males and 20 to 24 minutes (52,554 commuters, 16.2%) for females.
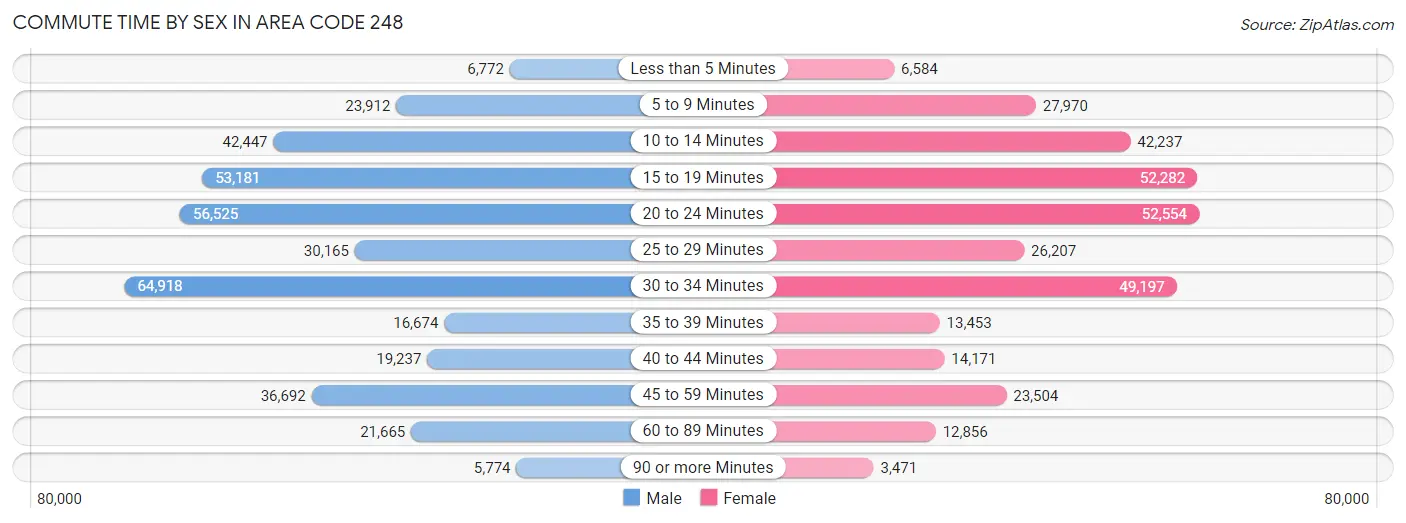
| Commute Time | Male | Female |
| Less than 5 Minutes | 6,772 (1.8%) | 6,584 (2.0%) |
| 5 to 9 Minutes | 23,912 (6.3%) | 27,970 (8.6%) |
| 10 to 14 Minutes | 42,447 (11.2%) | 42,237 (13.0%) |
| 15 to 19 Minutes | 53,181 (14.1%) | 52,282 (16.1%) |
| 20 to 24 Minutes | 56,525 (15.0%) | 52,554 (16.2%) |
| 25 to 29 Minutes | 30,165 (8.0%) | 26,207 (8.1%) |
| 30 to 34 Minutes | 64,918 (17.2%) | 49,197 (15.2%) |
| 35 to 39 Minutes | 16,674 (4.4%) | 13,453 (4.2%) |
| 40 to 44 Minutes | 19,237 (5.1%) | 14,171 (4.4%) |
| 45 to 59 Minutes | 36,692 (9.7%) | 23,504 (7.2%) |
| 60 to 89 Minutes | 21,665 (5.7%) | 12,856 (4.0%) |
| 90 or more Minutes | 5,774 (1.5%) | 3,471 (1.1%) |
Time of Departure to Work by Sex in Area Code 248
The most frequent times of departure to work in Area Code 248 are 7:00 AM to 7:29 AM (52,687, 13.9%) for males and 8:00 AM to 8:29 AM (47,199, 14.5%) for females.
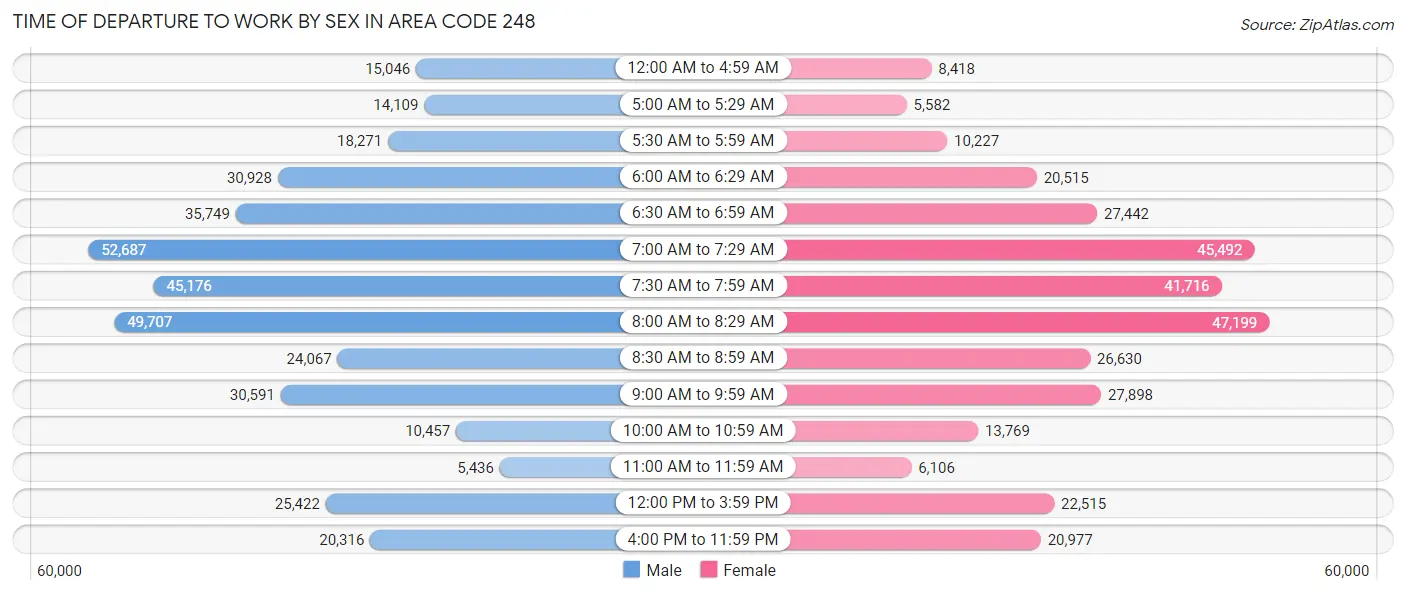
| Time of Departure | Male | Female |
| 12:00 AM to 4:59 AM | 15,046 (4.0%) | 8,418 (2.6%) |
| 5:00 AM to 5:29 AM | 14,109 (3.7%) | 5,582 (1.7%) |
| 5:30 AM to 5:59 AM | 18,271 (4.8%) | 10,227 (3.2%) |
| 6:00 AM to 6:29 AM | 30,928 (8.2%) | 20,515 (6.3%) |
| 6:30 AM to 6:59 AM | 35,749 (9.5%) | 27,442 (8.5%) |
| 7:00 AM to 7:29 AM | 52,687 (13.9%) | 45,492 (14.0%) |
| 7:30 AM to 7:59 AM | 45,176 (11.9%) | 41,716 (12.9%) |
| 8:00 AM to 8:29 AM | 49,707 (13.2%) | 47,199 (14.5%) |
| 8:30 AM to 8:59 AM | 24,067 (6.4%) | 26,630 (8.2%) |
| 9:00 AM to 9:59 AM | 30,591 (8.1%) | 27,898 (8.6%) |
| 10:00 AM to 10:59 AM | 10,457 (2.8%) | 13,769 (4.2%) |
| 11:00 AM to 11:59 AM | 5,436 (1.4%) | 6,106 (1.9%) |
| 12:00 PM to 3:59 PM | 25,422 (6.7%) | 22,515 (6.9%) |
| 4:00 PM to 11:59 PM | 20,316 (5.4%) | 20,977 (6.5%) |
| Total | 377,962 (100.0%) | 324,486 (100.0%) |
Housing Occupancy in Area Code 248
Occupancy by Ownership in Area Code 248
Of the total 692,495 dwellings in Area Code 248, owner-occupied units account for 484,034 (69.9%), while renter-occupied units make up 208,461 (30.1%).
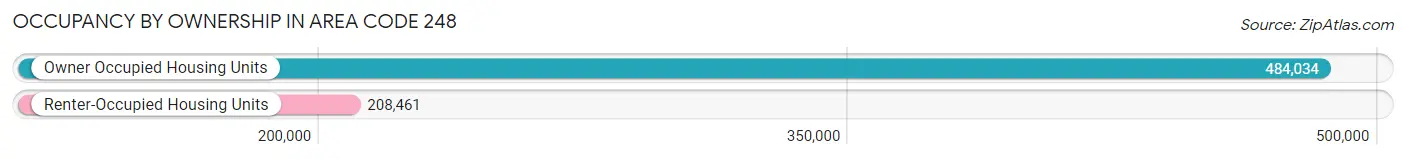
| Occupancy | # Housing Units | % Housing Units |
| Owner Occupied Housing Units | 484,034 | 69.9% |
| Renter-Occupied Housing Units | 208,461 | 30.1% |
| Total Occupied Housing Units | 692,495 | 100.0% |
Occupancy by Household Size in Area Code 248
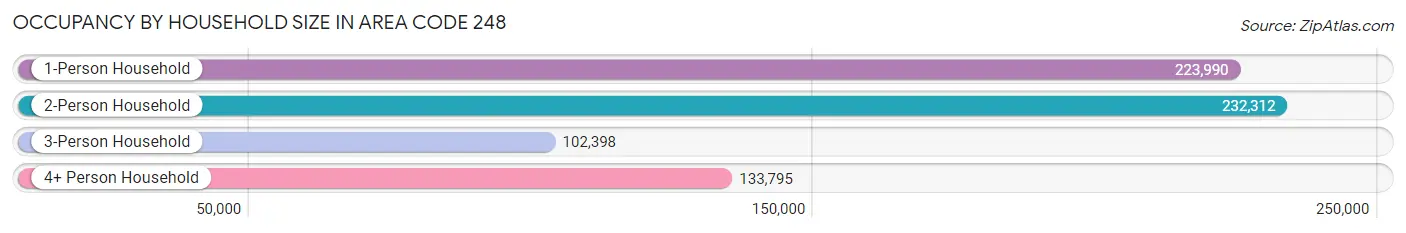
| Household Size | # Housing Units | % Housing Units |
| 1-Person Household | 223,990 | 32.4% |
| 2-Person Household | 232,312 | 33.6% |
| 3-Person Household | 102,398 | 14.8% |
| 4+ Person Household | 133,795 | 19.3% |
| Total Housing Units | 692,495 | 100.0% |
Occupancy by Ownership by Household Size in Area Code 248
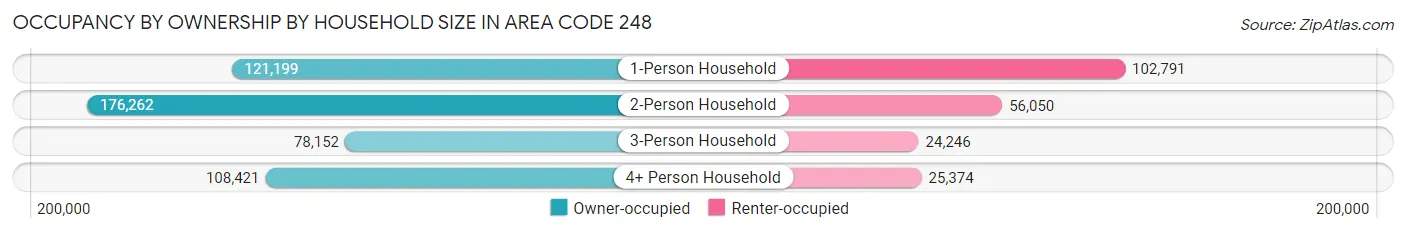
| Household Size | Owner-occupied | Renter-occupied |
| 1-Person Household | 121,199 (54.1%) | 102,791 (45.9%) |
| 2-Person Household | 176,262 (75.9%) | 56,050 (24.1%) |
| 3-Person Household | 78,152 (76.3%) | 24,246 (23.7%) |
| 4+ Person Household | 108,421 (81.0%) | 25,374 (19.0%) |
| Total Housing Units | 484,034 (69.9%) | 208,461 (30.1%) |
Occupancy by Educational Attainment in Area Code 248
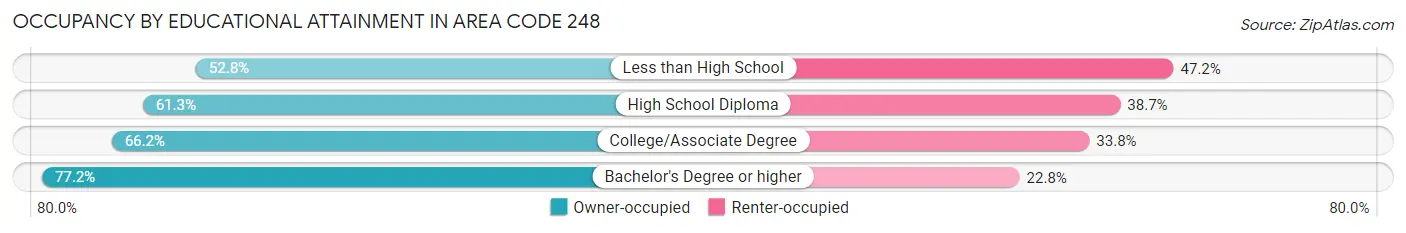
| Household Size | Owner-occupied | Renter-occupied |
| Less than High School | 18,207 (52.8%) | 16,260 (47.2%) |
| High School Diploma | 75,740 (61.3%) | 47,902 (38.7%) |
| College/Associate Degree | 135,632 (66.2%) | 69,299 (33.8%) |
| Bachelor's Degree or higher | 254,455 (77.2%) | 75,000 (22.8%) |
Occupancy by Age of Householder in Area Code 248
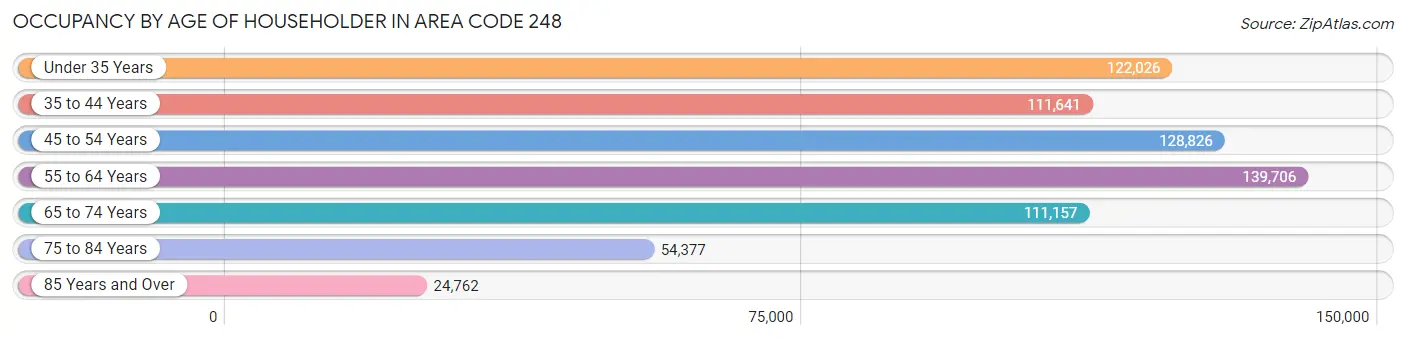
| Age Bracket | # Households | % Households |
| Under 35 Years | 122,026 | 17.6% |
| 35 to 44 Years | 111,641 | 16.1% |
| 45 to 54 Years | 128,826 | 18.6% |
| 55 to 64 Years | 139,706 | 20.2% |
| 65 to 74 Years | 111,157 | 16.1% |
| 75 to 84 Years | 54,377 | 7.9% |
| 85 Years and Over | 24,762 | 3.6% |
| Total | 692,495 | 100.0% |
Housing Finances in Area Code 248
Median Income by Occupancy in Area Code 248
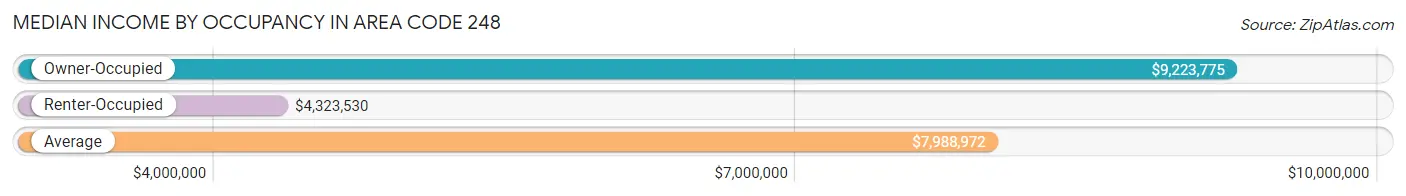
| Occupancy Type | # Households | Median Income |
| Owner-Occupied | 484,034 (69.9%) | $9,223,775 |
| Renter-Occupied | 208,461 (30.1%) | $4,323,530 |
| Average | 692,495 (100.0%) | $7,988,972 |
Occupancy by Householder Income Bracket in Area Code 248
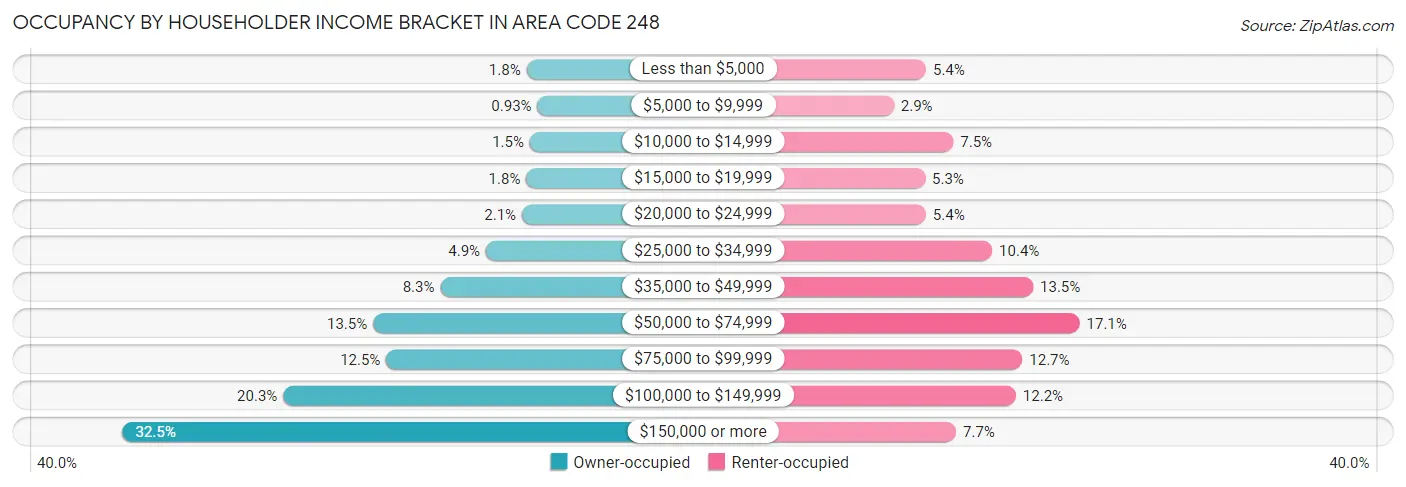
| Income Bracket | Owner-occupied | Renter-occupied |
| Less than $5,000 | 8,499 (1.8%) | 11,185 (5.4%) |
| $5,000 to $9,999 | 4,487 (0.9%) | 6,094 (2.9%) |
| $10,000 to $14,999 | 7,312 (1.5%) | 15,540 (7.4%) |
| $15,000 to $19,999 | 8,606 (1.8%) | 11,040 (5.3%) |
| $20,000 to $24,999 | 10,214 (2.1%) | 11,179 (5.4%) |
| $25,000 to $34,999 | 23,485 (4.9%) | 21,702 (10.4%) |
| $35,000 to $49,999 | 40,340 (8.3%) | 28,213 (13.5%) |
| $50,000 to $74,999 | 65,079 (13.5%) | 35,584 (17.1%) |
| $75,000 to $99,999 | 60,269 (12.4%) | 26,489 (12.7%) |
| $100,000 to $149,999 | 98,244 (20.3%) | 25,466 (12.2%) |
| $150,000 or more | 157,499 (32.5%) | 15,969 (7.7%) |
| Total | 484,034 (100.0%) | 208,461 (100.0%) |
Monthly Housing Cost Tiers in Area Code 248
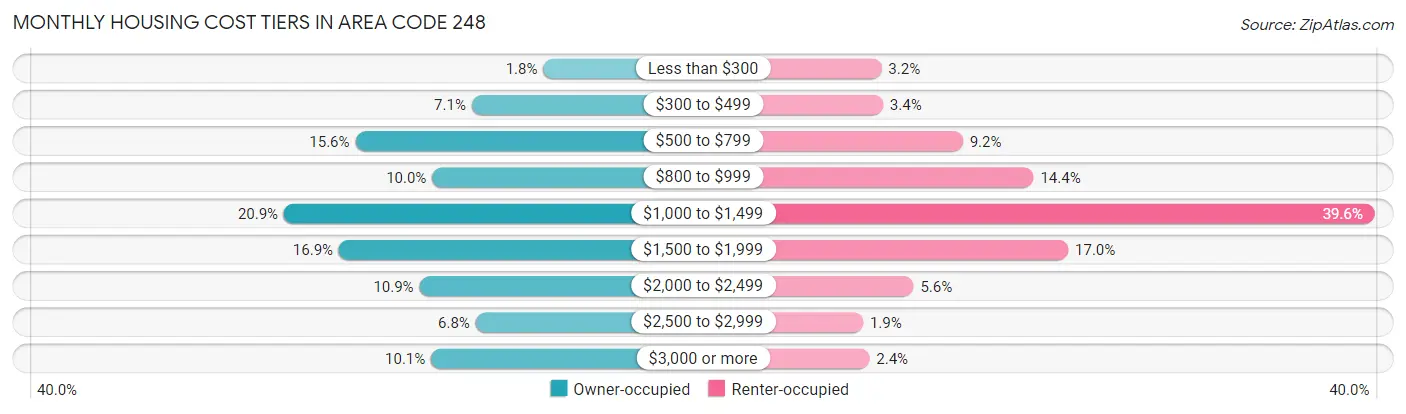
| Monthly Cost | Owner-occupied | Renter-occupied |
| Less than $300 | 8,701 (1.8%) | 6,750 (3.2%) |
| $300 to $499 | 34,232 (7.1%) | 6,987 (3.4%) |
| $500 to $799 | 75,694 (15.6%) | 19,249 (9.2%) |
| $800 to $999 | 48,312 (10.0%) | 30,110 (14.4%) |
| $1,000 to $1,499 | 101,171 (20.9%) | 82,496 (39.6%) |
| $1,500 to $1,999 | 81,537 (16.9%) | 35,421 (17.0%) |
| $2,000 to $2,499 | 52,875 (10.9%) | 11,667 (5.6%) |
| $2,500 to $2,999 | 32,803 (6.8%) | 3,929 (1.9%) |
| $3,000 or more | 48,709 (10.1%) | 4,904 (2.4%) |
| Total | 484,034 (100.0%) | 208,461 (100.0%) |
Physical Housing Characteristics in Area Code 248
Housing Structures in Area Code 248
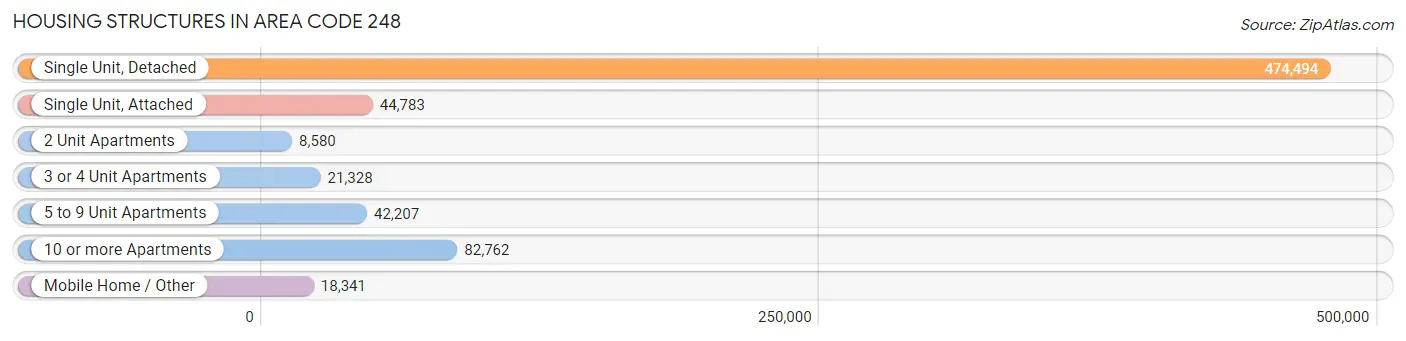
| Structure Type | # Housing Units | % Housing Units |
| Single Unit, Detached | 474,494 | 68.5% |
| Single Unit, Attached | 44,783 | 6.5% |
| 2 Unit Apartments | 8,580 | 1.2% |
| 3 or 4 Unit Apartments | 21,328 | 3.1% |
| 5 to 9 Unit Apartments | 42,207 | 6.1% |
| 10 or more Apartments | 82,762 | 11.9% |
| Mobile Home / Other | 18,341 | 2.6% |
| Total | 692,495 | 100.0% |
Housing Structures by Occupancy in Area Code 248
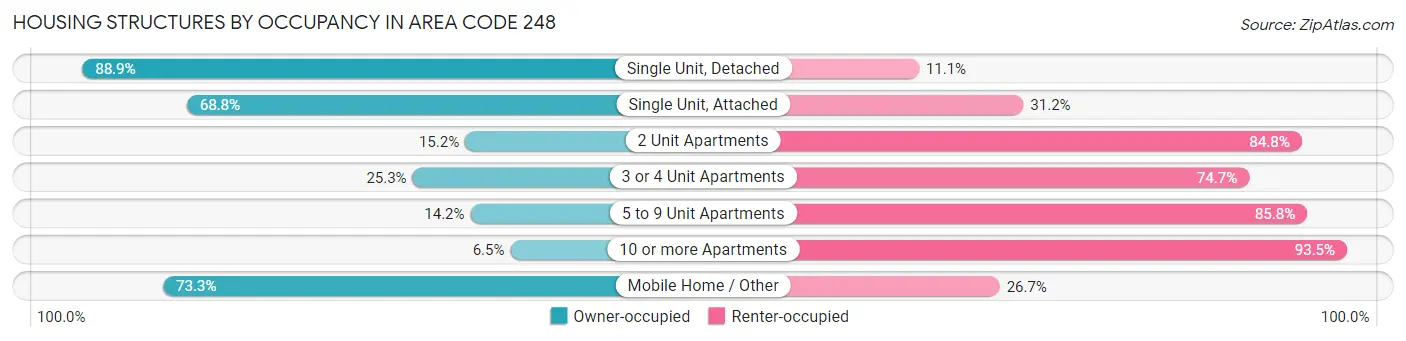
| Structure Type | Owner-occupied | Renter-occupied |
| Single Unit, Detached | 421,732 (88.9%) | 52,762 (11.1%) |
| Single Unit, Attached | 30,794 (68.8%) | 13,989 (31.2%) |
| 2 Unit Apartments | 1,305 (15.2%) | 7,275 (84.8%) |
| 3 or 4 Unit Apartments | 5,401 (25.3%) | 15,927 (74.7%) |
| 5 to 9 Unit Apartments | 5,979 (14.2%) | 36,228 (85.8%) |
| 10 or more Apartments | 5,374 (6.5%) | 77,388 (93.5%) |
| Mobile Home / Other | 13,449 (73.3%) | 4,892 (26.7%) |
| Total | 484,034 (69.9%) | 208,461 (30.1%) |
Housing Structures by Number of Rooms in Area Code 248
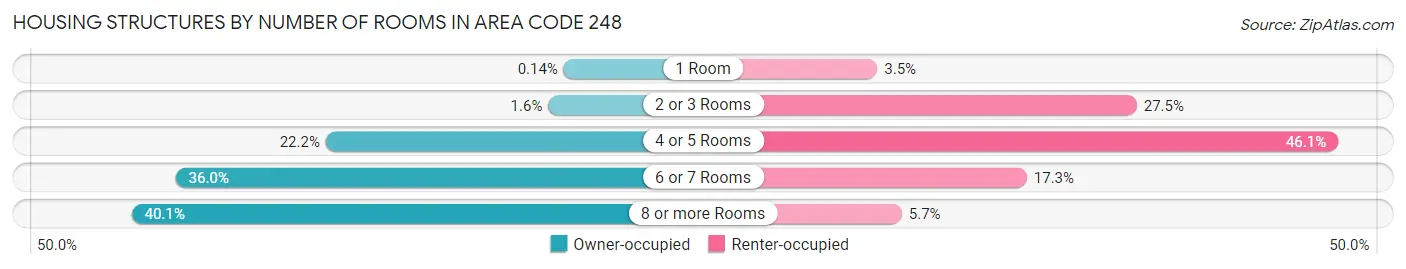
| Number of Rooms | Owner-occupied | Renter-occupied |
| 1 Room | 697 (0.1%) | 7,219 (3.5%) |
| 2 or 3 Rooms | 7,588 (1.6%) | 57,248 (27.5%) |
| 4 or 5 Rooms | 107,225 (22.2%) | 96,021 (46.1%) |
| 6 or 7 Rooms | 174,385 (36.0%) | 36,036 (17.3%) |
| 8 or more Rooms | 194,139 (40.1%) | 11,937 (5.7%) |
| Total | 484,034 (100.0%) | 208,461 (100.0%) |
Housing Structure by Heating Type in Area Code 248
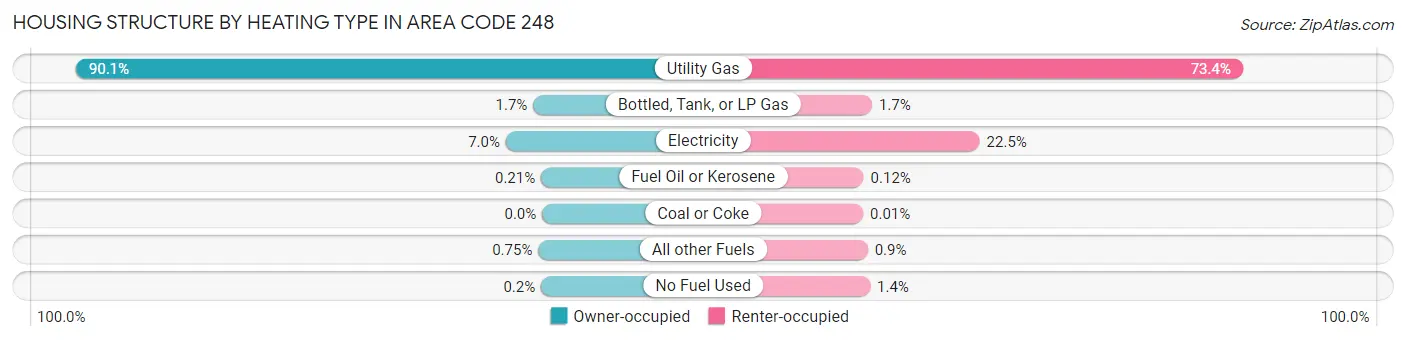
| Heating Type | Owner-occupied | Renter-occupied |
| Utility Gas | 436,081 (90.1%) | 152,927 (73.4%) |
| Bottled, Tank, or LP Gas | 8,397 (1.7%) | 3,591 (1.7%) |
| Electricity | 33,930 (7.0%) | 46,964 (22.5%) |
| Fuel Oil or Kerosene | 1,034 (0.2%) | 259 (0.1%) |
| Coal or Coke | 8 (0.0%) | 16 (0.0%) |
| All other Fuels | 3,612 (0.7%) | 1,871 (0.9%) |
| No Fuel Used | 972 (0.2%) | 2,833 (1.4%) |
| Total | 484,034 (100.0%) | 208,461 (100.0%) |
Household Vehicle Usage in Area Code 248
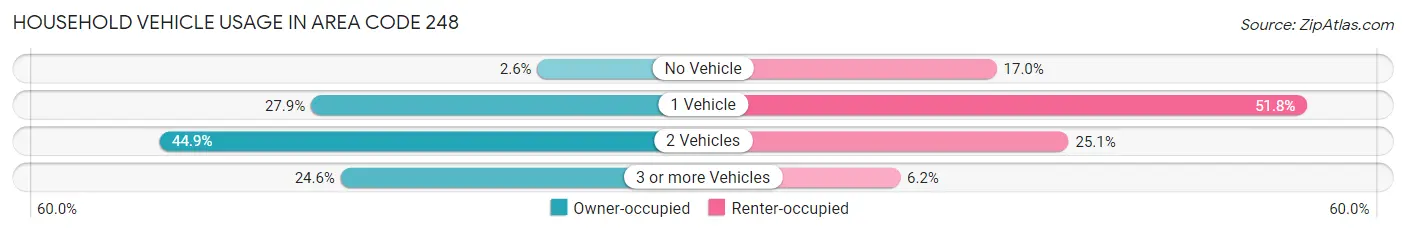
| Vehicles per Household | Owner-occupied | Renter-occupied |
| No Vehicle | 12,355 (2.5%) | 35,418 (17.0%) |
| 1 Vehicle | 135,129 (27.9%) | 107,942 (51.8%) |
| 2 Vehicles | 217,518 (44.9%) | 52,220 (25.1%) |
| 3 or more Vehicles | 119,032 (24.6%) | 12,881 (6.2%) |
| Total | 484,034 (100.0%) | 208,461 (100.0%) |
Real Estate & Mortgages in Area Code 248
Real Estate and Mortgage Overview in Area Code 248
| Characteristic | Without Mortgage | With Mortgage |
| Housing Units | 173,742 | 310,292 |
| Median Property Value | $22,876,700 | $26,594,600 |
| Median Household Income | $6,795,592 | $118,158 |
| Monthly Housing Costs | $59,477 | $47,134 |
| Real Estate Taxes | $313,774 | $7,542 |
Property Value by Mortgage Status in Area Code 248
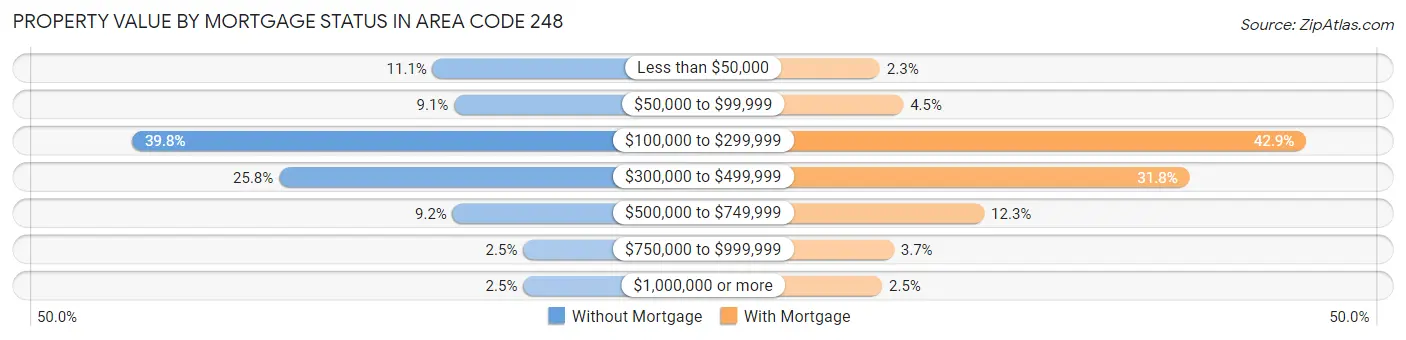
| Property Value | Without Mortgage | With Mortgage |
| Less than $50,000 | 19,350 (11.1%) | 7,193 (2.3%) |
| $50,000 to $99,999 | 15,795 (9.1%) | 14,075 (4.5%) |
| $100,000 to $299,999 | 69,092 (39.8%) | 133,144 (42.9%) |
| $300,000 to $499,999 | 44,749 (25.8%) | 98,705 (31.8%) |
| $500,000 to $749,999 | 16,038 (9.2%) | 38,005 (12.2%) |
| $750,000 to $999,999 | 4,358 (2.5%) | 11,317 (3.6%) |
| $1,000,000 or more | 4,360 (2.5%) | 7,853 (2.5%) |
| Total | 173,742 (100.0%) | 310,292 (100.0%) |
Household Income by Mortgage Status in Area Code 248
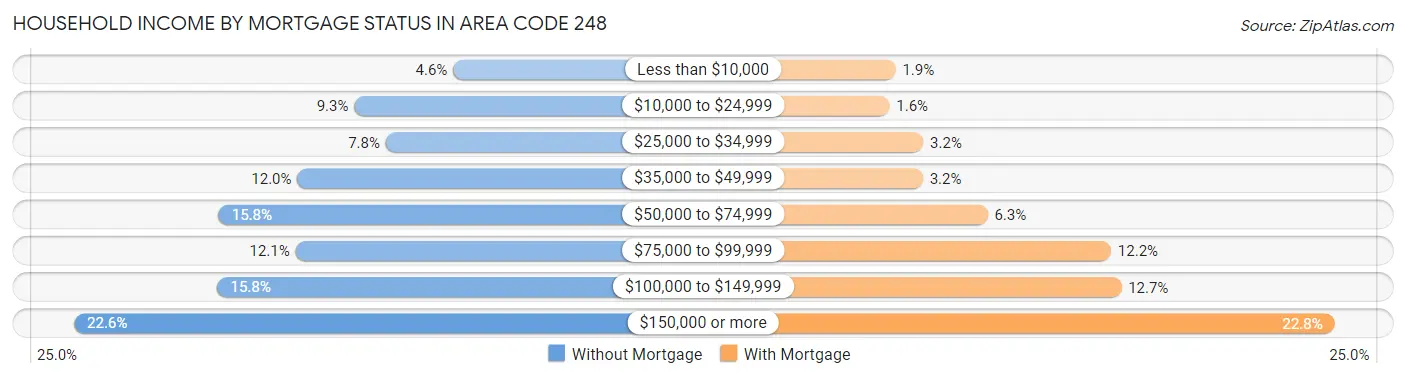
| Household Income | Without Mortgage | With Mortgage |
| Less than $10,000 | 7,980 (4.6%) | 5,898 (1.9%) |
| $10,000 to $24,999 | 16,152 (9.3%) | 5,006 (1.6%) |
| $25,000 to $34,999 | 13,554 (7.8%) | 9,980 (3.2%) |
| $35,000 to $49,999 | 20,862 (12.0%) | 9,931 (3.2%) |
| $50,000 to $74,999 | 27,360 (15.8%) | 19,478 (6.3%) |
| $75,000 to $99,999 | 21,016 (12.1%) | 37,719 (12.2%) |
| $100,000 to $149,999 | 27,477 (15.8%) | 39,253 (12.7%) |
| $150,000 or more | 39,341 (22.6%) | 70,767 (22.8%) |
| Total | 173,742 (100.0%) | 310,292 (100.0%) |
Property Value to Household Income Ratio in Area Code 248
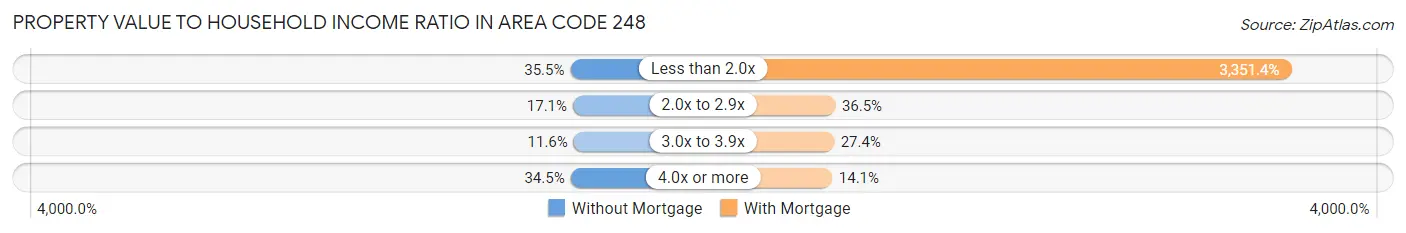
| Value-to-Income Ratio | Without Mortgage | With Mortgage |
| Less than 2.0x | 61,656 (35.5%) | 10,399,218 (3,351.4%) |
| 2.0x to 2.9x | 29,662 (17.1%) | 113,381 (36.5%) |
| 3.0x to 3.9x | 20,114 (11.6%) | 85,017 (27.4%) |
| 4.0x or more | 59,847 (34.4%) | 43,840 (14.1%) |
| Total | 173,742 (100.0%) | 310,292 (100.0%) |
Real Estate Taxes by Mortgage Status in Area Code 248
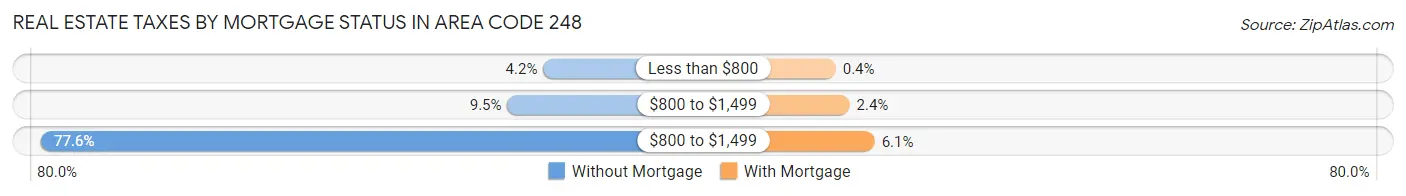
| Property Taxes | Without Mortgage | With Mortgage |
| Less than $800 | 7,330 (4.2%) | 1,245 (0.4%) |
| $800 to $1,499 | 16,441 (9.5%) | 7,502 (2.4%) |
| $800 to $1,499 | 134,805 (77.6%) | 18,883 (6.1%) |
| Total | 173,742 (100.0%) | 310,292 (100.0%) |
Health & Disability in Area Code 248
Health Insurance Coverage by Age in Area Code 248
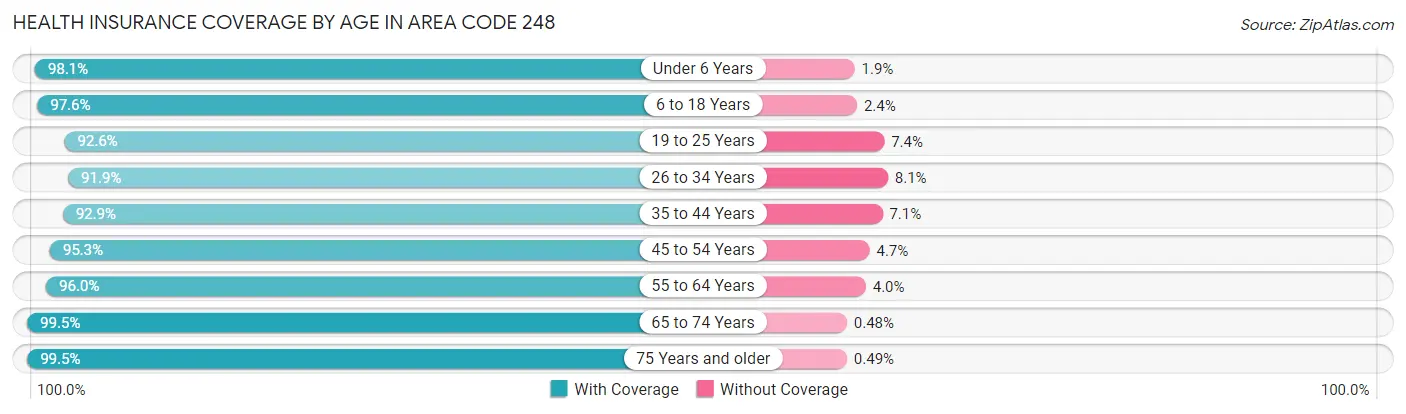
| Age Bracket | With Coverage | Without Coverage |
| Under 6 Years | 106,540 (98.1%) | 2,086 (1.9%) |
| 6 to 18 Years | 252,765 (97.6%) | 6,128 (2.4%) |
| 19 to 25 Years | 129,165 (92.6%) | 10,376 (7.4%) |
| 26 to 34 Years | 187,272 (91.9%) | 16,556 (8.1%) |
| 35 to 44 Years | 193,383 (92.9%) | 14,797 (7.1%) |
| 45 to 54 Years | 213,024 (95.3%) | 10,534 (4.7%) |
| 55 to 64 Years | 227,831 (96.0%) | 9,517 (4.0%) |
| 65 to 74 Years | 174,593 (99.5%) | 839 (0.5%) |
| 75 Years and older | 113,516 (99.5%) | 554 (0.5%) |
| Total | 1,598,089 (95.7%) | 71,387 (4.3%) |
Health Insurance Coverage by Citizenship Status in Area Code 248
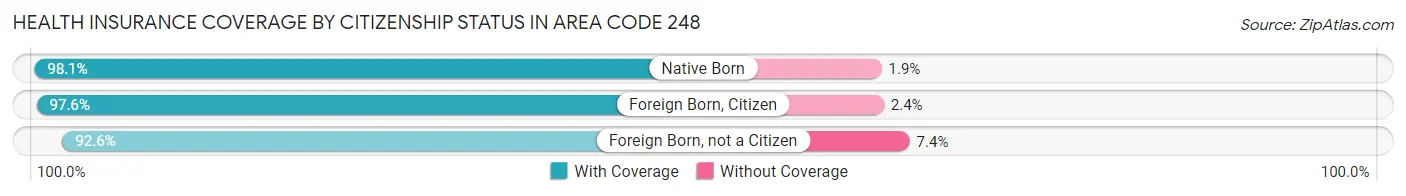
| Citizenship Status | With Coverage | Without Coverage |
| Native Born | 106,540 (98.1%) | 2,086 (1.9%) |
| Foreign Born, Citizen | 252,765 (97.6%) | 6,128 (2.4%) |
| Foreign Born, not a Citizen | 129,165 (92.6%) | 10,376 (7.4%) |
Health Insurance Coverage by Household Income in Area Code 248
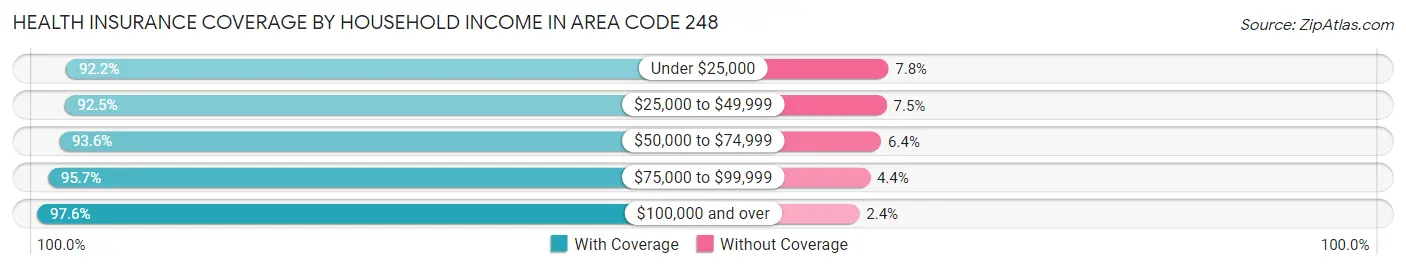
| Household Income | With Coverage | Without Coverage |
| Under $25,000 | 140,523 (92.2%) | 11,861 (7.8%) |
| $25,000 to $49,999 | 191,771 (92.5%) | 15,466 (7.5%) |
| $50,000 to $74,999 | 201,067 (93.6%) | 13,837 (6.4%) |
| $75,000 to $99,999 | 196,167 (95.7%) | 8,920 (4.3%) |
| $100,000 and over | 861,046 (97.6%) | 20,818 (2.4%) |
Public vs Private Health Insurance Coverage by Age in Area Code 248
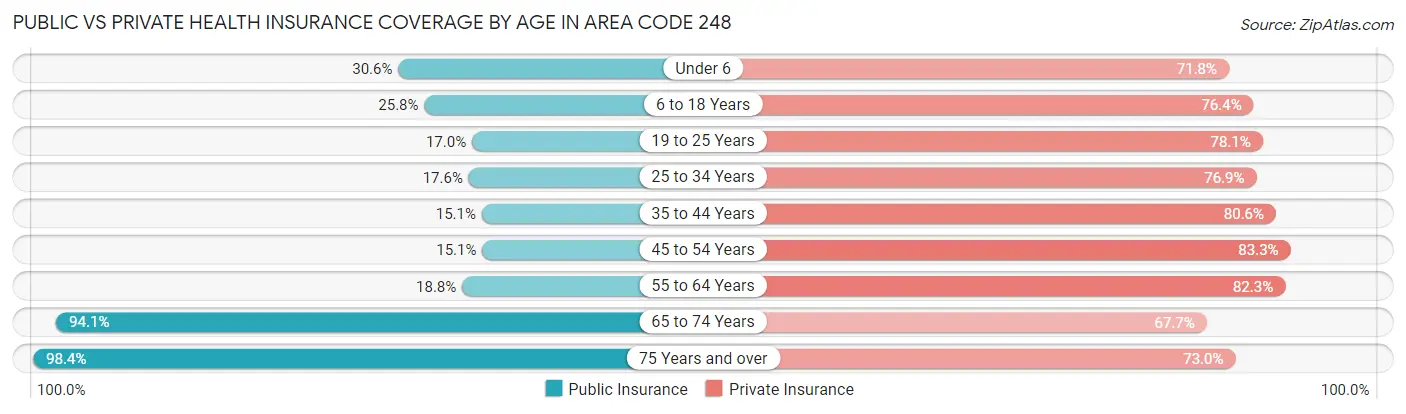
| Age Bracket | Public Insurance | Private Insurance |
| Under 6 | 33,282 (30.6%) | 78,032 (71.8%) |
| 6 to 18 Years | 66,798 (25.8%) | 197,815 (76.4%) |
| 19 to 25 Years | 23,670 (17.0%) | 109,000 (78.1%) |
| 25 to 34 Years | 35,791 (17.6%) | 156,826 (76.9%) |
| 35 to 44 Years | 31,512 (15.1%) | 167,717 (80.6%) |
| 45 to 54 Years | 33,649 (15.0%) | 186,133 (83.3%) |
| 55 to 64 Years | 44,603 (18.8%) | 195,247 (82.3%) |
| 65 to 74 Years | 165,152 (94.1%) | 118,777 (67.7%) |
| 75 Years and over | 112,252 (98.4%) | 83,309 (73.0%) |
| Total | 546,709 (32.8%) | 1,292,856 (77.4%) |
Disability Status by Sex by Age in Area Code 248
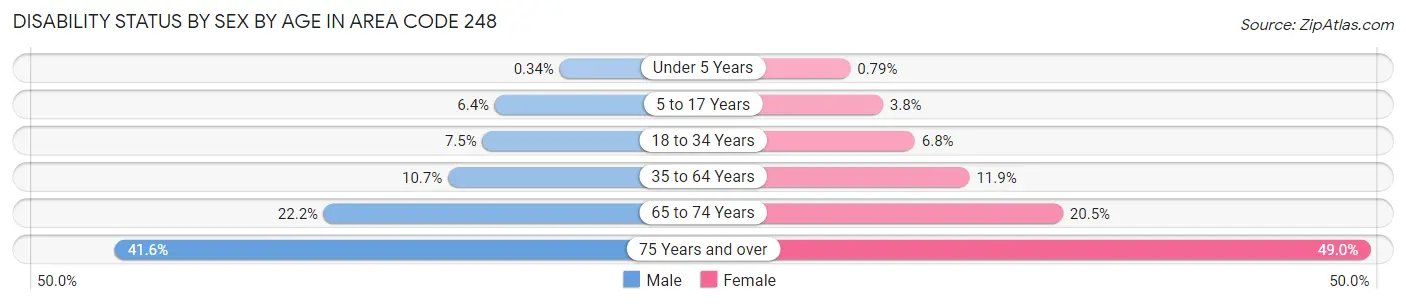
| Age Bracket | Male | Female |
| Under 5 Years | 157 (0.3%) | 341 (0.8%) |
| 5 to 17 Years | 8,360 (6.4%) | 4,874 (3.8%) |
| 18 to 34 Years | 13,906 (7.5%) | 12,003 (6.8%) |
| 35 to 64 Years | 35,214 (10.7%) | 40,302 (11.8%) |
| 65 to 74 Years | 18,012 (22.2%) | 19,365 (20.5%) |
| 75 Years and over | 19,195 (41.6%) | 33,320 (49.0%) |
Disability Class by Sex by Age in Area Code 248
Disability Class: Hearing Difficulty
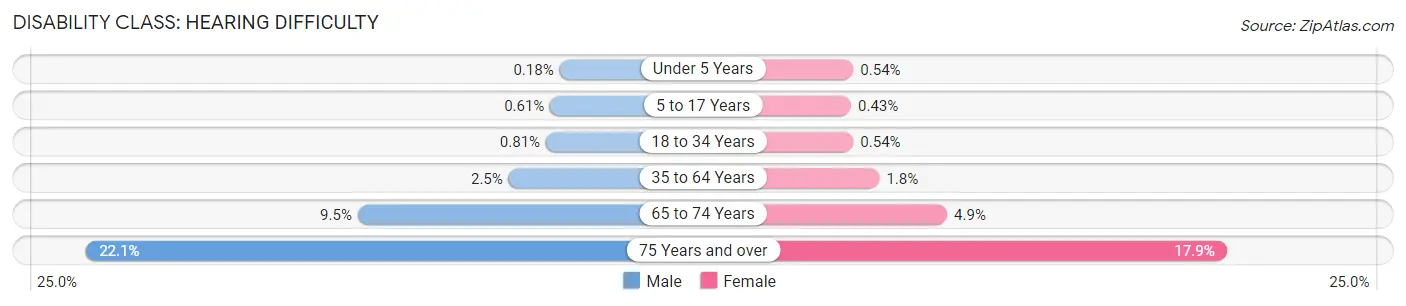
| Age Bracket | Male | Female |
| Under 5 Years | 82 (0.2%) | 233 (0.5%) |
| 5 to 17 Years | 807 (0.6%) | 553 (0.4%) |
| 18 to 34 Years | 1,500 (0.8%) | 964 (0.5%) |
| 35 to 64 Years | 8,368 (2.5%) | 5,954 (1.8%) |
| 65 to 74 Years | 7,736 (9.5%) | 4,618 (4.9%) |
| 75 Years and over | 10,208 (22.1%) | 12,132 (17.8%) |
Disability Class: Vision Difficulty
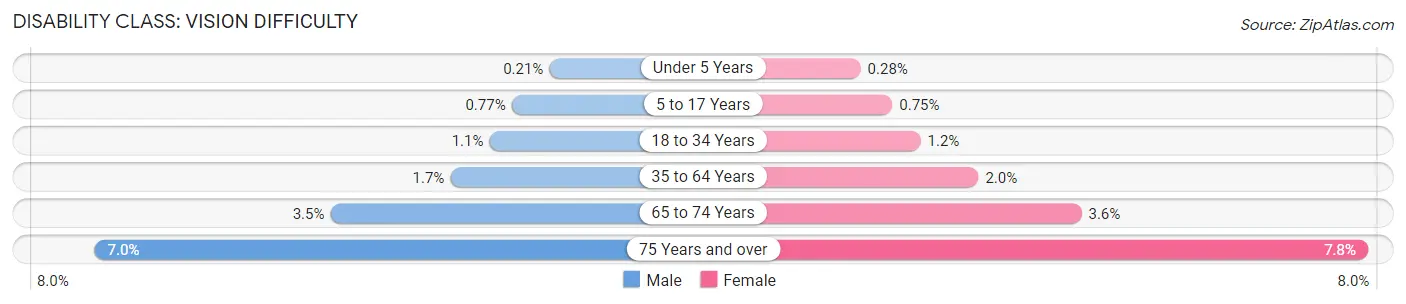
| Age Bracket | Male | Female |
| Under 5 Years | 97 (0.2%) | 118 (0.3%) |
| 5 to 17 Years | 1,019 (0.8%) | 962 (0.7%) |
| 18 to 34 Years | 2,049 (1.1%) | 2,076 (1.2%) |
| 35 to 64 Years | 5,533 (1.7%) | 6,910 (2.0%) |
| 65 to 74 Years | 2,809 (3.5%) | 3,358 (3.6%) |
| 75 Years and over | 3,209 (7.0%) | 5,308 (7.8%) |
Disability Class: Cognitive Difficulty
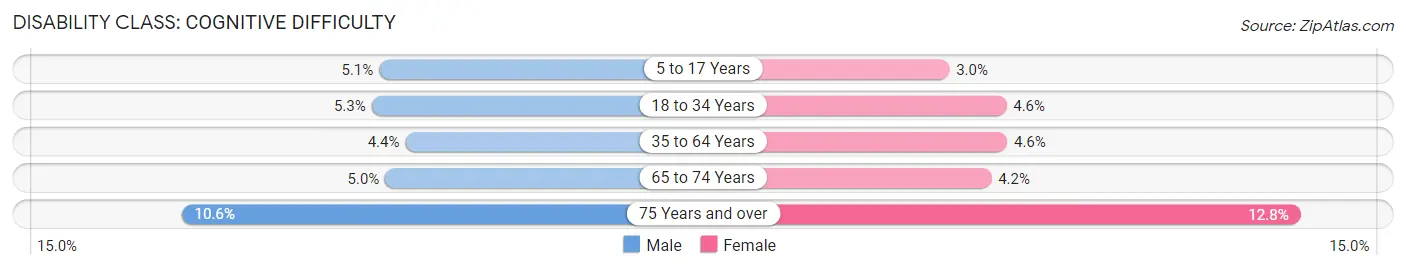
| Age Bracket | Male | Female |
| 5 to 17 Years | 6,746 (5.1%) | 3,816 (3.0%) |
| 18 to 34 Years | 9,914 (5.3%) | 8,109 (4.6%) |
| 35 to 64 Years | 14,494 (4.4%) | 15,631 (4.6%) |
| 65 to 74 Years | 4,020 (5.0%) | 3,926 (4.2%) |
| 75 Years and over | 4,899 (10.6%) | 8,678 (12.8%) |
Disability Class: Ambulatory Difficulty
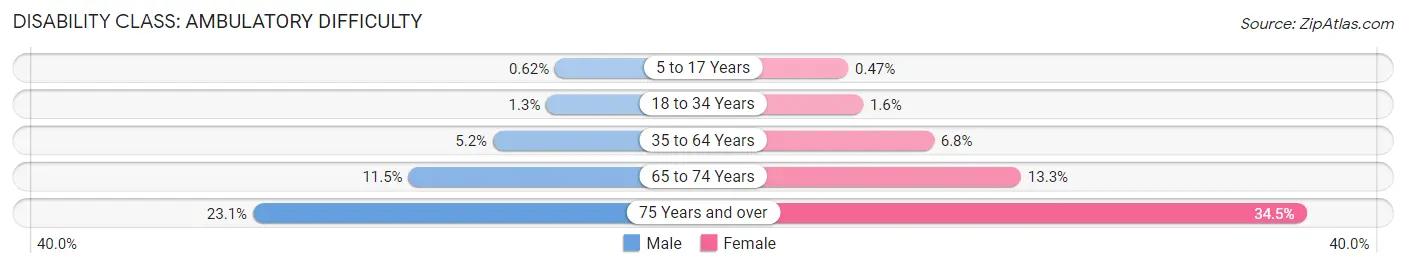
| Age Bracket | Male | Female |
| 5 to 17 Years | 813 (0.6%) | 595 (0.5%) |
| 18 to 34 Years | 2,359 (1.3%) | 2,781 (1.6%) |
| 35 to 64 Years | 17,214 (5.2%) | 23,211 (6.8%) |
| 65 to 74 Years | 9,321 (11.5%) | 12,548 (13.3%) |
| 75 Years and over | 10,629 (23.1%) | 23,441 (34.5%) |
Disability Class: Self-Care Difficulty
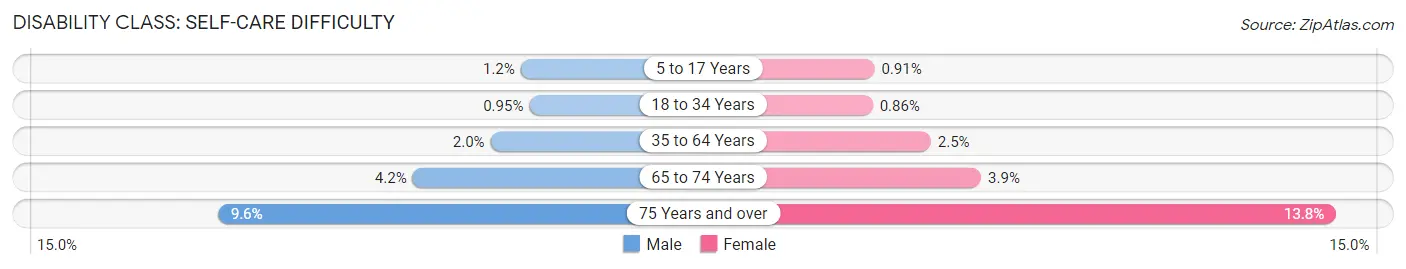
| Age Bracket | Male | Female |
| 5 to 17 Years | 1,566 (1.2%) | 1,157 (0.9%) |
| 18 to 34 Years | 1,758 (0.9%) | 1,514 (0.9%) |
| 35 to 64 Years | 6,693 (2.0%) | 8,442 (2.5%) |
| 65 to 74 Years | 3,403 (4.2%) | 3,664 (3.9%) |
| 75 Years and over | 4,435 (9.6%) | 9,350 (13.8%) |
Technology Access in Area Code 248
Computing Device Access in Area Code 248
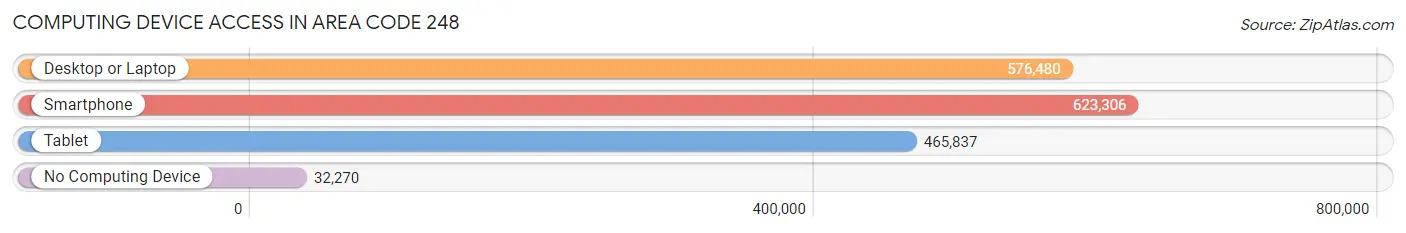
| Device Type | # Households | % Households |
| Desktop or Laptop | 576,480 | 83.3% |
| Smartphone | 623,306 | 90.0% |
| Tablet | 465,837 | 67.3% |
| No Computing Device | 32,270 | 4.7% |
| Total | 692,495 | 100.0% |
Internet Access in Area Code 248
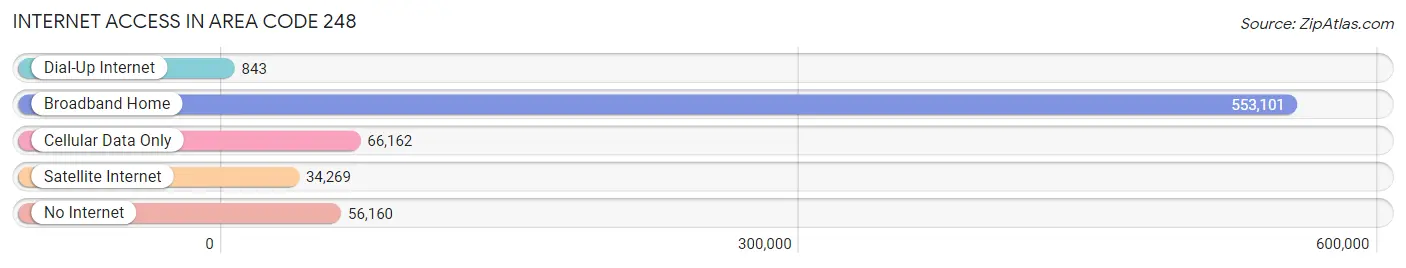
| Internet Type | # Households | % Households |
| Dial-Up Internet | 843 | 0.1% |
| Broadband Home | 553,101 | 79.9% |
| Cellular Data Only | 66,162 | 9.6% |
| Satellite Internet | 34,269 | 5.0% |
| No Internet | 56,160 | 8.1% |
| Total | 692,495 | 100.0% |
Area Code 248 Summary
Geography
Area code 248 is located in the southeastern region of Michigan. It covers the Oakland County area, including the cities of Auburn Hills, Farmington Hills, Novi, Southfield, and Troy.
Social
Area code 248 is a vibrant and diverse area, with a variety of cultural and recreational activities. The area is home to many museums, galleries, and theaters, as well as a variety of restaurants and shopping centers.
Economics
Area code 248 is a major economic hub in Michigan, with many large businesses and corporations based in the area. The area is also home to several universities and colleges, providing a strong educational base for the region.
Demographics
Area code 248 is home to a diverse population, with a mix of ethnicities and backgrounds. The population is largely white, with a significant African American population. The median household income is slightly higher than the national average, and the unemployment rate is lower than the national average.
Common Questions
What is Per Capita Income in Area Code 248?
Per Capita income in Area Code 248 is $51,862.
What is the Median Family Income in Area Code 248?
Median Family Income in Area Code 248 is $121,286.
What is the Median Household income in Area Code 248?
Median Household Income in Area Code 248 is $98,629.
What is Income or Wage Gap in Area Code 248?
Income or Wage Gap in Area Code 248 is 34.5%.
Women in Area Code 248 earn 65.5 cents for every dollar earned by a man.
What is Family Income Deficit in Area Code 248?
Family Income Deficit in Area Code 248 is $10,431.
Families that are below poverty line in Area Code 248 earn $10,431 less on average than the poverty threshold level.
What is Inequality or Gini Index in Area Code 248?
Inequality or Gini Index in Area Code 248 is 35.07.
What is the Total Population of Area Code 248?
Total Population of Area Code 248 is 1,679,831.
What is the Total Male Population of Area Code 248?
Total Male Population of Area Code 248 is 824,924.
What is the Total Female Population of Area Code 248?
Total Female Population of Area Code 248 is 854,907.
What is the Ratio of Males per 100 Females in Area Code 248?
There are 96.49 Males per 100 Females in Area Code 248.
What is the Ratio of Females per 100 Males in Area Code 248?
There are 103.63 Females per 100 Males in Area Code 248.
What is the Median Population Age in Area Code 248?
Median Population Age in Area Code 248 is 41.3 Years.
What is the Average Family Size in Area Code 248
Average Family Size in Area Code 248 is 3.1 People.
What is the Average Household Size in Area Code 248
Average Household Size in Area Code 248 is 2.4 People.
How Large is the Labor Force in Area Code 248?
There are 898,432 People in the Labor Forcein in Area Code 248.
What is the Percentage of People in the Labor Force in Area Code 248?
65.4% of People are in the Labor Force in Area Code 248.
What is the Unemployment Rate in Area Code 248?
Unemployment Rate in Area Code 248 is 5.3%.