Area Code 802 Map & Demographics
Area Code 802 Map
Area Code 802 Overview
$40,622
PER CAPITA INCOME
$93,079
AVG FAMILY INCOME
$76,006
AVG HOUSEHOLD INCOME
22.1%
WAGE / INCOME GAP [ % ]
77.9¢/ $1
WAGE / INCOME GAP [ $ ]
$9,993
FAMILY INCOME DEFICIT
99.84
INEQUALITY / GINI INDEX
638,732
TOTAL POPULATION
317,844
MALE POPULATION
320,888
FEMALE POPULATION
99.05
MALES / 100 FEMALES
100.96
FEMALES / 100 MALES
46.7
MEDIAN AGE
2.9
AVG FAMILY SIZE
2.4
AVG HOUSEHOLD SIZE
340,243
LABOR FORCE [ PEOPLE ]
63.3%
PERCENT IN LABOR FORCE
4.4%
UNEMPLOYMENT RATE
Income in Area Code 802
Income Overview in Area Code 802
Per Capita Income in Area Code 802 is $40,622, while median incomes of families and households are $93,079 and $76,006 respectively.
| Characteristic | Number | Measure |
| Per Capita Income | 638,732 | $40,622 |
| Median Family Income | 156,161 | $93,079 |
| Mean Family Income | 156,161 | $27,331,110 |
| Median Household Income | 263,609 | $76,006 |
| Mean Household Income | 263,609 | $23,241,485 |
| Income Deficit | 156,161 | $9,993 |
| Wage / Income Gap (%) | 638,732 | 22.15% |
| Wage / Income Gap ($) | 638,732 | 77.85¢ per $1 |
| Gini / Inequality Index | 638,732 | 99.84 |
Earnings by Sex in Area Code 802
Average Earnings in Area Code 802 are $40,771, $45,640 for men and $36,810 for women, a difference of 19.4%.
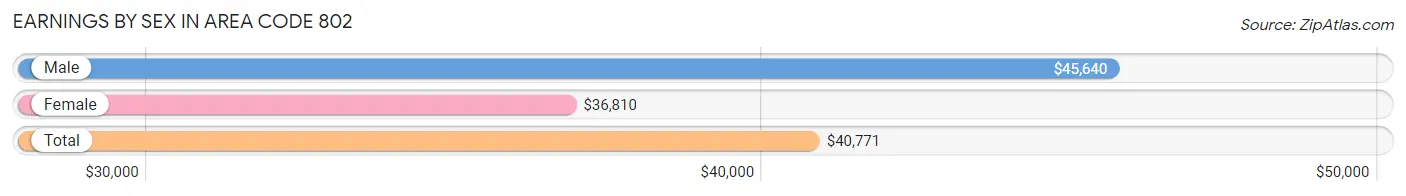
| Sex | Number | Average Earnings |
| Male | 192,603 (51.1%) | $45,640 |
| Female | 184,040 (48.9%) | $36,810 |
| Total | 376,643 (100.0%) | $40,771 |
Earnings by Sex by Income Bracket in Area Code 802
The most common earnings brackets in Area Code 802 are $100,000+ for men (27,803 | 14.4%) and $75,000 to $99,999 for women (16,182 | 8.8%).
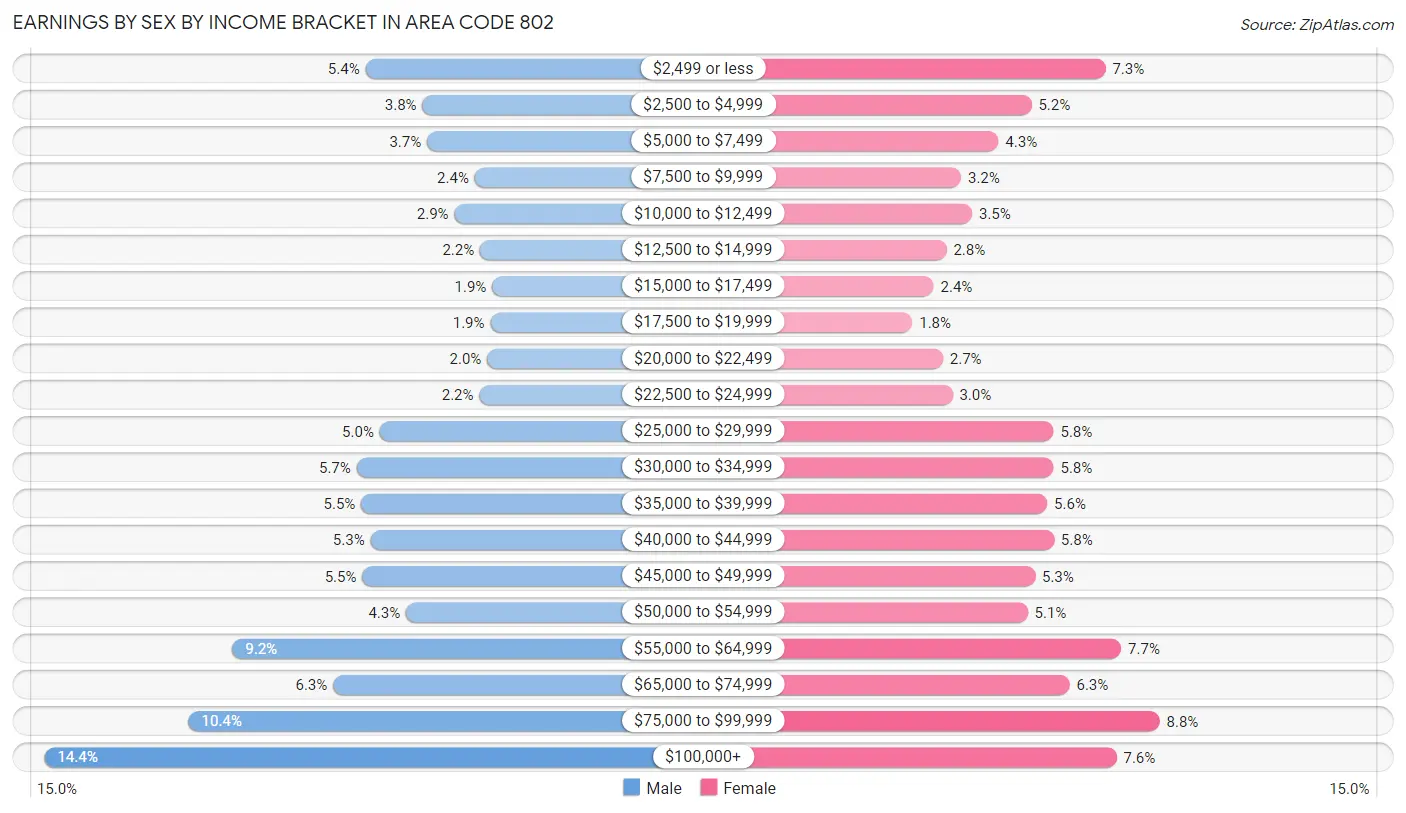
| Income | Male | Female |
| $2,499 or less | 10,435 (5.4%) | 13,383 (7.3%) |
| $2,500 to $4,999 | 7,364 (3.8%) | 9,552 (5.2%) |
| $5,000 to $7,499 | 7,112 (3.7%) | 7,845 (4.3%) |
| $7,500 to $9,999 | 4,532 (2.4%) | 5,901 (3.2%) |
| $10,000 to $12,499 | 5,623 (2.9%) | 6,475 (3.5%) |
| $12,500 to $14,999 | 4,231 (2.2%) | 5,162 (2.8%) |
| $15,000 to $17,499 | 3,583 (1.9%) | 4,491 (2.4%) |
| $17,500 to $19,999 | 3,675 (1.9%) | 3,393 (1.8%) |
| $20,000 to $22,499 | 3,853 (2.0%) | 4,968 (2.7%) |
| $22,500 to $24,999 | 4,267 (2.2%) | 5,460 (3.0%) |
| $25,000 to $29,999 | 9,660 (5.0%) | 10,696 (5.8%) |
| $30,000 to $34,999 | 10,928 (5.7%) | 10,697 (5.8%) |
| $35,000 to $39,999 | 10,671 (5.5%) | 10,368 (5.6%) |
| $40,000 to $44,999 | 10,166 (5.3%) | 10,718 (5.8%) |
| $45,000 to $49,999 | 10,605 (5.5%) | 9,740 (5.3%) |
| $50,000 to $54,999 | 8,250 (4.3%) | 9,355 (5.1%) |
| $55,000 to $64,999 | 17,635 (9.2%) | 14,183 (7.7%) |
| $65,000 to $74,999 | 12,193 (6.3%) | 11,520 (6.3%) |
| $75,000 to $99,999 | 20,017 (10.4%) | 16,182 (8.8%) |
| $100,000+ | 27,803 (14.4%) | 13,951 (7.6%) |
| Total | 192,603 (100.0%) | 184,040 (100.0%) |
Earnings by Sex by Educational Attainment in Area Code 802
Average earnings in Area Code 802 are $11,779,671 for men and $9,221,462 for women, a difference of 21.7%. Men with an educational attainment of bachelor's degree enjoy the highest average annual earnings of $11,378,606, while those with less than high school education earn the least with $3,105,325. Women with an educational attainment of graduate degree earn the most with the average annual earnings of $10,957,713, while those with less than high school education have the smallest earnings of $889,954.
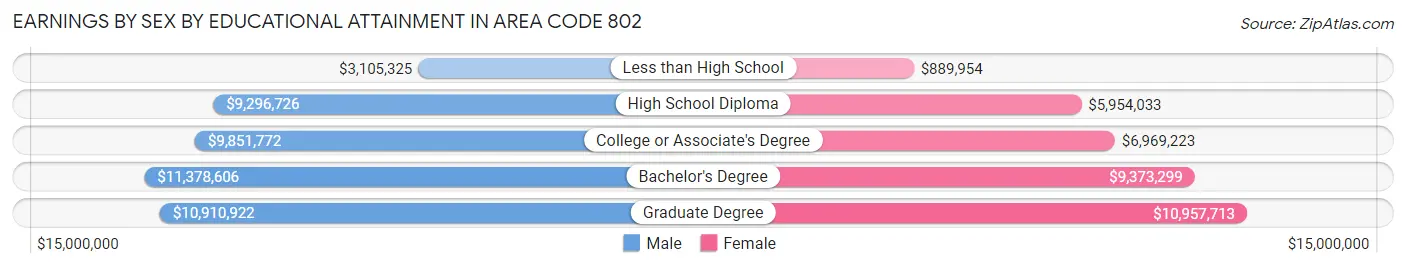
| Educational Attainment | Male Income | Female Income |
| Less than High School | $3,105,325 | $889,954 |
| High School Diploma | $9,296,726 | $5,954,033 |
| College or Associate's Degree | $9,851,772 | $6,969,223 |
| Bachelor's Degree | $11,378,606 | $9,373,299 |
| Graduate Degree | $10,910,922 | $10,957,713 |
| Total | $11,779,671 | $9,221,462 |
Family Income in Area Code 802
Family Income Brackets in Area Code 802
According to the Area Code 802 family income data, there are 8,867,602 families falling into the $100,000 to $149,999 income range, which is the most common income bracket and makes up 5,678.5% of all families. Conversely, the $10,000 to $14,999 income bracket is the least frequent group with only 392,901 families (251.6%) belonging to this category.
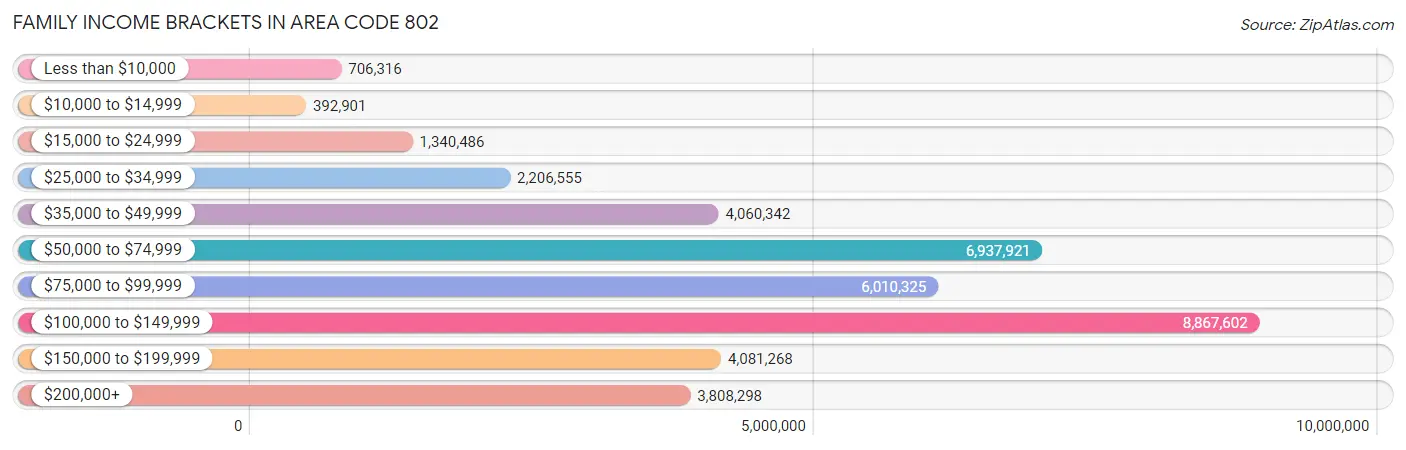
| Income Bracket | # Families | % Families |
| Less than $10,000 | 706,316 | 452.3% |
| $10,000 to $14,999 | 392,901 | 251.6% |
| $15,000 to $24,999 | 1,340,486 | 858.4% |
| $25,000 to $34,999 | 2,206,555 | 1,413.0% |
| $35,000 to $49,999 | 4,060,342 | 2,600.1% |
| $50,000 to $74,999 | 6,937,921 | 4,442.8% |
| $75,000 to $99,999 | 6,010,325 | 3,848.8% |
| $100,000 to $149,999 | 8,867,602 | 5,678.5% |
| $150,000 to $199,999 | 4,081,268 | 2,613.5% |
| $200,000+ | 3,808,298 | 2,438.7% |
Family Income by Famaliy Size in Area Code 802
6-person families (2,632 | 1.7%) account for the highest median family income in Area Code 802 with $155,486 per family, while 2-person families (88,144 | 56.4%) have the highest median income of $43,338 per family member.
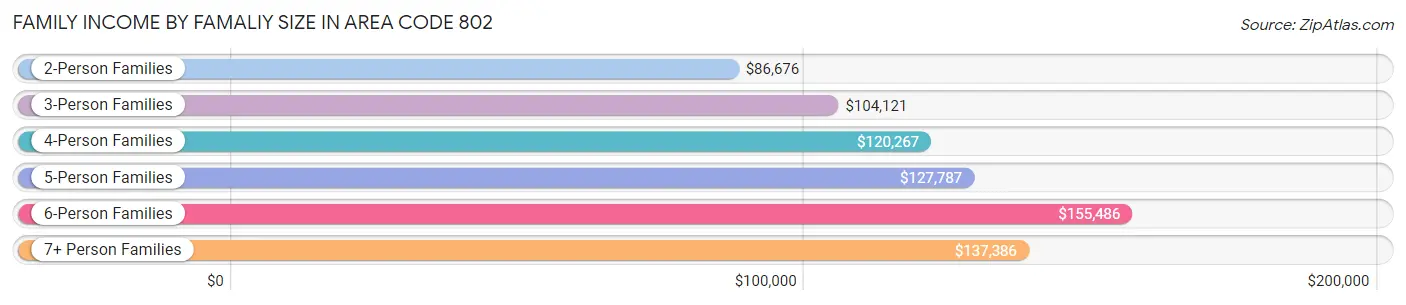
| Income Bracket | # Families | Median Income |
| 2-Person Families | 88,144 (56.4%) | $86,676 |
| 3-Person Families | 32,563 (20.8%) | $104,121 |
| 4-Person Families | 23,858 (15.3%) | $120,267 |
| 5-Person Families | 8,009 (5.1%) | $127,787 |
| 6-Person Families | 2,632 (1.7%) | $155,486 |
| 7+ Person Families | 955 (0.6%) | $137,386 |
| Total | 156,161 (100.0%) | $93,079 |
Family Income by Number of Earners in Area Code 802
The median family income in Area Code 802 is $93,079, with families comprising 3+ earners (16,266) having the highest median family income of $149,827, while families with no earners (23,838) have the lowest median family income of $61,219, accounting for 10.4% and 15.3% of families, respectively.
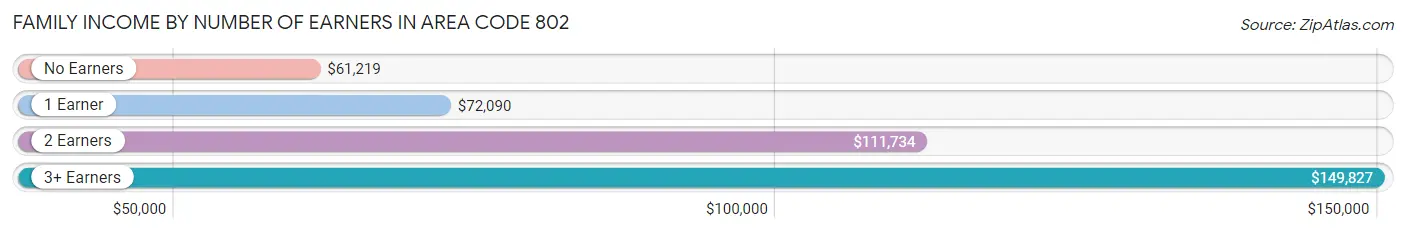
| Number of Earners | # Families | Median Income |
| No Earners | 23,838 (15.3%) | $61,219 |
| 1 Earner | 42,775 (27.4%) | $72,090 |
| 2 Earners | 73,282 (46.9%) | $111,734 |
| 3+ Earners | 16,266 (10.4%) | $149,827 |
| Total | 156,161 (100.0%) | $93,079 |
Household Income in Area Code 802
Household Income Brackets in Area Code 802
With 12,169,509 households falling in the category, the $100,000 to $149,999 income range is the most frequent in Area Code 802, accounting for 4,616.5% of all households. In contrast, only 2,161,857 households (820.1%) fall into the less than $10,000 income bracket, making it the least populous group.
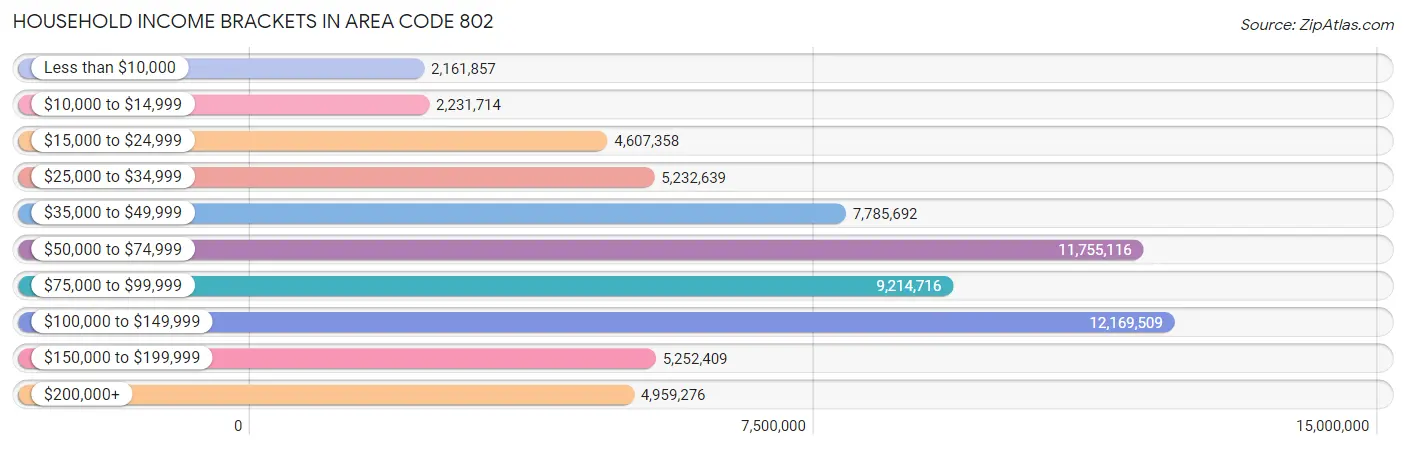
| Income Bracket | # Households | % Households |
| Less than $10,000 | 2,161,857 | 820.1% |
| $10,000 to $14,999 | 2,231,714 | 846.6% |
| $15,000 to $24,999 | 4,607,358 | 1,747.8% |
| $25,000 to $34,999 | 5,232,639 | 1,985.0% |
| $35,000 to $49,999 | 7,785,692 | 2,953.5% |
| $50,000 to $74,999 | 11,755,116 | 4,459.3% |
| $75,000 to $99,999 | 9,214,716 | 3,495.6% |
| $100,000 to $149,999 | 12,169,509 | 4,616.5% |
| $150,000 to $199,999 | 5,252,409 | 1,992.5% |
| $200,000+ | 4,959,276 | 1,881.3% |
Household Income by Householder Age in Area Code 802
The median household income in Area Code 802 is $76,006, with the highest median household income of $92,289 found in the 45 to 64 years age bracket for the primary householder. A total of 99,231 households (37.6%) fall into this category. Meanwhile, the 15 to 24 years age bracket for the primary householder has the lowest median household income of $47,730, with 10,017 households (3.8%) in this group.
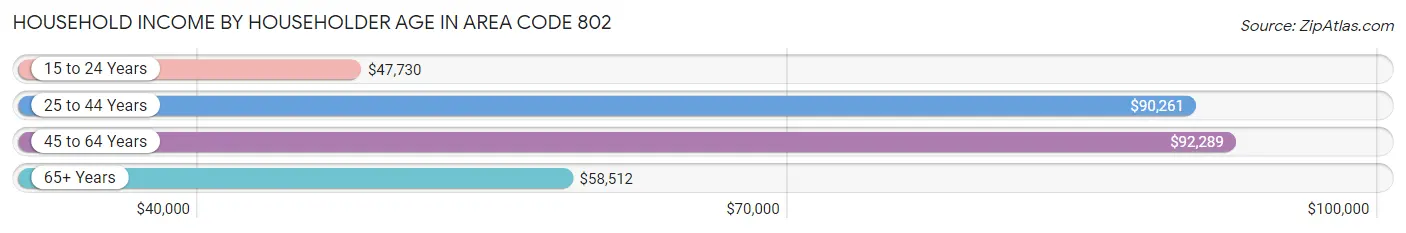
| Income Bracket | # Households | Median Income |
| 15 to 24 Years | 10,017 (3.8%) | $47,730 |
| 25 to 44 Years | 72,094 (27.4%) | $90,261 |
| 45 to 64 Years | 99,231 (37.6%) | $92,289 |
| 65+ Years | 82,267 (31.2%) | $58,512 |
| Total | 263,609 (100.0%) | $76,006 |
Poverty in Area Code 802
Income Below Poverty by Sex and Age in Area Code 802
With 9.3% poverty level for males and 11.5% for females among the residents of Area Code 802, 18 to 24 year old males and 18 to 24 year old females are the most vulnerable to poverty, with 4,592 males (16.9%) and 7,010 females (28.4%) in their respective age groups living below the poverty level.
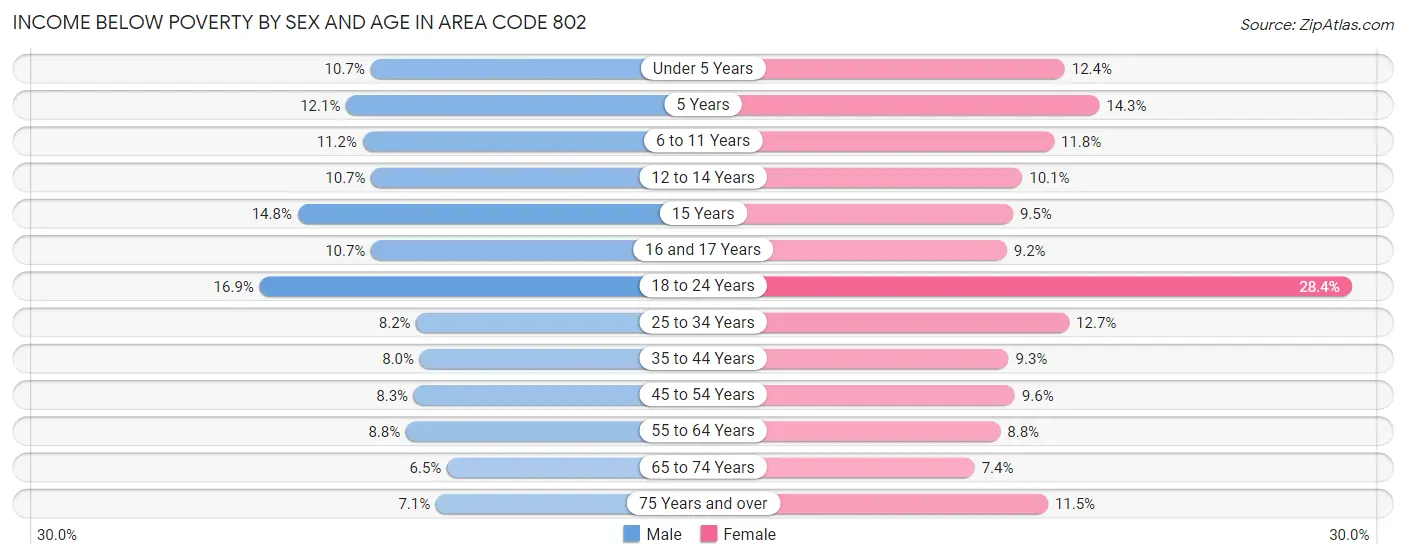
| Age Bracket | Male | Female |
| Under 5 Years | 1,512 (10.7%) | 1,657 (12.4%) |
| 5 Years | 355 (12.1%) | 415 (14.3%) |
| 6 to 11 Years | 2,286 (11.2%) | 2,113 (11.8%) |
| 12 to 14 Years | 1,135 (10.7%) | 1,022 (10.1%) |
| 15 Years | 555 (14.8%) | 299 (9.5%) |
| 16 and 17 Years | 803 (10.7%) | 657 (9.2%) |
| 18 to 24 Years | 4,592 (16.9%) | 7,010 (28.4%) |
| 25 to 34 Years | 3,112 (8.2%) | 4,674 (12.7%) |
| 35 to 44 Years | 2,950 (8.0%) | 3,501 (9.3%) |
| 45 to 54 Years | 3,270 (8.3%) | 3,776 (9.6%) |
| 55 to 64 Years | 4,123 (8.8%) | 4,295 (8.8%) |
| 65 to 74 Years | 2,473 (6.5%) | 2,960 (7.4%) |
| 75 Years and over | 1,484 (7.1%) | 3,109 (11.5%) |
| Total | 28,650 (9.3%) | 35,488 (11.5%) |
Income Above Poverty by Sex and Age in Area Code 802
According to the poverty statistics in Area Code 802, males aged 65 to 74 years and females aged 65 to 74 years are the age groups that are most secure financially, with 93.5% of males and 92.6% of females in these age groups living above the poverty line.
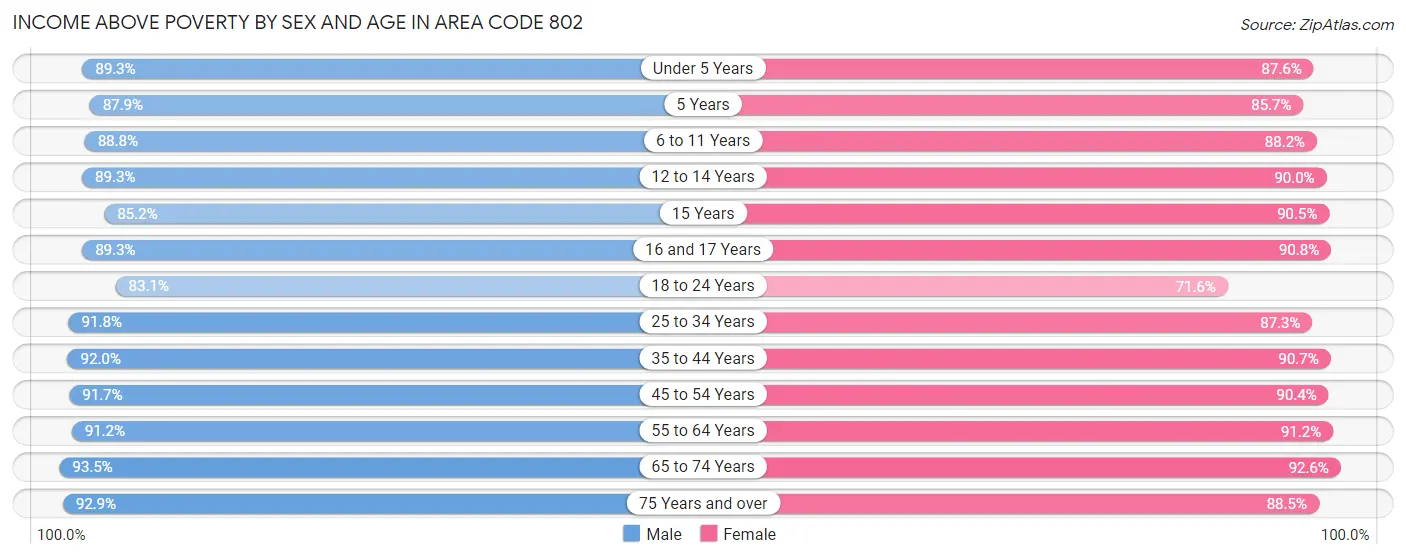
| Age Bracket | Male | Female |
| Under 5 Years | 12,576 (89.3%) | 11,683 (87.6%) |
| 5 Years | 2,582 (87.9%) | 2,480 (85.7%) |
| 6 to 11 Years | 18,178 (88.8%) | 15,771 (88.2%) |
| 12 to 14 Years | 9,478 (89.3%) | 9,151 (89.9%) |
| 15 Years | 3,198 (85.2%) | 2,840 (90.5%) |
| 16 and 17 Years | 6,705 (89.3%) | 6,494 (90.8%) |
| 18 to 24 Years | 22,564 (83.1%) | 17,687 (71.6%) |
| 25 to 34 Years | 34,912 (91.8%) | 32,257 (87.3%) |
| 35 to 44 Years | 33,991 (92.0%) | 34,183 (90.7%) |
| 45 to 54 Years | 36,016 (91.7%) | 35,398 (90.4%) |
| 55 to 64 Years | 42,940 (91.2%) | 44,362 (91.2%) |
| 65 to 74 Years | 35,751 (93.5%) | 37,036 (92.6%) |
| 75 Years and over | 19,461 (92.9%) | 23,977 (88.5%) |
| Total | 278,352 (90.7%) | 273,319 (88.5%) |
Income Below Poverty Among Married-Couple Families in Area Code 802
The poverty statistics for married-couple families in Area Code 802 show that 2.7% or 3,388 of the total 123,605 families live below the poverty line. Families with 5 or more children have the highest poverty rate of 34.1%, comprising of 102 families. On the other hand, families with no children have the lowest poverty rate of 2.5%, which includes 2,028 families.
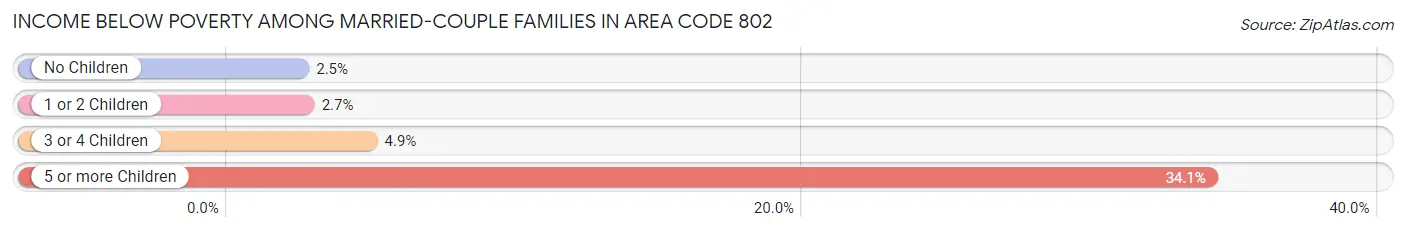
| Children | Above Poverty | Below Poverty |
| No Children | 79,740 (97.5%) | 2,028 (2.5%) |
| 1 or 2 Children | 33,784 (97.3%) | 926 (2.7%) |
| 3 or 4 Children | 6,496 (95.1%) | 332 (4.9%) |
| 5 or more Children | 197 (65.9%) | 102 (34.1%) |
| Total | 120,217 (97.3%) | 3,388 (2.7%) |
Income Below Poverty Among Single-Parent Households in Area Code 802
According to the poverty data in Area Code 802, 12.2% or 1,291 single-father households and 20.1% or 4,422 single-mother households are living below the poverty line. Among single-father households, those with 5 or more children have the highest poverty rate, with 58 households (51.3%) experiencing poverty. Likewise, among single-mother households, those with 5 or more children have the highest poverty rate, with 42 households (64.6%) falling below the poverty line.
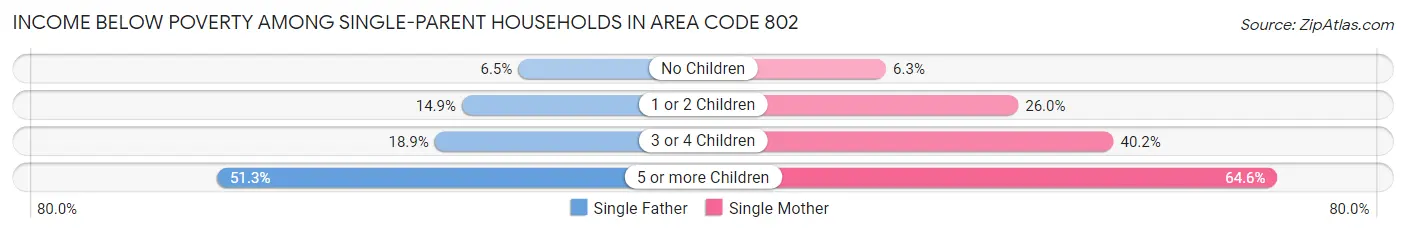
| Children | Single Father | Single Mother |
| No Children | 261 (6.5%) | 496 (6.3%) |
| 1 or 2 Children | 871 (14.9%) | 3,278 (26.0%) |
| 3 or 4 Children | 101 (18.9%) | 606 (40.2%) |
| 5 or more Children | 58 (51.3%) | 42 (64.6%) |
| Total | 1,291 (12.2%) | 4,422 (20.1%) |
Income Below Poverty Among Married-Couple vs Single-Parent Households in Area Code 802
The poverty data for Area Code 802 shows that 3,388 of the married-couple family households (2.7%) and 5,713 of the single-parent households (17.5%) are living below the poverty level. Within the married-couple family households, those with 5 or more children have the highest poverty rate, with 102 households (34.1%) falling below the poverty line. Among the single-parent households, those with 5 or more children have the highest poverty rate, with 100 household (56.2%) living below poverty.
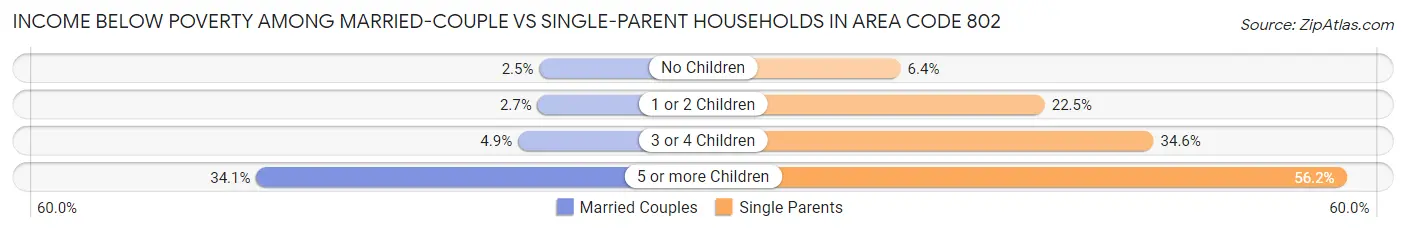
| Children | Married-Couple Families | Single-Parent Households |
| No Children | 2,028 (2.5%) | 757 (6.4%) |
| 1 or 2 Children | 926 (2.7%) | 4,149 (22.5%) |
| 3 or 4 Children | 332 (4.9%) | 707 (34.6%) |
| 5 or more Children | 102 (34.1%) | 100 (56.2%) |
| Total | 3,388 (2.7%) | 5,713 (17.5%) |
Race in Area Code 802
The most populous races in Area Code 802 are White / Caucasian (589,253 | 92.2%), Two or more Races (25,669 | 4.0%), and Hispanic or Latino (13,681 | 2.1%).
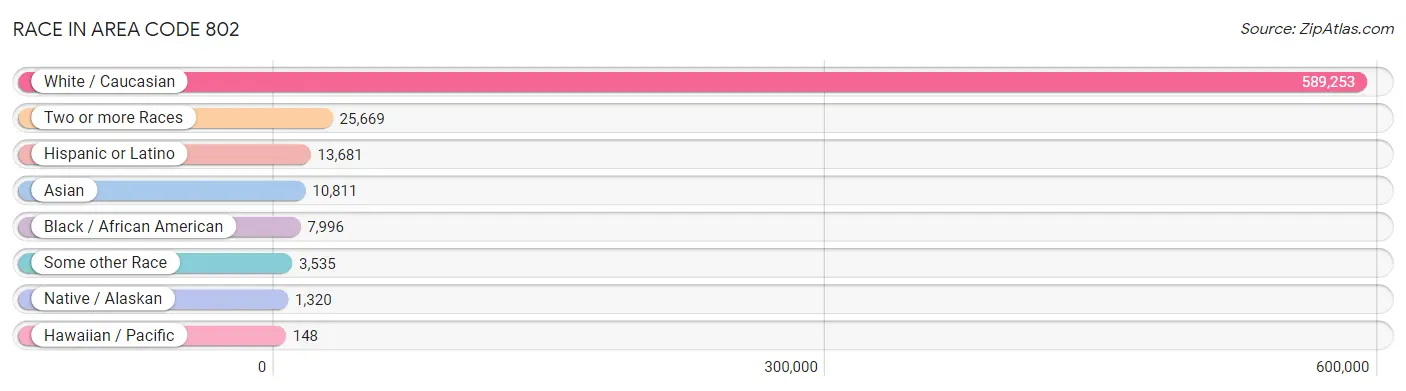
| Race | # Population | % Population |
| Asian | 10,811 | 1.7% |
| Black / African American | 7,996 | 1.3% |
| Hawaiian / Pacific | 148 | 0.0% |
| Hispanic or Latino | 13,681 | 2.1% |
| Native / Alaskan | 1,320 | 0.2% |
| White / Caucasian | 589,253 | 92.2% |
| Two or more Races | 25,669 | 4.0% |
| Some other Race | 3,535 | 0.5% |
| Total | 638,732 | 100.0% |
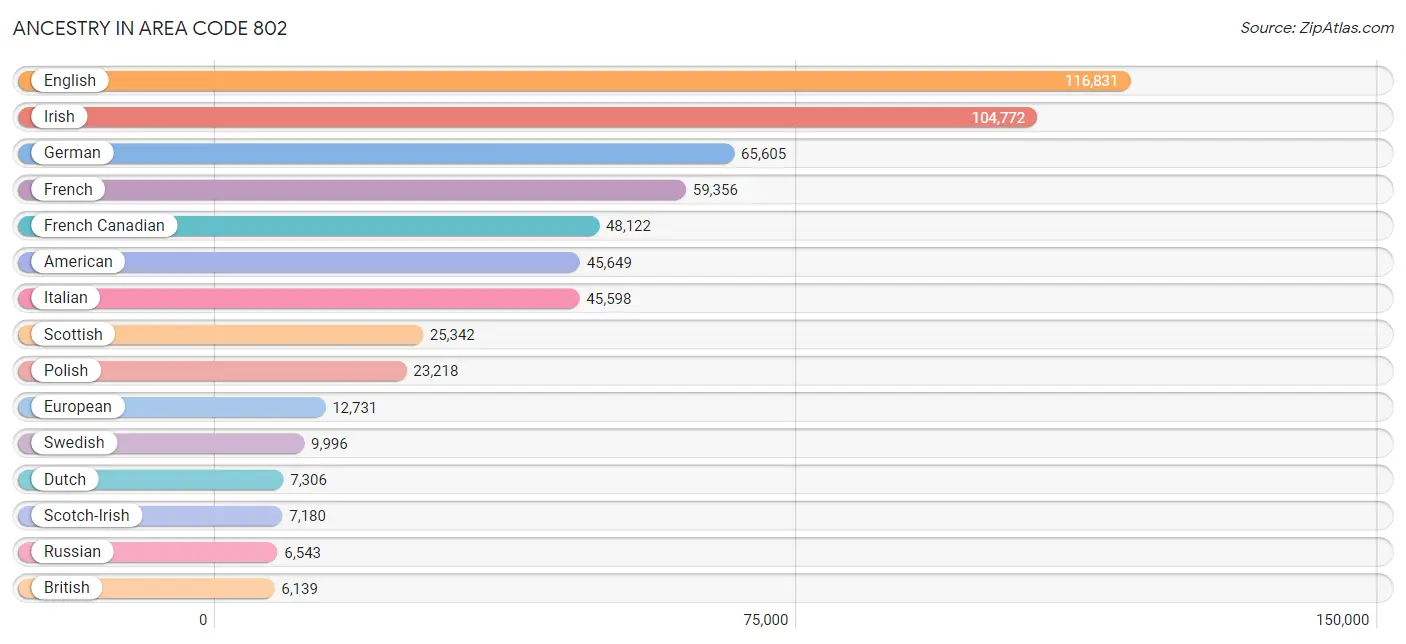
Ancestry in Area Code 802
The most populous ancestries reported in Area Code 802 are English (116,831 | 18.3%), Irish (104,772 | 16.4%), German (65,605 | 10.3%), French (59,356 | 9.3%), and French Canadian (48,122 | 7.5%), together accounting for 61.8% of all Area Code 802 residents.
| Ancestry | # Population | % Population |
| African | 896 | 0.1% |
| Alaska Native | 9 | 0.0% |
| Albanian | 93 | 0.0% |
| Aleut | 11 | 0.0% |
| Alsatian | 25 | 0.0% |
| American | 45,649 | 7.1% |
| Apache | 54 | 0.0% |
| Arab | 2,051 | 0.3% |
| Argentinean | 289 | 0.1% |
| Armenian | 640 | 0.1% |
| Assyrian / Chaldean / Syriac | 7 | 0.0% |
| Australian | 95 | 0.0% |
| Austrian | 1,885 | 0.3% |
| Bahamian | 2 | 0.0% |
| Barbadian | 59 | 0.0% |
| Basque | 30 | 0.0% |
| Belgian | 417 | 0.1% |
| Bhutanese | 1,089 | 0.2% |
| Blackfeet | 431 | 0.1% |
| Bolivian | 108 | 0.0% |
| Brazilian | 375 | 0.1% |
| British | 6,139 | 1.0% |
| British West Indian | 32 | 0.0% |
| Bulgarian | 56 | 0.0% |
| Burmese | 1,816 | 0.3% |
| Cajun | 51 | 0.0% |
| Cambodian | 14 | 0.0% |
| Canadian | 5,075 | 0.8% |
| Cape Verdean | 58 | 0.0% |
| Carpatho Rusyn | 7 | 0.0% |
| Celtic | 347 | 0.1% |
| Central American | 995 | 0.2% |
| Central American Indian | 357 | 0.1% |
| Cherokee | 761 | 0.1% |
| Cheyenne | 17 | 0.0% |
| Chickasaw | 54 | 0.0% |
| Chilean | 221 | 0.0% |
| Chippewa | 62 | 0.0% |
| Choctaw | 72 | 0.0% |
| Colombian | 570 | 0.1% |
| Costa Rican | 122 | 0.0% |
| Cree | 57 | 0.0% |
| Creek | 26 | 0.0% |
| Croatian | 363 | 0.1% |
| Crow | 4 | 0.0% |
| Cuban | 805 | 0.1% |
| Cypriot | 2 | 0.0% |
| Czech | 1,794 | 0.3% |
| Czechoslovakian | 384 | 0.1% |
| Danish | 2,207 | 0.4% |
| Delaware | 14 | 0.0% |
| Dominican | 688 | 0.1% |
| Dutch | 7,306 | 1.1% |
| Eastern European | 3,604 | 0.6% |
| Ecuadorian | 186 | 0.0% |
| Egyptian | 19 | 0.0% |
| English | 116,831 | 18.3% |
| Estonian | 44 | 0.0% |
| Ethiopian | 73 | 0.0% |
| European | 12,731 | 2.0% |
| Filipino | 76 | 0.0% |
| Finnish | 2,074 | 0.3% |
| French | 59,356 | 9.3% |
| French American Indian | 531 | 0.1% |
| French Canadian | 48,122 | 7.5% |
| German | 65,605 | 10.3% |
| German Russian | 38 | 0.0% |
| Ghanaian | 119 | 0.0% |
| Greek | 2,833 | 0.4% |
| Guamanian / Chamorro | 123 | 0.0% |
| Guatemalan | 310 | 0.1% |
| Guyanese | 35 | 0.0% |
| Haitian | 235 | 0.0% |
| Honduran | 36 | 0.0% |
| Hopi | 10 | 0.0% |
| Hungarian | 2,920 | 0.5% |
| Icelander | 117 | 0.0% |
| Indian (Asian) | 3,315 | 0.5% |
| Indonesian | 590 | 0.1% |
| Inupiat | 12 | 0.0% |
| Iranian | 421 | 0.1% |
| Iraqi | 73 | 0.0% |
| Irish | 104,772 | 16.4% |
| Iroquois | 370 | 0.1% |
| Israeli | 286 | 0.0% |
| Italian | 45,598 | 7.1% |
| Jamaican | 1,052 | 0.2% |
| Japanese | 132 | 0.0% |
| Jordanian | 29 | 0.0% |
| Kenyan | 126 | 0.0% |
| Korean | 2,407 | 0.4% |
| Laotian | 175 | 0.0% |
| Latvian | 296 | 0.1% |
| Lebanese | 1,171 | 0.2% |
| Lithuanian | 2,374 | 0.4% |
| Luxembourger | 63 | 0.0% |
| Macedonian | 82 | 0.0% |
| Malaysian | 124 | 0.0% |
| Maltese | 37 | 0.0% |
| Menominee | 12 | 0.0% |
| Mexican | 3,592 | 0.6% |
| Mexican American Indian | 27 | 0.0% |
| Mongolian | 54 | 0.0% |
| Moroccan | 27 | 0.0% |
| Native Hawaiian | 179 | 0.0% |
| Navajo | 139 | 0.0% |
| New Zealander | 78 | 0.0% |
| Nicaraguan | 216 | 0.0% |
| Nigerian | 541 | 0.1% |
| Northern European | 2,659 | 0.4% |
| Norwegian | 5,951 | 0.9% |
| Okinawan | 21 | 0.0% |
| Osage | 8 | 0.0% |
| Ottawa | 12 | 0.0% |
| Pakistani | 332 | 0.1% |
| Palestinian | 66 | 0.0% |
| Panamanian | 47 | 0.0% |
| Paraguayan | 45 | 0.0% |
| Pennsylvania German | 172 | 0.0% |
| Peruvian | 359 | 0.1% |
| Pima | 1 | 0.0% |
| Polish | 23,218 | 3.6% |
| Portuguese | 2,841 | 0.4% |
| Potawatomi | 5 | 0.0% |
| Pueblo | 25 | 0.0% |
| Puerto Rican | 2,466 | 0.4% |
| Romanian | 785 | 0.1% |
| Russian | 6,543 | 1.0% |
| Salvadoran | 264 | 0.0% |
| Samoan | 159 | 0.0% |
| Scandinavian | 2,067 | 0.3% |
| Scotch-Irish | 7,180 | 1.1% |
| Scottish | 25,342 | 4.0% |
| Seminole | 8 | 0.0% |
| Senegalese | 71 | 0.0% |
| Serbian | 242 | 0.0% |
| Shoshone | 40 | 0.0% |
| Sioux | 169 | 0.0% |
| Slavic | 183 | 0.0% |
| Slovak | 1,495 | 0.2% |
| Slovene | 274 | 0.0% |
| Somali | 489 | 0.1% |
| South African | 45 | 0.0% |
| South American | 2,316 | 0.4% |
| South American Indian | 131 | 0.0% |
| Spaniard | 911 | 0.1% |
| Spanish | 780 | 0.1% |
| Sri Lankan | 1,147 | 0.2% |
| Subsaharan African | 3,170 | 0.5% |
| Sudanese | 18 | 0.0% |
| Swedish | 9,996 | 1.6% |
| Swiss | 1,812 | 0.3% |
| Syrian | 349 | 0.1% |
| Thai | 2,391 | 0.4% |
| Trinidadian and Tobagonian | 74 | 0.0% |
| Turkish | 260 | 0.0% |
| U.S. Virgin Islander | 2 | 0.0% |
| Ugandan | 17 | 0.0% |
| Ukrainian | 2,124 | 0.3% |
| Uruguayan | 187 | 0.0% |
| Venezuelan | 351 | 0.1% |
| Vietnamese | 12 | 0.0% |
| Welsh | 6,099 | 0.9% |
| West Indian | 42 | 0.0% |
| Yaqui | 42 | 0.0% |
| Yugoslavian | 1,025 | 0.2% |
| Zimbabwean | 16 | 0.0% | View All 167 Rows |
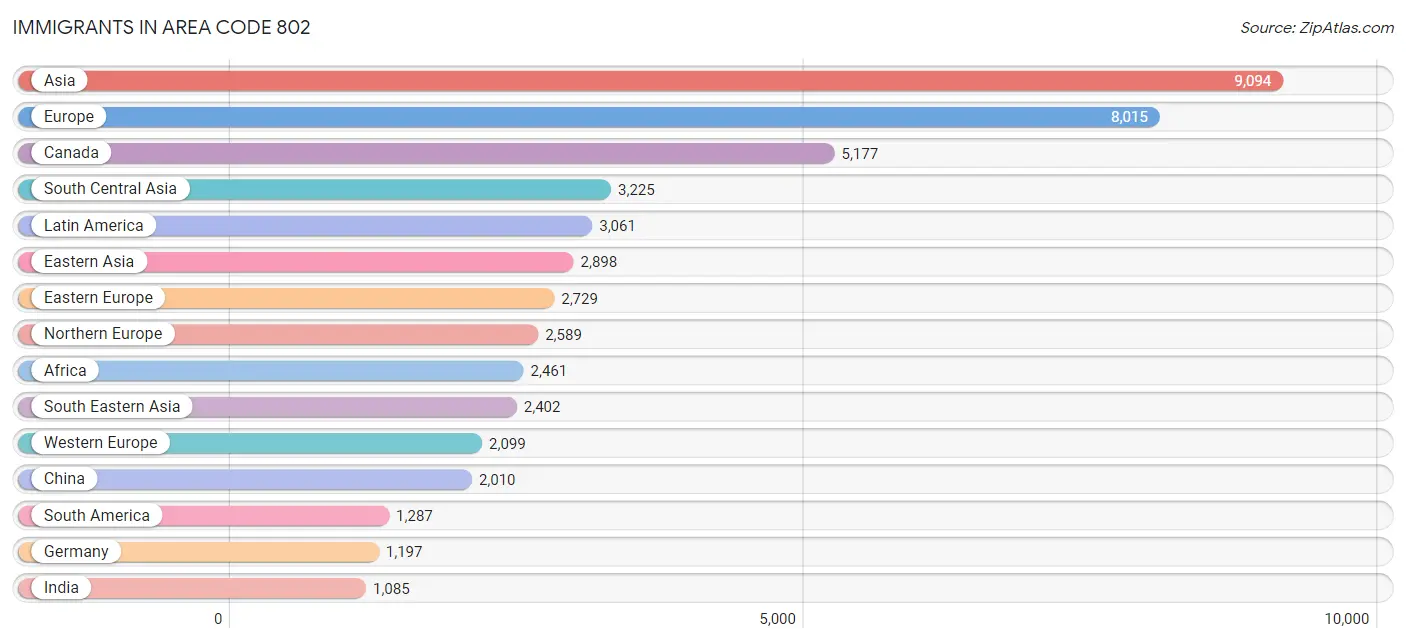
Immigrants in Area Code 802
The most numerous immigrant groups reported in Area Code 802 came from Asia (9,094 | 1.4%), Europe (8,015 | 1.3%), Canada (5,177 | 0.8%), South Central Asia (3,225 | 0.5%), and Latin America (3,061 | 0.5%), together accounting for 4.5% of all Area Code 802 residents.
| Immigration Origin | # Population | % Population |
| Afghanistan | 1 | 0.0% |
| Africa | 2,461 | 0.4% |
| Albania | 41 | 0.0% |
| Argentina | 89 | 0.0% |
| Armenia | 6 | 0.0% |
| Asia | 9,094 | 1.4% |
| Australia | 267 | 0.0% |
| Austria | 130 | 0.0% |
| Bahamas | 21 | 0.0% |
| Bangladesh | 62 | 0.0% |
| Barbados | 25 | 0.0% |
| Belarus | 28 | 0.0% |
| Belgium | 82 | 0.0% |
| Bolivia | 26 | 0.0% |
| Bosnia and Herzegovina | 866 | 0.1% |
| Brazil | 335 | 0.1% |
| Bulgaria | 35 | 0.0% |
| Cambodia | 77 | 0.0% |
| Canada | 5,177 | 0.8% |
| Caribbean | 954 | 0.2% |
| Central America | 820 | 0.1% |
| Chile | 62 | 0.0% |
| China | 2,010 | 0.3% |
| Colombia | 137 | 0.0% |
| Congo | 26 | 0.0% |
| Costa Rica | 3 | 0.0% |
| Croatia | 17 | 0.0% |
| Cuba | 31 | 0.0% |
| Czechoslovakia | 93 | 0.0% |
| Denmark | 37 | 0.0% |
| Dominica | 31 | 0.0% |
| Dominican Republic | 102 | 0.0% |
| Eastern Africa | 685 | 0.1% |
| Eastern Asia | 2,898 | 0.4% |
| Eastern Europe | 2,729 | 0.4% |
| Ecuador | 96 | 0.0% |
| Egypt | 8 | 0.0% |
| El Salvador | 40 | 0.0% |
| England | 886 | 0.1% |
| Ethiopia | 33 | 0.0% |
| Europe | 8,015 | 1.3% |
| France | 292 | 0.1% |
| Germany | 1,197 | 0.2% |
| Ghana | 269 | 0.0% |
| Greece | 136 | 0.0% |
| Guatemala | 214 | 0.0% |
| Guyana | 8 | 0.0% |
| Haiti | 151 | 0.0% |
| Honduras | 14 | 0.0% |
| Hong Kong | 105 | 0.0% |
| Hungary | 57 | 0.0% |
| India | 1,085 | 0.2% |
| Indonesia | 40 | 0.0% |
| Iran | 170 | 0.0% |
| Iraq | 132 | 0.0% |
| Ireland | 242 | 0.0% |
| Israel | 97 | 0.0% |
| Italy | 306 | 0.1% |
| Jamaica | 520 | 0.1% |
| Japan | 150 | 0.0% |
| Jordan | 21 | 0.0% |
| Kazakhstan | 49 | 0.0% |
| Kenya | 194 | 0.0% |
| Korea | 738 | 0.1% |
| Laos | 141 | 0.0% |
| Latin America | 3,061 | 0.5% |
| Latvia | 3 | 0.0% |
| Lebanon | 26 | 0.0% |
| Liberia | 19 | 0.0% |
| Lithuania | 48 | 0.0% |
| Malaysia | 37 | 0.0% |
| Mexico | 483 | 0.1% |
| Middle Africa | 374 | 0.1% |
| Moldova | 157 | 0.0% |
| Morocco | 68 | 0.0% |
| Nepal | 902 | 0.1% |
| Netherlands | 283 | 0.0% |
| Nicaragua | 20 | 0.0% |
| Nigeria | 300 | 0.1% |
| North Macedonia | 36 | 0.0% |
| Northern Africa | 235 | 0.0% |
| Northern Europe | 2,589 | 0.4% |
| Norway | 11 | 0.0% |
| Oceania | 306 | 0.1% |
| Pakistan | 95 | 0.0% |
| Panama | 46 | 0.0% |
| Peru | 197 | 0.0% |
| Philippines | 881 | 0.1% |
| Poland | 301 | 0.1% |
| Portugal | 43 | 0.0% |
| Romania | 101 | 0.0% |
| Russia | 527 | 0.1% |
| Scotland | 158 | 0.0% |
| Senegal | 65 | 0.0% |
| Serbia | 38 | 0.0% |
| Sierra Leone | 6 | 0.0% |
| Singapore | 32 | 0.0% |
| Somalia | 235 | 0.0% |
| South Africa | 189 | 0.0% |
| South America | 1,287 | 0.2% |
| South Central Asia | 3,225 | 0.5% |
| South Eastern Asia | 2,402 | 0.4% |
| Southern Europe | 598 | 0.1% |
| Spain | 106 | 0.0% |
| Sri Lanka | 82 | 0.0% |
| Sudan | 159 | 0.0% |
| Sweden | 131 | 0.0% |
| Switzerland | 106 | 0.0% |
| Syria | 1 | 0.0% |
| Taiwan | 199 | 0.0% |
| Thailand | 309 | 0.1% |
| Trinidad and Tobago | 49 | 0.0% |
| Turkey | 197 | 0.0% |
| Uganda | 23 | 0.0% |
| Ukraine | 158 | 0.0% |
| Uruguay | 131 | 0.0% |
| Uzbekistan | 37 | 0.0% |
| Venezuela | 188 | 0.0% |
| Vietnam | 503 | 0.1% |
| Western Africa | 949 | 0.2% |
| Western Asia | 569 | 0.1% |
| Western Europe | 2,099 | 0.3% |
| Yemen | 12 | 0.0% |
| Zaire | 333 | 0.1% |
| Zimbabwe | 80 | 0.0% | View All 125 Rows |
Sex and Age in Area Code 802
Sex and Age in Area Code 802
The most populous age groups in Area Code 802 are 60 to 64 Years (24,207 | 7.6%) for men and 60 to 64 Years (25,894 | 8.1%) for women.
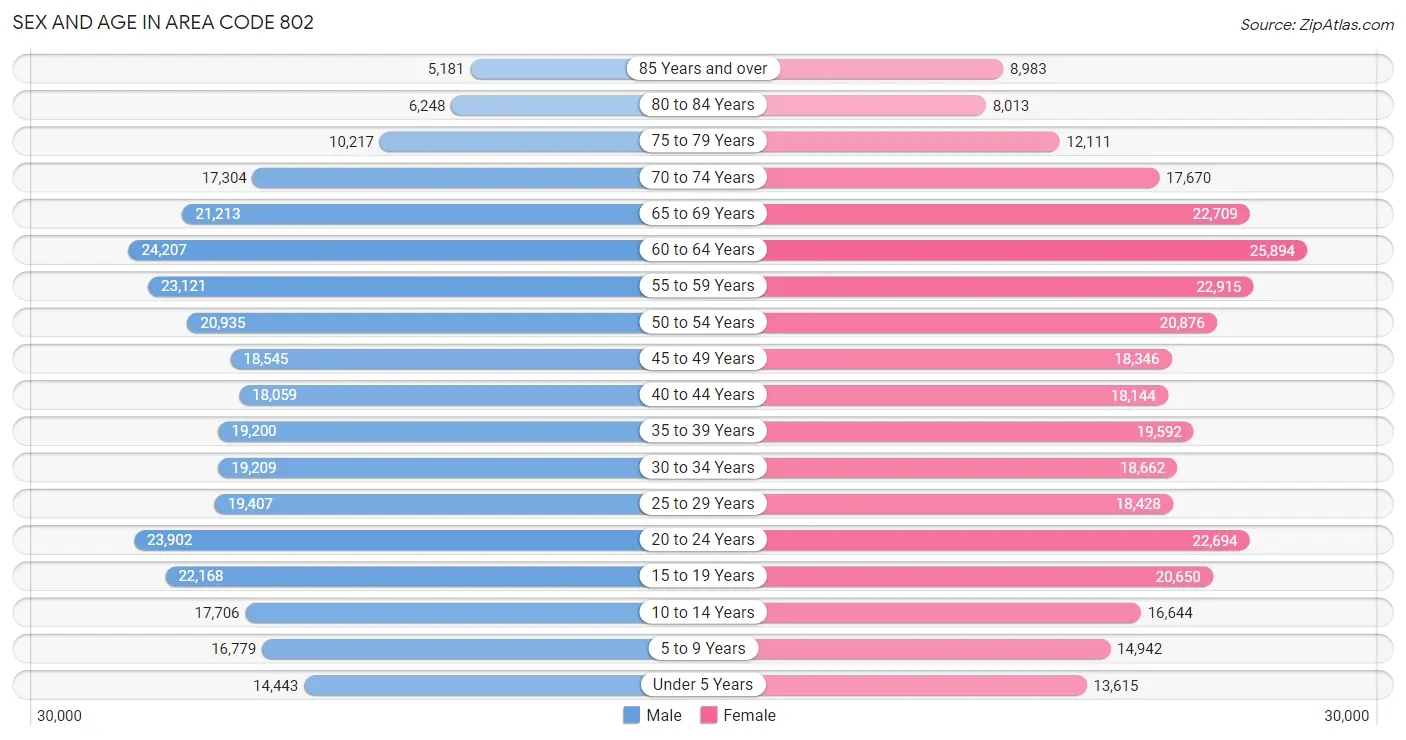
| Age Bracket | Male | Female |
| Under 5 Years | 14,443 (4.5%) | 13,615 (4.2%) |
| 5 to 9 Years | 16,779 (5.3%) | 14,942 (4.7%) |
| 10 to 14 Years | 17,706 (5.6%) | 16,644 (5.2%) |
| 15 to 19 Years | 22,168 (7.0%) | 20,650 (6.4%) |
| 20 to 24 Years | 23,902 (7.5%) | 22,694 (7.1%) |
| 25 to 29 Years | 19,407 (6.1%) | 18,428 (5.7%) |
| 30 to 34 Years | 19,209 (6.0%) | 18,662 (5.8%) |
| 35 to 39 Years | 19,200 (6.0%) | 19,592 (6.1%) |
| 40 to 44 Years | 18,059 (5.7%) | 18,144 (5.7%) |
| 45 to 49 Years | 18,545 (5.8%) | 18,346 (5.7%) |
| 50 to 54 Years | 20,935 (6.6%) | 20,876 (6.5%) |
| 55 to 59 Years | 23,121 (7.3%) | 22,915 (7.1%) |
| 60 to 64 Years | 24,207 (7.6%) | 25,894 (8.1%) |
| 65 to 69 Years | 21,213 (6.7%) | 22,709 (7.1%) |
| 70 to 74 Years | 17,304 (5.4%) | 17,670 (5.5%) |
| 75 to 79 Years | 10,217 (3.2%) | 12,111 (3.8%) |
| 80 to 84 Years | 6,248 (2.0%) | 8,013 (2.5%) |
| 85 Years and over | 5,181 (1.6%) | 8,983 (2.8%) |
| Total | 317,844 (100.0%) | 320,888 (100.0%) |
Families and Households in Area Code 802
Median Family Size in Area Code 802
The median family size in Area Code 802 is 2.91 persons per family, with single female/mother families (22,009 | 14.1%) accounting for the largest median family size of 3.11254 persons per family. On the other hand, married-couple families (123,605 | 79.1%) represent the smallest median family size with 2.89 persons per family.
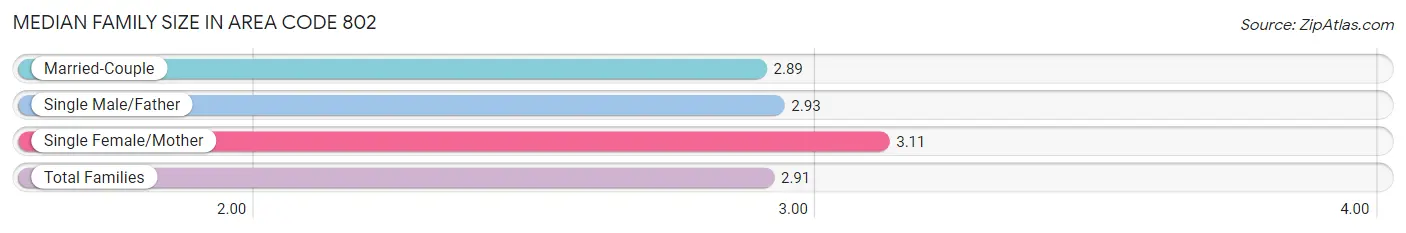
| Family Type | # Families | Family Size |
| Married-Couple | 123,605 (79.1%) | 2.89 |
| Single Male/Father | 10,547 (6.8%) | 2.93 |
| Single Female/Mother | 22,009 (14.1%) | 3.11 |
| Total Families | 156,161 (100.0%) | 2.91 |
Median Household Size in Area Code 802
The median household size in Area Code 802 is 2.37 persons per household, with single female/mother households (22,009 | 8.4%) accounting for the largest median household size of 3.50736 persons per household. non-family households (107,448 | 40.8%) represent the smallest median household size with 1.29 persons per household.
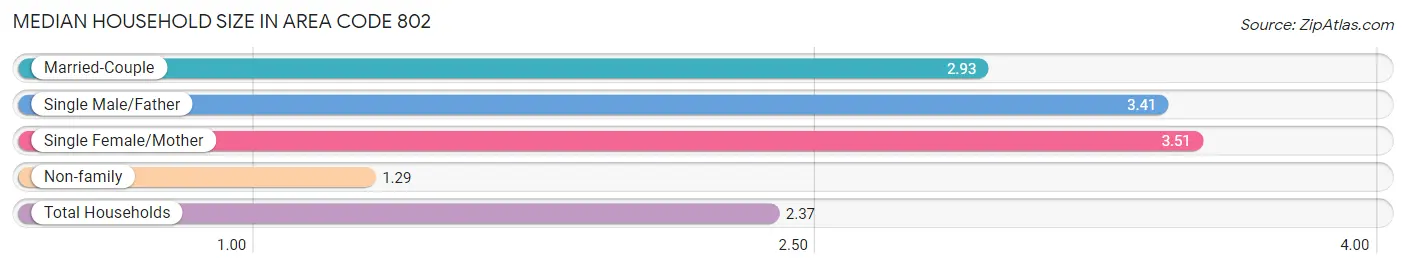
| Household Type | # Households | Household Size |
| Married-Couple | 123,605 (46.9%) | 2.93 |
| Single Male/Father | 10,547 (4.0%) | 3.41 |
| Single Female/Mother | 22,009 (8.4%) | 3.51 |
| Non-family | 107,448 (40.8%) | 1.29 |
| Total Households | 263,609 (100.0%) | 2.37 |
Household Size by Marriage Status in Area Code 802
Out of a total of 263,609 households in Area Code 802, 156,161 (59.2%) are family households, while 107,448 (40.8%) are nonfamily households. The most numerous type of family households are 2-person households, comprising 82,314, and the most common type of nonfamily households are 1-person households, comprising 81,754.
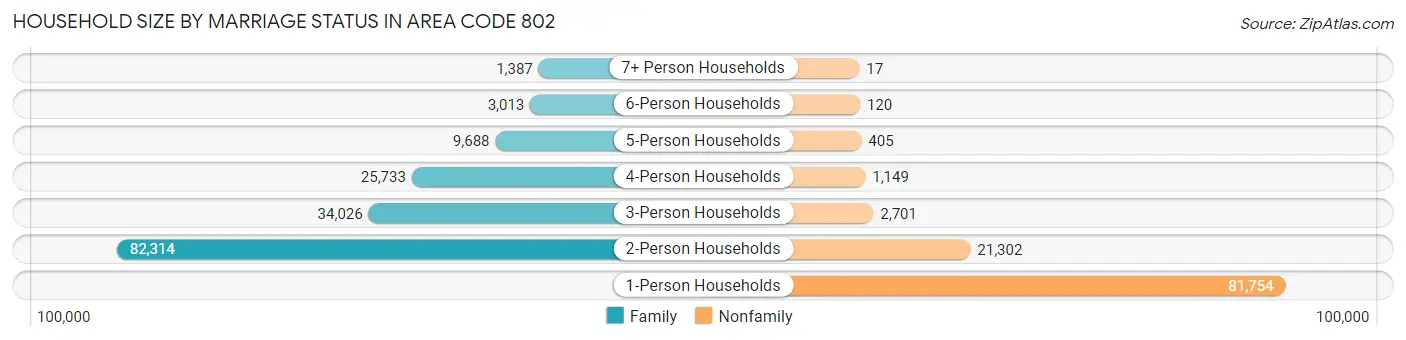
| Household Size | Family Households | Nonfamily Households |
| 1-Person Households | - | 81,754 (31.0%) |
| 2-Person Households | 82,314 (31.2%) | 21,302 (8.1%) |
| 3-Person Households | 34,026 (12.9%) | 2,701 (1.0%) |
| 4-Person Households | 25,733 (9.8%) | 1,149 (0.4%) |
| 5-Person Households | 9,688 (3.7%) | 405 (0.2%) |
| 6-Person Households | 3,013 (1.1%) | 120 (0.1%) |
| 7+ Person Households | 1,387 (0.5%) | 17 (0.0%) |
| Total | 156,161 (59.2%) | 107,448 (40.8%) |
Female Fertility in Area Code 802
Fertility by Age in Area Code 802
Average fertility rate in Area Code 802 is 59.7 births per 1,000 women. Women in the age bracket of 15 to 19 years have the highest fertility rate with 262.2 births per 1,000 women. Women in the age bracket of 20 to 34 years acount for 71.0% of all women with births.
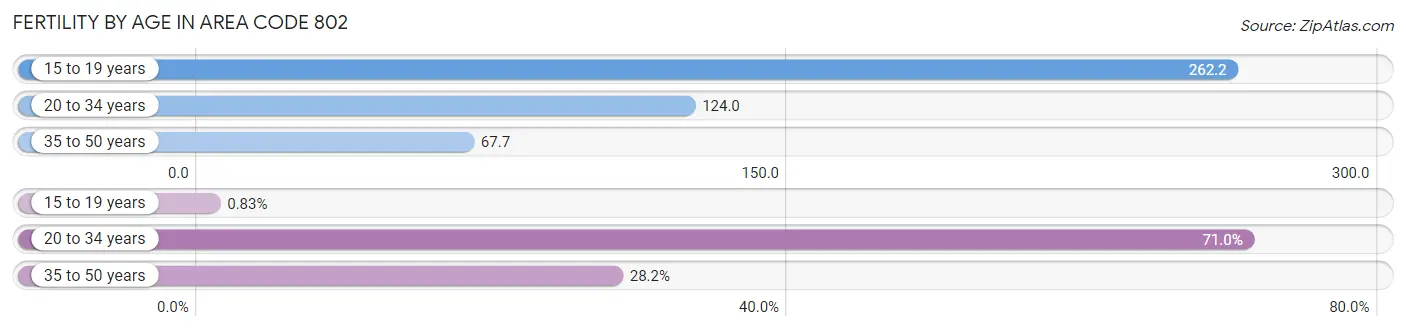
| Age Bracket | Women with Births | Births / 1,000 Women |
| 15 to 19 years | 49 (0.8%) | 262.2 |
| 20 to 34 years | 4,193 (71.0%) | 124.0 |
| 35 to 50 years | 1,662 (28.1%) | 67.7 |
| Total | 5,904 (100.0%) | 59.7 |
Fertility by Age by Marriage Status in Area Code 802
50.6% of women with births (5,904) in Area Code 802 are married. The highest percentage of unmarried women with births falls into 15 to 19 years age bracket with 100.0% of them unmarried at the time of birth, while the lowest percentage of unmarried women with births belong to 20 to 34 years age bracket with 58.8% of them unmarried.
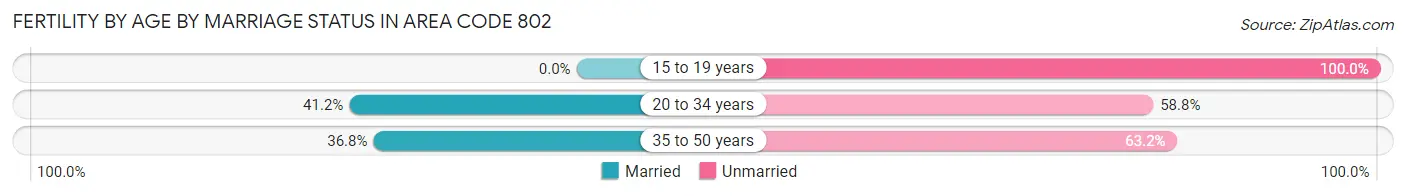
| Age Bracket | Married | Unmarried |
| 15 to 19 years | 0 (0.0%) | 49 (100.0%) |
| 20 to 34 years | 1,727 (41.2%) | 2,466 (58.8%) |
| 35 to 50 years | 612 (36.8%) | 1,050 (63.2%) |
| Total | 2,988 (50.6%) | 2,916 (49.4%) |
Fertility by Education in Area Code 802
Average fertility rate in Area Code 802 is 59.7 births per 1,000 women. Women with the education attainment of graduate degree have the highest fertility rate of 182.8 births per 1,000 women, while women with the education attainment of college or associate's degree have the lowest fertility at 102.7 births per 1,000 women. Women with the education attainment of bachelor's degree represent 27.7% of all women with births.
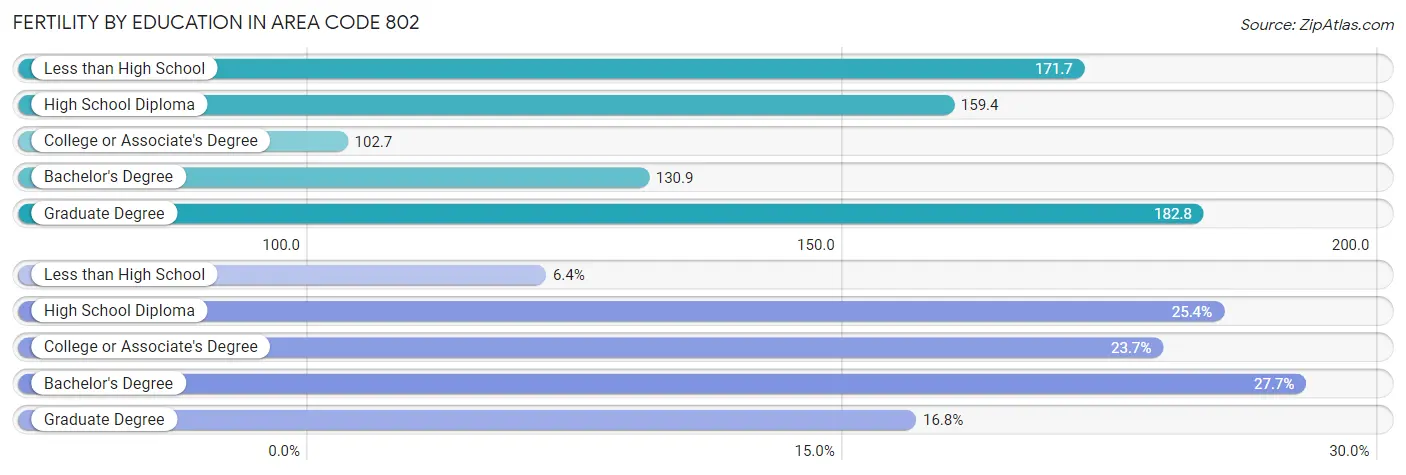
| Educational Attainment | Women with Births | Births / 1,000 Women |
| Less than High School | 376 (6.4%) | 171.7 |
| High School Diploma | 1,501 (25.4%) | 159.4 |
| College or Associate's Degree | 1,400 (23.7%) | 102.7 |
| Bachelor's Degree | 1,637 (27.7%) | 130.9 |
| Graduate Degree | 990 (16.8%) | 182.8 |
| Total | 5,904 (100.0%) | 59.7 |
Fertility by Education by Marriage Status in Area Code 802
49.4% of women with births in Area Code 802 are unmarried. Women with the educational attainment of bachelor's degree are most likely to be married with 46.4% of them married at childbirth, while women with the educational attainment of less than high school are least likely to be married with 95.2% of them unmarried at childbirth.
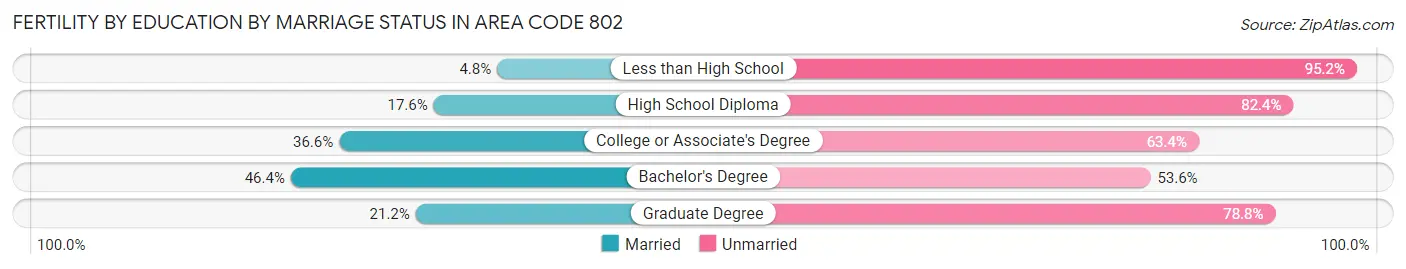
| Educational Attainment | Married | Unmarried |
| Less than High School | 18 (4.8%) | 358 (95.2%) |
| High School Diploma | 264 (17.6%) | 1,237 (82.4%) |
| College or Associate's Degree | 513 (36.6%) | 887 (63.4%) |
| Bachelor's Degree | 759 (46.4%) | 878 (53.6%) |
| Graduate Degree | 210 (21.2%) | 780 (78.8%) |
| Total | 2,988 (50.6%) | 2,916 (49.4%) |
Employment Characteristics in Area Code 802
Employment by Class of Employer in Area Code 802
Among the 327,996 employed individuals in Area Code 802, private company employees (181,835 | 55.4%), not-for-profit organizations (53,635 | 16.4%), and self-employed (not incorporated) (27,217 | 8.3%) make up the most common classes of employment.
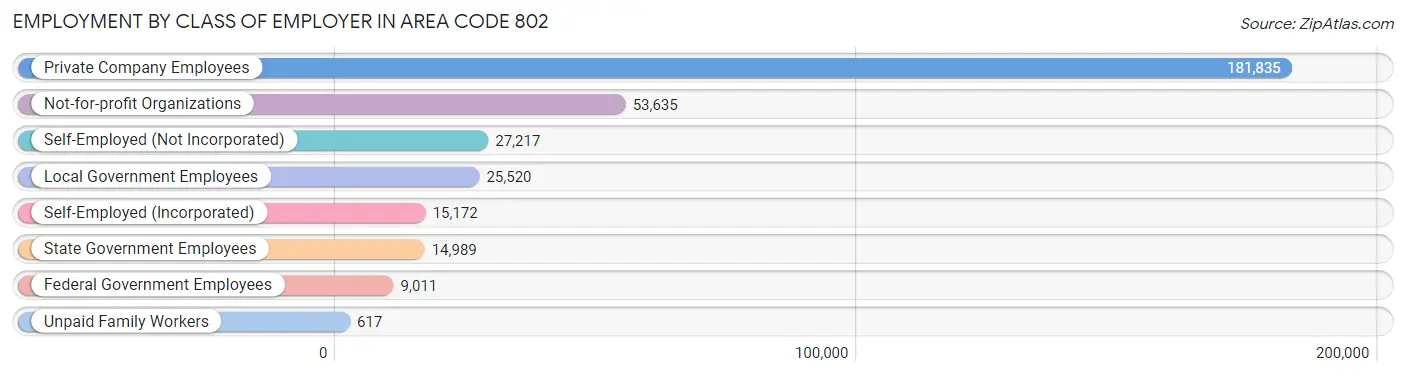
| Employer Class | # Employees | % Employees |
| Private Company Employees | 181,835 | 55.4% |
| Self-Employed (Incorporated) | 15,172 | 4.6% |
| Self-Employed (Not Incorporated) | 27,217 | 8.3% |
| Not-for-profit Organizations | 53,635 | 16.4% |
| Local Government Employees | 25,520 | 7.8% |
| State Government Employees | 14,989 | 4.6% |
| Federal Government Employees | 9,011 | 2.8% |
| Unpaid Family Workers | 617 | 0.2% |
| Total | 327,996 | 100.0% |
Employment Status by Age in Area Code 802
According to the labor force statistics for Area Code 802, out of the total population over 16 years of age (537,688), 63.3% or 340,249 individuals are in the labor force, with 4.4% or 14,835 of them unemployed. The age group with the highest labor force participation rate is 30 to 34 years, with 87.2% or 33,020 individuals in the labor force. Within the labor force, the 16 to 19 years age range has the highest percentage of unemployed individuals, with 1,880.6% or 354,136 of them being unemployed.
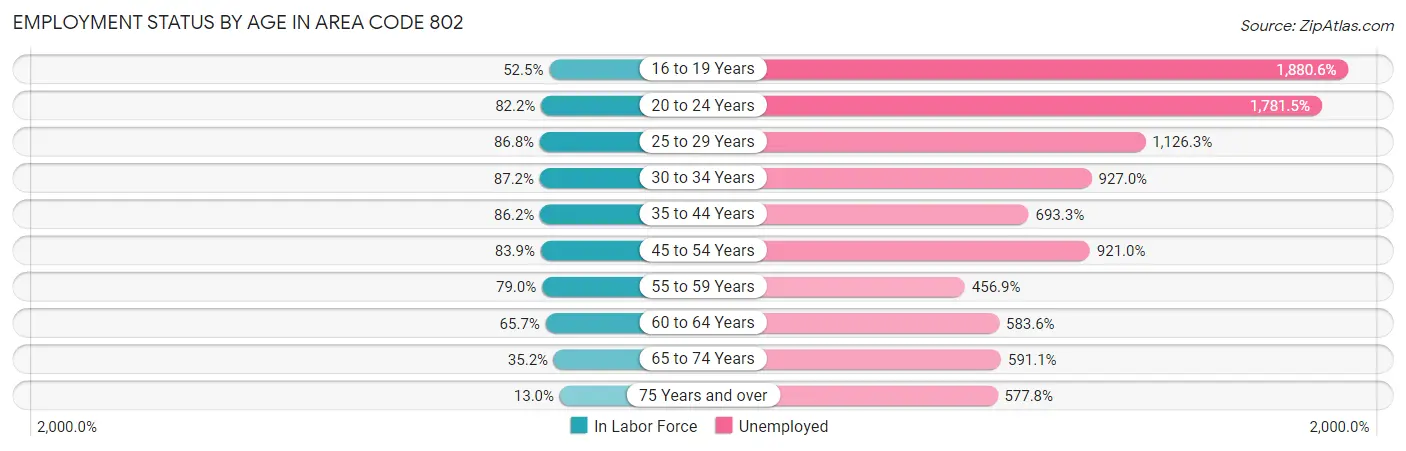
| Age Bracket | In Labor Force | Unemployed |
| 16 to 19 Years | 18,831 (52.4%) | 354,136 (1,880.6%) |
| 20 to 24 Years | 38,285 (82.2%) | 682,012 (1,781.5%) |
| 25 to 29 Years | 32,854 (86.8%) | 370,057 (1,126.3%) |
| 30 to 34 Years | 33,020 (87.2%) | 306,095 (927.0%) |
| 35 to 44 Years | 64,627 (86.2%) | 448,087 (693.3%) |
| 45 to 54 Years | 66,004 (83.9%) | 607,924 (921.0%) |
| 55 to 59 Years | 36,379 (79.0%) | 166,211 (456.9%) |
| 60 to 64 Years | 32,910 (65.7%) | 192,069 (583.6%) |
| 65 to 74 Years | 27,730 (35.1%) | 163,924 (591.1%) |
| 75 Years and over | 6,612 (13.0%) | 38,210 (577.8%) |
| Total | 340,243 (63.3%) | 14,826 (4.4%) |
Employment Status by Educational Attainment in Area Code 802
According to labor force statistics for Area Code 802, 79.9% of individuals (260,204) out of the total population between 25 and 64 years of age (325,540) are in the labor force, with 768.8% or 2,000,448 of them being unemployed. The group with the highest labor force participation rate are those with the educational attainment of bachelor's degree or higher, with 86.8% or 120,657 individuals in the labor force. Within the labor force, individuals with less than high school education have the highest percentage of unemployment, with 1,685.0% or 183,867 of them being unemployed.

| Educational Attainment | In Labor Force | Unemployed |
| Less than High School | 10,912 (62.7%) | 293,190 (1,685.0%) |
| High School Diploma | 67,008 (76.5%) | 971,894 (1,110.0%) |
| College / Associate Degree | 67,117 (82.3%) | 392,217 (480.8%) |
| Bachelor's Degree or higher | 120,654 (86.8%) | 661,252 (475.7%) |
| Total | 260,210 (79.9%) | 2,502,752 (768.8%) |
Employment Occupations by Sex in Area Code 802
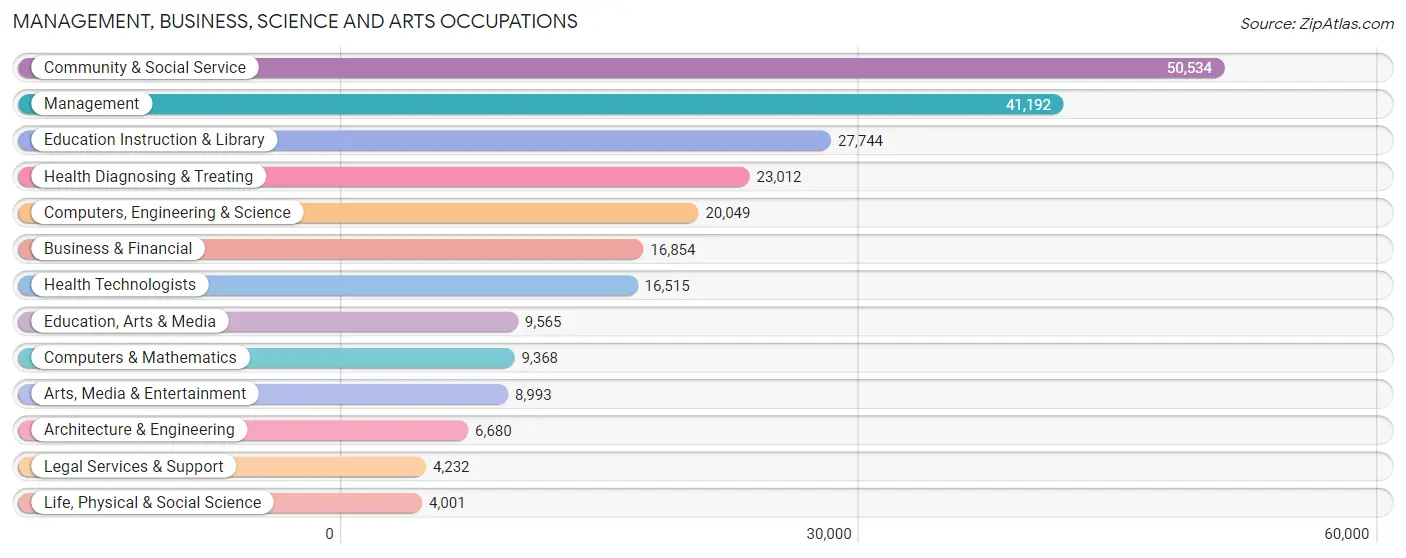
Management, Business, Science and Arts Occupations
The most common Management, Business, Science and Arts occupations in Area Code 802 are Community & Social Service (50,534 | 15.1%), Management (41,192 | 12.3%), Education Instruction & Library (27,744 | 8.3%), Health Diagnosing & Treating (23,012 | 6.9%), and Computers, Engineering & Science (20,049 | 6.0%).
Management, Business, Science and Arts Occupations by Sex
Within the Management, Business, Science and Arts occupations in Area Code 802, the most male-oriented occupations are Architecture & Engineering (81.2%), Computers & Mathematics (74.4%), and Computers, Engineering & Science (71.8%), while the most female-oriented occupations are Health Diagnosing & Treating (78.1%), Health Technologists (77.4%), and Education, Arts & Media (73.5%).
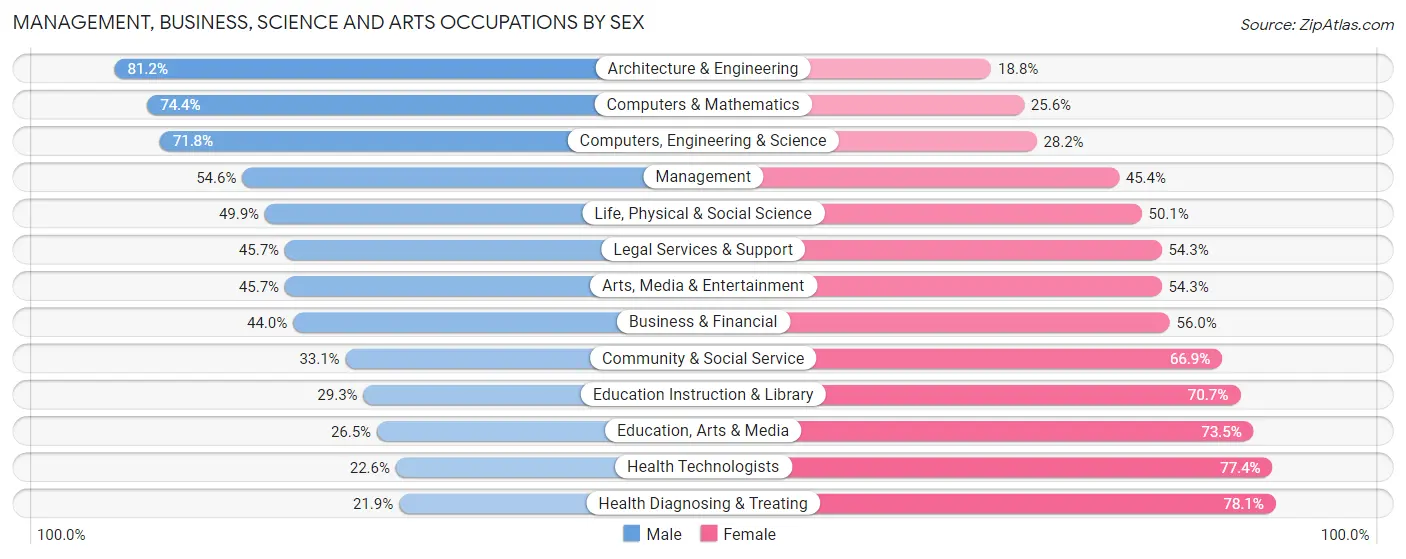
| Occupation | Male | Female |
| Management | 22,490 (54.6%) | 18,702 (45.4%) |
| Business & Financial | 7,416 (44.0%) | 9,438 (56.0%) |
| Computers, Engineering & Science | 14,391 (71.8%) | 5,658 (28.2%) |
| Computers & Mathematics | 6,970 (74.4%) | 2,398 (25.6%) |
| Architecture & Engineering | 5,426 (81.2%) | 1,254 (18.8%) |
| Life, Physical & Social Science | 1,995 (49.9%) | 2,006 (50.1%) |
| Community & Social Service | 16,713 (33.1%) | 33,821 (66.9%) |
| Education, Arts & Media | 2,535 (26.5%) | 7,030 (73.5%) |
| Legal Services & Support | 1,934 (45.7%) | 2,298 (54.3%) |
| Education Instruction & Library | 8,134 (29.3%) | 19,610 (70.7%) |
| Arts, Media & Entertainment | 4,110 (45.7%) | 4,883 (54.3%) |
| Health Diagnosing & Treating | 5,037 (21.9%) | 17,975 (78.1%) |
| Health Technologists | 3,725 (22.6%) | 12,790 (77.4%) |
| Total (Category) | 66,047 (43.5%) | 85,594 (56.5%) |
| Total (Overall) | 170,144 (50.9%) | 164,422 (49.1%) |
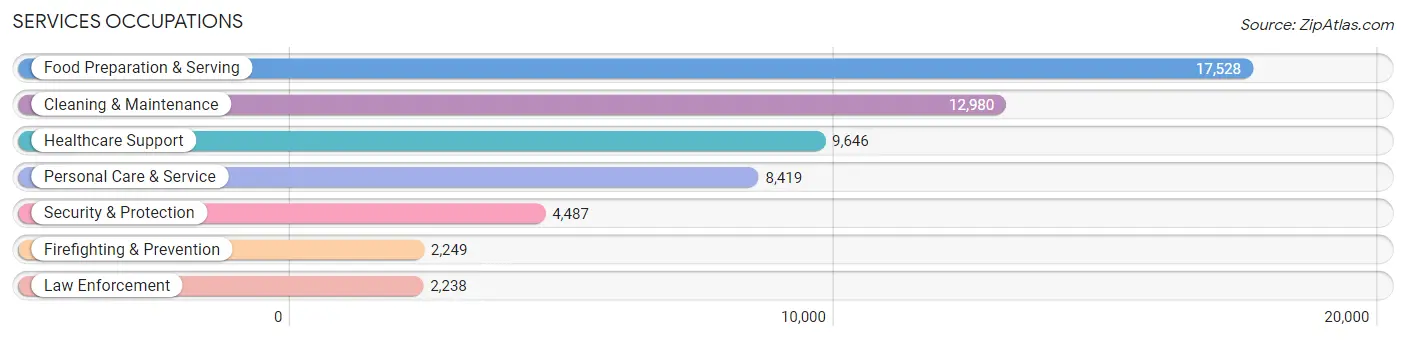
Services Occupations
The most common Services occupations in Area Code 802 are Food Preparation & Serving (17,528 | 5.2%), Cleaning & Maintenance (12,980 | 3.9%), Healthcare Support (9,646 | 2.9%), Personal Care & Service (8,419 | 2.5%), and Security & Protection (4,487 | 1.3%).
Services Occupations by Sex
Within the Services occupations in Area Code 802, the most male-oriented occupations are Law Enforcement (79.4%), Security & Protection (74.0%), and Firefighting & Prevention (68.7%), while the most female-oriented occupations are Healthcare Support (77.7%), Personal Care & Service (69.6%), and Food Preparation & Serving (54.4%).
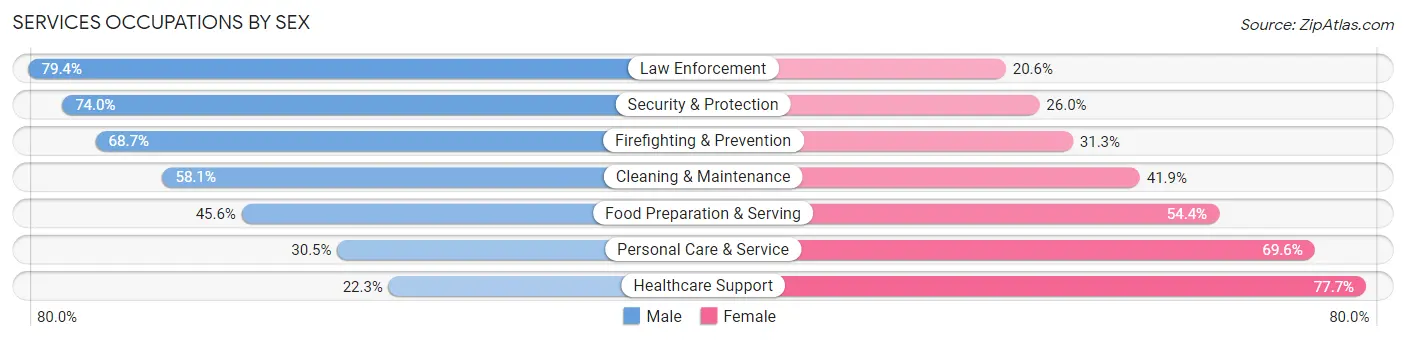
| Occupation | Male | Female |
| Healthcare Support | 2,153 (22.3%) | 7,493 (77.7%) |
| Security & Protection | 3,322 (74.0%) | 1,165 (26.0%) |
| Firefighting & Prevention | 1,546 (68.7%) | 703 (31.3%) |
| Law Enforcement | 1,776 (79.4%) | 462 (20.6%) |
| Food Preparation & Serving | 7,994 (45.6%) | 9,534 (54.4%) |
| Cleaning & Maintenance | 7,546 (58.1%) | 5,434 (41.9%) |
| Personal Care & Service | 2,564 (30.4%) | 5,855 (69.6%) |
| Total (Category) | 23,579 (44.4%) | 29,481 (55.6%) |
| Total (Overall) | 170,144 (50.9%) | 164,422 (49.1%) |
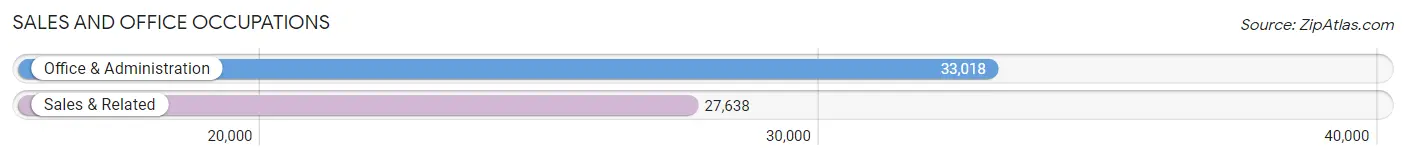
Sales and Office Occupations
The most common Sales and Office occupations in Area Code 802 are Office & Administration (33,018 | 9.9%), and Sales & Related (27,638 | 8.3%).
Sales and Office Occupations by Sex
| Occupation | Male | Female |
| Sales & Related | 13,665 (49.4%) | 13,973 (50.6%) |
| Office & Administration | 8,467 (25.6%) | 24,551 (74.4%) |
| Total (Category) | 22,132 (36.5%) | 38,524 (63.5%) |
| Total (Overall) | 170,144 (50.9%) | 164,422 (49.1%) |
Natural Resources, Construction and Maintenance Occupations
The most common Natural Resources, Construction and Maintenance occupations in Area Code 802 are Construction & Extraction (18,612 | 5.6%), Installation, Maintenance & Repair (10,563 | 3.2%), and Farming, Fishing & Forestry (4,115 | 1.2%).
Natural Resources, Construction and Maintenance Occupations by Sex
| Occupation | Male | Female |
| Farming, Fishing & Forestry | 3,093 (75.2%) | 1,022 (24.8%) |
| Construction & Extraction | 17,900 (96.2%) | 712 (3.8%) |
| Installation, Maintenance & Repair | 9,943 (94.1%) | 620 (5.9%) |
| Total (Category) | 30,936 (92.9%) | 2,354 (7.1%) |
| Total (Overall) | 170,144 (50.9%) | 164,422 (49.1%) |
Production, Transportation and Moving Occupations
The most common Production, Transportation and Moving occupations in Area Code 802 are Production (19,349 | 5.8%), Transportation (8,897 | 2.7%), and Material Moving (7,673 | 2.3%).
Production, Transportation and Moving Occupations by Sex
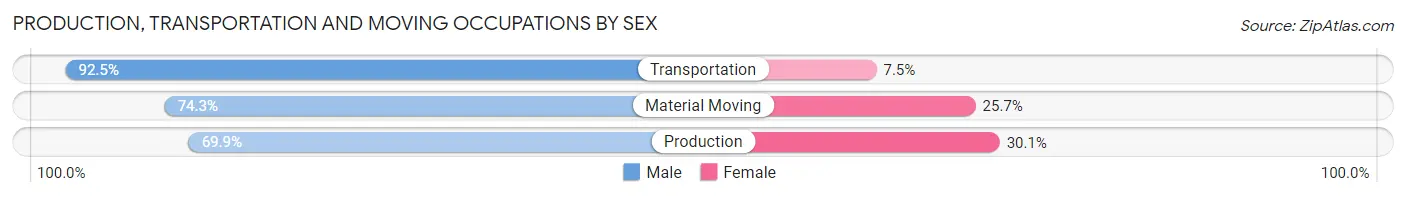
| Occupation | Male | Female |
| Production | 13,522 (69.9%) | 5,827 (30.1%) |
| Transportation | 8,228 (92.5%) | 669 (7.5%) |
| Material Moving | 5,700 (74.3%) | 1,973 (25.7%) |
| Total (Category) | 27,450 (76.4%) | 8,469 (23.6%) |
| Total (Overall) | 170,144 (50.9%) | 164,422 (49.1%) |
Employment Industries by Sex in Area Code 802
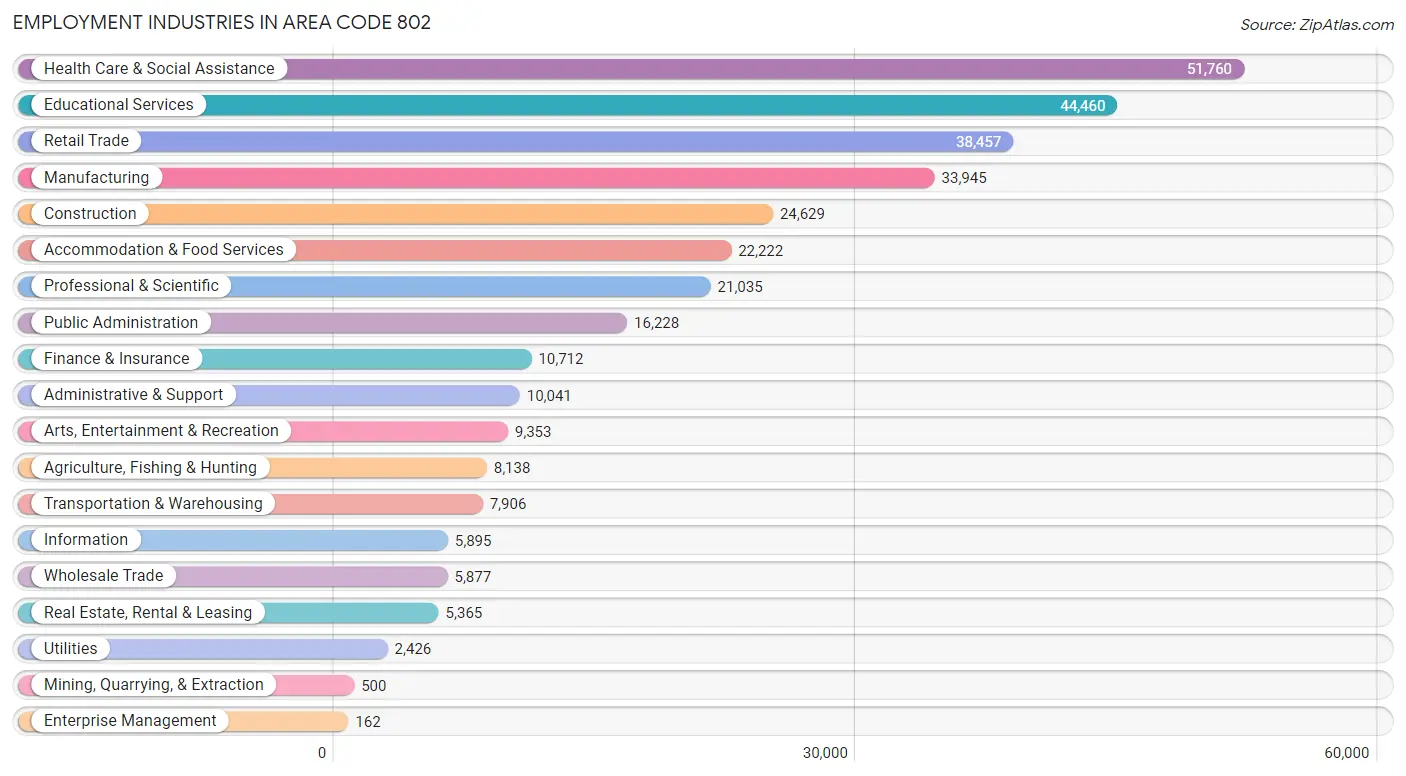
Employment Industries in Area Code 802
The major employment industries in Area Code 802 include Health Care & Social Assistance (51,760 | 15.5%), Educational Services (44,460 | 13.3%), Retail Trade (38,457 | 11.5%), Manufacturing (33,945 | 10.2%), and Construction (24,629 | 7.4%).
Employment Industries by Sex in Area Code 802
The Area Code 802 industries that see more men than women are Construction (91.5%), Mining, Quarrying, & Extraction (82.6%), and Utilities (81.3%), whereas the industries that tend to have a higher number of women are Health Care & Social Assistance (76.8%), Enterprise Management (67.9%), and Educational Services (65.8%).
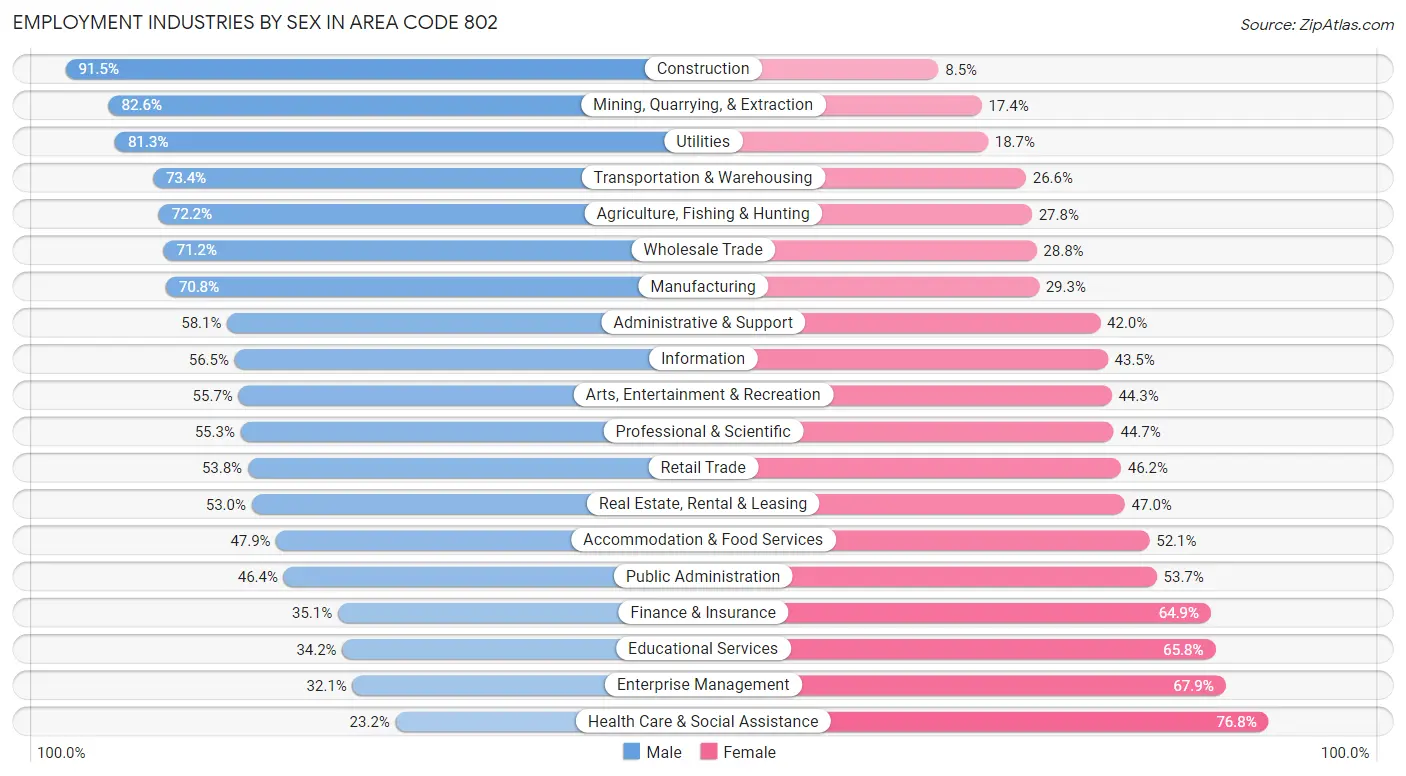
| Industry | Male | Female |
| Agriculture, Fishing & Hunting | 5,876 (72.2%) | 2,262 (27.8%) |
| Mining, Quarrying, & Extraction | 413 (82.6%) | 87 (17.4%) |
| Construction | 22,542 (91.5%) | 2,087 (8.5%) |
| Manufacturing | 24,016 (70.8%) | 9,929 (29.2%) |
| Wholesale Trade | 4,186 (71.2%) | 1,691 (28.8%) |
| Retail Trade | 20,679 (53.8%) | 17,778 (46.2%) |
| Transportation & Warehousing | 5,805 (73.4%) | 2,101 (26.6%) |
| Utilities | 1,972 (81.3%) | 454 (18.7%) |
| Information | 3,330 (56.5%) | 2,565 (43.5%) |
| Finance & Insurance | 3,763 (35.1%) | 6,949 (64.9%) |
| Real Estate, Rental & Leasing | 2,842 (53.0%) | 2,523 (47.0%) |
| Professional & Scientific | 11,624 (55.3%) | 9,411 (44.7%) |
| Enterprise Management | 52 (32.1%) | 110 (67.9%) |
| Administrative & Support | 5,829 (58.1%) | 4,212 (41.9%) |
| Educational Services | 15,210 (34.2%) | 29,250 (65.8%) |
| Health Care & Social Assistance | 12,008 (23.2%) | 39,752 (76.8%) |
| Arts, Entertainment & Recreation | 5,209 (55.7%) | 4,144 (44.3%) |
| Accommodation & Food Services | 10,637 (47.9%) | 11,585 (52.1%) |
| Public Administration | 7,521 (46.4%) | 8,707 (53.6%) |
| Total | 170,144 (50.9%) | 164,422 (49.1%) |
Education in Area Code 802
School Enrollment in Area Code 802
The most common levels of schooling among the 143,291 students in Area Code 802 are college / undergraduate (38,994 | 27.2%), high school (28,698 | 20.0%), and middle school (26,892 | 18.8%).
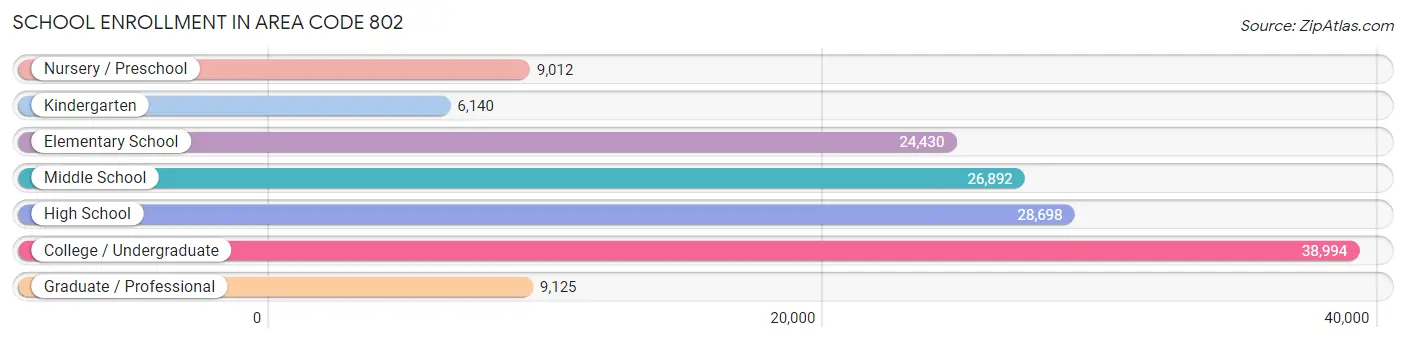
| School Level | # Students | % Students |
| Nursery / Preschool | 9,012 | 6.3% |
| Kindergarten | 6,140 | 4.3% |
| Elementary School | 24,430 | 17.1% |
| Middle School | 26,892 | 18.8% |
| High School | 28,698 | 20.0% |
| College / Undergraduate | 38,994 | 27.2% |
| Graduate / Professional | 9,125 | 6.4% |
| Total | 143,291 | 100.0% |
School Enrollment by Age by Funding Source in Area Code 802
Out of a total of 143,291 students who are enrolled in schools in Area Code 802, 29,874 (20.8%) attend a private institution, while the remaining 113,417 (79.1%) are enrolled in public schools. The age group of 35 years and over has the highest likelihood of being enrolled in private schools, with 2,601 (36.9% in the age bracket) enrolled. Conversely, the age group of 10 to 14 year olds has the lowest likelihood of being enrolled in a private school, with 29,321 (88.6% in the age bracket) attending a public institution.
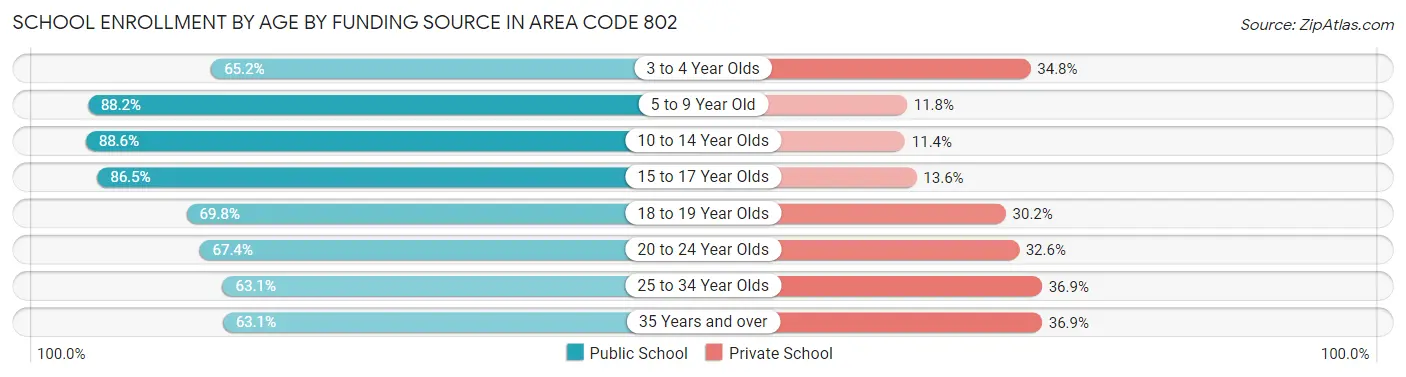
| Age Bracket | Public School | Private School |
| 3 to 4 Year Olds | 4,454 (65.2%) | 2,374 (34.8%) |
| 5 to 9 Year Old | 26,296 (88.2%) | 3,505 (11.8%) |
| 10 to 14 Year Olds | 29,321 (88.6%) | 3,774 (11.4%) |
| 15 to 17 Year Olds | 18,054 (86.5%) | 2,830 (13.6%) |
| 18 to 19 Year Olds | 11,936 (69.8%) | 5,154 (30.2%) |
| 20 to 24 Year Olds | 14,013 (67.4%) | 6,782 (32.6%) |
| 25 to 34 Year Olds | 4,892 (63.1%) | 2,860 (36.9%) |
| 35 Years and over | 4,445 (63.1%) | 2,601 (36.9%) |
| Total | 113,417 (79.1%) | 29,874 (20.8%) |
Educational Attainment by Field of Study in Area Code 802
Education (25,003 | 11.9%), business (22,683 | 10.8%), social sciences (21,312 | 10.2%), bio, nature & agricultural (18,538 | 8.8%), and science & technology (18,176 | 8.7%) are the most common fields of study among 209,778 individuals in Area Code 802 who have obtained a bachelor's degree or higher.
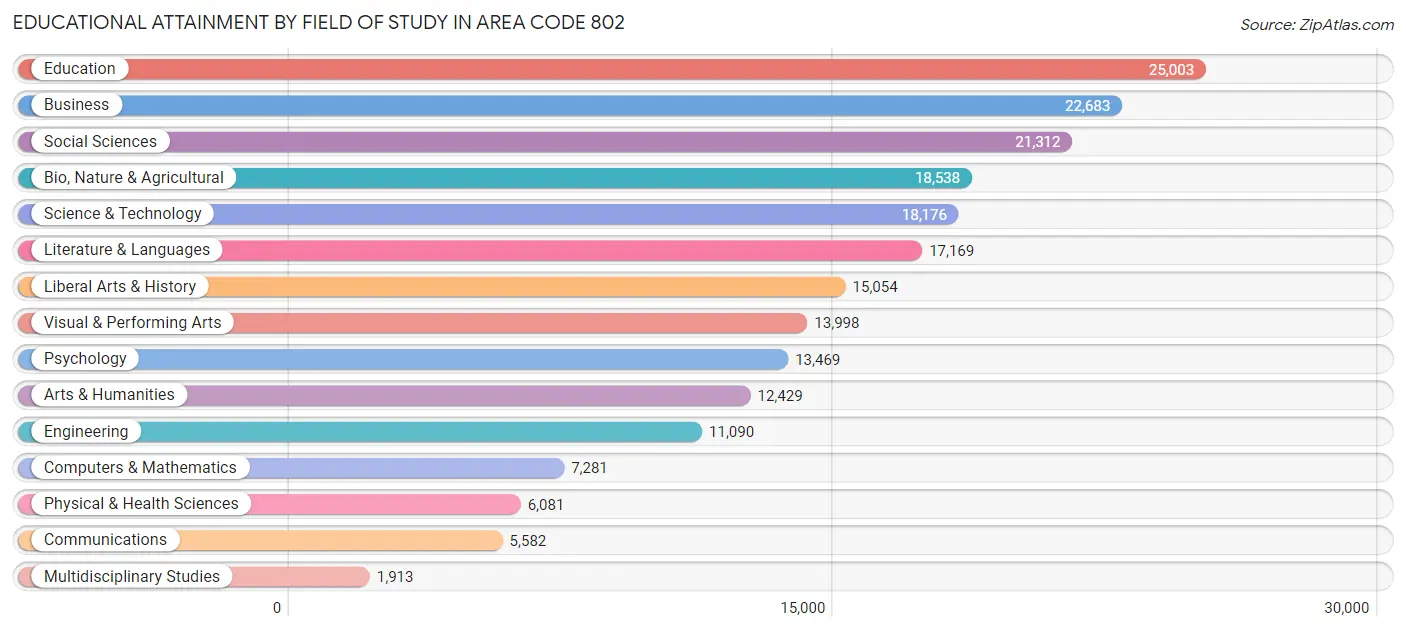
| Field of Study | # Graduates | % Graduates |
| Computers & Mathematics | 7,281 | 3.5% |
| Bio, Nature & Agricultural | 18,538 | 8.8% |
| Physical & Health Sciences | 6,081 | 2.9% |
| Psychology | 13,469 | 6.4% |
| Social Sciences | 21,312 | 10.2% |
| Engineering | 11,090 | 5.3% |
| Multidisciplinary Studies | 1,913 | 0.9% |
| Science & Technology | 18,176 | 8.7% |
| Business | 22,683 | 10.8% |
| Education | 25,003 | 11.9% |
| Literature & Languages | 17,169 | 8.2% |
| Liberal Arts & History | 15,054 | 7.2% |
| Visual & Performing Arts | 13,998 | 6.7% |
| Communications | 5,582 | 2.7% |
| Arts & Humanities | 12,429 | 5.9% |
| Total | 209,778 | 100.0% |
Transportation & Commute in Area Code 802
Vehicle Availability by Sex in Area Code 802
The most prevalent vehicle ownership categories in Area Code 802 are males with 2 vehicles (78,952, accounting for 47.8%) and females with 2 vehicles (73,430, making up 50.3%).
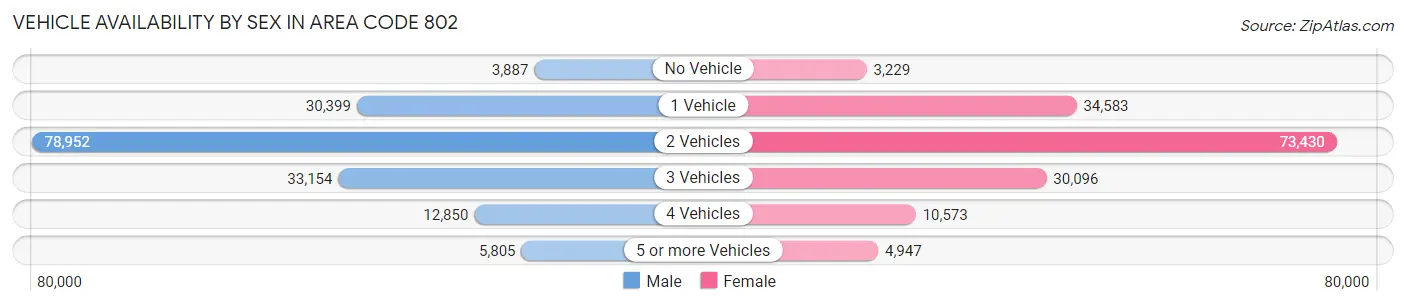
| Vehicles Available | Male | Female |
| No Vehicle | 3,887 (2.4%) | 3,229 (2.1%) |
| 1 Vehicle | 30,399 (18.4%) | 34,583 (22.1%) |
| 2 Vehicles | 78,952 (47.8%) | 73,430 (46.8%) |
| 3 Vehicles | 33,154 (20.1%) | 30,096 (19.2%) |
| 4 Vehicles | 12,850 (7.8%) | 10,573 (6.7%) |
| 5 or more Vehicles | 5,805 (3.5%) | 4,947 (3.2%) |
| Total | 165,047 (100.0%) | 156,858 (100.0%) |
Commute Time in Area Code 802
The most frequently occuring commute durations in Area Code 802 are 15 to 19 minutes (44,869 commuters, 15.8%), 10 to 14 minutes (41,991 commuters, 14.7%), and 20 to 24 minutes (40,524 commuters, 14.2%).
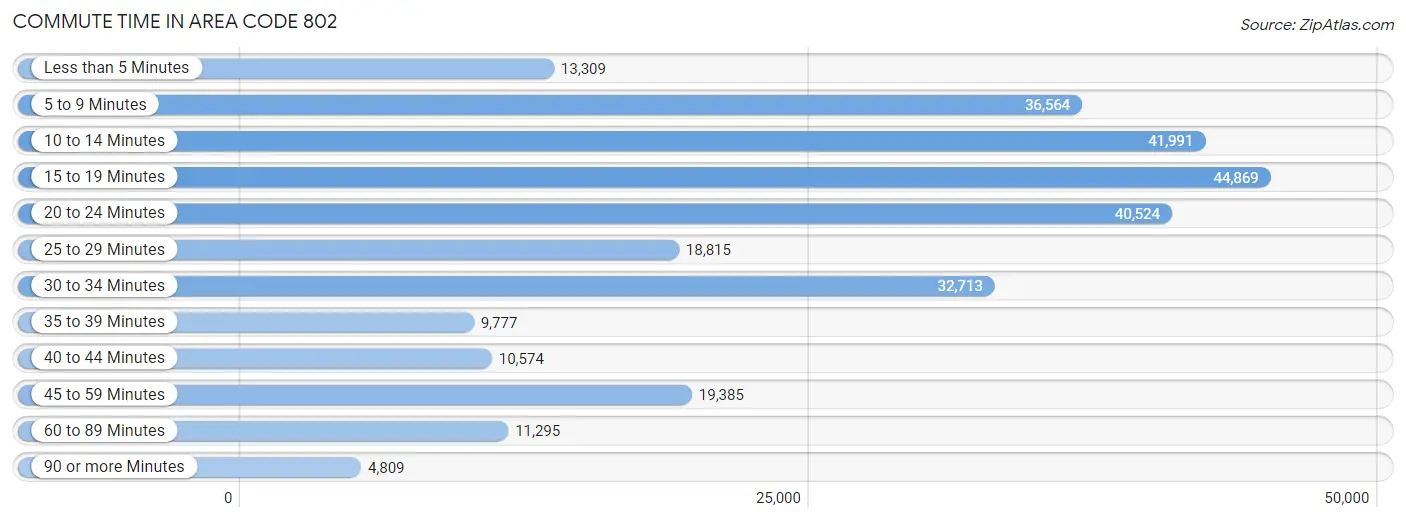
| Commute Time | # Commuters | % Commuters |
| Less than 5 Minutes | 13,309 | 4.7% |
| 5 to 9 Minutes | 36,564 | 12.9% |
| 10 to 14 Minutes | 41,991 | 14.7% |
| 15 to 19 Minutes | 44,869 | 15.8% |
| 20 to 24 Minutes | 40,524 | 14.2% |
| 25 to 29 Minutes | 18,815 | 6.6% |
| 30 to 34 Minutes | 32,713 | 11.5% |
| 35 to 39 Minutes | 9,777 | 3.4% |
| 40 to 44 Minutes | 10,574 | 3.7% |
| 45 to 59 Minutes | 19,385 | 6.8% |
| 60 to 89 Minutes | 11,295 | 4.0% |
| 90 or more Minutes | 4,809 | 1.7% |
Commute Time by Sex in Area Code 802
The most common commute times in Area Code 802 are 15 to 19 minutes (22,884 commuters, 15.5%) for males and 15 to 19 minutes (21,985 commuters, 16.0%) for females.
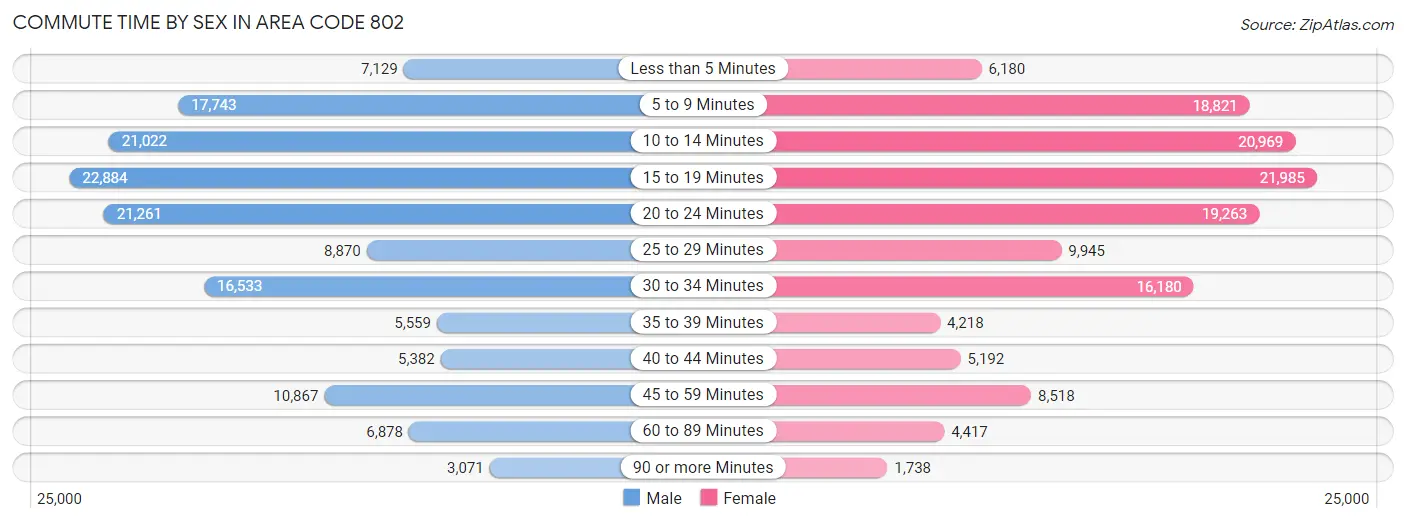
| Commute Time | Male | Female |
| Less than 5 Minutes | 7,129 (4.8%) | 6,180 (4.5%) |
| 5 to 9 Minutes | 17,743 (12.0%) | 18,821 (13.7%) |
| 10 to 14 Minutes | 21,022 (14.3%) | 20,969 (15.3%) |
| 15 to 19 Minutes | 22,884 (15.5%) | 21,985 (16.0%) |
| 20 to 24 Minutes | 21,261 (14.4%) | 19,263 (14.0%) |
| 25 to 29 Minutes | 8,870 (6.0%) | 9,945 (7.2%) |
| 30 to 34 Minutes | 16,533 (11.2%) | 16,180 (11.8%) |
| 35 to 39 Minutes | 5,559 (3.8%) | 4,218 (3.1%) |
| 40 to 44 Minutes | 5,382 (3.7%) | 5,192 (3.8%) |
| 45 to 59 Minutes | 10,867 (7.4%) | 8,518 (6.2%) |
| 60 to 89 Minutes | 6,878 (4.7%) | 4,417 (3.2%) |
| 90 or more Minutes | 3,071 (2.1%) | 1,738 (1.3%) |
Time of Departure to Work by Sex in Area Code 802
The most frequent times of departure to work in Area Code 802 are 7:00 AM to 7:29 AM (22,257, 15.1%) for males and 7:00 AM to 7:29 AM (24,686, 18.0%) for females.
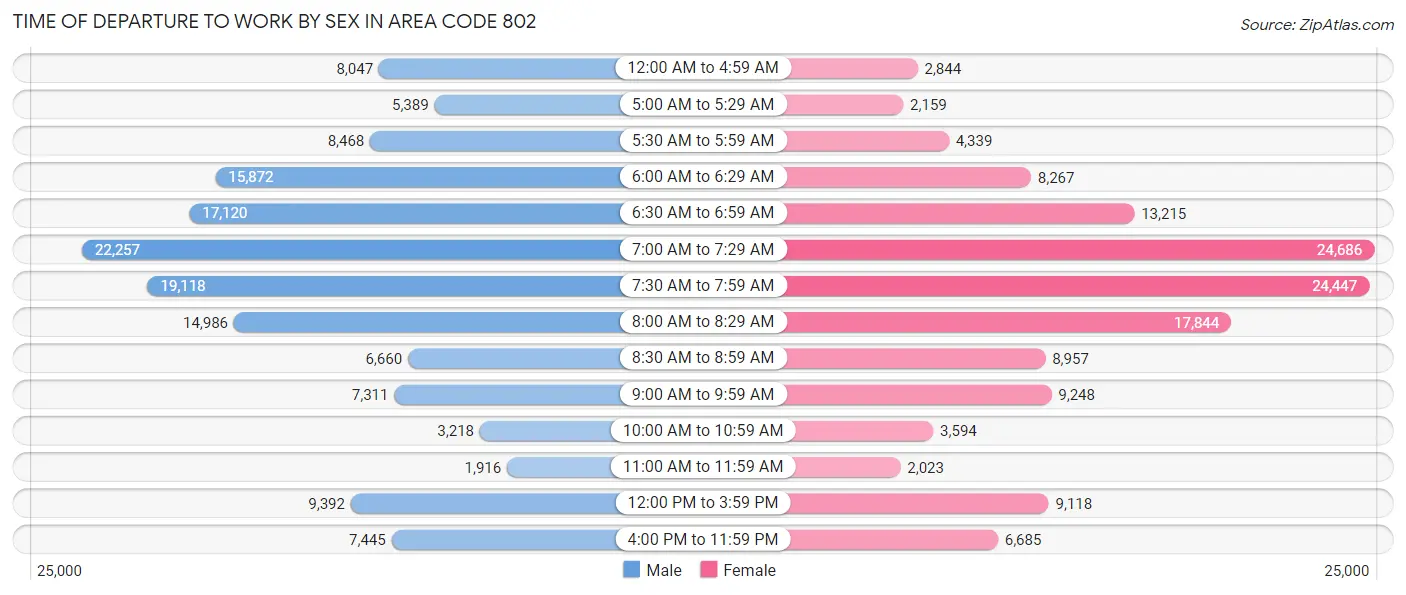
| Time of Departure | Male | Female |
| 12:00 AM to 4:59 AM | 8,047 (5.5%) | 2,844 (2.1%) |
| 5:00 AM to 5:29 AM | 5,389 (3.7%) | 2,159 (1.6%) |
| 5:30 AM to 5:59 AM | 8,468 (5.8%) | 4,339 (3.2%) |
| 6:00 AM to 6:29 AM | 15,872 (10.8%) | 8,267 (6.0%) |
| 6:30 AM to 6:59 AM | 17,120 (11.6%) | 13,215 (9.6%) |
| 7:00 AM to 7:29 AM | 22,257 (15.1%) | 24,686 (18.0%) |
| 7:30 AM to 7:59 AM | 19,118 (13.0%) | 24,447 (17.8%) |
| 8:00 AM to 8:29 AM | 14,986 (10.2%) | 17,844 (13.0%) |
| 8:30 AM to 8:59 AM | 6,660 (4.5%) | 8,957 (6.5%) |
| 9:00 AM to 9:59 AM | 7,311 (5.0%) | 9,248 (6.7%) |
| 10:00 AM to 10:59 AM | 3,218 (2.2%) | 3,594 (2.6%) |
| 11:00 AM to 11:59 AM | 1,916 (1.3%) | 2,023 (1.5%) |
| 12:00 PM to 3:59 PM | 9,392 (6.4%) | 9,118 (6.6%) |
| 4:00 PM to 11:59 PM | 7,445 (5.1%) | 6,685 (4.9%) |
| Total | 147,199 (100.0%) | 137,426 (100.0%) |
Housing Occupancy in Area Code 802
Occupancy by Ownership in Area Code 802
Of the total 263,609 dwellings in Area Code 802, owner-occupied units account for 191,457 (72.6%), while renter-occupied units make up 72,152 (27.4%).
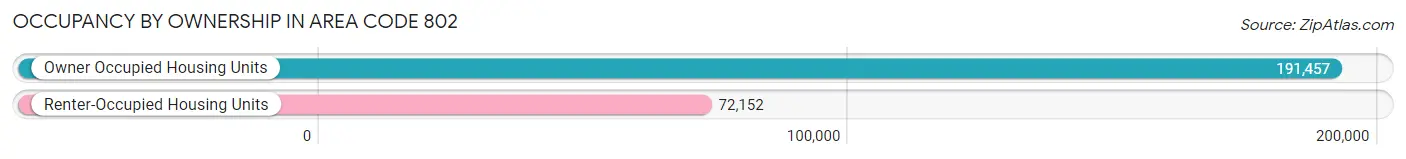
| Occupancy | # Housing Units | % Housing Units |
| Owner Occupied Housing Units | 191,457 | 72.6% |
| Renter-Occupied Housing Units | 72,152 | 27.4% |
| Total Occupied Housing Units | 263,609 | 100.0% |
Occupancy by Household Size in Area Code 802
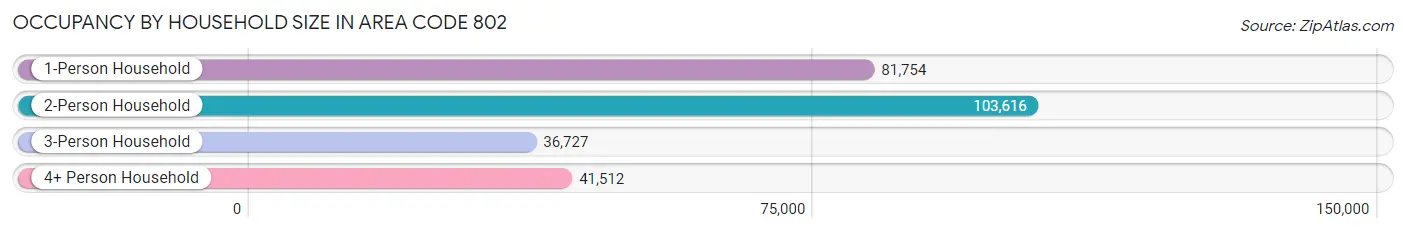
| Household Size | # Housing Units | % Housing Units |
| 1-Person Household | 81,754 | 31.0% |
| 2-Person Household | 103,616 | 39.3% |
| 3-Person Household | 36,727 | 13.9% |
| 4+ Person Household | 41,512 | 15.8% |
| Total Housing Units | 263,609 | 100.0% |
Occupancy by Ownership by Household Size in Area Code 802
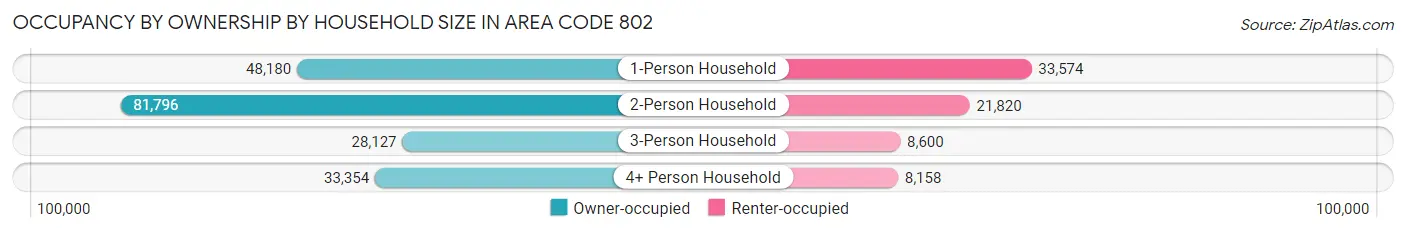
| Household Size | Owner-occupied | Renter-occupied |
| 1-Person Household | 48,180 (58.9%) | 33,574 (41.1%) |
| 2-Person Household | 81,796 (78.9%) | 21,820 (21.1%) |
| 3-Person Household | 28,127 (76.6%) | 8,600 (23.4%) |
| 4+ Person Household | 33,354 (80.3%) | 8,158 (19.7%) |
| Total Housing Units | 191,457 (72.6%) | 72,152 (27.4%) |
Occupancy by Educational Attainment in Area Code 802
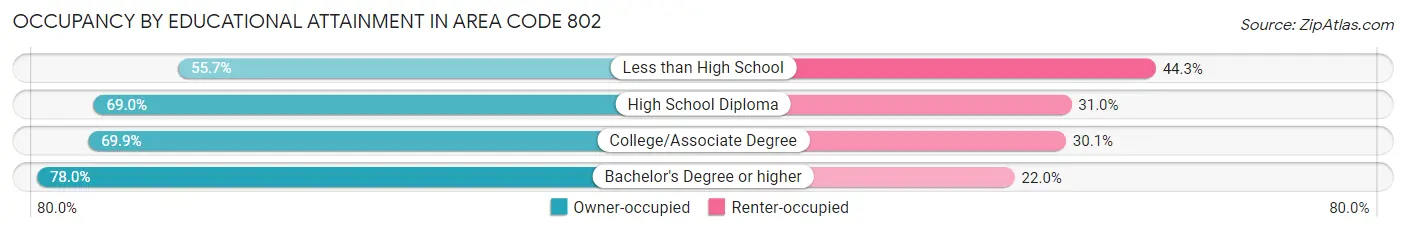
| Household Size | Owner-occupied | Renter-occupied |
| Less than High School | 6,978 (55.7%) | 5,559 (44.3%) |
| High School Diploma | 44,141 (69.0%) | 19,795 (31.0%) |
| College/Associate Degree | 48,904 (69.9%) | 21,049 (30.1%) |
| Bachelor's Degree or higher | 91,434 (78.0%) | 25,749 (22.0%) |
Occupancy by Age of Householder in Area Code 802
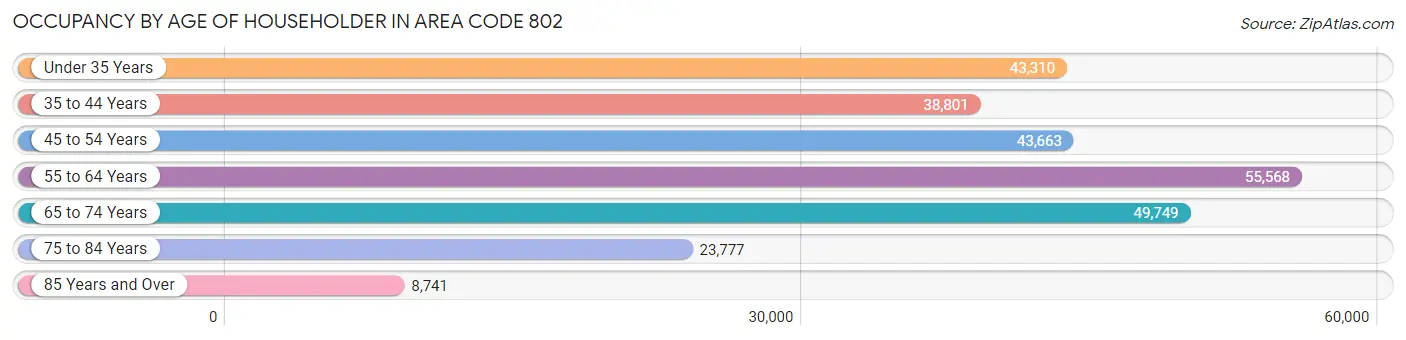
| Age Bracket | # Households | % Households |
| Under 35 Years | 43,310 | 16.4% |
| 35 to 44 Years | 38,801 | 14.7% |
| 45 to 54 Years | 43,663 | 16.6% |
| 55 to 64 Years | 55,568 | 21.1% |
| 65 to 74 Years | 49,749 | 18.9% |
| 75 to 84 Years | 23,777 | 9.0% |
| 85 Years and Over | 8,741 | 3.3% |
| Total | 263,609 | 100.0% |
Housing Finances in Area Code 802
Median Income by Occupancy in Area Code 802
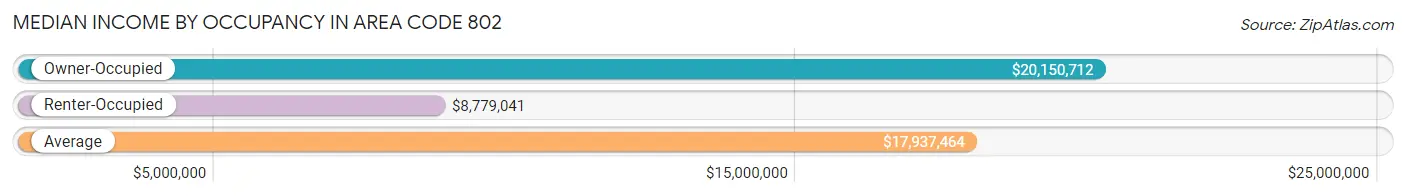
| Occupancy Type | # Households | Median Income |
| Owner-Occupied | 191,457 (72.6%) | $20,150,712 |
| Renter-Occupied | 72,152 (27.4%) | $8,779,041 |
| Average | 263,609 (100.0%) | $17,937,464 |
Occupancy by Householder Income Bracket in Area Code 802
| Income Bracket | Owner-occupied | Renter-occupied |
| Less than $5,000 | 2,555 (1.3%) | 3,728 (5.2%) |
| $5,000 to $9,999 | 1,694 (0.9%) | 2,215 (3.1%) |
| $10,000 to $14,999 | 3,812 (2.0%) | 6,783 (9.4%) |
| $15,000 to $19,999 | 4,202 (2.2%) | 4,734 (6.6%) |
| $20,000 to $24,999 | 5,396 (2.8%) | 4,073 (5.7%) |
| $25,000 to $34,999 | 11,810 (6.2%) | 8,568 (11.9%) |
| $35,000 to $49,999 | 18,548 (9.7%) | 10,517 (14.6%) |
| $50,000 to $74,999 | 31,374 (16.4%) | 13,082 (18.1%) |
| $75,000 to $99,999 | 26,928 (14.1%) | 8,442 (11.7%) |
| $100,000 to $149,999 | 42,031 (22.0%) | 6,655 (9.2%) |
| $150,000 or more | 43,107 (22.5%) | 3,355 (4.6%) |
| Total | 191,457 (100.0%) | 72,152 (100.0%) |
Monthly Housing Cost Tiers in Area Code 802
| Monthly Cost | Owner-occupied | Renter-occupied |
| Less than $300 | 3,433 (1.8%) | 2,802 (3.9%) |
| $300 to $499 | 9,271 (4.8%) | 4,076 (5.7%) |
| $500 to $799 | 29,839 (15.6%) | 7,362 (10.2%) |
| $800 to $999 | 21,210 (11.1%) | 11,916 (16.5%) |
| $1,000 to $1,499 | 42,570 (22.2%) | 22,410 (31.1%) |
| $1,500 to $1,999 | 35,640 (18.6%) | 13,415 (18.6%) |
| $2,000 to $2,499 | 23,962 (12.5%) | 3,997 (5.5%) |
| $2,500 to $2,999 | 12,244 (6.4%) | 1,036 (1.4%) |
| $3,000 or more | 13,288 (6.9%) | 1,311 (1.8%) |
| Total | 191,457 (100.0%) | 72,152 (100.0%) |
Physical Housing Characteristics in Area Code 802
Housing Structures in Area Code 802
| Structure Type | # Housing Units | % Housing Units |
| Single Unit, Detached | 175,831 | 66.7% |
| Single Unit, Attached | 10,723 | 4.1% |
| 2 Unit Apartments | 14,461 | 5.5% |
| 3 or 4 Unit Apartments | 16,645 | 6.3% |
| 5 to 9 Unit Apartments | 11,724 | 4.4% |
| 10 or more Apartments | 17,771 | 6.7% |
| Mobile Home / Other | 16,454 | 6.2% |
| Total | 263,609 | 100.0% |
Housing Structures by Occupancy in Area Code 802
| Structure Type | Owner-occupied | Renter-occupied |
| Single Unit, Detached | 161,730 (92.0%) | 14,101 (8.0%) |
| Single Unit, Attached | 7,999 (74.6%) | 2,724 (25.4%) |
| 2 Unit Apartments | 3,399 (23.5%) | 11,062 (76.5%) |
| 3 or 4 Unit Apartments | 2,230 (13.4%) | 14,415 (86.6%) |
| 5 to 9 Unit Apartments | 1,326 (11.3%) | 10,398 (88.7%) |
| 10 or more Apartments | 1,498 (8.4%) | 16,273 (91.6%) |
| Mobile Home / Other | 13,275 (80.7%) | 3,179 (19.3%) |
| Total | 191,457 (72.6%) | 72,152 (27.4%) |
Housing Structures by Number of Rooms in Area Code 802
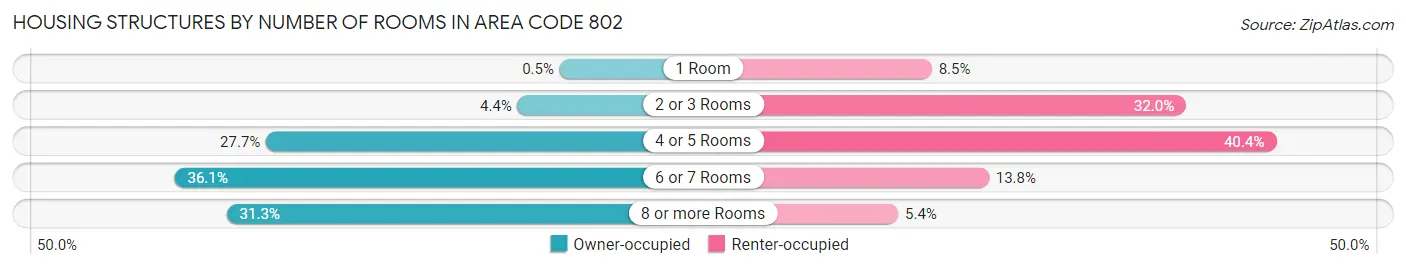
| Number of Rooms | Owner-occupied | Renter-occupied |
| 1 Room | 955 (0.5%) | 6,129 (8.5%) |
| 2 or 3 Rooms | 8,427 (4.4%) | 23,094 (32.0%) |
| 4 or 5 Rooms | 52,961 (27.7%) | 29,114 (40.4%) |
| 6 or 7 Rooms | 69,169 (36.1%) | 9,935 (13.8%) |
| 8 or more Rooms | 59,945 (31.3%) | 3,880 (5.4%) |
| Total | 191,457 (100.0%) | 72,152 (100.0%) |
Housing Structure by Heating Type in Area Code 802
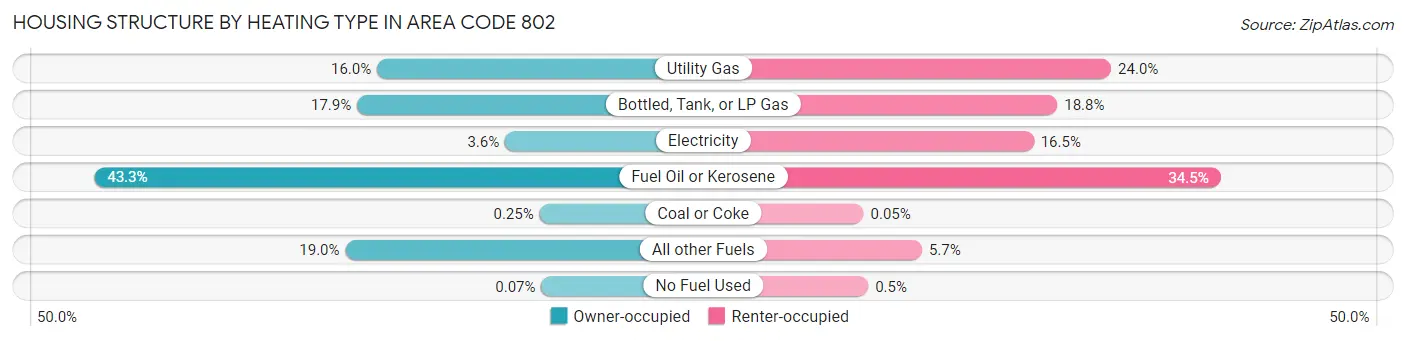
| Heating Type | Owner-occupied | Renter-occupied |
| Utility Gas | 30,541 (16.0%) | 17,292 (24.0%) |
| Bottled, Tank, or LP Gas | 34,232 (17.9%) | 13,540 (18.8%) |
| Electricity | 6,847 (3.6%) | 11,898 (16.5%) |
| Fuel Oil or Kerosene | 82,824 (43.3%) | 24,916 (34.5%) |
| Coal or Coke | 472 (0.3%) | 38 (0.1%) |
| All other Fuels | 36,404 (19.0%) | 4,109 (5.7%) |
| No Fuel Used | 137 (0.1%) | 359 (0.5%) |
| Total | 191,457 (100.0%) | 72,152 (100.0%) |
Household Vehicle Usage in Area Code 802
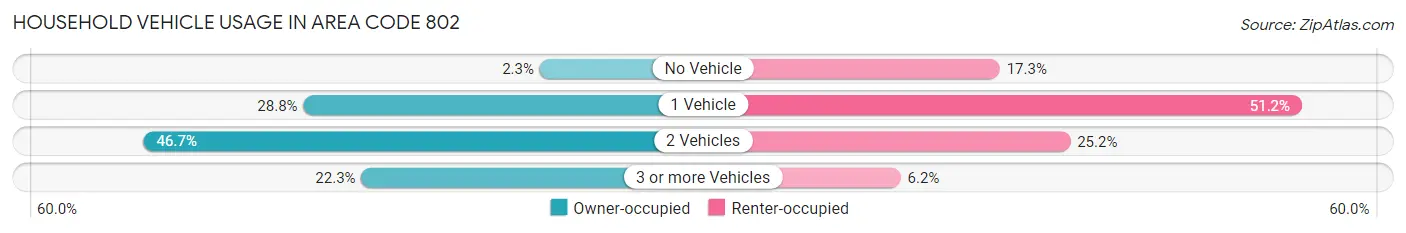
| Vehicles per Household | Owner-occupied | Renter-occupied |
| No Vehicle | 4,381 (2.3%) | 12,508 (17.3%) |
| 1 Vehicle | 55,075 (28.8%) | 36,930 (51.2%) |
| 2 Vehicles | 89,371 (46.7%) | 18,213 (25.2%) |
| 3 or more Vehicles | 42,630 (22.3%) | 4,501 (6.2%) |
| Total | 191,457 (100.0%) | 72,152 (100.0%) |
Real Estate & Mortgages in Area Code 802
Real Estate and Mortgage Overview in Area Code 802
| Characteristic | Without Mortgage | With Mortgage |
| Housing Units | 74,361 | 117,096 |
| Median Property Value | $60,785,501 | $62,587,900 |
| Median Household Income | $14,203,233 | $31,293 |
| Monthly Housing Costs | $173,676 | $12,919 |
| Real Estate Taxes | $1,031,130 | $1,095 |
Property Value by Mortgage Status in Area Code 802
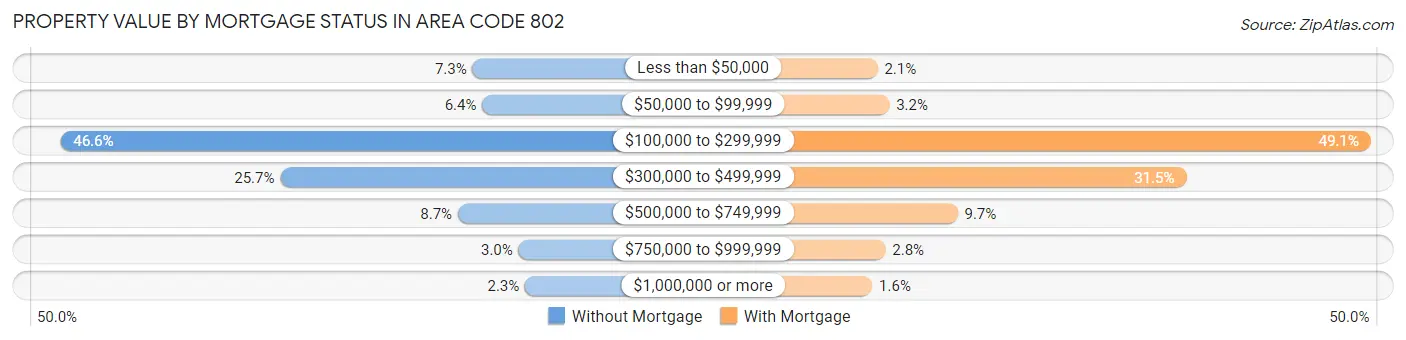
| Property Value | Without Mortgage | With Mortgage |
| Less than $50,000 | 5,455 (7.3%) | 2,449 (2.1%) |
| $50,000 to $99,999 | 4,767 (6.4%) | 3,758 (3.2%) |
| $100,000 to $299,999 | 34,650 (46.6%) | 57,460 (49.1%) |
| $300,000 to $499,999 | 19,074 (25.7%) | 36,885 (31.5%) |
| $500,000 to $749,999 | 6,489 (8.7%) | 11,375 (9.7%) |
| $750,000 to $999,999 | 2,197 (2.9%) | 3,323 (2.8%) |
| $1,000,000 or more | 1,729 (2.3%) | 1,846 (1.6%) |
| Total | 74,361 (100.0%) | 117,096 (100.0%) |
Household Income by Mortgage Status in Area Code 802
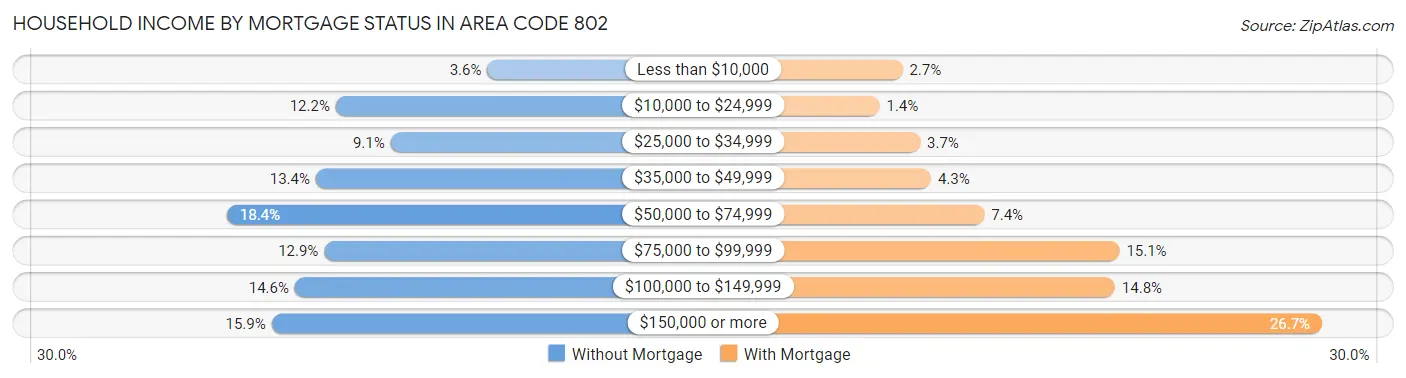
| Household Income | Without Mortgage | With Mortgage |
| Less than $10,000 | 2,649 (3.6%) | 3,136 (2.7%) |
| $10,000 to $24,999 | 9,089 (12.2%) | 1,600 (1.4%) |
| $25,000 to $34,999 | 6,761 (9.1%) | 4,321 (3.7%) |
| $35,000 to $49,999 | 9,931 (13.4%) | 5,049 (4.3%) |
| $50,000 to $74,999 | 13,713 (18.4%) | 8,617 (7.4%) |
| $75,000 to $99,999 | 9,577 (12.9%) | 17,661 (15.1%) |
| $100,000 to $149,999 | 10,827 (14.6%) | 17,351 (14.8%) |
| $150,000 or more | 11,814 (15.9%) | 31,204 (26.7%) |
| Total | 74,361 (100.0%) | 117,096 (100.0%) |
Property Value to Household Income Ratio in Area Code 802
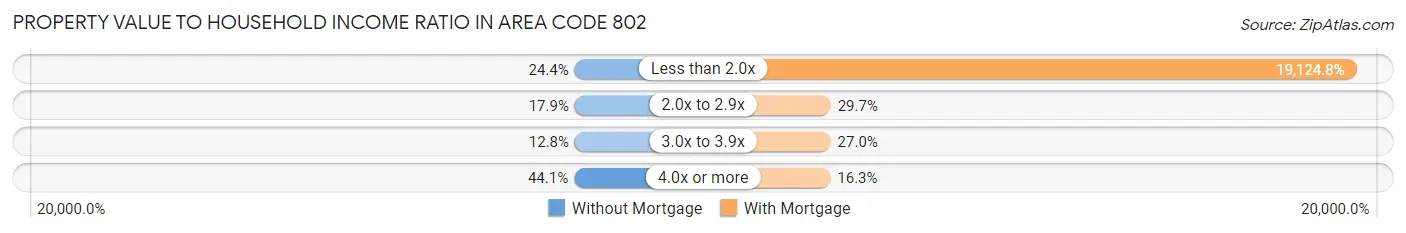
| Value-to-Income Ratio | Without Mortgage | With Mortgage |
| Less than 2.0x | 18,136 (24.4%) | 22,394,332 (19,124.8%) |
| 2.0x to 2.9x | 13,302 (17.9%) | 34,785 (29.7%) |
| 3.0x to 3.9x | 9,501 (12.8%) | 31,581 (27.0%) |
| 4.0x or more | 32,794 (44.1%) | 19,051 (16.3%) |
| Total | 74,361 (100.0%) | 117,096 (100.0%) |
Real Estate Taxes by Mortgage Status in Area Code 802
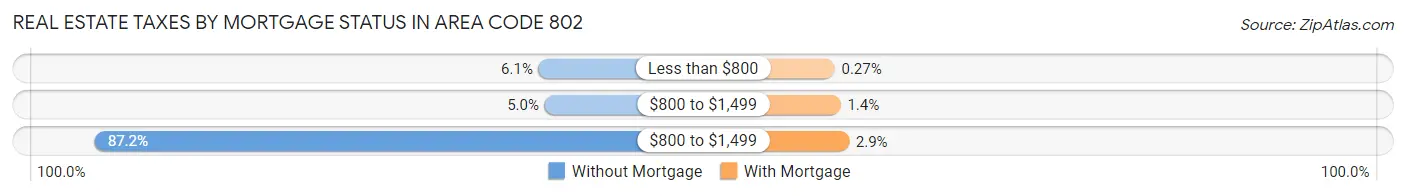
| Property Taxes | Without Mortgage | With Mortgage |
| Less than $800 | 4,527 (6.1%) | 315 (0.3%) |
| $800 to $1,499 | 3,707 (5.0%) | 1,591 (1.4%) |
| $800 to $1,499 | 64,821 (87.2%) | 3,372 (2.9%) |
| Total | 74,361 (100.0%) | 117,096 (100.0%) |
Health & Disability in Area Code 802
Health Insurance Coverage by Age in Area Code 802
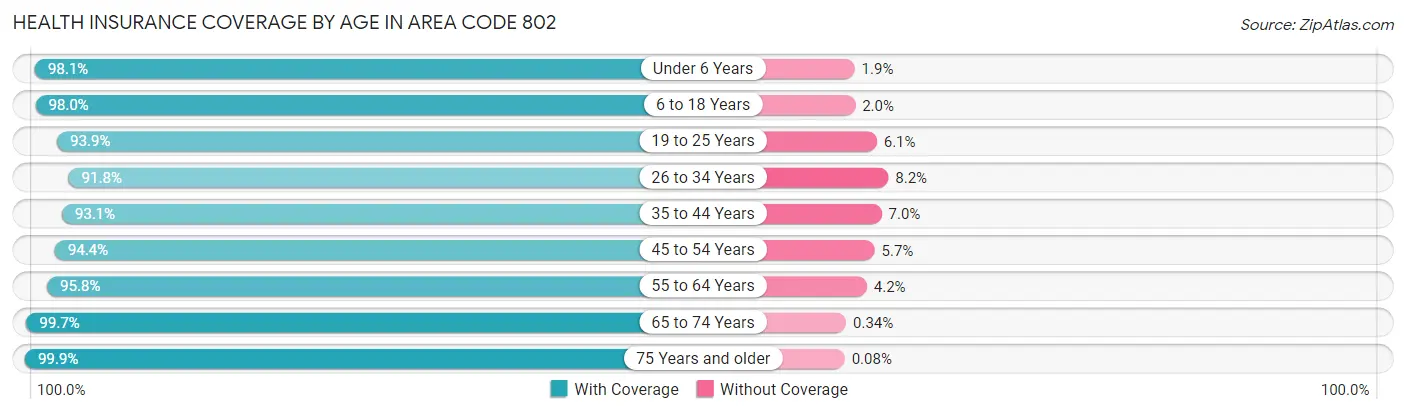
| Age Bracket | With Coverage | Without Coverage |
| Under 6 Years | 33,319 (98.1%) | 655 (1.9%) |
| 6 to 18 Years | 90,457 (98.0%) | 1,877 (2.0%) |
| 19 to 25 Years | 59,361 (93.9%) | 3,830 (6.1%) |
| 26 to 34 Years | 62,840 (91.8%) | 5,626 (8.2%) |
| 35 to 44 Years | 69,135 (93.0%) | 5,161 (7.0%) |
| 45 to 54 Years | 73,887 (94.4%) | 4,424 (5.7%) |
| 55 to 64 Years | 91,691 (95.8%) | 4,021 (4.2%) |
| 65 to 74 Years | 77,954 (99.7%) | 266 (0.3%) |
| 75 Years and older | 47,993 (99.9%) | 38 (0.1%) |
| Total | 606,637 (95.9%) | 25,898 (4.1%) |
Health Insurance Coverage by Citizenship Status in Area Code 802
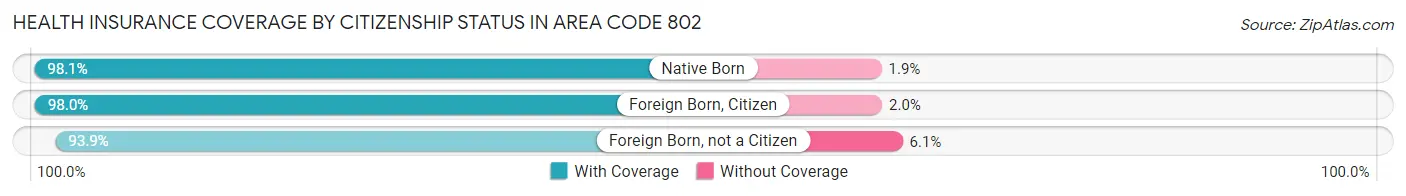
| Citizenship Status | With Coverage | Without Coverage |
| Native Born | 33,319 (98.1%) | 655 (1.9%) |
| Foreign Born, Citizen | 90,457 (98.0%) | 1,877 (2.0%) |
| Foreign Born, not a Citizen | 59,361 (93.9%) | 3,830 (6.1%) |
Health Insurance Coverage by Household Income in Area Code 802
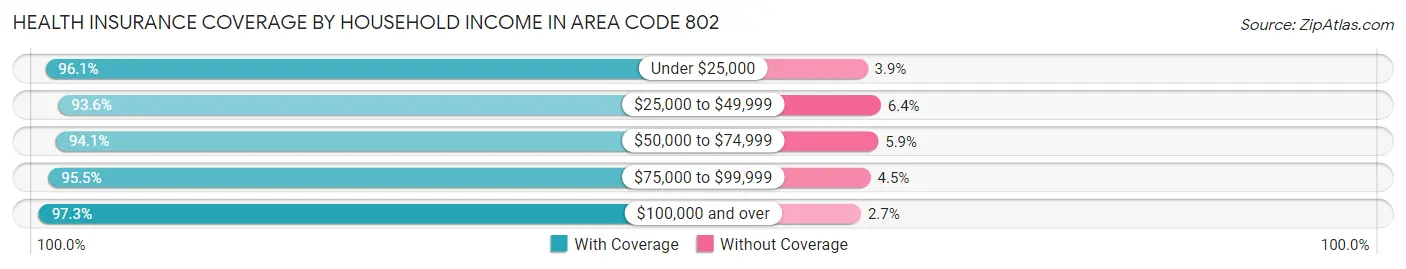
| Household Income | With Coverage | Without Coverage |
| Under $25,000 | 55,824 (96.1%) | 2,268 (3.9%) |
| $25,000 to $49,999 | 84,596 (93.6%) | 5,768 (6.4%) |
| $50,000 to $74,999 | 90,861 (94.1%) | 5,694 (5.9%) |
| $75,000 to $99,999 | 85,584 (95.5%) | 3,993 (4.5%) |
| $100,000 and over | 270,733 (97.3%) | 7,403 (2.7%) |
Public vs Private Health Insurance Coverage by Age in Area Code 802
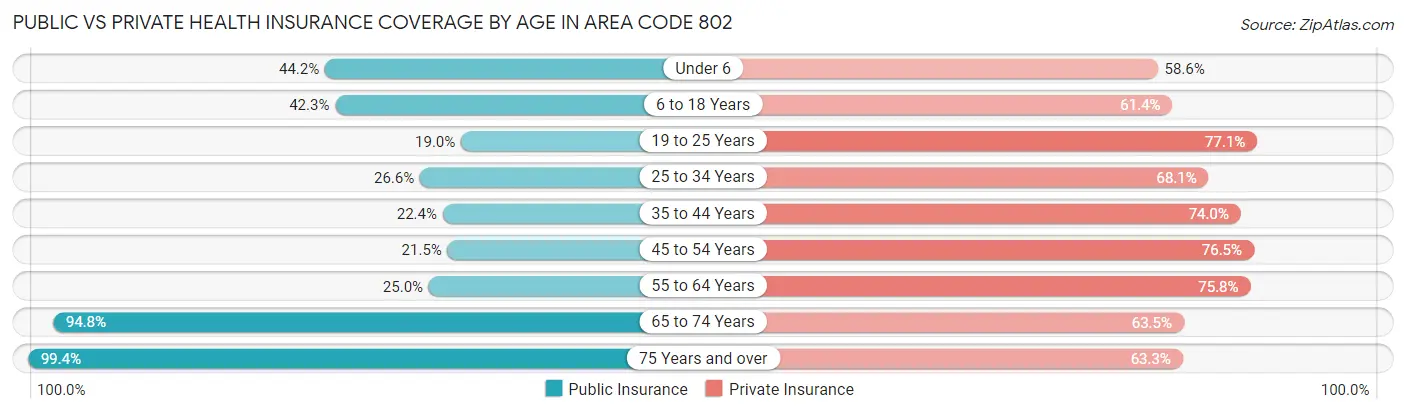
| Age Bracket | Public Insurance | Private Insurance |
| Under 6 | 15,027 (44.2%) | 19,913 (58.6%) |
| 6 to 18 Years | 39,093 (42.3%) | 56,660 (61.4%) |
| 19 to 25 Years | 11,993 (19.0%) | 48,714 (77.1%) |
| 25 to 34 Years | 18,210 (26.6%) | 46,612 (68.1%) |
| 35 to 44 Years | 16,617 (22.4%) | 55,009 (74.0%) |
| 45 to 54 Years | 16,816 (21.5%) | 59,894 (76.5%) |
| 55 to 64 Years | 23,892 (25.0%) | 72,578 (75.8%) |
| 65 to 74 Years | 74,118 (94.8%) | 49,654 (63.5%) |
| 75 Years and over | 47,747 (99.4%) | 30,387 (63.3%) |
| Total | 263,513 (41.7%) | 439,421 (69.5%) |
Disability Status by Sex by Age in Area Code 802
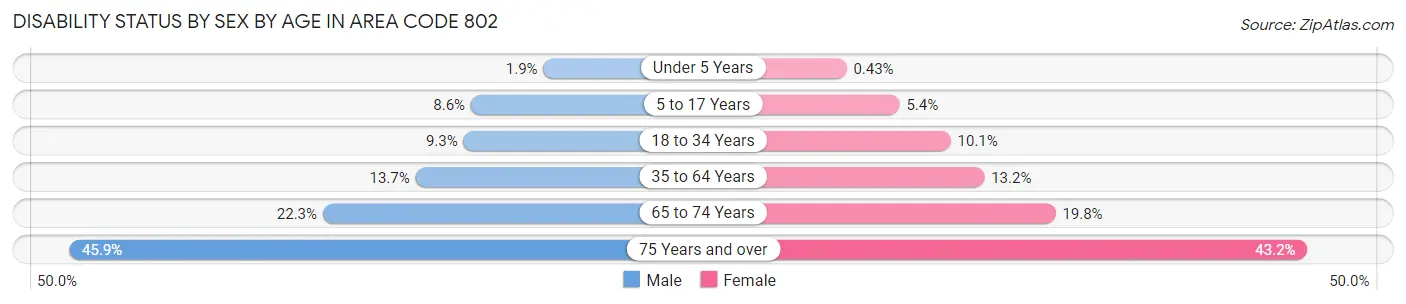
| Age Bracket | Male | Female |
| Under 5 Years | 267 (1.8%) | 58 (0.4%) |
| 5 to 17 Years | 3,928 (8.6%) | 2,240 (5.3%) |
| 18 to 34 Years | 6,701 (9.3%) | 7,061 (10.1%) |
| 35 to 64 Years | 16,859 (13.7%) | 16,585 (13.2%) |
| 65 to 74 Years | 8,530 (22.3%) | 7,932 (19.8%) |
| 75 Years and over | 9,609 (45.9%) | 11,705 (43.2%) |
Disability Class by Sex by Age in Area Code 802
Disability Class: Hearing Difficulty
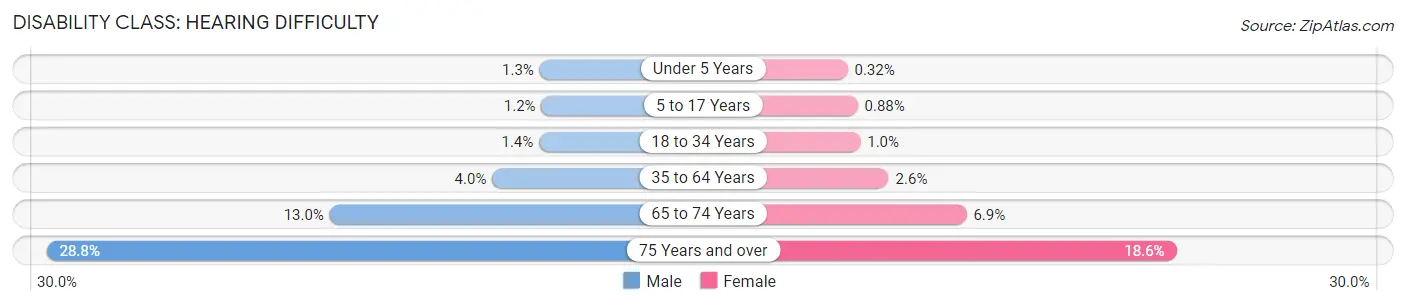
| Age Bracket | Male | Female |
| Under 5 Years | 191 (1.3%) | 43 (0.3%) |
| 5 to 17 Years | 556 (1.2%) | 370 (0.9%) |
| 18 to 34 Years | 974 (1.3%) | 721 (1.0%) |
| 35 to 64 Years | 4,869 (4.0%) | 3,274 (2.6%) |
| 65 to 74 Years | 4,972 (13.0%) | 2,775 (6.9%) |
| 75 Years and over | 6,029 (28.8%) | 5,046 (18.6%) |
Disability Class: Vision Difficulty
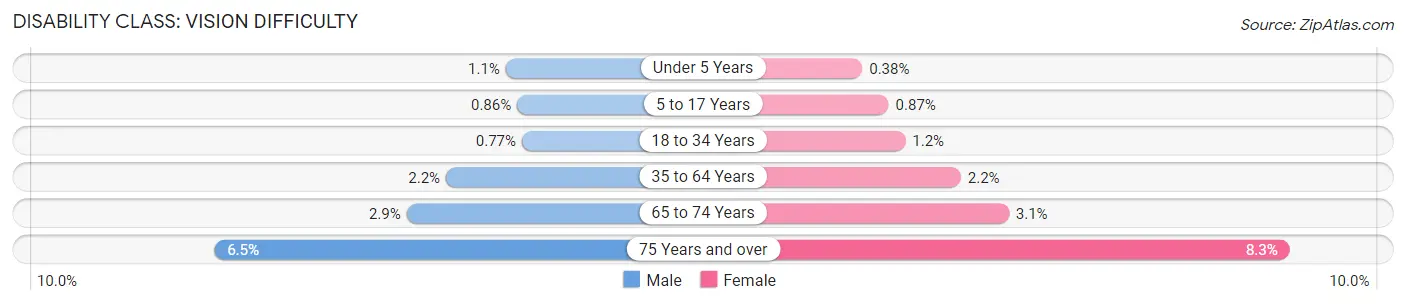
| Age Bracket | Male | Female |
| Under 5 Years | 154 (1.1%) | 52 (0.4%) |
| 5 to 17 Years | 393 (0.9%) | 365 (0.9%) |
| 18 to 34 Years | 560 (0.8%) | 823 (1.2%) |
| 35 to 64 Years | 2,676 (2.2%) | 2,771 (2.2%) |
| 65 to 74 Years | 1,113 (2.9%) | 1,239 (3.1%) |
| 75 Years and over | 1,358 (6.5%) | 2,251 (8.3%) |
Disability Class: Cognitive Difficulty
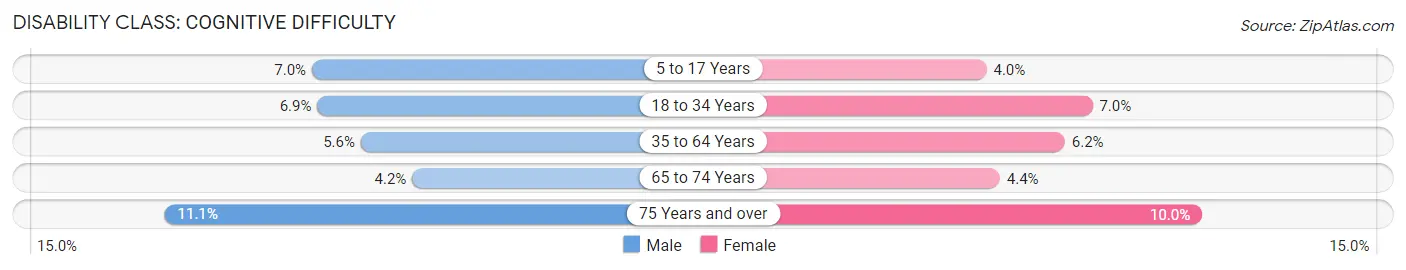
| Age Bracket | Male | Female |
| 5 to 17 Years | 3,203 (7.0%) | 1,687 (4.0%) |
| 18 to 34 Years | 4,952 (6.9%) | 4,878 (7.0%) |
| 35 to 64 Years | 6,926 (5.6%) | 7,789 (6.2%) |
| 65 to 74 Years | 1,611 (4.2%) | 1,760 (4.4%) |
| 75 Years and over | 2,324 (11.1%) | 2,718 (10.0%) |
Disability Class: Ambulatory Difficulty
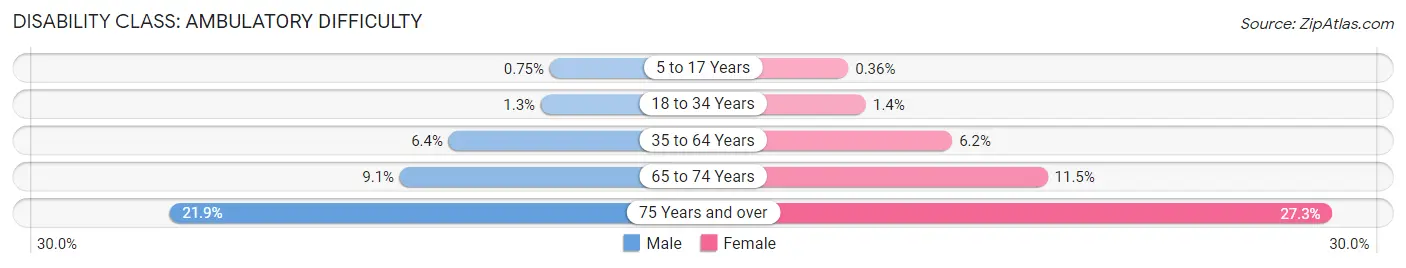
| Age Bracket | Male | Female |
| 5 to 17 Years | 343 (0.7%) | 152 (0.4%) |
| 18 to 34 Years | 903 (1.3%) | 945 (1.3%) |
| 35 to 64 Years | 7,835 (6.4%) | 7,712 (6.1%) |
| 65 to 74 Years | 3,480 (9.1%) | 4,583 (11.5%) |
| 75 Years and over | 4,596 (21.9%) | 7,400 (27.3%) |
Disability Class: Self-Care Difficulty
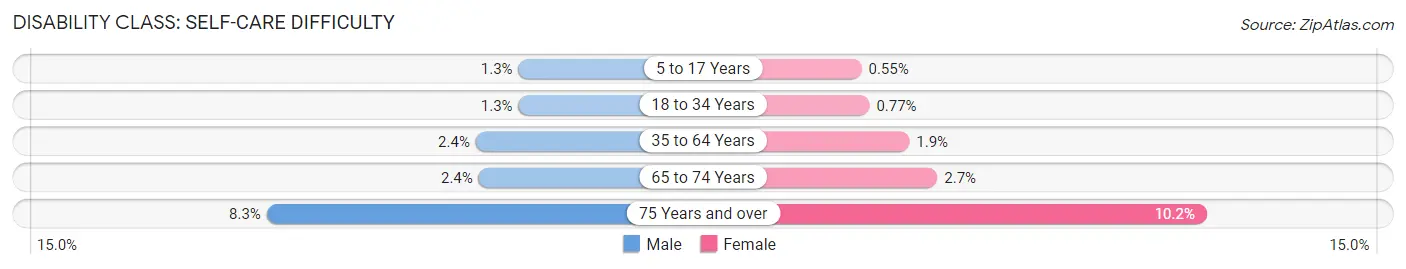
| Age Bracket | Male | Female |
| 5 to 17 Years | 570 (1.3%) | 232 (0.5%) |
| 18 to 34 Years | 902 (1.3%) | 538 (0.8%) |
| 35 to 64 Years | 3,002 (2.4%) | 2,354 (1.9%) |
| 65 to 74 Years | 902 (2.4%) | 1,064 (2.7%) |
| 75 Years and over | 1,731 (8.3%) | 2,752 (10.2%) |
Technology Access in Area Code 802
Computing Device Access in Area Code 802
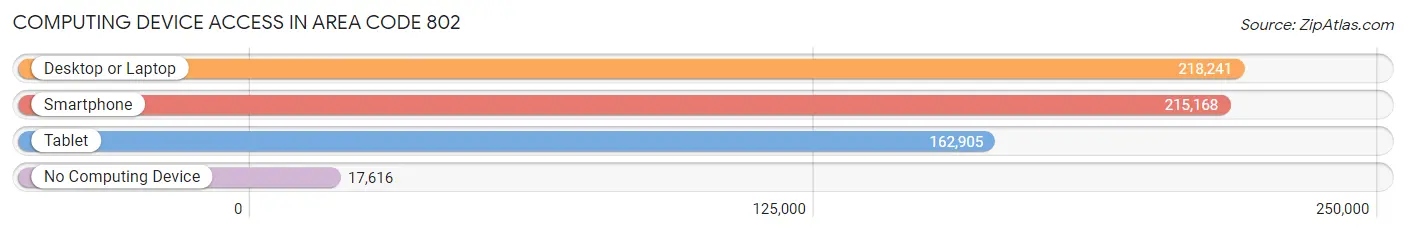
| Device Type | # Households | % Households |
| Desktop or Laptop | 218,241 | 82.8% |
| Smartphone | 215,168 | 81.6% |
| Tablet | 162,905 | 61.8% |
| No Computing Device | 17,616 | 6.7% |
| Total | 263,609 | 100.0% |
Internet Access in Area Code 802
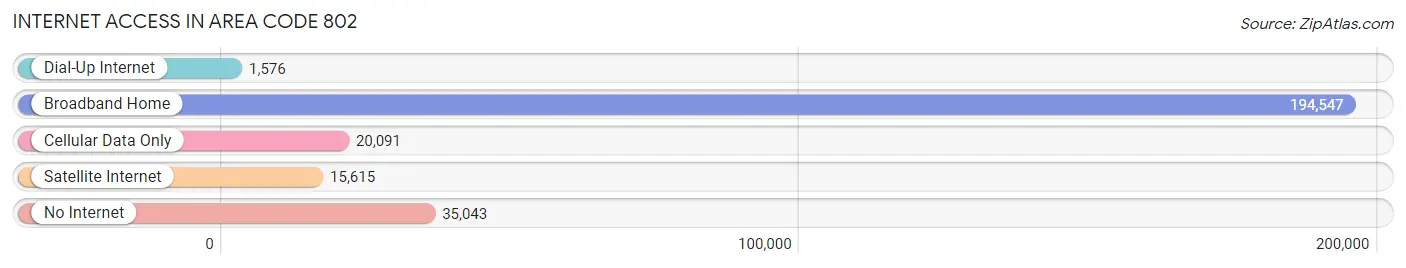
| Internet Type | # Households | % Households |
| Dial-Up Internet | 1,576 | 0.6% |
| Broadband Home | 194,547 | 73.8% |
| Cellular Data Only | 20,091 | 7.6% |
| Satellite Internet | 15,615 | 5.9% |
| No Internet | 35,043 | 13.3% |
| Total | 263,609 | 100.0% |
Area Code 802 Summary
Geography
Area code 802 is located in the state of Vermont, and covers the entire state. It is bordered by the states of New Hampshire, Massachusetts, New York, and Quebec, Canada.
Social
Area code 802 is a rural area, with a population of just over 626,000 people. The area is known for its natural beauty, with many outdoor activities such as skiing, hiking, and camping. The area is also known for its small towns and villages, with a strong sense of community.
Economics
Area code 802 is a largely agricultural area, with dairy farming being the main industry. The area is also home to a number of small businesses, such as craft breweries, wineries, and artisanal food producers.
Demographics
Area code 802 is predominantly white, with a population that is 94.3% white. The median household income is $56,817, and the median age is 42.7 years. The area is also home to a number of colleges and universities, including the University of Vermont and Middlebury College.
Common Questions
What is Per Capita Income in Area Code 802?
Per Capita income in Area Code 802 is $40,622.
What is the Median Family Income in Area Code 802?
Median Family Income in Area Code 802 is $93,079.
What is the Median Household income in Area Code 802?
Median Household Income in Area Code 802 is $76,006.
What is Income or Wage Gap in Area Code 802?
Income or Wage Gap in Area Code 802 is 22.1%.
Women in Area Code 802 earn 77.9 cents for every dollar earned by a man.
What is Family Income Deficit in Area Code 802?
Family Income Deficit in Area Code 802 is $9,993.
Families that are below poverty line in Area Code 802 earn $9,993 less on average than the poverty threshold level.
What is Inequality or Gini Index in Area Code 802?
Inequality or Gini Index in Area Code 802 is 99.84.
What is the Total Population of Area Code 802?
Total Population of Area Code 802 is 638,732.
What is the Total Male Population of Area Code 802?
Total Male Population of Area Code 802 is 317,844.
What is the Total Female Population of Area Code 802?
Total Female Population of Area Code 802 is 320,888.
What is the Ratio of Males per 100 Females in Area Code 802?
There are 99.05 Males per 100 Females in Area Code 802.
What is the Ratio of Females per 100 Males in Area Code 802?
There are 100.96 Females per 100 Males in Area Code 802.
What is the Median Population Age in Area Code 802?
Median Population Age in Area Code 802 is 46.7 Years.
What is the Average Family Size in Area Code 802
Average Family Size in Area Code 802 is 2.9 People.
What is the Average Household Size in Area Code 802
Average Household Size in Area Code 802 is 2.4 People.
How Large is the Labor Force in Area Code 802?
There are 340,243 People in the Labor Forcein in Area Code 802.
What is the Percentage of People in the Labor Force in Area Code 802?
63.3% of People are in the Labor Force in Area Code 802.
What is the Unemployment Rate in Area Code 802?
Unemployment Rate in Area Code 802 is 4.4%.