Area Code 361 Map & Demographics
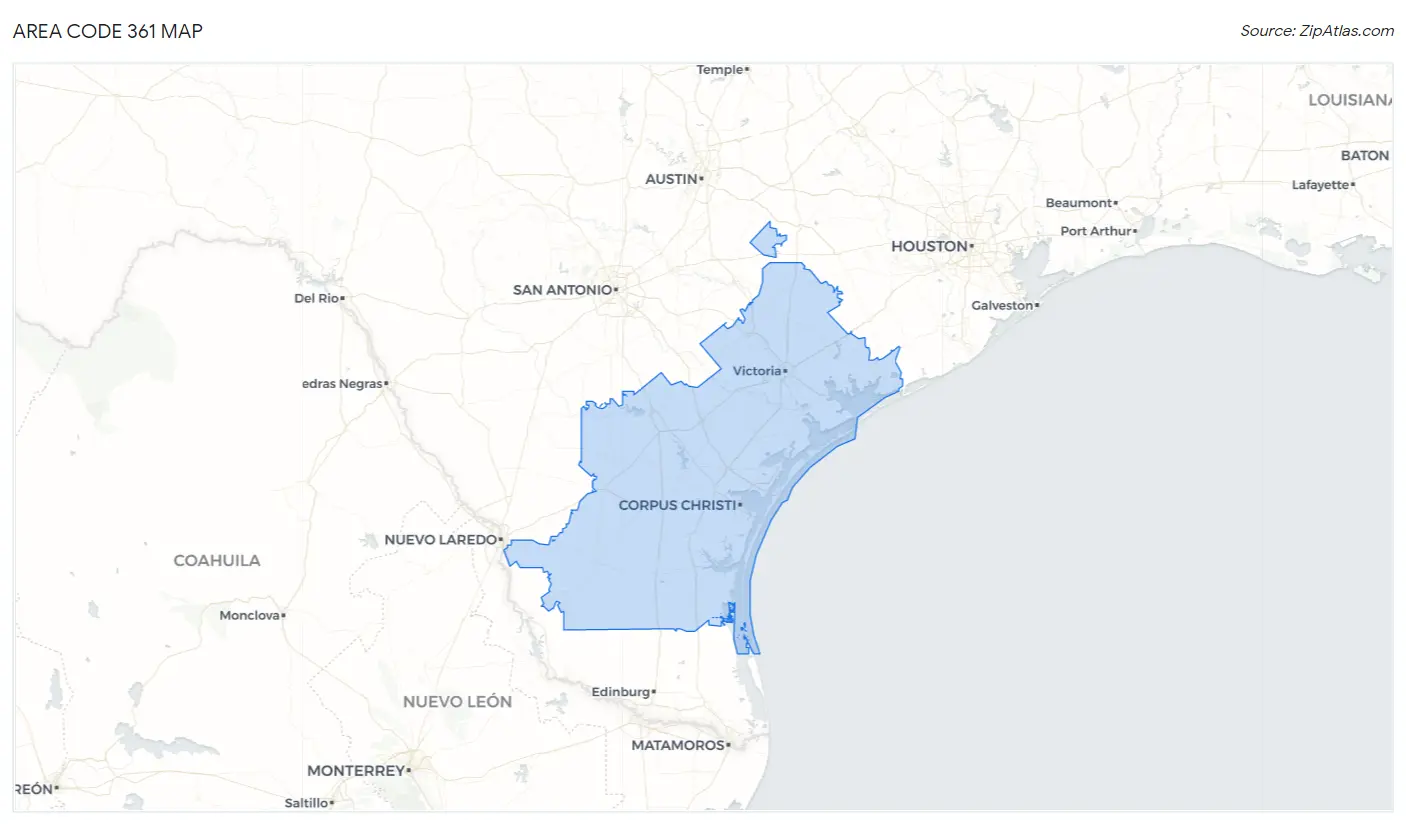
Area Code 361 Map
Area Code 361 Overview
$28,490
PER CAPITA INCOME
$72,400
AVG FAMILY INCOME
$59,051
AVG HOUSEHOLD INCOME
34.5%
WAGE / INCOME GAP [ % ]
65.5¢/ $1
WAGE / INCOME GAP [ $ ]
$11,539
FAMILY INCOME DEFICIT
43.94
INEQUALITY / GINI INDEX
781,473
TOTAL POPULATION
396,606
MALE POPULATION
384,867
FEMALE POPULATION
103.05
MALES / 100 FEMALES
97.04
FEMALES / 100 MALES
40.9
MEDIAN AGE
3.4
AVG FAMILY SIZE
2.8
AVG HOUSEHOLD SIZE
336,047
LABOR FORCE [ PEOPLE ]
54.7%
PERCENT IN LABOR FORCE
6.0%
UNEMPLOYMENT RATE
Income in Area Code 361
Income Overview in Area Code 361
Per Capita Income in Area Code 361 is $28,490, while median incomes of families and households are $72,400 and $59,051 respectively.
| Characteristic | Number | Measure |
| Per Capita Income | 781,473 | $28,490 |
| Median Family Income | 192,729 | $72,400 |
| Mean Family Income | 192,729 | $9,015,871 |
| Median Household Income | 283,806 | $59,051 |
| Mean Household Income | 283,806 | $8,007,035 |
| Income Deficit | 192,729 | $11,539 |
| Wage / Income Gap (%) | 781,473 | 34.52% |
| Wage / Income Gap ($) | 781,473 | 65.48¢ per $1 |
| Gini / Inequality Index | 781,473 | 43.94 |
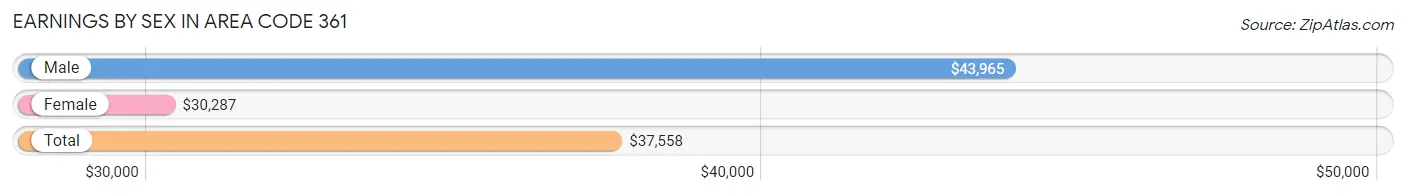
Earnings by Sex in Area Code 361
Average Earnings in Area Code 361 are $37,558, $43,965 for men and $30,287 for women, a difference of 31.1%.
| Sex | Number | Average Earnings |
| Male | 204,671 (54.8%) | $43,965 |
| Female | 168,717 (45.2%) | $30,287 |
| Total | 373,388 (100.0%) | $37,558 |
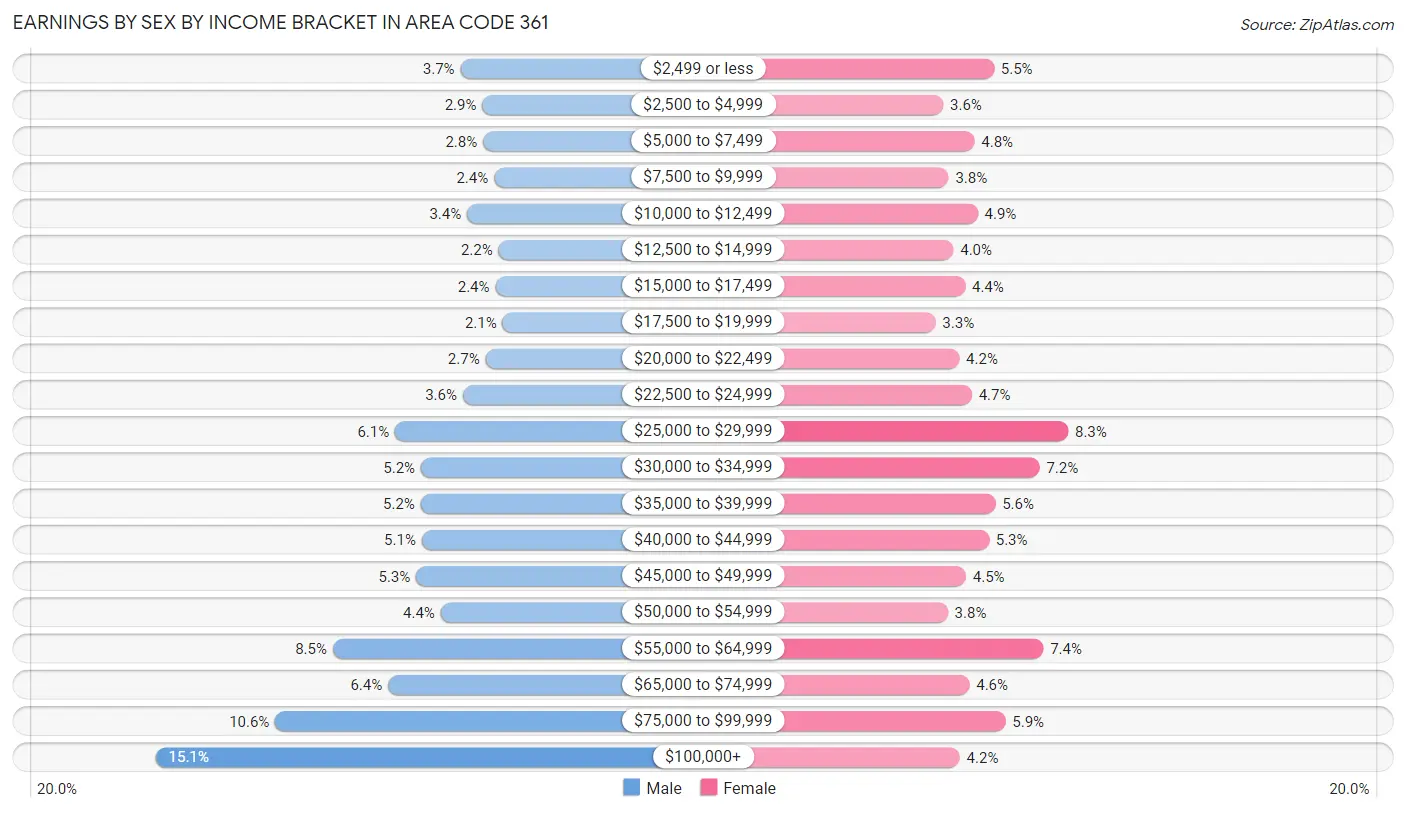
Earnings by Sex by Income Bracket in Area Code 361
The most common earnings brackets in Area Code 361 are $100,000+ for men (30,875 | 15.1%) and $25,000 to $29,999 for women (13,989 | 8.3%).
| Income | Male | Female |
| $2,499 or less | 7,520 (3.7%) | 9,288 (5.5%) |
| $2,500 to $4,999 | 5,831 (2.9%) | 6,091 (3.6%) |
| $5,000 to $7,499 | 5,780 (2.8%) | 8,061 (4.8%) |
| $7,500 to $9,999 | 4,932 (2.4%) | 6,427 (3.8%) |
| $10,000 to $12,499 | 6,991 (3.4%) | 8,274 (4.9%) |
| $12,500 to $14,999 | 4,592 (2.2%) | 6,740 (4.0%) |
| $15,000 to $17,499 | 4,831 (2.4%) | 7,473 (4.4%) |
| $17,500 to $19,999 | 4,283 (2.1%) | 5,609 (3.3%) |
| $20,000 to $22,499 | 5,589 (2.7%) | 7,104 (4.2%) |
| $22,500 to $24,999 | 7,319 (3.6%) | 7,900 (4.7%) |
| $25,000 to $29,999 | 12,523 (6.1%) | 13,989 (8.3%) |
| $30,000 to $34,999 | 10,550 (5.1%) | 12,179 (7.2%) |
| $35,000 to $39,999 | 10,560 (5.2%) | 9,384 (5.6%) |
| $40,000 to $44,999 | 10,470 (5.1%) | 8,971 (5.3%) |
| $45,000 to $49,999 | 10,910 (5.3%) | 7,521 (4.5%) |
| $50,000 to $54,999 | 9,033 (4.4%) | 6,381 (3.8%) |
| $55,000 to $64,999 | 17,299 (8.5%) | 12,420 (7.4%) |
| $65,000 to $74,999 | 13,067 (6.4%) | 7,736 (4.6%) |
| $75,000 to $99,999 | 21,716 (10.6%) | 10,030 (5.9%) |
| $100,000+ | 30,875 (15.1%) | 7,139 (4.2%) |
| Total | 204,671 (100.0%) | 168,717 (100.0%) |
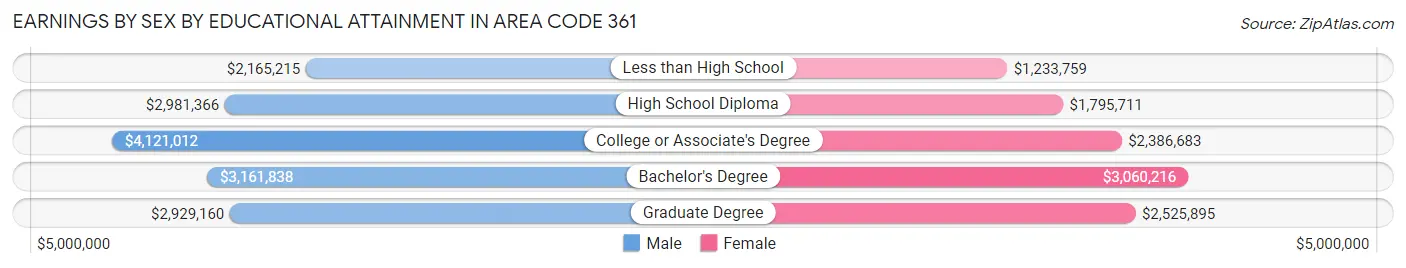
Earnings by Sex by Educational Attainment in Area Code 361
Average earnings in Area Code 361 are $4,507,912 for men and $2,596,030 for women, a difference of 42.4%. Men with an educational attainment of college or associate's degree enjoy the highest average annual earnings of $4,121,012, while those with less than high school education earn the least with $2,165,215. Women with an educational attainment of bachelor's degree earn the most with the average annual earnings of $3,060,216, while those with less than high school education have the smallest earnings of $1,233,759.
| Educational Attainment | Male Income | Female Income |
| Less than High School | $2,165,215 | $1,233,759 |
| High School Diploma | $2,981,366 | $1,795,711 |
| College or Associate's Degree | $4,121,012 | $2,386,683 |
| Bachelor's Degree | $3,161,838 | $3,060,216 |
| Graduate Degree | $2,929,160 | $2,525,895 |
| Total | $4,507,912 | $2,596,030 |
Family Income in Area Code 361
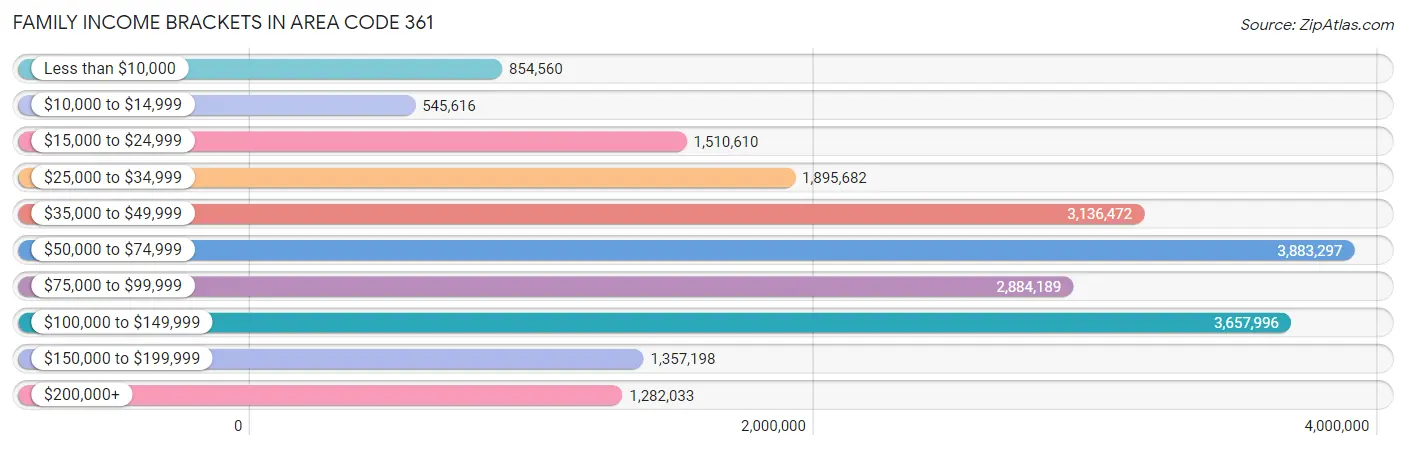
Family Income Brackets in Area Code 361
According to the Area Code 361 family income data, there are 3,883,297 families falling into the $50,000 to $74,999 income range, which is the most common income bracket and makes up 2,014.9% of all families. Conversely, the $10,000 to $14,999 income bracket is the least frequent group with only 545,616 families (283.1%) belonging to this category.
| Income Bracket | # Families | % Families |
| Less than $10,000 | 854,560 | 443.4% |
| $10,000 to $14,999 | 545,616 | 283.1% |
| $15,000 to $24,999 | 1,510,610 | 783.8% |
| $25,000 to $34,999 | 1,895,682 | 983.6% |
| $35,000 to $49,999 | 3,136,472 | 1,627.4% |
| $50,000 to $74,999 | 3,883,297 | 2,014.9% |
| $75,000 to $99,999 | 2,884,189 | 1,496.5% |
| $100,000 to $149,999 | 3,657,996 | 1,898.0% |
| $150,000 to $199,999 | 1,357,198 | 704.2% |
| $200,000+ | 1,282,033 | 665.2% |
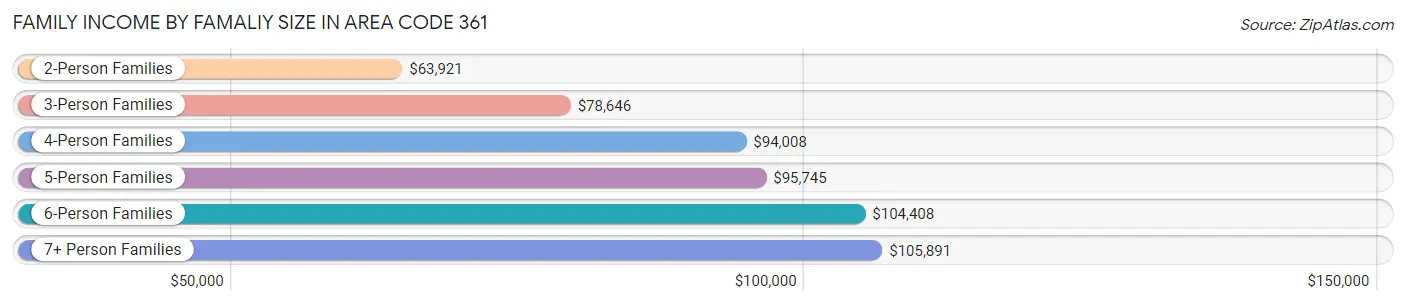
Family Income by Famaliy Size in Area Code 361
7+ person families (4,250 | 2.2%) account for the highest median family income in Area Code 361 with $105,891 per family, while 2-person families (88,965 | 46.2%) have the highest median income of $31,961 per family member.
| Income Bracket | # Families | Median Income |
| 2-Person Families | 88,965 (46.2%) | $63,921 |
| 3-Person Families | 42,794 (22.2%) | $78,646 |
| 4-Person Families | 33,518 (17.4%) | $94,008 |
| 5-Person Families | 16,839 (8.7%) | $95,745 |
| 6-Person Families | 6,363 (3.3%) | $104,408 |
| 7+ Person Families | 4,250 (2.2%) | $105,891 |
| Total | 192,729 (100.0%) | $72,400 |
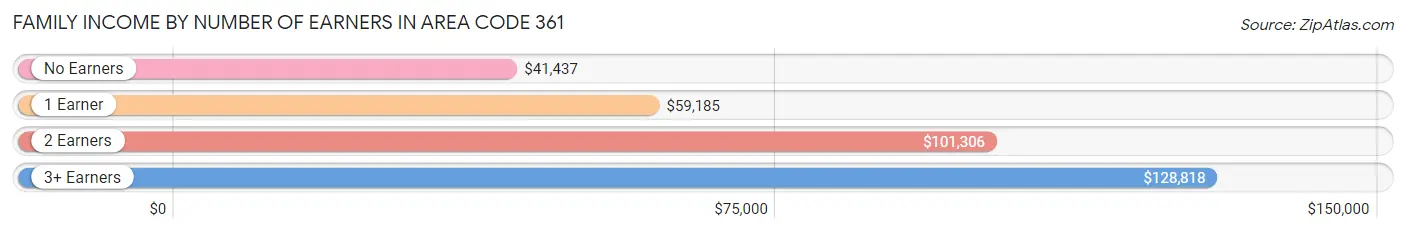
Family Income by Number of Earners in Area Code 361
The median family income in Area Code 361 is $72,400, with families comprising 3+ earners (17,010) having the highest median family income of $128,818, while families with no earners (31,186) have the lowest median family income of $41,437, accounting for 8.8% and 16.2% of families, respectively.
| Number of Earners | # Families | Median Income |
| No Earners | 31,186 (16.2%) | $41,437 |
| 1 Earner | 70,881 (36.8%) | $59,185 |
| 2 Earners | 73,652 (38.2%) | $101,306 |
| 3+ Earners | 17,010 (8.8%) | $128,818 |
| Total | 192,729 (100.0%) | $72,400 |
Household Income in Area Code 361
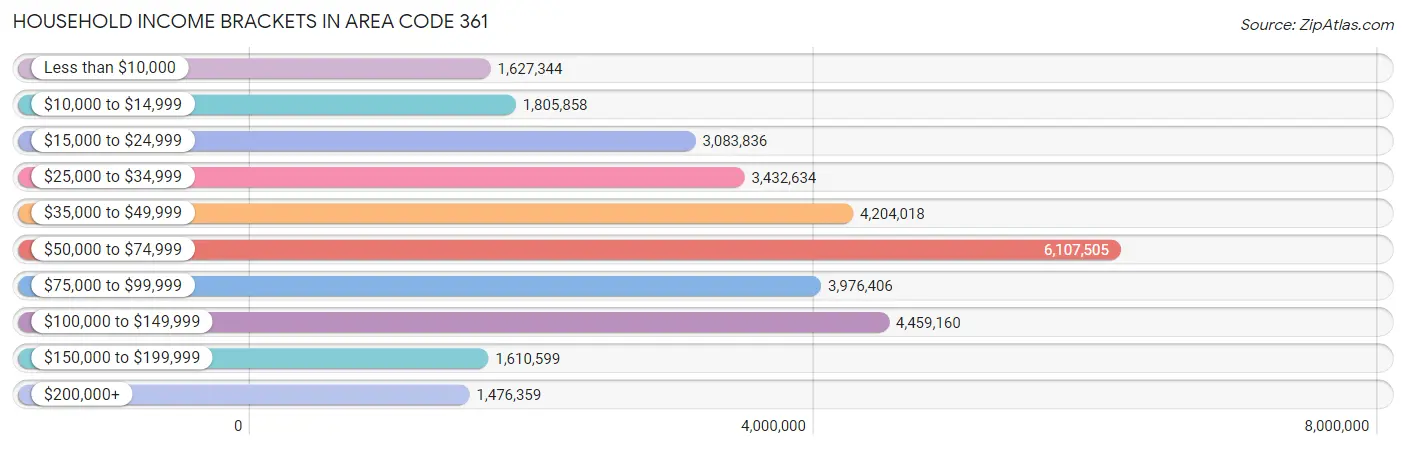
Household Income Brackets in Area Code 361
With 6,107,505 households falling in the category, the $50,000 to $74,999 income range is the most frequent in Area Code 361, accounting for 2,152.0% of all households. In contrast, only 1,476,359 households (520.2%) fall into the $200,000+ income bracket, making it the least populous group.
| Income Bracket | # Households | % Households |
| Less than $10,000 | 1,627,344 | 573.4% |
| $10,000 to $14,999 | 1,805,858 | 636.3% |
| $15,000 to $24,999 | 3,083,836 | 1,086.6% |
| $25,000 to $34,999 | 3,432,634 | 1,209.5% |
| $35,000 to $49,999 | 4,204,018 | 1,481.3% |
| $50,000 to $74,999 | 6,107,505 | 2,152.0% |
| $75,000 to $99,999 | 3,976,406 | 1,401.1% |
| $100,000 to $149,999 | 4,459,160 | 1,571.2% |
| $150,000 to $199,999 | 1,610,599 | 567.5% |
| $200,000+ | 1,476,359 | 520.2% |
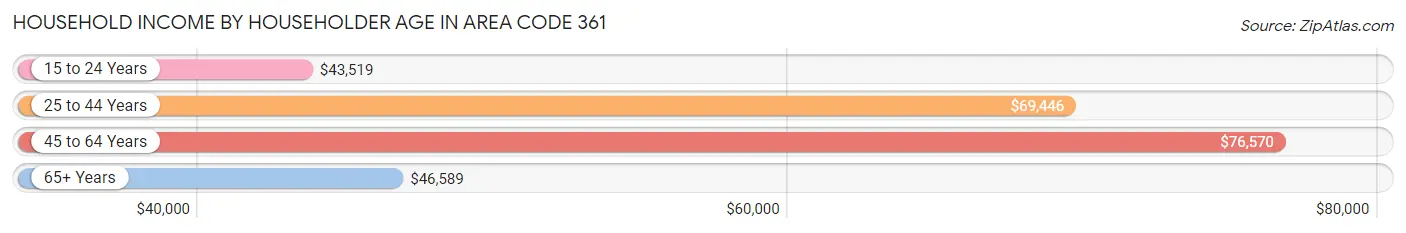
Household Income by Householder Age in Area Code 361
The median household income in Area Code 361 is $59,051, with the highest median household income of $76,570 found in the 45 to 64 years age bracket for the primary householder. A total of 97,779 households (34.4%) fall into this category. Meanwhile, the 15 to 24 years age bracket for the primary householder has the lowest median household income of $43,519, with 13,236 households (4.7%) in this group.
| Income Bracket | # Households | Median Income |
| 15 to 24 Years | 13,236 (4.7%) | $43,519 |
| 25 to 44 Years | 94,682 (33.4%) | $69,446 |
| 45 to 64 Years | 97,779 (34.4%) | $76,570 |
| 65+ Years | 78,109 (27.5%) | $46,589 |
| Total | 283,806 (100.0%) | $59,051 |
Poverty in Area Code 361
Income Below Poverty by Sex and Age in Area Code 361
With 15.4% poverty level for males and 19.8% for females among the residents of Area Code 361, 5 year old males and 5 year old females are the most vulnerable to poverty, with 1,753 males (29.8%) and 1,500 females (31.1%) in their respective age groups living below the poverty level.
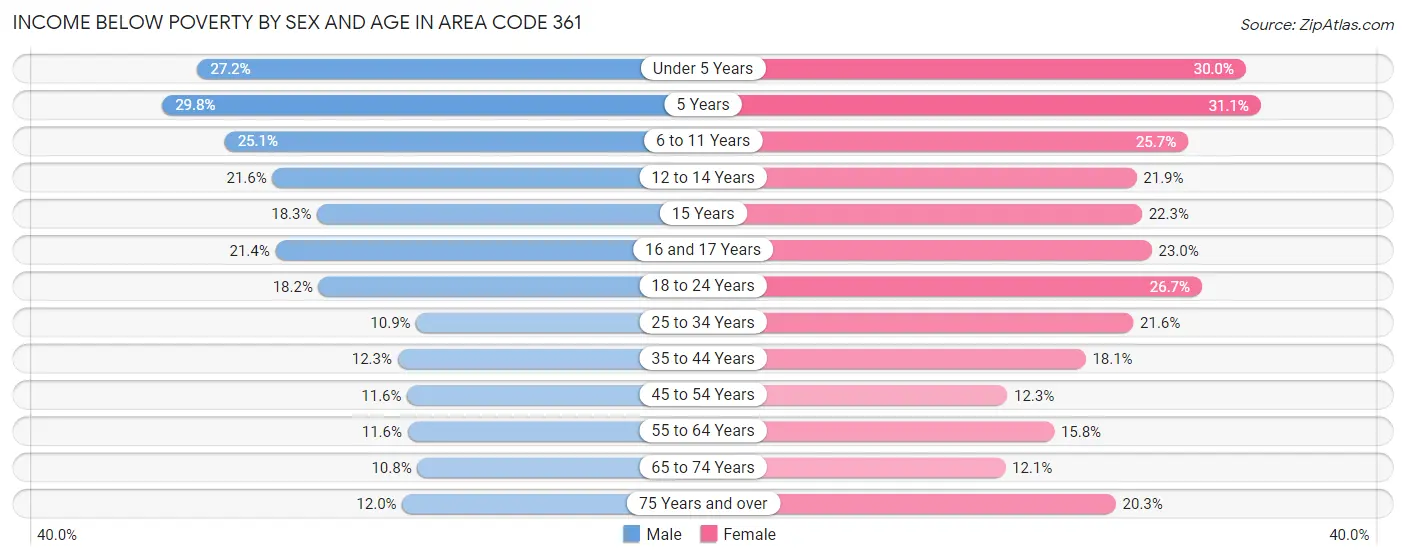
| Age Bracket | Male | Female |
| Under 5 Years | 6,761 (27.2%) | 6,997 (30.0%) |
| 5 Years | 1,753 (29.8%) | 1,500 (31.1%) |
| 6 to 11 Years | 7,947 (25.1%) | 7,740 (25.7%) |
| 12 to 14 Years | 3,442 (21.6%) | 3,471 (21.9%) |
| 15 Years | 1,081 (18.3%) | 1,223 (22.3%) |
| 16 and 17 Years | 2,287 (21.4%) | 2,437 (23.0%) |
| 18 to 24 Years | 6,612 (18.2%) | 9,059 (26.7%) |
| 25 to 34 Years | 5,623 (10.9%) | 10,567 (21.6%) |
| 35 to 44 Years | 5,994 (12.3%) | 8,637 (18.1%) |
| 45 to 54 Years | 4,944 (11.6%) | 5,282 (12.3%) |
| 55 to 64 Years | 5,164 (11.6%) | 7,384 (15.8%) |
| 65 to 74 Years | 3,775 (10.8%) | 4,575 (12.1%) |
| 75 Years and over | 2,517 (11.9%) | 5,864 (20.3%) |
| Total | 57,900 (15.4%) | 74,736 (19.8%) |
Income Above Poverty by Sex and Age in Area Code 361
According to the poverty statistics in Area Code 361, males aged 65 to 74 years and females aged 65 to 74 years are the age groups that are most secure financially, with 89.2% of males and 87.9% of females in these age groups living above the poverty line.
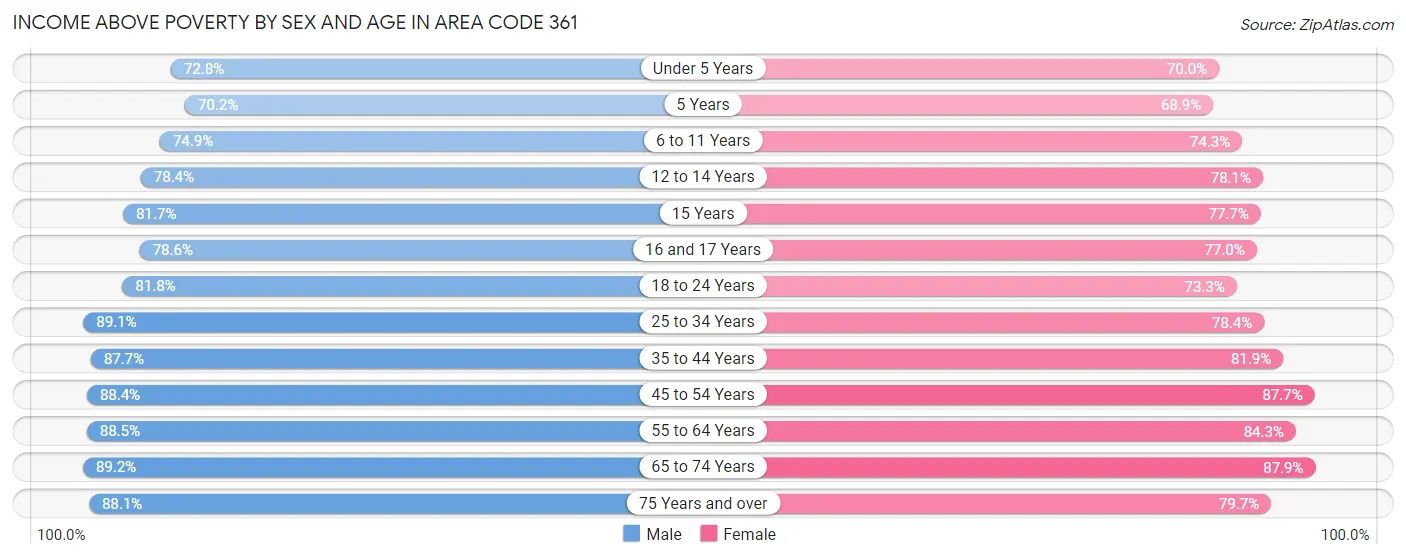
| Age Bracket | Male | Female |
| Under 5 Years | 18,122 (72.8%) | 16,335 (70.0%) |
| 5 Years | 4,134 (70.2%) | 3,323 (68.9%) |
| 6 to 11 Years | 23,668 (74.9%) | 22,380 (74.3%) |
| 12 to 14 Years | 12,501 (78.4%) | 12,401 (78.1%) |
| 15 Years | 4,836 (81.7%) | 4,268 (77.7%) |
| 16 and 17 Years | 8,413 (78.6%) | 8,159 (77.0%) |
| 18 to 24 Years | 29,802 (81.8%) | 24,836 (73.3%) |
| 25 to 34 Years | 45,918 (89.1%) | 38,287 (78.4%) |
| 35 to 44 Years | 42,789 (87.7%) | 39,117 (81.9%) |
| 45 to 54 Years | 37,744 (88.4%) | 37,759 (87.7%) |
| 55 to 64 Years | 39,532 (88.4%) | 39,504 (84.3%) |
| 65 to 74 Years | 31,073 (89.2%) | 33,176 (87.9%) |
| 75 Years and over | 18,538 (88.0%) | 22,977 (79.7%) |
| Total | 317,070 (84.6%) | 302,522 (80.2%) |
Income Below Poverty Among Married-Couple Families in Area Code 361
The poverty statistics for married-couple families in Area Code 361 show that 6.1% or 8,220 of the total 134,012 families live below the poverty line. Families with 5 or more children have the highest poverty rate of 27.3%, comprising of 274 families. On the other hand, families with no children have the lowest poverty rate of 4.4%, which includes 3,429 families.
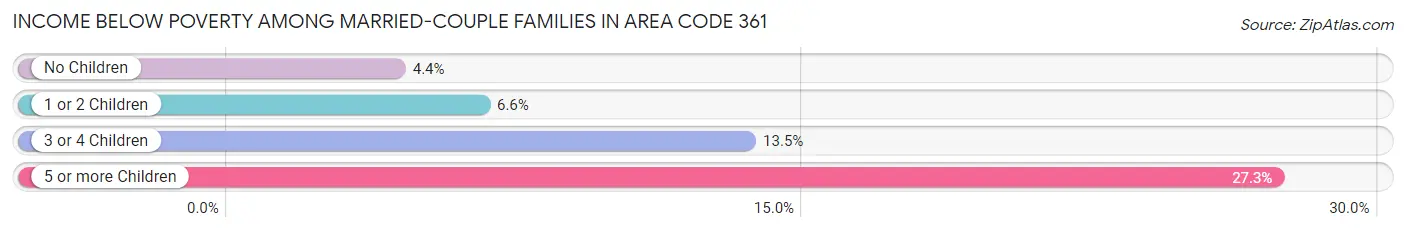
| Children | Above Poverty | Below Poverty |
| No Children | 74,846 (95.6%) | 3,429 (4.4%) |
| 1 or 2 Children | 38,809 (93.4%) | 2,732 (6.6%) |
| 3 or 4 Children | 11,408 (86.5%) | 1,785 (13.5%) |
| 5 or more Children | 729 (72.7%) | 274 (27.3%) |
| Total | 125,792 (93.9%) | 8,220 (6.1%) |
Income Below Poverty Among Single-Parent Households in Area Code 361
According to the poverty data in Area Code 361, 18.6% or 2,976 single-father households and 35.1% or 15,017 single-mother households are living below the poverty line. Among single-father households, those with 5 or more children have the highest poverty rate, with 9 households (100.0%) experiencing poverty. Likewise, among single-mother households, those with 5 or more children have the highest poverty rate, with 808 households (77.2%) falling below the poverty line.
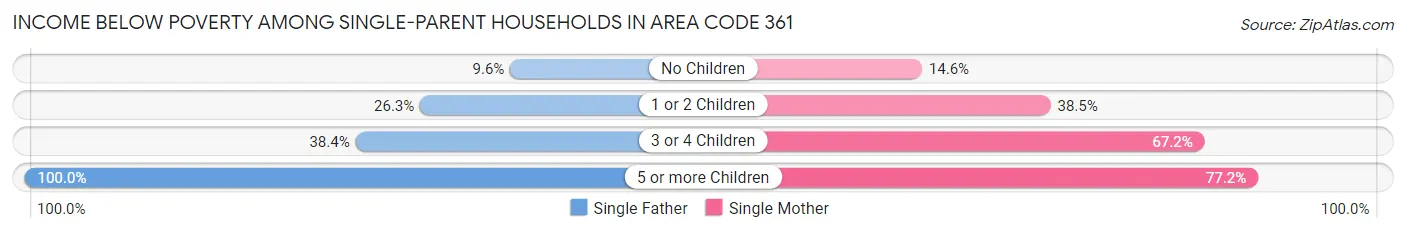
| Children | Single Father | Single Mother |
| No Children | 786 (9.6%) | 2,150 (14.6%) |
| 1 or 2 Children | 1,734 (26.3%) | 8,130 (38.5%) |
| 3 or 4 Children | 447 (38.4%) | 3,929 (67.2%) |
| 5 or more Children | 9 (100.0%) | 808 (77.2%) |
| Total | 2,976 (18.6%) | 15,017 (35.1%) |
Income Below Poverty Among Married-Couple vs Single-Parent Households in Area Code 361
The poverty data for Area Code 361 shows that 8,220 of the married-couple family households (6.1%) and 17,993 of the single-parent households (30.6%) are living below the poverty level. Within the married-couple family households, those with 5 or more children have the highest poverty rate, with 274 households (27.3%) falling below the poverty line. Among the single-parent households, those with 5 or more children have the highest poverty rate, with 817 household (77.4%) living below poverty.
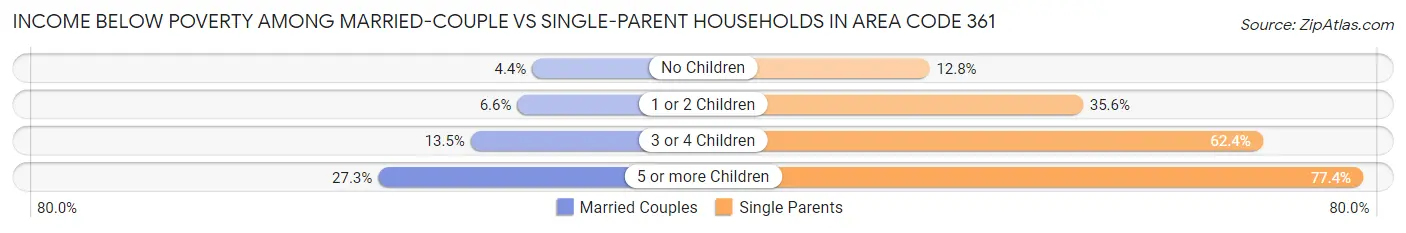
| Children | Married-Couple Families | Single-Parent Households |
| No Children | 3,429 (4.4%) | 2,936 (12.8%) |
| 1 or 2 Children | 2,732 (6.6%) | 9,864 (35.6%) |
| 3 or 4 Children | 1,785 (13.5%) | 4,376 (62.4%) |
| 5 or more Children | 274 (27.3%) | 817 (77.4%) |
| Total | 8,220 (6.1%) | 17,993 (30.6%) |
Race in Area Code 361
The most populous races in Area Code 361 are White / Caucasian (528,789 | 67.7%), Hispanic or Latino (461,703 | 59.1%), and Two or more Races (166,704 | 21.3%).
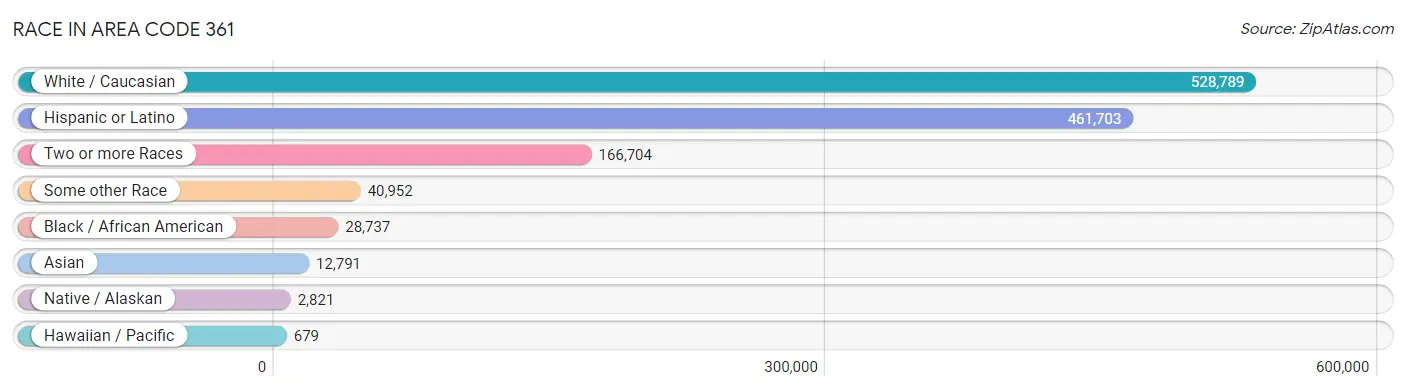
| Race | # Population | % Population |
| Asian | 12,791 | 1.6% |
| Black / African American | 28,737 | 3.7% |
| Hawaiian / Pacific | 679 | 0.1% |
| Hispanic or Latino | 461,703 | 59.1% |
| Native / Alaskan | 2,821 | 0.4% |
| White / Caucasian | 528,789 | 67.7% |
| Two or more Races | 166,704 | 21.3% |
| Some other Race | 40,952 | 5.2% |
| Total | 781,473 | 100.0% |
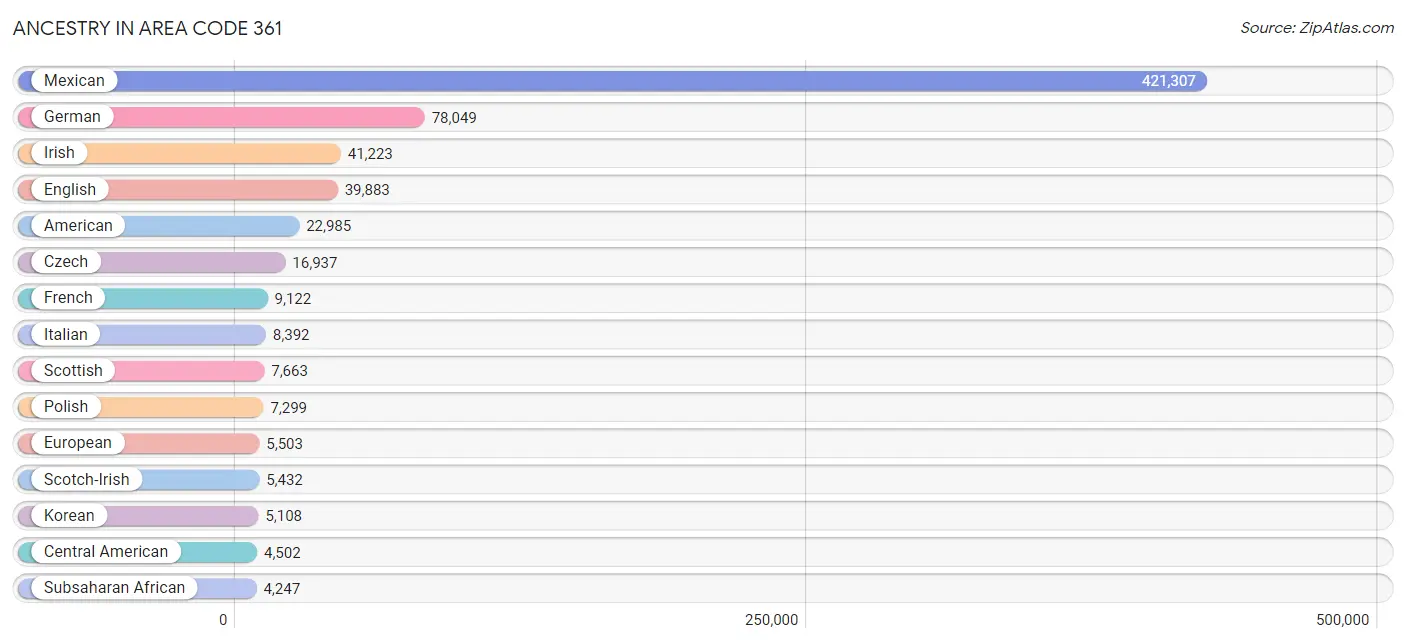
Ancestry in Area Code 361
The most populous ancestries reported in Area Code 361 are Mexican (421,307 | 53.9%), German (78,049 | 10.0%), Irish (41,223 | 5.3%), English (39,883 | 5.1%), and American (22,985 | 2.9%), together accounting for 77.2% of all Area Code 361 residents.
| Ancestry | # Population | % Population |
| Afghan | 280 | 0.0% |
| African | 3,703 | 0.5% |
| Albanian | 66 | 0.0% |
| Alsatian | 32 | 0.0% |
| American | 22,985 | 2.9% |
| Apache | 876 | 0.1% |
| Arab | 1,254 | 0.2% |
| Argentinean | 111 | 0.0% |
| Armenian | 169 | 0.0% |
| Australian | 93 | 0.0% |
| Austrian | 384 | 0.1% |
| Bahamian | 13 | 0.0% |
| Barbadian | 70 | 0.0% |
| Belgian | 132 | 0.0% |
| Belizean | 13 | 0.0% |
| Bhutanese | 1,244 | 0.2% |
| Blackfeet | 231 | 0.0% |
| Bolivian | 87 | 0.0% |
| Brazilian | 265 | 0.0% |
| British | 1,758 | 0.2% |
| British West Indian | 232 | 0.0% |
| Bulgarian | 42 | 0.0% |
| Burmese | 715 | 0.1% |
| Cajun | 315 | 0.0% |
| Cambodian | 25 | 0.0% |
| Canadian | 547 | 0.1% |
| Carpatho Rusyn | 48 | 0.0% |
| Celtic | 44 | 0.0% |
| Central American | 4,502 | 0.6% |
| Central American Indian | 786 | 0.1% |
| Cherokee | 2,943 | 0.4% |
| Cheyenne | 25 | 0.0% |
| Chickasaw | 73 | 0.0% |
| Chilean | 361 | 0.1% |
| Chinese | 38 | 0.0% |
| Chippewa | 93 | 0.0% |
| Choctaw | 619 | 0.1% |
| Colombian | 1,011 | 0.1% |
| Comanche | 311 | 0.0% |
| Costa Rican | 32 | 0.0% |
| Cree | 5 | 0.0% |
| Creek | 121 | 0.0% |
| Croatian | 101 | 0.0% |
| Crow | 19 | 0.0% |
| Cuban | 1,633 | 0.2% |
| Czech | 16,937 | 2.2% |
| Czechoslovakian | 904 | 0.1% |
| Danish | 798 | 0.1% |
| Dominican | 426 | 0.1% |
| Dutch | 3,207 | 0.4% |
| Dutch West Indian | 67 | 0.0% |
| Eastern European | 542 | 0.1% |
| Ecuadorian | 145 | 0.0% |
| Egyptian | 62 | 0.0% |
| English | 39,883 | 5.1% |
| Estonian | 17 | 0.0% |
| Ethiopian | 14 | 0.0% |
| European | 5,503 | 0.7% |
| Filipino | 536 | 0.1% |
| Finnish | 315 | 0.0% |
| French | 9,122 | 1.2% |
| French American Indian | 14 | 0.0% |
| French Canadian | 1,102 | 0.1% |
| German | 78,049 | 10.0% |
| German Russian | 58 | 0.0% |
| Ghanaian | 4 | 0.0% |
| Greek | 677 | 0.1% |
| Guamanian / Chamorro | 253 | 0.0% |
| Guatemalan | 1,265 | 0.2% |
| Haitian | 64 | 0.0% |
| Hmong | 11 | 0.0% |
| Honduran | 1,367 | 0.2% |
| Hopi | 59 | 0.0% |
| Hungarian | 495 | 0.1% |
| Indian (Asian) | 2,136 | 0.3% |
| Indonesian | 249 | 0.0% |
| Inupiat | 2 | 0.0% |
| Iranian | 211 | 0.0% |
| Iraqi | 127 | 0.0% |
| Irish | 41,223 | 5.3% |
| Iroquois | 28 | 0.0% |
| Israeli | 48 | 0.0% |
| Italian | 8,392 | 1.1% |
| Jamaican | 237 | 0.0% |
| Japanese | 86 | 0.0% |
| Jordanian | 7 | 0.0% |
| Kenyan | 3 | 0.0% |
| Kiowa | 7 | 0.0% |
| Korean | 5,108 | 0.6% |
| Laotian | 241 | 0.0% |
| Latvian | 27 | 0.0% |
| Lebanese | 458 | 0.1% |
| Lithuanian | 283 | 0.0% |
| Macedonian | 20 | 0.0% |
| Malaysian | 85 | 0.0% |
| Mexican | 421,307 | 53.9% |
| Mexican American Indian | 942 | 0.1% |
| Moroccan | 33 | 0.0% |
| Native Hawaiian | 721 | 0.1% |
| Navajo | 317 | 0.0% |
| Nicaraguan | 232 | 0.0% |
| Nigerian | 365 | 0.1% |
| Northern European | 304 | 0.0% |
| Norwegian | 2,403 | 0.3% |
| Osage | 225 | 0.0% |
| Ottawa | 3 | 0.0% |
| Pakistani | 376 | 0.1% |
| Palestinian | 160 | 0.0% |
| Panamanian | 236 | 0.0% |
| Paraguayan | 146 | 0.0% |
| Pennsylvania German | 220 | 0.0% |
| Peruvian | 179 | 0.0% |
| Polish | 7,299 | 0.9% |
| Portuguese | 788 | 0.1% |
| Potawatomi | 173 | 0.0% |
| Puerto Rican | 3,267 | 0.4% |
| Romanian | 283 | 0.0% |
| Russian | 1,065 | 0.1% |
| Salvadoran | 1,370 | 0.2% |
| Samoan | 302 | 0.0% |
| Scandinavian | 761 | 0.1% |
| Scotch-Irish | 5,432 | 0.7% |
| Scottish | 7,663 | 1.0% |
| Seminole | 16 | 0.0% |
| Serbian | 42 | 0.0% |
| Sioux | 153 | 0.0% |
| Slavic | 75 | 0.0% |
| Slovak | 185 | 0.0% |
| Slovene | 64 | 0.0% |
| Somali | 7 | 0.0% |
| South African | 43 | 0.0% |
| South American | 2,939 | 0.4% |
| South American Indian | 15 | 0.0% |
| Soviet Union | 7 | 0.0% |
| Spaniard | 3,779 | 0.5% |
| Spanish | 1,921 | 0.3% |
| Spanish American | 30 | 0.0% |
| Spanish American Indian | 13 | 0.0% |
| Sri Lankan | 2,536 | 0.3% |
| Subsaharan African | 4,247 | 0.5% |
| Sudanese | 4 | 0.0% |
| Swedish | 2,579 | 0.3% |
| Swiss | 633 | 0.1% |
| Syrian | 210 | 0.0% |
| Thai | 2,113 | 0.3% |
| Tlingit-Haida | 10 | 0.0% |
| Tohono O'Odham | 9 | 0.0% |
| Tongan | 14 | 0.0% |
| Trinidadian and Tobagonian | 86 | 0.0% |
| Turkish | 165 | 0.0% |
| Ugandan | 25 | 0.0% |
| Ukrainian | 457 | 0.1% |
| Uruguayan | 19 | 0.0% |
| Venezuelan | 880 | 0.1% |
| Vietnamese | 111 | 0.0% |
| Welsh | 2,128 | 0.3% |
| West Indian | 133 | 0.0% |
| Yakama | 6 | 0.0% |
| Yaqui | 8 | 0.0% |
| Yugoslavian | 148 | 0.0% |
| Yuman | 4 | 0.0% |
| Zimbabwean | 9 | 0.0% | View All 162 Rows |
Immigrants in Area Code 361
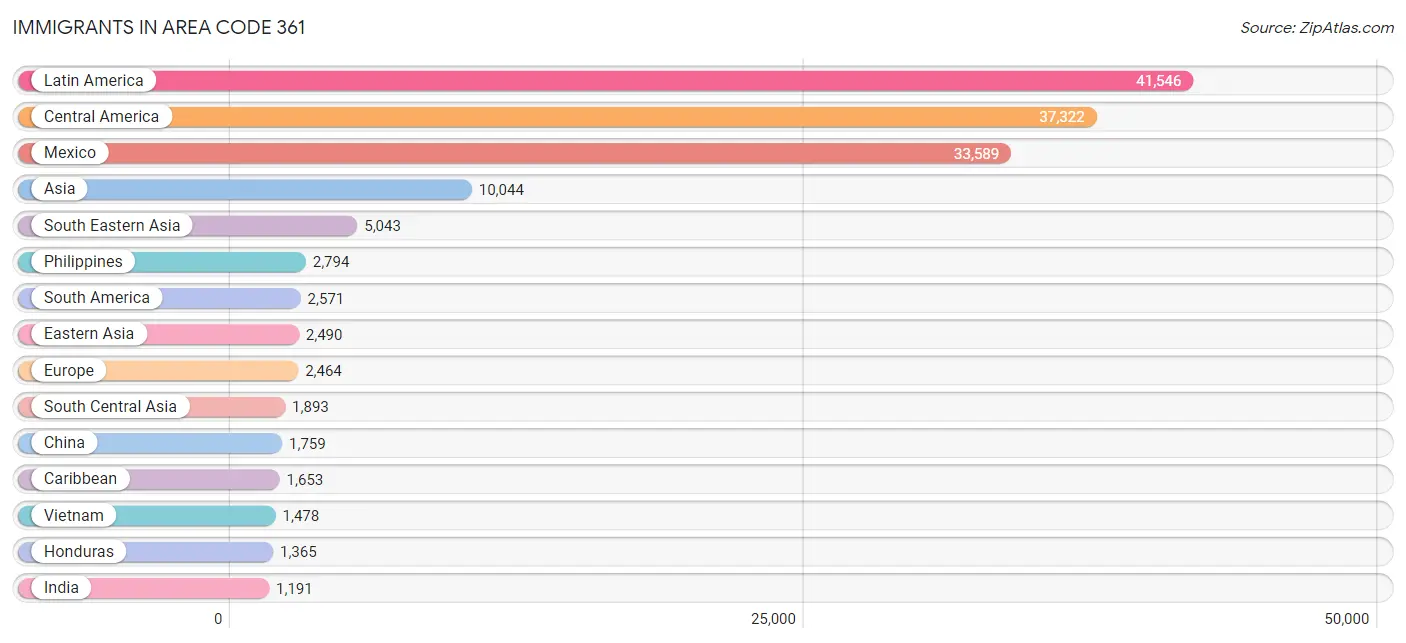
The most numerous immigrant groups reported in Area Code 361 came from Latin America (41,546 | 5.3%), Central America (37,322 | 4.8%), Mexico (33,589 | 4.3%), Asia (10,044 | 1.3%), and South Eastern Asia (5,043 | 0.6%), together accounting for 16.3% of all Area Code 361 residents.
| Immigration Origin | # Population | % Population |
| Afghanistan | 275 | 0.0% |
| Africa | 734 | 0.1% |
| Argentina | 89 | 0.0% |
| Asia | 10,044 | 1.3% |
| Australia | 77 | 0.0% |
| Austria | 32 | 0.0% |
| Bahamas | 32 | 0.0% |
| Bangladesh | 111 | 0.0% |
| Barbados | 53 | 0.0% |
| Belarus | 29 | 0.0% |
| Belgium | 26 | 0.0% |
| Belize | 38 | 0.0% |
| Bolivia | 33 | 0.0% |
| Bosnia and Herzegovina | 46 | 0.0% |
| Brazil | 274 | 0.0% |
| Bulgaria | 28 | 0.0% |
| Cambodia | 45 | 0.0% |
| Cameroon | 14 | 0.0% |
| Canada | 765 | 0.1% |
| Caribbean | 1,653 | 0.2% |
| Central America | 37,322 | 4.8% |
| Chile | 302 | 0.0% |
| China | 1,759 | 0.2% |
| Colombia | 562 | 0.1% |
| Costa Rica | 22 | 0.0% |
| Cuba | 1,050 | 0.1% |
| Czechoslovakia | 28 | 0.0% |
| Denmark | 5 | 0.0% |
| Dominica | 65 | 0.0% |
| Dominican Republic | 145 | 0.0% |
| Eastern Africa | 139 | 0.0% |
| Eastern Asia | 2,490 | 0.3% |
| Eastern Europe | 665 | 0.1% |
| Ecuador | 145 | 0.0% |
| Egypt | 68 | 0.0% |
| El Salvador | 976 | 0.1% |
| England | 298 | 0.0% |
| Ethiopia | 1 | 0.0% |
| Europe | 2,464 | 0.3% |
| Fiji | 42 | 0.0% |
| France | 45 | 0.0% |
| Germany | 730 | 0.1% |
| Grenada | 29 | 0.0% |
| Guatemala | 999 | 0.1% |
| Guyana | 20 | 0.0% |
| Honduras | 1,365 | 0.2% |
| Hong Kong | 45 | 0.0% |
| Hungary | 19 | 0.0% |
| India | 1,191 | 0.2% |
| Indonesia | 181 | 0.0% |
| Iran | 66 | 0.0% |
| Iraq | 202 | 0.0% |
| Ireland | 76 | 0.0% |
| Israel | 40 | 0.0% |
| Italy | 137 | 0.0% |
| Jamaica | 86 | 0.0% |
| Japan | 177 | 0.0% |
| Jordan | 29 | 0.0% |
| Kenya | 19 | 0.0% |
| Korea | 554 | 0.1% |
| Kuwait | 8 | 0.0% |
| Laos | 46 | 0.0% |
| Latin America | 41,546 | 5.3% |
| Lebanon | 14 | 0.0% |
| Malaysia | 76 | 0.0% |
| Mexico | 33,589 | 4.3% |
| Middle Africa | 35 | 0.0% |
| Moldova | 7 | 0.0% |
| Morocco | 30 | 0.0% |
| Netherlands | 23 | 0.0% |
| Nicaragua | 124 | 0.0% |
| Nigeria | 273 | 0.0% |
| Northern Africa | 102 | 0.0% |
| Northern Europe | 546 | 0.1% |
| Norway | 13 | 0.0% |
| Oceania | 247 | 0.0% |
| Pakistan | 225 | 0.0% |
| Panama | 182 | 0.0% |
| Peru | 187 | 0.0% |
| Philippines | 2,794 | 0.4% |
| Poland | 119 | 0.0% |
| Portugal | 10 | 0.0% |
| Romania | 22 | 0.0% |
| Russia | 178 | 0.0% |
| Saudi Arabia | 134 | 0.0% |
| Scotland | 34 | 0.0% |
| Serbia | 10 | 0.0% |
| Singapore | 6 | 0.0% |
| Somalia | 40 | 0.0% |
| South Africa | 66 | 0.0% |
| South America | 2,571 | 0.3% |
| South Central Asia | 1,893 | 0.2% |
| South Eastern Asia | 5,043 | 0.6% |
| Southern Europe | 342 | 0.0% |
| Spain | 195 | 0.0% |
| Sri Lanka | 25 | 0.0% |
| Sudan | 4 | 0.0% |
| Switzerland | 49 | 0.0% |
| Syria | 25 | 0.0% |
| Taiwan | 629 | 0.1% |
| Thailand | 307 | 0.0% |
| Trinidad and Tobago | 136 | 0.0% |
| Turkey | 138 | 0.0% |
| Uganda | 30 | 0.0% |
| Ukraine | 135 | 0.0% |
| Uruguay | 19 | 0.0% |
| Venezuela | 895 | 0.1% |
| Vietnam | 1,478 | 0.2% |
| West Indies | 20 | 0.0% |
| Western Africa | 273 | 0.0% |
| Western Asia | 618 | 0.1% |
| Western Europe | 911 | 0.1% |
| Zaire | 21 | 0.0% |
| Zimbabwe | 29 | 0.0% | View All 114 Rows |
Sex and Age in Area Code 361
Sex and Age in Area Code 361
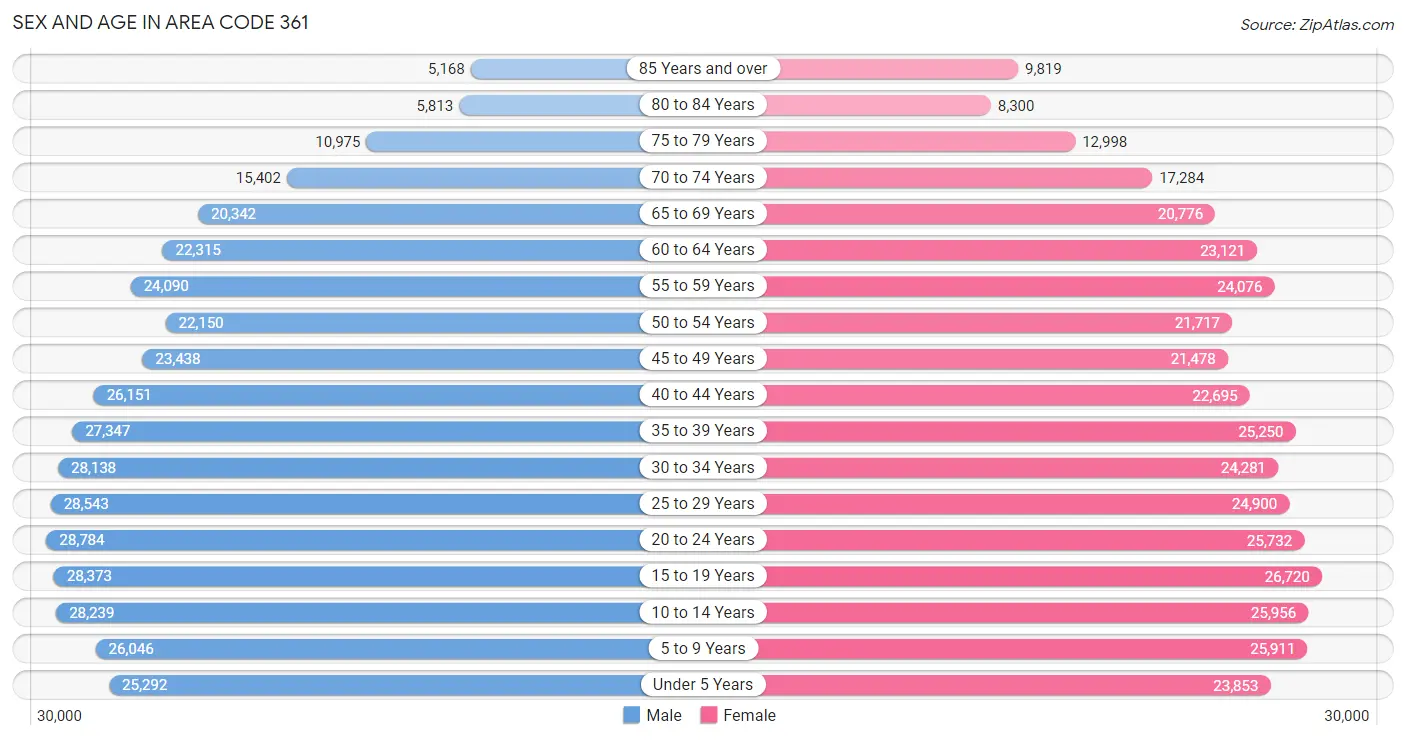
The most populous age groups in Area Code 361 are 20 to 24 Years (28,784 | 7.3%) for men and 15 to 19 Years (26,720 | 6.9%) for women.
| Age Bracket | Male | Female |
| Under 5 Years | 25,292 (6.4%) | 23,853 (6.2%) |
| 5 to 9 Years | 26,046 (6.6%) | 25,911 (6.7%) |
| 10 to 14 Years | 28,239 (7.1%) | 25,956 (6.7%) |
| 15 to 19 Years | 28,373 (7.1%) | 26,720 (6.9%) |
| 20 to 24 Years | 28,784 (7.3%) | 25,732 (6.7%) |
| 25 to 29 Years | 28,543 (7.2%) | 24,900 (6.5%) |
| 30 to 34 Years | 28,138 (7.1%) | 24,281 (6.3%) |
| 35 to 39 Years | 27,347 (6.9%) | 25,250 (6.6%) |
| 40 to 44 Years | 26,151 (6.6%) | 22,695 (5.9%) |
| 45 to 49 Years | 23,438 (5.9%) | 21,478 (5.6%) |
| 50 to 54 Years | 22,150 (5.6%) | 21,717 (5.6%) |
| 55 to 59 Years | 24,090 (6.1%) | 24,076 (6.3%) |
| 60 to 64 Years | 22,315 (5.6%) | 23,121 (6.0%) |
| 65 to 69 Years | 20,342 (5.1%) | 20,776 (5.4%) |
| 70 to 74 Years | 15,402 (3.9%) | 17,284 (4.5%) |
| 75 to 79 Years | 10,975 (2.8%) | 12,998 (3.4%) |
| 80 to 84 Years | 5,813 (1.5%) | 8,300 (2.2%) |
| 85 Years and over | 5,168 (1.3%) | 9,819 (2.5%) |
| Total | 396,606 (100.0%) | 384,867 (100.0%) |
Families and Households in Area Code 361
Median Family Size in Area Code 361
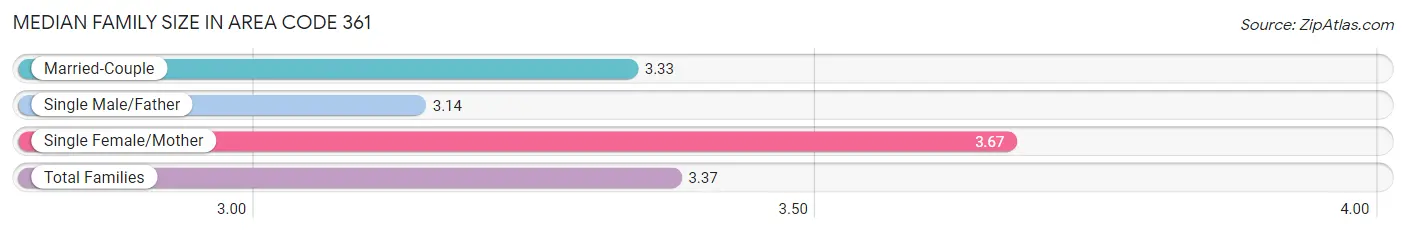
The median family size in Area Code 361 is 3.37 persons per family, with single female/mother families (42,736 | 22.2%) accounting for the largest median family size of 3.66947 persons per family. On the other hand, single male/father families (15,981 | 8.3%) represent the smallest median family size with 3.14 persons per family.
| Family Type | # Families | Family Size |
| Married-Couple | 134,012 (69.5%) | 3.33 |
| Single Male/Father | 15,981 (8.3%) | 3.14 |
| Single Female/Mother | 42,736 (22.2%) | 3.67 |
| Total Families | 192,729 (100.0%) | 3.37 |
Median Household Size in Area Code 361
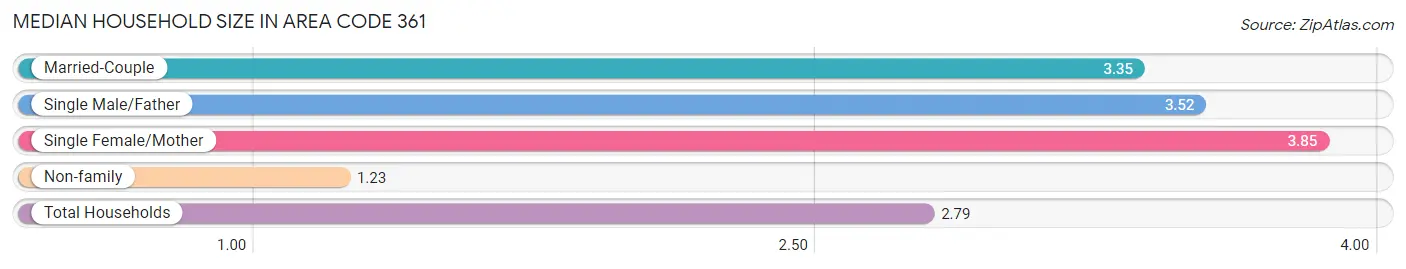
The median household size in Area Code 361 is 2.79 persons per household, with single female/mother households (42,736 | 15.1%) accounting for the largest median household size of 3.8451 persons per household. non-family households (91,077 | 32.1%) represent the smallest median household size with 1.23 persons per household.
| Household Type | # Households | Household Size |
| Married-Couple | 134,012 (47.2%) | 3.35 |
| Single Male/Father | 15,981 (5.6%) | 3.52 |
| Single Female/Mother | 42,736 (15.1%) | 3.85 |
| Non-family | 91,077 (32.1%) | 1.23 |
| Total Households | 283,806 (100.0%) | 2.79 |
Household Size by Marriage Status in Area Code 361
Out of a total of 283,806 households in Area Code 361, 192,729 (67.9%) are family households, while 91,077 (32.1%) are nonfamily households. The most numerous type of family households are 2-person households, comprising 82,564, and the most common type of nonfamily households are 1-person households, comprising 75,056.
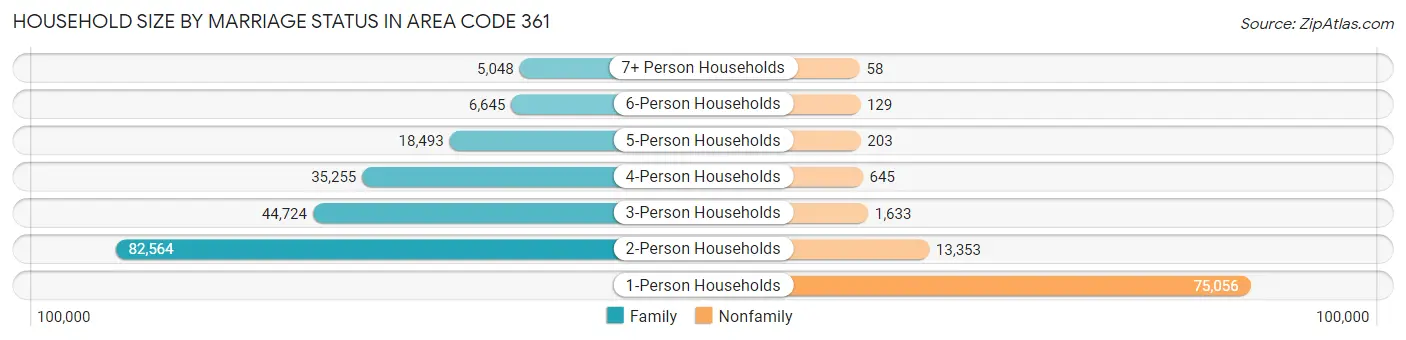
| Household Size | Family Households | Nonfamily Households |
| 1-Person Households | - | 75,056 (26.5%) |
| 2-Person Households | 82,564 (29.1%) | 13,353 (4.7%) |
| 3-Person Households | 44,724 (15.8%) | 1,633 (0.6%) |
| 4-Person Households | 35,255 (12.4%) | 645 (0.2%) |
| 5-Person Households | 18,493 (6.5%) | 203 (0.1%) |
| 6-Person Households | 6,645 (2.3%) | 129 (0.1%) |
| 7+ Person Households | 5,048 (1.8%) | 58 (0.0%) |
| Total | 192,729 (67.9%) | 91,077 (32.1%) |
Female Fertility in Area Code 361
Fertility by Age in Area Code 361
Average fertility rate in Area Code 361 is 140.5 births per 1,000 women. Women in the age bracket of 20 to 34 years have the highest fertility rate with 234.6 births per 1,000 women. Women in the age bracket of 20 to 34 years acount for 71.1% of all women with births.
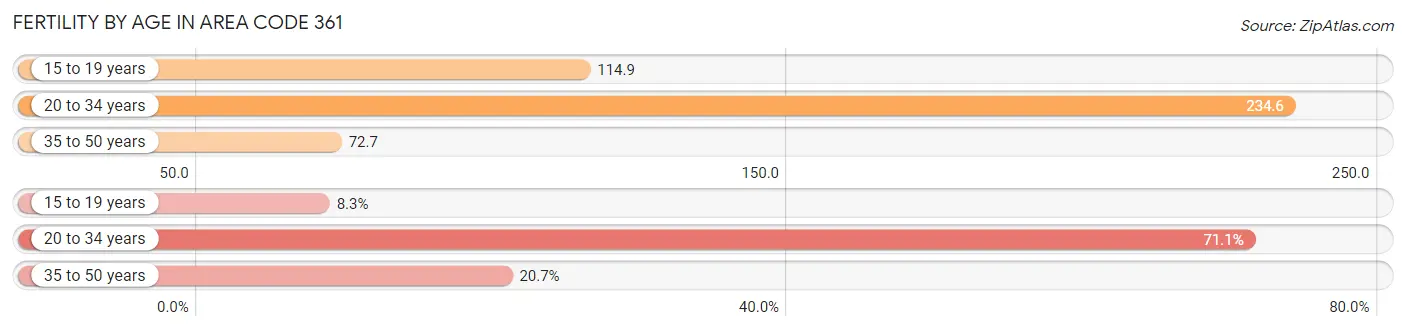
| Age Bracket | Women with Births | Births / 1,000 Women |
| 15 to 19 years | 862 (8.3%) | 114.8 |
| 20 to 34 years | 7,423 (71.1%) | 234.6 |
| 35 to 50 years | 2,157 (20.7%) | 72.7 |
| Total | 10,442 (100.0%) | 140.5 |
Fertility by Age by Marriage Status in Area Code 361
43.6% of women with births (10,442) in Area Code 361 are married. The highest percentage of unmarried women with births falls into 15 to 19 years age bracket with 90.4% of them unmarried at the time of birth, while the lowest percentage of unmarried women with births belong to 35 to 50 years age bracket with 51.7% of them unmarried.
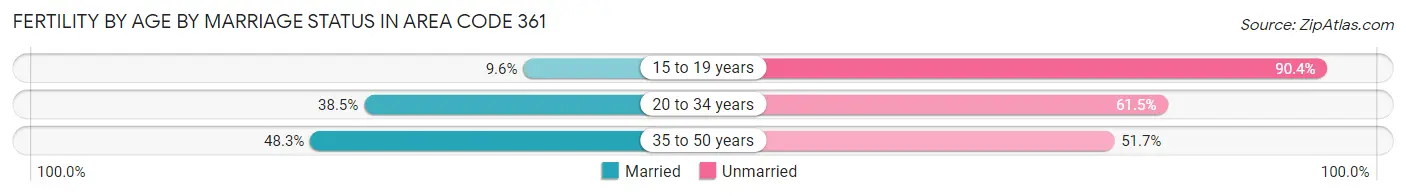
| Age Bracket | Married | Unmarried |
| 15 to 19 years | 83 (9.6%) | 779 (90.4%) |
| 20 to 34 years | 2,856 (38.5%) | 4,567 (61.5%) |
| 35 to 50 years | 1,041 (48.3%) | 1,116 (51.7%) |
| Total | 4,550 (43.6%) | 5,892 (56.4%) |
Fertility by Education in Area Code 361
Average fertility rate in Area Code 361 is 140.5 births per 1,000 women. Women with the education attainment of graduate degree have the highest fertility rate of 215.5 births per 1,000 women, while women with the education attainment of less than high school have the lowest fertility at 118.4 births per 1,000 women. Women with the education attainment of college or associate's degree represent 36.8% of all women with births.
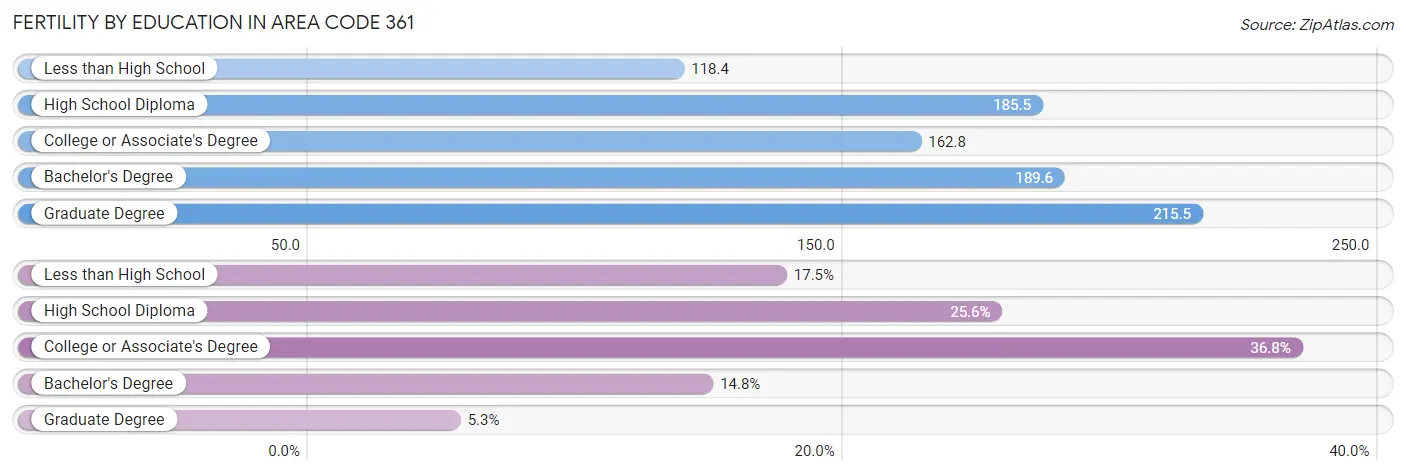
| Educational Attainment | Women with Births | Births / 1,000 Women |
| Less than High School | 1,829 (17.5%) | 118.4 |
| High School Diploma | 2,672 (25.6%) | 185.5 |
| College or Associate's Degree | 3,847 (36.8%) | 162.8 |
| Bachelor's Degree | 1,541 (14.8%) | 189.6 |
| Graduate Degree | 553 (5.3%) | 215.5 |
| Total | 10,442 (100.0%) | 140.5 |
Fertility by Education by Marriage Status in Area Code 361
56.4% of women with births in Area Code 361 are unmarried. Women with the educational attainment of graduate degree are most likely to be married with 75.9% of them married at childbirth, while women with the educational attainment of less than high school are least likely to be married with 82.2% of them unmarried at childbirth.
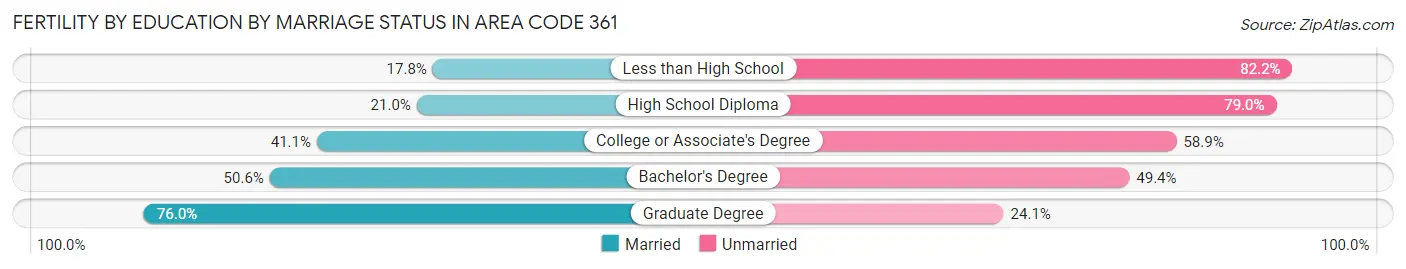
| Educational Attainment | Married | Unmarried |
| Less than High School | 325 (17.8%) | 1,504 (82.2%) |
| High School Diploma | 561 (21.0%) | 2,111 (79.0%) |
| College or Associate's Degree | 1,582 (41.1%) | 2,265 (58.9%) |
| Bachelor's Degree | 780 (50.6%) | 761 (49.4%) |
| Graduate Degree | 420 (75.9%) | 133 (24.0%) |
| Total | 4,550 (43.6%) | 5,892 (56.4%) |
Employment Characteristics in Area Code 361
Employment by Class of Employer in Area Code 361
Among the 335,123 employed individuals in Area Code 361, private company employees (227,238 | 67.8%), local government employees (29,895 | 8.9%), and self-employed (not incorporated) (24,116 | 7.2%) make up the most common classes of employment.
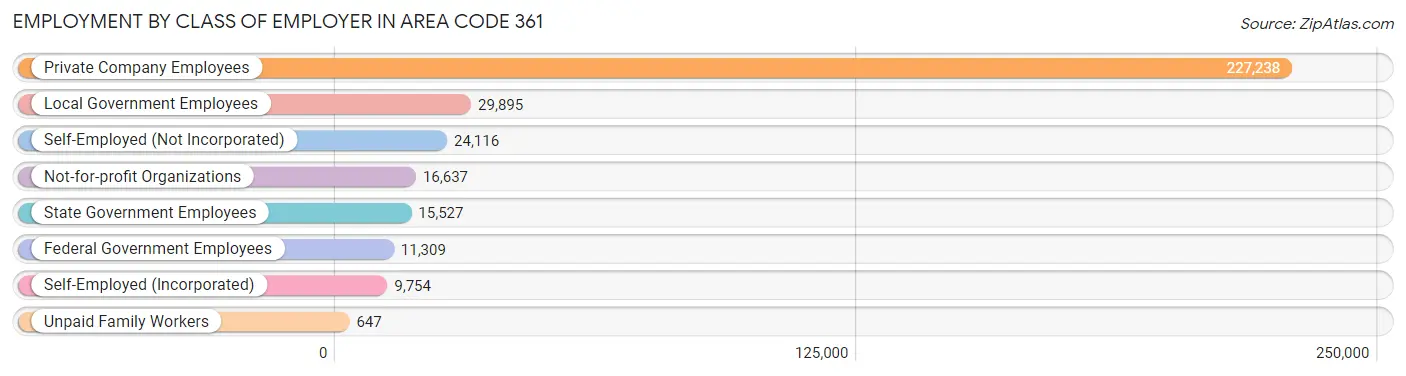
| Employer Class | # Employees | % Employees |
| Private Company Employees | 227,238 | 67.8% |
| Self-Employed (Incorporated) | 9,754 | 2.9% |
| Self-Employed (Not Incorporated) | 24,116 | 7.2% |
| Not-for-profit Organizations | 16,637 | 5.0% |
| Local Government Employees | 29,895 | 8.9% |
| State Government Employees | 15,527 | 4.6% |
| Federal Government Employees | 11,309 | 3.4% |
| Unpaid Family Workers | 647 | 0.2% |
| Total | 335,123 | 100.0% |
Employment Status by Age in Area Code 361
According to the labor force statistics for Area Code 361, out of the total population over 16 years of age (614,721), 54.7% or 336,068 individuals are in the labor force, with 6.0% or 20,198 of them unemployed. The age group with the highest labor force participation rate is 35 to 44 years, with 77.8% or 78,963 individuals in the labor force. Within the labor force, the 16 to 19 years age range has the highest percentage of unemployed individuals, with 1,116.3% or 162,165 of them being unemployed.
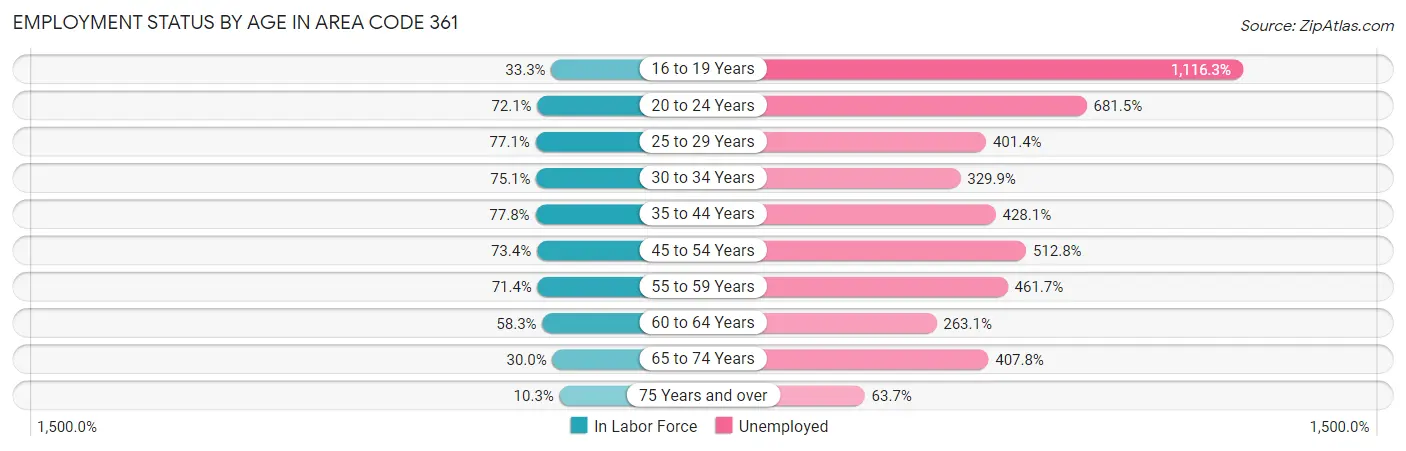
| Age Bracket | In Labor Force | Unemployed |
| 16 to 19 Years | 14,527 (33.3%) | 162,165 (1,116.3%) |
| 20 to 24 Years | 39,322 (72.1%) | 267,979 (681.5%) |
| 25 to 29 Years | 41,196 (77.1%) | 165,353 (401.4%) |
| 30 to 34 Years | 39,381 (75.1%) | 129,921 (329.9%) |
| 35 to 44 Years | 78,962 (77.8%) | 338,041 (428.1%) |
| 45 to 54 Years | 65,163 (73.4%) | 334,176 (512.8%) |
| 55 to 59 Years | 34,394 (71.4%) | 158,802 (461.7%) |
| 60 to 64 Years | 26,468 (58.3%) | 69,632 (263.1%) |
| 65 to 74 Years | 22,147 (30.0%) | 90,324 (407.8%) |
| 75 Years and over | 5,449 (10.3%) | 3,472 (63.7%) |
| Total | 336,047 (54.7%) | 20,211 (6.0%) |
Employment Status by Educational Attainment in Area Code 361
According to labor force statistics for Area Code 361, 69.7% of individuals (271,614) out of the total population between 25 and 64 years of age (389,690) are in the labor force, with 472.4% or 1,283,105 of them being unemployed. The group with the highest labor force participation rate are those with the educational attainment of bachelor's degree or higher, with 83.0% or 63,823 individuals in the labor force. Within the labor force, individuals with less than high school education have the highest percentage of unemployment, with 752.2% or 261,104 of them being unemployed.
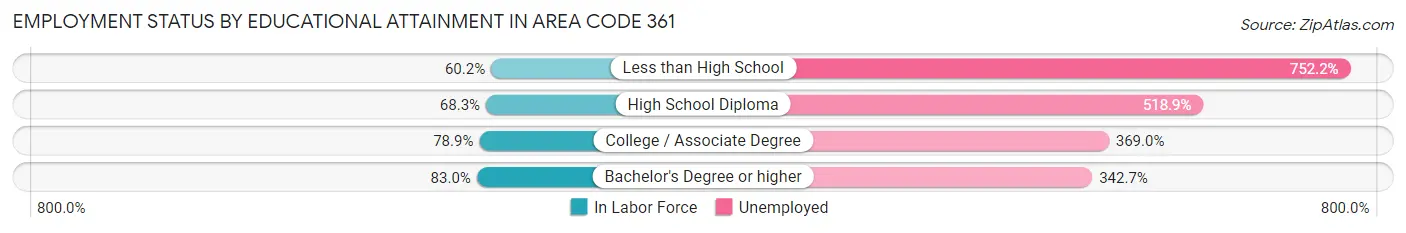
| Educational Attainment | In Labor Force | Unemployed |
| Less than High School | 34,715 (60.2%) | 433,515 (752.2%) |
| High School Diploma | 86,223 (68.3%) | 655,111 (518.9%) |
| College / Associate Degree | 101,698 (78.9%) | 475,752 (369.0%) |
| Bachelor's Degree or higher | 63,822 (83.0%) | 263,457 (342.7%) |
| Total | 271,596 (69.7%) | 1,840,896 (472.4%) |
Employment Occupations by Sex in Area Code 361
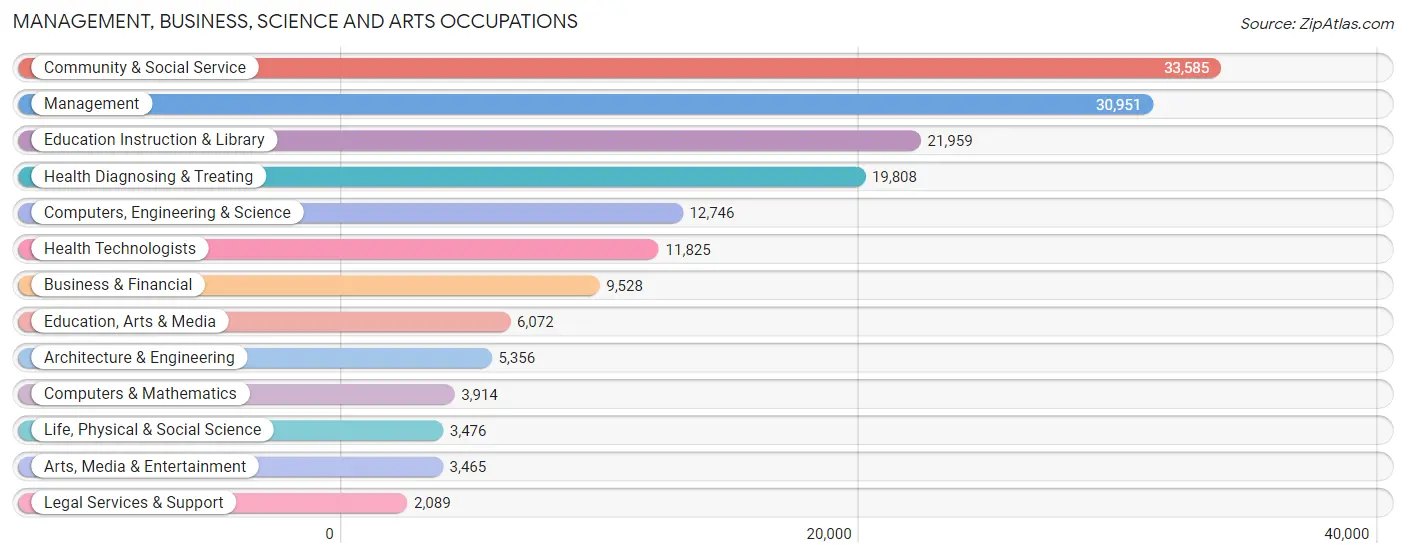
Management, Business, Science and Arts Occupations
The most common Management, Business, Science and Arts occupations in Area Code 361 are Community & Social Service (33,585 | 9.9%), Management (30,951 | 9.2%), Education Instruction & Library (21,959 | 6.5%), Health Diagnosing & Treating (19,808 | 5.9%), and Computers, Engineering & Science (12,746 | 3.8%).
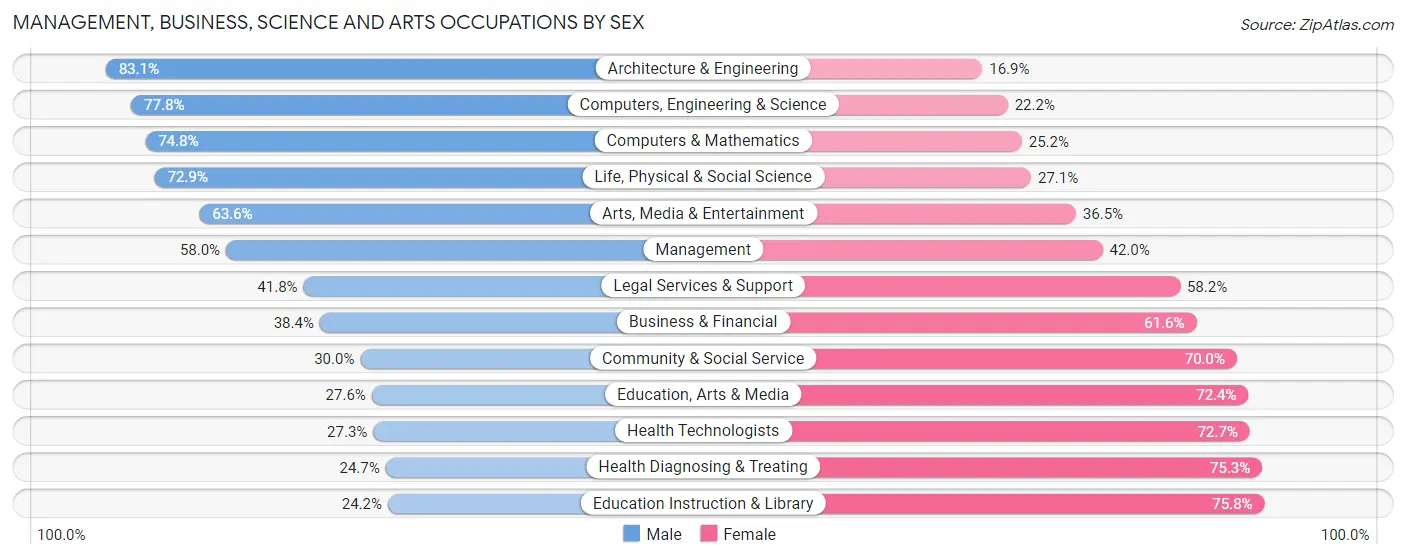
Management, Business, Science and Arts Occupations by Sex
Within the Management, Business, Science and Arts occupations in Area Code 361, the most male-oriented occupations are Architecture & Engineering (83.1%), Computers, Engineering & Science (77.8%), and Computers & Mathematics (74.8%), while the most female-oriented occupations are Education Instruction & Library (75.8%), Health Diagnosing & Treating (75.3%), and Health Technologists (72.7%).
| Occupation | Male | Female |
| Management | 17,951 (58.0%) | 13,000 (42.0%) |
| Business & Financial | 3,662 (38.4%) | 5,866 (61.6%) |
| Computers, Engineering & Science | 9,912 (77.8%) | 2,834 (22.2%) |
| Computers & Mathematics | 2,929 (74.8%) | 985 (25.2%) |
| Architecture & Engineering | 4,449 (83.1%) | 907 (16.9%) |
| Life, Physical & Social Science | 2,534 (72.9%) | 942 (27.1%) |
| Community & Social Service | 10,073 (30.0%) | 23,512 (70.0%) |
| Education, Arts & Media | 1,676 (27.6%) | 4,396 (72.4%) |
| Legal Services & Support | 874 (41.8%) | 1,215 (58.2%) |
| Education Instruction & Library | 5,321 (24.2%) | 16,638 (75.8%) |
| Arts, Media & Entertainment | 2,202 (63.5%) | 1,263 (36.4%) |
| Health Diagnosing & Treating | 4,894 (24.7%) | 14,914 (75.3%) |
| Health Technologists | 3,227 (27.3%) | 8,598 (72.7%) |
| Total (Category) | 46,492 (43.6%) | 60,126 (56.4%) |
| Total (Overall) | 184,014 (54.5%) | 153,851 (45.5%) |
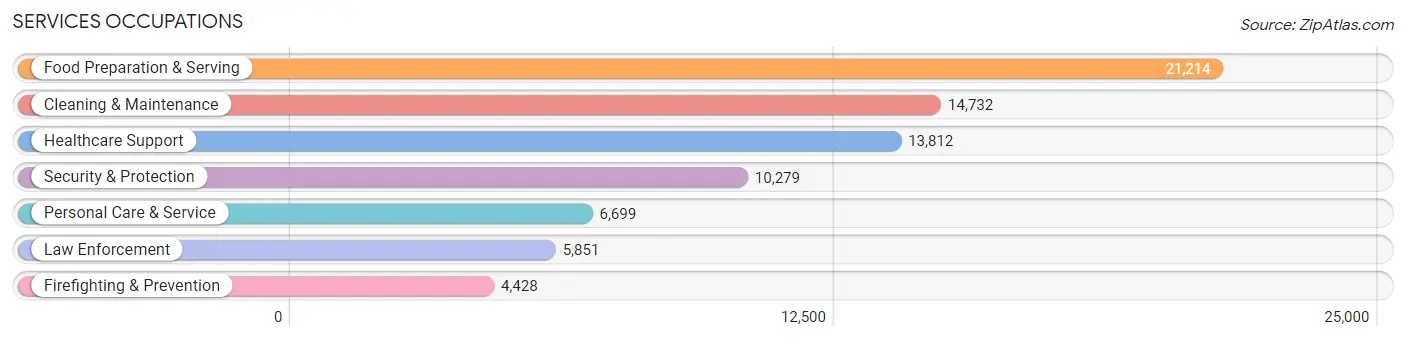
Services Occupations
The most common Services occupations in Area Code 361 are Food Preparation & Serving (21,214 | 6.3%), Cleaning & Maintenance (14,732 | 4.4%), Healthcare Support (13,812 | 4.1%), Security & Protection (10,279 | 3.0%), and Personal Care & Service (6,699 | 2.0%).
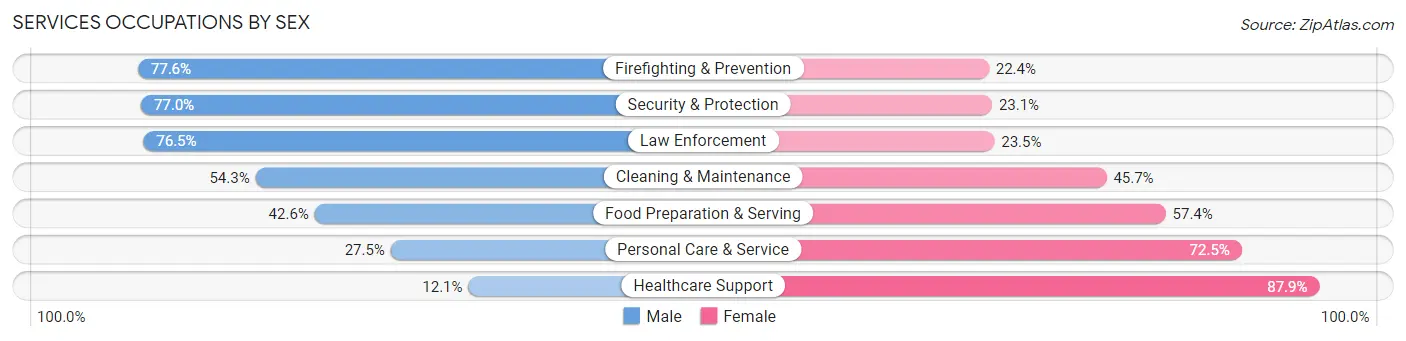
Services Occupations by Sex
Within the Services occupations in Area Code 361, the most male-oriented occupations are Firefighting & Prevention (77.6%), Security & Protection (76.9%), and Law Enforcement (76.5%), while the most female-oriented occupations are Healthcare Support (87.9%), Personal Care & Service (72.5%), and Food Preparation & Serving (57.4%).
| Occupation | Male | Female |
| Healthcare Support | 1,676 (12.1%) | 12,136 (87.9%) |
| Security & Protection | 7,910 (76.9%) | 2,369 (23.1%) |
| Firefighting & Prevention | 3,435 (77.6%) | 993 (22.4%) |
| Law Enforcement | 4,475 (76.5%) | 1,376 (23.5%) |
| Food Preparation & Serving | 9,029 (42.6%) | 12,185 (57.4%) |
| Cleaning & Maintenance | 7,996 (54.3%) | 6,736 (45.7%) |
| Personal Care & Service | 1,843 (27.5%) | 4,856 (72.5%) |
| Total (Category) | 28,454 (42.6%) | 38,282 (57.4%) |
| Total (Overall) | 184,014 (54.5%) | 153,851 (45.5%) |
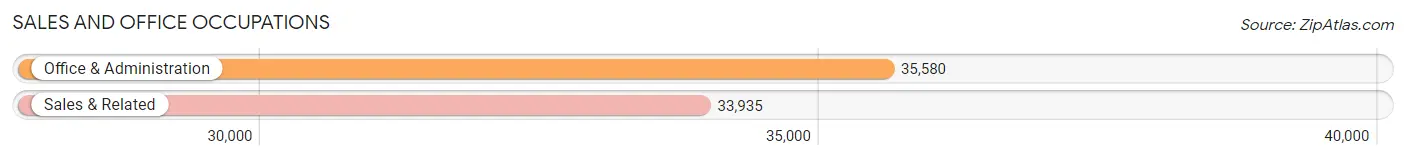
Sales and Office Occupations
The most common Sales and Office occupations in Area Code 361 are Office & Administration (35,580 | 10.5%), and Sales & Related (33,935 | 10.0%).
Sales and Office Occupations by Sex
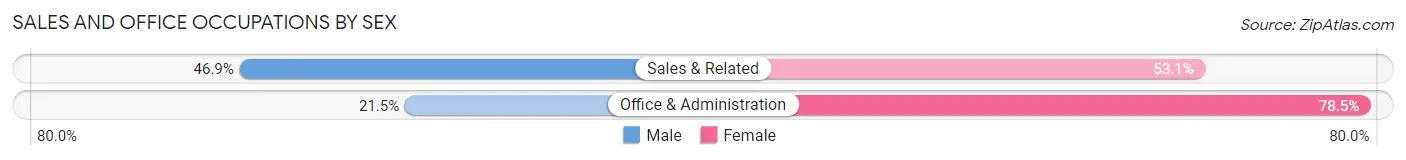
| Occupation | Male | Female |
| Sales & Related | 15,921 (46.9%) | 18,014 (53.1%) |
| Office & Administration | 7,640 (21.5%) | 27,940 (78.5%) |
| Total (Category) | 23,561 (33.9%) | 45,954 (66.1%) |
| Total (Overall) | 184,014 (54.5%) | 153,851 (45.5%) |
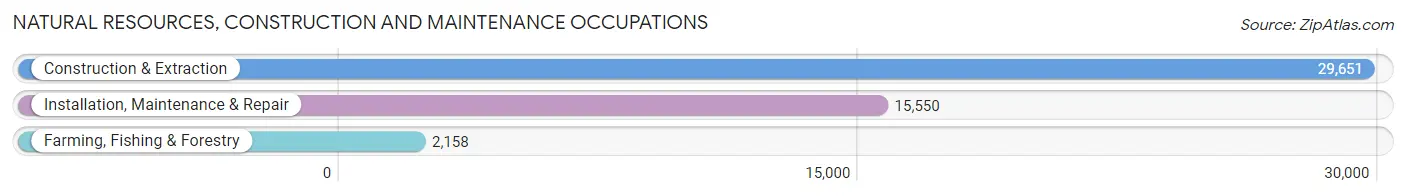
Natural Resources, Construction and Maintenance Occupations
The most common Natural Resources, Construction and Maintenance occupations in Area Code 361 are Construction & Extraction (29,651 | 8.8%), Installation, Maintenance & Repair (15,550 | 4.6%), and Farming, Fishing & Forestry (2,158 | 0.6%).
Natural Resources, Construction and Maintenance Occupations by Sex
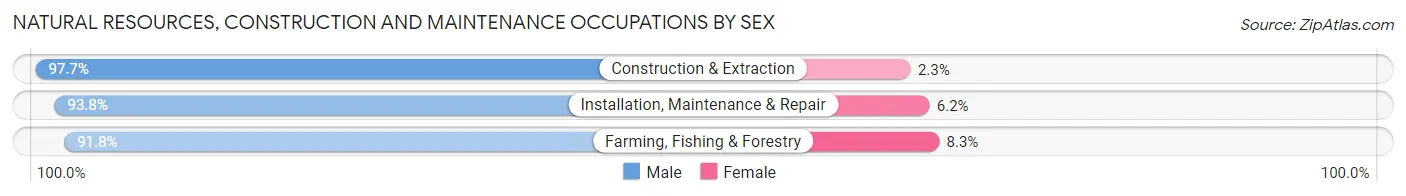
| Occupation | Male | Female |
| Farming, Fishing & Forestry | 1,980 (91.7%) | 178 (8.3%) |
| Construction & Extraction | 28,969 (97.7%) | 682 (2.3%) |
| Installation, Maintenance & Repair | 14,582 (93.8%) | 968 (6.2%) |
| Total (Category) | 45,531 (96.1%) | 1,828 (3.9%) |
| Total (Overall) | 184,014 (54.5%) | 153,851 (45.5%) |
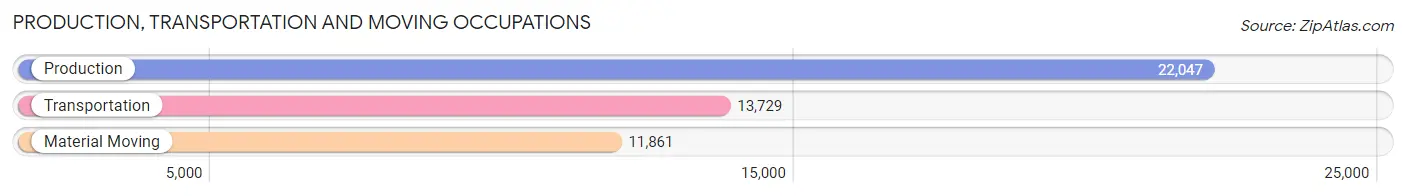
Production, Transportation and Moving Occupations
The most common Production, Transportation and Moving occupations in Area Code 361 are Production (22,047 | 6.5%), Transportation (13,729 | 4.1%), and Material Moving (11,861 | 3.5%).
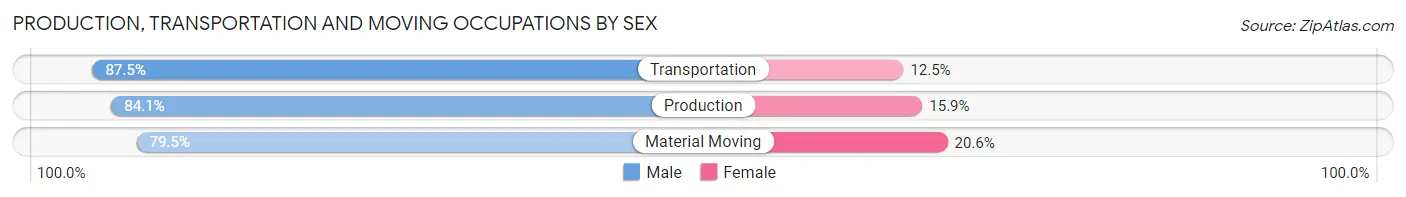
Production, Transportation and Moving Occupations by Sex
| Occupation | Male | Female |
| Production | 18,535 (84.1%) | 3,512 (15.9%) |
| Transportation | 12,018 (87.5%) | 1,711 (12.5%) |
| Material Moving | 9,423 (79.4%) | 2,438 (20.5%) |
| Total (Category) | 39,976 (83.9%) | 7,661 (16.1%) |
| Total (Overall) | 184,014 (54.5%) | 153,851 (45.5%) |
Employment Industries by Sex in Area Code 361
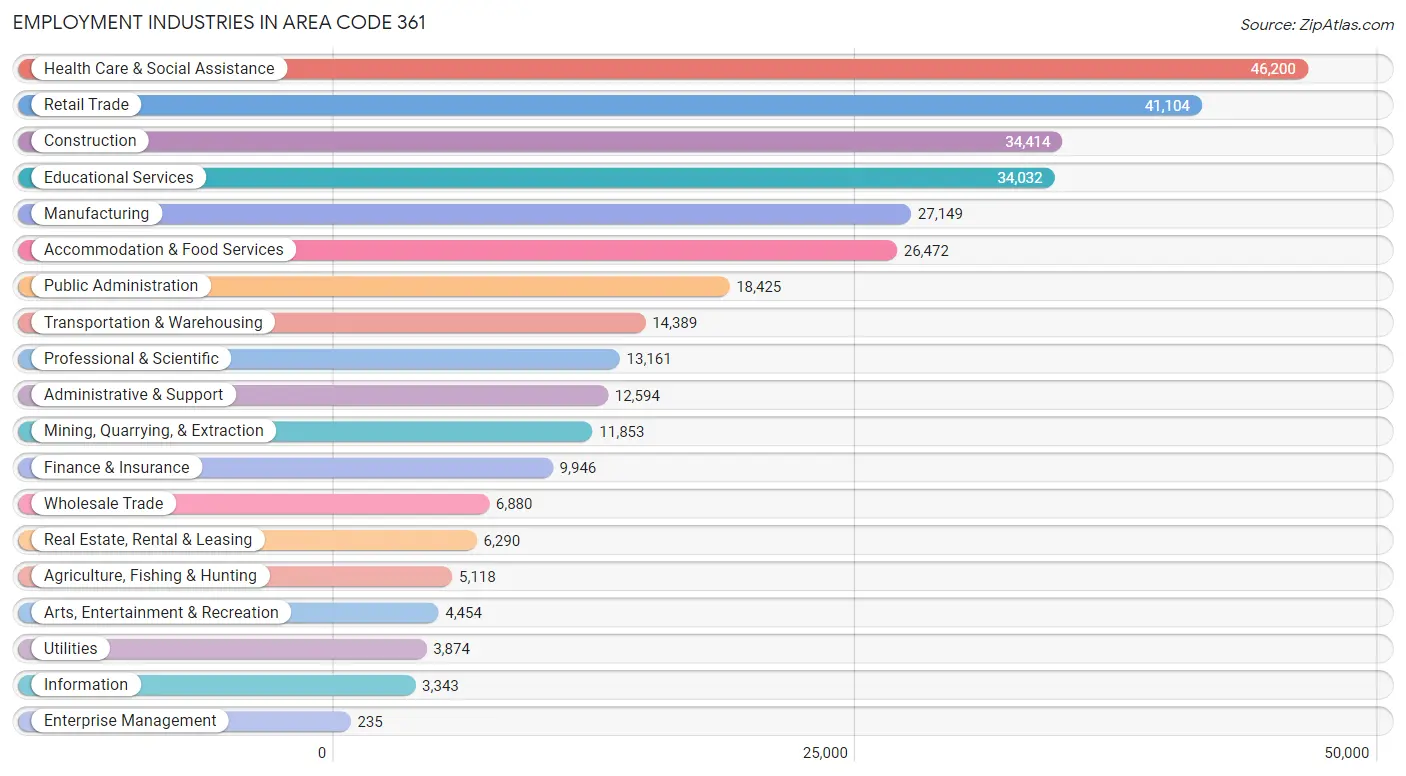
Employment Industries in Area Code 361
The major employment industries in Area Code 361 include Health Care & Social Assistance (46,200 | 13.7%), Retail Trade (41,104 | 12.2%), Construction (34,414 | 10.2%), Educational Services (34,032 | 10.1%), and Manufacturing (27,149 | 8.0%).
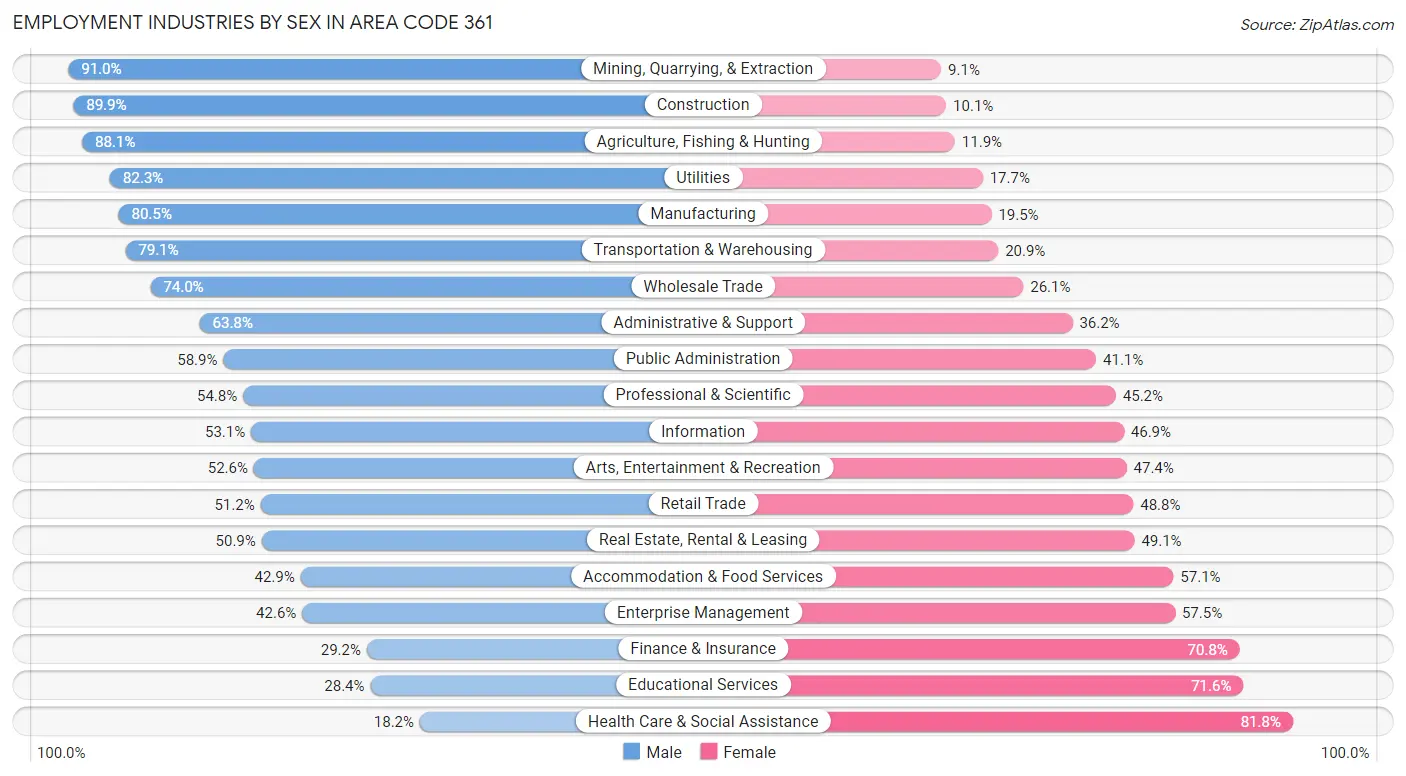
Employment Industries by Sex in Area Code 361
The Area Code 361 industries that see more men than women are Mining, Quarrying, & Extraction (90.9%), Construction (89.9%), and Agriculture, Fishing & Hunting (88.1%), whereas the industries that tend to have a higher number of women are Health Care & Social Assistance (81.8%), Educational Services (71.6%), and Finance & Insurance (70.8%).
| Industry | Male | Female |
| Agriculture, Fishing & Hunting | 4,509 (88.1%) | 609 (11.9%) |
| Mining, Quarrying, & Extraction | 10,780 (90.9%) | 1,073 (9.0%) |
| Construction | 30,942 (89.9%) | 3,472 (10.1%) |
| Manufacturing | 21,866 (80.5%) | 5,283 (19.5%) |
| Wholesale Trade | 5,088 (74.0%) | 1,792 (26.1%) |
| Retail Trade | 21,039 (51.2%) | 20,065 (48.8%) |
| Transportation & Warehousing | 11,388 (79.1%) | 3,001 (20.9%) |
| Utilities | 3,190 (82.3%) | 684 (17.7%) |
| Information | 1,776 (53.1%) | 1,567 (46.9%) |
| Finance & Insurance | 2,901 (29.2%) | 7,045 (70.8%) |
| Real Estate, Rental & Leasing | 3,204 (50.9%) | 3,086 (49.1%) |
| Professional & Scientific | 7,211 (54.8%) | 5,950 (45.2%) |
| Enterprise Management | 100 (42.5%) | 135 (57.5%) |
| Administrative & Support | 8,031 (63.8%) | 4,563 (36.2%) |
| Educational Services | 9,675 (28.4%) | 24,357 (71.6%) |
| Health Care & Social Assistance | 8,397 (18.2%) | 37,803 (81.8%) |
| Arts, Entertainment & Recreation | 2,341 (52.6%) | 2,113 (47.4%) |
| Accommodation & Food Services | 11,351 (42.9%) | 15,121 (57.1%) |
| Public Administration | 10,847 (58.9%) | 7,578 (41.1%) |
| Total | 184,014 (54.5%) | 153,851 (45.5%) |
Education in Area Code 361
School Enrollment in Area Code 361
The most common levels of schooling among the 186,972 students in Area Code 361 are middle school (42,672 | 22.8%), high school (42,632 | 22.8%), and elementary school (39,033 | 20.9%).
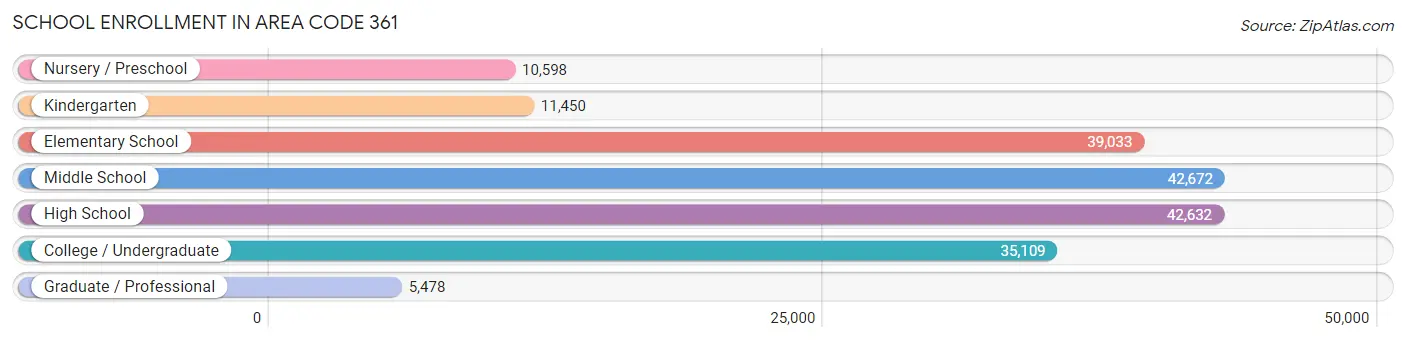
| School Level | # Students | % Students |
| Nursery / Preschool | 10,598 | 5.7% |
| Kindergarten | 11,450 | 6.1% |
| Elementary School | 39,033 | 20.9% |
| Middle School | 42,672 | 22.8% |
| High School | 42,632 | 22.8% |
| College / Undergraduate | 35,109 | 18.8% |
| Graduate / Professional | 5,478 | 2.9% |
| Total | 186,972 | 100.0% |
School Enrollment by Age by Funding Source in Area Code 361
Out of a total of 186,972 students who are enrolled in schools in Area Code 361, 17,866 (9.6%) attend a private institution, while the remaining 169,106 (90.4%) are enrolled in public schools. The age group of 3 to 4 year olds has the highest likelihood of being enrolled in private schools, with 2,338 (27.4% in the age bracket) enrolled. Conversely, the age group of 15 to 17 year olds has the lowest likelihood of being enrolled in a private school, with 28,861 (94.1% in the age bracket) attending a public institution.
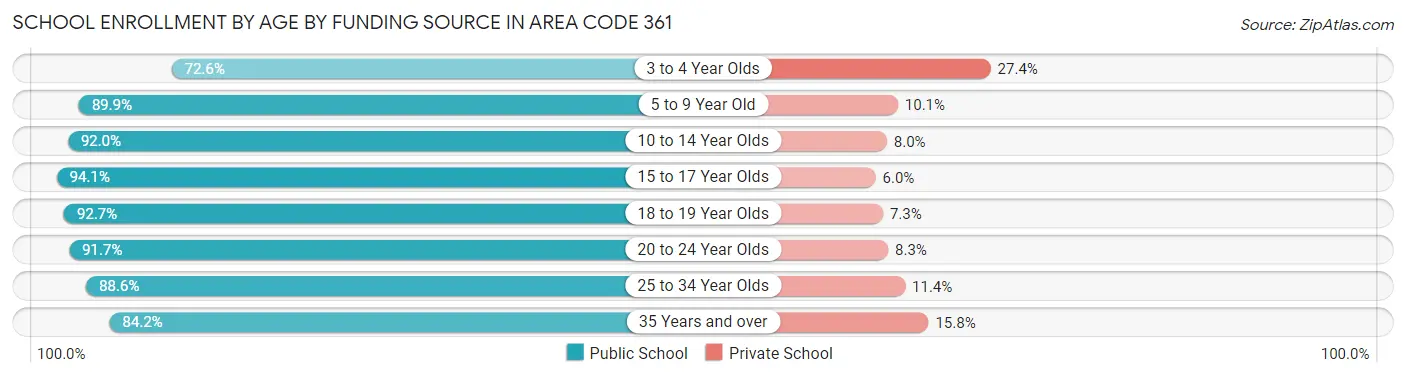
| Age Bracket | Public School | Private School |
| 3 to 4 Year Olds | 6,202 (72.6%) | 2,338 (27.4%) |
| 5 to 9 Year Old | 42,649 (89.9%) | 4,784 (10.1%) |
| 10 to 14 Year Olds | 47,951 (92.0%) | 4,191 (8.0%) |
| 15 to 17 Year Olds | 28,861 (94.1%) | 1,826 (5.9%) |
| 18 to 19 Year Olds | 13,278 (92.7%) | 1,049 (7.3%) |
| 20 to 24 Year Olds | 15,236 (91.7%) | 1,374 (8.3%) |
| 25 to 34 Year Olds | 8,469 (88.6%) | 1,094 (11.4%) |
| 35 Years and over | 6,458 (84.2%) | 1,212 (15.8%) |
| Total | 169,106 (90.4%) | 17,866 (9.6%) |
Educational Attainment by Field of Study in Area Code 361
Business (20,248 | 18.9%), education (20,066 | 18.8%), science & technology (10,825 | 10.1%), bio, nature & agricultural (8,121 | 7.6%), and arts & humanities (7,903 | 7.4%) are the most common fields of study among 107,020 individuals in Area Code 361 who have obtained a bachelor's degree or higher.
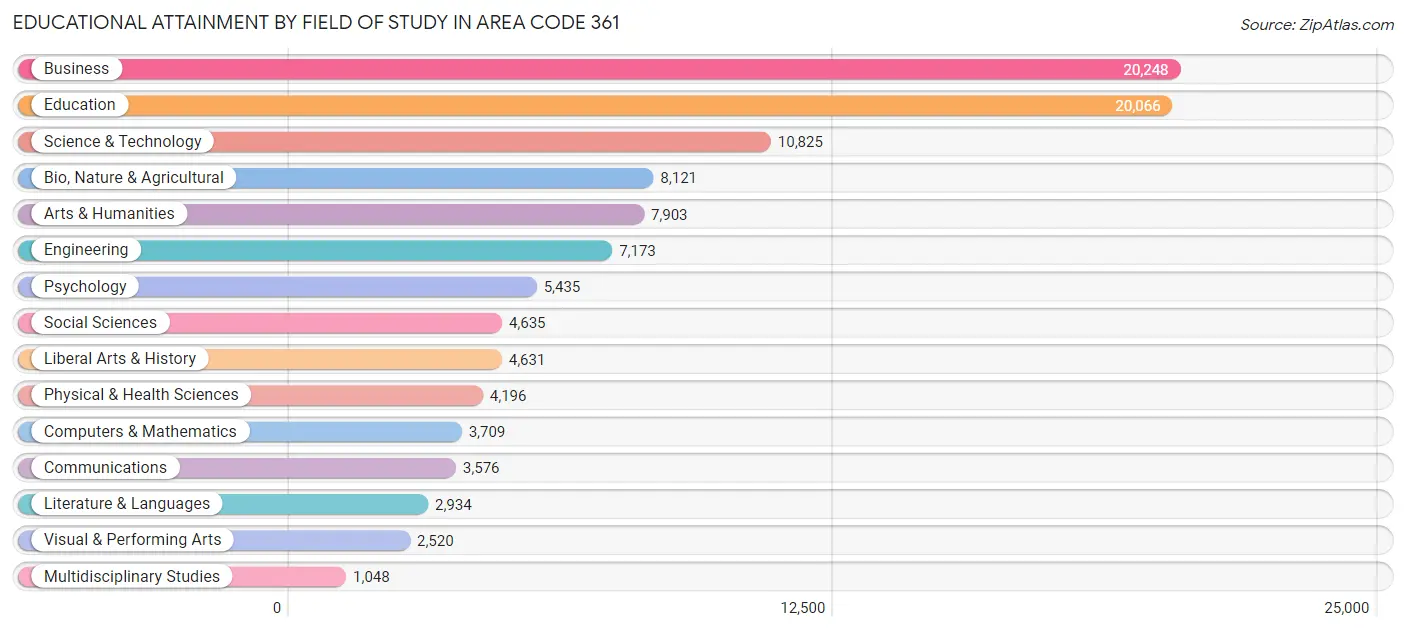
| Field of Study | # Graduates | % Graduates |
| Computers & Mathematics | 3,709 | 3.5% |
| Bio, Nature & Agricultural | 8,121 | 7.6% |
| Physical & Health Sciences | 4,196 | 3.9% |
| Psychology | 5,435 | 5.1% |
| Social Sciences | 4,635 | 4.3% |
| Engineering | 7,173 | 6.7% |
| Multidisciplinary Studies | 1,048 | 1.0% |
| Science & Technology | 10,825 | 10.1% |
| Business | 20,248 | 18.9% |
| Education | 20,066 | 18.8% |
| Literature & Languages | 2,934 | 2.7% |
| Liberal Arts & History | 4,631 | 4.3% |
| Visual & Performing Arts | 2,520 | 2.4% |
| Communications | 3,576 | 3.3% |
| Arts & Humanities | 7,903 | 7.4% |
| Total | 107,020 | 100.0% |
Transportation & Commute in Area Code 361
Vehicle Availability by Sex in Area Code 361
The most prevalent vehicle ownership categories in Area Code 361 are males with 2 vehicles (79,902, accounting for 43.6%) and females with 2 vehicles (61,630, making up 53.3%).
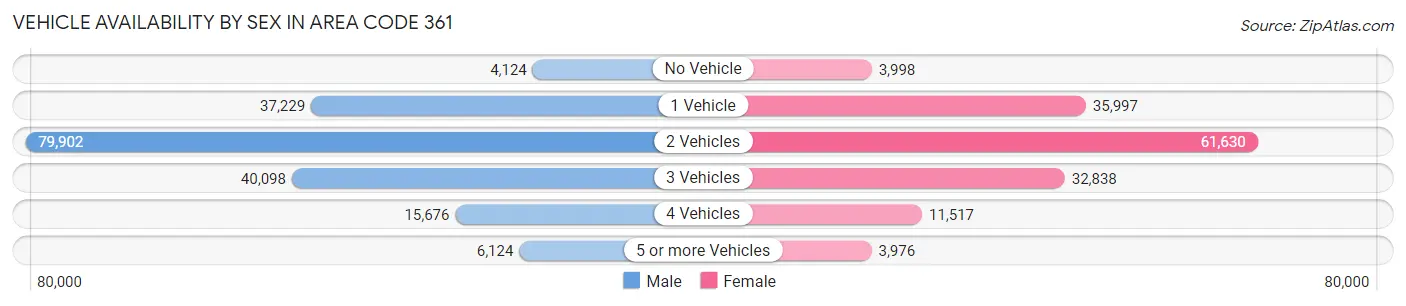
| Vehicles Available | Male | Female |
| No Vehicle | 4,124 (2.2%) | 3,998 (2.7%) |
| 1 Vehicle | 37,229 (20.3%) | 35,997 (24.0%) |
| 2 Vehicles | 79,902 (43.6%) | 61,630 (41.1%) |
| 3 Vehicles | 40,098 (21.9%) | 32,838 (21.9%) |
| 4 Vehicles | 15,676 (8.6%) | 11,517 (7.7%) |
| 5 or more Vehicles | 6,124 (3.3%) | 3,976 (2.6%) |
| Total | 183,153 (100.0%) | 149,956 (100.0%) |
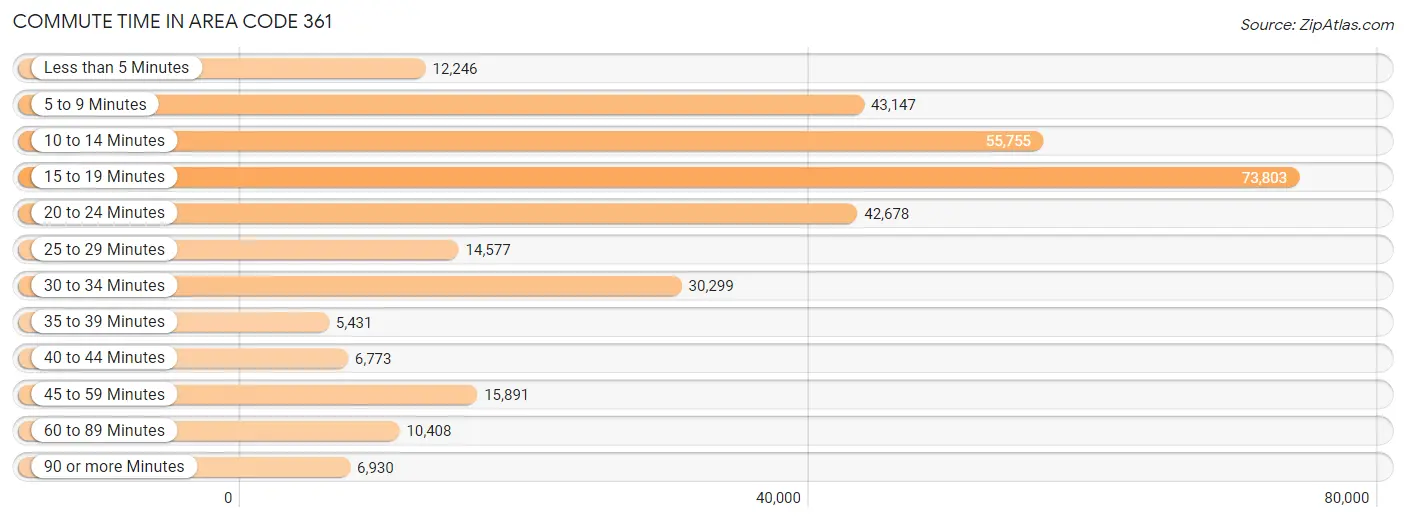
Commute Time in Area Code 361
The most frequently occuring commute durations in Area Code 361 are 15 to 19 minutes (73,803 commuters, 23.2%), 10 to 14 minutes (55,755 commuters, 17.5%), and 5 to 9 minutes (43,147 commuters, 13.6%).
| Commute Time | # Commuters | % Commuters |
| Less than 5 Minutes | 12,246 | 3.8% |
| 5 to 9 Minutes | 43,147 | 13.6% |
| 10 to 14 Minutes | 55,755 | 17.5% |
| 15 to 19 Minutes | 73,803 | 23.2% |
| 20 to 24 Minutes | 42,678 | 13.4% |
| 25 to 29 Minutes | 14,577 | 4.6% |
| 30 to 34 Minutes | 30,299 | 9.5% |
| 35 to 39 Minutes | 5,431 | 1.7% |
| 40 to 44 Minutes | 6,773 | 2.1% |
| 45 to 59 Minutes | 15,891 | 5.0% |
| 60 to 89 Minutes | 10,408 | 3.3% |
| 90 or more Minutes | 6,930 | 2.2% |
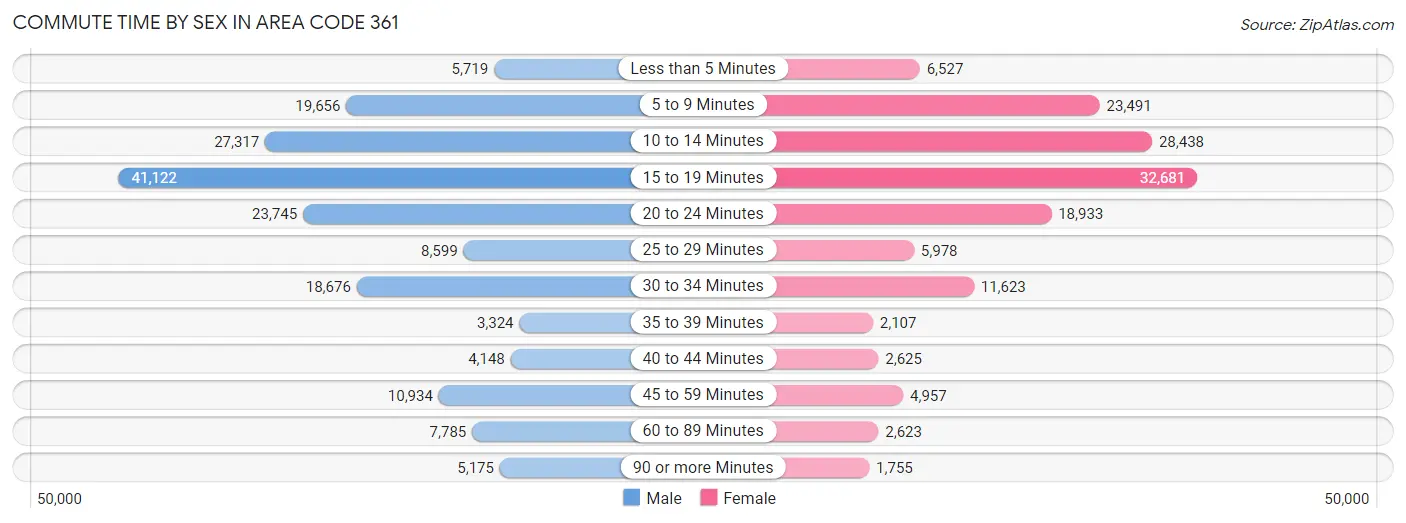
Commute Time by Sex in Area Code 361
The most common commute times in Area Code 361 are 15 to 19 minutes (41,122 commuters, 23.3%) for males and 15 to 19 minutes (32,681 commuters, 23.1%) for females.
| Commute Time | Male | Female |
| Less than 5 Minutes | 5,719 (3.3%) | 6,527 (4.6%) |
| 5 to 9 Minutes | 19,656 (11.2%) | 23,491 (16.6%) |
| 10 to 14 Minutes | 27,317 (15.5%) | 28,438 (20.1%) |
| 15 to 19 Minutes | 41,122 (23.3%) | 32,681 (23.1%) |
| 20 to 24 Minutes | 23,745 (13.5%) | 18,933 (13.4%) |
| 25 to 29 Minutes | 8,599 (4.9%) | 5,978 (4.2%) |
| 30 to 34 Minutes | 18,676 (10.6%) | 11,623 (8.2%) |
| 35 to 39 Minutes | 3,324 (1.9%) | 2,107 (1.5%) |
| 40 to 44 Minutes | 4,148 (2.4%) | 2,625 (1.8%) |
| 45 to 59 Minutes | 10,934 (6.2%) | 4,957 (3.5%) |
| 60 to 89 Minutes | 7,785 (4.4%) | 2,623 (1.8%) |
| 90 or more Minutes | 5,175 (2.9%) | 1,755 (1.2%) |
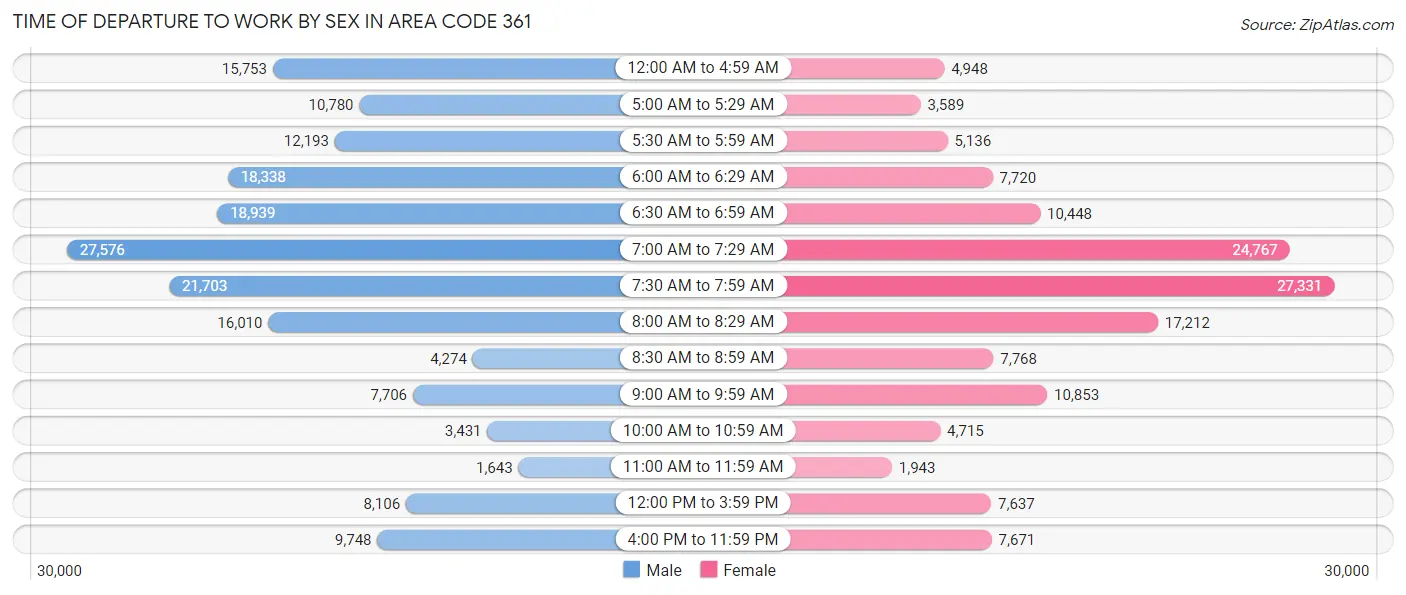
Time of Departure to Work by Sex in Area Code 361
The most frequent times of departure to work in Area Code 361 are 7:00 AM to 7:29 AM (27,576, 15.7%) for males and 7:30 AM to 7:59 AM (27,331, 19.3%) for females.
| Time of Departure | Male | Female |
| 12:00 AM to 4:59 AM | 15,753 (8.9%) | 4,948 (3.5%) |
| 5:00 AM to 5:29 AM | 10,780 (6.1%) | 3,589 (2.5%) |
| 5:30 AM to 5:59 AM | 12,193 (6.9%) | 5,136 (3.6%) |
| 6:00 AM to 6:29 AM | 18,338 (10.4%) | 7,720 (5.4%) |
| 6:30 AM to 6:59 AM | 18,939 (10.7%) | 10,448 (7.4%) |
| 7:00 AM to 7:29 AM | 27,576 (15.7%) | 24,767 (17.5%) |
| 7:30 AM to 7:59 AM | 21,703 (12.3%) | 27,331 (19.3%) |
| 8:00 AM to 8:29 AM | 16,010 (9.1%) | 17,212 (12.1%) |
| 8:30 AM to 8:59 AM | 4,274 (2.4%) | 7,768 (5.5%) |
| 9:00 AM to 9:59 AM | 7,706 (4.4%) | 10,853 (7.7%) |
| 10:00 AM to 10:59 AM | 3,431 (1.9%) | 4,715 (3.3%) |
| 11:00 AM to 11:59 AM | 1,643 (0.9%) | 1,943 (1.4%) |
| 12:00 PM to 3:59 PM | 8,106 (4.6%) | 7,637 (5.4%) |
| 4:00 PM to 11:59 PM | 9,748 (5.5%) | 7,671 (5.4%) |
| Total | 176,200 (100.0%) | 141,738 (100.0%) |
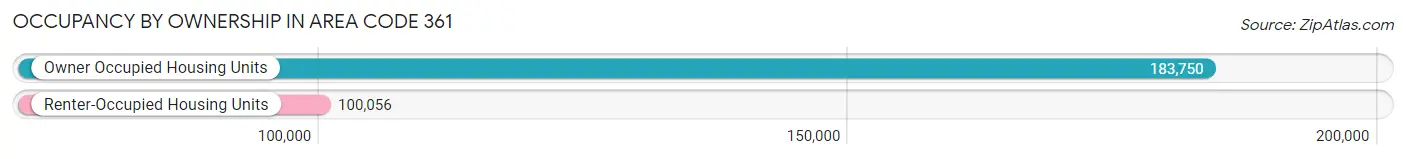
Housing Occupancy in Area Code 361
Occupancy by Ownership in Area Code 361
Of the total 283,806 dwellings in Area Code 361, owner-occupied units account for 183,750 (64.7%), while renter-occupied units make up 100,056 (35.3%).
| Occupancy | # Housing Units | % Housing Units |
| Owner Occupied Housing Units | 183,750 | 64.7% |
| Renter-Occupied Housing Units | 100,056 | 35.3% |
| Total Occupied Housing Units | 283,806 | 100.0% |
Occupancy by Household Size in Area Code 361
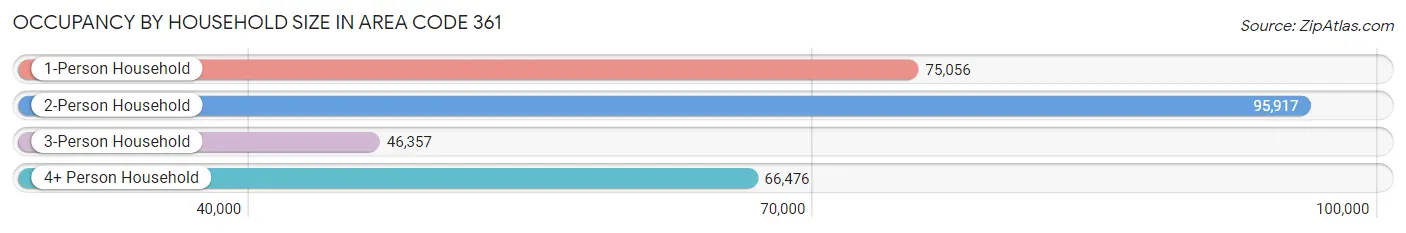
| Household Size | # Housing Units | % Housing Units |
| 1-Person Household | 75,056 | 26.5% |
| 2-Person Household | 95,917 | 33.8% |
| 3-Person Household | 46,357 | 16.3% |
| 4+ Person Household | 66,476 | 23.4% |
| Total Housing Units | 283,806 | 100.0% |
Occupancy by Ownership by Household Size in Area Code 361
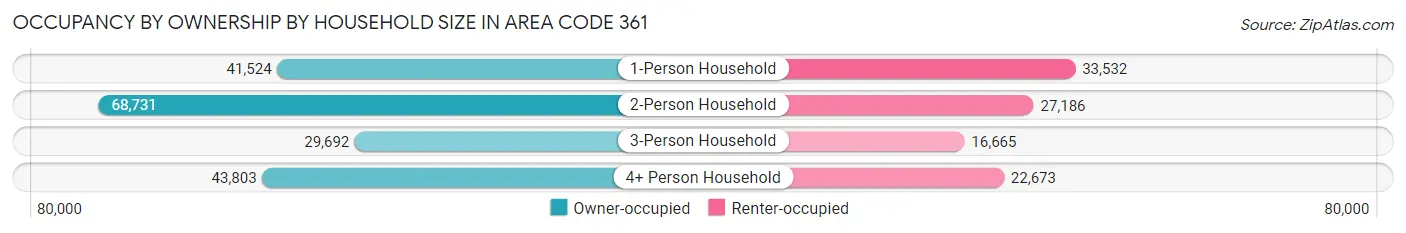
| Household Size | Owner-occupied | Renter-occupied |
| 1-Person Household | 41,524 (55.3%) | 33,532 (44.7%) |
| 2-Person Household | 68,731 (71.7%) | 27,186 (28.3%) |
| 3-Person Household | 29,692 (64.0%) | 16,665 (35.9%) |
| 4+ Person Household | 43,803 (65.9%) | 22,673 (34.1%) |
| Total Housing Units | 183,750 (64.7%) | 100,056 (35.3%) |
Occupancy by Educational Attainment in Area Code 361
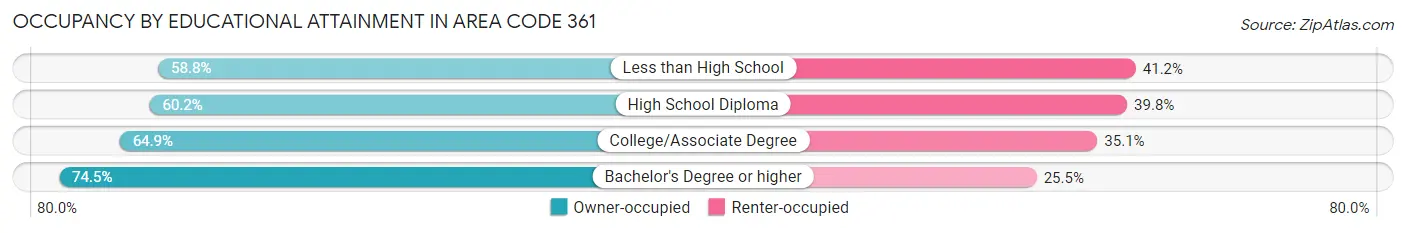
| Household Size | Owner-occupied | Renter-occupied |
| Less than High School | 25,100 (58.8%) | 17,581 (41.2%) |
| High School Diploma | 47,985 (60.2%) | 31,737 (39.8%) |
| College/Associate Degree | 64,963 (64.9%) | 35,116 (35.1%) |
| Bachelor's Degree or higher | 45,702 (74.5%) | 15,622 (25.5%) |
Occupancy by Age of Householder in Area Code 361
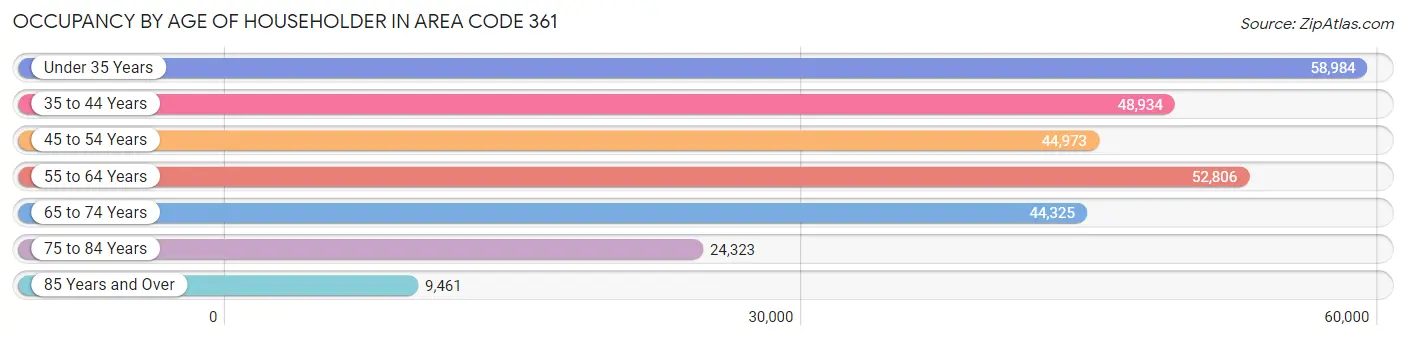
| Age Bracket | # Households | % Households |
| Under 35 Years | 58,984 | 20.8% |
| 35 to 44 Years | 48,934 | 17.2% |
| 45 to 54 Years | 44,973 | 15.9% |
| 55 to 64 Years | 52,806 | 18.6% |
| 65 to 74 Years | 44,325 | 15.6% |
| 75 to 84 Years | 24,323 | 8.6% |
| 85 Years and Over | 9,461 | 3.3% |
| Total | 283,806 | 100.0% |
Housing Finances in Area Code 361
Median Income by Occupancy in Area Code 361
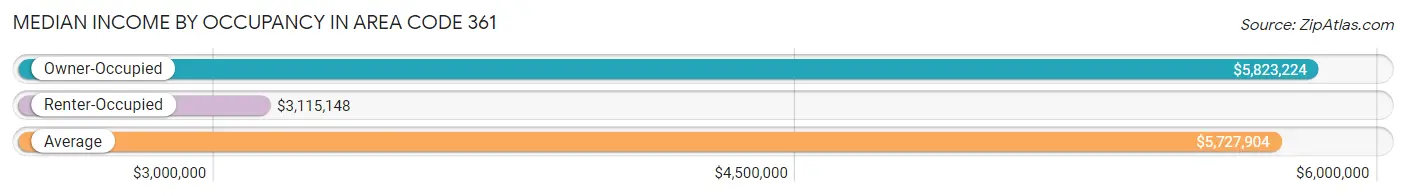
| Occupancy Type | # Households | Median Income |
| Owner-Occupied | 183,750 (64.7%) | $5,823,224 |
| Renter-Occupied | 100,056 (35.3%) | $3,115,148 |
| Average | 283,806 (100.0%) | $5,727,904 |
Occupancy by Householder Income Bracket in Area Code 361
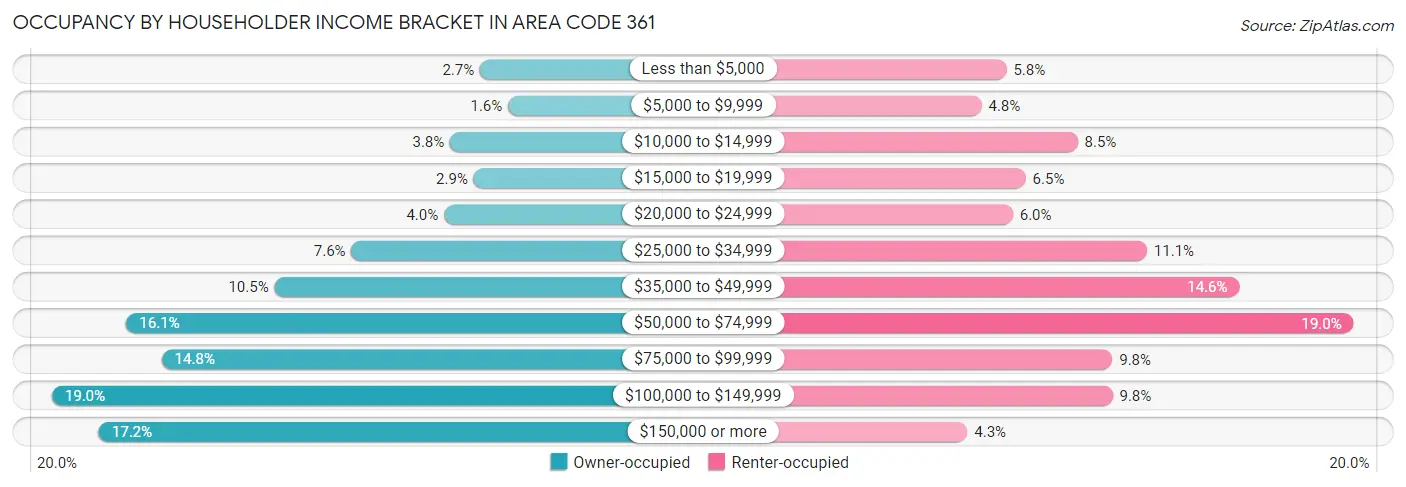
| Income Bracket | Owner-occupied | Renter-occupied |
| Less than $5,000 | 4,875 (2.6%) | 5,751 (5.8%) |
| $5,000 to $9,999 | 2,903 (1.6%) | 4,807 (4.8%) |
| $10,000 to $14,999 | 6,970 (3.8%) | 8,464 (8.5%) |
| $15,000 to $19,999 | 5,308 (2.9%) | 6,486 (6.5%) |
| $20,000 to $24,999 | 7,392 (4.0%) | 5,996 (6.0%) |
| $25,000 to $34,999 | 13,874 (7.5%) | 11,107 (11.1%) |
| $35,000 to $49,999 | 19,256 (10.5%) | 14,630 (14.6%) |
| $50,000 to $74,999 | 29,624 (16.1%) | 18,977 (19.0%) |
| $75,000 to $99,999 | 27,162 (14.8%) | 9,782 (9.8%) |
| $100,000 to $149,999 | 34,845 (19.0%) | 9,795 (9.8%) |
| $150,000 or more | 31,541 (17.2%) | 4,261 (4.3%) |
| Total | 183,750 (100.0%) | 100,056 (100.0%) |
Monthly Housing Cost Tiers in Area Code 361
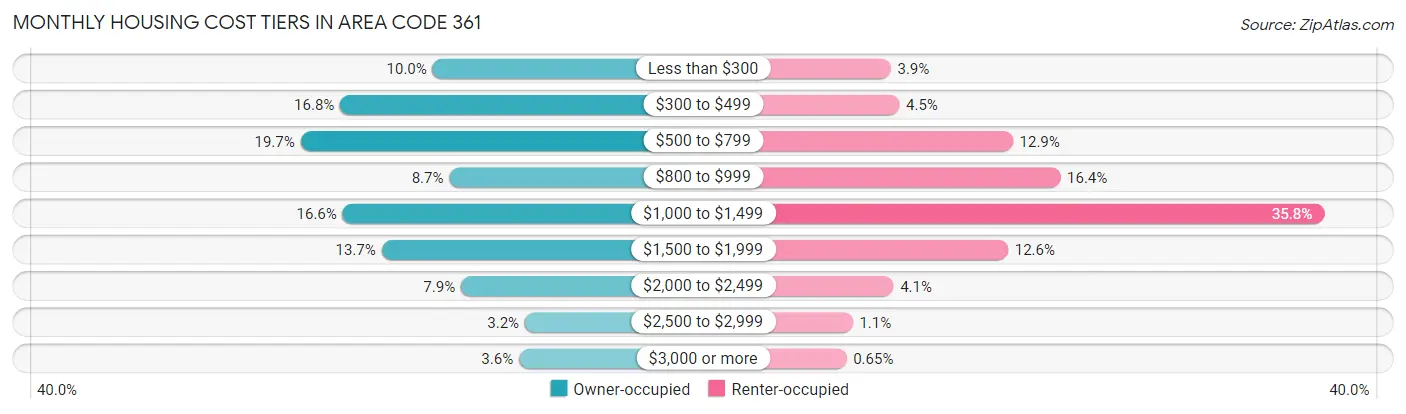
| Monthly Cost | Owner-occupied | Renter-occupied |
| Less than $300 | 18,274 (10.0%) | 3,912 (3.9%) |
| $300 to $499 | 30,788 (16.8%) | 4,538 (4.5%) |
| $500 to $799 | 36,170 (19.7%) | 12,903 (12.9%) |
| $800 to $999 | 16,024 (8.7%) | 16,413 (16.4%) |
| $1,000 to $1,499 | 30,462 (16.6%) | 35,849 (35.8%) |
| $1,500 to $1,999 | 25,199 (13.7%) | 12,556 (12.6%) |
| $2,000 to $2,499 | 14,449 (7.9%) | 4,108 (4.1%) |
| $2,500 to $2,999 | 5,783 (3.2%) | 1,115 (1.1%) |
| $3,000 or more | 6,601 (3.6%) | 651 (0.6%) |
| Total | 183,750 (100.0%) | 100,056 (100.0%) |
Physical Housing Characteristics in Area Code 361
Housing Structures in Area Code 361
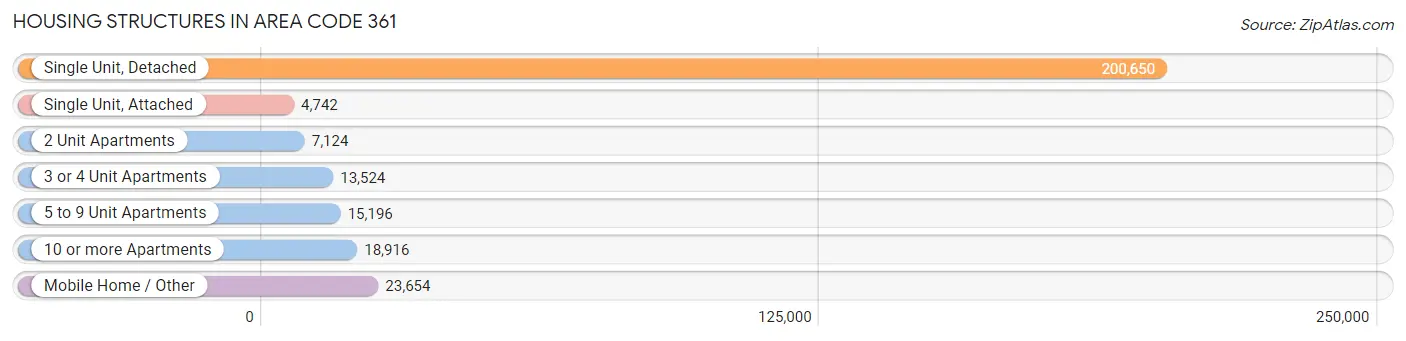
| Structure Type | # Housing Units | % Housing Units |
| Single Unit, Detached | 200,650 | 70.7% |
| Single Unit, Attached | 4,742 | 1.7% |
| 2 Unit Apartments | 7,124 | 2.5% |
| 3 or 4 Unit Apartments | 13,524 | 4.8% |
| 5 to 9 Unit Apartments | 15,196 | 5.3% |
| 10 or more Apartments | 18,916 | 6.7% |
| Mobile Home / Other | 23,654 | 8.3% |
| Total | 283,806 | 100.0% |
Housing Structures by Occupancy in Area Code 361
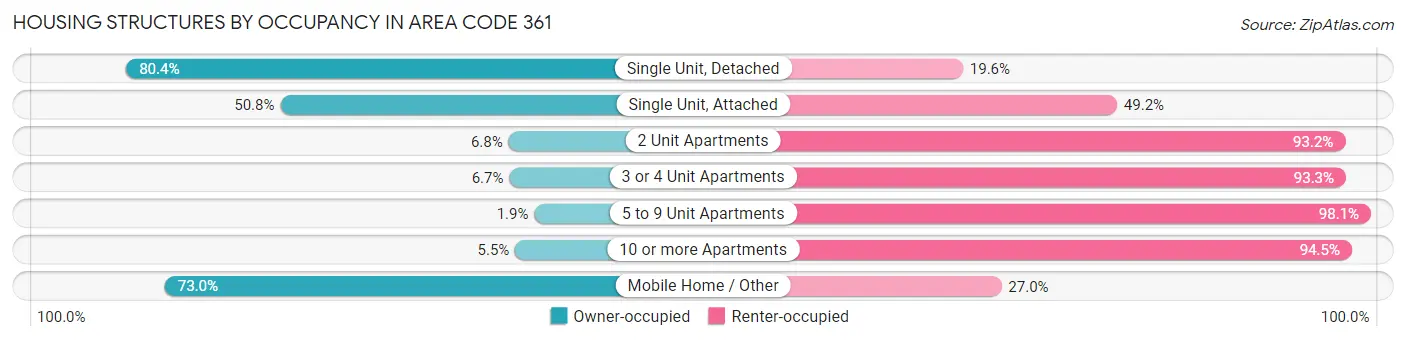
| Structure Type | Owner-occupied | Renter-occupied |
| Single Unit, Detached | 161,355 (80.4%) | 39,295 (19.6%) |
| Single Unit, Attached | 2,407 (50.8%) | 2,335 (49.2%) |
| 2 Unit Apartments | 486 (6.8%) | 6,638 (93.2%) |
| 3 or 4 Unit Apartments | 903 (6.7%) | 12,621 (93.3%) |
| 5 to 9 Unit Apartments | 283 (1.9%) | 14,913 (98.1%) |
| 10 or more Apartments | 1,048 (5.5%) | 17,868 (94.5%) |
| Mobile Home / Other | 17,268 (73.0%) | 6,386 (27.0%) |
| Total | 183,750 (64.7%) | 100,056 (35.3%) |
Housing Structures by Number of Rooms in Area Code 361
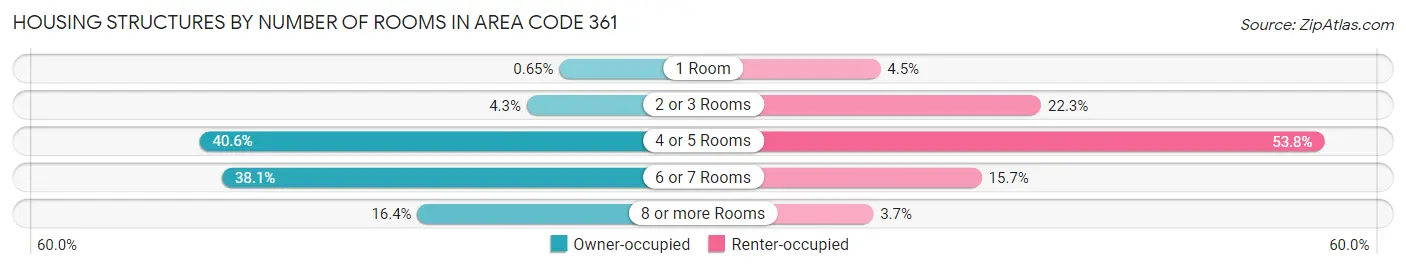
| Number of Rooms | Owner-occupied | Renter-occupied |
| 1 Room | 1,200 (0.6%) | 4,495 (4.5%) |
| 2 or 3 Rooms | 7,825 (4.3%) | 22,343 (22.3%) |
| 4 or 5 Rooms | 74,584 (40.6%) | 53,783 (53.7%) |
| 6 or 7 Rooms | 70,001 (38.1%) | 15,737 (15.7%) |
| 8 or more Rooms | 30,140 (16.4%) | 3,698 (3.7%) |
| Total | 183,750 (100.0%) | 100,056 (100.0%) |
Housing Structure by Heating Type in Area Code 361
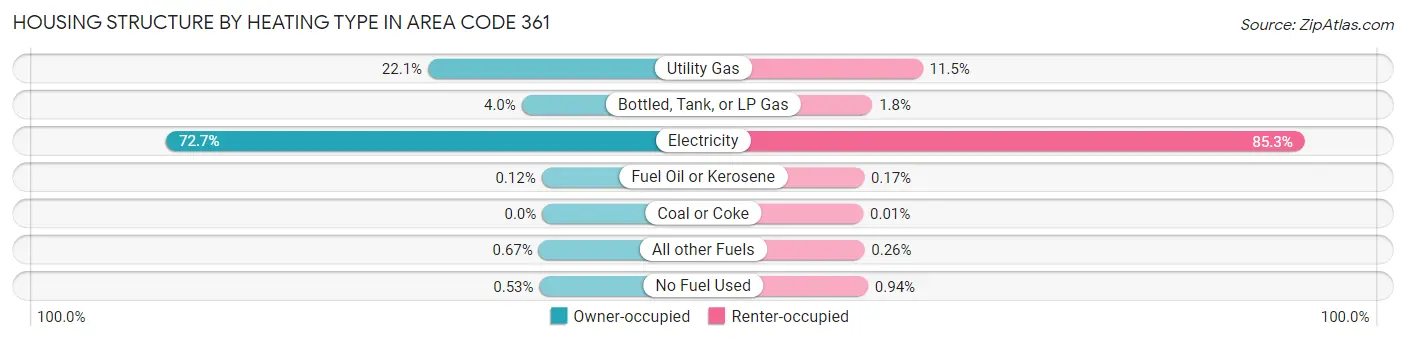
| Heating Type | Owner-occupied | Renter-occupied |
| Utility Gas | 40,551 (22.1%) | 11,522 (11.5%) |
| Bottled, Tank, or LP Gas | 7,278 (4.0%) | 1,780 (1.8%) |
| Electricity | 133,498 (72.7%) | 85,368 (85.3%) |
| Fuel Oil or Kerosene | 212 (0.1%) | 169 (0.2%) |
| Coal or Coke | 6 (0.0%) | 14 (0.0%) |
| All other Fuels | 1,232 (0.7%) | 265 (0.3%) |
| No Fuel Used | 973 (0.5%) | 938 (0.9%) |
| Total | 183,750 (100.0%) | 100,056 (100.0%) |
Household Vehicle Usage in Area Code 361
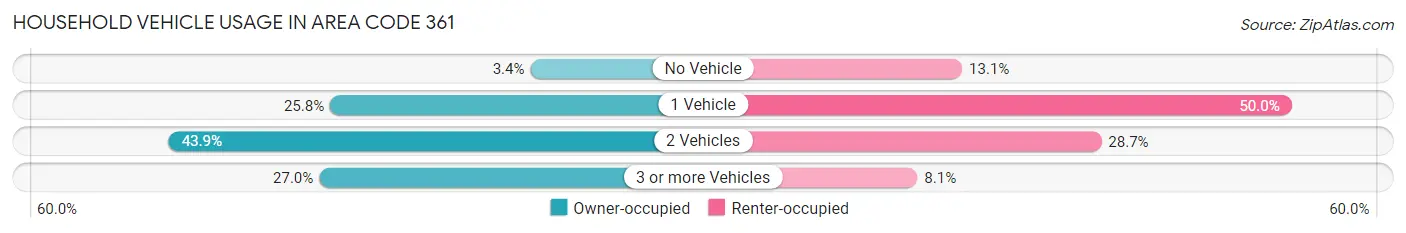
| Vehicles per Household | Owner-occupied | Renter-occupied |
| No Vehicle | 6,153 (3.4%) | 13,140 (13.1%) |
| 1 Vehicle | 47,385 (25.8%) | 50,051 (50.0%) |
| 2 Vehicles | 80,578 (43.9%) | 28,742 (28.7%) |
| 3 or more Vehicles | 49,634 (27.0%) | 8,123 (8.1%) |
| Total | 183,750 (100.0%) | 100,056 (100.0%) |
Real Estate & Mortgages in Area Code 361
Real Estate and Mortgage Overview in Area Code 361
| Characteristic | Without Mortgage | With Mortgage |
| Housing Units | 101,776 | 81,974 |
| Median Property Value | $11,469,100 | $13,573,400 |
| Median Household Income | $4,705,792 | $19,871 |
| Monthly Housing Costs | $46,903 | $6,432 |
| Real Estate Taxes | $127,981 | $4,651 |
Property Value by Mortgage Status in Area Code 361
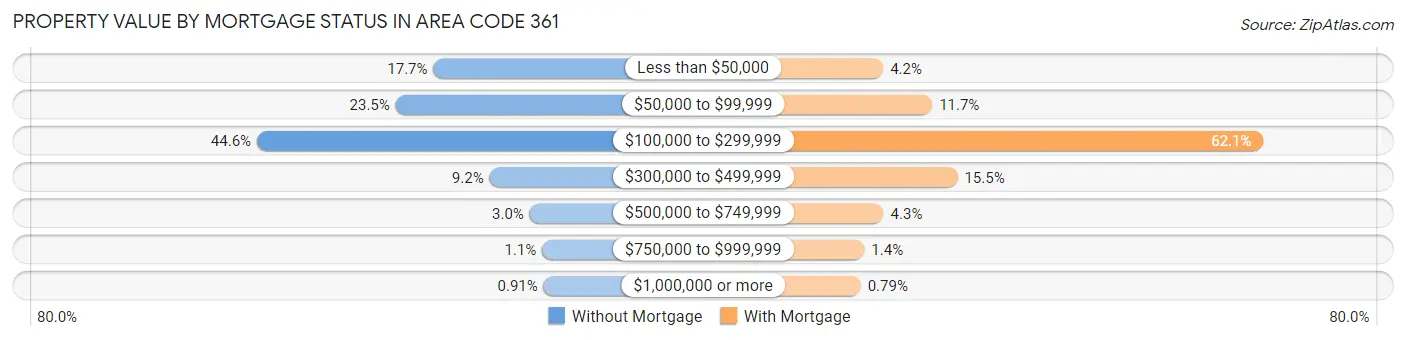
| Property Value | Without Mortgage | With Mortgage |
| Less than $50,000 | 18,027 (17.7%) | 3,457 (4.2%) |
| $50,000 to $99,999 | 23,886 (23.5%) | 9,577 (11.7%) |
| $100,000 to $299,999 | 45,388 (44.6%) | 50,942 (62.1%) |
| $300,000 to $499,999 | 9,318 (9.2%) | 12,734 (15.5%) |
| $500,000 to $749,999 | 3,080 (3.0%) | 3,508 (4.3%) |
| $750,000 to $999,999 | 1,154 (1.1%) | 1,107 (1.3%) |
| $1,000,000 or more | 923 (0.9%) | 649 (0.8%) |
| Total | 101,776 (100.0%) | 81,974 (100.0%) |
Household Income by Mortgage Status in Area Code 361
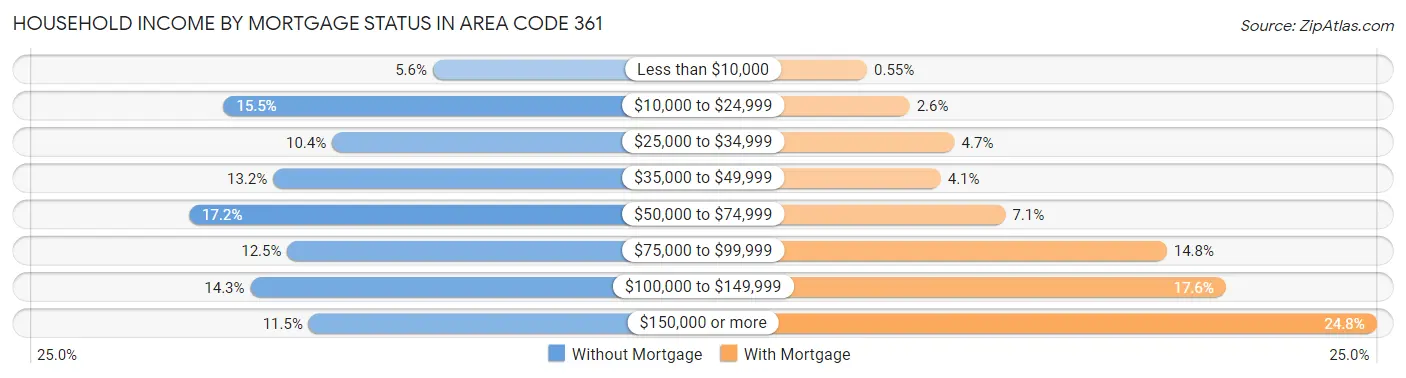
| Household Income | Without Mortgage | With Mortgage |
| Less than $10,000 | 5,662 (5.6%) | 447 (0.5%) |
| $10,000 to $24,999 | 15,804 (15.5%) | 2,116 (2.6%) |
| $25,000 to $34,999 | 10,547 (10.4%) | 3,866 (4.7%) |
| $35,000 to $49,999 | 13,402 (13.2%) | 3,327 (4.1%) |
| $50,000 to $74,999 | 17,474 (17.2%) | 5,854 (7.1%) |
| $75,000 to $99,999 | 12,709 (12.5%) | 12,150 (14.8%) |
| $100,000 to $149,999 | 14,508 (14.2%) | 14,453 (17.6%) |
| $150,000 or more | 11,670 (11.5%) | 20,337 (24.8%) |
| Total | 101,776 (100.0%) | 81,974 (100.0%) |
Property Value to Household Income Ratio in Area Code 361
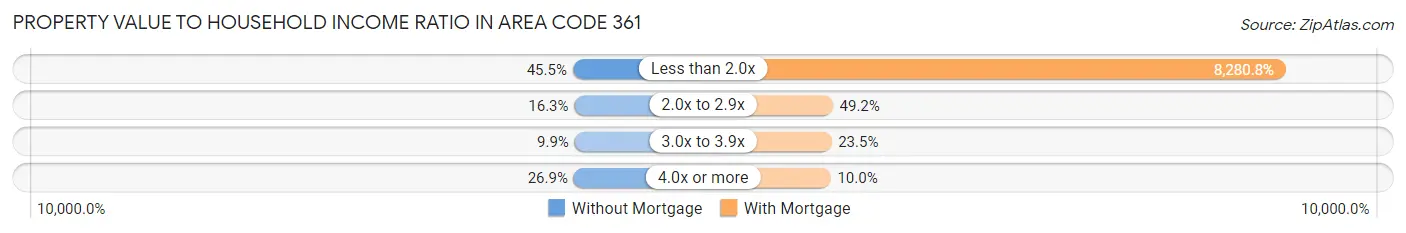
| Value-to-Income Ratio | Without Mortgage | With Mortgage |
| Less than 2.0x | 46,271 (45.5%) | 6,788,111 (8,280.8%) |
| 2.0x to 2.9x | 16,565 (16.3%) | 40,357 (49.2%) |
| 3.0x to 3.9x | 10,115 (9.9%) | 19,267 (23.5%) |
| 4.0x or more | 27,339 (26.9%) | 8,224 (10.0%) |
| Total | 101,776 (100.0%) | 81,974 (100.0%) |
Real Estate Taxes by Mortgage Status in Area Code 361
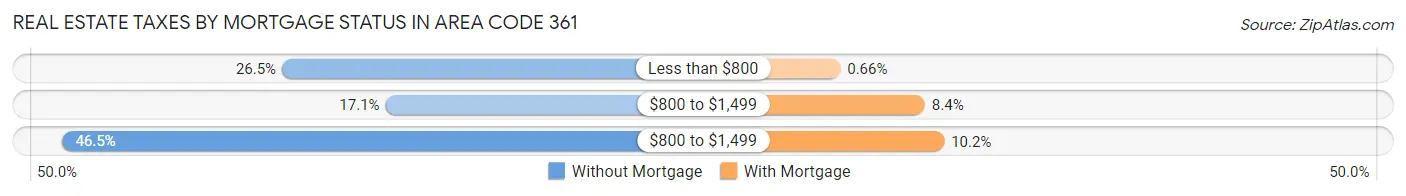
| Property Taxes | Without Mortgage | With Mortgage |
| Less than $800 | 26,972 (26.5%) | 544 (0.7%) |
| $800 to $1,499 | 17,351 (17.1%) | 6,880 (8.4%) |
| $800 to $1,499 | 47,371 (46.5%) | 8,319 (10.2%) |
| Total | 101,776 (100.0%) | 81,974 (100.0%) |
Health & Disability in Area Code 361
Health Insurance Coverage by Age in Area Code 361
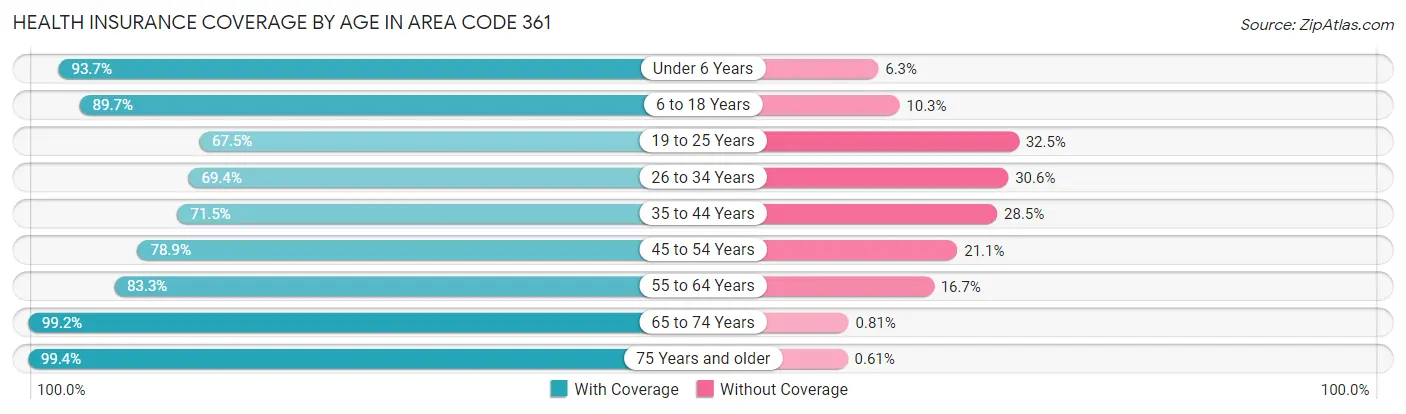
| Age Bracket | With Coverage | Without Coverage |
| Under 6 Years | 56,429 (93.7%) | 3,821 (6.3%) |
| 6 to 18 Years | 124,308 (89.7%) | 14,230 (10.3%) |
| 19 to 25 Years | 49,722 (67.5%) | 23,957 (32.5%) |
| 26 to 34 Years | 61,712 (69.4%) | 27,178 (30.6%) |
| 35 to 44 Years | 68,743 (71.5%) | 27,399 (28.5%) |
| 45 to 54 Years | 67,573 (78.9%) | 18,040 (21.1%) |
| 55 to 64 Years | 76,226 (83.3%) | 15,245 (16.7%) |
| 65 to 74 Years | 72,013 (99.2%) | 586 (0.8%) |
| 75 Years and older | 49,592 (99.4%) | 304 (0.6%) |
| Total | 626,318 (82.7%) | 130,760 (17.3%) |
Health Insurance Coverage by Citizenship Status in Area Code 361
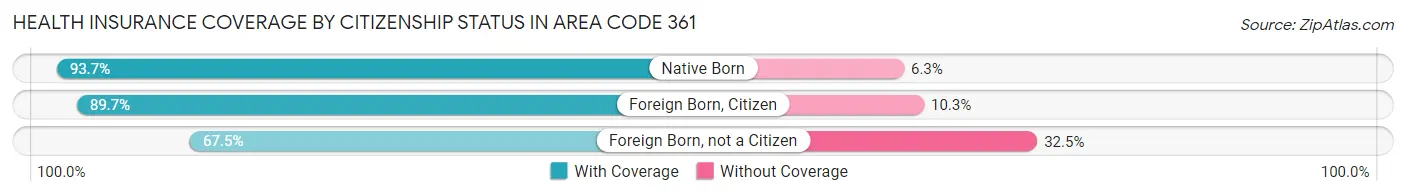
| Citizenship Status | With Coverage | Without Coverage |
| Native Born | 56,429 (93.7%) | 3,821 (6.3%) |
| Foreign Born, Citizen | 124,308 (89.7%) | 14,230 (10.3%) |
| Foreign Born, not a Citizen | 49,722 (67.5%) | 23,957 (32.5%) |
Health Insurance Coverage by Household Income in Area Code 361
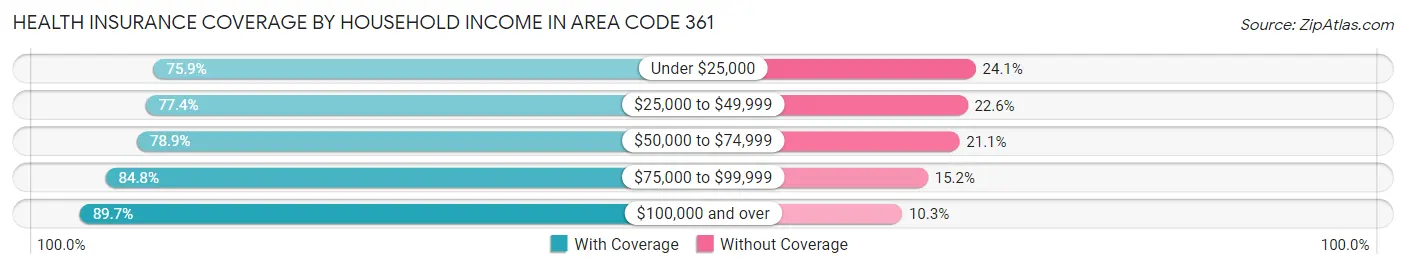
| Household Income | With Coverage | Without Coverage |
| Under $25,000 | 86,822 (75.9%) | 27,608 (24.1%) |
| $25,000 to $49,999 | 107,567 (77.4%) | 31,415 (22.6%) |
| $50,000 to $74,999 | 99,470 (78.9%) | 26,584 (21.1%) |
| $75,000 to $99,999 | 93,654 (84.8%) | 16,758 (15.2%) |
| $100,000 and over | 233,259 (89.7%) | 26,891 (10.3%) |
Public vs Private Health Insurance Coverage by Age in Area Code 361
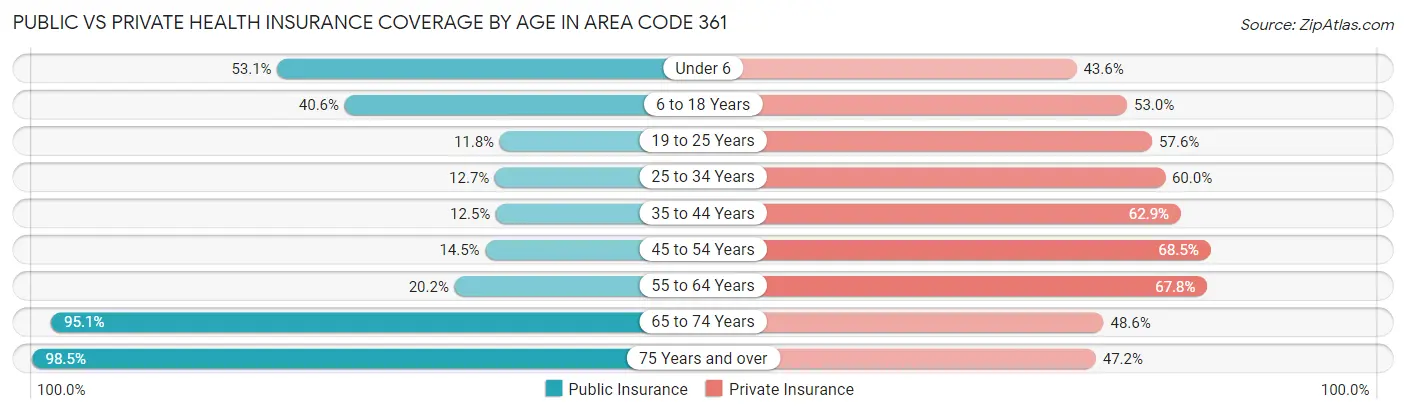
| Age Bracket | Public Insurance | Private Insurance |
| Under 6 | 31,976 (53.1%) | 26,244 (43.6%) |
| 6 to 18 Years | 56,178 (40.6%) | 73,352 (52.9%) |
| 19 to 25 Years | 8,669 (11.8%) | 42,443 (57.6%) |
| 25 to 34 Years | 11,256 (12.7%) | 53,325 (60.0%) |
| 35 to 44 Years | 11,985 (12.5%) | 60,509 (62.9%) |
| 45 to 54 Years | 12,379 (14.5%) | 58,614 (68.5%) |
| 55 to 64 Years | 18,437 (20.2%) | 62,045 (67.8%) |
| 65 to 74 Years | 69,013 (95.1%) | 35,265 (48.6%) |
| 75 Years and over | 49,155 (98.5%) | 23,527 (47.1%) |
| Total | 269,048 (35.5%) | 435,324 (57.5%) |
Disability Status by Sex by Age in Area Code 361
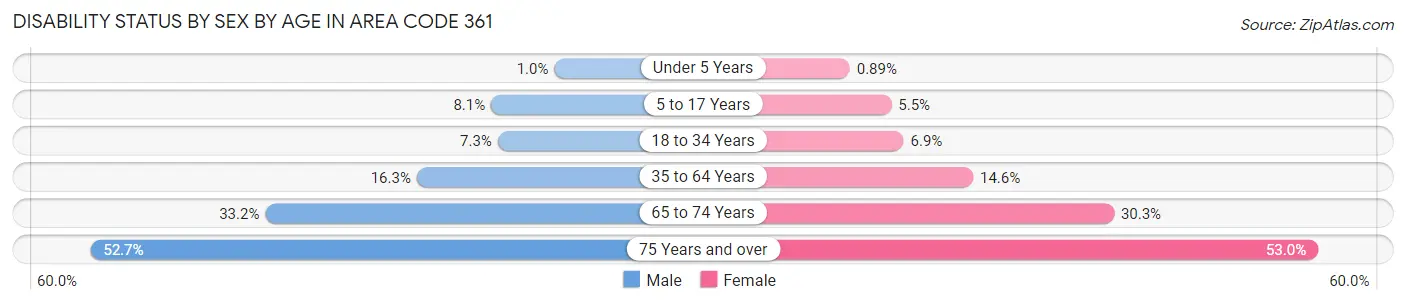
| Age Bracket | Male | Female |
| Under 5 Years | 256 (1.0%) | 213 (0.9%) |
| 5 to 17 Years | 5,702 (8.1%) | 3,751 (5.5%) |
| 18 to 34 Years | 6,472 (7.3%) | 5,839 (6.9%) |
| 35 to 64 Years | 22,139 (16.3%) | 20,115 (14.6%) |
| 65 to 74 Years | 11,571 (33.2%) | 11,441 (30.3%) |
| 75 Years and over | 11,092 (52.7%) | 15,295 (53.0%) |
Disability Class by Sex by Age in Area Code 361
Disability Class: Hearing Difficulty
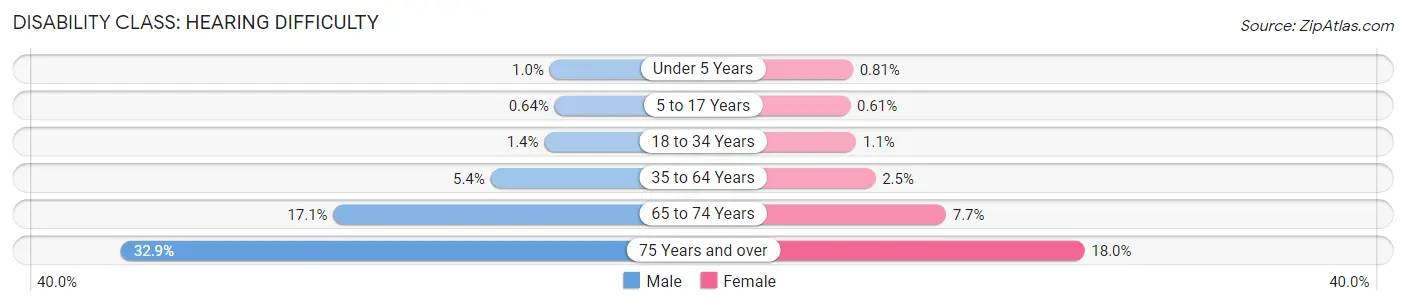
| Age Bracket | Male | Female |
| Under 5 Years | 256 (1.0%) | 193 (0.8%) |
| 5 to 17 Years | 457 (0.6%) | 414 (0.6%) |
| 18 to 34 Years | 1,244 (1.4%) | 904 (1.1%) |
| 35 to 64 Years | 7,317 (5.4%) | 3,410 (2.5%) |
| 65 to 74 Years | 5,948 (17.1%) | 2,913 (7.7%) |
| 75 Years and over | 6,916 (32.9%) | 5,193 (18.0%) |
Disability Class: Vision Difficulty
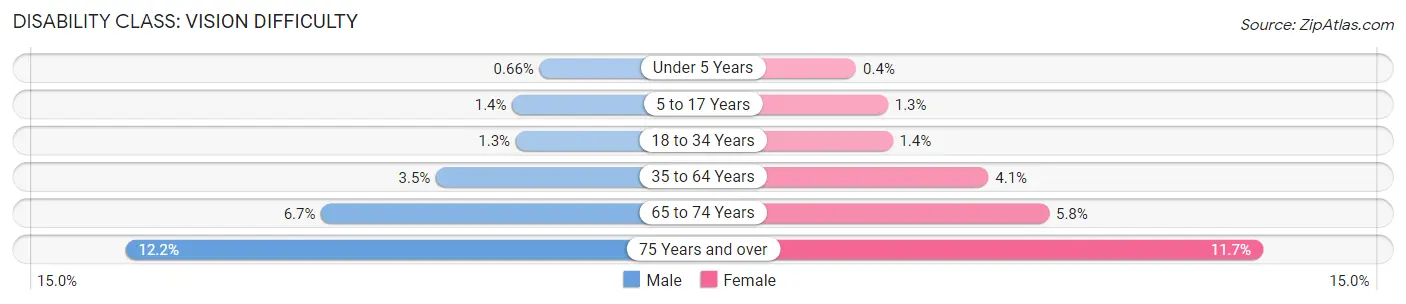
| Age Bracket | Male | Female |
| Under 5 Years | 168 (0.7%) | 95 (0.4%) |
| 5 to 17 Years | 1,003 (1.4%) | 868 (1.3%) |
| 18 to 34 Years | 1,165 (1.3%) | 1,196 (1.4%) |
| 35 to 64 Years | 4,799 (3.5%) | 5,616 (4.1%) |
| 65 to 74 Years | 2,350 (6.7%) | 2,178 (5.8%) |
| 75 Years and over | 2,566 (12.2%) | 3,379 (11.7%) |
Disability Class: Cognitive Difficulty
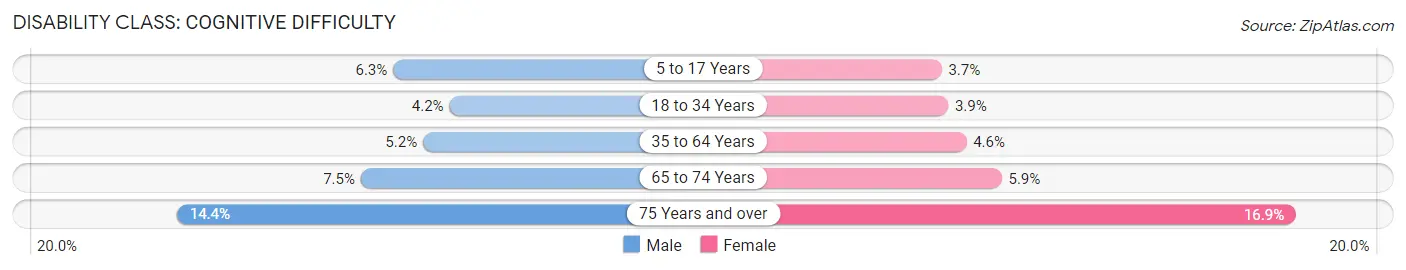
| Age Bracket | Male | Female |
| 5 to 17 Years | 4,480 (6.3%) | 2,512 (3.7%) |
| 18 to 34 Years | 3,746 (4.2%) | 3,347 (3.9%) |
| 35 to 64 Years | 7,062 (5.2%) | 6,357 (4.6%) |
| 65 to 74 Years | 2,621 (7.5%) | 2,237 (5.9%) |
| 75 Years and over | 3,021 (14.3%) | 4,863 (16.9%) |
Disability Class: Ambulatory Difficulty
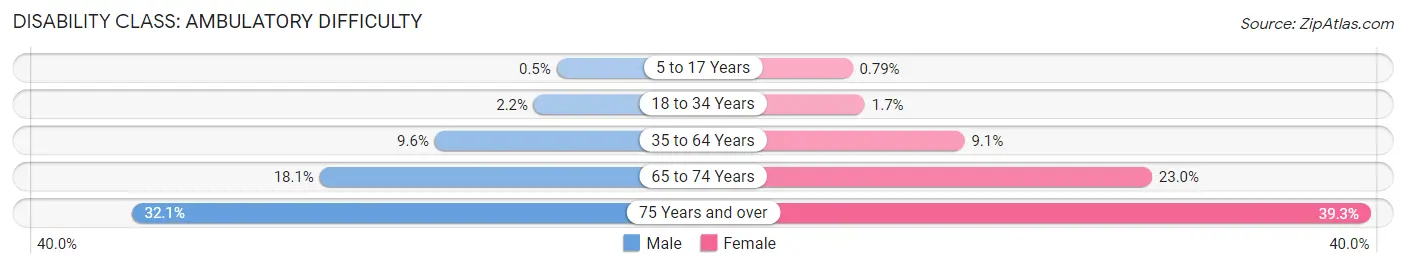
| Age Bracket | Male | Female |
| 5 to 17 Years | 353 (0.5%) | 534 (0.8%) |
| 18 to 34 Years | 1,941 (2.2%) | 1,454 (1.7%) |
| 35 to 64 Years | 12,954 (9.6%) | 12,535 (9.1%) |
| 65 to 74 Years | 6,305 (18.1%) | 8,689 (23.0%) |
| 75 Years and over | 6,751 (32.1%) | 11,330 (39.3%) |
Disability Class: Self-Care Difficulty
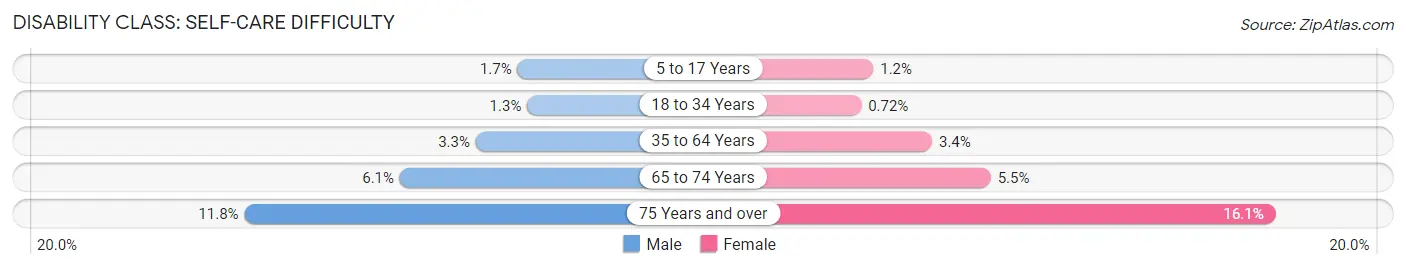
| Age Bracket | Male | Female |
| 5 to 17 Years | 1,202 (1.7%) | 798 (1.2%) |
| 18 to 34 Years | 1,190 (1.3%) | 610 (0.7%) |
| 35 to 64 Years | 4,403 (3.3%) | 4,605 (3.4%) |
| 65 to 74 Years | 2,116 (6.1%) | 2,089 (5.5%) |
| 75 Years and over | 2,493 (11.8%) | 4,643 (16.1%) |
Technology Access in Area Code 361
Computing Device Access in Area Code 361
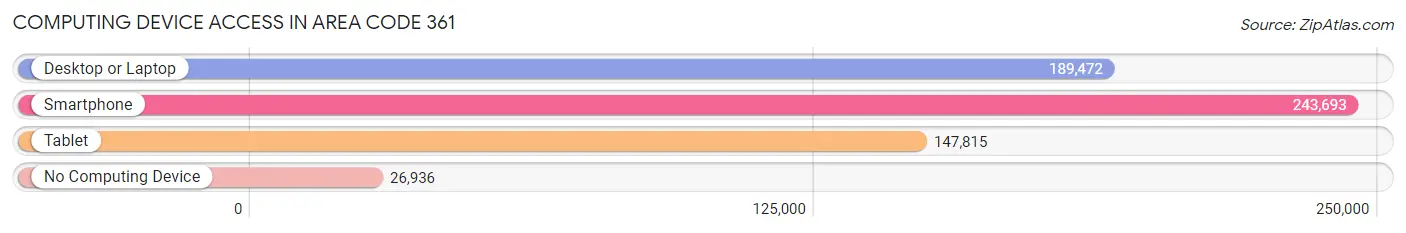
| Device Type | # Households | % Households |
| Desktop or Laptop | 189,472 | 66.8% |
| Smartphone | 243,693 | 85.9% |
| Tablet | 147,815 | 52.1% |
| No Computing Device | 26,936 | 9.5% |
| Total | 283,806 | 100.0% |
Internet Access in Area Code 361
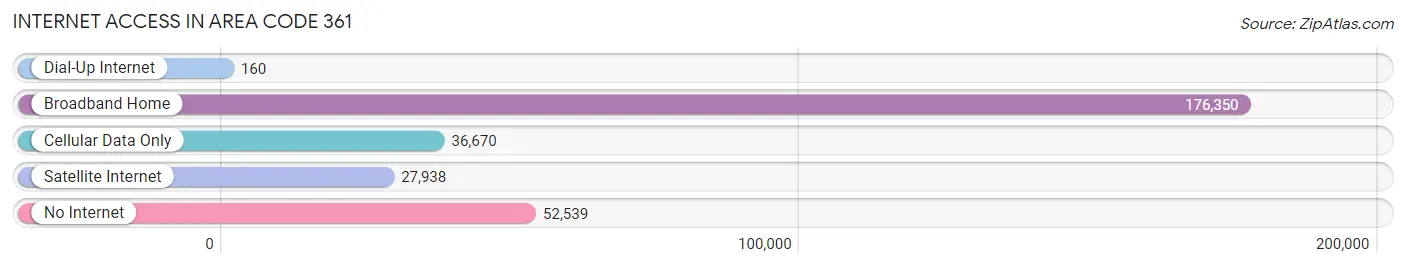
| Internet Type | # Households | % Households |
| Dial-Up Internet | 160 | 0.1% |
| Broadband Home | 176,350 | 62.1% |
| Cellular Data Only | 36,670 | 12.9% |
| Satellite Internet | 27,938 | 9.8% |
| No Internet | 52,539 | 18.5% |
| Total | 283,806 | 100.0% |
Area Code 361 Summary
Geography
Area code 361 is a telephone area code in the North American Numbering Plan (NANP) for the U.S. state of Texas. It was created on June 12, 1999, in a split from area code 512. It covers the Coastal Bend region of Texas, including Corpus Christi, Victoria, and the surrounding area.
Social
Area code 361 is home to a diverse population of people from all walks of life. The area is known for its vibrant culture, with a variety of festivals, events, and attractions. The area is also home to a number of universities and colleges, making it a great place for students to live and learn.
Economics
Area code 361 is a major economic hub in the state of Texas. The area is home to a number of large companies, including Valero Energy Corporation, Citgo Petroleum Corporation, and Flint Hills Resources. The area is also home to a number of smaller businesses, making it a great place to start a business or find employment.
Demographics
Area code 361 is home to a diverse population of people from all walks of life. According to the 2010 U.S. Census, the population of the area was 842,104, with a median age of 33.7 years. The area is also home to a large Hispanic population, with nearly 40% of the population identifying as Hispanic or Latino.
Common Questions
What is Per Capita Income in Area Code 361?
Per Capita income in Area Code 361 is $28,490.
What is the Median Family Income in Area Code 361?
Median Family Income in Area Code 361 is $72,400.
What is the Median Household income in Area Code 361?
Median Household Income in Area Code 361 is $59,051.
What is Income or Wage Gap in Area Code 361?
Income or Wage Gap in Area Code 361 is 34.5%.
Women in Area Code 361 earn 65.5 cents for every dollar earned by a man.
What is Family Income Deficit in Area Code 361?
Family Income Deficit in Area Code 361 is $11,539.
Families that are below poverty line in Area Code 361 earn $11,539 less on average than the poverty threshold level.
What is Inequality or Gini Index in Area Code 361?
Inequality or Gini Index in Area Code 361 is 43.94.
What is the Total Population of Area Code 361?
Total Population of Area Code 361 is 781,473.
What is the Total Male Population of Area Code 361?
Total Male Population of Area Code 361 is 396,606.
What is the Total Female Population of Area Code 361?
Total Female Population of Area Code 361 is 384,867.
What is the Ratio of Males per 100 Females in Area Code 361?
There are 103.05 Males per 100 Females in Area Code 361.
What is the Ratio of Females per 100 Males in Area Code 361?
There are 97.04 Females per 100 Males in Area Code 361.
What is the Median Population Age in Area Code 361?
Median Population Age in Area Code 361 is 40.9 Years.
What is the Average Family Size in Area Code 361
Average Family Size in Area Code 361 is 3.4 People.
What is the Average Household Size in Area Code 361
Average Household Size in Area Code 361 is 2.8 People.
How Large is the Labor Force in Area Code 361?
There are 336,047 People in the Labor Forcein in Area Code 361.
What is the Percentage of People in the Labor Force in Area Code 361?
54.7% of People are in the Labor Force in Area Code 361.
What is the Unemployment Rate in Area Code 361?
Unemployment Rate in Area Code 361 is 6.0%.