Area Code 202 Map & Demographics
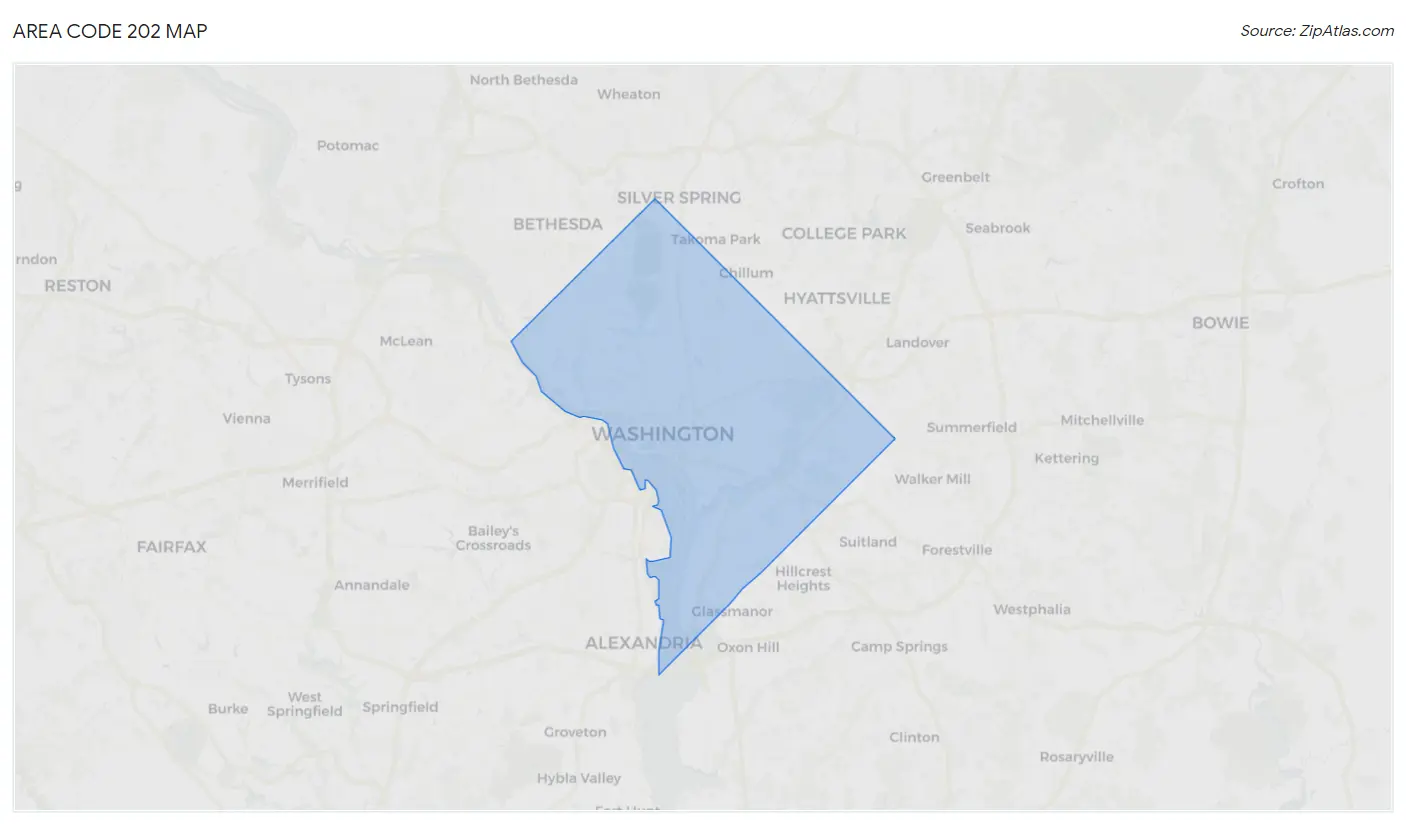
Area Code 202 Map
Area Code 202 Overview
$65,555
PER CAPITA INCOME
$173,869
AVG FAMILY INCOME
$111,161
AVG HOUSEHOLD INCOME
17.5%
WAGE / INCOME GAP [ % ]
82.5¢/ $1
WAGE / INCOME GAP [ $ ]
$13,592
FAMILY INCOME DEFICIT
10.69
INEQUALITY / GINI INDEX
670,587
TOTAL POPULATION
320,797
MALE POPULATION
349,790
FEMALE POPULATION
91.71
MALES / 100 FEMALES
109.04
FEMALES / 100 MALES
33.6
MEDIAN AGE
2.9
AVG FAMILY SIZE
2.1
AVG HOUSEHOLD SIZE
384,678
LABOR FORCE [ PEOPLE ]
69.1%
PERCENT IN LABOR FORCE
7.2%
UNEMPLOYMENT RATE
Income in Area Code 202
Income Overview in Area Code 202
Per Capita Income in Area Code 202 is $65,555, while median incomes of families and households are $173,869 and $111,161 respectively.
| Characteristic | Number | Measure |
| Per Capita Income | 670,587 | $65,555 |
| Median Family Income | 130,453 | $173,869 |
| Mean Family Income | 130,453 | $4,884,601 |
| Median Household Income | 315,785 | $111,161 |
| Mean Household Income | 315,785 | $3,433,517 |
| Income Deficit | 130,453 | $13,592 |
| Wage / Income Gap (%) | 670,587 | 17.53% |
| Wage / Income Gap ($) | 670,587 | 82.47¢ per $1 |
| Gini / Inequality Index | 670,587 | 10.69 |
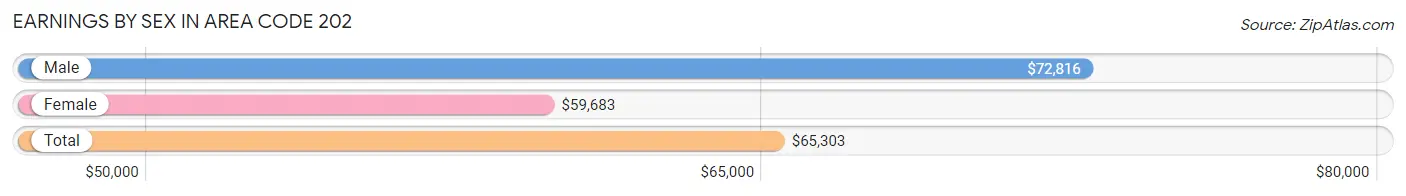
Earnings by Sex in Area Code 202
Average Earnings in Area Code 202 are $65,303, $72,816 for men and $59,683 for women, a difference of 18.0%.
| Sex | Number | Average Earnings |
| Male | 199,435 (48.6%) | $72,816 |
| Female | 210,749 (51.4%) | $59,683 |
| Total | 410,184 (100.0%) | $65,303 |
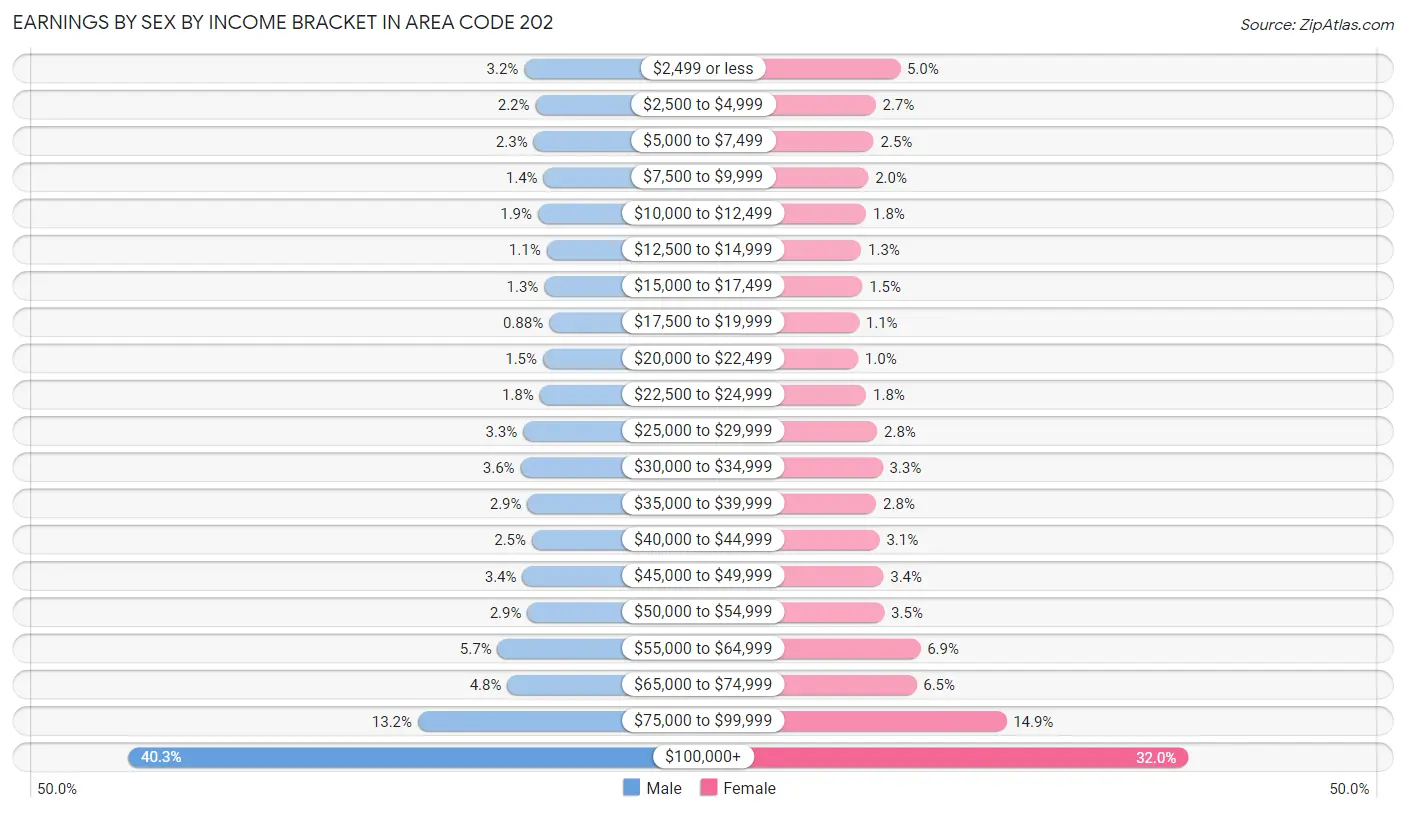
Earnings by Sex by Income Bracket in Area Code 202
The most common earnings brackets in Area Code 202 are $100,000+ for men (80,394 | 40.3%) and $100,000+ for women (67,400 | 32.0%).
| Income | Male | Female |
| $2,499 or less | 6,385 (3.2%) | 10,492 (5.0%) |
| $2,500 to $4,999 | 4,288 (2.1%) | 5,678 (2.7%) |
| $5,000 to $7,499 | 4,641 (2.3%) | 5,294 (2.5%) |
| $7,500 to $9,999 | 2,799 (1.4%) | 4,232 (2.0%) |
| $10,000 to $12,499 | 3,829 (1.9%) | 3,809 (1.8%) |
| $12,500 to $14,999 | 2,217 (1.1%) | 2,831 (1.3%) |
| $15,000 to $17,499 | 2,662 (1.3%) | 3,063 (1.5%) |
| $17,500 to $19,999 | 1,759 (0.9%) | 2,389 (1.1%) |
| $20,000 to $22,499 | 2,899 (1.5%) | 2,195 (1.0%) |
| $22,500 to $24,999 | 3,520 (1.8%) | 3,818 (1.8%) |
| $25,000 to $29,999 | 6,576 (3.3%) | 5,976 (2.8%) |
| $30,000 to $34,999 | 7,072 (3.5%) | 7,039 (3.3%) |
| $35,000 to $39,999 | 5,791 (2.9%) | 5,797 (2.8%) |
| $40,000 to $44,999 | 4,946 (2.5%) | 6,452 (3.1%) |
| $45,000 to $49,999 | 6,713 (3.4%) | 7,218 (3.4%) |
| $50,000 to $54,999 | 5,805 (2.9%) | 7,370 (3.5%) |
| $55,000 to $64,999 | 11,361 (5.7%) | 14,510 (6.9%) |
| $65,000 to $74,999 | 9,531 (4.8%) | 13,729 (6.5%) |
| $75,000 to $99,999 | 26,247 (13.2%) | 31,457 (14.9%) |
| $100,000+ | 80,394 (40.3%) | 67,400 (32.0%) |
| Total | 199,435 (100.0%) | 210,749 (100.0%) |
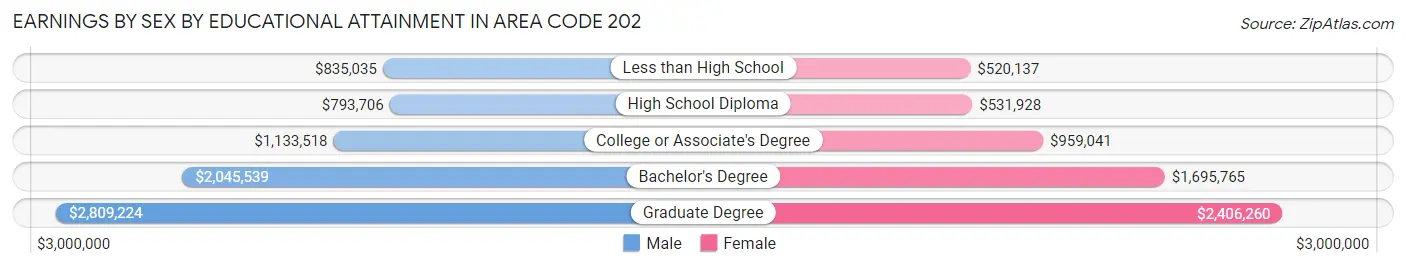
Earnings by Sex by Educational Attainment in Area Code 202
Average earnings in Area Code 202 are $2,170,935 for men and $1,819,677 for women, a difference of 16.2%. Men with an educational attainment of graduate degree enjoy the highest average annual earnings of $2,809,224, while those with high school diploma education earn the least with $793,706. Women with an educational attainment of graduate degree earn the most with the average annual earnings of $2,406,260, while those with less than high school education have the smallest earnings of $520,137.
| Educational Attainment | Male Income | Female Income |
| Less than High School | $835,035 | $520,137 |
| High School Diploma | $793,706 | $531,928 |
| College or Associate's Degree | $1,133,518 | $959,041 |
| Bachelor's Degree | $2,045,539 | $1,695,765 |
| Graduate Degree | $2,809,224 | $2,406,260 |
| Total | $2,170,935 | $1,819,677 |
Family Income in Area Code 202
Family Income Brackets in Area Code 202
According to the Area Code 202 family income data, there are 1,257,958 families falling into the $200,000+ income range, which is the most common income bracket and makes up 964.3% of all families. Conversely, the $10,000 to $14,999 income bracket is the least frequent group with only 42,658 families (32.7%) belonging to this category.
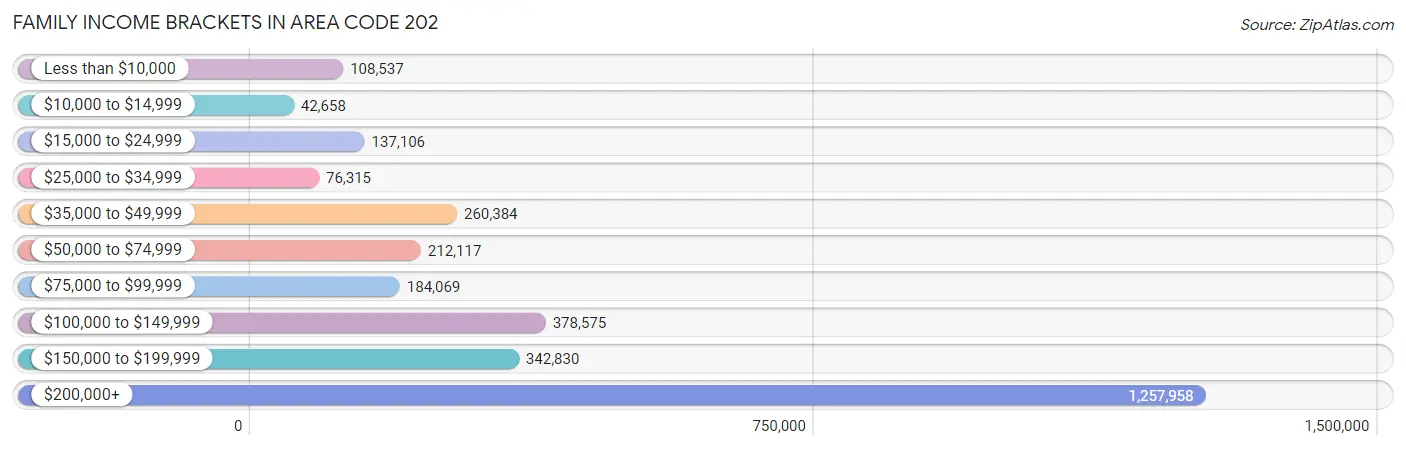
| Income Bracket | # Families | % Families |
| Less than $10,000 | 108,537 | 83.2% |
| $10,000 to $14,999 | 42,658 | 32.7% |
| $15,000 to $24,999 | 137,106 | 105.1% |
| $25,000 to $34,999 | 76,315 | 58.5% |
| $35,000 to $49,999 | 260,384 | 199.6% |
| $50,000 to $74,999 | 212,117 | 162.6% |
| $75,000 to $99,999 | 184,069 | 141.1% |
| $100,000 to $149,999 | 378,575 | 290.2% |
| $150,000 to $199,999 | 342,830 | 262.8% |
| $200,000+ | 1,257,958 | 964.3% |
Family Income by Famaliy Size in Area Code 202
6-person families (2,842 | 2.2%) account for the highest median family income in Area Code 202 with $189,495 per family, while 2-person families (68,338 | 52.4%) have the highest median income of $84,902 per family member.
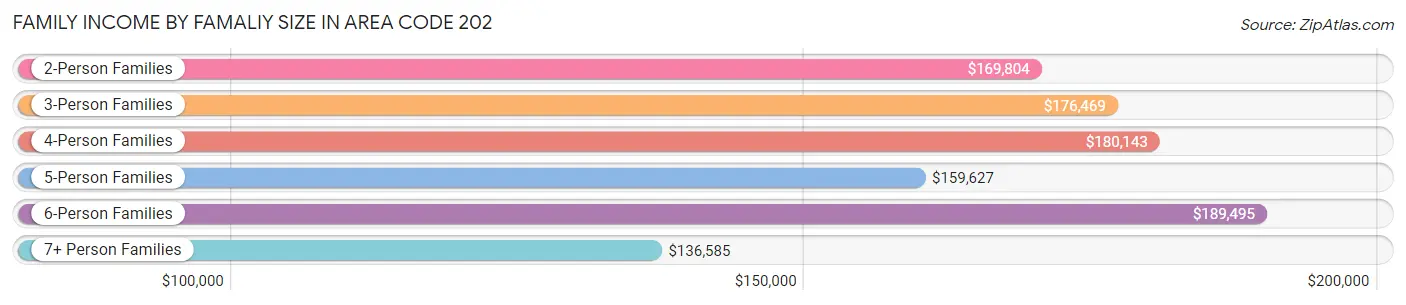
| Income Bracket | # Families | Median Income |
| 2-Person Families | 68,338 (52.4%) | $169,804 |
| 3-Person Families | 29,574 (22.7%) | $176,469 |
| 4-Person Families | 20,399 (15.6%) | $180,143 |
| 5-Person Families | 7,652 (5.9%) | $159,627 |
| 6-Person Families | 2,842 (2.2%) | $189,495 |
| 7+ Person Families | 1,648 (1.3%) | $136,585 |
| Total | 130,453 (100.0%) | $173,869 |
Family Income by Number of Earners in Area Code 202
The median family income in Area Code 202 is $173,869, with families comprising 2 earners (66,365) having the highest median family income of $211,215, while families with no earners (16,516) have the lowest median family income of $77,215, accounting for 50.9% and 12.7% of families, respectively.
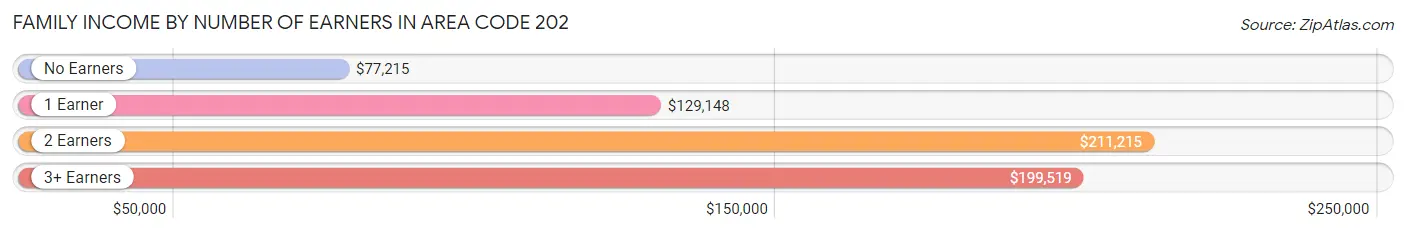
| Number of Earners | # Families | Median Income |
| No Earners | 16,516 (12.7%) | $77,215 |
| 1 Earner | 39,092 (30.0%) | $129,148 |
| 2 Earners | 66,365 (50.9%) | $211,215 |
| 3+ Earners | 8,480 (6.5%) | $199,519 |
| Total | 130,453 (100.0%) | $173,869 |
Household Income in Area Code 202
Household Income Brackets in Area Code 202
With 1,768,080 households falling in the category, the $200,000+ income range is the most frequent in Area Code 202, accounting for 559.9% of all households. In contrast, only 235,891 households (74.7%) fall into the $10,000 to $14,999 income bracket, making it the least populous group.
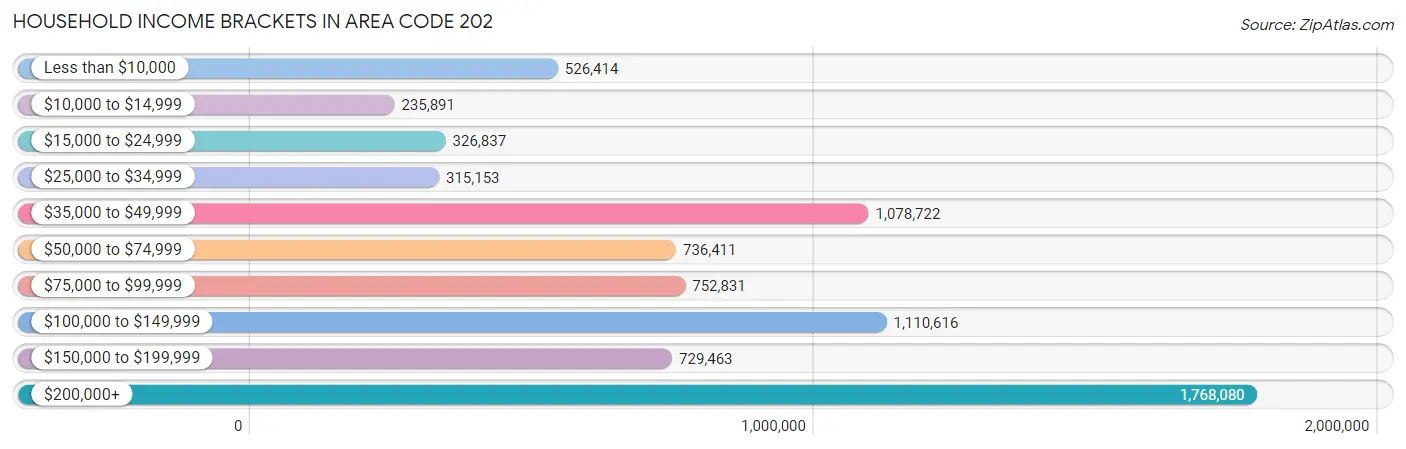
| Income Bracket | # Households | % Households |
| Less than $10,000 | 526,414 | 166.7% |
| $10,000 to $14,999 | 235,891 | 74.7% |
| $15,000 to $24,999 | 326,837 | 103.5% |
| $25,000 to $34,999 | 315,153 | 99.8% |
| $35,000 to $49,999 | 1,078,722 | 341.6% |
| $50,000 to $74,999 | 736,411 | 233.2% |
| $75,000 to $99,999 | 752,831 | 238.4% |
| $100,000 to $149,999 | 1,110,616 | 351.7% |
| $150,000 to $199,999 | 729,463 | 231.0% |
| $200,000+ | 1,768,080 | 559.9% |
Household Income by Householder Age in Area Code 202
The median household income in Area Code 202 is $111,161, with the highest median household income of $132,801 found in the 45 to 64 years age bracket for the primary householder. A total of 90,098 households (28.5%) fall into this category. Meanwhile, the 15 to 24 years age bracket for the primary householder has the lowest median household income of $54,709, with 13,809 households (4.4%) in this group.
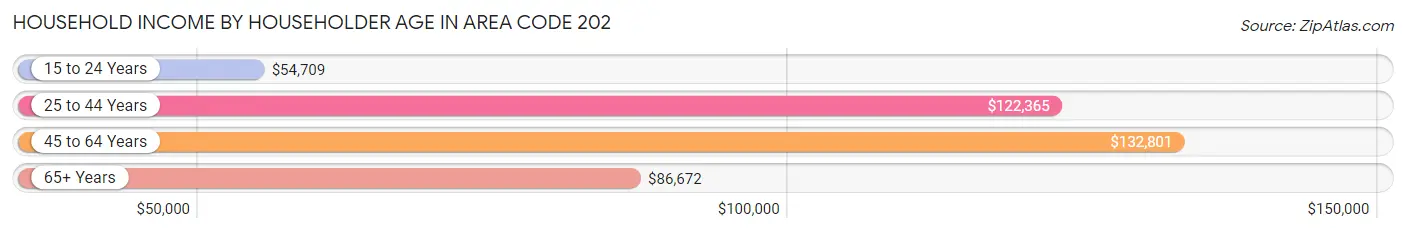
| Income Bracket | # Households | Median Income |
| 15 to 24 Years | 13,809 (4.4%) | $54,709 |
| 25 to 44 Years | 151,817 (48.1%) | $122,365 |
| 45 to 64 Years | 90,098 (28.5%) | $132,801 |
| 65+ Years | 60,061 (19.0%) | $86,672 |
| Total | 315,785 (100.0%) | $111,161 |
Poverty in Area Code 202
Income Below Poverty by Sex and Age in Area Code 202
With 13.8% poverty level for males and 16.3% for females among the residents of Area Code 202, 18 to 24 year old males and 18 to 24 year old females are the most vulnerable to poverty, with 6,513 males (29.8%) and 7,877 females (30.7%) in their respective age groups living below the poverty level.
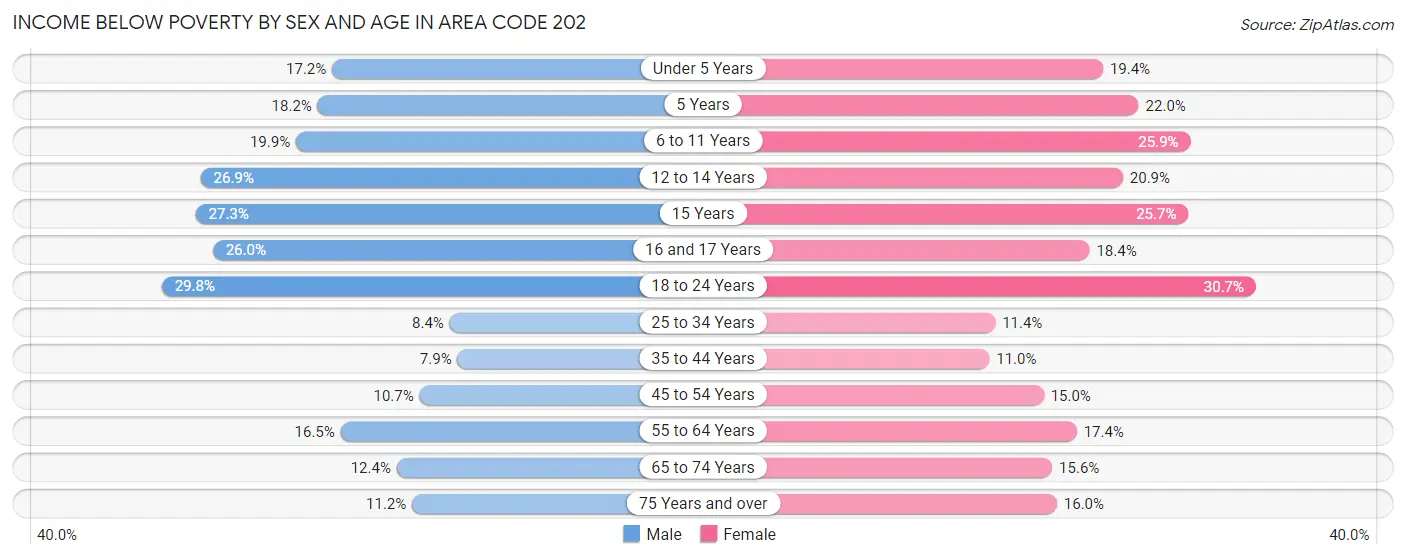
| Age Bracket | Male | Female |
| Under 5 Years | 3,602 (17.2%) | 3,872 (19.4%) |
| 5 Years | 629 (18.2%) | 790 (22.0%) |
| 6 to 11 Years | 4,105 (19.9%) | 5,345 (25.9%) |
| 12 to 14 Years | 2,453 (26.9%) | 1,784 (20.9%) |
| 15 Years | 742 (27.3%) | 665 (25.7%) |
| 16 and 17 Years | 1,264 (26.0%) | 947 (18.4%) |
| 18 to 24 Years | 6,513 (29.8%) | 7,877 (30.7%) |
| 25 to 34 Years | 5,971 (8.4%) | 9,159 (11.4%) |
| 35 to 44 Years | 4,167 (7.9%) | 5,968 (11.0%) |
| 45 to 54 Years | 3,906 (10.7%) | 5,335 (15.0%) |
| 55 to 64 Years | 5,310 (16.5%) | 5,963 (17.4%) |
| 65 to 74 Years | 2,592 (12.4%) | 4,254 (15.6%) |
| 75 Years and over | 1,446 (11.2%) | 3,380 (16.0%) |
| Total | 42,700 (13.8%) | 55,339 (16.3%) |
Income Above Poverty by Sex and Age in Area Code 202
According to the poverty statistics in Area Code 202, males aged 35 to 44 years and females aged 35 to 44 years are the age groups that are most secure financially, with 92.1% of males and 89.0% of females in these age groups living above the poverty line.
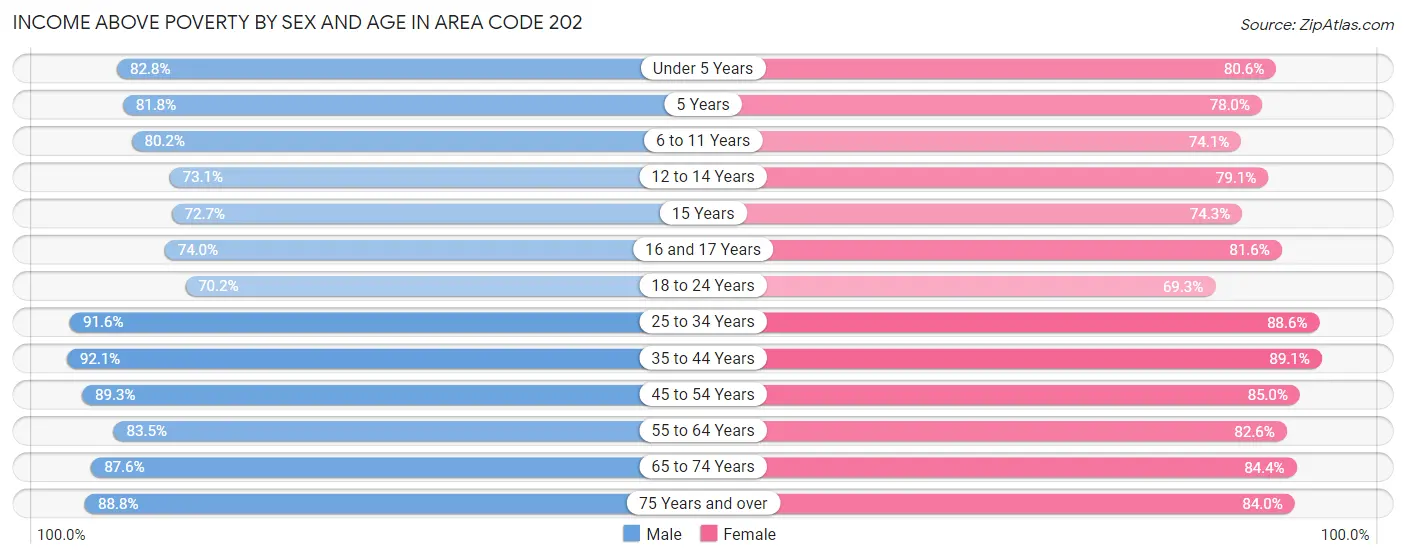
| Age Bracket | Male | Female |
| Under 5 Years | 17,381 (82.8%) | 16,099 (80.6%) |
| 5 Years | 2,819 (81.8%) | 2,794 (78.0%) |
| 6 to 11 Years | 16,575 (80.1%) | 15,305 (74.1%) |
| 12 to 14 Years | 6,656 (73.1%) | 6,763 (79.1%) |
| 15 Years | 1,976 (72.7%) | 1,921 (74.3%) |
| 16 and 17 Years | 3,592 (74.0%) | 4,202 (81.6%) |
| 18 to 24 Years | 15,330 (70.2%) | 17,748 (69.3%) |
| 25 to 34 Years | 64,812 (91.6%) | 71,262 (88.6%) |
| 35 to 44 Years | 48,871 (92.1%) | 48,530 (89.0%) |
| 45 to 54 Years | 32,682 (89.3%) | 30,248 (85.0%) |
| 55 to 64 Years | 26,791 (83.5%) | 28,230 (82.6%) |
| 65 to 74 Years | 18,358 (87.6%) | 22,985 (84.4%) |
| 75 Years and over | 11,427 (88.8%) | 17,788 (84.0%) |
| Total | 267,270 (86.2%) | 283,875 (83.7%) |
Income Below Poverty Among Married-Couple Families in Area Code 202
The poverty statistics for married-couple families in Area Code 202 show that 3.0% or 2,382 of the total 79,884 families live below the poverty line. Families with 5 or more children have the highest poverty rate of 15.1%, comprising of 30 families. On the other hand, families with no children have the lowest poverty rate of 2.1%, which includes 990 families.
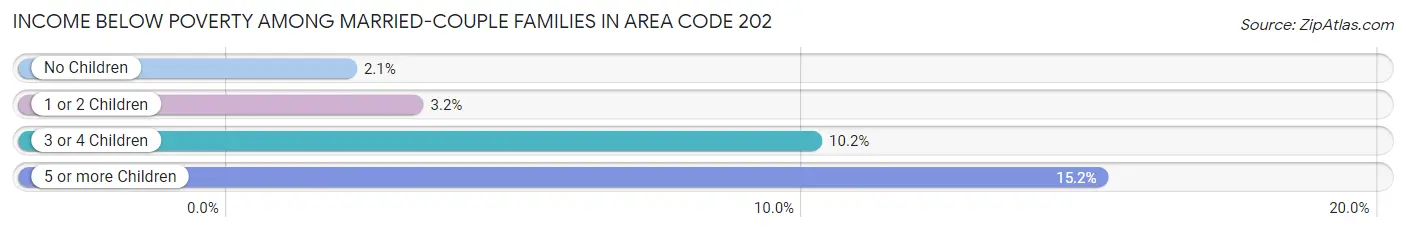
| Children | Above Poverty | Below Poverty |
| No Children | 46,871 (97.9%) | 990 (2.1%) |
| 1 or 2 Children | 26,152 (96.8%) | 874 (3.2%) |
| 3 or 4 Children | 4,311 (89.8%) | 488 (10.2%) |
| 5 or more Children | 168 (84.9%) | 30 (15.1%) |
| Total | 77,502 (97.0%) | 2,382 (3.0%) |
Income Below Poverty Among Single-Parent Households in Area Code 202
According to the poverty data in Area Code 202, 12.3% or 1,263 single-father households and 26.0% or 10,486 single-mother households are living below the poverty line. Among single-father households, those with 3 or 4 children have the highest poverty rate, with 73 households (23.3%) experiencing poverty. Likewise, among single-mother households, those with 5 or more children have the highest poverty rate, with 267 households (53.6%) falling below the poverty line.
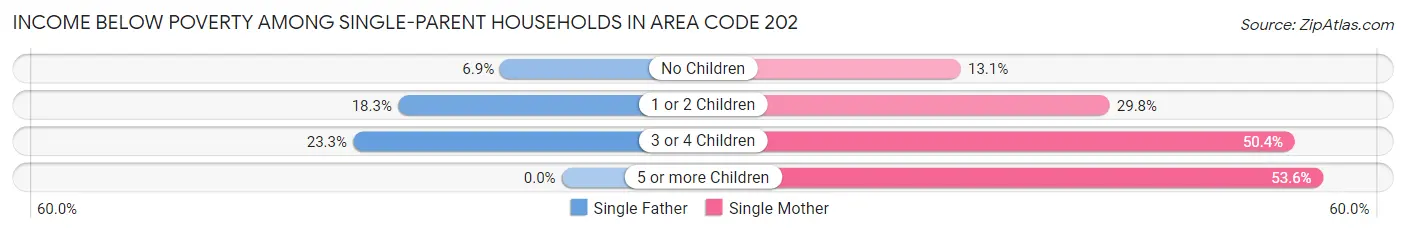
| Children | Single Father | Single Mother |
| No Children | 375 (6.9%) | 2,044 (13.1%) |
| 1 or 2 Children | 815 (18.3%) | 5,842 (29.7%) |
| 3 or 4 Children | 73 (23.3%) | 2,333 (50.4%) |
| 5 or more Children | 0 (0.0%) | 267 (53.6%) |
| Total | 1,263 (12.3%) | 10,486 (26.0%) |
Income Below Poverty Among Married-Couple vs Single-Parent Households in Area Code 202
The poverty data for Area Code 202 shows that 2,382 of the married-couple family households (3.0%) and 11,749 of the single-parent households (23.2%) are living below the poverty level. Within the married-couple family households, those with 5 or more children have the highest poverty rate, with 30 households (15.1%) falling below the poverty line. Among the single-parent households, those with 5 or more children have the highest poverty rate, with 267 household (53.6%) living below poverty.
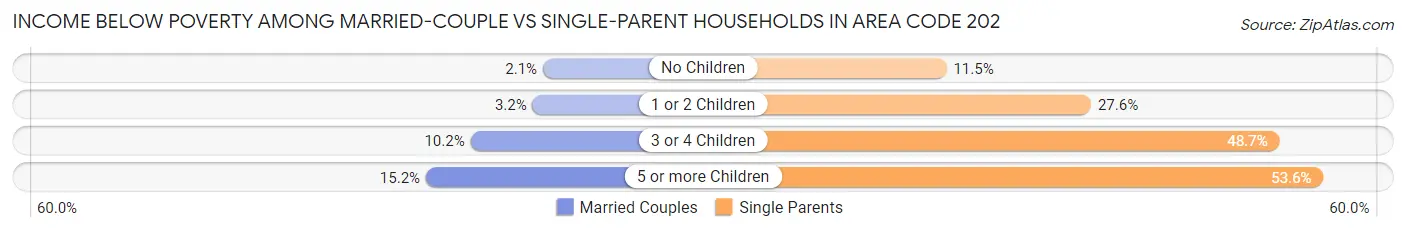
| Children | Married-Couple Families | Single-Parent Households |
| No Children | 990 (2.1%) | 2,419 (11.5%) |
| 1 or 2 Children | 874 (3.2%) | 6,657 (27.6%) |
| 3 or 4 Children | 488 (10.2%) | 2,406 (48.7%) |
| 5 or more Children | 30 (15.1%) | 267 (53.6%) |
| Total | 2,382 (3.0%) | 11,749 (23.2%) |
Race in Area Code 202
The most populous races in Area Code 202 are Black / African American (297,101 | 44.3%), White / Caucasian (265,633 | 39.6%), and Hispanic or Latino (77,168 | 11.5%).
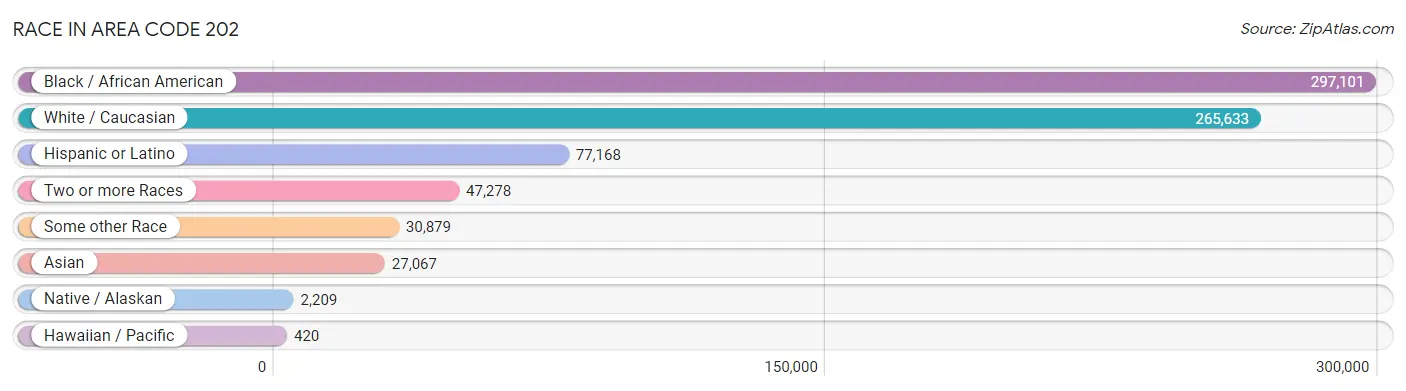
| Race | # Population | % Population |
| Asian | 27,067 | 4.0% |
| Black / African American | 297,101 | 44.3% |
| Hawaiian / Pacific | 420 | 0.1% |
| Hispanic or Latino | 77,168 | 11.5% |
| Native / Alaskan | 2,209 | 0.3% |
| White / Caucasian | 265,633 | 39.6% |
| Two or more Races | 47,278 | 7.0% |
| Some other Race | 30,879 | 4.6% |
| Total | 670,587 | 100.0% |
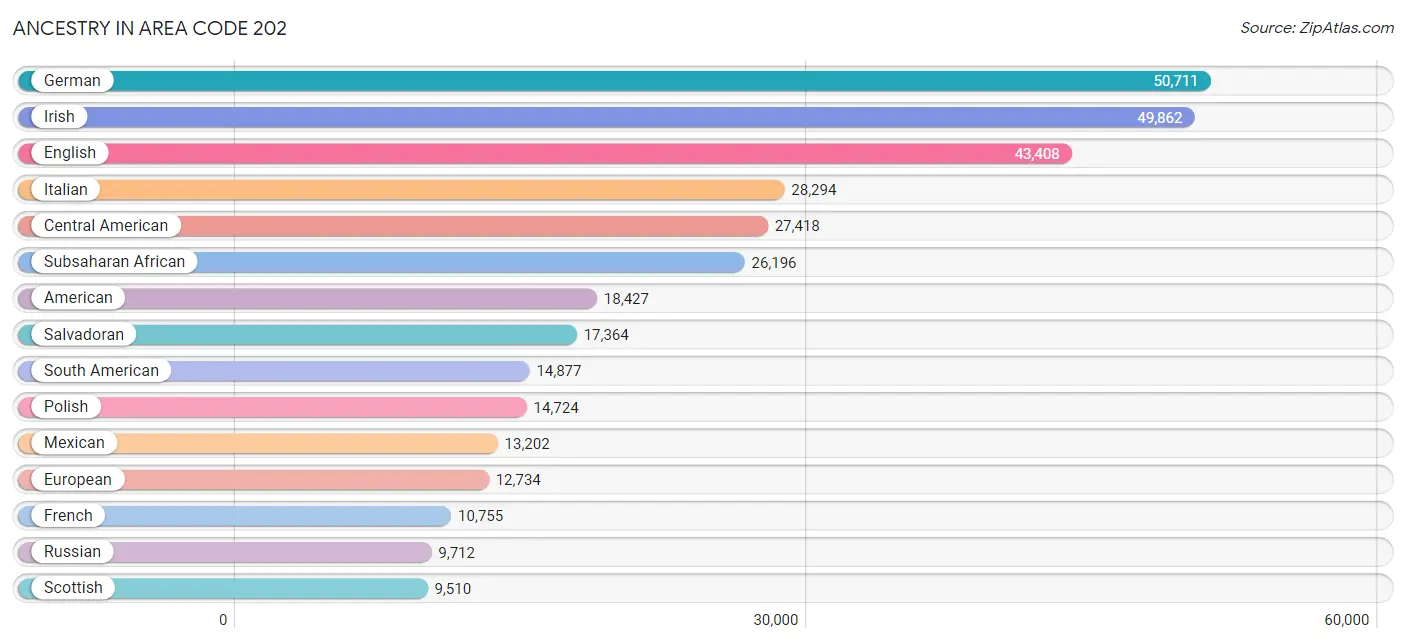
Ancestry in Area Code 202
The most populous ancestries reported in Area Code 202 are German (50,711 | 7.6%), Irish (49,862 | 7.4%), English (43,408 | 6.5%), Italian (28,294 | 4.2%), and Central American (27,418 | 4.1%), together accounting for 29.8% of all Area Code 202 residents.
| Ancestry | # Population | % Population |
| Afghan | 141 | 0.0% |
| African | 8,930 | 1.3% |
| Alaska Native | 20 | 0.0% |
| Albanian | 579 | 0.1% |
| Alsatian | 63 | 0.0% |
| American | 18,427 | 2.8% |
| Apache | 187 | 0.0% |
| Arab | 6,041 | 0.9% |
| Argentinean | 1,801 | 0.3% |
| Armenian | 884 | 0.1% |
| Assyrian / Chaldean / Syriac | 80 | 0.0% |
| Australian | 325 | 0.1% |
| Austrian | 2,233 | 0.3% |
| Bahamian | 91 | 0.0% |
| Bangladeshi | 5 | 0.0% |
| Barbadian | 101 | 0.0% |
| Basque | 153 | 0.0% |
| Belgian | 514 | 0.1% |
| Belizean | 116 | 0.0% |
| Bermudan | 85 | 0.0% |
| Bhutanese | 2,719 | 0.4% |
| Blackfeet | 723 | 0.1% |
| Bolivian | 794 | 0.1% |
| Brazilian | 1,250 | 0.2% |
| British | 5,673 | 0.9% |
| British West Indian | 439 | 0.1% |
| Bulgarian | 606 | 0.1% |
| Burmese | 4,502 | 0.7% |
| Cajun | 136 | 0.0% |
| Cambodian | 48 | 0.0% |
| Canadian | 1,228 | 0.2% |
| Cape Verdean | 175 | 0.0% |
| Carpatho Rusyn | 2 | 0.0% |
| Celtic | 49 | 0.0% |
| Central American | 27,418 | 4.1% |
| Central American Indian | 1,358 | 0.2% |
| Cherokee | 1,874 | 0.3% |
| Cheyenne | 3 | 0.0% |
| Chickasaw | 49 | 0.0% |
| Chilean | 1,306 | 0.2% |
| Chinese | 48 | 0.0% |
| Chippewa | 40 | 0.0% |
| Choctaw | 130 | 0.0% |
| Colombian | 5,058 | 0.7% |
| Colville | 59 | 0.0% |
| Comanche | 14 | 0.0% |
| Costa Rican | 1,205 | 0.2% |
| Cree | 38 | 0.0% |
| Creek | 79 | 0.0% |
| Croatian | 839 | 0.1% |
| Cuban | 3,250 | 0.5% |
| Cypriot | 111 | 0.0% |
| Czech | 2,190 | 0.3% |
| Czechoslovakian | 257 | 0.0% |
| Danish | 1,743 | 0.3% |
| Delaware | 12 | 0.0% |
| Dominican | 4,483 | 0.7% |
| Dutch | 4,819 | 0.7% |
| Eastern European | 7,091 | 1.1% |
| Ecuadorian | 946 | 0.1% |
| Egyptian | 613 | 0.1% |
| English | 43,408 | 6.5% |
| Estonian | 90 | 0.0% |
| Ethiopian | 7,736 | 1.1% |
| European | 12,734 | 1.9% |
| Fijian | 16 | 0.0% |
| Filipino | 831 | 0.1% |
| Finnish | 904 | 0.1% |
| French | 10,755 | 1.6% |
| French American Indian | 60 | 0.0% |
| French Canadian | 2,273 | 0.3% |
| German | 50,711 | 7.6% |
| German Russian | 24 | 0.0% |
| Ghanaian | 639 | 0.1% |
| Greek | 3,108 | 0.5% |
| Guamanian / Chamorro | 163 | 0.0% |
| Guatemalan | 3,397 | 0.5% |
| Guyanese | 718 | 0.1% |
| Haitian | 1,484 | 0.2% |
| Hmong | 3 | 0.0% |
| Honduran | 3,073 | 0.5% |
| Hungarian | 2,672 | 0.4% |
| Icelander | 269 | 0.0% |
| Indian (Asian) | 9,401 | 1.4% |
| Indonesian | 198 | 0.0% |
| Inupiat | 9 | 0.0% |
| Iranian | 2,439 | 0.4% |
| Iraqi | 432 | 0.1% |
| Irish | 49,862 | 7.4% |
| Iroquois | 36 | 0.0% |
| Israeli | 696 | 0.1% |
| Italian | 28,294 | 4.2% |
| Jamaican | 6,074 | 0.9% |
| Japanese | 208 | 0.0% |
| Jordanian | 73 | 0.0% |
| Kenyan | 553 | 0.1% |
| Korean | 3,831 | 0.6% |
| Laotian | 430 | 0.1% |
| Latvian | 540 | 0.1% |
| Lebanese | 1,934 | 0.3% |
| Liberian | 208 | 0.0% |
| Lithuanian | 2,487 | 0.4% |
| Lumbee | 39 | 0.0% |
| Luxembourger | 107 | 0.0% |
| Macedonian | 148 | 0.0% |
| Malaysian | 46 | 0.0% |
| Maltese | 135 | 0.0% |
| Mexican | 13,202 | 2.0% |
| Mexican American Indian | 709 | 0.1% |
| Mongolian | 80 | 0.0% |
| Moroccan | 564 | 0.1% |
| Native Hawaiian | 621 | 0.1% |
| Navajo | 103 | 0.0% |
| New Zealander | 162 | 0.0% |
| Nicaraguan | 1,138 | 0.2% |
| Nigerian | 4,069 | 0.6% |
| Northern European | 1,508 | 0.2% |
| Norwegian | 3,790 | 0.6% |
| Okinawan | 18 | 0.0% |
| Osage | 14 | 0.0% |
| Pakistani | 378 | 0.1% |
| Palestinian | 354 | 0.1% |
| Panamanian | 987 | 0.2% |
| Paraguayan | 293 | 0.0% |
| Pennsylvania German | 214 | 0.0% |
| Peruvian | 2,471 | 0.4% |
| Polish | 14,724 | 2.2% |
| Portuguese | 1,360 | 0.2% |
| Potawatomi | 7 | 0.0% |
| Pueblo | 57 | 0.0% |
| Puerto Rican | 6,020 | 0.9% |
| Romanian | 1,392 | 0.2% |
| Russian | 9,712 | 1.5% |
| Salvadoran | 17,364 | 2.6% |
| Samoan | 62 | 0.0% |
| Scandinavian | 1,083 | 0.2% |
| Scotch-Irish | 4,321 | 0.6% |
| Scottish | 9,510 | 1.4% |
| Seminole | 64 | 0.0% |
| Senegalese | 300 | 0.0% |
| Serbian | 438 | 0.1% |
| Sierra Leonean | 277 | 0.0% |
| Sioux | 8 | 0.0% |
| Slavic | 121 | 0.0% |
| Slovak | 1,273 | 0.2% |
| Slovene | 317 | 0.1% |
| Somali | 136 | 0.0% |
| South African | 439 | 0.1% |
| South American | 14,877 | 2.2% |
| South American Indian | 312 | 0.1% |
| Soviet Union | 15 | 0.0% |
| Spaniard | 4,116 | 0.6% |
| Spanish | 1,506 | 0.2% |
| Sri Lankan | 2,763 | 0.4% |
| Subsaharan African | 26,196 | 3.9% |
| Sudanese | 118 | 0.0% |
| Swedish | 5,839 | 0.9% |
| Swiss | 1,733 | 0.3% |
| Syrian | 599 | 0.1% |
| Taiwanese | 15 | 0.0% |
| Thai | 9,497 | 1.4% |
| Tlingit-Haida | 33 | 0.0% |
| Tongan | 23 | 0.0% |
| Trinidadian and Tobagonian | 2,117 | 0.3% |
| Turkish | 1,153 | 0.2% |
| U.S. Virgin Islander | 98 | 0.0% |
| Ugandan | 168 | 0.0% |
| Ukrainian | 3,348 | 0.5% |
| Uruguayan | 492 | 0.1% |
| Venezuelan | 1,649 | 0.3% |
| Vietnamese | 516 | 0.1% |
| Welsh | 3,030 | 0.4% |
| West Indian | 1,501 | 0.2% |
| Yaqui | 19 | 0.0% |
| Yugoslavian | 162 | 0.0% |
| Zimbabwean | 62 | 0.0% | View All 176 Rows |
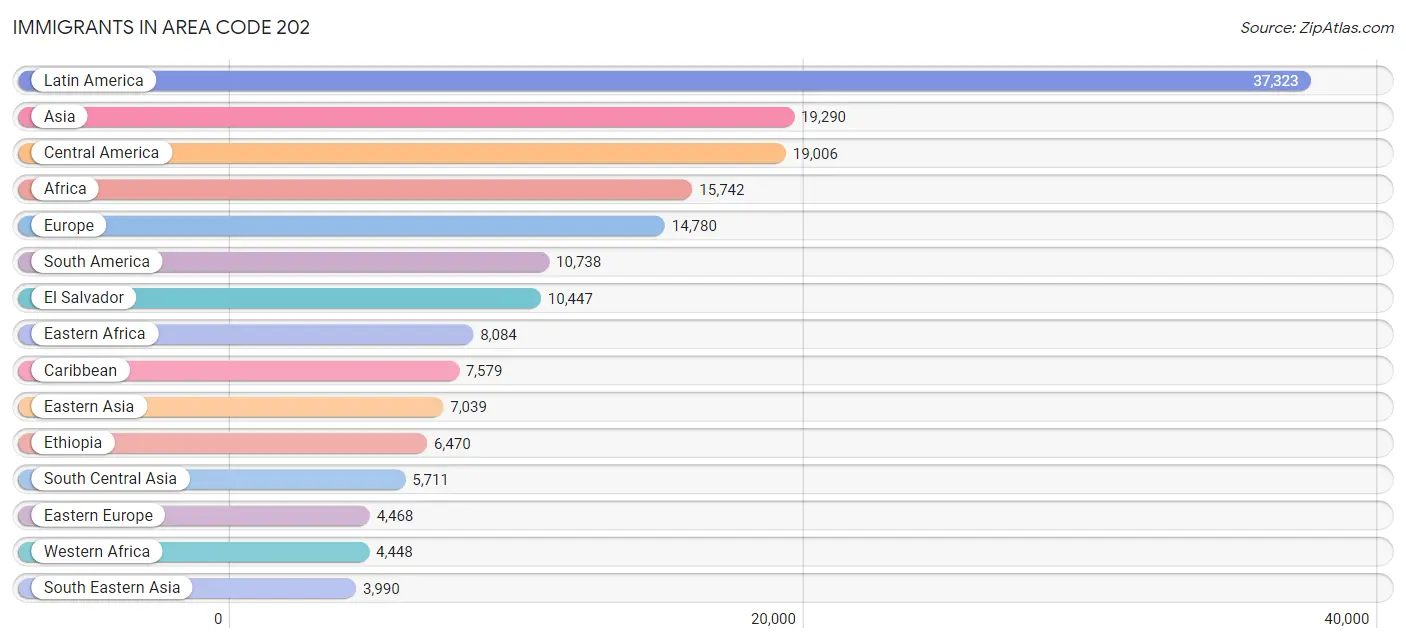
Immigrants in Area Code 202
The most numerous immigrant groups reported in Area Code 202 came from Latin America (37,323 | 5.6%), Asia (19,290 | 2.9%), Central America (19,006 | 2.8%), Africa (15,742 | 2.4%), and Europe (14,780 | 2.2%), together accounting for 15.8% of all Area Code 202 residents.
| Immigration Origin | # Population | % Population |
| Afghanistan | 92 | 0.0% |
| Africa | 15,742 | 2.4% |
| Albania | 258 | 0.0% |
| Argentina | 1,026 | 0.2% |
| Armenia | 139 | 0.0% |
| Asia | 19,290 | 2.9% |
| Australia | 603 | 0.1% |
| Austria | 52 | 0.0% |
| Bahamas | 44 | 0.0% |
| Bangladesh | 381 | 0.1% |
| Barbados | 58 | 0.0% |
| Belarus | 162 | 0.0% |
| Belgium | 264 | 0.0% |
| Belize | 49 | 0.0% |
| Bolivia | 461 | 0.1% |
| Brazil | 1,324 | 0.2% |
| Bulgaria | 411 | 0.1% |
| Cabo Verde | 2 | 0.0% |
| Cambodia | 53 | 0.0% |
| Cameroon | 959 | 0.1% |
| Canada | 2,077 | 0.3% |
| Caribbean | 7,579 | 1.1% |
| Central America | 19,006 | 2.8% |
| Chile | 640 | 0.1% |
| China | 3,974 | 0.6% |
| Colombia | 2,899 | 0.4% |
| Congo | 15 | 0.0% |
| Costa Rica | 458 | 0.1% |
| Croatia | 88 | 0.0% |
| Cuba | 635 | 0.1% |
| Czechoslovakia | 205 | 0.0% |
| Denmark | 27 | 0.0% |
| Dominica | 125 | 0.0% |
| Dominican Republic | 2,028 | 0.3% |
| Eastern Africa | 8,084 | 1.2% |
| Eastern Asia | 7,039 | 1.1% |
| Eastern Europe | 4,468 | 0.7% |
| Ecuador | 540 | 0.1% |
| Egypt | 258 | 0.0% |
| El Salvador | 10,447 | 1.6% |
| England | 762 | 0.1% |
| Eritrea | 299 | 0.0% |
| Ethiopia | 6,470 | 1.0% |
| Europe | 14,780 | 2.2% |
| France | 1,612 | 0.2% |
| Germany | 1,465 | 0.2% |
| Ghana | 547 | 0.1% |
| Greece | 281 | 0.0% |
| Grenada | 110 | 0.0% |
| Guatemala | 1,852 | 0.3% |
| Guyana | 556 | 0.1% |
| Haiti | 305 | 0.1% |
| Honduras | 1,685 | 0.3% |
| Hong Kong | 376 | 0.1% |
| Hungary | 134 | 0.0% |
| India | 3,088 | 0.5% |
| Indonesia | 297 | 0.0% |
| Iran | 1,199 | 0.2% |
| Iraq | 176 | 0.0% |
| Ireland | 302 | 0.1% |
| Israel | 402 | 0.1% |
| Italy | 876 | 0.1% |
| Jamaica | 2,468 | 0.4% |
| Japan | 953 | 0.1% |
| Jordan | 42 | 0.0% |
| Kazakhstan | 152 | 0.0% |
| Kenya | 515 | 0.1% |
| Korea | 2,083 | 0.3% |
| Kuwait | 59 | 0.0% |
| Laos | 10 | 0.0% |
| Latin America | 37,323 | 5.6% |
| Latvia | 115 | 0.0% |
| Lebanon | 329 | 0.1% |
| Liberia | 156 | 0.0% |
| Lithuania | 152 | 0.0% |
| Malaysia | 130 | 0.0% |
| Mexico | 3,373 | 0.5% |
| Middle Africa | 1,430 | 0.2% |
| Moldova | 12 | 0.0% |
| Morocco | 443 | 0.1% |
| Nepal | 232 | 0.0% |
| Netherlands | 290 | 0.0% |
| Nicaragua | 699 | 0.1% |
| Nigeria | 2,332 | 0.4% |
| Northern Africa | 985 | 0.2% |
| Northern Europe | 3,527 | 0.5% |
| Norway | 111 | 0.0% |
| Oceania | 795 | 0.1% |
| Pakistan | 413 | 0.1% |
| Panama | 443 | 0.1% |
| Peru | 1,377 | 0.2% |
| Philippines | 1,508 | 0.2% |
| Poland | 292 | 0.0% |
| Portugal | 112 | 0.0% |
| Romania | 361 | 0.1% |
| Russia | 1,075 | 0.2% |
| Saudi Arabia | 215 | 0.0% |
| Scotland | 37 | 0.0% |
| Senegal | 291 | 0.0% |
| Serbia | 225 | 0.0% |
| Sierra Leone | 291 | 0.0% |
| Singapore | 151 | 0.0% |
| Somalia | 37 | 0.0% |
| South Africa | 492 | 0.1% |
| South America | 10,738 | 1.6% |
| South Central Asia | 5,711 | 0.9% |
| South Eastern Asia | 3,990 | 0.6% |
| Southern Europe | 2,901 | 0.4% |
| Spain | 1,632 | 0.2% |
| Sri Lanka | 77 | 0.0% |
| St. Vincent and the Grenadines | 115 | 0.0% |
| Sudan | 91 | 0.0% |
| Sweden | 405 | 0.1% |
| Switzerland | 188 | 0.0% |
| Syria | 223 | 0.0% |
| Taiwan | 334 | 0.1% |
| Thailand | 159 | 0.0% |
| Trinidad and Tobago | 1,494 | 0.2% |
| Turkey | 378 | 0.1% |
| Uganda | 155 | 0.0% |
| Ukraine | 438 | 0.1% |
| Uruguay | 454 | 0.1% |
| Uzbekistan | 77 | 0.0% |
| Venezuela | 1,166 | 0.2% |
| Vietnam | 1,503 | 0.2% |
| West Indies | 37 | 0.0% |
| Western Africa | 4,448 | 0.7% |
| Western Asia | 2,546 | 0.4% |
| Western Europe | 3,871 | 0.6% |
| Zaire | 347 | 0.1% |
| Zimbabwe | 51 | 0.0% | View All 131 Rows |
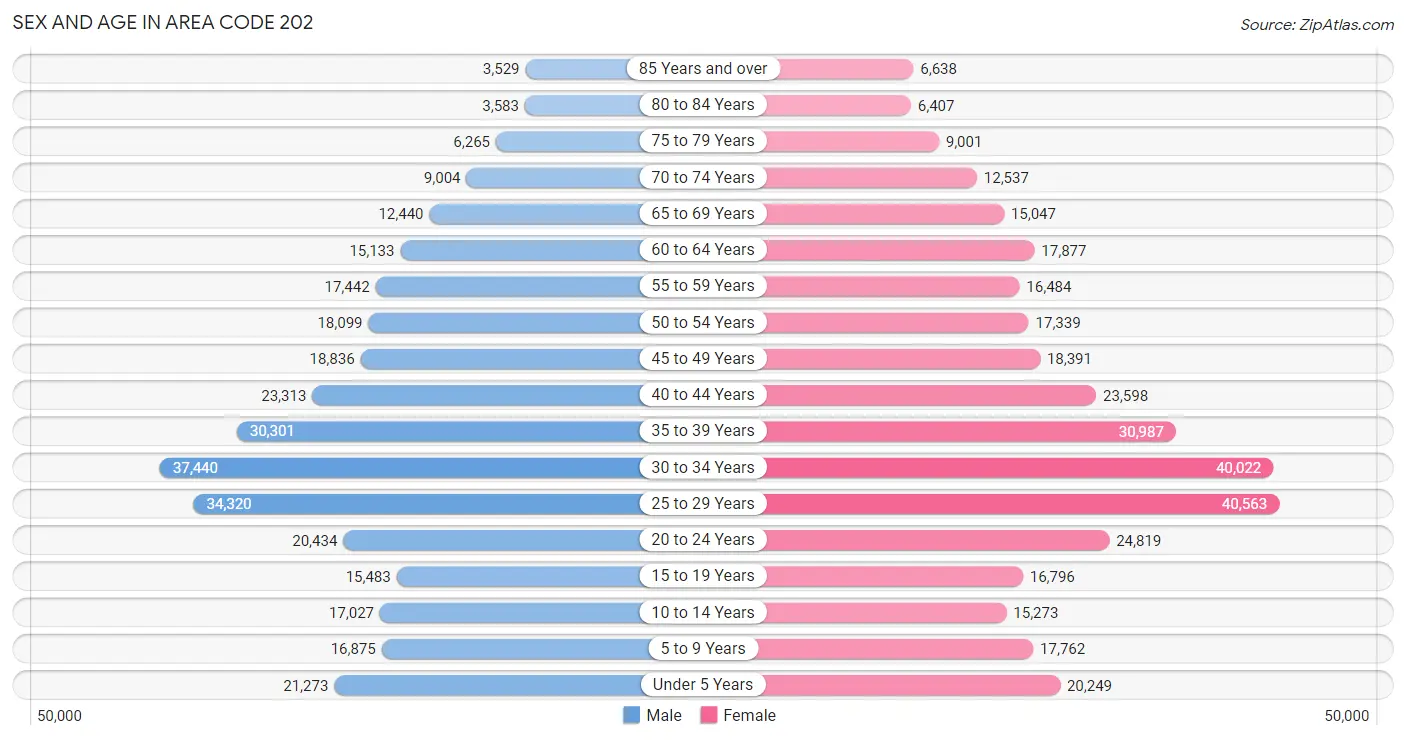
Sex and Age in Area Code 202
Sex and Age in Area Code 202
The most populous age groups in Area Code 202 are 30 to 34 Years (37,440 | 11.7%) for men and 25 to 29 Years (40,563 | 11.6%) for women.
| Age Bracket | Male | Female |
| Under 5 Years | 21,273 (6.6%) | 20,249 (5.8%) |
| 5 to 9 Years | 16,875 (5.3%) | 17,762 (5.1%) |
| 10 to 14 Years | 17,027 (5.3%) | 15,273 (4.4%) |
| 15 to 19 Years | 15,483 (4.8%) | 16,796 (4.8%) |
| 20 to 24 Years | 20,434 (6.4%) | 24,819 (7.1%) |
| 25 to 29 Years | 34,320 (10.7%) | 40,563 (11.6%) |
| 30 to 34 Years | 37,440 (11.7%) | 40,022 (11.4%) |
| 35 to 39 Years | 30,301 (9.5%) | 30,987 (8.9%) |
| 40 to 44 Years | 23,313 (7.3%) | 23,598 (6.8%) |
| 45 to 49 Years | 18,836 (5.9%) | 18,391 (5.3%) |
| 50 to 54 Years | 18,099 (5.6%) | 17,339 (5.0%) |
| 55 to 59 Years | 17,442 (5.4%) | 16,484 (4.7%) |
| 60 to 64 Years | 15,133 (4.7%) | 17,877 (5.1%) |
| 65 to 69 Years | 12,440 (3.9%) | 15,047 (4.3%) |
| 70 to 74 Years | 9,004 (2.8%) | 12,537 (3.6%) |
| 75 to 79 Years | 6,265 (1.9%) | 9,001 (2.6%) |
| 80 to 84 Years | 3,583 (1.1%) | 6,407 (1.8%) |
| 85 Years and over | 3,529 (1.1%) | 6,638 (1.9%) |
| Total | 320,797 (100.0%) | 349,790 (100.0%) |
Families and Households in Area Code 202
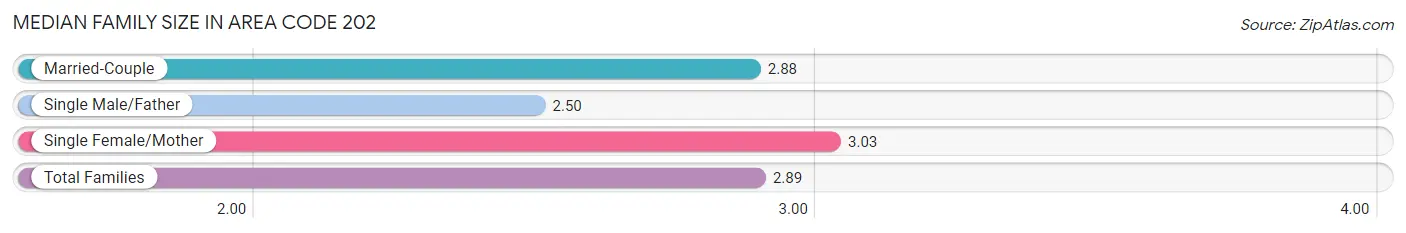
Median Family Size in Area Code 202
The median family size in Area Code 202 is 2.89 persons per family, with single female/mother families (40,342 | 30.9%) accounting for the largest median family size of 3.02666 persons per family. On the other hand, single male/father families (10,227 | 7.8%) represent the smallest median family size with 2.50 persons per family.
| Family Type | # Families | Family Size |
| Married-Couple | 79,884 (61.2%) | 2.88 |
| Single Male/Father | 10,227 (7.8%) | 2.50 |
| Single Female/Mother | 40,342 (30.9%) | 3.03 |
| Total Families | 130,453 (100.0%) | 2.89 |
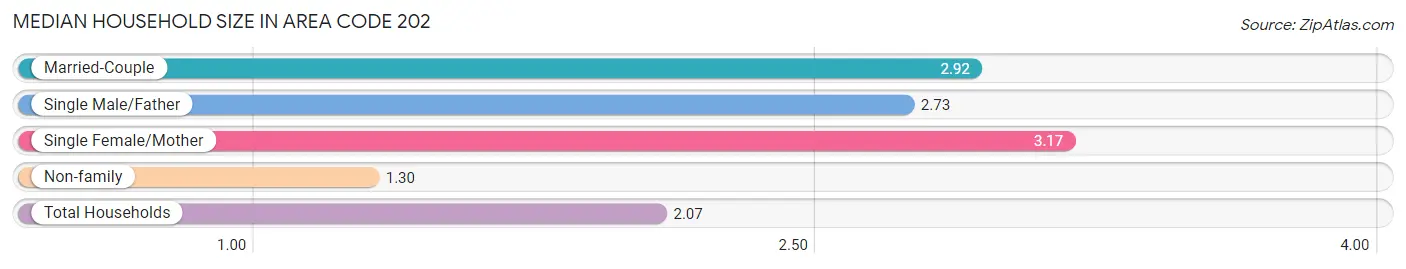
Median Household Size in Area Code 202
The median household size in Area Code 202 is 2.07 persons per household, with single female/mother households (40,342 | 12.8%) accounting for the largest median household size of 3.16571 persons per household. non-family households (185,332 | 58.7%) represent the smallest median household size with 1.30 persons per household.
| Household Type | # Households | Household Size |
| Married-Couple | 79,884 (25.3%) | 2.92 |
| Single Male/Father | 10,227 (3.2%) | 2.73 |
| Single Female/Mother | 40,342 (12.8%) | 3.17 |
| Non-family | 185,332 (58.7%) | 1.30 |
| Total Households | 315,785 (100.0%) | 2.07 |
Household Size by Marriage Status in Area Code 202
Out of a total of 315,785 households in Area Code 202, 130,453 (41.3%) are family households, while 185,332 (58.7%) are nonfamily households. The most numerous type of family households are 2-person households, comprising 64,147, and the most common type of nonfamily households are 1-person households, comprising 146,319.
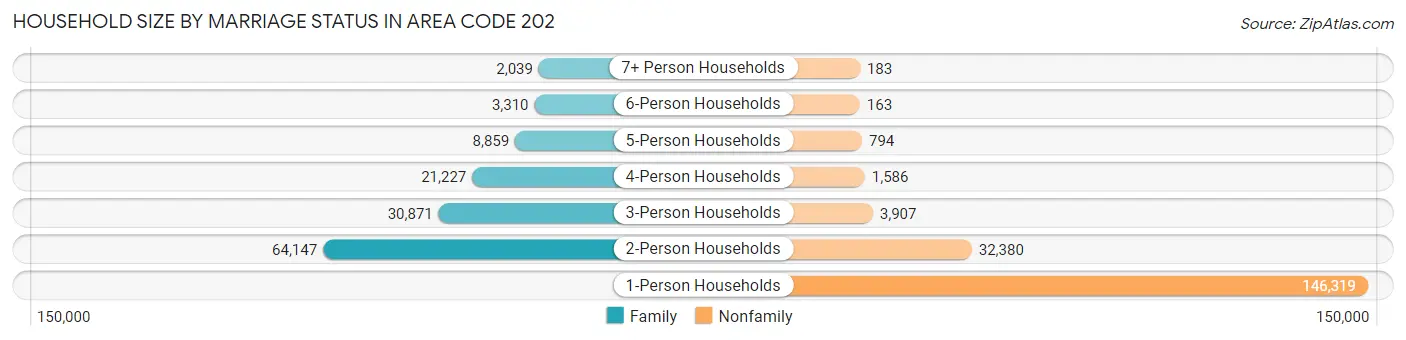
| Household Size | Family Households | Nonfamily Households |
| 1-Person Households | - | 146,319 (46.3%) |
| 2-Person Households | 64,147 (20.3%) | 32,380 (10.2%) |
| 3-Person Households | 30,871 (9.8%) | 3,907 (1.2%) |
| 4-Person Households | 21,227 (6.7%) | 1,586 (0.5%) |
| 5-Person Households | 8,859 (2.8%) | 794 (0.3%) |
| 6-Person Households | 3,310 (1.1%) | 163 (0.1%) |
| 7+ Person Households | 2,039 (0.6%) | 183 (0.1%) |
| Total | 130,453 (41.3%) | 185,332 (58.7%) |
Female Fertility in Area Code 202
Fertility by Age in Area Code 202
Average fertility rate in Area Code 202 is 39.4 births per 1,000 women. Women in the age bracket of 20 to 34 years have the highest fertility rate with 49.5 births per 1,000 women. Women in the age bracket of 20 to 34 years acount for 59.2% of all women with births.
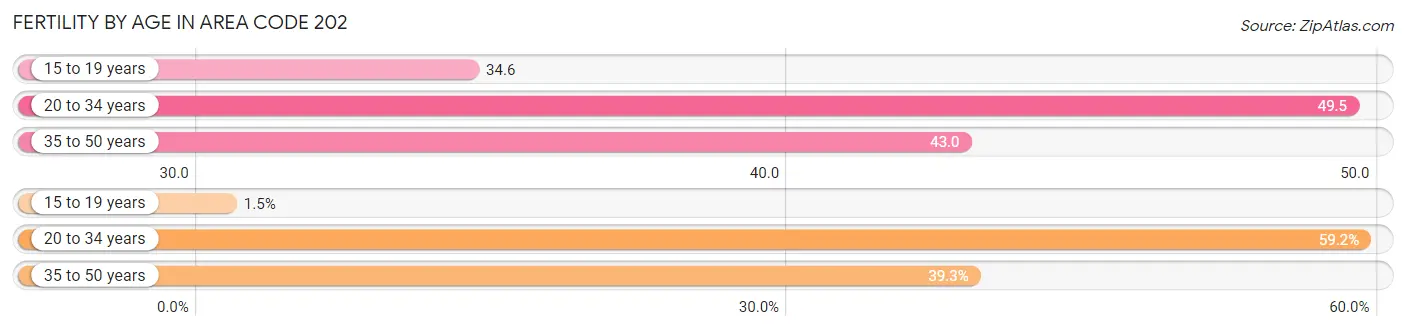
| Age Bracket | Women with Births | Births / 1,000 Women |
| 15 to 19 years | 123 (1.5%) | 34.6 |
| 20 to 34 years | 4,937 (59.2%) | 49.5 |
| 35 to 50 years | 3,279 (39.3%) | 43.0 |
| Total | 8,339 (100.0%) | 39.4 |
Fertility by Age by Marriage Status in Area Code 202
58.8% of women with births (8,339) in Area Code 202 are married. The highest percentage of unmarried women with births falls into 15 to 19 years age bracket with 100.0% of them unmarried at the time of birth, while the lowest percentage of unmarried women with births belong to 35 to 50 years age bracket with 32.7% of them unmarried.
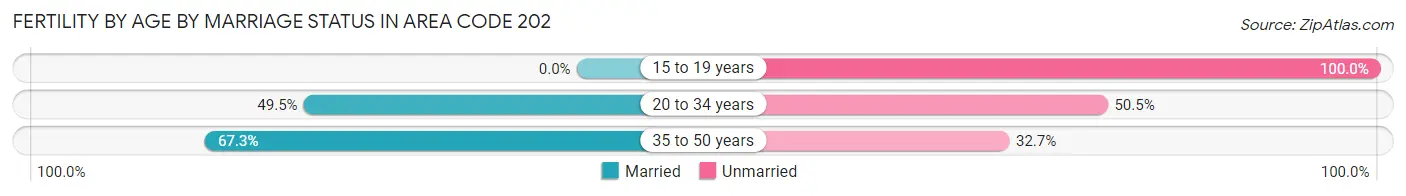
| Age Bracket | Married | Unmarried |
| 15 to 19 years | 0 (0.0%) | 123 (100.0%) |
| 20 to 34 years | 2,443 (49.5%) | 2,494 (50.5%) |
| 35 to 50 years | 2,207 (67.3%) | 1,072 (32.7%) |
| Total | 4,903 (58.8%) | 3,436 (41.2%) |
Fertility by Education in Area Code 202
Average fertility rate in Area Code 202 is 39.4 births per 1,000 women. Women with the education attainment of high school diploma have the highest fertility rate of 131.3 births per 1,000 women, while women with the education attainment of graduate degree have the lowest fertility at 41.6 births per 1,000 women. Women with the education attainment of graduate degree represent 32.9% of all women with births.
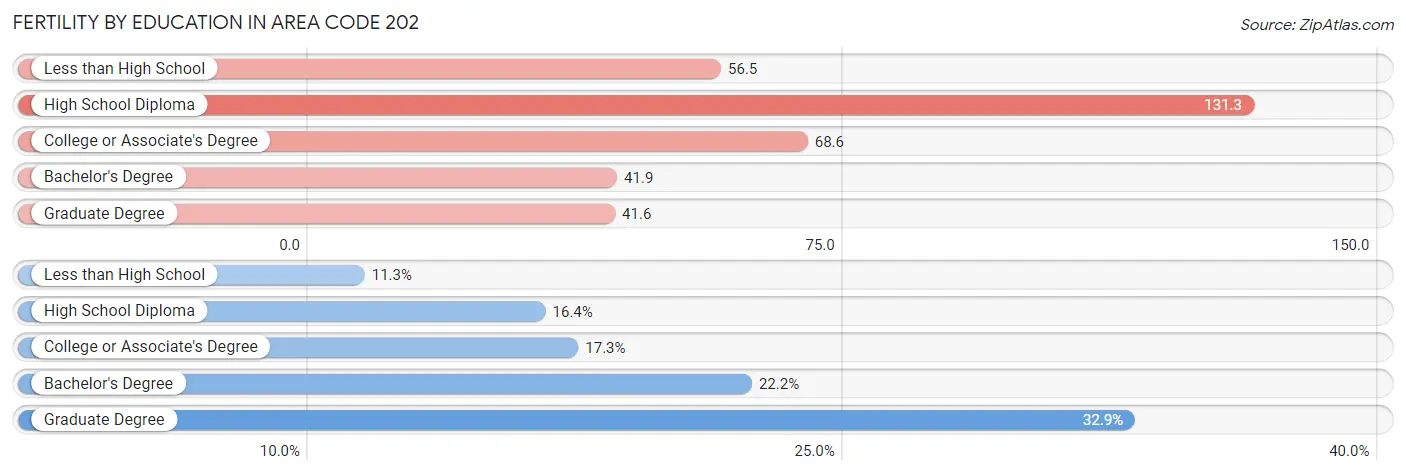
| Educational Attainment | Women with Births | Births / 1,000 Women |
| Less than High School | 941 (11.3%) | 56.5 |
| High School Diploma | 1,364 (16.4%) | 131.3 |
| College or Associate's Degree | 1,441 (17.3%) | 68.6 |
| Bachelor's Degree | 1,848 (22.2%) | 41.9 |
| Graduate Degree | 2,745 (32.9%) | 41.6 |
| Total | 8,339 (100.0%) | 39.4 |
Fertility by Education by Marriage Status in Area Code 202
41.2% of women with births in Area Code 202 are unmarried. Women with the educational attainment of graduate degree are most likely to be married with 89.6% of them married at childbirth, while women with the educational attainment of less than high school are least likely to be married with 88.5% of them unmarried at childbirth.
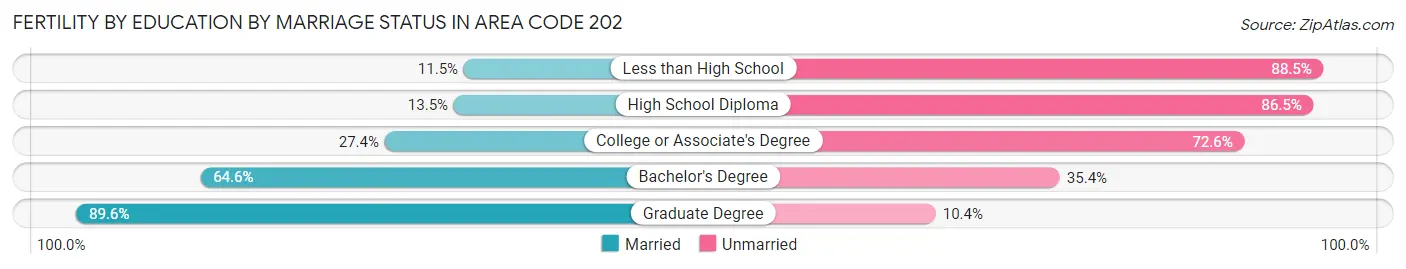
| Educational Attainment | Married | Unmarried |
| Less than High School | 108 (11.5%) | 833 (88.5%) |
| High School Diploma | 184 (13.5%) | 1,180 (86.5%) |
| College or Associate's Degree | 395 (27.4%) | 1,046 (72.6%) |
| Bachelor's Degree | 1,194 (64.6%) | 654 (35.4%) |
| Graduate Degree | 2,460 (89.6%) | 285 (10.4%) |
| Total | 4,903 (58.8%) | 3,436 (41.2%) |
Employment Characteristics in Area Code 202
Employment by Class of Employer in Area Code 202
Among the 366,965 employed individuals in Area Code 202, private company employees (171,653 | 46.8%), not-for-profit organizations (71,618 | 19.5%), and federal government employees (69,582 | 19.0%) make up the most common classes of employment.
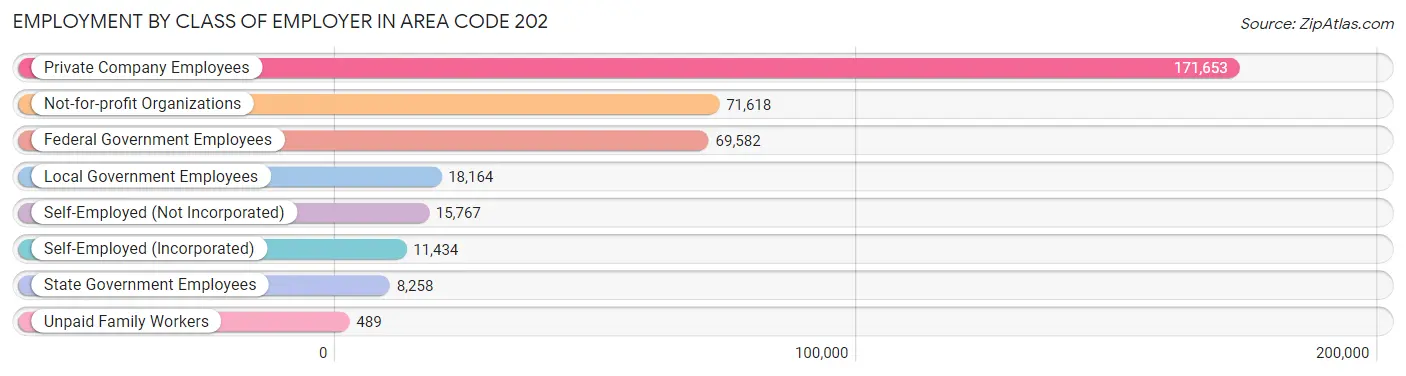
| Employer Class | # Employees | % Employees |
| Private Company Employees | 171,653 | 46.8% |
| Self-Employed (Incorporated) | 11,434 | 3.1% |
| Self-Employed (Not Incorporated) | 15,767 | 4.3% |
| Not-for-profit Organizations | 71,618 | 19.5% |
| Local Government Employees | 18,164 | 5.0% |
| State Government Employees | 8,258 | 2.2% |
| Federal Government Employees | 69,582 | 19.0% |
| Unpaid Family Workers | 489 | 0.1% |
| Total | 366,965 | 100.0% |
Employment Status by Age in Area Code 202
According to the labor force statistics for Area Code 202, out of the total population over 16 years of age (556,781), 69.1% or 384,680 individuals are in the labor force, with 7.2% or 27,582 of them unemployed. The age group with the highest labor force participation rate is 30 to 34 years, with 91.5% or 70,901 individuals in the labor force. Within the labor force, the 16 to 19 years age range has the highest percentage of unemployed individuals, with 565.8% or 54,871 of them being unemployed.
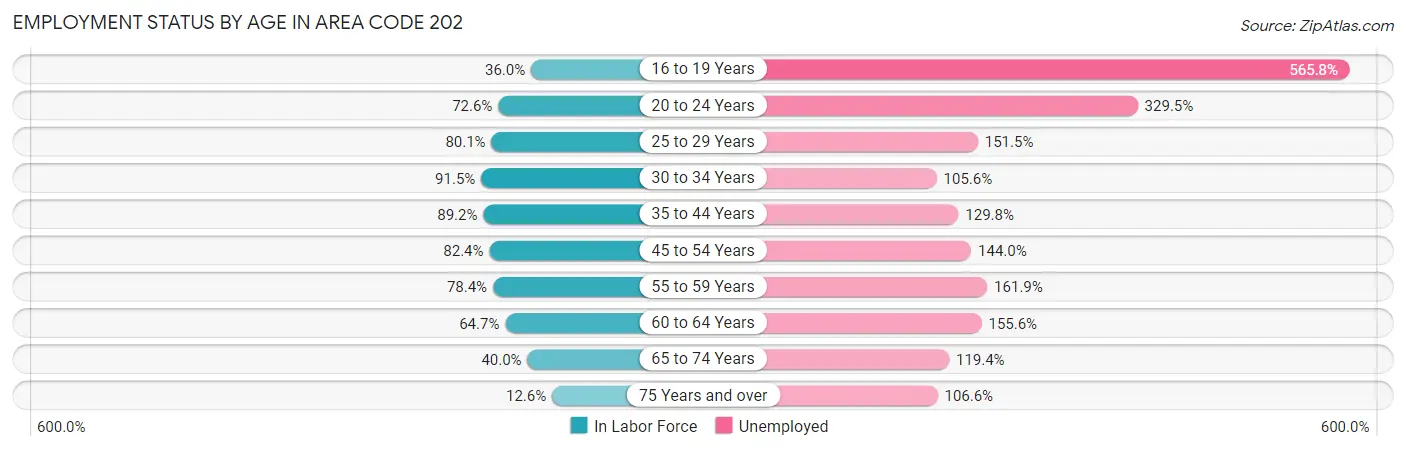
| Age Bracket | In Labor Force | Unemployed |
| 16 to 19 Years | 9,699 (36.0%) | 54,871 (565.8%) |
| 20 to 24 Years | 32,835 (72.6%) | 108,195 (329.5%) |
| 25 to 29 Years | 59,968 (80.1%) | 90,848 (151.5%) |
| 30 to 34 Years | 70,902 (91.5%) | 74,871 (105.6%) |
| 35 to 44 Years | 96,469 (89.2%) | 125,218 (129.8%) |
| 45 to 54 Years | 59,879 (82.4%) | 86,221 (144.0%) |
| 55 to 59 Years | 26,600 (78.4%) | 43,062 (161.9%) |
| 60 to 64 Years | 21,367 (64.7%) | 33,247 (155.6%) |
| 65 to 74 Years | 19,600 (40.0%) | 23,404 (119.4%) |
| 75 Years and over | 4,467 (12.6%) | 4,762 (106.6%) |
| Total | 384,678 (69.1%) | 27,593 (7.2%) |
Employment Status by Educational Attainment in Area Code 202
According to labor force statistics for Area Code 202, 77.9% of individuals (311,593) out of the total population between 25 and 64 years of age (400,145) are in the labor force, with 132.4% or 412,549 of them being unemployed. The group with the highest labor force participation rate are those with the educational attainment of bachelor's degree or higher, with 82.4% or 215,927 individuals in the labor force. Within the labor force, individuals with less than high school education have the highest percentage of unemployment, with 348.2% or 50,520 of them being unemployed.
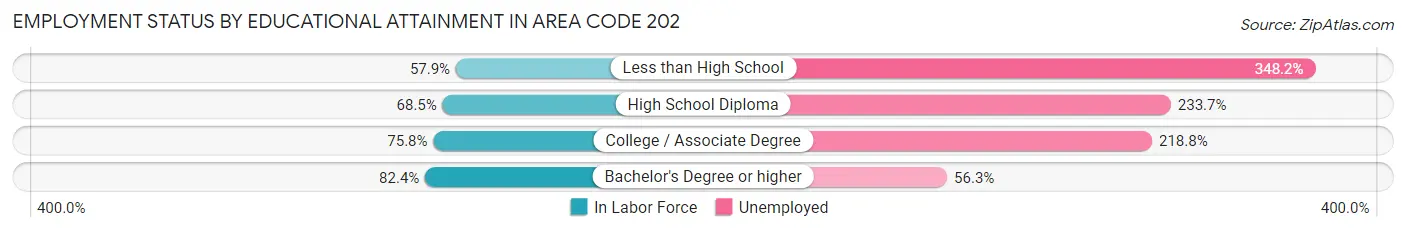
| Educational Attainment | In Labor Force | Unemployed |
| Less than High School | 14,508 (57.9%) | 87,255 (348.2%) |
| High School Diploma | 37,814 (68.5%) | 129,019 (233.7%) |
| College / Associate Degree | 43,725 (75.8%) | 126,189 (218.8%) |
| Bachelor's Degree or higher | 215,936 (82.4%) | 147,622 (56.3%) |
| Total | 311,575 (77.9%) | 529,792 (132.4%) |
Employment Occupations by Sex in Area Code 202
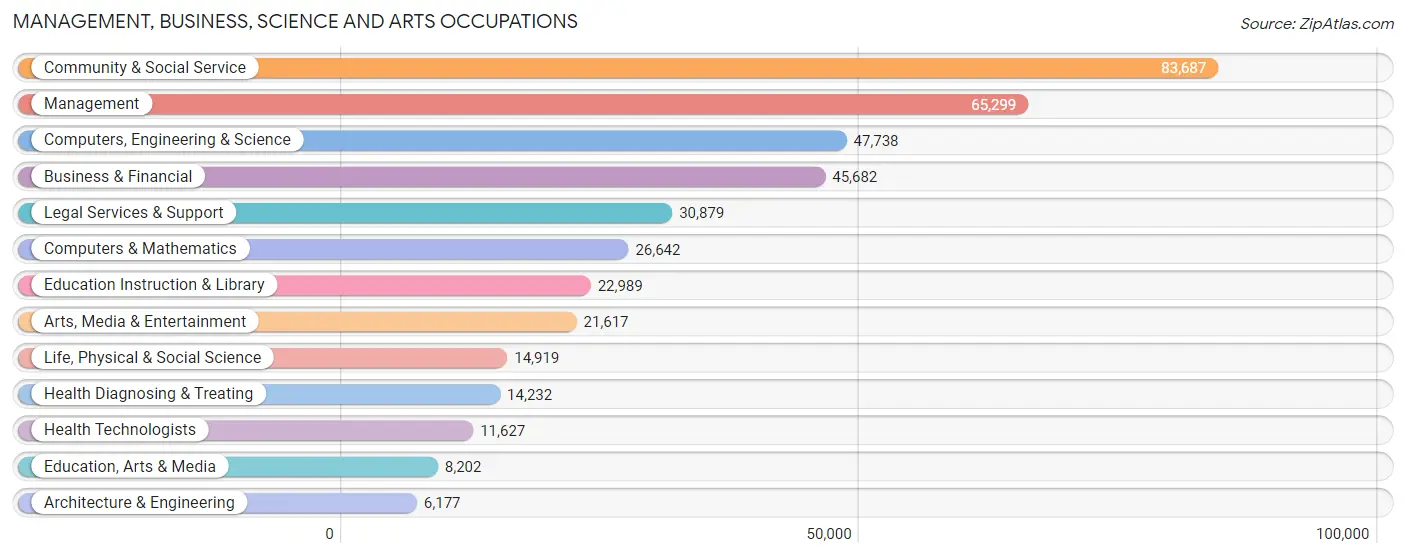
Management, Business, Science and Arts Occupations
The most common Management, Business, Science and Arts occupations in Area Code 202 are Community & Social Service (83,687 | 22.7%), Management (65,299 | 17.7%), Computers, Engineering & Science (47,738 | 12.9%), Business & Financial (45,682 | 12.4%), and Legal Services & Support (30,879 | 8.4%).
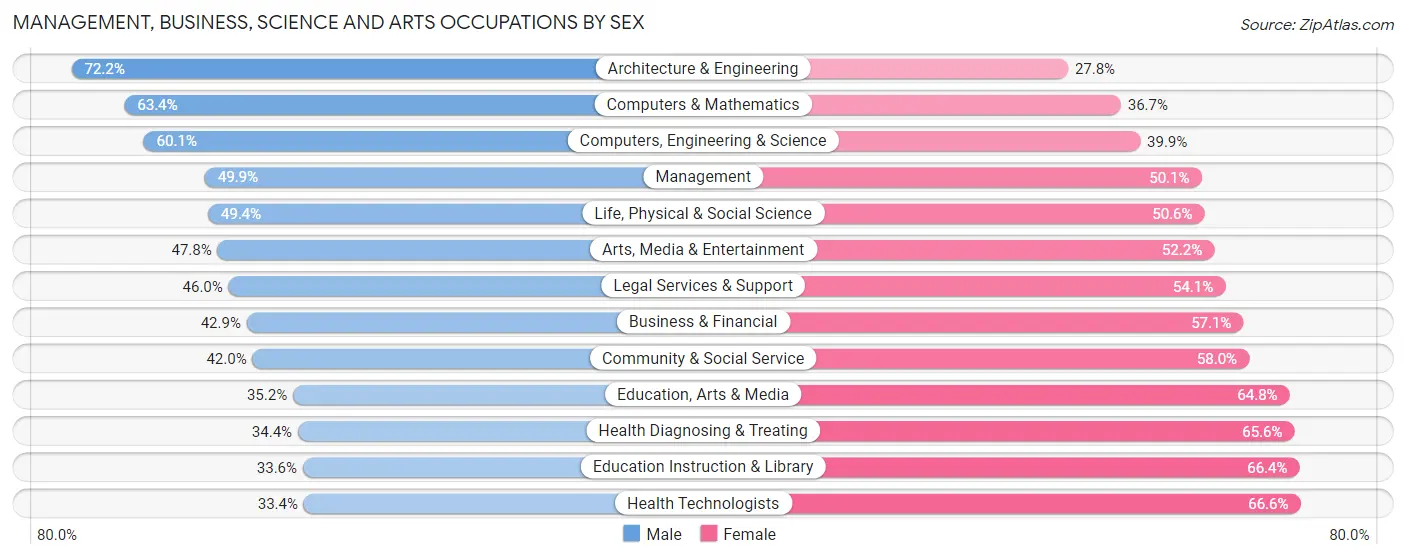
Management, Business, Science and Arts Occupations by Sex
Within the Management, Business, Science and Arts occupations in Area Code 202, the most male-oriented occupations are Architecture & Engineering (72.2%), Computers & Mathematics (63.3%), and Computers, Engineering & Science (60.1%), while the most female-oriented occupations are Health Technologists (66.6%), Education Instruction & Library (66.4%), and Health Diagnosing & Treating (65.6%).
| Occupation | Male | Female |
| Management | 32,600 (49.9%) | 32,699 (50.1%) |
| Business & Financial | 19,611 (42.9%) | 26,071 (57.1%) |
| Computers, Engineering & Science | 28,707 (60.1%) | 19,031 (39.9%) |
| Computers & Mathematics | 16,878 (63.3%) | 9,764 (36.6%) |
| Architecture & Engineering | 4,458 (72.2%) | 1,719 (27.8%) |
| Life, Physical & Social Science | 7,371 (49.4%) | 7,548 (50.6%) |
| Community & Social Service | 35,125 (42.0%) | 48,562 (58.0%) |
| Education, Arts & Media | 2,888 (35.2%) | 5,314 (64.8%) |
| Legal Services & Support | 14,189 (46.0%) | 16,690 (54.0%) |
| Education Instruction & Library | 7,716 (33.6%) | 15,273 (66.4%) |
| Arts, Media & Entertainment | 10,332 (47.8%) | 11,285 (52.2%) |
| Health Diagnosing & Treating | 4,895 (34.4%) | 9,337 (65.6%) |
| Health Technologists | 3,883 (33.4%) | 7,744 (66.6%) |
| Total (Category) | 120,938 (47.1%) | 135,700 (52.9%) |
| Total (Overall) | 178,439 (48.3%) | 190,959 (51.7%) |
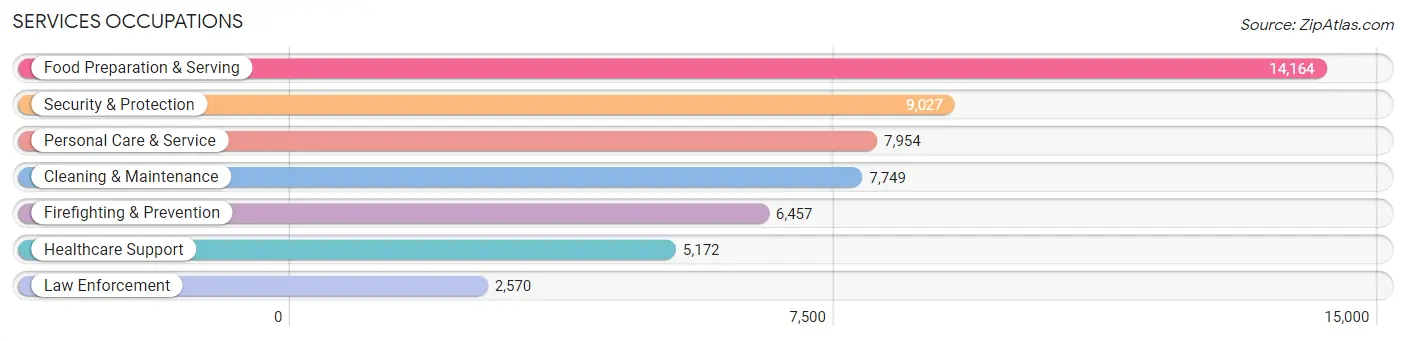
Services Occupations
The most common Services occupations in Area Code 202 are Food Preparation & Serving (14,164 | 3.8%), Security & Protection (9,027 | 2.4%), Personal Care & Service (7,954 | 2.1%), Cleaning & Maintenance (7,749 | 2.1%), and Firefighting & Prevention (6,457 | 1.8%).
Services Occupations by Sex
Within the Services occupations in Area Code 202, the most male-oriented occupations are Law Enforcement (71.2%), Cleaning & Maintenance (53.0%), and Security & Protection (52.3%), while the most female-oriented occupations are Personal Care & Service (76.9%), Healthcare Support (71.9%), and Firefighting & Prevention (55.2%).

| Occupation | Male | Female |
| Healthcare Support | 1,453 (28.1%) | 3,719 (71.9%) |
| Security & Protection | 4,723 (52.3%) | 4,304 (47.7%) |
| Firefighting & Prevention | 2,893 (44.8%) | 3,564 (55.2%) |
| Law Enforcement | 1,830 (71.2%) | 740 (28.8%) |
| Food Preparation & Serving | 7,098 (50.1%) | 7,066 (49.9%) |
| Cleaning & Maintenance | 4,107 (53.0%) | 3,642 (47.0%) |
| Personal Care & Service | 1,838 (23.1%) | 6,116 (76.9%) |
| Total (Category) | 19,219 (43.6%) | 24,847 (56.4%) |
| Total (Overall) | 178,439 (48.3%) | 190,959 (51.7%) |
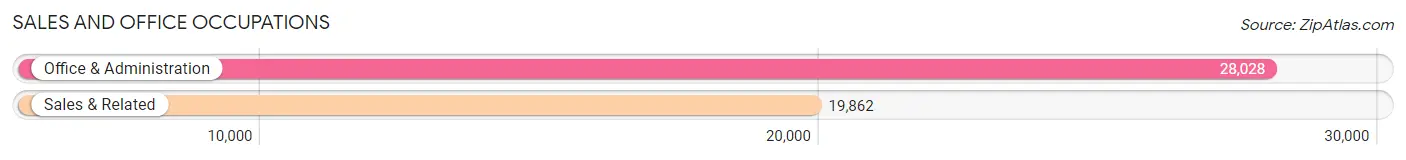
Sales and Office Occupations
The most common Sales and Office occupations in Area Code 202 are Office & Administration (28,028 | 7.6%), and Sales & Related (19,862 | 5.4%).
Sales and Office Occupations by Sex
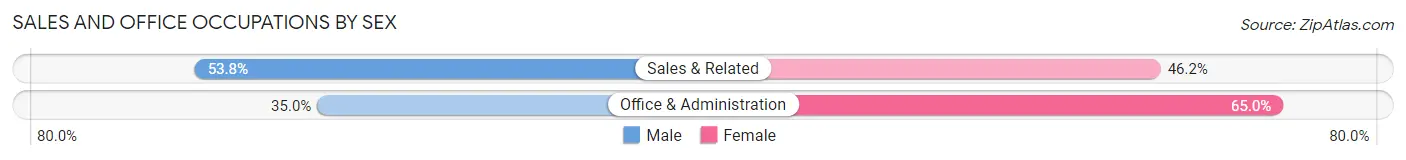
| Occupation | Male | Female |
| Sales & Related | 10,689 (53.8%) | 9,173 (46.2%) |
| Office & Administration | 9,807 (35.0%) | 18,221 (65.0%) |
| Total (Category) | 20,496 (42.8%) | 27,394 (57.2%) |
| Total (Overall) | 178,439 (48.3%) | 190,959 (51.7%) |
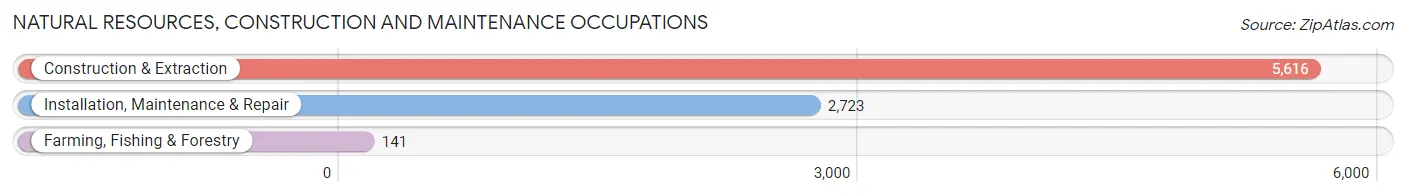
Natural Resources, Construction and Maintenance Occupations
The most common Natural Resources, Construction and Maintenance occupations in Area Code 202 are Construction & Extraction (5,616 | 1.5%), Installation, Maintenance & Repair (2,723 | 0.7%), and Farming, Fishing & Forestry (141 | 0.0%).
Natural Resources, Construction and Maintenance Occupations by Sex
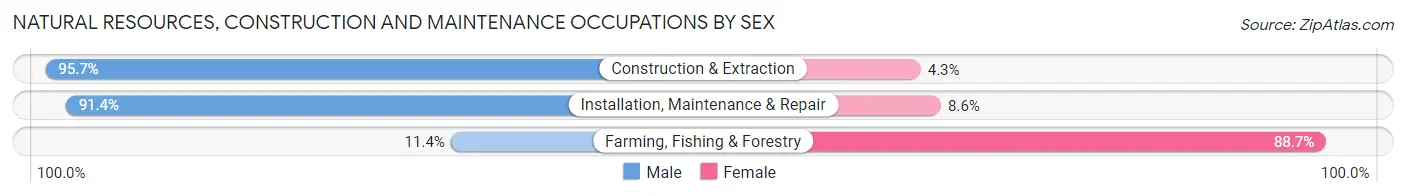
| Occupation | Male | Female |
| Farming, Fishing & Forestry | 16 (11.4%) | 125 (88.6%) |
| Construction & Extraction | 5,372 (95.7%) | 244 (4.3%) |
| Installation, Maintenance & Repair | 2,490 (91.4%) | 233 (8.6%) |
| Total (Category) | 7,878 (92.9%) | 602 (7.1%) |
| Total (Overall) | 178,439 (48.3%) | 190,959 (51.7%) |
Production, Transportation and Moving Occupations
The most common Production, Transportation and Moving occupations in Area Code 202 are Transportation (6,747 | 1.8%), Material Moving (3,342 | 0.9%), and Production (2,235 | 0.6%).
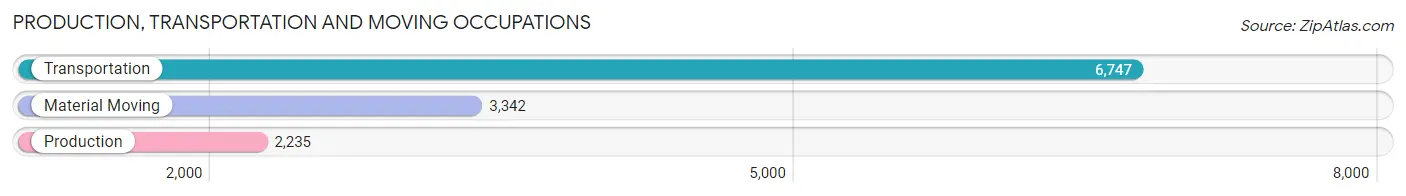
Production, Transportation and Moving Occupations by Sex
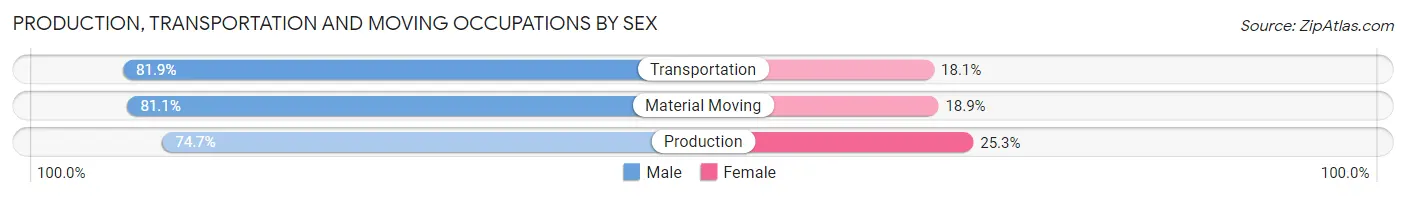
| Occupation | Male | Female |
| Production | 1,670 (74.7%) | 565 (25.3%) |
| Transportation | 5,527 (81.9%) | 1,220 (18.1%) |
| Material Moving | 2,711 (81.1%) | 631 (18.9%) |
| Total (Category) | 9,908 (80.4%) | 2,416 (19.6%) |
| Total (Overall) | 178,439 (48.3%) | 190,959 (51.7%) |
Employment Industries by Sex in Area Code 202
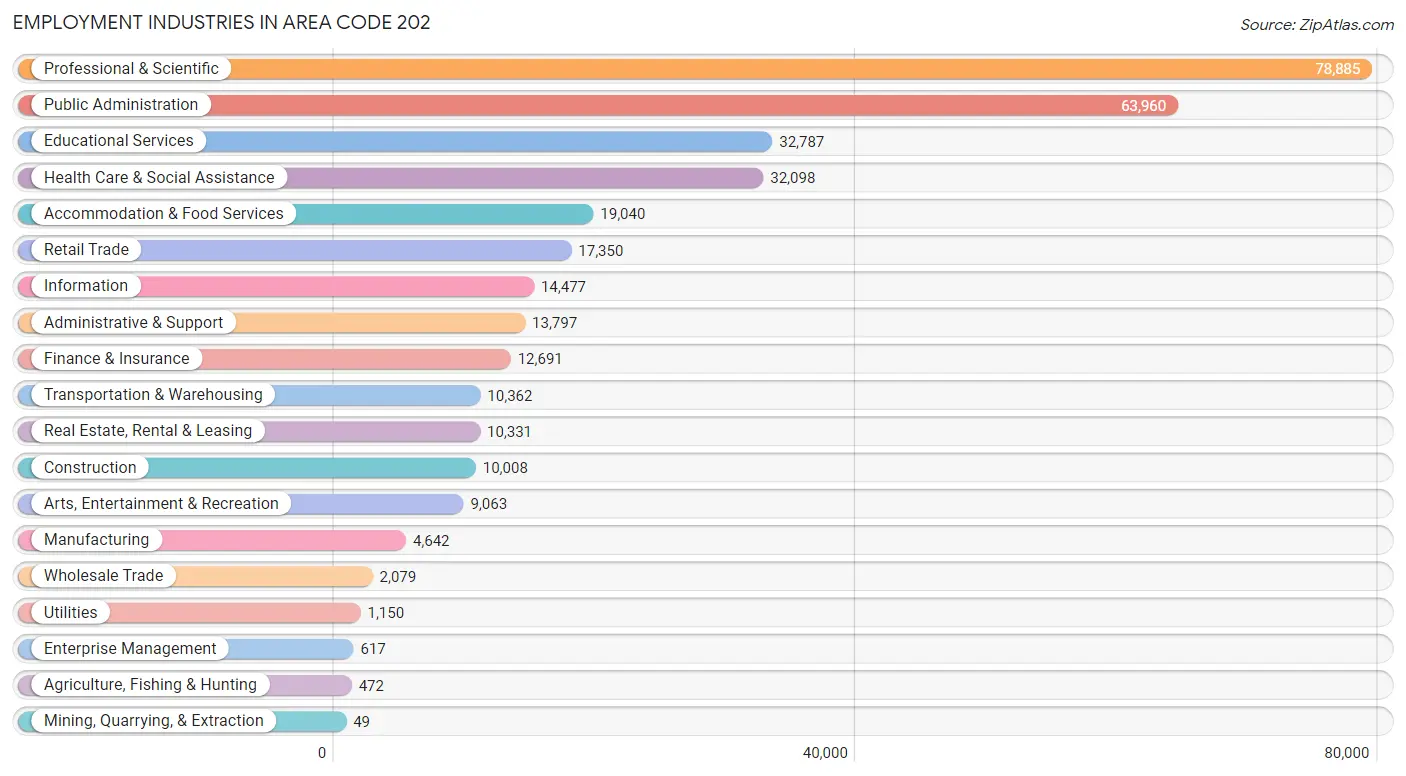
Employment Industries in Area Code 202
The major employment industries in Area Code 202 include Professional & Scientific (78,885 | 21.4%), Public Administration (63,960 | 17.3%), Educational Services (32,787 | 8.9%), Health Care & Social Assistance (32,098 | 8.7%), and Accommodation & Food Services (19,040 | 5.1%).
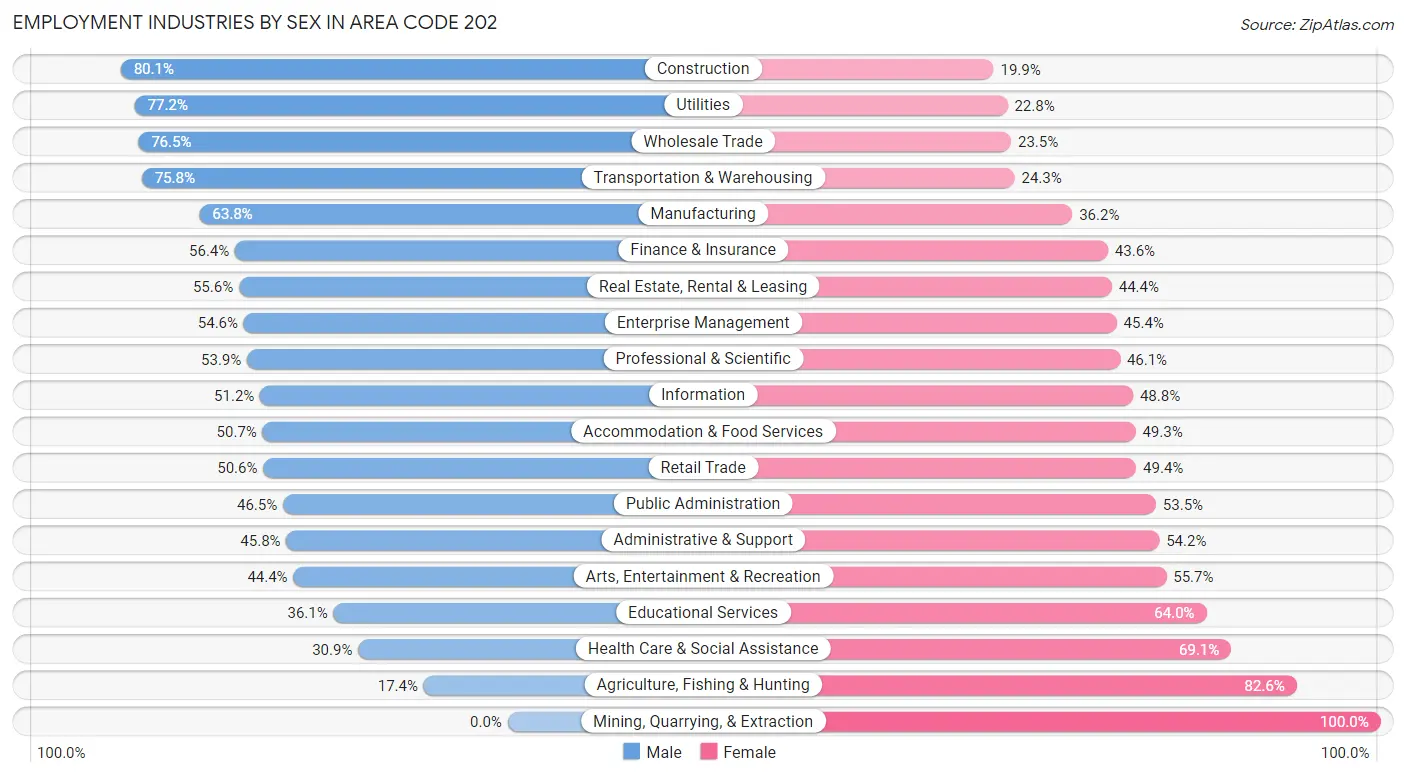
Employment Industries by Sex in Area Code 202
The Area Code 202 industries that see more men than women are Construction (80.1%), Utilities (77.2%), and Wholesale Trade (76.5%), whereas the industries that tend to have a higher number of women are Mining, Quarrying, & Extraction (100.0%), Agriculture, Fishing & Hunting (82.6%), and Health Care & Social Assistance (69.1%).
| Industry | Male | Female |
| Agriculture, Fishing & Hunting | 82 (17.4%) | 390 (82.6%) |
| Mining, Quarrying, & Extraction | 0 (0.0%) | 49 (100.0%) |
| Construction | 8,016 (80.1%) | 1,992 (19.9%) |
| Manufacturing | 2,962 (63.8%) | 1,680 (36.2%) |
| Wholesale Trade | 1,590 (76.5%) | 489 (23.5%) |
| Retail Trade | 8,778 (50.6%) | 8,572 (49.4%) |
| Transportation & Warehousing | 7,849 (75.7%) | 2,513 (24.2%) |
| Utilities | 888 (77.2%) | 262 (22.8%) |
| Information | 7,418 (51.2%) | 7,059 (48.8%) |
| Finance & Insurance | 7,161 (56.4%) | 5,530 (43.6%) |
| Real Estate, Rental & Leasing | 5,747 (55.6%) | 4,584 (44.4%) |
| Professional & Scientific | 42,552 (53.9%) | 36,333 (46.1%) |
| Enterprise Management | 337 (54.6%) | 280 (45.4%) |
| Administrative & Support | 6,321 (45.8%) | 7,476 (54.2%) |
| Educational Services | 11,821 (36.0%) | 20,966 (63.9%) |
| Health Care & Social Assistance | 9,931 (30.9%) | 22,167 (69.1%) |
| Arts, Entertainment & Recreation | 4,019 (44.4%) | 5,044 (55.6%) |
| Accommodation & Food Services | 9,658 (50.7%) | 9,382 (49.3%) |
| Public Administration | 29,739 (46.5%) | 34,221 (53.5%) |
| Total | 178,439 (48.3%) | 190,959 (51.7%) |
Education in Area Code 202
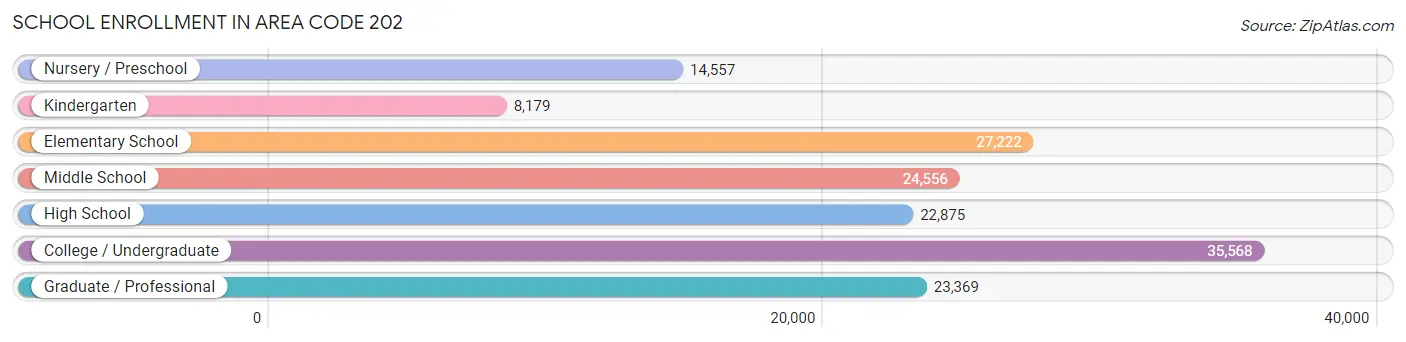
School Enrollment in Area Code 202
The most common levels of schooling among the 156,326 students in Area Code 202 are college / undergraduate (35,568 | 22.8%), elementary school (27,222 | 17.4%), and middle school (24,556 | 15.7%).
| School Level | # Students | % Students |
| Nursery / Preschool | 14,557 | 9.3% |
| Kindergarten | 8,179 | 5.2% |
| Elementary School | 27,222 | 17.4% |
| Middle School | 24,556 | 15.7% |
| High School | 22,875 | 14.6% |
| College / Undergraduate | 35,568 | 22.8% |
| Graduate / Professional | 23,369 | 14.9% |
| Total | 156,326 | 100.0% |
School Enrollment by Age by Funding Source in Area Code 202
Out of a total of 156,326 students who are enrolled in schools in Area Code 202, 56,743 (36.3%) attend a private institution, while the remaining 99,583 (63.7%) are enrolled in public schools. The age group of 20 to 24 year olds has the highest likelihood of being enrolled in private schools, with 14,069 (76.1% in the age bracket) enrolled. Conversely, the age group of 5 to 9 year old has the lowest likelihood of being enrolled in a private school, with 29,084 (87.3% in the age bracket) attending a public institution.
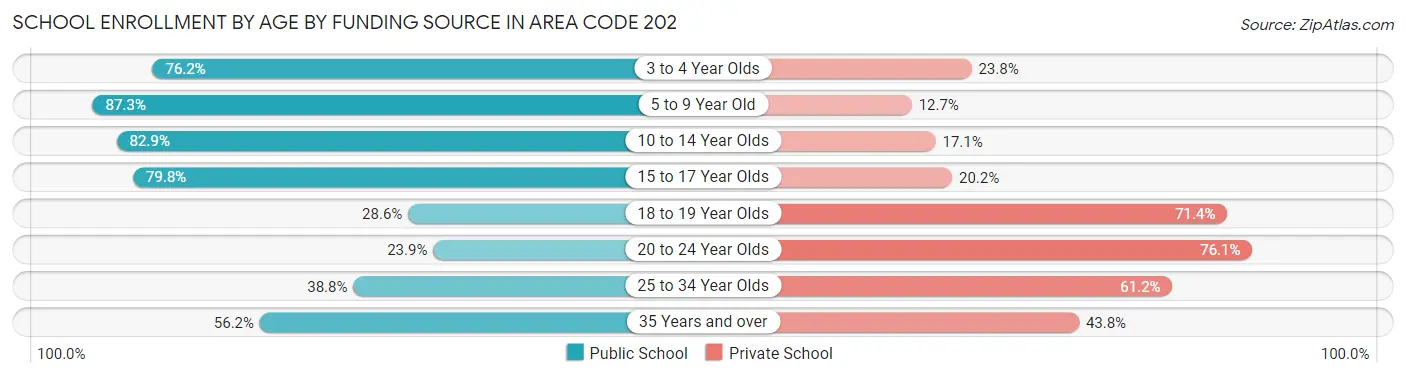
| Age Bracket | Public School | Private School |
| 3 to 4 Year Olds | 10,250 (76.2%) | 3,204 (23.8%) |
| 5 to 9 Year Old | 29,084 (87.3%) | 4,219 (12.7%) |
| 10 to 14 Year Olds | 25,951 (82.9%) | 5,361 (17.1%) |
| 15 to 17 Year Olds | 11,990 (79.8%) | 3,031 (20.2%) |
| 18 to 19 Year Olds | 3,986 (28.6%) | 9,971 (71.4%) |
| 20 to 24 Year Olds | 4,415 (23.9%) | 14,069 (76.1%) |
| 25 to 34 Year Olds | 7,548 (38.8%) | 11,921 (61.2%) |
| 35 Years and over | 6,363 (56.2%) | 4,963 (43.8%) |
| Total | 99,587 (63.7%) | 56,743 (36.3%) |
Educational Attainment by Field of Study in Area Code 202
Social sciences (89,758 | 26.0%), business (41,444 | 12.0%), liberal arts & history (31,057 | 9.0%), literature & languages (28,114 | 8.2%), and communications (19,553 | 5.7%) are the most common fields of study among 345,038 individuals in Area Code 202 who have obtained a bachelor's degree or higher.
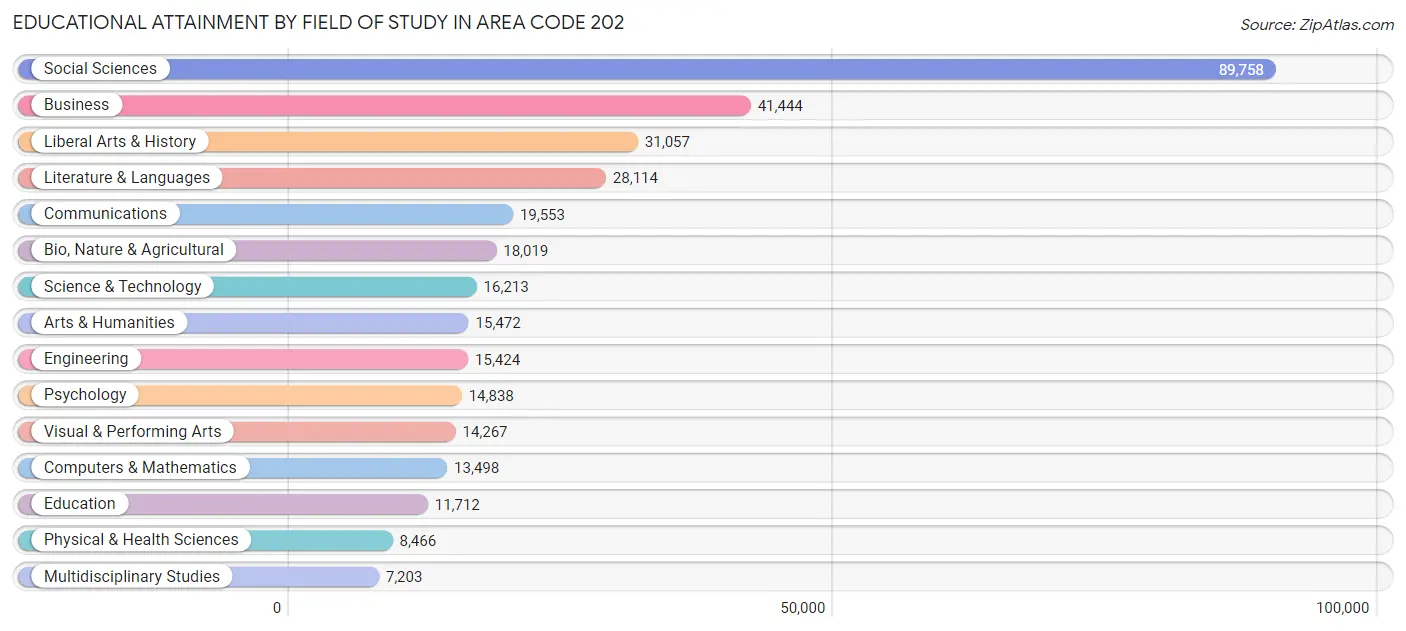
| Field of Study | # Graduates | % Graduates |
| Computers & Mathematics | 13,498 | 3.9% |
| Bio, Nature & Agricultural | 18,019 | 5.2% |
| Physical & Health Sciences | 8,466 | 2.5% |
| Psychology | 14,838 | 4.3% |
| Social Sciences | 89,758 | 26.0% |
| Engineering | 15,424 | 4.5% |
| Multidisciplinary Studies | 7,203 | 2.1% |
| Science & Technology | 16,213 | 4.7% |
| Business | 41,444 | 12.0% |
| Education | 11,712 | 3.4% |
| Literature & Languages | 28,114 | 8.2% |
| Liberal Arts & History | 31,057 | 9.0% |
| Visual & Performing Arts | 14,267 | 4.1% |
| Communications | 19,553 | 5.7% |
| Arts & Humanities | 15,472 | 4.5% |
| Total | 345,038 | 100.0% |
Transportation & Commute in Area Code 202
Vehicle Availability by Sex in Area Code 202
The most prevalent vehicle ownership categories in Area Code 202 are males with 1 vehicle (80,205, accounting for 45.6%) and females with 1 vehicle (87,501, making up 43.4%).
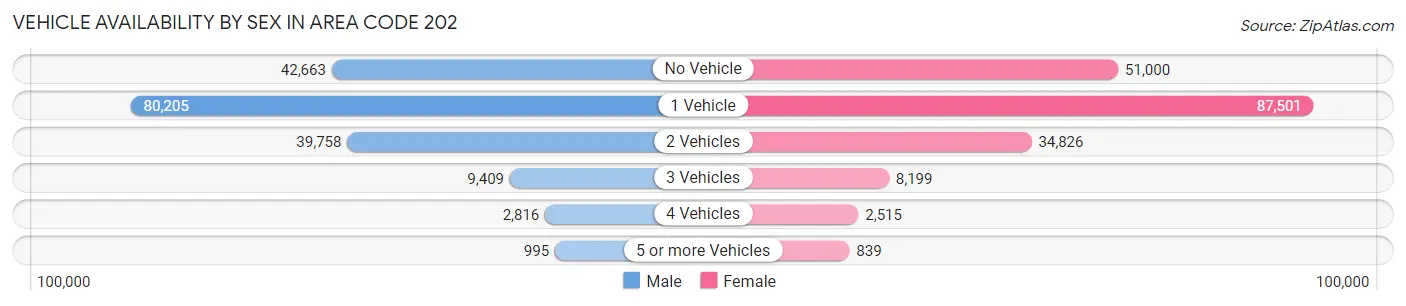
| Vehicles Available | Male | Female |
| No Vehicle | 42,663 (24.3%) | 51,000 (27.6%) |
| 1 Vehicle | 80,205 (45.6%) | 87,501 (47.3%) |
| 2 Vehicles | 39,758 (22.6%) | 34,826 (18.8%) |
| 3 Vehicles | 9,409 (5.3%) | 8,199 (4.4%) |
| 4 Vehicles | 2,816 (1.6%) | 2,515 (1.4%) |
| 5 or more Vehicles | 995 (0.6%) | 839 (0.4%) |
| Total | 175,846 (100.0%) | 184,880 (100.0%) |
Commute Time in Area Code 202
The most frequently occuring commute durations in Area Code 202 are 30 to 34 minutes (57,619 commuters, 20.9%), 20 to 24 minutes (40,438 commuters, 14.7%), and 45 to 59 minutes (32,712 commuters, 11.9%).
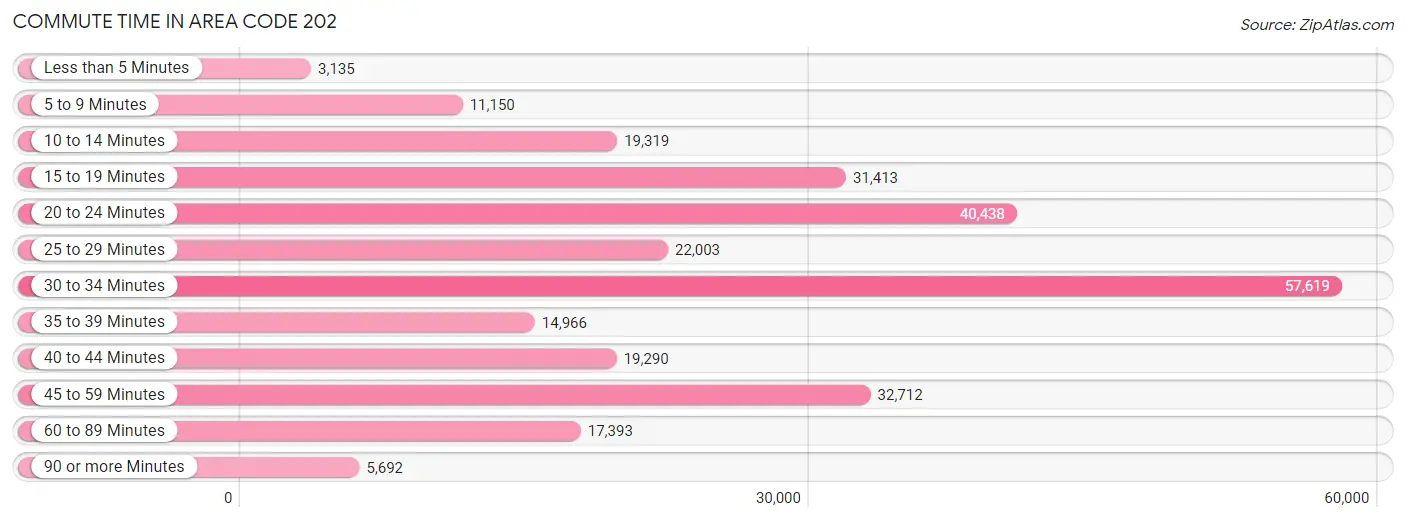
| Commute Time | # Commuters | % Commuters |
| Less than 5 Minutes | 3,135 | 1.1% |
| 5 to 9 Minutes | 11,150 | 4.1% |
| 10 to 14 Minutes | 19,319 | 7.0% |
| 15 to 19 Minutes | 31,413 | 11.4% |
| 20 to 24 Minutes | 40,438 | 14.7% |
| 25 to 29 Minutes | 22,003 | 8.0% |
| 30 to 34 Minutes | 57,619 | 20.9% |
| 35 to 39 Minutes | 14,966 | 5.4% |
| 40 to 44 Minutes | 19,290 | 7.0% |
| 45 to 59 Minutes | 32,712 | 11.9% |
| 60 to 89 Minutes | 17,393 | 6.3% |
| 90 or more Minutes | 5,692 | 2.1% |
Commute Time by Sex in Area Code 202
The most common commute times in Area Code 202 are 30 to 34 minutes (27,941 commuters, 20.5%) for males and 30 to 34 minutes (29,678 commuters, 21.4%) for females.
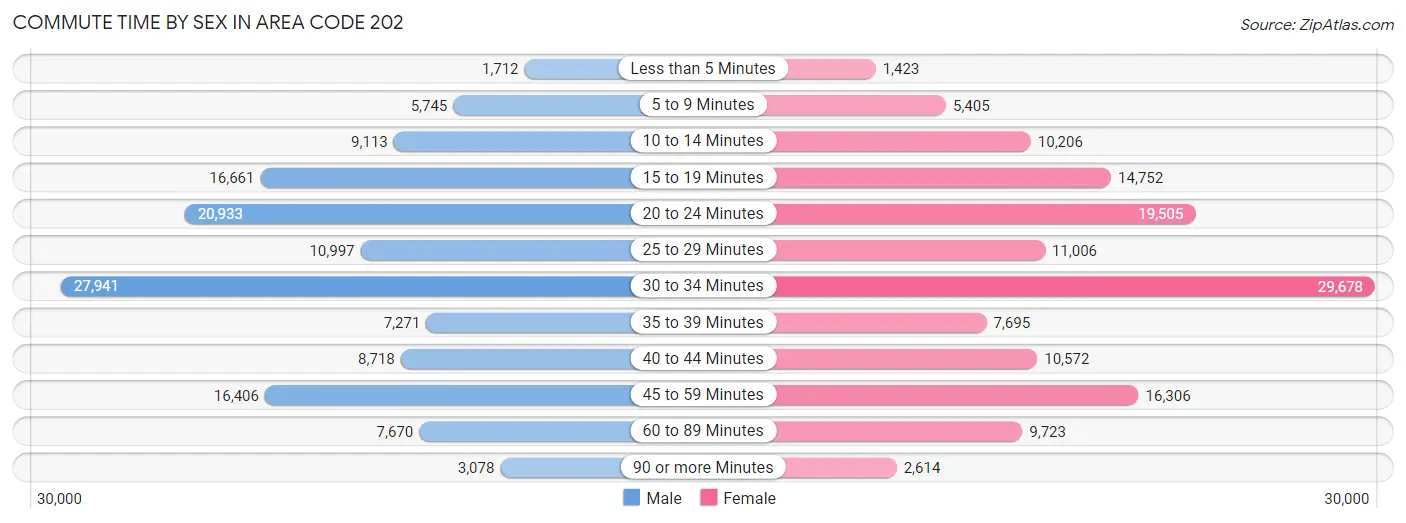
| Commute Time | Male | Female |
| Less than 5 Minutes | 1,712 (1.3%) | 1,423 (1.0%) |
| 5 to 9 Minutes | 5,745 (4.2%) | 5,405 (3.9%) |
| 10 to 14 Minutes | 9,113 (6.7%) | 10,206 (7.3%) |
| 15 to 19 Minutes | 16,661 (12.2%) | 14,752 (10.6%) |
| 20 to 24 Minutes | 20,933 (15.4%) | 19,505 (14.0%) |
| 25 to 29 Minutes | 10,997 (8.1%) | 11,006 (7.9%) |
| 30 to 34 Minutes | 27,941 (20.5%) | 29,678 (21.4%) |
| 35 to 39 Minutes | 7,271 (5.3%) | 7,695 (5.5%) |
| 40 to 44 Minutes | 8,718 (6.4%) | 10,572 (7.6%) |
| 45 to 59 Minutes | 16,406 (12.0%) | 16,306 (11.7%) |
| 60 to 89 Minutes | 7,670 (5.6%) | 9,723 (7.0%) |
| 90 or more Minutes | 3,078 (2.3%) | 2,614 (1.9%) |
Time of Departure to Work by Sex in Area Code 202
The most frequent times of departure to work in Area Code 202 are 8:00 AM to 8:29 AM (25,692, 18.9%) for males and 8:00 AM to 8:29 AM (29,112, 21.0%) for females.
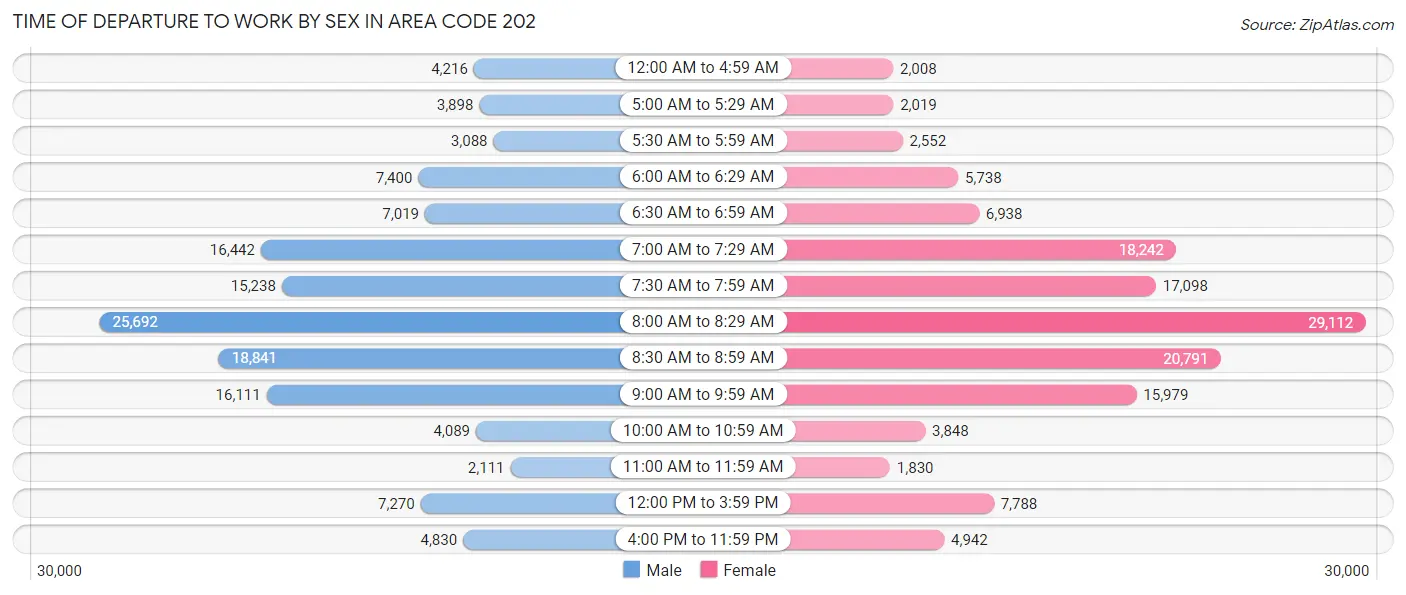
| Time of Departure | Male | Female |
| 12:00 AM to 4:59 AM | 4,216 (3.1%) | 2,008 (1.5%) |
| 5:00 AM to 5:29 AM | 3,898 (2.9%) | 2,019 (1.5%) |
| 5:30 AM to 5:59 AM | 3,088 (2.3%) | 2,552 (1.8%) |
| 6:00 AM to 6:29 AM | 7,400 (5.4%) | 5,738 (4.1%) |
| 6:30 AM to 6:59 AM | 7,019 (5.1%) | 6,938 (5.0%) |
| 7:00 AM to 7:29 AM | 16,442 (12.1%) | 18,242 (13.1%) |
| 7:30 AM to 7:59 AM | 15,238 (11.2%) | 17,098 (12.3%) |
| 8:00 AM to 8:29 AM | 25,692 (18.9%) | 29,112 (21.0%) |
| 8:30 AM to 8:59 AM | 18,841 (13.8%) | 20,791 (15.0%) |
| 9:00 AM to 9:59 AM | 16,111 (11.8%) | 15,979 (11.5%) |
| 10:00 AM to 10:59 AM | 4,089 (3.0%) | 3,848 (2.8%) |
| 11:00 AM to 11:59 AM | 2,111 (1.5%) | 1,830 (1.3%) |
| 12:00 PM to 3:59 PM | 7,270 (5.3%) | 7,788 (5.6%) |
| 4:00 PM to 11:59 PM | 4,830 (3.5%) | 4,942 (3.6%) |
| Total | 136,245 (100.0%) | 138,885 (100.0%) |
Housing Occupancy in Area Code 202
Occupancy by Ownership in Area Code 202
Of the total 315,785 dwellings in Area Code 202, owner-occupied units account for 130,865 (41.4%), while renter-occupied units make up 184,920 (58.6%).
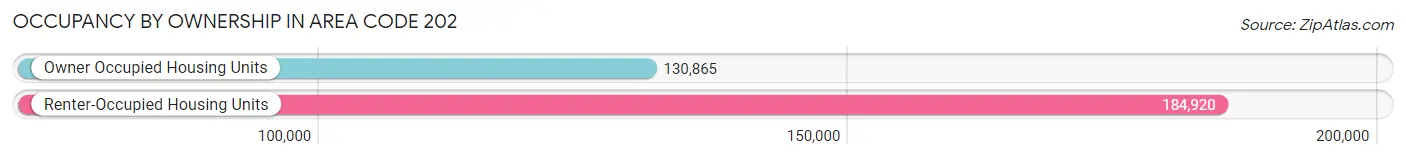
| Occupancy | # Housing Units | % Housing Units |
| Owner Occupied Housing Units | 130,865 | 41.4% |
| Renter-Occupied Housing Units | 184,920 | 58.6% |
| Total Occupied Housing Units | 315,785 | 100.0% |
Occupancy by Household Size in Area Code 202
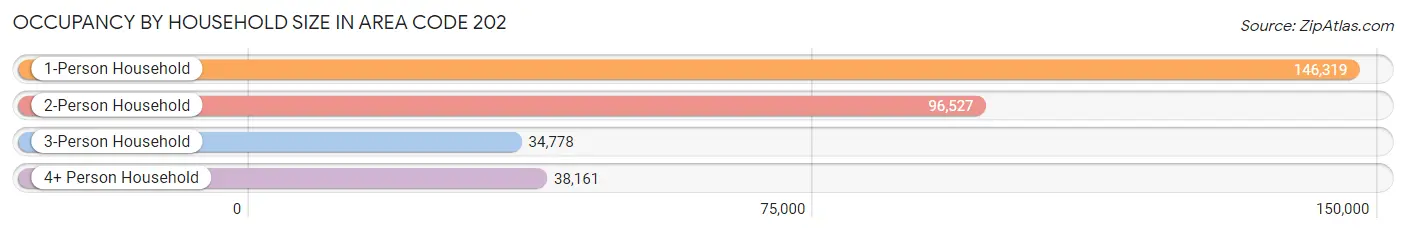
| Household Size | # Housing Units | % Housing Units |
| 1-Person Household | 146,319 | 46.3% |
| 2-Person Household | 96,527 | 30.6% |
| 3-Person Household | 34,778 | 11.0% |
| 4+ Person Household | 38,161 | 12.1% |
| Total Housing Units | 315,785 | 100.0% |
Occupancy by Ownership by Household Size in Area Code 202
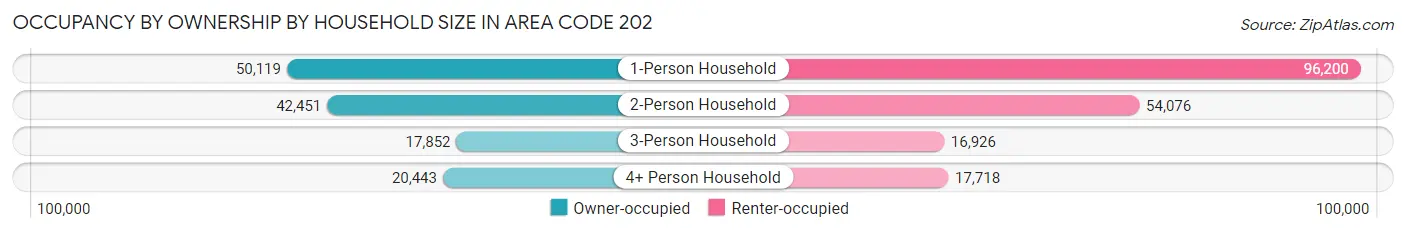
| Household Size | Owner-occupied | Renter-occupied |
| 1-Person Household | 50,119 (34.3%) | 96,200 (65.7%) |
| 2-Person Household | 42,451 (44.0%) | 54,076 (56.0%) |
| 3-Person Household | 17,852 (51.3%) | 16,926 (48.7%) |
| 4+ Person Household | 20,443 (53.6%) | 17,718 (46.4%) |
| Total Housing Units | 130,865 (41.4%) | 184,920 (58.6%) |
Occupancy by Educational Attainment in Area Code 202
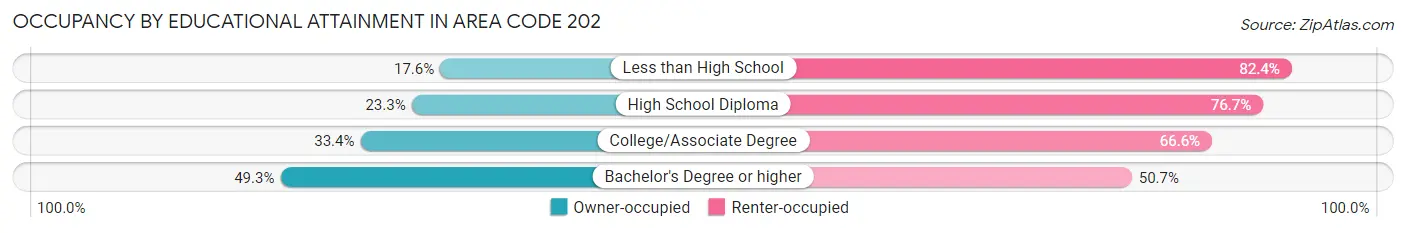
| Household Size | Owner-occupied | Renter-occupied |
| Less than High School | 3,670 (17.6%) | 17,146 (82.4%) |
| High School Diploma | 9,708 (23.3%) | 31,950 (76.7%) |
| College/Associate Degree | 15,659 (33.4%) | 31,168 (66.6%) |
| Bachelor's Degree or higher | 101,828 (49.3%) | 104,656 (50.7%) |
Occupancy by Age of Householder in Area Code 202
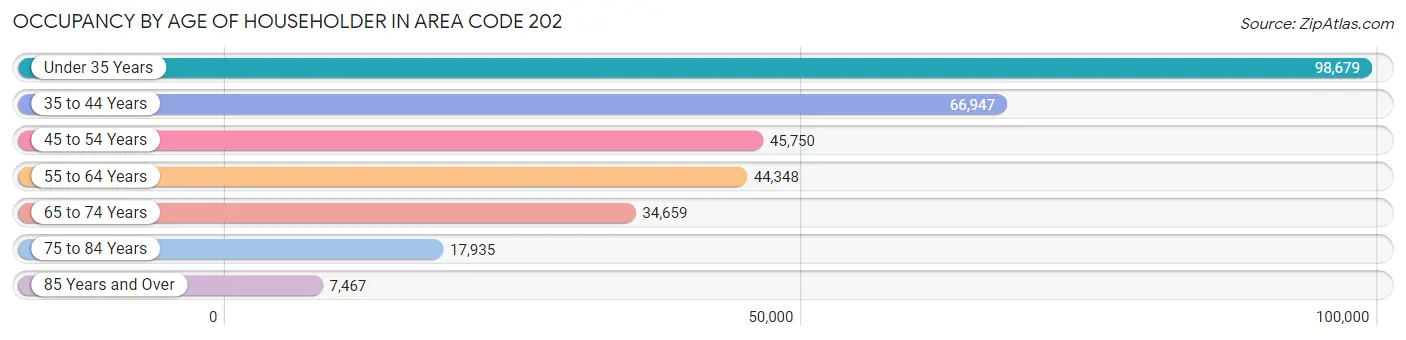
| Age Bracket | # Households | % Households |
| Under 35 Years | 98,679 | 31.2% |
| 35 to 44 Years | 66,947 | 21.2% |
| 45 to 54 Years | 45,750 | 14.5% |
| 55 to 64 Years | 44,348 | 14.0% |
| 65 to 74 Years | 34,659 | 11.0% |
| 75 to 84 Years | 17,935 | 5.7% |
| 85 Years and Over | 7,467 | 2.4% |
| Total | 315,785 | 100.0% |
Housing Finances in Area Code 202
Median Income by Occupancy in Area Code 202
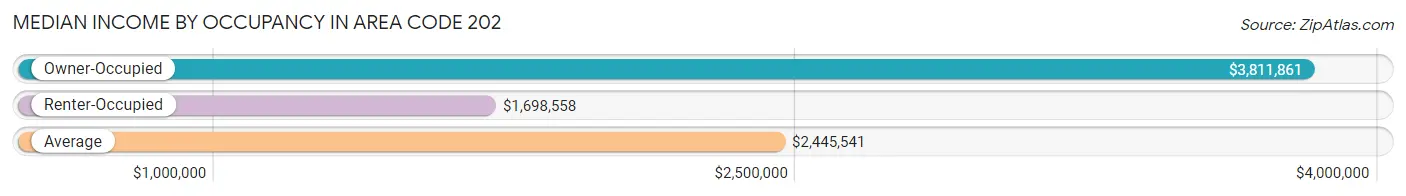
| Occupancy Type | # Households | Median Income |
| Owner-Occupied | 130,865 (41.4%) | $3,811,861 |
| Renter-Occupied | 184,920 (58.6%) | $1,698,558 |
| Average | 315,785 (100.0%) | $2,445,541 |
Occupancy by Householder Income Bracket in Area Code 202
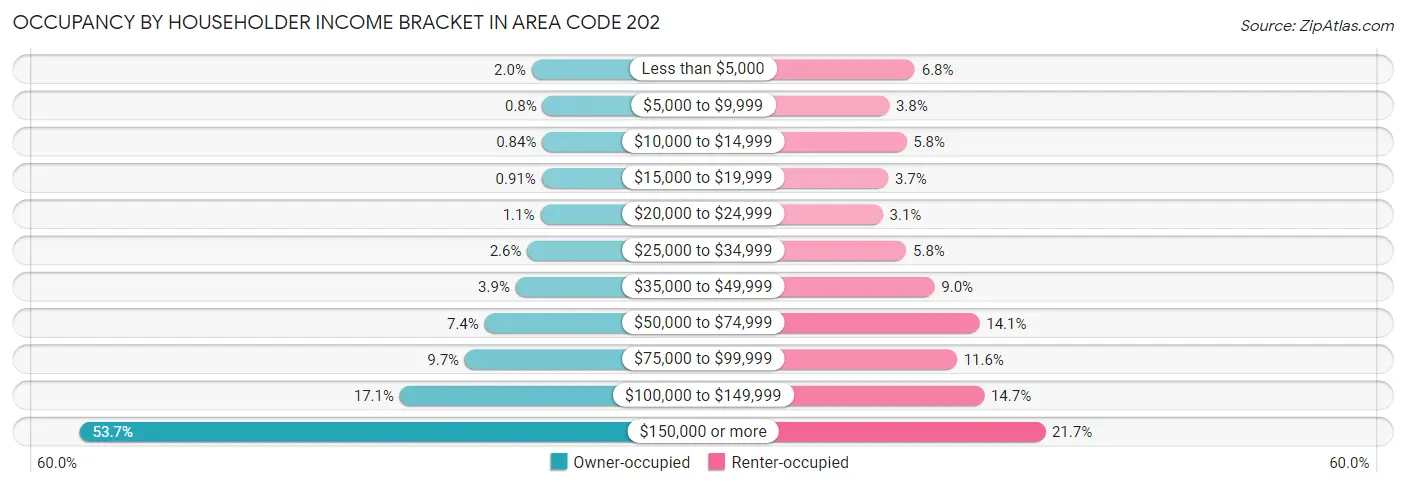
| Income Bracket | Owner-occupied | Renter-occupied |
| Less than $5,000 | 2,664 (2.0%) | 12,512 (6.8%) |
| $5,000 to $9,999 | 1,045 (0.8%) | 7,066 (3.8%) |
| $10,000 to $14,999 | 1,094 (0.8%) | 10,725 (5.8%) |
| $15,000 to $19,999 | 1,189 (0.9%) | 6,852 (3.7%) |
| $20,000 to $24,999 | 1,393 (1.1%) | 5,709 (3.1%) |
| $25,000 to $34,999 | 3,338 (2.5%) | 10,681 (5.8%) |
| $35,000 to $49,999 | 5,060 (3.9%) | 16,667 (9.0%) |
| $50,000 to $74,999 | 9,721 (7.4%) | 26,156 (14.1%) |
| $75,000 to $99,999 | 12,665 (9.7%) | 21,379 (11.6%) |
| $100,000 to $149,999 | 22,403 (17.1%) | 27,140 (14.7%) |
| $150,000 or more | 70,293 (53.7%) | 40,033 (21.6%) |
| Total | 130,865 (100.0%) | 184,920 (100.0%) |
Monthly Housing Cost Tiers in Area Code 202
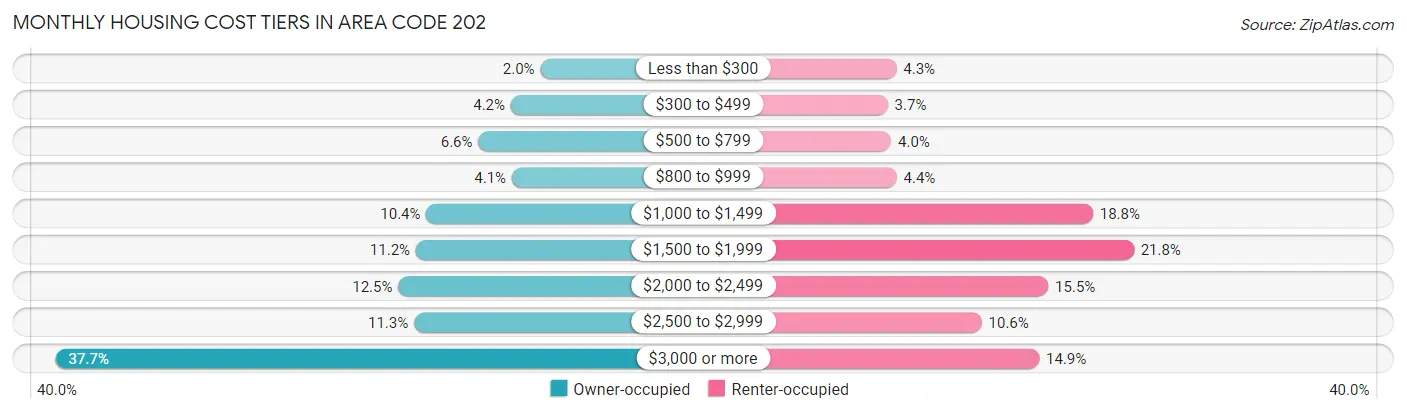
| Monthly Cost | Owner-occupied | Renter-occupied |
| Less than $300 | 2,627 (2.0%) | 8,019 (4.3%) |
| $300 to $499 | 5,487 (4.2%) | 6,851 (3.7%) |
| $500 to $799 | 8,612 (6.6%) | 7,307 (4.0%) |
| $800 to $999 | 5,384 (4.1%) | 8,065 (4.4%) |
| $1,000 to $1,499 | 13,629 (10.4%) | 34,782 (18.8%) |
| $1,500 to $1,999 | 14,626 (11.2%) | 40,355 (21.8%) |
| $2,000 to $2,499 | 16,330 (12.5%) | 28,691 (15.5%) |
| $2,500 to $2,999 | 14,813 (11.3%) | 19,639 (10.6%) |
| $3,000 or more | 49,357 (37.7%) | 27,463 (14.8%) |
| Total | 130,865 (100.0%) | 184,920 (100.0%) |
Physical Housing Characteristics in Area Code 202
Housing Structures in Area Code 202
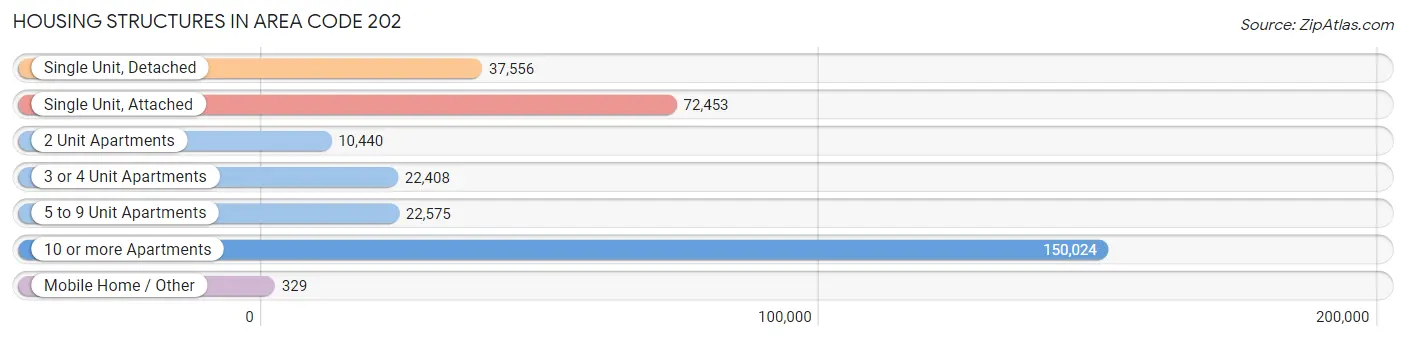
| Structure Type | # Housing Units | % Housing Units |
| Single Unit, Detached | 37,556 | 11.9% |
| Single Unit, Attached | 72,453 | 22.9% |
| 2 Unit Apartments | 10,440 | 3.3% |
| 3 or 4 Unit Apartments | 22,408 | 7.1% |
| 5 to 9 Unit Apartments | 22,575 | 7.1% |
| 10 or more Apartments | 150,024 | 47.5% |
| Mobile Home / Other | 329 | 0.1% |
| Total | 315,785 | 100.0% |
Housing Structures by Occupancy in Area Code 202
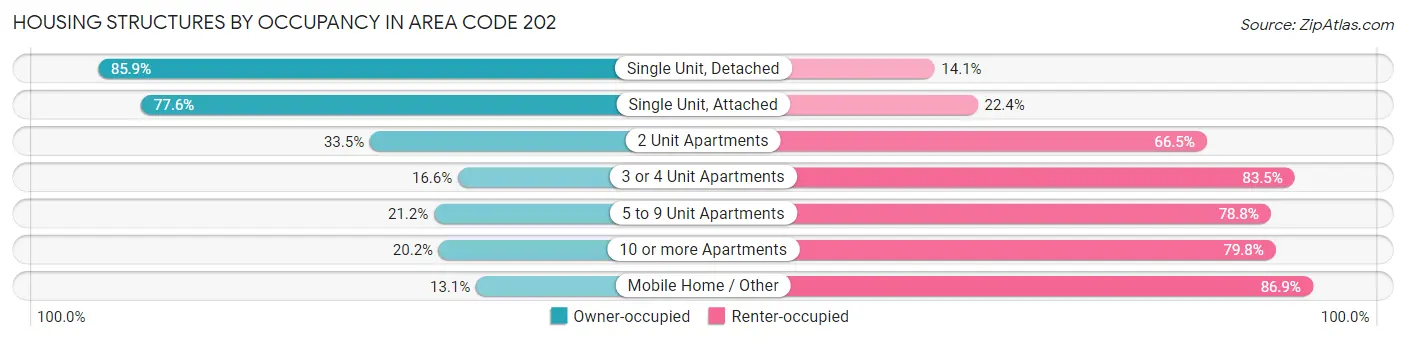
| Structure Type | Owner-occupied | Renter-occupied |
| Single Unit, Detached | 32,261 (85.9%) | 5,295 (14.1%) |
| Single Unit, Attached | 56,223 (77.6%) | 16,230 (22.4%) |
| 2 Unit Apartments | 3,497 (33.5%) | 6,943 (66.5%) |
| 3 or 4 Unit Apartments | 3,709 (16.6%) | 18,699 (83.5%) |
| 5 to 9 Unit Apartments | 4,776 (21.2%) | 17,799 (78.8%) |
| 10 or more Apartments | 30,356 (20.2%) | 119,668 (79.8%) |
| Mobile Home / Other | 43 (13.1%) | 286 (86.9%) |
| Total | 130,865 (41.4%) | 184,920 (58.6%) |
Housing Structures by Number of Rooms in Area Code 202
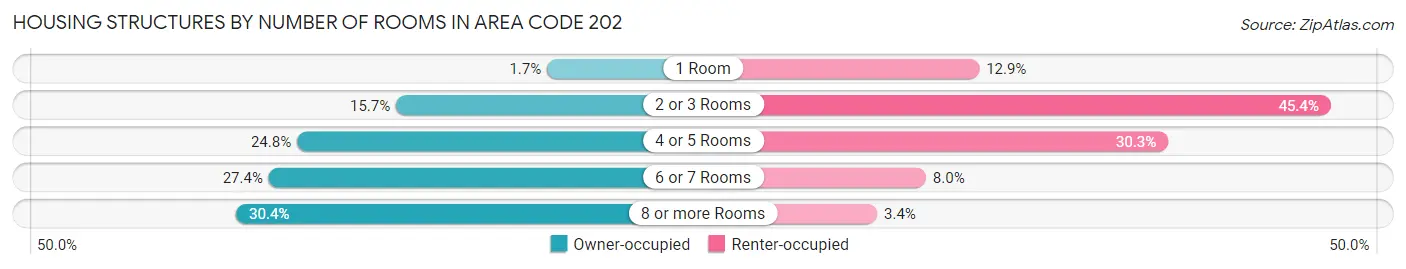
| Number of Rooms | Owner-occupied | Renter-occupied |
| 1 Room | 2,204 (1.7%) | 23,816 (12.9%) |
| 2 or 3 Rooms | 20,483 (15.7%) | 83,931 (45.4%) |
| 4 or 5 Rooms | 32,471 (24.8%) | 56,102 (30.3%) |
| 6 or 7 Rooms | 35,880 (27.4%) | 14,702 (8.0%) |
| 8 or more Rooms | 39,827 (30.4%) | 6,369 (3.4%) |
| Total | 130,865 (100.0%) | 184,920 (100.0%) |
Housing Structure by Heating Type in Area Code 202
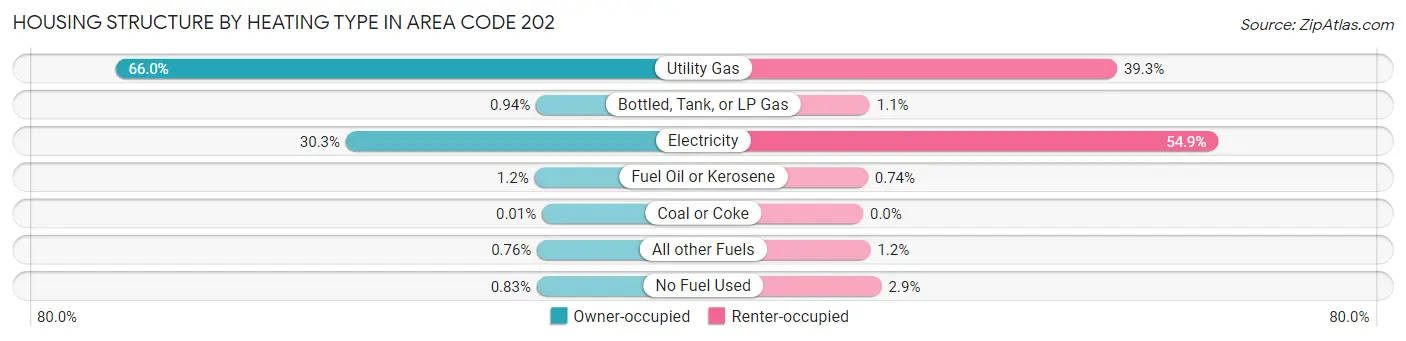
| Heating Type | Owner-occupied | Renter-occupied |
| Utility Gas | 86,308 (65.9%) | 72,596 (39.3%) |
| Bottled, Tank, or LP Gas | 1,230 (0.9%) | 1,947 (1.1%) |
| Electricity | 39,699 (30.3%) | 101,556 (54.9%) |
| Fuel Oil or Kerosene | 1,541 (1.2%) | 1,366 (0.7%) |
| Coal or Coke | 13 (0.0%) | 0 (0.0%) |
| All other Fuels | 989 (0.8%) | 2,135 (1.1%) |
| No Fuel Used | 1,085 (0.8%) | 5,320 (2.9%) |
| Total | 130,865 (100.0%) | 184,920 (100.0%) |
Household Vehicle Usage in Area Code 202
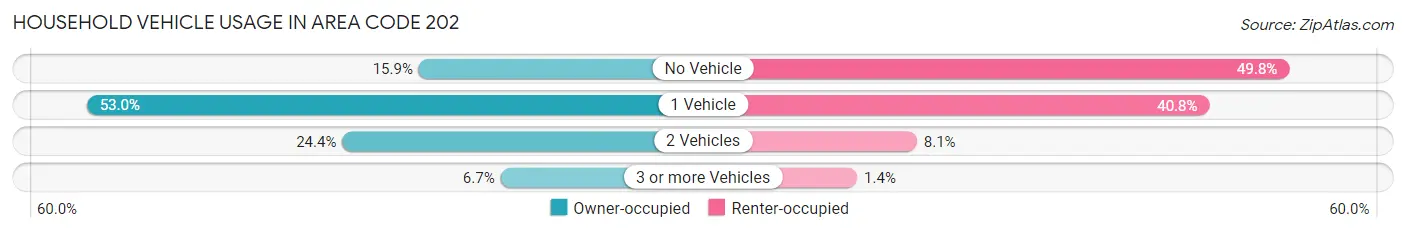
| Vehicles per Household | Owner-occupied | Renter-occupied |
| No Vehicle | 20,745 (15.9%) | 92,017 (49.8%) |
| 1 Vehicle | 69,411 (53.0%) | 75,469 (40.8%) |
| 2 Vehicles | 31,959 (24.4%) | 14,905 (8.1%) |
| 3 or more Vehicles | 8,750 (6.7%) | 2,529 (1.4%) |
| Total | 130,865 (100.0%) | 184,920 (100.0%) |
Real Estate & Mortgages in Area Code 202
Real Estate and Mortgage Overview in Area Code 202
| Characteristic | Without Mortgage | With Mortgage |
| Housing Units | 31,753 | 99,112 |
| Median Property Value | $15,180,700 | $15,803,000 |
| Median Household Income | $2,384,680 | $58,132 |
| Monthly Housing Costs | $18,494 | $48,396 |
| Real Estate Taxes | $88,009 | $1,909 |
Property Value by Mortgage Status in Area Code 202
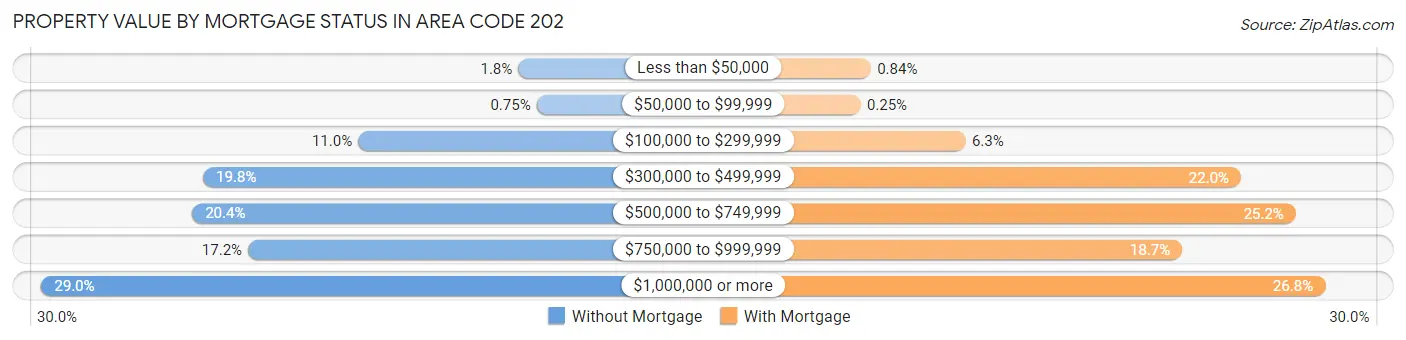
| Property Value | Without Mortgage | With Mortgage |
| Less than $50,000 | 573 (1.8%) | 833 (0.8%) |
| $50,000 to $99,999 | 238 (0.7%) | 243 (0.3%) |
| $100,000 to $299,999 | 3,477 (11.0%) | 6,199 (6.2%) |
| $300,000 to $499,999 | 6,287 (19.8%) | 21,827 (22.0%) |
| $500,000 to $749,999 | 6,485 (20.4%) | 24,924 (25.2%) |
| $750,000 to $999,999 | 5,473 (17.2%) | 18,491 (18.7%) |
| $1,000,000 or more | 9,220 (29.0%) | 26,595 (26.8%) |
| Total | 31,753 (100.0%) | 99,112 (100.0%) |
Household Income by Mortgage Status in Area Code 202
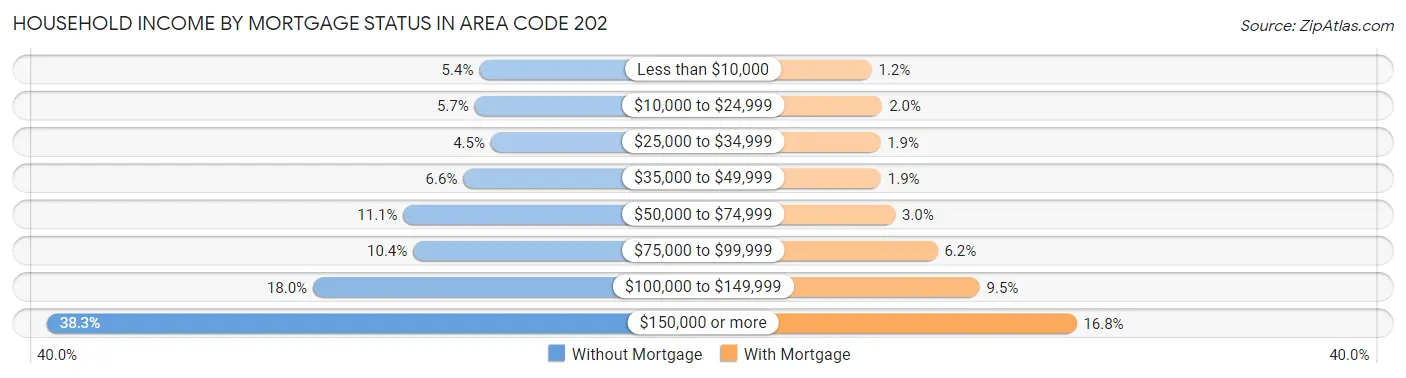
| Household Income | Without Mortgage | With Mortgage |
| Less than $10,000 | 1,701 (5.4%) | 1,205 (1.2%) |
| $10,000 to $24,999 | 1,817 (5.7%) | 2,008 (2.0%) |
| $25,000 to $34,999 | 1,421 (4.5%) | 1,859 (1.9%) |
| $35,000 to $49,999 | 2,088 (6.6%) | 1,917 (1.9%) |
| $50,000 to $74,999 | 3,537 (11.1%) | 2,972 (3.0%) |
| $75,000 to $99,999 | 3,302 (10.4%) | 6,184 (6.2%) |
| $100,000 to $149,999 | 5,726 (18.0%) | 9,363 (9.5%) |
| $150,000 or more | 12,161 (38.3%) | 16,677 (16.8%) |
| Total | 31,753 (100.0%) | 99,112 (100.0%) |
Property Value to Household Income Ratio in Area Code 202
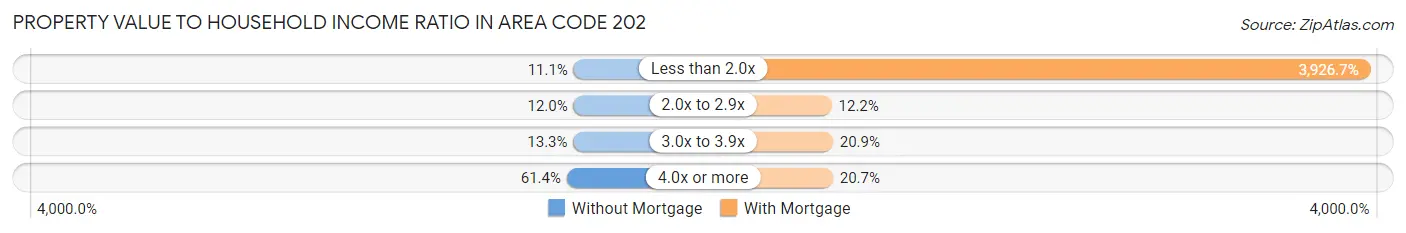
| Value-to-Income Ratio | Without Mortgage | With Mortgage |
| Less than 2.0x | 3,518 (11.1%) | 3,891,819 (3,926.7%) |
| 2.0x to 2.9x | 3,798 (12.0%) | 12,101 (12.2%) |
| 3.0x to 3.9x | 4,236 (13.3%) | 20,679 (20.9%) |
| 4.0x or more | 19,505 (61.4%) | 20,509 (20.7%) |
| Total | 31,753 (100.0%) | 99,112 (100.0%) |
Real Estate Taxes by Mortgage Status in Area Code 202
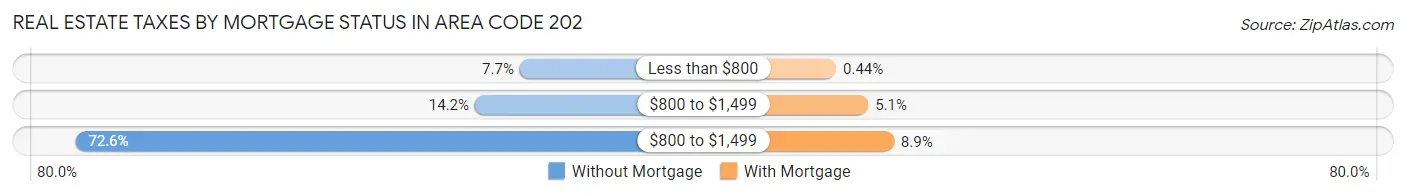
| Property Taxes | Without Mortgage | With Mortgage |
| Less than $800 | 2,428 (7.6%) | 435 (0.4%) |
| $800 to $1,499 | 4,511 (14.2%) | 5,092 (5.1%) |
| $800 to $1,499 | 23,047 (72.6%) | 8,814 (8.9%) |
| Total | 31,753 (100.0%) | 99,112 (100.0%) |
Health & Disability in Area Code 202
Health Insurance Coverage by Age in Area Code 202
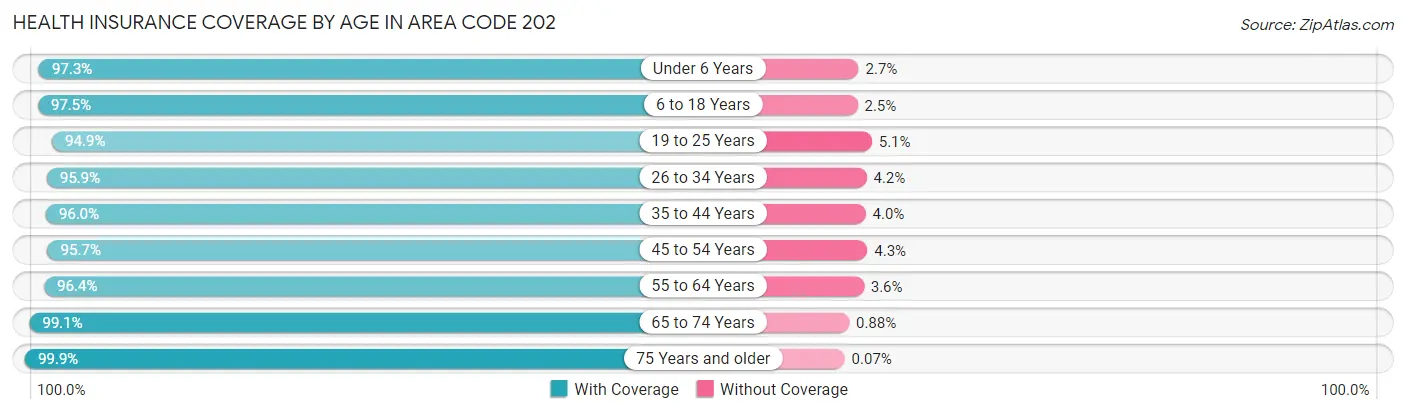
| Age Bracket | With Coverage | Without Coverage |
| Under 6 Years | 47,278 (97.3%) | 1,296 (2.7%) |
| 6 to 18 Years | 81,447 (97.5%) | 2,063 (2.5%) |
| 19 to 25 Years | 63,370 (94.9%) | 3,425 (5.1%) |
| 26 to 34 Years | 130,335 (95.9%) | 5,647 (4.2%) |
| 35 to 44 Years | 102,153 (96.0%) | 4,219 (4.0%) |
| 45 to 54 Years | 68,811 (95.7%) | 3,094 (4.3%) |
| 55 to 64 Years | 63,825 (96.4%) | 2,403 (3.6%) |
| 65 to 74 Years | 47,767 (99.1%) | 422 (0.9%) |
| 75 Years and older | 34,018 (99.9%) | 23 (0.1%) |
| Total | 639,004 (96.6%) | 22,592 (3.4%) |
Health Insurance Coverage by Citizenship Status in Area Code 202
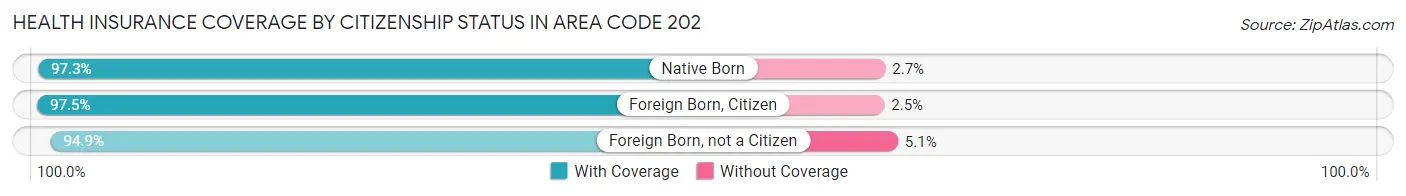
| Citizenship Status | With Coverage | Without Coverage |
| Native Born | 47,278 (97.3%) | 1,296 (2.7%) |
| Foreign Born, Citizen | 81,447 (97.5%) | 2,063 (2.5%) |
| Foreign Born, not a Citizen | 63,370 (94.9%) | 3,425 (5.1%) |
Health Insurance Coverage by Household Income in Area Code 202
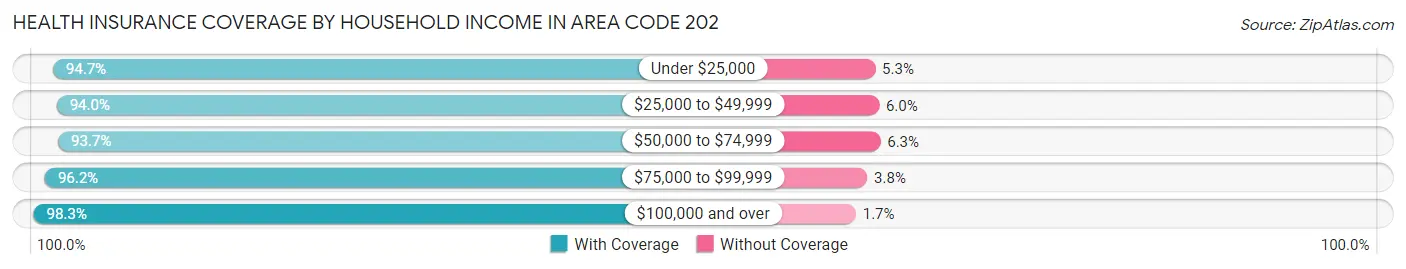
| Household Income | With Coverage | Without Coverage |
| Under $25,000 | 82,182 (94.7%) | 4,606 (5.3%) |
| $25,000 to $49,999 | 63,862 (94.0%) | 4,093 (6.0%) |
| $50,000 to $74,999 | 59,517 (93.7%) | 3,979 (6.3%) |
| $75,000 to $99,999 | 54,640 (96.2%) | 2,173 (3.8%) |
| $100,000 and over | 357,904 (98.3%) | 6,145 (1.7%) |
Public vs Private Health Insurance Coverage by Age in Area Code 202
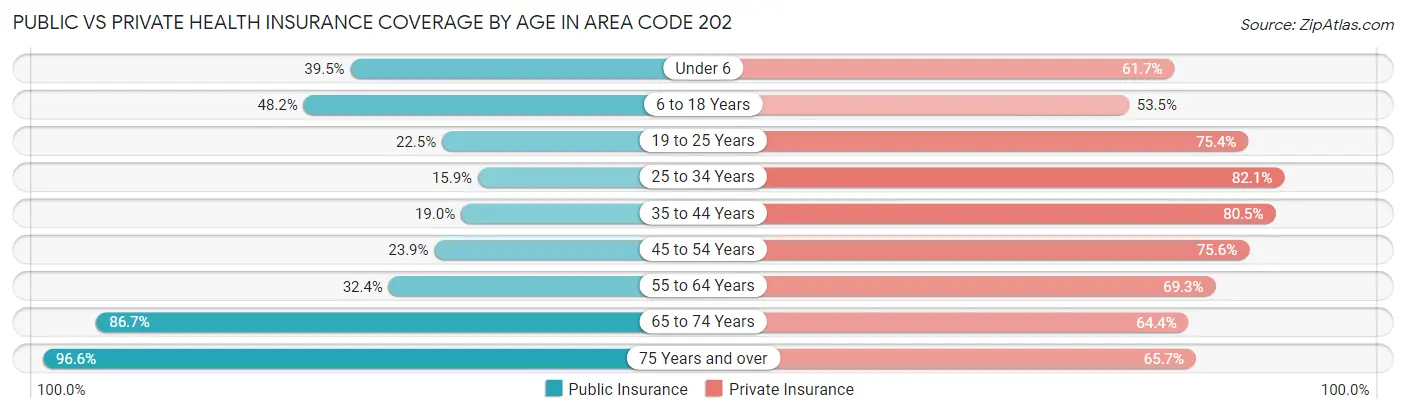
| Age Bracket | Public Insurance | Private Insurance |
| Under 6 | 19,203 (39.5%) | 29,985 (61.7%) |
| 6 to 18 Years | 40,260 (48.2%) | 44,641 (53.5%) |
| 19 to 25 Years | 15,043 (22.5%) | 50,383 (75.4%) |
| 25 to 34 Years | 21,548 (15.9%) | 111,632 (82.1%) |
| 35 to 44 Years | 20,208 (19.0%) | 85,591 (80.5%) |
| 45 to 54 Years | 17,212 (23.9%) | 54,338 (75.6%) |
| 55 to 64 Years | 21,474 (32.4%) | 45,906 (69.3%) |
| 65 to 74 Years | 41,774 (86.7%) | 31,017 (64.4%) |
| 75 Years and over | 32,885 (96.6%) | 22,369 (65.7%) |
| Total | 229,607 (34.7%) | 475,862 (71.9%) |
Disability Status by Sex by Age in Area Code 202
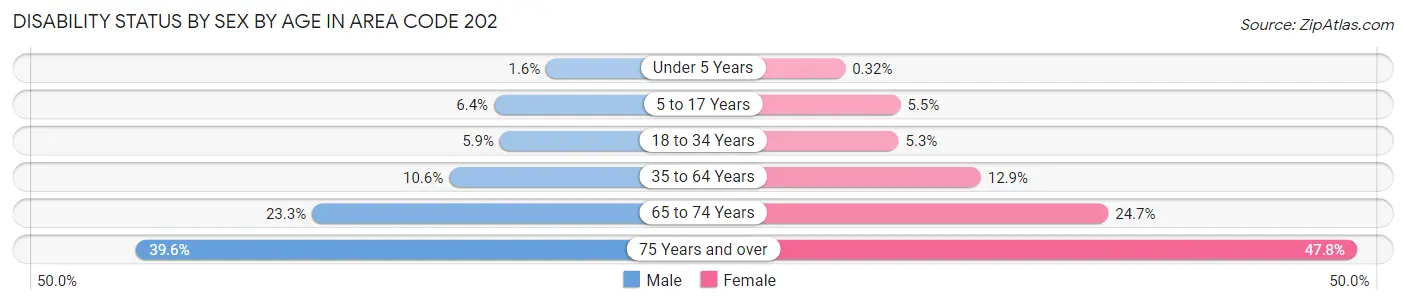
| Age Bracket | Male | Female |
| Under 5 Years | 341 (1.6%) | 64 (0.3%) |
| 5 to 17 Years | 2,670 (6.4%) | 2,227 (5.4%) |
| 18 to 34 Years | 5,731 (5.9%) | 5,999 (5.3%) |
| 35 to 64 Years | 12,781 (10.6%) | 16,002 (12.9%) |
| 65 to 74 Years | 4,888 (23.3%) | 6,735 (24.7%) |
| 75 Years and over | 5,102 (39.6%) | 10,119 (47.8%) |
Disability Class by Sex by Age in Area Code 202
Disability Class: Hearing Difficulty
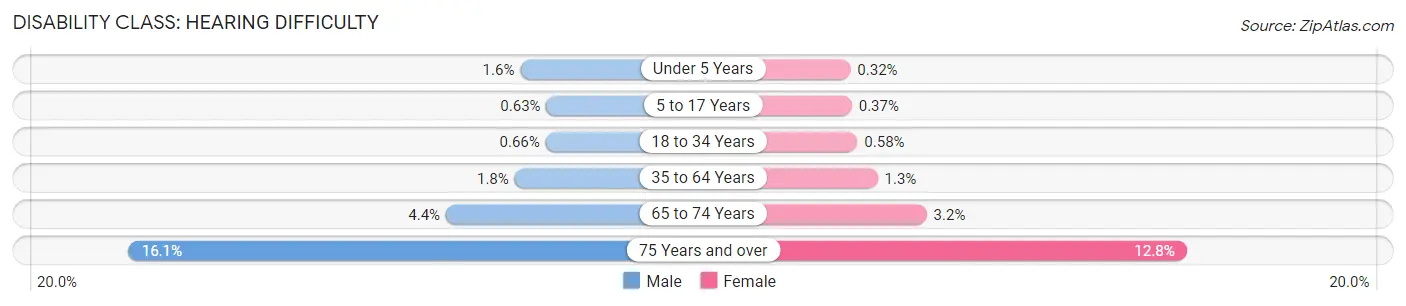
| Age Bracket | Male | Female |
| Under 5 Years | 341 (1.6%) | 64 (0.3%) |
| 5 to 17 Years | 260 (0.6%) | 151 (0.4%) |
| 18 to 34 Years | 646 (0.7%) | 665 (0.6%) |
| 35 to 64 Years | 2,182 (1.8%) | 1,651 (1.3%) |
| 65 to 74 Years | 913 (4.4%) | 859 (3.2%) |
| 75 Years and over | 2,077 (16.1%) | 2,709 (12.8%) |
Disability Class: Vision Difficulty
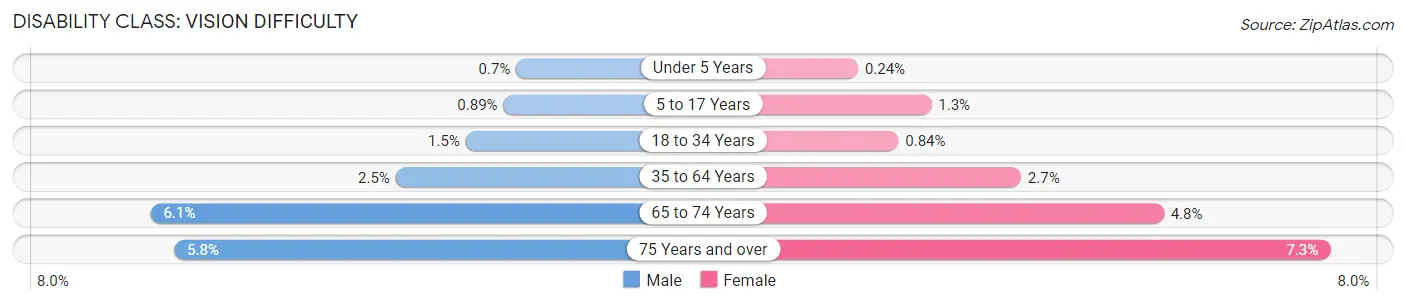
| Age Bracket | Male | Female |
| Under 5 Years | 149 (0.7%) | 49 (0.2%) |
| 5 to 17 Years | 369 (0.9%) | 545 (1.3%) |
| 18 to 34 Years | 1,406 (1.5%) | 958 (0.8%) |
| 35 to 64 Years | 3,002 (2.5%) | 3,297 (2.7%) |
| 65 to 74 Years | 1,285 (6.1%) | 1,302 (4.8%) |
| 75 Years and over | 744 (5.8%) | 1,534 (7.2%) |
Disability Class: Cognitive Difficulty
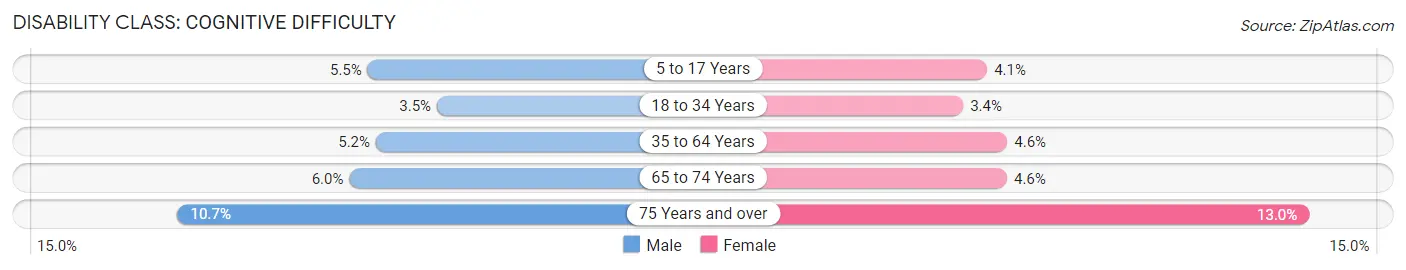
| Age Bracket | Male | Female |
| 5 to 17 Years | 2,261 (5.4%) | 1,652 (4.1%) |
| 18 to 34 Years | 3,417 (3.5%) | 3,855 (3.4%) |
| 35 to 64 Years | 6,288 (5.2%) | 5,723 (4.6%) |
| 65 to 74 Years | 1,249 (6.0%) | 1,252 (4.6%) |
| 75 Years and over | 1,383 (10.7%) | 2,754 (13.0%) |
Disability Class: Ambulatory Difficulty
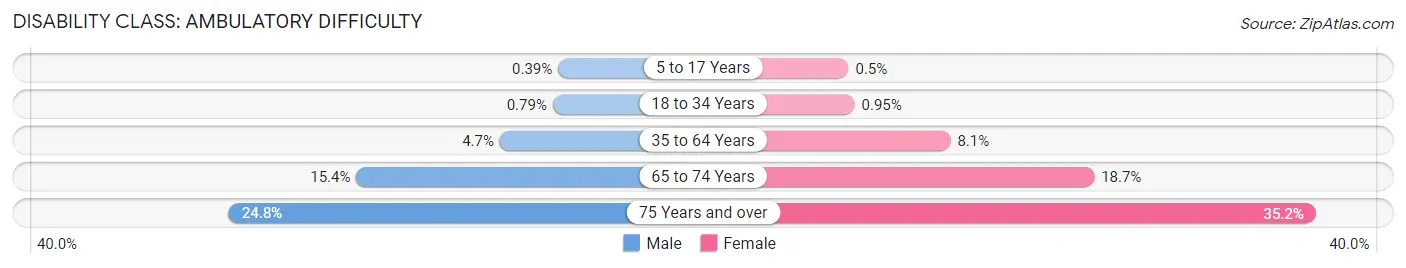
| Age Bracket | Male | Female |
| 5 to 17 Years | 161 (0.4%) | 205 (0.5%) |
| 18 to 34 Years | 769 (0.8%) | 1,078 (0.9%) |
| 35 to 64 Years | 5,691 (4.7%) | 10,013 (8.1%) |
| 65 to 74 Years | 3,220 (15.4%) | 5,105 (18.7%) |
| 75 Years and over | 3,197 (24.8%) | 7,446 (35.2%) |
Disability Class: Self-Care Difficulty
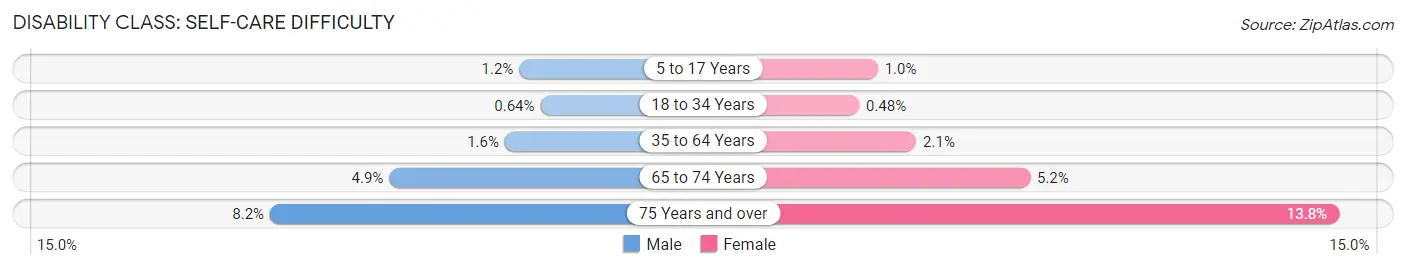
| Age Bracket | Male | Female |
| 5 to 17 Years | 509 (1.2%) | 407 (1.0%) |
| 18 to 34 Years | 617 (0.6%) | 545 (0.5%) |
| 35 to 64 Years | 1,964 (1.6%) | 2,566 (2.1%) |
| 65 to 74 Years | 1,017 (4.9%) | 1,427 (5.2%) |
| 75 Years and over | 1,052 (8.2%) | 2,929 (13.8%) |
Technology Access in Area Code 202
Computing Device Access in Area Code 202
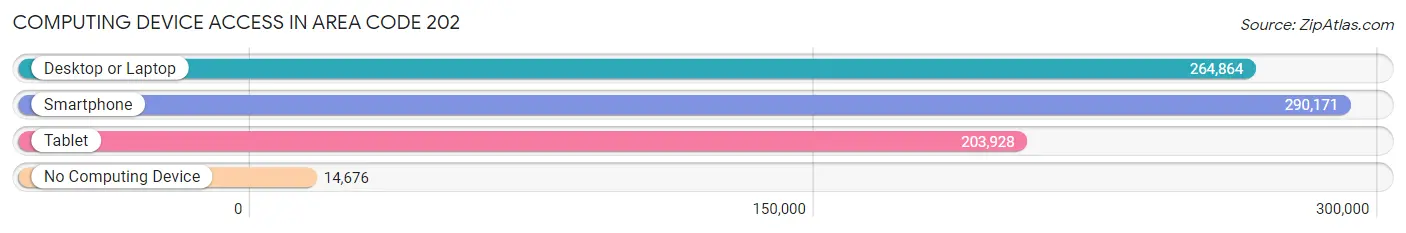
| Device Type | # Households | % Households |
| Desktop or Laptop | 264,864 | 83.9% |
| Smartphone | 290,171 | 91.9% |
| Tablet | 203,928 | 64.6% |
| No Computing Device | 14,676 | 4.6% |
| Total | 315,785 | 100.0% |
Internet Access in Area Code 202
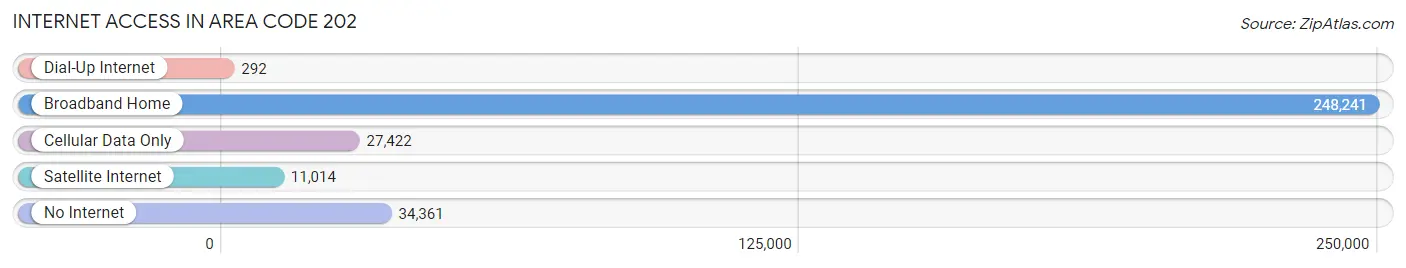
| Internet Type | # Households | % Households |
| Dial-Up Internet | 292 | 0.1% |
| Broadband Home | 248,241 | 78.6% |
| Cellular Data Only | 27,422 | 8.7% |
| Satellite Internet | 11,014 | 3.5% |
| No Internet | 34,361 | 10.9% |
| Total | 315,785 | 100.0% |
Area Code 202 Summary
Area code 202 is a telephone area code that serves the District of Columbia, which is the capital city of the United States. The area code encompasses a diverse range of geographic, social, economic, and demographic characteristics.
Geographically, the District of Columbia is located in the mid-Atlantic region of the United States, bordered by Maryland to the north and east and Virginia to the south. The city is known for its iconic landmarks, including the White House, the Capitol Building, and the National Mall. The region is also home to several parks and green spaces, including Rock Creek Park and the National Arboretum.
Socially, the District of Columbia is a diverse and cosmopolitan city, with a mix of ethnicities and cultures. The population is generally highly educated, with a large number of professionals and government employees. The region is home to several universities and colleges, including Georgetown University, American University, and Howard University. The city also has a vibrant arts and culture scene, with several theaters, museums, and galleries.
Economically, the District of Columbia is one of the most prosperous regions in the United States. The city is home to the federal government, which is the largest employer in the region. The area is also known for its strong healthcare, education, and technology sectors. The region has a relatively high median household income of approximately $86,000.
Demographically, the District of Columbia is a diverse city, with a mix of ethnicities and cultures. The largest ethnic group is Black/African American, followed by White, Hispanic/Latino, and Asian/Pacific Islander. The city has a relatively high number of foreign-born residents, with immigrants making up approximately 14% of the population. The area is known for its diversity and acceptance of different cultures and religions.
In conclusion, area code 202 serves a diverse and prosperous city that is the capital of the United States. The region is known for its iconic landmarks, highly educated population, strong economy, and diverse culture.
Common Questions
What is Per Capita Income in Area Code 202?
Per Capita income in Area Code 202 is $65,555.
What is the Median Family Income in Area Code 202?
Median Family Income in Area Code 202 is $173,869.
What is the Median Household income in Area Code 202?
Median Household Income in Area Code 202 is $111,161.
What is Income or Wage Gap in Area Code 202?
Income or Wage Gap in Area Code 202 is 17.5%.
Women in Area Code 202 earn 82.5 cents for every dollar earned by a man.
What is Family Income Deficit in Area Code 202?
Family Income Deficit in Area Code 202 is $13,592.
Families that are below poverty line in Area Code 202 earn $13,592 less on average than the poverty threshold level.
What is Inequality or Gini Index in Area Code 202?
Inequality or Gini Index in Area Code 202 is 10.69.
What is the Total Population of Area Code 202?
Total Population of Area Code 202 is 670,587.
What is the Total Male Population of Area Code 202?
Total Male Population of Area Code 202 is 320,797.
What is the Total Female Population of Area Code 202?
Total Female Population of Area Code 202 is 349,790.
What is the Ratio of Males per 100 Females in Area Code 202?
There are 91.71 Males per 100 Females in Area Code 202.
What is the Ratio of Females per 100 Males in Area Code 202?
There are 109.04 Females per 100 Males in Area Code 202.
What is the Median Population Age in Area Code 202?
Median Population Age in Area Code 202 is 33.6 Years.
What is the Average Family Size in Area Code 202
Average Family Size in Area Code 202 is 2.9 People.
What is the Average Household Size in Area Code 202
Average Household Size in Area Code 202 is 2.1 People.
How Large is the Labor Force in Area Code 202?
There are 384,678 People in the Labor Forcein in Area Code 202.
What is the Percentage of People in the Labor Force in Area Code 202?
69.1% of People are in the Labor Force in Area Code 202.
What is the Unemployment Rate in Area Code 202?
Unemployment Rate in Area Code 202 is 7.2%.