Area Code 330 Map & Demographics
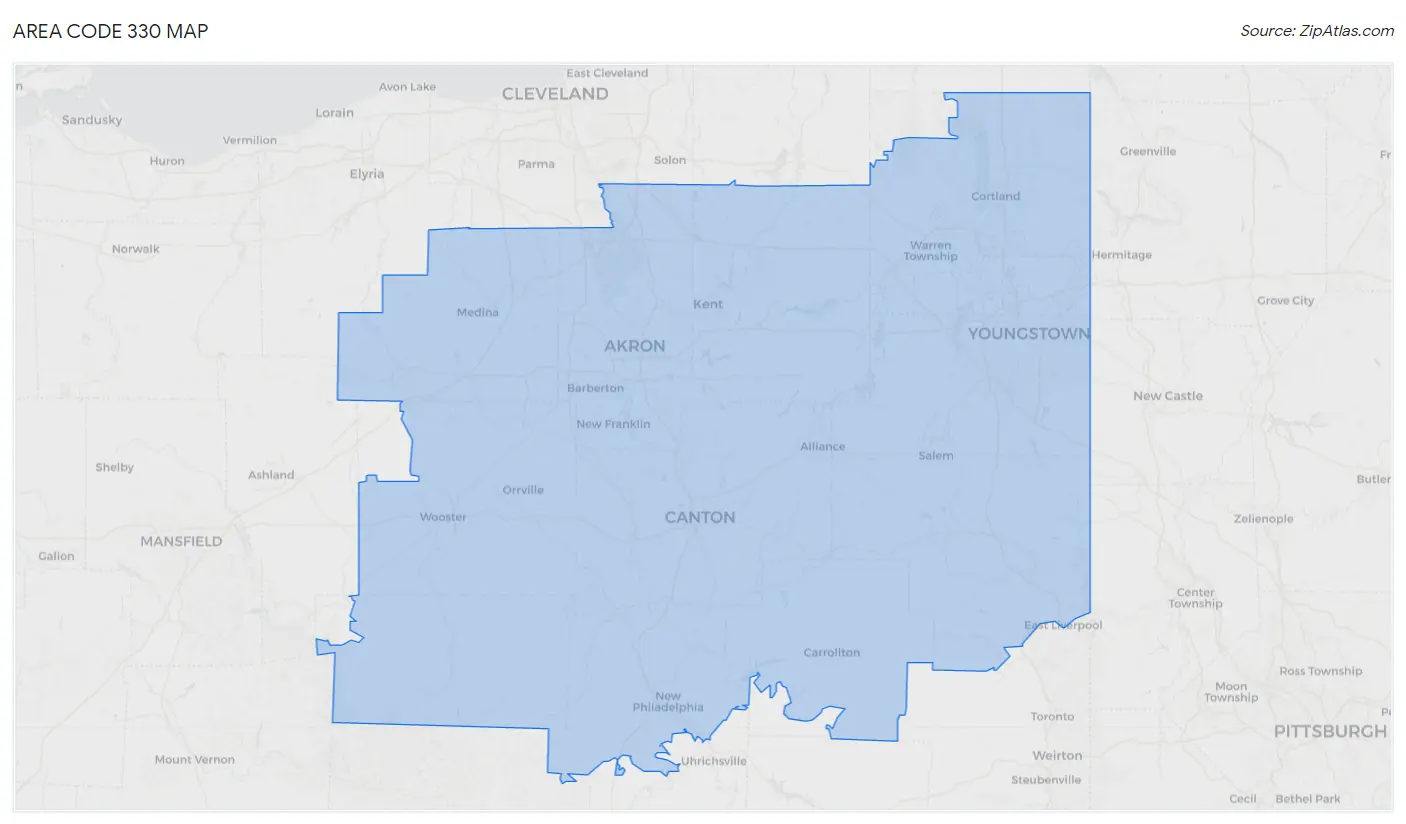
Area Code 330 Map
Area Code 330 Overview
$33,517
PER CAPITA INCOME
$80,795
AVG FAMILY INCOME
$65,861
AVG HOUSEHOLD INCOME
33.5%
WAGE / INCOME GAP [ % ]
66.5¢/ $1
WAGE / INCOME GAP [ $ ]
$10,519
FAMILY INCOME DEFICIT
68.63
INEQUALITY / GINI INDEX
1,816,161
TOTAL POPULATION
895,762
MALE POPULATION
920,399
FEMALE POPULATION
97.32
MALES / 100 FEMALES
102.75
FEMALES / 100 MALES
42.0
MEDIAN AGE
3.0
AVG FAMILY SIZE
2.5
AVG HOUSEHOLD SIZE
894,239
LABOR FORCE [ PEOPLE ]
60.5%
PERCENT IN LABOR FORCE
5.4%
UNEMPLOYMENT RATE
Income in Area Code 330
Income Overview in Area Code 330
Per Capita Income in Area Code 330 is $33,517, while median incomes of families and households are $80,795 and $65,861 respectively.
| Characteristic | Number | Measure |
| Per Capita Income | 1,816,161 | $33,517 |
| Median Family Income | 469,177 | $80,795 |
| Mean Family Income | 469,177 | $16,075,116 |
| Median Household Income | 745,038 | $65,861 |
| Mean Household Income | 745,038 | $13,583,084 |
| Income Deficit | 469,177 | $10,519 |
| Wage / Income Gap (%) | 1,816,161 | 33.50% |
| Wage / Income Gap ($) | 1,816,161 | 66.50¢ per $1 |
| Gini / Inequality Index | 1,816,161 | 68.63 |
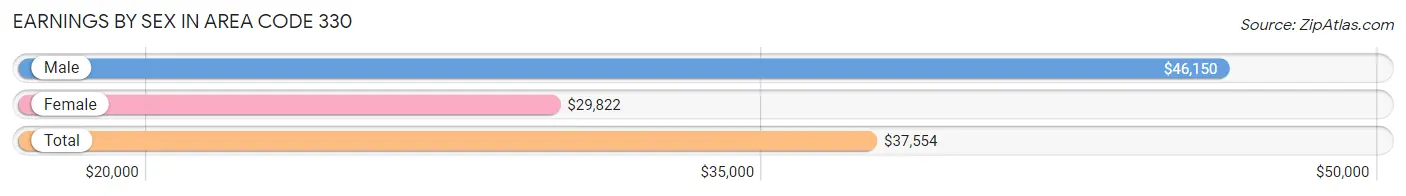
Earnings by Sex in Area Code 330
Average Earnings in Area Code 330 are $37,554, $46,150 for men and $29,822 for women, a difference of 35.4%.
| Sex | Number | Average Earnings |
| Male | 508,430 (52.8%) | $46,150 |
| Female | 453,752 (47.2%) | $29,822 |
| Total | 962,182 (100.0%) | $37,554 |
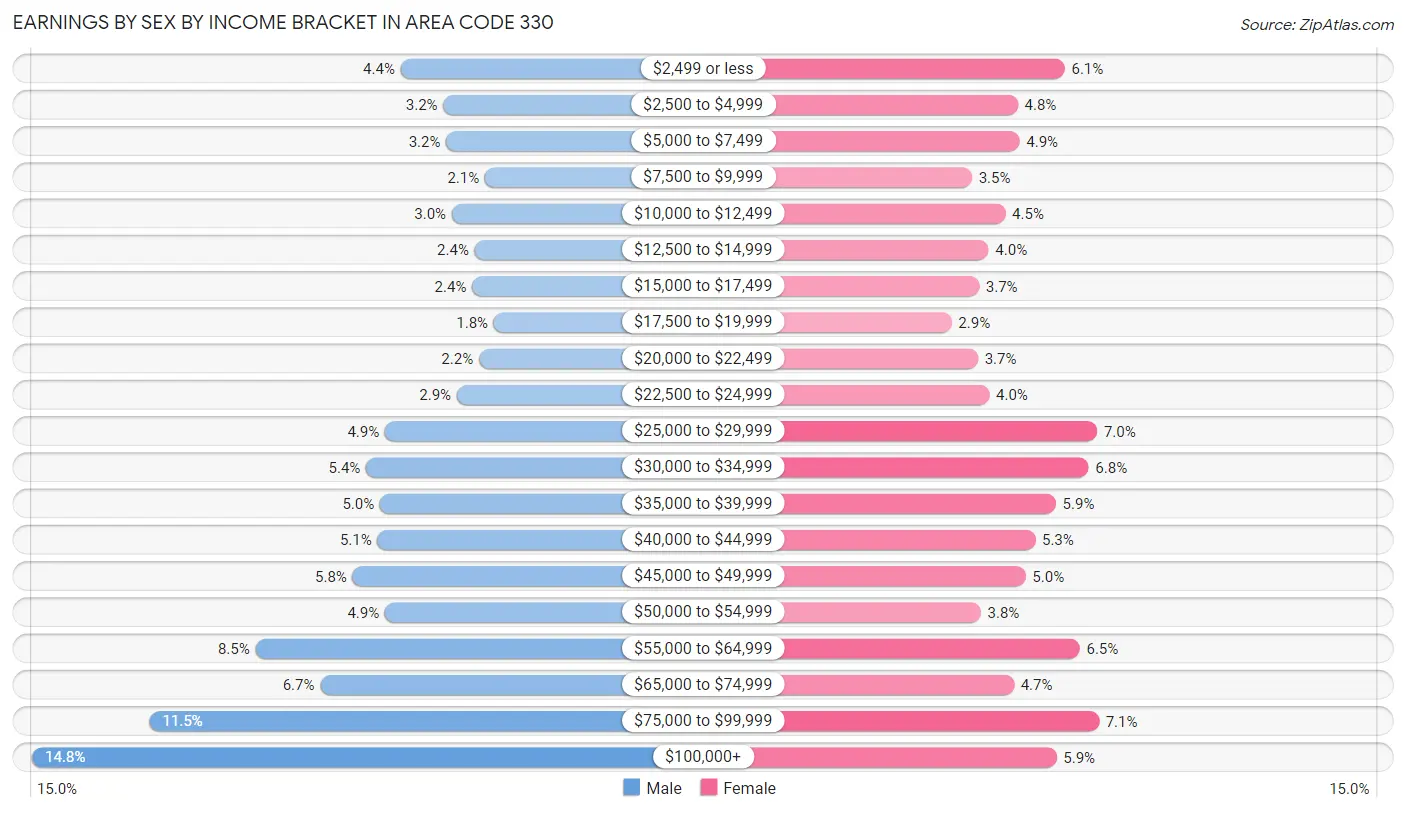
Earnings by Sex by Income Bracket in Area Code 330
The most common earnings brackets in Area Code 330 are $100,000+ for men (75,205 | 14.8%) and $75,000 to $99,999 for women (32,134 | 7.1%).
| Income | Male | Female |
| $2,499 or less | 22,519 (4.4%) | 27,761 (6.1%) |
| $2,500 to $4,999 | 16,443 (3.2%) | 21,762 (4.8%) |
| $5,000 to $7,499 | 16,008 (3.2%) | 22,028 (4.9%) |
| $7,500 to $9,999 | 10,456 (2.1%) | 15,941 (3.5%) |
| $10,000 to $12,499 | 15,187 (3.0%) | 20,187 (4.4%) |
| $12,500 to $14,999 | 11,940 (2.4%) | 18,055 (4.0%) |
| $15,000 to $17,499 | 12,318 (2.4%) | 16,844 (3.7%) |
| $17,500 to $19,999 | 9,205 (1.8%) | 13,339 (2.9%) |
| $20,000 to $22,499 | 11,356 (2.2%) | 16,683 (3.7%) |
| $22,500 to $24,999 | 14,466 (2.9%) | 18,152 (4.0%) |
| $25,000 to $29,999 | 24,745 (4.9%) | 31,895 (7.0%) |
| $30,000 to $34,999 | 27,454 (5.4%) | 30,829 (6.8%) |
| $35,000 to $39,999 | 25,482 (5.0%) | 26,613 (5.9%) |
| $40,000 to $44,999 | 25,813 (5.1%) | 24,020 (5.3%) |
| $45,000 to $49,999 | 29,379 (5.8%) | 22,775 (5.0%) |
| $50,000 to $54,999 | 24,745 (4.9%) | 17,064 (3.8%) |
| $55,000 to $64,999 | 43,262 (8.5%) | 29,665 (6.5%) |
| $65,000 to $74,999 | 34,008 (6.7%) | 21,294 (4.7%) |
| $75,000 to $99,999 | 58,439 (11.5%) | 32,134 (7.1%) |
| $100,000+ | 75,205 (14.8%) | 26,711 (5.9%) |
| Total | 508,430 (100.0%) | 453,752 (100.0%) |
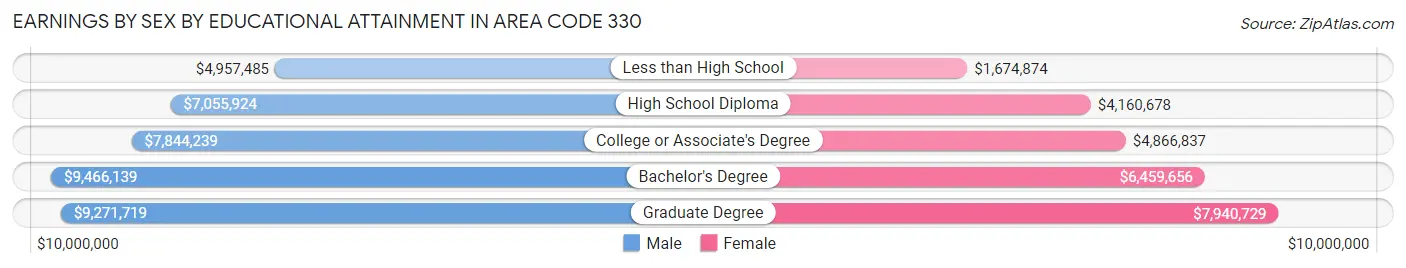
Earnings by Sex by Educational Attainment in Area Code 330
Average earnings in Area Code 330 are $8,439,868 for men and $5,518,286 for women, a difference of 34.6%. Men with an educational attainment of bachelor's degree enjoy the highest average annual earnings of $9,466,139, while those with less than high school education earn the least with $4,957,485. Women with an educational attainment of graduate degree earn the most with the average annual earnings of $7,940,729, while those with less than high school education have the smallest earnings of $1,674,874.
| Educational Attainment | Male Income | Female Income |
| Less than High School | $4,957,485 | $1,674,874 |
| High School Diploma | $7,055,924 | $4,160,678 |
| College or Associate's Degree | $7,844,239 | $4,866,837 |
| Bachelor's Degree | $9,466,139 | $6,459,656 |
| Graduate Degree | $9,271,719 | $7,940,729 |
| Total | $8,439,868 | $5,518,286 |
Family Income in Area Code 330
Family Income Brackets in Area Code 330
According to the Area Code 330 family income data, there are 15,292,355 families falling into the $100,000 to $149,999 income range, which is the most common income bracket and makes up 3,259.4% of all families. Conversely, the $10,000 to $14,999 income bracket is the least frequent group with only 1,871,078 families (398.8%) belonging to this category.
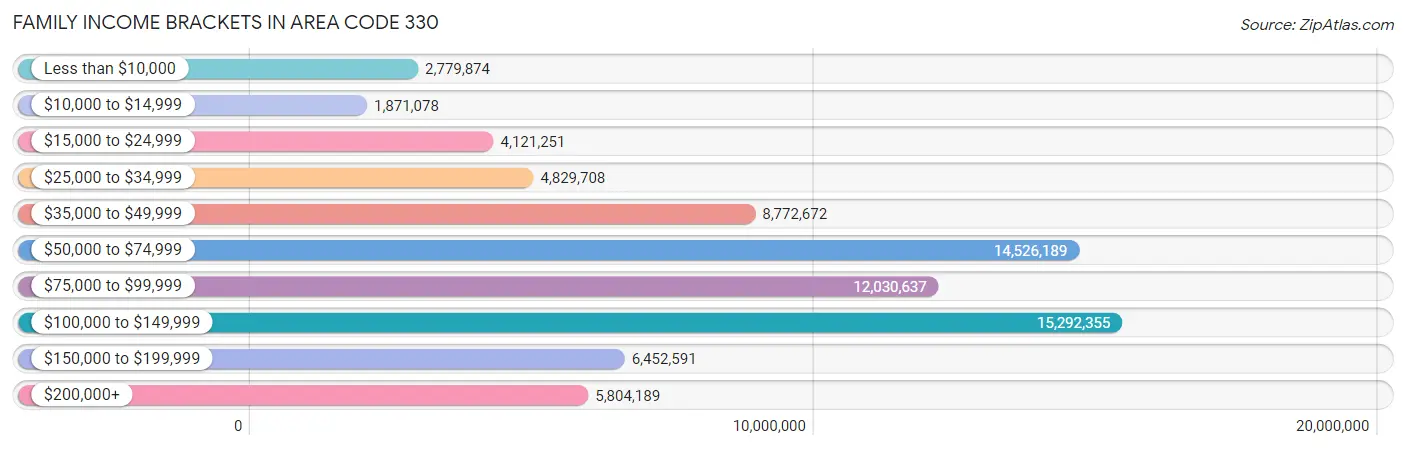
| Income Bracket | # Families | % Families |
| Less than $10,000 | 2,779,874 | 592.5% |
| $10,000 to $14,999 | 1,871,078 | 398.8% |
| $15,000 to $24,999 | 4,121,251 | 878.4% |
| $25,000 to $34,999 | 4,829,708 | 1,029.4% |
| $35,000 to $49,999 | 8,772,672 | 1,869.8% |
| $50,000 to $74,999 | 14,526,189 | 3,096.1% |
| $75,000 to $99,999 | 12,030,637 | 2,564.2% |
| $100,000 to $149,999 | 15,292,355 | 3,259.4% |
| $150,000 to $199,999 | 6,452,591 | 1,375.3% |
| $200,000+ | 5,804,189 | 1,237.1% |
Family Income by Famaliy Size in Area Code 330
7+ person families (8,405 | 1.8%) account for the highest median family income in Area Code 330 with $125,070 per family, while 2-person families (241,452 | 51.5%) have the highest median income of $36,117 per family member.
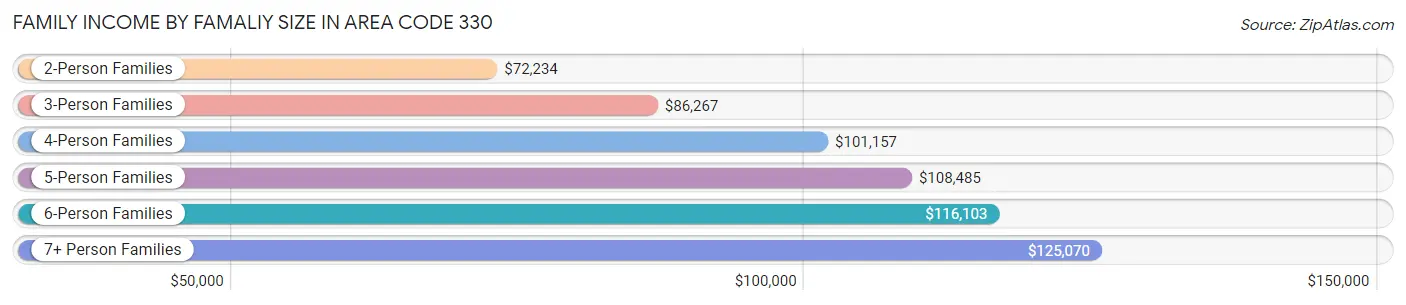
| Income Bracket | # Families | Median Income |
| 2-Person Families | 241,452 (51.5%) | $72,234 |
| 3-Person Families | 100,324 (21.4%) | $86,267 |
| 4-Person Families | 76,136 (16.2%) | $101,157 |
| 5-Person Families | 32,356 (6.9%) | $108,485 |
| 6-Person Families | 10,504 (2.2%) | $116,103 |
| 7+ Person Families | 8,405 (1.8%) | $125,070 |
| Total | 469,177 (100.0%) | $80,795 |
Family Income by Number of Earners in Area Code 330
The median family income in Area Code 330 is $80,795, with families comprising 3+ earners (54,698) having the highest median family income of $131,900, while families with no earners (77,180) have the lowest median family income of $47,744, accounting for 11.7% and 16.5% of families, respectively.
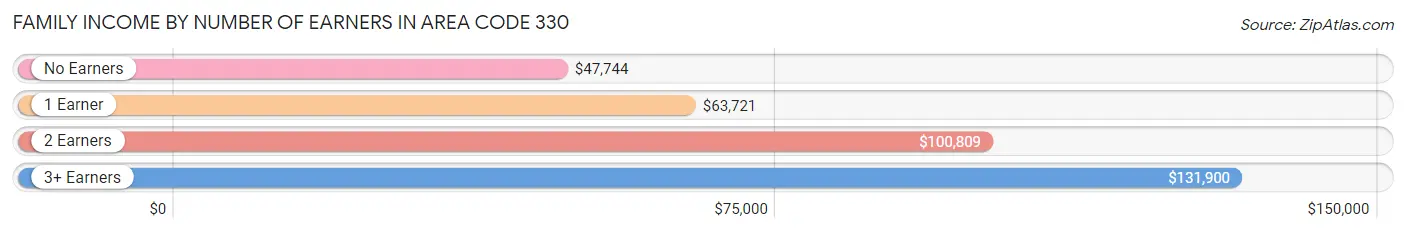
| Number of Earners | # Families | Median Income |
| No Earners | 77,180 (16.5%) | $47,744 |
| 1 Earner | 153,014 (32.6%) | $63,721 |
| 2 Earners | 184,285 (39.3%) | $100,809 |
| 3+ Earners | 54,698 (11.7%) | $131,900 |
| Total | 469,177 (100.0%) | $80,795 |
Household Income in Area Code 330
Household Income Brackets in Area Code 330
With 22,073,241 households falling in the category, the $50,000 to $74,999 income range is the most frequent in Area Code 330, accounting for 2,962.7% of all households. In contrast, only 5,513,281 households (740.0%) fall into the $10,000 to $14,999 income bracket, making it the least populous group.
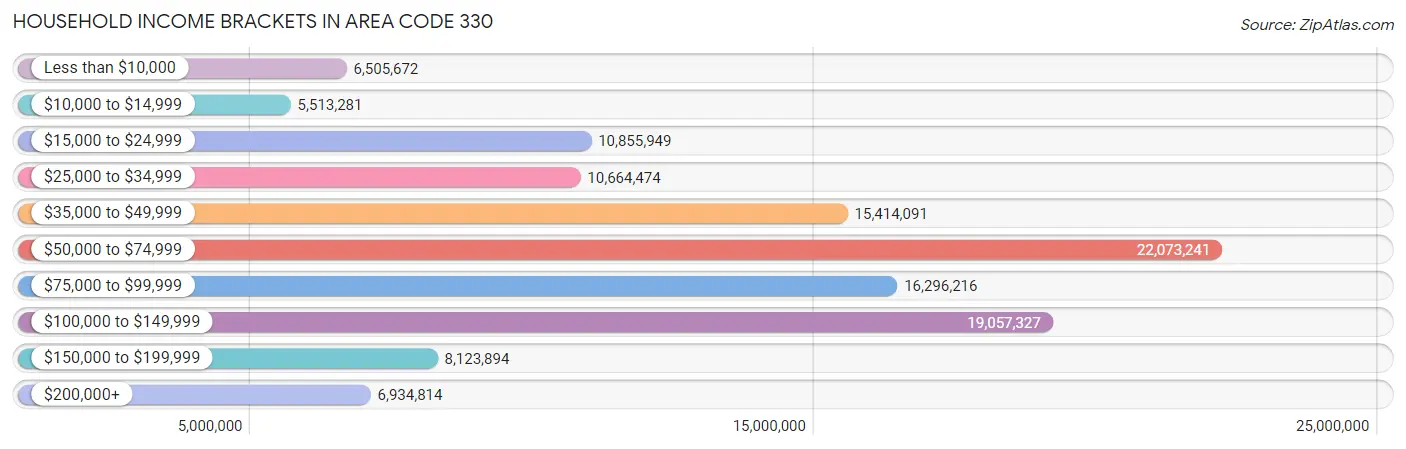
| Income Bracket | # Households | % Households |
| Less than $10,000 | 6,505,672 | 873.2% |
| $10,000 to $14,999 | 5,513,281 | 740.0% |
| $15,000 to $24,999 | 10,855,949 | 1,457.1% |
| $25,000 to $34,999 | 10,664,474 | 1,431.4% |
| $35,000 to $49,999 | 15,414,091 | 2,068.9% |
| $50,000 to $74,999 | 22,073,241 | 2,962.7% |
| $75,000 to $99,999 | 16,296,216 | 2,187.3% |
| $100,000 to $149,999 | 19,057,327 | 2,557.9% |
| $150,000 to $199,999 | 8,123,894 | 1,090.4% |
| $200,000+ | 6,934,814 | 930.8% |
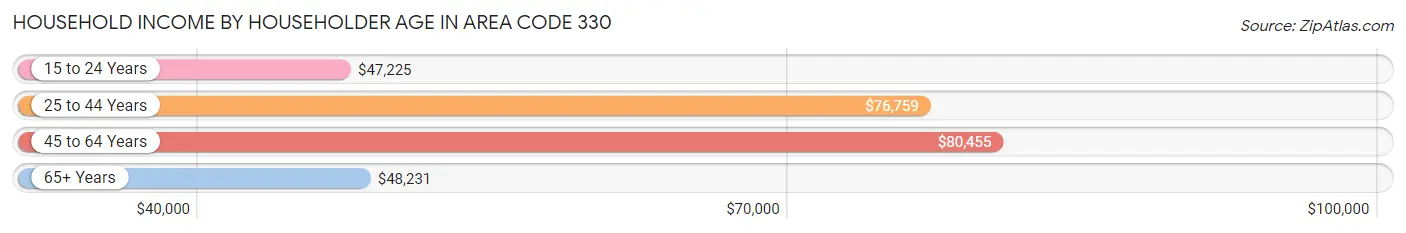
Household Income by Householder Age in Area Code 330
The median household income in Area Code 330 is $65,861, with the highest median household income of $80,455 found in the 45 to 64 years age bracket for the primary householder. A total of 280,902 households (37.7%) fall into this category. Meanwhile, the 15 to 24 years age bracket for the primary householder has the lowest median household income of $47,225, with 27,313 households (3.7%) in this group.
| Income Bracket | # Households | Median Income |
| 15 to 24 Years | 27,313 (3.7%) | $47,225 |
| 25 to 44 Years | 213,028 (28.6%) | $76,759 |
| 45 to 64 Years | 280,902 (37.7%) | $80,455 |
| 65+ Years | 223,795 (30.0%) | $48,231 |
| Total | 745,038 (100.0%) | $65,861 |
Poverty in Area Code 330
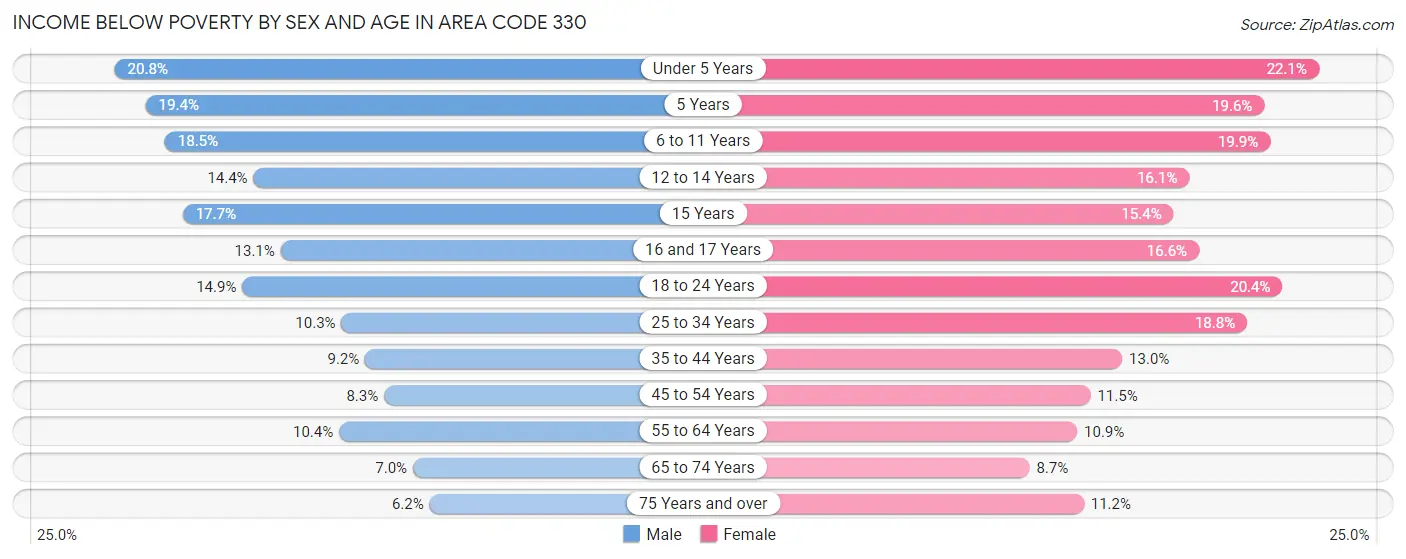
Income Below Poverty by Sex and Age in Area Code 330
With 11.4% poverty level for males and 14.4% for females among the residents of Area Code 330, under 5 year old males and under 5 year old females are the most vulnerable to poverty, with 10,251 males (20.8%) and 10,293 females (22.1%) in their respective age groups living below the poverty level.
| Age Bracket | Male | Female |
| Under 5 Years | 10,251 (20.8%) | 10,293 (22.1%) |
| 5 Years | 2,060 (19.4%) | 1,961 (19.6%) |
| 6 to 11 Years | 12,261 (18.5%) | 12,292 (19.9%) |
| 12 to 14 Years | 4,695 (14.4%) | 5,246 (16.1%) |
| 15 Years | 2,080 (17.7%) | 1,788 (15.4%) |
| 16 and 17 Years | 3,099 (13.1%) | 3,803 (16.6%) |
| 18 to 24 Years | 11,533 (14.9%) | 14,726 (20.4%) |
| 25 to 34 Years | 11,128 (10.3%) | 19,903 (18.8%) |
| 35 to 44 Years | 9,678 (9.2%) | 13,642 (13.0%) |
| 45 to 54 Years | 9,223 (8.3%) | 12,997 (11.5%) |
| 55 to 64 Years | 13,128 (10.4%) | 14,290 (10.9%) |
| 65 to 74 Years | 6,776 (7.0%) | 9,397 (8.7%) |
| 75 Years and over | 3,538 (6.2%) | 8,926 (11.2%) |
| Total | 99,450 (11.4%) | 129,264 (14.4%) |
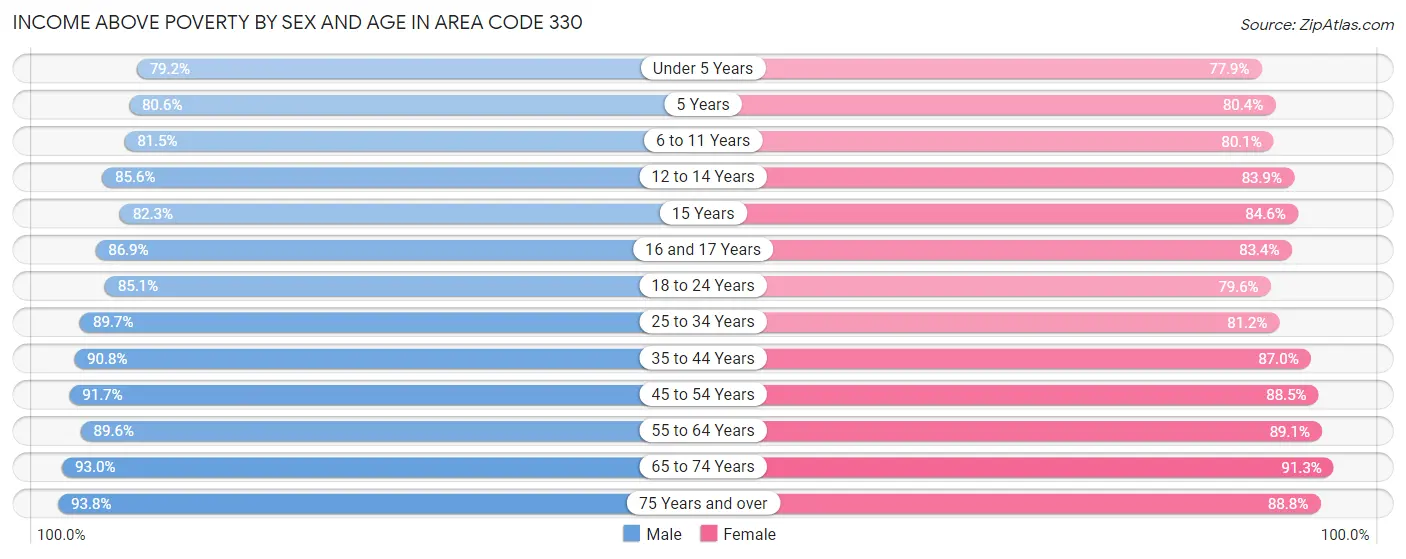
Income Above Poverty by Sex and Age in Area Code 330
According to the poverty statistics in Area Code 330, males aged 75 years and over and females aged 65 to 74 years are the age groups that are most secure financially, with 93.8% of males and 91.3% of females in these age groups living above the poverty line.
| Age Bracket | Male | Female |
| Under 5 Years | 38,995 (79.2%) | 36,220 (77.9%) |
| 5 Years | 8,569 (80.6%) | 8,042 (80.4%) |
| 6 to 11 Years | 54,048 (81.5%) | 49,559 (80.1%) |
| 12 to 14 Years | 27,944 (85.6%) | 27,292 (83.9%) |
| 15 Years | 9,699 (82.3%) | 9,829 (84.6%) |
| 16 and 17 Years | 20,523 (86.9%) | 19,145 (83.4%) |
| 18 to 24 Years | 65,884 (85.1%) | 57,311 (79.6%) |
| 25 to 34 Years | 96,876 (89.7%) | 85,992 (81.2%) |
| 35 to 44 Years | 95,499 (90.8%) | 91,232 (87.0%) |
| 45 to 54 Years | 101,681 (91.7%) | 99,598 (88.5%) |
| 55 to 64 Years | 113,012 (89.6%) | 116,610 (89.1%) |
| 65 to 74 Years | 90,368 (93.0%) | 98,472 (91.3%) |
| 75 Years and over | 53,391 (93.8%) | 70,574 (88.8%) |
| Total | 776,489 (88.6%) | 769,876 (85.6%) |
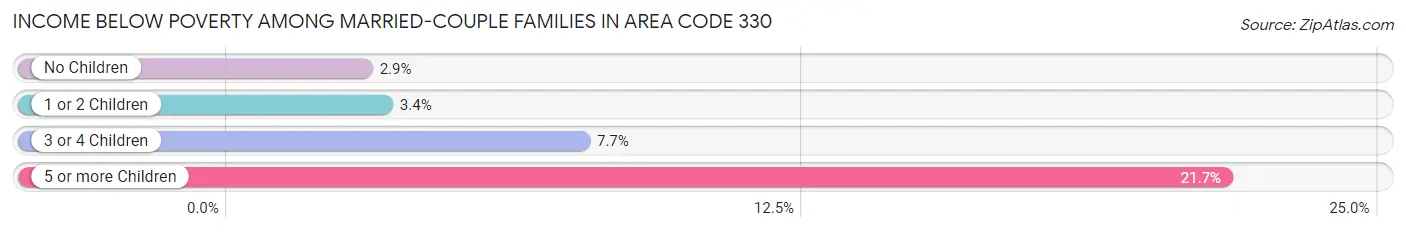
Income Below Poverty Among Married-Couple Families in Area Code 330
The poverty statistics for married-couple families in Area Code 330 show that 3.6% or 12,583 of the total 346,155 families live below the poverty line. Families with 5 or more children have the highest poverty rate of 21.6%, comprising of 908 families. On the other hand, families with no children have the lowest poverty rate of 2.9%, which includes 6,455 families.
| Children | Above Poverty | Below Poverty |
| No Children | 213,556 (97.1%) | 6,455 (2.9%) |
| 1 or 2 Children | 92,858 (96.6%) | 3,241 (3.4%) |
| 3 or 4 Children | 23,872 (92.3%) | 1,979 (7.7%) |
| 5 or more Children | 3,286 (78.3%) | 908 (21.6%) |
| Total | 333,572 (96.4%) | 12,583 (3.6%) |
Income Below Poverty Among Single-Parent Households in Area Code 330
According to the poverty data in Area Code 330, 13.1% or 4,742 single-father households and 29.6% or 25,664 single-mother households are living below the poverty line. Among single-father households, those with 5 or more children have the highest poverty rate, with 75 households (43.9%) experiencing poverty. Likewise, among single-mother households, those with 5 or more children have the highest poverty rate, with 715 households (82.2%) falling below the poverty line.
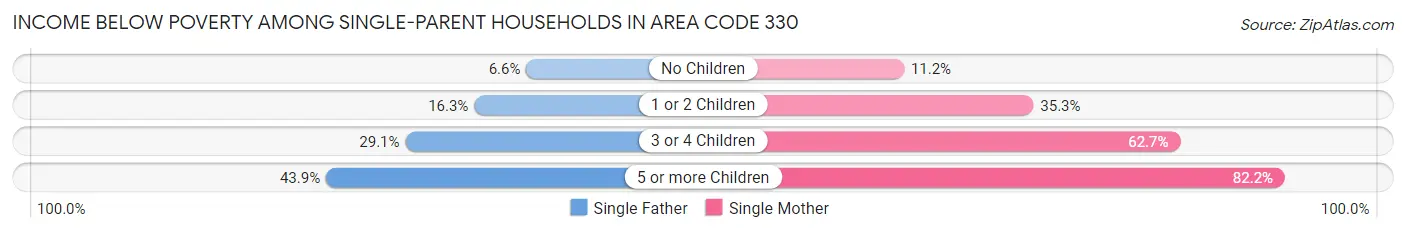
| Children | Single Father | Single Mother |
| No Children | 1,031 (6.6%) | 3,674 (11.2%) |
| 1 or 2 Children | 2,904 (16.3%) | 15,551 (35.3%) |
| 3 or 4 Children | 732 (29.1%) | 5,724 (62.7%) |
| 5 or more Children | 75 (43.9%) | 715 (82.2%) |
| Total | 4,742 (13.1%) | 25,664 (29.6%) |
Income Below Poverty Among Married-Couple vs Single-Parent Households in Area Code 330
The poverty data for Area Code 330 shows that 12,583 of the married-couple family households (3.6%) and 30,406 of the single-parent households (24.7%) are living below the poverty level. Within the married-couple family households, those with 5 or more children have the highest poverty rate, with 908 households (21.6%) falling below the poverty line. Among the single-parent households, those with 5 or more children have the highest poverty rate, with 790 household (75.9%) living below poverty.
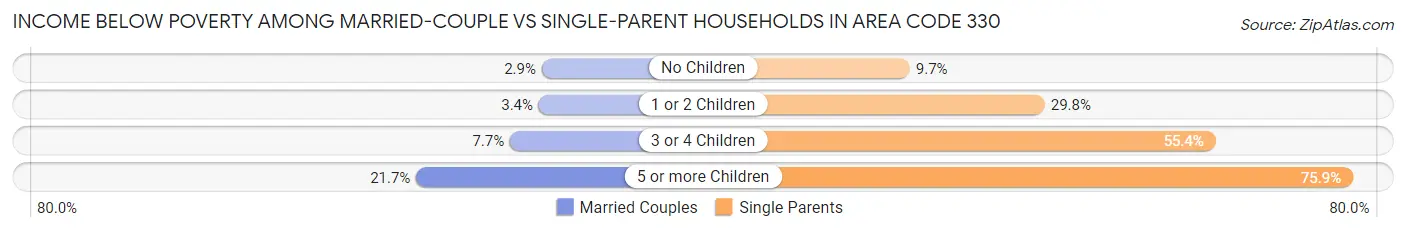
| Children | Married-Couple Families | Single-Parent Households |
| No Children | 6,455 (2.9%) | 4,705 (9.7%) |
| 1 or 2 Children | 3,241 (3.4%) | 18,455 (29.8%) |
| 3 or 4 Children | 1,979 (7.7%) | 6,456 (55.4%) |
| 5 or more Children | 908 (21.6%) | 790 (75.9%) |
| Total | 12,583 (3.6%) | 30,406 (24.7%) |
Race in Area Code 330
The most populous races in Area Code 330 are White / Caucasian (1,534,833 | 84.5%), Black / African American (154,469 | 8.5%), and Two or more Races (81,474 | 4.5%).
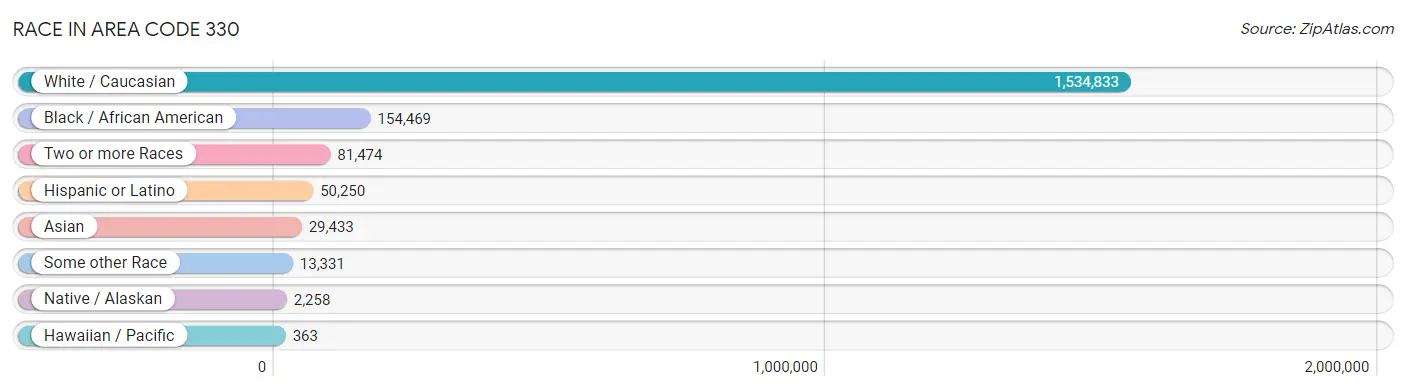
| Race | # Population | % Population |
| Asian | 29,433 | 1.6% |
| Black / African American | 154,469 | 8.5% |
| Hawaiian / Pacific | 363 | 0.0% |
| Hispanic or Latino | 50,250 | 2.8% |
| Native / Alaskan | 2,258 | 0.1% |
| White / Caucasian | 1,534,833 | 84.5% |
| Two or more Races | 81,474 | 4.5% |
| Some other Race | 13,331 | 0.7% |
| Total | 1,816,161 | 100.0% |
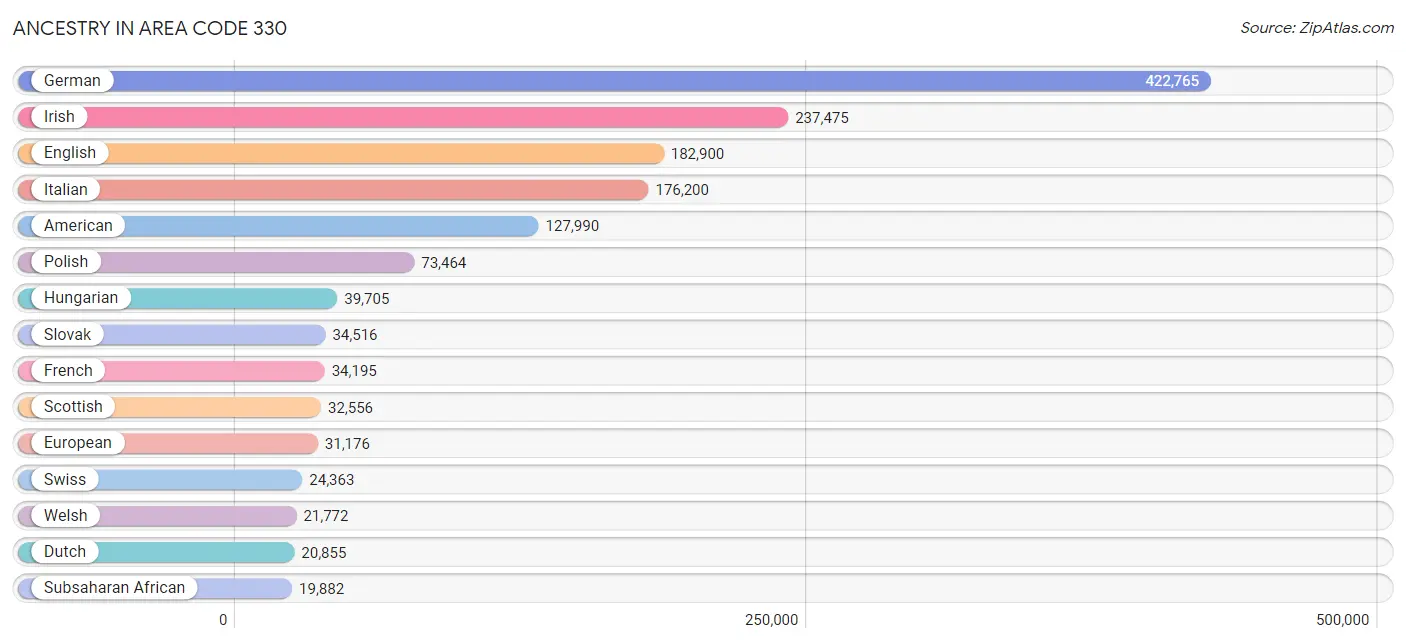
Ancestry in Area Code 330
The most populous ancestries reported in Area Code 330 are German (422,765 | 23.3%), Irish (237,475 | 13.1%), English (182,900 | 10.1%), Italian (176,200 | 9.7%), and American (127,990 | 7.0%), together accounting for 63.2% of all Area Code 330 residents.
| Ancestry | # Population | % Population |
| Afghan | 55 | 0.0% |
| African | 16,366 | 0.9% |
| Alaska Native | 5 | 0.0% |
| Alaskan Athabascan | 13 | 0.0% |
| Albanian | 453 | 0.0% |
| Alsatian | 58 | 0.0% |
| American | 127,990 | 7.0% |
| Apache | 248 | 0.0% |
| Arab | 11,622 | 0.6% |
| Arapaho | 10 | 0.0% |
| Argentinean | 452 | 0.0% |
| Armenian | 713 | 0.0% |
| Assyrian / Chaldean / Syriac | 16 | 0.0% |
| Australian | 380 | 0.0% |
| Austrian | 4,515 | 0.3% |
| Bahamian | 35 | 0.0% |
| Bangladeshi | 282 | 0.0% |
| Barbadian | 73 | 0.0% |
| Basque | 11 | 0.0% |
| Belgian | 1,039 | 0.1% |
| Belizean | 59 | 0.0% |
| Bhutanese | 2,213 | 0.1% |
| Blackfeet | 2,088 | 0.1% |
| Brazilian | 728 | 0.0% |
| British | 8,355 | 0.5% |
| British West Indian | 16 | 0.0% |
| Bulgarian | 659 | 0.0% |
| Burmese | 2,467 | 0.1% |
| Cajun | 12 | 0.0% |
| Cambodian | 54 | 0.0% |
| Canadian | 2,167 | 0.1% |
| Cape Verdean | 86 | 0.0% |
| Carpatho Rusyn | 139 | 0.0% |
| Celtic | 179 | 0.0% |
| Central American | 4,885 | 0.3% |
| Central American Indian | 542 | 0.0% |
| Cherokee | 5,173 | 0.3% |
| Cheyenne | 137 | 0.0% |
| Chickasaw | 13 | 0.0% |
| Chilean | 136 | 0.0% |
| Chinese | 21 | 0.0% |
| Chippewa | 292 | 0.0% |
| Choctaw | 217 | 0.0% |
| Colombian | 1,052 | 0.1% |
| Colville | 4 | 0.0% |
| Comanche | 13 | 0.0% |
| Costa Rican | 110 | 0.0% |
| Cree | 16 | 0.0% |
| Creek | 79 | 0.0% |
| Croatian | 10,060 | 0.5% |
| Crow | 32 | 0.0% |
| Cuban | 1,547 | 0.1% |
| Cypriot | 35 | 0.0% |
| Czech | 11,508 | 0.6% |
| Czechoslovakian | 4,185 | 0.2% |
| Danish | 2,553 | 0.1% |
| Delaware | 293 | 0.0% |
| Dominican | 616 | 0.0% |
| Dutch | 20,855 | 1.1% |
| Dutch West Indian | 14 | 0.0% |
| Eastern European | 6,176 | 0.3% |
| Ecuadorian | 332 | 0.0% |
| Egyptian | 503 | 0.0% |
| English | 182,900 | 10.1% |
| Estonian | 41 | 0.0% |
| Ethiopian | 134 | 0.0% |
| European | 31,176 | 1.7% |
| Filipino | 359 | 0.0% |
| Finnish | 2,597 | 0.1% |
| French | 34,195 | 1.9% |
| French American Indian | 47 | 0.0% |
| French Canadian | 3,848 | 0.2% |
| German | 422,765 | 23.3% |
| German Russian | 62 | 0.0% |
| Ghanaian | 290 | 0.0% |
| Greek | 13,594 | 0.7% |
| Guamanian / Chamorro | 134 | 0.0% |
| Guatemalan | 2,365 | 0.1% |
| Guyanese | 52 | 0.0% |
| Haitian | 426 | 0.0% |
| Honduran | 1,206 | 0.1% |
| Hopi | 1 | 0.0% |
| Hungarian | 39,705 | 2.2% |
| Icelander | 166 | 0.0% |
| Indian (Asian) | 6,122 | 0.3% |
| Indonesian | 1,678 | 0.1% |
| Inupiat | 45 | 0.0% |
| Iranian | 1,026 | 0.1% |
| Iraqi | 37 | 0.0% |
| Irish | 237,475 | 13.1% |
| Iroquois | 373 | 0.0% |
| Israeli | 303 | 0.0% |
| Italian | 176,200 | 9.7% |
| Jamaican | 1,763 | 0.1% |
| Japanese | 598 | 0.0% |
| Jordanian | 681 | 0.0% |
| Kenyan | 89 | 0.0% |
| Korean | 5,826 | 0.3% |
| Laotian | 121 | 0.0% |
| Latvian | 523 | 0.0% |
| Lebanese | 5,753 | 0.3% |
| Liberian | 74 | 0.0% |
| Lithuanian | 2,889 | 0.2% |
| Lumbee | 43 | 0.0% |
| Luxembourger | 49 | 0.0% |
| Macedonian | 1,313 | 0.1% |
| Malaysian | 583 | 0.0% |
| Maltese | 70 | 0.0% |
| Mexican | 18,222 | 1.0% |
| Mexican American Indian | 265 | 0.0% |
| Mongolian | 102 | 0.0% |
| Moroccan | 271 | 0.0% |
| Native Hawaiian | 518 | 0.0% |
| Navajo | 119 | 0.0% |
| New Zealander | 40 | 0.0% |
| Nicaraguan | 191 | 0.0% |
| Nigerian | 962 | 0.1% |
| Northern European | 1,343 | 0.1% |
| Norwegian | 5,450 | 0.3% |
| Okinawan | 198 | 0.0% |
| Osage | 28 | 0.0% |
| Paiute | 4 | 0.0% |
| Pakistani | 565 | 0.0% |
| Palestinian | 1,325 | 0.1% |
| Panamanian | 295 | 0.0% |
| Pennsylvania German | 12,878 | 0.7% |
| Peruvian | 251 | 0.0% |
| Polish | 73,464 | 4.1% |
| Portuguese | 2,079 | 0.1% |
| Potawatomi | 26 | 0.0% |
| Pueblo | 8 | 0.0% |
| Puerto Rican | 16,658 | 0.9% |
| Romanian | 8,034 | 0.4% |
| Russian | 10,661 | 0.6% |
| Salvadoran | 718 | 0.0% |
| Samoan | 131 | 0.0% |
| Scandinavian | 2,787 | 0.2% |
| Scotch-Irish | 17,220 | 0.9% |
| Scottish | 32,556 | 1.8% |
| Seminole | 23 | 0.0% |
| Serbian | 5,439 | 0.3% |
| Shoshone | 12 | 0.0% |
| Sierra Leonean | 26 | 0.0% |
| Sioux | 345 | 0.0% |
| Slavic | 1,675 | 0.1% |
| Slovak | 34,516 | 1.9% |
| Slovene | 6,649 | 0.4% |
| South African | 282 | 0.0% |
| South American | 2,481 | 0.1% |
| Soviet Union | 18 | 0.0% |
| Spaniard | 1,472 | 0.1% |
| Spanish | 2,252 | 0.1% |
| Spanish American | 59 | 0.0% |
| Sri Lankan | 2,078 | 0.1% |
| Subsaharan African | 19,882 | 1.1% |
| Sudanese | 92 | 0.0% |
| Swedish | 11,971 | 0.7% |
| Swiss | 24,363 | 1.3% |
| Syrian | 980 | 0.1% |
| Thai | 9,622 | 0.5% |
| Tlingit-Haida | 8 | 0.0% |
| Tongan | 6 | 0.0% |
| Trinidadian and Tobagonian | 113 | 0.0% |
| Turkish | 369 | 0.0% |
| U.S. Virgin Islander | 19 | 0.0% |
| Ugandan | 50 | 0.0% |
| Ukrainian | 8,582 | 0.5% |
| Uruguayan | 62 | 0.0% |
| Ute | 8 | 0.0% |
| Venezuelan | 196 | 0.0% |
| Vietnamese | 157 | 0.0% |
| Welsh | 21,772 | 1.2% |
| West Indian | 327 | 0.0% |
| Yaqui | 12 | 0.0% |
| Yugoslavian | 1,694 | 0.1% |
| Zimbabwean | 21 | 0.0% | View All 176 Rows |
Immigrants in Area Code 330
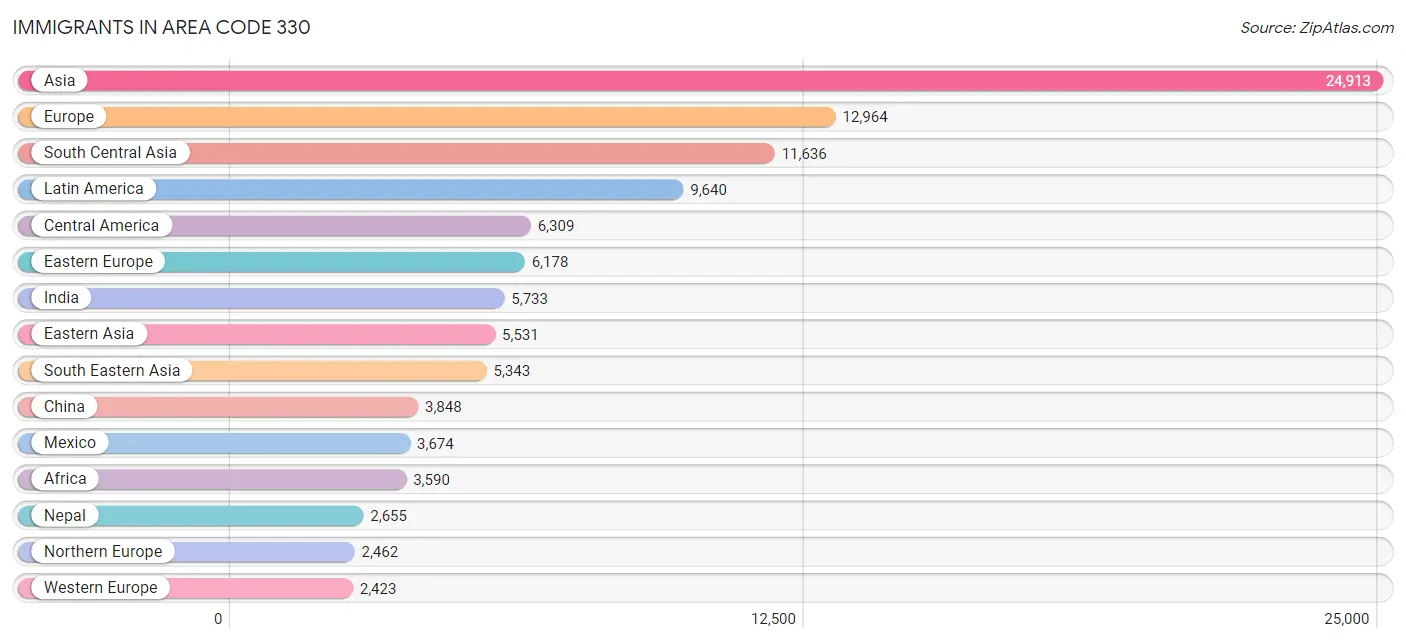
The most numerous immigrant groups reported in Area Code 330 came from Asia (24,913 | 1.4%), Europe (12,964 | 0.7%), South Central Asia (11,636 | 0.6%), Latin America (9,640 | 0.5%), and Central America (6,309 | 0.4%), together accounting for 3.6% of all Area Code 330 residents.
| Immigration Origin | # Population | % Population |
| Afghanistan | 53 | 0.0% |
| Africa | 3,590 | 0.2% |
| Albania | 136 | 0.0% |
| Argentina | 310 | 0.0% |
| Armenia | 33 | 0.0% |
| Asia | 24,913 | 1.4% |
| Australia | 184 | 0.0% |
| Austria | 263 | 0.0% |
| Bahamas | 74 | 0.0% |
| Bangladesh | 367 | 0.0% |
| Belarus | 70 | 0.0% |
| Belgium | 122 | 0.0% |
| Belize | 32 | 0.0% |
| Bosnia and Herzegovina | 339 | 0.0% |
| Brazil | 634 | 0.0% |
| Bulgaria | 34 | 0.0% |
| Cabo Verde | 46 | 0.0% |
| Cambodia | 195 | 0.0% |
| Cameroon | 248 | 0.0% |
| Canada | 2,352 | 0.1% |
| Caribbean | 1,127 | 0.1% |
| Central America | 6,309 | 0.4% |
| Chile | 45 | 0.0% |
| China | 3,848 | 0.2% |
| Colombia | 560 | 0.0% |
| Congo | 520 | 0.0% |
| Costa Rica | 62 | 0.0% |
| Croatia | 242 | 0.0% |
| Cuba | 78 | 0.0% |
| Czechoslovakia | 233 | 0.0% |
| Denmark | 83 | 0.0% |
| Dominican Republic | 154 | 0.0% |
| Eastern Africa | 637 | 0.0% |
| Eastern Asia | 5,531 | 0.3% |
| Eastern Europe | 6,178 | 0.3% |
| Ecuador | 204 | 0.0% |
| Egypt | 356 | 0.0% |
| El Salvador | 429 | 0.0% |
| England | 1,133 | 0.1% |
| Ethiopia | 131 | 0.0% |
| Europe | 12,964 | 0.7% |
| France | 135 | 0.0% |
| Germany | 1,645 | 0.1% |
| Ghana | 227 | 0.0% |
| Greece | 532 | 0.0% |
| Guatemala | 1,315 | 0.1% |
| Guyana | 69 | 0.0% |
| Haiti | 100 | 0.0% |
| Honduras | 604 | 0.0% |
| Hong Kong | 69 | 0.0% |
| Hungary | 267 | 0.0% |
| India | 5,733 | 0.3% |
| Indonesia | 116 | 0.0% |
| Iran | 621 | 0.0% |
| Iraq | 17 | 0.0% |
| Ireland | 150 | 0.0% |
| Israel | 168 | 0.0% |
| Italy | 1,211 | 0.1% |
| Jamaica | 398 | 0.0% |
| Japan | 421 | 0.0% |
| Jordan | 550 | 0.0% |
| Kazakhstan | 97 | 0.0% |
| Kenya | 95 | 0.0% |
| Korea | 1,252 | 0.1% |
| Kuwait | 62 | 0.0% |
| Laos | 356 | 0.0% |
| Latin America | 9,640 | 0.5% |
| Latvia | 153 | 0.0% |
| Lebanon | 248 | 0.0% |
| Liberia | 86 | 0.0% |
| Lithuania | 7 | 0.0% |
| Malaysia | 113 | 0.0% |
| Mexico | 3,674 | 0.2% |
| Micronesia | 2 | 0.0% |
| Middle Africa | 1,101 | 0.1% |
| Moldova | 68 | 0.0% |
| Morocco | 130 | 0.0% |
| Nepal | 2,655 | 0.2% |
| Netherlands | 223 | 0.0% |
| Nicaragua | 87 | 0.0% |
| Nigeria | 338 | 0.0% |
| North Macedonia | 458 | 0.0% |
| Northern Africa | 695 | 0.0% |
| Northern Europe | 2,462 | 0.1% |
| Norway | 8 | 0.0% |
| Oceania | 264 | 0.0% |
| Pakistan | 424 | 0.0% |
| Panama | 106 | 0.0% |
| Peru | 159 | 0.0% |
| Philippines | 2,076 | 0.1% |
| Poland | 473 | 0.0% |
| Portugal | 53 | 0.0% |
| Romania | 794 | 0.0% |
| Russia | 1,109 | 0.1% |
| Saudi Arabia | 451 | 0.0% |
| Scotland | 184 | 0.0% |
| Serbia | 413 | 0.0% |
| Sierra Leone | 35 | 0.0% |
| Singapore | 66 | 0.0% |
| South Africa | 317 | 0.0% |
| South America | 2,204 | 0.1% |
| South Central Asia | 11,636 | 0.6% |
| South Eastern Asia | 5,343 | 0.3% |
| Southern Europe | 1,901 | 0.1% |
| Spain | 105 | 0.0% |
| Sri Lanka | 117 | 0.0% |
| St. Vincent and the Grenadines | 54 | 0.0% |
| Sudan | 36 | 0.0% |
| Sweden | 42 | 0.0% |
| Switzerland | 35 | 0.0% |
| Syria | 231 | 0.0% |
| Taiwan | 441 | 0.0% |
| Thailand | 690 | 0.0% |
| Trinidad and Tobago | 114 | 0.0% |
| Turkey | 4 | 0.0% |
| Uganda | 50 | 0.0% |
| Ukraine | 906 | 0.1% |
| Uruguay | 39 | 0.0% |
| Uzbekistan | 64 | 0.0% |
| Venezuela | 184 | 0.0% |
| Vietnam | 803 | 0.0% |
| Western Africa | 769 | 0.0% |
| Western Asia | 2,004 | 0.1% |
| Western Europe | 2,423 | 0.1% |
| Yemen | 10 | 0.0% |
| Zaire | 333 | 0.0% |
| Zimbabwe | 41 | 0.0% | View All 127 Rows |
Sex and Age in Area Code 330
Sex and Age in Area Code 330
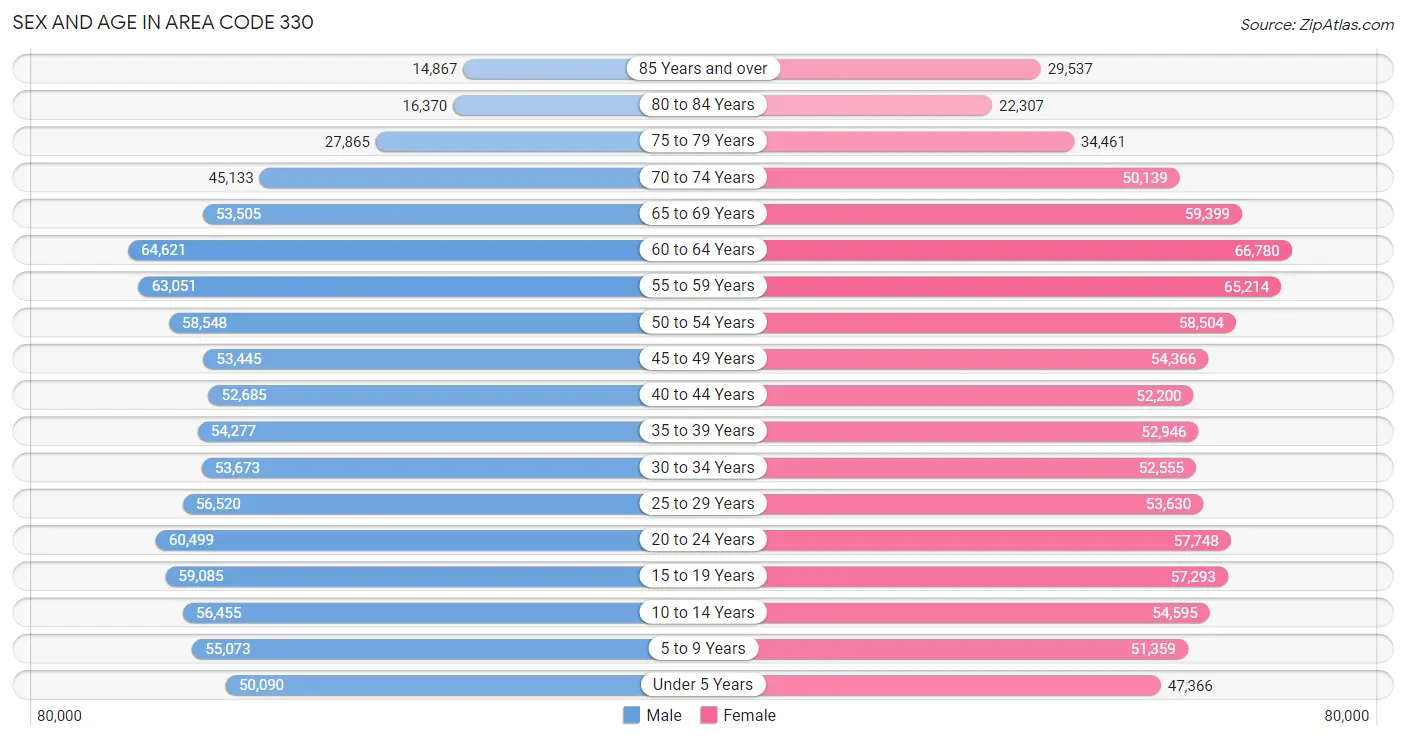
The most populous age groups in Area Code 330 are 60 to 64 Years (64,621 | 7.2%) for men and 60 to 64 Years (66,780 | 7.3%) for women.
| Age Bracket | Male | Female |
| Under 5 Years | 50,090 (5.6%) | 47,366 (5.1%) |
| 5 to 9 Years | 55,073 (6.1%) | 51,359 (5.6%) |
| 10 to 14 Years | 56,455 (6.3%) | 54,595 (5.9%) |
| 15 to 19 Years | 59,085 (6.6%) | 57,293 (6.2%) |
| 20 to 24 Years | 60,499 (6.8%) | 57,748 (6.3%) |
| 25 to 29 Years | 56,520 (6.3%) | 53,630 (5.8%) |
| 30 to 34 Years | 53,673 (6.0%) | 52,555 (5.7%) |
| 35 to 39 Years | 54,277 (6.1%) | 52,946 (5.8%) |
| 40 to 44 Years | 52,685 (5.9%) | 52,200 (5.7%) |
| 45 to 49 Years | 53,445 (6.0%) | 54,366 (5.9%) |
| 50 to 54 Years | 58,548 (6.5%) | 58,504 (6.4%) |
| 55 to 59 Years | 63,051 (7.0%) | 65,214 (7.1%) |
| 60 to 64 Years | 64,621 (7.2%) | 66,780 (7.3%) |
| 65 to 69 Years | 53,505 (6.0%) | 59,399 (6.5%) |
| 70 to 74 Years | 45,133 (5.0%) | 50,139 (5.4%) |
| 75 to 79 Years | 27,865 (3.1%) | 34,461 (3.7%) |
| 80 to 84 Years | 16,370 (1.8%) | 22,307 (2.4%) |
| 85 Years and over | 14,867 (1.7%) | 29,537 (3.2%) |
| Total | 895,762 (100.0%) | 920,399 (100.0%) |
Families and Households in Area Code 330
Median Family Size in Area Code 330
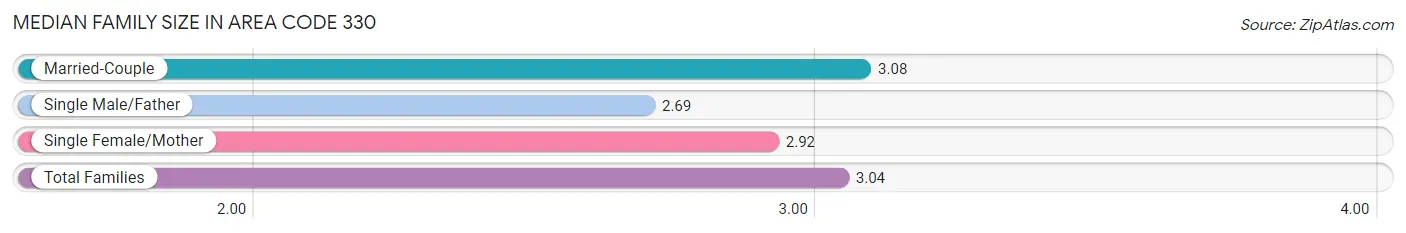
The median family size in Area Code 330 is 3.04 persons per family, with married-couple families (346,155 | 73.8%) accounting for the largest median family size of 3.08024 persons per family. On the other hand, single male/father families (36,290 | 7.7%) represent the smallest median family size with 2.69 persons per family.
| Family Type | # Families | Family Size |
| Married-Couple | 346,155 (73.8%) | 3.08 |
| Single Male/Father | 36,290 (7.7%) | 2.69 |
| Single Female/Mother | 86,732 (18.5%) | 2.92 |
| Total Families | 469,177 (100.0%) | 3.04 |
Median Household Size in Area Code 330
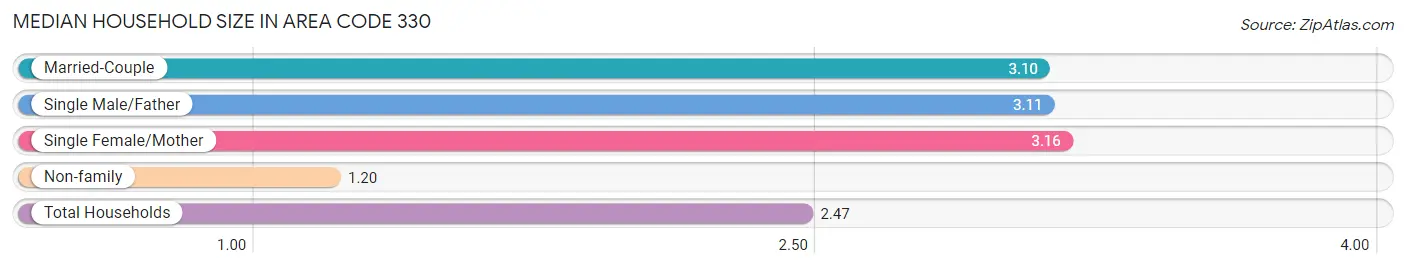
The median household size in Area Code 330 is 2.47 persons per household, with single female/mother households (86,732 | 11.6%) accounting for the largest median household size of 3.15907 persons per household. non-family households (275,861 | 37.0%) represent the smallest median household size with 1.20 persons per household.
| Household Type | # Households | Household Size |
| Married-Couple | 346,155 (46.5%) | 3.10 |
| Single Male/Father | 36,290 (4.9%) | 3.11 |
| Single Female/Mother | 86,732 (11.6%) | 3.16 |
| Non-family | 275,861 (37.0%) | 1.20 |
| Total Households | 745,038 (100.0%) | 2.47 |
Household Size by Marriage Status in Area Code 330
Out of a total of 745,038 households in Area Code 330, 469,177 (63.0%) are family households, while 275,861 (37.0%) are nonfamily households. The most numerous type of family households are 2-person households, comprising 225,778, and the most common type of nonfamily households are 1-person households, comprising 231,188.
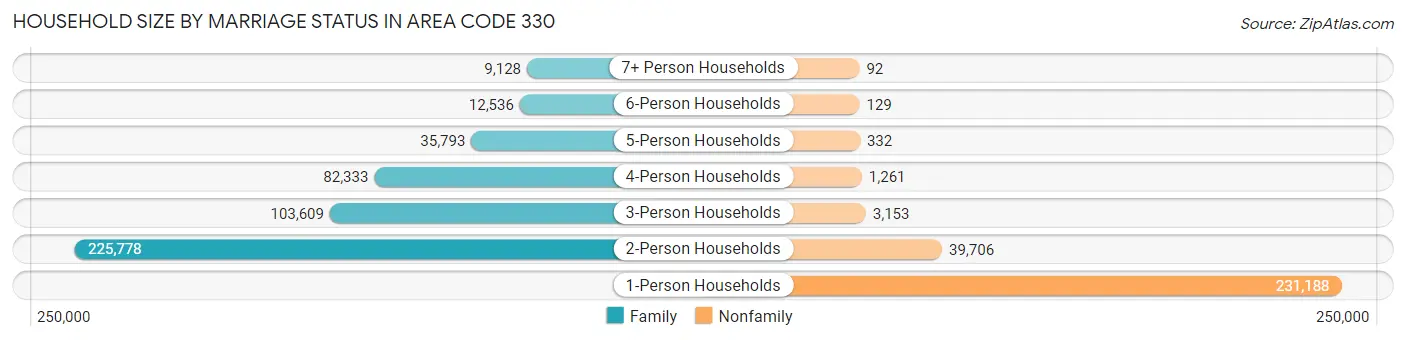
| Household Size | Family Households | Nonfamily Households |
| 1-Person Households | - | 231,188 (31.0%) |
| 2-Person Households | 225,778 (30.3%) | 39,706 (5.3%) |
| 3-Person Households | 103,609 (13.9%) | 3,153 (0.4%) |
| 4-Person Households | 82,333 (11.1%) | 1,261 (0.2%) |
| 5-Person Households | 35,793 (4.8%) | 332 (0.0%) |
| 6-Person Households | 12,536 (1.7%) | 129 (0.0%) |
| 7+ Person Households | 9,128 (1.2%) | 92 (0.0%) |
| Total | 469,177 (63.0%) | 275,861 (37.0%) |
Female Fertility in Area Code 330
Fertility by Age in Area Code 330
Average fertility rate in Area Code 330 is 63.3 births per 1,000 women. Women in the age bracket of 20 to 34 years have the highest fertility rate with 121.1 births per 1,000 women. Women in the age bracket of 20 to 34 years acount for 76.8% of all women with births.
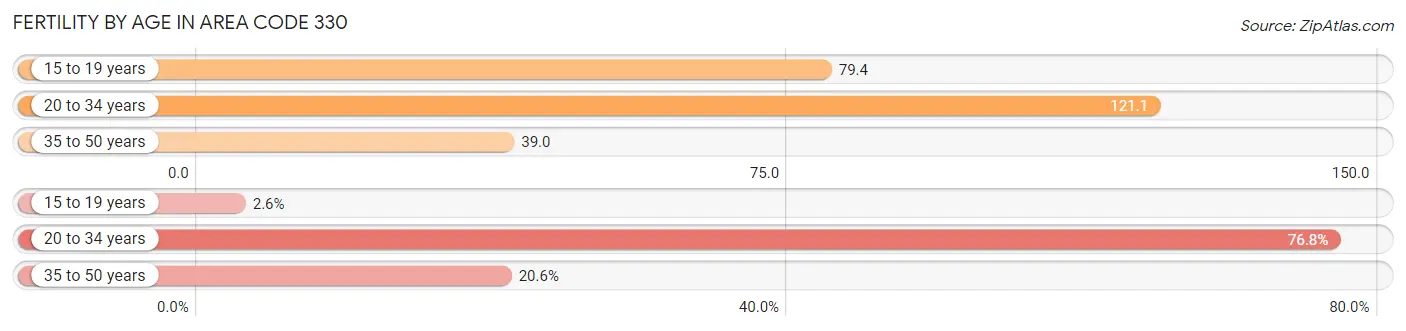
| Age Bracket | Women with Births | Births / 1,000 Women |
| 15 to 19 years | 524 (2.6%) | 79.4 |
| 20 to 34 years | 15,737 (76.8%) | 121.1 |
| 35 to 50 years | 4,221 (20.6%) | 39.0 |
| Total | 20,482 (100.0%) | 63.3 |
Fertility by Age by Marriage Status in Area Code 330
57.1% of women with births (20,482) in Area Code 330 are married. The highest percentage of unmarried women with births falls into 15 to 19 years age bracket with 100.0% of them unmarried at the time of birth, while the lowest percentage of unmarried women with births belong to 20 to 34 years age bracket with 47.7% of them unmarried.
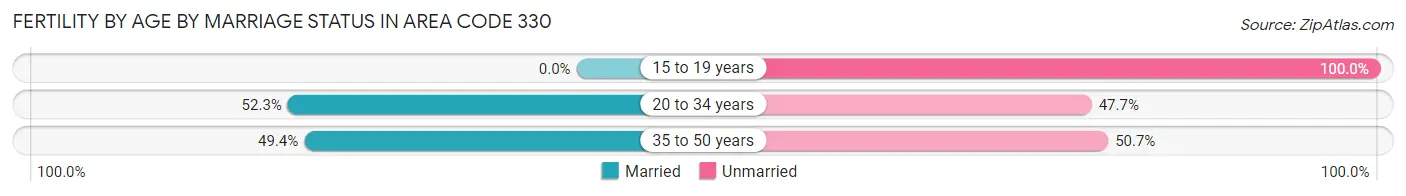
| Age Bracket | Married | Unmarried |
| 15 to 19 years | 0 (0.0%) | 524 (100.0%) |
| 20 to 34 years | 8,235 (52.3%) | 7,502 (47.7%) |
| 35 to 50 years | 2,083 (49.3%) | 2,138 (50.6%) |
| Total | 11,688 (57.1%) | 8,794 (42.9%) |
Fertility by Education in Area Code 330
Average fertility rate in Area Code 330 is 63.3 births per 1,000 women. Women with the education attainment of graduate degree have the highest fertility rate of 164.6 births per 1,000 women, while women with the education attainment of college or associate's degree have the lowest fertility at 74.1 births per 1,000 women. Women with the education attainment of college or associate's degree represent 28.1% of all women with births.
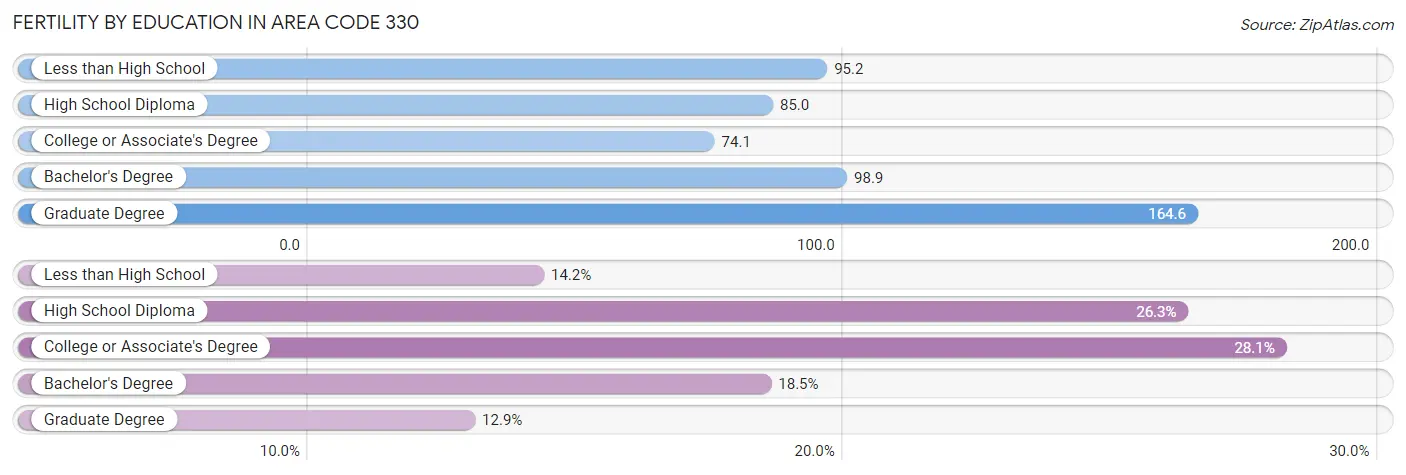
| Educational Attainment | Women with Births | Births / 1,000 Women |
| Less than High School | 2,911 (14.2%) | 95.2 |
| High School Diploma | 5,382 (26.3%) | 85.0 |
| College or Associate's Degree | 5,759 (28.1%) | 74.1 |
| Bachelor's Degree | 3,783 (18.5%) | 98.9 |
| Graduate Degree | 2,647 (12.9%) | 164.6 |
| Total | 20,482 (100.0%) | 63.3 |
Fertility by Education by Marriage Status in Area Code 330
42.9% of women with births in Area Code 330 are unmarried. Women with the educational attainment of graduate degree are most likely to be married with 42.0% of them married at childbirth, while women with the educational attainment of less than high school are least likely to be married with 80.4% of them unmarried at childbirth.
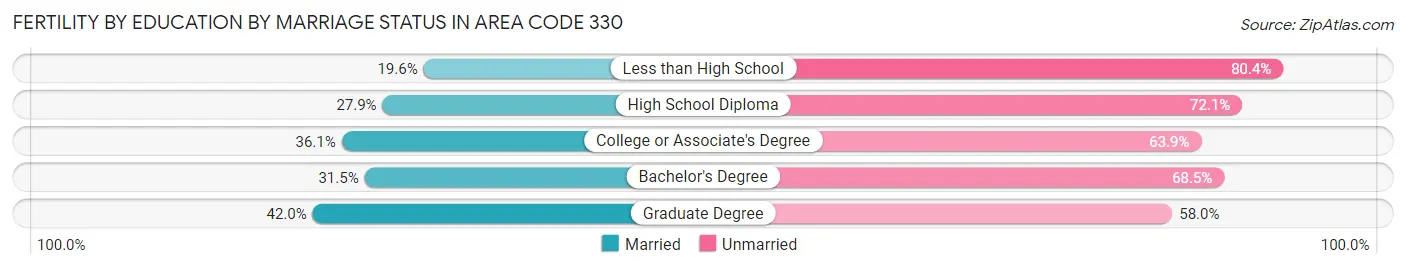
| Educational Attainment | Married | Unmarried |
| Less than High School | 571 (19.6%) | 2,340 (80.4%) |
| High School Diploma | 1,501 (27.9%) | 3,881 (72.1%) |
| College or Associate's Degree | 2,081 (36.1%) | 3,678 (63.9%) |
| Bachelor's Degree | 1,192 (31.5%) | 2,591 (68.5%) |
| Graduate Degree | 1,111 (42.0%) | 1,536 (58.0%) |
| Total | 11,688 (57.1%) | 8,794 (42.9%) |
Employment Characteristics in Area Code 330
Employment by Class of Employer in Area Code 330
Among the 856,764 employed individuals in Area Code 330, private company employees (607,749 | 70.9%), not-for-profit organizations (77,503 | 9.0%), and local government employees (64,271 | 7.5%) make up the most common classes of employment.
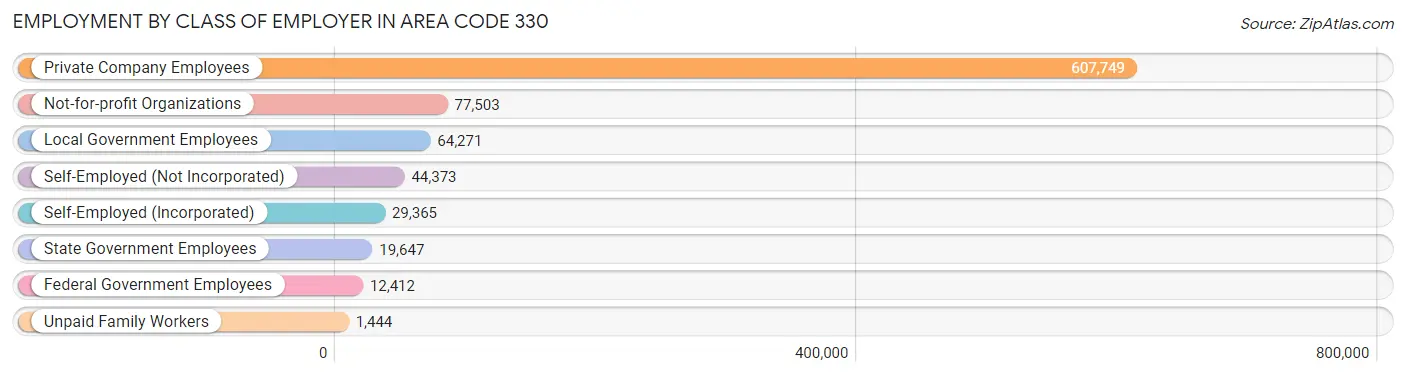
| Employer Class | # Employees | % Employees |
| Private Company Employees | 607,749 | 70.9% |
| Self-Employed (Incorporated) | 29,365 | 3.4% |
| Self-Employed (Not Incorporated) | 44,373 | 5.2% |
| Not-for-profit Organizations | 77,503 | 9.0% |
| Local Government Employees | 64,271 | 7.5% |
| State Government Employees | 19,647 | 2.3% |
| Federal Government Employees | 12,412 | 1.5% |
| Unpaid Family Workers | 1,444 | 0.2% |
| Total | 856,764 | 100.0% |
Employment Status by Age in Area Code 330
According to the labor force statistics for Area Code 330, out of the total population over 16 years of age (1,477,723), 60.5% or 894,170 individuals are in the labor force, with 5.4% or 48,375 of them unemployed. The age group with the highest labor force participation rate is 30 to 34 years, with 82.2% or 87,351 individuals in the labor force. Within the labor force, the 16 to 19 years age range has the highest percentage of unemployed individuals, with 1,972.9% or 919,312 of them being unemployed.
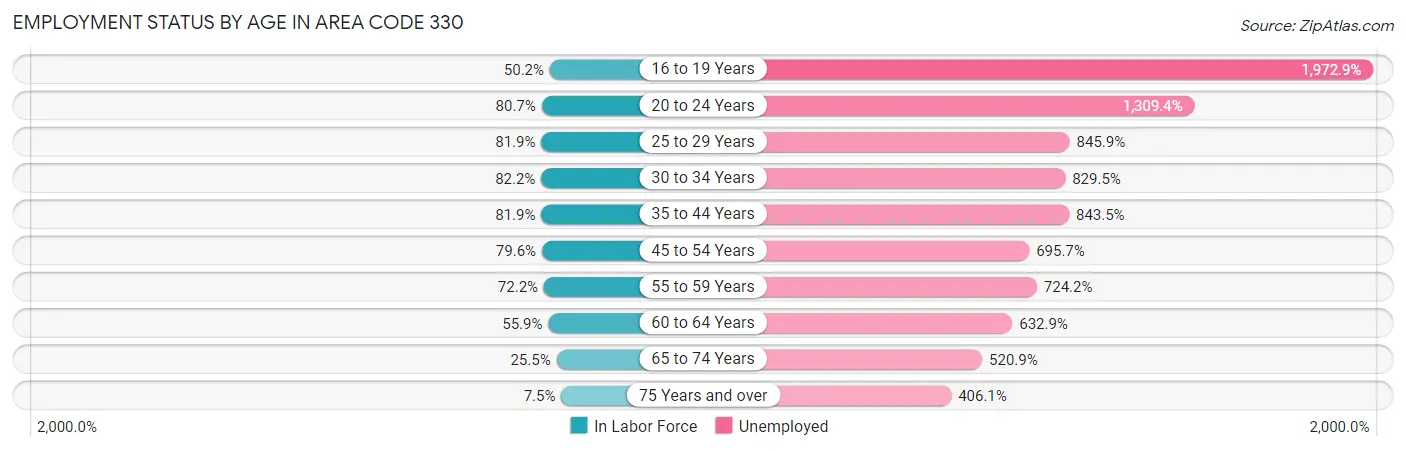
| Age Bracket | In Labor Force | Unemployed |
| 16 to 19 Years | 46,594 (50.2%) | 919,312 (1,972.9%) |
| 20 to 24 Years | 95,391 (80.7%) | 1,249,037 (1,309.4%) |
| 25 to 29 Years | 90,175 (81.9%) | 762,833 (845.9%) |
| 30 to 34 Years | 87,348 (82.2%) | 724,577 (829.5%) |
| 35 to 44 Years | 173,714 (81.9%) | 1,465,294 (843.5%) |
| 45 to 54 Years | 178,950 (79.6%) | 1,244,927 (695.7%) |
| 55 to 59 Years | 92,636 (72.2%) | 670,848 (724.2%) |
| 60 to 64 Years | 73,394 (55.8%) | 464,466 (632.9%) |
| 65 to 74 Years | 53,072 (25.5%) | 276,410 (520.9%) |
| 75 Years and over | 10,924 (7.5%) | 44,346 (406.1%) |
| Total | 894,239 (60.5%) | 48,342 (5.4%) |
Employment Status by Educational Attainment in Area Code 330
According to labor force statistics for Area Code 330, 75.7% of individuals (691,061) out of the total population between 25 and 64 years of age (913,015) are in the labor force, with 783.7% or 5,415,845 of them being unemployed. The group with the highest labor force participation rate are those with the educational attainment of bachelor's degree or higher, with 86.9% or 230,942 individuals in the labor force. Within the labor force, individuals with less than high school education have the highest percentage of unemployment, with 1,600.9% or 692,485 of them being unemployed.
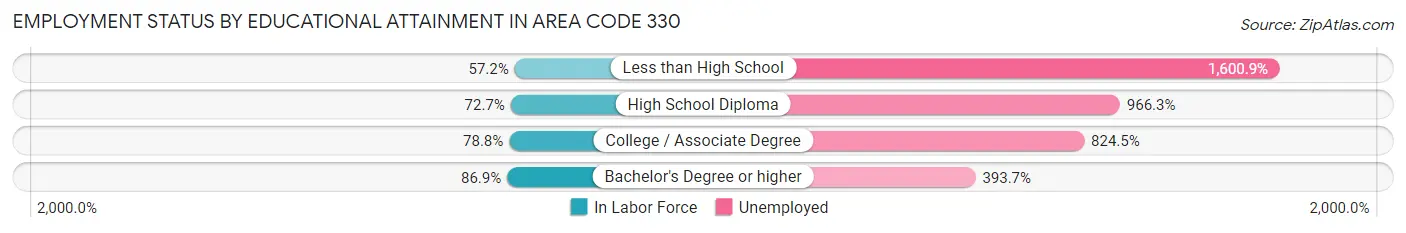
| Educational Attainment | In Labor Force | Unemployed |
| Less than High School | 43,253 (57.2%) | 1,211,497 (1,600.9%) |
| High School Diploma | 219,552 (72.7%) | 2,918,864 (966.3%) |
| College / Associate Degree | 212,269 (78.8%) | 2,220,906 (824.5%) |
| Bachelor's Degree or higher | 230,936 (86.9%) | 1,046,884 (393.7%) |
| Total | 691,041 (75.7%) | 7,155,299 (783.7%) |
Employment Occupations by Sex in Area Code 330
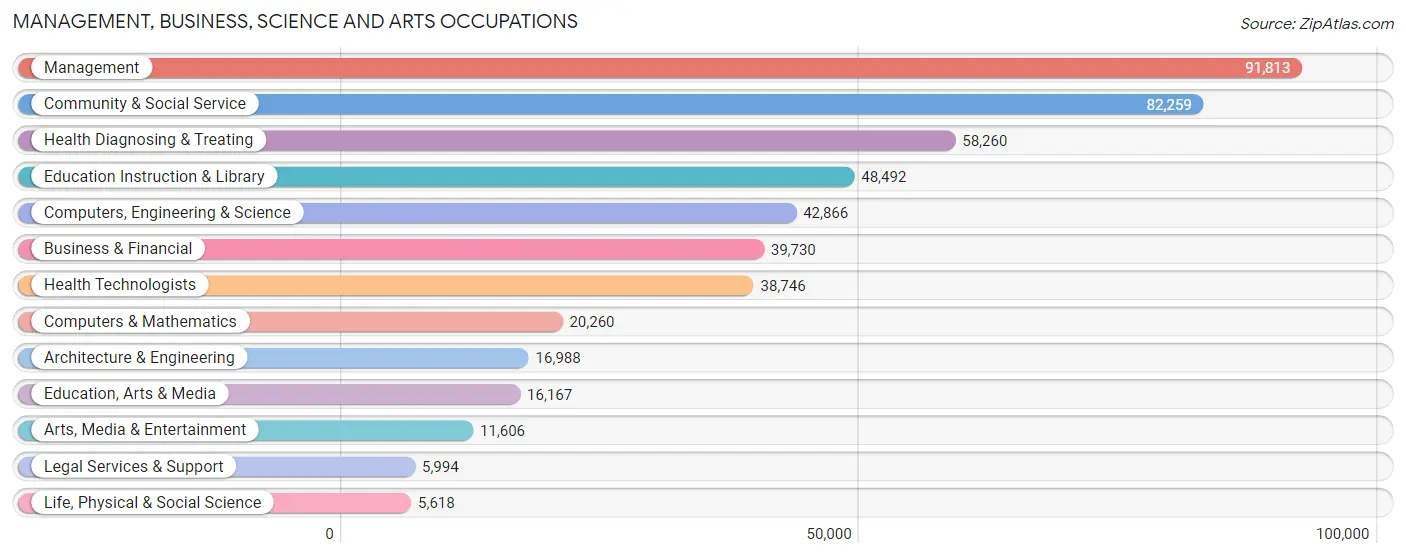
Management, Business, Science and Arts Occupations
The most common Management, Business, Science and Arts occupations in Area Code 330 are Management (91,813 | 10.5%), Community & Social Service (82,259 | 9.4%), Health Diagnosing & Treating (58,260 | 6.7%), Education Instruction & Library (48,492 | 5.6%), and Computers, Engineering & Science (42,866 | 4.9%).
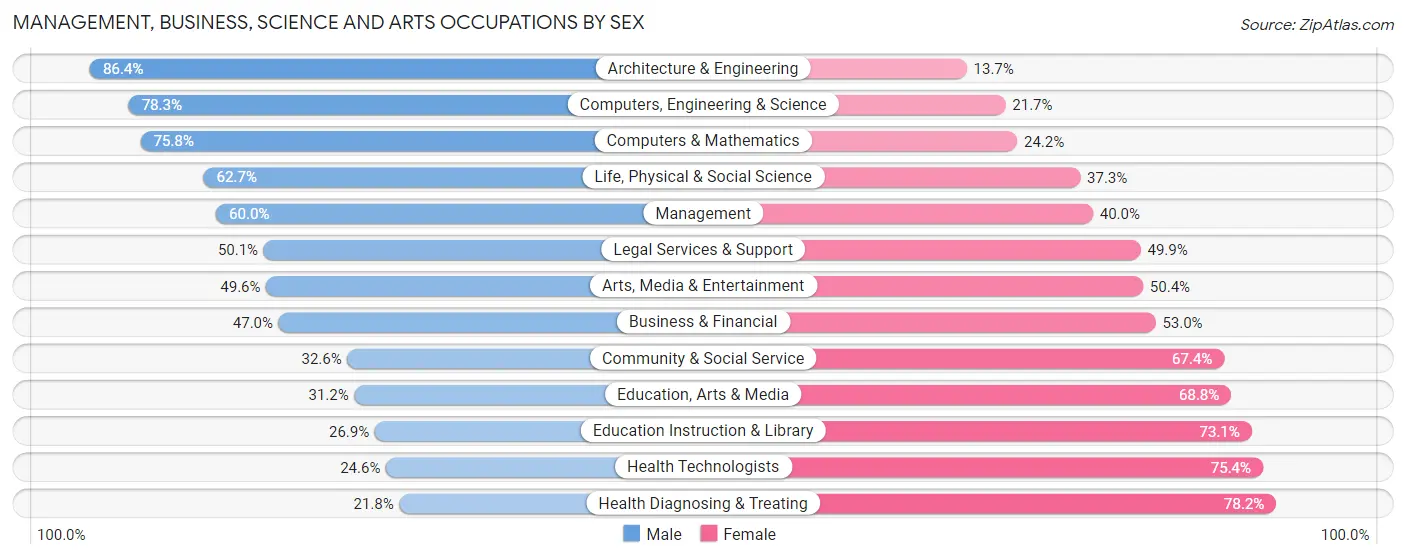
Management, Business, Science and Arts Occupations by Sex
Within the Management, Business, Science and Arts occupations in Area Code 330, the most male-oriented occupations are Architecture & Engineering (86.4%), Computers, Engineering & Science (78.3%), and Computers & Mathematics (75.8%), while the most female-oriented occupations are Health Diagnosing & Treating (78.2%), Health Technologists (75.4%), and Education Instruction & Library (73.1%).
| Occupation | Male | Female |
| Management | 55,115 (60.0%) | 36,698 (40.0%) |
| Business & Financial | 18,656 (47.0%) | 21,074 (53.0%) |
| Computers, Engineering & Science | 33,551 (78.3%) | 9,315 (21.7%) |
| Computers & Mathematics | 15,361 (75.8%) | 4,899 (24.2%) |
| Architecture & Engineering | 14,669 (86.4%) | 2,319 (13.7%) |
| Life, Physical & Social Science | 3,521 (62.7%) | 2,097 (37.3%) |
| Community & Social Service | 26,838 (32.6%) | 55,421 (67.4%) |
| Education, Arts & Media | 5,041 (31.2%) | 11,126 (68.8%) |
| Legal Services & Support | 3,001 (50.1%) | 2,993 (49.9%) |
| Education Instruction & Library | 13,043 (26.9%) | 35,449 (73.1%) |
| Arts, Media & Entertainment | 5,753 (49.6%) | 5,853 (50.4%) |
| Health Diagnosing & Treating | 12,691 (21.8%) | 45,569 (78.2%) |
| Health Technologists | 9,516 (24.6%) | 29,230 (75.4%) |
| Total (Category) | 146,851 (46.6%) | 168,077 (53.4%) |
| Total (Overall) | 461,461 (52.8%) | 413,049 (47.2%) |
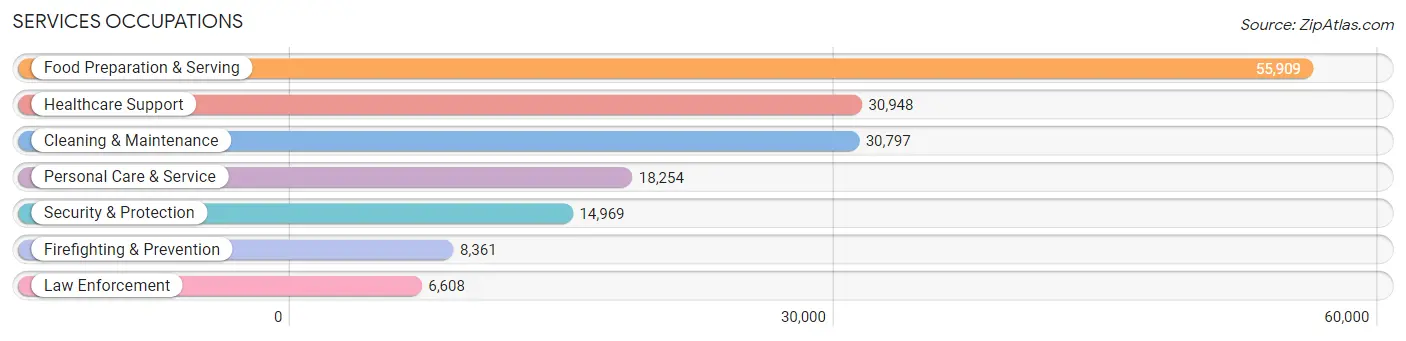
Services Occupations
The most common Services occupations in Area Code 330 are Food Preparation & Serving (55,909 | 6.4%), Healthcare Support (30,948 | 3.5%), Cleaning & Maintenance (30,797 | 3.5%), Personal Care & Service (18,254 | 2.1%), and Security & Protection (14,969 | 1.7%).
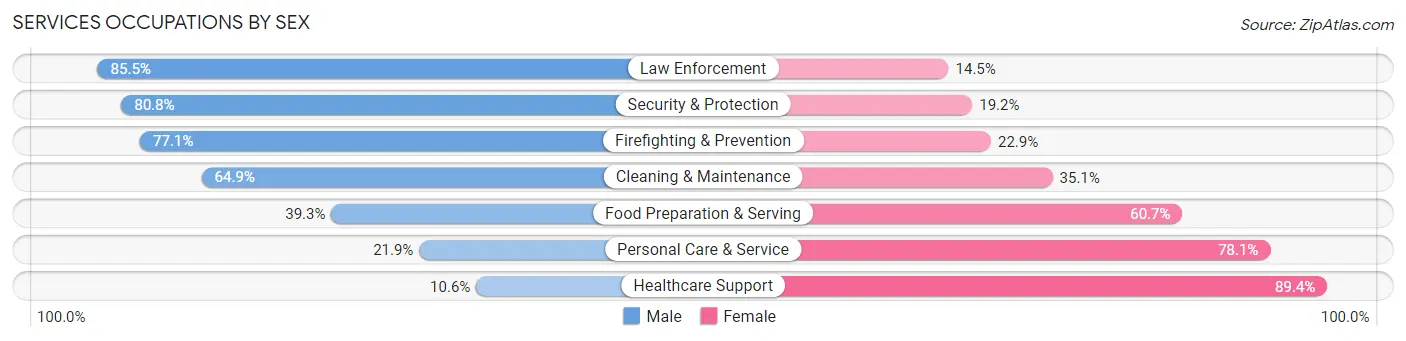
Services Occupations by Sex
Within the Services occupations in Area Code 330, the most male-oriented occupations are Law Enforcement (85.5%), Security & Protection (80.8%), and Firefighting & Prevention (77.1%), while the most female-oriented occupations are Healthcare Support (89.4%), Personal Care & Service (78.1%), and Food Preparation & Serving (60.7%).
| Occupation | Male | Female |
| Healthcare Support | 3,273 (10.6%) | 27,675 (89.4%) |
| Security & Protection | 12,101 (80.8%) | 2,868 (19.2%) |
| Firefighting & Prevention | 6,449 (77.1%) | 1,912 (22.9%) |
| Law Enforcement | 5,652 (85.5%) | 956 (14.5%) |
| Food Preparation & Serving | 21,951 (39.3%) | 33,958 (60.7%) |
| Cleaning & Maintenance | 20,000 (64.9%) | 10,797 (35.1%) |
| Personal Care & Service | 3,990 (21.9%) | 14,264 (78.1%) |
| Total (Category) | 61,315 (40.6%) | 89,562 (59.4%) |
| Total (Overall) | 461,461 (52.8%) | 413,049 (47.2%) |
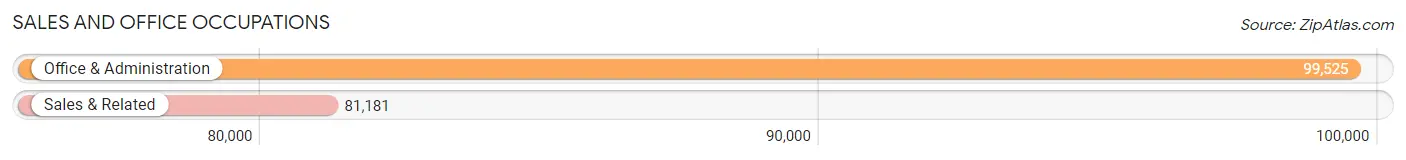
Sales and Office Occupations
The most common Sales and Office occupations in Area Code 330 are Office & Administration (99,525 | 11.4%), and Sales & Related (81,181 | 9.3%).
Sales and Office Occupations by Sex
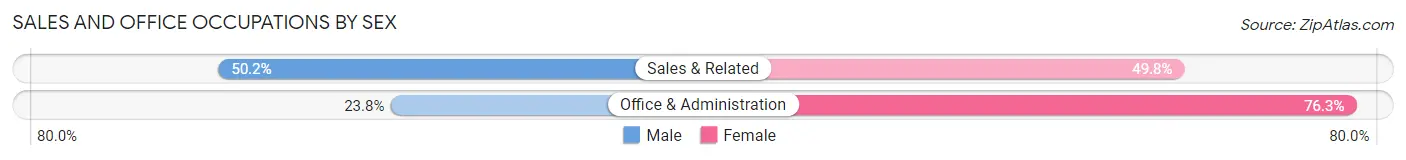
| Occupation | Male | Female |
| Sales & Related | 40,746 (50.2%) | 40,435 (49.8%) |
| Office & Administration | 23,634 (23.7%) | 75,891 (76.2%) |
| Total (Category) | 64,380 (35.6%) | 116,326 (64.4%) |
| Total (Overall) | 461,461 (52.8%) | 413,049 (47.2%) |
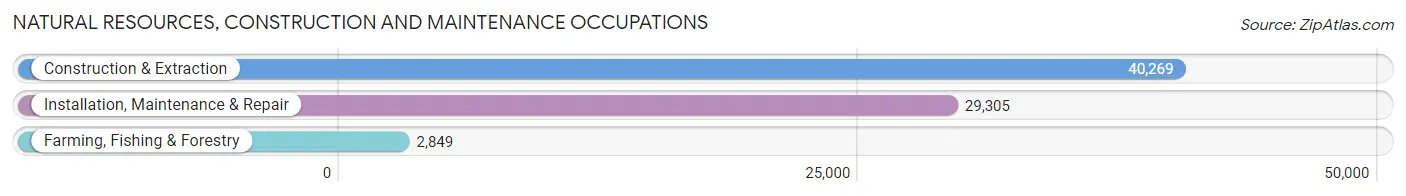
Natural Resources, Construction and Maintenance Occupations
The most common Natural Resources, Construction and Maintenance occupations in Area Code 330 are Construction & Extraction (40,269 | 4.6%), Installation, Maintenance & Repair (29,305 | 3.4%), and Farming, Fishing & Forestry (2,849 | 0.3%).
Natural Resources, Construction and Maintenance Occupations by Sex
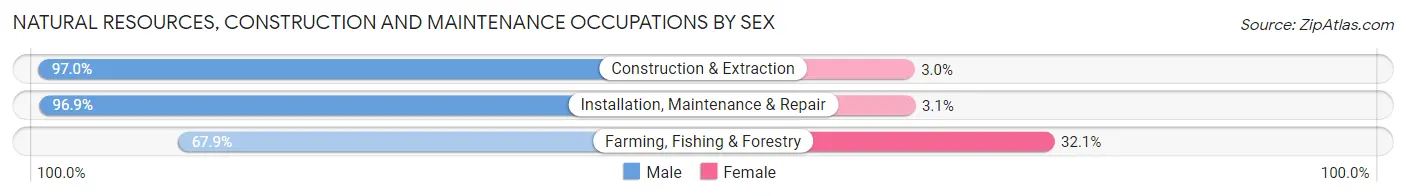
| Occupation | Male | Female |
| Farming, Fishing & Forestry | 1,935 (67.9%) | 914 (32.1%) |
| Construction & Extraction | 39,074 (97.0%) | 1,195 (3.0%) |
| Installation, Maintenance & Repair | 28,387 (96.9%) | 918 (3.1%) |
| Total (Category) | 69,396 (95.8%) | 3,027 (4.2%) |
| Total (Overall) | 461,461 (52.8%) | 413,049 (47.2%) |
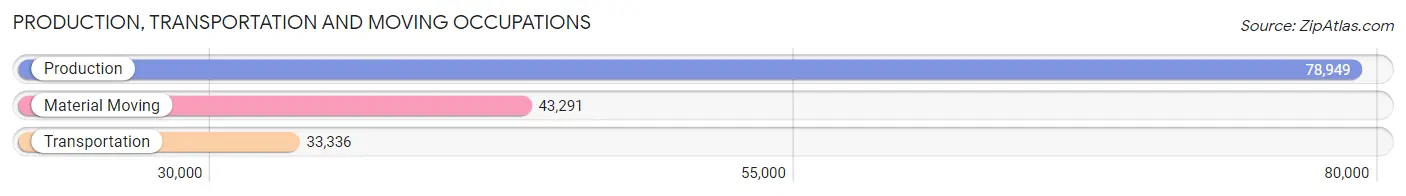
Production, Transportation and Moving Occupations
The most common Production, Transportation and Moving occupations in Area Code 330 are Production (78,949 | 9.0%), Material Moving (43,291 | 5.0%), and Transportation (33,336 | 3.8%).
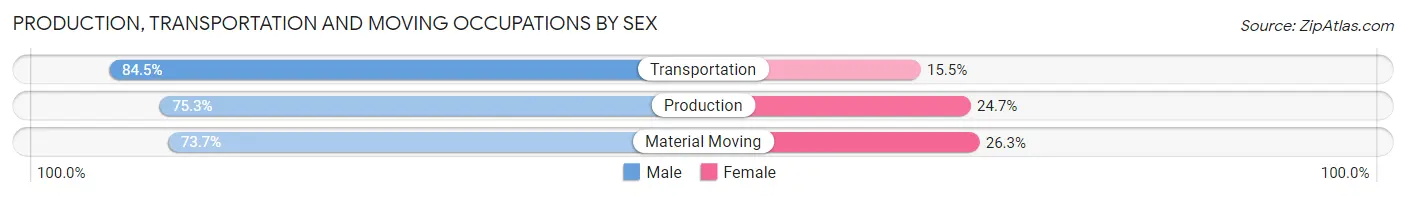
Production, Transportation and Moving Occupations by Sex
| Occupation | Male | Female |
| Production | 59,445 (75.3%) | 19,504 (24.7%) |
| Transportation | 28,166 (84.5%) | 5,170 (15.5%) |
| Material Moving | 31,908 (73.7%) | 11,383 (26.3%) |
| Total (Category) | 119,519 (76.8%) | 36,057 (23.2%) |
| Total (Overall) | 461,461 (52.8%) | 413,049 (47.2%) |
Employment Industries by Sex in Area Code 330
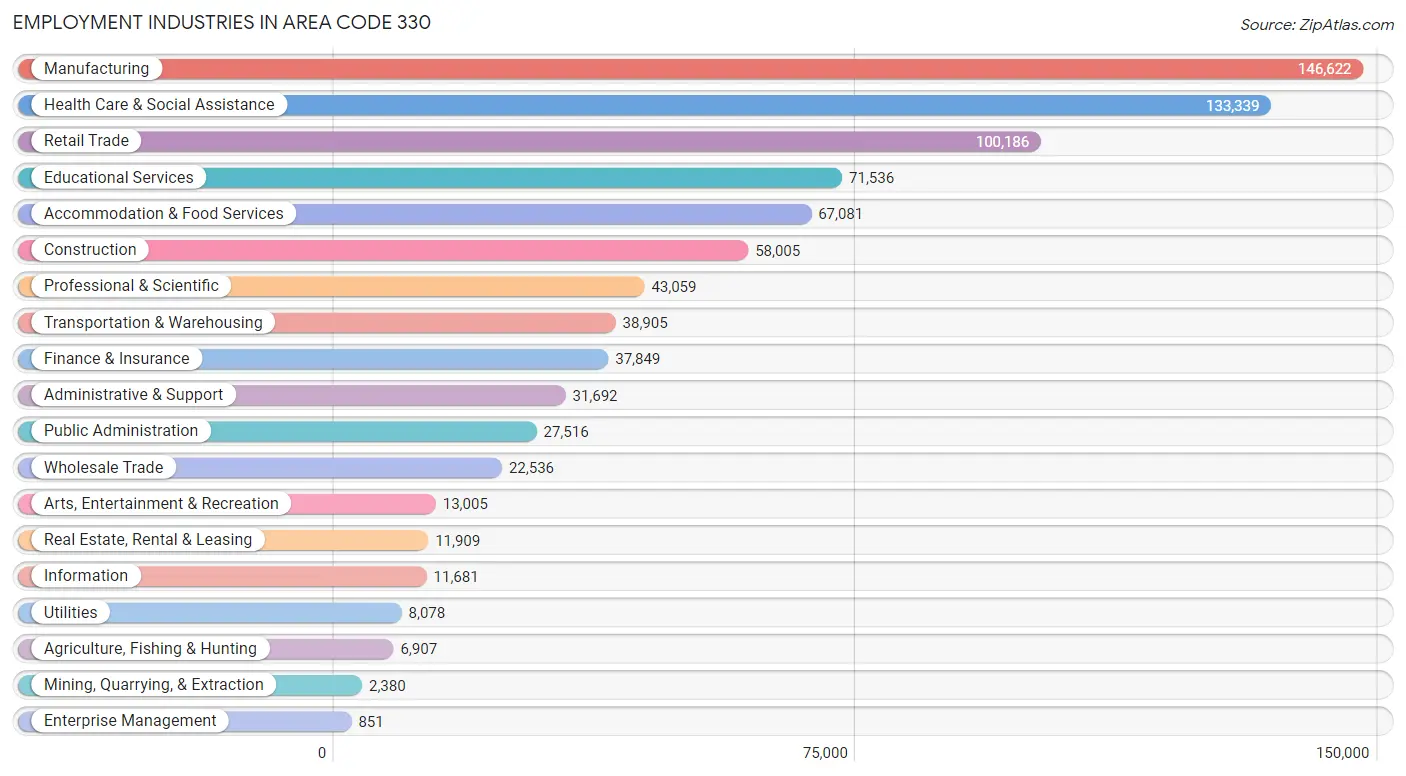
Employment Industries in Area Code 330
The major employment industries in Area Code 330 include Manufacturing (146,622 | 16.8%), Health Care & Social Assistance (133,339 | 15.2%), Retail Trade (100,186 | 11.5%), Educational Services (71,536 | 8.2%), and Accommodation & Food Services (67,081 | 7.7%).
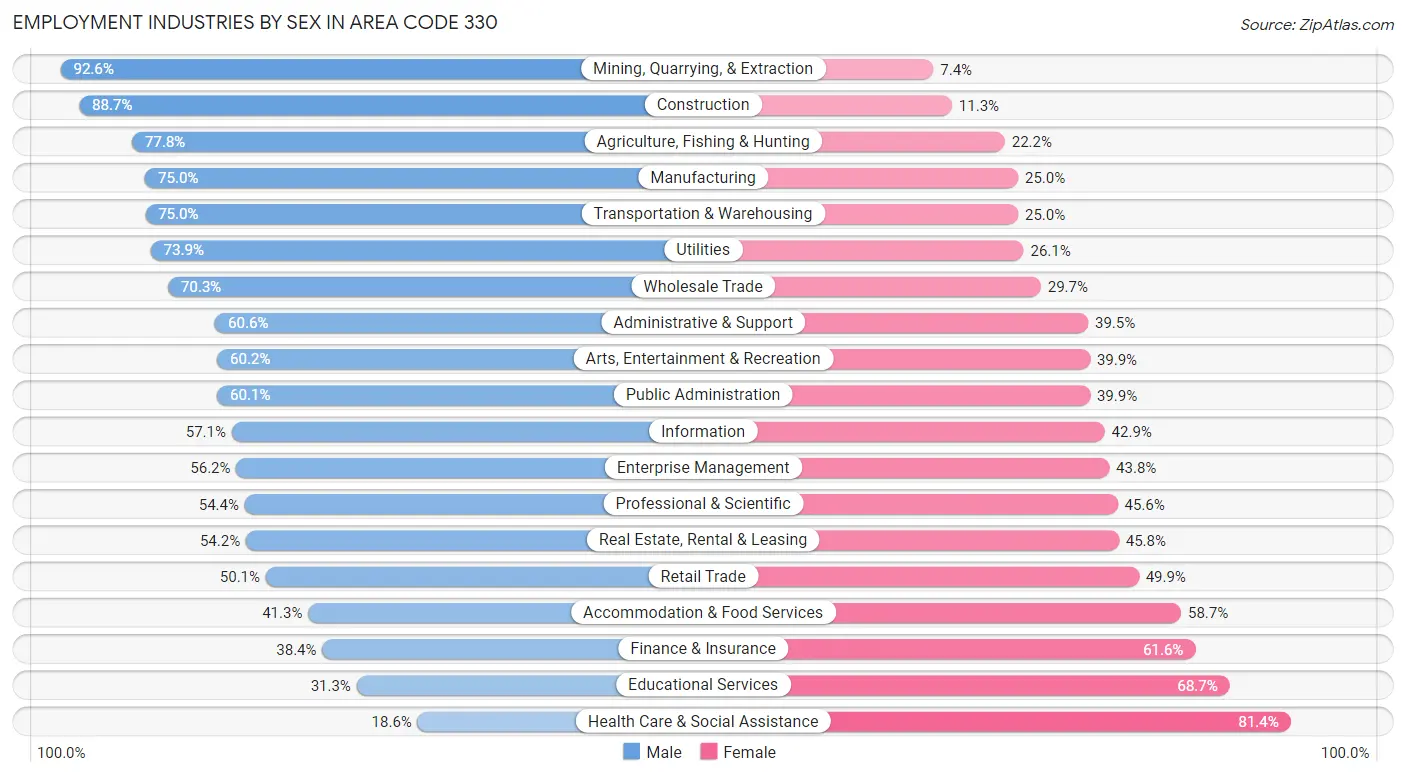
Employment Industries by Sex in Area Code 330
The Area Code 330 industries that see more men than women are Mining, Quarrying, & Extraction (92.6%), Construction (88.7%), and Agriculture, Fishing & Hunting (77.8%), whereas the industries that tend to have a higher number of women are Health Care & Social Assistance (81.4%), Educational Services (68.7%), and Finance & Insurance (61.6%).
| Industry | Male | Female |
| Agriculture, Fishing & Hunting | 5,372 (77.8%) | 1,535 (22.2%) |
| Mining, Quarrying, & Extraction | 2,203 (92.6%) | 177 (7.4%) |
| Construction | 51,463 (88.7%) | 6,542 (11.3%) |
| Manufacturing | 110,020 (75.0%) | 36,602 (25.0%) |
| Wholesale Trade | 15,850 (70.3%) | 6,686 (29.7%) |
| Retail Trade | 50,156 (50.1%) | 50,030 (49.9%) |
| Transportation & Warehousing | 29,192 (75.0%) | 9,713 (25.0%) |
| Utilities | 5,970 (73.9%) | 2,108 (26.1%) |
| Information | 6,671 (57.1%) | 5,010 (42.9%) |
| Finance & Insurance | 14,524 (38.4%) | 23,325 (61.6%) |
| Real Estate, Rental & Leasing | 6,452 (54.2%) | 5,457 (45.8%) |
| Professional & Scientific | 23,436 (54.4%) | 19,623 (45.6%) |
| Enterprise Management | 478 (56.2%) | 373 (43.8%) |
| Administrative & Support | 19,191 (60.6%) | 12,501 (39.5%) |
| Educational Services | 22,359 (31.3%) | 49,177 (68.7%) |
| Health Care & Social Assistance | 24,858 (18.6%) | 108,481 (81.4%) |
| Arts, Entertainment & Recreation | 7,823 (60.2%) | 5,182 (39.9%) |
| Accommodation & Food Services | 27,698 (41.3%) | 39,383 (58.7%) |
| Public Administration | 16,549 (60.1%) | 10,967 (39.9%) |
| Total | 461,461 (52.8%) | 413,049 (47.2%) |
Education in Area Code 330
School Enrollment in Area Code 330
The most common levels of schooling among the 400,589 students in Area Code 330 are high school (88,972 | 22.2%), middle school (87,648 | 21.9%), and elementary school (83,731 | 20.9%).
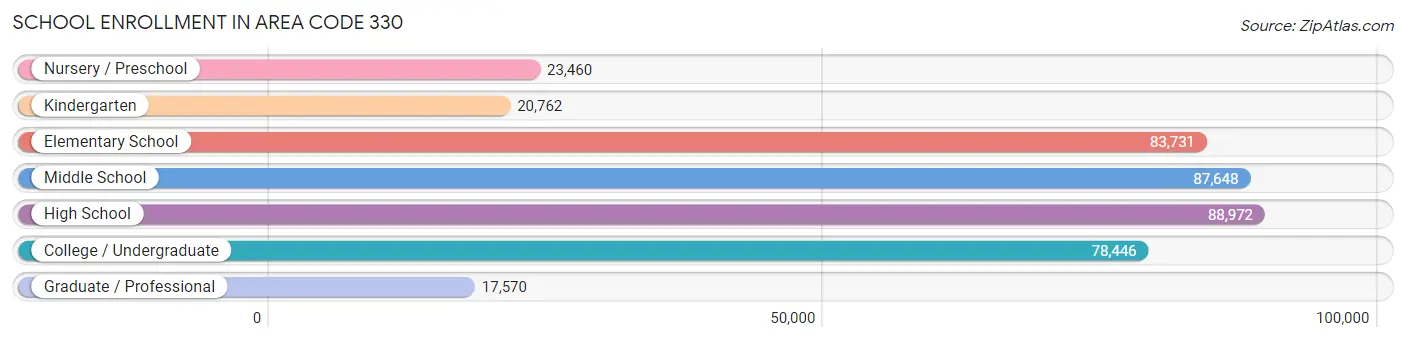
| School Level | # Students | % Students |
| Nursery / Preschool | 23,460 | 5.9% |
| Kindergarten | 20,762 | 5.2% |
| Elementary School | 83,731 | 20.9% |
| Middle School | 87,648 | 21.9% |
| High School | 88,972 | 22.2% |
| College / Undergraduate | 78,446 | 19.6% |
| Graduate / Professional | 17,570 | 4.4% |
| Total | 400,589 | 100.0% |
School Enrollment by Age by Funding Source in Area Code 330
Out of a total of 400,589 students who are enrolled in schools in Area Code 330, 68,132 (17.0%) attend a private institution, while the remaining 332,457 (83.0%) are enrolled in public schools. The age group of 3 to 4 year olds has the highest likelihood of being enrolled in private schools, with 6,362 (36.8% in the age bracket) enrolled. Conversely, the age group of 15 to 17 year olds has the lowest likelihood of being enrolled in a private school, with 59,021 (90.3% in the age bracket) attending a public institution.
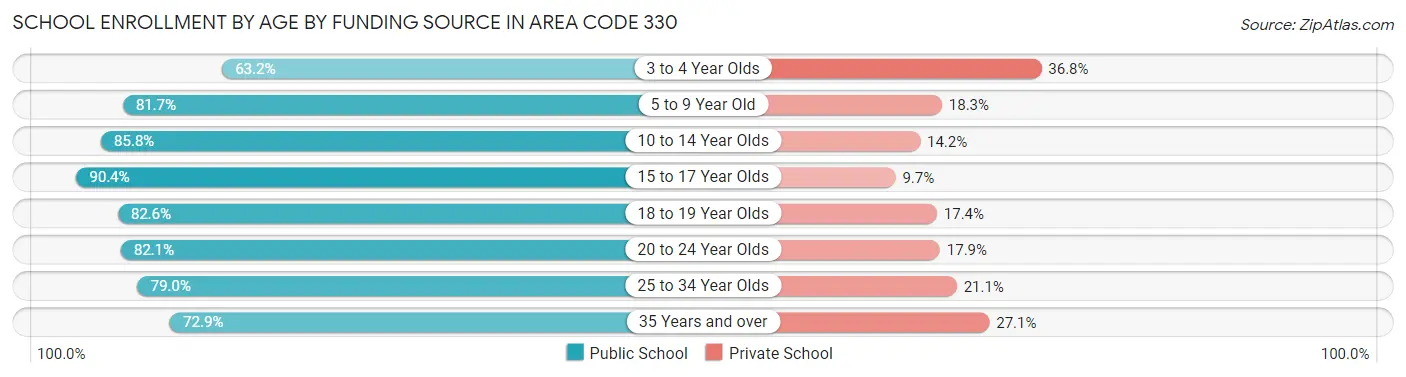
| Age Bracket | Public School | Private School |
| 3 to 4 Year Olds | 10,916 (63.2%) | 6,362 (36.8%) |
| 5 to 9 Year Old | 80,681 (81.7%) | 18,055 (18.3%) |
| 10 to 14 Year Olds | 91,839 (85.8%) | 15,224 (14.2%) |
| 15 to 17 Year Olds | 59,021 (90.3%) | 6,307 (9.7%) |
| 18 to 19 Year Olds | 27,182 (82.6%) | 5,710 (17.4%) |
| 20 to 24 Year Olds | 34,519 (82.1%) | 7,537 (17.9%) |
| 25 to 34 Year Olds | 14,992 (78.9%) | 3,997 (21.0%) |
| 35 Years and over | 13,298 (72.9%) | 4,949 (27.1%) |
| Total | 332,457 (83.0%) | 68,132 (17.0%) |
Educational Attainment by Field of Study in Area Code 330
Business (79,105 | 21.3%), education (63,673 | 17.2%), science & technology (47,242 | 12.7%), engineering (24,871 | 6.7%), and arts & humanities (22,803 | 6.1%) are the most common fields of study among 370,756 individuals in Area Code 330 who have obtained a bachelor's degree or higher.
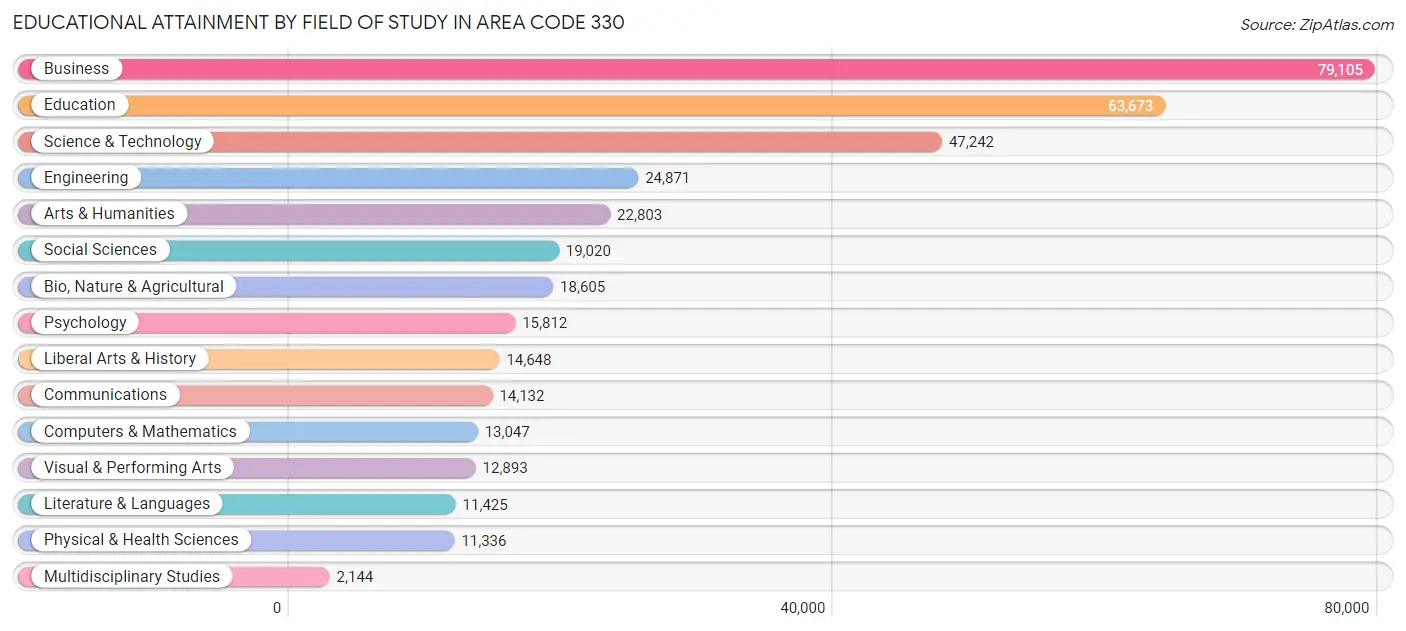
| Field of Study | # Graduates | % Graduates |
| Computers & Mathematics | 13,047 | 3.5% |
| Bio, Nature & Agricultural | 18,605 | 5.0% |
| Physical & Health Sciences | 11,336 | 3.1% |
| Psychology | 15,812 | 4.3% |
| Social Sciences | 19,020 | 5.1% |
| Engineering | 24,871 | 6.7% |
| Multidisciplinary Studies | 2,144 | 0.6% |
| Science & Technology | 47,242 | 12.7% |
| Business | 79,105 | 21.3% |
| Education | 63,673 | 17.2% |
| Literature & Languages | 11,425 | 3.1% |
| Liberal Arts & History | 14,648 | 4.0% |
| Visual & Performing Arts | 12,893 | 3.5% |
| Communications | 14,132 | 3.8% |
| Arts & Humanities | 22,803 | 6.1% |
| Total | 370,756 | 100.0% |
Transportation & Commute in Area Code 330
Vehicle Availability by Sex in Area Code 330
The most prevalent vehicle ownership categories in Area Code 330 are males with 2 vehicles (192,987, accounting for 42.7%) and females with 2 vehicles (164,654, making up 48.4%).
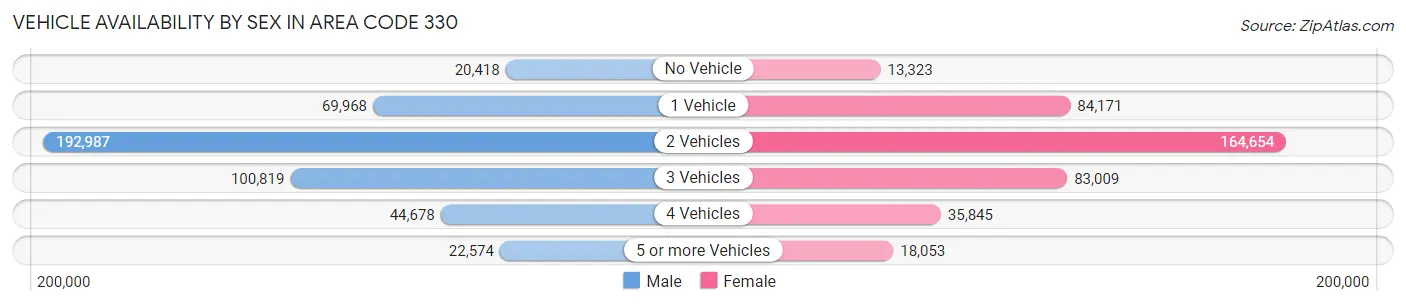
| Vehicles Available | Male | Female |
| No Vehicle | 20,418 (4.5%) | 13,323 (3.3%) |
| 1 Vehicle | 69,968 (15.5%) | 84,171 (21.1%) |
| 2 Vehicles | 192,987 (42.7%) | 164,654 (41.3%) |
| 3 Vehicles | 100,819 (22.3%) | 83,009 (20.8%) |
| 4 Vehicles | 44,678 (9.9%) | 35,845 (9.0%) |
| 5 or more Vehicles | 22,574 (5.0%) | 18,053 (4.5%) |
| Total | 451,444 (100.0%) | 399,055 (100.0%) |
Commute Time in Area Code 330
The most frequently occuring commute durations in Area Code 330 are 15 to 19 minutes (125,762 commuters, 16.1%), 10 to 14 minutes (120,882 commuters, 15.5%), and 20 to 24 minutes (114,155 commuters, 14.6%).
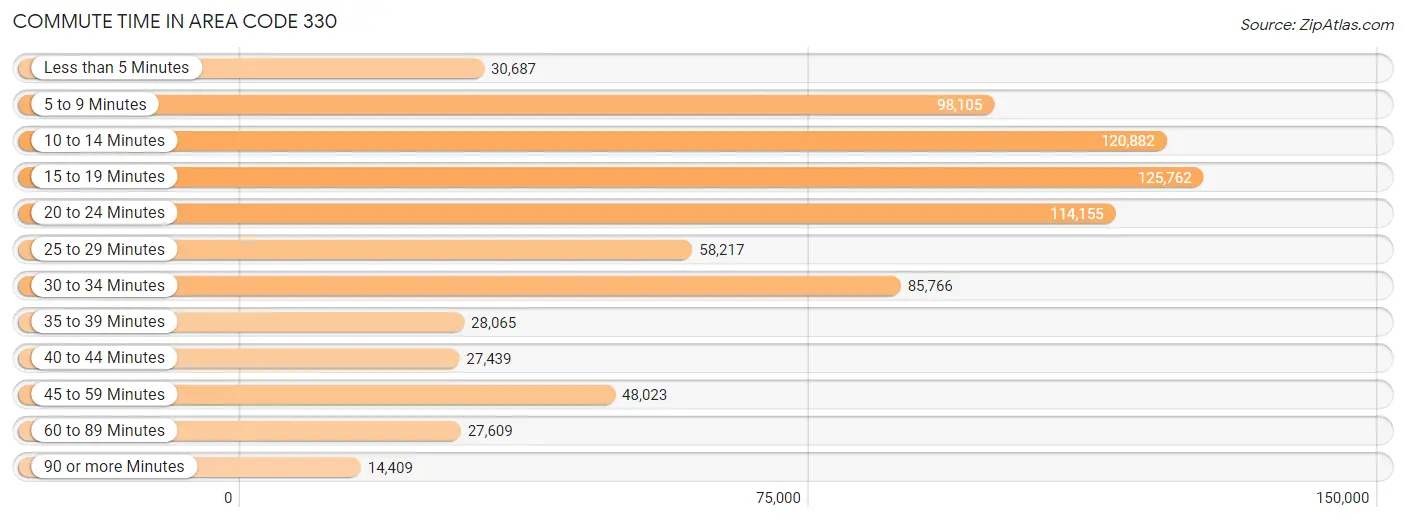
| Commute Time | # Commuters | % Commuters |
| Less than 5 Minutes | 30,687 | 3.9% |
| 5 to 9 Minutes | 98,105 | 12.6% |
| 10 to 14 Minutes | 120,882 | 15.5% |
| 15 to 19 Minutes | 125,762 | 16.1% |
| 20 to 24 Minutes | 114,155 | 14.6% |
| 25 to 29 Minutes | 58,217 | 7.5% |
| 30 to 34 Minutes | 85,766 | 11.0% |
| 35 to 39 Minutes | 28,065 | 3.6% |
| 40 to 44 Minutes | 27,439 | 3.5% |
| 45 to 59 Minutes | 48,023 | 6.2% |
| 60 to 89 Minutes | 27,609 | 3.5% |
| 90 or more Minutes | 14,409 | 1.8% |
Commute Time by Sex in Area Code 330
The most common commute times in Area Code 330 are 15 to 19 minutes (62,280 commuters, 14.9%) for males and 15 to 19 minutes (63,482 commuters, 17.5%) for females.
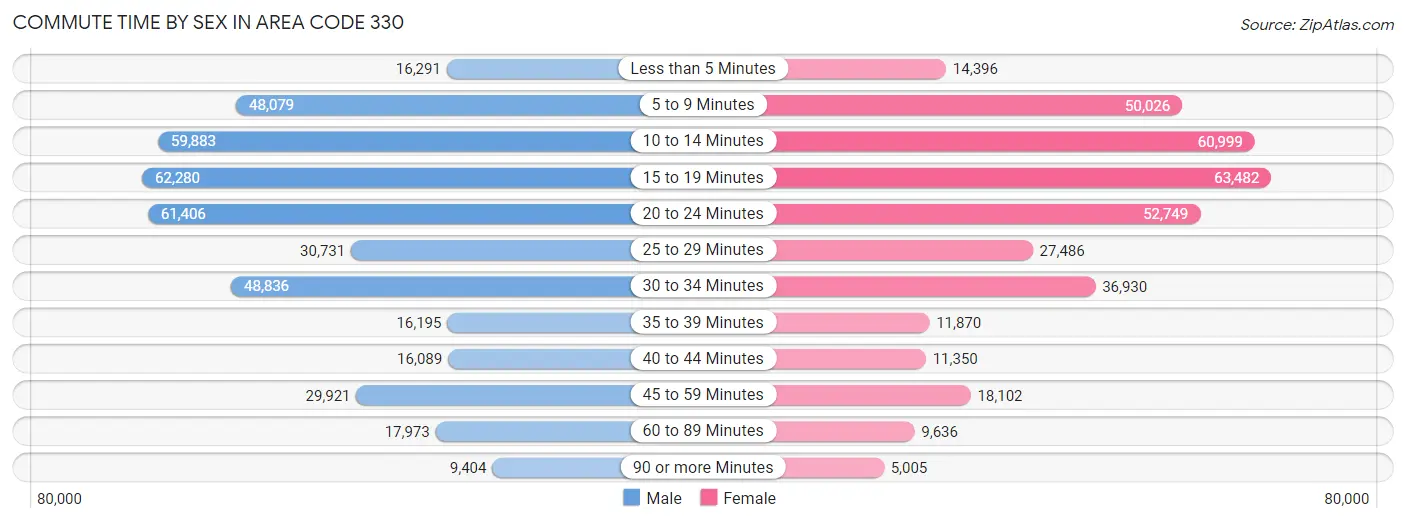
| Commute Time | Male | Female |
| Less than 5 Minutes | 16,291 (3.9%) | 14,396 (4.0%) |
| 5 to 9 Minutes | 48,079 (11.5%) | 50,026 (13.8%) |
| 10 to 14 Minutes | 59,883 (14.4%) | 60,999 (16.9%) |
| 15 to 19 Minutes | 62,280 (14.9%) | 63,482 (17.5%) |
| 20 to 24 Minutes | 61,406 (14.7%) | 52,749 (14.6%) |
| 25 to 29 Minutes | 30,731 (7.4%) | 27,486 (7.6%) |
| 30 to 34 Minutes | 48,836 (11.7%) | 36,930 (10.2%) |
| 35 to 39 Minutes | 16,195 (3.9%) | 11,870 (3.3%) |
| 40 to 44 Minutes | 16,089 (3.9%) | 11,350 (3.1%) |
| 45 to 59 Minutes | 29,921 (7.2%) | 18,102 (5.0%) |
| 60 to 89 Minutes | 17,973 (4.3%) | 9,636 (2.7%) |
| 90 or more Minutes | 9,404 (2.2%) | 5,005 (1.4%) |
Time of Departure to Work by Sex in Area Code 330
The most frequent times of departure to work in Area Code 330 are 7:00 AM to 7:29 AM (56,092, 13.5%) for males and 7:30 AM to 7:59 AM (53,089, 14.7%) for females.
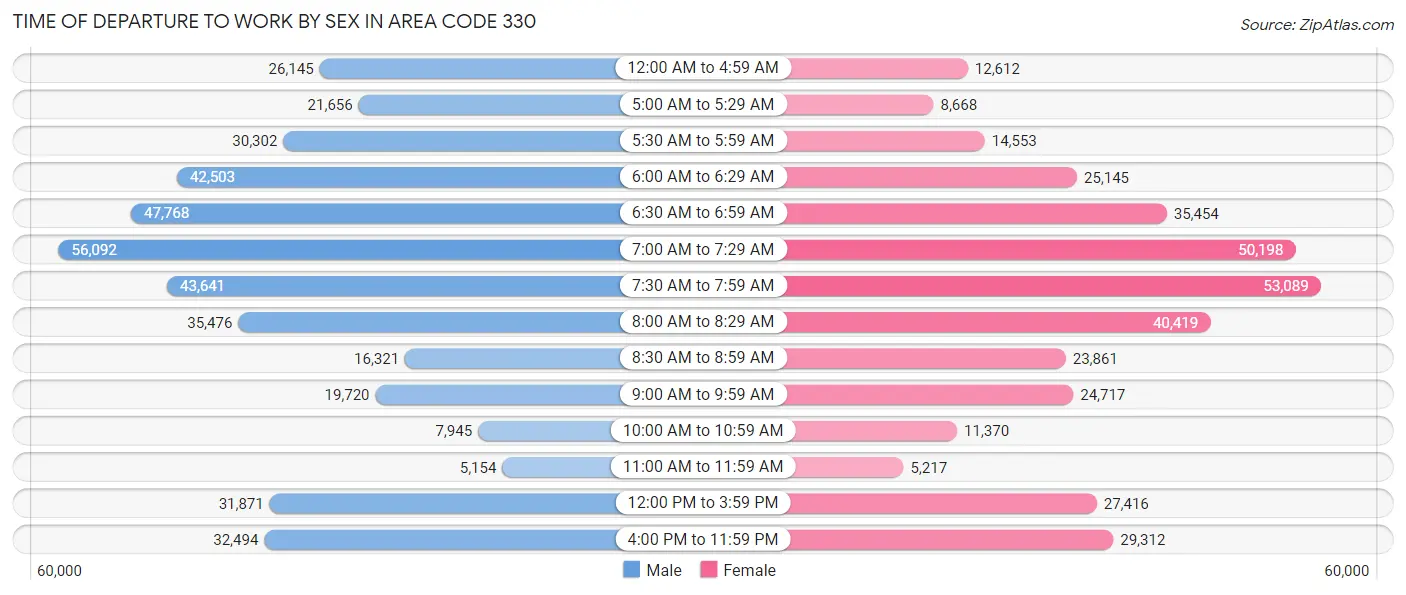
| Time of Departure | Male | Female |
| 12:00 AM to 4:59 AM | 26,145 (6.3%) | 12,612 (3.5%) |
| 5:00 AM to 5:29 AM | 21,656 (5.2%) | 8,668 (2.4%) |
| 5:30 AM to 5:59 AM | 30,302 (7.3%) | 14,553 (4.0%) |
| 6:00 AM to 6:29 AM | 42,503 (10.2%) | 25,145 (7.0%) |
| 6:30 AM to 6:59 AM | 47,768 (11.5%) | 35,454 (9.8%) |
| 7:00 AM to 7:29 AM | 56,092 (13.5%) | 50,198 (13.9%) |
| 7:30 AM to 7:59 AM | 43,641 (10.5%) | 53,089 (14.7%) |
| 8:00 AM to 8:29 AM | 35,476 (8.5%) | 40,419 (11.2%) |
| 8:30 AM to 8:59 AM | 16,321 (3.9%) | 23,861 (6.6%) |
| 9:00 AM to 9:59 AM | 19,720 (4.7%) | 24,717 (6.8%) |
| 10:00 AM to 10:59 AM | 7,945 (1.9%) | 11,370 (3.1%) |
| 11:00 AM to 11:59 AM | 5,154 (1.2%) | 5,217 (1.4%) |
| 12:00 PM to 3:59 PM | 31,871 (7.6%) | 27,416 (7.6%) |
| 4:00 PM to 11:59 PM | 32,494 (7.8%) | 29,312 (8.1%) |
| Total | 417,088 (100.0%) | 362,031 (100.0%) |
Housing Occupancy in Area Code 330
Occupancy by Ownership in Area Code 330
Of the total 745,038 dwellings in Area Code 330, owner-occupied units account for 524,086 (70.3%), while renter-occupied units make up 220,952 (29.7%).
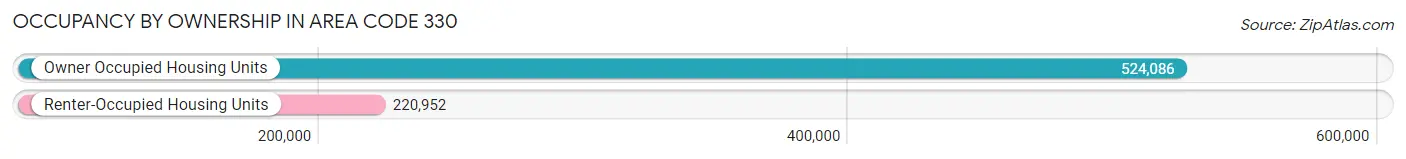
| Occupancy | # Housing Units | % Housing Units |
| Owner Occupied Housing Units | 524,086 | 70.3% |
| Renter-Occupied Housing Units | 220,952 | 29.7% |
| Total Occupied Housing Units | 745,038 | 100.0% |
Occupancy by Household Size in Area Code 330
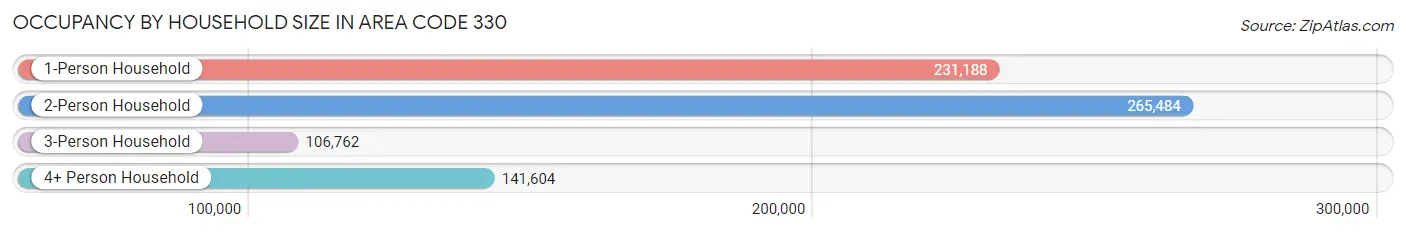
| Household Size | # Housing Units | % Housing Units |
| 1-Person Household | 231,188 | 31.0% |
| 2-Person Household | 265,484 | 35.6% |
| 3-Person Household | 106,762 | 14.3% |
| 4+ Person Household | 141,604 | 19.0% |
| Total Housing Units | 745,038 | 100.0% |
Occupancy by Ownership by Household Size in Area Code 330
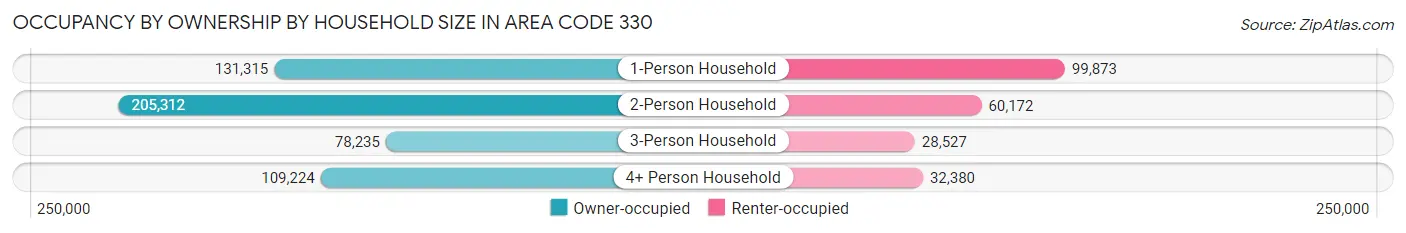
| Household Size | Owner-occupied | Renter-occupied |
| 1-Person Household | 131,315 (56.8%) | 99,873 (43.2%) |
| 2-Person Household | 205,312 (77.3%) | 60,172 (22.7%) |
| 3-Person Household | 78,235 (73.3%) | 28,527 (26.7%) |
| 4+ Person Household | 109,224 (77.1%) | 32,380 (22.9%) |
| Total Housing Units | 524,086 (70.3%) | 220,952 (29.7%) |
Occupancy by Educational Attainment in Area Code 330
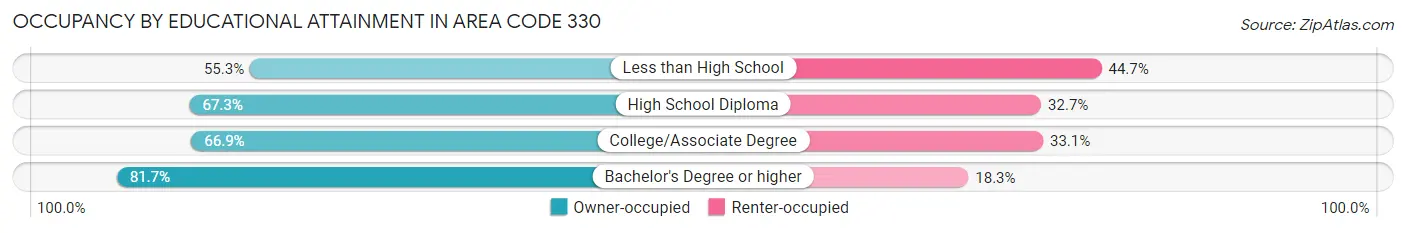
| Household Size | Owner-occupied | Renter-occupied |
| Less than High School | 32,682 (55.3%) | 26,403 (44.7%) |
| High School Diploma | 166,695 (67.3%) | 81,049 (32.7%) |
| College/Associate Degree | 151,024 (66.9%) | 74,642 (33.1%) |
| Bachelor's Degree or higher | 173,685 (81.7%) | 38,858 (18.3%) |
Occupancy by Age of Householder in Area Code 330
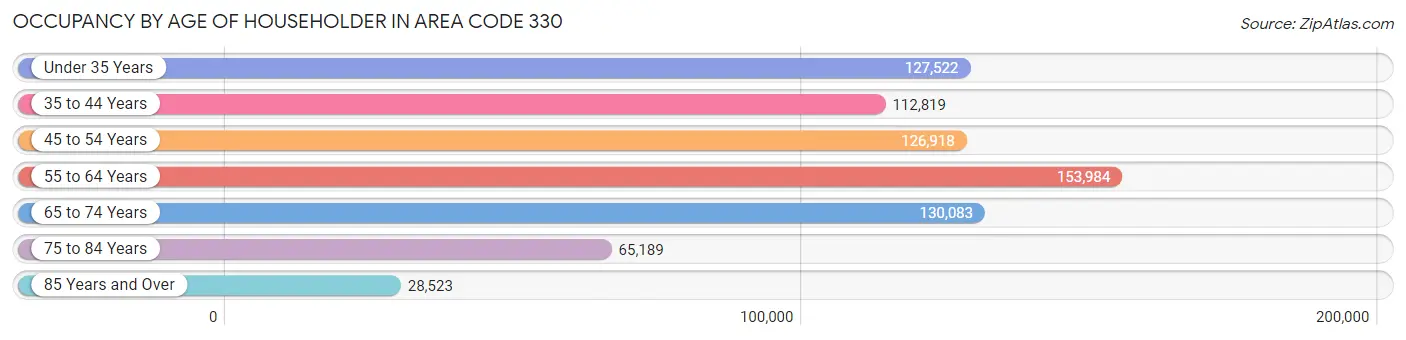
| Age Bracket | # Households | % Households |
| Under 35 Years | 127,522 | 17.1% |
| 35 to 44 Years | 112,819 | 15.1% |
| 45 to 54 Years | 126,918 | 17.0% |
| 55 to 64 Years | 153,984 | 20.7% |
| 65 to 74 Years | 130,083 | 17.5% |
| 75 to 84 Years | 65,189 | 8.7% |
| 85 Years and Over | 28,523 | 3.8% |
| Total | 745,038 | 100.0% |
Housing Finances in Area Code 330
Median Income by Occupancy in Area Code 330
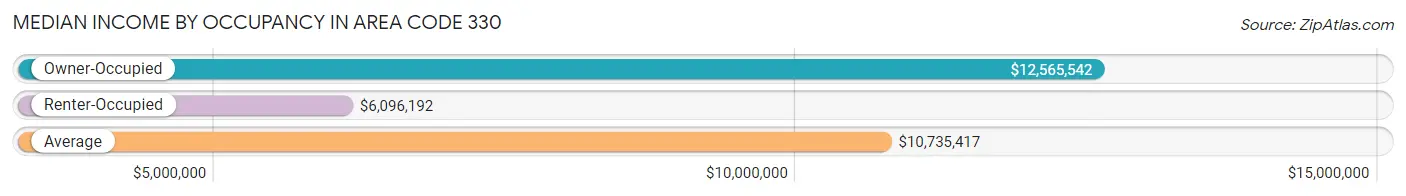
| Occupancy Type | # Households | Median Income |
| Owner-Occupied | 524,086 (70.3%) | $12,565,542 |
| Renter-Occupied | 220,952 (29.7%) | $6,096,192 |
| Average | 745,038 (100.0%) | $10,735,417 |
Occupancy by Householder Income Bracket in Area Code 330
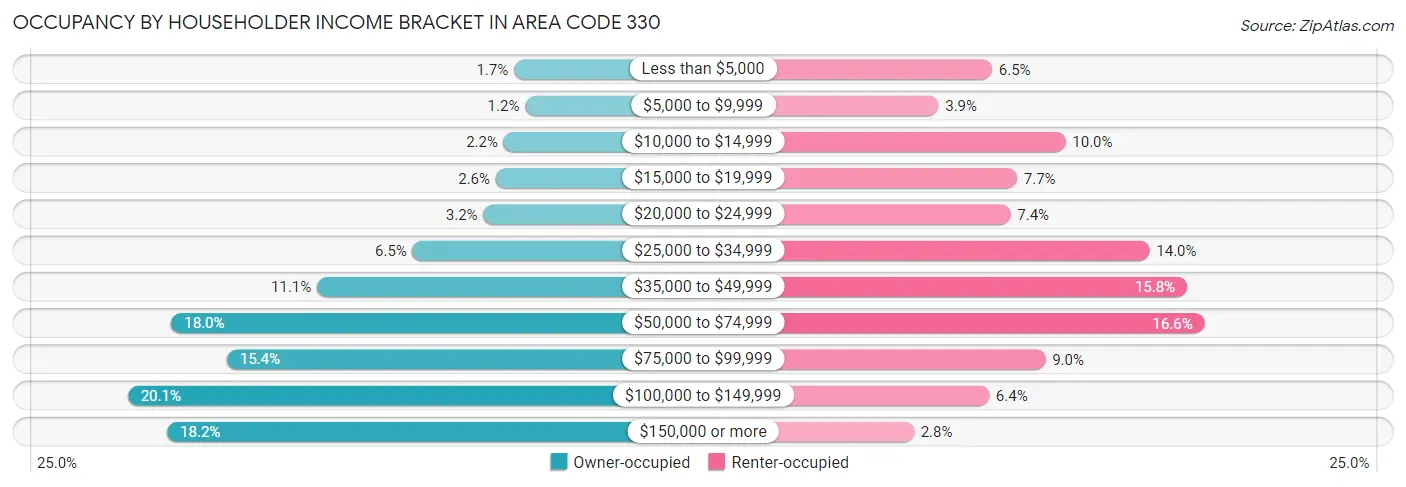
| Income Bracket | Owner-occupied | Renter-occupied |
| Less than $5,000 | 8,839 (1.7%) | 14,333 (6.5%) |
| $5,000 to $9,999 | 6,071 (1.2%) | 8,699 (3.9%) |
| $10,000 to $14,999 | 11,413 (2.2%) | 22,078 (10.0%) |
| $15,000 to $19,999 | 13,435 (2.6%) | 16,962 (7.7%) |
| $20,000 to $24,999 | 16,486 (3.2%) | 16,286 (7.4%) |
| $25,000 to $34,999 | 34,149 (6.5%) | 30,918 (14.0%) |
| $35,000 to $49,999 | 58,037 (11.1%) | 34,868 (15.8%) |
| $50,000 to $74,999 | 94,366 (18.0%) | 36,727 (16.6%) |
| $75,000 to $99,999 | 80,538 (15.4%) | 19,947 (9.0%) |
| $100,000 to $149,999 | 105,306 (20.1%) | 14,022 (6.4%) |
| $150,000 or more | 95,446 (18.2%) | 6,112 (2.8%) |
| Total | 524,086 (100.0%) | 220,952 (100.0%) |
Monthly Housing Cost Tiers in Area Code 330
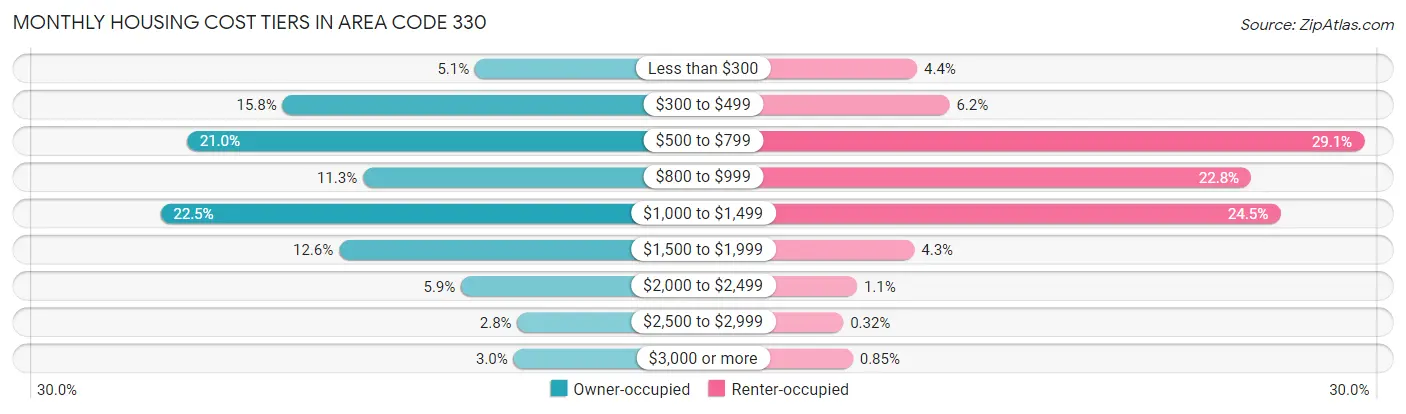
| Monthly Cost | Owner-occupied | Renter-occupied |
| Less than $300 | 26,828 (5.1%) | 9,718 (4.4%) |
| $300 to $499 | 82,542 (15.8%) | 13,667 (6.2%) |
| $500 to $799 | 110,259 (21.0%) | 64,254 (29.1%) |
| $800 to $999 | 59,257 (11.3%) | 50,465 (22.8%) |
| $1,000 to $1,499 | 117,904 (22.5%) | 54,020 (24.4%) |
| $1,500 to $1,999 | 66,179 (12.6%) | 9,382 (4.3%) |
| $2,000 to $2,499 | 30,866 (5.9%) | 2,393 (1.1%) |
| $2,500 to $2,999 | 14,593 (2.8%) | 718 (0.3%) |
| $3,000 or more | 15,658 (3.0%) | 1,868 (0.9%) |
| Total | 524,086 (100.0%) | 220,952 (100.0%) |
Physical Housing Characteristics in Area Code 330
Housing Structures in Area Code 330
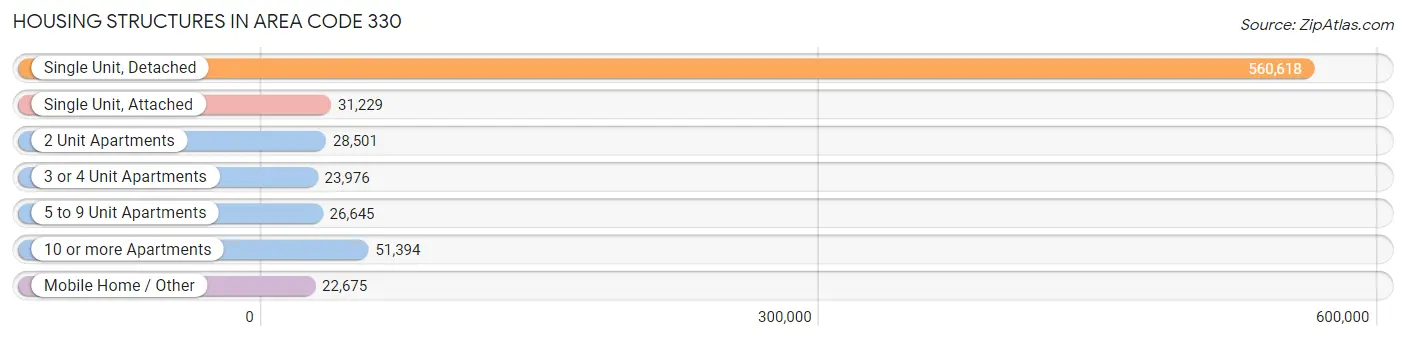
| Structure Type | # Housing Units | % Housing Units |
| Single Unit, Detached | 560,618 | 75.2% |
| Single Unit, Attached | 31,229 | 4.2% |
| 2 Unit Apartments | 28,501 | 3.8% |
| 3 or 4 Unit Apartments | 23,976 | 3.2% |
| 5 to 9 Unit Apartments | 26,645 | 3.6% |
| 10 or more Apartments | 51,394 | 6.9% |
| Mobile Home / Other | 22,675 | 3.0% |
| Total | 745,038 | 100.0% |
Housing Structures by Occupancy in Area Code 330
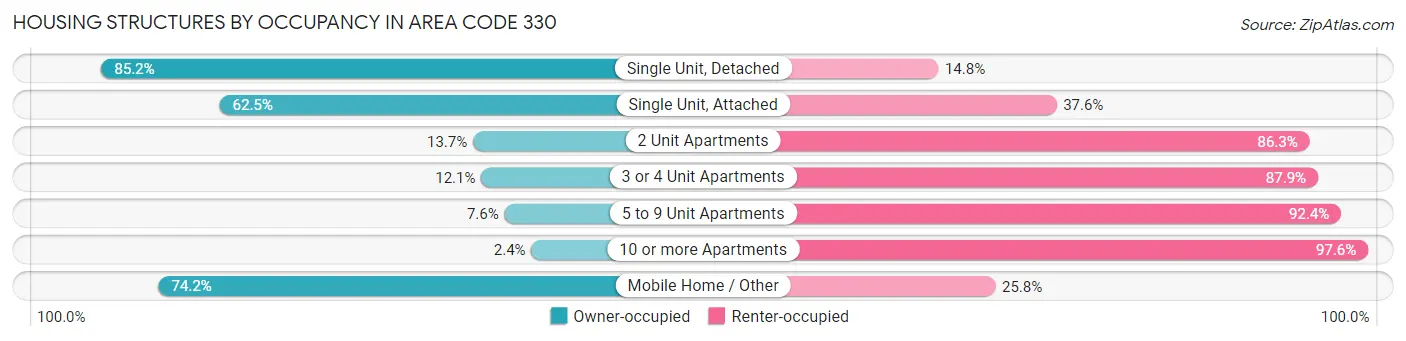
| Structure Type | Owner-occupied | Renter-occupied |
| Single Unit, Detached | 477,697 (85.2%) | 82,921 (14.8%) |
| Single Unit, Attached | 19,501 (62.5%) | 11,728 (37.6%) |
| 2 Unit Apartments | 3,894 (13.7%) | 24,607 (86.3%) |
| 3 or 4 Unit Apartments | 2,894 (12.1%) | 21,082 (87.9%) |
| 5 to 9 Unit Apartments | 2,023 (7.6%) | 24,622 (92.4%) |
| 10 or more Apartments | 1,245 (2.4%) | 50,149 (97.6%) |
| Mobile Home / Other | 16,832 (74.2%) | 5,843 (25.8%) |
| Total | 524,086 (70.3%) | 220,952 (29.7%) |
Housing Structures by Number of Rooms in Area Code 330
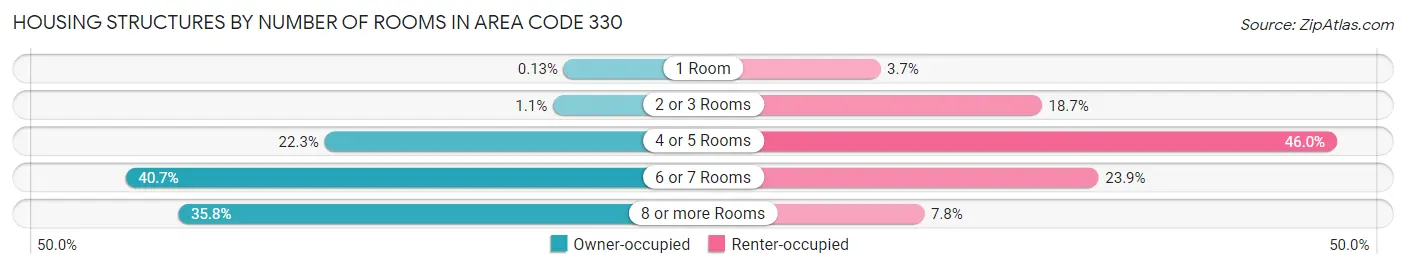
| Number of Rooms | Owner-occupied | Renter-occupied |
| 1 Room | 686 (0.1%) | 8,200 (3.7%) |
| 2 or 3 Rooms | 5,912 (1.1%) | 41,204 (18.6%) |
| 4 or 5 Rooms | 116,595 (22.3%) | 101,553 (46.0%) |
| 6 or 7 Rooms | 213,222 (40.7%) | 52,807 (23.9%) |
| 8 or more Rooms | 187,671 (35.8%) | 17,188 (7.8%) |
| Total | 524,086 (100.0%) | 220,952 (100.0%) |
Housing Structure by Heating Type in Area Code 330
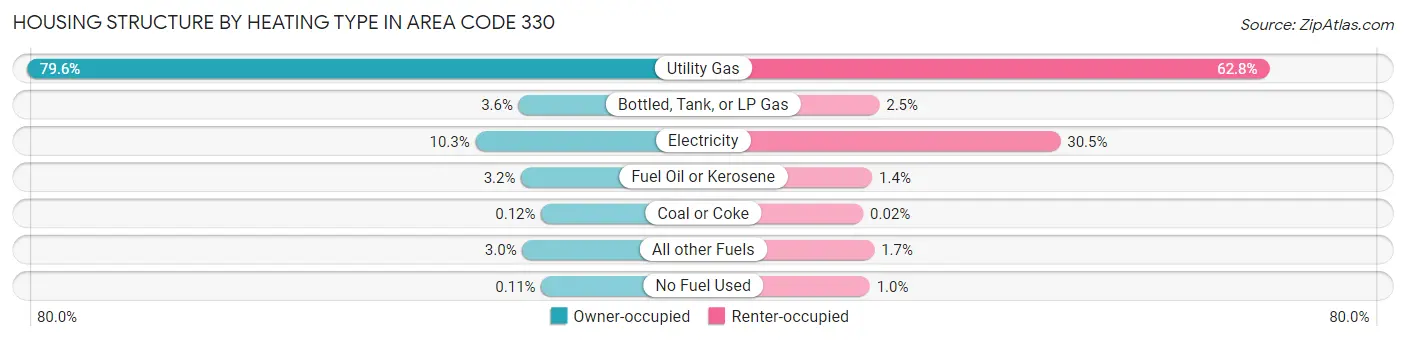
| Heating Type | Owner-occupied | Renter-occupied |
| Utility Gas | 417,374 (79.6%) | 138,760 (62.8%) |
| Bottled, Tank, or LP Gas | 18,868 (3.6%) | 5,546 (2.5%) |
| Electricity | 53,935 (10.3%) | 67,369 (30.5%) |
| Fuel Oil or Kerosene | 16,845 (3.2%) | 3,126 (1.4%) |
| Coal or Coke | 604 (0.1%) | 34 (0.0%) |
| All other Fuels | 15,887 (3.0%) | 3,833 (1.7%) |
| No Fuel Used | 573 (0.1%) | 2,284 (1.0%) |
| Total | 524,086 (100.0%) | 220,952 (100.0%) |
Household Vehicle Usage in Area Code 330
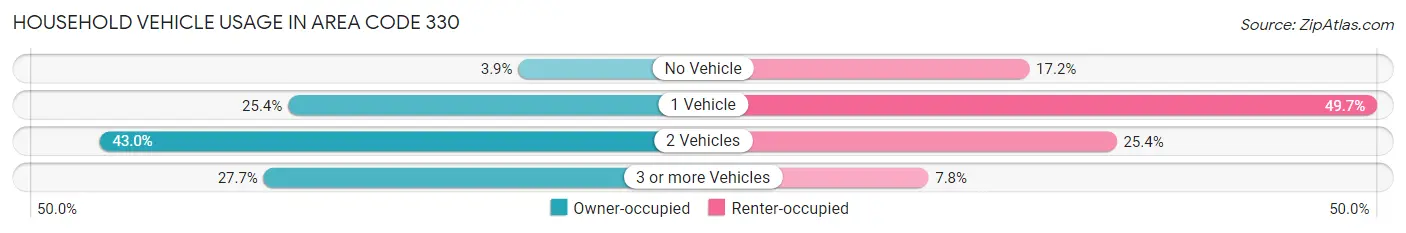
| Vehicles per Household | Owner-occupied | Renter-occupied |
| No Vehicle | 20,469 (3.9%) | 38,004 (17.2%) |
| 1 Vehicle | 133,125 (25.4%) | 109,753 (49.7%) |
| 2 Vehicles | 225,413 (43.0%) | 56,006 (25.4%) |
| 3 or more Vehicles | 145,079 (27.7%) | 17,189 (7.8%) |
| Total | 524,086 (100.0%) | 220,952 (100.0%) |
Real Estate & Mortgages in Area Code 330
Real Estate and Mortgage Overview in Area Code 330
| Characteristic | Without Mortgage | With Mortgage |
| Housing Units | 213,593 | 310,493 |
| Median Property Value | $24,961,000 | $28,068,400 |
| Median Household Income | $9,505,820 | $69,032 |
| Monthly Housing Costs | $79,985 | $15,239 |
| Real Estate Taxes | $332,322 | $5,620 |
Property Value by Mortgage Status in Area Code 330
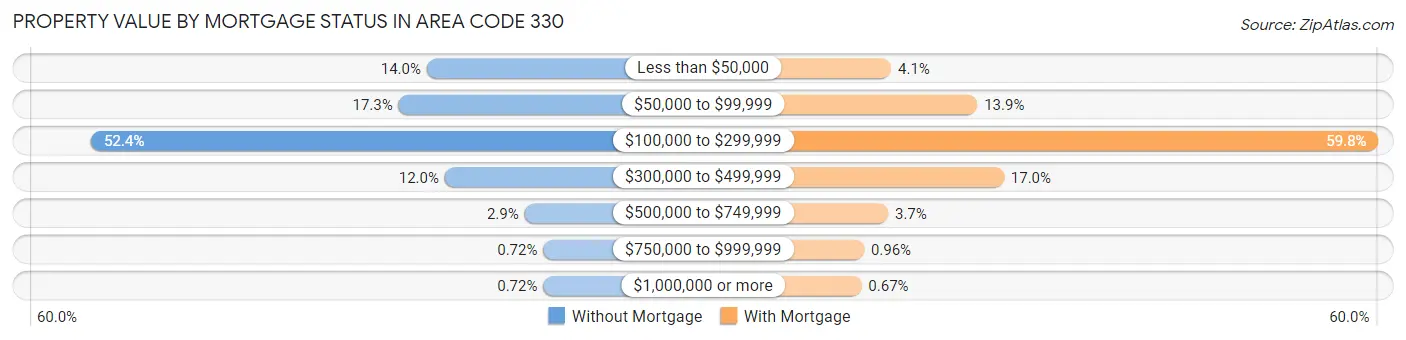
| Property Value | Without Mortgage | With Mortgage |
| Less than $50,000 | 29,998 (14.0%) | 12,595 (4.1%) |
| $50,000 to $99,999 | 36,864 (17.3%) | 43,179 (13.9%) |
| $100,000 to $299,999 | 111,946 (52.4%) | 185,530 (59.8%) |
| $300,000 to $499,999 | 25,599 (12.0%) | 52,640 (17.0%) |
| $500,000 to $749,999 | 6,110 (2.9%) | 11,513 (3.7%) |
| $750,000 to $999,999 | 1,533 (0.7%) | 2,967 (1.0%) |
| $1,000,000 or more | 1,543 (0.7%) | 2,069 (0.7%) |
| Total | 213,593 (100.0%) | 310,493 (100.0%) |
Household Income by Mortgage Status in Area Code 330
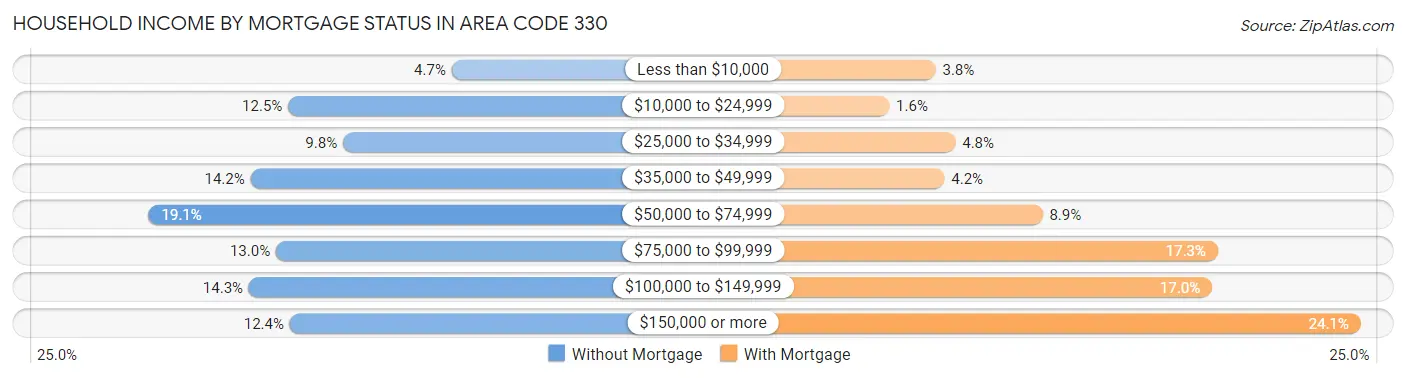
| Household Income | Without Mortgage | With Mortgage |
| Less than $10,000 | 9,946 (4.7%) | 11,816 (3.8%) |
| $10,000 to $24,999 | 26,588 (12.4%) | 4,964 (1.6%) |
| $25,000 to $34,999 | 21,026 (9.8%) | 14,746 (4.8%) |
| $35,000 to $49,999 | 30,408 (14.2%) | 13,123 (4.2%) |
| $50,000 to $74,999 | 40,794 (19.1%) | 27,629 (8.9%) |
| $75,000 to $99,999 | 27,825 (13.0%) | 53,572 (17.2%) |
| $100,000 to $149,999 | 30,592 (14.3%) | 52,713 (17.0%) |
| $150,000 or more | 26,414 (12.4%) | 74,714 (24.1%) |
| Total | 213,593 (100.0%) | 310,493 (100.0%) |
Property Value to Household Income Ratio in Area Code 330
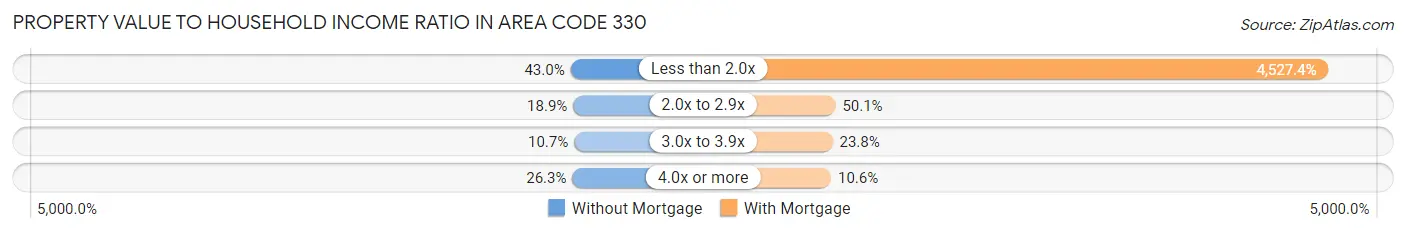
| Value-to-Income Ratio | Without Mortgage | With Mortgage |
| Less than 2.0x | 91,828 (43.0%) | 14,057,112 (4,527.3%) |
| 2.0x to 2.9x | 40,254 (18.9%) | 155,475 (50.1%) |
| 3.0x to 3.9x | 22,945 (10.7%) | 73,773 (23.8%) |
| 4.0x or more | 56,110 (26.3%) | 32,879 (10.6%) |
| Total | 213,593 (100.0%) | 310,493 (100.0%) |
Real Estate Taxes by Mortgage Status in Area Code 330
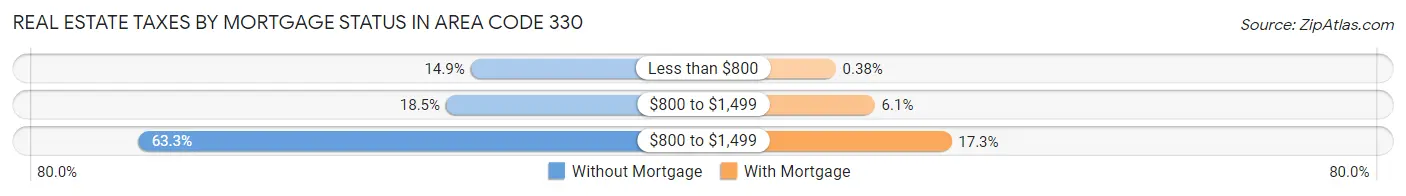
| Property Taxes | Without Mortgage | With Mortgage |
| Less than $800 | 31,724 (14.8%) | 1,188 (0.4%) |
| $800 to $1,499 | 39,398 (18.4%) | 18,872 (6.1%) |
| $800 to $1,499 | 135,242 (63.3%) | 53,677 (17.3%) |
| Total | 213,593 (100.0%) | 310,493 (100.0%) |
Health & Disability in Area Code 330
Health Insurance Coverage by Age in Area Code 330
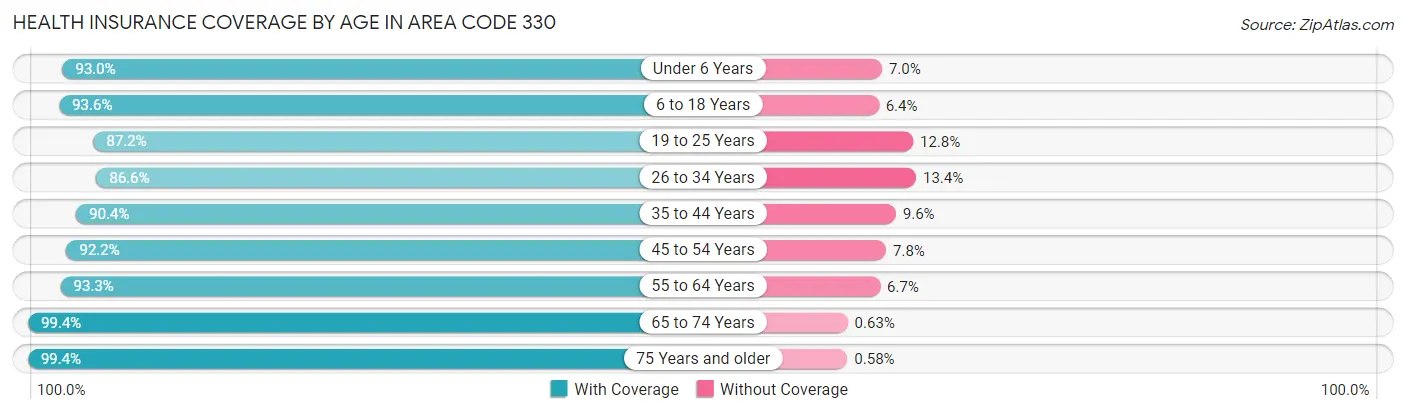
| Age Bracket | With Coverage | Without Coverage |
| Under 6 Years | 110,096 (93.0%) | 8,323 (7.0%) |
| 6 to 18 Years | 272,121 (93.6%) | 18,662 (6.4%) |
| 19 to 25 Years | 139,647 (87.2%) | 20,545 (12.8%) |
| 26 to 34 Years | 166,656 (86.6%) | 25,745 (13.4%) |
| 35 to 44 Years | 189,793 (90.4%) | 20,172 (9.6%) |
| 45 to 54 Years | 206,013 (92.2%) | 17,413 (7.8%) |
| 55 to 64 Years | 239,868 (93.3%) | 17,172 (6.7%) |
| 65 to 74 Years | 203,717 (99.4%) | 1,296 (0.6%) |
| 75 Years and older | 135,638 (99.4%) | 791 (0.6%) |
| Total | 1,663,549 (92.7%) | 130,119 (7.2%) |
Health Insurance Coverage by Citizenship Status in Area Code 330
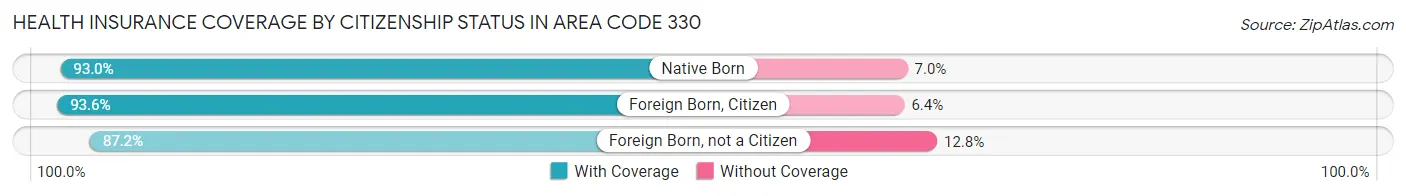
| Citizenship Status | With Coverage | Without Coverage |
| Native Born | 110,096 (93.0%) | 8,323 (7.0%) |
| Foreign Born, Citizen | 272,121 (93.6%) | 18,662 (6.4%) |
| Foreign Born, not a Citizen | 139,647 (87.2%) | 20,545 (12.8%) |
Health Insurance Coverage by Household Income in Area Code 330
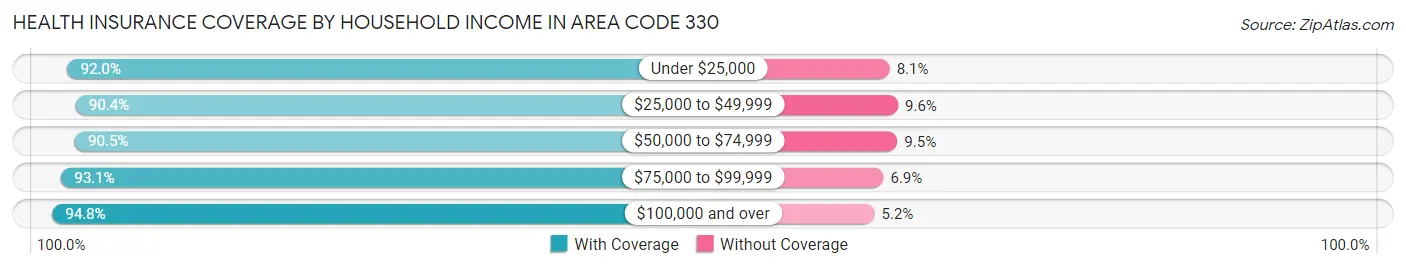
| Household Income | With Coverage | Without Coverage |
| Under $25,000 | 201,180 (91.9%) | 17,617 (8.1%) |
| $25,000 to $49,999 | 274,238 (90.4%) | 29,161 (9.6%) |
| $50,000 to $74,999 | 274,920 (90.5%) | 28,783 (9.5%) |
| $75,000 to $99,999 | 246,712 (93.1%) | 18,226 (6.9%) |
| $100,000 and over | 648,483 (94.8%) | 35,622 (5.2%) |
Public vs Private Health Insurance Coverage by Age in Area Code 330
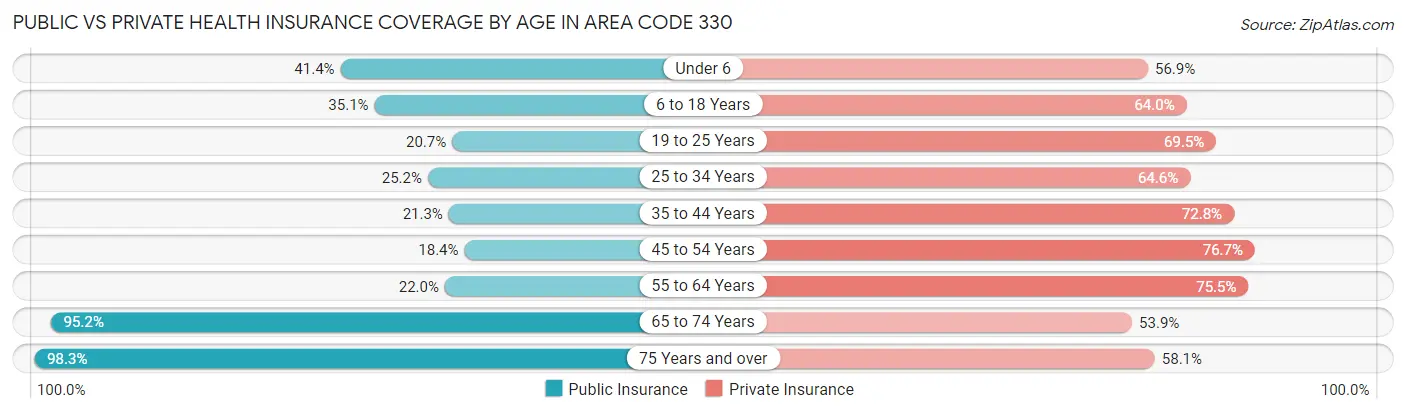
| Age Bracket | Public Insurance | Private Insurance |
| Under 6 | 49,006 (41.4%) | 67,320 (56.9%) |
| 6 to 18 Years | 101,967 (35.1%) | 186,017 (64.0%) |
| 19 to 25 Years | 33,098 (20.7%) | 111,304 (69.5%) |
| 25 to 34 Years | 48,406 (25.2%) | 124,349 (64.6%) |
| 35 to 44 Years | 44,682 (21.3%) | 152,803 (72.8%) |
| 45 to 54 Years | 41,063 (18.4%) | 171,258 (76.6%) |
| 55 to 64 Years | 56,587 (22.0%) | 193,928 (75.4%) |
| 65 to 74 Years | 195,158 (95.2%) | 110,492 (53.9%) |
| 75 Years and over | 134,048 (98.3%) | 79,276 (58.1%) |
| Total | 704,015 (39.3%) | 1,196,747 (66.7%) |
Disability Status by Sex by Age in Area Code 330
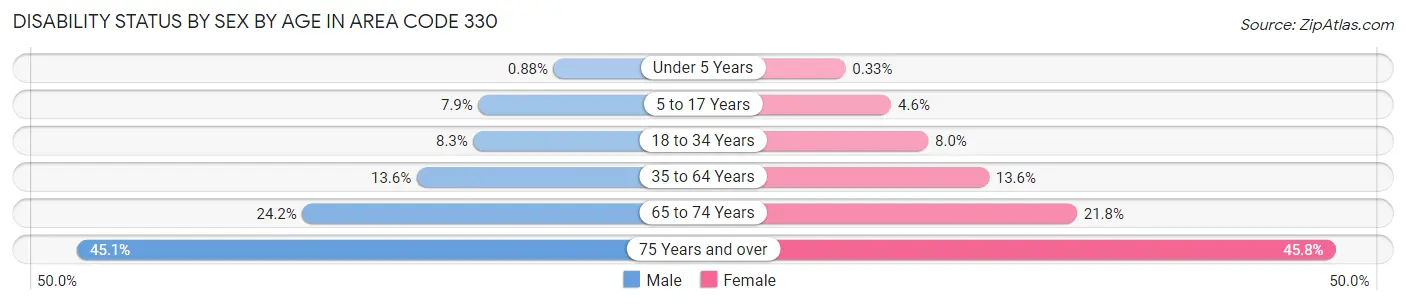
| Age Bracket | Male | Female |
| Under 5 Years | 440 (0.9%) | 154 (0.3%) |
| 5 to 17 Years | 11,560 (7.9%) | 6,434 (4.6%) |
| 18 to 34 Years | 15,885 (8.3%) | 14,904 (8.0%) |
| 35 to 64 Years | 46,466 (13.6%) | 47,515 (13.6%) |
| 65 to 74 Years | 23,511 (24.2%) | 23,525 (21.8%) |
| 75 Years and over | 25,696 (45.1%) | 36,419 (45.8%) |
Disability Class by Sex by Age in Area Code 330
Disability Class: Hearing Difficulty
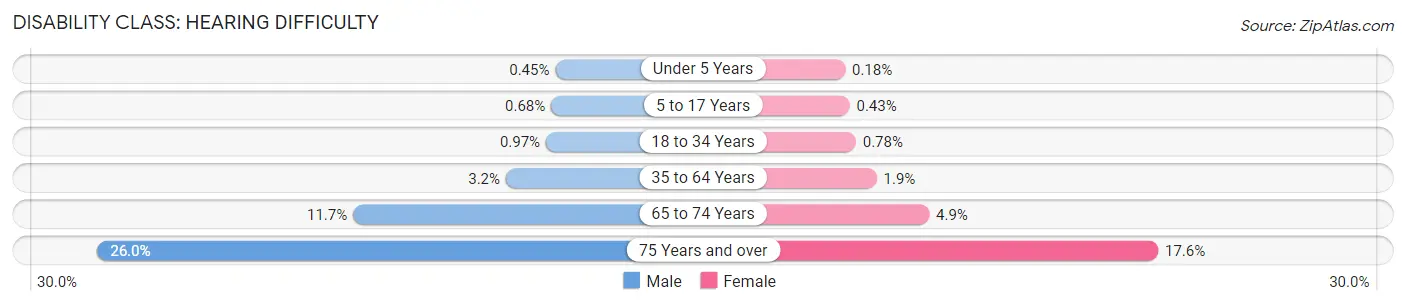
| Age Bracket | Male | Female |
| Under 5 Years | 226 (0.4%) | 87 (0.2%) |
| 5 to 17 Years | 997 (0.7%) | 599 (0.4%) |
| 18 to 34 Years | 1,850 (1.0%) | 1,456 (0.8%) |
| 35 to 64 Years | 10,958 (3.2%) | 6,763 (1.9%) |
| 65 to 74 Years | 11,372 (11.7%) | 5,239 (4.9%) |
| 75 Years and over | 14,771 (26.0%) | 13,997 (17.6%) |
Disability Class: Vision Difficulty
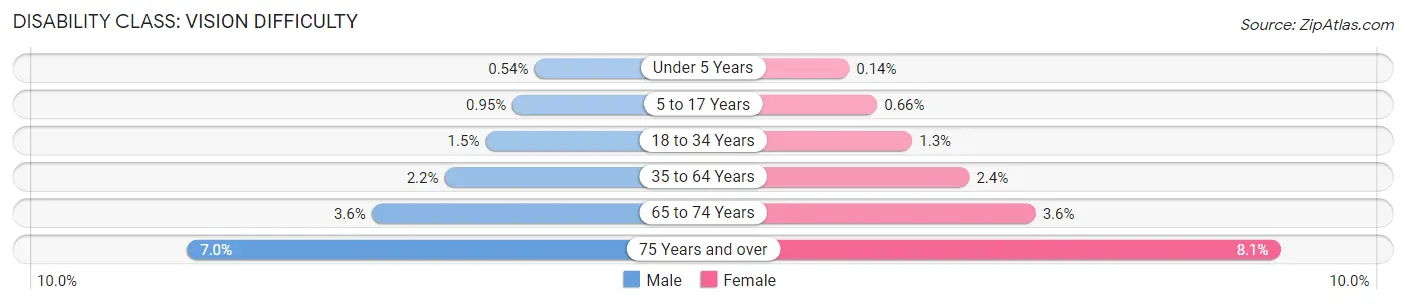
| Age Bracket | Male | Female |
| Under 5 Years | 272 (0.5%) | 67 (0.1%) |
| 5 to 17 Years | 1,391 (0.9%) | 932 (0.7%) |
| 18 to 34 Years | 2,766 (1.5%) | 2,436 (1.3%) |
| 35 to 64 Years | 7,564 (2.2%) | 8,260 (2.4%) |
| 65 to 74 Years | 3,460 (3.6%) | 3,885 (3.6%) |
| 75 Years and over | 3,974 (7.0%) | 6,469 (8.1%) |
Disability Class: Cognitive Difficulty
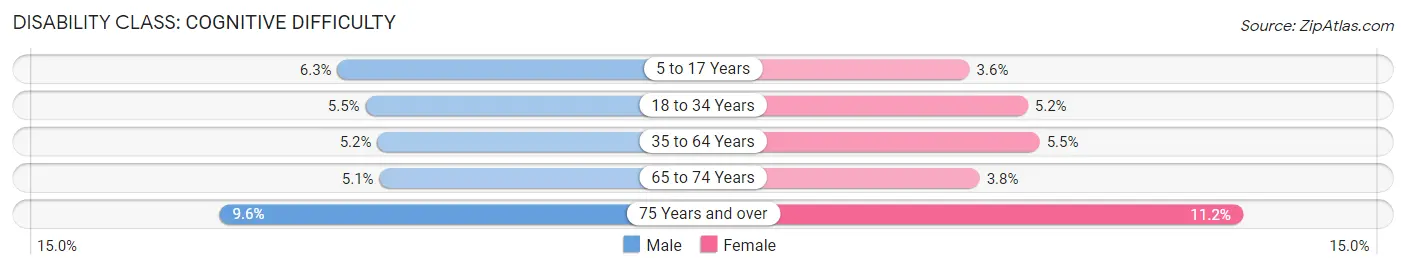
| Age Bracket | Male | Female |
| 5 to 17 Years | 9,245 (6.3%) | 5,002 (3.6%) |
| 18 to 34 Years | 10,502 (5.5%) | 9,640 (5.2%) |
| 35 to 64 Years | 17,713 (5.2%) | 19,202 (5.5%) |
| 65 to 74 Years | 4,973 (5.1%) | 4,143 (3.8%) |
| 75 Years and over | 5,449 (9.6%) | 8,872 (11.2%) |
Disability Class: Ambulatory Difficulty
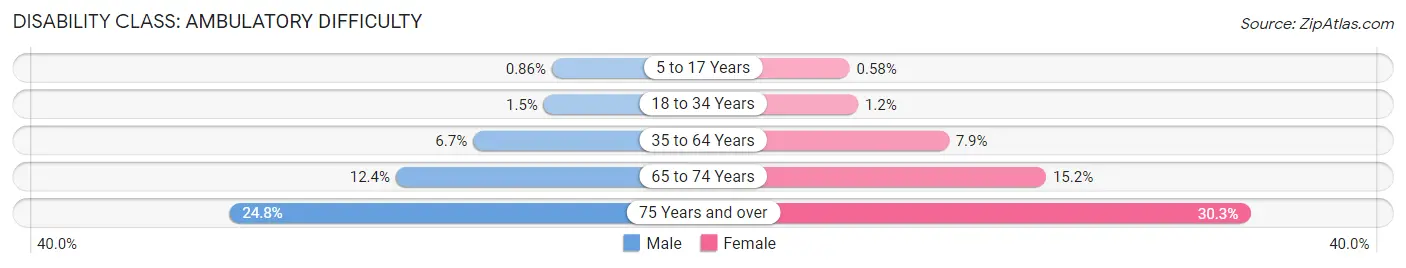
| Age Bracket | Male | Female |
| 5 to 17 Years | 1,259 (0.9%) | 817 (0.6%) |
| 18 to 34 Years | 2,791 (1.5%) | 2,243 (1.2%) |
| 35 to 64 Years | 22,950 (6.7%) | 27,649 (7.9%) |
| 65 to 74 Years | 12,080 (12.4%) | 16,351 (15.2%) |
| 75 Years and over | 14,114 (24.8%) | 24,098 (30.3%) |
Disability Class: Self-Care Difficulty
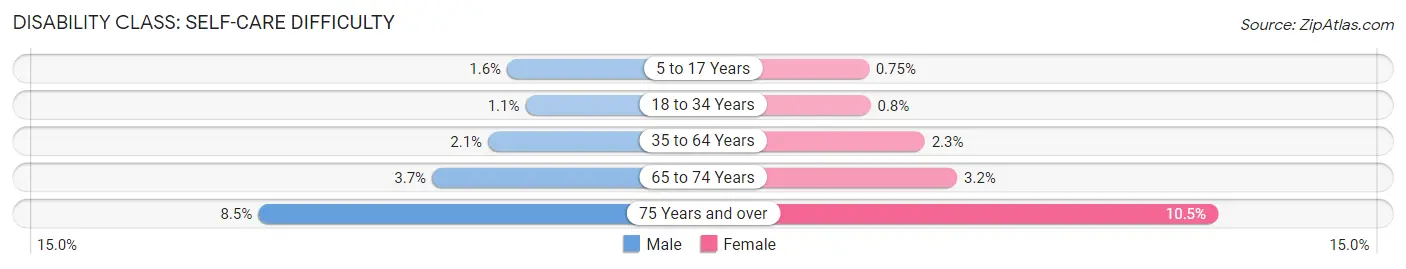
| Age Bracket | Male | Female |
| 5 to 17 Years | 2,310 (1.6%) | 1,057 (0.7%) |
| 18 to 34 Years | 2,020 (1.1%) | 1,490 (0.8%) |
| 35 to 64 Years | 7,187 (2.1%) | 8,045 (2.3%) |
| 65 to 74 Years | 3,557 (3.7%) | 3,462 (3.2%) |
| 75 Years and over | 4,838 (8.5%) | 8,325 (10.5%) |
Technology Access in Area Code 330
Computing Device Access in Area Code 330
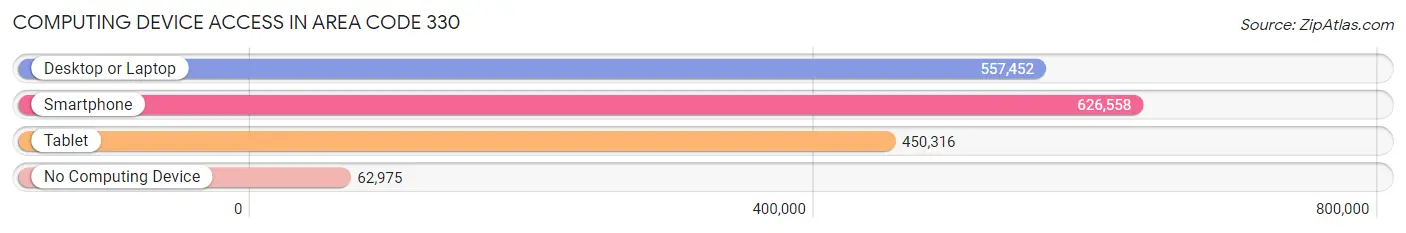
| Device Type | # Households | % Households |
| Desktop or Laptop | 557,452 | 74.8% |
| Smartphone | 626,558 | 84.1% |
| Tablet | 450,316 | 60.4% |
| No Computing Device | 62,975 | 8.5% |
| Total | 745,038 | 100.0% |
Internet Access in Area Code 330
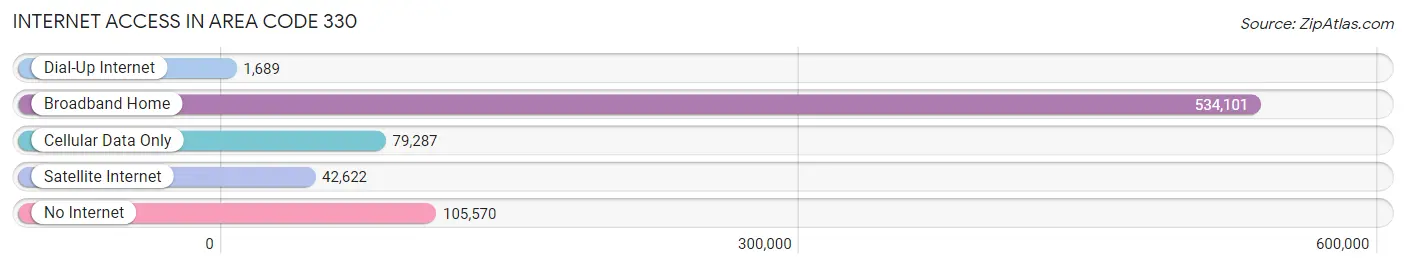
| Internet Type | # Households | % Households |
| Dial-Up Internet | 1,689 | 0.2% |
| Broadband Home | 534,101 | 71.7% |
| Cellular Data Only | 79,287 | 10.6% |
| Satellite Internet | 42,622 | 5.7% |
| No Internet | 105,570 | 14.2% |
| Total | 745,038 | 100.0% |
Area Code 330 Summary
Geography
Area code 330 is a telephone area code in the North American Numbering Plan (NANP) for the northeastern Ohio counties of Summit, Portage, Stark, and Wayne. It was created in 1996 as an overlay to area code 216.
Social
Area code 330 is home to many of Ohio's major cities, including Akron, Canton, and Youngstown. It is also home to many universities and colleges, including the University of Akron, Kent State University, and Youngstown State University.
Economics
Area code 330 is home to many of Ohio's major industries, including manufacturing, healthcare, and technology. The area is also home to a number of Fortune 500 companies, including Goodyear Tire & Rubber Company, FirstEnergy, and Diebold Nixdorf.
Demographics
Area code 330 is home to a diverse population, with a median age of 38.7 years. The population is predominantly white (83.3%), followed by African American (11.2%), Hispanic (2.7%), and Asian (2.2%). The median household income is $50,845, and the median home value is $133,400.
Common Questions
What is Per Capita Income in Area Code 330?
Per Capita income in Area Code 330 is $33,517.
What is the Median Family Income in Area Code 330?
Median Family Income in Area Code 330 is $80,795.
What is the Median Household income in Area Code 330?
Median Household Income in Area Code 330 is $65,861.
What is Income or Wage Gap in Area Code 330?
Income or Wage Gap in Area Code 330 is 33.5%.
Women in Area Code 330 earn 66.5 cents for every dollar earned by a man.
What is Family Income Deficit in Area Code 330?
Family Income Deficit in Area Code 330 is $10,519.
Families that are below poverty line in Area Code 330 earn $10,519 less on average than the poverty threshold level.
What is Inequality or Gini Index in Area Code 330?
Inequality or Gini Index in Area Code 330 is 68.63.
What is the Total Population of Area Code 330?
Total Population of Area Code 330 is 1,816,161.
What is the Total Male Population of Area Code 330?
Total Male Population of Area Code 330 is 895,762.
What is the Total Female Population of Area Code 330?
Total Female Population of Area Code 330 is 920,399.
What is the Ratio of Males per 100 Females in Area Code 330?
There are 97.32 Males per 100 Females in Area Code 330.
What is the Ratio of Females per 100 Males in Area Code 330?
There are 102.75 Females per 100 Males in Area Code 330.
What is the Median Population Age in Area Code 330?
Median Population Age in Area Code 330 is 42.0 Years.
What is the Average Family Size in Area Code 330
Average Family Size in Area Code 330 is 3.0 People.
What is the Average Household Size in Area Code 330
Average Household Size in Area Code 330 is 2.5 People.
How Large is the Labor Force in Area Code 330?
There are 894,239 People in the Labor Forcein in Area Code 330.
What is the Percentage of People in the Labor Force in Area Code 330?
60.5% of People are in the Labor Force in Area Code 330.
What is the Unemployment Rate in Area Code 330?
Unemployment Rate in Area Code 330 is 5.4%.