Area Code 913 Map & Demographics
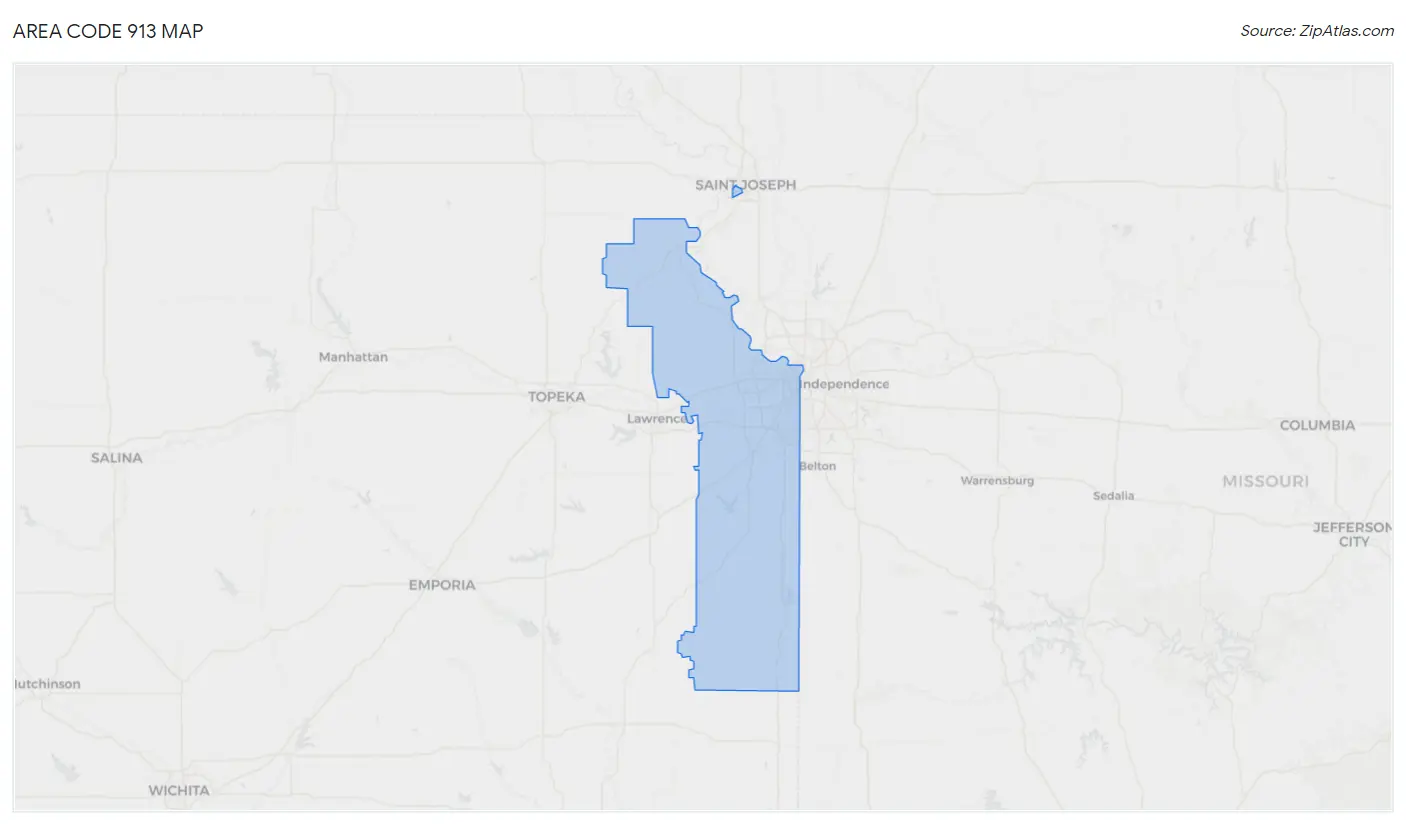
Area Code 913 Map
Area Code 913 Overview
$45,047
PER CAPITA INCOME
$107,307
AVG FAMILY INCOME
$89,773
AVG HOUSEHOLD INCOME
33.9%
WAGE / INCOME GAP [ % ]
66.1¢/ $1
WAGE / INCOME GAP [ $ ]
$10,368
FAMILY INCOME DEFICIT
28.73
INEQUALITY / GINI INDEX
927,785
TOTAL POPULATION
464,189
MALE POPULATION
463,596
FEMALE POPULATION
100.13
MALES / 100 FEMALES
99.87
FEMALES / 100 MALES
40.6
MEDIAN AGE
3.1
AVG FAMILY SIZE
2.6
AVG HOUSEHOLD SIZE
482,806
LABOR FORCE [ PEOPLE ]
66.3%
PERCENT IN LABOR FORCE
3.9%
UNEMPLOYMENT RATE
Income in Area Code 913
Income Overview in Area Code 913
Per Capita Income in Area Code 913 is $45,047, while median incomes of families and households are $107,307 and $89,773 respectively.
| Characteristic | Number | Measure |
| Per Capita Income | 927,785 | $45,047 |
| Median Family Income | 238,801 | $107,307 |
| Mean Family Income | 238,801 | $9,039,288 |
| Median Household Income | 357,609 | $89,773 |
| Mean Household Income | 357,609 | $7,877,801 |
| Income Deficit | 238,801 | $10,368 |
| Wage / Income Gap (%) | 927,785 | 33.91% |
| Wage / Income Gap ($) | 927,785 | 66.09¢ per $1 |
| Gini / Inequality Index | 927,785 | 28.73 |
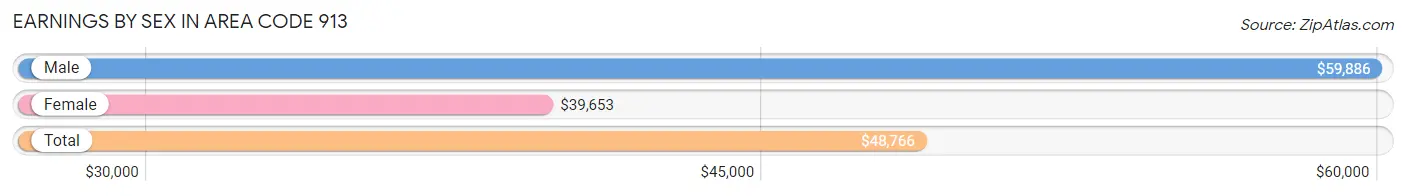
Earnings by Sex in Area Code 913
Average Earnings in Area Code 913 are $48,766, $59,886 for men and $39,653 for women, a difference of 33.8%.
| Sex | Number | Average Earnings |
| Male | 282,635 (53.3%) | $59,886 |
| Female | 247,557 (46.7%) | $39,653 |
| Total | 530,192 (100.0%) | $48,766 |
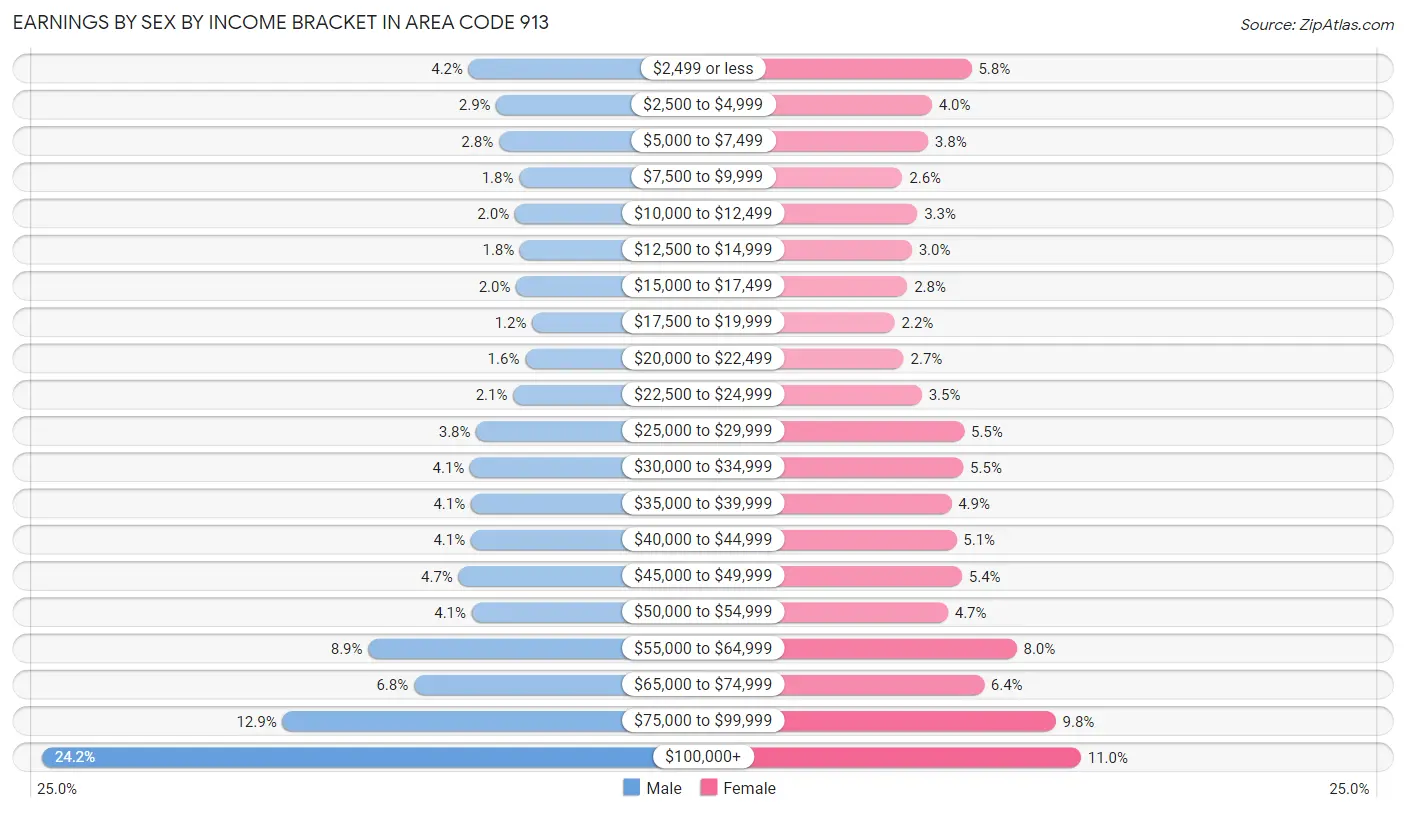
Earnings by Sex by Income Bracket in Area Code 913
The most common earnings brackets in Area Code 913 are $100,000+ for men (68,372 | 24.2%) and $100,000+ for women (27,121 | 11.0%).
| Income | Male | Female |
| $2,499 or less | 11,847 (4.2%) | 14,467 (5.8%) |
| $2,500 to $4,999 | 8,195 (2.9%) | 9,841 (4.0%) |
| $5,000 to $7,499 | 7,849 (2.8%) | 9,403 (3.8%) |
| $7,500 to $9,999 | 5,163 (1.8%) | 6,445 (2.6%) |
| $10,000 to $12,499 | 5,739 (2.0%) | 8,178 (3.3%) |
| $12,500 to $14,999 | 5,071 (1.8%) | 7,517 (3.0%) |
| $15,000 to $17,499 | 5,579 (2.0%) | 7,017 (2.8%) |
| $17,500 to $19,999 | 3,436 (1.2%) | 5,553 (2.2%) |
| $20,000 to $22,499 | 4,371 (1.5%) | 6,581 (2.7%) |
| $22,500 to $24,999 | 5,977 (2.1%) | 8,694 (3.5%) |
| $25,000 to $29,999 | 10,853 (3.8%) | 13,586 (5.5%) |
| $30,000 to $34,999 | 11,671 (4.1%) | 13,503 (5.4%) |
| $35,000 to $39,999 | 11,556 (4.1%) | 12,117 (4.9%) |
| $40,000 to $44,999 | 11,563 (4.1%) | 12,689 (5.1%) |
| $45,000 to $49,999 | 13,186 (4.7%) | 13,341 (5.4%) |
| $50,000 to $54,999 | 11,434 (4.1%) | 11,714 (4.7%) |
| $55,000 to $64,999 | 25,155 (8.9%) | 19,685 (8.0%) |
| $65,000 to $74,999 | 19,096 (6.8%) | 15,885 (6.4%) |
| $75,000 to $99,999 | 36,522 (12.9%) | 24,220 (9.8%) |
| $100,000+ | 68,372 (24.2%) | 27,121 (11.0%) |
| Total | 282,635 (100.0%) | 247,557 (100.0%) |
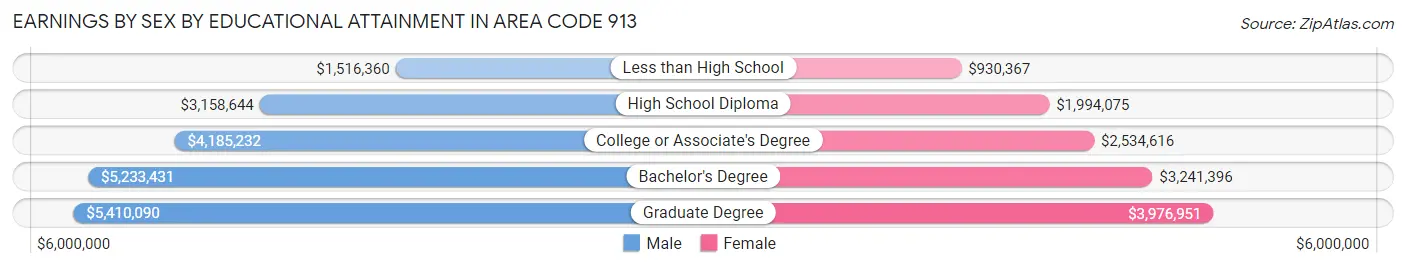
Earnings by Sex by Educational Attainment in Area Code 913
Average earnings in Area Code 913 are $4,682,901 for men and $3,095,720 for women, a difference of 33.9%. Men with an educational attainment of graduate degree enjoy the highest average annual earnings of $5,410,090, while those with less than high school education earn the least with $1,516,360. Women with an educational attainment of graduate degree earn the most with the average annual earnings of $3,976,951, while those with less than high school education have the smallest earnings of $930,367.
| Educational Attainment | Male Income | Female Income |
| Less than High School | $1,516,360 | $930,367 |
| High School Diploma | $3,158,644 | $1,994,075 |
| College or Associate's Degree | $4,185,232 | $2,534,616 |
| Bachelor's Degree | $5,233,431 | $3,241,396 |
| Graduate Degree | $5,410,090 | $3,976,951 |
| Total | $4,682,901 | $3,095,720 |
Family Income in Area Code 913
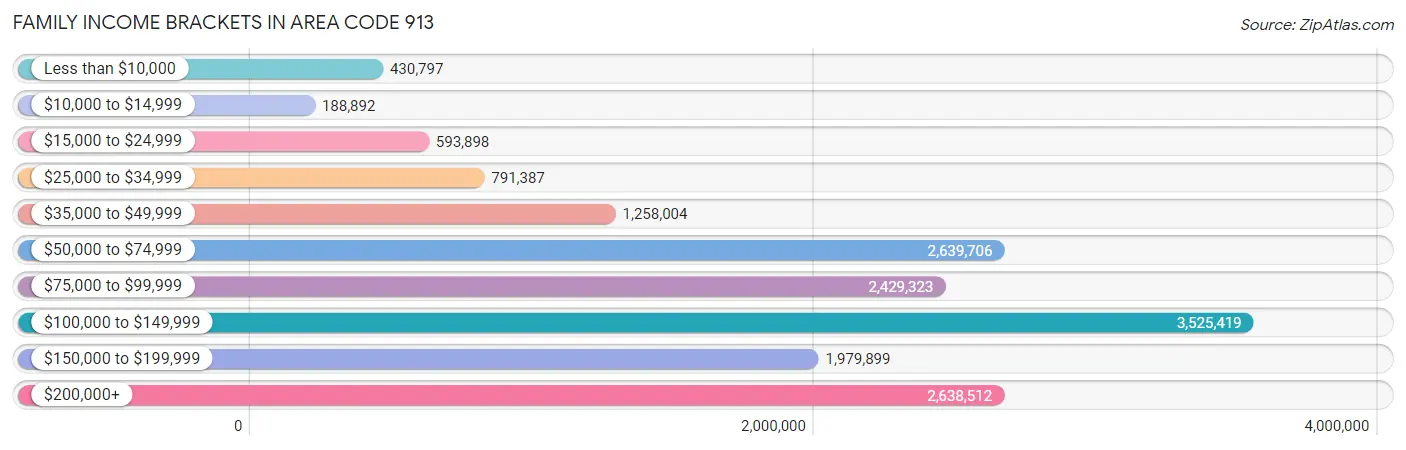
Family Income Brackets in Area Code 913
According to the Area Code 913 family income data, there are 3,525,419 families falling into the $100,000 to $149,999 income range, which is the most common income bracket and makes up 1,476.3% of all families. Conversely, the $10,000 to $14,999 income bracket is the least frequent group with only 188,892 families (79.1%) belonging to this category.
| Income Bracket | # Families | % Families |
| Less than $10,000 | 430,797 | 180.4% |
| $10,000 to $14,999 | 188,892 | 79.1% |
| $15,000 to $24,999 | 593,898 | 248.7% |
| $25,000 to $34,999 | 791,387 | 331.4% |
| $35,000 to $49,999 | 1,258,004 | 526.8% |
| $50,000 to $74,999 | 2,639,706 | 1,105.4% |
| $75,000 to $99,999 | 2,429,323 | 1,017.3% |
| $100,000 to $149,999 | 3,525,419 | 1,476.3% |
| $150,000 to $199,999 | 1,979,899 | 829.1% |
| $200,000+ | 2,638,512 | 1,104.9% |
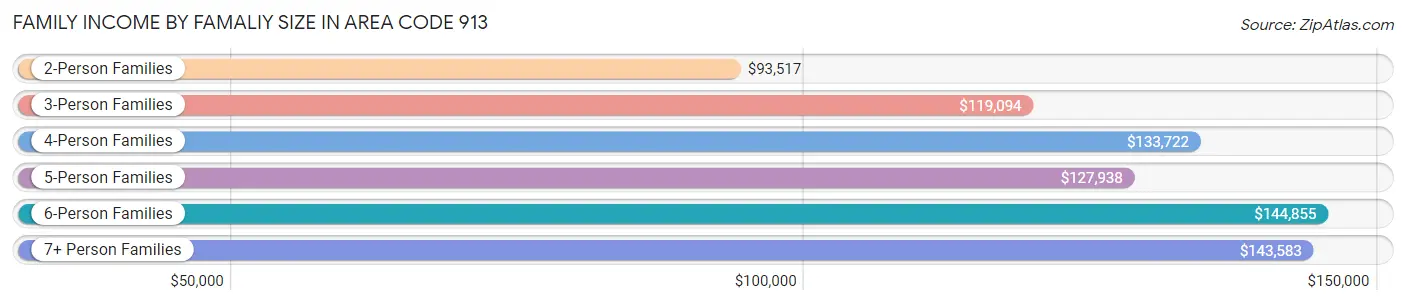
Family Income by Famaliy Size in Area Code 913
6-person families (7,079 | 3.0%) account for the highest median family income in Area Code 913 with $144,855 per family, while 2-person families (111,427 | 46.7%) have the highest median income of $46,759 per family member.
| Income Bracket | # Families | Median Income |
| 2-Person Families | 111,427 (46.7%) | $93,517 |
| 3-Person Families | 49,392 (20.7%) | $119,094 |
| 4-Person Families | 47,206 (19.8%) | $133,722 |
| 5-Person Families | 20,110 (8.4%) | $127,938 |
| 6-Person Families | 7,079 (3.0%) | $144,855 |
| 7+ Person Families | 3,587 (1.5%) | $143,583 |
| Total | 238,801 (100.0%) | $107,307 |
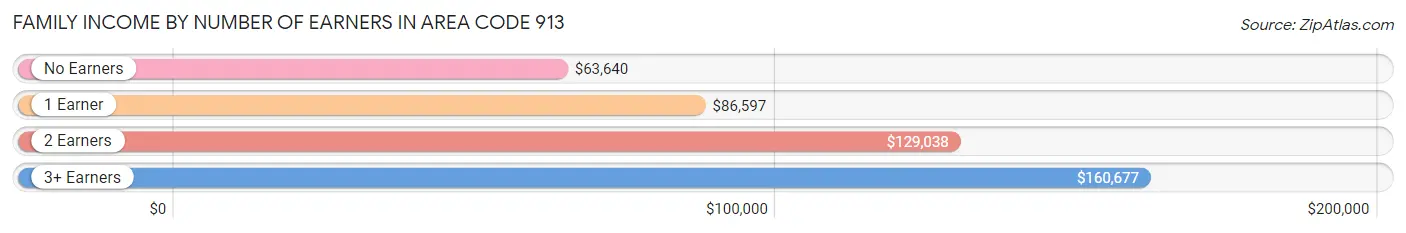
Family Income by Number of Earners in Area Code 913
The median family income in Area Code 913 is $107,307, with families comprising 3+ earners (30,500) having the highest median family income of $160,677, while families with no earners (28,285) have the lowest median family income of $63,640, accounting for 12.8% and 11.8% of families, respectively.
| Number of Earners | # Families | Median Income |
| No Earners | 28,285 (11.8%) | $63,640 |
| 1 Earner | 66,982 (28.1%) | $86,597 |
| 2 Earners | 113,034 (47.3%) | $129,038 |
| 3+ Earners | 30,500 (12.8%) | $160,677 |
| Total | 238,801 (100.0%) | $107,307 |
Household Income in Area Code 913
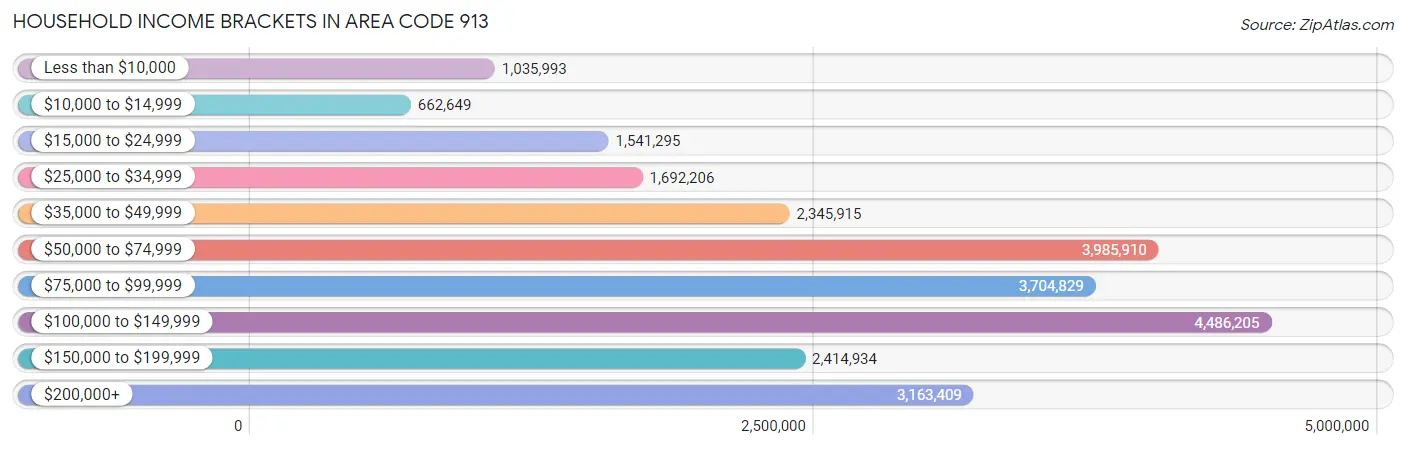
Household Income Brackets in Area Code 913
With 4,486,205 households falling in the category, the $100,000 to $149,999 income range is the most frequent in Area Code 913, accounting for 1,254.5% of all households. In contrast, only 662,649 households (185.3%) fall into the $10,000 to $14,999 income bracket, making it the least populous group.
| Income Bracket | # Households | % Households |
| Less than $10,000 | 1,035,993 | 289.7% |
| $10,000 to $14,999 | 662,649 | 185.3% |
| $15,000 to $24,999 | 1,541,295 | 431.0% |
| $25,000 to $34,999 | 1,692,206 | 473.2% |
| $35,000 to $49,999 | 2,345,915 | 656.0% |
| $50,000 to $74,999 | 3,985,910 | 1,114.6% |
| $75,000 to $99,999 | 3,704,829 | 1,036.0% |
| $100,000 to $149,999 | 4,486,205 | 1,254.5% |
| $150,000 to $199,999 | 2,414,934 | 675.3% |
| $200,000+ | 3,163,409 | 884.6% |
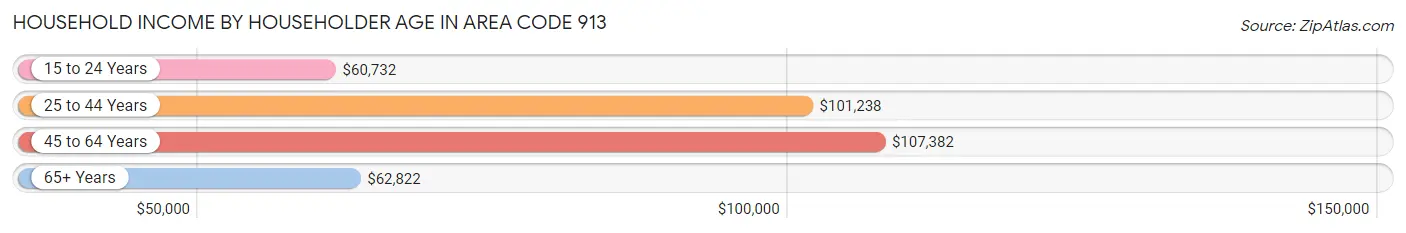
Household Income by Householder Age in Area Code 913
The median household income in Area Code 913 is $89,773, with the highest median household income of $107,382 found in the 45 to 64 years age bracket for the primary householder. A total of 130,713 households (36.5%) fall into this category. Meanwhile, the 15 to 24 years age bracket for the primary householder has the lowest median household income of $60,732, with 14,885 households (4.2%) in this group.
| Income Bracket | # Households | Median Income |
| 15 to 24 Years | 14,885 (4.2%) | $60,732 |
| 25 to 44 Years | 124,890 (34.9%) | $101,238 |
| 45 to 64 Years | 130,713 (36.5%) | $107,382 |
| 65+ Years | 87,121 (24.4%) | $62,822 |
| Total | 357,609 (100.0%) | $89,773 |
Poverty in Area Code 913
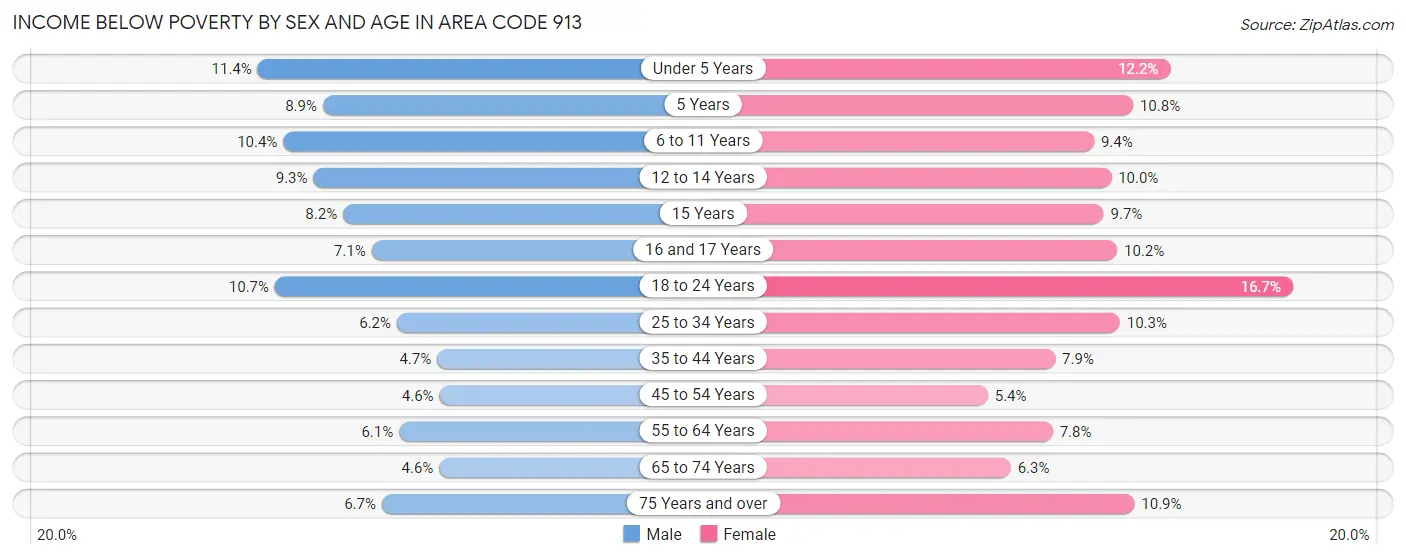
Income Below Poverty by Sex and Age in Area Code 913
With 7.0% poverty level for males and 9.2% for females among the residents of Area Code 913, under 5 year old males and 18 to 24 year old females are the most vulnerable to poverty, with 3,291 males (11.4%) and 6,169 females (16.7%) in their respective age groups living below the poverty level.
| Age Bracket | Male | Female |
| Under 5 Years | 3,291 (11.4%) | 3,431 (12.2%) |
| 5 Years | 568 (8.9%) | 590 (10.8%) |
| 6 to 11 Years | 3,952 (10.4%) | 3,453 (9.4%) |
| 12 to 14 Years | 1,848 (9.3%) | 1,900 (10.0%) |
| 15 Years | 563 (8.2%) | 614 (9.7%) |
| 16 and 17 Years | 963 (7.1%) | 1,318 (10.2%) |
| 18 to 24 Years | 4,207 (10.7%) | 6,169 (16.7%) |
| 25 to 34 Years | 3,825 (6.2%) | 6,172 (10.3%) |
| 35 to 44 Years | 3,012 (4.7%) | 5,015 (7.9%) |
| 45 to 54 Years | 2,666 (4.6%) | 3,036 (5.4%) |
| 55 to 64 Years | 3,402 (6.1%) | 4,570 (7.8%) |
| 65 to 74 Years | 1,804 (4.6%) | 2,754 (6.3%) |
| 75 Years and over | 1,474 (6.7%) | 3,331 (10.9%) |
| Total | 31,575 (7.0%) | 42,353 (9.2%) |
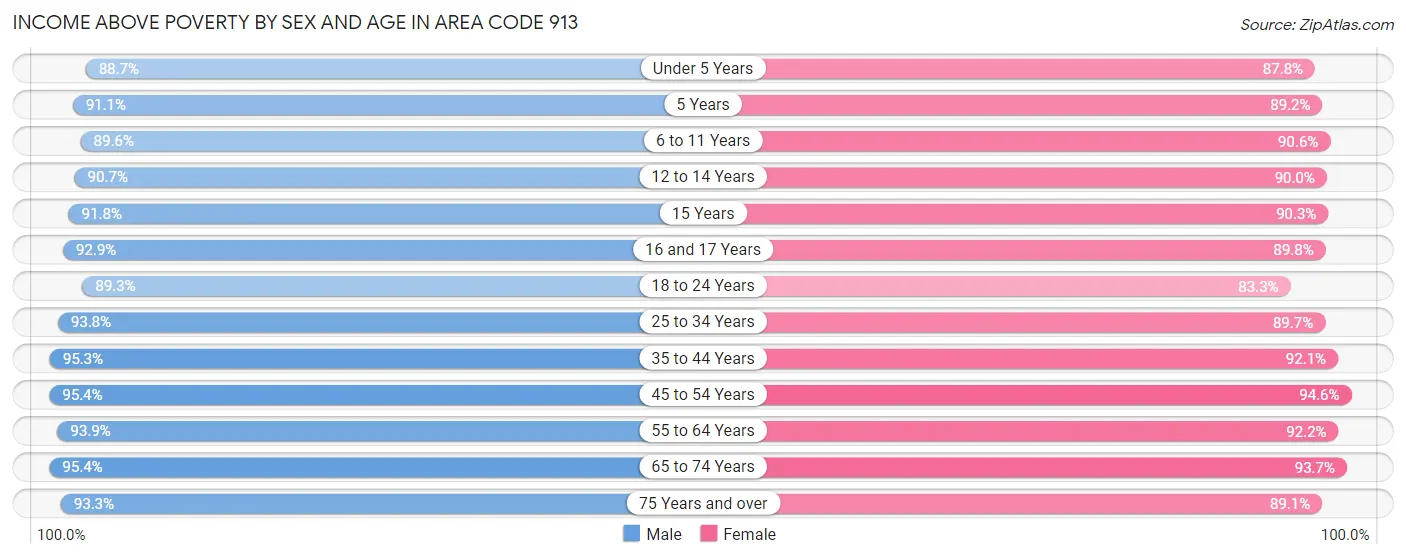
Income Above Poverty by Sex and Age in Area Code 913
According to the poverty statistics in Area Code 913, males aged 45 to 54 years and females aged 45 to 54 years are the age groups that are most secure financially, with 95.4% of males and 94.6% of females in these age groups living above the poverty line.
| Age Bracket | Male | Female |
| Under 5 Years | 25,702 (88.6%) | 24,722 (87.8%) |
| 5 Years | 5,792 (91.1%) | 4,870 (89.2%) |
| 6 to 11 Years | 34,031 (89.6%) | 33,447 (90.6%) |
| 12 to 14 Years | 18,070 (90.7%) | 17,107 (90.0%) |
| 15 Years | 6,316 (91.8%) | 5,700 (90.3%) |
| 16 and 17 Years | 12,560 (92.9%) | 11,582 (89.8%) |
| 18 to 24 Years | 35,058 (89.3%) | 30,686 (83.3%) |
| 25 to 34 Years | 58,052 (93.8%) | 53,644 (89.7%) |
| 35 to 44 Years | 61,156 (95.3%) | 58,319 (92.1%) |
| 45 to 54 Years | 55,338 (95.4%) | 52,991 (94.6%) |
| 55 to 64 Years | 52,410 (93.9%) | 53,810 (92.2%) |
| 65 to 74 Years | 37,289 (95.4%) | 41,203 (93.7%) |
| 75 Years and over | 20,384 (93.3%) | 27,346 (89.1%) |
| Total | 422,158 (93.0%) | 415,427 (90.7%) |
Income Below Poverty Among Married-Couple Families in Area Code 913
The poverty statistics for married-couple families in Area Code 913 show that 2.8% or 5,366 of the total 190,031 families live below the poverty line. Families with 5 or more children have the highest poverty rate of 11.3%, comprising of 165 families. On the other hand, families with no children have the lowest poverty rate of 2.4%, which includes 2,499 families.

| Children | Above Poverty | Below Poverty |
| No Children | 102,913 (97.6%) | 2,499 (2.4%) |
| 1 or 2 Children | 63,125 (97.5%) | 1,652 (2.5%) |
| 3 or 4 Children | 17,325 (94.3%) | 1,050 (5.7%) |
| 5 or more Children | 1,302 (88.7%) | 165 (11.3%) |
| Total | 184,665 (97.2%) | 5,366 (2.8%) |
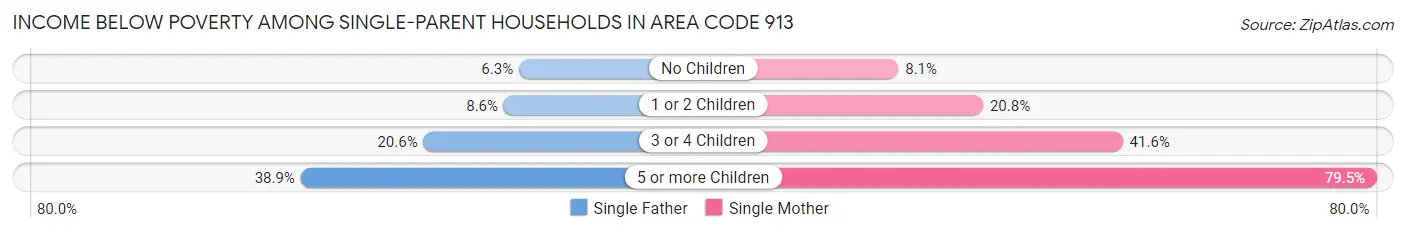
Income Below Poverty Among Single-Parent Households in Area Code 913
According to the poverty data in Area Code 913, 9.1% or 1,407 single-father households and 19.1% or 6,362 single-mother households are living below the poverty line. Among single-father households, those with 5 or more children have the highest poverty rate, with 82 households (38.9%) experiencing poverty. Likewise, among single-mother households, those with 5 or more children have the highest poverty rate, with 236 households (79.5%) falling below the poverty line.
| Children | Single Father | Single Mother |
| No Children | 414 (6.3%) | 964 (8.1%) |
| 1 or 2 Children | 627 (8.6%) | 3,639 (20.8%) |
| 3 or 4 Children | 284 (20.6%) | 1,523 (41.6%) |
| 5 or more Children | 82 (38.9%) | 236 (79.5%) |
| Total | 1,407 (9.1%) | 6,362 (19.1%) |
Income Below Poverty Among Married-Couple vs Single-Parent Households in Area Code 913
The poverty data for Area Code 913 shows that 5,366 of the married-couple family households (2.8%) and 7,769 of the single-parent households (15.9%) are living below the poverty level. Within the married-couple family households, those with 5 or more children have the highest poverty rate, with 165 households (11.3%) falling below the poverty line. Among the single-parent households, those with 5 or more children have the highest poverty rate, with 318 household (62.6%) living below poverty.
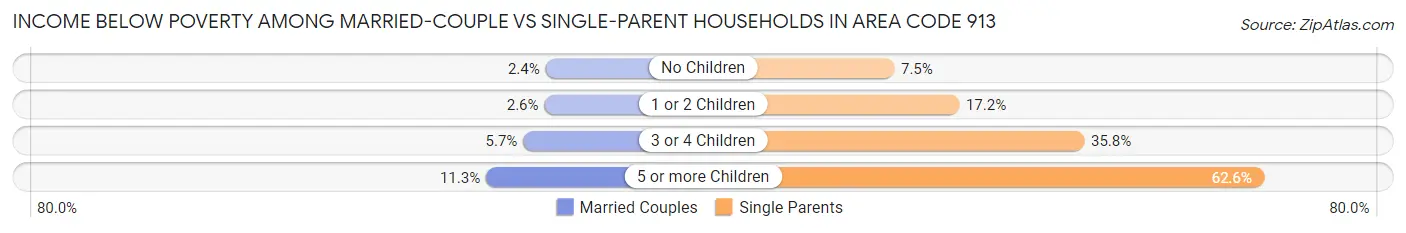
| Children | Married-Couple Families | Single-Parent Households |
| No Children | 2,499 (2.4%) | 1,378 (7.5%) |
| 1 or 2 Children | 1,652 (2.5%) | 4,266 (17.2%) |
| 3 or 4 Children | 1,050 (5.7%) | 1,807 (35.8%) |
| 5 or more Children | 165 (11.3%) | 318 (62.6%) |
| Total | 5,366 (2.8%) | 7,769 (15.9%) |
Race in Area Code 913
The most populous races in Area Code 913 are White / Caucasian (712,943 | 76.8%), Hispanic or Latino (108,786 | 11.7%), and Black / African American (71,319 | 7.7%).
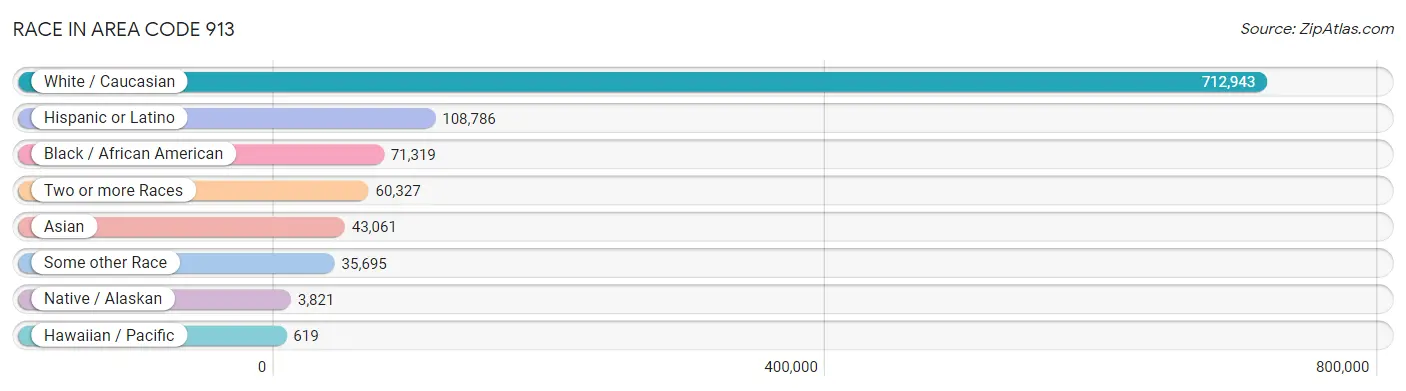
| Race | # Population | % Population |
| Asian | 43,061 | 4.6% |
| Black / African American | 71,319 | 7.7% |
| Hawaiian / Pacific | 619 | 0.1% |
| Hispanic or Latino | 108,786 | 11.7% |
| Native / Alaskan | 3,821 | 0.4% |
| White / Caucasian | 712,943 | 76.8% |
| Two or more Races | 60,327 | 6.5% |
| Some other Race | 35,695 | 3.8% |
| Total | 927,785 | 100.0% |
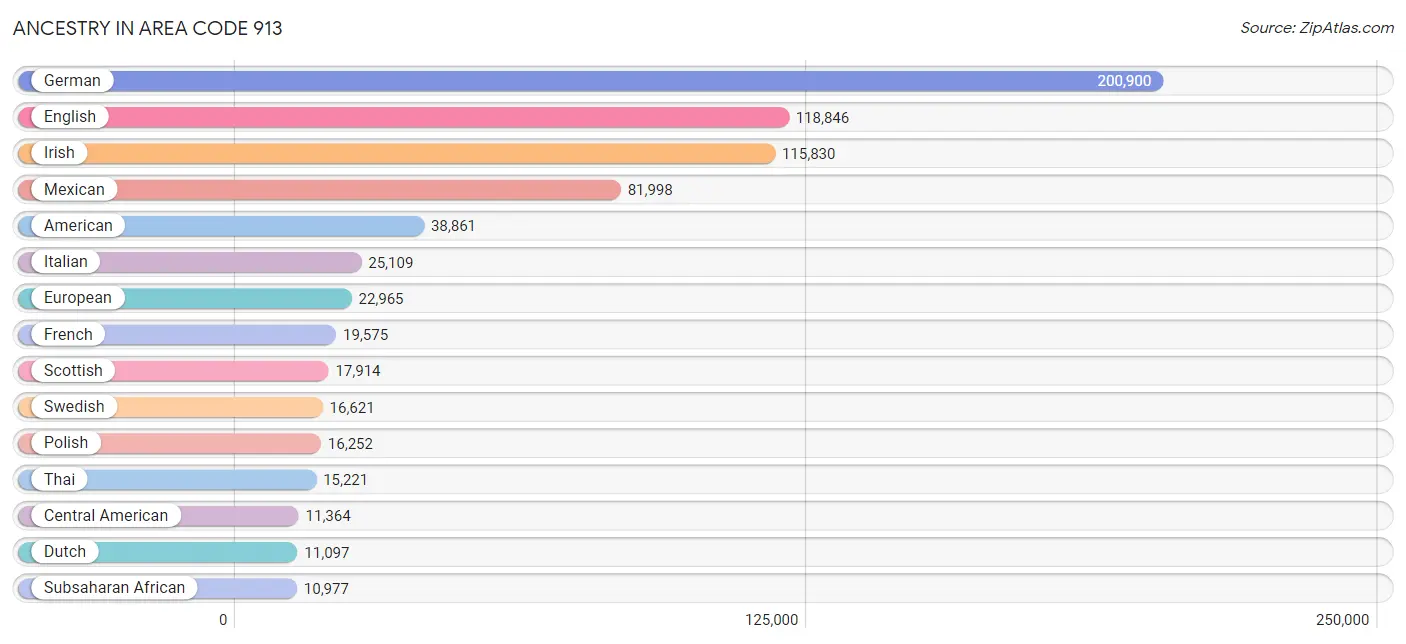
Ancestry in Area Code 913
The most populous ancestries reported in Area Code 913 are German (200,900 | 21.6%), English (118,846 | 12.8%), Irish (115,830 | 12.5%), Mexican (81,998 | 8.8%), and American (38,861 | 4.2%), together accounting for 60.0% of all Area Code 913 residents.
| Ancestry | # Population | % Population |
| Afghan | 789 | 0.1% |
| African | 5,356 | 0.6% |
| Alaska Native | 30 | 0.0% |
| Alaskan Athabascan | 27 | 0.0% |
| Albanian | 112 | 0.0% |
| Alsatian | 16 | 0.0% |
| American | 38,861 | 4.2% |
| Apache | 301 | 0.0% |
| Arab | 4,527 | 0.5% |
| Arapaho | 26 | 0.0% |
| Argentinean | 372 | 0.0% |
| Armenian | 369 | 0.0% |
| Australian | 163 | 0.0% |
| Austrian | 1,999 | 0.2% |
| Bahamian | 2 | 0.0% |
| Bangladeshi | 2,887 | 0.3% |
| Barbadian | 11 | 0.0% |
| Basque | 78 | 0.0% |
| Belgian | 2,580 | 0.3% |
| Bhutanese | 2,495 | 0.3% |
| Blackfeet | 1,053 | 0.1% |
| Bolivian | 157 | 0.0% |
| Brazilian | 1,033 | 0.1% |
| British | 6,515 | 0.7% |
| British West Indian | 17 | 0.0% |
| Bulgarian | 211 | 0.0% |
| Burmese | 3,823 | 0.4% |
| Cajun | 138 | 0.0% |
| Canadian | 998 | 0.1% |
| Carpatho Rusyn | 3 | 0.0% |
| Celtic | 317 | 0.0% |
| Central American | 11,364 | 1.2% |
| Central American Indian | 1,035 | 0.1% |
| Cherokee | 3,844 | 0.4% |
| Chickasaw | 170 | 0.0% |
| Chilean | 16 | 0.0% |
| Chinese | 7 | 0.0% |
| Chippewa | 193 | 0.0% |
| Choctaw | 620 | 0.1% |
| Colombian | 958 | 0.1% |
| Colville | 7 | 0.0% |
| Comanche | 80 | 0.0% |
| Costa Rican | 83 | 0.0% |
| Cree | 56 | 0.0% |
| Creek | 222 | 0.0% |
| Croatian | 3,728 | 0.4% |
| Crow | 154 | 0.0% |
| Cuban | 1,818 | 0.2% |
| Czech | 5,310 | 0.6% |
| Czechoslovakian | 764 | 0.1% |
| Danish | 5,250 | 0.6% |
| Delaware | 242 | 0.0% |
| Dominican | 584 | 0.1% |
| Dutch | 11,097 | 1.2% |
| Eastern European | 2,721 | 0.3% |
| Ecuadorian | 409 | 0.0% |
| Egyptian | 175 | 0.0% |
| English | 118,846 | 12.8% |
| Estonian | 24 | 0.0% |
| Ethiopian | 1,187 | 0.1% |
| European | 22,965 | 2.5% |
| Fijian | 159 | 0.0% |
| Filipino | 627 | 0.1% |
| Finnish | 623 | 0.1% |
| French | 19,575 | 2.1% |
| French American Indian | 47 | 0.0% |
| French Canadian | 1,960 | 0.2% |
| German | 200,900 | 21.6% |
| German Russian | 228 | 0.0% |
| Ghanaian | 450 | 0.1% |
| Greek | 1,826 | 0.2% |
| Guamanian / Chamorro | 242 | 0.0% |
| Guatemalan | 4,805 | 0.5% |
| Guyanese | 34 | 0.0% |
| Haitian | 511 | 0.1% |
| Honduran | 2,968 | 0.3% |
| Hopi | 31 | 0.0% |
| Hungarian | 2,229 | 0.2% |
| Icelander | 67 | 0.0% |
| Indian (Asian) | 8,573 | 0.9% |
| Indonesian | 3,381 | 0.4% |
| Inupiat | 16 | 0.0% |
| Iranian | 1,363 | 0.2% |
| Iraqi | 440 | 0.1% |
| Irish | 115,830 | 12.5% |
| Iroquois | 303 | 0.0% |
| Israeli | 113 | 0.0% |
| Italian | 25,109 | 2.7% |
| Jamaican | 706 | 0.1% |
| Japanese | 106 | 0.0% |
| Jordanian | 606 | 0.1% |
| Kenyan | 1,704 | 0.2% |
| Kiowa | 33 | 0.0% |
| Korean | 3,492 | 0.4% |
| Laotian | 557 | 0.1% |
| Latvian | 121 | 0.0% |
| Lebanese | 1,064 | 0.1% |
| Liberian | 55 | 0.0% |
| Lithuanian | 896 | 0.1% |
| Luxembourger | 296 | 0.0% |
| Malaysian | 1,780 | 0.2% |
| Mexican | 81,998 | 8.8% |
| Mexican American Indian | 919 | 0.1% |
| Mongolian | 273 | 0.0% |
| Moroccan | 61 | 0.0% |
| Native Hawaiian | 486 | 0.1% |
| Navajo | 100 | 0.0% |
| New Zealander | 68 | 0.0% |
| Nicaraguan | 238 | 0.0% |
| Nigerian | 796 | 0.1% |
| Northern European | 1,787 | 0.2% |
| Norwegian | 10,695 | 1.1% |
| Okinawan | 36 | 0.0% |
| Osage | 325 | 0.0% |
| Ottawa | 9 | 0.0% |
| Pakistani | 1,114 | 0.1% |
| Palestinian | 546 | 0.1% |
| Panamanian | 514 | 0.1% |
| Paraguayan | 73 | 0.0% |
| Pennsylvania German | 410 | 0.0% |
| Peruvian | 939 | 0.1% |
| Polish | 16,252 | 1.8% |
| Portuguese | 920 | 0.1% |
| Potawatomi | 473 | 0.1% |
| Pueblo | 22 | 0.0% |
| Puerto Rican | 4,084 | 0.4% |
| Puget Sound Salish | 29 | 0.0% |
| Romanian | 644 | 0.1% |
| Russian | 5,333 | 0.6% |
| Salvadoran | 2,586 | 0.3% |
| Samoan | 120 | 0.0% |
| Scandinavian | 3,342 | 0.4% |
| Scotch-Irish | 9,052 | 1.0% |
| Scottish | 17,914 | 1.9% |
| Seminole | 96 | 0.0% |
| Senegalese | 40 | 0.0% |
| Serbian | 391 | 0.0% |
| Sioux | 575 | 0.1% |
| Slavic | 300 | 0.0% |
| Slovak | 681 | 0.1% |
| Slovene | 529 | 0.1% |
| Somali | 178 | 0.0% |
| South African | 163 | 0.0% |
| South American | 3,856 | 0.4% |
| South American Indian | 51 | 0.0% |
| Spaniard | 1,395 | 0.2% |
| Spanish | 1,171 | 0.1% |
| Spanish American | 15 | 0.0% |
| Sri Lankan | 4,073 | 0.4% |
| Subsaharan African | 10,977 | 1.2% |
| Sudanese | 68 | 0.0% |
| Swedish | 16,621 | 1.8% |
| Swiss | 3,758 | 0.4% |
| Syrian | 145 | 0.0% |
| Thai | 15,221 | 1.6% |
| Tlingit-Haida | 25 | 0.0% |
| Tohono O'Odham | 30 | 0.0% |
| Tongan | 5 | 0.0% |
| Trinidadian and Tobagonian | 34 | 0.0% |
| Turkish | 382 | 0.0% |
| Ugandan | 214 | 0.0% |
| Ukrainian | 1,895 | 0.2% |
| Uruguayan | 120 | 0.0% |
| Ute | 13 | 0.0% |
| Venezuelan | 649 | 0.1% |
| Vietnamese | 326 | 0.0% |
| Welsh | 7,380 | 0.8% |
| West Indian | 259 | 0.0% |
| Yaqui | 11 | 0.0% |
| Yugoslavian | 228 | 0.0% |
| Yup'ik | 45 | 0.0% | View All 171 Rows |
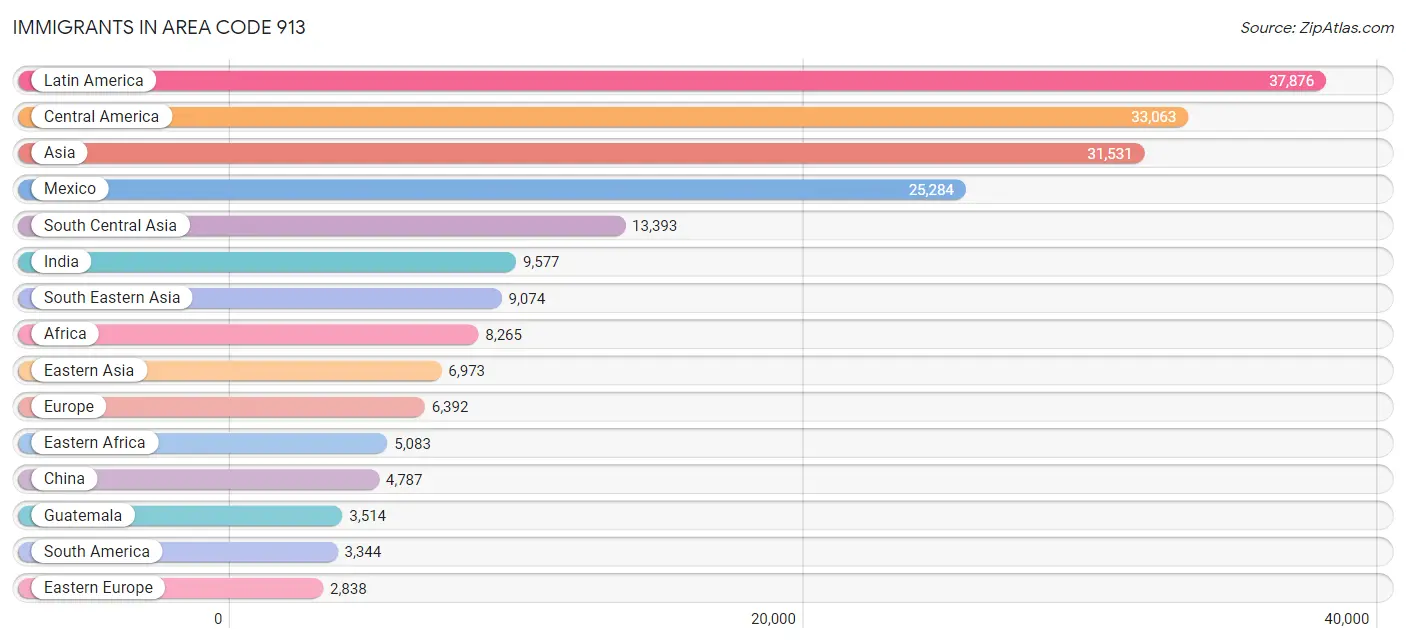
Immigrants in Area Code 913
The most numerous immigrant groups reported in Area Code 913 came from Latin America (37,876 | 4.1%), Central America (33,063 | 3.6%), Asia (31,531 | 3.4%), Mexico (25,284 | 2.7%), and South Central Asia (13,393 | 1.4%), together accounting for 15.2% of all Area Code 913 residents.
| Immigration Origin | # Population | % Population |
| Afghanistan | 577 | 0.1% |
| Africa | 8,265 | 0.9% |
| Albania | 50 | 0.0% |
| Argentina | 129 | 0.0% |
| Asia | 31,531 | 3.4% |
| Australia | 158 | 0.0% |
| Austria | 7 | 0.0% |
| Bahamas | 28 | 0.0% |
| Bangladesh | 543 | 0.1% |
| Barbados | 11 | 0.0% |
| Belarus | 93 | 0.0% |
| Belgium | 105 | 0.0% |
| Bolivia | 144 | 0.0% |
| Bosnia and Herzegovina | 76 | 0.0% |
| Brazil | 1,056 | 0.1% |
| Bulgaria | 132 | 0.0% |
| Cambodia | 28 | 0.0% |
| Cameroon | 73 | 0.0% |
| Canada | 960 | 0.1% |
| Caribbean | 1,469 | 0.2% |
| Central America | 33,063 | 3.6% |
| China | 4,787 | 0.5% |
| Colombia | 519 | 0.1% |
| Congo | 360 | 0.0% |
| Costa Rica | 36 | 0.0% |
| Croatia | 24 | 0.0% |
| Cuba | 491 | 0.1% |
| Czechoslovakia | 108 | 0.0% |
| Denmark | 9 | 0.0% |
| Dominican Republic | 190 | 0.0% |
| Eastern Africa | 5,083 | 0.5% |
| Eastern Asia | 6,973 | 0.7% |
| Eastern Europe | 2,838 | 0.3% |
| Ecuador | 352 | 0.0% |
| Egypt | 215 | 0.0% |
| El Salvador | 1,578 | 0.2% |
| England | 741 | 0.1% |
| Eritrea | 44 | 0.0% |
| Ethiopia | 1,423 | 0.2% |
| Europe | 6,392 | 0.7% |
| Fiji | 41 | 0.0% |
| France | 302 | 0.0% |
| Germany | 1,074 | 0.1% |
| Ghana | 389 | 0.0% |
| Greece | 47 | 0.0% |
| Guatemala | 3,514 | 0.4% |
| Guyana | 19 | 0.0% |
| Haiti | 346 | 0.0% |
| Honduras | 2,261 | 0.2% |
| Hong Kong | 330 | 0.0% |
| Hungary | 86 | 0.0% |
| India | 9,577 | 1.0% |
| Indonesia | 283 | 0.0% |
| Iran | 1,008 | 0.1% |
| Iraq | 570 | 0.1% |
| Ireland | 134 | 0.0% |
| Israel | 135 | 0.0% |
| Italy | 127 | 0.0% |
| Jamaica | 287 | 0.0% |
| Japan | 465 | 0.1% |
| Jordan | 462 | 0.1% |
| Kazakhstan | 16 | 0.0% |
| Kenya | 2,473 | 0.3% |
| Korea | 1,721 | 0.2% |
| Kuwait | 169 | 0.0% |
| Laos | 1,508 | 0.2% |
| Latin America | 37,876 | 4.1% |
| Lebanon | 107 | 0.0% |
| Liberia | 48 | 0.0% |
| Malaysia | 318 | 0.0% |
| Mexico | 25,284 | 2.7% |
| Micronesia | 236 | 0.0% |
| Middle Africa | 534 | 0.1% |
| Moldova | 290 | 0.0% |
| Nepal | 436 | 0.1% |
| Netherlands | 81 | 0.0% |
| Nicaragua | 132 | 0.0% |
| Nigeria | 441 | 0.1% |
| Northern Africa | 838 | 0.1% |
| Northern Europe | 1,502 | 0.2% |
| Norway | 33 | 0.0% |
| Oceania | 565 | 0.1% |
| Pakistan | 623 | 0.1% |
| Panama | 120 | 0.0% |
| Peru | 395 | 0.0% |
| Philippines | 1,674 | 0.2% |
| Poland | 89 | 0.0% |
| Portugal | 44 | 0.0% |
| Romania | 322 | 0.0% |
| Russia | 807 | 0.1% |
| Saudi Arabia | 243 | 0.0% |
| Scotland | 64 | 0.0% |
| Senegal | 37 | 0.0% |
| Serbia | 48 | 0.0% |
| Sierra Leone | 70 | 0.0% |
| Singapore | 68 | 0.0% |
| Somalia | 79 | 0.0% |
| South Africa | 267 | 0.0% |
| South America | 3,344 | 0.4% |
| South Central Asia | 13,393 | 1.4% |
| South Eastern Asia | 9,074 | 1.0% |
| Southern Europe | 429 | 0.1% |
| Spain | 211 | 0.0% |
| Sri Lanka | 127 | 0.0% |
| Sudan | 178 | 0.0% |
| Sweden | 5 | 0.0% |
| Switzerland | 37 | 0.0% |
| Syria | 89 | 0.0% |
| Taiwan | 941 | 0.1% |
| Thailand | 945 | 0.1% |
| Trinidad and Tobago | 5 | 0.0% |
| Turkey | 140 | 0.0% |
| Uganda | 299 | 0.0% |
| Ukraine | 570 | 0.1% |
| Uruguay | 53 | 0.0% |
| Uzbekistan | 81 | 0.0% |
| Venezuela | 604 | 0.1% |
| Vietnam | 2,157 | 0.2% |
| Western Africa | 1,125 | 0.1% |
| Western Asia | 2,080 | 0.2% |
| Western Europe | 1,623 | 0.2% |
| Yemen | 24 | 0.0% |
| Zaire | 75 | 0.0% |
| Zimbabwe | 31 | 0.0% | View All 124 Rows |
Sex and Age in Area Code 913
Sex and Age in Area Code 913
The most populous age groups in Area Code 913 are 35 to 39 Years (34,431 | 7.4%) for men and 35 to 39 Years (34,207 | 7.4%) for women.
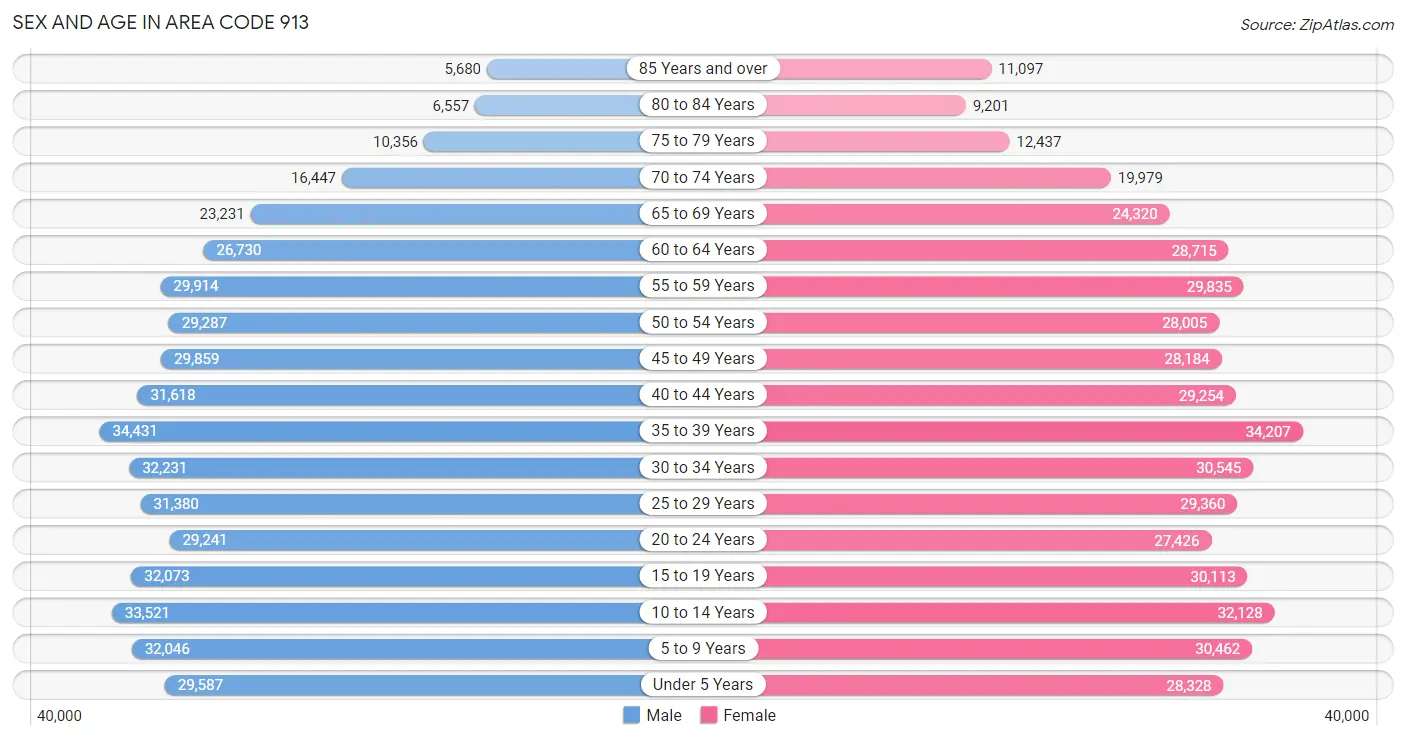
| Age Bracket | Male | Female |
| Under 5 Years | 29,587 (6.4%) | 28,328 (6.1%) |
| 5 to 9 Years | 32,046 (6.9%) | 30,462 (6.6%) |
| 10 to 14 Years | 33,521 (7.2%) | 32,128 (6.9%) |
| 15 to 19 Years | 32,073 (6.9%) | 30,113 (6.5%) |
| 20 to 24 Years | 29,241 (6.3%) | 27,426 (5.9%) |
| 25 to 29 Years | 31,380 (6.8%) | 29,360 (6.3%) |
| 30 to 34 Years | 32,231 (6.9%) | 30,545 (6.6%) |
| 35 to 39 Years | 34,431 (7.4%) | 34,207 (7.4%) |
| 40 to 44 Years | 31,618 (6.8%) | 29,254 (6.3%) |
| 45 to 49 Years | 29,859 (6.4%) | 28,184 (6.1%) |
| 50 to 54 Years | 29,287 (6.3%) | 28,005 (6.0%) |
| 55 to 59 Years | 29,914 (6.4%) | 29,835 (6.4%) |
| 60 to 64 Years | 26,730 (5.8%) | 28,715 (6.2%) |
| 65 to 69 Years | 23,231 (5.0%) | 24,320 (5.2%) |
| 70 to 74 Years | 16,447 (3.5%) | 19,979 (4.3%) |
| 75 to 79 Years | 10,356 (2.2%) | 12,437 (2.7%) |
| 80 to 84 Years | 6,557 (1.4%) | 9,201 (2.0%) |
| 85 Years and over | 5,680 (1.2%) | 11,097 (2.4%) |
| Total | 464,189 (100.0%) | 463,596 (100.0%) |
Families and Households in Area Code 913
Median Family Size in Area Code 913
The median family size in Area Code 913 is 3.10 persons per family, with married-couple families (190,031 | 79.6%) accounting for the largest median family size of 3.13536 persons per family. On the other hand, single male/father families (15,442 | 6.5%) represent the smallest median family size with 2.74 persons per family.
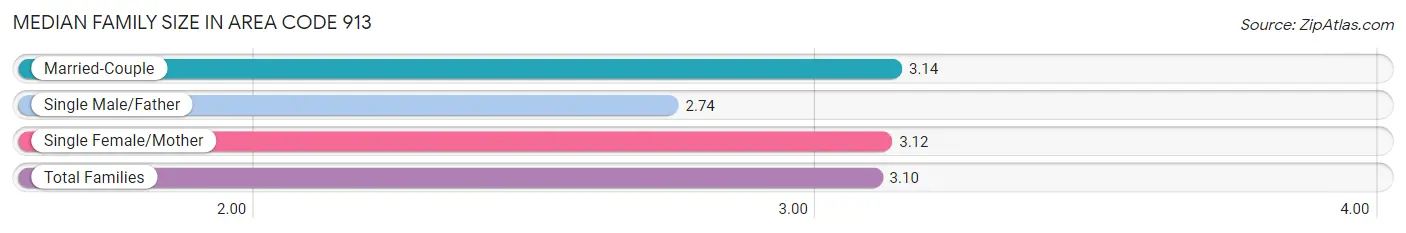
| Family Type | # Families | Family Size |
| Married-Couple | 190,031 (79.6%) | 3.14 |
| Single Male/Father | 15,442 (6.5%) | 2.74 |
| Single Female/Mother | 33,328 (14.0%) | 3.12 |
| Total Families | 238,801 (100.0%) | 3.10 |
Median Household Size in Area Code 913
The median household size in Area Code 913 is 2.58 persons per household, with single female/mother households (33,328 | 9.3%) accounting for the largest median household size of 3.33852 persons per household. non-family households (118,808 | 33.2%) represent the smallest median household size with 1.28 persons per household.
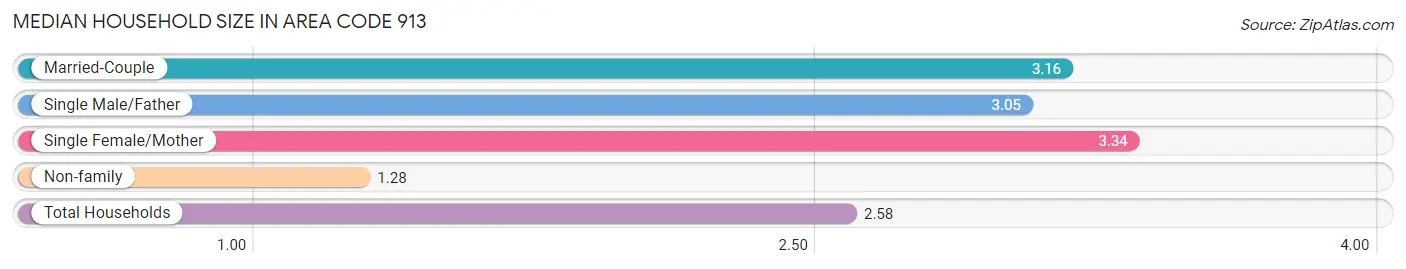
| Household Type | # Households | Household Size |
| Married-Couple | 190,031 (53.1%) | 3.16 |
| Single Male/Father | 15,442 (4.3%) | 3.05 |
| Single Female/Mother | 33,328 (9.3%) | 3.34 |
| Non-family | 118,808 (33.2%) | 1.28 |
| Total Households | 357,609 (100.0%) | 2.58 |
Household Size by Marriage Status in Area Code 913
Out of a total of 357,609 households in Area Code 913, 238,801 (66.8%) are family households, while 118,808 (33.2%) are nonfamily households. The most numerous type of family households are 2-person households, comprising 105,791, and the most common type of nonfamily households are 1-person households, comprising 96,875.
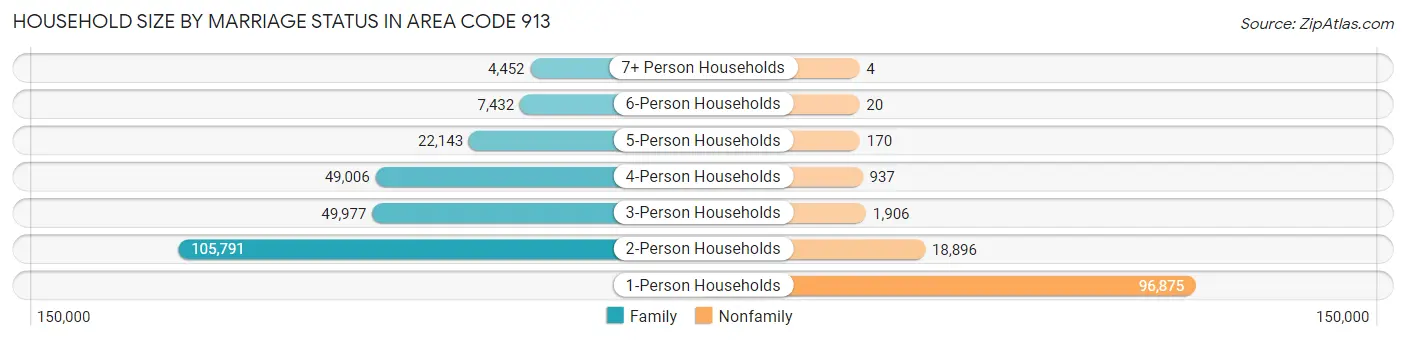
| Household Size | Family Households | Nonfamily Households |
| 1-Person Households | - | 96,875 (27.1%) |
| 2-Person Households | 105,791 (29.6%) | 18,896 (5.3%) |
| 3-Person Households | 49,977 (14.0%) | 1,906 (0.5%) |
| 4-Person Households | 49,006 (13.7%) | 937 (0.3%) |
| 5-Person Households | 22,143 (6.2%) | 170 (0.1%) |
| 6-Person Households | 7,432 (2.1%) | 20 (0.0%) |
| 7+ Person Households | 4,452 (1.2%) | 4 (0.0%) |
| Total | 238,801 (66.8%) | 118,808 (33.2%) |
Female Fertility in Area Code 913
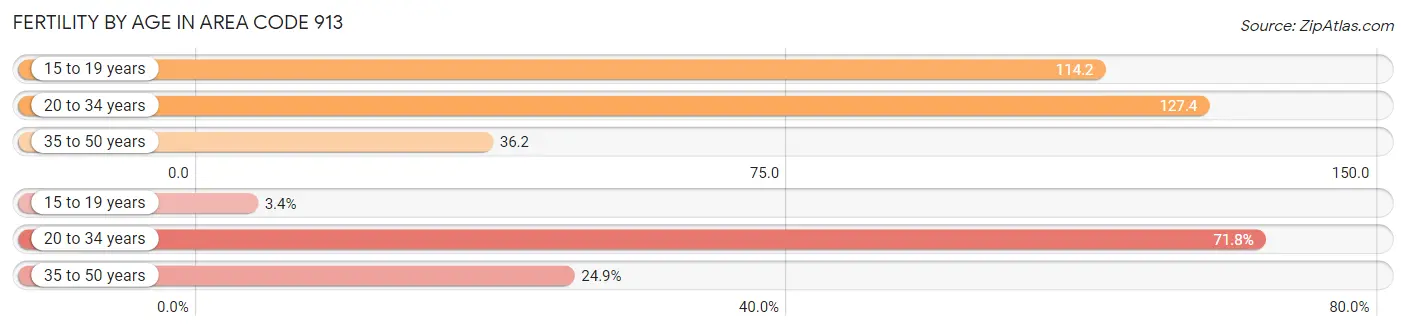
Fertility by Age in Area Code 913
Average fertility rate in Area Code 913 is 61.5 births per 1,000 women. Women in the age bracket of 20 to 34 years have the highest fertility rate with 127.4 births per 1,000 women. Women in the age bracket of 20 to 34 years acount for 71.8% of all women with births.
| Age Bracket | Women with Births | Births / 1,000 Women |
| 15 to 19 years | 414 (3.4%) | 114.2 |
| 20 to 34 years | 8,824 (71.8%) | 127.4 |
| 35 to 50 years | 3,056 (24.9%) | 36.2 |
| Total | 12,294 (100.0%) | 61.5 |
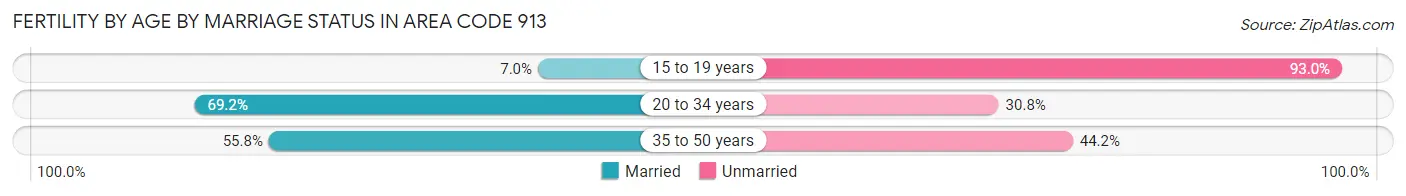
Fertility by Age by Marriage Status in Area Code 913
69.7% of women with births (12,294) in Area Code 913 are married. The highest percentage of unmarried women with births falls into 15 to 19 years age bracket with 93.0% of them unmarried at the time of birth, while the lowest percentage of unmarried women with births belong to 20 to 34 years age bracket with 30.8% of them unmarried.
| Age Bracket | Married | Unmarried |
| 15 to 19 years | 29 (7.0%) | 385 (93.0%) |
| 20 to 34 years | 6,106 (69.2%) | 2,718 (30.8%) |
| 35 to 50 years | 1,704 (55.8%) | 1,352 (44.2%) |
| Total | 8,574 (69.7%) | 3,720 (30.3%) |
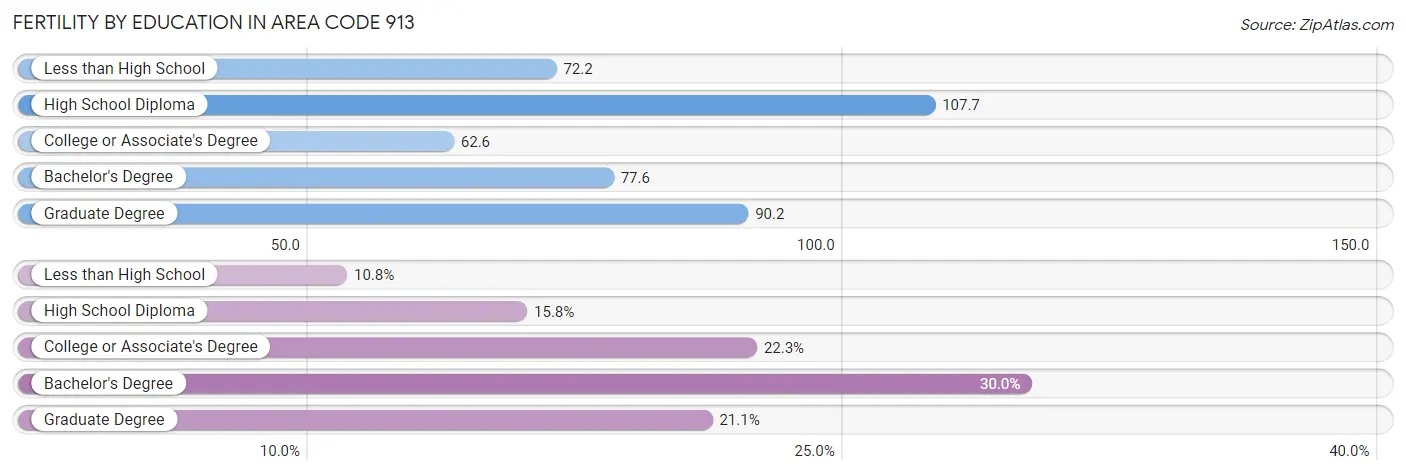
Fertility by Education in Area Code 913
Average fertility rate in Area Code 913 is 61.5 births per 1,000 women. Women with the education attainment of high school diploma have the highest fertility rate of 107.7 births per 1,000 women, while women with the education attainment of college or associate's degree have the lowest fertility at 62.6 births per 1,000 women. Women with the education attainment of bachelor's degree represent 30.0% of all women with births.
| Educational Attainment | Women with Births | Births / 1,000 Women |
| Less than High School | 1,325 (10.8%) | 72.2 |
| High School Diploma | 1,947 (15.8%) | 107.7 |
| College or Associate's Degree | 2,742 (22.3%) | 62.6 |
| Bachelor's Degree | 3,692 (30.0%) | 77.6 |
| Graduate Degree | 2,588 (21.0%) | 90.2 |
| Total | 12,294 (100.0%) | 61.5 |
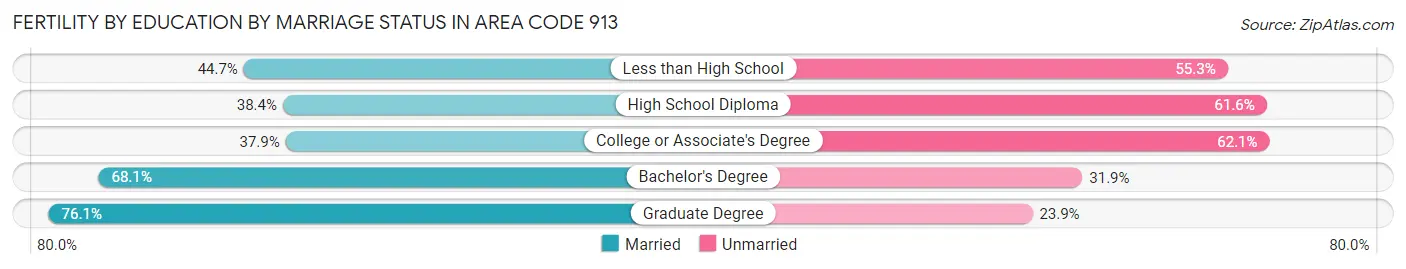
Fertility by Education by Marriage Status in Area Code 913
30.3% of women with births in Area Code 913 are unmarried. Women with the educational attainment of graduate degree are most likely to be married with 76.1% of them married at childbirth, while women with the educational attainment of college or associate's degree are least likely to be married with 62.1% of them unmarried at childbirth.
| Educational Attainment | Married | Unmarried |
| Less than High School | 592 (44.7%) | 733 (55.3%) |
| High School Diploma | 747 (38.4%) | 1,200 (61.6%) |
| College or Associate's Degree | 1,040 (37.9%) | 1,702 (62.1%) |
| Bachelor's Degree | 2,513 (68.1%) | 1,179 (31.9%) |
| Graduate Degree | 1,970 (76.1%) | 618 (23.9%) |
| Total | 8,574 (69.7%) | 3,720 (30.3%) |
Employment Characteristics in Area Code 913
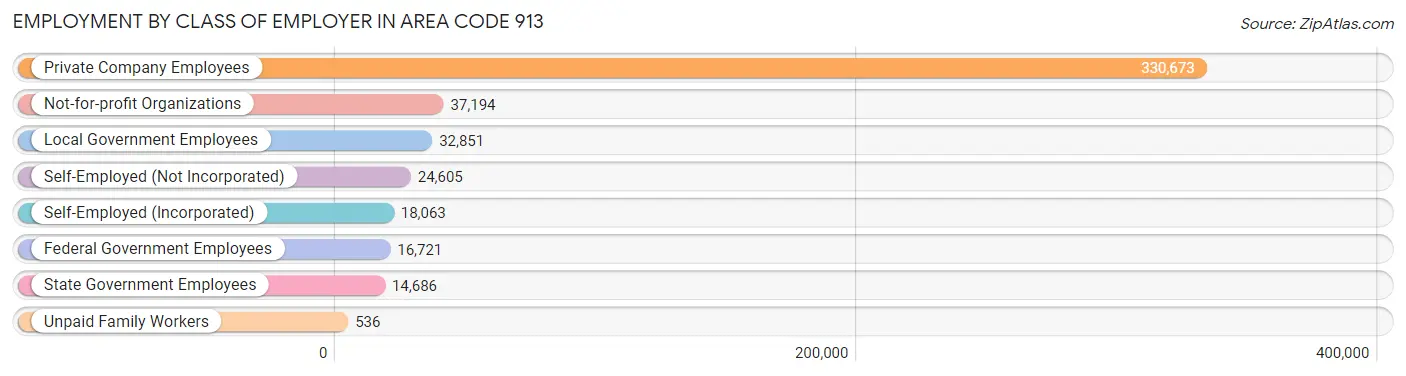
Employment by Class of Employer in Area Code 913
Among the 475,329 employed individuals in Area Code 913, private company employees (330,673 | 69.6%), not-for-profit organizations (37,194 | 7.8%), and local government employees (32,851 | 6.9%) make up the most common classes of employment.
| Employer Class | # Employees | % Employees |
| Private Company Employees | 330,673 | 69.6% |
| Self-Employed (Incorporated) | 18,063 | 3.8% |
| Self-Employed (Not Incorporated) | 24,605 | 5.2% |
| Not-for-profit Organizations | 37,194 | 7.8% |
| Local Government Employees | 32,851 | 6.9% |
| State Government Employees | 14,686 | 3.1% |
| Federal Government Employees | 16,721 | 3.5% |
| Unpaid Family Workers | 536 | 0.1% |
| Total | 475,329 | 100.0% |
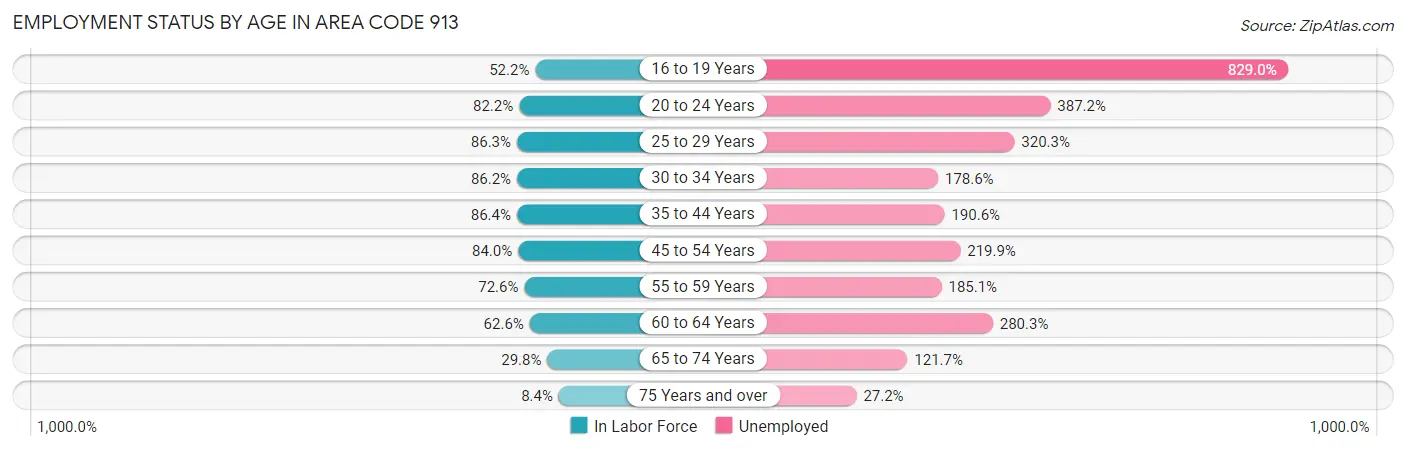
Employment Status by Age in Area Code 913
According to the labor force statistics for Area Code 913, out of the total population over 16 years of age (728,497), 66.3% or 482,775 individuals are in the labor force, with 3.9% or 18,683 of them unemployed. The age group with the highest labor force participation rate is 35 to 44 years, with 86.4% or 111,910 individuals in the labor force. Within the labor force, the 16 to 19 years age range has the highest percentage of unemployed individuals, with 829.0% or 211,992 of them being unemployed.
| Age Bracket | In Labor Force | Unemployed |
| 16 to 19 Years | 25,572 (52.2%) | 211,992 (829.0%) |
| 20 to 24 Years | 46,559 (82.2%) | 180,273 (387.2%) |
| 25 to 29 Years | 52,432 (86.3%) | 167,936 (320.3%) |
| 30 to 34 Years | 54,093 (86.2%) | 96,612 (178.6%) |
| 35 to 44 Years | 111,910 (86.4%) | 213,300 (190.6%) |
| 45 to 54 Years | 96,932 (84.0%) | 213,145 (219.9%) |
| 55 to 59 Years | 43,358 (72.6%) | 80,259 (185.1%) |
| 60 to 64 Years | 34,681 (62.5%) | 97,211 (280.3%) |
| 65 to 74 Years | 25,039 (29.8%) | 30,476 (121.7%) |
| 75 Years and over | 4,660 (8.4%) | 1,267 (27.2%) |
| Total | 482,806 (66.3%) | 18,687 (3.9%) |
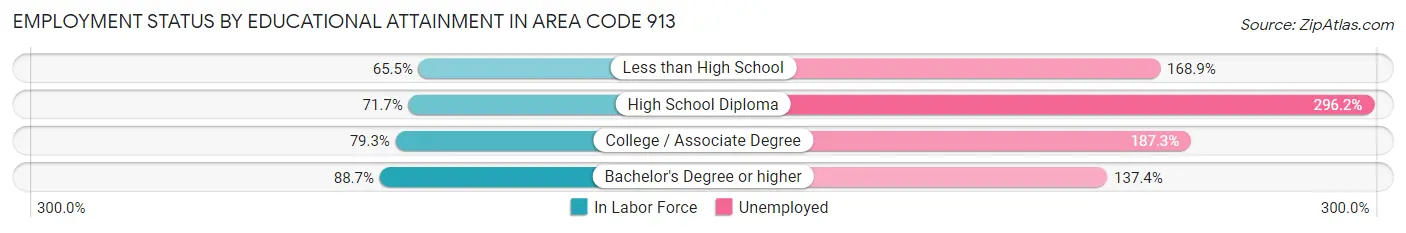
Employment Status by Educational Attainment in Area Code 913
According to labor force statistics for Area Code 913, 80.2% of individuals (387,956) out of the total population between 25 and 64 years of age (483,555) are in the labor force, with 208.8% or 810,052 of them being unemployed. The group with the highest labor force participation rate are those with the educational attainment of bachelor's degree or higher, with 88.7% or 205,951 individuals in the labor force. Within the labor force, individuals with high school diploma education have the highest percentage of unemployment, with 296.2% or 188,487 of them being unemployed.
| Educational Attainment | In Labor Force | Unemployed |
| Less than High School | 20,864 (65.5%) | 53,764 (168.9%) |
| High School Diploma | 63,638 (71.7%) | 263,067 (296.2%) |
| College / Associate Degree | 103,637 (79.3%) | 244,889 (187.3%) |
| Bachelor's Degree or higher | 205,945 (88.7%) | 318,991 (137.4%) |
| Total | 387,956 (80.2%) | 1,009,663 (208.8%) |
Employment Occupations by Sex in Area Code 913
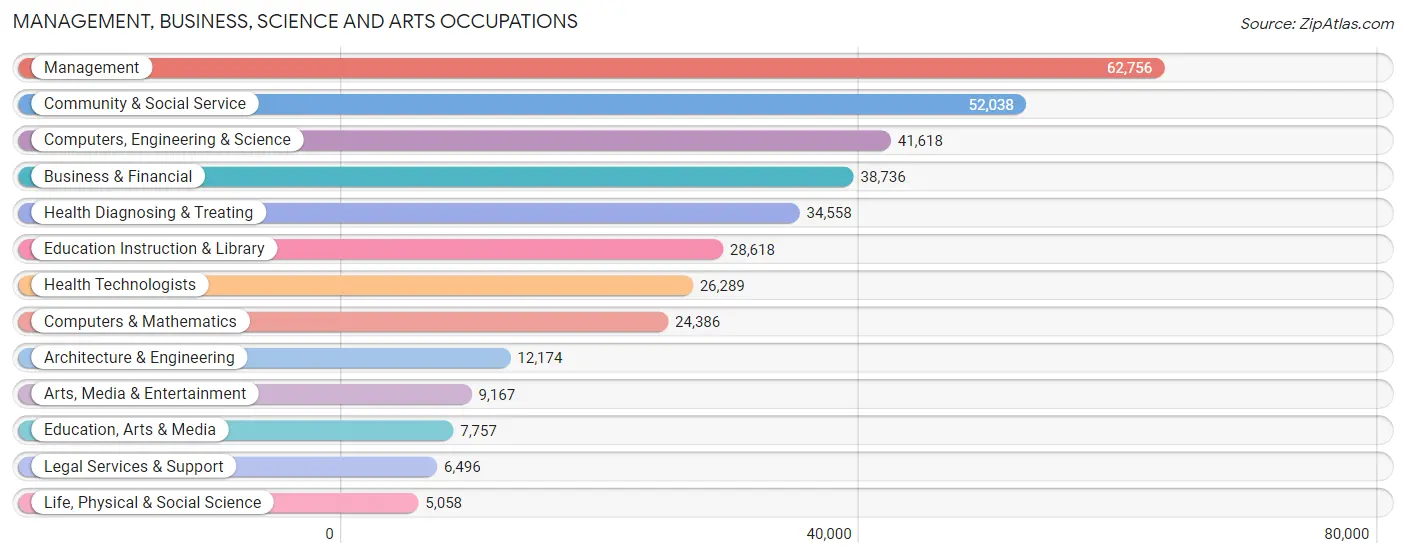
Management, Business, Science and Arts Occupations
The most common Management, Business, Science and Arts occupations in Area Code 913 are Management (62,756 | 13.0%), Community & Social Service (52,038 | 10.8%), Computers, Engineering & Science (41,618 | 8.6%), Business & Financial (38,736 | 8.1%), and Health Diagnosing & Treating (34,558 | 7.2%).
Management, Business, Science and Arts Occupations by Sex
Within the Management, Business, Science and Arts occupations in Area Code 913, the most male-oriented occupations are Architecture & Engineering (81.9%), Computers & Mathematics (75.9%), and Computers, Engineering & Science (74.9%), while the most female-oriented occupations are Education Instruction & Library (78.8%), Health Diagnosing & Treating (73.1%), and Health Technologists (72.6%).
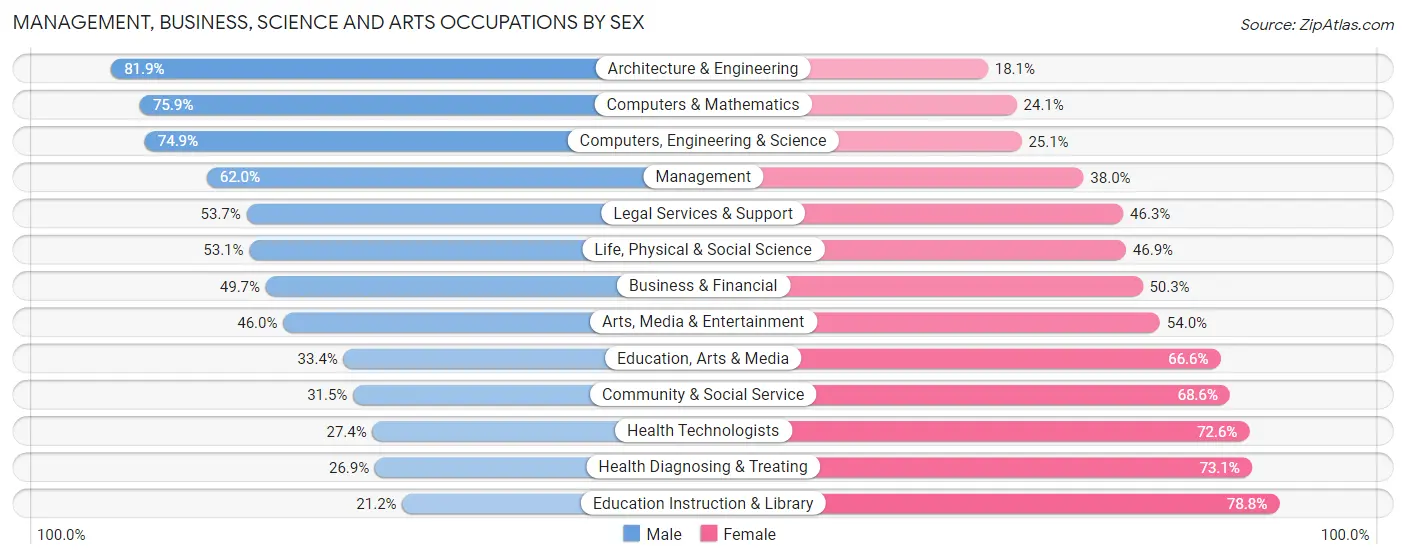
| Occupation | Male | Female |
| Management | 38,902 (62.0%) | 23,854 (38.0%) |
| Business & Financial | 19,242 (49.7%) | 19,494 (50.3%) |
| Computers, Engineering & Science | 31,175 (74.9%) | 10,443 (25.1%) |
| Computers & Mathematics | 18,514 (75.9%) | 5,872 (24.1%) |
| Architecture & Engineering | 9,974 (81.9%) | 2,200 (18.1%) |
| Life, Physical & Social Science | 2,687 (53.1%) | 2,371 (46.9%) |
| Community & Social Service | 16,367 (31.5%) | 35,671 (68.5%) |
| Education, Arts & Media | 2,594 (33.4%) | 5,163 (66.6%) |
| Legal Services & Support | 3,488 (53.7%) | 3,008 (46.3%) |
| Education Instruction & Library | 6,065 (21.2%) | 22,553 (78.8%) |
| Arts, Media & Entertainment | 4,220 (46.0%) | 4,947 (54.0%) |
| Health Diagnosing & Treating | 9,294 (26.9%) | 25,264 (73.1%) |
| Health Technologists | 7,206 (27.4%) | 19,083 (72.6%) |
| Total (Category) | 114,980 (50.1%) | 114,726 (49.9%) |
| Total (Overall) | 256,065 (53.2%) | 225,219 (46.8%) |
Services Occupations
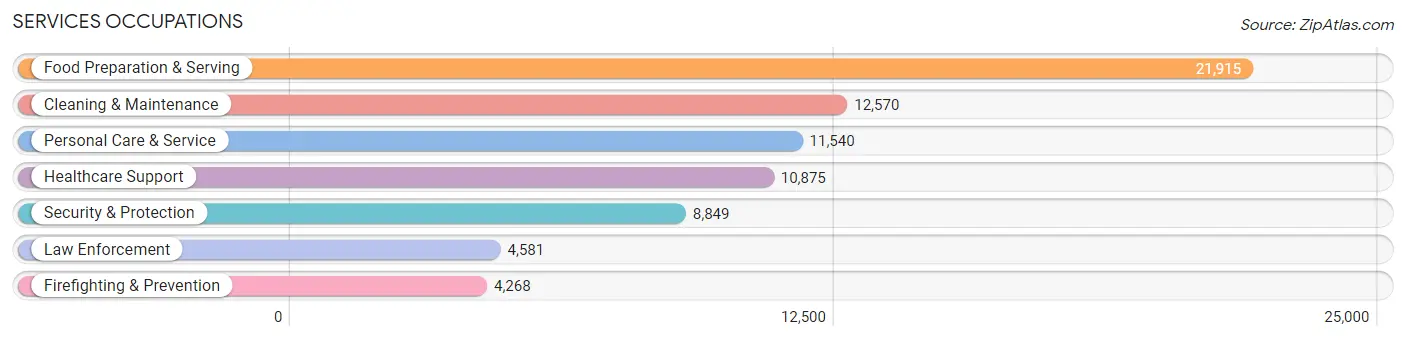
The most common Services occupations in Area Code 913 are Food Preparation & Serving (21,915 | 4.5%), Cleaning & Maintenance (12,570 | 2.6%), Personal Care & Service (11,540 | 2.4%), Healthcare Support (10,875 | 2.3%), and Security & Protection (8,849 | 1.8%).
Services Occupations by Sex
Within the Services occupations in Area Code 913, the most male-oriented occupations are Law Enforcement (83.0%), Security & Protection (77.3%), and Firefighting & Prevention (71.2%), while the most female-oriented occupations are Healthcare Support (87.3%), Personal Care & Service (79.4%), and Food Preparation & Serving (57.7%).
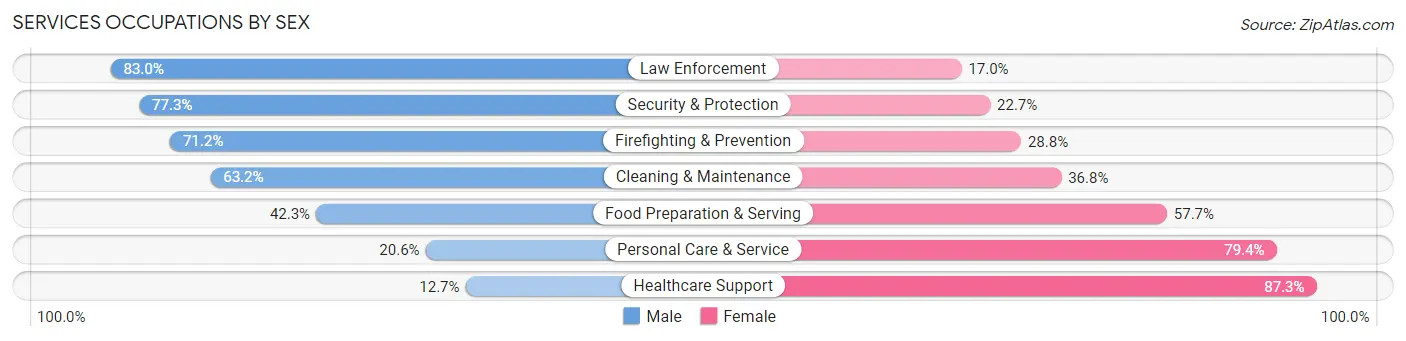
| Occupation | Male | Female |
| Healthcare Support | 1,383 (12.7%) | 9,492 (87.3%) |
| Security & Protection | 6,841 (77.3%) | 2,008 (22.7%) |
| Firefighting & Prevention | 3,039 (71.2%) | 1,229 (28.8%) |
| Law Enforcement | 3,802 (83.0%) | 779 (17.0%) |
| Food Preparation & Serving | 9,272 (42.3%) | 12,643 (57.7%) |
| Cleaning & Maintenance | 7,948 (63.2%) | 4,622 (36.8%) |
| Personal Care & Service | 2,381 (20.6%) | 9,159 (79.4%) |
| Total (Category) | 27,825 (42.3%) | 37,924 (57.7%) |
| Total (Overall) | 256,065 (53.2%) | 225,219 (46.8%) |
Sales and Office Occupations
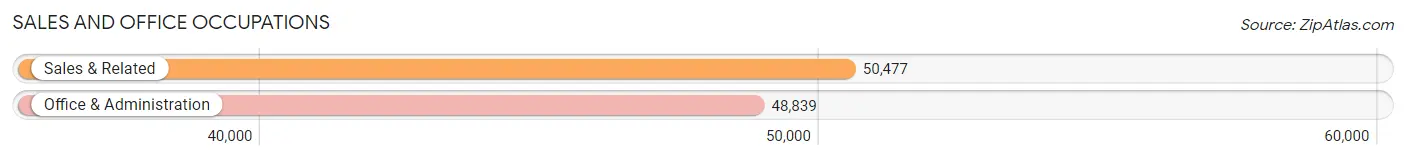
The most common Sales and Office occupations in Area Code 913 are Sales & Related (50,477 | 10.5%), and Office & Administration (48,839 | 10.2%).
Sales and Office Occupations by Sex
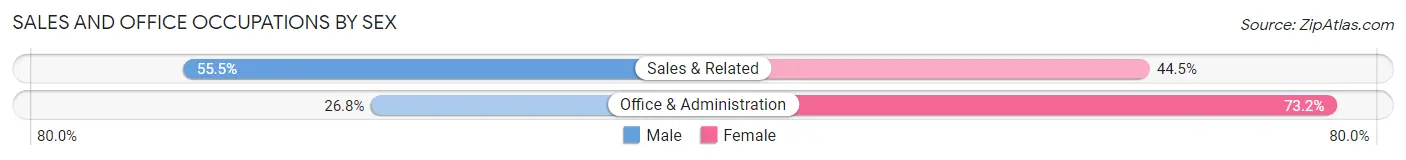
| Occupation | Male | Female |
| Sales & Related | 28,014 (55.5%) | 22,463 (44.5%) |
| Office & Administration | 13,100 (26.8%) | 35,739 (73.2%) |
| Total (Category) | 41,114 (41.4%) | 58,202 (58.6%) |
| Total (Overall) | 256,065 (53.2%) | 225,219 (46.8%) |
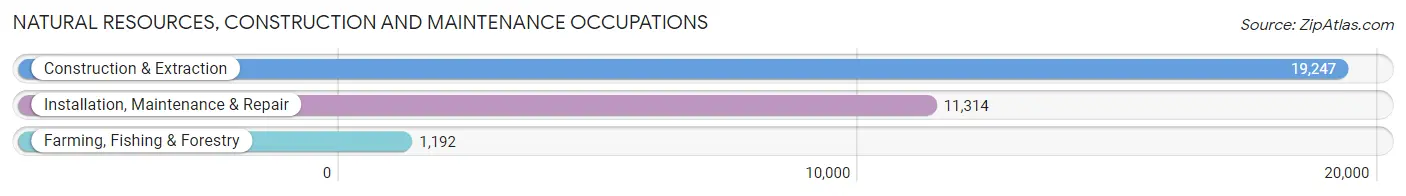
Natural Resources, Construction and Maintenance Occupations
The most common Natural Resources, Construction and Maintenance occupations in Area Code 913 are Construction & Extraction (19,247 | 4.0%), Installation, Maintenance & Repair (11,314 | 2.4%), and Farming, Fishing & Forestry (1,192 | 0.3%).
Natural Resources, Construction and Maintenance Occupations by Sex
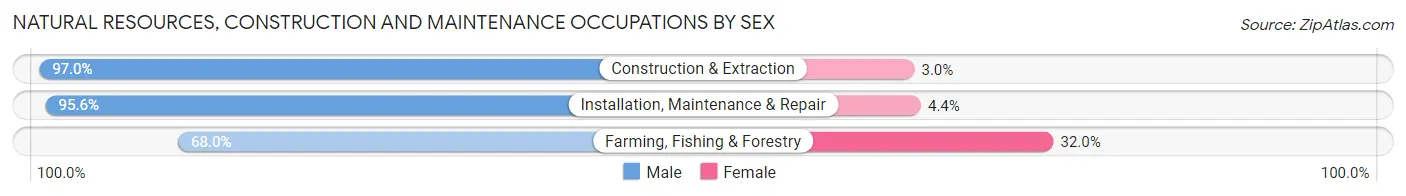
| Occupation | Male | Female |
| Farming, Fishing & Forestry | 811 (68.0%) | 381 (32.0%) |
| Construction & Extraction | 18,662 (97.0%) | 585 (3.0%) |
| Installation, Maintenance & Repair | 10,817 (95.6%) | 497 (4.4%) |
| Total (Category) | 30,290 (95.4%) | 1,463 (4.6%) |
| Total (Overall) | 256,065 (53.2%) | 225,219 (46.8%) |
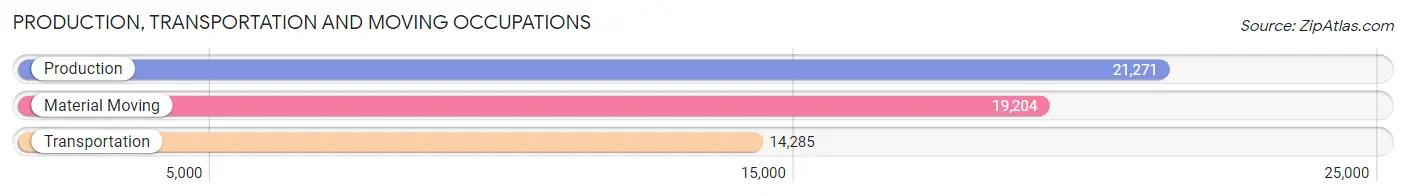
Production, Transportation and Moving Occupations
The most common Production, Transportation and Moving occupations in Area Code 913 are Production (21,271 | 4.4%), Material Moving (19,204 | 4.0%), and Transportation (14,285 | 3.0%).
Production, Transportation and Moving Occupations by Sex
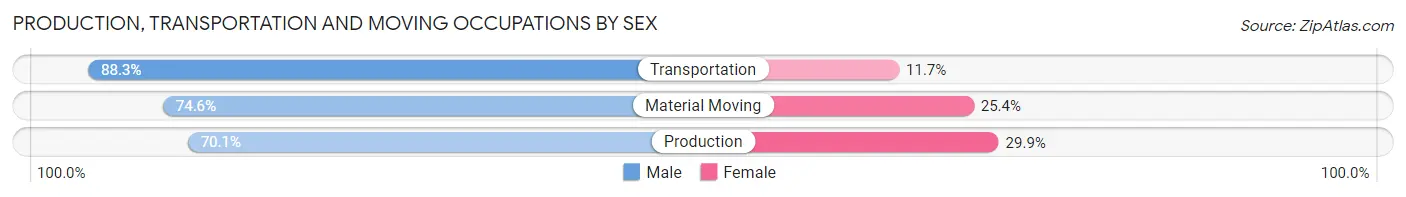
| Occupation | Male | Female |
| Production | 14,904 (70.1%) | 6,367 (29.9%) |
| Transportation | 12,620 (88.3%) | 1,665 (11.7%) |
| Material Moving | 14,332 (74.6%) | 4,872 (25.4%) |
| Total (Category) | 41,856 (76.4%) | 12,904 (23.6%) |
| Total (Overall) | 256,065 (53.2%) | 225,219 (46.8%) |
Employment Industries by Sex in Area Code 913
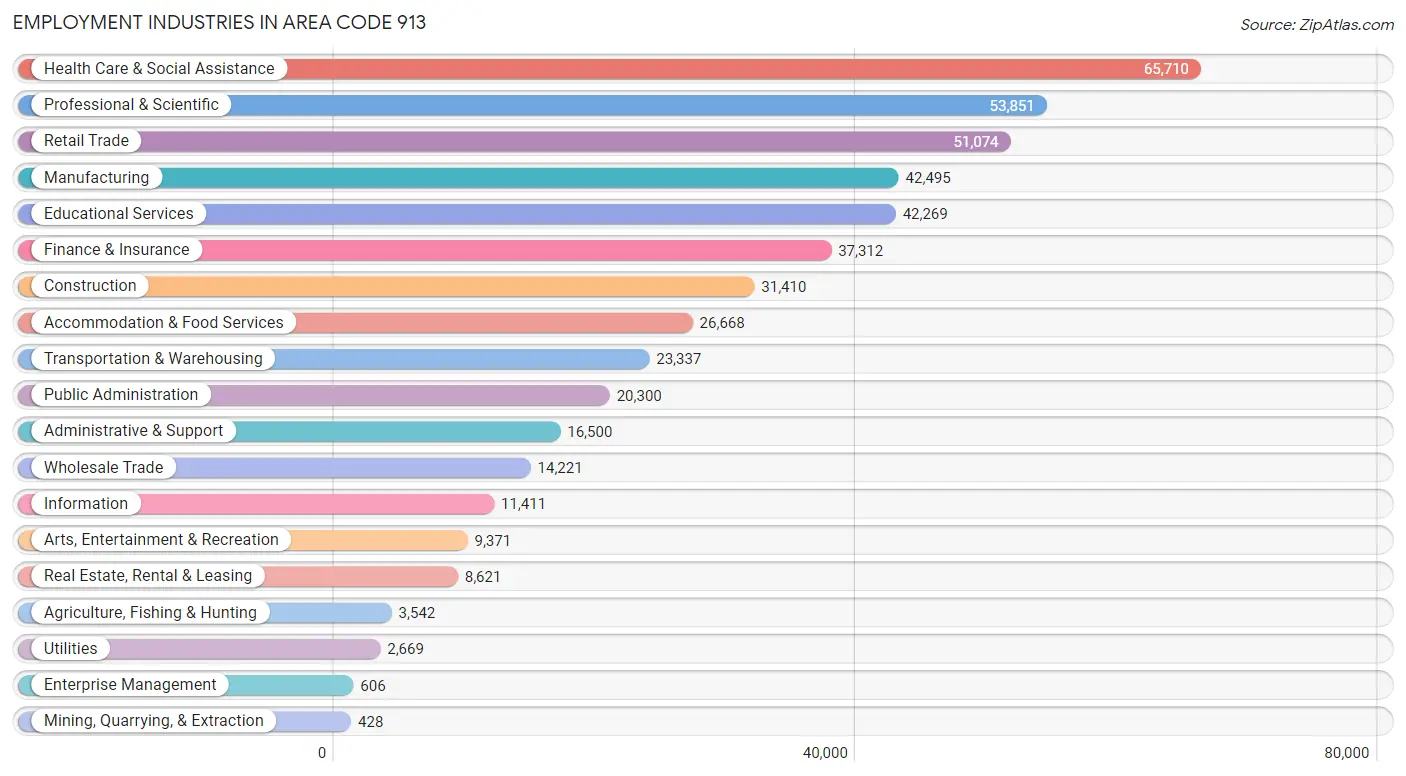
Employment Industries in Area Code 913
The major employment industries in Area Code 913 include Health Care & Social Assistance (65,710 | 13.7%), Professional & Scientific (53,851 | 11.2%), Retail Trade (51,074 | 10.6%), Manufacturing (42,495 | 8.8%), and Educational Services (42,269 | 8.8%).
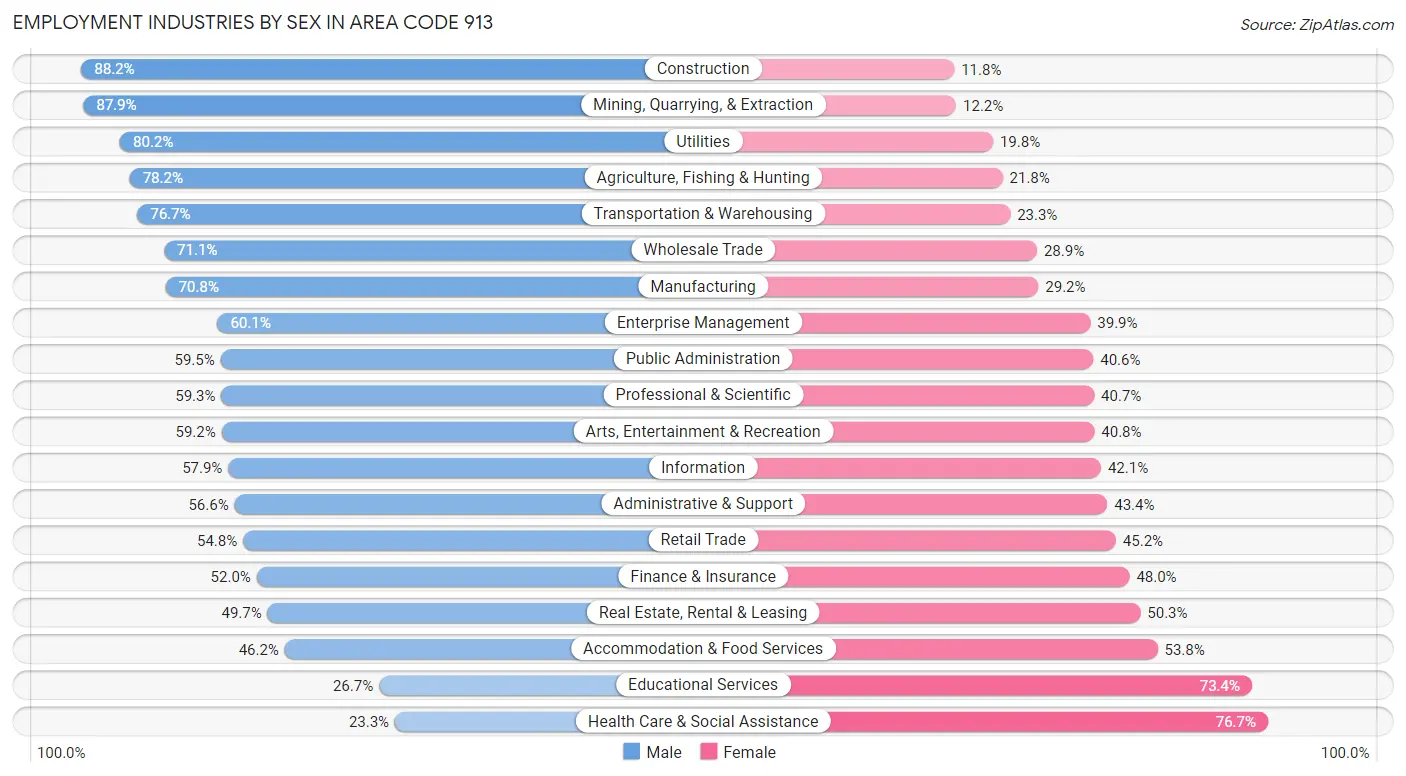
Employment Industries by Sex in Area Code 913
The Area Code 913 industries that see more men than women are Construction (88.2%), Mining, Quarrying, & Extraction (87.8%), and Utilities (80.2%), whereas the industries that tend to have a higher number of women are Health Care & Social Assistance (76.7%), Educational Services (73.4%), and Accommodation & Food Services (53.8%).
| Industry | Male | Female |
| Agriculture, Fishing & Hunting | 2,771 (78.2%) | 771 (21.8%) |
| Mining, Quarrying, & Extraction | 376 (87.8%) | 52 (12.1%) |
| Construction | 27,716 (88.2%) | 3,694 (11.8%) |
| Manufacturing | 30,098 (70.8%) | 12,397 (29.2%) |
| Wholesale Trade | 10,112 (71.1%) | 4,109 (28.9%) |
| Retail Trade | 27,976 (54.8%) | 23,098 (45.2%) |
| Transportation & Warehousing | 17,891 (76.7%) | 5,446 (23.3%) |
| Utilities | 2,141 (80.2%) | 528 (19.8%) |
| Information | 6,602 (57.9%) | 4,809 (42.1%) |
| Finance & Insurance | 19,390 (52.0%) | 17,922 (48.0%) |
| Real Estate, Rental & Leasing | 4,286 (49.7%) | 4,335 (50.3%) |
| Professional & Scientific | 31,930 (59.3%) | 21,921 (40.7%) |
| Enterprise Management | 364 (60.1%) | 242 (39.9%) |
| Administrative & Support | 9,332 (56.6%) | 7,168 (43.4%) |
| Educational Services | 11,266 (26.7%) | 31,003 (73.4%) |
| Health Care & Social Assistance | 15,339 (23.3%) | 50,371 (76.7%) |
| Arts, Entertainment & Recreation | 5,550 (59.2%) | 3,821 (40.8%) |
| Accommodation & Food Services | 12,309 (46.2%) | 14,359 (53.8%) |
| Public Administration | 12,069 (59.5%) | 8,231 (40.6%) |
| Total | 256,065 (53.2%) | 225,219 (46.8%) |
Education in Area Code 913
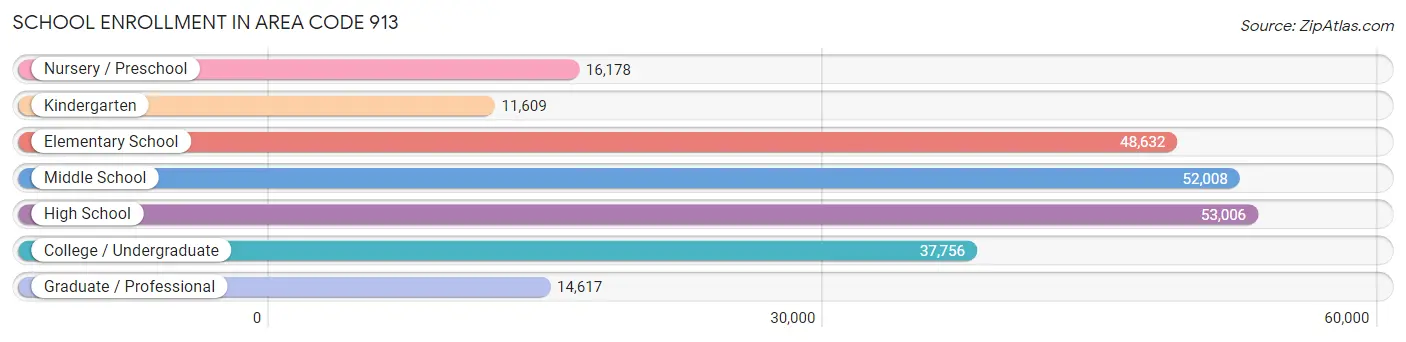
School Enrollment in Area Code 913
The most common levels of schooling among the 233,806 students in Area Code 913 are high school (53,006 | 22.7%), middle school (52,008 | 22.2%), and elementary school (48,632 | 20.8%).
| School Level | # Students | % Students |
| Nursery / Preschool | 16,178 | 6.9% |
| Kindergarten | 11,609 | 5.0% |
| Elementary School | 48,632 | 20.8% |
| Middle School | 52,008 | 22.2% |
| High School | 53,006 | 22.7% |
| College / Undergraduate | 37,756 | 16.2% |
| Graduate / Professional | 14,617 | 6.2% |
| Total | 233,806 | 100.0% |
School Enrollment by Age by Funding Source in Area Code 913
Out of a total of 233,806 students who are enrolled in schools in Area Code 913, 38,230 (16.4%) attend a private institution, while the remaining 195,576 (83.7%) are enrolled in public schools. The age group of 3 to 4 year olds has the highest likelihood of being enrolled in private schools, with 5,156 (44.4% in the age bracket) enrolled. Conversely, the age group of 15 to 17 year olds has the lowest likelihood of being enrolled in a private school, with 34,858 (89.9% in the age bracket) attending a public institution.
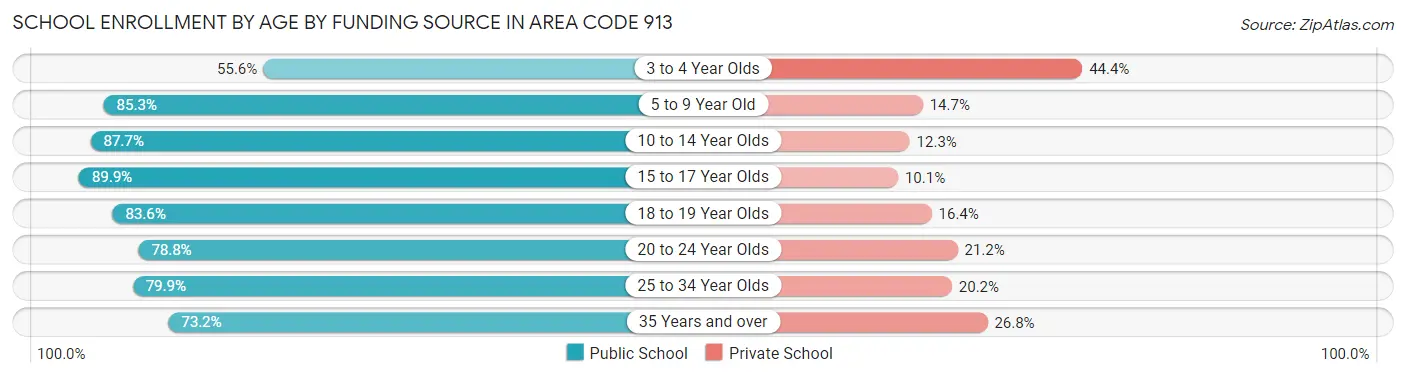
| Age Bracket | Public School | Private School |
| 3 to 4 Year Olds | 6,449 (55.6%) | 5,156 (44.4%) |
| 5 to 9 Year Old | 49,833 (85.3%) | 8,605 (14.7%) |
| 10 to 14 Year Olds | 56,287 (87.7%) | 7,884 (12.3%) |
| 15 to 17 Year Olds | 34,858 (89.9%) | 3,924 (10.1%) |
| 18 to 19 Year Olds | 13,904 (83.6%) | 2,723 (16.4%) |
| 20 to 24 Year Olds | 14,833 (78.8%) | 3,994 (21.2%) |
| 25 to 34 Year Olds | 10,270 (79.8%) | 2,591 (20.2%) |
| 35 Years and over | 9,149 (73.2%) | 3,346 (26.8%) |
| Total | 195,576 (83.7%) | 38,230 (16.4%) |
Educational Attainment by Field of Study in Area Code 913
Business (73,931 | 23.6%), education (36,785 | 11.7%), science & technology (33,937 | 10.8%), engineering (21,526 | 6.9%), and bio, nature & agricultural (19,892 | 6.4%) are the most common fields of study among 313,406 individuals in Area Code 913 who have obtained a bachelor's degree or higher.
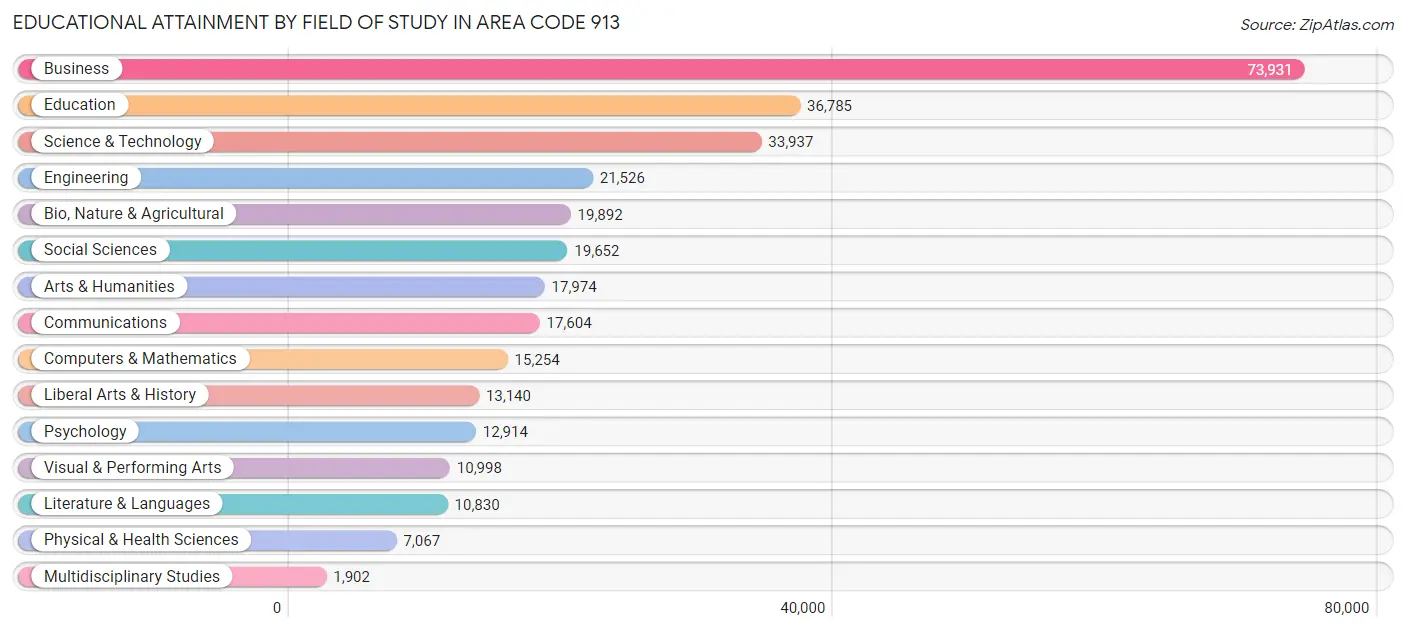
| Field of Study | # Graduates | % Graduates |
| Computers & Mathematics | 15,254 | 4.9% |
| Bio, Nature & Agricultural | 19,892 | 6.4% |
| Physical & Health Sciences | 7,067 | 2.2% |
| Psychology | 12,914 | 4.1% |
| Social Sciences | 19,652 | 6.3% |
| Engineering | 21,526 | 6.9% |
| Multidisciplinary Studies | 1,902 | 0.6% |
| Science & Technology | 33,937 | 10.8% |
| Business | 73,931 | 23.6% |
| Education | 36,785 | 11.7% |
| Literature & Languages | 10,830 | 3.5% |
| Liberal Arts & History | 13,140 | 4.2% |
| Visual & Performing Arts | 10,998 | 3.5% |
| Communications | 17,604 | 5.6% |
| Arts & Humanities | 17,974 | 5.7% |
| Total | 313,406 | 100.0% |
Transportation & Commute in Area Code 913
Vehicle Availability by Sex in Area Code 913
The most prevalent vehicle ownership categories in Area Code 913 are males with 2 vehicles (115,709, accounting for 45.5%) and females with 2 vehicles (95,932, making up 52.8%).
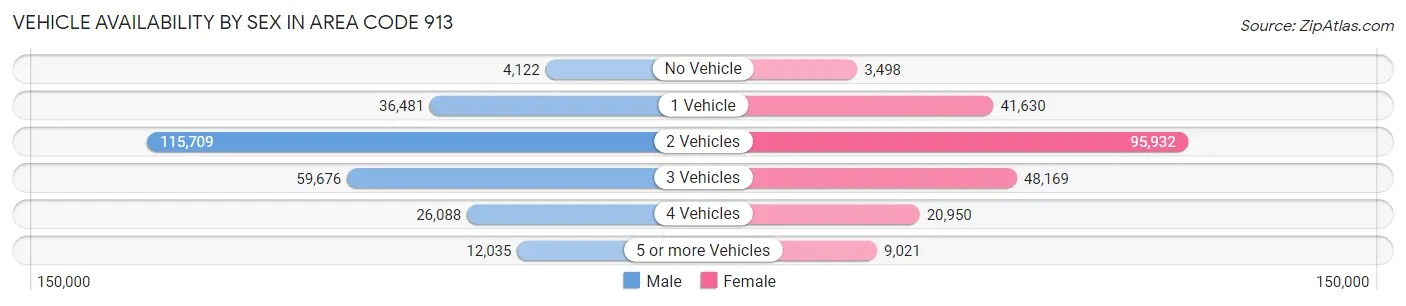
| Vehicles Available | Male | Female |
| No Vehicle | 4,122 (1.6%) | 3,498 (1.6%) |
| 1 Vehicle | 36,481 (14.4%) | 41,630 (19.0%) |
| 2 Vehicles | 115,709 (45.5%) | 95,932 (43.8%) |
| 3 Vehicles | 59,676 (23.5%) | 48,169 (22.0%) |
| 4 Vehicles | 26,088 (10.3%) | 20,950 (9.6%) |
| 5 or more Vehicles | 12,035 (4.7%) | 9,021 (4.1%) |
| Total | 254,111 (100.0%) | 219,200 (100.0%) |
Commute Time in Area Code 913
The most frequently occuring commute durations in Area Code 913 are 15 to 19 minutes (77,548 commuters, 19.1%), 20 to 24 minutes (75,094 commuters, 18.5%), and 10 to 14 minutes (60,578 commuters, 14.9%).
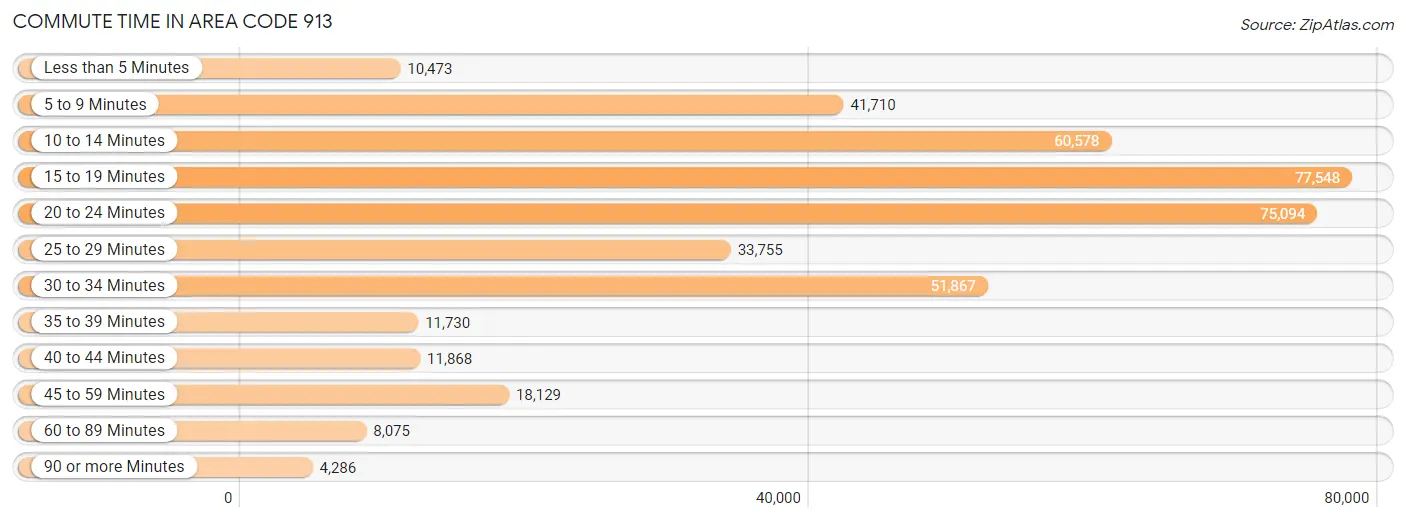
| Commute Time | # Commuters | % Commuters |
| Less than 5 Minutes | 10,473 | 2.6% |
| 5 to 9 Minutes | 41,710 | 10.3% |
| 10 to 14 Minutes | 60,578 | 14.9% |
| 15 to 19 Minutes | 77,548 | 19.1% |
| 20 to 24 Minutes | 75,094 | 18.5% |
| 25 to 29 Minutes | 33,755 | 8.3% |
| 30 to 34 Minutes | 51,867 | 12.8% |
| 35 to 39 Minutes | 11,730 | 2.9% |
| 40 to 44 Minutes | 11,868 | 2.9% |
| 45 to 59 Minutes | 18,129 | 4.5% |
| 60 to 89 Minutes | 8,075 | 2.0% |
| 90 or more Minutes | 4,286 | 1.1% |
Commute Time by Sex in Area Code 913
The most common commute times in Area Code 913 are 15 to 19 minutes (41,250 commuters, 18.8%) for males and 15 to 19 minutes (36,298 commuters, 19.6%) for females.
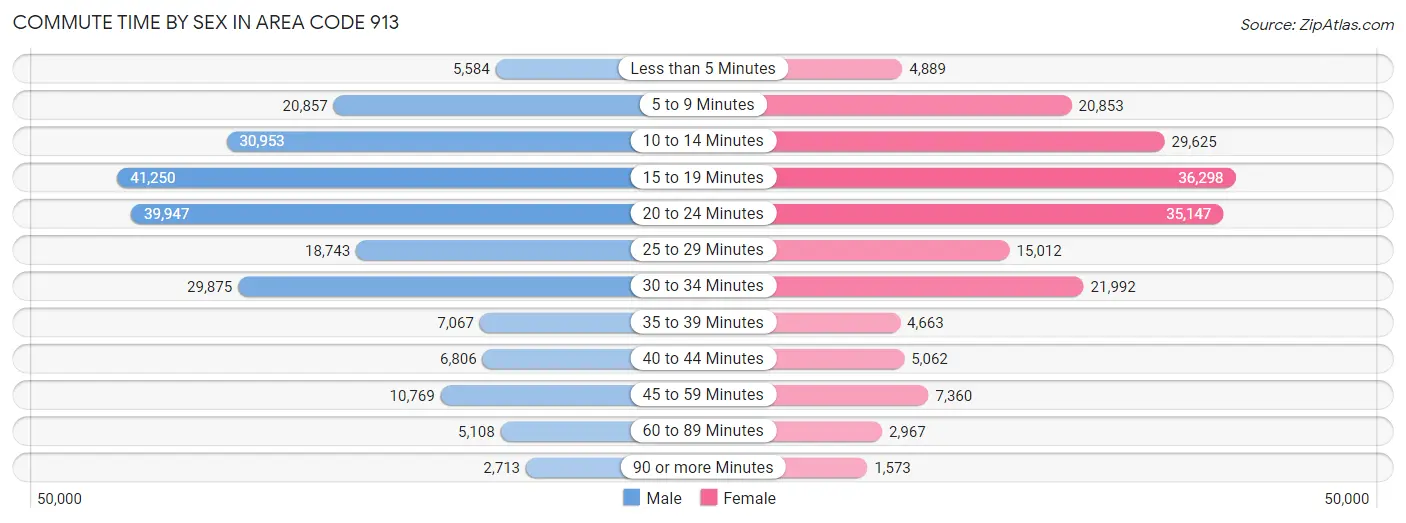
| Commute Time | Male | Female |
| Less than 5 Minutes | 5,584 (2.5%) | 4,889 (2.6%) |
| 5 to 9 Minutes | 20,857 (9.5%) | 20,853 (11.3%) |
| 10 to 14 Minutes | 30,953 (14.1%) | 29,625 (16.0%) |
| 15 to 19 Minutes | 41,250 (18.8%) | 36,298 (19.6%) |
| 20 to 24 Minutes | 39,947 (18.2%) | 35,147 (19.0%) |
| 25 to 29 Minutes | 18,743 (8.5%) | 15,012 (8.1%) |
| 30 to 34 Minutes | 29,875 (13.6%) | 21,992 (11.9%) |
| 35 to 39 Minutes | 7,067 (3.2%) | 4,663 (2.5%) |
| 40 to 44 Minutes | 6,806 (3.1%) | 5,062 (2.7%) |
| 45 to 59 Minutes | 10,769 (4.9%) | 7,360 (4.0%) |
| 60 to 89 Minutes | 5,108 (2.3%) | 2,967 (1.6%) |
| 90 or more Minutes | 2,713 (1.2%) | 1,573 (0.9%) |
Time of Departure to Work by Sex in Area Code 913
The most frequent times of departure to work in Area Code 913 are 7:00 AM to 7:29 AM (34,921, 15.9%) for males and 7:30 AM to 7:59 AM (32,771, 17.7%) for females.
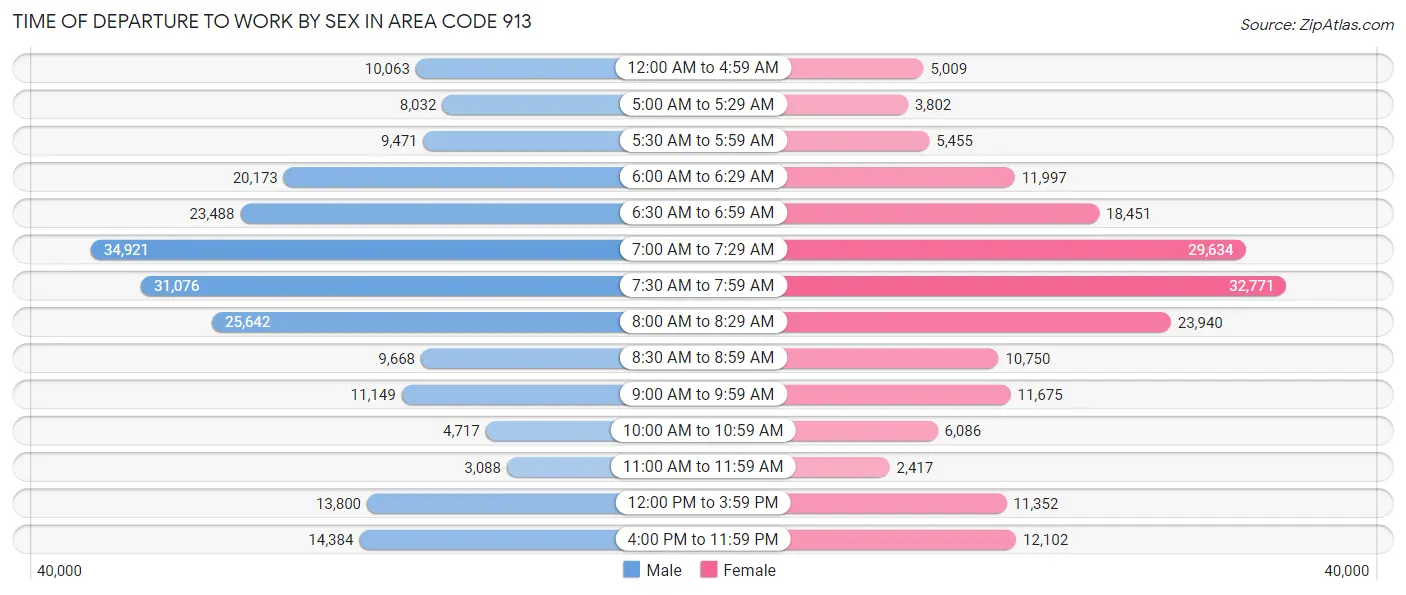
| Time of Departure | Male | Female |
| 12:00 AM to 4:59 AM | 10,063 (4.6%) | 5,009 (2.7%) |
| 5:00 AM to 5:29 AM | 8,032 (3.7%) | 3,802 (2.1%) |
| 5:30 AM to 5:59 AM | 9,471 (4.3%) | 5,455 (2.9%) |
| 6:00 AM to 6:29 AM | 20,173 (9.2%) | 11,997 (6.5%) |
| 6:30 AM to 6:59 AM | 23,488 (10.7%) | 18,451 (10.0%) |
| 7:00 AM to 7:29 AM | 34,921 (15.9%) | 29,634 (16.0%) |
| 7:30 AM to 7:59 AM | 31,076 (14.1%) | 32,771 (17.7%) |
| 8:00 AM to 8:29 AM | 25,642 (11.7%) | 23,940 (12.9%) |
| 8:30 AM to 8:59 AM | 9,668 (4.4%) | 10,750 (5.8%) |
| 9:00 AM to 9:59 AM | 11,149 (5.1%) | 11,675 (6.3%) |
| 10:00 AM to 10:59 AM | 4,717 (2.1%) | 6,086 (3.3%) |
| 11:00 AM to 11:59 AM | 3,088 (1.4%) | 2,417 (1.3%) |
| 12:00 PM to 3:59 PM | 13,800 (6.3%) | 11,352 (6.1%) |
| 4:00 PM to 11:59 PM | 14,384 (6.6%) | 12,102 (6.5%) |
| Total | 219,672 (100.0%) | 185,441 (100.0%) |
Housing Occupancy in Area Code 913
Occupancy by Ownership in Area Code 913
Of the total 357,609 dwellings in Area Code 913, owner-occupied units account for 243,141 (68.0%), while renter-occupied units make up 114,468 (32.0%).
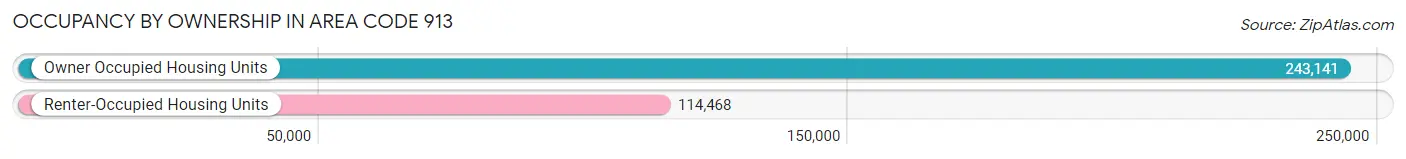
| Occupancy | # Housing Units | % Housing Units |
| Owner Occupied Housing Units | 243,141 | 68.0% |
| Renter-Occupied Housing Units | 114,468 | 32.0% |
| Total Occupied Housing Units | 357,609 | 100.0% |
Occupancy by Household Size in Area Code 913
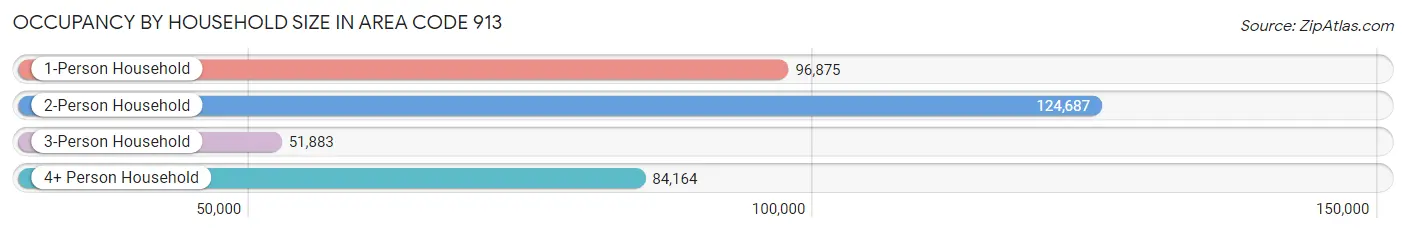
| Household Size | # Housing Units | % Housing Units |
| 1-Person Household | 96,875 | 27.1% |
| 2-Person Household | 124,687 | 34.9% |
| 3-Person Household | 51,883 | 14.5% |
| 4+ Person Household | 84,164 | 23.5% |
| Total Housing Units | 357,609 | 100.0% |
Occupancy by Ownership by Household Size in Area Code 913
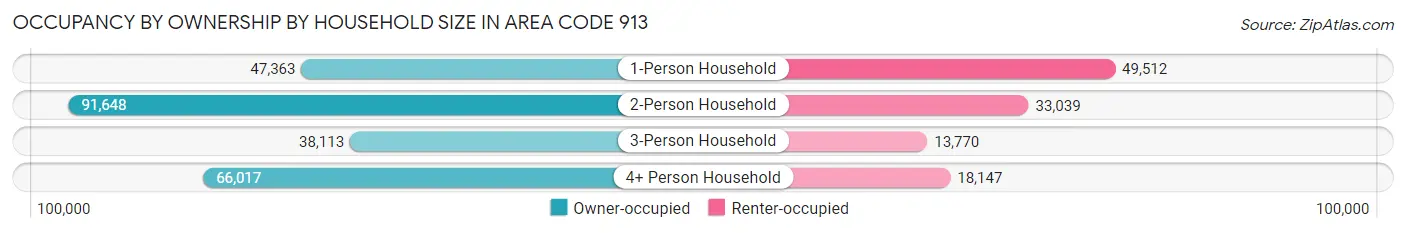
| Household Size | Owner-occupied | Renter-occupied |
| 1-Person Household | 47,363 (48.9%) | 49,512 (51.1%) |
| 2-Person Household | 91,648 (73.5%) | 33,039 (26.5%) |
| 3-Person Household | 38,113 (73.5%) | 13,770 (26.5%) |
| 4+ Person Household | 66,017 (78.4%) | 18,147 (21.6%) |
| Total Housing Units | 243,141 (68.0%) | 114,468 (32.0%) |
Occupancy by Educational Attainment in Area Code 913
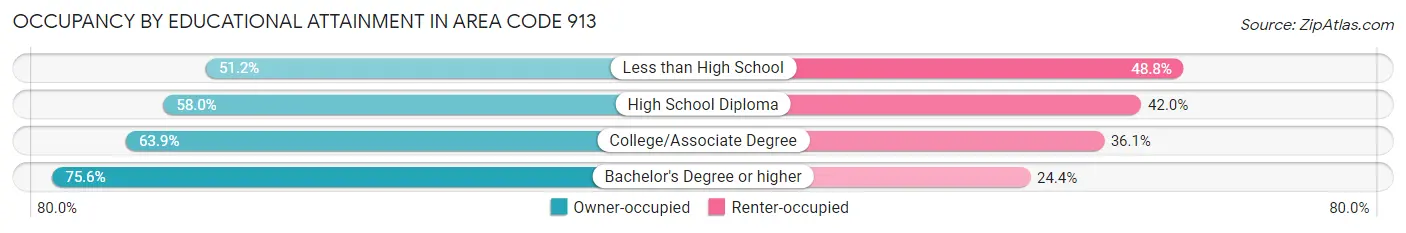
| Household Size | Owner-occupied | Renter-occupied |
| Less than High School | 9,662 (51.2%) | 9,198 (48.8%) |
| High School Diploma | 36,217 (58.0%) | 26,249 (42.0%) |
| College/Associate Degree | 63,532 (63.9%) | 35,871 (36.1%) |
| Bachelor's Degree or higher | 133,730 (75.6%) | 43,150 (24.4%) |
Occupancy by Age of Householder in Area Code 913
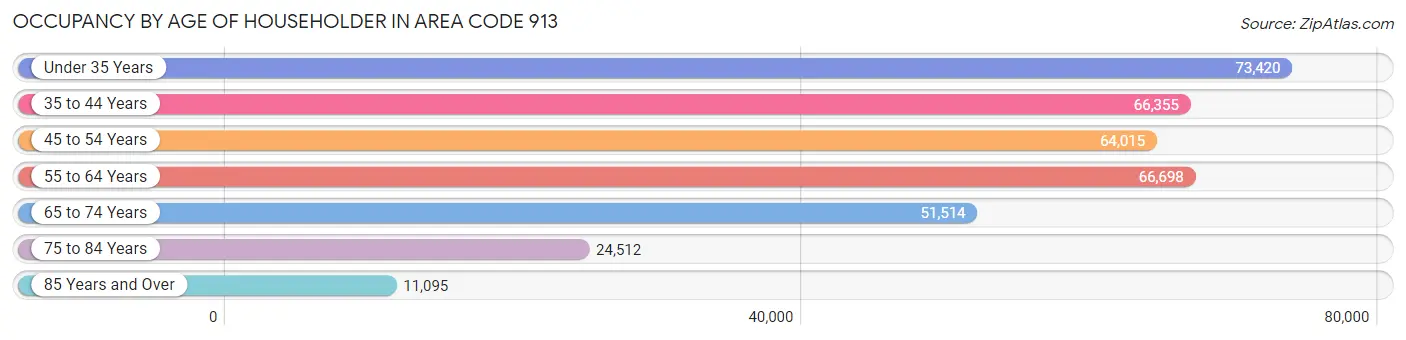
| Age Bracket | # Households | % Households |
| Under 35 Years | 73,420 | 20.5% |
| 35 to 44 Years | 66,355 | 18.6% |
| 45 to 54 Years | 64,015 | 17.9% |
| 55 to 64 Years | 66,698 | 18.6% |
| 65 to 74 Years | 51,514 | 14.4% |
| 75 to 84 Years | 24,512 | 6.9% |
| 85 Years and Over | 11,095 | 3.1% |
| Total | 357,609 | 100.0% |
Housing Finances in Area Code 913
Median Income by Occupancy in Area Code 913
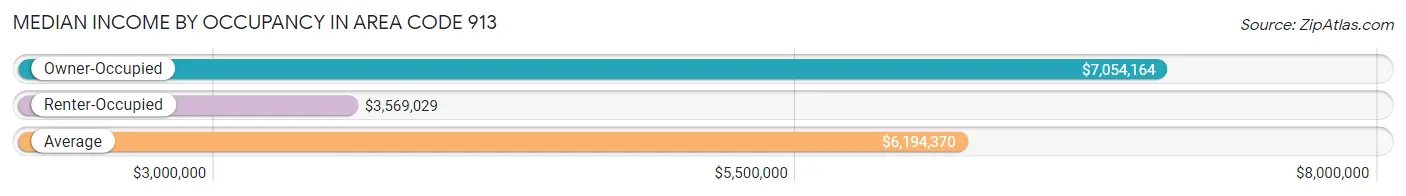
| Occupancy Type | # Households | Median Income |
| Owner-Occupied | 243,141 (68.0%) | $7,054,164 |
| Renter-Occupied | 114,468 (32.0%) | $3,569,029 |
| Average | 357,609 (100.0%) | $6,194,370 |
Occupancy by Householder Income Bracket in Area Code 913
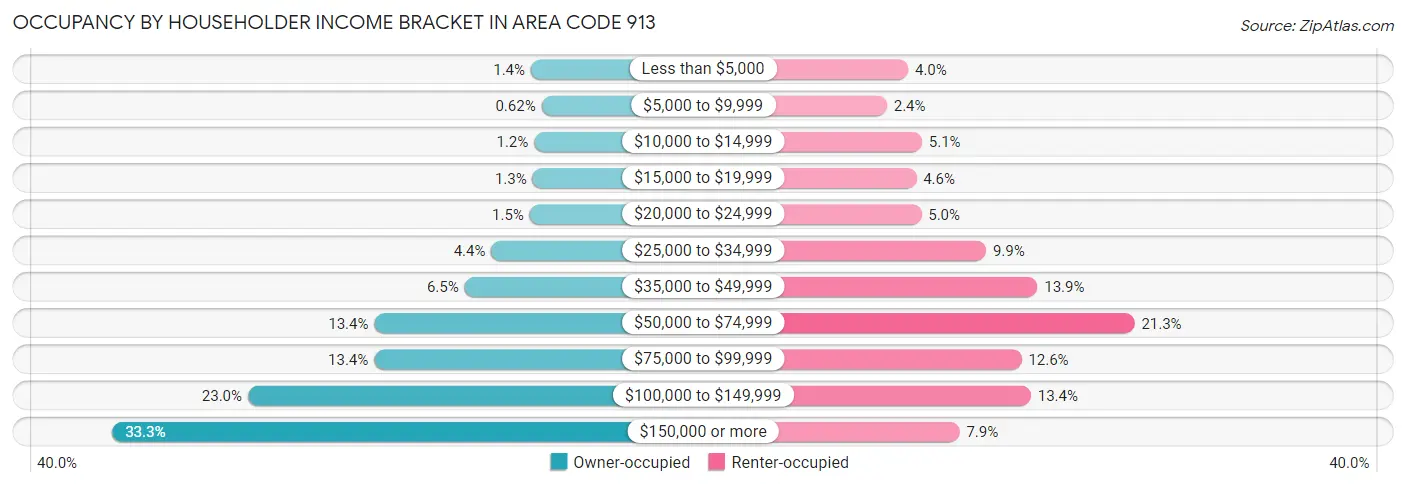
| Income Bracket | Owner-occupied | Renter-occupied |
| Less than $5,000 | 3,465 (1.4%) | 4,580 (4.0%) |
| $5,000 to $9,999 | 1,502 (0.6%) | 2,727 (2.4%) |
| $10,000 to $14,999 | 2,880 (1.2%) | 5,784 (5.1%) |
| $15,000 to $19,999 | 3,167 (1.3%) | 5,287 (4.6%) |
| $20,000 to $24,999 | 3,692 (1.5%) | 5,733 (5.0%) |
| $25,000 to $34,999 | 10,788 (4.4%) | 11,374 (9.9%) |
| $35,000 to $49,999 | 15,760 (6.5%) | 15,849 (13.9%) |
| $50,000 to $74,999 | 32,476 (13.4%) | 24,324 (21.2%) |
| $75,000 to $99,999 | 32,504 (13.4%) | 14,467 (12.6%) |
| $100,000 to $149,999 | 55,896 (23.0%) | 15,282 (13.4%) |
| $150,000 or more | 81,011 (33.3%) | 9,061 (7.9%) |
| Total | 243,141 (100.0%) | 114,468 (100.0%) |
Monthly Housing Cost Tiers in Area Code 913
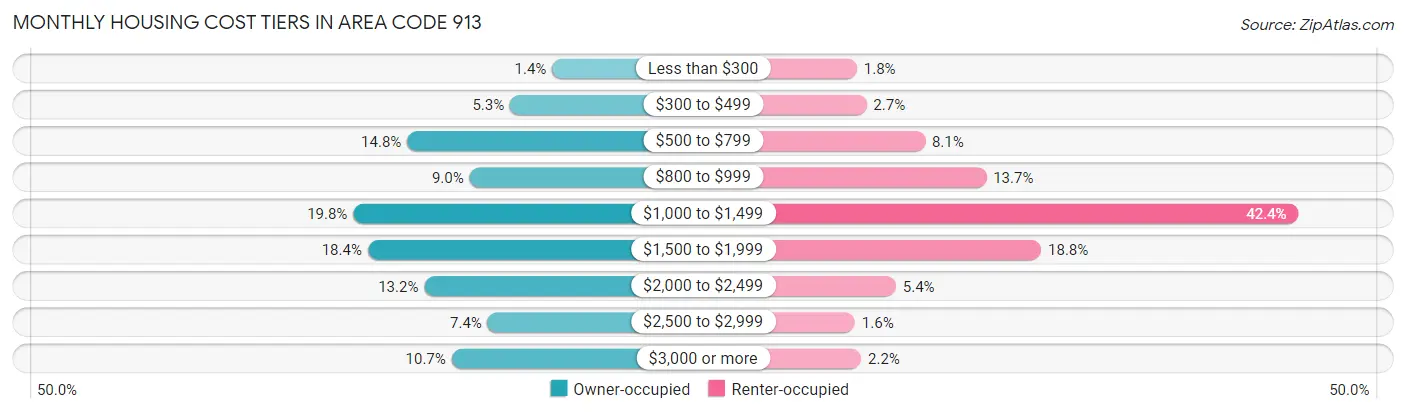
| Monthly Cost | Owner-occupied | Renter-occupied |
| Less than $300 | 3,489 (1.4%) | 2,046 (1.8%) |
| $300 to $499 | 12,916 (5.3%) | 3,060 (2.7%) |
| $500 to $799 | 35,933 (14.8%) | 9,226 (8.1%) |
| $800 to $999 | 21,970 (9.0%) | 15,686 (13.7%) |
| $1,000 to $1,499 | 48,031 (19.8%) | 48,576 (42.4%) |
| $1,500 to $1,999 | 44,768 (18.4%) | 21,468 (18.8%) |
| $2,000 to $2,499 | 32,121 (13.2%) | 6,164 (5.4%) |
| $2,500 to $2,999 | 17,930 (7.4%) | 1,844 (1.6%) |
| $3,000 or more | 25,983 (10.7%) | 2,497 (2.2%) |
| Total | 243,141 (100.0%) | 114,468 (100.0%) |
Physical Housing Characteristics in Area Code 913
Housing Structures in Area Code 913
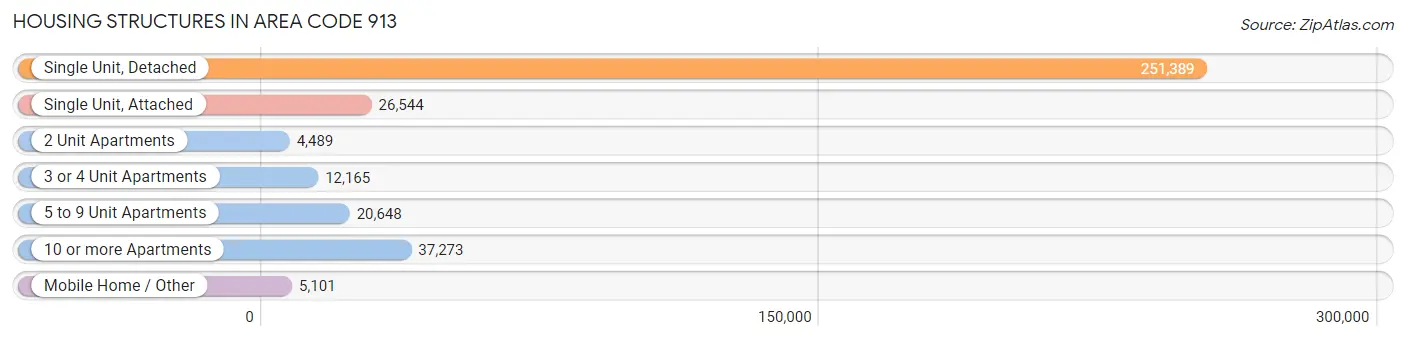
| Structure Type | # Housing Units | % Housing Units |
| Single Unit, Detached | 251,389 | 70.3% |
| Single Unit, Attached | 26,544 | 7.4% |
| 2 Unit Apartments | 4,489 | 1.3% |
| 3 or 4 Unit Apartments | 12,165 | 3.4% |
| 5 to 9 Unit Apartments | 20,648 | 5.8% |
| 10 or more Apartments | 37,273 | 10.4% |
| Mobile Home / Other | 5,101 | 1.4% |
| Total | 357,609 | 100.0% |
Housing Structures by Occupancy in Area Code 913
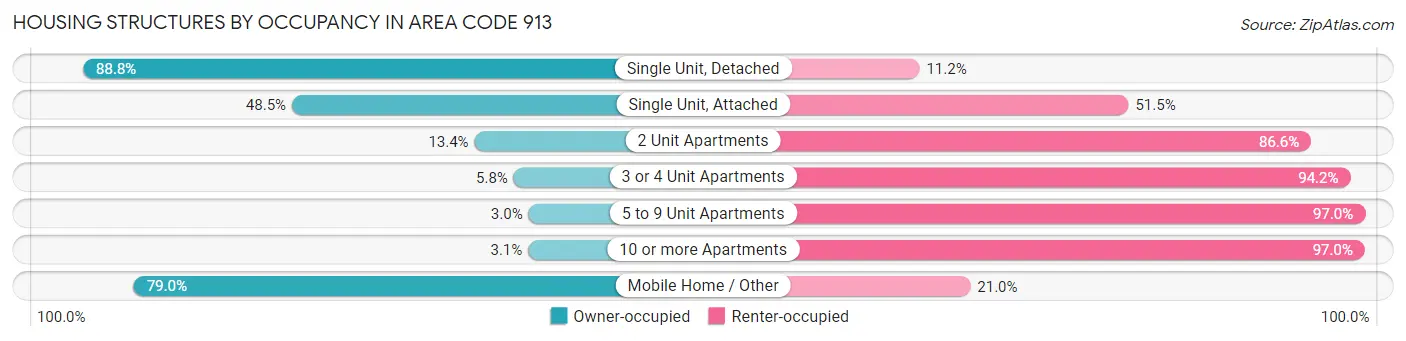
| Structure Type | Owner-occupied | Renter-occupied |
| Single Unit, Detached | 223,168 (88.8%) | 28,221 (11.2%) |
| Single Unit, Attached | 12,883 (48.5%) | 13,661 (51.5%) |
| 2 Unit Apartments | 601 (13.4%) | 3,888 (86.6%) |
| 3 or 4 Unit Apartments | 709 (5.8%) | 11,456 (94.2%) |
| 5 to 9 Unit Apartments | 615 (3.0%) | 20,033 (97.0%) |
| 10 or more Apartments | 1,136 (3.0%) | 36,137 (97.0%) |
| Mobile Home / Other | 4,029 (79.0%) | 1,072 (21.0%) |
| Total | 243,141 (68.0%) | 114,468 (32.0%) |
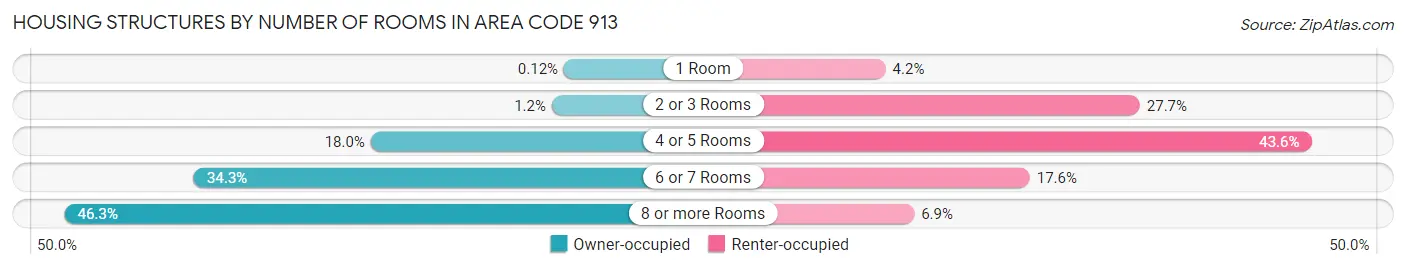
Housing Structures by Number of Rooms in Area Code 913
| Number of Rooms | Owner-occupied | Renter-occupied |
| 1 Room | 302 (0.1%) | 4,844 (4.2%) |
| 2 or 3 Rooms | 3,017 (1.2%) | 31,754 (27.7%) |
| 4 or 5 Rooms | 43,749 (18.0%) | 49,902 (43.6%) |
| 6 or 7 Rooms | 83,496 (34.3%) | 20,105 (17.6%) |
| 8 or more Rooms | 112,577 (46.3%) | 7,863 (6.9%) |
| Total | 243,141 (100.0%) | 114,468 (100.0%) |
Housing Structure by Heating Type in Area Code 913
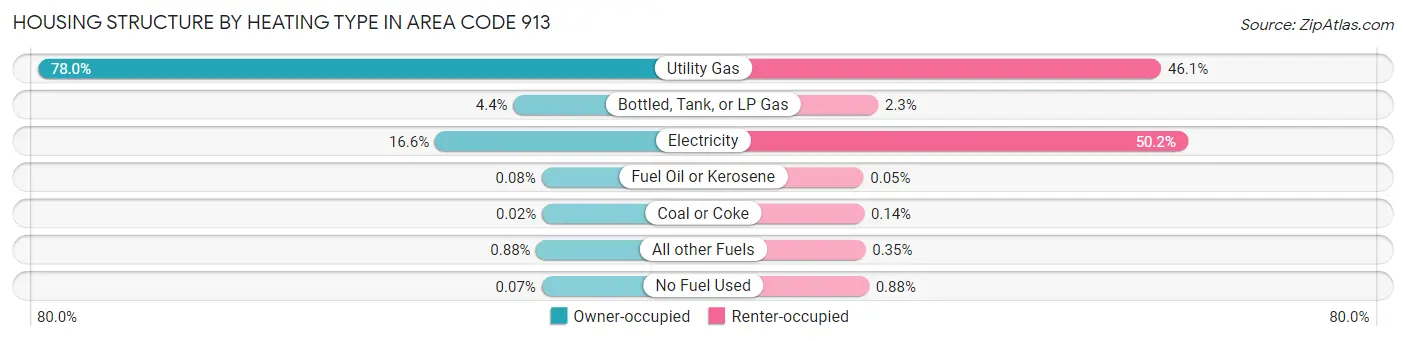
| Heating Type | Owner-occupied | Renter-occupied |
| Utility Gas | 189,563 (78.0%) | 52,740 (46.1%) |
| Bottled, Tank, or LP Gas | 10,779 (4.4%) | 2,654 (2.3%) |
| Electricity | 40,256 (16.6%) | 57,446 (50.2%) |
| Fuel Oil or Kerosene | 184 (0.1%) | 58 (0.1%) |
| Coal or Coke | 60 (0.0%) | 159 (0.1%) |
| All other Fuels | 2,130 (0.9%) | 398 (0.4%) |
| No Fuel Used | 169 (0.1%) | 1,013 (0.9%) |
| Total | 243,141 (100.0%) | 114,468 (100.0%) |
Household Vehicle Usage in Area Code 913
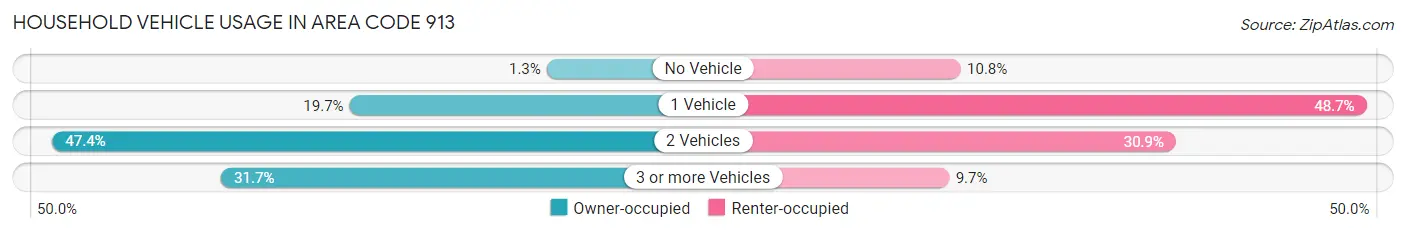
| Vehicles per Household | Owner-occupied | Renter-occupied |
| No Vehicle | 3,084 (1.3%) | 12,304 (10.7%) |
| 1 Vehicle | 47,855 (19.7%) | 55,725 (48.7%) |
| 2 Vehicles | 115,242 (47.4%) | 35,346 (30.9%) |
| 3 or more Vehicles | 76,960 (31.7%) | 11,093 (9.7%) |
| Total | 243,141 (100.0%) | 114,468 (100.0%) |
Real Estate & Mortgages in Area Code 913
Real Estate and Mortgage Overview in Area Code 913
| Characteristic | Without Mortgage | With Mortgage |
| Housing Units | 82,329 | 160,812 |
| Median Property Value | $17,424,200 | $19,186,600 |
| Median Household Income | $5,429,522 | $63,046 |
| Monthly Housing Costs | $49,067 | $25,531 |
| Real Estate Taxes | $214,432 | $2,546 |
Property Value by Mortgage Status in Area Code 913
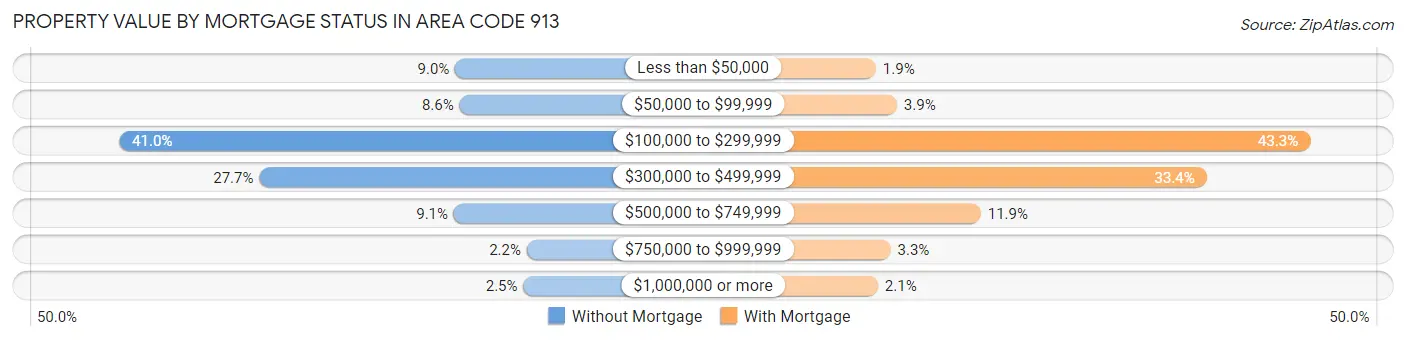
| Property Value | Without Mortgage | With Mortgage |
| Less than $50,000 | 7,400 (9.0%) | 3,125 (1.9%) |
| $50,000 to $99,999 | 7,062 (8.6%) | 6,340 (3.9%) |
| $100,000 to $299,999 | 33,749 (41.0%) | 69,620 (43.3%) |
| $300,000 to $499,999 | 22,766 (27.7%) | 53,754 (33.4%) |
| $500,000 to $749,999 | 7,507 (9.1%) | 19,181 (11.9%) |
| $750,000 to $999,999 | 1,783 (2.2%) | 5,373 (3.3%) |
| $1,000,000 or more | 2,062 (2.5%) | 3,419 (2.1%) |
| Total | 82,329 (100.0%) | 160,812 (100.0%) |
Household Income by Mortgage Status in Area Code 913
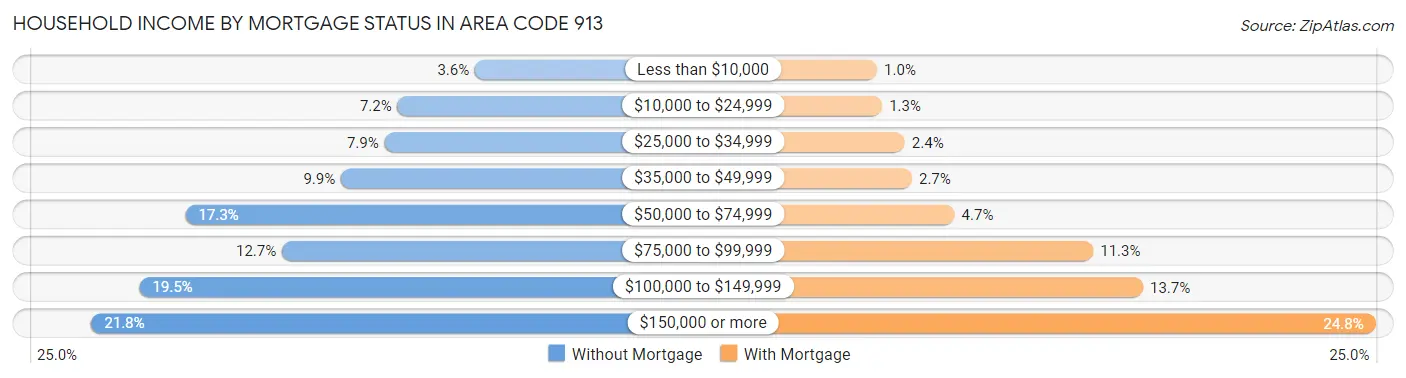
| Household Income | Without Mortgage | With Mortgage |
| Less than $10,000 | 2,921 (3.5%) | 1,658 (1.0%) |
| $10,000 to $24,999 | 5,964 (7.2%) | 2,046 (1.3%) |
| $25,000 to $34,999 | 6,468 (7.9%) | 3,775 (2.4%) |
| $35,000 to $49,999 | 8,172 (9.9%) | 4,320 (2.7%) |
| $50,000 to $74,999 | 14,274 (17.3%) | 7,588 (4.7%) |
| $75,000 to $99,999 | 10,489 (12.7%) | 18,202 (11.3%) |
| $100,000 to $149,999 | 16,076 (19.5%) | 22,015 (13.7%) |
| $150,000 or more | 17,965 (21.8%) | 39,820 (24.8%) |
| Total | 82,329 (100.0%) | 160,812 (100.0%) |
Property Value to Household Income Ratio in Area Code 913
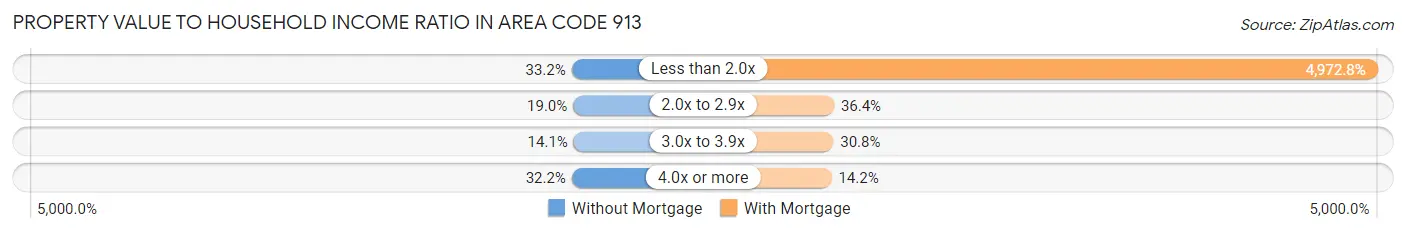
| Value-to-Income Ratio | Without Mortgage | With Mortgage |
| Less than 2.0x | 27,352 (33.2%) | 7,996,856 (4,972.8%) |
| 2.0x to 2.9x | 15,675 (19.0%) | 58,542 (36.4%) |
| 3.0x to 3.9x | 11,611 (14.1%) | 49,550 (30.8%) |
| 4.0x or more | 26,521 (32.2%) | 22,855 (14.2%) |
| Total | 82,329 (100.0%) | 160,812 (100.0%) |
Real Estate Taxes by Mortgage Status in Area Code 913
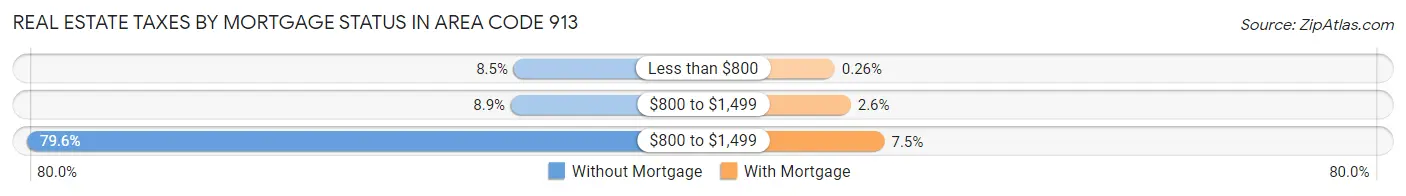
| Property Taxes | Without Mortgage | With Mortgage |
| Less than $800 | 7,014 (8.5%) | 414 (0.3%) |
| $800 to $1,499 | 7,362 (8.9%) | 4,167 (2.6%) |
| $800 to $1,499 | 65,563 (79.6%) | 12,092 (7.5%) |
| Total | 82,329 (100.0%) | 160,812 (100.0%) |
Health & Disability in Area Code 913
Health Insurance Coverage by Age in Area Code 913
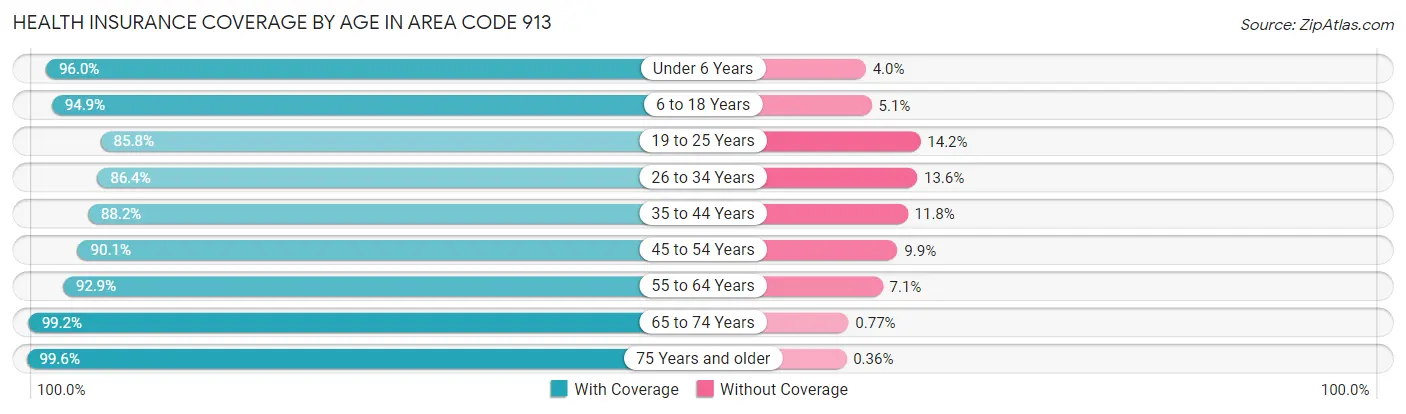
| Age Bracket | With Coverage | Without Coverage |
| Under 6 Years | 67,207 (96.0%) | 2,791 (4.0%) |
| 6 to 18 Years | 159,480 (94.9%) | 8,551 (5.1%) |
| 19 to 25 Years | 66,263 (85.8%) | 10,951 (14.2%) |
| 26 to 34 Years | 94,042 (86.4%) | 14,757 (13.6%) |
| 35 to 44 Years | 111,377 (88.2%) | 14,911 (11.8%) |
| 45 to 54 Years | 102,350 (90.1%) | 11,244 (9.9%) |
| 55 to 64 Years | 106,010 (92.9%) | 8,151 (7.1%) |
| 65 to 74 Years | 82,413 (99.2%) | 637 (0.8%) |
| 75 Years and older | 52,345 (99.6%) | 190 (0.4%) |
| Total | 841,487 (92.1%) | 72,183 (7.9%) |
Health Insurance Coverage by Citizenship Status in Area Code 913
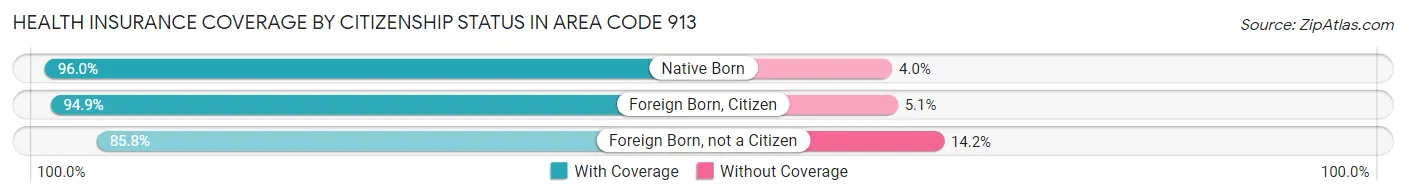
| Citizenship Status | With Coverage | Without Coverage |
| Native Born | 67,207 (96.0%) | 2,791 (4.0%) |
| Foreign Born, Citizen | 159,480 (94.9%) | 8,551 (5.1%) |
| Foreign Born, not a Citizen | 66,263 (85.8%) | 10,951 (14.2%) |
Health Insurance Coverage by Household Income in Area Code 913
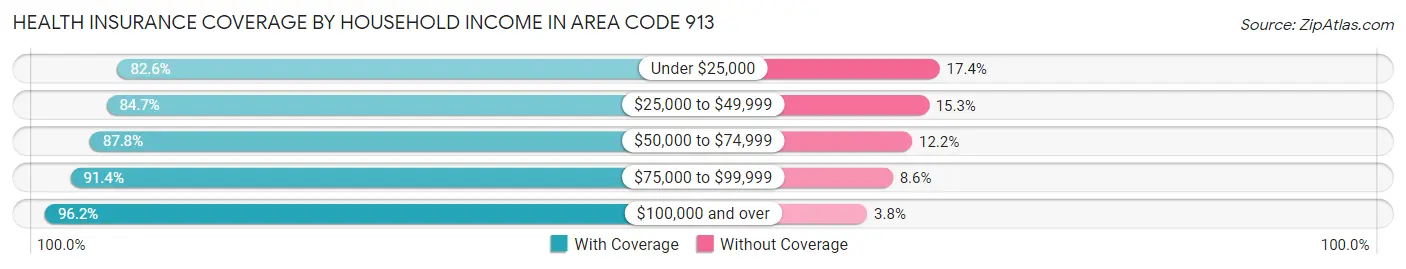
| Household Income | With Coverage | Without Coverage |
| Under $25,000 | 53,080 (82.6%) | 11,185 (17.4%) |
| $25,000 to $49,999 | 87,483 (84.7%) | 15,854 (15.3%) |
| $50,000 to $74,999 | 108,815 (87.8%) | 15,169 (12.2%) |
| $75,000 to $99,999 | 112,956 (91.4%) | 10,626 (8.6%) |
| $100,000 and over | 475,021 (96.2%) | 18,880 (3.8%) |
Public vs Private Health Insurance Coverage by Age in Area Code 913
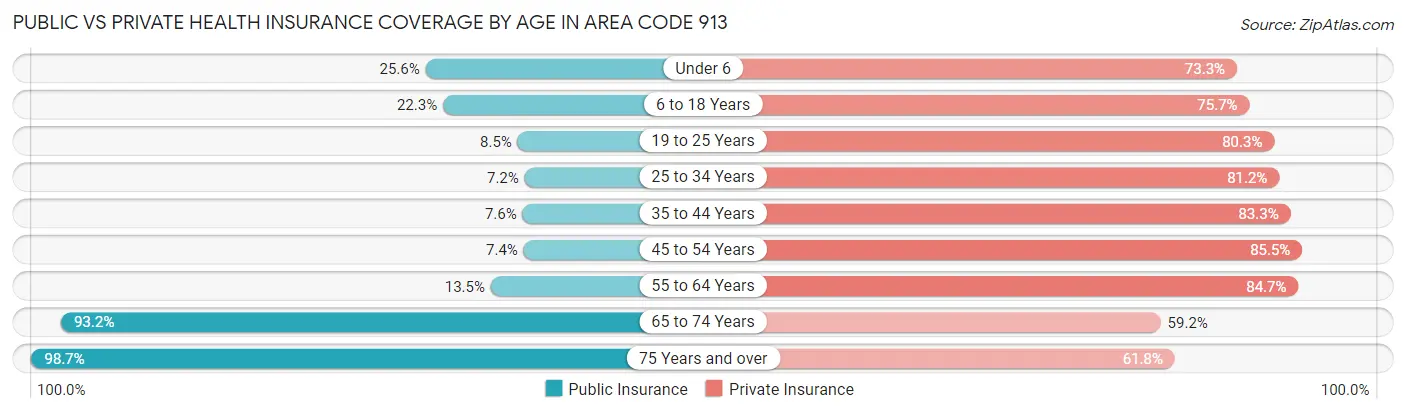
| Age Bracket | Public Insurance | Private Insurance |
| Under 6 | 17,906 (25.6%) | 51,331 (73.3%) |
| 6 to 18 Years | 37,531 (22.3%) | 127,114 (75.6%) |
| 19 to 25 Years | 6,547 (8.5%) | 61,972 (80.3%) |
| 25 to 34 Years | 7,821 (7.2%) | 88,327 (81.2%) |
| 35 to 44 Years | 9,568 (7.6%) | 105,174 (83.3%) |
| 45 to 54 Years | 8,355 (7.4%) | 97,068 (85.5%) |
| 55 to 64 Years | 15,374 (13.5%) | 96,723 (84.7%) |
| 65 to 74 Years | 77,435 (93.2%) | 49,159 (59.2%) |
| 75 Years and over | 51,872 (98.7%) | 32,472 (61.8%) |
| Total | 232,409 (25.4%) | 709,340 (77.6%) |
Disability Status by Sex by Age in Area Code 913
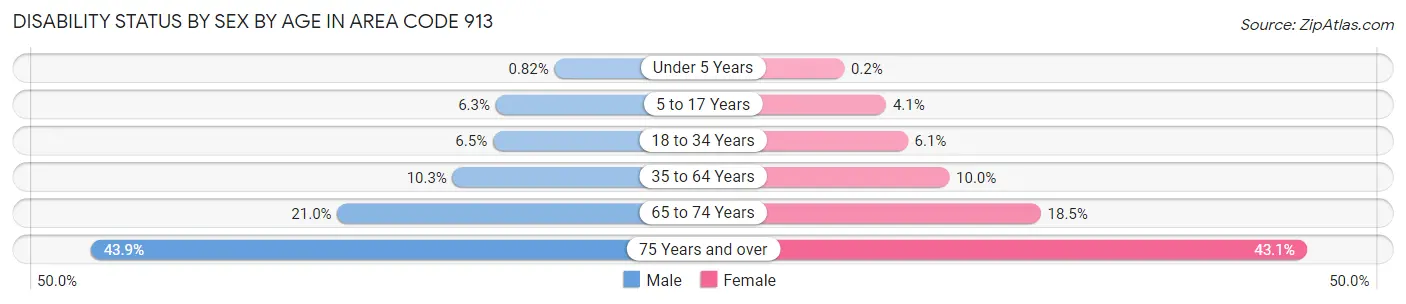
| Age Bracket | Male | Female |
| Under 5 Years | 244 (0.8%) | 57 (0.2%) |
| 5 to 17 Years | 5,387 (6.3%) | 3,353 (4.1%) |
| 18 to 34 Years | 6,565 (6.5%) | 5,983 (6.1%) |
| 35 to 64 Years | 18,116 (10.3%) | 17,698 (10.0%) |
| 65 to 74 Years | 8,197 (21.0%) | 8,111 (18.4%) |
| 75 Years and over | 9,588 (43.9%) | 13,230 (43.1%) |
Disability Class by Sex by Age in Area Code 913
Disability Class: Hearing Difficulty
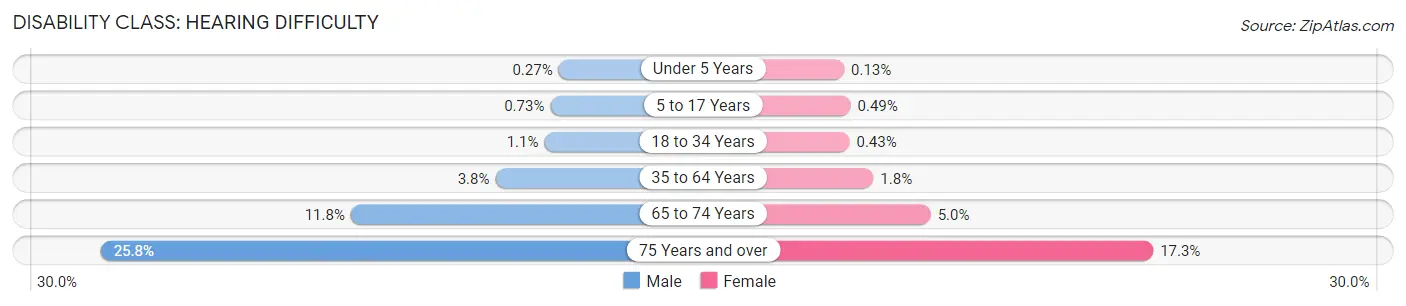
| Age Bracket | Male | Female |
| Under 5 Years | 79 (0.3%) | 37 (0.1%) |
| 5 to 17 Years | 631 (0.7%) | 397 (0.5%) |
| 18 to 34 Years | 1,068 (1.1%) | 416 (0.4%) |
| 35 to 64 Years | 6,684 (3.8%) | 3,135 (1.8%) |
| 65 to 74 Years | 4,627 (11.8%) | 2,175 (5.0%) |
| 75 Years and over | 5,630 (25.8%) | 5,320 (17.3%) |
Disability Class: Vision Difficulty
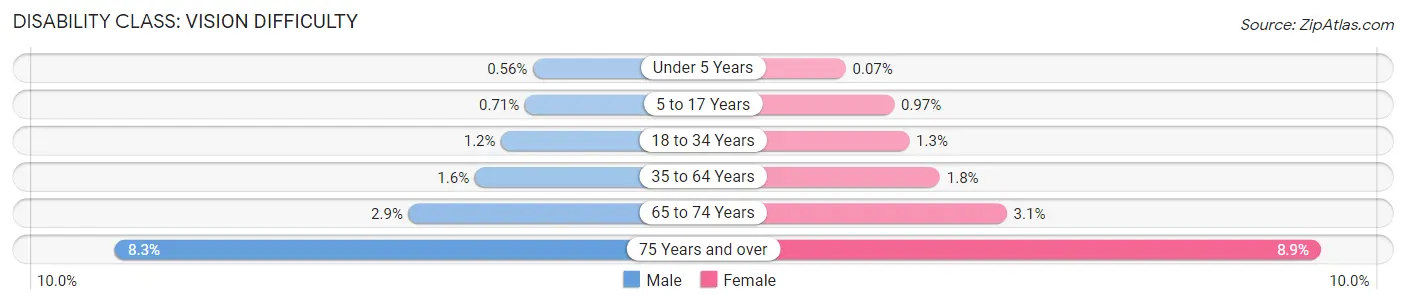
| Age Bracket | Male | Female |
| Under 5 Years | 165 (0.6%) | 20 (0.1%) |
| 5 to 17 Years | 612 (0.7%) | 792 (1.0%) |
| 18 to 34 Years | 1,156 (1.1%) | 1,223 (1.3%) |
| 35 to 64 Years | 2,889 (1.6%) | 3,239 (1.8%) |
| 65 to 74 Years | 1,121 (2.9%) | 1,347 (3.1%) |
| 75 Years and over | 1,818 (8.3%) | 2,726 (8.9%) |
Disability Class: Cognitive Difficulty
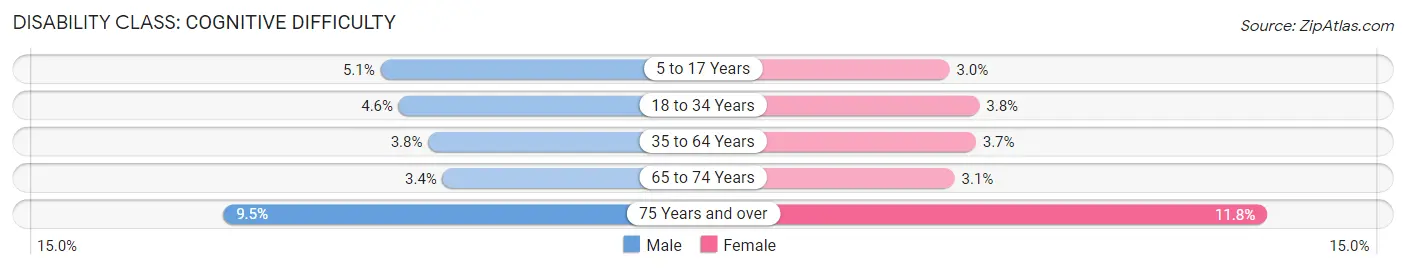
| Age Bracket | Male | Female |
| 5 to 17 Years | 4,374 (5.1%) | 2,457 (3.0%) |
| 18 to 34 Years | 4,601 (4.6%) | 3,746 (3.8%) |
| 35 to 64 Years | 6,631 (3.8%) | 6,628 (3.7%) |
| 65 to 74 Years | 1,315 (3.4%) | 1,381 (3.1%) |
| 75 Years and over | 2,070 (9.5%) | 3,633 (11.8%) |
Disability Class: Ambulatory Difficulty
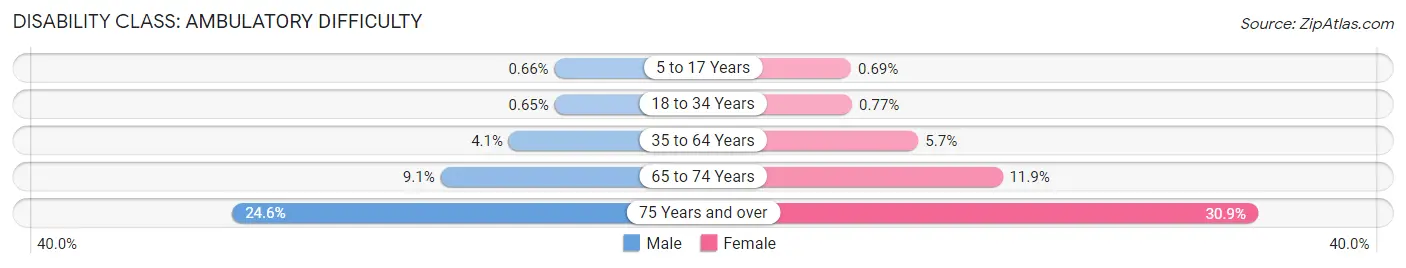
| Age Bracket | Male | Female |
| 5 to 17 Years | 567 (0.7%) | 567 (0.7%) |
| 18 to 34 Years | 654 (0.6%) | 758 (0.8%) |
| 35 to 64 Years | 7,150 (4.1%) | 10,109 (5.7%) |
| 65 to 74 Years | 3,567 (9.1%) | 5,242 (11.9%) |
| 75 Years and over | 5,373 (24.6%) | 9,474 (30.9%) |
Disability Class: Self-Care Difficulty
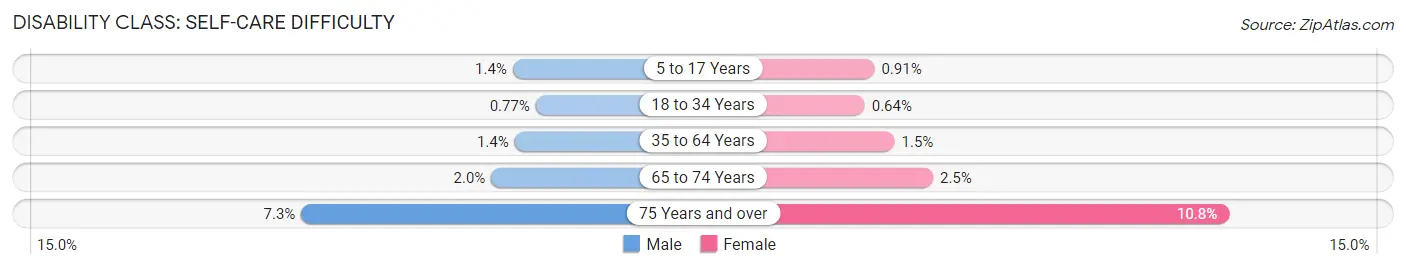
| Age Bracket | Male | Female |
| 5 to 17 Years | 1,209 (1.4%) | 745 (0.9%) |
| 18 to 34 Years | 779 (0.8%) | 626 (0.6%) |
| 35 to 64 Years | 2,393 (1.4%) | 2,612 (1.5%) |
| 65 to 74 Years | 787 (2.0%) | 1,115 (2.5%) |
| 75 Years and over | 1,595 (7.3%) | 3,306 (10.8%) |
Technology Access in Area Code 913
Computing Device Access in Area Code 913
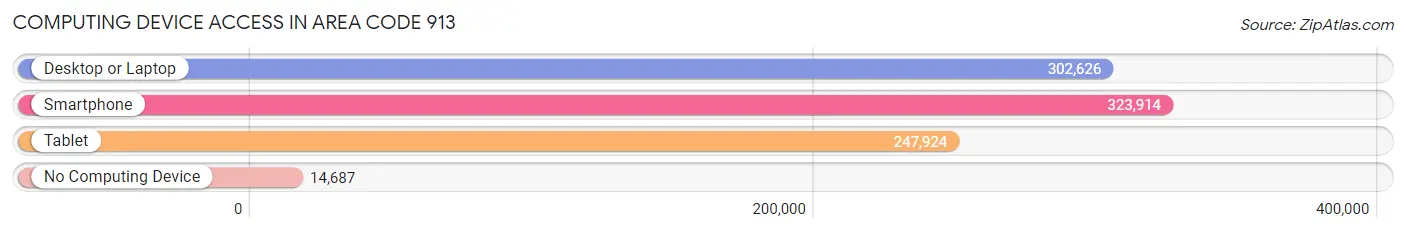
| Device Type | # Households | % Households |
| Desktop or Laptop | 302,626 | 84.6% |
| Smartphone | 323,914 | 90.6% |
| Tablet | 247,924 | 69.3% |
| No Computing Device | 14,687 | 4.1% |
| Total | 357,609 | 100.0% |
Internet Access in Area Code 913
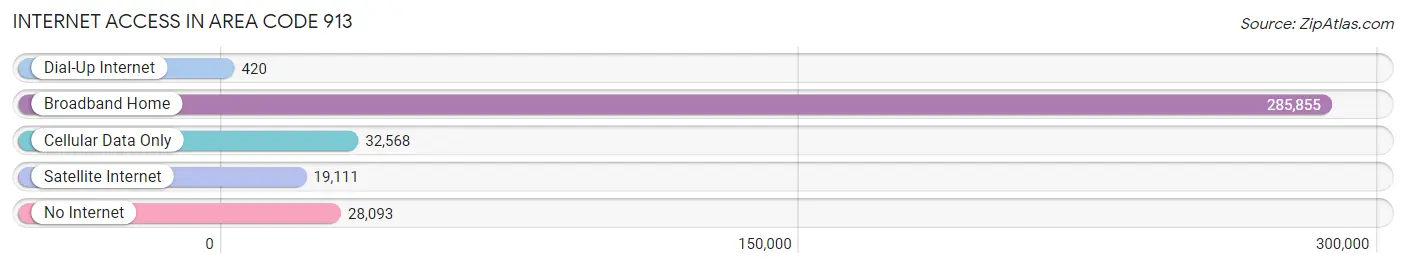
| Internet Type | # Households | % Households |
| Dial-Up Internet | 420 | 0.1% |
| Broadband Home | 285,855 | 79.9% |
| Cellular Data Only | 32,568 | 9.1% |
| Satellite Internet | 19,111 | 5.3% |
| No Internet | 28,093 | 7.9% |
| Total | 357,609 | 100.0% |
Area Code 913 Summary
Geography
Area code 913 is located in the state of Kansas and covers the Kansas City metropolitan area. It includes the cities of Kansas City, Overland Park, Olathe, Lenexa, Shawnee, and Leavenworth. It also covers parts of Johnson, Wyandotte, and Leavenworth counties.
Social
Area code 913 is home to a diverse population of people from all walks of life. The area is known for its vibrant culture, with a variety of restaurants, bars, and entertainment venues. The area is also home to several universities, including the University of Kansas and Kansas State University.
Economics
Area code 913 is a major economic hub in the Midwest. The area is home to several Fortune 500 companies, including Sprint, Garmin, and Hallmark. The area is also home to a number of small businesses, including restaurants, retail stores, and professional services.
Demographics
Area code 913 is home to a diverse population of people from all walks of life. According to the U.S. Census Bureau, the population of the area is approximately 1.5 million people. The area is predominantly white, with a large Hispanic population. The median household income is approximately $60,000.
Common Questions
What is Per Capita Income in Area Code 913?
Per Capita income in Area Code 913 is $45,047.
What is the Median Family Income in Area Code 913?
Median Family Income in Area Code 913 is $107,307.
What is the Median Household income in Area Code 913?
Median Household Income in Area Code 913 is $89,773.
What is Income or Wage Gap in Area Code 913?
Income or Wage Gap in Area Code 913 is 33.9%.
Women in Area Code 913 earn 66.1 cents for every dollar earned by a man.
What is Family Income Deficit in Area Code 913?
Family Income Deficit in Area Code 913 is $10,368.
Families that are below poverty line in Area Code 913 earn $10,368 less on average than the poverty threshold level.
What is Inequality or Gini Index in Area Code 913?
Inequality or Gini Index in Area Code 913 is 28.73.
What is the Total Population of Area Code 913?
Total Population of Area Code 913 is 927,785.
What is the Total Male Population of Area Code 913?
Total Male Population of Area Code 913 is 464,189.
What is the Total Female Population of Area Code 913?
Total Female Population of Area Code 913 is 463,596.
What is the Ratio of Males per 100 Females in Area Code 913?
There are 100.13 Males per 100 Females in Area Code 913.
What is the Ratio of Females per 100 Males in Area Code 913?
There are 99.87 Females per 100 Males in Area Code 913.
What is the Median Population Age in Area Code 913?
Median Population Age in Area Code 913 is 40.6 Years.
What is the Average Family Size in Area Code 913
Average Family Size in Area Code 913 is 3.1 People.
What is the Average Household Size in Area Code 913
Average Household Size in Area Code 913 is 2.6 People.
How Large is the Labor Force in Area Code 913?
There are 482,806 People in the Labor Forcein in Area Code 913.
What is the Percentage of People in the Labor Force in Area Code 913?
66.3% of People are in the Labor Force in Area Code 913.
What is the Unemployment Rate in Area Code 913?
Unemployment Rate in Area Code 913 is 3.9%.