Area Code 413 Map & Demographics
Area Code 413 Map
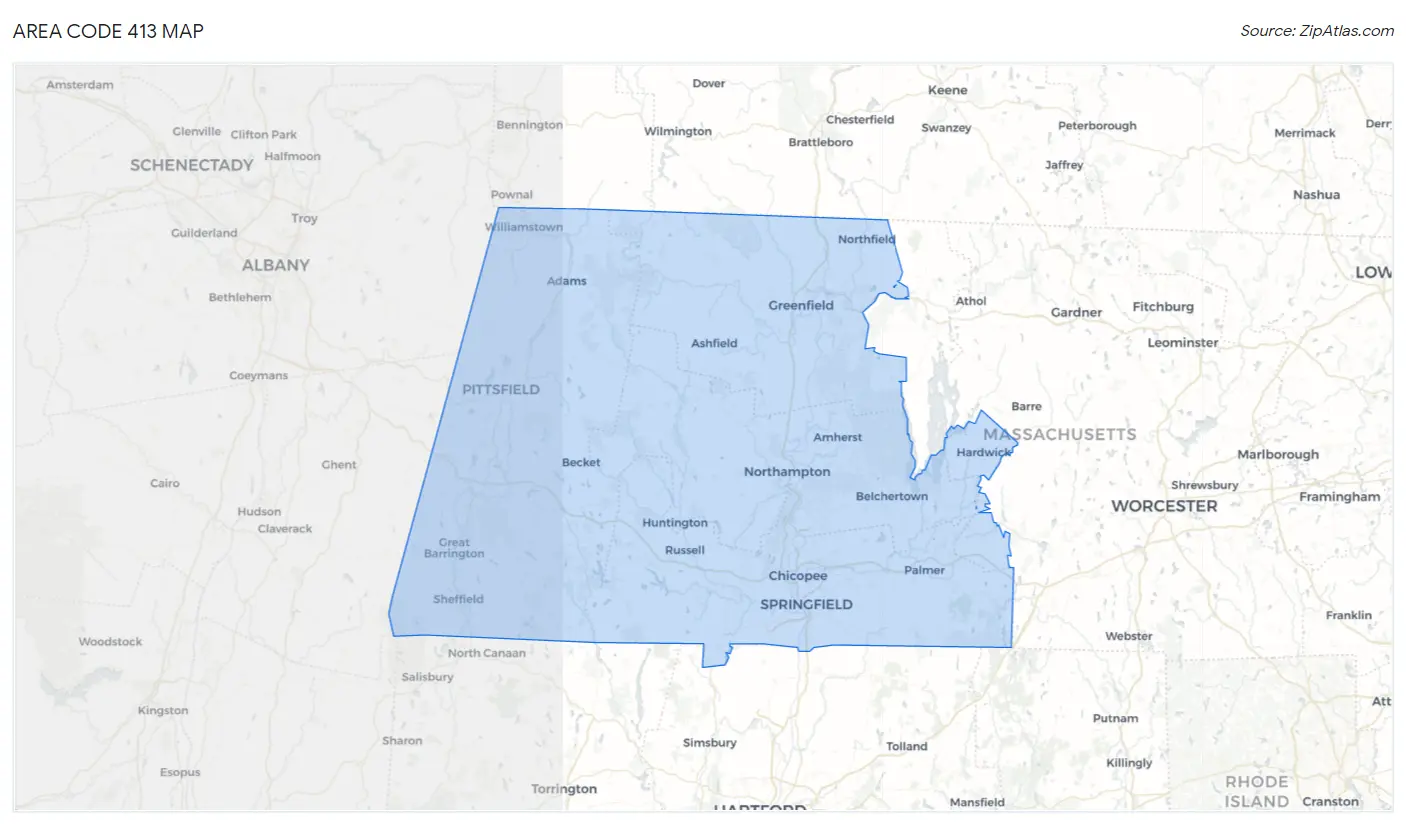
Area Code 413 Overview
$43,583
PER CAPITA INCOME
$101,242
AVG FAMILY INCOME
$79,080
AVG HOUSEHOLD INCOME
26.6%
WAGE / INCOME GAP [ % ]
73.4¢/ $1
WAGE / INCOME GAP [ $ ]
$10,823
FAMILY INCOME DEFICIT
48.36
INEQUALITY / GINI INDEX
807,334
TOTAL POPULATION
391,864
MALE POPULATION
415,470
FEMALE POPULATION
94.32
MALES / 100 FEMALES
106.02
FEMALES / 100 MALES
46.7
MEDIAN AGE
2.8
AVG FAMILY SIZE
2.3
AVG HOUSEHOLD SIZE
416,730
LABOR FORCE [ PEOPLE ]
61.9%
PERCENT IN LABOR FORCE
5.5%
UNEMPLOYMENT RATE
Income in Area Code 413
Income Overview in Area Code 413
Per Capita Income in Area Code 413 is $43,583, while median incomes of families and households are $101,242 and $79,080 respectively.
| Characteristic | Number | Measure |
| Per Capita Income | 807,334 | $43,583 |
| Median Family Income | 198,903 | $101,242 |
| Mean Family Income | 198,903 | $13,670,051 |
| Median Household Income | 327,428 | $79,080 |
| Mean Household Income | 327,428 | $11,430,372 |
| Income Deficit | 198,903 | $10,823 |
| Wage / Income Gap (%) | 807,334 | 26.58% |
| Wage / Income Gap ($) | 807,334 | 73.42¢ per $1 |
| Gini / Inequality Index | 807,334 | 48.36 |
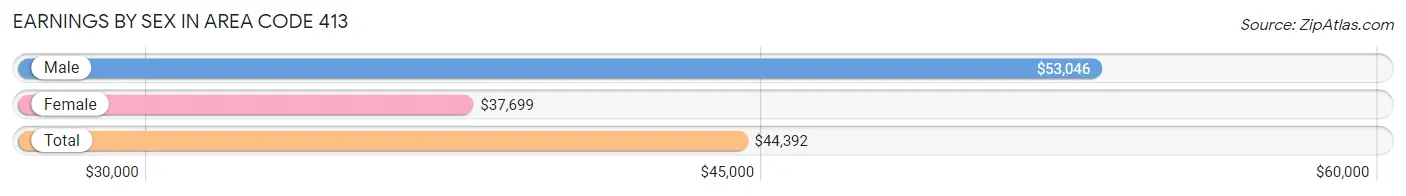
Earnings by Sex in Area Code 413
Average Earnings in Area Code 413 are $44,392, $53,046 for men and $37,699 for women, a difference of 28.9%.
| Sex | Number | Average Earnings |
| Male | 218,505 (50.0%) | $53,046 |
| Female | 218,321 (50.0%) | $37,699 |
| Total | 436,826 (100.0%) | $44,392 |
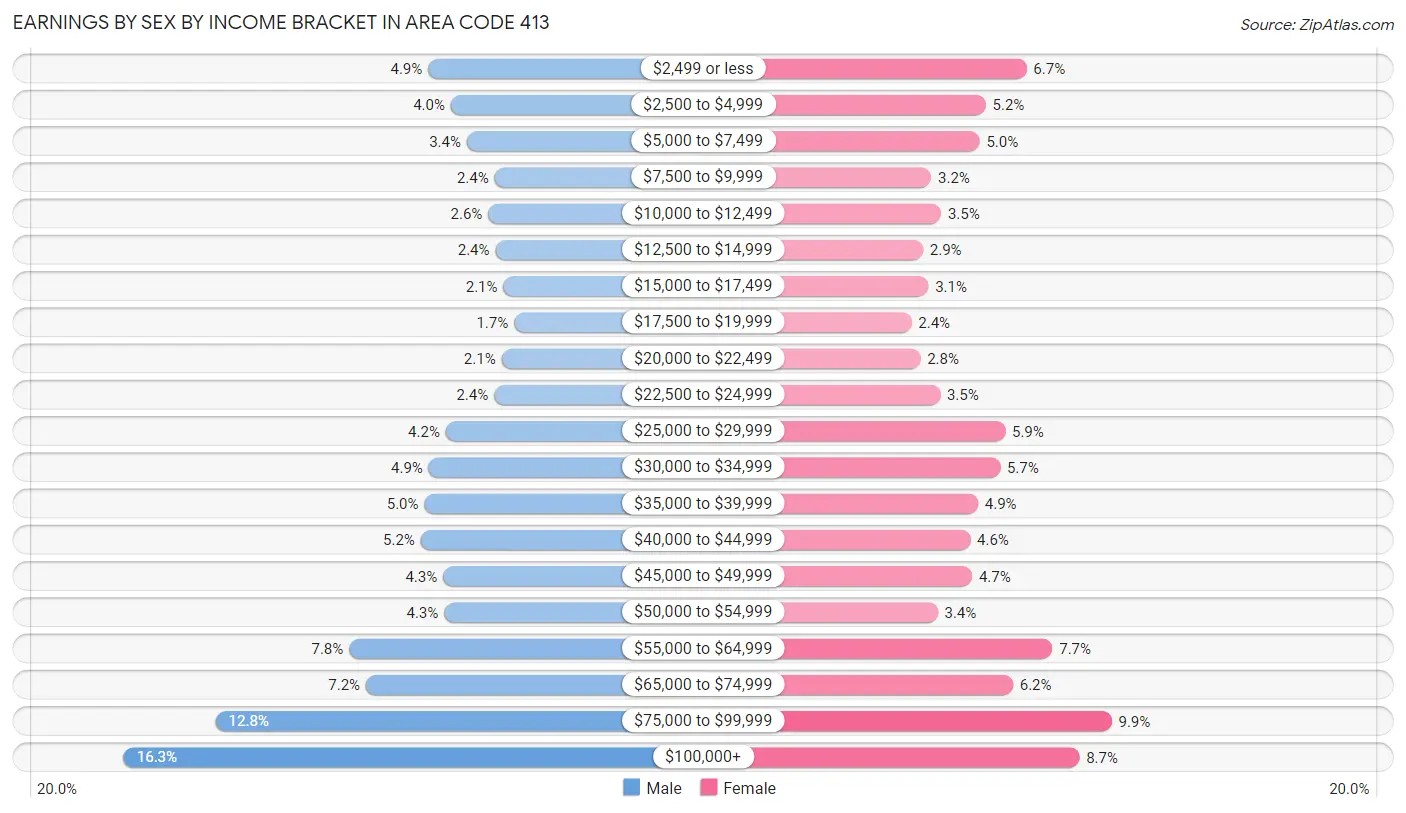
Earnings by Sex by Income Bracket in Area Code 413
The most common earnings brackets in Area Code 413 are $100,000+ for men (35,565 | 16.3%) and $75,000 to $99,999 for women (21,667 | 9.9%).
| Income | Male | Female |
| $2,499 or less | 10,670 (4.9%) | 14,683 (6.7%) |
| $2,500 to $4,999 | 8,809 (4.0%) | 11,345 (5.2%) |
| $5,000 to $7,499 | 7,488 (3.4%) | 10,847 (5.0%) |
| $7,500 to $9,999 | 5,216 (2.4%) | 6,904 (3.2%) |
| $10,000 to $12,499 | 5,737 (2.6%) | 7,703 (3.5%) |
| $12,500 to $14,999 | 5,154 (2.4%) | 6,219 (2.9%) |
| $15,000 to $17,499 | 4,506 (2.1%) | 6,664 (3.0%) |
| $17,500 to $19,999 | 3,627 (1.7%) | 5,273 (2.4%) |
| $20,000 to $22,499 | 4,659 (2.1%) | 6,011 (2.8%) |
| $22,500 to $24,999 | 5,268 (2.4%) | 7,623 (3.5%) |
| $25,000 to $29,999 | 9,227 (4.2%) | 12,953 (5.9%) |
| $30,000 to $34,999 | 10,609 (4.9%) | 12,539 (5.7%) |
| $35,000 to $39,999 | 10,961 (5.0%) | 10,722 (4.9%) |
| $40,000 to $44,999 | 11,267 (5.2%) | 10,087 (4.6%) |
| $45,000 to $49,999 | 9,445 (4.3%) | 10,241 (4.7%) |
| $50,000 to $54,999 | 9,356 (4.3%) | 7,413 (3.4%) |
| $55,000 to $64,999 | 17,136 (7.8%) | 16,821 (7.7%) |
| $65,000 to $74,999 | 15,749 (7.2%) | 13,580 (6.2%) |
| $75,000 to $99,999 | 28,056 (12.8%) | 21,667 (9.9%) |
| $100,000+ | 35,565 (16.3%) | 19,026 (8.7%) |
| Total | 218,505 (100.0%) | 218,321 (100.0%) |
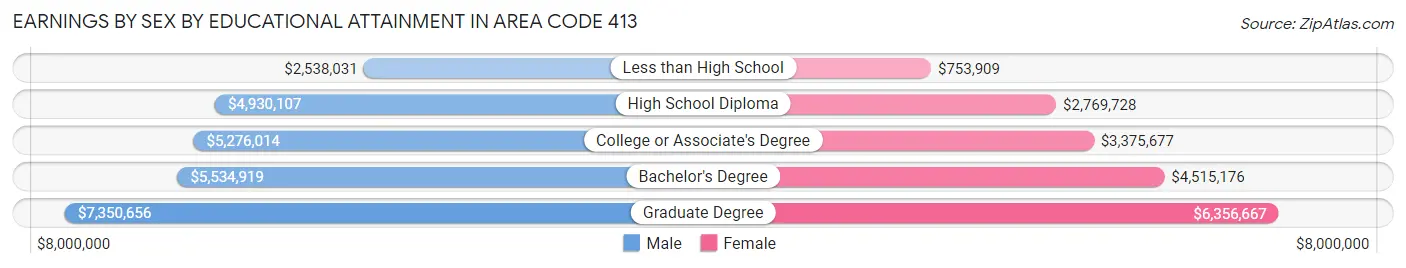
Earnings by Sex by Educational Attainment in Area Code 413
Average earnings in Area Code 413 are $6,227,709 for men and $4,523,257 for women, a difference of 27.4%. Men with an educational attainment of graduate degree enjoy the highest average annual earnings of $7,350,656, while those with less than high school education earn the least with $2,538,031. Women with an educational attainment of graduate degree earn the most with the average annual earnings of $6,356,667, while those with less than high school education have the smallest earnings of $753,909.
| Educational Attainment | Male Income | Female Income |
| Less than High School | $2,538,031 | $753,909 |
| High School Diploma | $4,930,107 | $2,769,728 |
| College or Associate's Degree | $5,276,014 | $3,375,677 |
| Bachelor's Degree | $5,534,919 | $4,515,176 |
| Graduate Degree | $7,350,656 | $6,356,667 |
| Total | $6,227,709 | $4,523,257 |
Family Income in Area Code 413
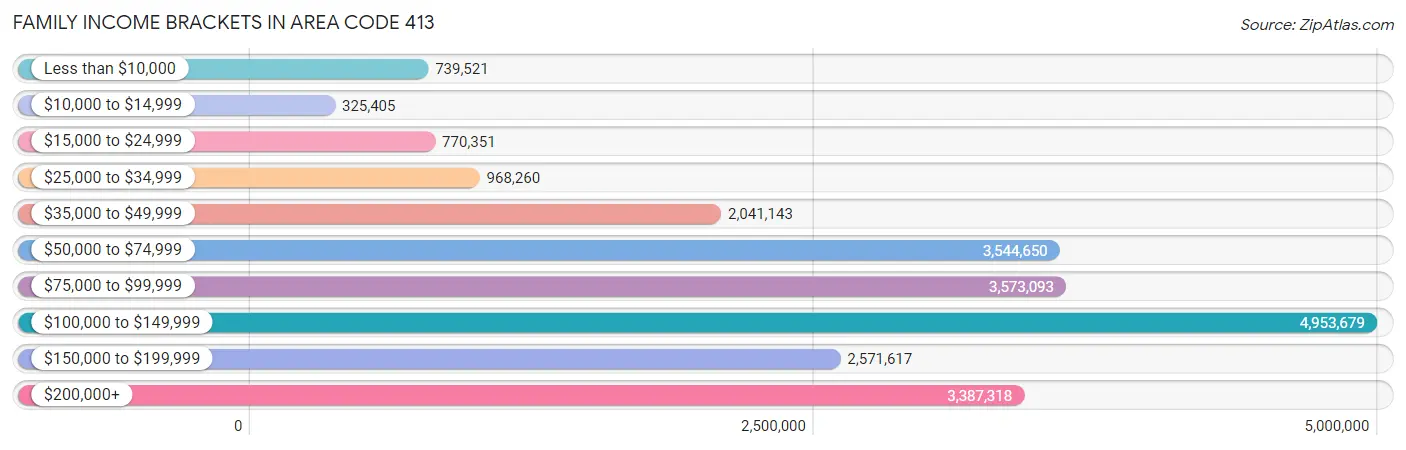
Family Income Brackets in Area Code 413
According to the Area Code 413 family income data, there are 4,953,679 families falling into the $100,000 to $149,999 income range, which is the most common income bracket and makes up 2,490.5% of all families. Conversely, the $10,000 to $14,999 income bracket is the least frequent group with only 325,405 families (163.6%) belonging to this category.
| Income Bracket | # Families | % Families |
| Less than $10,000 | 739,521 | 371.8% |
| $10,000 to $14,999 | 325,405 | 163.6% |
| $15,000 to $24,999 | 770,351 | 387.3% |
| $25,000 to $34,999 | 968,260 | 486.8% |
| $35,000 to $49,999 | 2,041,143 | 1,026.2% |
| $50,000 to $74,999 | 3,544,650 | 1,782.1% |
| $75,000 to $99,999 | 3,573,093 | 1,796.4% |
| $100,000 to $149,999 | 4,953,679 | 2,490.5% |
| $150,000 to $199,999 | 2,571,617 | 1,292.9% |
| $200,000+ | 3,387,318 | 1,703.0% |
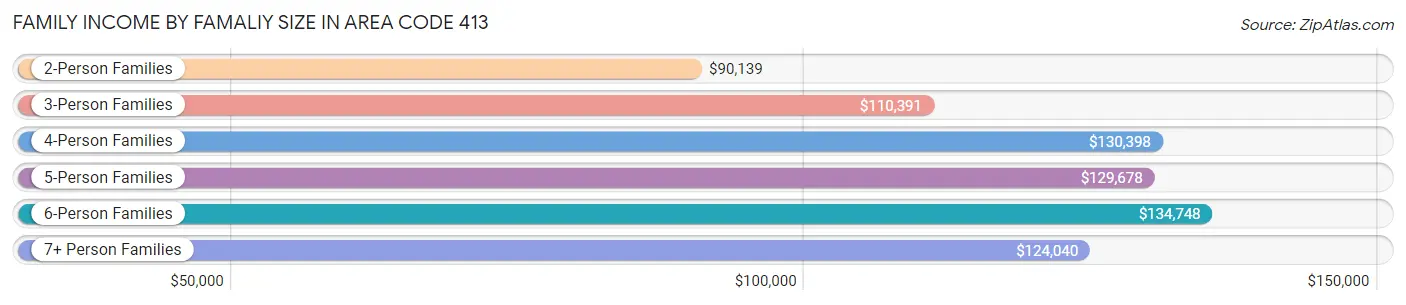
Family Income by Famaliy Size in Area Code 413
6-person families (3,940 | 2.0%) account for the highest median family income in Area Code 413 with $134,748 per family, while 2-person families (99,885 | 50.2%) have the highest median income of $45,069 per family member.
| Income Bracket | # Families | Median Income |
| 2-Person Families | 99,885 (50.2%) | $90,139 |
| 3-Person Families | 47,028 (23.6%) | $110,391 |
| 4-Person Families | 33,937 (17.1%) | $130,398 |
| 5-Person Families | 12,062 (6.1%) | $129,678 |
| 6-Person Families | 3,940 (2.0%) | $134,748 |
| 7+ Person Families | 2,051 (1.0%) | $124,040 |
| Total | 198,903 (100.0%) | $101,242 |
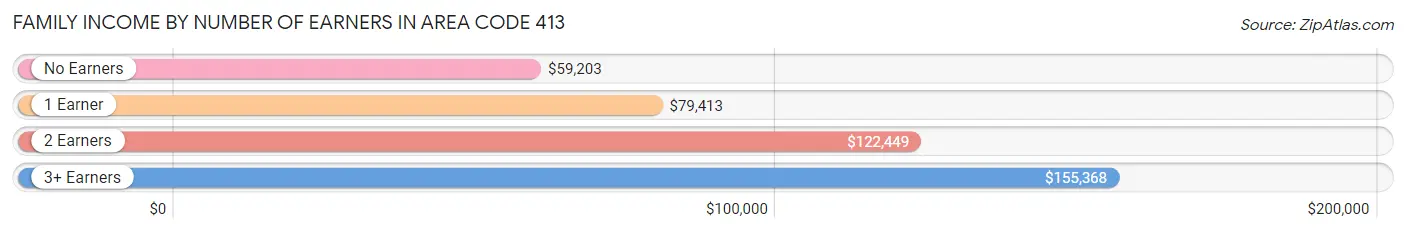
Family Income by Number of Earners in Area Code 413
The median family income in Area Code 413 is $101,242, with families comprising 3+ earners (24,546) having the highest median family income of $155,368, while families with no earners (32,263) have the lowest median family income of $59,203, accounting for 12.3% and 16.2% of families, respectively.
| Number of Earners | # Families | Median Income |
| No Earners | 32,263 (16.2%) | $59,203 |
| 1 Earner | 63,061 (31.7%) | $79,413 |
| 2 Earners | 79,033 (39.7%) | $122,449 |
| 3+ Earners | 24,546 (12.3%) | $155,368 |
| Total | 198,903 (100.0%) | $101,242 |
Household Income in Area Code 413
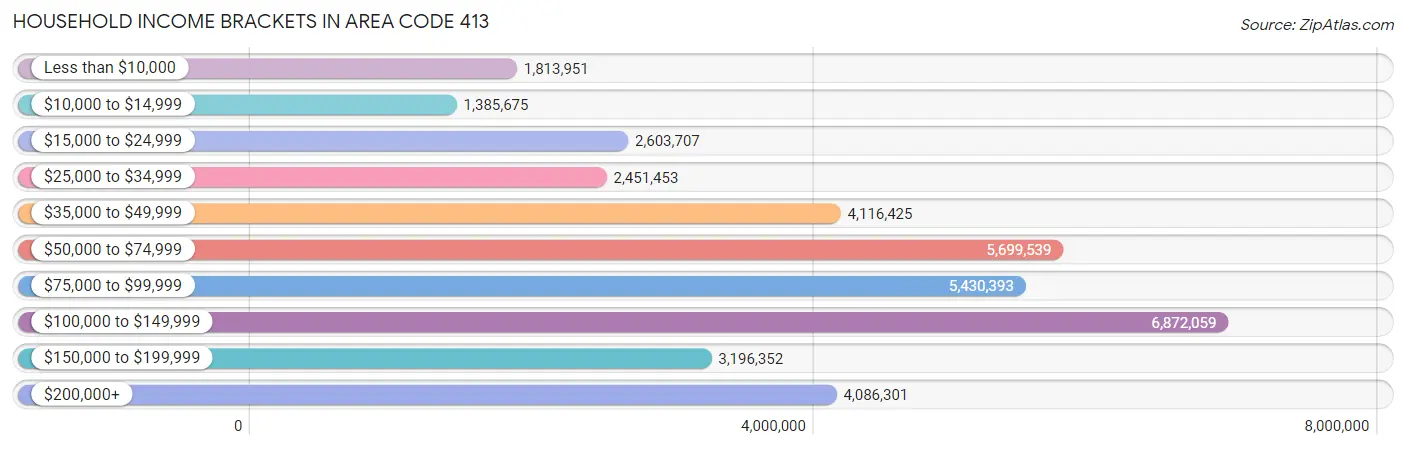
Household Income Brackets in Area Code 413
With 6,872,059 households falling in the category, the $100,000 to $149,999 income range is the most frequent in Area Code 413, accounting for 2,098.8% of all households. In contrast, only 1,385,675 households (423.2%) fall into the $10,000 to $14,999 income bracket, making it the least populous group.
| Income Bracket | # Households | % Households |
| Less than $10,000 | 1,813,951 | 554.0% |
| $10,000 to $14,999 | 1,385,675 | 423.2% |
| $15,000 to $24,999 | 2,603,707 | 795.2% |
| $25,000 to $34,999 | 2,451,453 | 748.7% |
| $35,000 to $49,999 | 4,116,425 | 1,257.2% |
| $50,000 to $74,999 | 5,699,539 | 1,740.7% |
| $75,000 to $99,999 | 5,430,393 | 1,658.5% |
| $100,000 to $149,999 | 6,872,059 | 2,098.8% |
| $150,000 to $199,999 | 3,196,352 | 976.2% |
| $200,000+ | 4,086,301 | 1,248.0% |
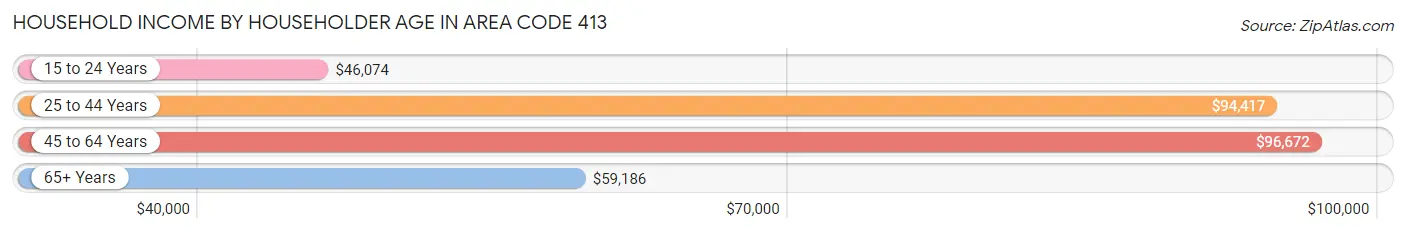
Household Income by Householder Age in Area Code 413
The median household income in Area Code 413 is $79,080, with the highest median household income of $96,672 found in the 45 to 64 years age bracket for the primary householder. A total of 124,752 households (38.1%) fall into this category. Meanwhile, the 15 to 24 years age bracket for the primary householder has the lowest median household income of $46,074, with 10,469 households (3.2%) in this group.
| Income Bracket | # Households | Median Income |
| 15 to 24 Years | 10,469 (3.2%) | $46,074 |
| 25 to 44 Years | 92,632 (28.3%) | $94,417 |
| 45 to 64 Years | 124,752 (38.1%) | $96,672 |
| 65+ Years | 99,575 (30.4%) | $59,186 |
| Total | 327,428 (100.0%) | $79,080 |
Poverty in Area Code 413
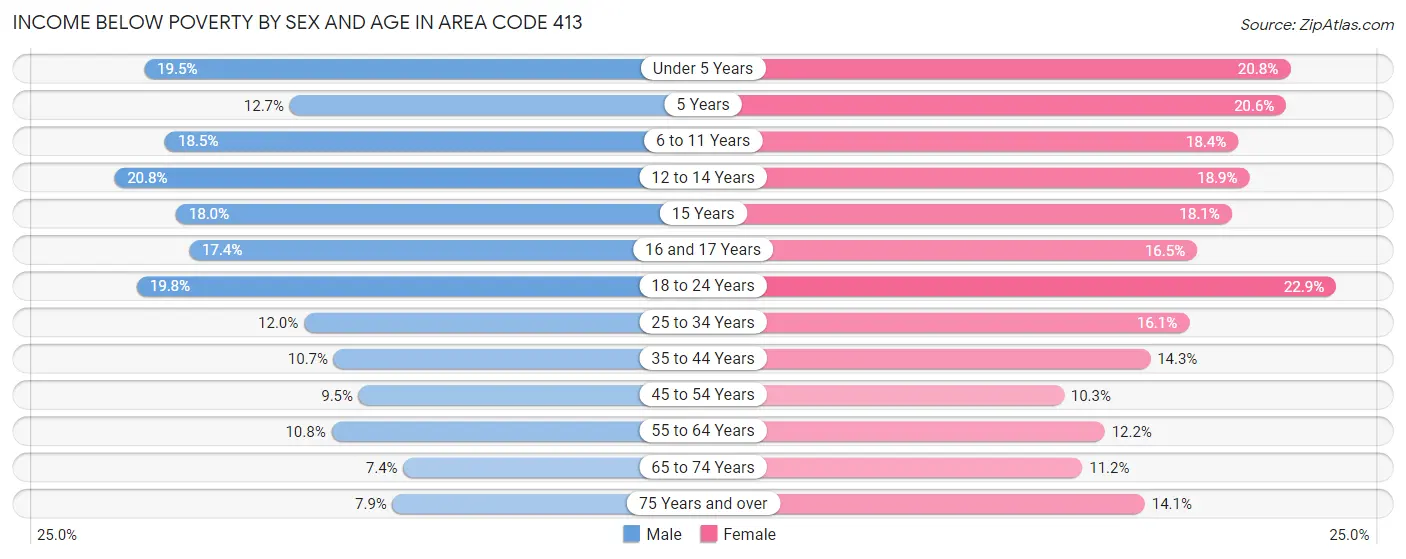
Income Below Poverty by Sex and Age in Area Code 413
With 12.7% poverty level for males and 14.8% for females among the residents of Area Code 413, 12 to 14 year old males and 18 to 24 year old females are the most vulnerable to poverty, with 3,129 males (20.8%) and 7,068 females (22.9%) in their respective age groups living below the poverty level.
| Age Bracket | Male | Female |
| Under 5 Years | 3,638 (19.5%) | 3,701 (20.8%) |
| 5 Years | 409 (12.7%) | 843 (20.6%) |
| 6 to 11 Years | 4,739 (18.5%) | 4,470 (18.4%) |
| 12 to 14 Years | 3,129 (20.8%) | 2,277 (18.9%) |
| 15 Years | 997 (18.0%) | 783 (18.1%) |
| 16 and 17 Years | 1,642 (17.4%) | 1,547 (16.5%) |
| 18 to 24 Years | 6,827 (19.8%) | 7,068 (22.9%) |
| 25 to 34 Years | 5,916 (12.0%) | 7,814 (16.1%) |
| 35 to 44 Years | 4,762 (10.6%) | 6,866 (14.3%) |
| 45 to 54 Years | 4,477 (9.5%) | 5,209 (10.3%) |
| 55 to 64 Years | 5,934 (10.8%) | 7,206 (12.2%) |
| 65 to 74 Years | 3,158 (7.4%) | 5,372 (11.2%) |
| 75 Years and over | 1,906 (7.9%) | 4,969 (14.1%) |
| Total | 47,534 (12.7%) | 58,125 (14.8%) |
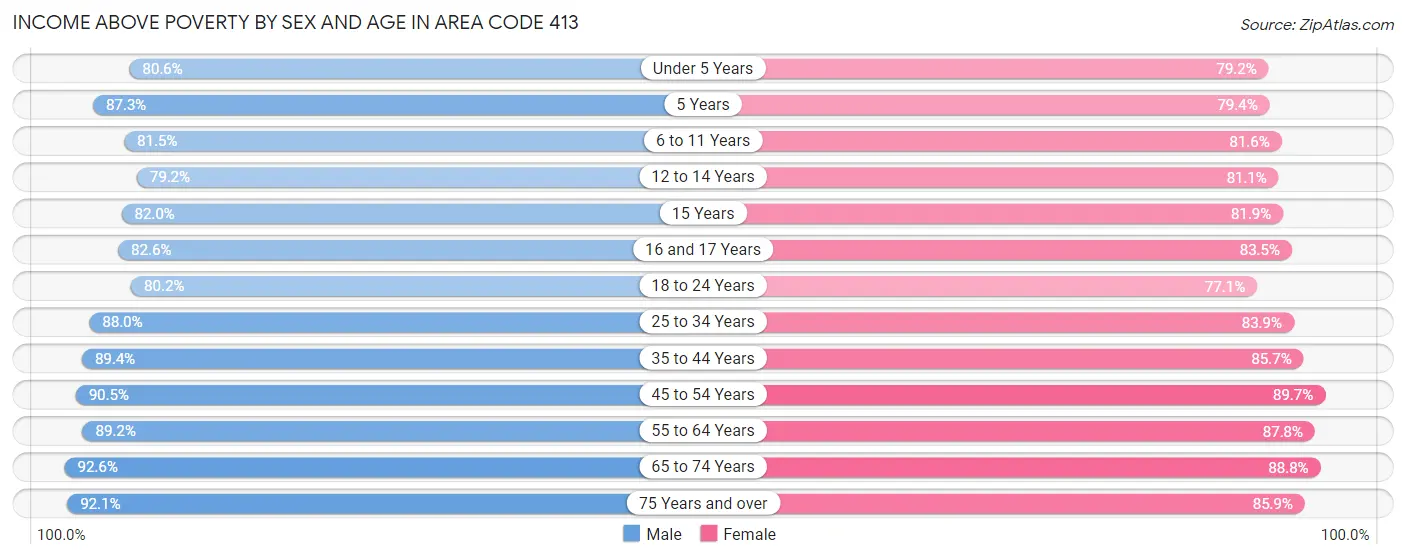
Income Above Poverty by Sex and Age in Area Code 413
According to the poverty statistics in Area Code 413, males aged 65 to 74 years and females aged 45 to 54 years are the age groups that are most secure financially, with 92.6% of males and 89.7% of females in these age groups living above the poverty line.
| Age Bracket | Male | Female |
| Under 5 Years | 15,064 (80.5%) | 14,089 (79.2%) |
| 5 Years | 2,814 (87.3%) | 3,245 (79.4%) |
| 6 to 11 Years | 20,911 (81.5%) | 19,834 (81.6%) |
| 12 to 14 Years | 11,887 (79.2%) | 9,767 (81.1%) |
| 15 Years | 4,548 (82.0%) | 3,545 (81.9%) |
| 16 and 17 Years | 7,810 (82.6%) | 7,838 (83.5%) |
| 18 to 24 Years | 27,663 (80.2%) | 23,753 (77.1%) |
| 25 to 34 Years | 43,241 (88.0%) | 40,684 (83.9%) |
| 35 to 44 Years | 39,958 (89.3%) | 41,128 (85.7%) |
| 45 to 54 Years | 42,679 (90.5%) | 45,353 (89.7%) |
| 55 to 64 Years | 49,238 (89.2%) | 51,871 (87.8%) |
| 65 to 74 Years | 39,381 (92.6%) | 42,749 (88.8%) |
| 75 Years and over | 22,145 (92.1%) | 30,365 (85.9%) |
| Total | 327,339 (87.3%) | 334,221 (85.2%) |
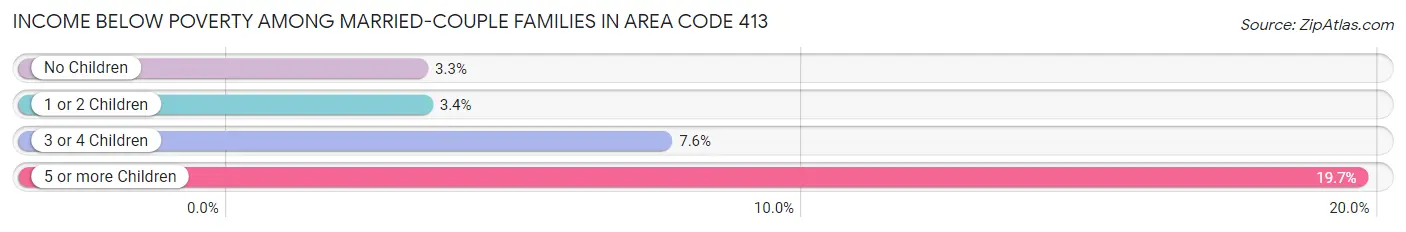
Income Below Poverty Among Married-Couple Families in Area Code 413
The poverty statistics for married-couple families in Area Code 413 show that 3.6% or 5,018 of the total 138,259 families live below the poverty line. Families with 5 or more children have the highest poverty rate of 19.7%, comprising of 111 families. On the other hand, families with no children have the lowest poverty rate of 3.3%, which includes 2,998 families.
| Children | Above Poverty | Below Poverty |
| No Children | 87,693 (96.7%) | 2,998 (3.3%) |
| 1 or 2 Children | 38,064 (96.6%) | 1,334 (3.4%) |
| 3 or 4 Children | 7,031 (92.4%) | 575 (7.6%) |
| 5 or more Children | 453 (80.3%) | 111 (19.7%) |
| Total | 133,241 (96.4%) | 5,018 (3.6%) |
Income Below Poverty Among Single-Parent Households in Area Code 413
According to the poverty data in Area Code 413, 10.6% or 1,744 single-father households and 24.6% or 10,890 single-mother households are living below the poverty line. Among single-father households, those with 5 or more children have the highest poverty rate, with 23 households (48.9%) experiencing poverty. Likewise, among single-mother households, those with 5 or more children have the highest poverty rate, with 322 households (74.7%) falling below the poverty line.
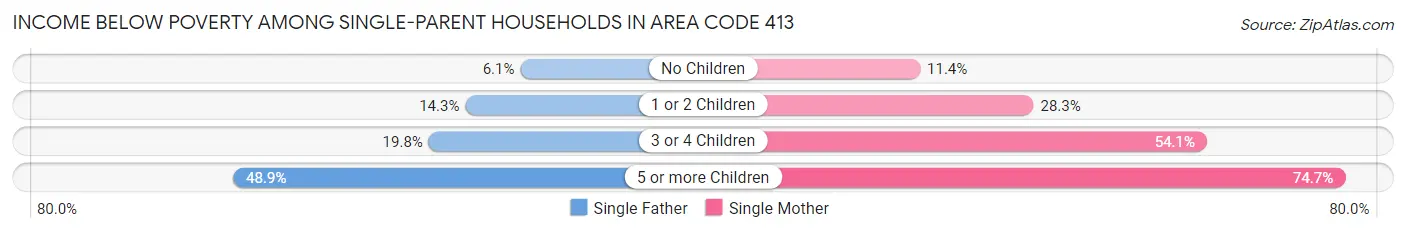
| Children | Single Father | Single Mother |
| No Children | 505 (6.1%) | 1,867 (11.4%) |
| 1 or 2 Children | 1,031 (14.3%) | 6,728 (28.3%) |
| 3 or 4 Children | 185 (19.8%) | 1,973 (54.1%) |
| 5 or more Children | 23 (48.9%) | 322 (74.7%) |
| Total | 1,744 (10.6%) | 10,890 (24.6%) |
Income Below Poverty Among Married-Couple vs Single-Parent Households in Area Code 413
The poverty data for Area Code 413 shows that 5,018 of the married-couple family households (3.6%) and 12,634 of the single-parent households (20.8%) are living below the poverty level. Within the married-couple family households, those with 5 or more children have the highest poverty rate, with 111 households (19.7%) falling below the poverty line. Among the single-parent households, those with 5 or more children have the highest poverty rate, with 345 household (72.2%) living below poverty.
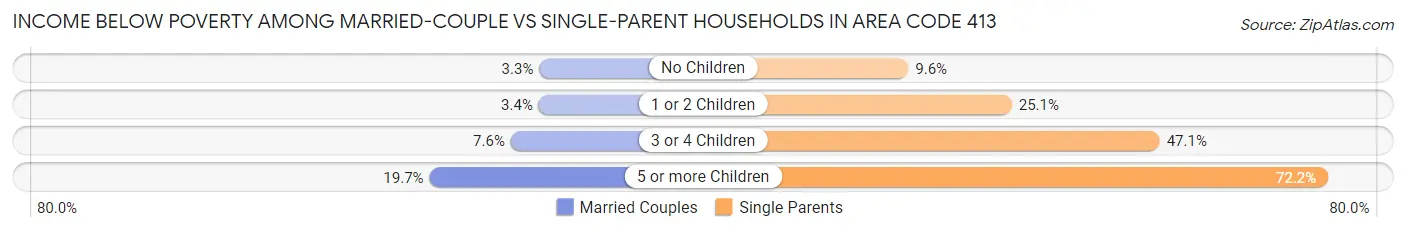
| Children | Married-Couple Families | Single-Parent Households |
| No Children | 2,998 (3.3%) | 2,372 (9.6%) |
| 1 or 2 Children | 1,334 (3.4%) | 7,759 (25.1%) |
| 3 or 4 Children | 575 (7.6%) | 2,158 (47.1%) |
| 5 or more Children | 111 (19.7%) | 345 (72.2%) |
| Total | 5,018 (3.6%) | 12,634 (20.8%) |
Race in Area Code 413
The most populous races in Area Code 413 are White / Caucasian (628,195 | 77.8%), Hispanic or Latino (143,743 | 17.8%), and Two or more Races (69,585 | 8.6%).
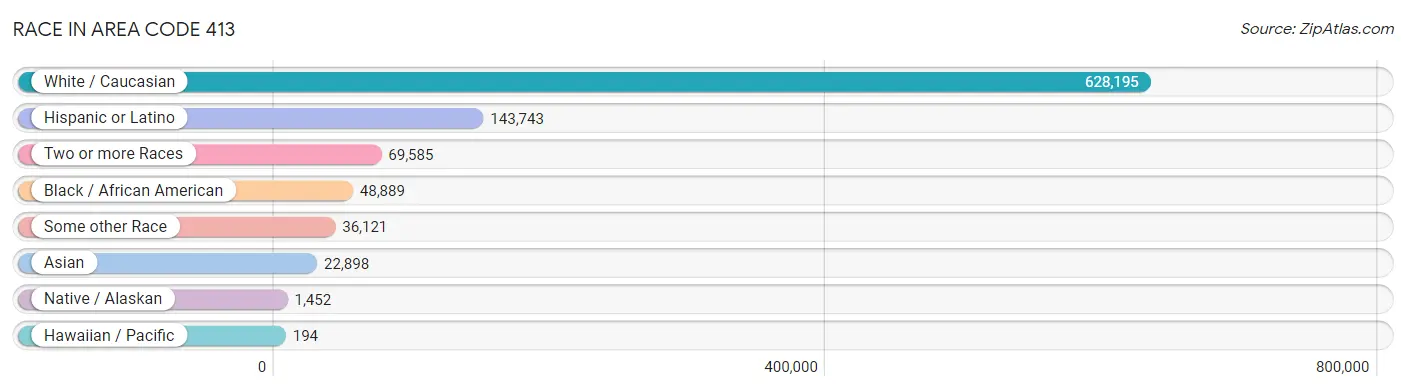
| Race | # Population | % Population |
| Asian | 22,898 | 2.8% |
| Black / African American | 48,889 | 6.1% |
| Hawaiian / Pacific | 194 | 0.0% |
| Hispanic or Latino | 143,743 | 17.8% |
| Native / Alaskan | 1,452 | 0.2% |
| White / Caucasian | 628,195 | 77.8% |
| Two or more Races | 69,585 | 8.6% |
| Some other Race | 36,121 | 4.5% |
| Total | 807,334 | 100.0% |
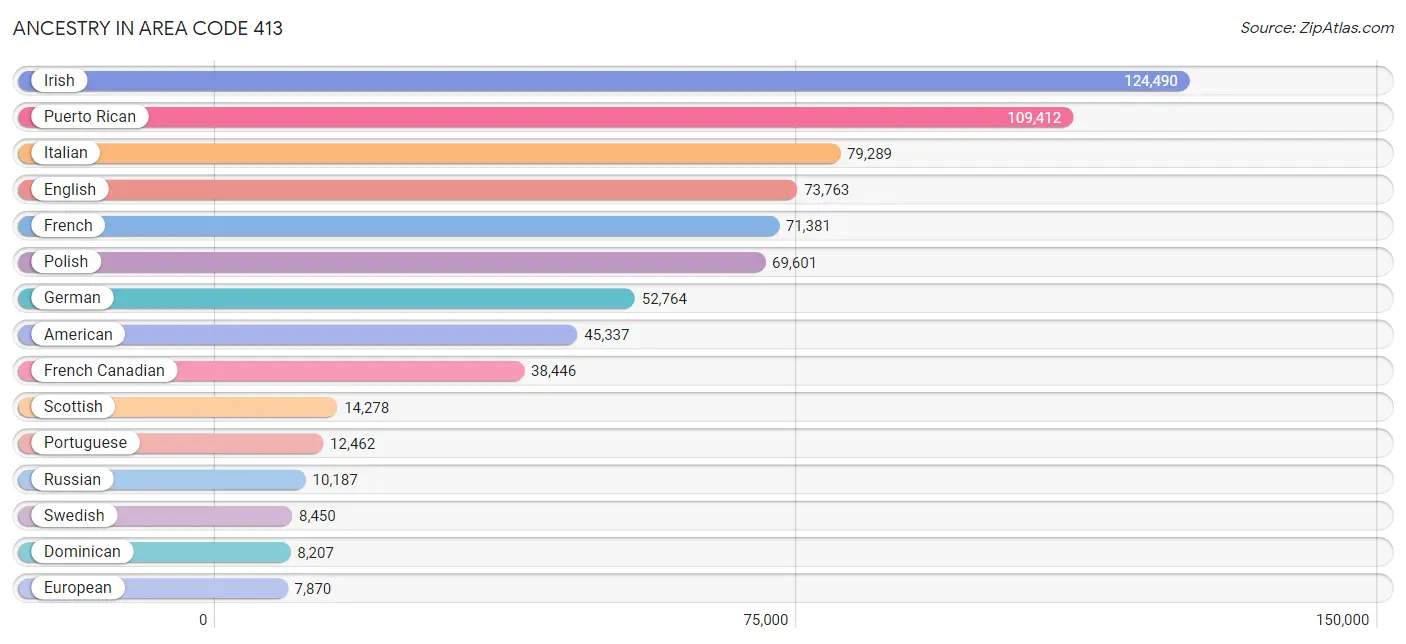
Ancestry in Area Code 413
The most populous ancestries reported in Area Code 413 are Irish (124,490 | 15.4%), Puerto Rican (109,412 | 13.6%), Italian (79,289 | 9.8%), English (73,763 | 9.1%), and French (71,381 | 8.8%), together accounting for 56.8% of all Area Code 413 residents.
| Ancestry | # Population | % Population |
| Afghan | 127 | 0.0% |
| African | 2,180 | 0.3% |
| Alaska Native | 13 | 0.0% |
| Albanian | 414 | 0.1% |
| Aleut | 5 | 0.0% |
| Alsatian | 47 | 0.0% |
| American | 45,337 | 5.6% |
| Apache | 46 | 0.0% |
| Arab | 5,059 | 0.6% |
| Argentinean | 369 | 0.1% |
| Armenian | 1,170 | 0.1% |
| Assyrian / Chaldean / Syriac | 23 | 0.0% |
| Australian | 136 | 0.0% |
| Austrian | 2,061 | 0.3% |
| Bahamian | 12 | 0.0% |
| Bangladeshi | 110 | 0.0% |
| Barbadian | 186 | 0.0% |
| Basque | 70 | 0.0% |
| Belgian | 454 | 0.1% |
| Belizean | 14 | 0.0% |
| Bhutanese | 1,438 | 0.2% |
| Blackfeet | 678 | 0.1% |
| Bolivian | 73 | 0.0% |
| Brazilian | 1,085 | 0.1% |
| British | 3,539 | 0.4% |
| British West Indian | 223 | 0.0% |
| Bulgarian | 144 | 0.0% |
| Burmese | 1,741 | 0.2% |
| Cajun | 28 | 0.0% |
| Cambodian | 13 | 0.0% |
| Canadian | 4,090 | 0.5% |
| Cape Verdean | 627 | 0.1% |
| Carpatho Rusyn | 4 | 0.0% |
| Celtic | 101 | 0.0% |
| Central American | 6,880 | 0.9% |
| Central American Indian | 915 | 0.1% |
| Cherokee | 1,170 | 0.1% |
| Chickasaw | 23 | 0.0% |
| Chilean | 167 | 0.0% |
| Chippewa | 61 | 0.0% |
| Choctaw | 131 | 0.0% |
| Colombian | 2,068 | 0.3% |
| Costa Rican | 362 | 0.0% |
| Cree | 6 | 0.0% |
| Creek | 112 | 0.0% |
| Croatian | 374 | 0.1% |
| Crow | 18 | 0.0% |
| Cuban | 1,585 | 0.2% |
| Cypriot | 5 | 0.0% |
| Czech | 1,964 | 0.2% |
| Czechoslovakian | 383 | 0.1% |
| Danish | 1,447 | 0.2% |
| Delaware | 20 | 0.0% |
| Dominican | 8,207 | 1.0% |
| Dutch | 4,560 | 0.6% |
| Eastern European | 3,995 | 0.5% |
| Ecuadorian | 1,653 | 0.2% |
| Egyptian | 212 | 0.0% |
| English | 73,763 | 9.1% |
| Estonian | 64 | 0.0% |
| Ethiopian | 56 | 0.0% |
| European | 7,870 | 1.0% |
| Filipino | 273 | 0.0% |
| Finnish | 1,783 | 0.2% |
| French | 71,381 | 8.8% |
| French American Indian | 310 | 0.0% |
| French Canadian | 38,446 | 4.8% |
| German | 52,764 | 6.5% |
| German Russian | 17 | 0.0% |
| Ghanaian | 628 | 0.1% |
| Greek | 6,056 | 0.7% |
| Guamanian / Chamorro | 92 | 0.0% |
| Guatemalan | 2,519 | 0.3% |
| Guyanese | 183 | 0.0% |
| Haitian | 994 | 0.1% |
| Honduran | 821 | 0.1% |
| Hungarian | 1,973 | 0.2% |
| Icelander | 111 | 0.0% |
| Indian (Asian) | 7,195 | 0.9% |
| Indonesian | 185 | 0.0% |
| Inupiat | 10 | 0.0% |
| Iranian | 589 | 0.1% |
| Iraqi | 1,005 | 0.1% |
| Irish | 124,490 | 15.4% |
| Iroquois | 205 | 0.0% |
| Israeli | 182 | 0.0% |
| Italian | 79,289 | 9.8% |
| Jamaican | 5,740 | 0.7% |
| Japanese | 1,866 | 0.2% |
| Jordanian | 66 | 0.0% |
| Kenyan | 303 | 0.0% |
| Korean | 1,854 | 0.2% |
| Laotian | 128 | 0.0% |
| Latvian | 172 | 0.0% |
| Lebanese | 2,452 | 0.3% |
| Liberian | 89 | 0.0% |
| Lithuanian | 4,729 | 0.6% |
| Luxembourger | 42 | 0.0% |
| Macedonian | 81 | 0.0% |
| Malaysian | 316 | 0.0% |
| Maltese | 82 | 0.0% |
| Mexican | 6,397 | 0.8% |
| Mexican American Indian | 204 | 0.0% |
| Mongolian | 108 | 0.0% |
| Moroccan | 344 | 0.0% |
| Native Hawaiian | 477 | 0.1% |
| Navajo | 52 | 0.0% |
| New Zealander | 91 | 0.0% |
| Nicaraguan | 514 | 0.1% |
| Nigerian | 977 | 0.1% |
| Northern European | 904 | 0.1% |
| Norwegian | 3,240 | 0.4% |
| Okinawan | 27 | 0.0% |
| Pakistani | 328 | 0.0% |
| Palestinian | 164 | 0.0% |
| Panamanian | 374 | 0.1% |
| Paraguayan | 22 | 0.0% |
| Pennsylvania German | 84 | 0.0% |
| Peruvian | 1,114 | 0.1% |
| Polish | 69,601 | 8.6% |
| Portuguese | 12,462 | 1.5% |
| Potawatomi | 32 | 0.0% |
| Pueblo | 3 | 0.0% |
| Puerto Rican | 109,412 | 13.6% |
| Romanian | 1,499 | 0.2% |
| Russian | 10,187 | 1.3% |
| Salvadoran | 2,270 | 0.3% |
| Samoan | 137 | 0.0% |
| Scandinavian | 1,288 | 0.2% |
| Scotch-Irish | 4,522 | 0.6% |
| Scottish | 14,278 | 1.8% |
| Seminole | 1 | 0.0% |
| Senegalese | 95 | 0.0% |
| Serbian | 250 | 0.0% |
| Sierra Leonean | 15 | 0.0% |
| Sioux | 81 | 0.0% |
| Slavic | 207 | 0.0% |
| Slovak | 1,016 | 0.1% |
| Slovene | 171 | 0.0% |
| Somali | 745 | 0.1% |
| South African | 238 | 0.0% |
| South American | 6,293 | 0.8% |
| South American Indian | 44 | 0.0% |
| Soviet Union | 21 | 0.0% |
| Spaniard | 1,194 | 0.2% |
| Spanish | 827 | 0.1% |
| Spanish American Indian | 192 | 0.0% |
| Sri Lankan | 2,873 | 0.4% |
| Subsaharan African | 6,555 | 0.8% |
| Sudanese | 48 | 0.0% |
| Swedish | 8,450 | 1.1% |
| Swiss | 1,120 | 0.1% |
| Syrian | 209 | 0.0% |
| Taiwanese | 9 | 0.0% |
| Thai | 4,961 | 0.6% |
| Tongan | 14 | 0.0% |
| Trinidadian and Tobagonian | 353 | 0.0% |
| Turkish | 1,527 | 0.2% |
| U.S. Virgin Islander | 83 | 0.0% |
| Ukrainian | 4,797 | 0.6% |
| Uruguayan | 333 | 0.0% |
| Venezuelan | 439 | 0.1% |
| Vietnamese | 150 | 0.0% |
| Welsh | 3,097 | 0.4% |
| West Indian | 708 | 0.1% |
| Yaqui | 18 | 0.0% |
| Yugoslavian | 212 | 0.0% |
| Zimbabwean | 20 | 0.0% | View All 168 Rows |
Immigrants in Area Code 413
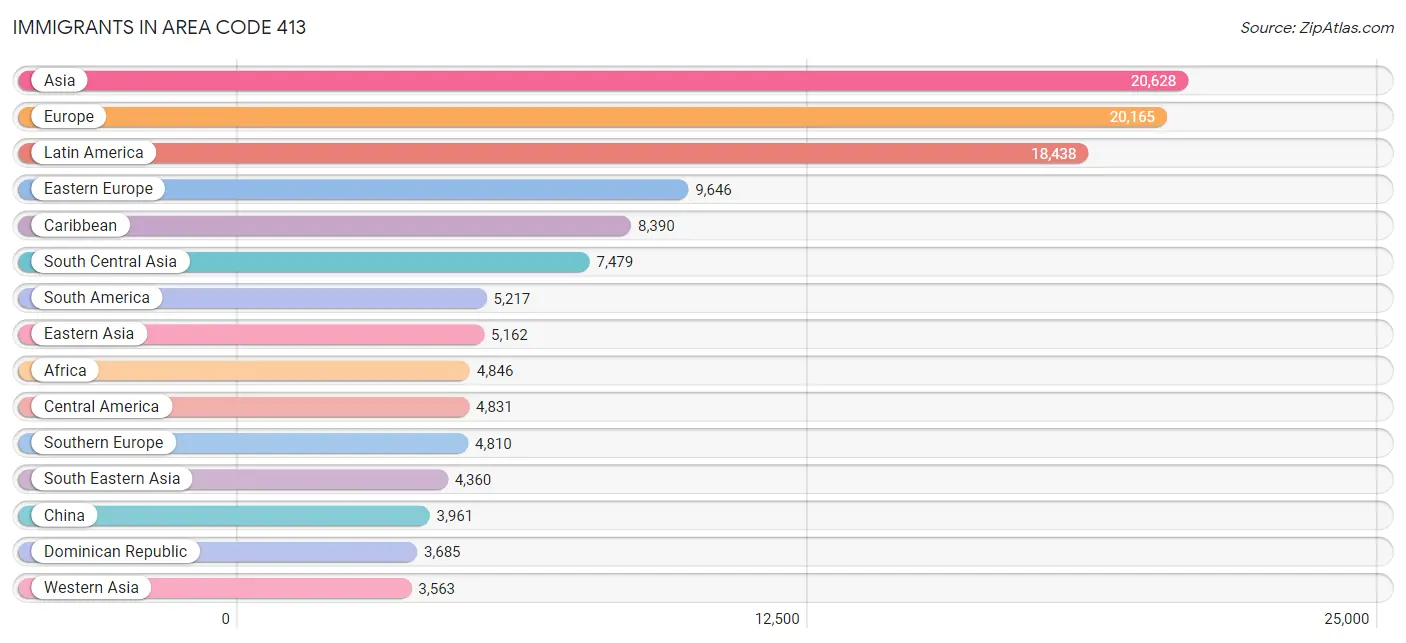
The most numerous immigrant groups reported in Area Code 413 came from Asia (20,628 | 2.6%), Europe (20,165 | 2.5%), Latin America (18,438 | 2.3%), Eastern Europe (9,646 | 1.2%), and Caribbean (8,390 | 1.0%), together accounting for 9.6% of all Area Code 413 residents.
| Immigration Origin | # Population | % Population |
| Afghanistan | 120 | 0.0% |
| Africa | 4,846 | 0.6% |
| Albania | 113 | 0.0% |
| Argentina | 324 | 0.0% |
| Armenia | 127 | 0.0% |
| Asia | 20,628 | 2.6% |
| Australia | 133 | 0.0% |
| Austria | 86 | 0.0% |
| Azores | 209 | 0.0% |
| Bahamas | 12 | 0.0% |
| Bangladesh | 168 | 0.0% |
| Barbados | 199 | 0.0% |
| Belarus | 605 | 0.1% |
| Belgium | 158 | 0.0% |
| Bolivia | 44 | 0.0% |
| Bosnia and Herzegovina | 67 | 0.0% |
| Brazil | 1,195 | 0.2% |
| Bulgaria | 105 | 0.0% |
| Cabo Verde | 33 | 0.0% |
| Cambodia | 750 | 0.1% |
| Cameroon | 79 | 0.0% |
| Canada | 2,911 | 0.4% |
| Caribbean | 8,390 | 1.0% |
| Central America | 4,831 | 0.6% |
| Chile | 68 | 0.0% |
| China | 3,961 | 0.5% |
| Colombia | 1,468 | 0.2% |
| Congo | 64 | 0.0% |
| Costa Rica | 133 | 0.0% |
| Croatia | 2 | 0.0% |
| Cuba | 227 | 0.0% |
| Czechoslovakia | 108 | 0.0% |
| Denmark | 34 | 0.0% |
| Dominica | 167 | 0.0% |
| Dominican Republic | 3,685 | 0.5% |
| Eastern Africa | 1,523 | 0.2% |
| Eastern Asia | 5,162 | 0.6% |
| Eastern Europe | 9,646 | 1.2% |
| Ecuador | 651 | 0.1% |
| Egypt | 72 | 0.0% |
| El Salvador | 1,245 | 0.2% |
| England | 900 | 0.1% |
| Ethiopia | 52 | 0.0% |
| Europe | 20,165 | 2.5% |
| Fiji | 17 | 0.0% |
| France | 434 | 0.1% |
| Germany | 1,481 | 0.2% |
| Ghana | 1,281 | 0.2% |
| Greece | 538 | 0.1% |
| Grenada | 24 | 0.0% |
| Guatemala | 1,492 | 0.2% |
| Guyana | 208 | 0.0% |
| Haiti | 294 | 0.0% |
| Honduras | 494 | 0.1% |
| Hong Kong | 101 | 0.0% |
| Hungary | 124 | 0.0% |
| India | 2,291 | 0.3% |
| Indonesia | 101 | 0.0% |
| Iran | 499 | 0.1% |
| Iraq | 1,375 | 0.2% |
| Ireland | 663 | 0.1% |
| Israel | 140 | 0.0% |
| Italy | 1,046 | 0.1% |
| Jamaica | 3,338 | 0.4% |
| Japan | 397 | 0.1% |
| Jordan | 82 | 0.0% |
| Kazakhstan | 373 | 0.1% |
| Kenya | 358 | 0.0% |
| Korea | 804 | 0.1% |
| Kuwait | 23 | 0.0% |
| Laos | 161 | 0.0% |
| Latin America | 18,438 | 2.3% |
| Latvia | 75 | 0.0% |
| Lebanon | 387 | 0.1% |
| Liberia | 35 | 0.0% |
| Lithuania | 57 | 0.0% |
| Malaysia | 192 | 0.0% |
| Mexico | 1,203 | 0.2% |
| Middle Africa | 272 | 0.0% |
| Moldova | 880 | 0.1% |
| Morocco | 301 | 0.0% |
| Nepal | 1,564 | 0.2% |
| Netherlands | 104 | 0.0% |
| Nicaragua | 213 | 0.0% |
| Nigeria | 507 | 0.1% |
| Northern Africa | 458 | 0.1% |
| Northern Europe | 3,354 | 0.4% |
| Norway | 17 | 0.0% |
| Oceania | 181 | 0.0% |
| Pakistan | 904 | 0.1% |
| Panama | 51 | 0.0% |
| Peru | 733 | 0.1% |
| Philippines | 827 | 0.1% |
| Poland | 2,466 | 0.3% |
| Portugal | 3,117 | 0.4% |
| Romania | 187 | 0.0% |
| Russia | 1,920 | 0.2% |
| Saudi Arabia | 17 | 0.0% |
| Scotland | 167 | 0.0% |
| Senegal | 81 | 0.0% |
| Serbia | 73 | 0.0% |
| Sierra Leone | 28 | 0.0% |
| Singapore | 188 | 0.0% |
| Somalia | 280 | 0.0% |
| South Africa | 202 | 0.0% |
| South America | 5,217 | 0.6% |
| South Central Asia | 7,479 | 0.9% |
| South Eastern Asia | 4,360 | 0.5% |
| Southern Europe | 4,810 | 0.6% |
| Spain | 109 | 0.0% |
| Sri Lanka | 301 | 0.0% |
| St. Vincent and the Grenadines | 7 | 0.0% |
| Sudan | 33 | 0.0% |
| Sweden | 153 | 0.0% |
| Switzerland | 78 | 0.0% |
| Syria | 260 | 0.0% |
| Taiwan | 479 | 0.1% |
| Thailand | 407 | 0.1% |
| Trinidad and Tobago | 235 | 0.0% |
| Turkey | 727 | 0.1% |
| Uganda | 15 | 0.0% |
| Ukraine | 2,478 | 0.3% |
| Uruguay | 168 | 0.0% |
| Uzbekistan | 110 | 0.0% |
| Venezuela | 299 | 0.0% |
| Vietnam | 1,637 | 0.2% |
| West Indies | 143 | 0.0% |
| Western Africa | 2,186 | 0.3% |
| Western Asia | 3,563 | 0.4% |
| Western Europe | 2,355 | 0.3% |
| Yemen | 45 | 0.0% |
| Zaire | 27 | 0.0% |
| Zimbabwe | 31 | 0.0% | View All 133 Rows |
Sex and Age in Area Code 413
Sex and Age in Area Code 413
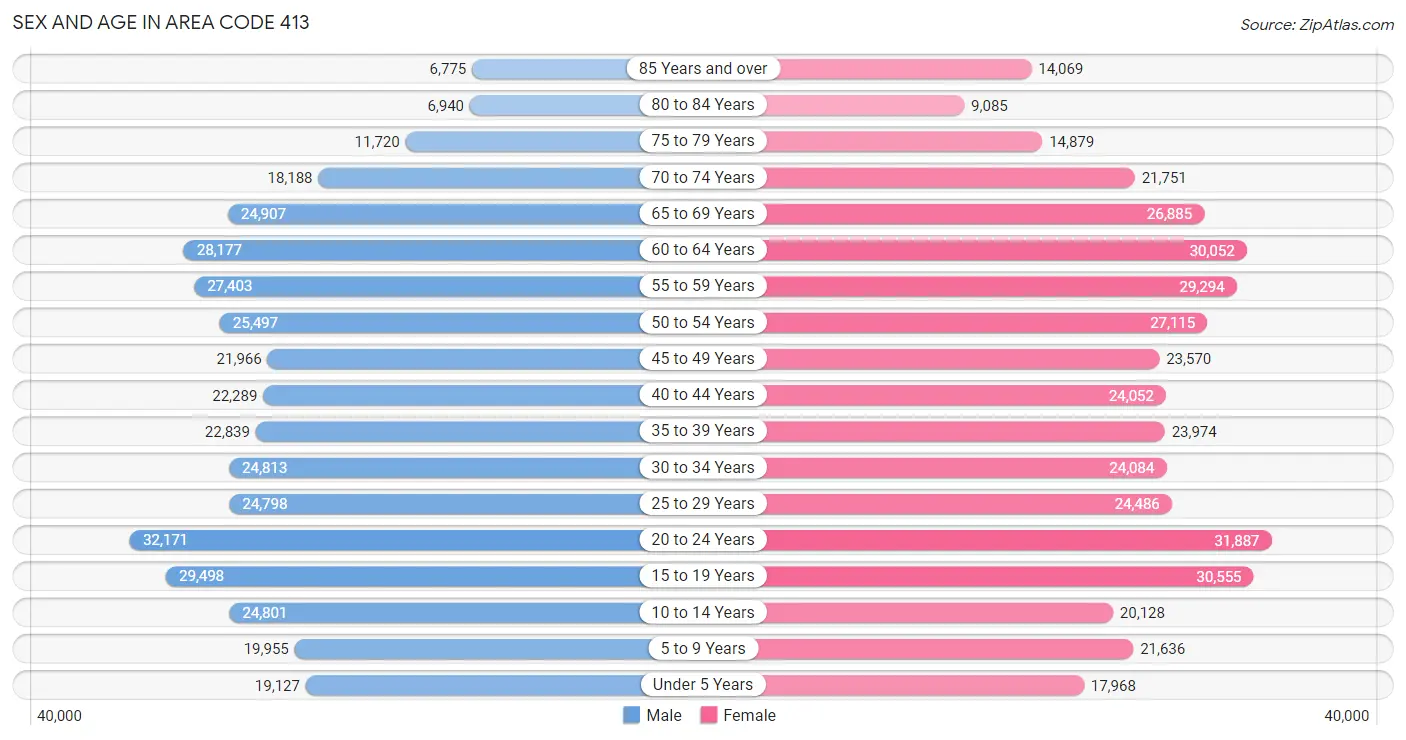
The most populous age groups in Area Code 413 are 20 to 24 Years (32,171 | 8.2%) for men and 20 to 24 Years (31,887 | 7.7%) for women.
| Age Bracket | Male | Female |
| Under 5 Years | 19,127 (4.9%) | 17,968 (4.3%) |
| 5 to 9 Years | 19,955 (5.1%) | 21,636 (5.2%) |
| 10 to 14 Years | 24,801 (6.3%) | 20,128 (4.8%) |
| 15 to 19 Years | 29,498 (7.5%) | 30,555 (7.3%) |
| 20 to 24 Years | 32,171 (8.2%) | 31,887 (7.7%) |
| 25 to 29 Years | 24,798 (6.3%) | 24,486 (5.9%) |
| 30 to 34 Years | 24,813 (6.3%) | 24,084 (5.8%) |
| 35 to 39 Years | 22,839 (5.8%) | 23,974 (5.8%) |
| 40 to 44 Years | 22,289 (5.7%) | 24,052 (5.8%) |
| 45 to 49 Years | 21,966 (5.6%) | 23,570 (5.7%) |
| 50 to 54 Years | 25,497 (6.5%) | 27,115 (6.5%) |
| 55 to 59 Years | 27,403 (7.0%) | 29,294 (7.0%) |
| 60 to 64 Years | 28,177 (7.2%) | 30,052 (7.2%) |
| 65 to 69 Years | 24,907 (6.4%) | 26,885 (6.5%) |
| 70 to 74 Years | 18,188 (4.6%) | 21,751 (5.2%) |
| 75 to 79 Years | 11,720 (3.0%) | 14,879 (3.6%) |
| 80 to 84 Years | 6,940 (1.8%) | 9,085 (2.2%) |
| 85 Years and over | 6,775 (1.7%) | 14,069 (3.4%) |
| Total | 391,864 (100.0%) | 415,470 (100.0%) |
Families and Households in Area Code 413
Median Family Size in Area Code 413
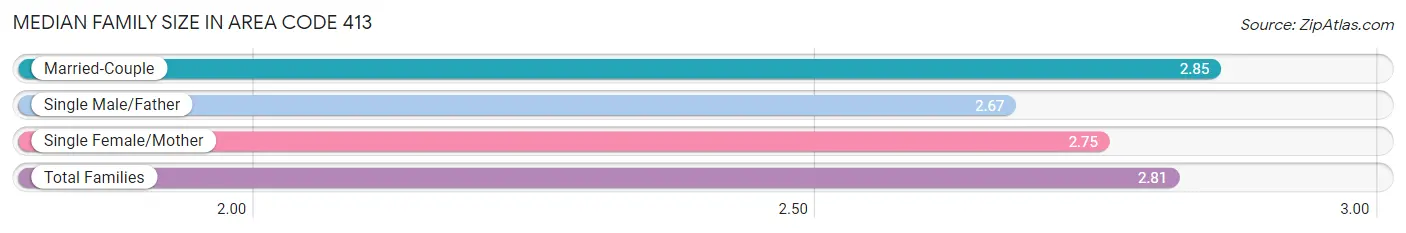
The median family size in Area Code 413 is 2.81 persons per family, with married-couple families (138,259 | 69.5%) accounting for the largest median family size of 2.85201 persons per family. On the other hand, single male/father families (16,394 | 8.2%) represent the smallest median family size with 2.67 persons per family.
| Family Type | # Families | Family Size |
| Married-Couple | 138,259 (69.5%) | 2.85 |
| Single Male/Father | 16,394 (8.2%) | 2.67 |
| Single Female/Mother | 44,250 (22.3%) | 2.75 |
| Total Families | 198,903 (100.0%) | 2.81 |
Median Household Size in Area Code 413
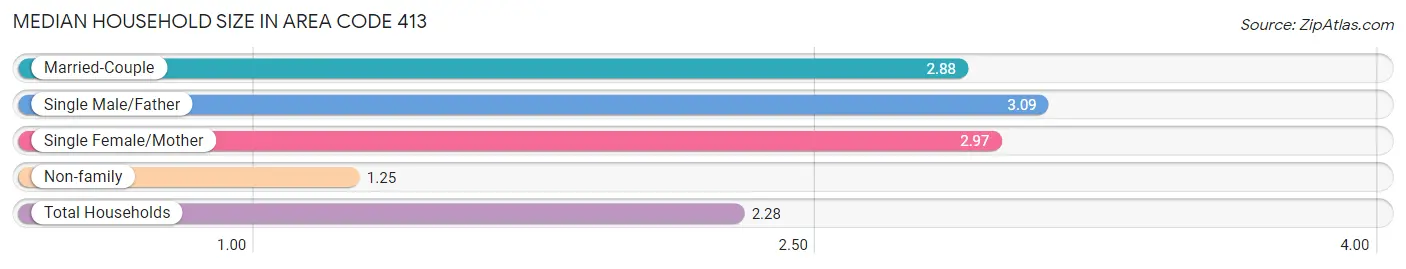
The median household size in Area Code 413 is 2.28 persons per household, with single male/father households (16,394 | 5.0%) accounting for the largest median household size of 3.09435 persons per household. non-family households (128,525 | 39.3%) represent the smallest median household size with 1.25 persons per household.
| Household Type | # Households | Household Size |
| Married-Couple | 138,259 (42.2%) | 2.88 |
| Single Male/Father | 16,394 (5.0%) | 3.09 |
| Single Female/Mother | 44,250 (13.5%) | 2.97 |
| Non-family | 128,525 (39.3%) | 1.25 |
| Total Households | 327,428 (100.0%) | 2.28 |
Household Size by Marriage Status in Area Code 413
Out of a total of 327,428 households in Area Code 413, 198,903 (60.8%) are family households, while 128,525 (39.3%) are nonfamily households. The most numerous type of family households are 2-person households, comprising 92,683, and the most common type of nonfamily households are 1-person households, comprising 103,025.
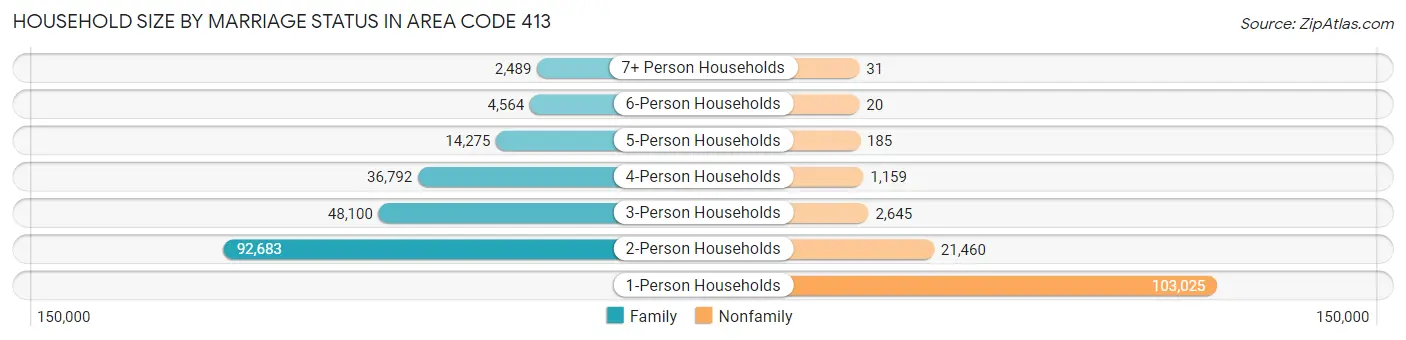
| Household Size | Family Households | Nonfamily Households |
| 1-Person Households | - | 103,025 (31.5%) |
| 2-Person Households | 92,683 (28.3%) | 21,460 (6.6%) |
| 3-Person Households | 48,100 (14.7%) | 2,645 (0.8%) |
| 4-Person Households | 36,792 (11.2%) | 1,159 (0.4%) |
| 5-Person Households | 14,275 (4.4%) | 185 (0.1%) |
| 6-Person Households | 4,564 (1.4%) | 20 (0.0%) |
| 7+ Person Households | 2,489 (0.8%) | 31 (0.0%) |
| Total | 198,903 (60.8%) | 128,525 (39.3%) |
Female Fertility in Area Code 413
Fertility by Age in Area Code 413
Average fertility rate in Area Code 413 is 56.3 births per 1,000 women. Women in the age bracket of 20 to 34 years have the highest fertility rate with 104.2 births per 1,000 women. Women in the age bracket of 20 to 34 years acount for 69.7% of all women with births.
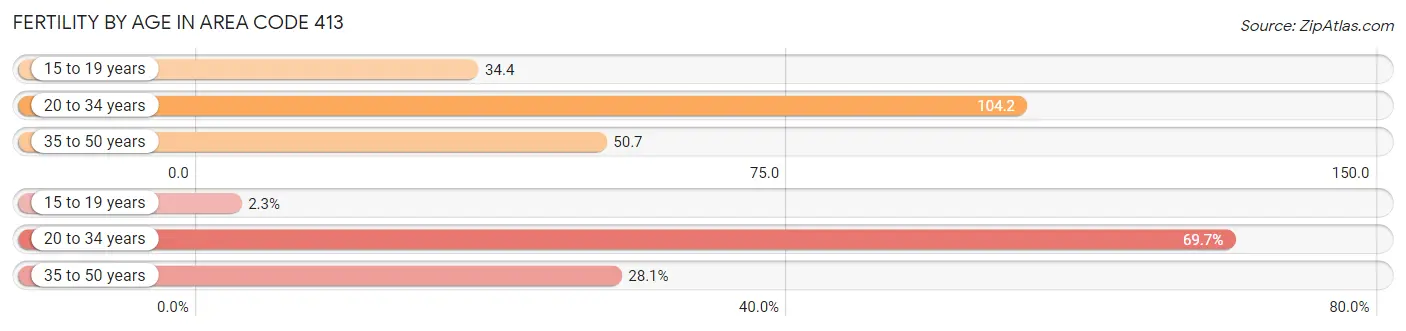
| Age Bracket | Women with Births | Births / 1,000 Women |
| 15 to 19 years | 189 (2.2%) | 34.4 |
| 20 to 34 years | 5,858 (69.7%) | 104.2 |
| 35 to 50 years | 2,357 (28.1%) | 50.7 |
| Total | 8,404 (100.0%) | 56.3 |
Fertility by Age by Marriage Status in Area Code 413
51.3% of women with births (8,404) in Area Code 413 are married. The highest percentage of unmarried women with births falls into 15 to 19 years age bracket with 100.0% of them unmarried at the time of birth, while the lowest percentage of unmarried women with births belong to 35 to 50 years age bracket with 56.3% of them unmarried.
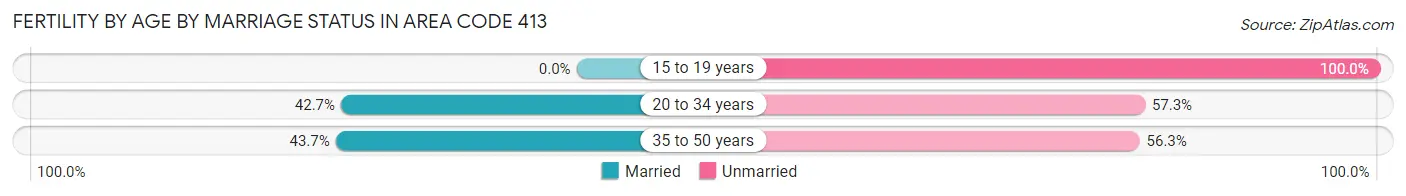
| Age Bracket | Married | Unmarried |
| 15 to 19 years | 0 (0.0%) | 189 (100.0%) |
| 20 to 34 years | 2,501 (42.7%) | 3,357 (57.3%) |
| 35 to 50 years | 1,029 (43.7%) | 1,328 (56.3%) |
| Total | 4,313 (51.3%) | 4,091 (48.7%) |
Fertility by Education in Area Code 413
Average fertility rate in Area Code 413 is 56.3 births per 1,000 women. Women with the education attainment of graduate degree have the highest fertility rate of 163.3 births per 1,000 women, while women with the education attainment of less than high school have the lowest fertility at 60.7 births per 1,000 women. Women with the education attainment of college or associate's degree represent 31.3% of all women with births.
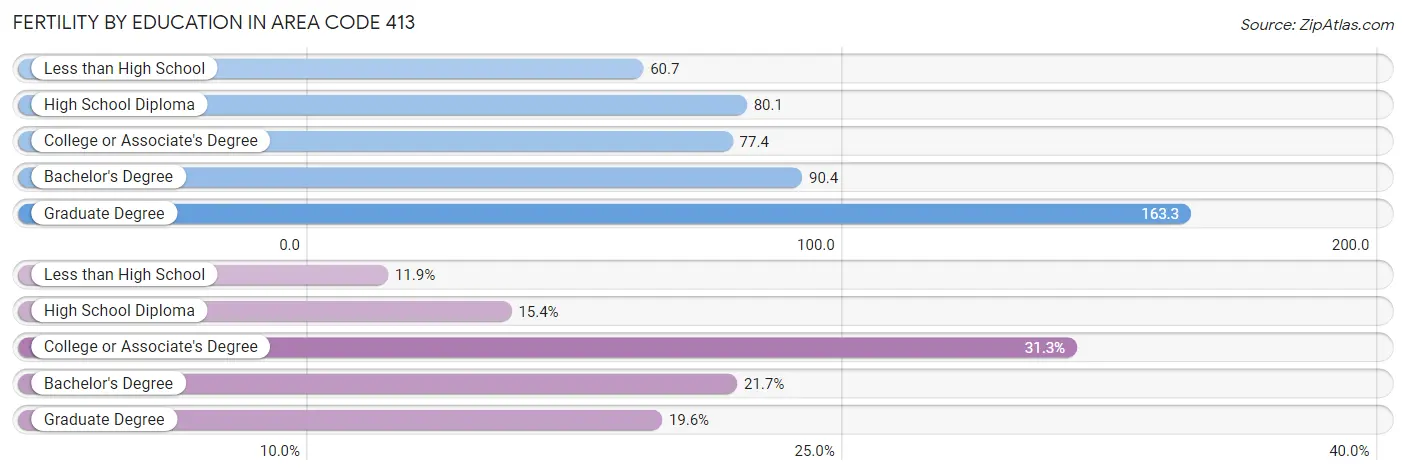
| Educational Attainment | Women with Births | Births / 1,000 Women |
| Less than High School | 1,003 (11.9%) | 60.7 |
| High School Diploma | 1,294 (15.4%) | 80.1 |
| College or Associate's Degree | 2,630 (31.3%) | 77.4 |
| Bachelor's Degree | 1,827 (21.7%) | 90.4 |
| Graduate Degree | 1,650 (19.6%) | 163.3 |
| Total | 8,404 (100.0%) | 56.3 |
Fertility by Education by Marriage Status in Area Code 413
48.7% of women with births in Area Code 413 are unmarried. Women with the educational attainment of bachelor's degree are most likely to be married with 40.3% of them married at childbirth, while women with the educational attainment of less than high school are least likely to be married with 85.6% of them unmarried at childbirth.
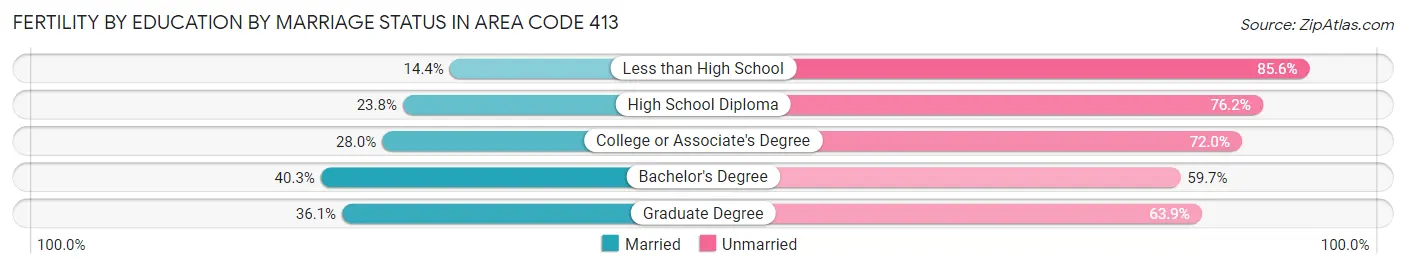
| Educational Attainment | Married | Unmarried |
| Less than High School | 144 (14.4%) | 859 (85.6%) |
| High School Diploma | 308 (23.8%) | 986 (76.2%) |
| College or Associate's Degree | 736 (28.0%) | 1,894 (72.0%) |
| Bachelor's Degree | 737 (40.3%) | 1,090 (59.7%) |
| Graduate Degree | 595 (36.1%) | 1,055 (63.9%) |
| Total | 4,313 (51.3%) | 4,091 (48.7%) |
Employment Characteristics in Area Code 413
Employment by Class of Employer in Area Code 413
Among the 377,251 employed individuals in Area Code 413, private company employees (224,868 | 59.6%), not-for-profit organizations (52,251 | 13.9%), and local government employees (32,084 | 8.5%) make up the most common classes of employment.
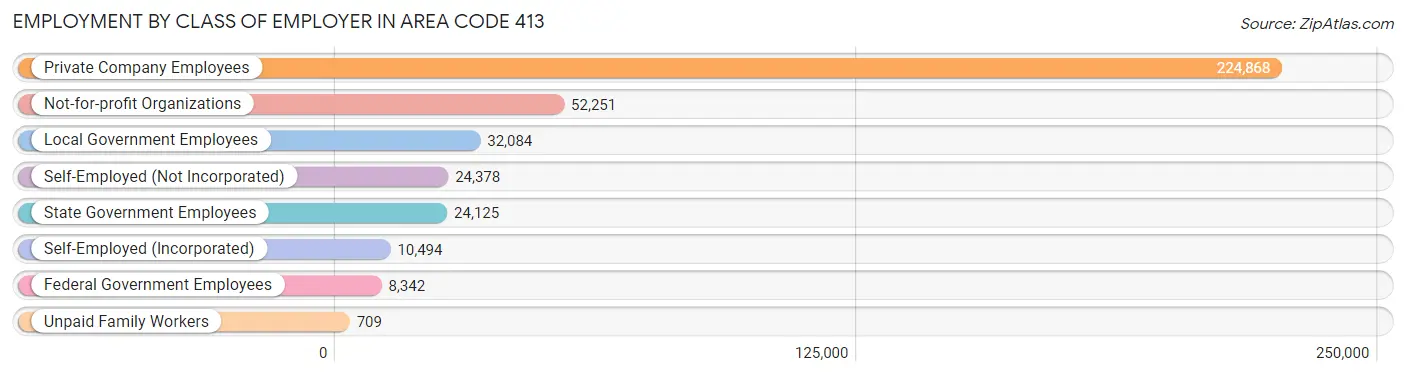
| Employer Class | # Employees | % Employees |
| Private Company Employees | 224,868 | 59.6% |
| Self-Employed (Incorporated) | 10,494 | 2.8% |
| Self-Employed (Not Incorporated) | 24,378 | 6.5% |
| Not-for-profit Organizations | 52,251 | 13.9% |
| Local Government Employees | 32,084 | 8.5% |
| State Government Employees | 24,125 | 6.4% |
| Federal Government Employees | 8,342 | 2.2% |
| Unpaid Family Workers | 709 | 0.2% |
| Total | 377,251 | 100.0% |
Employment Status by Age in Area Code 413
According to the labor force statistics for Area Code 413, out of the total population over 16 years of age (673,732), 61.9% or 416,703 individuals are in the labor force, with 5.5% or 22,877 of them unemployed. The age group with the highest labor force participation rate is 30 to 34 years, with 85.7% or 41,880 individuals in the labor force. Within the labor force, the 16 to 19 years age range has the highest percentage of unemployed individuals, with 1,580.8% or 372,136 of them being unemployed.
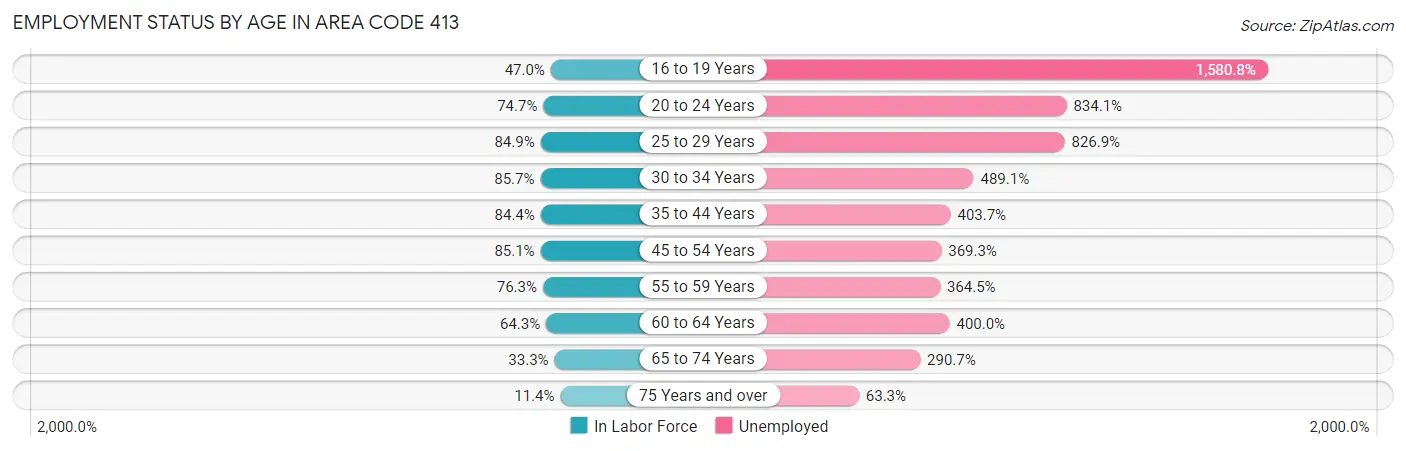
| Age Bracket | In Labor Force | Unemployed |
| 16 to 19 Years | 23,540 (47.0%) | 372,136 (1,580.8%) |
| 20 to 24 Years | 47,856 (74.7%) | 399,184 (834.1%) |
| 25 to 29 Years | 41,860 (84.9%) | 346,157 (826.9%) |
| 30 to 34 Years | 41,879 (85.7%) | 204,835 (489.1%) |
| 35 to 44 Years | 78,628 (84.4%) | 317,433 (403.7%) |
| 45 to 54 Years | 83,523 (85.1%) | 308,454 (369.3%) |
| 55 to 59 Years | 43,237 (76.3%) | 157,599 (364.5%) |
| 60 to 64 Years | 37,424 (64.3%) | 149,696 (400.0%) |
| 65 to 74 Years | 30,501 (33.3%) | 88,666 (290.7%) |
| 75 Years and over | 7,249 (11.4%) | 4,588 (63.3%) |
| Total | 416,730 (61.9%) | 22,891 (5.5%) |
Employment Status by Educational Attainment in Area Code 413
According to labor force statistics for Area Code 413, 80.0% of individuals (323,527) out of the total population between 25 and 64 years of age (404,409) are in the labor force, with 447.8% or 1,448,754 of them being unemployed. The group with the highest labor force participation rate are those with the educational attainment of bachelor's degree or higher, with 87.0% or 125,064 individuals in the labor force. Within the labor force, individuals with less than high school education have the highest percentage of unemployment, with 725.2% or 166,201 of them being unemployed.
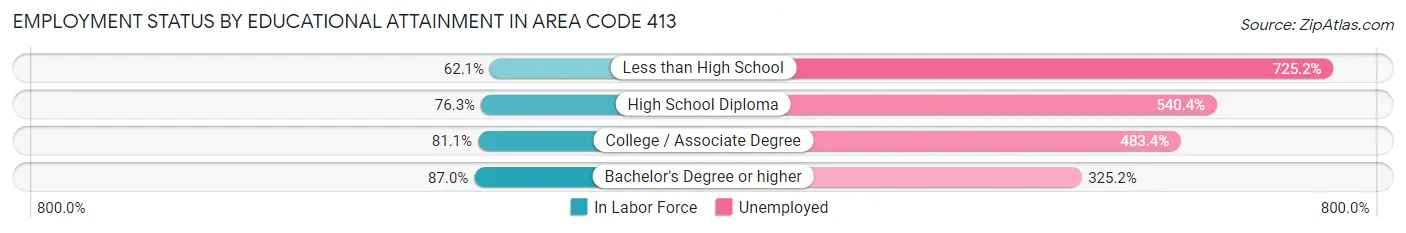
| Educational Attainment | In Labor Force | Unemployed |
| Less than High School | 22,920 (62.1%) | 267,722 (725.2%) |
| High School Diploma | 83,686 (76.3%) | 592,943 (540.4%) |
| College / Associate Degree | 92,382 (81.0%) | 550,999 (483.4%) |
| Bachelor's Degree or higher | 125,059 (87.0%) | 467,589 (325.2%) |
| Total | 323,513 (80.0%) | 1,810,944 (447.8%) |
Employment Occupations by Sex in Area Code 413
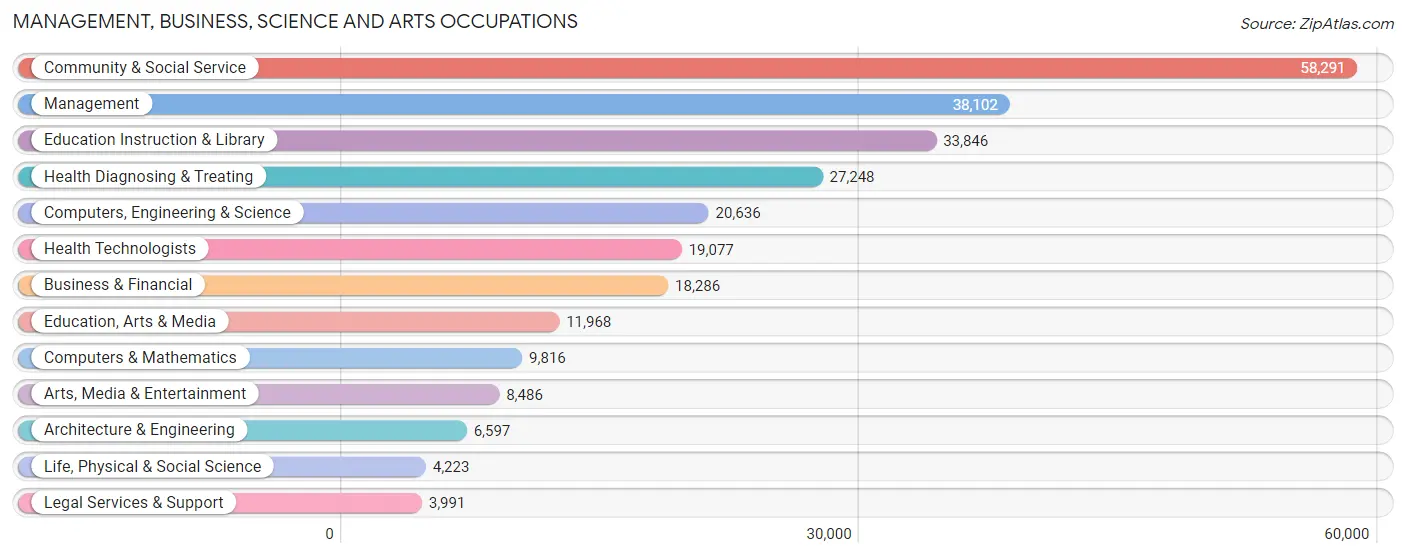
Management, Business, Science and Arts Occupations
The most common Management, Business, Science and Arts occupations in Area Code 413 are Community & Social Service (58,291 | 15.1%), Management (38,102 | 9.9%), Education Instruction & Library (33,846 | 8.8%), Health Diagnosing & Treating (27,248 | 7.1%), and Computers, Engineering & Science (20,636 | 5.3%).
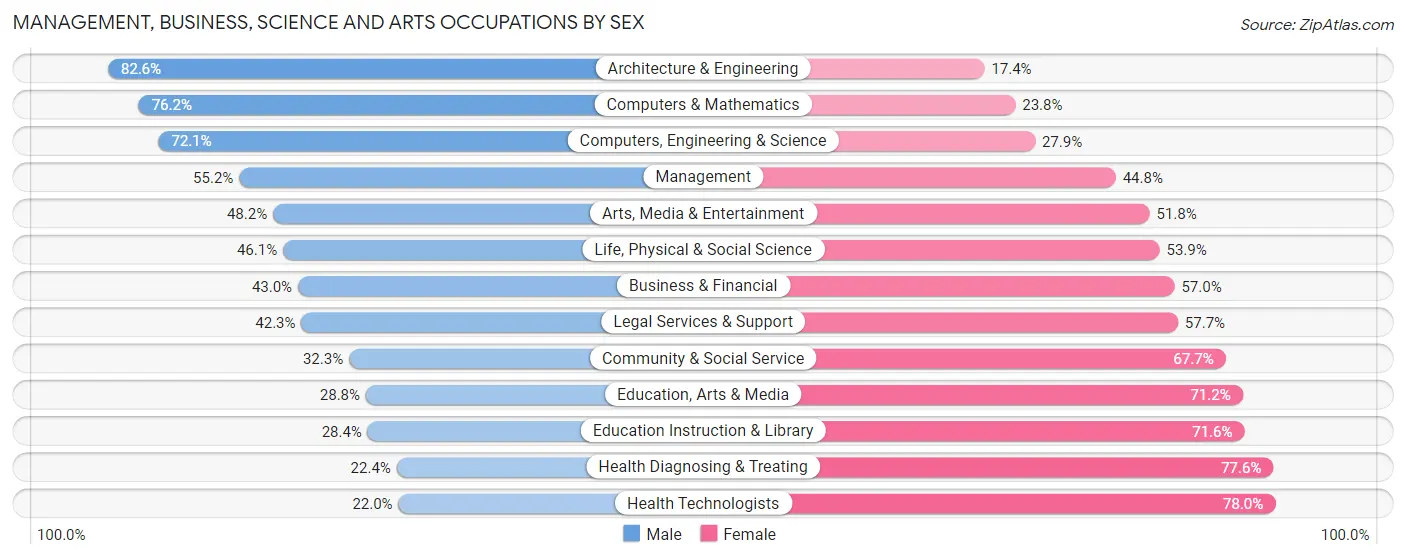
Management, Business, Science and Arts Occupations by Sex
Within the Management, Business, Science and Arts occupations in Area Code 413, the most male-oriented occupations are Architecture & Engineering (82.6%), Computers & Mathematics (76.2%), and Computers, Engineering & Science (72.1%), while the most female-oriented occupations are Health Technologists (78.0%), Health Diagnosing & Treating (77.6%), and Education Instruction & Library (71.6%).
| Occupation | Male | Female |
| Management | 21,048 (55.2%) | 17,054 (44.8%) |
| Business & Financial | 7,860 (43.0%) | 10,426 (57.0%) |
| Computers, Engineering & Science | 14,877 (72.1%) | 5,759 (27.9%) |
| Computers & Mathematics | 7,479 (76.2%) | 2,337 (23.8%) |
| Architecture & Engineering | 5,451 (82.6%) | 1,146 (17.4%) |
| Life, Physical & Social Science | 1,947 (46.1%) | 2,276 (53.9%) |
| Community & Social Service | 18,847 (32.3%) | 39,444 (67.7%) |
| Education, Arts & Media | 3,448 (28.8%) | 8,520 (71.2%) |
| Legal Services & Support | 1,687 (42.3%) | 2,304 (57.7%) |
| Education Instruction & Library | 9,623 (28.4%) | 24,223 (71.6%) |
| Arts, Media & Entertainment | 4,089 (48.2%) | 4,397 (51.8%) |
| Health Diagnosing & Treating | 6,101 (22.4%) | 21,147 (77.6%) |
| Health Technologists | 4,199 (22.0%) | 14,878 (78.0%) |
| Total (Category) | 68,733 (42.3%) | 93,830 (57.7%) |
| Total (Overall) | 194,041 (50.3%) | 191,806 (49.7%) |
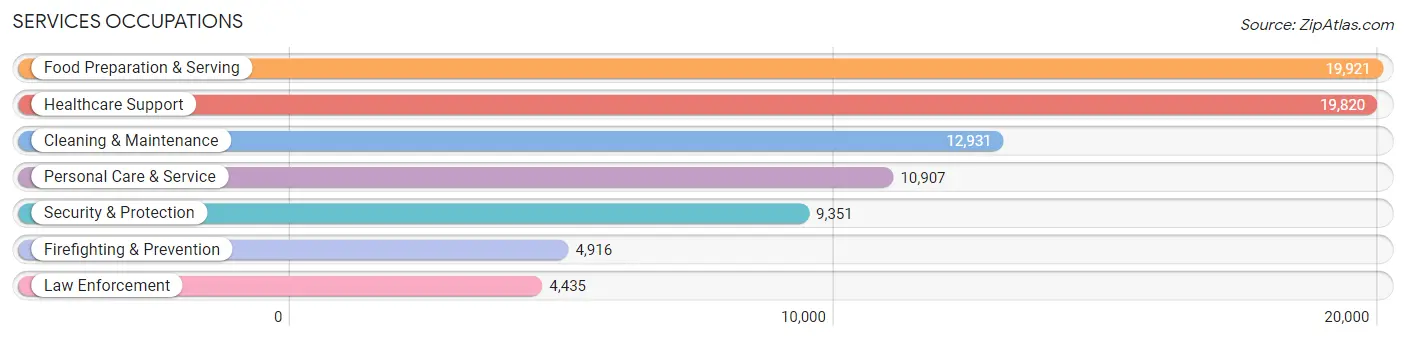
Services Occupations
The most common Services occupations in Area Code 413 are Food Preparation & Serving (19,921 | 5.2%), Healthcare Support (19,820 | 5.1%), Cleaning & Maintenance (12,931 | 3.4%), Personal Care & Service (10,907 | 2.8%), and Security & Protection (9,351 | 2.4%).
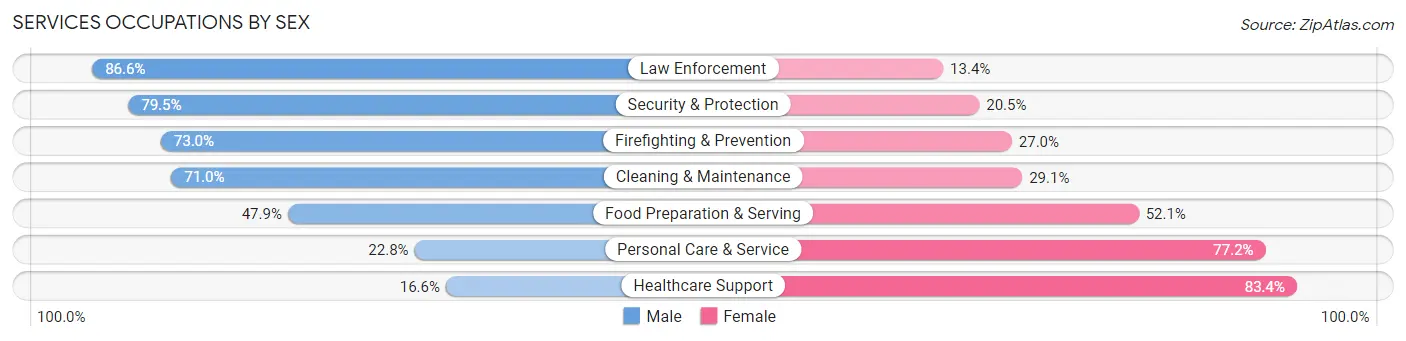
Services Occupations by Sex
Within the Services occupations in Area Code 413, the most male-oriented occupations are Law Enforcement (86.6%), Security & Protection (79.5%), and Firefighting & Prevention (73.0%), while the most female-oriented occupations are Healthcare Support (83.4%), Personal Care & Service (77.2%), and Food Preparation & Serving (52.1%).
| Occupation | Male | Female |
| Healthcare Support | 3,288 (16.6%) | 16,532 (83.4%) |
| Security & Protection | 7,430 (79.5%) | 1,921 (20.5%) |
| Firefighting & Prevention | 3,589 (73.0%) | 1,327 (27.0%) |
| Law Enforcement | 3,841 (86.6%) | 594 (13.4%) |
| Food Preparation & Serving | 9,540 (47.9%) | 10,381 (52.1%) |
| Cleaning & Maintenance | 9,175 (71.0%) | 3,756 (29.0%) |
| Personal Care & Service | 2,488 (22.8%) | 8,419 (77.2%) |
| Total (Category) | 31,921 (43.8%) | 41,009 (56.2%) |
| Total (Overall) | 194,041 (50.3%) | 191,806 (49.7%) |
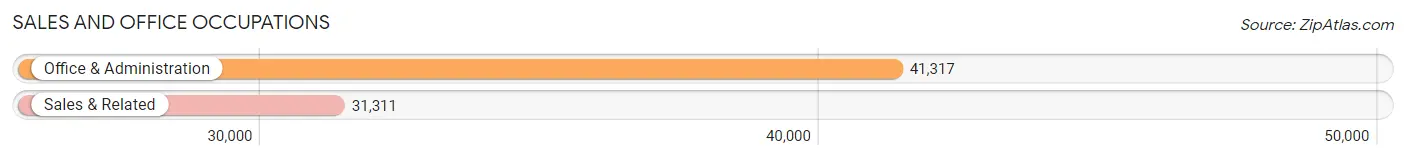
Sales and Office Occupations
The most common Sales and Office occupations in Area Code 413 are Office & Administration (41,317 | 10.7%), and Sales & Related (31,311 | 8.1%).
Sales and Office Occupations by Sex
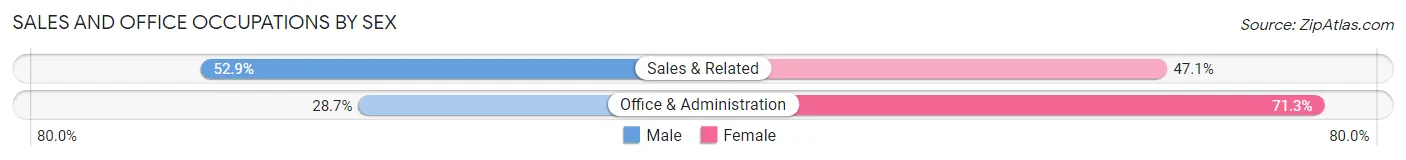
| Occupation | Male | Female |
| Sales & Related | 16,573 (52.9%) | 14,738 (47.1%) |
| Office & Administration | 11,843 (28.7%) | 29,474 (71.3%) |
| Total (Category) | 28,416 (39.1%) | 44,212 (60.9%) |
| Total (Overall) | 194,041 (50.3%) | 191,806 (49.7%) |
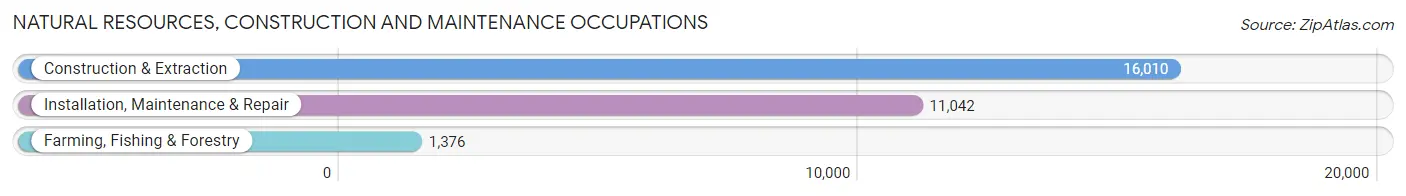
Natural Resources, Construction and Maintenance Occupations
The most common Natural Resources, Construction and Maintenance occupations in Area Code 413 are Construction & Extraction (16,010 | 4.2%), Installation, Maintenance & Repair (11,042 | 2.9%), and Farming, Fishing & Forestry (1,376 | 0.4%).
Natural Resources, Construction and Maintenance Occupations by Sex
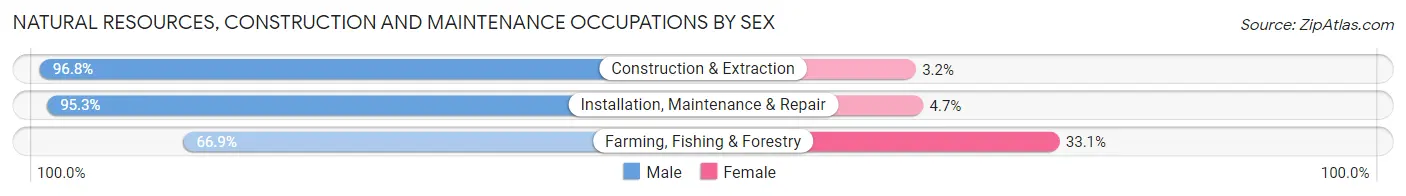
| Occupation | Male | Female |
| Farming, Fishing & Forestry | 921 (66.9%) | 455 (33.1%) |
| Construction & Extraction | 15,500 (96.8%) | 510 (3.2%) |
| Installation, Maintenance & Repair | 10,522 (95.3%) | 520 (4.7%) |
| Total (Category) | 26,943 (94.8%) | 1,485 (5.2%) |
| Total (Overall) | 194,041 (50.3%) | 191,806 (49.7%) |
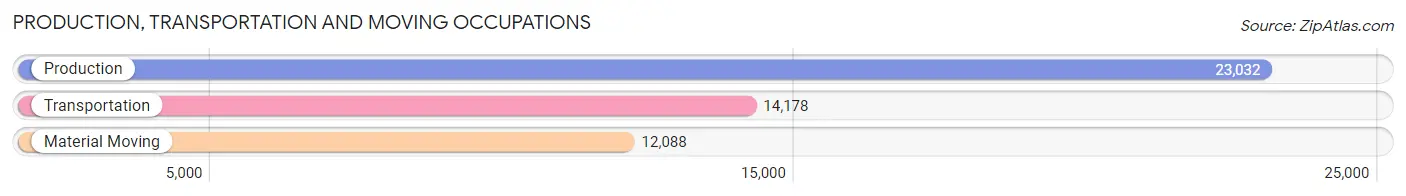
Production, Transportation and Moving Occupations
The most common Production, Transportation and Moving occupations in Area Code 413 are Production (23,032 | 6.0%), Transportation (14,178 | 3.7%), and Material Moving (12,088 | 3.1%).
Production, Transportation and Moving Occupations by Sex
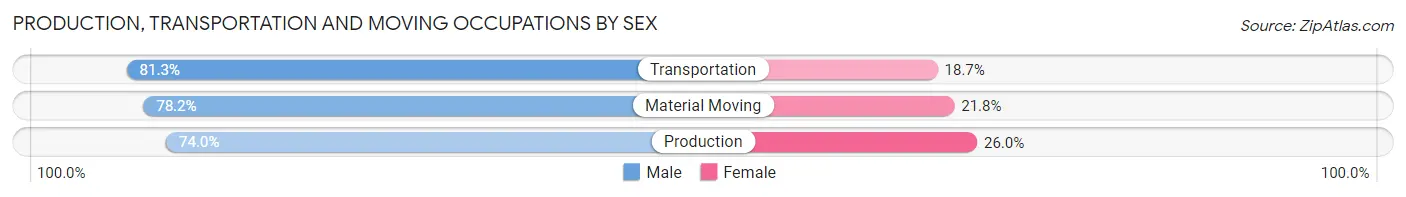
| Occupation | Male | Female |
| Production | 17,051 (74.0%) | 5,981 (26.0%) |
| Transportation | 11,523 (81.3%) | 2,655 (18.7%) |
| Material Moving | 9,454 (78.2%) | 2,634 (21.8%) |
| Total (Category) | 38,028 (77.1%) | 11,270 (22.9%) |
| Total (Overall) | 194,041 (50.3%) | 191,806 (49.7%) |
Employment Industries by Sex in Area Code 413
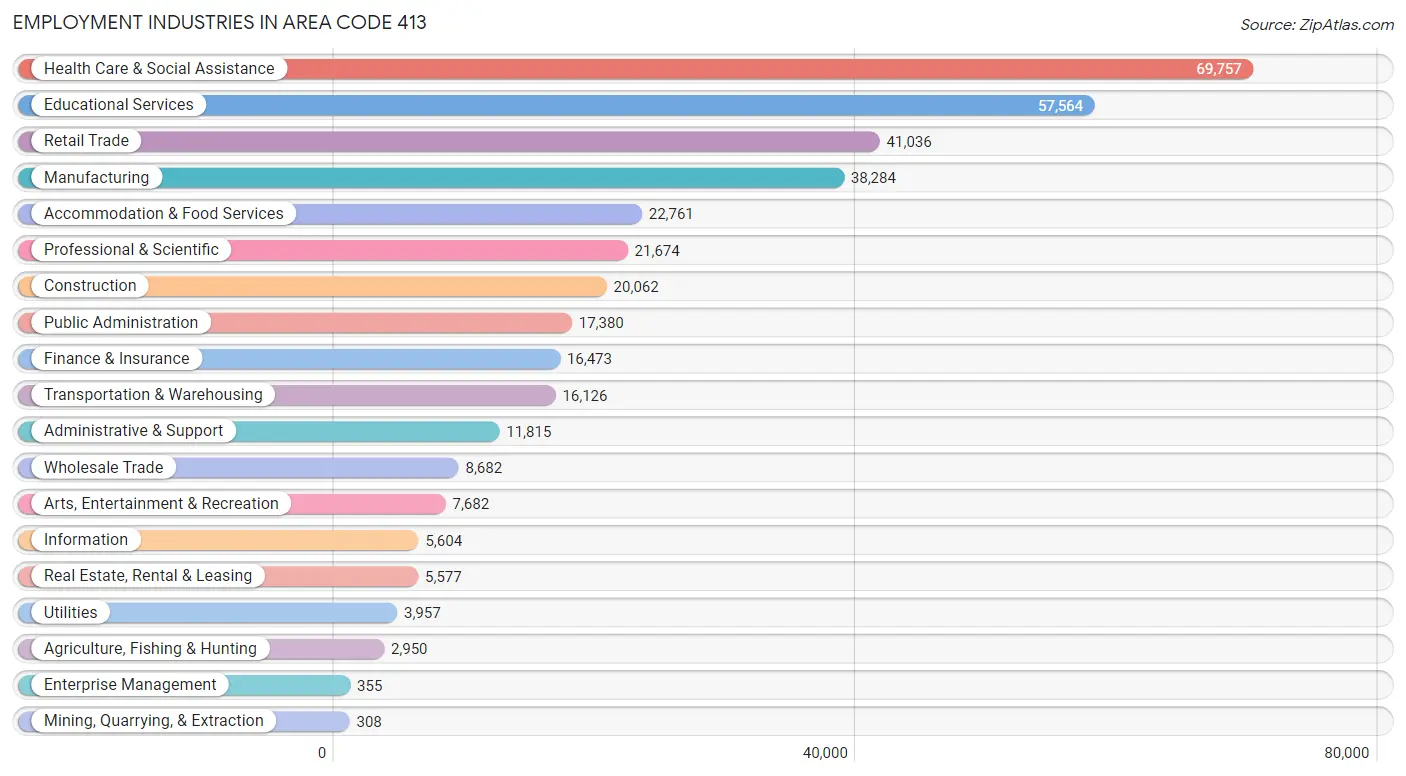
Employment Industries in Area Code 413
The major employment industries in Area Code 413 include Health Care & Social Assistance (69,757 | 18.1%), Educational Services (57,564 | 14.9%), Retail Trade (41,036 | 10.6%), Manufacturing (38,284 | 9.9%), and Accommodation & Food Services (22,761 | 5.9%).
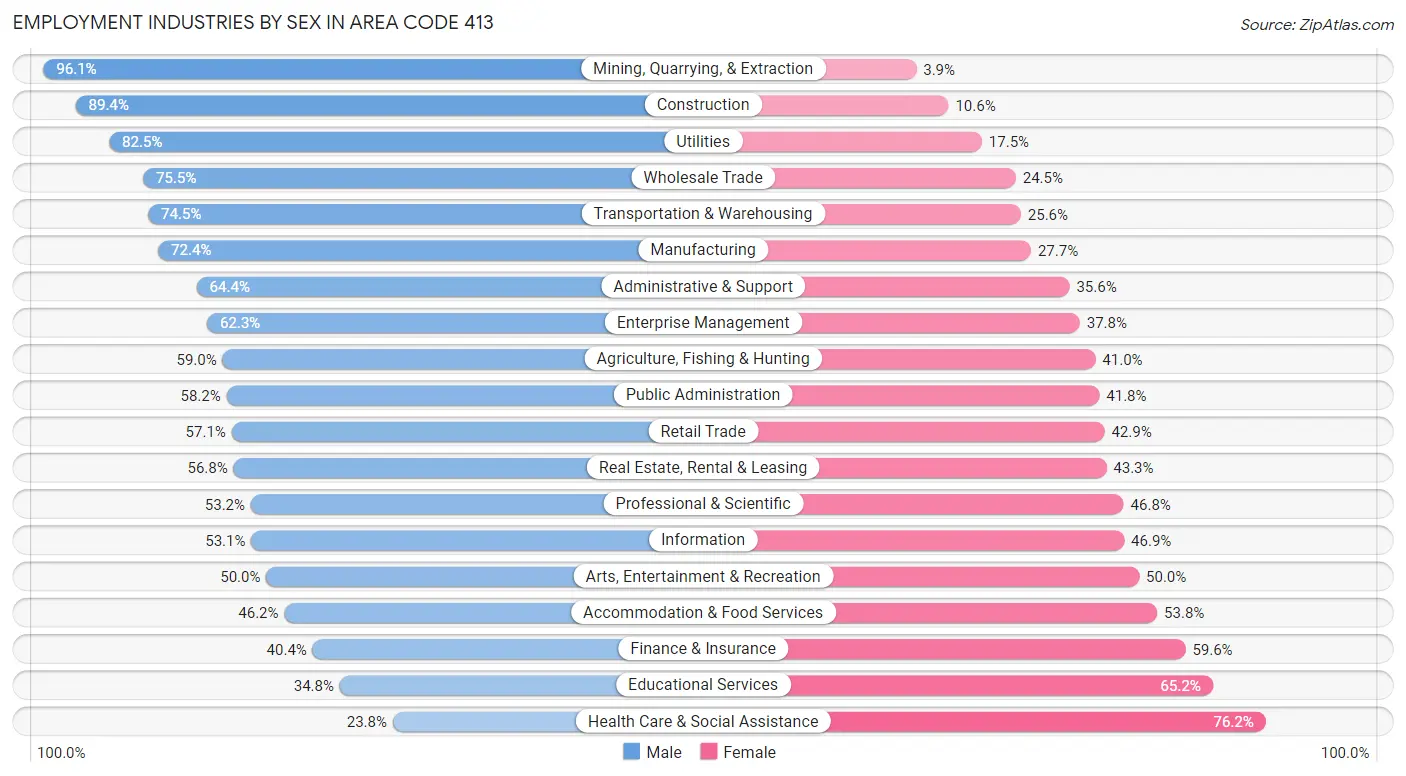
Employment Industries by Sex in Area Code 413
The Area Code 413 industries that see more men than women are Mining, Quarrying, & Extraction (96.1%), Construction (89.4%), and Utilities (82.5%), whereas the industries that tend to have a higher number of women are Health Care & Social Assistance (76.2%), Educational Services (65.2%), and Finance & Insurance (59.6%).
| Industry | Male | Female |
| Agriculture, Fishing & Hunting | 1,741 (59.0%) | 1,209 (41.0%) |
| Mining, Quarrying, & Extraction | 296 (96.1%) | 12 (3.9%) |
| Construction | 17,942 (89.4%) | 2,120 (10.6%) |
| Manufacturing | 27,700 (72.4%) | 10,584 (27.7%) |
| Wholesale Trade | 6,554 (75.5%) | 2,128 (24.5%) |
| Retail Trade | 23,446 (57.1%) | 17,590 (42.9%) |
| Transportation & Warehousing | 12,006 (74.5%) | 4,120 (25.6%) |
| Utilities | 3,265 (82.5%) | 692 (17.5%) |
| Information | 2,974 (53.1%) | 2,630 (46.9%) |
| Finance & Insurance | 6,651 (40.4%) | 9,822 (59.6%) |
| Real Estate, Rental & Leasing | 3,165 (56.8%) | 2,412 (43.2%) |
| Professional & Scientific | 11,524 (53.2%) | 10,150 (46.8%) |
| Enterprise Management | 221 (62.3%) | 134 (37.8%) |
| Administrative & Support | 7,607 (64.4%) | 4,208 (35.6%) |
| Educational Services | 20,008 (34.8%) | 37,556 (65.2%) |
| Health Care & Social Assistance | 16,592 (23.8%) | 53,165 (76.2%) |
| Arts, Entertainment & Recreation | 3,839 (50.0%) | 3,843 (50.0%) |
| Accommodation & Food Services | 10,524 (46.2%) | 12,237 (53.8%) |
| Public Administration | 10,116 (58.2%) | 7,264 (41.8%) |
| Total | 194,041 (50.3%) | 191,806 (49.7%) |
Education in Area Code 413
School Enrollment in Area Code 413
The most common levels of schooling among the 198,816 students in Area Code 413 are college / undergraduate (61,182 | 30.8%), high school (39,081 | 19.7%), and middle school (35,608 | 17.9%).
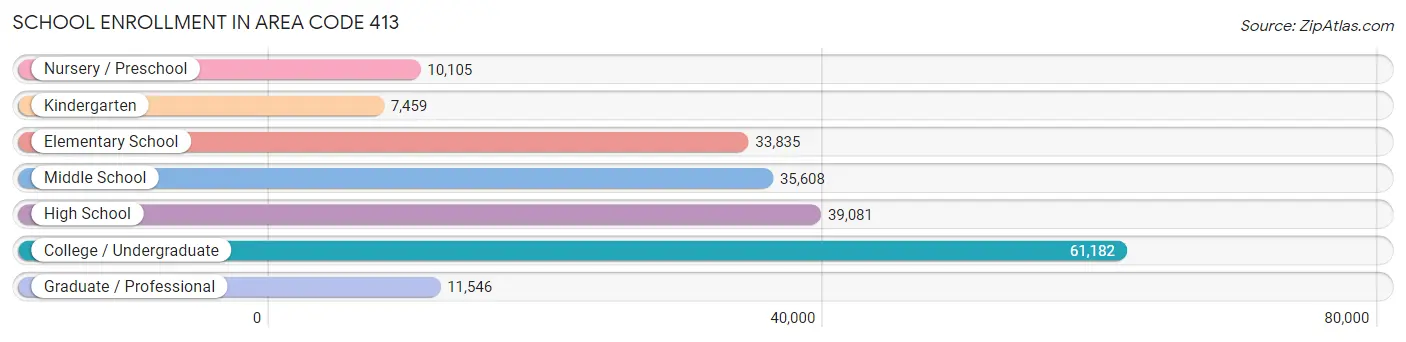
| School Level | # Students | % Students |
| Nursery / Preschool | 10,105 | 5.1% |
| Kindergarten | 7,459 | 3.7% |
| Elementary School | 33,835 | 17.0% |
| Middle School | 35,608 | 17.9% |
| High School | 39,081 | 19.7% |
| College / Undergraduate | 61,182 | 30.8% |
| Graduate / Professional | 11,546 | 5.8% |
| Total | 198,816 | 100.0% |
School Enrollment by Age by Funding Source in Area Code 413
Out of a total of 198,816 students who are enrolled in schools in Area Code 413, 39,862 (20.1%) attend a private institution, while the remaining 158,954 (79.9%) are enrolled in public schools. The age group of 20 to 24 year olds has the highest likelihood of being enrolled in private schools, with 12,470 (38.0% in the age bracket) enrolled. Conversely, the age group of 15 to 17 year olds has the lowest likelihood of being enrolled in a private school, with 26,029 (91.2% in the age bracket) attending a public institution.
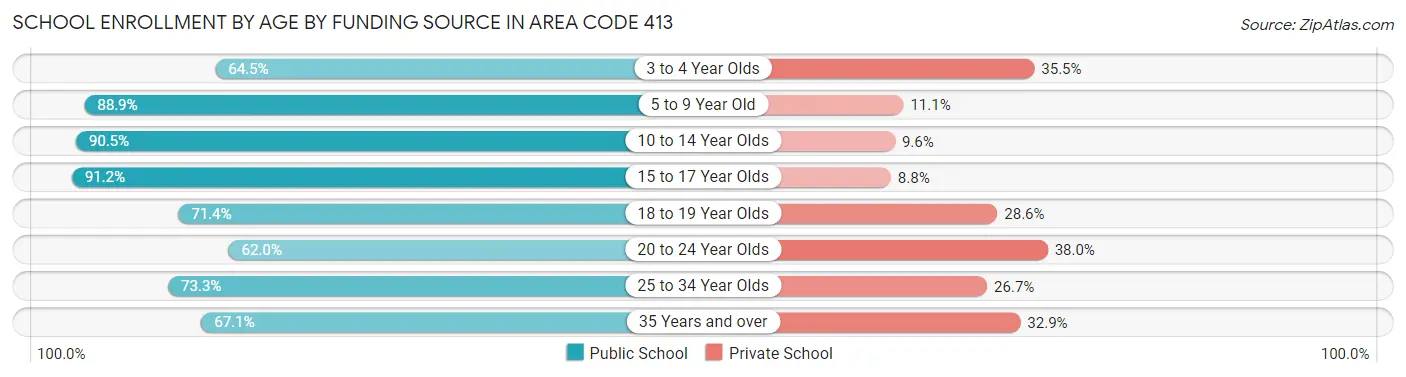
| Age Bracket | Public School | Private School |
| 3 to 4 Year Olds | 5,182 (64.5%) | 2,854 (35.5%) |
| 5 to 9 Year Old | 34,508 (88.9%) | 4,328 (11.1%) |
| 10 to 14 Year Olds | 40,095 (90.4%) | 4,235 (9.6%) |
| 15 to 17 Year Olds | 26,029 (91.2%) | 2,511 (8.8%) |
| 18 to 19 Year Olds | 18,301 (71.4%) | 7,343 (28.6%) |
| 20 to 24 Year Olds | 20,342 (62.0%) | 12,470 (38.0%) |
| 25 to 34 Year Olds | 7,921 (73.3%) | 2,889 (26.7%) |
| 35 Years and over | 6,579 (67.1%) | 3,229 (32.9%) |
| Total | 158,954 (79.9%) | 39,862 (20.1%) |
Educational Attainment by Field of Study in Area Code 413
Business (30,225 | 14.2%), education (24,862 | 11.7%), social sciences (20,067 | 9.4%), science & technology (19,046 | 8.9%), and literature & languages (15,373 | 7.2%) are the most common fields of study among 213,417 individuals in Area Code 413 who have obtained a bachelor's degree or higher.
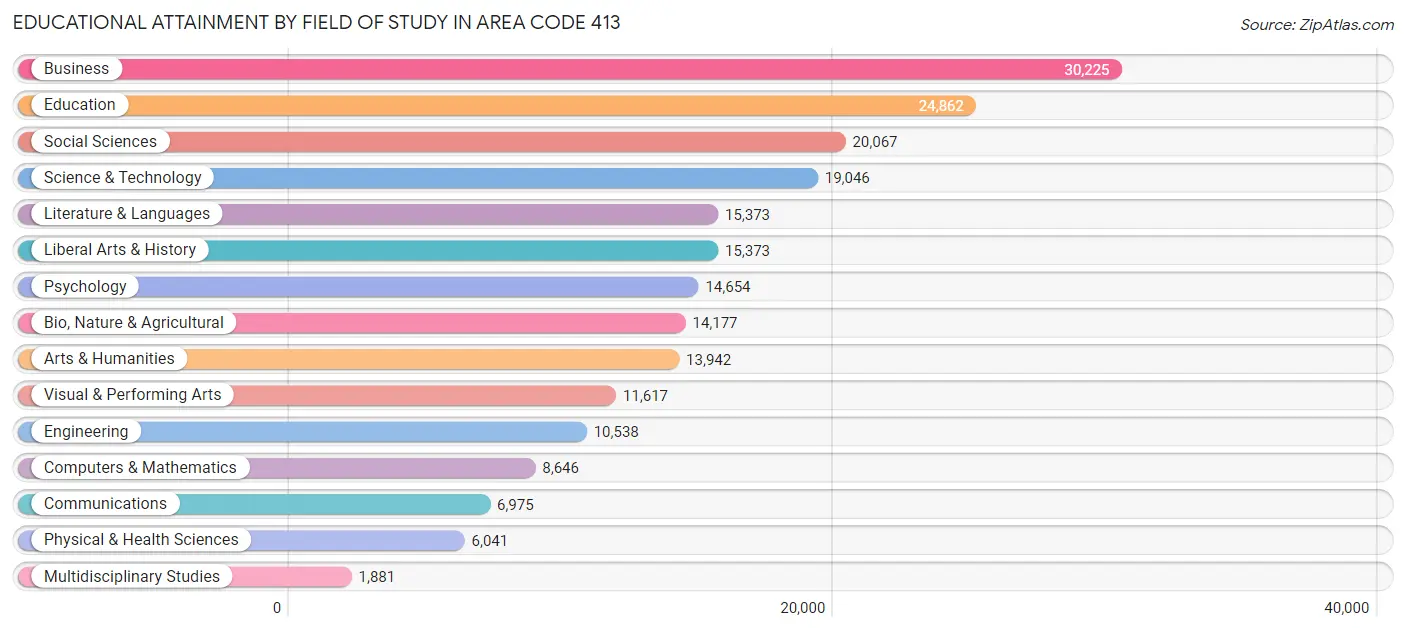
| Field of Study | # Graduates | % Graduates |
| Computers & Mathematics | 8,646 | 4.1% |
| Bio, Nature & Agricultural | 14,177 | 6.6% |
| Physical & Health Sciences | 6,041 | 2.8% |
| Psychology | 14,654 | 6.9% |
| Social Sciences | 20,067 | 9.4% |
| Engineering | 10,538 | 4.9% |
| Multidisciplinary Studies | 1,881 | 0.9% |
| Science & Technology | 19,046 | 8.9% |
| Business | 30,225 | 14.2% |
| Education | 24,862 | 11.7% |
| Literature & Languages | 15,373 | 7.2% |
| Liberal Arts & History | 15,373 | 7.2% |
| Visual & Performing Arts | 11,617 | 5.4% |
| Communications | 6,975 | 3.3% |
| Arts & Humanities | 13,942 | 6.5% |
| Total | 213,417 | 100.0% |
Transportation & Commute in Area Code 413
Vehicle Availability by Sex in Area Code 413
The most prevalent vehicle ownership categories in Area Code 413 are males with 2 vehicles (83,311, accounting for 44.4%) and females with 2 vehicles (77,333, making up 46.1%).
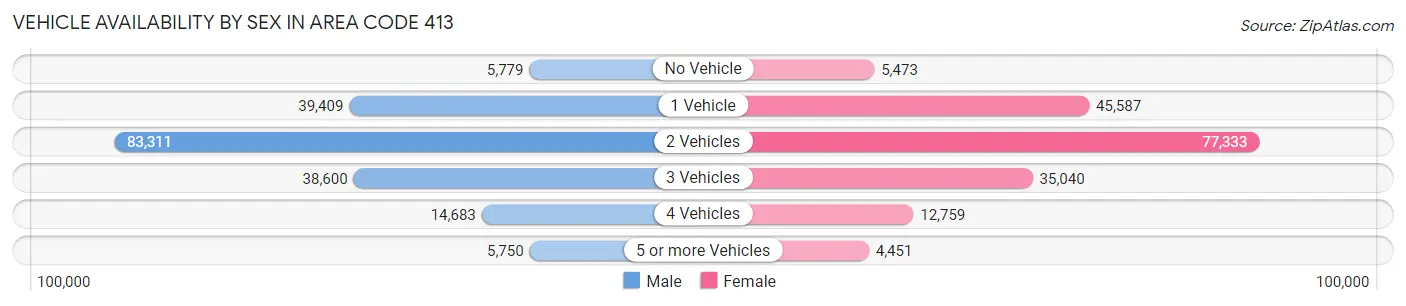
| Vehicles Available | Male | Female |
| No Vehicle | 5,779 (3.1%) | 5,473 (3.0%) |
| 1 Vehicle | 39,409 (21.0%) | 45,587 (25.2%) |
| 2 Vehicles | 83,311 (44.4%) | 77,333 (42.8%) |
| 3 Vehicles | 38,600 (20.6%) | 35,040 (19.4%) |
| 4 Vehicles | 14,683 (7.8%) | 12,759 (7.1%) |
| 5 or more Vehicles | 5,750 (3.1%) | 4,451 (2.5%) |
| Total | 187,532 (100.0%) | 180,643 (100.0%) |
Commute Time in Area Code 413
The most frequently occuring commute durations in Area Code 413 are 15 to 19 minutes (58,600 commuters, 17.3%), 10 to 14 minutes (54,498 commuters, 16.1%), and 20 to 24 minutes (51,120 commuters, 15.1%).
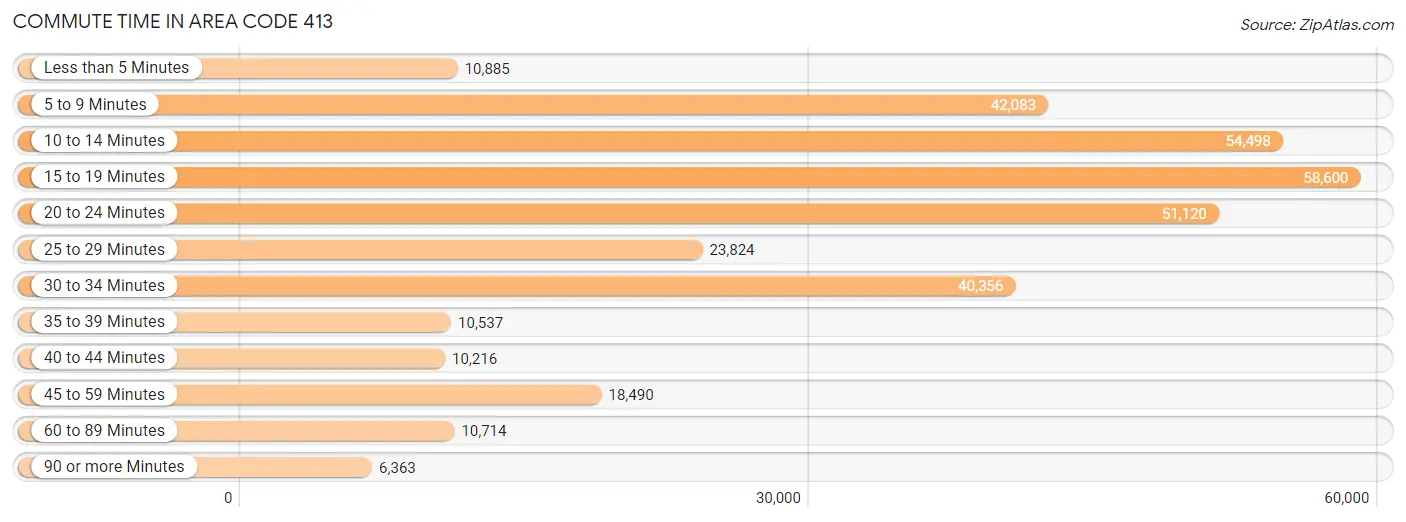
| Commute Time | # Commuters | % Commuters |
| Less than 5 Minutes | 10,885 | 3.2% |
| 5 to 9 Minutes | 42,083 | 12.5% |
| 10 to 14 Minutes | 54,498 | 16.1% |
| 15 to 19 Minutes | 58,600 | 17.3% |
| 20 to 24 Minutes | 51,120 | 15.1% |
| 25 to 29 Minutes | 23,824 | 7.1% |
| 30 to 34 Minutes | 40,356 | 11.9% |
| 35 to 39 Minutes | 10,537 | 3.1% |
| 40 to 44 Minutes | 10,216 | 3.0% |
| 45 to 59 Minutes | 18,490 | 5.5% |
| 60 to 89 Minutes | 10,714 | 3.2% |
| 90 or more Minutes | 6,363 | 1.9% |
Commute Time by Sex in Area Code 413
The most common commute times in Area Code 413 are 15 to 19 minutes (28,420 commuters, 16.4%) for males and 15 to 19 minutes (30,180 commuters, 18.3%) for females.
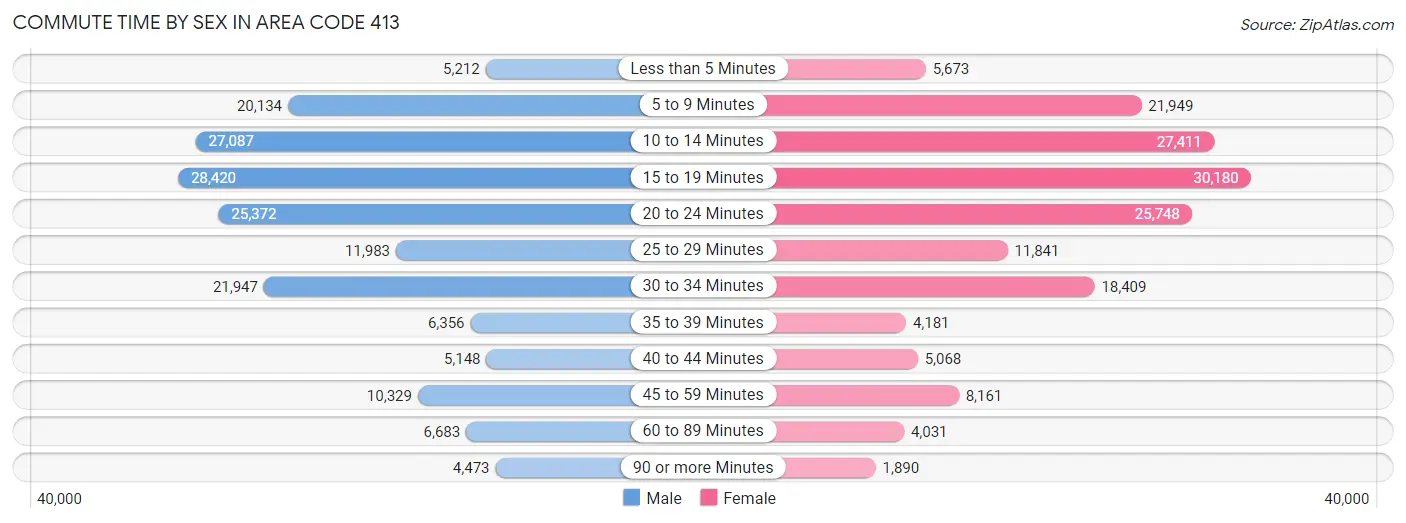
| Commute Time | Male | Female |
| Less than 5 Minutes | 5,212 (3.0%) | 5,673 (3.5%) |
| 5 to 9 Minutes | 20,134 (11.6%) | 21,949 (13.3%) |
| 10 to 14 Minutes | 27,087 (15.6%) | 27,411 (16.7%) |
| 15 to 19 Minutes | 28,420 (16.4%) | 30,180 (18.3%) |
| 20 to 24 Minutes | 25,372 (14.6%) | 25,748 (15.7%) |
| 25 to 29 Minutes | 11,983 (6.9%) | 11,841 (7.2%) |
| 30 to 34 Minutes | 21,947 (12.7%) | 18,409 (11.2%) |
| 35 to 39 Minutes | 6,356 (3.7%) | 4,181 (2.5%) |
| 40 to 44 Minutes | 5,148 (3.0%) | 5,068 (3.1%) |
| 45 to 59 Minutes | 10,329 (6.0%) | 8,161 (5.0%) |
| 60 to 89 Minutes | 6,683 (3.9%) | 4,031 (2.5%) |
| 90 or more Minutes | 4,473 (2.6%) | 1,890 (1.1%) |
Time of Departure to Work by Sex in Area Code 413
The most frequent times of departure to work in Area Code 413 are 7:00 AM to 7:29 AM (23,216, 13.4%) for males and 7:30 AM to 7:59 AM (25,302, 15.4%) for females.
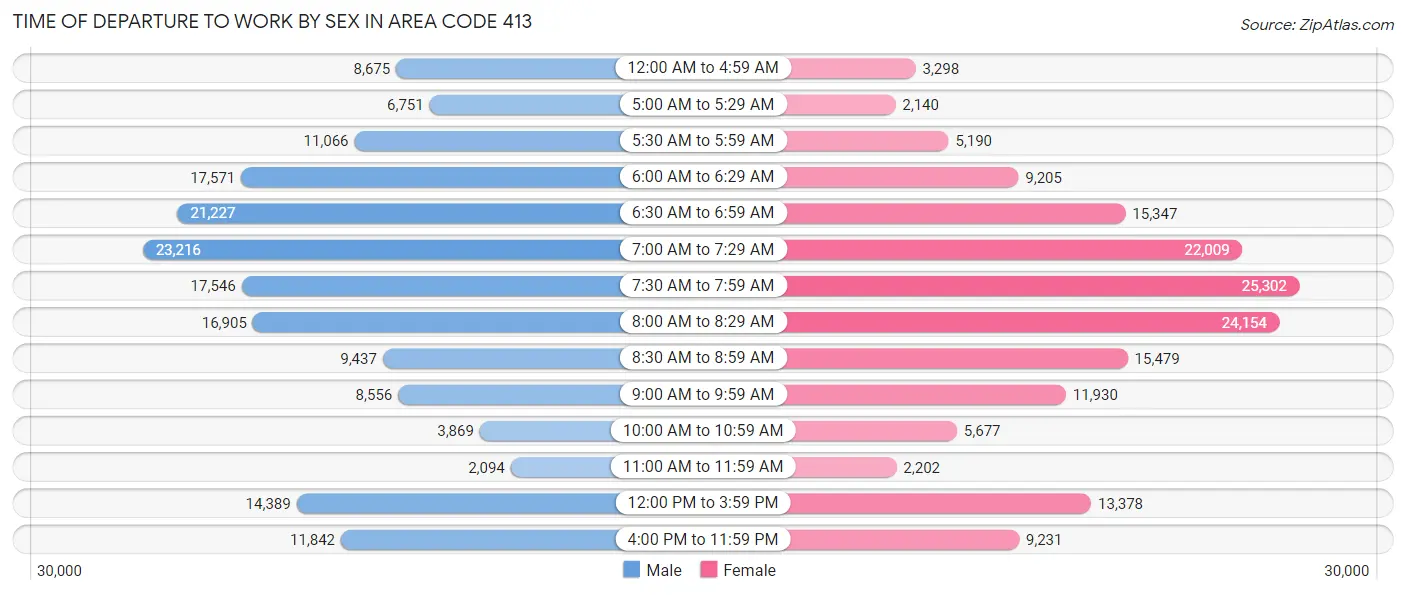
| Time of Departure | Male | Female |
| 12:00 AM to 4:59 AM | 8,675 (5.0%) | 3,298 (2.0%) |
| 5:00 AM to 5:29 AM | 6,751 (3.9%) | 2,140 (1.3%) |
| 5:30 AM to 5:59 AM | 11,066 (6.4%) | 5,190 (3.2%) |
| 6:00 AM to 6:29 AM | 17,571 (10.2%) | 9,205 (5.6%) |
| 6:30 AM to 6:59 AM | 21,227 (12.3%) | 15,347 (9.3%) |
| 7:00 AM to 7:29 AM | 23,216 (13.4%) | 22,009 (13.4%) |
| 7:30 AM to 7:59 AM | 17,546 (10.1%) | 25,302 (15.4%) |
| 8:00 AM to 8:29 AM | 16,905 (9.8%) | 24,154 (14.7%) |
| 8:30 AM to 8:59 AM | 9,437 (5.4%) | 15,479 (9.4%) |
| 9:00 AM to 9:59 AM | 8,556 (4.9%) | 11,930 (7.2%) |
| 10:00 AM to 10:59 AM | 3,869 (2.2%) | 5,677 (3.5%) |
| 11:00 AM to 11:59 AM | 2,094 (1.2%) | 2,202 (1.3%) |
| 12:00 PM to 3:59 PM | 14,389 (8.3%) | 13,378 (8.1%) |
| 4:00 PM to 11:59 PM | 11,842 (6.8%) | 9,231 (5.6%) |
| Total | 173,144 (100.0%) | 164,542 (100.0%) |
Housing Occupancy in Area Code 413
Occupancy by Ownership in Area Code 413
Of the total 327,428 dwellings in Area Code 413, owner-occupied units account for 212,689 (65.0%), while renter-occupied units make up 114,739 (35.0%).
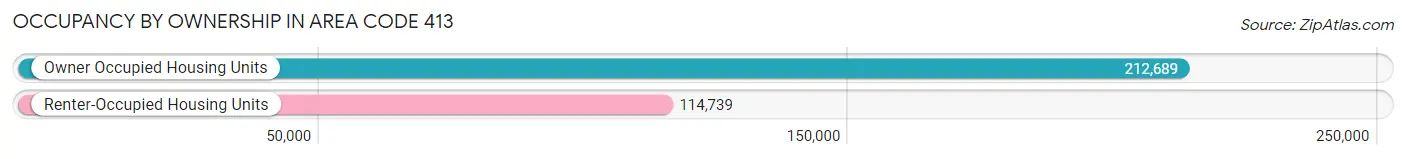
| Occupancy | # Housing Units | % Housing Units |
| Owner Occupied Housing Units | 212,689 | 65.0% |
| Renter-Occupied Housing Units | 114,739 | 35.0% |
| Total Occupied Housing Units | 327,428 | 100.0% |
Occupancy by Household Size in Area Code 413
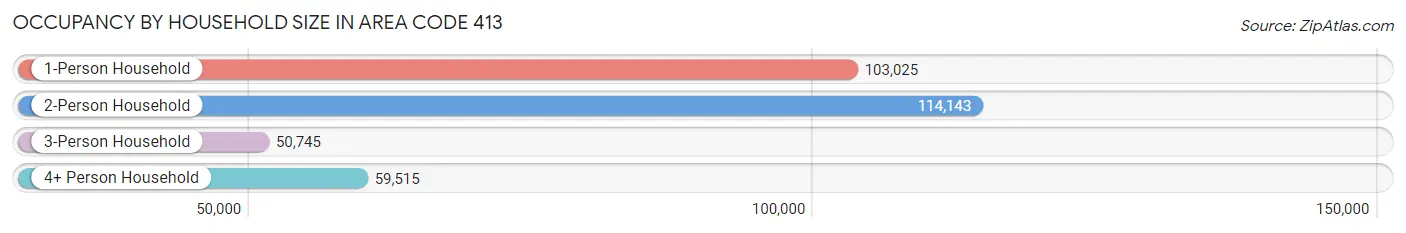
| Household Size | # Housing Units | % Housing Units |
| 1-Person Household | 103,025 | 31.5% |
| 2-Person Household | 114,143 | 34.9% |
| 3-Person Household | 50,745 | 15.5% |
| 4+ Person Household | 59,515 | 18.2% |
| Total Housing Units | 327,428 | 100.0% |
Occupancy by Ownership by Household Size in Area Code 413
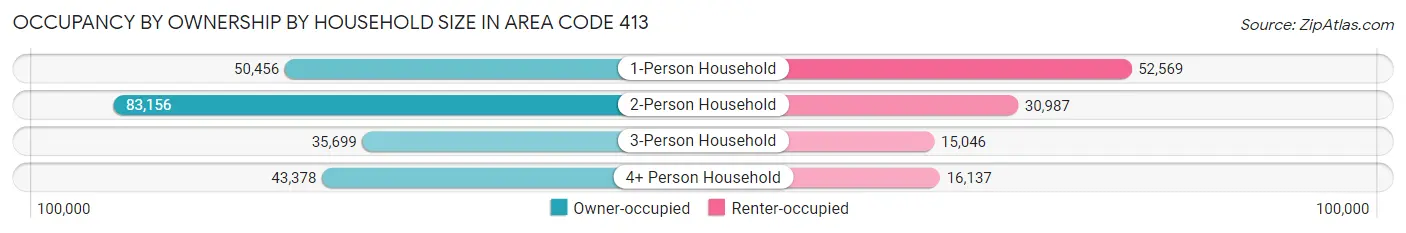
| Household Size | Owner-occupied | Renter-occupied |
| 1-Person Household | 50,456 (49.0%) | 52,569 (51.0%) |
| 2-Person Household | 83,156 (72.9%) | 30,987 (27.2%) |
| 3-Person Household | 35,699 (70.4%) | 15,046 (29.6%) |
| 4+ Person Household | 43,378 (72.9%) | 16,137 (27.1%) |
| Total Housing Units | 212,689 (65.0%) | 114,739 (35.0%) |
Occupancy by Educational Attainment in Area Code 413
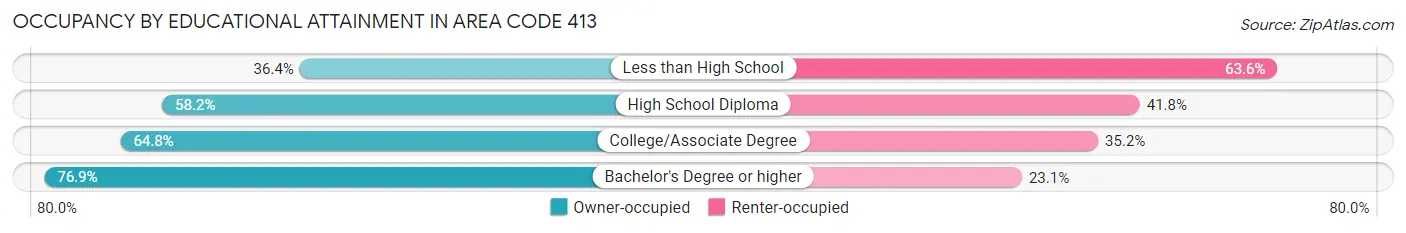
| Household Size | Owner-occupied | Renter-occupied |
| Less than High School | 10,593 (36.4%) | 18,534 (63.6%) |
| High School Diploma | 49,045 (58.2%) | 35,232 (41.8%) |
| College/Associate Degree | 61,524 (64.8%) | 33,436 (35.2%) |
| Bachelor's Degree or higher | 91,527 (76.9%) | 27,537 (23.1%) |
Occupancy by Age of Householder in Area Code 413
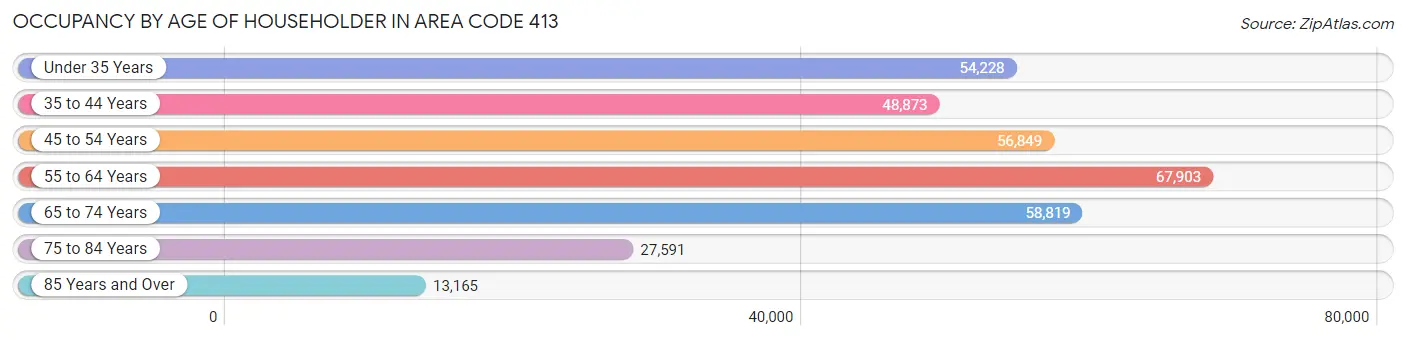
| Age Bracket | # Households | % Households |
| Under 35 Years | 54,228 | 16.6% |
| 35 to 44 Years | 48,873 | 14.9% |
| 45 to 54 Years | 56,849 | 17.4% |
| 55 to 64 Years | 67,903 | 20.7% |
| 65 to 74 Years | 58,819 | 18.0% |
| 75 to 84 Years | 27,591 | 8.4% |
| 85 Years and Over | 13,165 | 4.0% |
| Total | 327,428 | 100.0% |
Housing Finances in Area Code 413
Median Income by Occupancy in Area Code 413
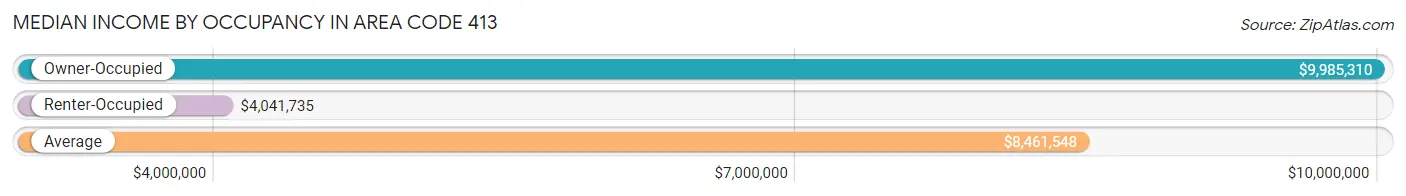
| Occupancy Type | # Households | Median Income |
| Owner-Occupied | 212,689 (65.0%) | $9,985,310 |
| Renter-Occupied | 114,739 (35.0%) | $4,041,735 |
| Average | 327,428 (100.0%) | $8,461,548 |
Occupancy by Householder Income Bracket in Area Code 413
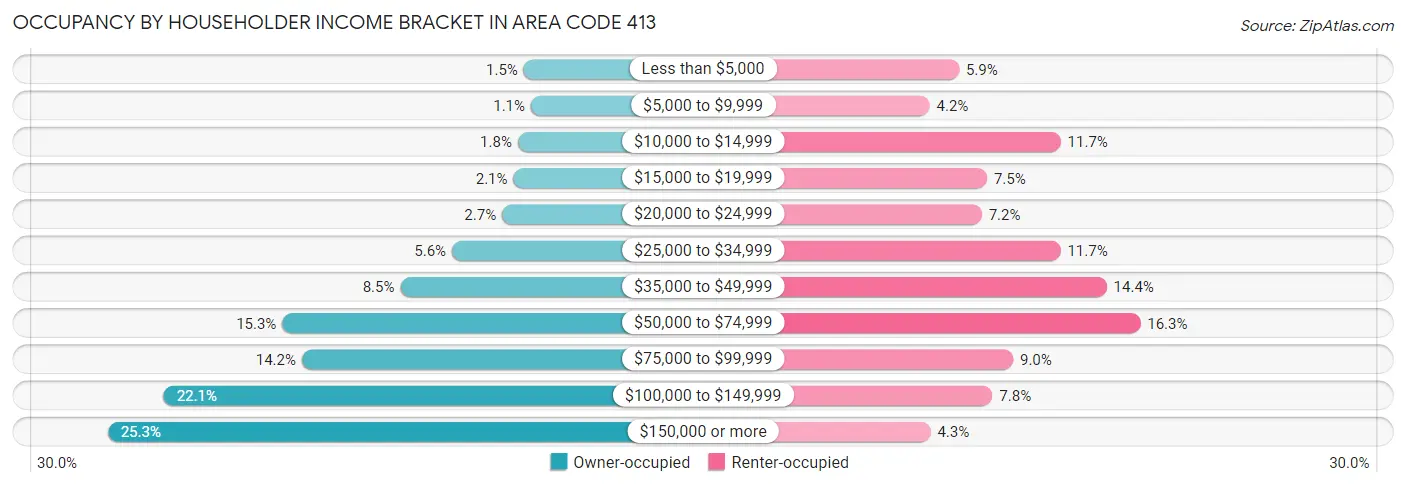
| Income Bracket | Owner-occupied | Renter-occupied |
| Less than $5,000 | 3,139 (1.5%) | 6,778 (5.9%) |
| $5,000 to $9,999 | 2,276 (1.1%) | 4,849 (4.2%) |
| $10,000 to $14,999 | 3,874 (1.8%) | 13,453 (11.7%) |
| $15,000 to $19,999 | 4,403 (2.1%) | 8,621 (7.5%) |
| $20,000 to $24,999 | 5,786 (2.7%) | 8,270 (7.2%) |
| $25,000 to $34,999 | 11,877 (5.6%) | 13,438 (11.7%) |
| $35,000 to $49,999 | 18,134 (8.5%) | 16,462 (14.3%) |
| $50,000 to $74,999 | 32,489 (15.3%) | 18,664 (16.3%) |
| $75,000 to $99,999 | 30,112 (14.2%) | 10,322 (9.0%) |
| $100,000 to $149,999 | 46,891 (22.1%) | 8,973 (7.8%) |
| $150,000 or more | 53,708 (25.3%) | 4,909 (4.3%) |
| Total | 212,689 (100.0%) | 114,739 (100.0%) |
Monthly Housing Cost Tiers in Area Code 413
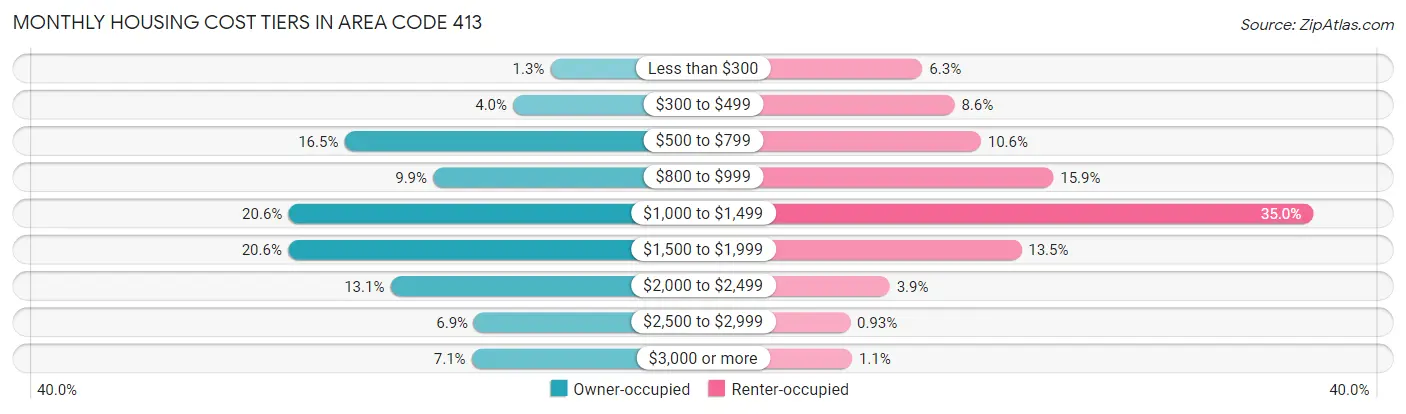
| Monthly Cost | Owner-occupied | Renter-occupied |
| Less than $300 | 2,735 (1.3%) | 7,187 (6.3%) |
| $300 to $499 | 8,595 (4.0%) | 9,885 (8.6%) |
| $500 to $799 | 34,999 (16.5%) | 12,114 (10.6%) |
| $800 to $999 | 21,117 (9.9%) | 18,245 (15.9%) |
| $1,000 to $1,499 | 43,795 (20.6%) | 40,195 (35.0%) |
| $1,500 to $1,999 | 43,867 (20.6%) | 15,539 (13.5%) |
| $2,000 to $2,499 | 27,801 (13.1%) | 4,421 (3.8%) |
| $2,500 to $2,999 | 14,695 (6.9%) | 1,071 (0.9%) |
| $3,000 or more | 15,085 (7.1%) | 1,227 (1.1%) |
| Total | 212,689 (100.0%) | 114,739 (100.0%) |
Physical Housing Characteristics in Area Code 413
Housing Structures in Area Code 413
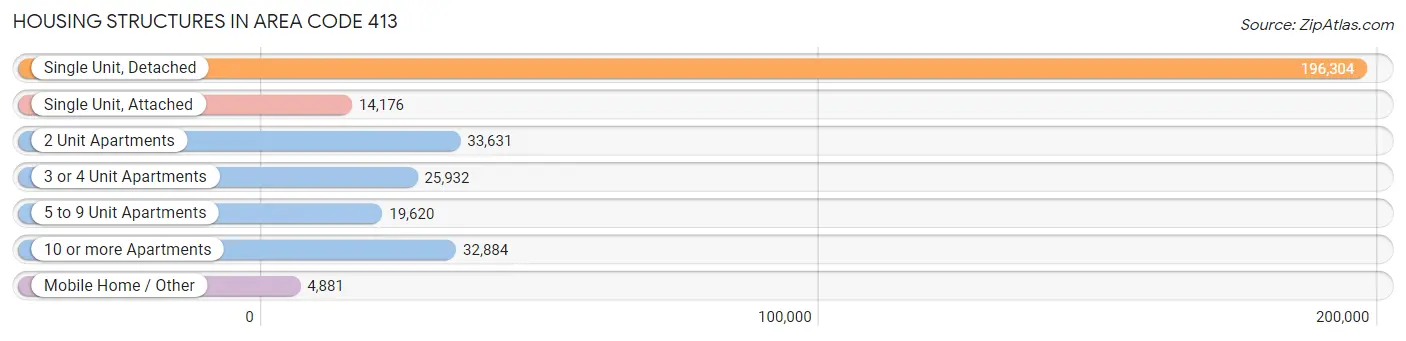
| Structure Type | # Housing Units | % Housing Units |
| Single Unit, Detached | 196,304 | 60.0% |
| Single Unit, Attached | 14,176 | 4.3% |
| 2 Unit Apartments | 33,631 | 10.3% |
| 3 or 4 Unit Apartments | 25,932 | 7.9% |
| 5 to 9 Unit Apartments | 19,620 | 6.0% |
| 10 or more Apartments | 32,884 | 10.0% |
| Mobile Home / Other | 4,881 | 1.5% |
| Total | 327,428 | 100.0% |
Housing Structures by Occupancy in Area Code 413
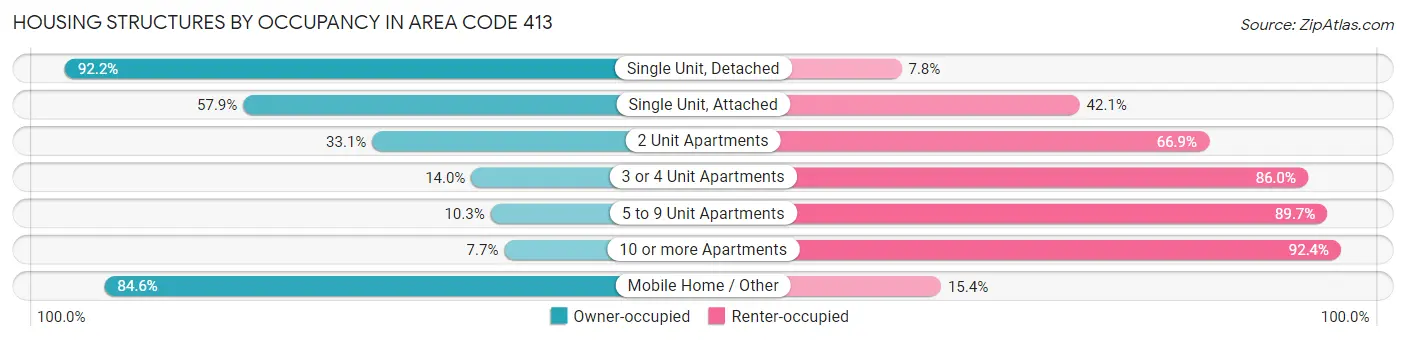
| Structure Type | Owner-occupied | Renter-occupied |
| Single Unit, Detached | 181,052 (92.2%) | 15,252 (7.8%) |
| Single Unit, Attached | 8,212 (57.9%) | 5,964 (42.1%) |
| 2 Unit Apartments | 11,124 (33.1%) | 22,507 (66.9%) |
| 3 or 4 Unit Apartments | 3,632 (14.0%) | 22,300 (86.0%) |
| 5 to 9 Unit Apartments | 2,021 (10.3%) | 17,599 (89.7%) |
| 10 or more Apartments | 2,517 (7.6%) | 30,367 (92.3%) |
| Mobile Home / Other | 4,131 (84.6%) | 750 (15.4%) |
| Total | 212,689 (65.0%) | 114,739 (35.0%) |
Housing Structures by Number of Rooms in Area Code 413
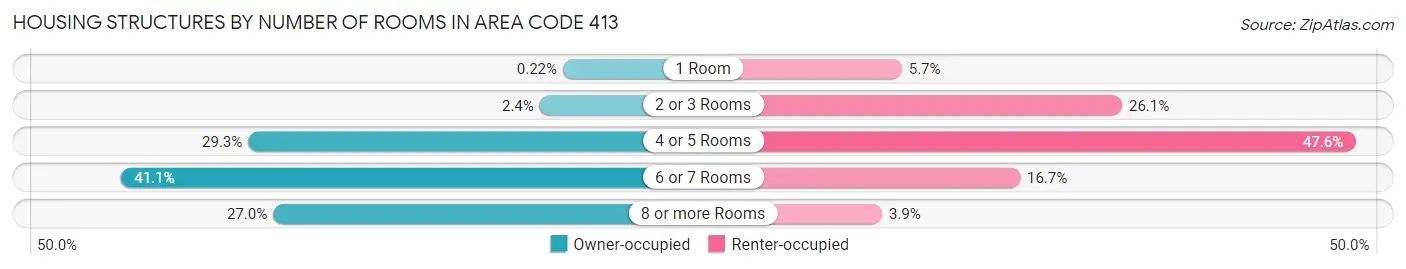
| Number of Rooms | Owner-occupied | Renter-occupied |
| 1 Room | 463 (0.2%) | 6,566 (5.7%) |
| 2 or 3 Rooms | 5,035 (2.4%) | 29,930 (26.1%) |
| 4 or 5 Rooms | 62,373 (29.3%) | 54,666 (47.6%) |
| 6 or 7 Rooms | 87,318 (41.0%) | 19,112 (16.7%) |
| 8 or more Rooms | 57,500 (27.0%) | 4,465 (3.9%) |
| Total | 212,689 (100.0%) | 114,739 (100.0%) |
Housing Structure by Heating Type in Area Code 413
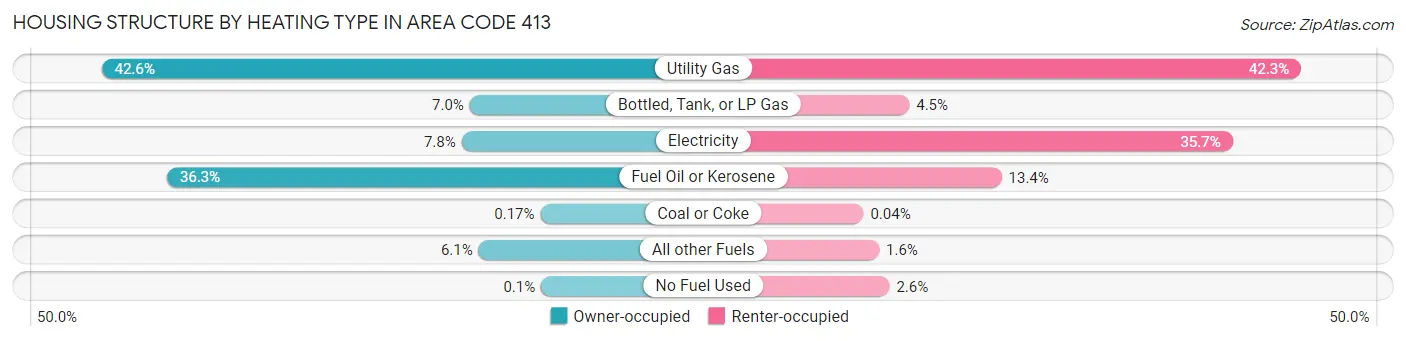
| Heating Type | Owner-occupied | Renter-occupied |
| Utility Gas | 90,531 (42.6%) | 48,556 (42.3%) |
| Bottled, Tank, or LP Gas | 14,890 (7.0%) | 5,129 (4.5%) |
| Electricity | 16,545 (7.8%) | 40,946 (35.7%) |
| Fuel Oil or Kerosene | 77,090 (36.2%) | 15,367 (13.4%) |
| Coal or Coke | 366 (0.2%) | 43 (0.0%) |
| All other Fuels | 13,060 (6.1%) | 1,774 (1.5%) |
| No Fuel Used | 207 (0.1%) | 2,924 (2.5%) |
| Total | 212,689 (100.0%) | 114,739 (100.0%) |
Household Vehicle Usage in Area Code 413
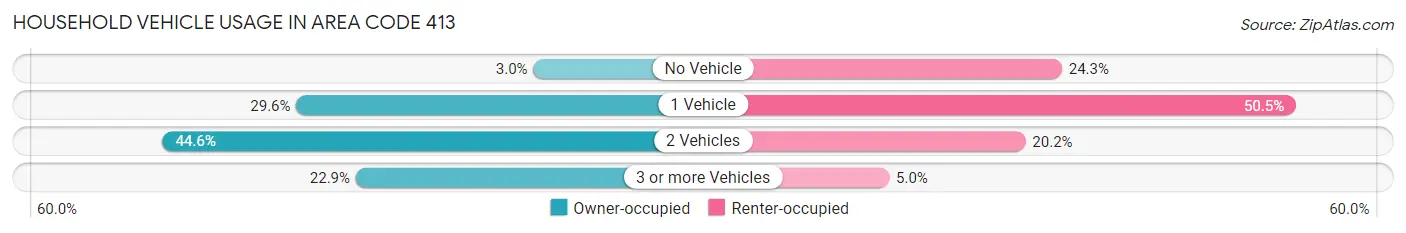
| Vehicles per Household | Owner-occupied | Renter-occupied |
| No Vehicle | 6,391 (3.0%) | 27,875 (24.3%) |
| 1 Vehicle | 62,865 (29.6%) | 57,979 (50.5%) |
| 2 Vehicles | 94,758 (44.6%) | 23,203 (20.2%) |
| 3 or more Vehicles | 48,675 (22.9%) | 5,682 (5.0%) |
| Total | 212,689 (100.0%) | 114,739 (100.0%) |
Real Estate & Mortgages in Area Code 413
Real Estate and Mortgage Overview in Area Code 413
| Characteristic | Without Mortgage | With Mortgage |
| Housing Units | 78,108 | 134,581 |
| Median Property Value | $30,358,400 | $34,021,600 |
| Median Household Income | $7,543,620 | $39,252 |
| Monthly Housing Costs | $82,210 | $14,947 |
| Real Estate Taxes | $432,290 | $2,051 |
Property Value by Mortgage Status in Area Code 413
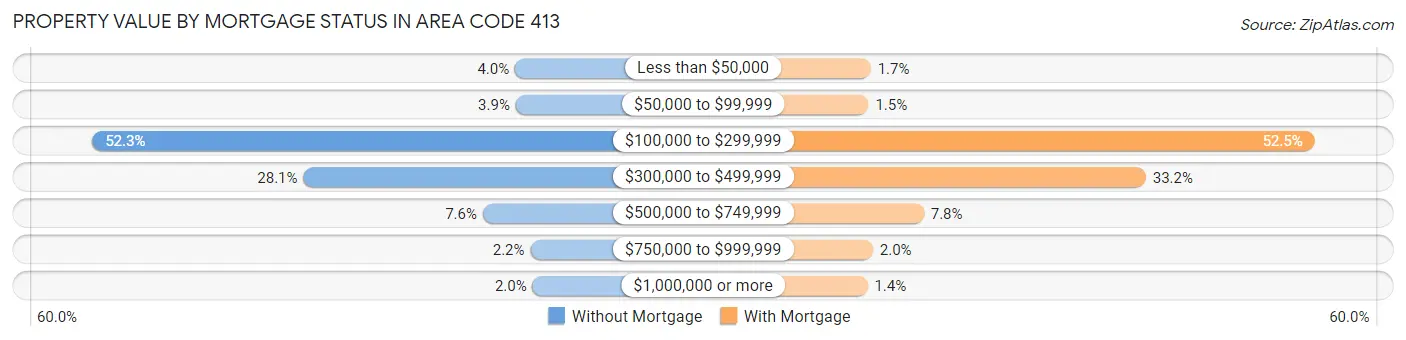
| Property Value | Without Mortgage | With Mortgage |
| Less than $50,000 | 3,083 (4.0%) | 2,333 (1.7%) |
| $50,000 to $99,999 | 3,019 (3.9%) | 1,997 (1.5%) |
| $100,000 to $299,999 | 40,825 (52.3%) | 70,611 (52.5%) |
| $300,000 to $499,999 | 21,980 (28.1%) | 44,643 (33.2%) |
| $500,000 to $749,999 | 5,962 (7.6%) | 10,491 (7.8%) |
| $750,000 to $999,999 | 1,718 (2.2%) | 2,669 (2.0%) |
| $1,000,000 or more | 1,521 (1.9%) | 1,837 (1.4%) |
| Total | 78,108 (100.0%) | 134,581 (100.0%) |
Household Income by Mortgage Status in Area Code 413
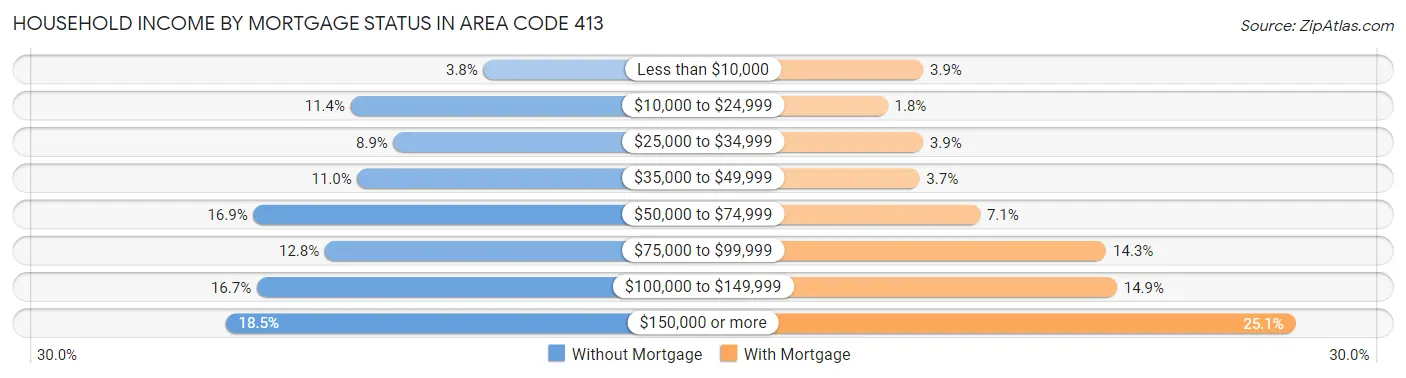
| Household Income | Without Mortgage | With Mortgage |
| Less than $10,000 | 2,947 (3.8%) | 5,200 (3.9%) |
| $10,000 to $24,999 | 8,876 (11.4%) | 2,468 (1.8%) |
| $25,000 to $34,999 | 6,962 (8.9%) | 5,187 (3.8%) |
| $35,000 to $49,999 | 8,569 (11.0%) | 4,915 (3.6%) |
| $50,000 to $74,999 | 13,219 (16.9%) | 9,565 (7.1%) |
| $75,000 to $99,999 | 10,021 (12.8%) | 19,270 (14.3%) |
| $100,000 to $149,999 | 13,058 (16.7%) | 20,091 (14.9%) |
| $150,000 or more | 14,456 (18.5%) | 33,833 (25.1%) |
| Total | 78,108 (100.0%) | 134,581 (100.0%) |
Property Value to Household Income Ratio in Area Code 413
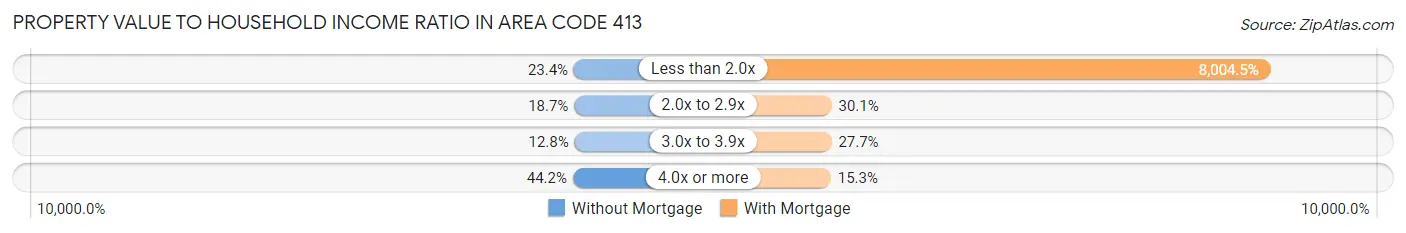
| Value-to-Income Ratio | Without Mortgage | With Mortgage |
| Less than 2.0x | 18,251 (23.4%) | 10,772,536 (8,004.5%) |
| 2.0x to 2.9x | 14,606 (18.7%) | 40,495 (30.1%) |
| 3.0x to 3.9x | 10,010 (12.8%) | 37,290 (27.7%) |
| 4.0x or more | 34,508 (44.2%) | 20,589 (15.3%) |
| Total | 78,108 (100.0%) | 134,581 (100.0%) |
Real Estate Taxes by Mortgage Status in Area Code 413
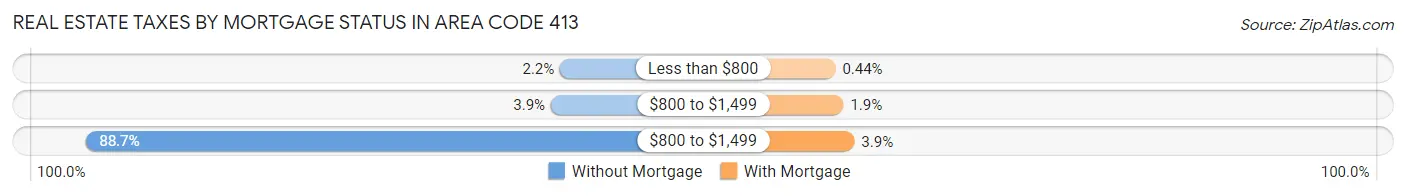
| Property Taxes | Without Mortgage | With Mortgage |
| Less than $800 | 1,707 (2.2%) | 586 (0.4%) |
| $800 to $1,499 | 3,017 (3.9%) | 2,575 (1.9%) |
| $800 to $1,499 | 69,302 (88.7%) | 5,248 (3.9%) |
| Total | 78,108 (100.0%) | 134,581 (100.0%) |
Health & Disability in Area Code 413
Health Insurance Coverage by Age in Area Code 413
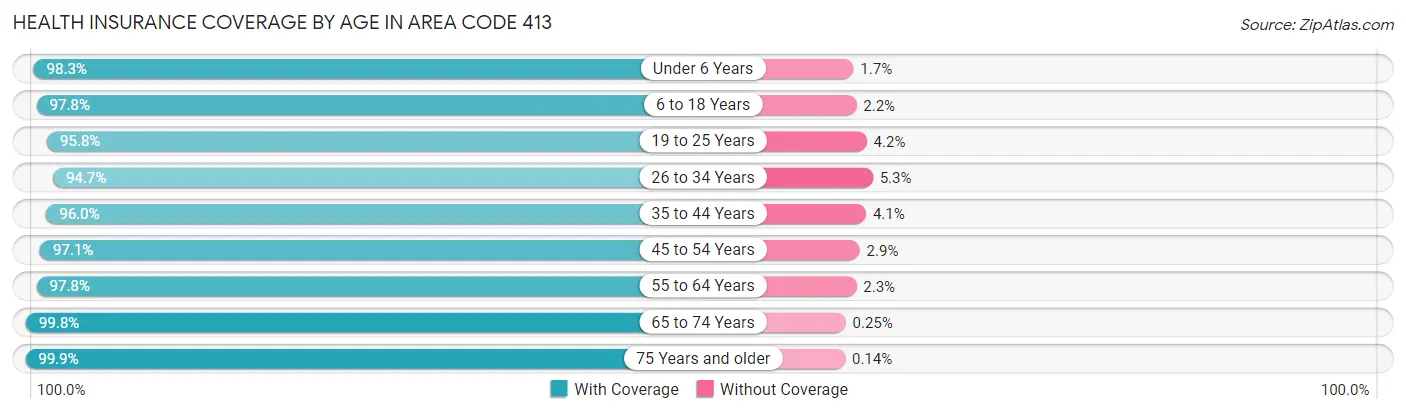
| Age Bracket | With Coverage | Without Coverage |
| Under 6 Years | 43,763 (98.3%) | 757 (1.7%) |
| 6 to 18 Years | 120,051 (97.8%) | 2,755 (2.2%) |
| 19 to 25 Years | 85,351 (95.8%) | 3,710 (4.2%) |
| 26 to 34 Years | 83,071 (94.7%) | 4,650 (5.3%) |
| 35 to 44 Years | 88,778 (96.0%) | 3,749 (4.1%) |
| 45 to 54 Years | 94,830 (97.1%) | 2,791 (2.9%) |
| 55 to 64 Years | 111,664 (97.8%) | 2,566 (2.2%) |
| 65 to 74 Years | 90,436 (99.8%) | 224 (0.3%) |
| 75 Years and older | 59,301 (99.9%) | 84 (0.1%) |
| Total | 777,245 (97.3%) | 21,286 (2.7%) |
Health Insurance Coverage by Citizenship Status in Area Code 413
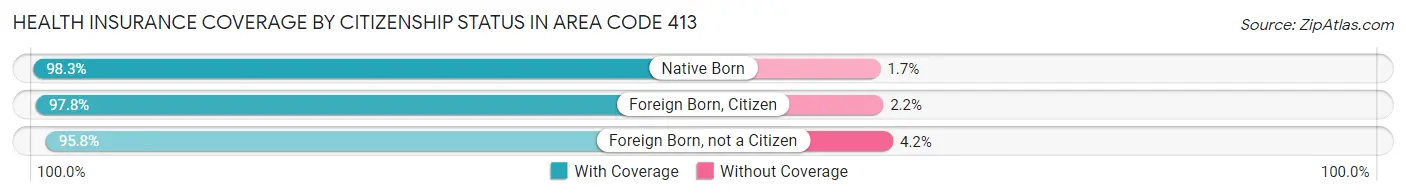
| Citizenship Status | With Coverage | Without Coverage |
| Native Born | 43,763 (98.3%) | 757 (1.7%) |
| Foreign Born, Citizen | 120,051 (97.8%) | 2,755 (2.2%) |
| Foreign Born, not a Citizen | 85,351 (95.8%) | 3,710 (4.2%) |
Health Insurance Coverage by Household Income in Area Code 413
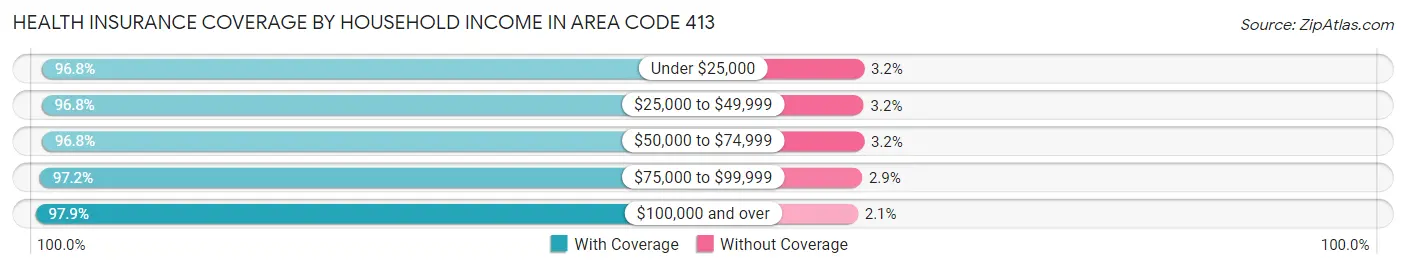
| Household Income | With Coverage | Without Coverage |
| Under $25,000 | 96,754 (96.8%) | 3,234 (3.2%) |
| $25,000 to $49,999 | 113,622 (96.8%) | 3,712 (3.2%) |
| $50,000 to $74,999 | 107,355 (96.8%) | 3,581 (3.2%) |
| $75,000 to $99,999 | 96,871 (97.2%) | 2,842 (2.9%) |
| $100,000 and over | 329,700 (97.9%) | 6,932 (2.1%) |
Public vs Private Health Insurance Coverage by Age in Area Code 413
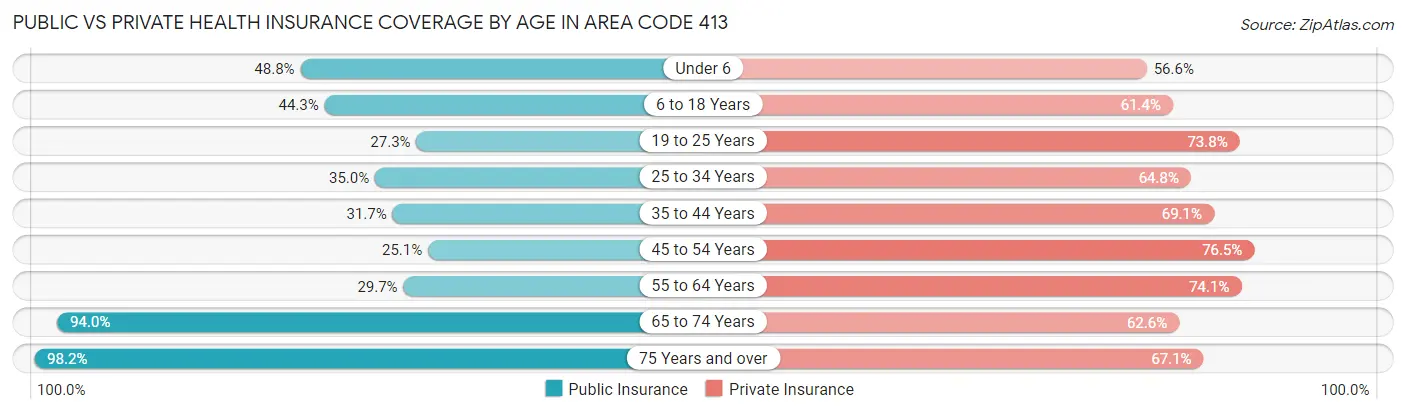
| Age Bracket | Public Insurance | Private Insurance |
| Under 6 | 21,731 (48.8%) | 25,198 (56.6%) |
| 6 to 18 Years | 54,433 (44.3%) | 75,445 (61.4%) |
| 19 to 25 Years | 24,297 (27.3%) | 65,736 (73.8%) |
| 25 to 34 Years | 30,660 (34.9%) | 56,804 (64.8%) |
| 35 to 44 Years | 29,330 (31.7%) | 63,887 (69.1%) |
| 45 to 54 Years | 24,526 (25.1%) | 74,723 (76.5%) |
| 55 to 64 Years | 33,908 (29.7%) | 84,686 (74.1%) |
| 65 to 74 Years | 85,200 (94.0%) | 56,735 (62.6%) |
| 75 Years and over | 58,325 (98.2%) | 39,858 (67.1%) |
| Total | 362,410 (45.4%) | 543,072 (68.0%) |
Disability Status by Sex by Age in Area Code 413
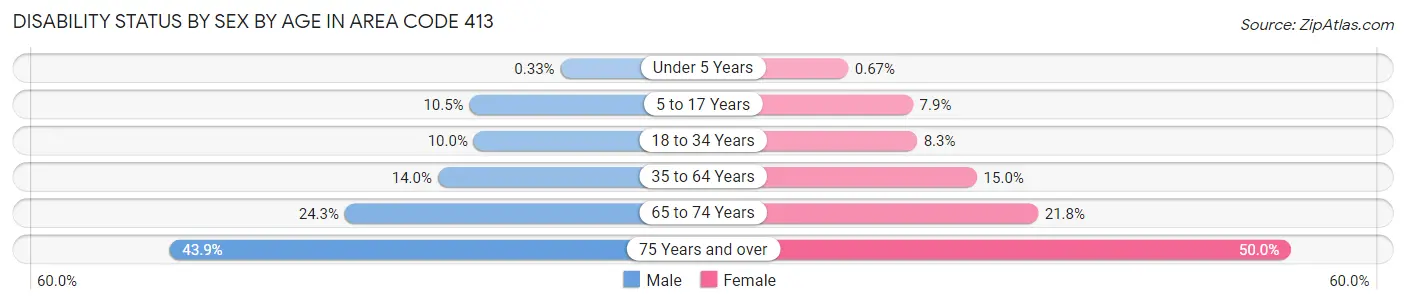
| Age Bracket | Male | Female |
| Under 5 Years | 64 (0.3%) | 121 (0.7%) |
| 5 to 17 Years | 6,256 (10.5%) | 4,402 (7.9%) |
| 18 to 34 Years | 9,452 (10.0%) | 8,064 (8.3%) |
| 35 to 64 Years | 20,521 (14.0%) | 23,671 (15.0%) |
| 65 to 74 Years | 10,355 (24.3%) | 10,503 (21.8%) |
| 75 Years and over | 10,550 (43.9%) | 17,679 (50.0%) |
Disability Class by Sex by Age in Area Code 413
Disability Class: Hearing Difficulty
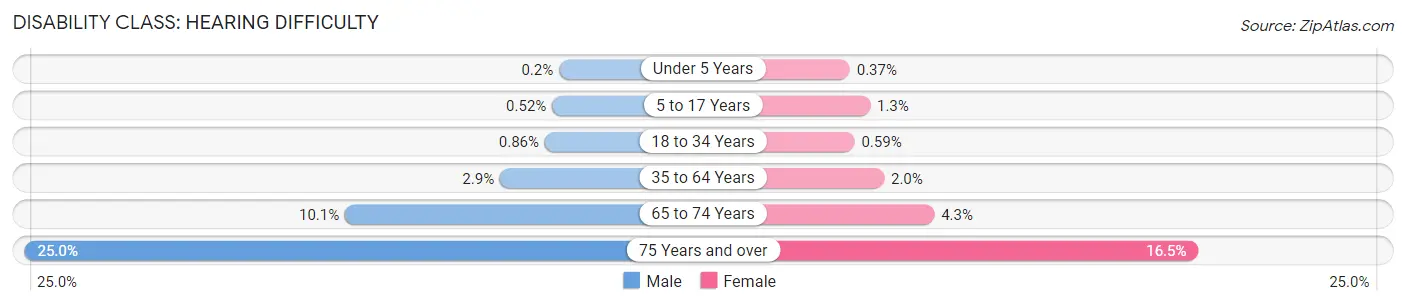
| Age Bracket | Male | Female |
| Under 5 Years | 38 (0.2%) | 66 (0.4%) |
| 5 to 17 Years | 308 (0.5%) | 733 (1.3%) |
| 18 to 34 Years | 817 (0.9%) | 567 (0.6%) |
| 35 to 64 Years | 4,313 (2.9%) | 3,087 (2.0%) |
| 65 to 74 Years | 4,309 (10.1%) | 2,063 (4.3%) |
| 75 Years and over | 6,013 (25.0%) | 5,845 (16.5%) |
Disability Class: Vision Difficulty
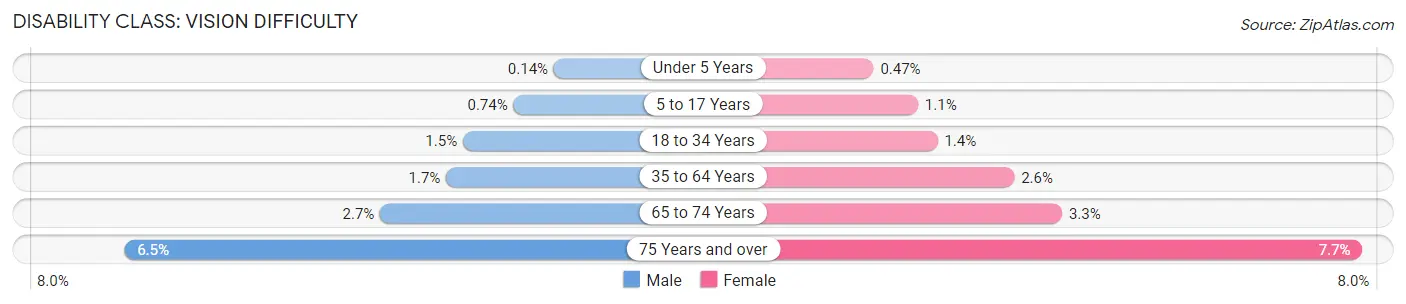
| Age Bracket | Male | Female |
| Under 5 Years | 26 (0.1%) | 85 (0.5%) |
| 5 to 17 Years | 445 (0.7%) | 628 (1.1%) |
| 18 to 34 Years | 1,415 (1.5%) | 1,370 (1.4%) |
| 35 to 64 Years | 2,561 (1.7%) | 4,037 (2.6%) |
| 65 to 74 Years | 1,157 (2.7%) | 1,575 (3.3%) |
| 75 Years and over | 1,568 (6.5%) | 2,733 (7.7%) |
Disability Class: Cognitive Difficulty
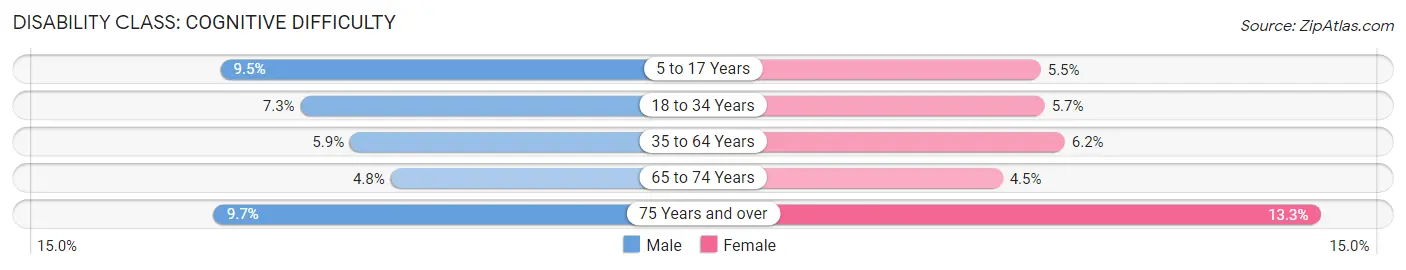
| Age Bracket | Male | Female |
| 5 to 17 Years | 5,701 (9.5%) | 3,092 (5.5%) |
| 18 to 34 Years | 6,930 (7.3%) | 5,463 (5.7%) |
| 35 to 64 Years | 8,727 (5.9%) | 9,788 (6.2%) |
| 65 to 74 Years | 2,046 (4.8%) | 2,158 (4.5%) |
| 75 Years and over | 2,339 (9.7%) | 4,707 (13.3%) |
Disability Class: Ambulatory Difficulty
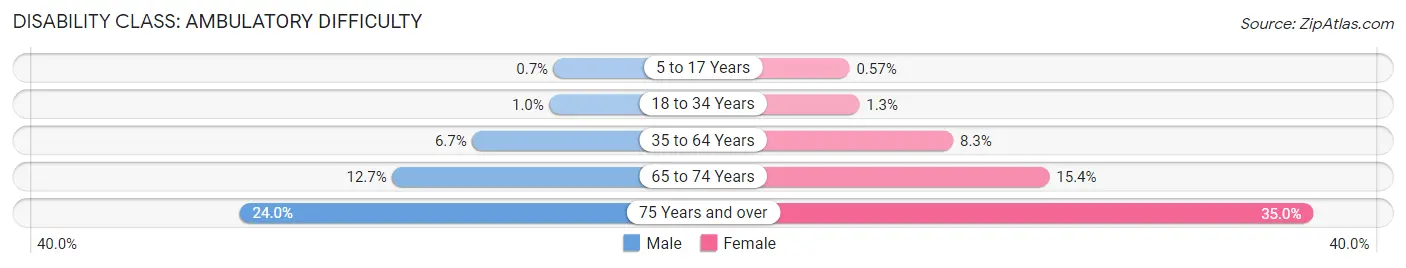
| Age Bracket | Male | Female |
| 5 to 17 Years | 421 (0.7%) | 317 (0.6%) |
| 18 to 34 Years | 968 (1.0%) | 1,257 (1.3%) |
| 35 to 64 Years | 9,896 (6.7%) | 13,012 (8.3%) |
| 65 to 74 Years | 5,392 (12.7%) | 7,414 (15.4%) |
| 75 Years and over | 5,779 (24.0%) | 12,367 (35.0%) |
Disability Class: Self-Care Difficulty
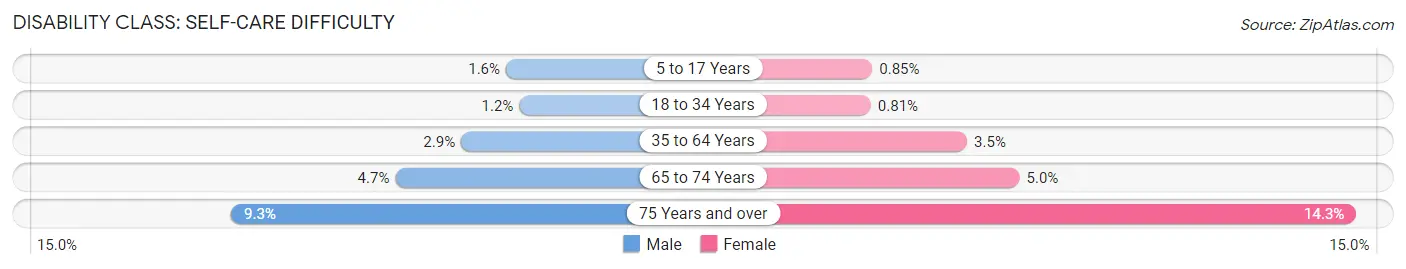
| Age Bracket | Male | Female |
| 5 to 17 Years | 958 (1.6%) | 474 (0.9%) |
| 18 to 34 Years | 1,162 (1.2%) | 783 (0.8%) |
| 35 to 64 Years | 4,189 (2.9%) | 5,505 (3.5%) |
| 65 to 74 Years | 1,991 (4.7%) | 2,383 (5.0%) |
| 75 Years and over | 2,225 (9.2%) | 5,060 (14.3%) |
Technology Access in Area Code 413
Computing Device Access in Area Code 413
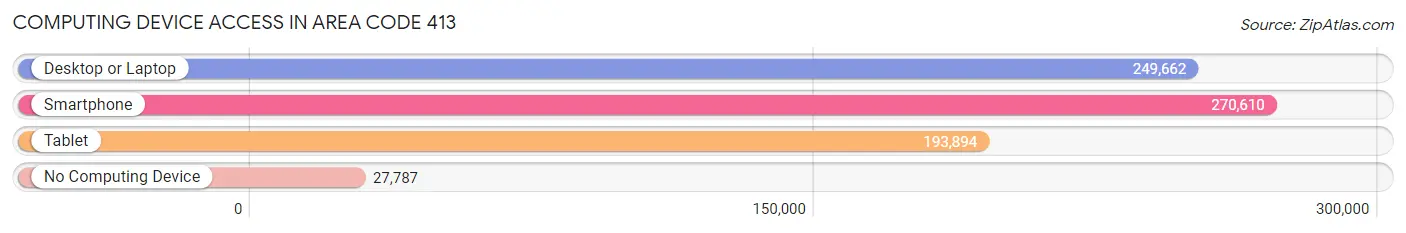
| Device Type | # Households | % Households |
| Desktop or Laptop | 249,662 | 76.2% |
| Smartphone | 270,610 | 82.7% |
| Tablet | 193,894 | 59.2% |
| No Computing Device | 27,787 | 8.5% |
| Total | 327,428 | 100.0% |
Internet Access in Area Code 413
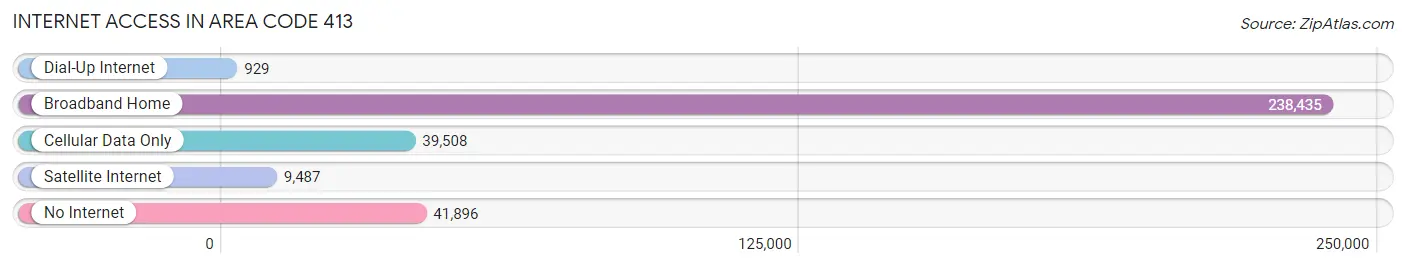
| Internet Type | # Households | % Households |
| Dial-Up Internet | 929 | 0.3% |
| Broadband Home | 238,435 | 72.8% |
| Cellular Data Only | 39,508 | 12.1% |
| Satellite Internet | 9,487 | 2.9% |
| No Internet | 41,896 | 12.8% |
| Total | 327,428 | 100.0% |
Area Code 413 Summary
Geography
Area code 413 is a telephone area code in the North American Numbering Plan (NANP) for the western third of Massachusetts. It includes the cities of Springfield, Pittsfield, Northampton, and Greenfield.
Social
Area code 413 is home to a diverse population of people from all walks of life. The area is known for its vibrant arts and culture scene, with a variety of museums, galleries, and performance venues.
Economics
Area code 413 is an important economic hub for the state of Massachusetts. It is home to a number of major employers, including Baystate Health, MassMutual, and Smith & Wesson.
Demographics
Area code 413 is home to a population of over 1.2 million people. The population is diverse, with a mix of races and ethnicities. The median household income is $60,000, and the median age is 39.
Common Questions
What is Per Capita Income in Area Code 413?
Per Capita income in Area Code 413 is $43,583.
What is the Median Family Income in Area Code 413?
Median Family Income in Area Code 413 is $101,242.
What is the Median Household income in Area Code 413?
Median Household Income in Area Code 413 is $79,080.
What is Income or Wage Gap in Area Code 413?
Income or Wage Gap in Area Code 413 is 26.6%.
Women in Area Code 413 earn 73.4 cents for every dollar earned by a man.
What is Family Income Deficit in Area Code 413?
Family Income Deficit in Area Code 413 is $10,823.
Families that are below poverty line in Area Code 413 earn $10,823 less on average than the poverty threshold level.
What is Inequality or Gini Index in Area Code 413?
Inequality or Gini Index in Area Code 413 is 48.36.
What is the Total Population of Area Code 413?
Total Population of Area Code 413 is 807,334.
What is the Total Male Population of Area Code 413?
Total Male Population of Area Code 413 is 391,864.
What is the Total Female Population of Area Code 413?
Total Female Population of Area Code 413 is 415,470.
What is the Ratio of Males per 100 Females in Area Code 413?
There are 94.32 Males per 100 Females in Area Code 413.
What is the Ratio of Females per 100 Males in Area Code 413?
There are 106.02 Females per 100 Males in Area Code 413.
What is the Median Population Age in Area Code 413?
Median Population Age in Area Code 413 is 46.7 Years.
What is the Average Family Size in Area Code 413
Average Family Size in Area Code 413 is 2.8 People.
What is the Average Household Size in Area Code 413
Average Household Size in Area Code 413 is 2.3 People.
How Large is the Labor Force in Area Code 413?
There are 416,730 People in the Labor Forcein in Area Code 413.
What is the Percentage of People in the Labor Force in Area Code 413?
61.9% of People are in the Labor Force in Area Code 413.
What is the Unemployment Rate in Area Code 413?
Unemployment Rate in Area Code 413 is 5.5%.