Area Code 520 Map & Demographics
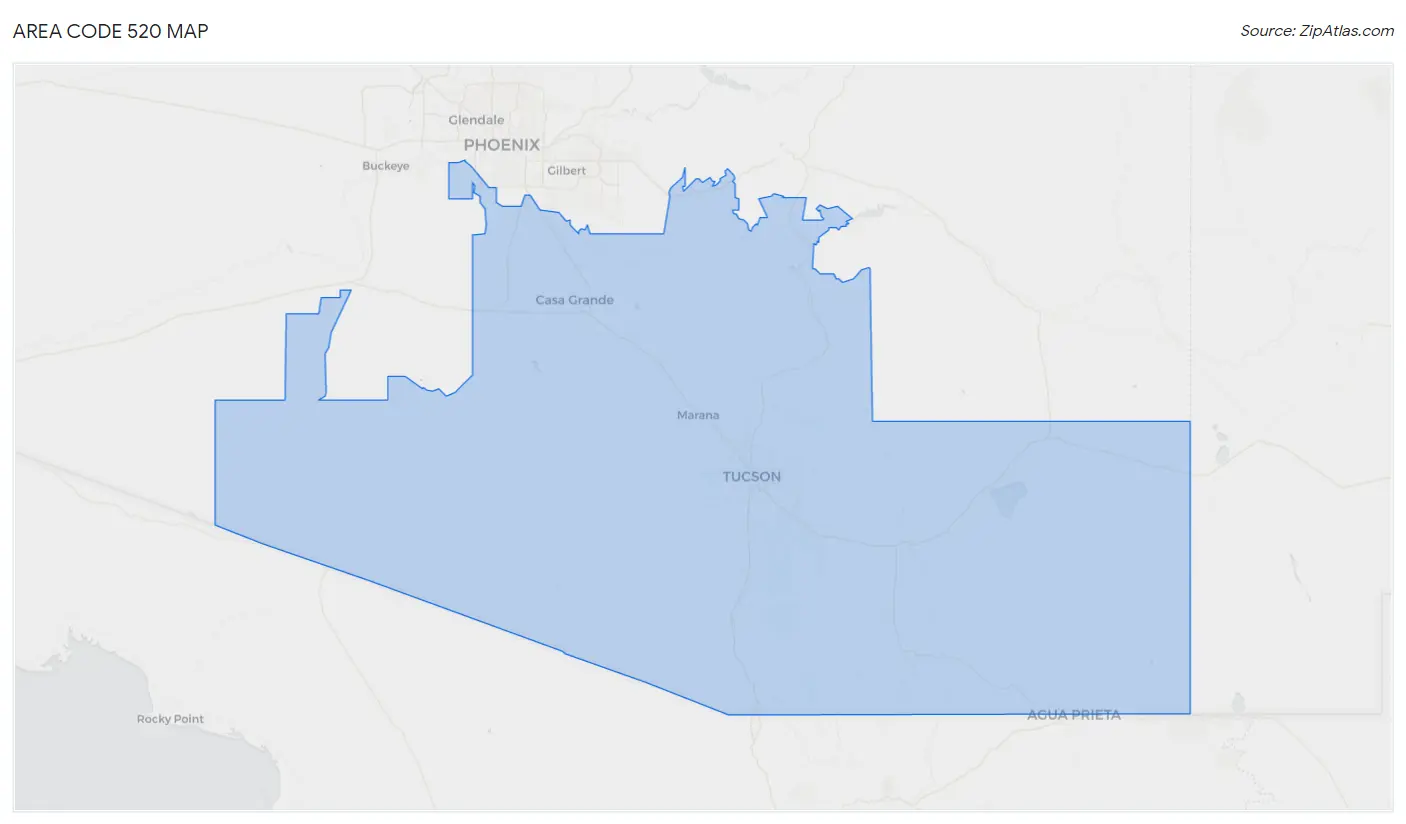
Area Code 520 Map
Area Code 520 Overview
$36,087
PER CAPITA INCOME
$83,905
AVG FAMILY INCOME
$69,197
AVG HOUSEHOLD INCOME
26.9%
WAGE / INCOME GAP [ % ]
73.1¢/ $1
WAGE / INCOME GAP [ $ ]
$11,461
FAMILY INCOME DEFICIT
54.92
INEQUALITY / GINI INDEX
2,618,669
TOTAL POPULATION
1,317,051
MALE POPULATION
1,301,618
FEMALE POPULATION
101.19
MALES / 100 FEMALES
98.83
FEMALES / 100 MALES
44.2
MEDIAN AGE
3.0
AVG FAMILY SIZE
2.5
AVG HOUSEHOLD SIZE
1,134,057
LABOR FORCE [ PEOPLE ]
53.4%
PERCENT IN LABOR FORCE
7.5%
UNEMPLOYMENT RATE
Income in Area Code 520
Income Overview in Area Code 520
Per Capita Income in Area Code 520 is $36,087, while median incomes of families and households are $83,905 and $69,197 respectively.
| Characteristic | Number | Measure |
| Per Capita Income | 2,618,669 | $36,087 |
| Median Family Income | 651,989 | $83,905 |
| Mean Family Income | 651,989 | $13,012,454 |
| Median Household Income | 1,018,628 | $69,197 |
| Mean Household Income | 1,018,628 | $11,255,186 |
| Income Deficit | 651,989 | $11,461 |
| Wage / Income Gap (%) | 2,618,669 | 26.85% |
| Wage / Income Gap ($) | 2,618,669 | 73.15¢ per $1 |
| Gini / Inequality Index | 2,618,669 | 54.92 |
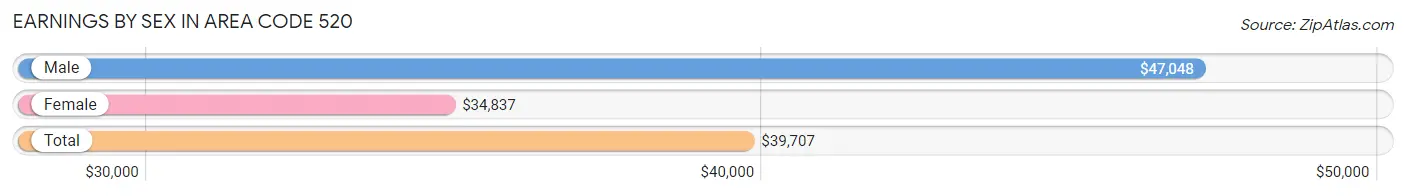
Earnings by Sex in Area Code 520
Average Earnings in Area Code 520 are $39,707, $47,048 for men and $34,837 for women, a difference of 26.0%.
| Sex | Number | Average Earnings |
| Male | 708,137 (53.8%) | $47,048 |
| Female | 606,964 (46.2%) | $34,837 |
| Total | 1,315,101 (100.0%) | $39,707 |
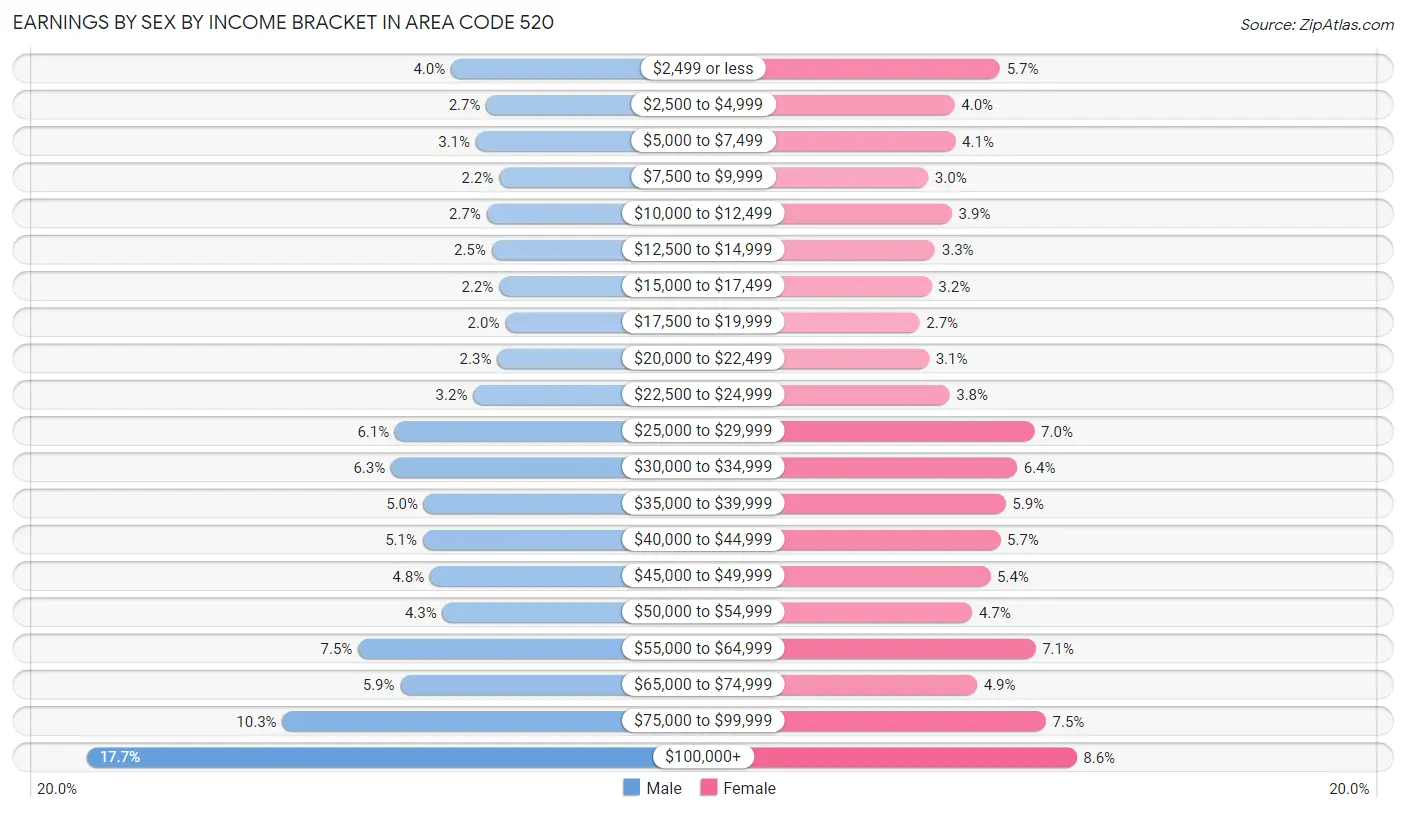
Earnings by Sex by Income Bracket in Area Code 520
The most common earnings brackets in Area Code 520 are $100,000+ for men (125,127 | 17.7%) and $100,000+ for women (52,216 | 8.6%).
| Income | Male | Female |
| $2,499 or less | 28,501 (4.0%) | 34,761 (5.7%) |
| $2,500 to $4,999 | 19,134 (2.7%) | 24,445 (4.0%) |
| $5,000 to $7,499 | 21,861 (3.1%) | 24,623 (4.1%) |
| $7,500 to $9,999 | 15,730 (2.2%) | 18,432 (3.0%) |
| $10,000 to $12,499 | 19,055 (2.7%) | 23,881 (3.9%) |
| $12,500 to $14,999 | 17,687 (2.5%) | 20,004 (3.3%) |
| $15,000 to $17,499 | 15,748 (2.2%) | 19,265 (3.2%) |
| $17,500 to $19,999 | 14,064 (2.0%) | 16,538 (2.7%) |
| $20,000 to $22,499 | 16,217 (2.3%) | 18,621 (3.1%) |
| $22,500 to $24,999 | 22,564 (3.2%) | 23,322 (3.8%) |
| $25,000 to $29,999 | 43,308 (6.1%) | 42,632 (7.0%) |
| $30,000 to $34,999 | 44,383 (6.3%) | 38,662 (6.4%) |
| $35,000 to $39,999 | 35,694 (5.0%) | 36,042 (5.9%) |
| $40,000 to $44,999 | 35,990 (5.1%) | 34,821 (5.7%) |
| $45,000 to $49,999 | 34,077 (4.8%) | 32,586 (5.4%) |
| $50,000 to $54,999 | 30,746 (4.3%) | 28,480 (4.7%) |
| $55,000 to $64,999 | 53,143 (7.5%) | 42,863 (7.1%) |
| $65,000 to $74,999 | 41,921 (5.9%) | 29,534 (4.9%) |
| $75,000 to $99,999 | 73,187 (10.3%) | 45,236 (7.4%) |
| $100,000+ | 125,127 (17.7%) | 52,216 (8.6%) |
| Total | 708,137 (100.0%) | 606,964 (100.0%) |
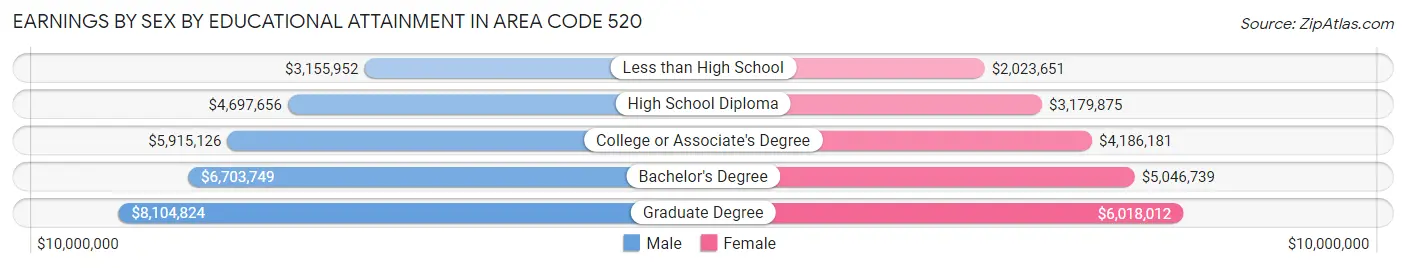
Earnings by Sex by Educational Attainment in Area Code 520
Average earnings in Area Code 520 are $6,890,436 for men and $4,654,512 for women, a difference of 32.5%. Men with an educational attainment of graduate degree enjoy the highest average annual earnings of $8,104,824, while those with less than high school education earn the least with $3,155,952. Women with an educational attainment of graduate degree earn the most with the average annual earnings of $6,018,012, while those with less than high school education have the smallest earnings of $2,023,651.
| Educational Attainment | Male Income | Female Income |
| Less than High School | $3,155,952 | $2,023,651 |
| High School Diploma | $4,697,656 | $3,179,875 |
| College or Associate's Degree | $5,915,126 | $4,186,181 |
| Bachelor's Degree | $6,703,749 | $5,046,739 |
| Graduate Degree | $8,104,824 | $6,018,012 |
| Total | $6,890,436 | $4,654,512 |
Family Income in Area Code 520
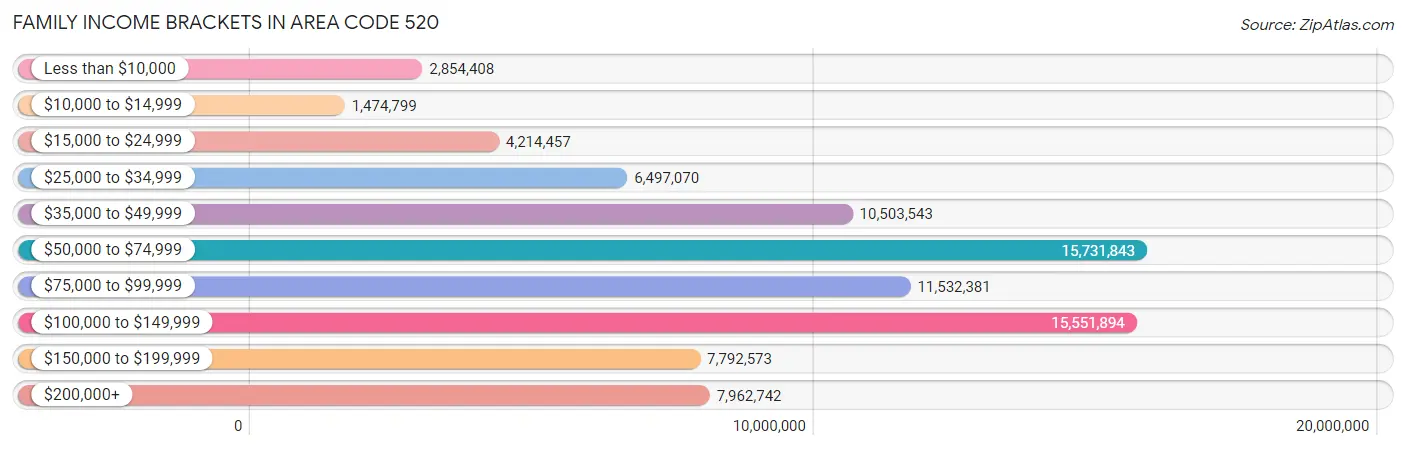
Family Income Brackets in Area Code 520
According to the Area Code 520 family income data, there are 15,731,843 families falling into the $50,000 to $74,999 income range, which is the most common income bracket and makes up 2,412.9% of all families. Conversely, the $10,000 to $14,999 income bracket is the least frequent group with only 1,474,799 families (226.2%) belonging to this category.
| Income Bracket | # Families | % Families |
| Less than $10,000 | 2,854,408 | 437.8% |
| $10,000 to $14,999 | 1,474,799 | 226.2% |
| $15,000 to $24,999 | 4,214,457 | 646.4% |
| $25,000 to $34,999 | 6,497,070 | 996.5% |
| $35,000 to $49,999 | 10,503,543 | 1,611.0% |
| $50,000 to $74,999 | 15,731,843 | 2,412.9% |
| $75,000 to $99,999 | 11,532,381 | 1,768.8% |
| $100,000 to $149,999 | 15,551,894 | 2,385.3% |
| $150,000 to $199,999 | 7,792,573 | 1,195.2% |
| $200,000+ | 7,962,742 | 1,221.3% |
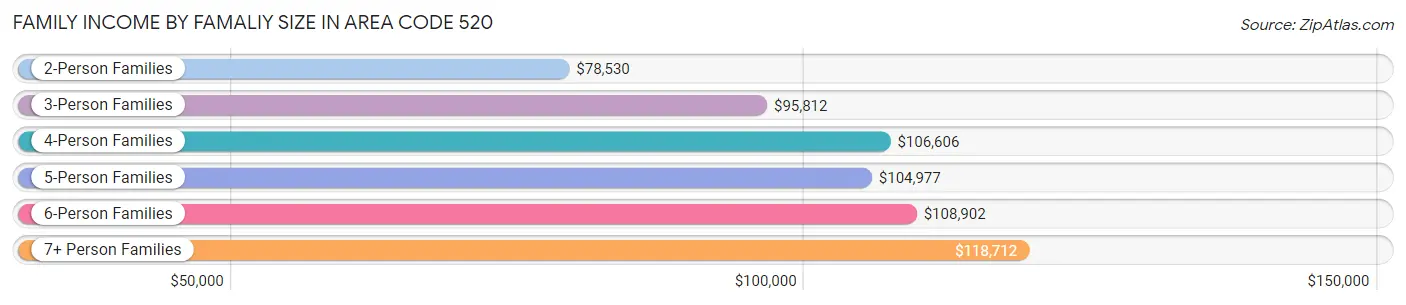
Family Income by Famaliy Size in Area Code 520
7+ person families (13,752 | 2.1%) account for the highest median family income in Area Code 520 with $118,712 per family, while 2-person families (321,848 | 49.4%) have the highest median income of $39,265 per family member.
| Income Bracket | # Families | Median Income |
| 2-Person Families | 321,848 (49.4%) | $78,530 |
| 3-Person Families | 128,751 (19.8%) | $95,812 |
| 4-Person Families | 110,372 (16.9%) | $106,606 |
| 5-Person Families | 52,974 (8.1%) | $104,977 |
| 6-Person Families | 24,292 (3.7%) | $108,902 |
| 7+ Person Families | 13,752 (2.1%) | $118,712 |
| Total | 651,989 (100.0%) | $83,905 |
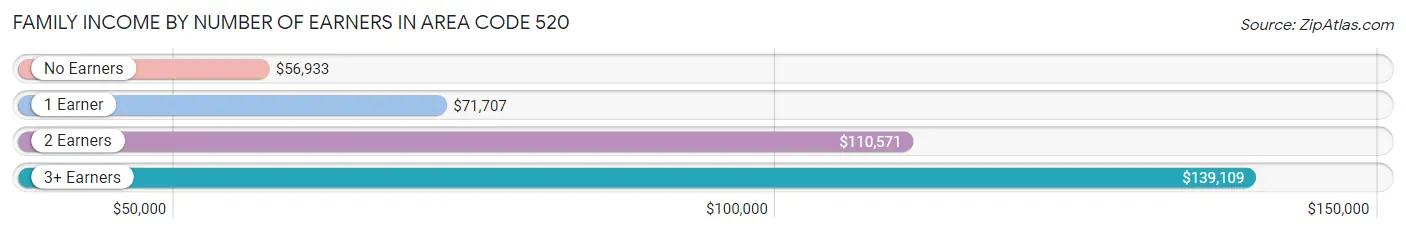
Family Income by Number of Earners in Area Code 520
The median family income in Area Code 520 is $83,905, with families comprising 3+ earners (65,502) having the highest median family income of $139,109, while families with no earners (127,771) have the lowest median family income of $56,933, accounting for 10.1% and 19.6% of families, respectively.
| Number of Earners | # Families | Median Income |
| No Earners | 127,771 (19.6%) | $56,933 |
| 1 Earner | 214,671 (32.9%) | $71,707 |
| 2 Earners | 244,045 (37.4%) | $110,571 |
| 3+ Earners | 65,502 (10.1%) | $139,109 |
| Total | 651,989 (100.0%) | $83,905 |
Household Income in Area Code 520
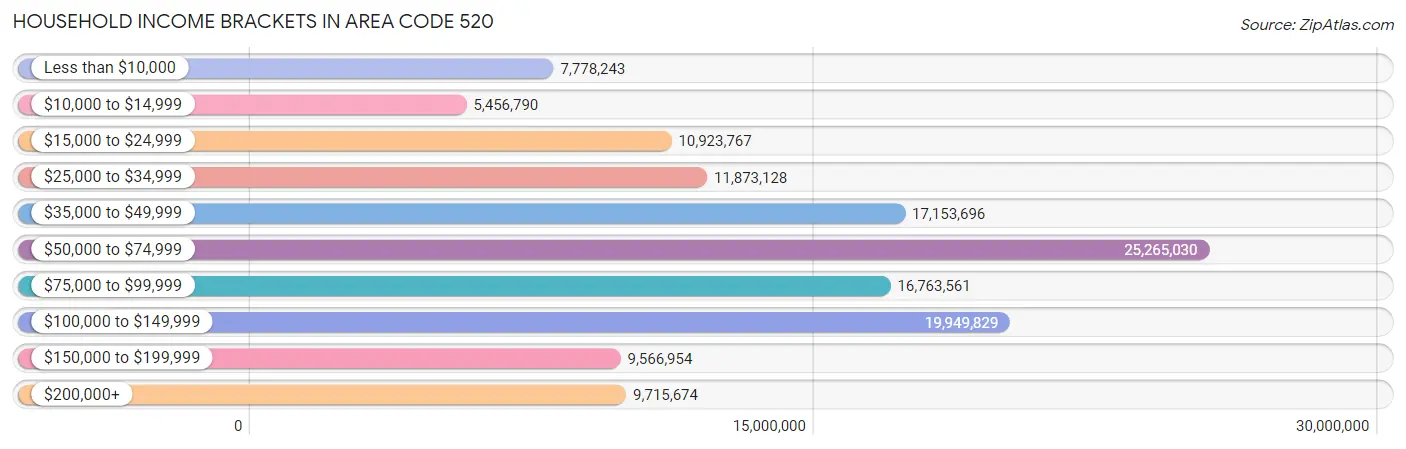
Household Income Brackets in Area Code 520
With 25,265,030 households falling in the category, the $50,000 to $74,999 income range is the most frequent in Area Code 520, accounting for 2,480.3% of all households. In contrast, only 5,456,790 households (535.7%) fall into the $10,000 to $14,999 income bracket, making it the least populous group.
| Income Bracket | # Households | % Households |
| Less than $10,000 | 7,778,243 | 763.6% |
| $10,000 to $14,999 | 5,456,790 | 535.7% |
| $15,000 to $24,999 | 10,923,767 | 1,072.4% |
| $25,000 to $34,999 | 11,873,128 | 1,165.6% |
| $35,000 to $49,999 | 17,153,696 | 1,684.0% |
| $50,000 to $74,999 | 25,265,030 | 2,480.3% |
| $75,000 to $99,999 | 16,763,561 | 1,645.7% |
| $100,000 to $149,999 | 19,949,829 | 1,958.5% |
| $150,000 to $199,999 | 9,566,954 | 939.2% |
| $200,000+ | 9,715,674 | 953.8% |
Household Income by Householder Age in Area Code 520
The median household income in Area Code 520 is $69,197, with the highest median household income of $82,346 found in the 45 to 64 years age bracket for the primary householder. A total of 339,331 households (33.3%) fall into this category. Meanwhile, the 15 to 24 years age bracket for the primary householder has the lowest median household income of $50,638, with 52,847 households (5.2%) in this group.
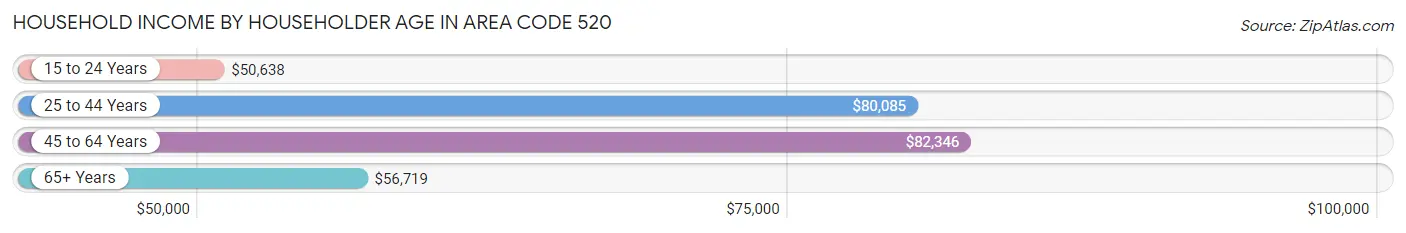
| Income Bracket | # Households | Median Income |
| 15 to 24 Years | 52,847 (5.2%) | $50,638 |
| 25 to 44 Years | 315,470 (31.0%) | $80,085 |
| 45 to 64 Years | 339,331 (33.3%) | $82,346 |
| 65+ Years | 310,980 (30.5%) | $56,719 |
| Total | 1,018,628 (100.0%) | $69,197 |
Poverty in Area Code 520
Income Below Poverty by Sex and Age in Area Code 520
With 11.8% poverty level for males and 14.0% for females among the residents of Area Code 520, under 5 year old males and 18 to 24 year old females are the most vulnerable to poverty, with 14,079 males (19.8%) and 27,932 females (23.6%) in their respective age groups living below the poverty level.
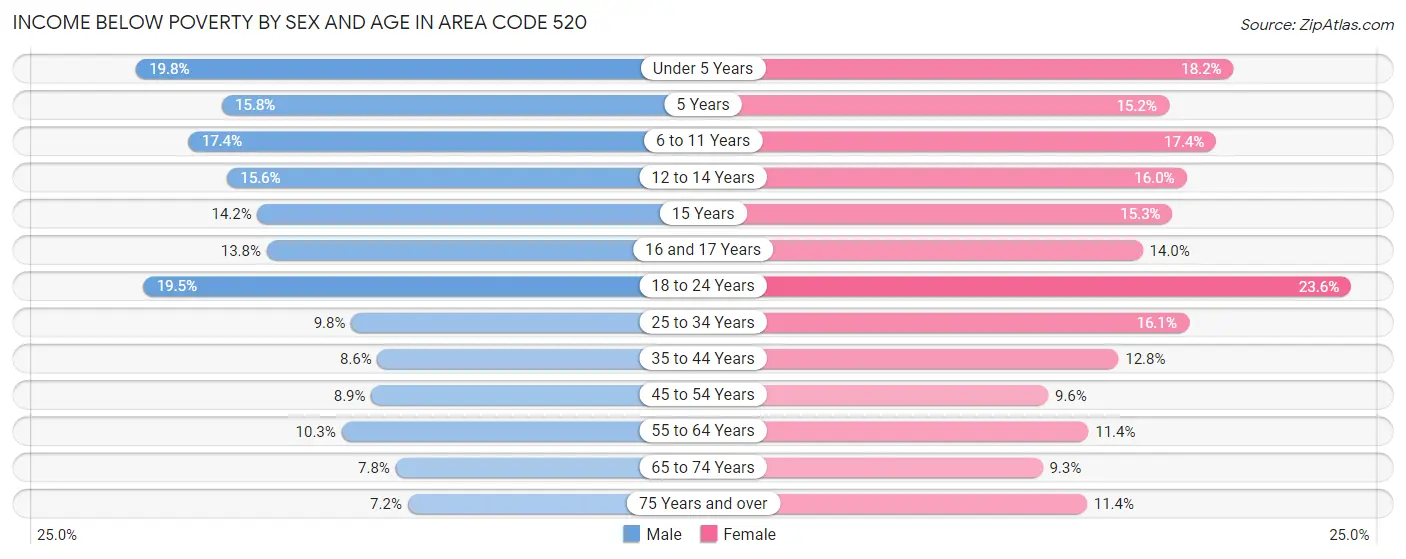
| Age Bracket | Male | Female |
| Under 5 Years | 14,079 (19.8%) | 11,981 (18.2%) |
| 5 Years | 2,513 (15.8%) | 2,072 (15.2%) |
| 6 to 11 Years | 16,429 (17.4%) | 16,097 (17.4%) |
| 12 to 14 Years | 8,025 (15.6%) | 7,450 (16.0%) |
| 15 Years | 2,481 (14.2%) | 2,581 (15.3%) |
| 16 and 17 Years | 4,510 (13.8%) | 4,252 (14.0%) |
| 18 to 24 Years | 25,130 (19.5%) | 27,932 (23.6%) |
| 25 to 34 Years | 16,948 (9.8%) | 26,886 (16.1%) |
| 35 to 44 Years | 13,793 (8.6%) | 19,559 (12.8%) |
| 45 to 54 Years | 12,929 (8.9%) | 14,159 (9.6%) |
| 55 to 64 Years | 14,950 (10.3%) | 18,299 (11.4%) |
| 65 to 74 Years | 10,370 (7.8%) | 14,333 (9.3%) |
| 75 Years and over | 6,882 (7.2%) | 12,999 (11.4%) |
| Total | 149,039 (11.8%) | 178,600 (14.0%) |
Income Above Poverty by Sex and Age in Area Code 520
According to the poverty statistics in Area Code 520, males aged 75 years and over and females aged 65 to 74 years are the age groups that are most secure financially, with 92.8% of males and 90.7% of females in these age groups living above the poverty line.
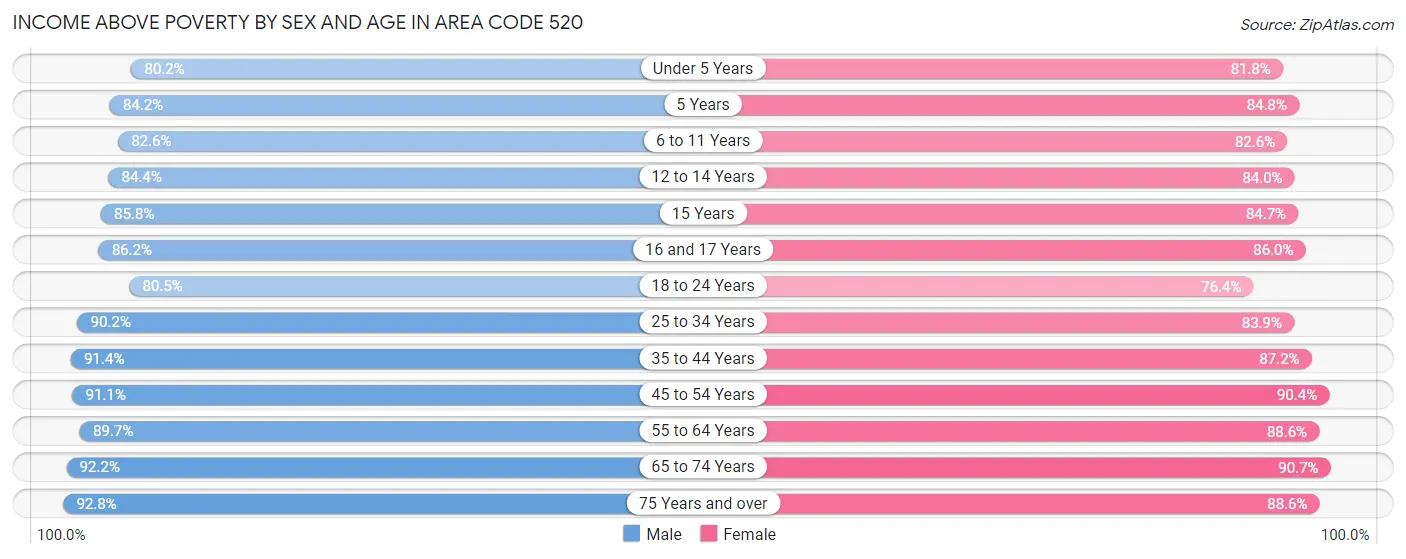
| Age Bracket | Male | Female |
| Under 5 Years | 56,952 (80.2%) | 53,950 (81.8%) |
| 5 Years | 13,356 (84.2%) | 11,589 (84.8%) |
| 6 to 11 Years | 78,089 (82.6%) | 76,564 (82.6%) |
| 12 to 14 Years | 43,435 (84.4%) | 39,149 (84.0%) |
| 15 Years | 15,001 (85.8%) | 14,244 (84.7%) |
| 16 and 17 Years | 28,277 (86.2%) | 26,214 (86.0%) |
| 18 to 24 Years | 103,918 (80.5%) | 90,263 (76.4%) |
| 25 to 34 Years | 155,238 (90.2%) | 140,135 (83.9%) |
| 35 to 44 Years | 146,177 (91.4%) | 132,910 (87.2%) |
| 45 to 54 Years | 132,128 (91.1%) | 133,773 (90.4%) |
| 55 to 64 Years | 130,368 (89.7%) | 141,631 (88.6%) |
| 65 to 74 Years | 122,965 (92.2%) | 139,667 (90.7%) |
| 75 Years and over | 88,380 (92.8%) | 101,305 (88.6%) |
| Total | 1,114,284 (88.2%) | 1,101,394 (86.1%) |
Income Below Poverty Among Married-Couple Families in Area Code 520
The poverty statistics for married-couple families in Area Code 520 show that 4.8% or 22,954 of the total 480,197 families live below the poverty line. Families with 5 or more children have the highest poverty rate of 20.7%, comprising of 860 families. On the other hand, families with no children have the lowest poverty rate of 3.5%, which includes 10,250 families.
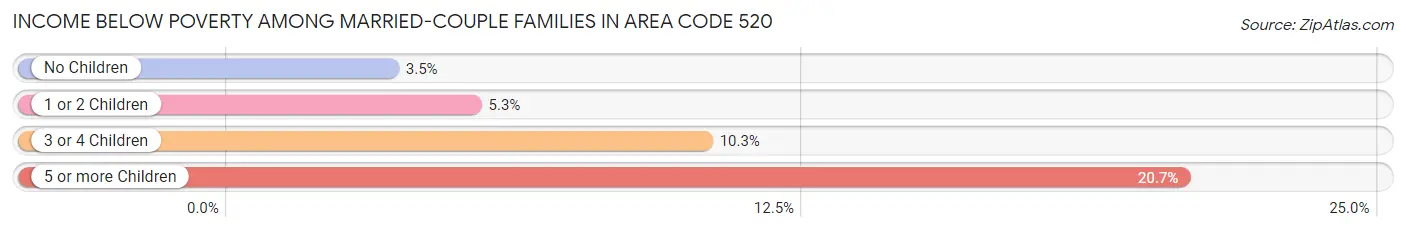
| Children | Above Poverty | Below Poverty |
| No Children | 282,524 (96.5%) | 10,250 (3.5%) |
| 1 or 2 Children | 133,562 (94.7%) | 7,481 (5.3%) |
| 3 or 4 Children | 37,867 (89.7%) | 4,363 (10.3%) |
| 5 or more Children | 3,290 (79.3%) | 860 (20.7%) |
| Total | 457,243 (95.2%) | 22,954 (4.8%) |
Income Below Poverty Among Single-Parent Households in Area Code 520
According to the poverty data in Area Code 520, 13.3% or 7,293 single-father households and 23.6% or 27,576 single-mother households are living below the poverty line. Among single-father households, those with 5 or more children have the highest poverty rate, with 253 households (45.7%) experiencing poverty. Likewise, among single-mother households, those with 5 or more children have the highest poverty rate, with 1,051 households (69.1%) falling below the poverty line.
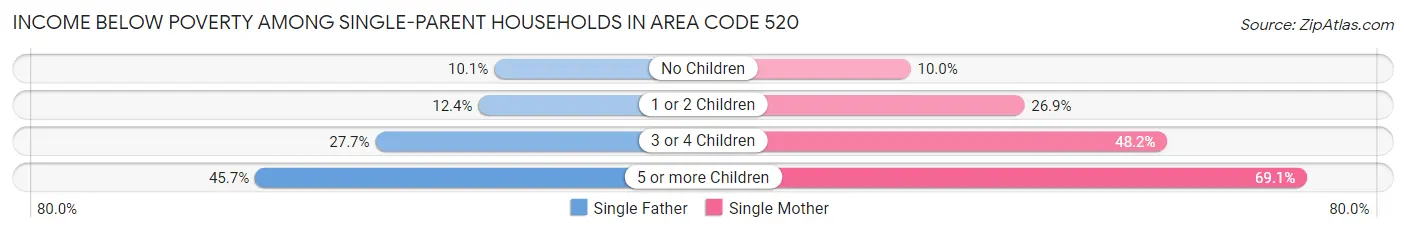
| Children | Single Father | Single Mother |
| No Children | 2,200 (10.1%) | 4,450 (10.0%) |
| 1 or 2 Children | 3,327 (12.4%) | 15,255 (26.9%) |
| 3 or 4 Children | 1,513 (27.7%) | 6,820 (48.2%) |
| 5 or more Children | 253 (45.7%) | 1,051 (69.1%) |
| Total | 7,293 (13.3%) | 27,576 (23.6%) |
Income Below Poverty Among Married-Couple vs Single-Parent Households in Area Code 520
The poverty data for Area Code 520 shows that 22,954 of the married-couple family households (4.8%) and 34,869 of the single-parent households (20.3%) are living below the poverty level. Within the married-couple family households, those with 5 or more children have the highest poverty rate, with 860 households (20.7%) falling below the poverty line. Among the single-parent households, those with 5 or more children have the highest poverty rate, with 1,304 household (62.8%) living below poverty.
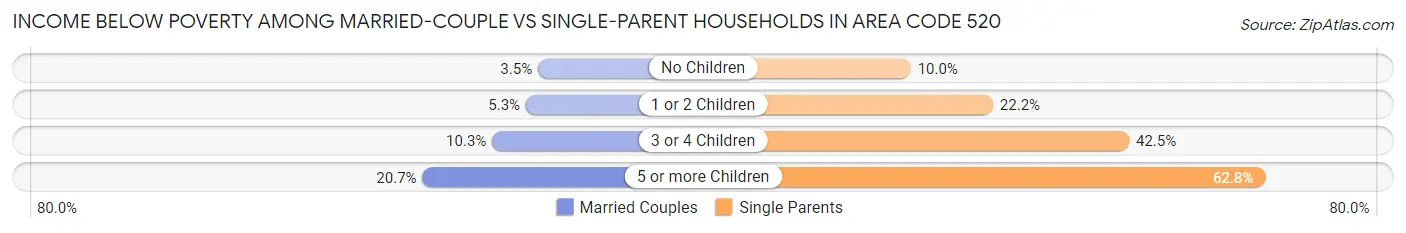
| Children | Married-Couple Families | Single-Parent Households |
| No Children | 10,250 (3.5%) | 6,650 (10.0%) |
| 1 or 2 Children | 7,481 (5.3%) | 18,582 (22.2%) |
| 3 or 4 Children | 4,363 (10.3%) | 8,333 (42.5%) |
| 5 or more Children | 860 (20.7%) | 1,304 (62.8%) |
| Total | 22,954 (4.8%) | 34,869 (20.3%) |
Race in Area Code 520
The most populous races in Area Code 520 are White / Caucasian (1,745,246 | 66.6%), Hispanic or Latino (906,730 | 34.6%), and Two or more Races (363,905 | 13.9%).
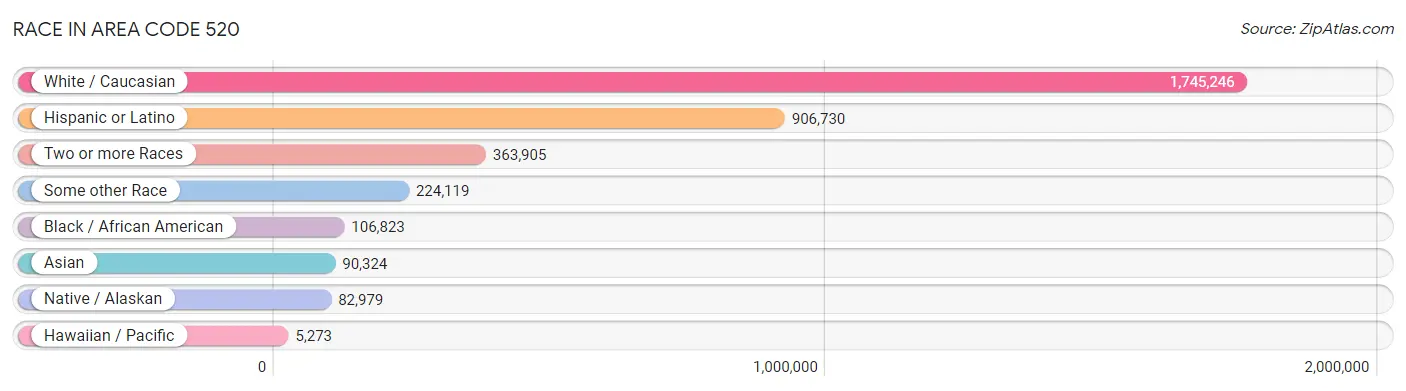
| Race | # Population | % Population |
| Asian | 90,324 | 3.5% |
| Black / African American | 106,823 | 4.1% |
| Hawaiian / Pacific | 5,273 | 0.2% |
| Hispanic or Latino | 906,730 | 34.6% |
| Native / Alaskan | 82,979 | 3.2% |
| White / Caucasian | 1,745,246 | 66.6% |
| Two or more Races | 363,905 | 13.9% |
| Some other Race | 224,119 | 8.6% |
| Total | 2,618,669 | 100.0% |
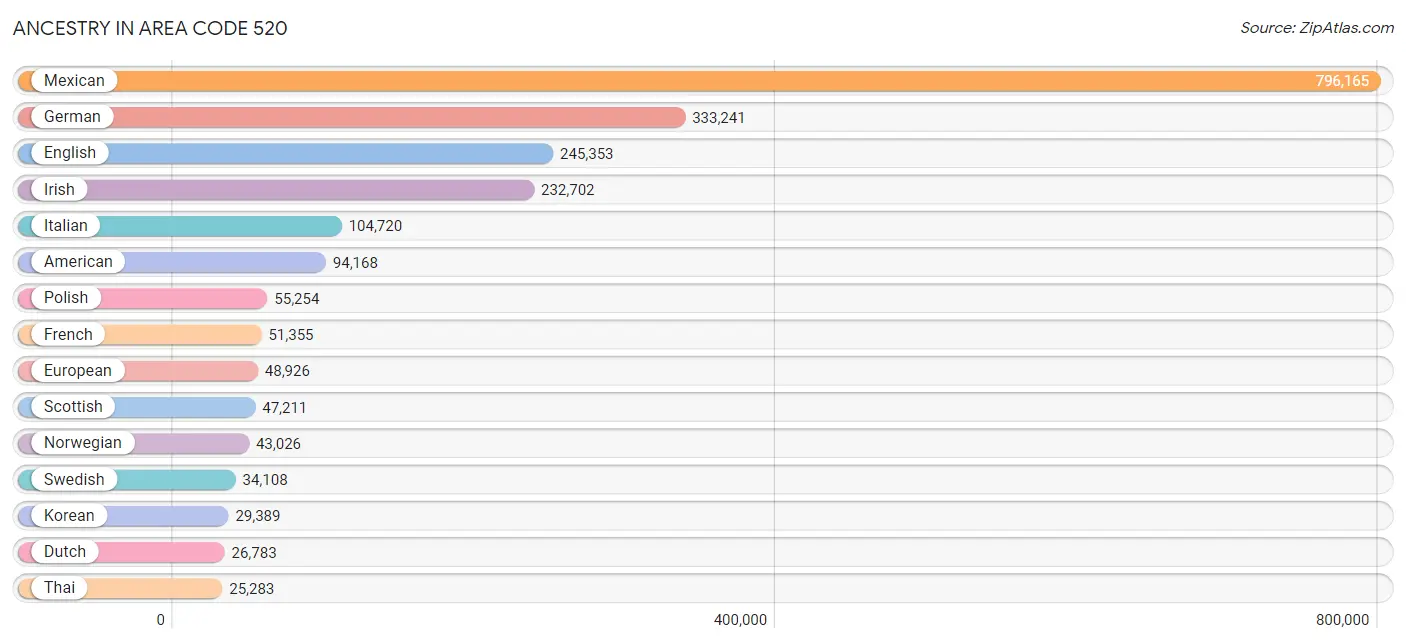
Ancestry in Area Code 520
The most populous ancestries reported in Area Code 520 are Mexican (796,165 | 30.4%), German (333,241 | 12.7%), English (245,353 | 9.4%), Irish (232,702 | 8.9%), and Italian (104,720 | 4.0%), together accounting for 65.4% of all Area Code 520 residents.
| Ancestry | # Population | % Population |
| Afghan | 597 | 0.0% |
| African | 7,652 | 0.3% |
| Alaska Native | 31 | 0.0% |
| Alaskan Athabascan | 118 | 0.0% |
| Albanian | 314 | 0.0% |
| Aleut | 239 | 0.0% |
| Alsatian | 81 | 0.0% |
| American | 94,168 | 3.6% |
| Apache | 5,524 | 0.2% |
| Arab | 13,196 | 0.5% |
| Argentinean | 974 | 0.0% |
| Armenian | 1,801 | 0.1% |
| Assyrian / Chaldean / Syriac | 944 | 0.0% |
| Australian | 634 | 0.0% |
| Austrian | 4,801 | 0.2% |
| Bahamian | 59 | 0.0% |
| Bangladeshi | 150 | 0.0% |
| Barbadian | 73 | 0.0% |
| Basque | 1,030 | 0.0% |
| Belgian | 2,532 | 0.1% |
| Belizean | 367 | 0.0% |
| Bermudan | 11 | 0.0% |
| Bhutanese | 12,346 | 0.5% |
| Blackfeet | 1,289 | 0.1% |
| Bolivian | 340 | 0.0% |
| Brazilian | 1,758 | 0.1% |
| British | 18,451 | 0.7% |
| British West Indian | 124 | 0.0% |
| Bulgarian | 514 | 0.0% |
| Burmese | 12,061 | 0.5% |
| Cajun | 185 | 0.0% |
| Cambodian | 266 | 0.0% |
| Canadian | 7,143 | 0.3% |
| Cape Verdean | 93 | 0.0% |
| Carpatho Rusyn | 83 | 0.0% |
| Celtic | 837 | 0.0% |
| Central American | 17,444 | 0.7% |
| Central American Indian | 2,810 | 0.1% |
| Cherokee | 8,624 | 0.3% |
| Cheyenne | 125 | 0.0% |
| Chickasaw | 733 | 0.0% |
| Chilean | 1,025 | 0.0% |
| Chinese | 197 | 0.0% |
| Chippewa | 1,002 | 0.0% |
| Choctaw | 2,425 | 0.1% |
| Colombian | 4,524 | 0.2% |
| Colville | 45 | 0.0% |
| Comanche | 322 | 0.0% |
| Costa Rican | 989 | 0.0% |
| Cree | 154 | 0.0% |
| Creek | 460 | 0.0% |
| Croatian | 3,552 | 0.1% |
| Crow | 64 | 0.0% |
| Cuban | 5,194 | 0.2% |
| Cypriot | 88 | 0.0% |
| Czech | 9,593 | 0.4% |
| Czechoslovakian | 2,507 | 0.1% |
| Danish | 12,842 | 0.5% |
| Delaware | 120 | 0.0% |
| Dominican | 2,260 | 0.1% |
| Dutch | 26,783 | 1.0% |
| Dutch West Indian | 72 | 0.0% |
| Eastern European | 7,903 | 0.3% |
| Ecuadorian | 2,019 | 0.1% |
| Egyptian | 1,830 | 0.1% |
| English | 245,353 | 9.4% |
| Estonian | 189 | 0.0% |
| Ethiopian | 1,604 | 0.1% |
| European | 48,926 | 1.9% |
| Fijian | 380 | 0.0% |
| Filipino | 1,442 | 0.1% |
| Finnish | 5,972 | 0.2% |
| French | 51,355 | 2.0% |
| French American Indian | 520 | 0.0% |
| French Canadian | 11,172 | 0.4% |
| German | 333,241 | 12.7% |
| German Russian | 119 | 0.0% |
| Ghanaian | 248 | 0.0% |
| Greek | 8,411 | 0.3% |
| Guamanian / Chamorro | 1,877 | 0.1% |
| Guatemalan | 4,927 | 0.2% |
| Guyanese | 245 | 0.0% |
| Haitian | 1,231 | 0.1% |
| Honduran | 1,759 | 0.1% |
| Hopi | 2,103 | 0.1% |
| Houma | 192 | 0.0% |
| Hungarian | 9,994 | 0.4% |
| Icelander | 355 | 0.0% |
| Indian (Asian) | 24,483 | 0.9% |
| Indonesian | 224 | 0.0% |
| Inupiat | 301 | 0.0% |
| Iranian | 3,530 | 0.1% |
| Iraqi | 1,214 | 0.1% |
| Irish | 232,702 | 8.9% |
| Iroquois | 659 | 0.0% |
| Israeli | 1,038 | 0.0% |
| Italian | 104,720 | 4.0% |
| Jamaican | 1,841 | 0.1% |
| Japanese | 1,500 | 0.1% |
| Jordanian | 722 | 0.0% |
| Kenyan | 719 | 0.0% |
| Kiowa | 94 | 0.0% |
| Korean | 29,389 | 1.1% |
| Laotian | 945 | 0.0% |
| Latvian | 638 | 0.0% |
| Lebanese | 4,194 | 0.2% |
| Liberian | 302 | 0.0% |
| Lithuanian | 4,795 | 0.2% |
| Lumbee | 11 | 0.0% |
| Luxembourger | 394 | 0.0% |
| Macedonian | 487 | 0.0% |
| Malaysian | 1,142 | 0.0% |
| Maltese | 112 | 0.0% |
| Menominee | 105 | 0.0% |
| Mexican | 796,165 | 30.4% |
| Mexican American Indian | 5,329 | 0.2% |
| Mongolian | 218 | 0.0% |
| Moroccan | 349 | 0.0% |
| Native Hawaiian | 5,116 | 0.2% |
| Navajo | 22,034 | 0.8% |
| New Zealander | 201 | 0.0% |
| Nicaraguan | 3,008 | 0.1% |
| Nigerian | 2,305 | 0.1% |
| Northern European | 5,803 | 0.2% |
| Norwegian | 43,026 | 1.6% |
| Okinawan | 14 | 0.0% |
| Osage | 115 | 0.0% |
| Ottawa | 133 | 0.0% |
| Paiute | 82 | 0.0% |
| Pakistani | 2,730 | 0.1% |
| Palestinian | 661 | 0.0% |
| Panamanian | 1,483 | 0.1% |
| Paraguayan | 83 | 0.0% |
| Pennsylvania German | 620 | 0.0% |
| Peruvian | 2,966 | 0.1% |
| Pima | 13,695 | 0.5% |
| Polish | 55,254 | 2.1% |
| Portuguese | 6,137 | 0.2% |
| Potawatomi | 286 | 0.0% |
| Pueblo | 1,008 | 0.0% |
| Puerto Rican | 21,998 | 0.8% |
| Puget Sound Salish | 48 | 0.0% |
| Romanian | 3,224 | 0.1% |
| Russian | 15,450 | 0.6% |
| Salvadoran | 5,185 | 0.2% |
| Samoan | 1,459 | 0.1% |
| Scandinavian | 10,679 | 0.4% |
| Scotch-Irish | 21,210 | 0.8% |
| Scottish | 47,211 | 1.8% |
| Seminole | 94 | 0.0% |
| Senegalese | 110 | 0.0% |
| Serbian | 1,727 | 0.1% |
| Shoshone | 298 | 0.0% |
| Sierra Leonean | 151 | 0.0% |
| Sioux | 2,034 | 0.1% |
| Slavic | 1,212 | 0.1% |
| Slovak | 3,303 | 0.1% |
| Slovene | 1,293 | 0.1% |
| Somali | 643 | 0.0% |
| South African | 489 | 0.0% |
| South American | 13,201 | 0.5% |
| South American Indian | 720 | 0.0% |
| Soviet Union | 63 | 0.0% |
| Spaniard | 14,367 | 0.5% |
| Spanish | 11,617 | 0.4% |
| Spanish American | 289 | 0.0% |
| Spanish American Indian | 119 | 0.0% |
| Sri Lankan | 12,029 | 0.5% |
| Subsaharan African | 16,903 | 0.6% |
| Sudanese | 373 | 0.0% |
| Swedish | 34,108 | 1.3% |
| Swiss | 6,557 | 0.3% |
| Syrian | 1,290 | 0.1% |
| Taiwanese | 98 | 0.0% |
| Thai | 25,283 | 1.0% |
| Tlingit-Haida | 330 | 0.0% |
| Tohono O'Odham | 15,138 | 0.6% |
| Tongan | 735 | 0.0% |
| Trinidadian and Tobagonian | 693 | 0.0% |
| Tsimshian | 26 | 0.0% |
| Turkish | 772 | 0.0% |
| U.S. Virgin Islander | 108 | 0.0% |
| Ugandan | 81 | 0.0% |
| Ukrainian | 6,301 | 0.2% |
| Uruguayan | 67 | 0.0% |
| Ute | 79 | 0.0% |
| Venezuelan | 1,113 | 0.0% |
| Vietnamese | 1,901 | 0.1% |
| Welsh | 15,882 | 0.6% |
| West Indian | 700 | 0.0% |
| Yakama | 46 | 0.0% |
| Yaqui | 16,977 | 0.6% |
| Yugoslavian | 2,264 | 0.1% |
| Yuman | 1,782 | 0.1% |
| Yup'ik | 203 | 0.0% |
| Zimbabwean | 157 | 0.0% | View All 196 Rows |
Immigrants in Area Code 520
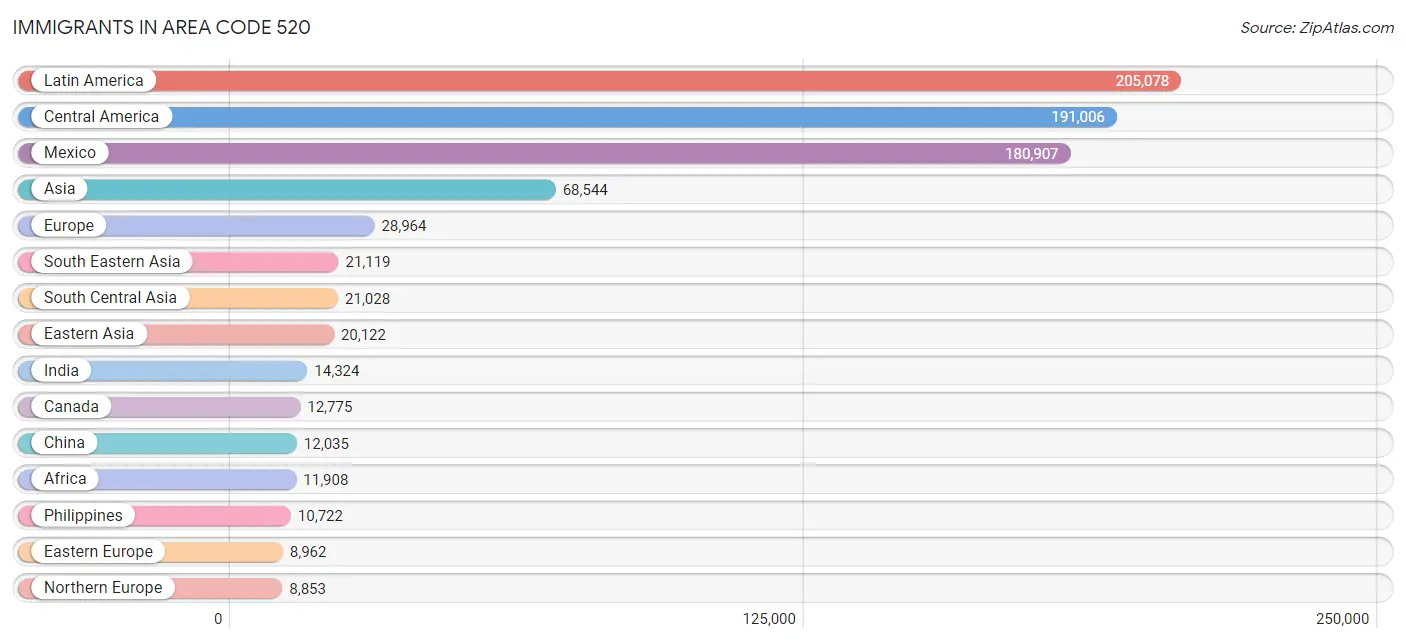
The most numerous immigrant groups reported in Area Code 520 came from Latin America (205,078 | 7.8%), Central America (191,006 | 7.3%), Mexico (180,907 | 6.9%), Asia (68,544 | 2.6%), and Europe (28,964 | 1.1%), together accounting for 25.8% of all Area Code 520 residents.
| Immigration Origin | # Population | % Population |
| Afghanistan | 306 | 0.0% |
| Africa | 11,908 | 0.4% |
| Albania | 147 | 0.0% |
| Argentina | 661 | 0.0% |
| Armenia | 140 | 0.0% |
| Asia | 68,544 | 2.6% |
| Australia | 727 | 0.0% |
| Austria | 320 | 0.0% |
| Azores | 8 | 0.0% |
| Bahamas | 90 | 0.0% |
| Bangladesh | 1,374 | 0.1% |
| Barbados | 201 | 0.0% |
| Belarus | 73 | 0.0% |
| Belgium | 282 | 0.0% |
| Belize | 124 | 0.0% |
| Bolivia | 202 | 0.0% |
| Bosnia and Herzegovina | 520 | 0.0% |
| Brazil | 1,062 | 0.0% |
| Bulgaria | 308 | 0.0% |
| Cabo Verde | 9 | 0.0% |
| Cambodia | 626 | 0.0% |
| Cameroon | 282 | 0.0% |
| Canada | 12,775 | 0.5% |
| Caribbean | 5,270 | 0.2% |
| Central America | 191,006 | 7.3% |
| Chile | 585 | 0.0% |
| China | 12,035 | 0.5% |
| Colombia | 2,635 | 0.1% |
| Congo | 485 | 0.0% |
| Costa Rica | 718 | 0.0% |
| Croatia | 295 | 0.0% |
| Cuba | 2,098 | 0.1% |
| Czechoslovakia | 742 | 0.0% |
| Denmark | 267 | 0.0% |
| Dominica | 54 | 0.0% |
| Dominican Republic | 789 | 0.0% |
| Eastern Africa | 5,273 | 0.2% |
| Eastern Asia | 20,122 | 0.8% |
| Eastern Europe | 8,962 | 0.3% |
| Ecuador | 812 | 0.0% |
| Egypt | 944 | 0.0% |
| El Salvador | 2,909 | 0.1% |
| England | 3,935 | 0.2% |
| Eritrea | 277 | 0.0% |
| Ethiopia | 1,075 | 0.0% |
| Europe | 28,964 | 1.1% |
| Fiji | 243 | 0.0% |
| France | 1,060 | 0.0% |
| Germany | 5,783 | 0.2% |
| Ghana | 218 | 0.0% |
| Greece | 442 | 0.0% |
| Grenada | 27 | 0.0% |
| Guatemala | 2,953 | 0.1% |
| Guyana | 222 | 0.0% |
| Haiti | 512 | 0.0% |
| Honduras | 948 | 0.0% |
| Hong Kong | 886 | 0.0% |
| Hungary | 453 | 0.0% |
| India | 14,324 | 0.5% |
| Indonesia | 516 | 0.0% |
| Iran | 2,407 | 0.1% |
| Iraq | 1,214 | 0.1% |
| Ireland | 610 | 0.0% |
| Israel | 497 | 0.0% |
| Italy | 886 | 0.0% |
| Jamaica | 871 | 0.0% |
| Japan | 2,628 | 0.1% |
| Jordan | 571 | 0.0% |
| Kazakhstan | 97 | 0.0% |
| Kenya | 1,757 | 0.1% |
| Korea | 5,374 | 0.2% |
| Kuwait | 417 | 0.0% |
| Laos | 469 | 0.0% |
| Latin America | 205,078 | 7.8% |
| Latvia | 87 | 0.0% |
| Lebanon | 797 | 0.0% |
| Liberia | 221 | 0.0% |
| Lithuania | 350 | 0.0% |
| Malaysia | 625 | 0.0% |
| Mexico | 180,907 | 6.9% |
| Micronesia | 76 | 0.0% |
| Middle Africa | 1,189 | 0.1% |
| Moldova | 94 | 0.0% |
| Morocco | 305 | 0.0% |
| Nepal | 814 | 0.0% |
| Netherlands | 844 | 0.0% |
| Nicaragua | 2,092 | 0.1% |
| Nigeria | 1,267 | 0.1% |
| North Macedonia | 88 | 0.0% |
| Northern Africa | 1,686 | 0.1% |
| Northern Europe | 8,853 | 0.3% |
| Norway | 65 | 0.0% |
| Oceania | 2,009 | 0.1% |
| Pakistan | 987 | 0.0% |
| Panama | 343 | 0.0% |
| Peru | 1,733 | 0.1% |
| Philippines | 10,722 | 0.4% |
| Poland | 1,549 | 0.1% |
| Portugal | 160 | 0.0% |
| Romania | 1,055 | 0.0% |
| Russia | 1,271 | 0.1% |
| Saudi Arabia | 403 | 0.0% |
| Scotland | 484 | 0.0% |
| Senegal | 149 | 0.0% |
| Serbia | 250 | 0.0% |
| Sierra Leone | 149 | 0.0% |
| Singapore | 281 | 0.0% |
| Somalia | 585 | 0.0% |
| South Africa | 765 | 0.0% |
| South America | 8,802 | 0.3% |
| South Central Asia | 21,028 | 0.8% |
| South Eastern Asia | 21,119 | 0.8% |
| Southern Europe | 2,351 | 0.1% |
| Spain | 845 | 0.0% |
| Sri Lanka | 273 | 0.0% |
| Sudan | 249 | 0.0% |
| Sweden | 399 | 0.0% |
| Switzerland | 445 | 0.0% |
| Syria | 997 | 0.0% |
| Taiwan | 2,557 | 0.1% |
| Thailand | 1,465 | 0.1% |
| Trinidad and Tobago | 488 | 0.0% |
| Turkey | 454 | 0.0% |
| Uganda | 109 | 0.0% |
| Ukraine | 888 | 0.0% |
| Uruguay | 56 | 0.0% |
| Uzbekistan | 204 | 0.0% |
| Venezuela | 733 | 0.0% |
| Vietnam | 6,263 | 0.2% |
| West Indies | 69 | 0.0% |
| Western Africa | 2,487 | 0.1% |
| Western Asia | 5,870 | 0.2% |
| Western Europe | 8,785 | 0.3% |
| Yemen | 125 | 0.0% |
| Zaire | 335 | 0.0% |
| Zimbabwe | 273 | 0.0% | View All 136 Rows |
Sex and Age in Area Code 520
Sex and Age in Area Code 520
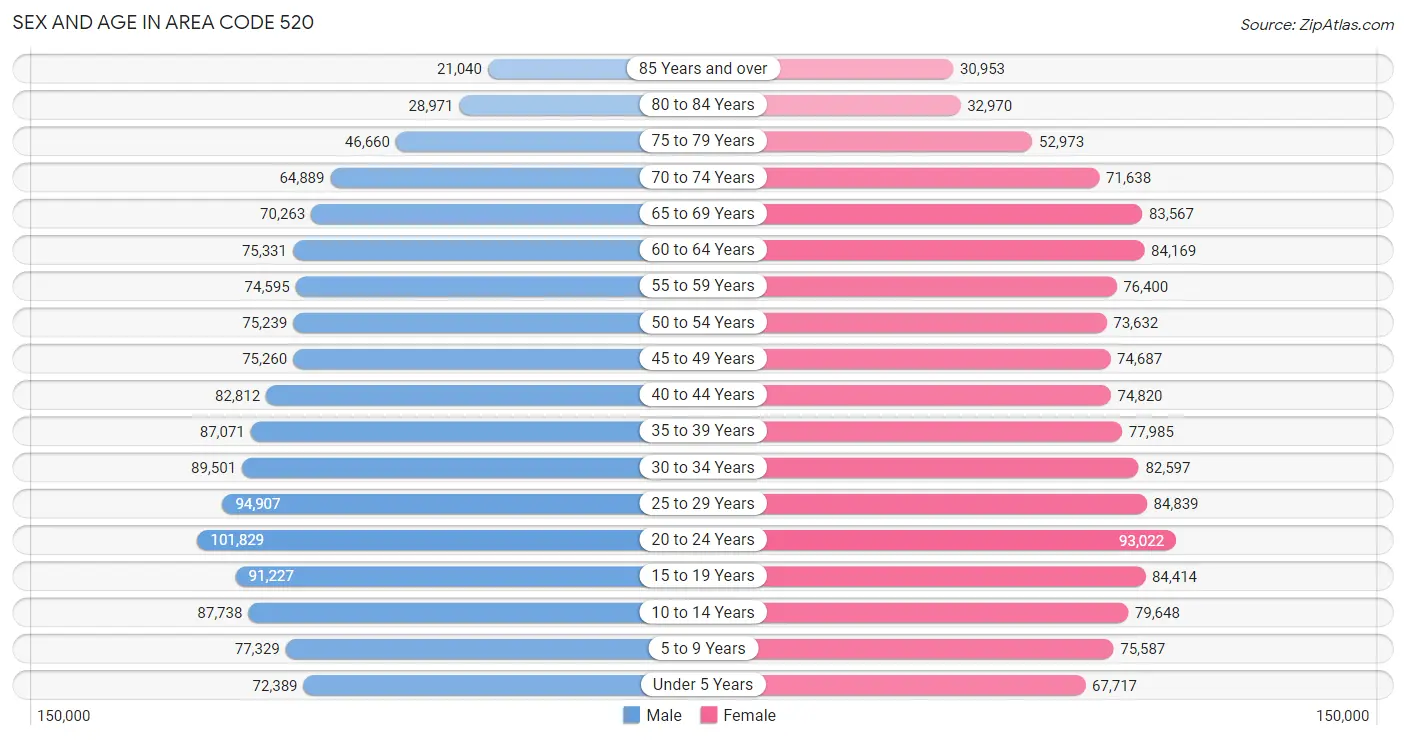
The most populous age groups in Area Code 520 are 20 to 24 Years (101,829 | 7.7%) for men and 20 to 24 Years (93,022 | 7.1%) for women.
| Age Bracket | Male | Female |
| Under 5 Years | 72,389 (5.5%) | 67,717 (5.2%) |
| 5 to 9 Years | 77,329 (5.9%) | 75,587 (5.8%) |
| 10 to 14 Years | 87,738 (6.7%) | 79,648 (6.1%) |
| 15 to 19 Years | 91,227 (6.9%) | 84,414 (6.5%) |
| 20 to 24 Years | 101,829 (7.7%) | 93,022 (7.1%) |
| 25 to 29 Years | 94,907 (7.2%) | 84,839 (6.5%) |
| 30 to 34 Years | 89,501 (6.8%) | 82,597 (6.4%) |
| 35 to 39 Years | 87,071 (6.6%) | 77,985 (6.0%) |
| 40 to 44 Years | 82,812 (6.3%) | 74,820 (5.8%) |
| 45 to 49 Years | 75,260 (5.7%) | 74,687 (5.7%) |
| 50 to 54 Years | 75,239 (5.7%) | 73,632 (5.7%) |
| 55 to 59 Years | 74,595 (5.7%) | 76,400 (5.9%) |
| 60 to 64 Years | 75,331 (5.7%) | 84,169 (6.5%) |
| 65 to 69 Years | 70,263 (5.3%) | 83,567 (6.4%) |
| 70 to 74 Years | 64,889 (4.9%) | 71,638 (5.5%) |
| 75 to 79 Years | 46,660 (3.5%) | 52,973 (4.1%) |
| 80 to 84 Years | 28,971 (2.2%) | 32,970 (2.5%) |
| 85 Years and over | 21,040 (1.6%) | 30,953 (2.4%) |
| Total | 1,317,051 (100.0%) | 1,301,618 (100.0%) |
Families and Households in Area Code 520
Median Family Size in Area Code 520
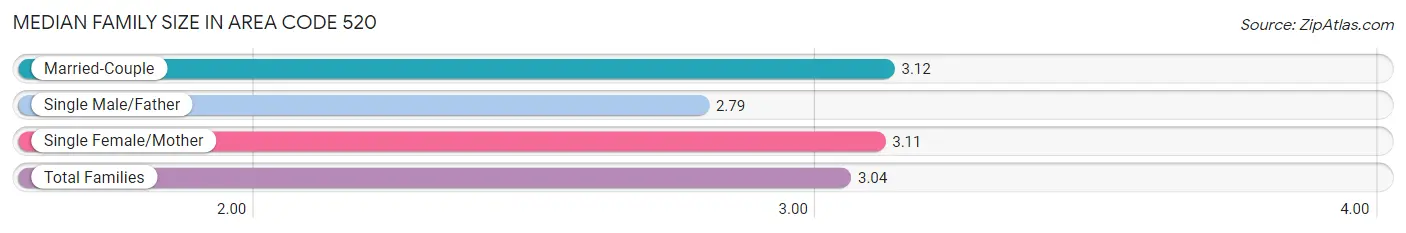
The median family size in Area Code 520 is 3.04 persons per family, with married-couple families (480,197 | 73.7%) accounting for the largest median family size of 3.12193 persons per family. On the other hand, single male/father families (54,747 | 8.4%) represent the smallest median family size with 2.79 persons per family.
| Family Type | # Families | Family Size |
| Married-Couple | 480,197 (73.7%) | 3.12 |
| Single Male/Father | 54,747 (8.4%) | 2.79 |
| Single Female/Mother | 117,045 (17.9%) | 3.11 |
| Total Families | 651,989 (100.0%) | 3.04 |
Median Household Size in Area Code 520
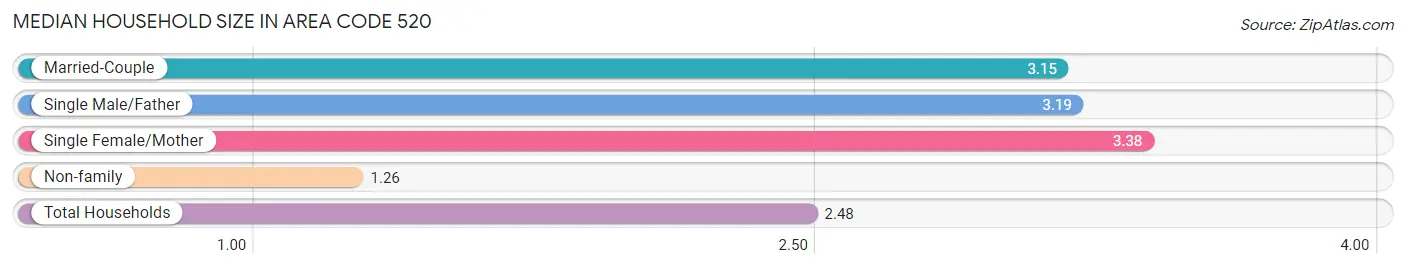
The median household size in Area Code 520 is 2.48 persons per household, with single female/mother households (117,045 | 11.5%) accounting for the largest median household size of 3.37731 persons per household. non-family households (366,639 | 36.0%) represent the smallest median household size with 1.26 persons per household.
| Household Type | # Households | Household Size |
| Married-Couple | 480,197 (47.1%) | 3.15 |
| Single Male/Father | 54,747 (5.4%) | 3.19 |
| Single Female/Mother | 117,045 (11.5%) | 3.38 |
| Non-family | 366,639 (36.0%) | 1.26 |
| Total Households | 1,018,628 (100.0%) | 2.48 |
Household Size by Marriage Status in Area Code 520
Out of a total of 1,018,628 households in Area Code 520, 651,989 (64.0%) are family households, while 366,639 (36.0%) are nonfamily households. The most numerous type of family households are 2-person households, comprising 299,416, and the most common type of nonfamily households are 1-person households, comprising 285,661.
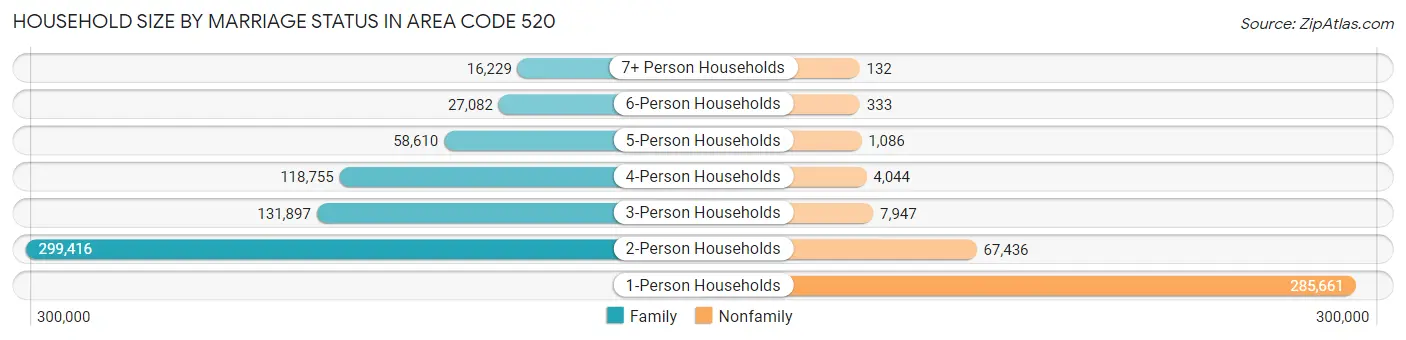
| Household Size | Family Households | Nonfamily Households |
| 1-Person Households | - | 285,661 (28.0%) |
| 2-Person Households | 299,416 (29.4%) | 67,436 (6.6%) |
| 3-Person Households | 131,897 (13.0%) | 7,947 (0.8%) |
| 4-Person Households | 118,755 (11.7%) | 4,044 (0.4%) |
| 5-Person Households | 58,610 (5.8%) | 1,086 (0.1%) |
| 6-Person Households | 27,082 (2.7%) | 333 (0.0%) |
| 7+ Person Households | 16,229 (1.6%) | 132 (0.0%) |
| Total | 651,989 (64.0%) | 366,639 (36.0%) |
Female Fertility in Area Code 520
Fertility by Age in Area Code 520
Average fertility rate in Area Code 520 is 56.6 births per 1,000 women. Women in the age bracket of 20 to 34 years have the highest fertility rate with 103.9 births per 1,000 women. Women in the age bracket of 20 to 34 years acount for 72.8% of all women with births.
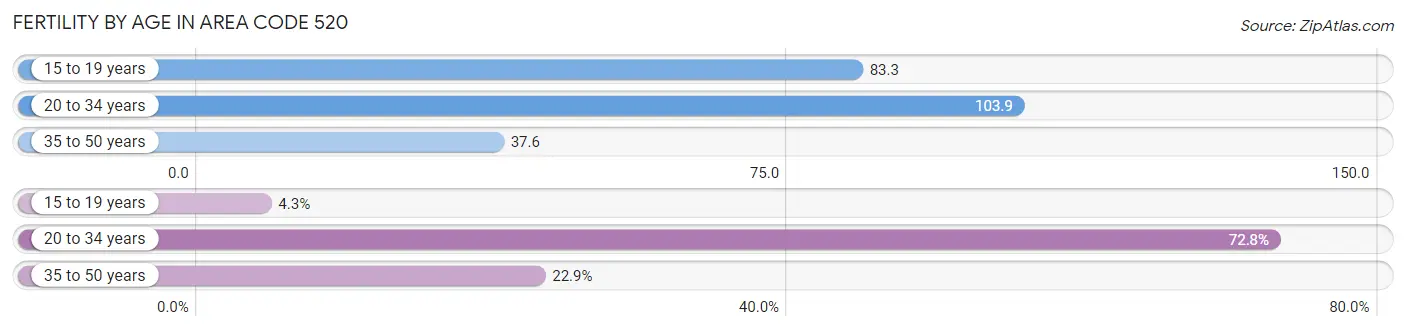
| Age Bracket | Women with Births | Births / 1,000 Women |
| 15 to 19 years | 1,347 (4.3%) | 83.3 |
| 20 to 34 years | 22,835 (72.8%) | 103.9 |
| 35 to 50 years | 7,180 (22.9%) | 37.6 |
| Total | 31,362 (100.0%) | 56.6 |
Fertility by Age by Marriage Status in Area Code 520
59.0% of women with births (31,362) in Area Code 520 are married. The highest percentage of unmarried women with births falls into 15 to 19 years age bracket with 99.3% of them unmarried at the time of birth, while the lowest percentage of unmarried women with births belong to 35 to 50 years age bracket with 38.9% of them unmarried.
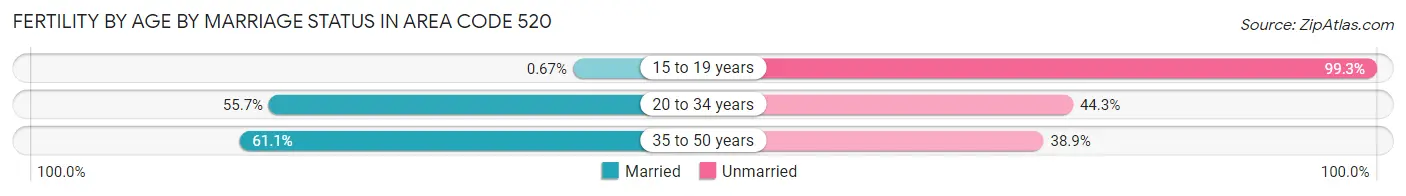
| Age Bracket | Married | Unmarried |
| 15 to 19 years | 9 (0.7%) | 1,338 (99.3%) |
| 20 to 34 years | 12,727 (55.7%) | 10,108 (44.3%) |
| 35 to 50 years | 4,385 (61.1%) | 2,795 (38.9%) |
| Total | 18,516 (59.0%) | 12,846 (41.0%) |
Fertility by Education in Area Code 520
Average fertility rate in Area Code 520 is 56.6 births per 1,000 women. Women with the education attainment of graduate degree have the highest fertility rate of 80.6 births per 1,000 women, while women with the education attainment of college or associate's degree have the lowest fertility at 58.4 births per 1,000 women. Women with the education attainment of college or associate's degree represent 31.5% of all women with births.
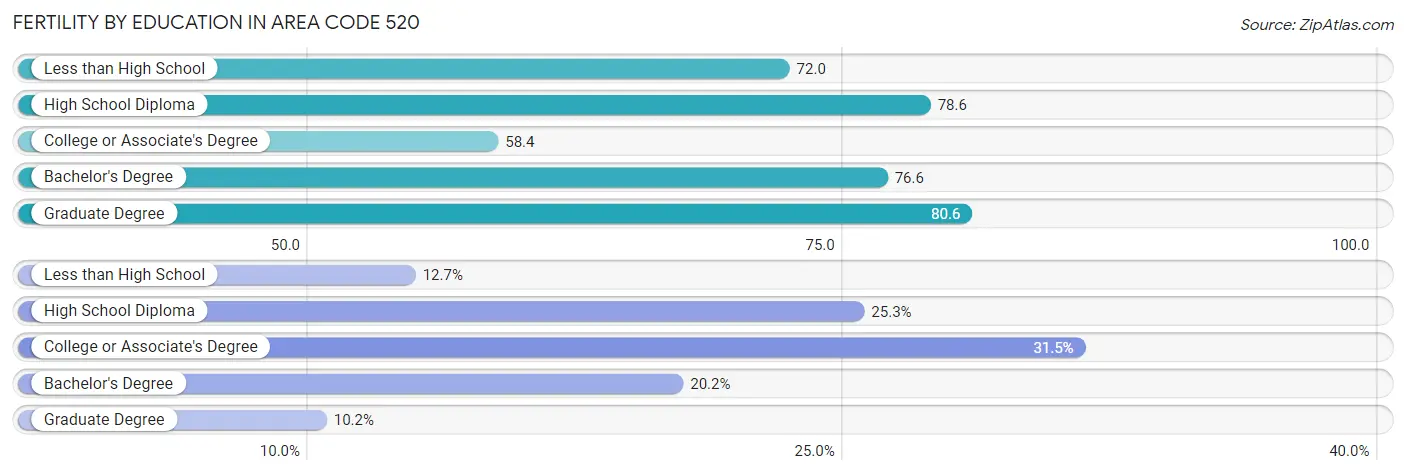
| Educational Attainment | Women with Births | Births / 1,000 Women |
| Less than High School | 3,985 (12.7%) | 72.0 |
| High School Diploma | 7,942 (25.3%) | 78.6 |
| College or Associate's Degree | 9,888 (31.5%) | 58.4 |
| Bachelor's Degree | 6,346 (20.2%) | 76.6 |
| Graduate Degree | 3,201 (10.2%) | 80.6 |
| Total | 31,362 (100.0%) | 56.6 |
Fertility by Education by Marriage Status in Area Code 520
41.0% of women with births in Area Code 520 are unmarried. Women with the educational attainment of bachelor's degree are most likely to be married with 60.8% of them married at childbirth, while women with the educational attainment of less than high school are least likely to be married with 78.8% of them unmarried at childbirth.
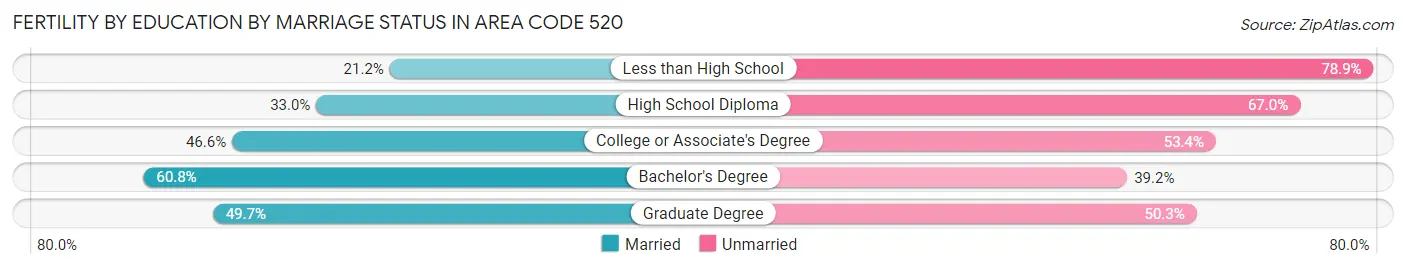
| Educational Attainment | Married | Unmarried |
| Less than High School | 843 (21.1%) | 3,142 (78.8%) |
| High School Diploma | 2,620 (33.0%) | 5,322 (67.0%) |
| College or Associate's Degree | 4,605 (46.6%) | 5,283 (53.4%) |
| Bachelor's Degree | 3,861 (60.8%) | 2,485 (39.2%) |
| Graduate Degree | 1,590 (49.7%) | 1,611 (50.3%) |
| Total | 18,516 (59.0%) | 12,846 (41.0%) |
Employment Characteristics in Area Code 520
Employment by Class of Employer in Area Code 520
Among the 1,165,136 employed individuals in Area Code 520, private company employees (762,386 | 65.4%), not-for-profit organizations (88,863 | 7.6%), and local government employees (82,703 | 7.1%) make up the most common classes of employment.
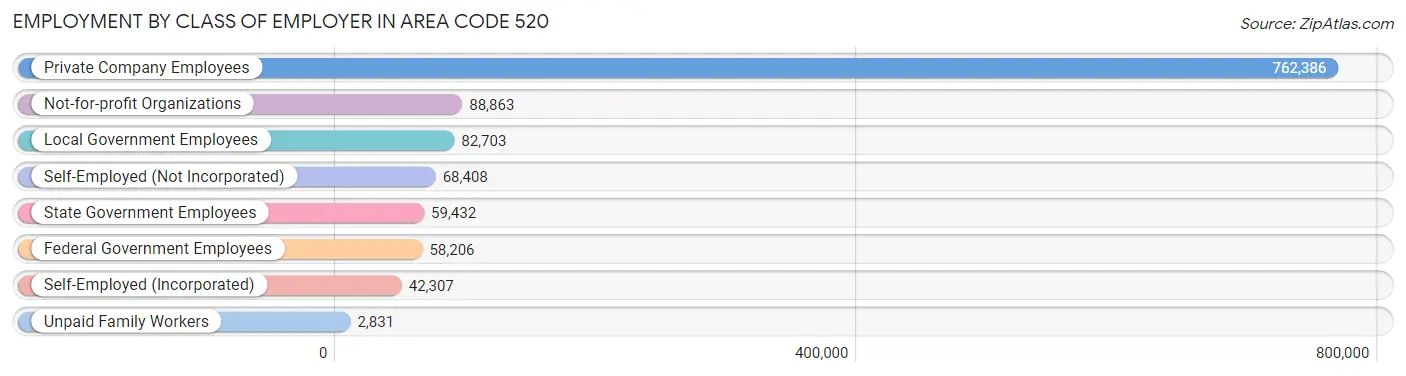
| Employer Class | # Employees | % Employees |
| Private Company Employees | 762,386 | 65.4% |
| Self-Employed (Incorporated) | 42,307 | 3.6% |
| Self-Employed (Not Incorporated) | 68,408 | 5.9% |
| Not-for-profit Organizations | 88,863 | 7.6% |
| Local Government Employees | 82,703 | 7.1% |
| State Government Employees | 59,432 | 5.1% |
| Federal Government Employees | 58,206 | 5.0% |
| Unpaid Family Workers | 2,831 | 0.2% |
| Total | 1,165,136 | 100.0% |
Employment Status by Age in Area Code 520
According to the labor force statistics for Area Code 520, out of the total population over 16 years of age (2,123,762), 53.4% or 1,134,089 individuals are in the labor force, with 7.5% or 84,830 of them unemployed. The age group with the highest labor force participation rate is 25 to 29 years, with 80.0% or 143,869 individuals in the labor force. Within the labor force, the 16 to 19 years age range has the highest percentage of unemployed individuals, with 1,981.9% or 1,136,263 of them being unemployed.
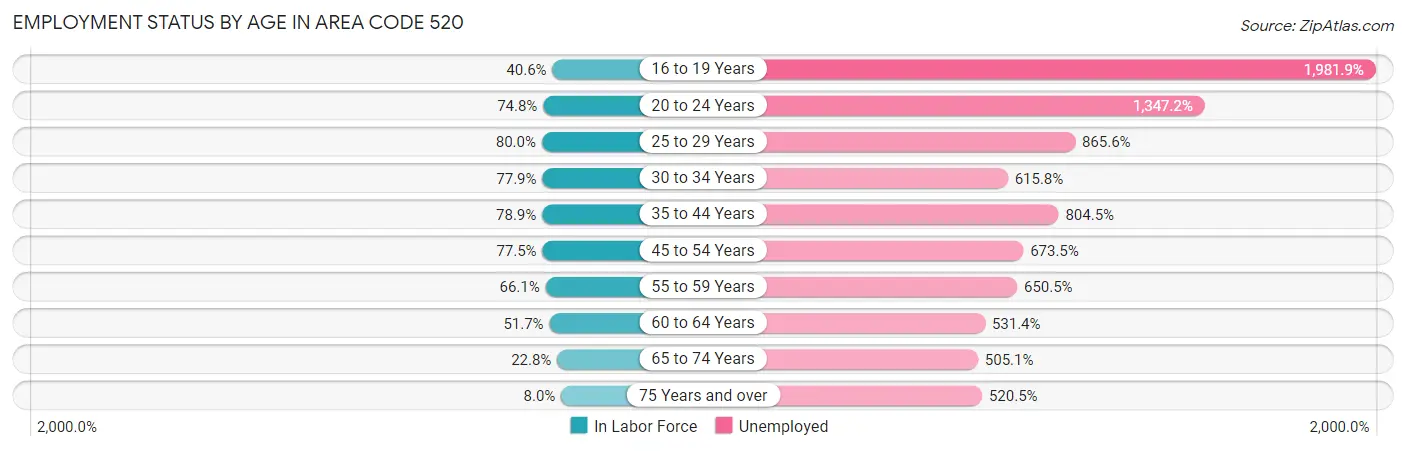
| Age Bracket | In Labor Force | Unemployed |
| 16 to 19 Years | 57,330 (40.6%) | 1,136,263 (1,981.9%) |
| 20 to 24 Years | 145,810 (74.8%) | 1,964,312 (1,347.2%) |
| 25 to 29 Years | 143,860 (80.0%) | 1,245,330 (865.6%) |
| 30 to 34 Years | 134,006 (77.9%) | 825,252 (615.8%) |
| 35 to 44 Years | 254,577 (78.9%) | 2,048,008 (804.5%) |
| 45 to 54 Years | 231,695 (77.5%) | 1,560,520 (673.5%) |
| 55 to 59 Years | 99,757 (66.1%) | 648,952 (650.5%) |
| 60 to 64 Years | 82,446 (51.7%) | 438,118 (531.4%) |
| 65 to 74 Years | 66,283 (22.8%) | 334,826 (505.1%) |
| 75 Years and over | 17,064 (8.0%) | 88,818 (520.5%) |
| Total | 1,134,057 (53.4%) | 84,859 (7.5%) |
Employment Status by Educational Attainment in Area Code 520
According to labor force statistics for Area Code 520, 70.4% of individuals (904,084) out of the total population between 25 and 64 years of age (1,283,845) are in the labor force, with 836.5% or 7,562,663 of them being unemployed. The group with the highest labor force participation rate are those with the educational attainment of bachelor's degree or higher, with 80.0% or 348,077 individuals in the labor force. Within the labor force, individuals with less than high school education have the highest percentage of unemployment, with 1,225.5% or 951,135 of them being unemployed.
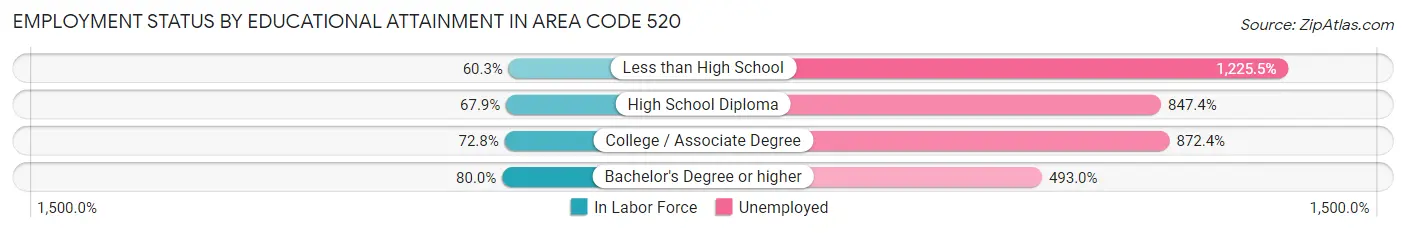
| Educational Attainment | In Labor Force | Unemployed |
| Less than High School | 77,614 (60.3%) | 1,578,640 (1,225.5%) |
| High School Diploma | 197,221 (67.9%) | 2,460,926 (847.4%) |
| College / Associate Degree | 312,425 (72.8%) | 3,745,745 (872.4%) |
| Bachelor's Degree or higher | 348,055 (80.0%) | 2,145,827 (493.0%) |
| Total | 904,095 (70.4%) | 10,739,363 (836.5%) |
Employment Occupations by Sex in Area Code 520
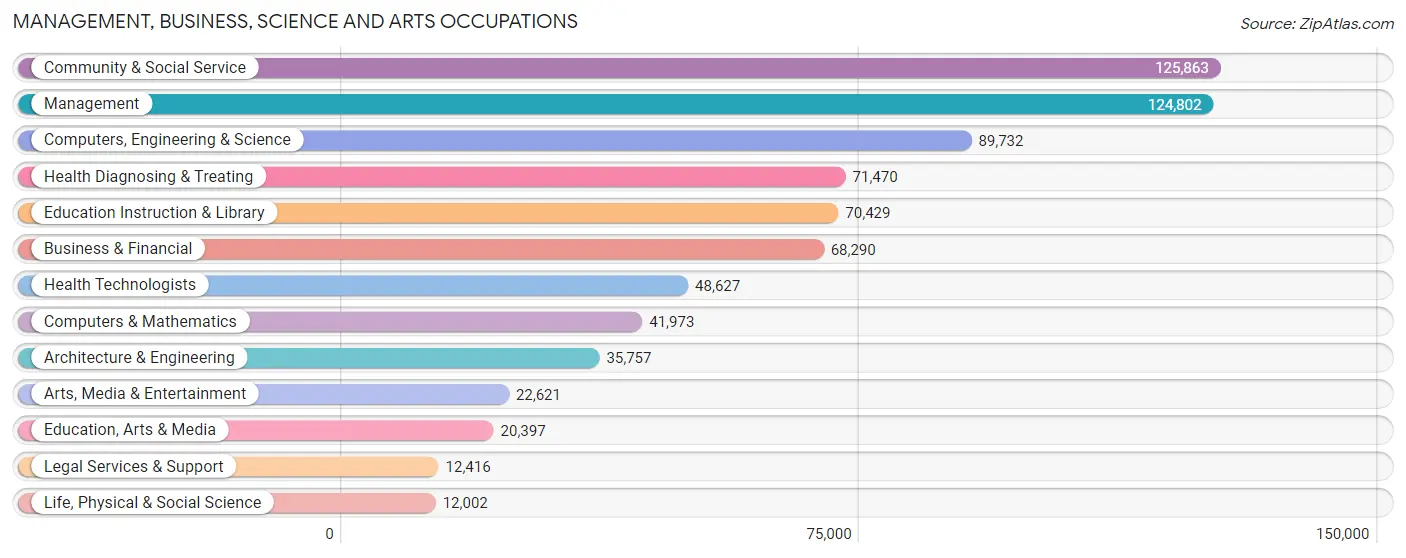
Management, Business, Science and Arts Occupations
The most common Management, Business, Science and Arts occupations in Area Code 520 are Community & Social Service (125,863 | 10.7%), Management (124,802 | 10.6%), Computers, Engineering & Science (89,732 | 7.7%), Health Diagnosing & Treating (71,470 | 6.1%), and Education Instruction & Library (70,429 | 6.0%).
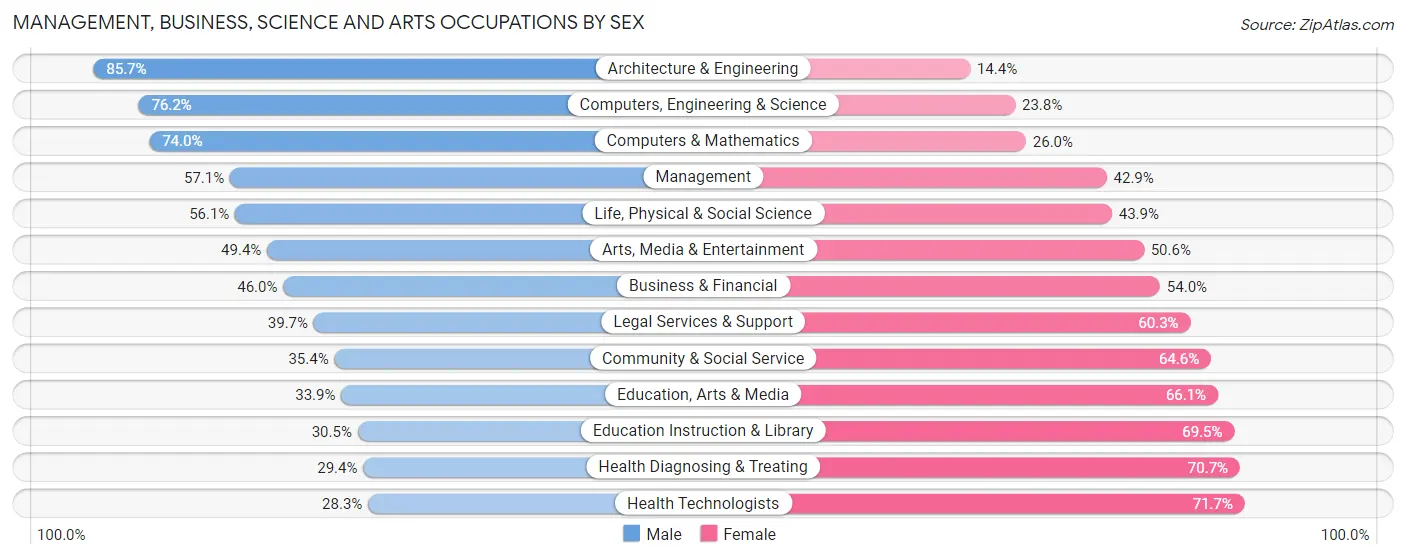
Management, Business, Science and Arts Occupations by Sex
Within the Management, Business, Science and Arts occupations in Area Code 520, the most male-oriented occupations are Architecture & Engineering (85.7%), Computers, Engineering & Science (76.2%), and Computers & Mathematics (74.0%), while the most female-oriented occupations are Health Technologists (71.7%), Health Diagnosing & Treating (70.7%), and Education Instruction & Library (69.5%).
| Occupation | Male | Female |
| Management | 71,311 (57.1%) | 53,491 (42.9%) |
| Business & Financial | 31,437 (46.0%) | 36,853 (54.0%) |
| Computers, Engineering & Science | 68,412 (76.2%) | 21,320 (23.8%) |
| Computers & Mathematics | 31,057 (74.0%) | 10,916 (26.0%) |
| Architecture & Engineering | 30,625 (85.7%) | 5,132 (14.3%) |
| Life, Physical & Social Science | 6,730 (56.1%) | 5,272 (43.9%) |
| Community & Social Service | 44,505 (35.4%) | 81,358 (64.6%) |
| Education, Arts & Media | 6,921 (33.9%) | 13,476 (66.1%) |
| Legal Services & Support | 4,924 (39.7%) | 7,492 (60.3%) |
| Education Instruction & Library | 21,485 (30.5%) | 48,944 (69.5%) |
| Arts, Media & Entertainment | 11,175 (49.4%) | 11,446 (50.6%) |
| Health Diagnosing & Treating | 20,977 (29.3%) | 50,493 (70.7%) |
| Health Technologists | 13,775 (28.3%) | 34,852 (71.7%) |
| Total (Category) | 236,642 (49.3%) | 243,515 (50.7%) |
| Total (Overall) | 627,832 (53.6%) | 544,136 (46.4%) |
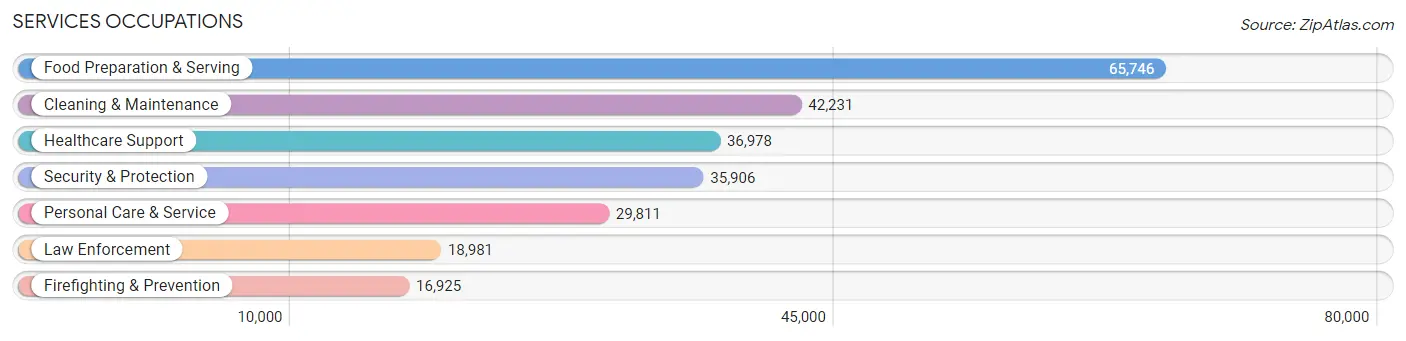
Services Occupations
The most common Services occupations in Area Code 520 are Food Preparation & Serving (65,746 | 5.6%), Cleaning & Maintenance (42,231 | 3.6%), Healthcare Support (36,978 | 3.2%), Security & Protection (35,906 | 3.1%), and Personal Care & Service (29,811 | 2.5%).
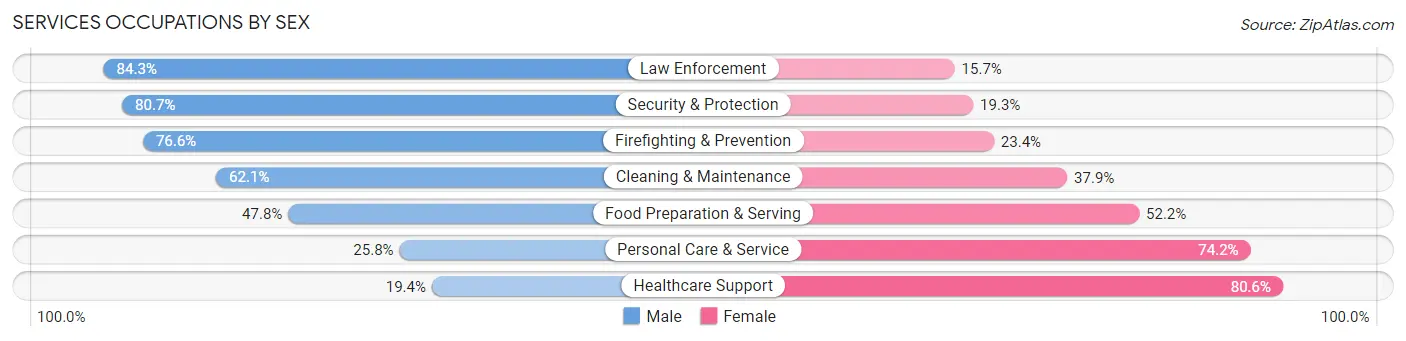
Services Occupations by Sex
Within the Services occupations in Area Code 520, the most male-oriented occupations are Law Enforcement (84.3%), Security & Protection (80.7%), and Firefighting & Prevention (76.6%), while the most female-oriented occupations are Healthcare Support (80.6%), Personal Care & Service (74.2%), and Food Preparation & Serving (52.2%).
| Occupation | Male | Female |
| Healthcare Support | 7,163 (19.4%) | 29,815 (80.6%) |
| Security & Protection | 28,965 (80.7%) | 6,941 (19.3%) |
| Firefighting & Prevention | 12,957 (76.6%) | 3,968 (23.4%) |
| Law Enforcement | 16,008 (84.3%) | 2,973 (15.7%) |
| Food Preparation & Serving | 31,431 (47.8%) | 34,315 (52.2%) |
| Cleaning & Maintenance | 26,208 (62.1%) | 16,023 (37.9%) |
| Personal Care & Service | 7,685 (25.8%) | 22,126 (74.2%) |
| Total (Category) | 101,452 (48.2%) | 109,220 (51.8%) |
| Total (Overall) | 627,832 (53.6%) | 544,136 (46.4%) |
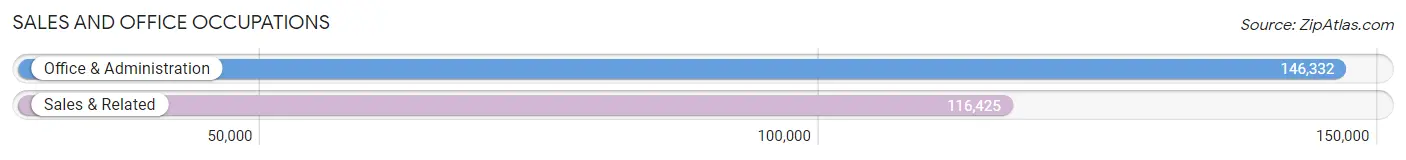
Sales and Office Occupations
The most common Sales and Office occupations in Area Code 520 are Office & Administration (146,332 | 12.5%), and Sales & Related (116,425 | 9.9%).
Sales and Office Occupations by Sex
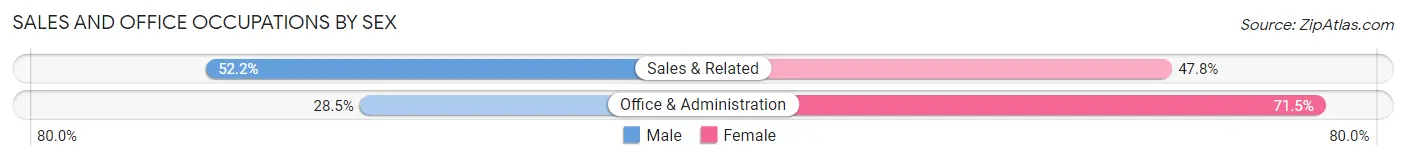
| Occupation | Male | Female |
| Sales & Related | 60,788 (52.2%) | 55,637 (47.8%) |
| Office & Administration | 41,641 (28.5%) | 104,691 (71.5%) |
| Total (Category) | 102,429 (39.0%) | 160,328 (61.0%) |
| Total (Overall) | 627,832 (53.6%) | 544,136 (46.4%) |
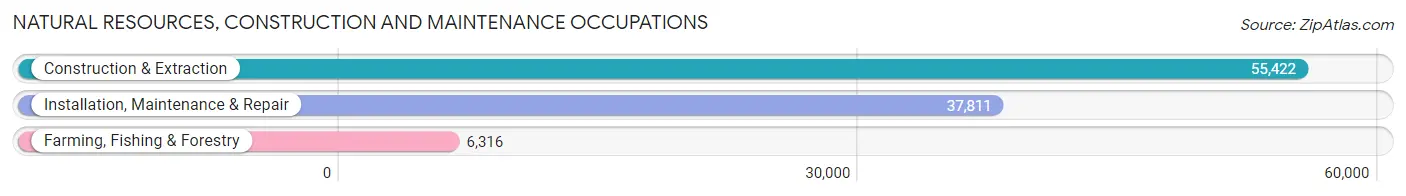
Natural Resources, Construction and Maintenance Occupations
The most common Natural Resources, Construction and Maintenance occupations in Area Code 520 are Construction & Extraction (55,422 | 4.7%), Installation, Maintenance & Repair (37,811 | 3.2%), and Farming, Fishing & Forestry (6,316 | 0.5%).
Natural Resources, Construction and Maintenance Occupations by Sex
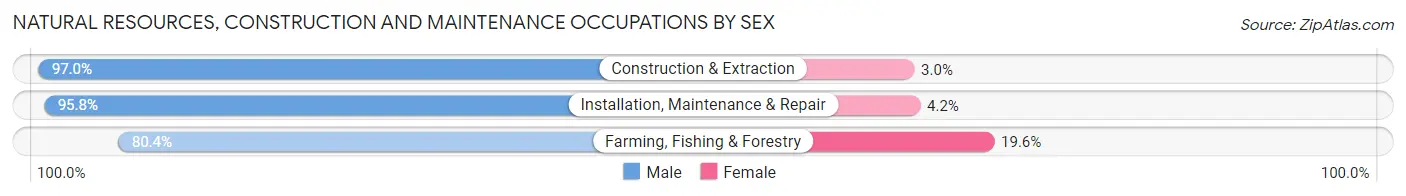
| Occupation | Male | Female |
| Farming, Fishing & Forestry | 5,078 (80.4%) | 1,238 (19.6%) |
| Construction & Extraction | 53,783 (97.0%) | 1,639 (3.0%) |
| Installation, Maintenance & Repair | 36,226 (95.8%) | 1,585 (4.2%) |
| Total (Category) | 95,087 (95.5%) | 4,462 (4.5%) |
| Total (Overall) | 627,832 (53.6%) | 544,136 (46.4%) |
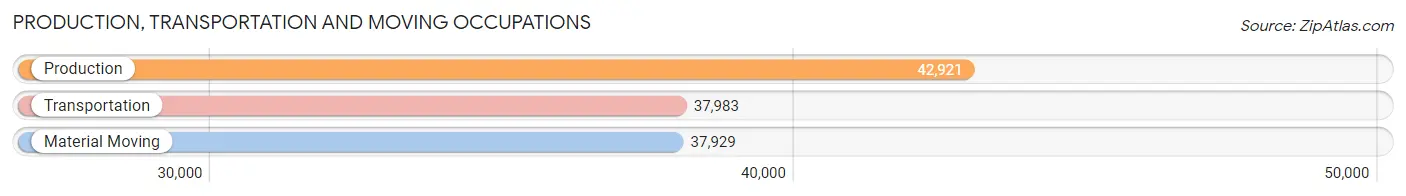
Production, Transportation and Moving Occupations
The most common Production, Transportation and Moving occupations in Area Code 520 are Production (42,921 | 3.7%), Transportation (37,983 | 3.2%), and Material Moving (37,929 | 3.2%).
Production, Transportation and Moving Occupations by Sex
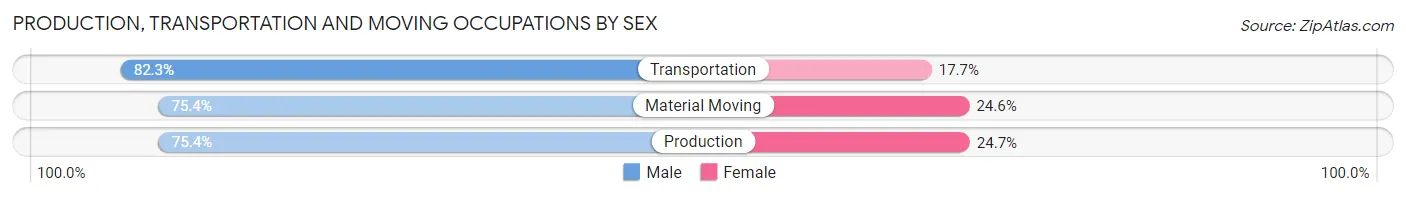
| Occupation | Male | Female |
| Production | 32,342 (75.3%) | 10,579 (24.6%) |
| Transportation | 31,274 (82.3%) | 6,709 (17.7%) |
| Material Moving | 28,606 (75.4%) | 9,323 (24.6%) |
| Total (Category) | 92,222 (77.6%) | 26,611 (22.4%) |
| Total (Overall) | 627,832 (53.6%) | 544,136 (46.4%) |
Employment Industries by Sex in Area Code 520
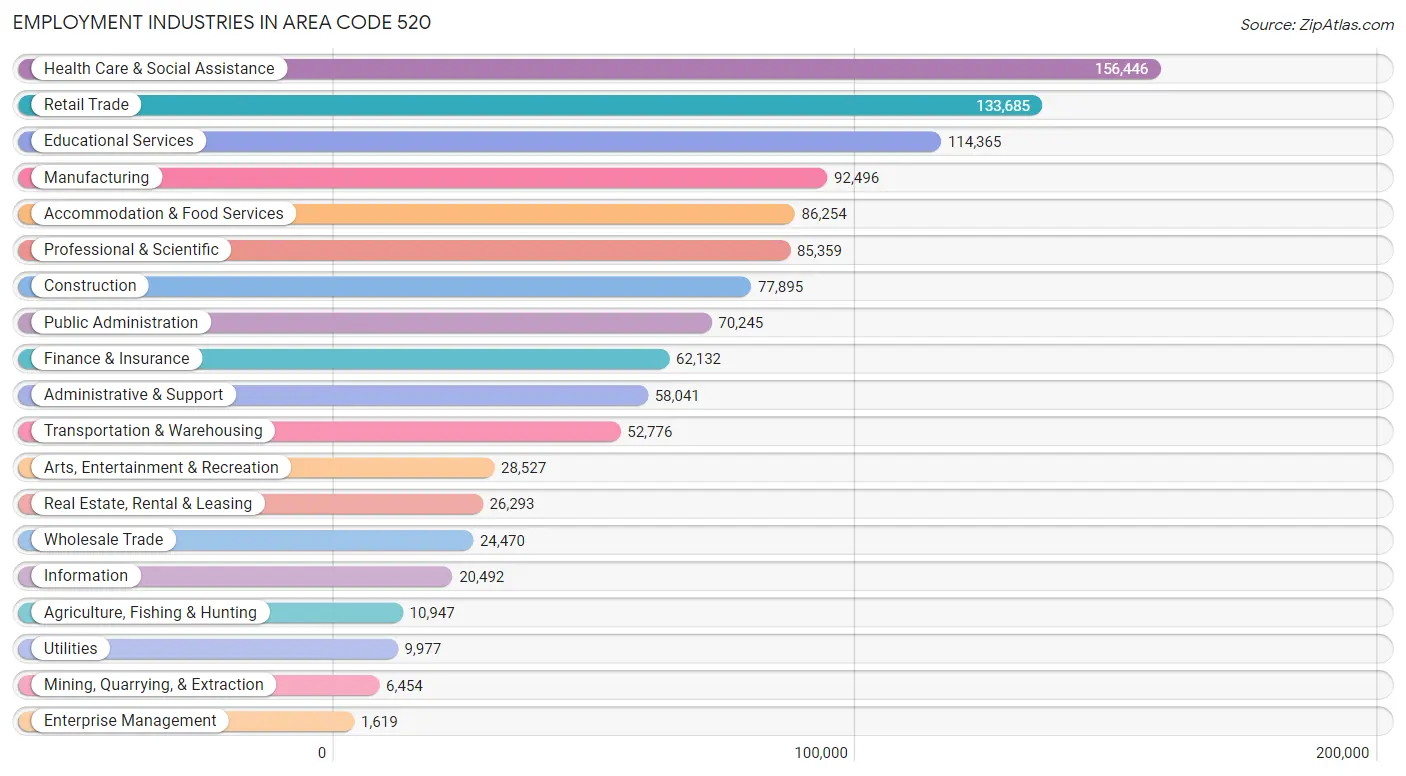
Employment Industries in Area Code 520
The major employment industries in Area Code 520 include Health Care & Social Assistance (156,446 | 13.4%), Retail Trade (133,685 | 11.4%), Educational Services (114,365 | 9.8%), Manufacturing (92,496 | 7.9%), and Accommodation & Food Services (86,254 | 7.4%).
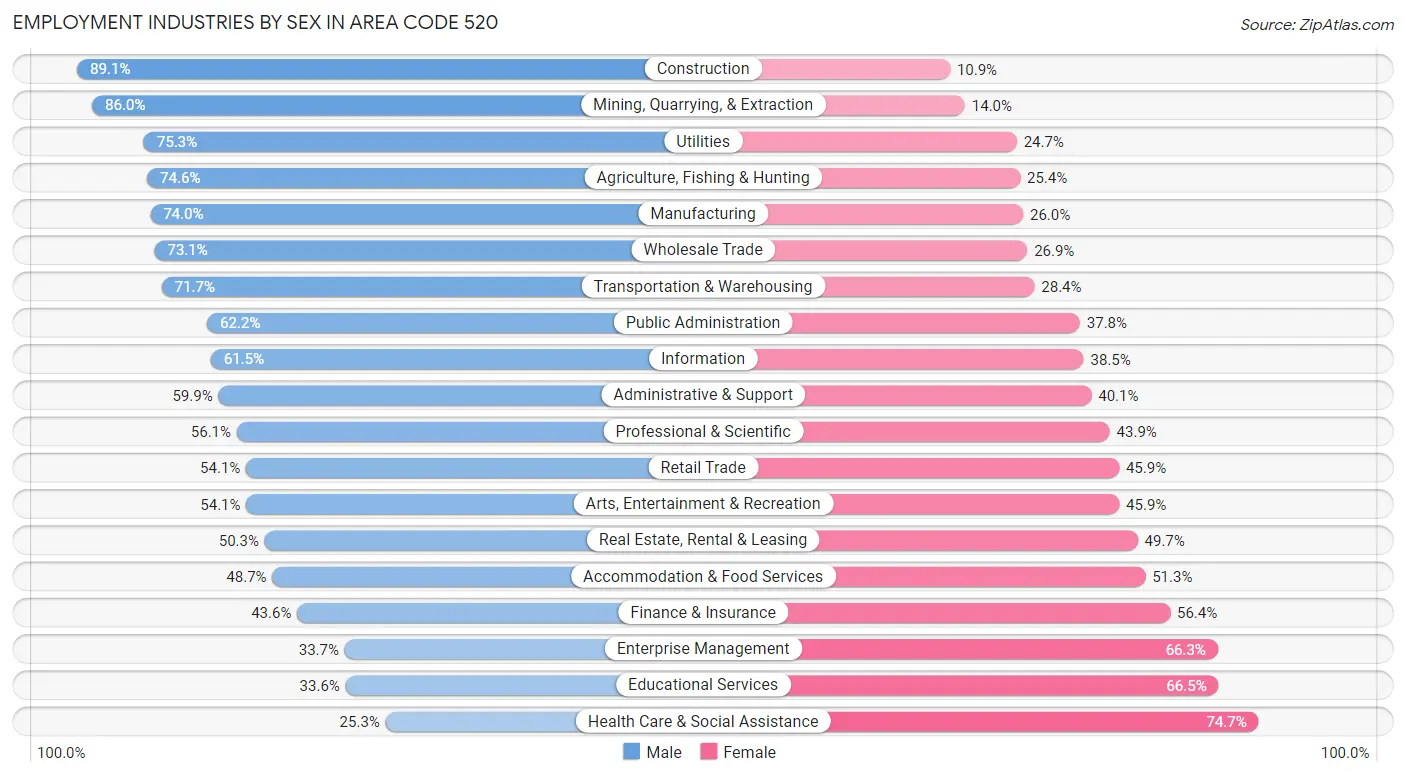
Employment Industries by Sex in Area Code 520
The Area Code 520 industries that see more men than women are Construction (89.1%), Mining, Quarrying, & Extraction (86.0%), and Utilities (75.3%), whereas the industries that tend to have a higher number of women are Health Care & Social Assistance (74.7%), Educational Services (66.4%), and Enterprise Management (66.3%).
| Industry | Male | Female |
| Agriculture, Fishing & Hunting | 8,169 (74.6%) | 2,778 (25.4%) |
| Mining, Quarrying, & Extraction | 5,553 (86.0%) | 901 (14.0%) |
| Construction | 69,426 (89.1%) | 8,469 (10.9%) |
| Manufacturing | 68,435 (74.0%) | 24,061 (26.0%) |
| Wholesale Trade | 17,898 (73.1%) | 6,572 (26.9%) |
| Retail Trade | 72,375 (54.1%) | 61,310 (45.9%) |
| Transportation & Warehousing | 37,814 (71.7%) | 14,962 (28.3%) |
| Utilities | 7,514 (75.3%) | 2,463 (24.7%) |
| Information | 12,594 (61.5%) | 7,898 (38.5%) |
| Finance & Insurance | 27,073 (43.6%) | 35,059 (56.4%) |
| Real Estate, Rental & Leasing | 13,222 (50.3%) | 13,071 (49.7%) |
| Professional & Scientific | 47,862 (56.1%) | 37,497 (43.9%) |
| Enterprise Management | 546 (33.7%) | 1,073 (66.3%) |
| Administrative & Support | 34,747 (59.9%) | 23,294 (40.1%) |
| Educational Services | 38,374 (33.6%) | 75,991 (66.4%) |
| Health Care & Social Assistance | 39,532 (25.3%) | 116,914 (74.7%) |
| Arts, Entertainment & Recreation | 15,433 (54.1%) | 13,094 (45.9%) |
| Accommodation & Food Services | 42,012 (48.7%) | 44,242 (51.3%) |
| Public Administration | 43,720 (62.2%) | 26,525 (37.8%) |
| Total | 627,832 (53.6%) | 544,136 (46.4%) |
Education in Area Code 520
School Enrollment in Area Code 520
The most common levels of schooling among the 633,314 students in Area Code 520 are college / undergraduate (150,472 | 23.8%), high school (135,200 | 21.3%), and middle school (132,930 | 21.0%).
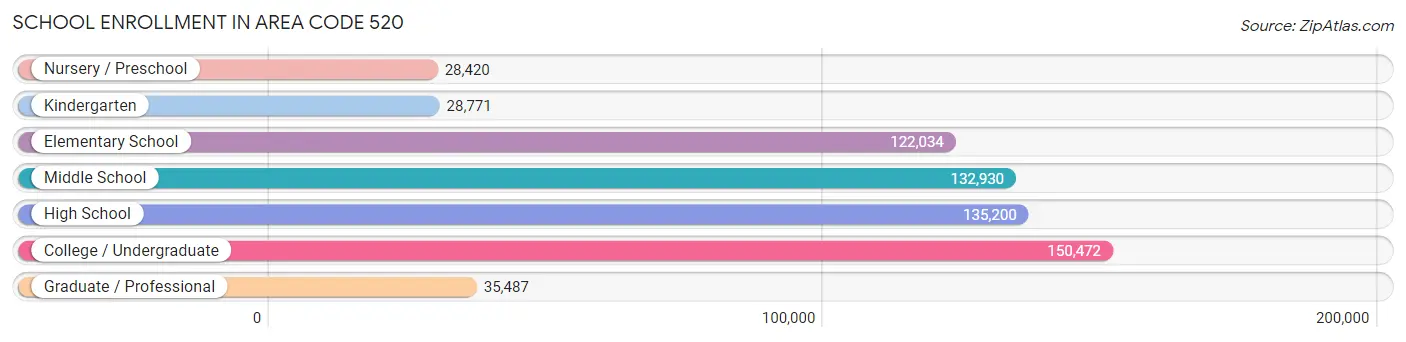
| School Level | # Students | % Students |
| Nursery / Preschool | 28,420 | 4.5% |
| Kindergarten | 28,771 | 4.5% |
| Elementary School | 122,034 | 19.3% |
| Middle School | 132,930 | 21.0% |
| High School | 135,200 | 21.3% |
| College / Undergraduate | 150,472 | 23.8% |
| Graduate / Professional | 35,487 | 5.6% |
| Total | 633,314 | 100.0% |
School Enrollment by Age by Funding Source in Area Code 520
Out of a total of 633,314 students who are enrolled in schools in Area Code 520, 83,162 (13.1%) attend a private institution, while the remaining 550,152 (86.9%) are enrolled in public schools. The age group of 3 to 4 year olds has the highest likelihood of being enrolled in private schools, with 7,907 (34.7% in the age bracket) enrolled. Conversely, the age group of 18 to 19 year olds has the lowest likelihood of being enrolled in a private school, with 51,267 (93.2% in the age bracket) attending a public institution.
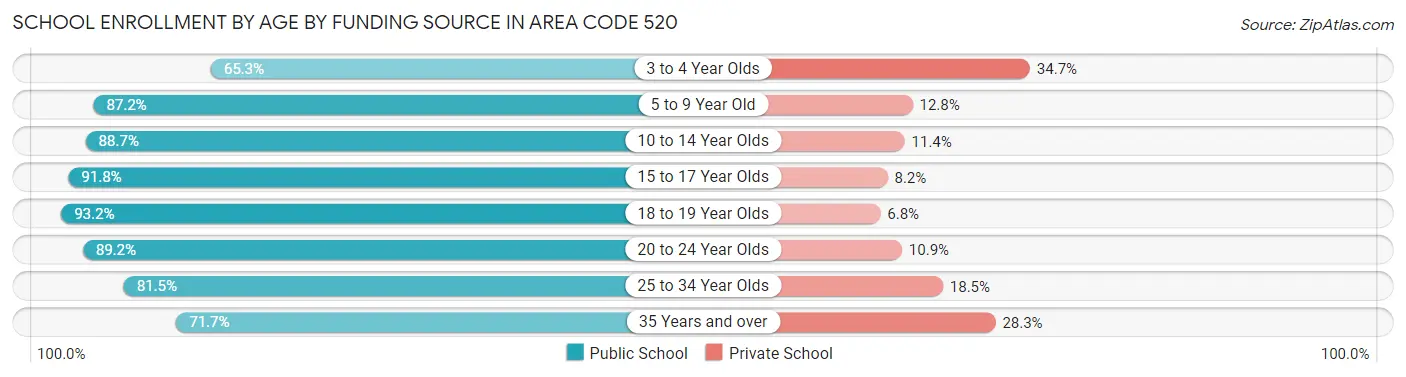
| Age Bracket | Public School | Private School |
| 3 to 4 Year Olds | 14,885 (65.3%) | 7,907 (34.7%) |
| 5 to 9 Year Old | 123,224 (87.2%) | 18,137 (12.8%) |
| 10 to 14 Year Olds | 145,186 (88.6%) | 18,585 (11.4%) |
| 15 to 17 Year Olds | 87,156 (91.8%) | 7,755 (8.2%) |
| 18 to 19 Year Olds | 51,267 (93.2%) | 3,758 (6.8%) |
| 20 to 24 Year Olds | 65,146 (89.1%) | 7,930 (10.8%) |
| 25 to 34 Year Olds | 34,961 (81.5%) | 7,924 (18.5%) |
| 35 Years and over | 28,329 (71.7%) | 11,164 (28.3%) |
| Total | 550,152 (86.9%) | 83,162 (13.1%) |
Educational Attainment by Field of Study in Area Code 520
Business (122,381 | 18.5%), education (81,880 | 12.4%), science & technology (65,376 | 9.9%), engineering (57,754 | 8.7%), and social sciences (48,453 | 7.3%) are the most common fields of study among 659,861 individuals in Area Code 520 who have obtained a bachelor's degree or higher.
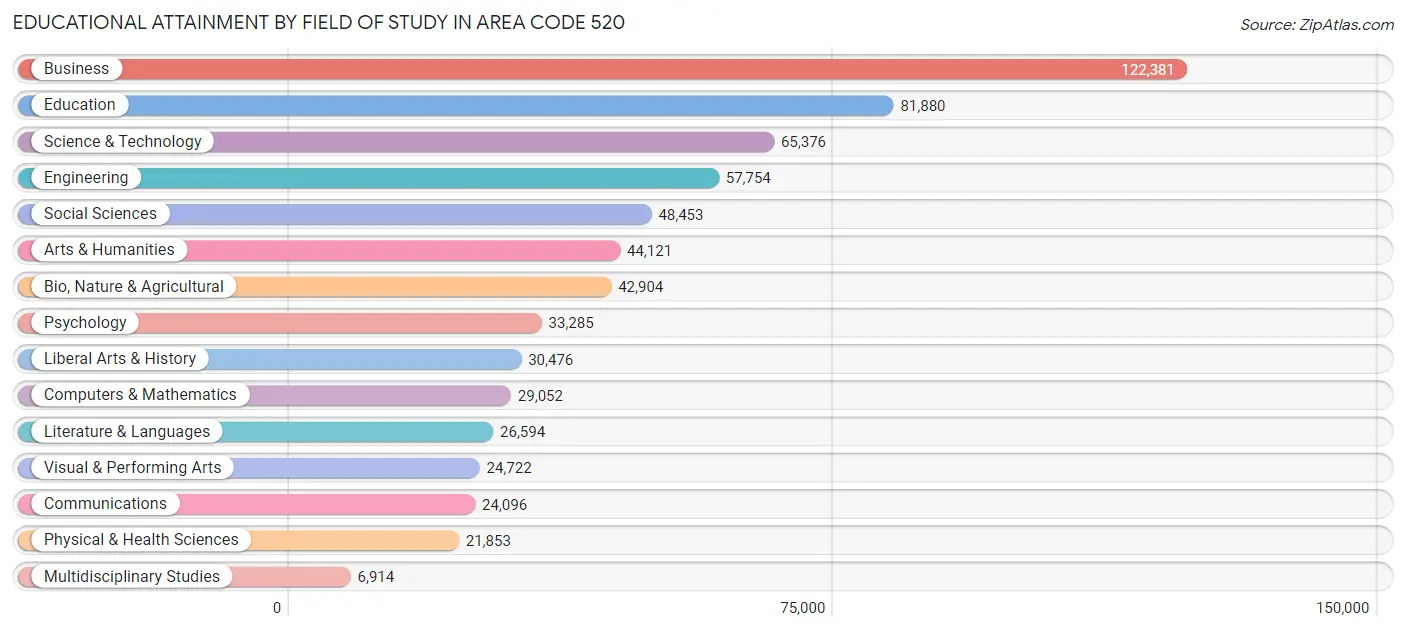
| Field of Study | # Graduates | % Graduates |
| Computers & Mathematics | 29,052 | 4.4% |
| Bio, Nature & Agricultural | 42,904 | 6.5% |
| Physical & Health Sciences | 21,853 | 3.3% |
| Psychology | 33,285 | 5.0% |
| Social Sciences | 48,453 | 7.3% |
| Engineering | 57,754 | 8.7% |
| Multidisciplinary Studies | 6,914 | 1.1% |
| Science & Technology | 65,376 | 9.9% |
| Business | 122,381 | 18.5% |
| Education | 81,880 | 12.4% |
| Literature & Languages | 26,594 | 4.0% |
| Liberal Arts & History | 30,476 | 4.6% |
| Visual & Performing Arts | 24,722 | 3.7% |
| Communications | 24,096 | 3.6% |
| Arts & Humanities | 44,121 | 6.7% |
| Total | 659,861 | 100.0% |
Transportation & Commute in Area Code 520
Vehicle Availability by Sex in Area Code 520
The most prevalent vehicle ownership categories in Area Code 520 are males with 2 vehicles (263,228, accounting for 42.2%) and females with 2 vehicles (216,989, making up 49.8%).
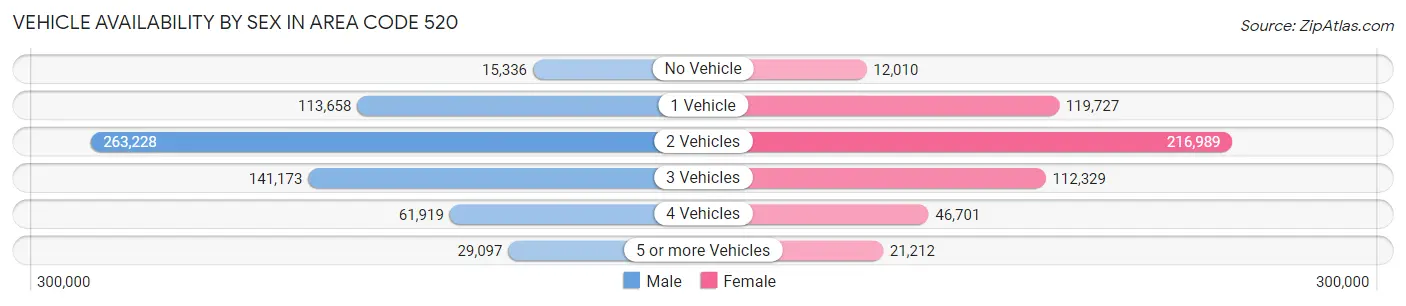
| Vehicles Available | Male | Female |
| No Vehicle | 15,336 (2.5%) | 12,010 (2.3%) |
| 1 Vehicle | 113,658 (18.2%) | 119,727 (22.6%) |
| 2 Vehicles | 263,228 (42.2%) | 216,989 (41.0%) |
| 3 Vehicles | 141,173 (22.6%) | 112,329 (21.2%) |
| 4 Vehicles | 61,919 (9.9%) | 46,701 (8.8%) |
| 5 or more Vehicles | 29,097 (4.7%) | 21,212 (4.0%) |
| Total | 624,411 (100.0%) | 528,968 (100.0%) |
Commute Time in Area Code 520
The most frequently occuring commute durations in Area Code 520 are 15 to 19 minutes (162,212 commuters, 16.1%), 20 to 24 minutes (148,386 commuters, 14.7%), and 30 to 34 minutes (138,958 commuters, 13.8%).
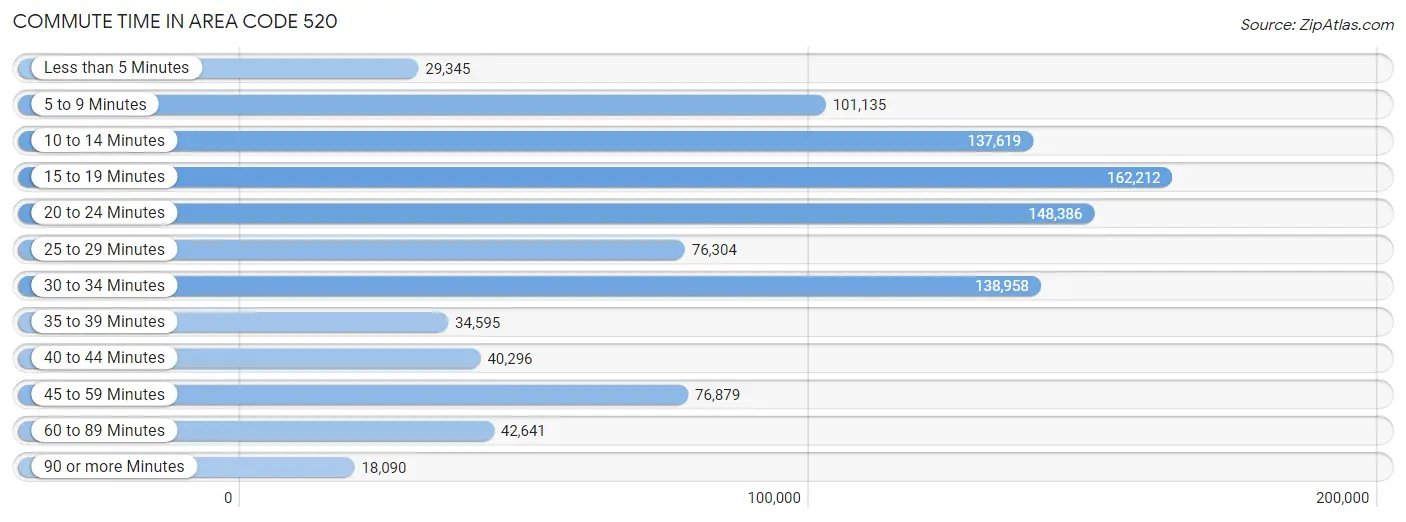
| Commute Time | # Commuters | % Commuters |
| Less than 5 Minutes | 29,345 | 2.9% |
| 5 to 9 Minutes | 101,135 | 10.1% |
| 10 to 14 Minutes | 137,619 | 13.7% |
| 15 to 19 Minutes | 162,212 | 16.1% |
| 20 to 24 Minutes | 148,386 | 14.7% |
| 25 to 29 Minutes | 76,304 | 7.6% |
| 30 to 34 Minutes | 138,958 | 13.8% |
| 35 to 39 Minutes | 34,595 | 3.4% |
| 40 to 44 Minutes | 40,296 | 4.0% |
| 45 to 59 Minutes | 76,879 | 7.6% |
| 60 to 89 Minutes | 42,641 | 4.2% |
| 90 or more Minutes | 18,090 | 1.8% |
Commute Time by Sex in Area Code 520
The most common commute times in Area Code 520 are 15 to 19 minutes (88,689 commuters, 15.9%) for males and 15 to 19 minutes (73,523 commuters, 16.3%) for females.
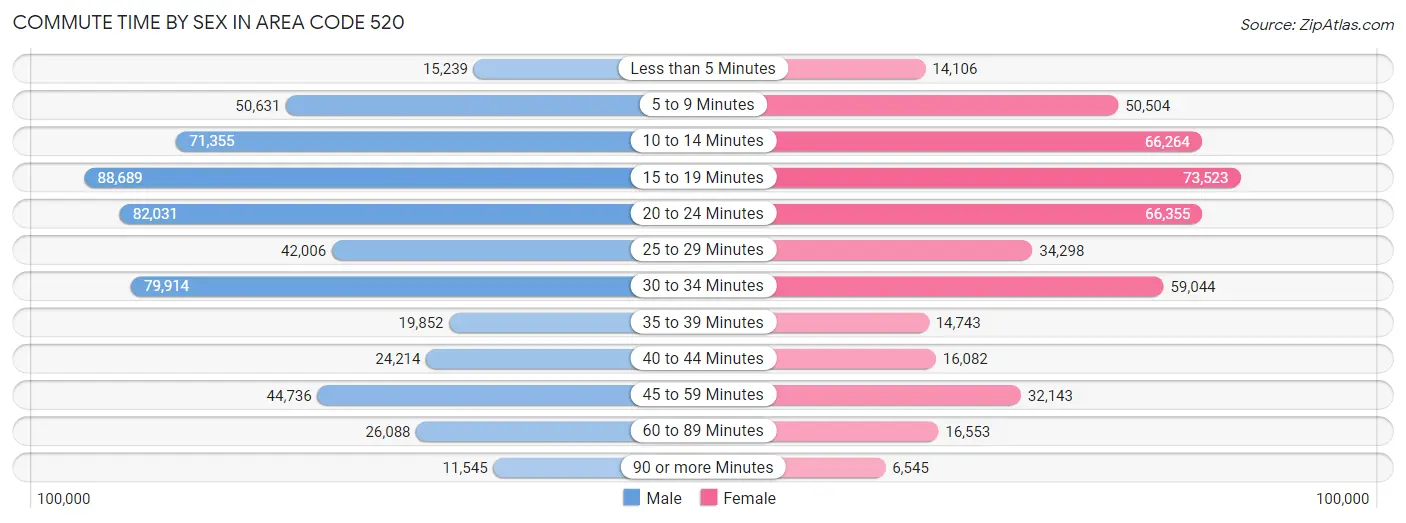
| Commute Time | Male | Female |
| Less than 5 Minutes | 15,239 (2.7%) | 14,106 (3.1%) |
| 5 to 9 Minutes | 50,631 (9.1%) | 50,504 (11.2%) |
| 10 to 14 Minutes | 71,355 (12.8%) | 66,264 (14.7%) |
| 15 to 19 Minutes | 88,689 (15.9%) | 73,523 (16.3%) |
| 20 to 24 Minutes | 82,031 (14.7%) | 66,355 (14.7%) |
| 25 to 29 Minutes | 42,006 (7.5%) | 34,298 (7.6%) |
| 30 to 34 Minutes | 79,914 (14.4%) | 59,044 (13.1%) |
| 35 to 39 Minutes | 19,852 (3.6%) | 14,743 (3.3%) |
| 40 to 44 Minutes | 24,214 (4.3%) | 16,082 (3.6%) |
| 45 to 59 Minutes | 44,736 (8.0%) | 32,143 (7.1%) |
| 60 to 89 Minutes | 26,088 (4.7%) | 16,553 (3.7%) |
| 90 or more Minutes | 11,545 (2.1%) | 6,545 (1.5%) |
Time of Departure to Work by Sex in Area Code 520
The most frequent times of departure to work in Area Code 520 are 7:00 AM to 7:29 AM (67,076, 12.1%) for males and 7:00 AM to 7:29 AM (66,651, 14.8%) for females.
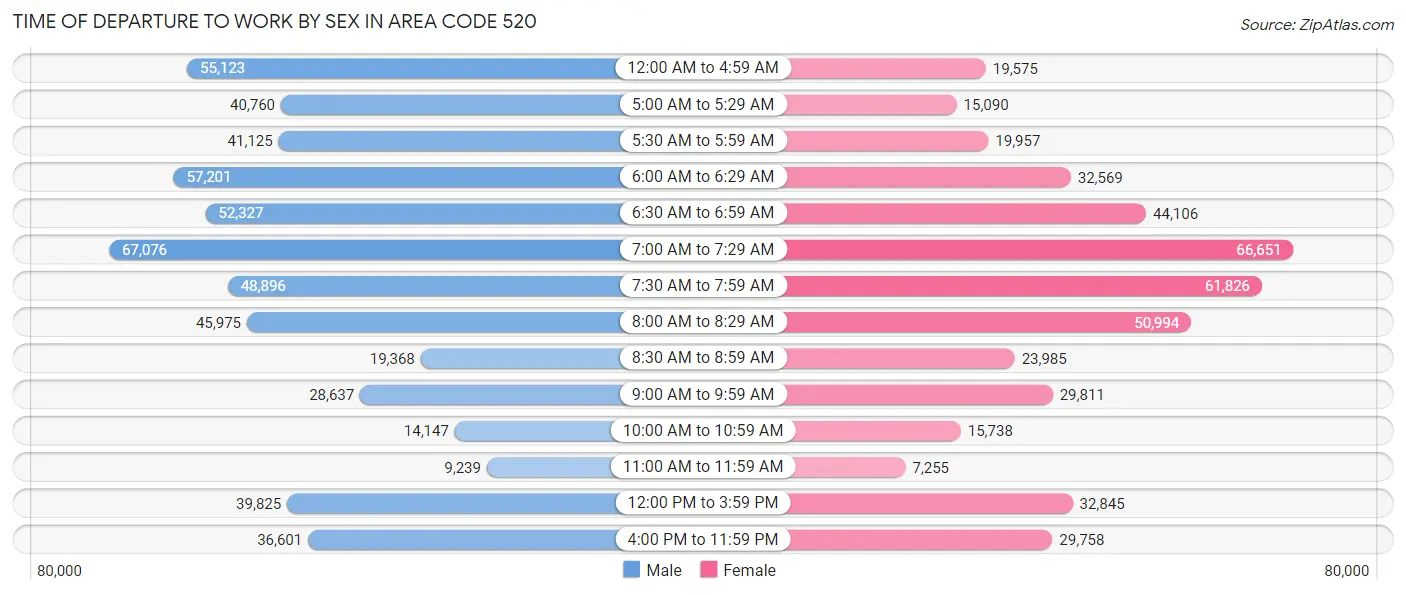
| Time of Departure | Male | Female |
| 12:00 AM to 4:59 AM | 55,123 (9.9%) | 19,575 (4.3%) |
| 5:00 AM to 5:29 AM | 40,760 (7.3%) | 15,090 (3.4%) |
| 5:30 AM to 5:59 AM | 41,125 (7.4%) | 19,957 (4.4%) |
| 6:00 AM to 6:29 AM | 57,201 (10.3%) | 32,569 (7.2%) |
| 6:30 AM to 6:59 AM | 52,327 (9.4%) | 44,106 (9.8%) |
| 7:00 AM to 7:29 AM | 67,076 (12.1%) | 66,651 (14.8%) |
| 7:30 AM to 7:59 AM | 48,896 (8.8%) | 61,826 (13.7%) |
| 8:00 AM to 8:29 AM | 45,975 (8.3%) | 50,994 (11.3%) |
| 8:30 AM to 8:59 AM | 19,368 (3.5%) | 23,985 (5.3%) |
| 9:00 AM to 9:59 AM | 28,637 (5.1%) | 29,811 (6.6%) |
| 10:00 AM to 10:59 AM | 14,147 (2.5%) | 15,738 (3.5%) |
| 11:00 AM to 11:59 AM | 9,239 (1.7%) | 7,255 (1.6%) |
| 12:00 PM to 3:59 PM | 39,825 (7.2%) | 32,845 (7.3%) |
| 4:00 PM to 11:59 PM | 36,601 (6.6%) | 29,758 (6.6%) |
| Total | 556,300 (100.0%) | 450,160 (100.0%) |
Housing Occupancy in Area Code 520
Occupancy by Ownership in Area Code 520
Of the total 1,018,628 dwellings in Area Code 520, owner-occupied units account for 684,775 (67.2%), while renter-occupied units make up 333,853 (32.8%).
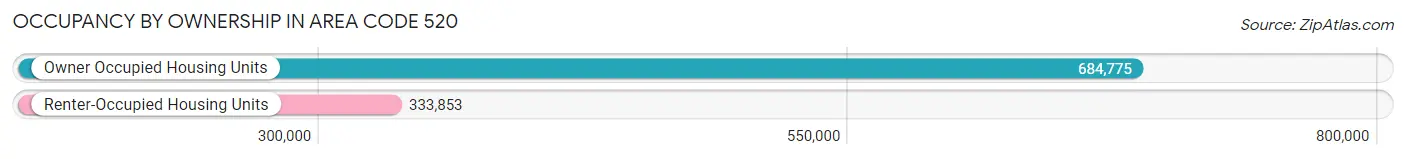
| Occupancy | # Housing Units | % Housing Units |
| Owner Occupied Housing Units | 684,775 | 67.2% |
| Renter-Occupied Housing Units | 333,853 | 32.8% |
| Total Occupied Housing Units | 1,018,628 | 100.0% |
Occupancy by Household Size in Area Code 520
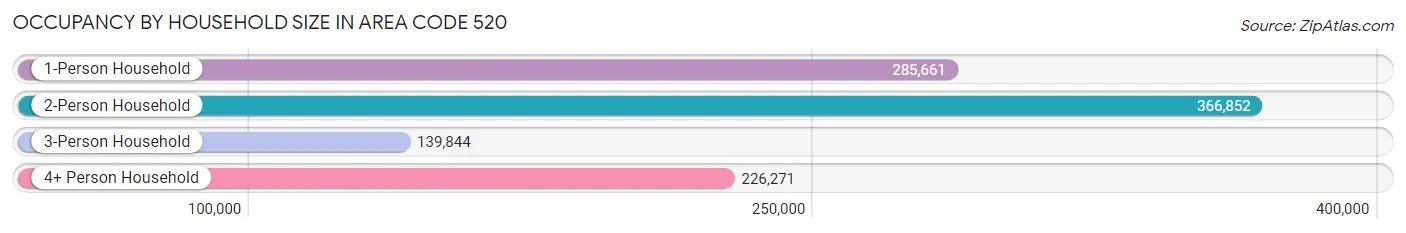
| Household Size | # Housing Units | % Housing Units |
| 1-Person Household | 285,661 | 28.0% |
| 2-Person Household | 366,852 | 36.0% |
| 3-Person Household | 139,844 | 13.7% |
| 4+ Person Household | 226,271 | 22.2% |
| Total Housing Units | 1,018,628 | 100.0% |
Occupancy by Ownership by Household Size in Area Code 520
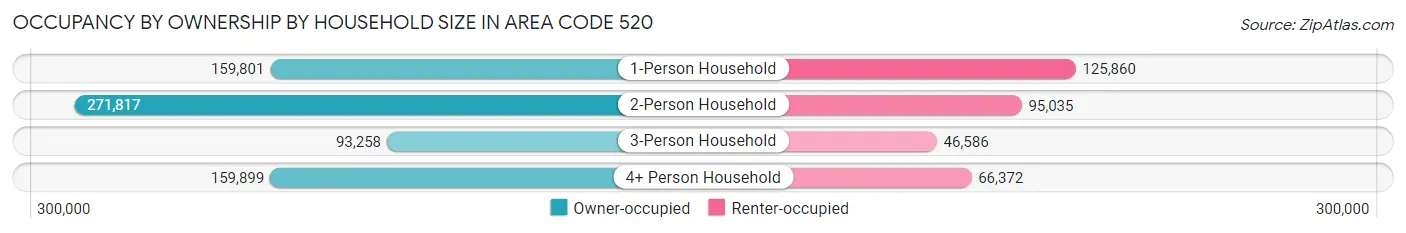
| Household Size | Owner-occupied | Renter-occupied |
| 1-Person Household | 159,801 (55.9%) | 125,860 (44.1%) |
| 2-Person Household | 271,817 (74.1%) | 95,035 (25.9%) |
| 3-Person Household | 93,258 (66.7%) | 46,586 (33.3%) |
| 4+ Person Household | 159,899 (70.7%) | 66,372 (29.3%) |
| Total Housing Units | 684,775 (67.2%) | 333,853 (32.8%) |
Occupancy by Educational Attainment in Area Code 520
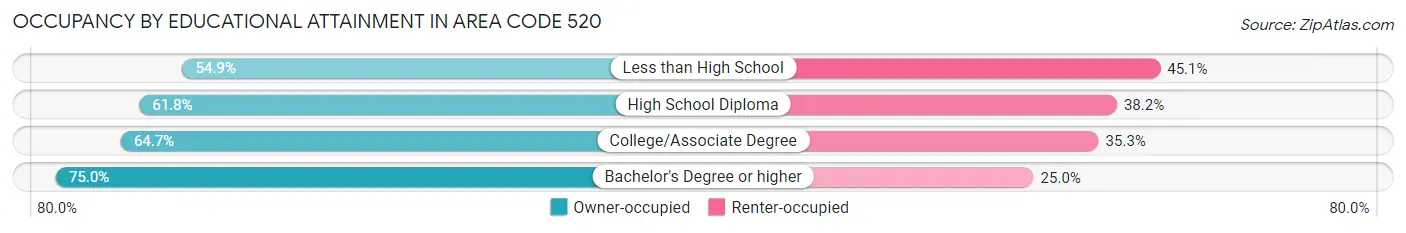
| Household Size | Owner-occupied | Renter-occupied |
| Less than High School | 45,525 (54.9%) | 37,342 (45.1%) |
| High School Diploma | 119,265 (61.8%) | 73,734 (38.2%) |
| College/Associate Degree | 233,723 (64.7%) | 127,473 (35.3%) |
| Bachelor's Degree or higher | 286,262 (75.0%) | 95,304 (25.0%) |
Occupancy by Age of Householder in Area Code 520
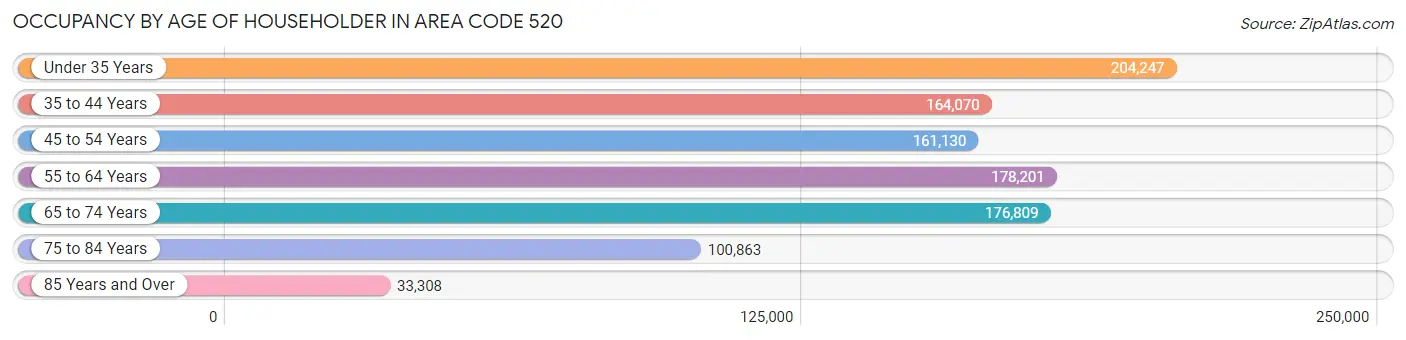
| Age Bracket | # Households | % Households |
| Under 35 Years | 204,247 | 20.1% |
| 35 to 44 Years | 164,070 | 16.1% |
| 45 to 54 Years | 161,130 | 15.8% |
| 55 to 64 Years | 178,201 | 17.5% |
| 65 to 74 Years | 176,809 | 17.4% |
| 75 to 84 Years | 100,863 | 9.9% |
| 85 Years and Over | 33,308 | 3.3% |
| Total | 1,018,628 | 100.0% |
Housing Finances in Area Code 520
Median Income by Occupancy in Area Code 520
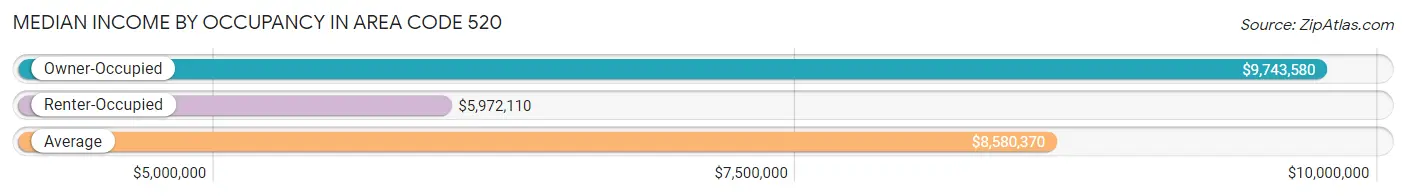
| Occupancy Type | # Households | Median Income |
| Owner-Occupied | 684,775 (67.2%) | $9,743,580 |
| Renter-Occupied | 333,853 (32.8%) | $5,972,110 |
| Average | 1,018,628 (100.0%) | $8,580,370 |
Occupancy by Householder Income Bracket in Area Code 520
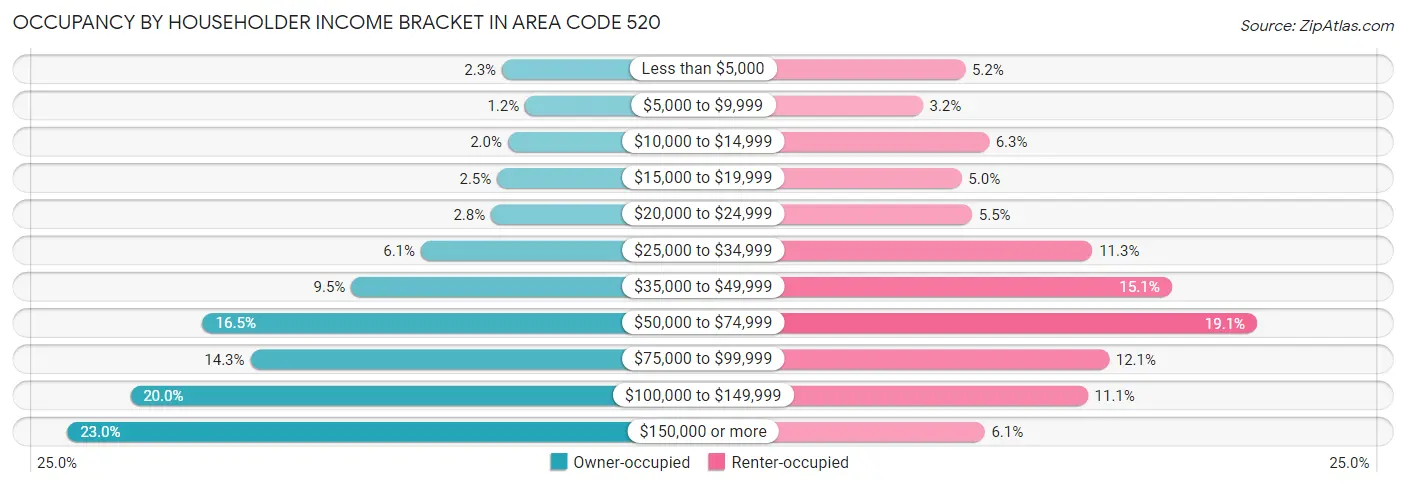
| Income Bracket | Owner-occupied | Renter-occupied |
| Less than $5,000 | 15,574 (2.3%) | 17,407 (5.2%) |
| $5,000 to $9,999 | 8,003 (1.2%) | 10,640 (3.2%) |
| $10,000 to $14,999 | 13,603 (2.0%) | 21,163 (6.3%) |
| $15,000 to $19,999 | 17,089 (2.5%) | 16,817 (5.0%) |
| $20,000 to $24,999 | 19,116 (2.8%) | 18,504 (5.5%) |
| $25,000 to $34,999 | 41,973 (6.1%) | 37,639 (11.3%) |
| $35,000 to $49,999 | 64,710 (9.5%) | 50,241 (15.0%) |
| $50,000 to $74,999 | 113,107 (16.5%) | 63,813 (19.1%) |
| $75,000 to $99,999 | 97,604 (14.2%) | 40,263 (12.1%) |
| $100,000 to $149,999 | 136,736 (20.0%) | 36,882 (11.1%) |
| $150,000 or more | 157,260 (23.0%) | 20,484 (6.1%) |
| Total | 684,775 (100.0%) | 333,853 (100.0%) |
Monthly Housing Cost Tiers in Area Code 520
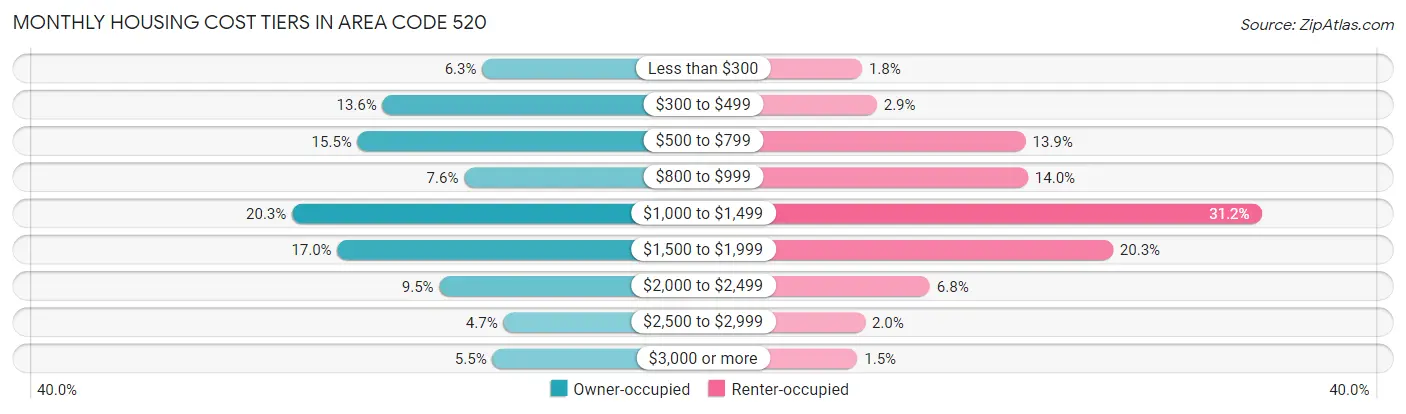
| Monthly Cost | Owner-occupied | Renter-occupied |
| Less than $300 | 43,049 (6.3%) | 6,032 (1.8%) |
| $300 to $499 | 93,430 (13.6%) | 9,678 (2.9%) |
| $500 to $799 | 105,917 (15.5%) | 46,259 (13.9%) |
| $800 to $999 | 52,191 (7.6%) | 46,853 (14.0%) |
| $1,000 to $1,499 | 139,020 (20.3%) | 104,229 (31.2%) |
| $1,500 to $1,999 | 116,144 (17.0%) | 67,727 (20.3%) |
| $2,000 to $2,499 | 64,707 (9.5%) | 22,747 (6.8%) |
| $2,500 to $2,999 | 32,409 (4.7%) | 6,792 (2.0%) |
| $3,000 or more | 37,908 (5.5%) | 4,913 (1.5%) |
| Total | 684,775 (100.0%) | 333,853 (100.0%) |
Physical Housing Characteristics in Area Code 520
Housing Structures in Area Code 520
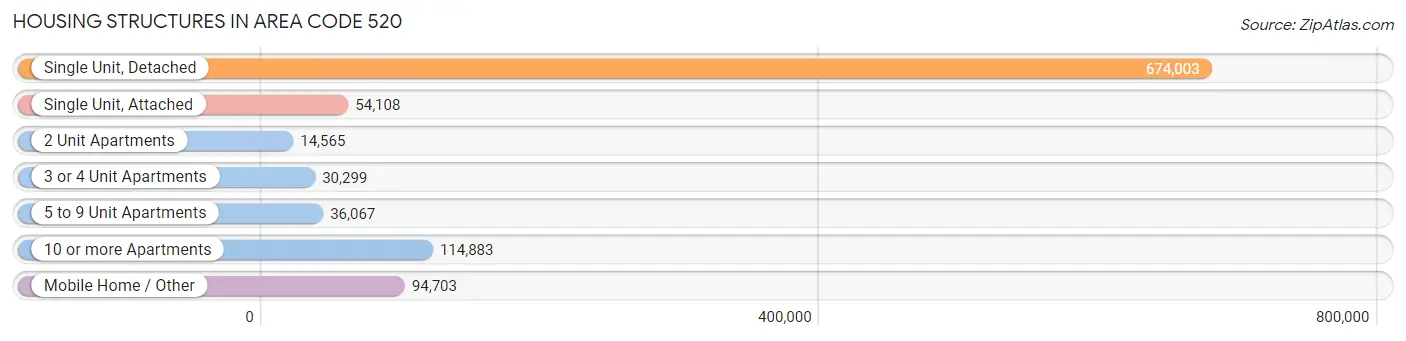
| Structure Type | # Housing Units | % Housing Units |
| Single Unit, Detached | 674,003 | 66.2% |
| Single Unit, Attached | 54,108 | 5.3% |
| 2 Unit Apartments | 14,565 | 1.4% |
| 3 or 4 Unit Apartments | 30,299 | 3.0% |
| 5 to 9 Unit Apartments | 36,067 | 3.5% |
| 10 or more Apartments | 114,883 | 11.3% |
| Mobile Home / Other | 94,703 | 9.3% |
| Total | 1,018,628 | 100.0% |
Housing Structures by Occupancy in Area Code 520
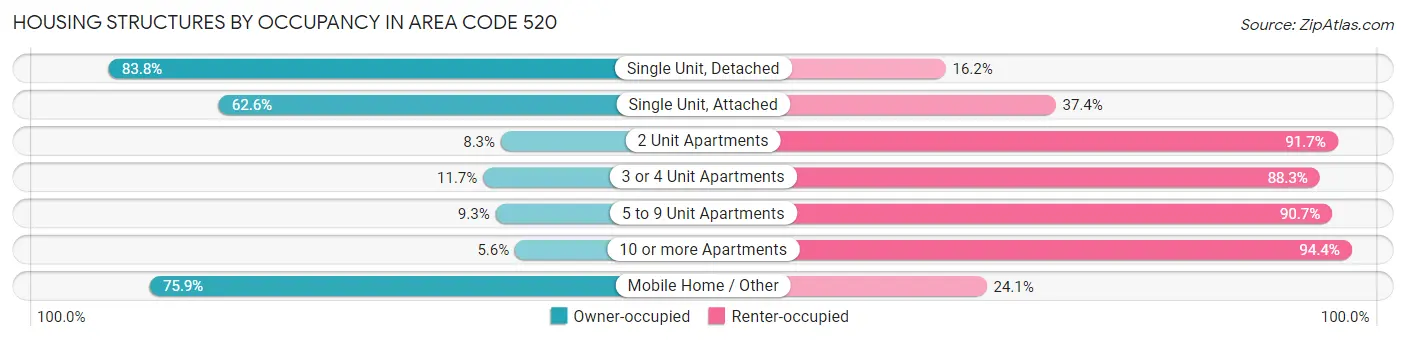
| Structure Type | Owner-occupied | Renter-occupied |
| Single Unit, Detached | 564,552 (83.8%) | 109,451 (16.2%) |
| Single Unit, Attached | 33,859 (62.6%) | 20,249 (37.4%) |
| 2 Unit Apartments | 1,209 (8.3%) | 13,356 (91.7%) |
| 3 or 4 Unit Apartments | 3,550 (11.7%) | 26,749 (88.3%) |
| 5 to 9 Unit Apartments | 3,367 (9.3%) | 32,700 (90.7%) |
| 10 or more Apartments | 6,396 (5.6%) | 108,487 (94.4%) |
| Mobile Home / Other | 71,842 (75.9%) | 22,861 (24.1%) |
| Total | 684,775 (67.2%) | 333,853 (32.8%) |
Housing Structures by Number of Rooms in Area Code 520
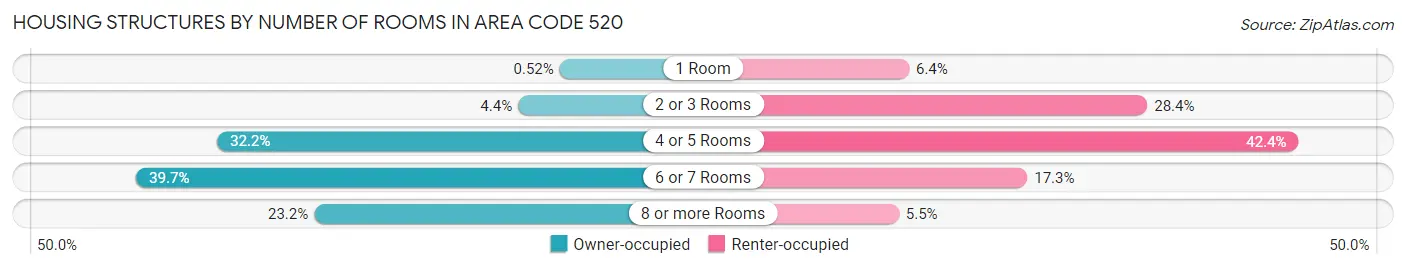
| Number of Rooms | Owner-occupied | Renter-occupied |
| 1 Room | 3,546 (0.5%) | 21,330 (6.4%) |
| 2 or 3 Rooms | 29,954 (4.4%) | 94,905 (28.4%) |
| 4 or 5 Rooms | 220,491 (32.2%) | 141,544 (42.4%) |
| 6 or 7 Rooms | 271,685 (39.7%) | 57,869 (17.3%) |
| 8 or more Rooms | 159,099 (23.2%) | 18,205 (5.4%) |
| Total | 684,775 (100.0%) | 333,853 (100.0%) |
Housing Structure by Heating Type in Area Code 520
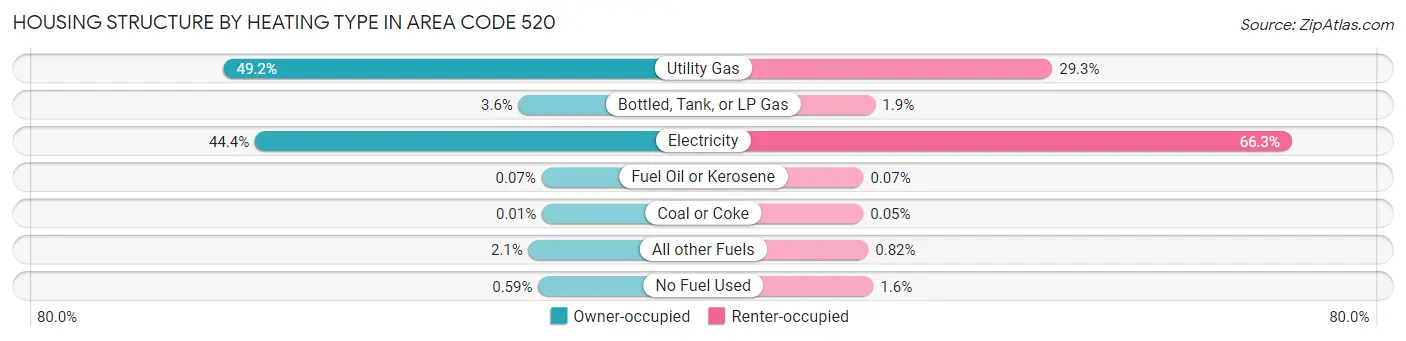
| Heating Type | Owner-occupied | Renter-occupied |
| Utility Gas | 337,171 (49.2%) | 97,678 (29.3%) |
| Bottled, Tank, or LP Gas | 24,807 (3.6%) | 6,388 (1.9%) |
| Electricity | 303,902 (44.4%) | 221,266 (66.3%) |
| Fuel Oil or Kerosene | 470 (0.1%) | 248 (0.1%) |
| Coal or Coke | 54 (0.0%) | 173 (0.1%) |
| All other Fuels | 14,363 (2.1%) | 2,754 (0.8%) |
| No Fuel Used | 4,008 (0.6%) | 5,346 (1.6%) |
| Total | 684,775 (100.0%) | 333,853 (100.0%) |
Household Vehicle Usage in Area Code 520
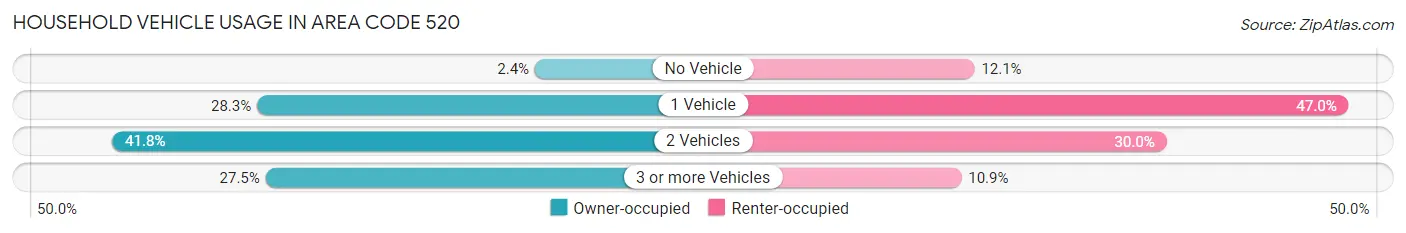
| Vehicles per Household | Owner-occupied | Renter-occupied |
| No Vehicle | 16,191 (2.4%) | 40,370 (12.1%) |
| 1 Vehicle | 193,763 (28.3%) | 156,966 (47.0%) |
| 2 Vehicles | 286,475 (41.8%) | 100,254 (30.0%) |
| 3 or more Vehicles | 188,346 (27.5%) | 36,263 (10.9%) |
| Total | 684,775 (100.0%) | 333,853 (100.0%) |
Real Estate & Mortgages in Area Code 520
Real Estate and Mortgage Overview in Area Code 520
| Characteristic | Without Mortgage | With Mortgage |
| Housing Units | 257,102 | 427,673 |
| Median Property Value | $31,715,700 | $35,485,200 |
| Median Household Income | $7,835,227 | $116,922 |
| Monthly Housing Costs | $58,481 | $37,201 |
| Real Estate Taxes | $210,922 | $12,052 |
Property Value by Mortgage Status in Area Code 520
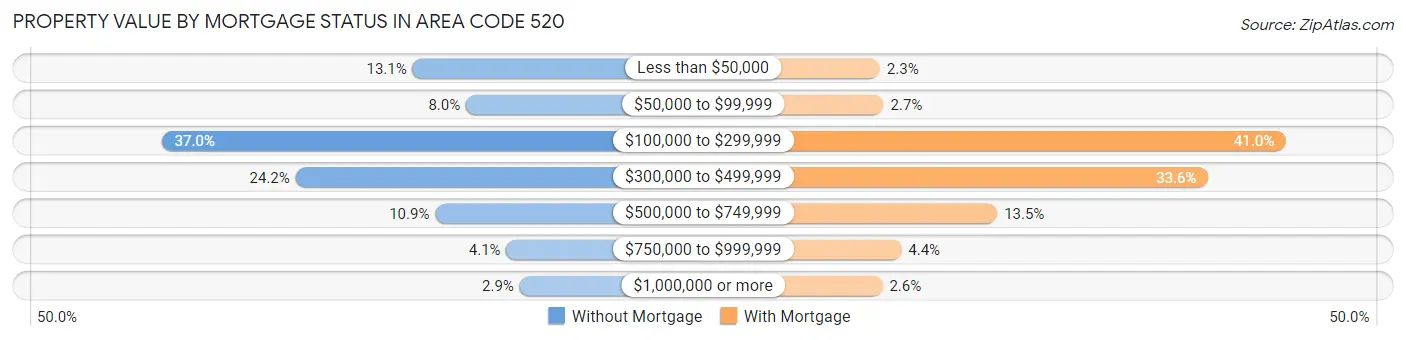
| Property Value | Without Mortgage | With Mortgage |
| Less than $50,000 | 33,558 (13.1%) | 9,935 (2.3%) |
| $50,000 to $99,999 | 20,473 (8.0%) | 11,401 (2.7%) |
| $100,000 to $299,999 | 94,988 (36.9%) | 175,373 (41.0%) |
| $300,000 to $499,999 | 62,183 (24.2%) | 143,685 (33.6%) |
| $500,000 to $749,999 | 28,004 (10.9%) | 57,697 (13.5%) |
| $750,000 to $999,999 | 10,569 (4.1%) | 18,644 (4.4%) |
| $1,000,000 or more | 7,327 (2.9%) | 10,938 (2.6%) |
| Total | 257,102 (100.0%) | 427,673 (100.0%) |
Household Income by Mortgage Status in Area Code 520
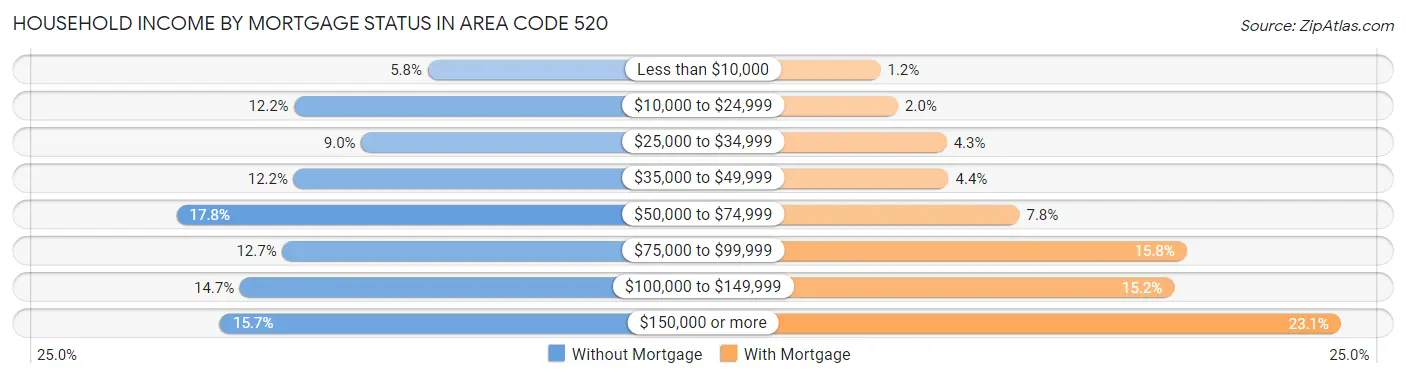
| Household Income | Without Mortgage | With Mortgage |
| Less than $10,000 | 14,912 (5.8%) | 5,096 (1.2%) |
| $10,000 to $24,999 | 31,246 (12.1%) | 8,665 (2.0%) |
| $25,000 to $34,999 | 23,032 (9.0%) | 18,562 (4.3%) |
| $35,000 to $49,999 | 31,303 (12.2%) | 18,941 (4.4%) |
| $50,000 to $74,999 | 45,652 (17.8%) | 33,407 (7.8%) |
| $75,000 to $99,999 | 32,713 (12.7%) | 67,455 (15.8%) |
| $100,000 to $149,999 | 37,906 (14.7%) | 64,891 (15.2%) |
| $150,000 or more | 40,338 (15.7%) | 98,830 (23.1%) |
| Total | 257,102 (100.0%) | 427,673 (100.0%) |
Property Value to Household Income Ratio in Area Code 520
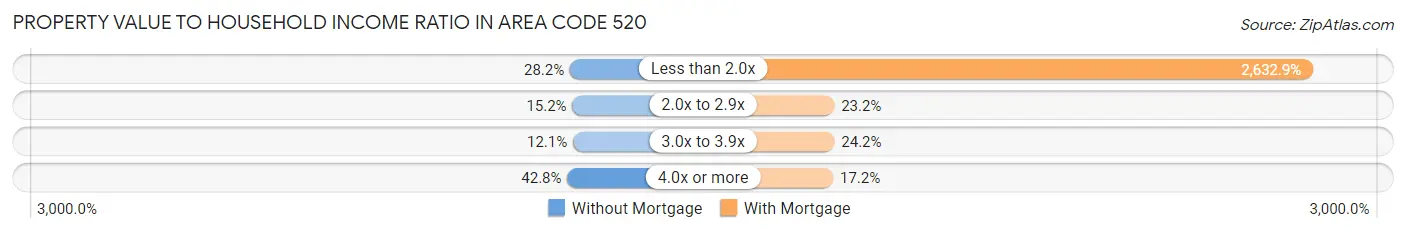
| Value-to-Income Ratio | Without Mortgage | With Mortgage |
| Less than 2.0x | 72,570 (28.2%) | 11,260,316 (2,632.9%) |
| 2.0x to 2.9x | 38,953 (15.1%) | 99,359 (23.2%) |
| 3.0x to 3.9x | 31,086 (12.1%) | 103,288 (24.1%) |
| 4.0x or more | 110,036 (42.8%) | 73,544 (17.2%) |
| Total | 257,102 (100.0%) | 427,673 (100.0%) |
Real Estate Taxes by Mortgage Status in Area Code 520
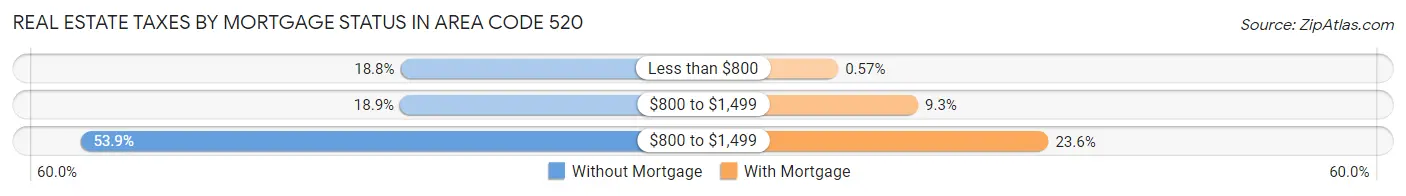
| Property Taxes | Without Mortgage | With Mortgage |
| Less than $800 | 48,410 (18.8%) | 2,445 (0.6%) |
| $800 to $1,499 | 48,521 (18.9%) | 39,841 (9.3%) |
| $800 to $1,499 | 138,512 (53.9%) | 100,953 (23.6%) |
| Total | 257,102 (100.0%) | 427,673 (100.0%) |
Health & Disability in Area Code 520
Health Insurance Coverage by Age in Area Code 520
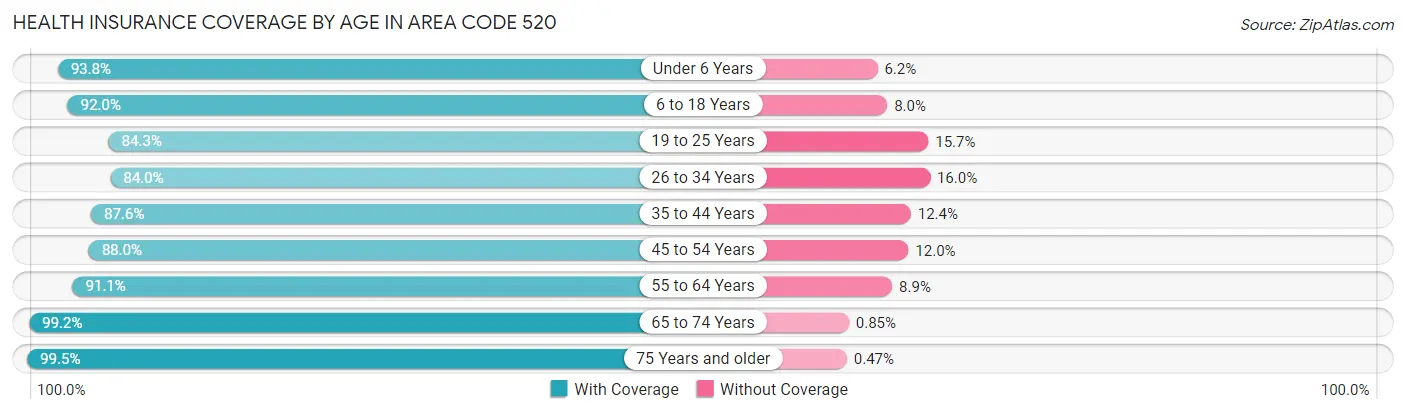
| Age Bracket | With Coverage | Without Coverage |
| Under 6 Years | 159,649 (93.8%) | 10,510 (6.2%) |
| 6 to 18 Years | 393,352 (92.0%) | 34,261 (8.0%) |
| 19 to 25 Years | 217,341 (84.3%) | 40,344 (15.7%) |
| 26 to 34 Years | 250,525 (84.0%) | 47,648 (16.0%) |
| 35 to 44 Years | 271,117 (87.6%) | 38,381 (12.4%) |
| 45 to 54 Years | 257,235 (88.0%) | 34,930 (12.0%) |
| 55 to 64 Years | 277,909 (91.1%) | 27,249 (8.9%) |
| 65 to 74 Years | 284,904 (99.2%) | 2,431 (0.9%) |
| 75 Years and older | 208,574 (99.5%) | 992 (0.5%) |
| Total | 2,320,606 (90.7%) | 236,746 (9.3%) |
Health Insurance Coverage by Citizenship Status in Area Code 520
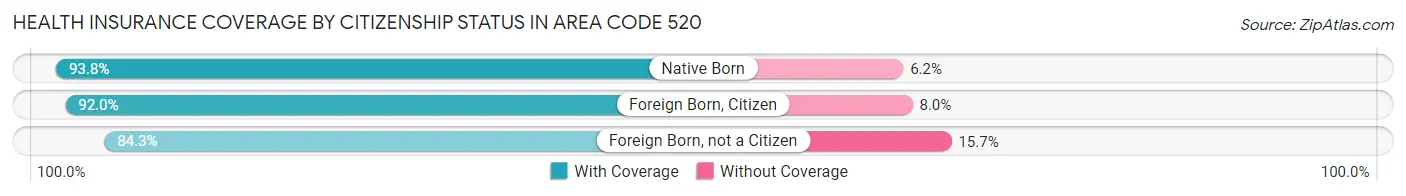
| Citizenship Status | With Coverage | Without Coverage |
| Native Born | 159,649 (93.8%) | 10,510 (6.2%) |
| Foreign Born, Citizen | 393,352 (92.0%) | 34,261 (8.0%) |
| Foreign Born, not a Citizen | 217,341 (84.3%) | 40,344 (15.7%) |
Health Insurance Coverage by Household Income in Area Code 520
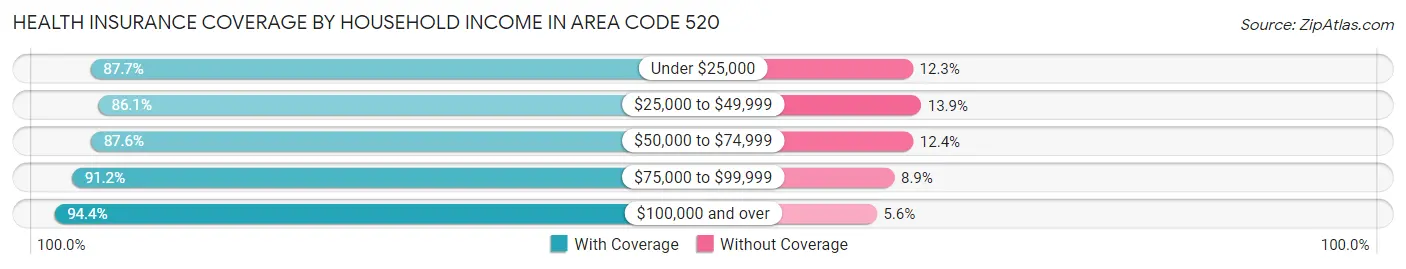
| Household Income | With Coverage | Without Coverage |
| Under $25,000 | 242,264 (87.7%) | 34,080 (12.3%) |
| $25,000 to $49,999 | 351,273 (86.1%) | 56,528 (13.9%) |
| $50,000 to $74,999 | 373,080 (87.6%) | 52,745 (12.4%) |
| $75,000 to $99,999 | 329,451 (91.1%) | 31,975 (8.8%) |
| $100,000 and over | 998,967 (94.4%) | 58,849 (5.6%) |
Public vs Private Health Insurance Coverage by Age in Area Code 520
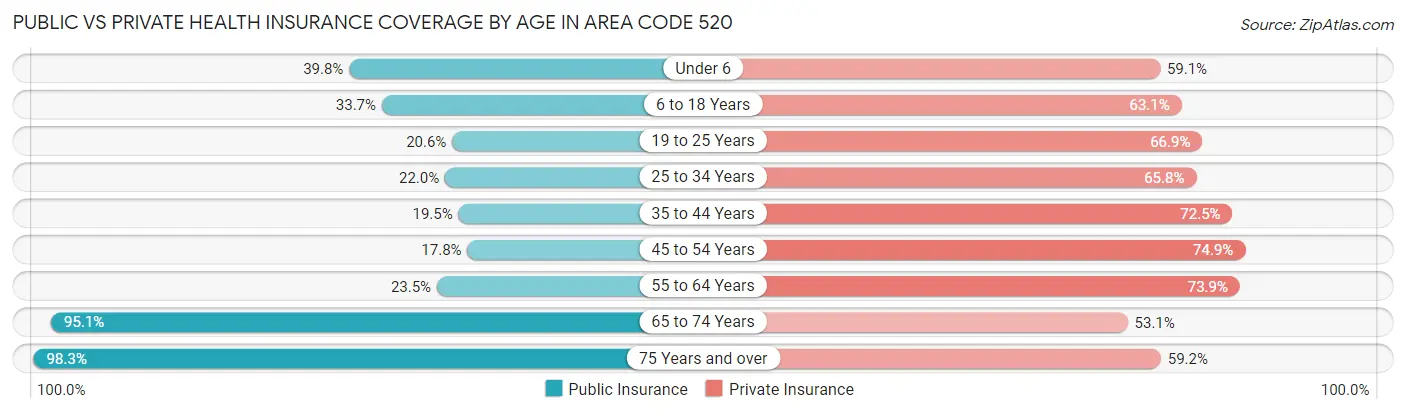
| Age Bracket | Public Insurance | Private Insurance |
| Under 6 | 67,633 (39.8%) | 100,479 (59.1%) |
| 6 to 18 Years | 144,075 (33.7%) | 269,672 (63.1%) |
| 19 to 25 Years | 53,148 (20.6%) | 172,404 (66.9%) |
| 25 to 34 Years | 65,478 (22.0%) | 196,140 (65.8%) |
| 35 to 44 Years | 60,183 (19.5%) | 224,399 (72.5%) |
| 45 to 54 Years | 52,041 (17.8%) | 218,706 (74.9%) |
| 55 to 64 Years | 71,585 (23.5%) | 225,419 (73.9%) |
| 65 to 74 Years | 273,272 (95.1%) | 152,417 (53.0%) |
| 75 Years and over | 206,085 (98.3%) | 124,094 (59.2%) |
| Total | 993,500 (38.9%) | 1,683,730 (65.8%) |
Disability Status by Sex by Age in Area Code 520
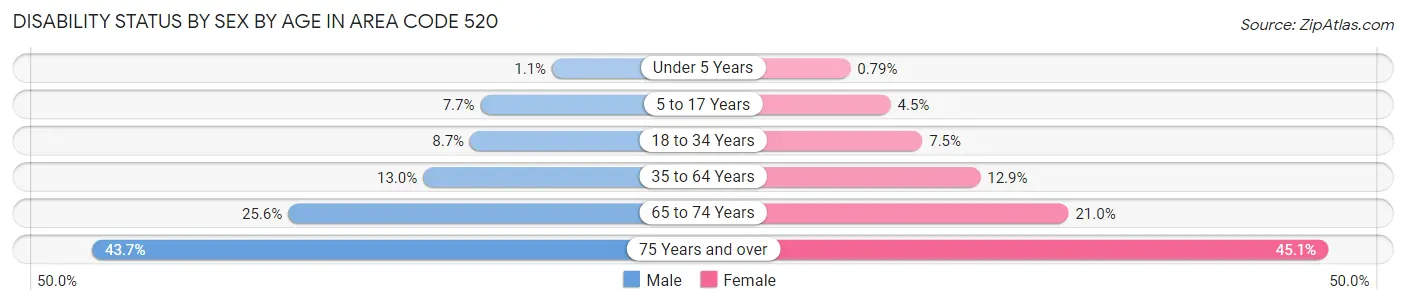
| Age Bracket | Male | Female |
| Under 5 Years | 769 (1.1%) | 536 (0.8%) |
| 5 to 17 Years | 16,587 (7.7%) | 9,191 (4.5%) |
| 18 to 34 Years | 26,067 (8.7%) | 22,035 (7.5%) |
| 35 to 64 Years | 58,181 (13.0%) | 59,130 (12.9%) |
| 65 to 74 Years | 34,065 (25.6%) | 32,398 (21.0%) |
| 75 Years and over | 41,671 (43.7%) | 51,557 (45.1%) |
Disability Class by Sex by Age in Area Code 520
Disability Class: Hearing Difficulty
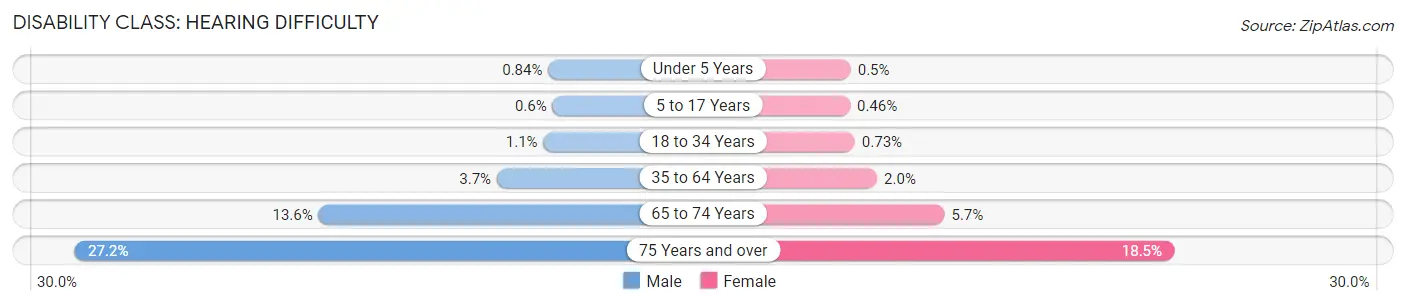
| Age Bracket | Male | Female |
| Under 5 Years | 610 (0.8%) | 336 (0.5%) |
| 5 to 17 Years | 1,283 (0.6%) | 925 (0.5%) |
| 18 to 34 Years | 3,334 (1.1%) | 2,147 (0.7%) |
| 35 to 64 Years | 16,544 (3.7%) | 9,072 (2.0%) |
| 65 to 74 Years | 18,167 (13.6%) | 8,815 (5.7%) |
| 75 Years and over | 25,898 (27.2%) | 21,131 (18.5%) |
Disability Class: Vision Difficulty
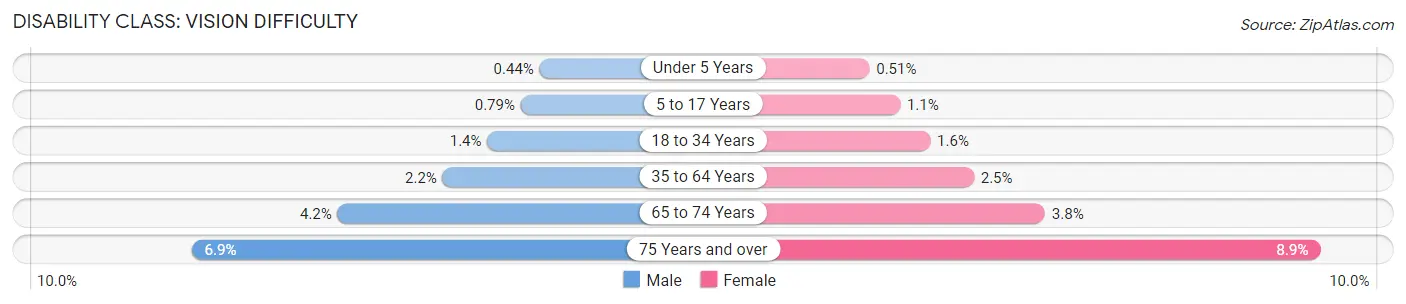
| Age Bracket | Male | Female |
| Under 5 Years | 317 (0.4%) | 346 (0.5%) |
| 5 to 17 Years | 1,699 (0.8%) | 2,182 (1.1%) |
| 18 to 34 Years | 4,250 (1.4%) | 4,832 (1.6%) |
| 35 to 64 Years | 9,989 (2.2%) | 11,293 (2.5%) |
| 65 to 74 Years | 5,581 (4.2%) | 5,801 (3.8%) |
| 75 Years and over | 6,571 (6.9%) | 10,151 (8.9%) |
Disability Class: Cognitive Difficulty
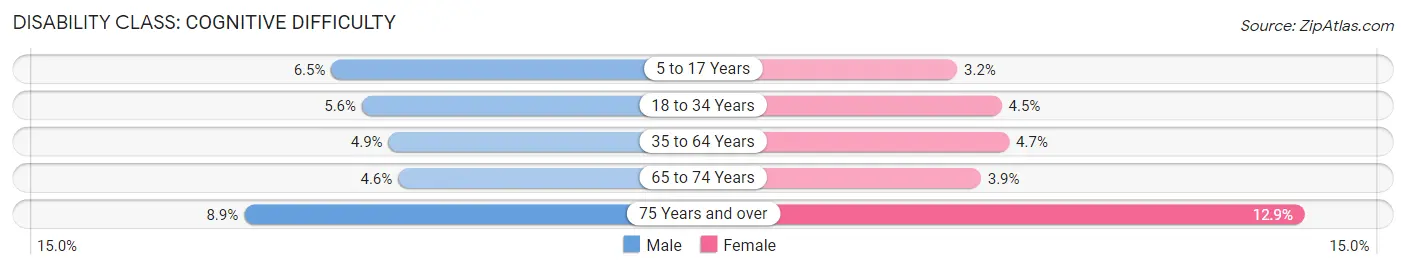
| Age Bracket | Male | Female |
| 5 to 17 Years | 13,910 (6.5%) | 6,502 (3.2%) |
| 18 to 34 Years | 16,864 (5.6%) | 13,129 (4.4%) |
| 35 to 64 Years | 21,754 (4.9%) | 21,439 (4.7%) |
| 65 to 74 Years | 6,138 (4.6%) | 5,954 (3.9%) |
| 75 Years and over | 8,467 (8.9%) | 14,736 (12.9%) |
Disability Class: Ambulatory Difficulty
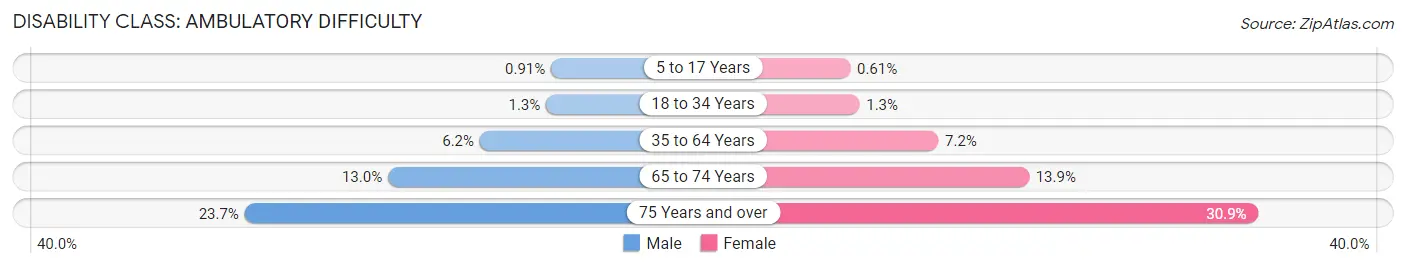
| Age Bracket | Male | Female |
| 5 to 17 Years | 1,950 (0.9%) | 1,233 (0.6%) |
| 18 to 34 Years | 3,861 (1.3%) | 3,840 (1.3%) |
| 35 to 64 Years | 27,681 (6.2%) | 32,892 (7.1%) |
| 65 to 74 Years | 17,363 (13.0%) | 21,375 (13.9%) |
| 75 Years and over | 22,541 (23.7%) | 35,355 (30.9%) |
Disability Class: Self-Care Difficulty
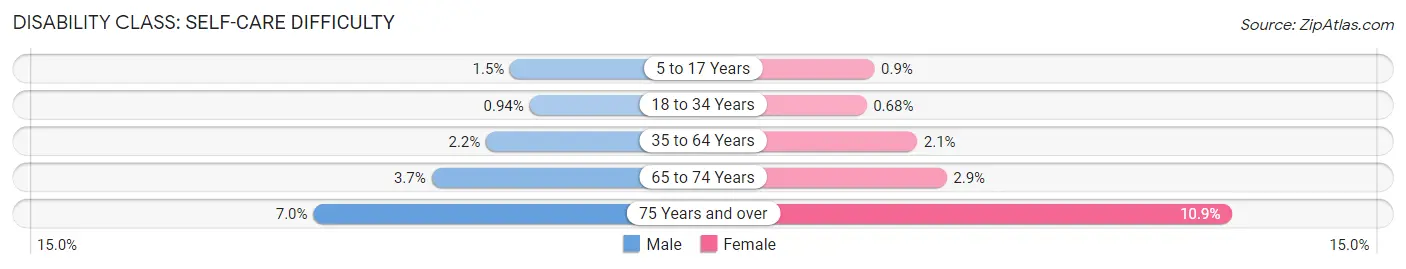
| Age Bracket | Male | Female |
| 5 to 17 Years | 3,178 (1.5%) | 1,829 (0.9%) |
| 18 to 34 Years | 2,816 (0.9%) | 2,011 (0.7%) |
| 35 to 64 Years | 9,623 (2.1%) | 9,610 (2.1%) |
| 65 to 74 Years | 4,899 (3.7%) | 4,480 (2.9%) |
| 75 Years and over | 6,630 (7.0%) | 12,429 (10.9%) |
Technology Access in Area Code 520
Computing Device Access in Area Code 520
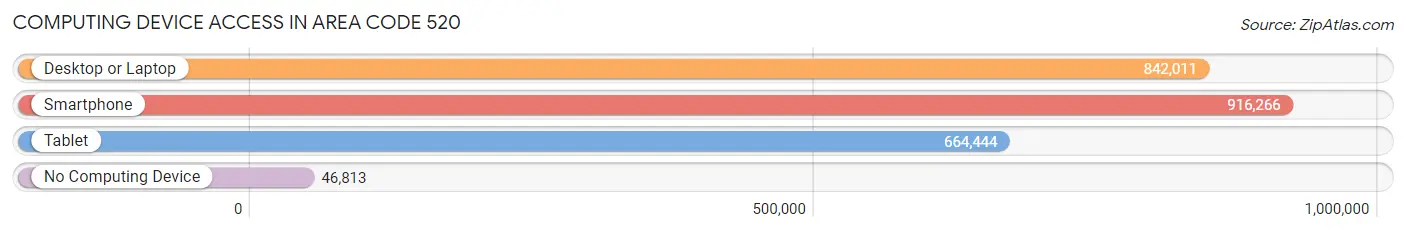
| Device Type | # Households | % Households |
| Desktop or Laptop | 842,011 | 82.7% |
| Smartphone | 916,266 | 89.9% |
| Tablet | 664,444 | 65.2% |
| No Computing Device | 46,813 | 4.6% |
| Total | 1,018,628 | 100.0% |
Internet Access in Area Code 520
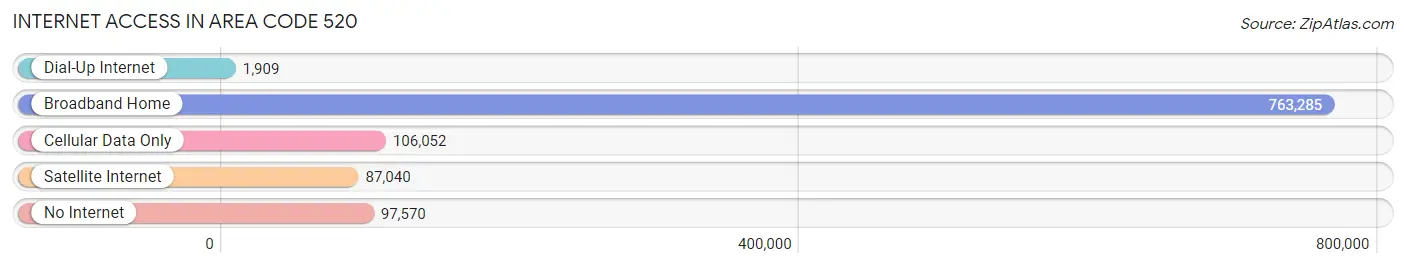
| Internet Type | # Households | % Households |
| Dial-Up Internet | 1,909 | 0.2% |
| Broadband Home | 763,285 | 74.9% |
| Cellular Data Only | 106,052 | 10.4% |
| Satellite Internet | 87,040 | 8.5% |
| No Internet | 97,570 | 9.6% |
| Total | 1,018,628 | 100.0% |
Area Code 520 Summary
Geography
Area code 520 is located in the state of Arizona. It covers the southeastern part of the state, including the cities of Tucson, Sierra Vista, and Yuma.
Social
Area code 520 is home to a diverse population of people from all walks of life. The area is known for its vibrant culture, with a variety of festivals and events throughout the year.
Economics
Area code 520 is an important economic hub for the state of Arizona. It is home to a number of large businesses, including the University of Arizona, Raytheon, and Honeywell.
Demographics
Area code 520 is home to a diverse population of people from all backgrounds. According to the 2010 census, the population of the area is approximately 1.2 million people. The majority of the population is Hispanic or Latino, followed by White, African American, and Native American.
Common Questions
What is Per Capita Income in Area Code 520?
Per Capita income in Area Code 520 is $36,087.
What is the Median Family Income in Area Code 520?
Median Family Income in Area Code 520 is $83,905.
What is the Median Household income in Area Code 520?
Median Household Income in Area Code 520 is $69,197.
What is Income or Wage Gap in Area Code 520?
Income or Wage Gap in Area Code 520 is 26.9%.
Women in Area Code 520 earn 73.1 cents for every dollar earned by a man.
What is Family Income Deficit in Area Code 520?
Family Income Deficit in Area Code 520 is $11,461.
Families that are below poverty line in Area Code 520 earn $11,461 less on average than the poverty threshold level.
What is Inequality or Gini Index in Area Code 520?
Inequality or Gini Index in Area Code 520 is 54.92.
What is the Total Population of Area Code 520?
Total Population of Area Code 520 is 2,618,669.
What is the Total Male Population of Area Code 520?
Total Male Population of Area Code 520 is 1,317,051.
What is the Total Female Population of Area Code 520?
Total Female Population of Area Code 520 is 1,301,618.
What is the Ratio of Males per 100 Females in Area Code 520?
There are 101.19 Males per 100 Females in Area Code 520.
What is the Ratio of Females per 100 Males in Area Code 520?
There are 98.83 Females per 100 Males in Area Code 520.
What is the Median Population Age in Area Code 520?
Median Population Age in Area Code 520 is 44.2 Years.
What is the Average Family Size in Area Code 520
Average Family Size in Area Code 520 is 3.0 People.
What is the Average Household Size in Area Code 520
Average Household Size in Area Code 520 is 2.5 People.
How Large is the Labor Force in Area Code 520?
There are 1,134,057 People in the Labor Forcein in Area Code 520.
What is the Percentage of People in the Labor Force in Area Code 520?
53.4% of People are in the Labor Force in Area Code 520.
What is the Unemployment Rate in Area Code 520?
Unemployment Rate in Area Code 520 is 7.5%.