Area Code 401 Map & Demographics
Area Code 401 Map
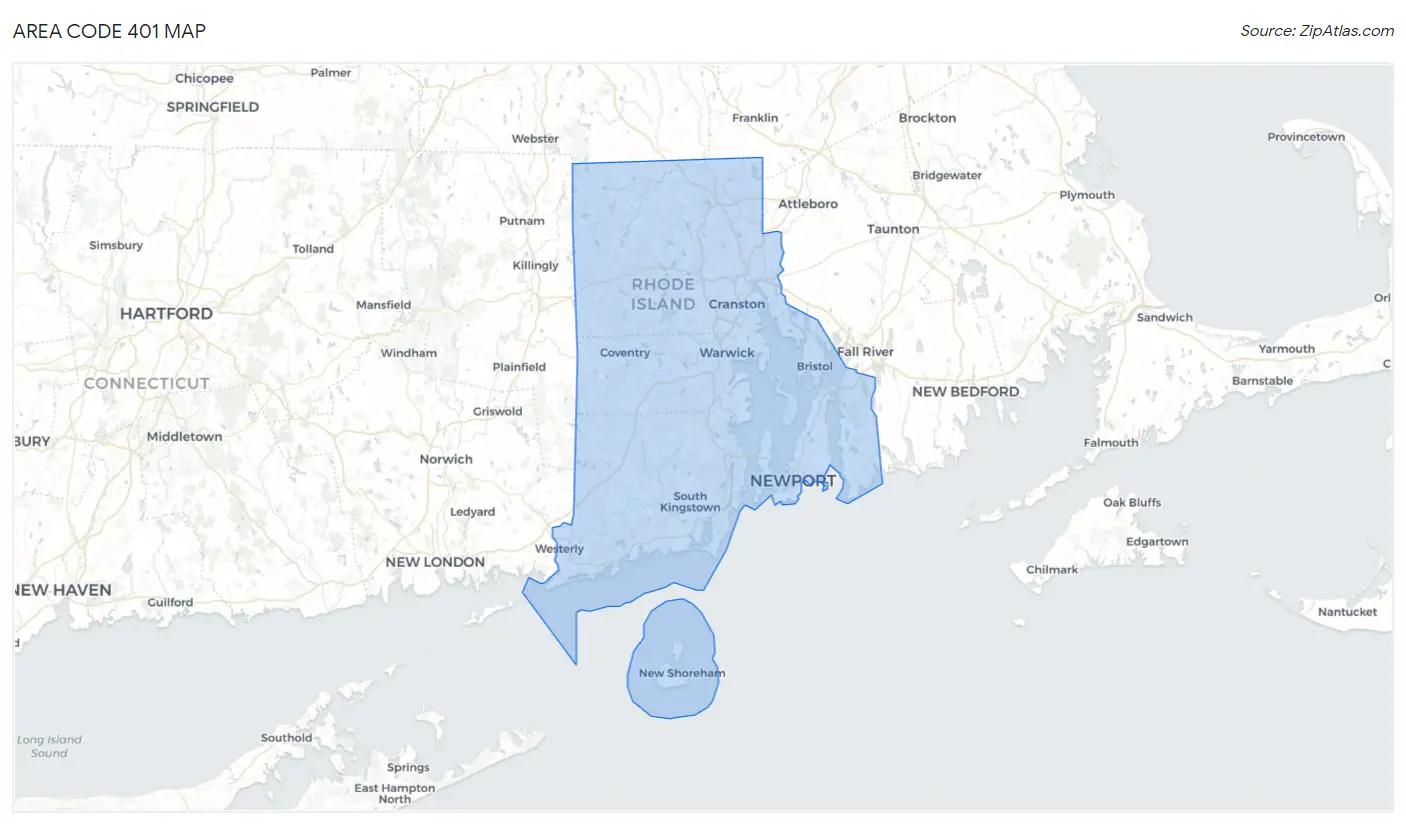
Area Code 401 Overview
$45,237
PER CAPITA INCOME
$111,793
AVG FAMILY INCOME
$92,091
AVG HOUSEHOLD INCOME
27.2%
WAGE / INCOME GAP [ % ]
72.8¢/ $1
WAGE / INCOME GAP [ $ ]
$9,672
FAMILY INCOME DEFICIT
30.75
INEQUALITY / GINI INDEX
1,094,278
TOTAL POPULATION
537,229
MALE POPULATION
557,049
FEMALE POPULATION
96.44
MALES / 100 FEMALES
103.69
FEMALES / 100 MALES
42.9
MEDIAN AGE
3.0
AVG FAMILY SIZE
2.4
AVG HOUSEHOLD SIZE
588,477
LABOR FORCE [ PEOPLE ]
64.5%
PERCENT IN LABOR FORCE
6.0%
UNEMPLOYMENT RATE
Income in Area Code 401
Income Overview in Area Code 401
Per Capita Income in Area Code 401 is $45,237, while median incomes of families and households are $111,793 and $92,091 respectively.
| Characteristic | Number | Measure |
| Per Capita Income | 1,094,278 | $45,237 |
| Median Family Income | 265,609 | $111,793 |
| Mean Family Income | 265,609 | $9,566,351 |
| Median Household Income | 432,239 | $92,091 |
| Mean Household Income | 432,239 | $8,483,614 |
| Income Deficit | 265,609 | $9,672 |
| Wage / Income Gap (%) | 1,094,278 | 27.23% |
| Wage / Income Gap ($) | 1,094,278 | 72.77¢ per $1 |
| Gini / Inequality Index | 1,094,278 | 30.75 |
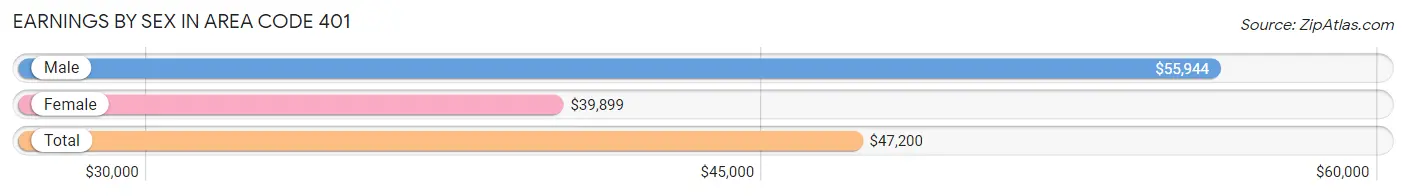
Earnings by Sex in Area Code 401
Average Earnings in Area Code 401 are $47,200, $55,944 for men and $39,899 for women, a difference of 28.7%.
| Sex | Number | Average Earnings |
| Male | 318,079 (51.3%) | $55,944 |
| Female | 301,329 (48.6%) | $39,899 |
| Total | 619,408 (100.0%) | $47,200 |
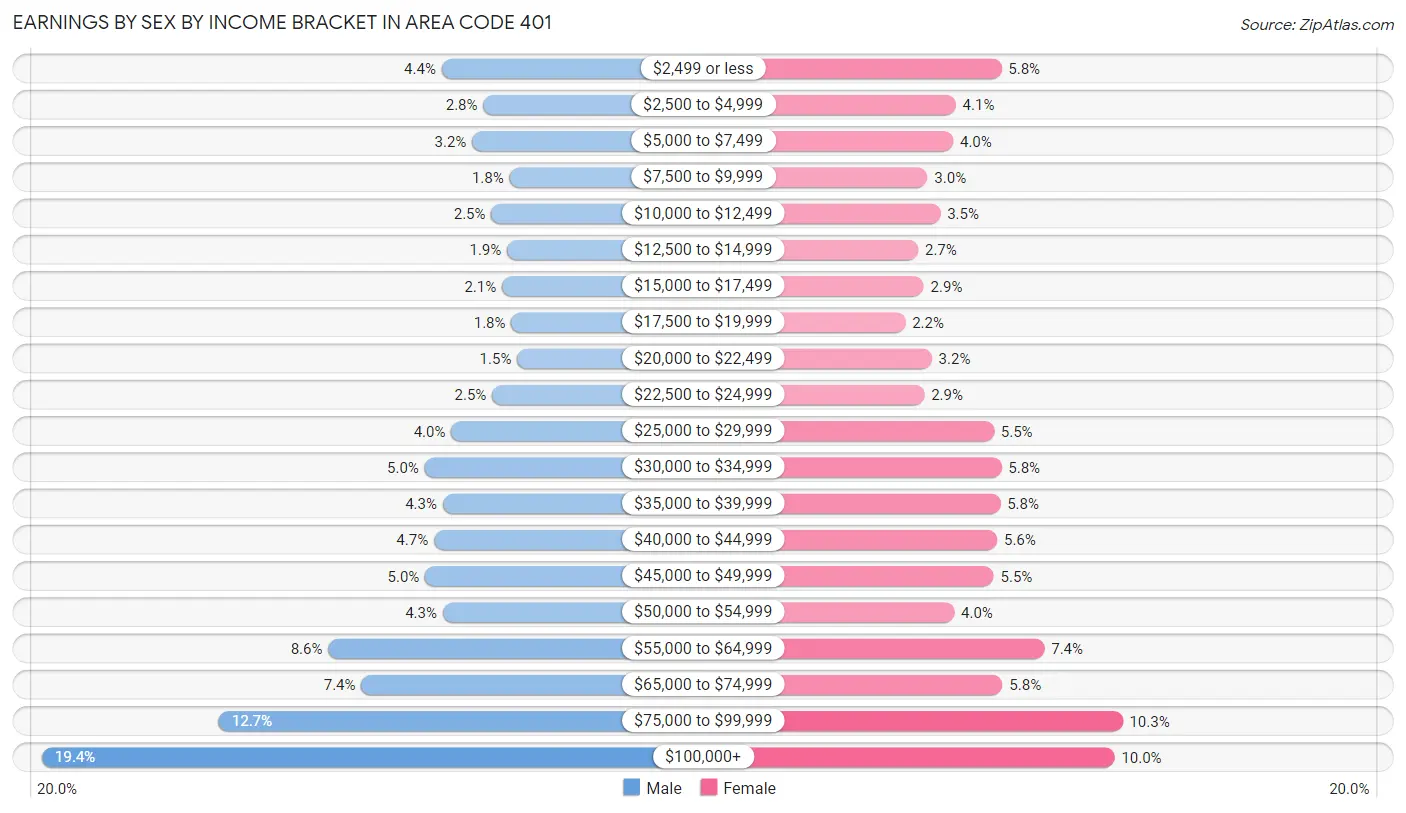
Earnings by Sex by Income Bracket in Area Code 401
The most common earnings brackets in Area Code 401 are $100,000+ for men (61,558 | 19.4%) and $75,000 to $99,999 for women (31,133 | 10.3%).
| Income | Male | Female |
| $2,499 or less | 13,912 (4.4%) | 17,461 (5.8%) |
| $2,500 to $4,999 | 8,944 (2.8%) | 12,309 (4.1%) |
| $5,000 to $7,499 | 10,286 (3.2%) | 11,982 (4.0%) |
| $7,500 to $9,999 | 5,827 (1.8%) | 9,113 (3.0%) |
| $10,000 to $12,499 | 7,995 (2.5%) | 10,543 (3.5%) |
| $12,500 to $14,999 | 6,111 (1.9%) | 8,060 (2.7%) |
| $15,000 to $17,499 | 6,709 (2.1%) | 8,689 (2.9%) |
| $17,500 to $19,999 | 5,596 (1.8%) | 6,605 (2.2%) |
| $20,000 to $22,499 | 4,910 (1.5%) | 9,574 (3.2%) |
| $22,500 to $24,999 | 7,879 (2.5%) | 8,745 (2.9%) |
| $25,000 to $29,999 | 12,762 (4.0%) | 16,601 (5.5%) |
| $30,000 to $34,999 | 15,950 (5.0%) | 17,432 (5.8%) |
| $35,000 to $39,999 | 13,774 (4.3%) | 17,328 (5.8%) |
| $40,000 to $44,999 | 14,830 (4.7%) | 16,961 (5.6%) |
| $45,000 to $49,999 | 15,882 (5.0%) | 16,586 (5.5%) |
| $50,000 to $54,999 | 13,784 (4.3%) | 12,121 (4.0%) |
| $55,000 to $64,999 | 27,419 (8.6%) | 22,285 (7.4%) |
| $65,000 to $74,999 | 23,476 (7.4%) | 17,575 (5.8%) |
| $75,000 to $99,999 | 40,475 (12.7%) | 31,133 (10.3%) |
| $100,000+ | 61,558 (19.4%) | 30,226 (10.0%) |
| Total | 318,079 (100.0%) | 301,329 (100.0%) |
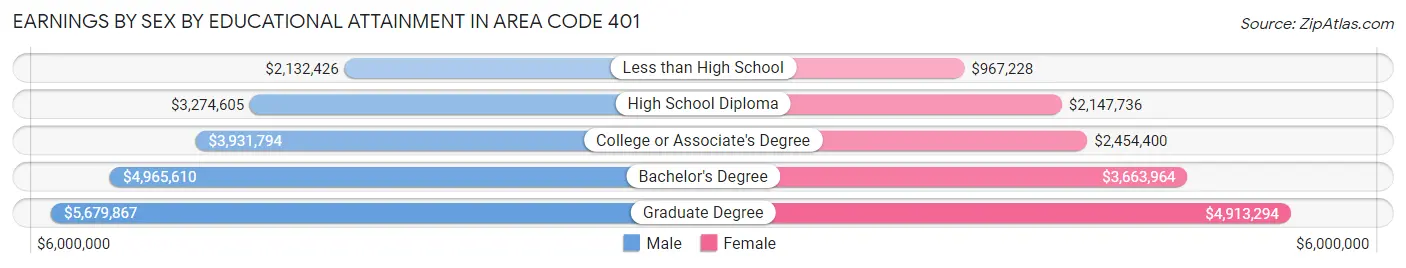
Earnings by Sex by Educational Attainment in Area Code 401
Average earnings in Area Code 401 are $4,825,705 for men and $3,272,144 for women, a difference of 32.2%. Men with an educational attainment of graduate degree enjoy the highest average annual earnings of $5,679,867, while those with less than high school education earn the least with $2,132,426. Women with an educational attainment of graduate degree earn the most with the average annual earnings of $4,913,294, while those with less than high school education have the smallest earnings of $967,228.
| Educational Attainment | Male Income | Female Income |
| Less than High School | $2,132,426 | $967,228 |
| High School Diploma | $3,274,605 | $2,147,736 |
| College or Associate's Degree | $3,931,794 | $2,454,400 |
| Bachelor's Degree | $4,965,610 | $3,663,964 |
| Graduate Degree | $5,679,867 | $4,913,294 |
| Total | $4,825,705 | $3,272,144 |
Family Income in Area Code 401
Family Income Brackets in Area Code 401
According to the Area Code 401 family income data, there are 4,972,466 families falling into the $100,000 to $149,999 income range, which is the most common income bracket and makes up 1,872.1% of all families. Conversely, the $10,000 to $14,999 income bracket is the least frequent group with only 245,954 families (92.6%) belonging to this category.
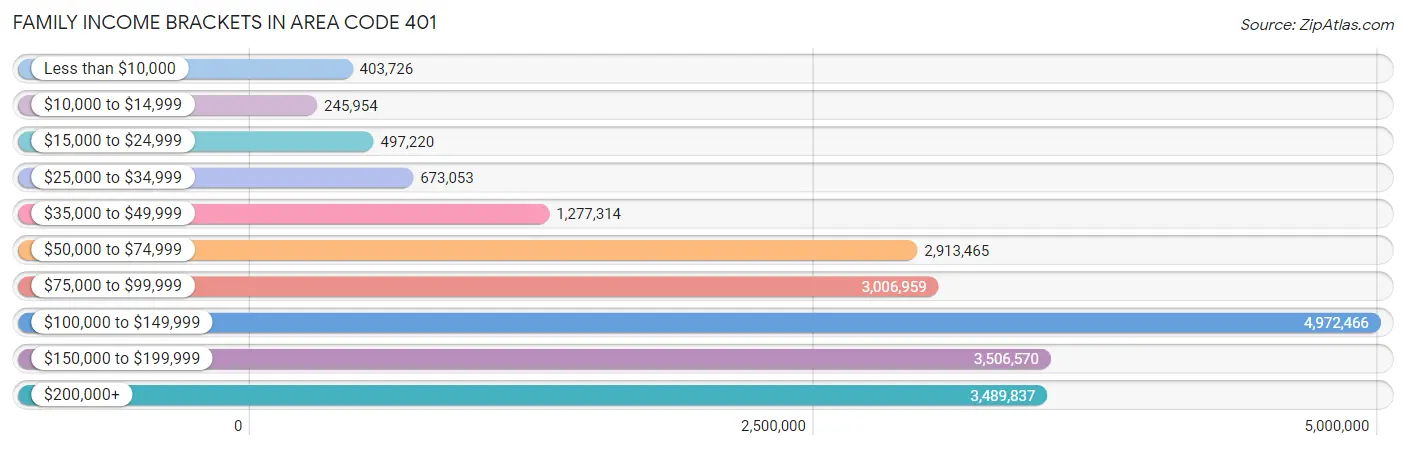
| Income Bracket | # Families | % Families |
| Less than $10,000 | 403,726 | 152.0% |
| $10,000 to $14,999 | 245,954 | 92.6% |
| $15,000 to $24,999 | 497,220 | 187.2% |
| $25,000 to $34,999 | 673,053 | 253.4% |
| $35,000 to $49,999 | 1,277,314 | 480.9% |
| $50,000 to $74,999 | 2,913,465 | 1,096.9% |
| $75,000 to $99,999 | 3,006,959 | 1,132.1% |
| $100,000 to $149,999 | 4,972,466 | 1,872.1% |
| $150,000 to $199,999 | 3,506,570 | 1,320.2% |
| $200,000+ | 3,489,837 | 1,313.9% |
Family Income by Famaliy Size in Area Code 401
6-person families (5,269 | 2.0%) account for the highest median family income in Area Code 401 with $156,846 per family, while 2-person families (127,300 | 47.9%) have the highest median income of $49,444 per family member.
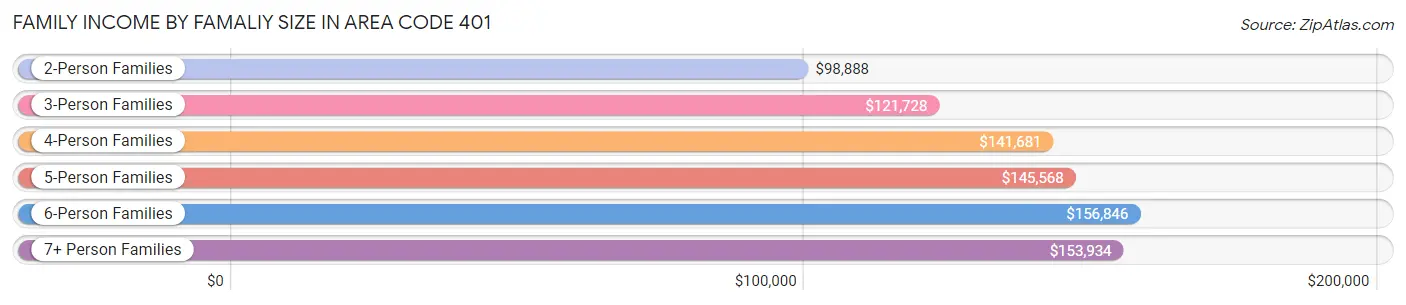
| Income Bracket | # Families | Median Income |
| 2-Person Families | 127,300 (47.9%) | $98,888 |
| 3-Person Families | 61,975 (23.3%) | $121,728 |
| 4-Person Families | 49,672 (18.7%) | $141,681 |
| 5-Person Families | 18,906 (7.1%) | $145,568 |
| 6-Person Families | 5,269 (2.0%) | $156,846 |
| 7+ Person Families | 2,487 (0.9%) | $153,934 |
| Total | 265,609 (100.0%) | $111,793 |
Family Income by Number of Earners in Area Code 401
The median family income in Area Code 401 is $111,793, with families comprising 3+ earners (36,108) having the highest median family income of $172,234, while families with no earners (35,840) have the lowest median family income of $62,043, accounting for 13.6% and 13.5% of families, respectively.
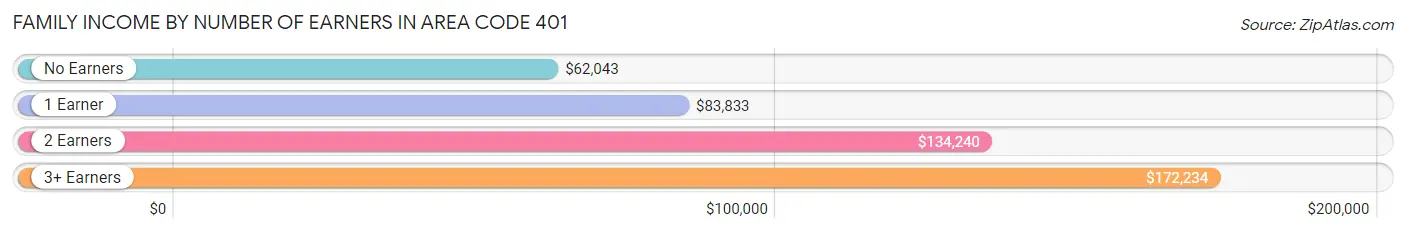
| Number of Earners | # Families | Median Income |
| No Earners | 35,840 (13.5%) | $62,043 |
| 1 Earner | 80,933 (30.5%) | $83,833 |
| 2 Earners | 112,728 (42.4%) | $134,240 |
| 3+ Earners | 36,108 (13.6%) | $172,234 |
| Total | 265,609 (100.0%) | $111,793 |
Household Income in Area Code 401
Household Income Brackets in Area Code 401
With 6,540,641 households falling in the category, the $100,000 to $149,999 income range is the most frequent in Area Code 401, accounting for 1,513.2% of all households. In contrast, only 1,087,513 households (251.6%) fall into the $10,000 to $14,999 income bracket, making it the least populous group.
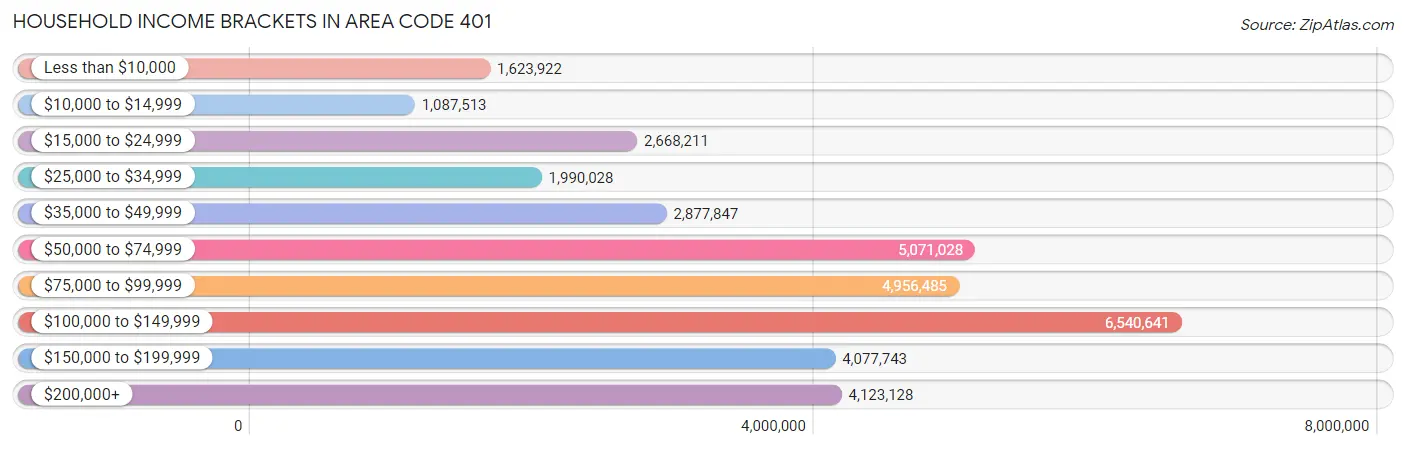
| Income Bracket | # Households | % Households |
| Less than $10,000 | 1,623,922 | 375.7% |
| $10,000 to $14,999 | 1,087,513 | 251.6% |
| $15,000 to $24,999 | 2,668,211 | 617.3% |
| $25,000 to $34,999 | 1,990,028 | 460.4% |
| $35,000 to $49,999 | 2,877,847 | 665.8% |
| $50,000 to $74,999 | 5,071,028 | 1,173.2% |
| $75,000 to $99,999 | 4,956,485 | 1,146.7% |
| $100,000 to $149,999 | 6,540,641 | 1,513.2% |
| $150,000 to $199,999 | 4,077,743 | 943.4% |
| $200,000+ | 4,123,128 | 953.9% |
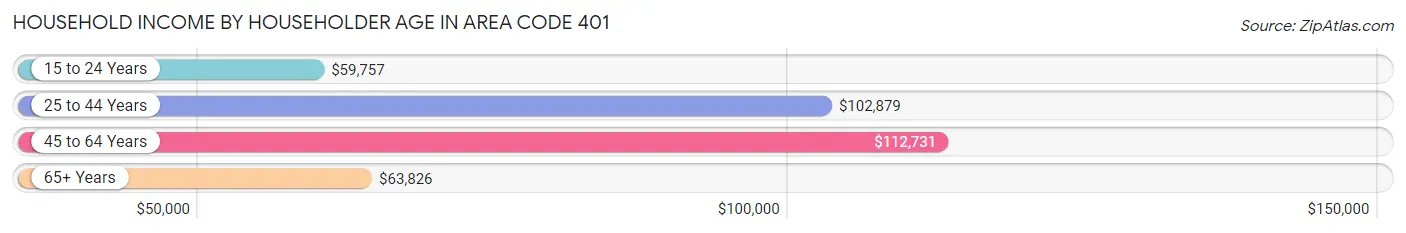
Household Income by Householder Age in Area Code 401
The median household income in Area Code 401 is $92,091, with the highest median household income of $112,731 found in the 45 to 64 years age bracket for the primary householder. A total of 167,582 households (38.8%) fall into this category. Meanwhile, the 15 to 24 years age bracket for the primary householder has the lowest median household income of $59,757, with 10,762 households (2.5%) in this group.
| Income Bracket | # Households | Median Income |
| 15 to 24 Years | 10,762 (2.5%) | $59,757 |
| 25 to 44 Years | 133,140 (30.8%) | $102,879 |
| 45 to 64 Years | 167,582 (38.8%) | $112,731 |
| 65+ Years | 120,755 (27.9%) | $63,826 |
| Total | 432,239 (100.0%) | $92,091 |
Poverty in Area Code 401
Income Below Poverty by Sex and Age in Area Code 401
With 10.1% poverty level for males and 12.3% for females among the residents of Area Code 401, under 5 year old males and 18 to 24 year old females are the most vulnerable to poverty, with 4,087 males (15.0%) and 8,586 females (19.6%) in their respective age groups living below the poverty level.
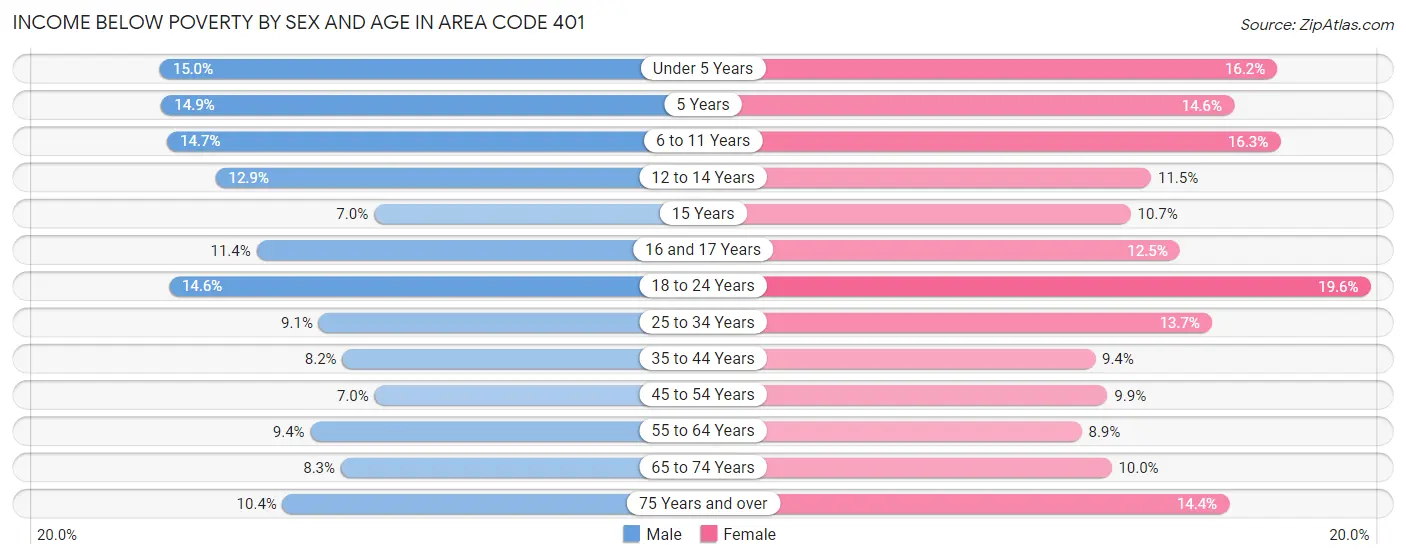
| Age Bracket | Male | Female |
| Under 5 Years | 4,087 (15.0%) | 4,205 (16.2%) |
| 5 Years | 799 (14.9%) | 843 (14.5%) |
| 6 to 11 Years | 5,055 (14.7%) | 5,233 (16.3%) |
| 12 to 14 Years | 2,403 (12.9%) | 1,994 (11.5%) |
| 15 Years | 410 (7.0%) | 607 (10.7%) |
| 16 and 17 Years | 1,567 (11.4%) | 1,571 (12.5%) |
| 18 to 24 Years | 6,514 (14.6%) | 8,586 (19.6%) |
| 25 to 34 Years | 6,953 (9.1%) | 10,105 (13.7%) |
| 35 to 44 Years | 5,450 (8.2%) | 6,161 (9.4%) |
| 45 to 54 Years | 4,731 (7.0%) | 6,795 (9.9%) |
| 55 to 64 Years | 6,935 (9.4%) | 6,995 (8.9%) |
| 65 to 74 Years | 4,330 (8.3%) | 5,863 (10.0%) |
| 75 Years and over | 3,154 (10.4%) | 6,687 (14.4%) |
| Total | 52,388 (10.1%) | 65,645 (12.3%) |
Income Above Poverty by Sex and Age in Area Code 401
According to the poverty statistics in Area Code 401, males aged 45 to 54 years and females aged 55 to 64 years are the age groups that are most secure financially, with 93.0% of males and 91.1% of females in these age groups living above the poverty line.
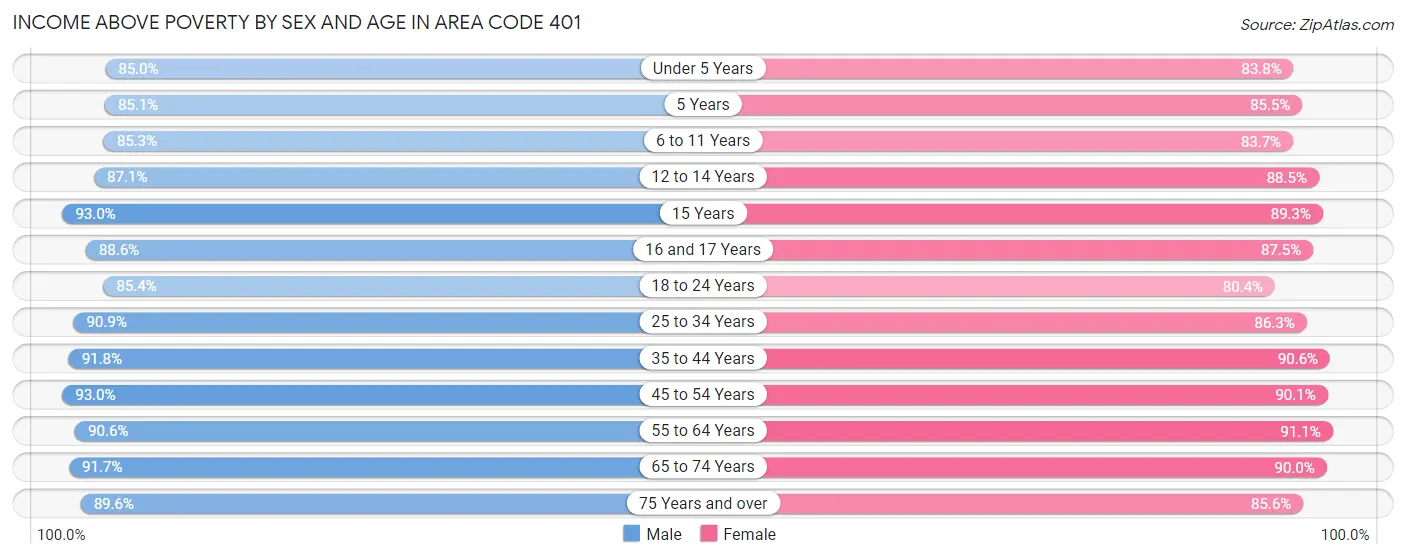
| Age Bracket | Male | Female |
| Under 5 Years | 23,205 (85.0%) | 21,809 (83.8%) |
| 5 Years | 4,557 (85.1%) | 4,950 (85.5%) |
| 6 to 11 Years | 29,300 (85.3%) | 26,928 (83.7%) |
| 12 to 14 Years | 16,215 (87.1%) | 15,376 (88.5%) |
| 15 Years | 5,424 (93.0%) | 5,055 (89.3%) |
| 16 and 17 Years | 12,191 (88.6%) | 10,952 (87.5%) |
| 18 to 24 Years | 37,975 (85.4%) | 35,174 (80.4%) |
| 25 to 34 Years | 69,631 (90.9%) | 63,505 (86.3%) |
| 35 to 44 Years | 61,043 (91.8%) | 59,356 (90.6%) |
| 45 to 54 Years | 62,726 (93.0%) | 62,103 (90.1%) |
| 55 to 64 Years | 66,946 (90.6%) | 71,643 (91.1%) |
| 65 to 74 Years | 48,063 (91.7%) | 52,700 (90.0%) |
| 75 Years and over | 27,120 (89.6%) | 39,837 (85.6%) |
| Total | 464,396 (89.9%) | 469,388 (87.7%) |
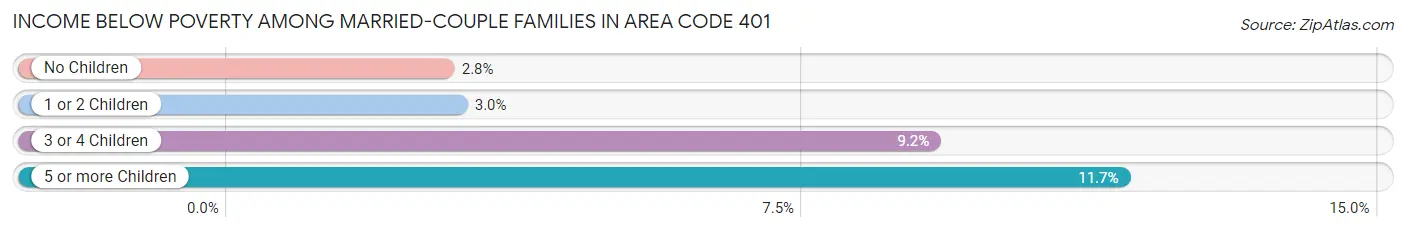
Income Below Poverty Among Married-Couple Families in Area Code 401
The poverty statistics for married-couple families in Area Code 401 show that 3.3% or 6,147 of the total 188,605 families live below the poverty line. Families with 5 or more children have the highest poverty rate of 11.7%, comprising of 48 families. On the other hand, families with no children have the lowest poverty rate of 2.8%, which includes 3,295 families.
| Children | Above Poverty | Below Poverty |
| No Children | 113,039 (97.2%) | 3,295 (2.8%) |
| 1 or 2 Children | 59,503 (97.0%) | 1,839 (3.0%) |
| 3 or 4 Children | 9,552 (90.8%) | 965 (9.2%) |
| 5 or more Children | 364 (88.3%) | 48 (11.7%) |
| Total | 182,458 (96.7%) | 6,147 (3.3%) |
Income Below Poverty Among Single-Parent Households in Area Code 401
According to the poverty data in Area Code 401, 12.1% or 2,716 single-father households and 18.9% or 10,333 single-mother households are living below the poverty line. Among single-father households, those with 3 or 4 children have the highest poverty rate, with 601 households (36.9%) experiencing poverty. Likewise, among single-mother households, those with 5 or more children have the highest poverty rate, with 102 households (57.0%) falling below the poverty line.
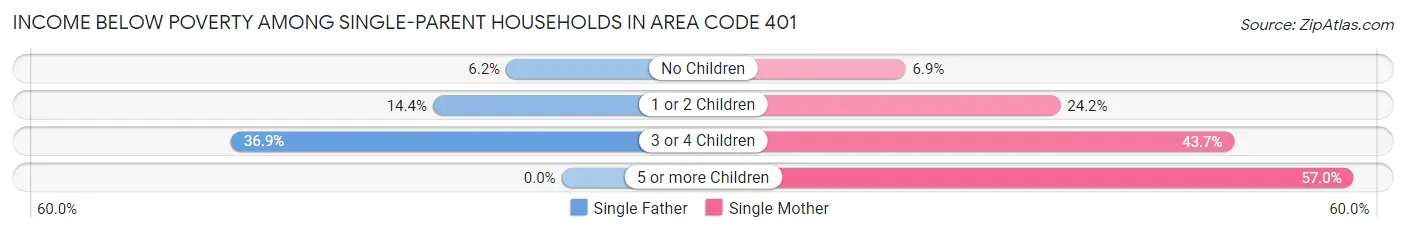
| Children | Single Father | Single Mother |
| No Children | 658 (6.2%) | 1,550 (6.9%) |
| 1 or 2 Children | 1,457 (14.4%) | 6,626 (24.2%) |
| 3 or 4 Children | 601 (36.9%) | 2,055 (43.6%) |
| 5 or more Children | 0 (0.0%) | 102 (57.0%) |
| Total | 2,716 (12.1%) | 10,333 (18.9%) |
Income Below Poverty Among Married-Couple vs Single-Parent Households in Area Code 401
The poverty data for Area Code 401 shows that 6,147 of the married-couple family households (3.3%) and 13,049 of the single-parent households (17.0%) are living below the poverty level. Within the married-couple family households, those with 5 or more children have the highest poverty rate, with 48 households (11.7%) falling below the poverty line. Among the single-parent households, those with 5 or more children have the highest poverty rate, with 102 household (57.0%) living below poverty.
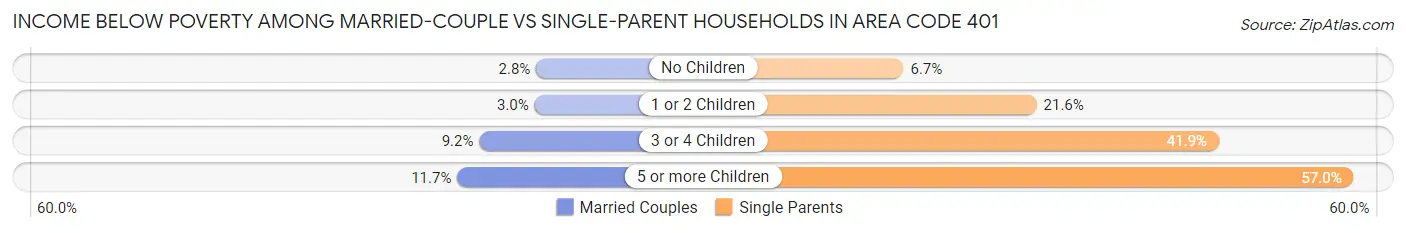
| Children | Married-Couple Families | Single-Parent Households |
| No Children | 3,295 (2.8%) | 2,208 (6.7%) |
| 1 or 2 Children | 1,839 (3.0%) | 8,083 (21.6%) |
| 3 or 4 Children | 965 (9.2%) | 2,656 (41.9%) |
| 5 or more Children | 48 (11.7%) | 102 (57.0%) |
| Total | 6,147 (3.3%) | 13,049 (17.0%) |
Race in Area Code 401
The most populous races in Area Code 401 are White / Caucasian (816,336 | 74.6%), Hispanic or Latino (183,196 | 16.7%), and Two or more Races (91,944 | 8.4%).
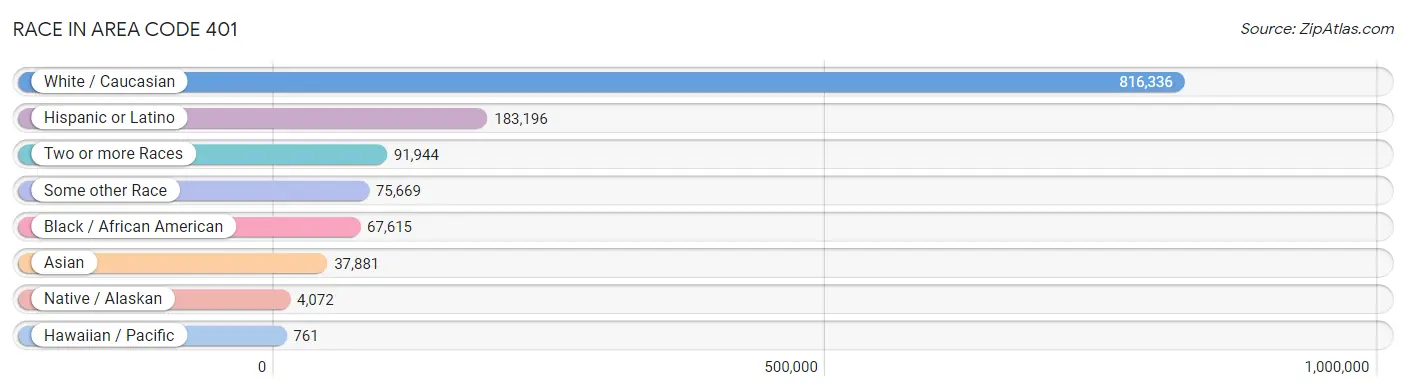
| Race | # Population | % Population |
| Asian | 37,881 | 3.5% |
| Black / African American | 67,615 | 6.2% |
| Hawaiian / Pacific | 761 | 0.1% |
| Hispanic or Latino | 183,196 | 16.7% |
| Native / Alaskan | 4,072 | 0.4% |
| White / Caucasian | 816,336 | 74.6% |
| Two or more Races | 91,944 | 8.4% |
| Some other Race | 75,669 | 6.9% |
| Total | 1,094,278 | 100.0% |
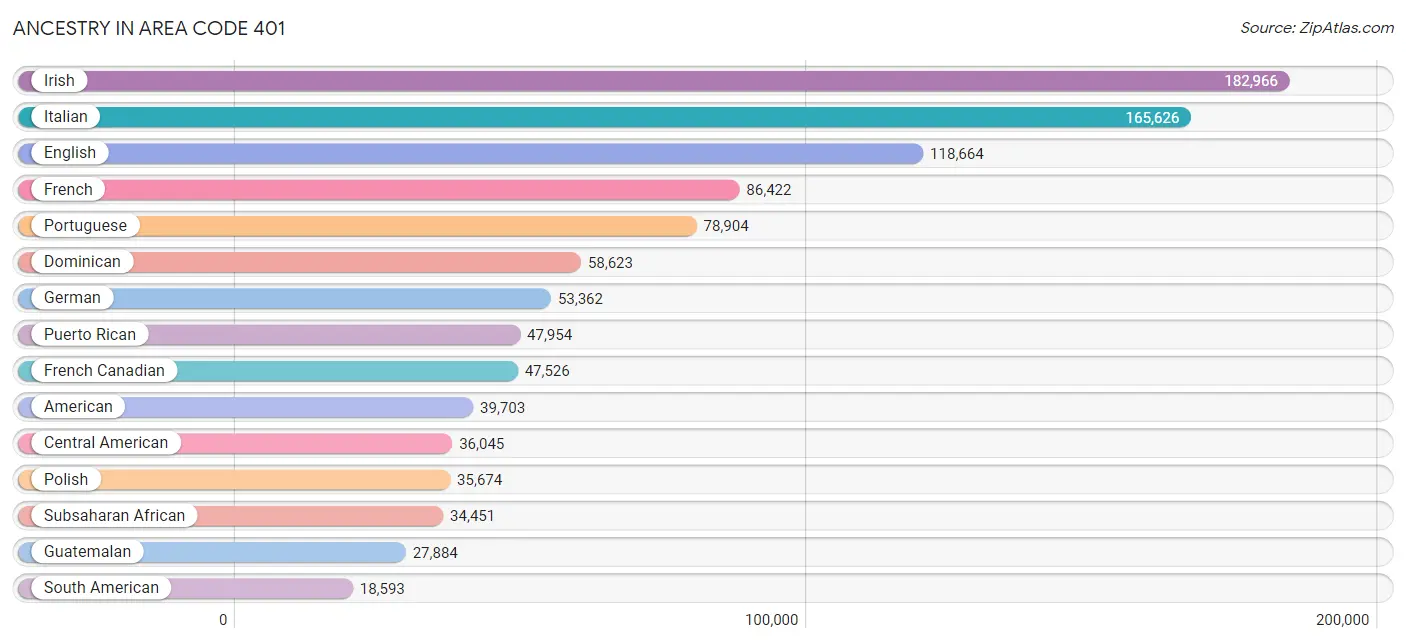
Ancestry in Area Code 401
The most populous ancestries reported in Area Code 401 are Irish (182,966 | 16.7%), Italian (165,626 | 15.1%), English (118,664 | 10.8%), French (86,422 | 7.9%), and Portuguese (78,904 | 7.2%), together accounting for 57.8% of all Area Code 401 residents.
| Ancestry | # Population | % Population |
| Afghan | 4 | 0.0% |
| African | 6,269 | 0.6% |
| Albanian | 756 | 0.1% |
| Alsatian | 31 | 0.0% |
| American | 39,703 | 3.6% |
| Apache | 64 | 0.0% |
| Arab | 9,304 | 0.9% |
| Arapaho | 10 | 0.0% |
| Argentinean | 638 | 0.1% |
| Armenian | 5,056 | 0.5% |
| Assyrian / Chaldean / Syriac | 267 | 0.0% |
| Australian | 208 | 0.0% |
| Austrian | 1,701 | 0.2% |
| Bahamian | 13 | 0.0% |
| Bangladeshi | 900 | 0.1% |
| Barbadian | 276 | 0.0% |
| Basque | 113 | 0.0% |
| Belgian | 1,081 | 0.1% |
| Belizean | 114 | 0.0% |
| Bermudan | 72 | 0.0% |
| Bhutanese | 2,622 | 0.2% |
| Blackfeet | 401 | 0.0% |
| Bolivian | 1,849 | 0.2% |
| Brazilian | 2,395 | 0.2% |
| British | 4,666 | 0.4% |
| British West Indian | 260 | 0.0% |
| Bulgarian | 139 | 0.0% |
| Burmese | 3,072 | 0.3% |
| Cajun | 91 | 0.0% |
| Cambodian | 15 | 0.0% |
| Canadian | 3,407 | 0.3% |
| Cape Verdean | 18,154 | 1.7% |
| Carpatho Rusyn | 133 | 0.0% |
| Celtic | 71 | 0.0% |
| Central American | 36,045 | 3.3% |
| Central American Indian | 2,811 | 0.3% |
| Cherokee | 1,150 | 0.1% |
| Cheyenne | 48 | 0.0% |
| Chilean | 328 | 0.0% |
| Chinese | 25 | 0.0% |
| Chippewa | 135 | 0.0% |
| Choctaw | 119 | 0.0% |
| Colombian | 11,637 | 1.1% |
| Costa Rican | 587 | 0.1% |
| Cree | 22 | 0.0% |
| Creek | 110 | 0.0% |
| Croatian | 493 | 0.1% |
| Crow | 23 | 0.0% |
| Cuban | 2,045 | 0.2% |
| Cypriot | 57 | 0.0% |
| Czech | 1,642 | 0.2% |
| Czechoslovakian | 397 | 0.0% |
| Danish | 1,334 | 0.1% |
| Delaware | 16 | 0.0% |
| Dominican | 58,623 | 5.4% |
| Dutch | 4,555 | 0.4% |
| Dutch West Indian | 38 | 0.0% |
| Eastern European | 4,058 | 0.4% |
| Ecuadorian | 1,750 | 0.2% |
| Egyptian | 1,105 | 0.1% |
| English | 118,664 | 10.8% |
| Estonian | 52 | 0.0% |
| Ethiopian | 58 | 0.0% |
| European | 9,016 | 0.8% |
| Filipino | 828 | 0.1% |
| Finnish | 1,218 | 0.1% |
| French | 86,422 | 7.9% |
| French American Indian | 323 | 0.0% |
| French Canadian | 47,526 | 4.3% |
| German | 53,362 | 4.9% |
| German Russian | 17 | 0.0% |
| Ghanaian | 140 | 0.0% |
| Greek | 7,229 | 0.7% |
| Guamanian / Chamorro | 49 | 0.0% |
| Guatemalan | 27,884 | 2.5% |
| Guyanese | 427 | 0.0% |
| Haitian | 4,855 | 0.4% |
| Honduran | 1,886 | 0.2% |
| Hungarian | 2,114 | 0.2% |
| Icelander | 89 | 0.0% |
| Indian (Asian) | 9,292 | 0.9% |
| Indonesian | 145 | 0.0% |
| Iranian | 291 | 0.0% |
| Iraqi | 129 | 0.0% |
| Irish | 182,966 | 16.7% |
| Iroquois | 418 | 0.0% |
| Israeli | 195 | 0.0% |
| Italian | 165,626 | 15.1% |
| Jamaican | 2,271 | 0.2% |
| Japanese | 6,731 | 0.6% |
| Jordanian | 177 | 0.0% |
| Kenyan | 90 | 0.0% |
| Korean | 5,961 | 0.5% |
| Laotian | 220 | 0.0% |
| Latvian | 255 | 0.0% |
| Lebanese | 3,564 | 0.3% |
| Liberian | 3,646 | 0.3% |
| Lithuanian | 3,403 | 0.3% |
| Lumbee | 25 | 0.0% |
| Luxembourger | 43 | 0.0% |
| Macedonian | 107 | 0.0% |
| Malaysian | 3,101 | 0.3% |
| Maltese | 76 | 0.0% |
| Menominee | 9 | 0.0% |
| Mexican | 11,441 | 1.1% |
| Mexican American Indian | 548 | 0.1% |
| Mongolian | 103 | 0.0% |
| Moroccan | 576 | 0.1% |
| Native Hawaiian | 636 | 0.1% |
| Navajo | 138 | 0.0% |
| New Zealander | 35 | 0.0% |
| Nicaraguan | 536 | 0.1% |
| Nigerian | 4,462 | 0.4% |
| Northern European | 758 | 0.1% |
| Norwegian | 3,896 | 0.4% |
| Okinawan | 44 | 0.0% |
| Ottawa | 2 | 0.0% |
| Pakistani | 909 | 0.1% |
| Palestinian | 246 | 0.0% |
| Panamanian | 857 | 0.1% |
| Pennsylvania German | 135 | 0.0% |
| Peruvian | 1,173 | 0.1% |
| Polish | 35,674 | 3.3% |
| Portuguese | 78,904 | 7.2% |
| Pueblo | 32 | 0.0% |
| Puerto Rican | 47,954 | 4.4% |
| Romanian | 1,029 | 0.1% |
| Russian | 8,617 | 0.8% |
| Salvadoran | 4,148 | 0.4% |
| Samoan | 213 | 0.0% |
| Scandinavian | 1,674 | 0.2% |
| Scotch-Irish | 4,505 | 0.4% |
| Scottish | 16,923 | 1.5% |
| Seminole | 259 | 0.0% |
| Senegalese | 536 | 0.1% |
| Serbian | 96 | 0.0% |
| Shoshone | 11 | 0.0% |
| Sierra Leonean | 154 | 0.0% |
| Sioux | 63 | 0.0% |
| Slavic | 110 | 0.0% |
| Slovak | 878 | 0.1% |
| Slovene | 72 | 0.0% |
| Somali | 15 | 0.0% |
| South African | 124 | 0.0% |
| South American | 18,593 | 1.7% |
| South American Indian | 316 | 0.0% |
| Soviet Union | 7 | 0.0% |
| Spaniard | 1,714 | 0.2% |
| Spanish | 1,507 | 0.1% |
| Spanish American Indian | 26 | 0.0% |
| Sri Lankan | 1,452 | 0.1% |
| Subsaharan African | 34,451 | 3.2% |
| Swedish | 14,736 | 1.3% |
| Swiss | 1,067 | 0.1% |
| Syrian | 2,157 | 0.2% |
| Thai | 10,147 | 0.9% |
| Tohono O'Odham | 6 | 0.0% |
| Trinidadian and Tobagonian | 499 | 0.1% |
| Turkish | 451 | 0.0% |
| Ukrainian | 2,984 | 0.3% |
| Uruguayan | 90 | 0.0% |
| Venezuelan | 1,071 | 0.1% |
| Vietnamese | 278 | 0.0% |
| Welsh | 3,329 | 0.3% |
| West Indian | 753 | 0.1% |
| Yaqui | 14 | 0.0% |
| Yugoslavian | 43 | 0.0% |
| Zimbabwean | 8 | 0.0% | View All 168 Rows |
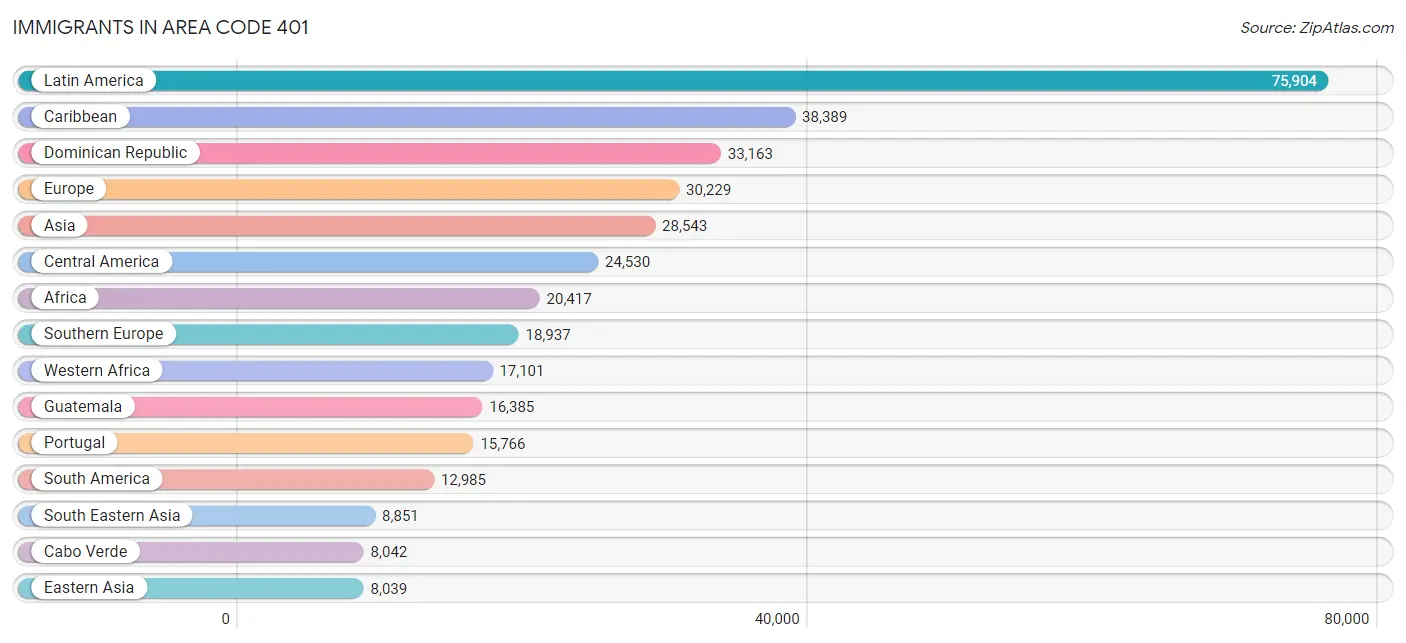
Immigrants in Area Code 401
The most numerous immigrant groups reported in Area Code 401 came from Latin America (75,904 | 6.9%), Caribbean (38,389 | 3.5%), Dominican Republic (33,163 | 3.0%), Europe (30,229 | 2.8%), and Asia (28,543 | 2.6%), together accounting for 18.9% of all Area Code 401 residents.
| Immigration Origin | # Population | % Population |
| Africa | 20,417 | 1.9% |
| Albania | 336 | 0.0% |
| Argentina | 283 | 0.0% |
| Armenia | 147 | 0.0% |
| Asia | 28,543 | 2.6% |
| Australia | 135 | 0.0% |
| Austria | 110 | 0.0% |
| Azores | 3,822 | 0.4% |
| Bangladesh | 84 | 0.0% |
| Barbados | 118 | 0.0% |
| Belarus | 262 | 0.0% |
| Belgium | 77 | 0.0% |
| Belize | 21 | 0.0% |
| Bolivia | 821 | 0.1% |
| Bosnia and Herzegovina | 52 | 0.0% |
| Brazil | 2,826 | 0.3% |
| Bulgaria | 137 | 0.0% |
| Cabo Verde | 8,042 | 0.7% |
| Cambodia | 1,902 | 0.2% |
| Cameroon | 40 | 0.0% |
| Canada | 2,304 | 0.2% |
| Caribbean | 38,389 | 3.5% |
| Central America | 24,530 | 2.2% |
| Chile | 114 | 0.0% |
| China | 5,954 | 0.5% |
| Colombia | 6,520 | 0.6% |
| Costa Rica | 79 | 0.0% |
| Croatia | 33 | 0.0% |
| Cuba | 406 | 0.0% |
| Czechoslovakia | 137 | 0.0% |
| Denmark | 130 | 0.0% |
| Dominica | 131 | 0.0% |
| Dominican Republic | 33,163 | 3.0% |
| Eastern Africa | 583 | 0.1% |
| Eastern Asia | 8,039 | 0.7% |
| Eastern Europe | 4,947 | 0.4% |
| Ecuador | 793 | 0.1% |
| Egypt | 505 | 0.1% |
| El Salvador | 2,654 | 0.2% |
| England | 1,051 | 0.1% |
| Eritrea | 39 | 0.0% |
| Ethiopia | 25 | 0.0% |
| Europe | 30,229 | 2.8% |
| Fiji | 135 | 0.0% |
| France | 630 | 0.1% |
| Germany | 1,314 | 0.1% |
| Ghana | 332 | 0.0% |
| Greece | 603 | 0.1% |
| Guatemala | 16,385 | 1.5% |
| Guyana | 175 | 0.0% |
| Haiti | 3,057 | 0.3% |
| Honduras | 1,059 | 0.1% |
| Hong Kong | 712 | 0.1% |
| Hungary | 241 | 0.0% |
| India | 6,461 | 0.6% |
| Indonesia | 138 | 0.0% |
| Iran | 213 | 0.0% |
| Iraq | 332 | 0.0% |
| Ireland | 637 | 0.1% |
| Israel | 225 | 0.0% |
| Italy | 2,155 | 0.2% |
| Jamaica | 848 | 0.1% |
| Japan | 734 | 0.1% |
| Jordan | 127 | 0.0% |
| Kazakhstan | 96 | 0.0% |
| Kenya | 134 | 0.0% |
| Korea | 1,351 | 0.1% |
| Kuwait | 26 | 0.0% |
| Laos | 2,091 | 0.2% |
| Latin America | 75,904 | 6.9% |
| Latvia | 57 | 0.0% |
| Lebanon | 847 | 0.1% |
| Liberia | 3,901 | 0.4% |
| Lithuania | 71 | 0.0% |
| Malaysia | 113 | 0.0% |
| Mexico | 3,836 | 0.4% |
| Middle Africa | 359 | 0.0% |
| Moldova | 64 | 0.0% |
| Morocco | 311 | 0.0% |
| Nepal | 76 | 0.0% |
| Netherlands | 405 | 0.0% |
| Nicaragua | 192 | 0.0% |
| Nigeria | 2,997 | 0.3% |
| North Macedonia | 35 | 0.0% |
| Northern Africa | 899 | 0.1% |
| Northern Europe | 3,635 | 0.3% |
| Norway | 126 | 0.0% |
| Oceania | 309 | 0.0% |
| Pakistan | 790 | 0.1% |
| Panama | 304 | 0.0% |
| Peru | 556 | 0.1% |
| Philippines | 2,625 | 0.2% |
| Poland | 1,070 | 0.1% |
| Portugal | 15,766 | 1.4% |
| Romania | 303 | 0.0% |
| Russia | 1,165 | 0.1% |
| Saudi Arabia | 33 | 0.0% |
| Scotland | 453 | 0.0% |
| Senegal | 895 | 0.1% |
| Serbia | 74 | 0.0% |
| Sierra Leone | 172 | 0.0% |
| Singapore | 197 | 0.0% |
| South Africa | 115 | 0.0% |
| South America | 12,985 | 1.2% |
| South Central Asia | 7,926 | 0.7% |
| South Eastern Asia | 8,851 | 0.8% |
| Southern Europe | 18,937 | 1.7% |
| Spain | 399 | 0.0% |
| Sri Lanka | 59 | 0.0% |
| Sweden | 150 | 0.0% |
| Switzerland | 107 | 0.0% |
| Syria | 901 | 0.1% |
| Taiwan | 453 | 0.0% |
| Thailand | 954 | 0.1% |
| Trinidad and Tobago | 554 | 0.1% |
| Turkey | 478 | 0.0% |
| Ukraine | 769 | 0.1% |
| Uruguay | 52 | 0.0% |
| Uzbekistan | 147 | 0.0% |
| Venezuela | 756 | 0.1% |
| Vietnam | 714 | 0.1% |
| West Indies | 5 | 0.0% |
| Western Africa | 17,101 | 1.6% |
| Western Asia | 3,646 | 0.3% |
| Western Europe | 2,659 | 0.2% |
| Zaire | 44 | 0.0% |
| Zimbabwe | 25 | 0.0% | View All 127 Rows |
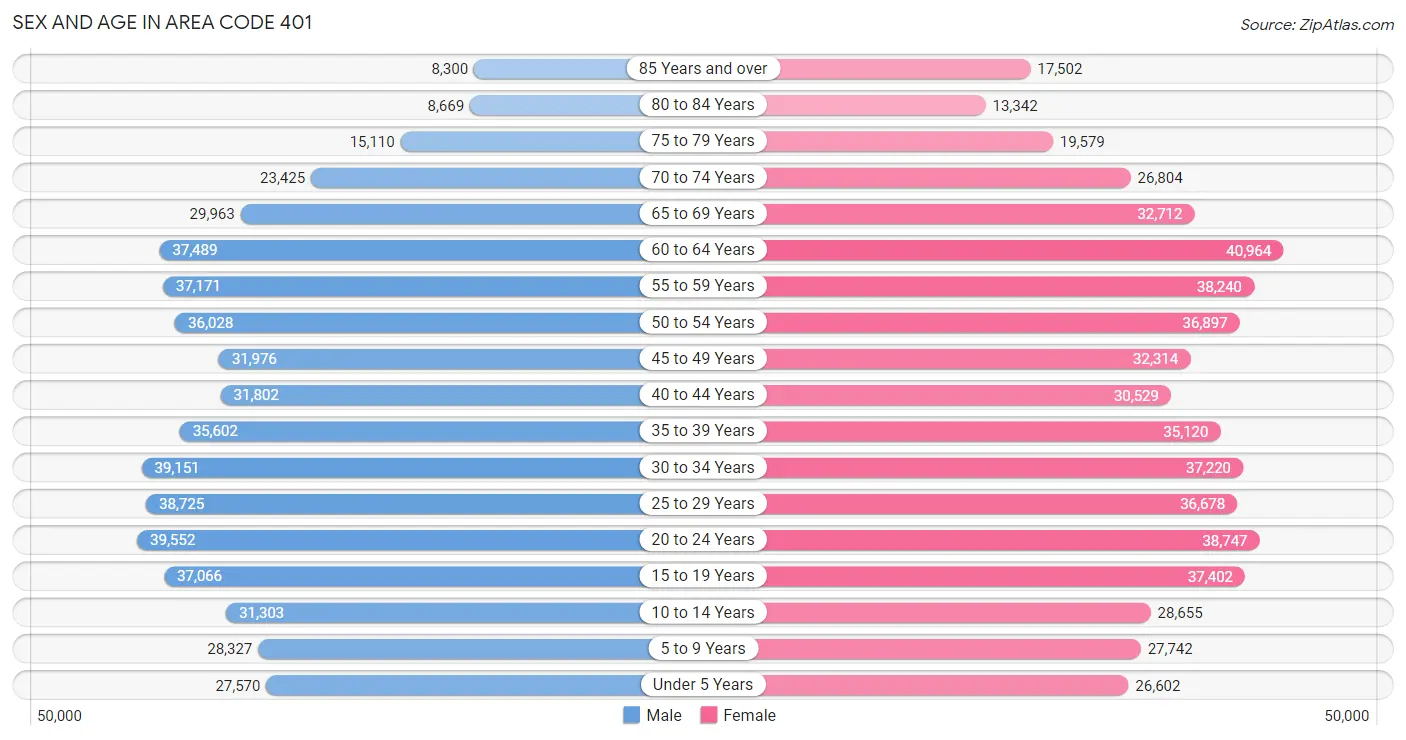
Sex and Age in Area Code 401
Sex and Age in Area Code 401
The most populous age groups in Area Code 401 are 20 to 24 Years (39,552 | 7.4%) for men and 60 to 64 Years (40,964 | 7.3%) for women.
| Age Bracket | Male | Female |
| Under 5 Years | 27,570 (5.1%) | 26,602 (4.8%) |
| 5 to 9 Years | 28,327 (5.3%) | 27,742 (5.0%) |
| 10 to 14 Years | 31,303 (5.8%) | 28,655 (5.1%) |
| 15 to 19 Years | 37,066 (6.9%) | 37,402 (6.7%) |
| 20 to 24 Years | 39,552 (7.4%) | 38,747 (7.0%) |
| 25 to 29 Years | 38,725 (7.2%) | 36,678 (6.6%) |
| 30 to 34 Years | 39,151 (7.3%) | 37,220 (6.7%) |
| 35 to 39 Years | 35,602 (6.6%) | 35,120 (6.3%) |
| 40 to 44 Years | 31,802 (5.9%) | 30,529 (5.5%) |
| 45 to 49 Years | 31,976 (5.9%) | 32,314 (5.8%) |
| 50 to 54 Years | 36,028 (6.7%) | 36,897 (6.6%) |
| 55 to 59 Years | 37,171 (6.9%) | 38,240 (6.9%) |
| 60 to 64 Years | 37,489 (7.0%) | 40,964 (7.3%) |
| 65 to 69 Years | 29,963 (5.6%) | 32,712 (5.9%) |
| 70 to 74 Years | 23,425 (4.4%) | 26,804 (4.8%) |
| 75 to 79 Years | 15,110 (2.8%) | 19,579 (3.5%) |
| 80 to 84 Years | 8,669 (1.6%) | 13,342 (2.4%) |
| 85 Years and over | 8,300 (1.5%) | 17,502 (3.1%) |
| Total | 537,229 (100.0%) | 557,049 (100.0%) |
Families and Households in Area Code 401
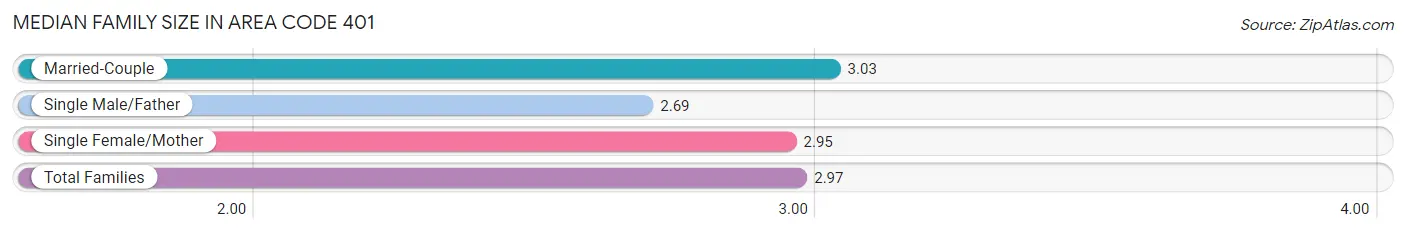
Median Family Size in Area Code 401
The median family size in Area Code 401 is 2.97 persons per family, with married-couple families (188,605 | 71.0%) accounting for the largest median family size of 3.02582 persons per family. On the other hand, single male/father families (22,355 | 8.4%) represent the smallest median family size with 2.69 persons per family.
| Family Type | # Families | Family Size |
| Married-Couple | 188,605 (71.0%) | 3.03 |
| Single Male/Father | 22,355 (8.4%) | 2.69 |
| Single Female/Mother | 54,649 (20.6%) | 2.95 |
| Total Families | 265,609 (100.0%) | 2.97 |
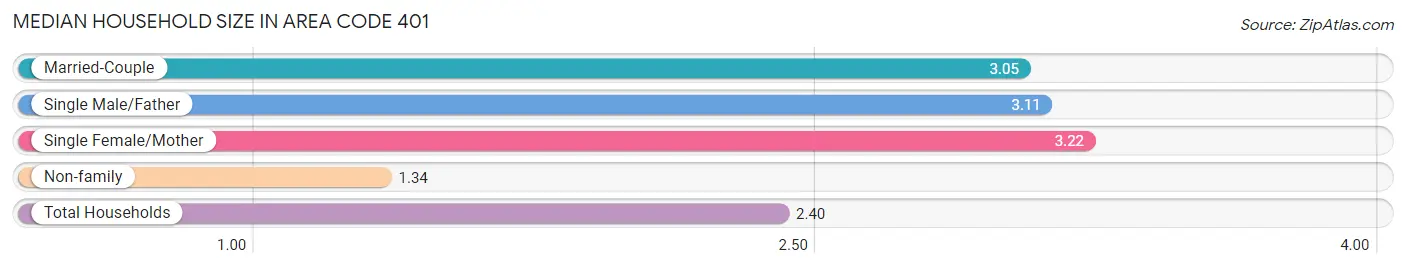
Median Household Size in Area Code 401
The median household size in Area Code 401 is 2.40 persons per household, with single female/mother households (54,649 | 12.6%) accounting for the largest median household size of 3.22151 persons per household. non-family households (166,630 | 38.6%) represent the smallest median household size with 1.34 persons per household.
| Household Type | # Households | Household Size |
| Married-Couple | 188,605 (43.6%) | 3.05 |
| Single Male/Father | 22,355 (5.2%) | 3.11 |
| Single Female/Mother | 54,649 (12.6%) | 3.22 |
| Non-family | 166,630 (38.6%) | 1.34 |
| Total Households | 432,239 (100.0%) | 2.40 |
Household Size by Marriage Status in Area Code 401
Out of a total of 432,239 households in Area Code 401, 265,609 (61.5%) are family households, while 166,630 (38.6%) are nonfamily households. The most numerous type of family households are 2-person households, comprising 117,537, and the most common type of nonfamily households are 1-person households, comprising 131,636.
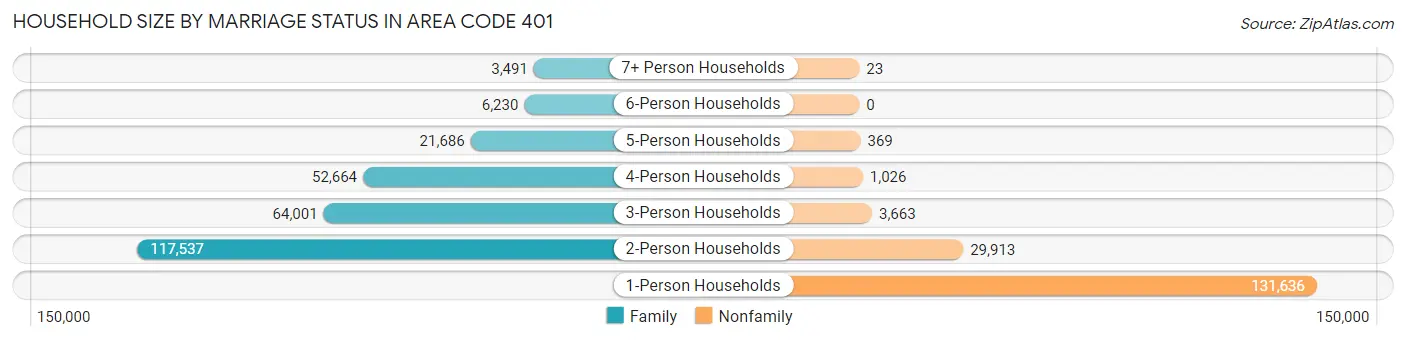
| Household Size | Family Households | Nonfamily Households |
| 1-Person Households | - | 131,636 (30.4%) |
| 2-Person Households | 117,537 (27.2%) | 29,913 (6.9%) |
| 3-Person Households | 64,001 (14.8%) | 3,663 (0.9%) |
| 4-Person Households | 52,664 (12.2%) | 1,026 (0.2%) |
| 5-Person Households | 21,686 (5.0%) | 369 (0.1%) |
| 6-Person Households | 6,230 (1.4%) | 0 (0.0%) |
| 7+ Person Households | 3,491 (0.8%) | 23 (0.0%) |
| Total | 265,609 (61.5%) | 166,630 (38.6%) |
Female Fertility in Area Code 401
Fertility by Age in Area Code 401
Average fertility rate in Area Code 401 is 56.3 births per 1,000 women. Women in the age bracket of 20 to 34 years have the highest fertility rate with 98.5 births per 1,000 women. Women in the age bracket of 20 to 34 years acount for 66.5% of all women with births.
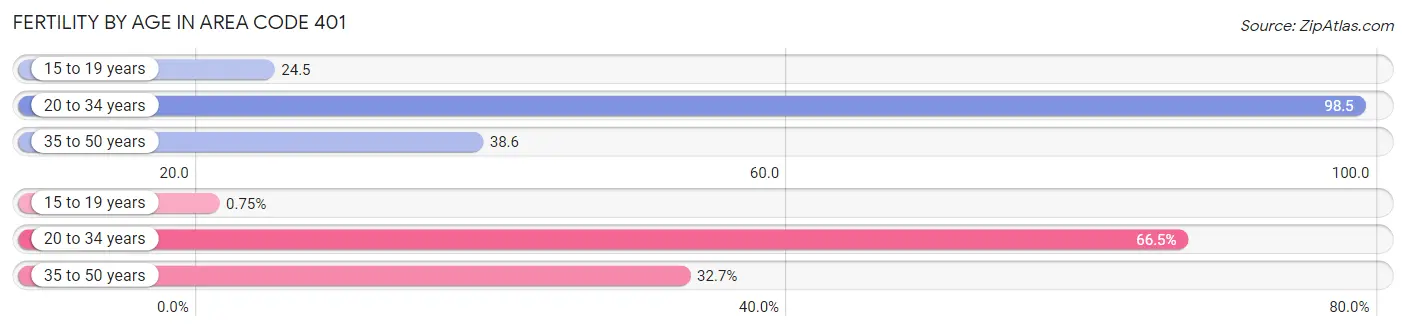
| Age Bracket | Women with Births | Births / 1,000 Women |
| 15 to 19 years | 88 (0.7%) | 24.5 |
| 20 to 34 years | 7,845 (66.5%) | 98.5 |
| 35 to 50 years | 3,858 (32.7%) | 38.6 |
| Total | 11,791 (100.0%) | 56.3 |
Fertility by Age by Marriage Status in Area Code 401
61.4% of women with births (11,791) in Area Code 401 are married. The highest percentage of unmarried women with births falls into 15 to 19 years age bracket with 100.0% of them unmarried at the time of birth, while the lowest percentage of unmarried women with births belong to 20 to 34 years age bracket with 43.0% of them unmarried.
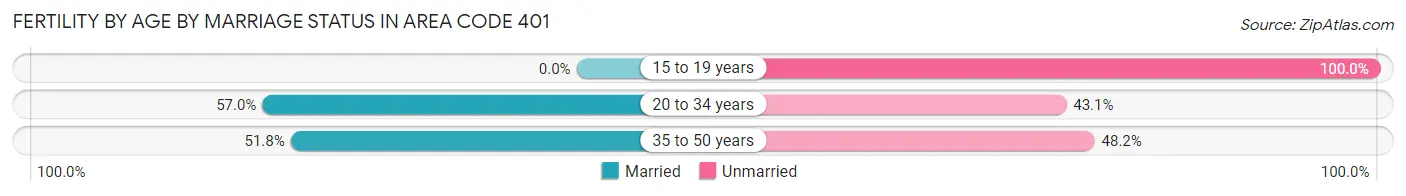
| Age Bracket | Married | Unmarried |
| 15 to 19 years | 0 (0.0%) | 88 (100.0%) |
| 20 to 34 years | 4,468 (57.0%) | 3,377 (43.0%) |
| 35 to 50 years | 1,999 (51.8%) | 1,859 (48.2%) |
| Total | 7,244 (61.4%) | 4,547 (38.6%) |
Fertility by Education in Area Code 401
Average fertility rate in Area Code 401 is 56.3 births per 1,000 women. Women with the education attainment of graduate degree have the highest fertility rate of 104.8 births per 1,000 women, while women with the education attainment of college or associate's degree have the lowest fertility at 64.2 births per 1,000 women. Women with the education attainment of bachelor's degree represent 26.8% of all women with births.
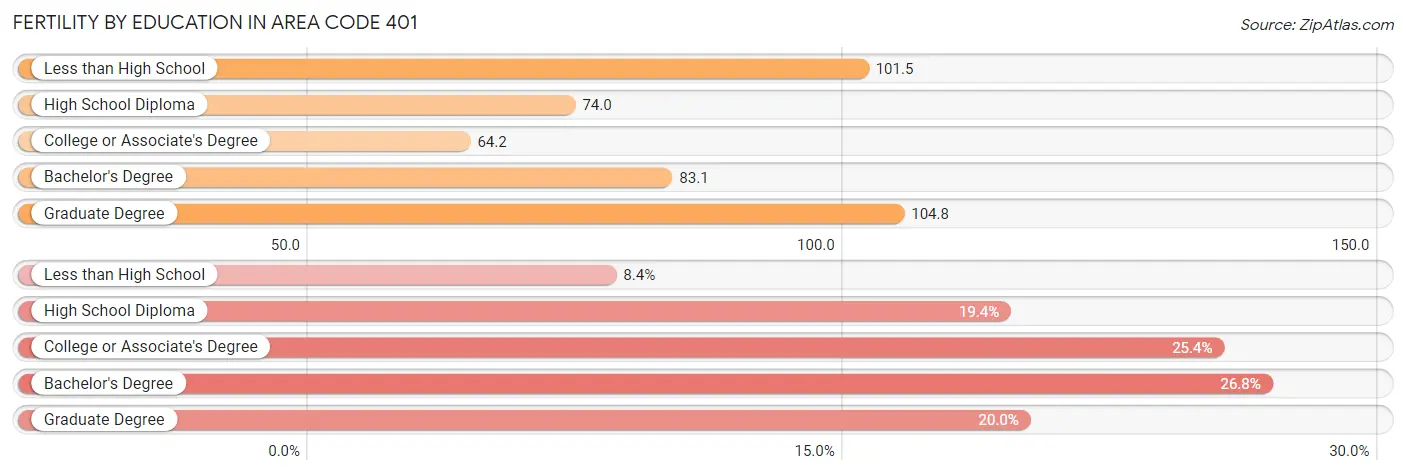
| Educational Attainment | Women with Births | Births / 1,000 Women |
| Less than High School | 985 (8.4%) | 101.5 |
| High School Diploma | 2,292 (19.4%) | 74.0 |
| College or Associate's Degree | 2,998 (25.4%) | 64.2 |
| Bachelor's Degree | 3,159 (26.8%) | 83.1 |
| Graduate Degree | 2,357 (20.0%) | 104.8 |
| Total | 11,791 (100.0%) | 56.3 |
Fertility by Education by Marriage Status in Area Code 401
38.6% of women with births in Area Code 401 are unmarried. Women with the educational attainment of graduate degree are most likely to be married with 65.5% of them married at childbirth, while women with the educational attainment of high school diploma are least likely to be married with 78.4% of them unmarried at childbirth.
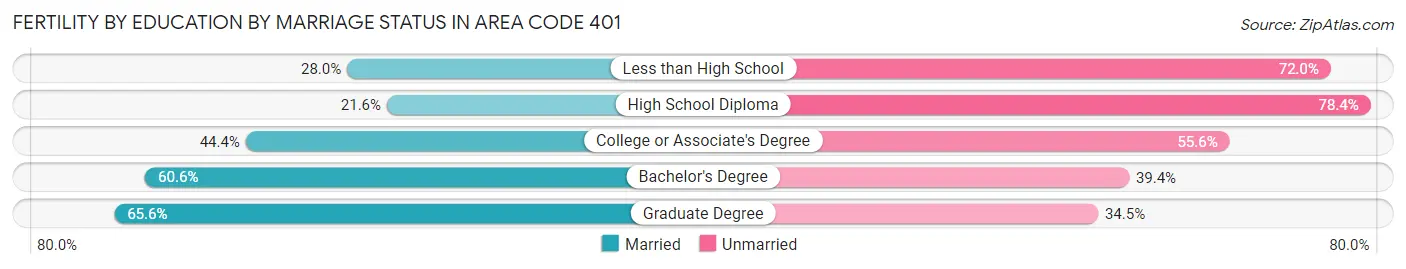
| Educational Attainment | Married | Unmarried |
| Less than High School | 276 (28.0%) | 709 (72.0%) |
| High School Diploma | 495 (21.6%) | 1,797 (78.4%) |
| College or Associate's Degree | 1,330 (44.4%) | 1,668 (55.6%) |
| Bachelor's Degree | 1,913 (60.6%) | 1,246 (39.4%) |
| Graduate Degree | 1,545 (65.5%) | 812 (34.4%) |
| Total | 7,244 (61.4%) | 4,547 (38.6%) |
Employment Characteristics in Area Code 401
Employment by Class of Employer in Area Code 401
Among the 542,687 employed individuals in Area Code 401, private company employees (356,252 | 65.6%), not-for-profit organizations (65,722 | 12.1%), and local government employees (34,158 | 6.3%) make up the most common classes of employment.
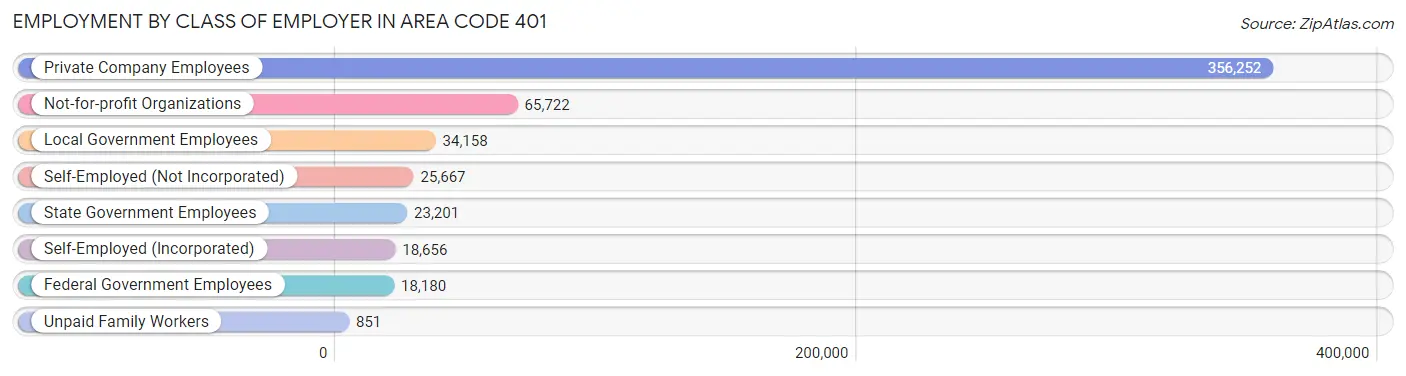
| Employer Class | # Employees | % Employees |
| Private Company Employees | 356,252 | 65.6% |
| Self-Employed (Incorporated) | 18,656 | 3.4% |
| Self-Employed (Not Incorporated) | 25,667 | 4.7% |
| Not-for-profit Organizations | 65,722 | 12.1% |
| Local Government Employees | 34,158 | 6.3% |
| State Government Employees | 23,201 | 4.3% |
| Federal Government Employees | 18,180 | 3.4% |
| Unpaid Family Workers | 851 | 0.2% |
| Total | 542,687 | 100.0% |
Employment Status by Age in Area Code 401
According to the labor force statistics for Area Code 401, out of the total population over 16 years of age (912,544), 64.5% or 588,500 individuals are in the labor force, with 5.9% or 35,016 of them unemployed. The age group with the highest labor force participation rate is 25 to 29 years, with 88.6% or 66,792 individuals in the labor force. Within the labor force, the 16 to 19 years age range has the highest percentage of unemployed individuals, with 887.3% or 260,777 of them being unemployed.
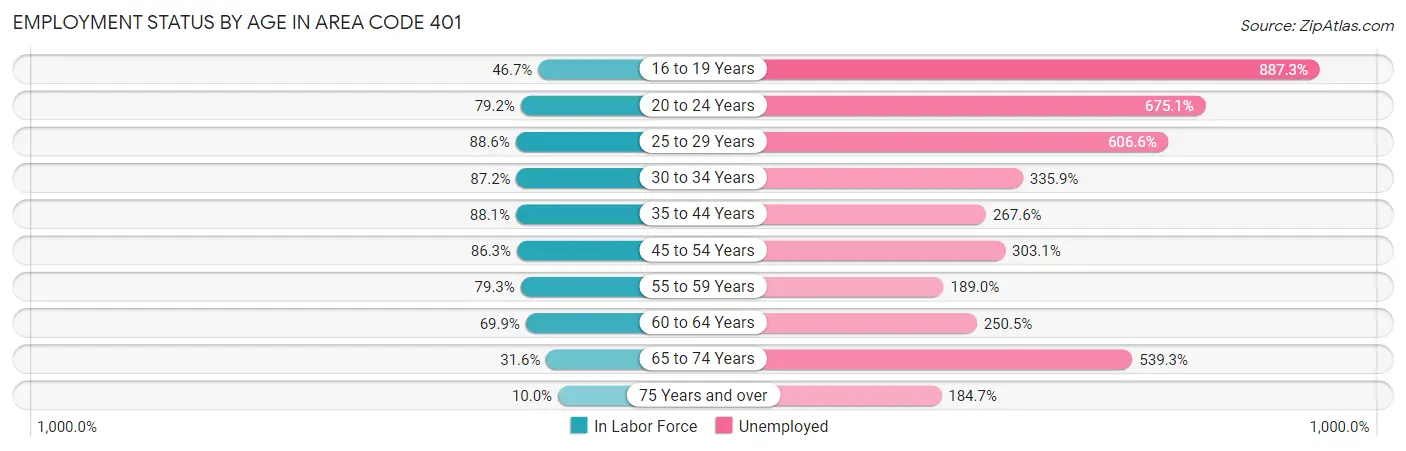
| Age Bracket | In Labor Force | Unemployed |
| 16 to 19 Years | 29,388 (46.7%) | 260,777 (887.3%) |
| 20 to 24 Years | 61,977 (79.1%) | 418,386 (675.1%) |
| 25 to 29 Years | 66,791 (88.6%) | 405,160 (606.6%) |
| 30 to 34 Years | 66,570 (87.2%) | 223,619 (335.9%) |
| 35 to 44 Years | 117,276 (88.1%) | 313,823 (267.6%) |
| 45 to 54 Years | 118,407 (86.3%) | 358,879 (303.1%) |
| 55 to 59 Years | 59,790 (79.3%) | 113,009 (189.0%) |
| 60 to 64 Years | 54,840 (69.9%) | 137,372 (250.5%) |
| 65 to 74 Years | 35,694 (31.6%) | 192,471 (539.3%) |
| 75 Years and over | 8,267 (10.0%) | 15,269 (184.7%) |
| Total | 588,477 (64.5%) | 35,029 (5.9%) |
Employment Status by Educational Attainment in Area Code 401
According to labor force statistics for Area Code 401, 82.7% of individuals (476,044) out of the total population between 25 and 64 years of age (575,906) are in the labor force, with 318.7% or 1,517,152 of them being unemployed. The group with the highest labor force participation rate are those with the educational attainment of bachelor's degree or higher, with 88.8% or 193,178 individuals in the labor force. Within the labor force, individuals with less than high school education have the highest percentage of unemployment, with 599.3% or 193,993 of them being unemployed.
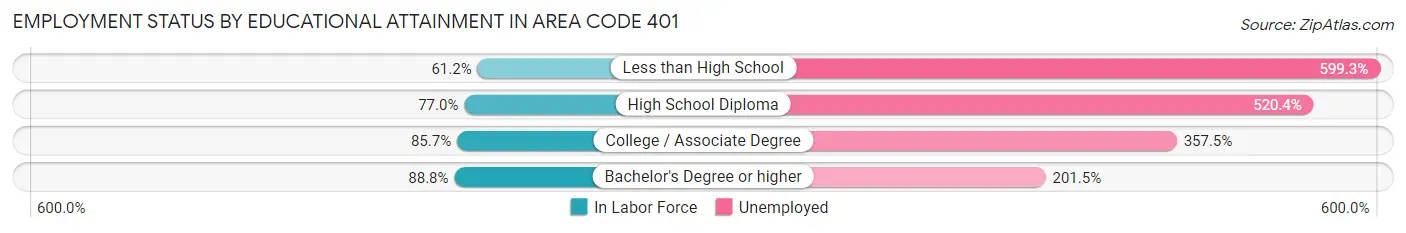
| Educational Attainment | In Labor Force | Unemployed |
| Less than High School | 32,371 (61.2%) | 316,832 (599.3%) |
| High School Diploma | 112,560 (77.0%) | 760,653 (520.4%) |
| College / Associate Degree | 136,407 (85.7%) | 569,340 (357.5%) |
| Bachelor's Degree or higher | 193,181 (88.8%) | 438,496 (201.5%) |
| Total | 476,070 (82.7%) | 1,835,412 (318.7%) |
Employment Occupations by Sex in Area Code 401
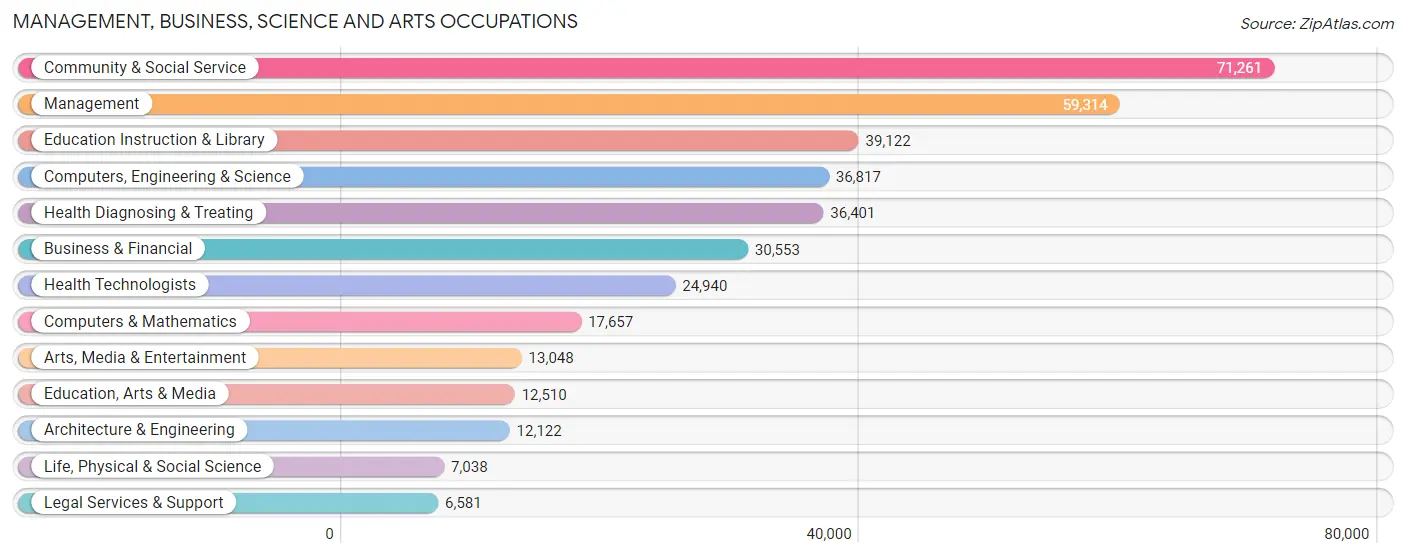
Management, Business, Science and Arts Occupations
The most common Management, Business, Science and Arts occupations in Area Code 401 are Community & Social Service (71,261 | 12.9%), Management (59,314 | 10.7%), Education Instruction & Library (39,122 | 7.1%), Computers, Engineering & Science (36,817 | 6.7%), and Health Diagnosing & Treating (36,401 | 6.6%).
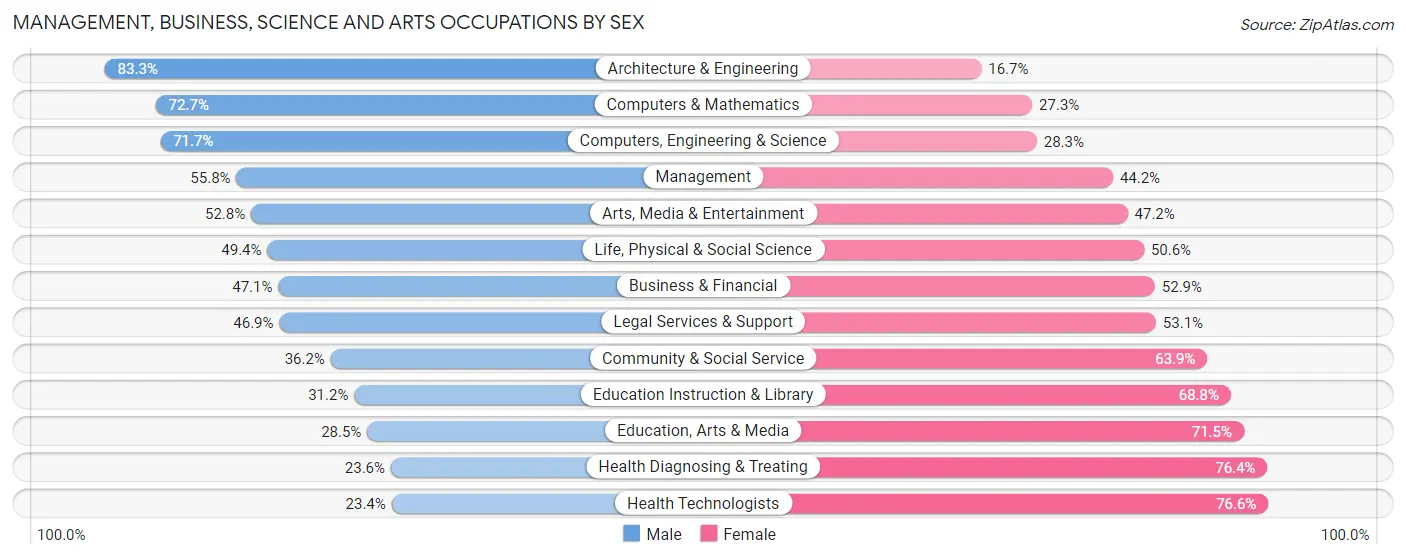
Management, Business, Science and Arts Occupations by Sex
Within the Management, Business, Science and Arts occupations in Area Code 401, the most male-oriented occupations are Architecture & Engineering (83.3%), Computers & Mathematics (72.7%), and Computers, Engineering & Science (71.7%), while the most female-oriented occupations are Health Technologists (76.6%), Health Diagnosing & Treating (76.4%), and Education, Arts & Media (71.5%).
| Occupation | Male | Female |
| Management | 33,111 (55.8%) | 26,203 (44.2%) |
| Business & Financial | 14,384 (47.1%) | 16,169 (52.9%) |
| Computers, Engineering & Science | 26,401 (71.7%) | 10,416 (28.3%) |
| Computers & Mathematics | 12,831 (72.7%) | 4,826 (27.3%) |
| Architecture & Engineering | 10,096 (83.3%) | 2,026 (16.7%) |
| Life, Physical & Social Science | 3,474 (49.4%) | 3,564 (50.6%) |
| Community & Social Service | 25,758 (36.1%) | 45,503 (63.8%) |
| Education, Arts & Media | 3,569 (28.5%) | 8,941 (71.5%) |
| Legal Services & Support | 3,084 (46.9%) | 3,497 (53.1%) |
| Education Instruction & Library | 12,221 (31.2%) | 26,901 (68.8%) |
| Arts, Media & Entertainment | 6,884 (52.8%) | 6,164 (47.2%) |
| Health Diagnosing & Treating | 8,589 (23.6%) | 27,812 (76.4%) |
| Health Technologists | 5,846 (23.4%) | 19,094 (76.6%) |
| Total (Category) | 108,243 (46.2%) | 126,103 (53.8%) |
| Total (Overall) | 284,519 (51.3%) | 269,535 (48.6%) |
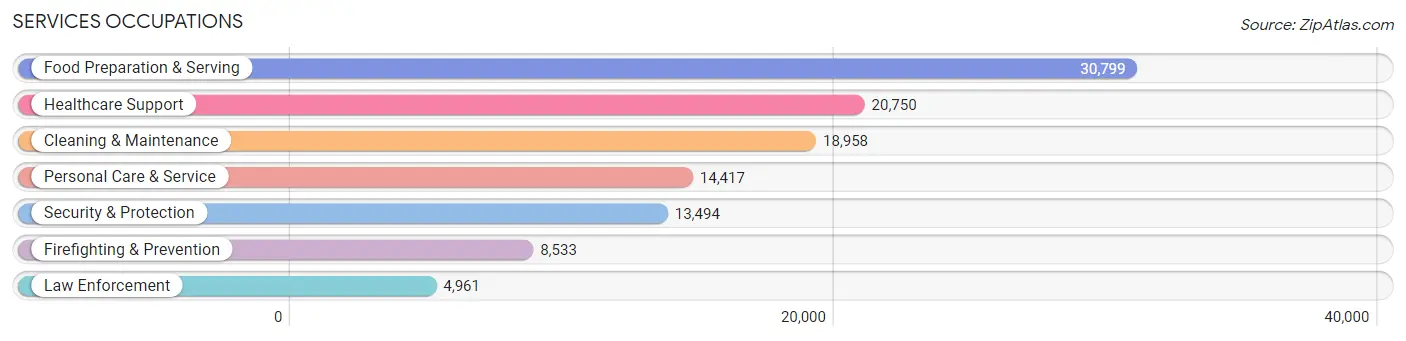
Services Occupations
The most common Services occupations in Area Code 401 are Food Preparation & Serving (30,799 | 5.6%), Healthcare Support (20,750 | 3.7%), Cleaning & Maintenance (18,958 | 3.4%), Personal Care & Service (14,417 | 2.6%), and Security & Protection (13,494 | 2.4%).
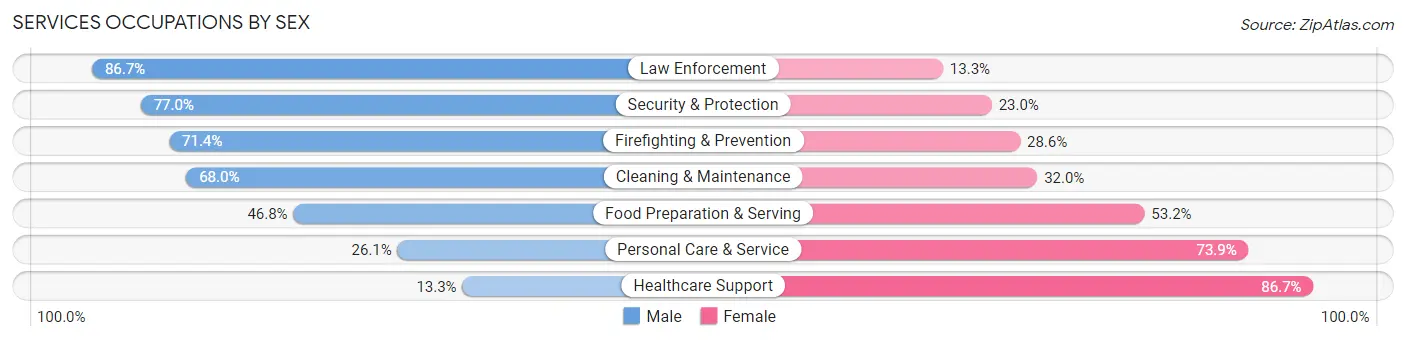
Services Occupations by Sex
Within the Services occupations in Area Code 401, the most male-oriented occupations are Law Enforcement (86.7%), Security & Protection (77.0%), and Firefighting & Prevention (71.4%), while the most female-oriented occupations are Healthcare Support (86.7%), Personal Care & Service (73.9%), and Food Preparation & Serving (53.2%).
| Occupation | Male | Female |
| Healthcare Support | 2,759 (13.3%) | 17,991 (86.7%) |
| Security & Protection | 10,390 (77.0%) | 3,104 (23.0%) |
| Firefighting & Prevention | 6,091 (71.4%) | 2,442 (28.6%) |
| Law Enforcement | 4,299 (86.7%) | 662 (13.3%) |
| Food Preparation & Serving | 14,403 (46.8%) | 16,396 (53.2%) |
| Cleaning & Maintenance | 12,889 (68.0%) | 6,069 (32.0%) |
| Personal Care & Service | 3,768 (26.1%) | 10,649 (73.9%) |
| Total (Category) | 44,209 (44.9%) | 54,209 (55.1%) |
| Total (Overall) | 284,519 (51.3%) | 269,535 (48.6%) |
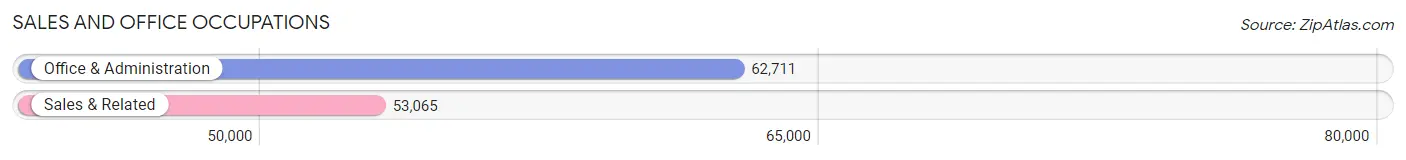
Sales and Office Occupations
The most common Sales and Office occupations in Area Code 401 are Office & Administration (62,711 | 11.3%), and Sales & Related (53,065 | 9.6%).
Sales and Office Occupations by Sex
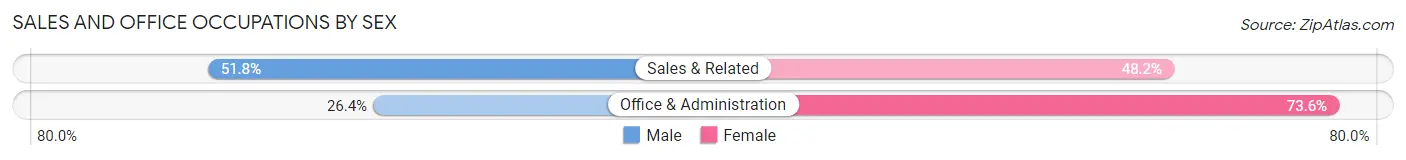
| Occupation | Male | Female |
| Sales & Related | 27,495 (51.8%) | 25,570 (48.2%) |
| Office & Administration | 16,563 (26.4%) | 46,148 (73.6%) |
| Total (Category) | 44,058 (38.1%) | 71,718 (62.0%) |
| Total (Overall) | 284,519 (51.3%) | 269,535 (48.6%) |
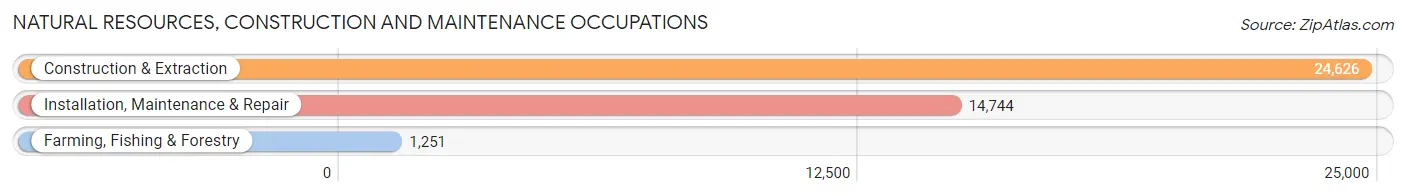
Natural Resources, Construction and Maintenance Occupations
The most common Natural Resources, Construction and Maintenance occupations in Area Code 401 are Construction & Extraction (24,626 | 4.4%), Installation, Maintenance & Repair (14,744 | 2.7%), and Farming, Fishing & Forestry (1,251 | 0.2%).
Natural Resources, Construction and Maintenance Occupations by Sex
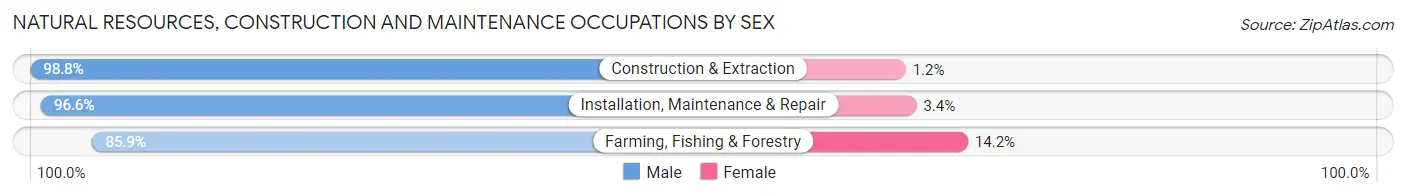
| Occupation | Male | Female |
| Farming, Fishing & Forestry | 1,074 (85.9%) | 177 (14.1%) |
| Construction & Extraction | 24,327 (98.8%) | 299 (1.2%) |
| Installation, Maintenance & Repair | 14,237 (96.6%) | 507 (3.4%) |
| Total (Category) | 39,638 (97.6%) | 983 (2.4%) |
| Total (Overall) | 284,519 (51.3%) | 269,535 (48.6%) |
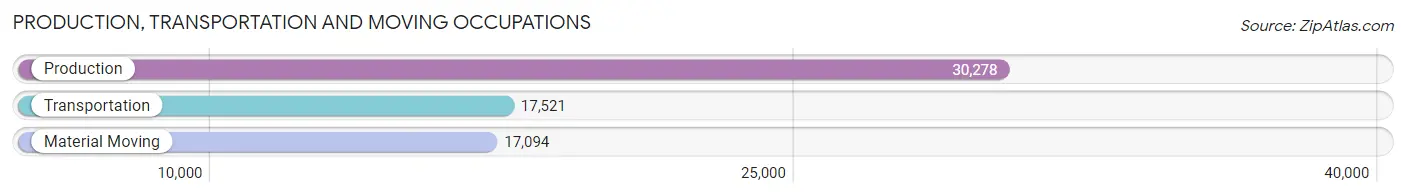
Production, Transportation and Moving Occupations
The most common Production, Transportation and Moving occupations in Area Code 401 are Production (30,278 | 5.5%), Transportation (17,521 | 3.2%), and Material Moving (17,094 | 3.1%).
Production, Transportation and Moving Occupations by Sex
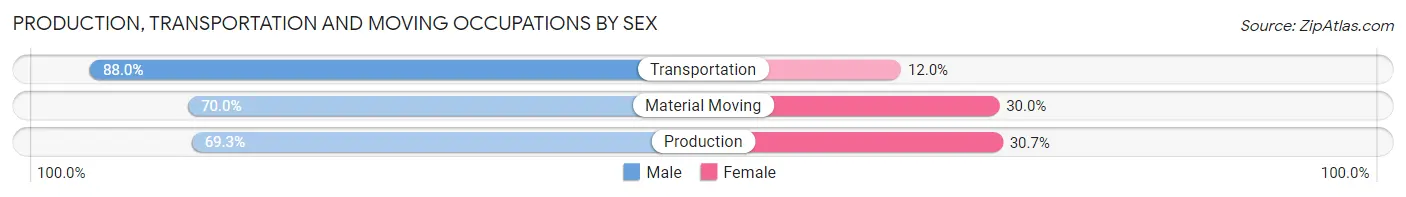
| Occupation | Male | Female |
| Production | 20,993 (69.3%) | 9,285 (30.7%) |
| Transportation | 15,418 (88.0%) | 2,103 (12.0%) |
| Material Moving | 11,960 (70.0%) | 5,134 (30.0%) |
| Total (Category) | 48,371 (74.5%) | 16,522 (25.5%) |
| Total (Overall) | 284,519 (51.3%) | 269,535 (48.6%) |
Employment Industries by Sex in Area Code 401
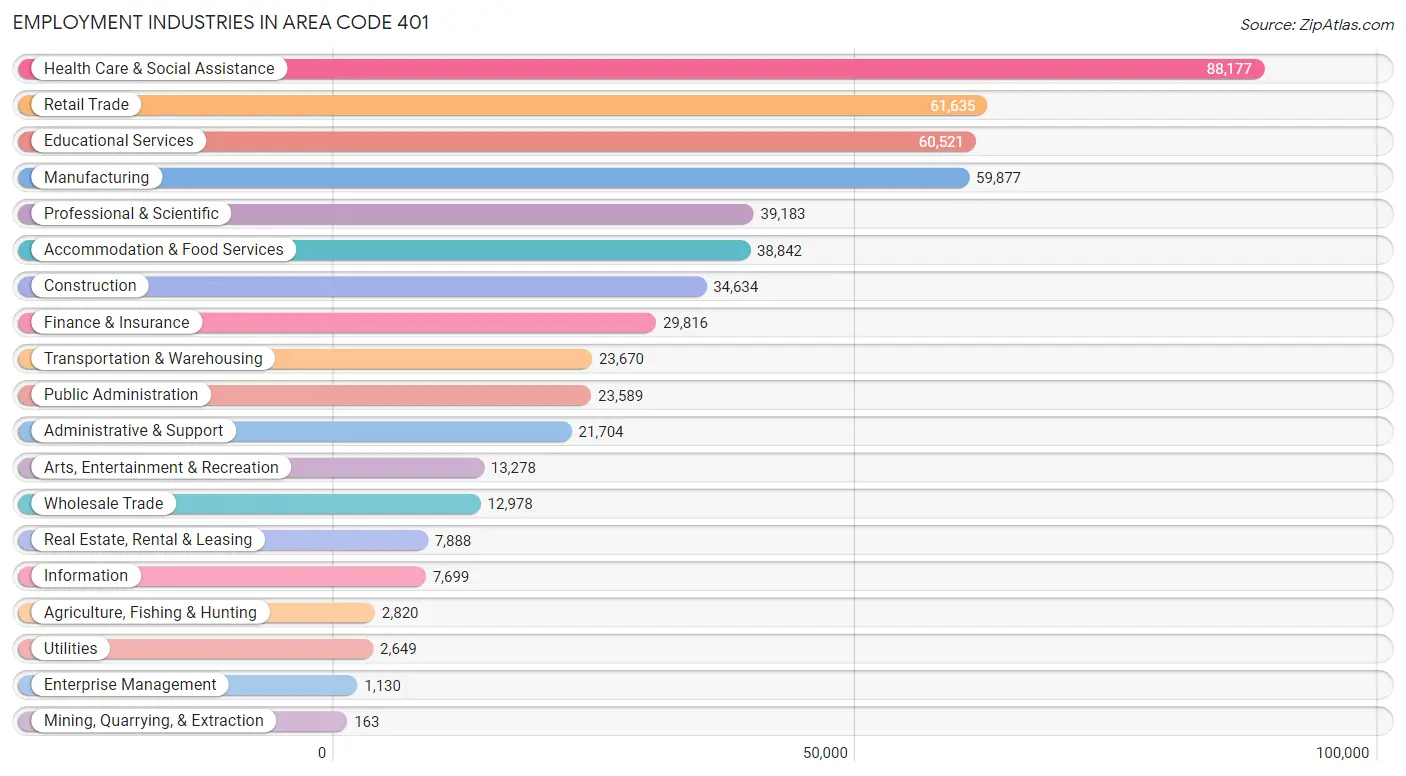
Employment Industries in Area Code 401
The major employment industries in Area Code 401 include Health Care & Social Assistance (88,177 | 15.9%), Retail Trade (61,635 | 11.1%), Educational Services (60,521 | 10.9%), Manufacturing (59,877 | 10.8%), and Professional & Scientific (39,183 | 7.1%).
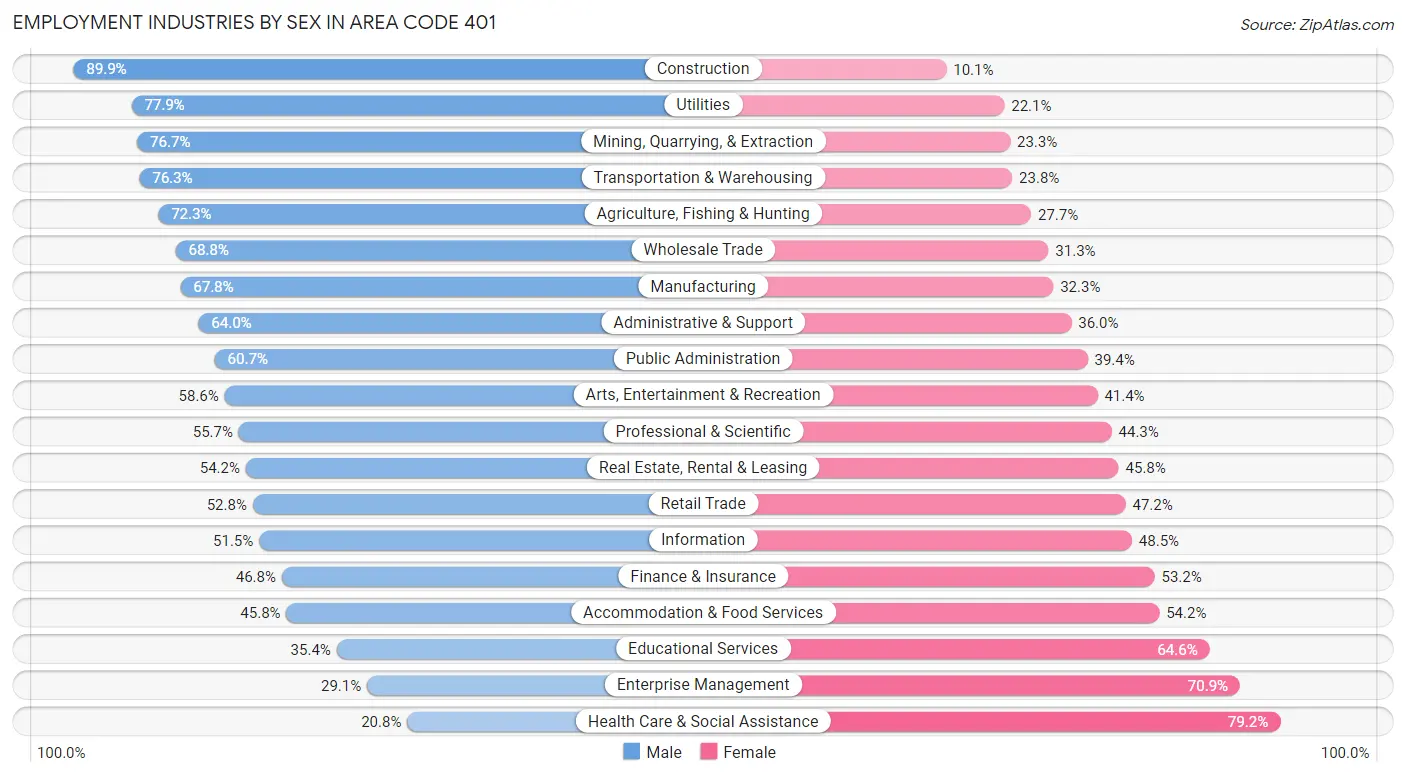
Employment Industries by Sex in Area Code 401
The Area Code 401 industries that see more men than women are Construction (89.9%), Utilities (77.9%), and Mining, Quarrying, & Extraction (76.7%), whereas the industries that tend to have a higher number of women are Health Care & Social Assistance (79.2%), Enterprise Management (70.9%), and Educational Services (64.6%).
| Industry | Male | Female |
| Agriculture, Fishing & Hunting | 2,040 (72.3%) | 780 (27.7%) |
| Mining, Quarrying, & Extraction | 125 (76.7%) | 38 (23.3%) |
| Construction | 31,134 (89.9%) | 3,500 (10.1%) |
| Manufacturing | 40,565 (67.7%) | 19,312 (32.3%) |
| Wholesale Trade | 8,922 (68.8%) | 4,056 (31.2%) |
| Retail Trade | 32,534 (52.8%) | 29,101 (47.2%) |
| Transportation & Warehousing | 18,049 (76.2%) | 5,621 (23.7%) |
| Utilities | 2,063 (77.9%) | 586 (22.1%) |
| Information | 3,962 (51.5%) | 3,737 (48.5%) |
| Finance & Insurance | 13,945 (46.8%) | 15,871 (53.2%) |
| Real Estate, Rental & Leasing | 4,277 (54.2%) | 3,611 (45.8%) |
| Professional & Scientific | 21,813 (55.7%) | 17,370 (44.3%) |
| Enterprise Management | 329 (29.1%) | 801 (70.9%) |
| Administrative & Support | 13,894 (64.0%) | 7,810 (36.0%) |
| Educational Services | 21,428 (35.4%) | 39,093 (64.6%) |
| Health Care & Social Assistance | 18,339 (20.8%) | 69,838 (79.2%) |
| Arts, Entertainment & Recreation | 7,781 (58.6%) | 5,497 (41.4%) |
| Accommodation & Food Services | 17,792 (45.8%) | 21,050 (54.2%) |
| Public Administration | 14,306 (60.7%) | 9,283 (39.4%) |
| Total | 284,519 (51.3%) | 269,535 (48.6%) |
Education in Area Code 401
School Enrollment in Area Code 401
The most common levels of schooling among the 260,381 students in Area Code 401 are college / undergraduate (75,422 | 29.0%), high school (50,337 | 19.3%), and middle school (46,147 | 17.7%).
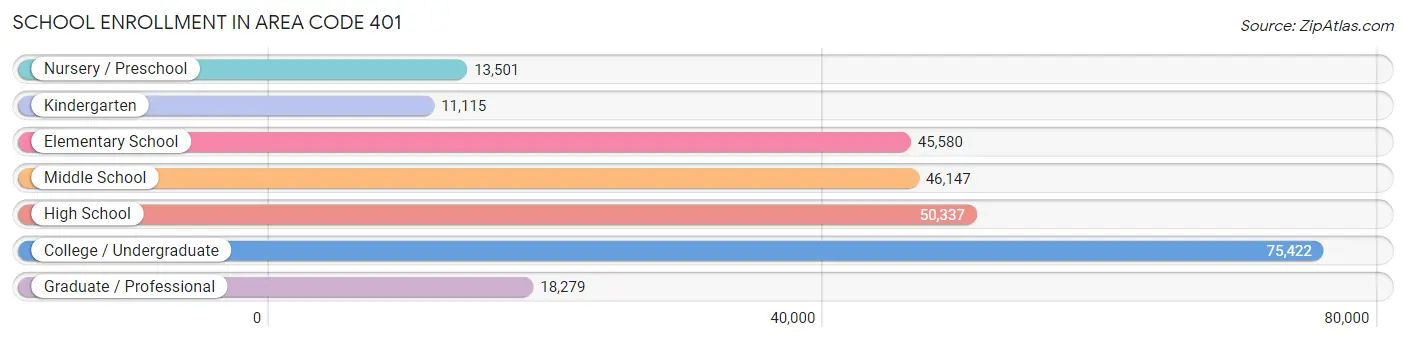
| School Level | # Students | % Students |
| Nursery / Preschool | 13,501 | 5.2% |
| Kindergarten | 11,115 | 4.3% |
| Elementary School | 45,580 | 17.5% |
| Middle School | 46,147 | 17.7% |
| High School | 50,337 | 19.3% |
| College / Undergraduate | 75,422 | 29.0% |
| Graduate / Professional | 18,279 | 7.0% |
| Total | 260,381 | 100.0% |
School Enrollment by Age by Funding Source in Area Code 401
Out of a total of 260,381 students who are enrolled in schools in Area Code 401, 68,265 (26.2%) attend a private institution, while the remaining 192,116 (73.8%) are enrolled in public schools. The age group of 18 to 19 year olds has the highest likelihood of being enrolled in private schools, with 13,828 (45.0% in the age bracket) enrolled. Conversely, the age group of 15 to 17 year olds has the lowest likelihood of being enrolled in a private school, with 31,967 (87.0% in the age bracket) attending a public institution.
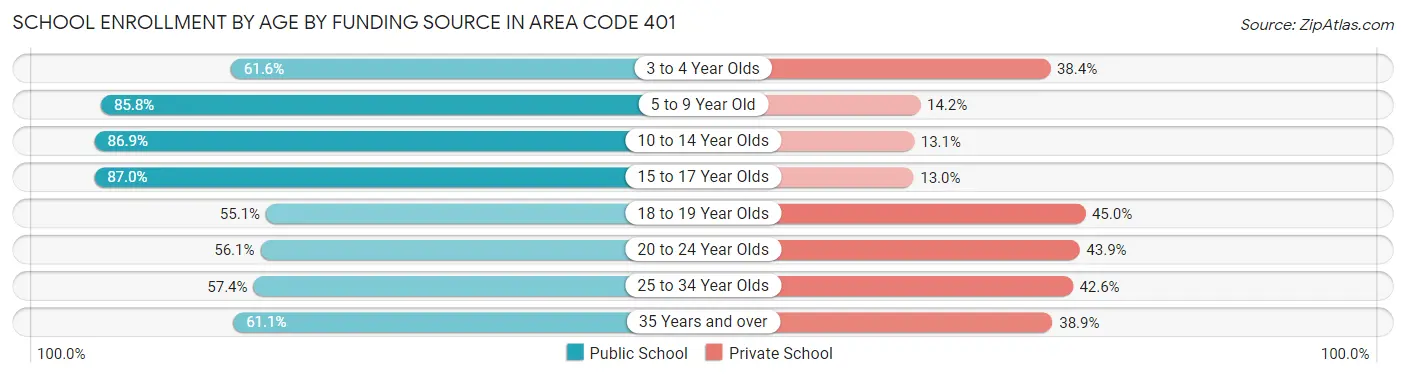
| Age Bracket | Public School | Private School |
| 3 to 4 Year Olds | 6,634 (61.6%) | 4,141 (38.4%) |
| 5 to 9 Year Old | 45,173 (85.8%) | 7,494 (14.2%) |
| 10 to 14 Year Olds | 50,541 (86.9%) | 7,593 (13.1%) |
| 15 to 17 Year Olds | 31,967 (87.0%) | 4,765 (13.0%) |
| 18 to 19 Year Olds | 16,937 (55.0%) | 13,828 (45.0%) |
| 20 to 24 Year Olds | 22,691 (56.1%) | 17,766 (43.9%) |
| 25 to 34 Year Olds | 10,220 (57.4%) | 7,588 (42.6%) |
| 35 Years and over | 7,974 (61.1%) | 5,069 (38.9%) |
| Total | 192,116 (73.8%) | 68,265 (26.2%) |
Educational Attainment by Field of Study in Area Code 401
Business (53,017 | 17.4%), education (32,736 | 10.8%), science & technology (29,622 | 9.7%), social sciences (24,561 | 8.1%), and engineering (20,182 | 6.6%) are the most common fields of study among 304,193 individuals in Area Code 401 who have obtained a bachelor's degree or higher.
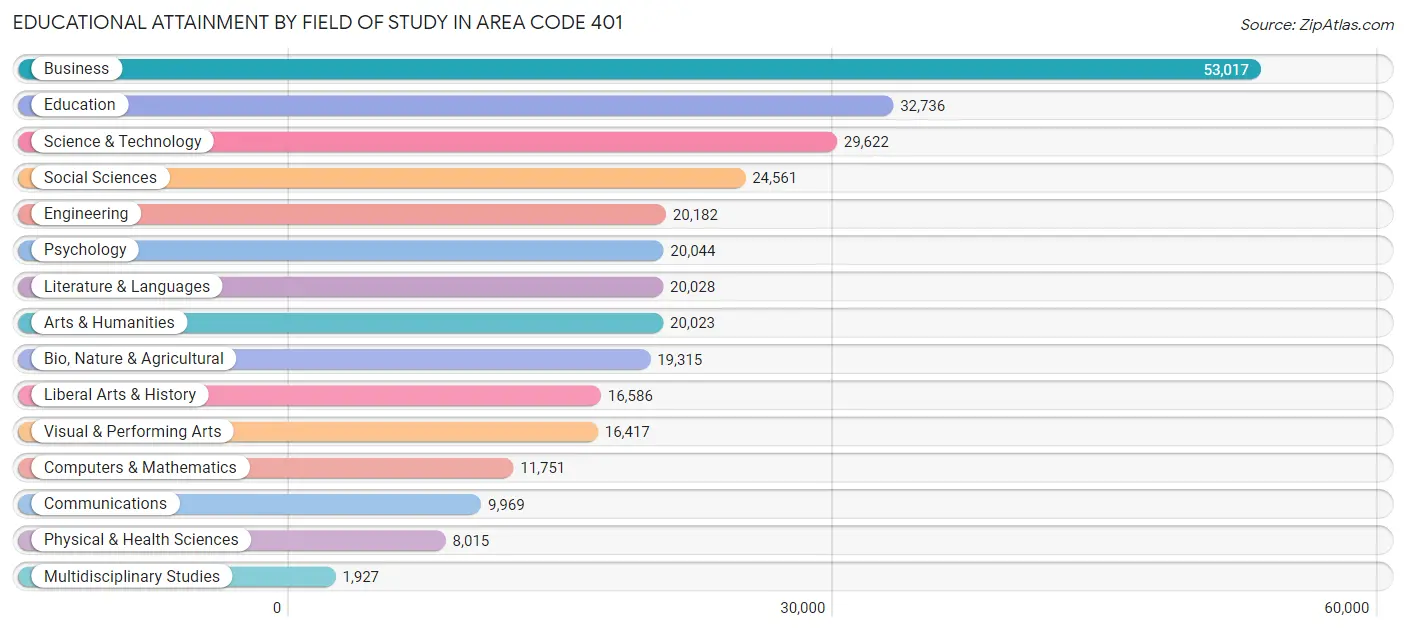
| Field of Study | # Graduates | % Graduates |
| Computers & Mathematics | 11,751 | 3.9% |
| Bio, Nature & Agricultural | 19,315 | 6.4% |
| Physical & Health Sciences | 8,015 | 2.6% |
| Psychology | 20,044 | 6.6% |
| Social Sciences | 24,561 | 8.1% |
| Engineering | 20,182 | 6.6% |
| Multidisciplinary Studies | 1,927 | 0.6% |
| Science & Technology | 29,622 | 9.7% |
| Business | 53,017 | 17.4% |
| Education | 32,736 | 10.8% |
| Literature & Languages | 20,028 | 6.6% |
| Liberal Arts & History | 16,586 | 5.4% |
| Visual & Performing Arts | 16,417 | 5.4% |
| Communications | 9,969 | 3.3% |
| Arts & Humanities | 20,023 | 6.6% |
| Total | 304,193 | 100.0% |
Transportation & Commute in Area Code 401
Vehicle Availability by Sex in Area Code 401
The most prevalent vehicle ownership categories in Area Code 401 are males with 2 vehicles (122,792, accounting for 44.3%) and females with 2 vehicles (109,999, making up 48.0%).
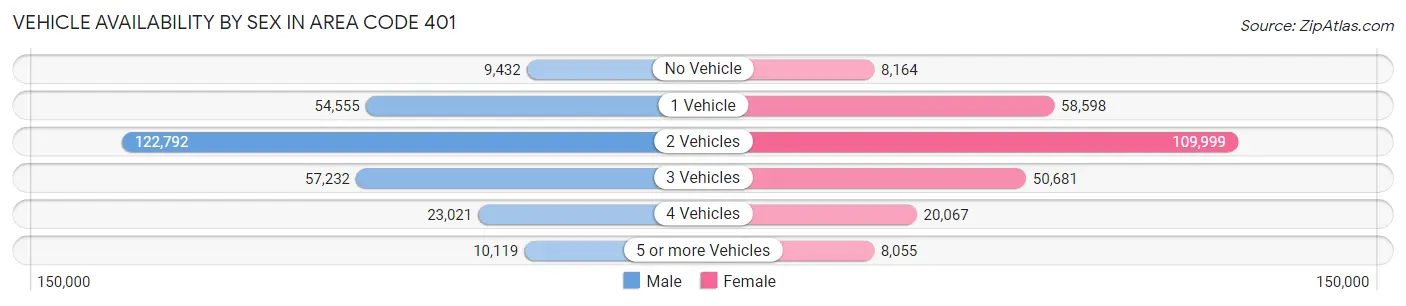
| Vehicles Available | Male | Female |
| No Vehicle | 9,432 (3.4%) | 8,164 (3.2%) |
| 1 Vehicle | 54,555 (19.7%) | 58,598 (22.9%) |
| 2 Vehicles | 122,792 (44.3%) | 109,999 (43.0%) |
| 3 Vehicles | 57,232 (20.6%) | 50,681 (19.8%) |
| 4 Vehicles | 23,021 (8.3%) | 20,067 (7.9%) |
| 5 or more Vehicles | 10,119 (3.6%) | 8,055 (3.2%) |
| Total | 277,151 (100.0%) | 255,564 (100.0%) |
Commute Time in Area Code 401
The most frequently occuring commute durations in Area Code 401 are 15 to 19 minutes (79,446 commuters, 16.2%), 20 to 24 minutes (79,233 commuters, 16.2%), and 10 to 14 minutes (72,080 commuters, 14.7%).
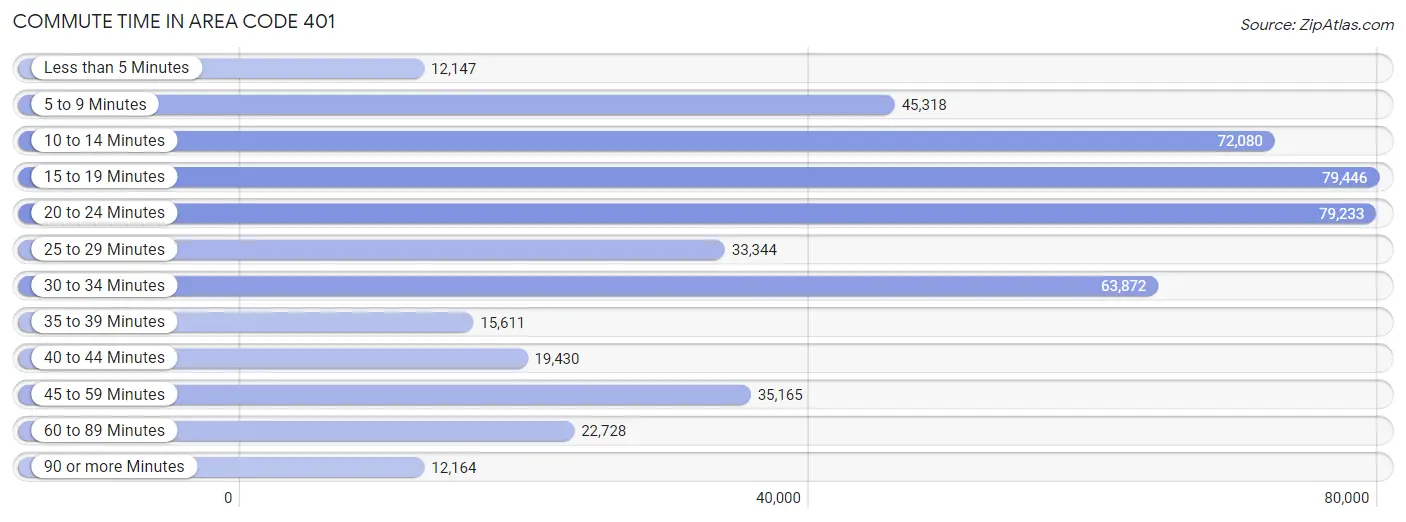
| Commute Time | # Commuters | % Commuters |
| Less than 5 Minutes | 12,147 | 2.5% |
| 5 to 9 Minutes | 45,318 | 9.2% |
| 10 to 14 Minutes | 72,080 | 14.7% |
| 15 to 19 Minutes | 79,446 | 16.2% |
| 20 to 24 Minutes | 79,233 | 16.2% |
| 25 to 29 Minutes | 33,344 | 6.8% |
| 30 to 34 Minutes | 63,872 | 13.0% |
| 35 to 39 Minutes | 15,611 | 3.2% |
| 40 to 44 Minutes | 19,430 | 4.0% |
| 45 to 59 Minutes | 35,165 | 7.2% |
| 60 to 89 Minutes | 22,728 | 4.6% |
| 90 or more Minutes | 12,164 | 2.5% |
Commute Time by Sex in Area Code 401
The most common commute times in Area Code 401 are 20 to 24 minutes (39,333 commuters, 15.3%) for males and 15 to 19 minutes (41,790 commuters, 17.8%) for females.
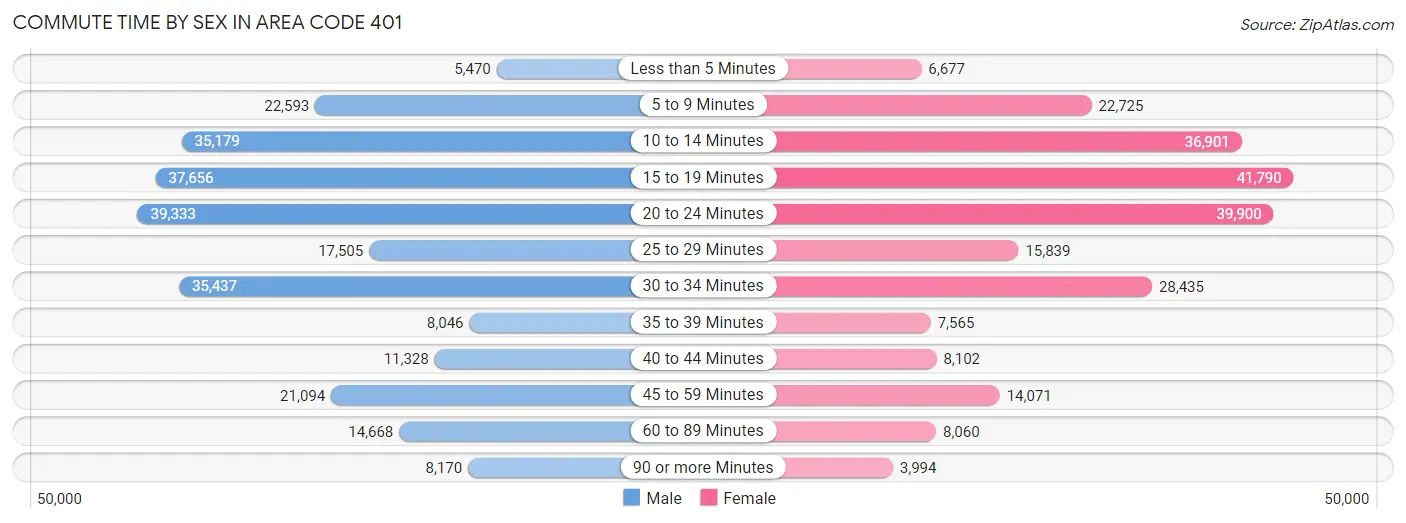
| Commute Time | Male | Female |
| Less than 5 Minutes | 5,470 (2.1%) | 6,677 (2.9%) |
| 5 to 9 Minutes | 22,593 (8.8%) | 22,725 (9.7%) |
| 10 to 14 Minutes | 35,179 (13.7%) | 36,901 (15.8%) |
| 15 to 19 Minutes | 37,656 (14.7%) | 41,790 (17.8%) |
| 20 to 24 Minutes | 39,333 (15.3%) | 39,900 (17.1%) |
| 25 to 29 Minutes | 17,505 (6.8%) | 15,839 (6.8%) |
| 30 to 34 Minutes | 35,437 (13.8%) | 28,435 (12.1%) |
| 35 to 39 Minutes | 8,046 (3.1%) | 7,565 (3.2%) |
| 40 to 44 Minutes | 11,328 (4.4%) | 8,102 (3.5%) |
| 45 to 59 Minutes | 21,094 (8.2%) | 14,071 (6.0%) |
| 60 to 89 Minutes | 14,668 (5.7%) | 8,060 (3.4%) |
| 90 or more Minutes | 8,170 (3.2%) | 3,994 (1.7%) |
Time of Departure to Work by Sex in Area Code 401
The most frequent times of departure to work in Area Code 401 are 7:00 AM to 7:29 AM (39,084, 15.2%) for males and 8:00 AM to 8:29 AM (36,049, 15.4%) for females.
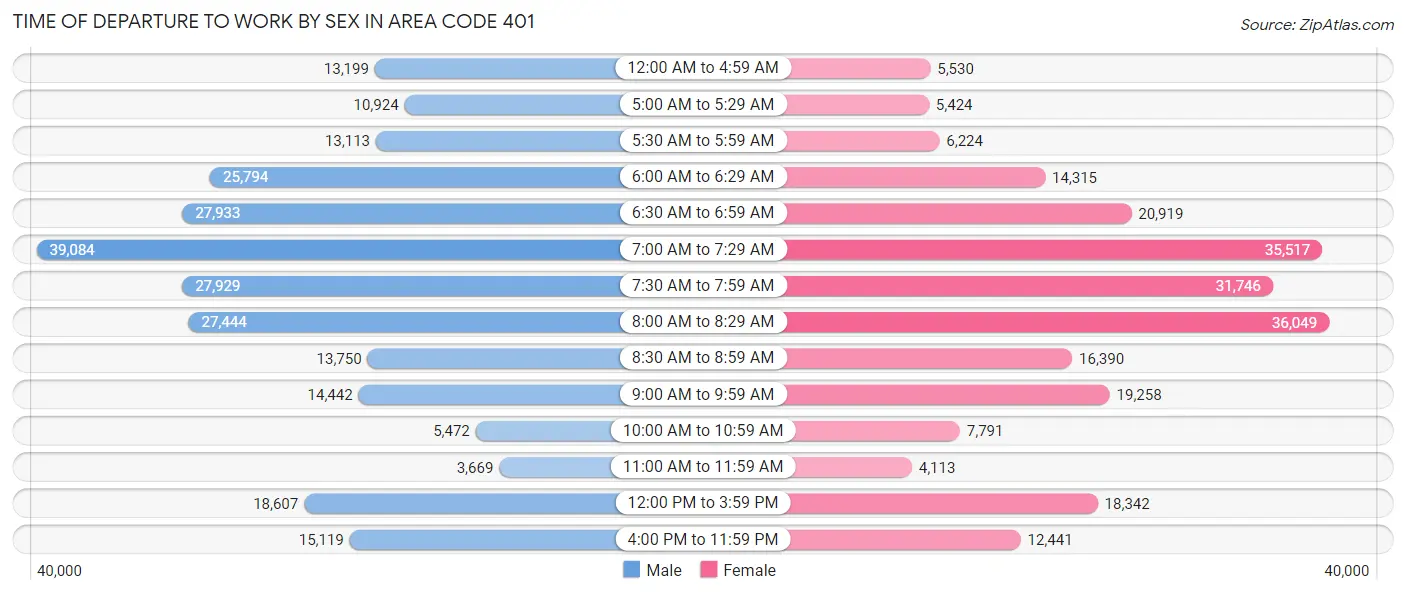
| Time of Departure | Male | Female |
| 12:00 AM to 4:59 AM | 13,199 (5.1%) | 5,530 (2.4%) |
| 5:00 AM to 5:29 AM | 10,924 (4.3%) | 5,424 (2.3%) |
| 5:30 AM to 5:59 AM | 13,113 (5.1%) | 6,224 (2.7%) |
| 6:00 AM to 6:29 AM | 25,794 (10.1%) | 14,315 (6.1%) |
| 6:30 AM to 6:59 AM | 27,933 (10.9%) | 20,919 (8.9%) |
| 7:00 AM to 7:29 AM | 39,084 (15.2%) | 35,517 (15.2%) |
| 7:30 AM to 7:59 AM | 27,929 (10.9%) | 31,746 (13.6%) |
| 8:00 AM to 8:29 AM | 27,444 (10.7%) | 36,049 (15.4%) |
| 8:30 AM to 8:59 AM | 13,750 (5.4%) | 16,390 (7.0%) |
| 9:00 AM to 9:59 AM | 14,442 (5.6%) | 19,258 (8.2%) |
| 10:00 AM to 10:59 AM | 5,472 (2.1%) | 7,791 (3.3%) |
| 11:00 AM to 11:59 AM | 3,669 (1.4%) | 4,113 (1.8%) |
| 12:00 PM to 3:59 PM | 18,607 (7.2%) | 18,342 (7.8%) |
| 4:00 PM to 11:59 PM | 15,119 (5.9%) | 12,441 (5.3%) |
| Total | 256,479 (100.0%) | 234,059 (100.0%) |
Housing Occupancy in Area Code 401
Occupancy by Ownership in Area Code 401
Of the total 432,239 dwellings in Area Code 401, owner-occupied units account for 270,970 (62.7%), while renter-occupied units make up 161,269 (37.3%).
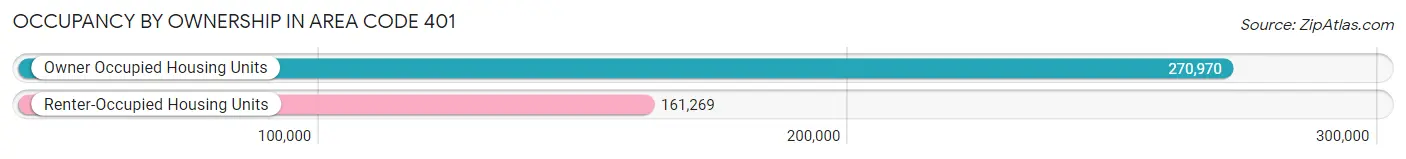
| Occupancy | # Housing Units | % Housing Units |
| Owner Occupied Housing Units | 270,970 | 62.7% |
| Renter-Occupied Housing Units | 161,269 | 37.3% |
| Total Occupied Housing Units | 432,239 | 100.0% |
Occupancy by Household Size in Area Code 401
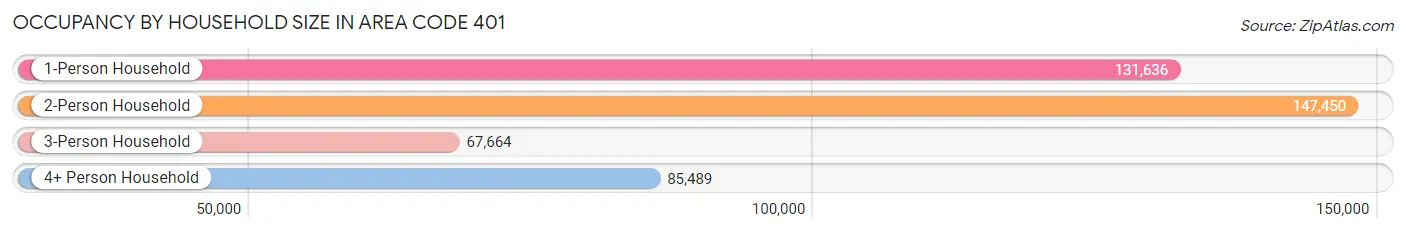
| Household Size | # Housing Units | % Housing Units |
| 1-Person Household | 131,636 | 30.4% |
| 2-Person Household | 147,450 | 34.1% |
| 3-Person Household | 67,664 | 15.7% |
| 4+ Person Household | 85,489 | 19.8% |
| Total Housing Units | 432,239 | 100.0% |
Occupancy by Ownership by Household Size in Area Code 401
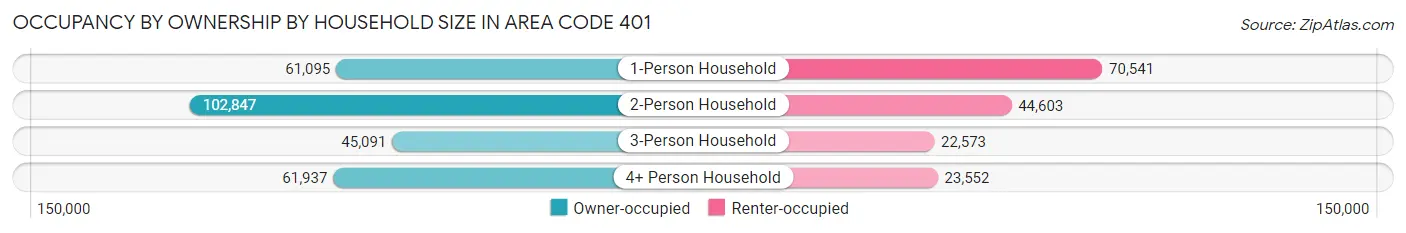
| Household Size | Owner-occupied | Renter-occupied |
| 1-Person Household | 61,095 (46.4%) | 70,541 (53.6%) |
| 2-Person Household | 102,847 (69.8%) | 44,603 (30.2%) |
| 3-Person Household | 45,091 (66.6%) | 22,573 (33.4%) |
| 4+ Person Household | 61,937 (72.5%) | 23,552 (27.6%) |
| Total Housing Units | 270,970 (62.7%) | 161,269 (37.3%) |
Occupancy by Educational Attainment in Area Code 401
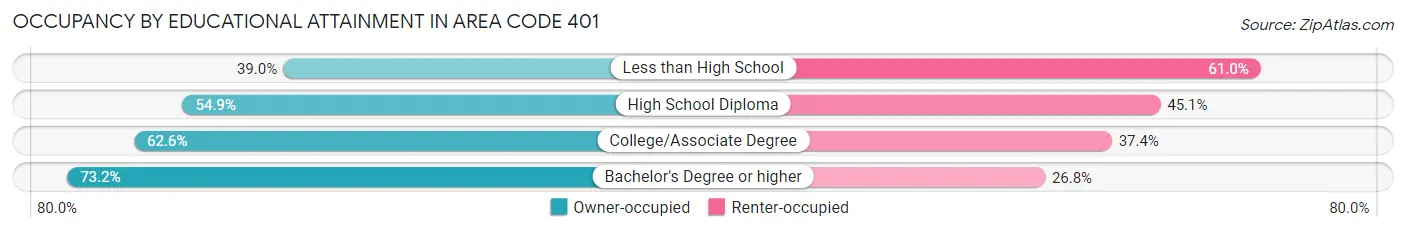
| Household Size | Owner-occupied | Renter-occupied |
| Less than High School | 15,754 (39.0%) | 24,625 (61.0%) |
| High School Diploma | 58,112 (54.9%) | 47,672 (45.1%) |
| College/Associate Degree | 73,286 (62.6%) | 43,702 (37.4%) |
| Bachelor's Degree or higher | 123,818 (73.2%) | 45,270 (26.8%) |
Occupancy by Age of Householder in Area Code 401
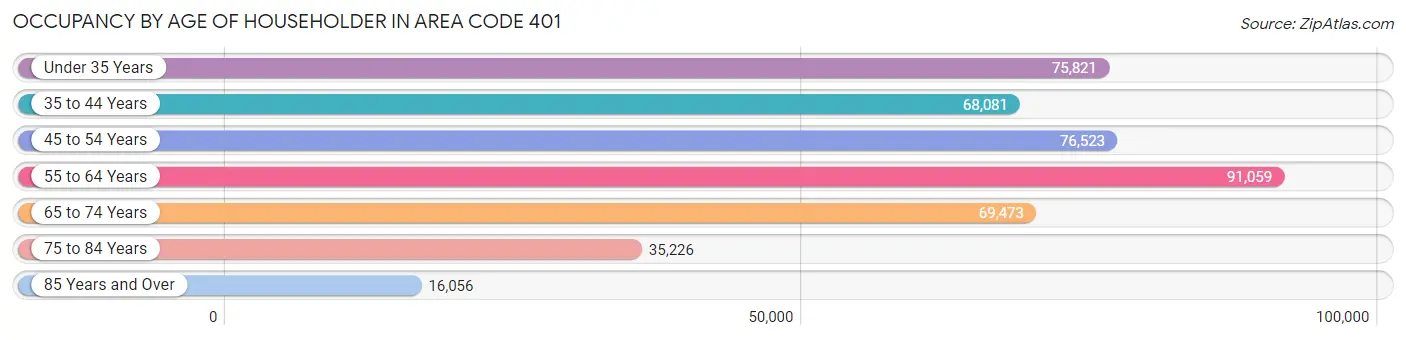
| Age Bracket | # Households | % Households |
| Under 35 Years | 75,821 | 17.5% |
| 35 to 44 Years | 68,081 | 15.8% |
| 45 to 54 Years | 76,523 | 17.7% |
| 55 to 64 Years | 91,059 | 21.1% |
| 65 to 74 Years | 69,473 | 16.1% |
| 75 to 84 Years | 35,226 | 8.2% |
| 85 Years and Over | 16,056 | 3.7% |
| Total | 432,239 | 100.0% |
Housing Finances in Area Code 401
Median Income by Occupancy in Area Code 401
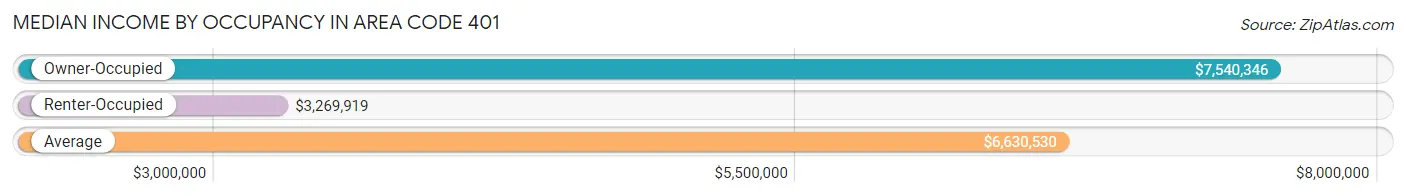
| Occupancy Type | # Households | Median Income |
| Owner-Occupied | 270,970 (62.7%) | $7,540,346 |
| Renter-Occupied | 161,269 (37.3%) | $3,269,919 |
| Average | 432,239 (100.0%) | $6,630,530 |
Occupancy by Householder Income Bracket in Area Code 401
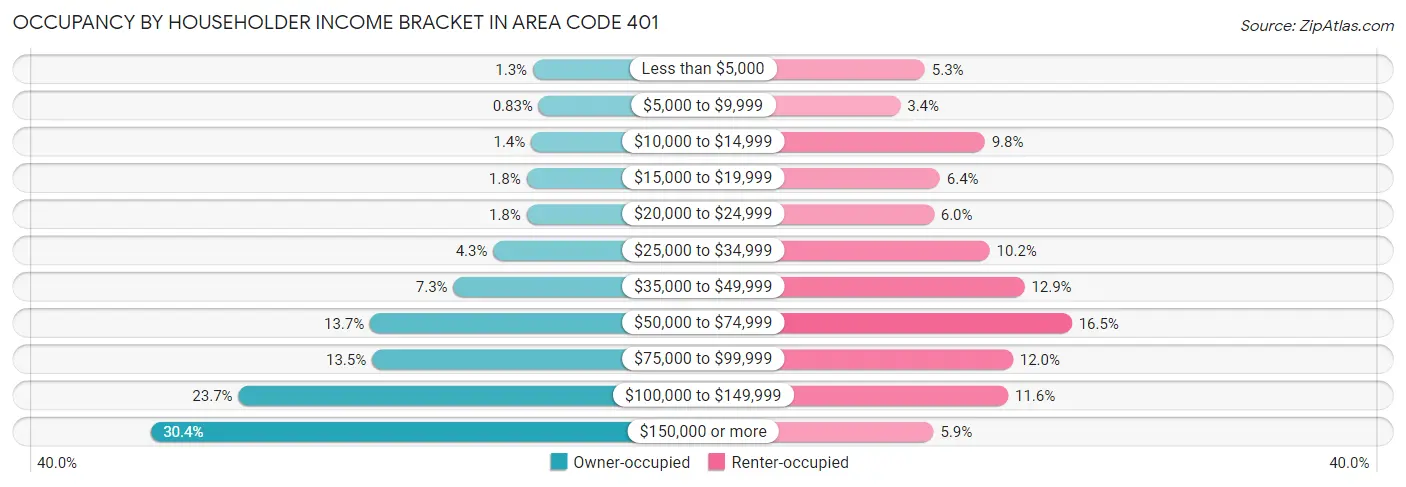
| Income Bracket | Owner-occupied | Renter-occupied |
| Less than $5,000 | 3,435 (1.3%) | 8,513 (5.3%) |
| $5,000 to $9,999 | 2,236 (0.8%) | 5,498 (3.4%) |
| $10,000 to $14,999 | 3,831 (1.4%) | 15,865 (9.8%) |
| $15,000 to $19,999 | 4,770 (1.8%) | 10,355 (6.4%) |
| $20,000 to $24,999 | 4,755 (1.8%) | 9,607 (6.0%) |
| $25,000 to $34,999 | 11,625 (4.3%) | 16,476 (10.2%) |
| $35,000 to $49,999 | 19,855 (7.3%) | 20,762 (12.9%) |
| $50,000 to $74,999 | 37,082 (13.7%) | 26,555 (16.5%) |
| $75,000 to $99,999 | 36,655 (13.5%) | 19,319 (12.0%) |
| $100,000 to $149,999 | 64,259 (23.7%) | 18,737 (11.6%) |
| $150,000 or more | 82,467 (30.4%) | 9,582 (5.9%) |
| Total | 270,970 (100.0%) | 161,269 (100.0%) |
Monthly Housing Cost Tiers in Area Code 401
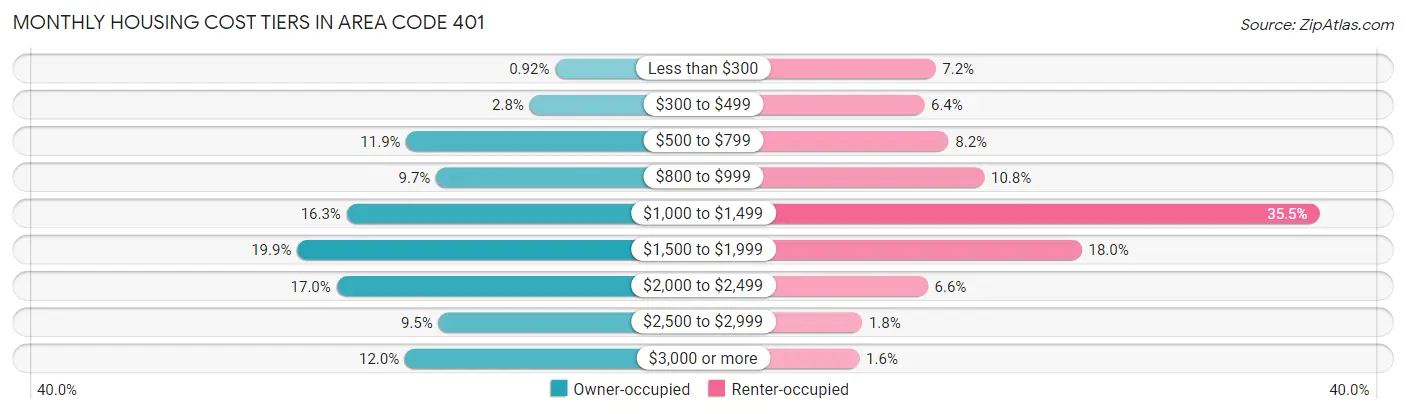
| Monthly Cost | Owner-occupied | Renter-occupied |
| Less than $300 | 2,505 (0.9%) | 11,633 (7.2%) |
| $300 to $499 | 7,577 (2.8%) | 10,283 (6.4%) |
| $500 to $799 | 32,182 (11.9%) | 13,181 (8.2%) |
| $800 to $999 | 26,248 (9.7%) | 17,414 (10.8%) |
| $1,000 to $1,499 | 44,116 (16.3%) | 57,236 (35.5%) |
| $1,500 to $1,999 | 53,988 (19.9%) | 28,995 (18.0%) |
| $2,000 to $2,499 | 46,119 (17.0%) | 10,709 (6.6%) |
| $2,500 to $2,999 | 25,766 (9.5%) | 2,916 (1.8%) |
| $3,000 or more | 32,469 (12.0%) | 2,582 (1.6%) |
| Total | 270,970 (100.0%) | 161,269 (100.0%) |
Physical Housing Characteristics in Area Code 401
Housing Structures in Area Code 401
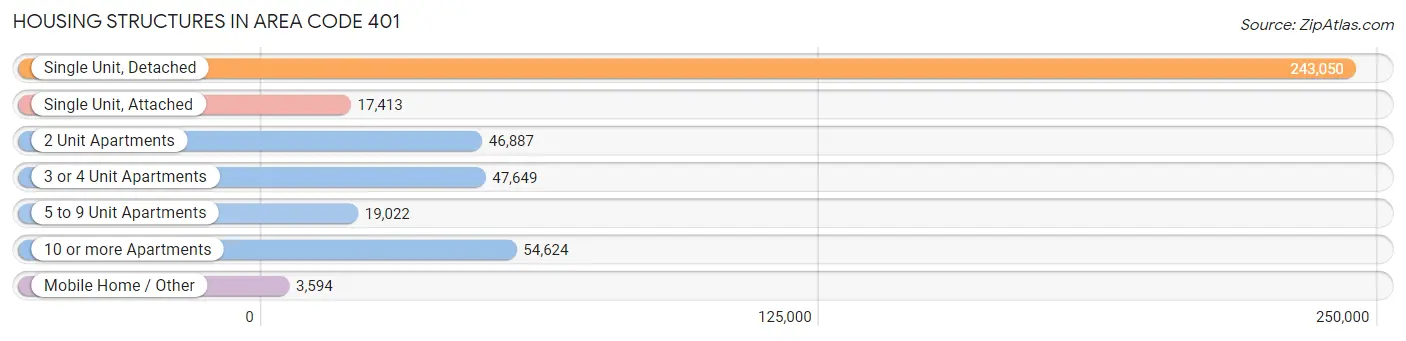
| Structure Type | # Housing Units | % Housing Units |
| Single Unit, Detached | 243,050 | 56.2% |
| Single Unit, Attached | 17,413 | 4.0% |
| 2 Unit Apartments | 46,887 | 10.8% |
| 3 or 4 Unit Apartments | 47,649 | 11.0% |
| 5 to 9 Unit Apartments | 19,022 | 4.4% |
| 10 or more Apartments | 54,624 | 12.6% |
| Mobile Home / Other | 3,594 | 0.8% |
| Total | 432,239 | 100.0% |
Housing Structures by Occupancy in Area Code 401
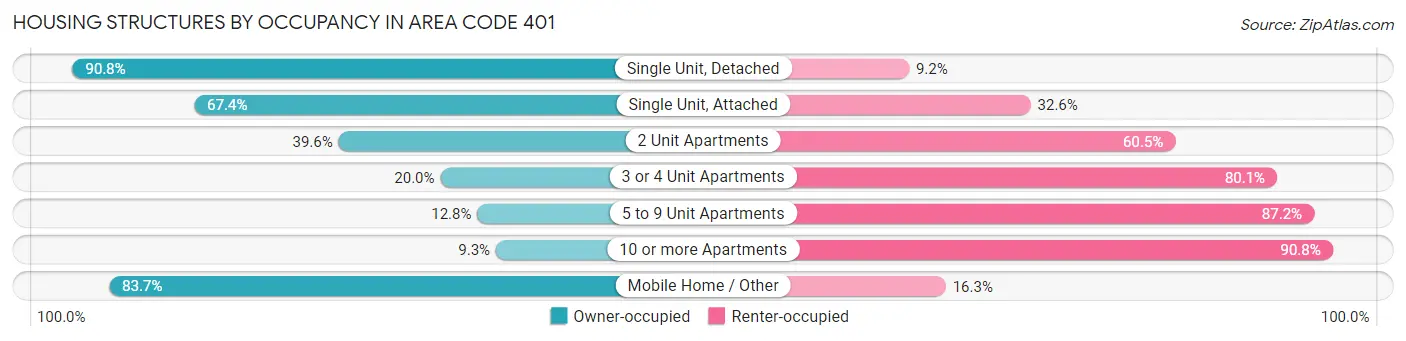
| Structure Type | Owner-occupied | Renter-occupied |
| Single Unit, Detached | 220,681 (90.8%) | 22,369 (9.2%) |
| Single Unit, Attached | 11,731 (67.4%) | 5,682 (32.6%) |
| 2 Unit Apartments | 18,544 (39.6%) | 28,343 (60.5%) |
| 3 or 4 Unit Apartments | 9,508 (20.0%) | 38,141 (80.0%) |
| 5 to 9 Unit Apartments | 2,443 (12.8%) | 16,579 (87.2%) |
| 10 or more Apartments | 5,054 (9.2%) | 49,570 (90.7%) |
| Mobile Home / Other | 3,009 (83.7%) | 585 (16.3%) |
| Total | 270,970 (62.7%) | 161,269 (37.3%) |
Housing Structures by Number of Rooms in Area Code 401
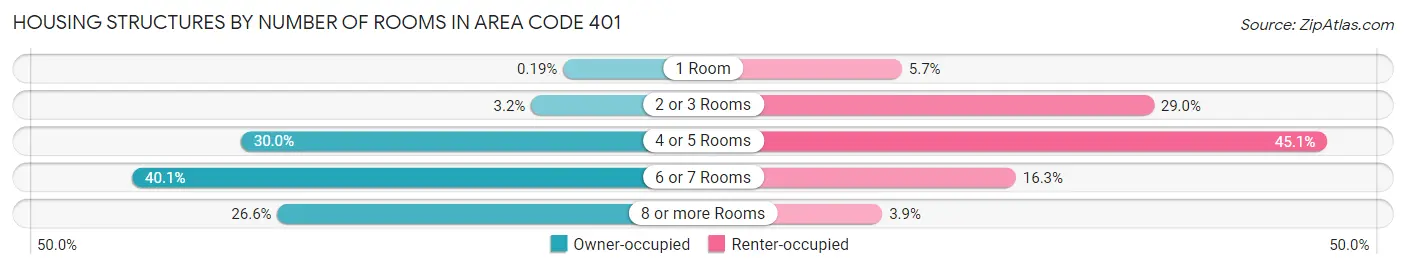
| Number of Rooms | Owner-occupied | Renter-occupied |
| 1 Room | 509 (0.2%) | 9,235 (5.7%) |
| 2 or 3 Rooms | 8,543 (3.2%) | 46,821 (29.0%) |
| 4 or 5 Rooms | 81,280 (30.0%) | 72,662 (45.1%) |
| 6 or 7 Rooms | 108,519 (40.1%) | 26,246 (16.3%) |
| 8 or more Rooms | 72,119 (26.6%) | 6,305 (3.9%) |
| Total | 270,970 (100.0%) | 161,269 (100.0%) |
Housing Structure by Heating Type in Area Code 401
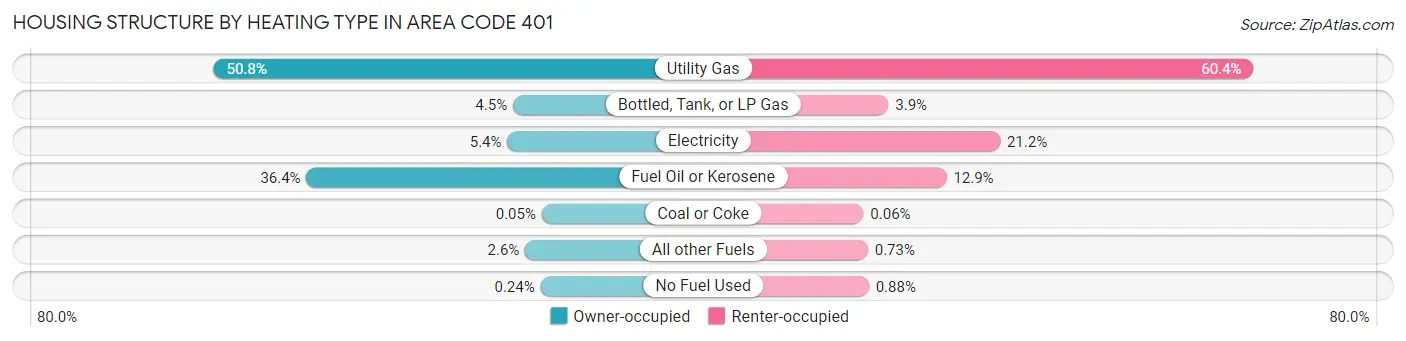
| Heating Type | Owner-occupied | Renter-occupied |
| Utility Gas | 137,594 (50.8%) | 97,332 (60.4%) |
| Bottled, Tank, or LP Gas | 12,206 (4.5%) | 6,313 (3.9%) |
| Electricity | 14,555 (5.4%) | 34,147 (21.2%) |
| Fuel Oil or Kerosene | 98,711 (36.4%) | 20,790 (12.9%) |
| Coal or Coke | 137 (0.1%) | 92 (0.1%) |
| All other Fuels | 7,108 (2.6%) | 1,170 (0.7%) |
| No Fuel Used | 659 (0.2%) | 1,425 (0.9%) |
| Total | 270,970 (100.0%) | 161,269 (100.0%) |
Household Vehicle Usage in Area Code 401
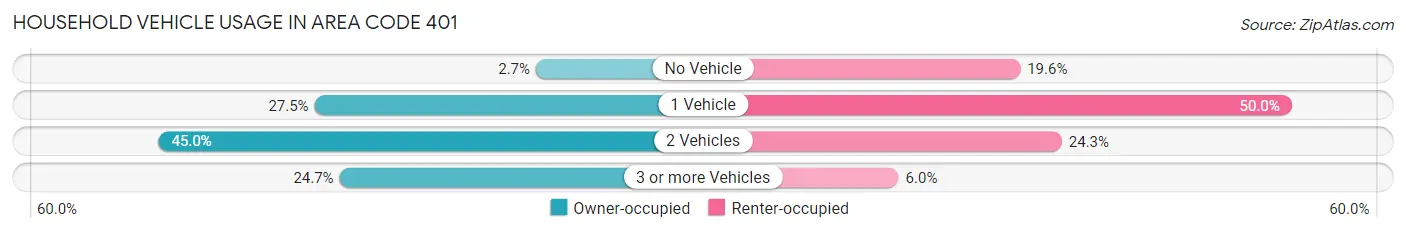
| Vehicles per Household | Owner-occupied | Renter-occupied |
| No Vehicle | 7,404 (2.7%) | 31,675 (19.6%) |
| 1 Vehicle | 74,604 (27.5%) | 80,683 (50.0%) |
| 2 Vehicles | 121,948 (45.0%) | 39,195 (24.3%) |
| 3 or more Vehicles | 67,014 (24.7%) | 9,716 (6.0%) |
| Total | 270,970 (100.0%) | 161,269 (100.0%) |
Real Estate & Mortgages in Area Code 401
Real Estate and Mortgage Overview in Area Code 401
| Characteristic | Without Mortgage | With Mortgage |
| Housing Units | 88,038 | 182,932 |
| Median Property Value | $25,152,300 | $26,969,000 |
| Median Household Income | $5,315,752 | $62,721 |
| Monthly Housing Costs | $56,554 | $31,738 |
| Real Estate Taxes | $314,090 | $2,061 |
Property Value by Mortgage Status in Area Code 401
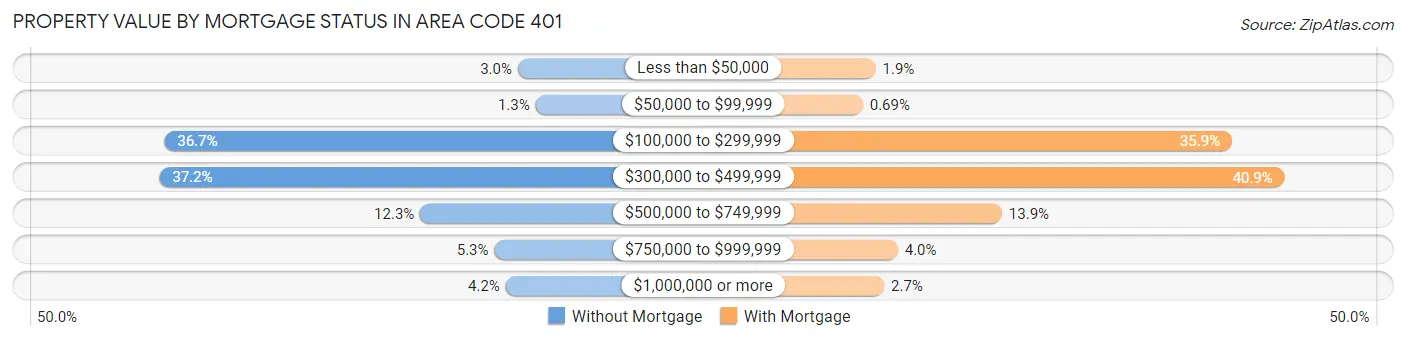
| Property Value | Without Mortgage | With Mortgage |
| Less than $50,000 | 2,666 (3.0%) | 3,489 (1.9%) |
| $50,000 to $99,999 | 1,177 (1.3%) | 1,256 (0.7%) |
| $100,000 to $299,999 | 32,303 (36.7%) | 65,590 (35.8%) |
| $300,000 to $499,999 | 32,723 (37.2%) | 74,760 (40.9%) |
| $500,000 to $749,999 | 10,858 (12.3%) | 25,497 (13.9%) |
| $750,000 to $999,999 | 4,635 (5.3%) | 7,360 (4.0%) |
| $1,000,000 or more | 3,676 (4.2%) | 4,980 (2.7%) |
| Total | 88,038 (100.0%) | 182,932 (100.0%) |
Household Income by Mortgage Status in Area Code 401
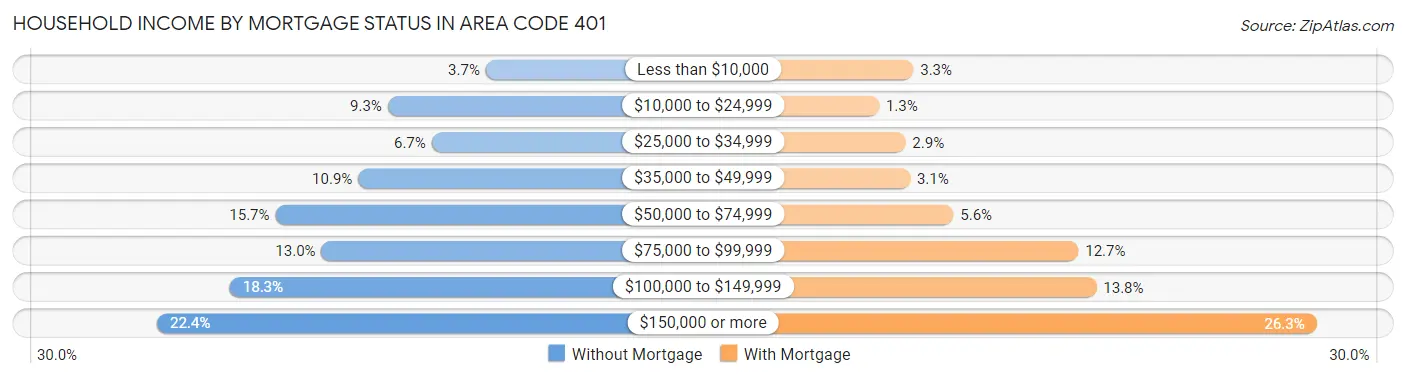
| Household Income | Without Mortgage | With Mortgage |
| Less than $10,000 | 3,217 (3.6%) | 6,035 (3.3%) |
| $10,000 to $24,999 | 8,147 (9.2%) | 2,454 (1.3%) |
| $25,000 to $34,999 | 5,936 (6.7%) | 5,209 (2.9%) |
| $35,000 to $49,999 | 9,634 (10.9%) | 5,689 (3.1%) |
| $50,000 to $74,999 | 13,792 (15.7%) | 10,221 (5.6%) |
| $75,000 to $99,999 | 11,484 (13.0%) | 23,290 (12.7%) |
| $100,000 to $149,999 | 16,082 (18.3%) | 25,171 (13.8%) |
| $150,000 or more | 19,746 (22.4%) | 48,177 (26.3%) |
| Total | 88,038 (100.0%) | 182,932 (100.0%) |
Property Value to Household Income Ratio in Area Code 401
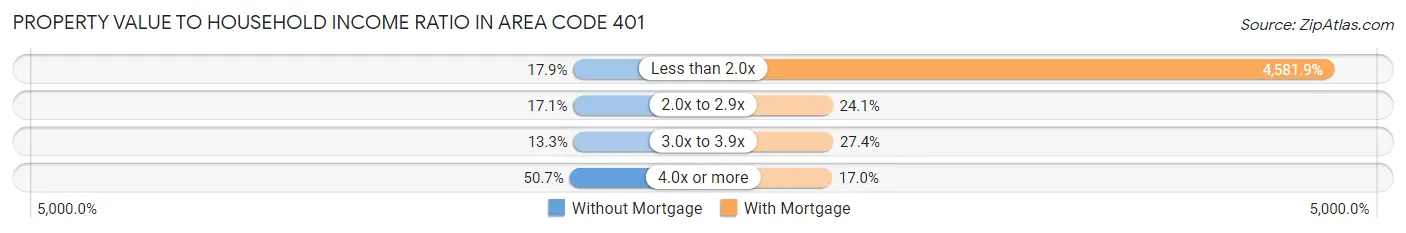
| Value-to-Income Ratio | Without Mortgage | With Mortgage |
| Less than 2.0x | 15,769 (17.9%) | 8,381,707 (4,581.9%) |
| 2.0x to 2.9x | 15,090 (17.1%) | 44,019 (24.1%) |
| 3.0x to 3.9x | 11,746 (13.3%) | 50,199 (27.4%) |
| 4.0x or more | 44,674 (50.7%) | 31,114 (17.0%) |
| Total | 88,038 (100.0%) | 182,932 (100.0%) |
Real Estate Taxes by Mortgage Status in Area Code 401
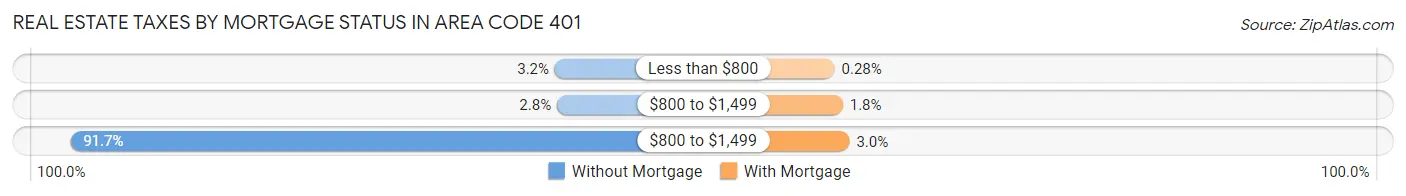
| Property Taxes | Without Mortgage | With Mortgage |
| Less than $800 | 2,777 (3.2%) | 513 (0.3%) |
| $800 to $1,499 | 2,432 (2.8%) | 3,251 (1.8%) |
| $800 to $1,499 | 80,708 (91.7%) | 5,491 (3.0%) |
| Total | 88,038 (100.0%) | 182,932 (100.0%) |
Health & Disability in Area Code 401
Health Insurance Coverage by Age in Area Code 401
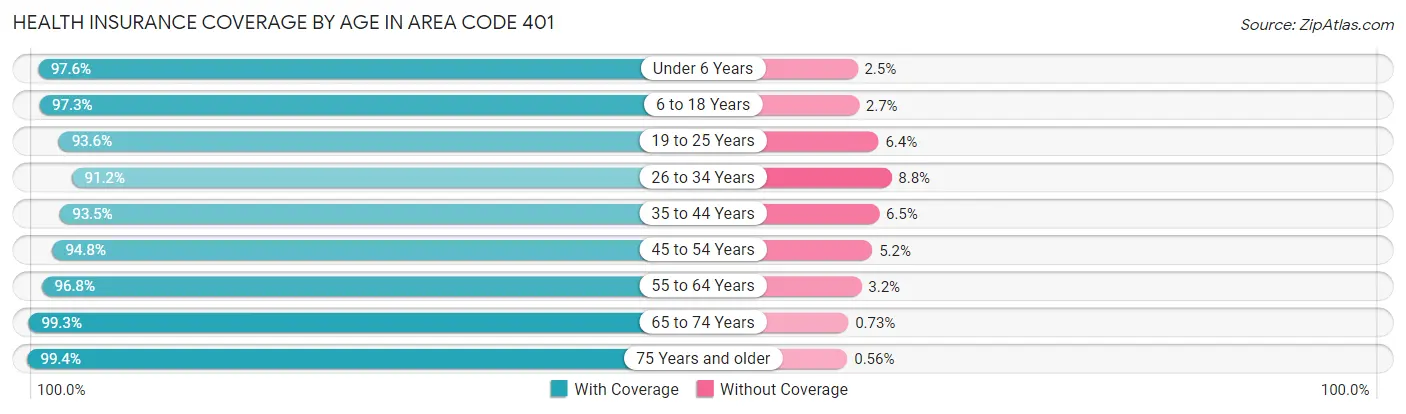
| Age Bracket | With Coverage | Without Coverage |
| Under 6 Years | 64,029 (97.6%) | 1,607 (2.5%) |
| 6 to 18 Years | 155,488 (97.3%) | 4,342 (2.7%) |
| 19 to 25 Years | 102,982 (93.6%) | 7,008 (6.4%) |
| 26 to 34 Years | 122,865 (91.2%) | 11,812 (8.8%) |
| 35 to 44 Years | 122,577 (93.5%) | 8,491 (6.5%) |
| 45 to 54 Years | 129,041 (94.8%) | 7,098 (5.2%) |
| 55 to 64 Years | 147,634 (96.8%) | 4,851 (3.2%) |
| 65 to 74 Years | 110,150 (99.3%) | 806 (0.7%) |
| 75 Years and older | 76,368 (99.4%) | 430 (0.6%) |
| Total | 1,031,134 (95.7%) | 46,445 (4.3%) |
Health Insurance Coverage by Citizenship Status in Area Code 401
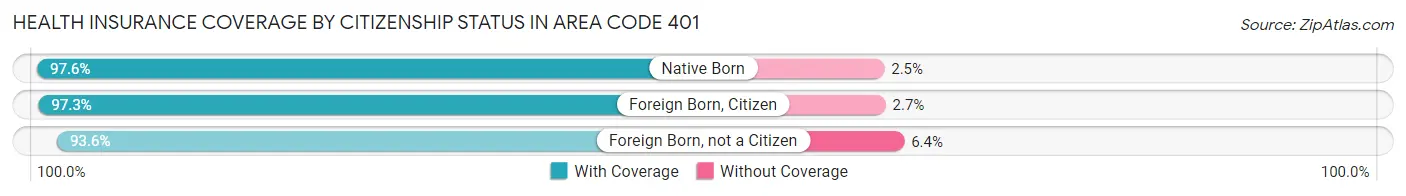
| Citizenship Status | With Coverage | Without Coverage |
| Native Born | 64,029 (97.6%) | 1,607 (2.5%) |
| Foreign Born, Citizen | 155,488 (97.3%) | 4,342 (2.7%) |
| Foreign Born, not a Citizen | 102,982 (93.6%) | 7,008 (6.4%) |
Health Insurance Coverage by Household Income in Area Code 401
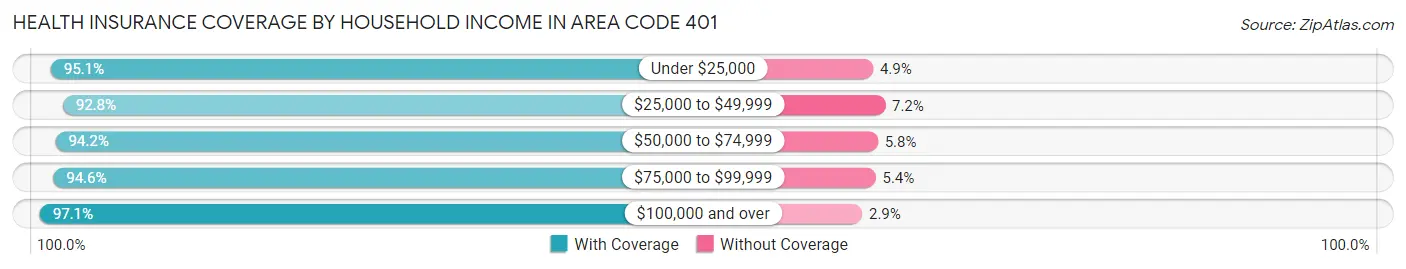
| Household Income | With Coverage | Without Coverage |
| Under $25,000 | 102,011 (95.1%) | 5,266 (4.9%) |
| $25,000 to $49,999 | 123,771 (92.8%) | 9,549 (7.2%) |
| $50,000 to $74,999 | 136,989 (94.2%) | 8,423 (5.8%) |
| $75,000 to $99,999 | 132,420 (94.6%) | 7,539 (5.4%) |
| $100,000 and over | 505,545 (97.1%) | 14,873 (2.9%) |
Public vs Private Health Insurance Coverage by Age in Area Code 401
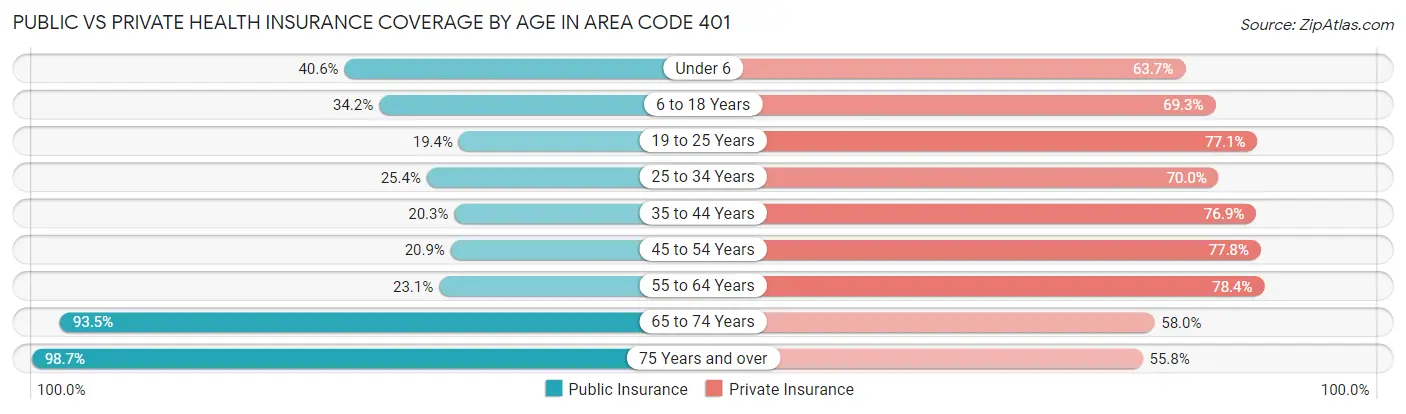
| Age Bracket | Public Insurance | Private Insurance |
| Under 6 | 26,670 (40.6%) | 41,801 (63.7%) |
| 6 to 18 Years | 54,676 (34.2%) | 110,806 (69.3%) |
| 19 to 25 Years | 21,342 (19.4%) | 84,843 (77.1%) |
| 25 to 34 Years | 34,156 (25.4%) | 94,208 (70.0%) |
| 35 to 44 Years | 26,546 (20.3%) | 100,797 (76.9%) |
| 45 to 54 Years | 28,467 (20.9%) | 105,887 (77.8%) |
| 55 to 64 Years | 35,183 (23.1%) | 119,569 (78.4%) |
| 65 to 74 Years | 103,684 (93.4%) | 64,351 (58.0%) |
| 75 Years and over | 75,781 (98.7%) | 42,871 (55.8%) |
| Total | 406,505 (37.7%) | 765,133 (71.0%) |
Disability Status by Sex by Age in Area Code 401
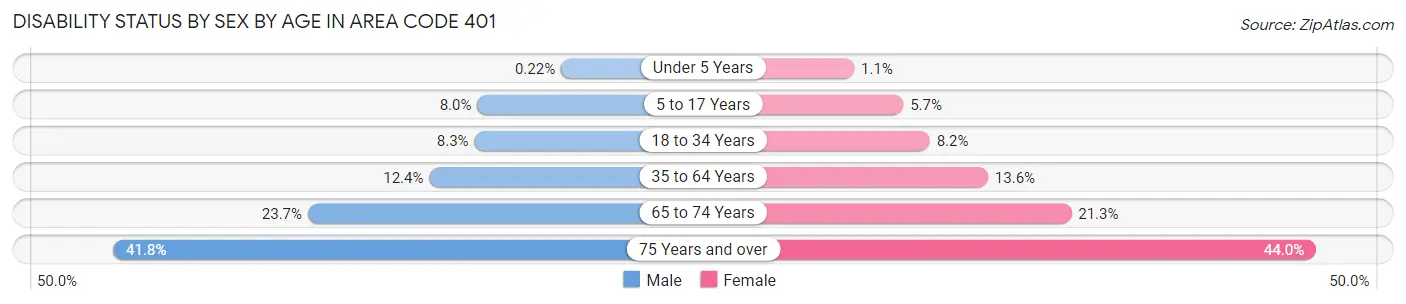
| Age Bracket | Male | Female |
| Under 5 Years | 61 (0.2%) | 304 (1.1%) |
| 5 to 17 Years | 6,331 (8.0%) | 4,257 (5.7%) |
| 18 to 34 Years | 10,816 (8.3%) | 10,672 (8.2%) |
| 35 to 64 Years | 25,714 (12.4%) | 28,870 (13.6%) |
| 65 to 74 Years | 12,422 (23.7%) | 12,472 (21.3%) |
| 75 Years and over | 12,651 (41.8%) | 20,477 (44.0%) |
Disability Class by Sex by Age in Area Code 401
Disability Class: Hearing Difficulty
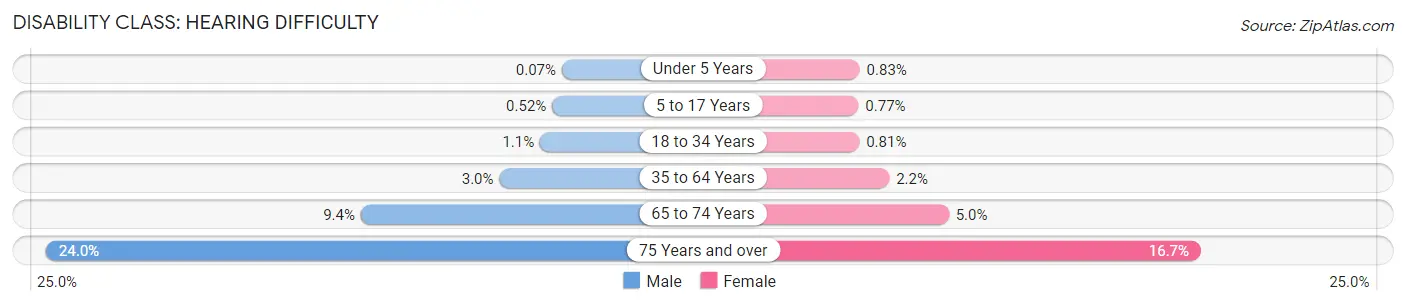
| Age Bracket | Male | Female |
| Under 5 Years | 20 (0.1%) | 220 (0.8%) |
| 5 to 17 Years | 414 (0.5%) | 579 (0.8%) |
| 18 to 34 Years | 1,411 (1.1%) | 1,061 (0.8%) |
| 35 to 64 Years | 6,135 (3.0%) | 4,679 (2.2%) |
| 65 to 74 Years | 4,924 (9.4%) | 2,902 (5.0%) |
| 75 Years and over | 7,269 (24.0%) | 7,752 (16.7%) |
Disability Class: Vision Difficulty
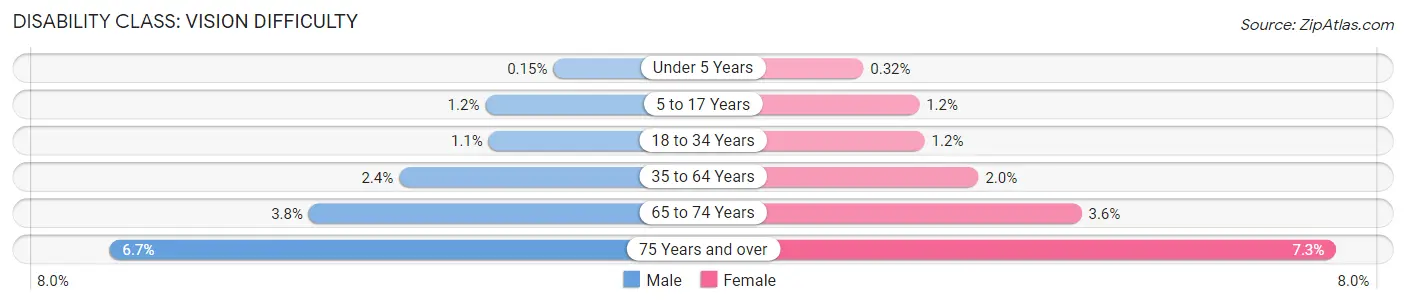
| Age Bracket | Male | Female |
| Under 5 Years | 41 (0.2%) | 84 (0.3%) |
| 5 to 17 Years | 917 (1.2%) | 862 (1.1%) |
| 18 to 34 Years | 1,452 (1.1%) | 1,611 (1.2%) |
| 35 to 64 Years | 5,044 (2.4%) | 4,326 (2.0%) |
| 65 to 74 Years | 1,983 (3.8%) | 2,082 (3.6%) |
| 75 Years and over | 2,041 (6.7%) | 3,415 (7.3%) |
Disability Class: Cognitive Difficulty
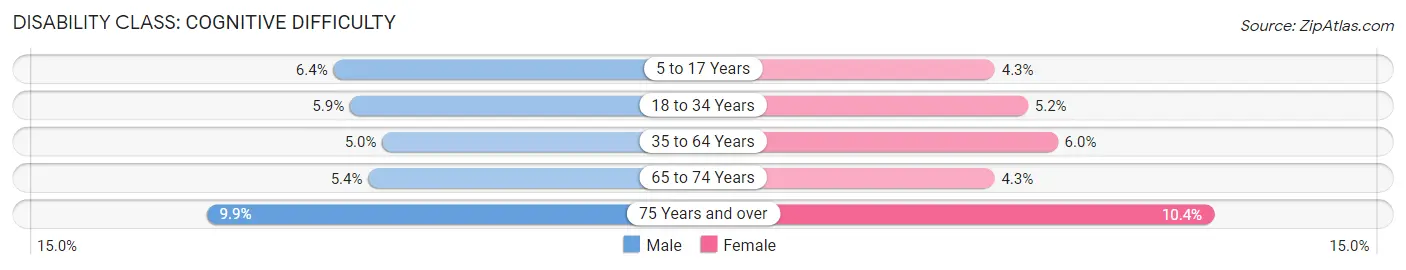
| Age Bracket | Male | Female |
| 5 to 17 Years | 5,073 (6.4%) | 3,183 (4.3%) |
| 18 to 34 Years | 7,792 (5.9%) | 6,779 (5.2%) |
| 35 to 64 Years | 10,427 (5.0%) | 12,804 (6.0%) |
| 65 to 74 Years | 2,847 (5.4%) | 2,488 (4.3%) |
| 75 Years and over | 3,006 (9.9%) | 4,819 (10.4%) |
Disability Class: Ambulatory Difficulty
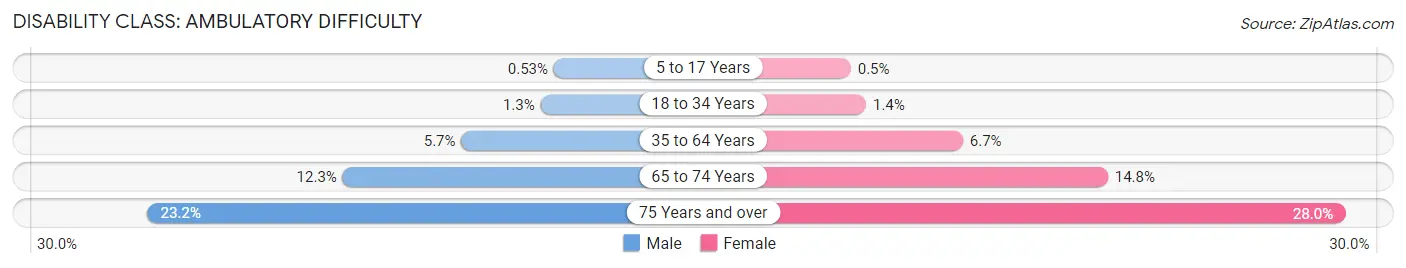
| Age Bracket | Male | Female |
| 5 to 17 Years | 420 (0.5%) | 370 (0.5%) |
| 18 to 34 Years | 1,672 (1.3%) | 1,771 (1.3%) |
| 35 to 64 Years | 11,734 (5.7%) | 14,348 (6.7%) |
| 65 to 74 Years | 6,438 (12.3%) | 8,671 (14.8%) |
| 75 Years and over | 7,009 (23.2%) | 13,037 (28.0%) |
Disability Class: Self-Care Difficulty
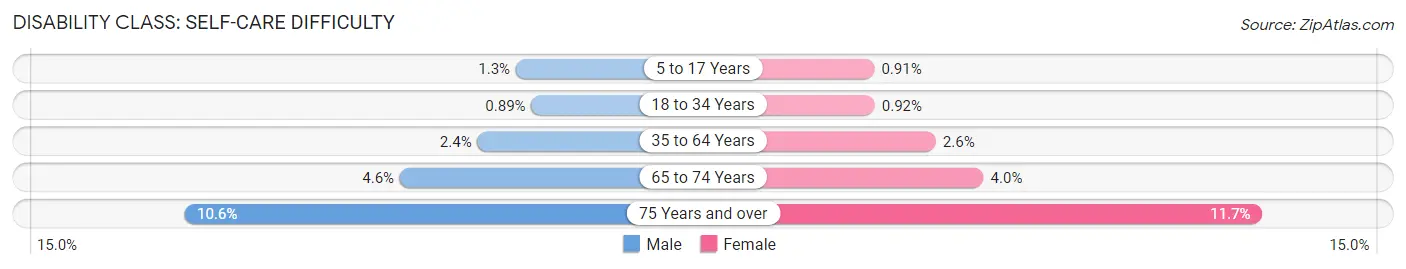
| Age Bracket | Male | Female |
| 5 to 17 Years | 1,045 (1.3%) | 683 (0.9%) |
| 18 to 34 Years | 1,163 (0.9%) | 1,203 (0.9%) |
| 35 to 64 Years | 4,942 (2.4%) | 5,578 (2.6%) |
| 65 to 74 Years | 2,384 (4.5%) | 2,312 (4.0%) |
| 75 Years and over | 3,197 (10.6%) | 5,449 (11.7%) |
Technology Access in Area Code 401
Computing Device Access in Area Code 401
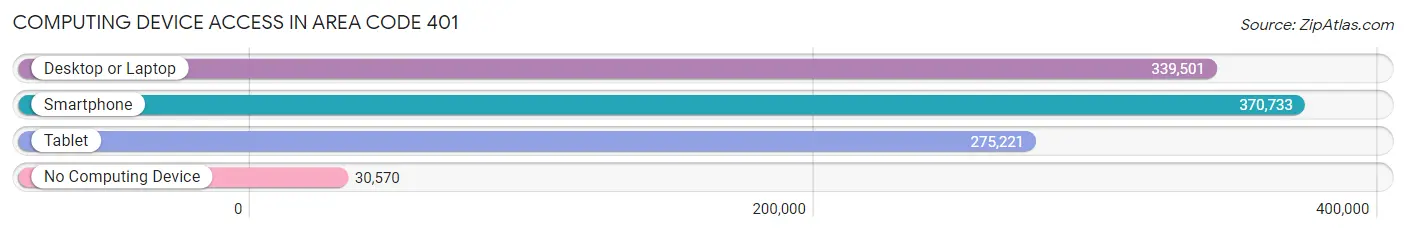
| Device Type | # Households | % Households |
| Desktop or Laptop | 339,501 | 78.5% |
| Smartphone | 370,733 | 85.8% |
| Tablet | 275,221 | 63.7% |
| No Computing Device | 30,570 | 7.1% |
| Total | 432,239 | 100.0% |
Internet Access in Area Code 401
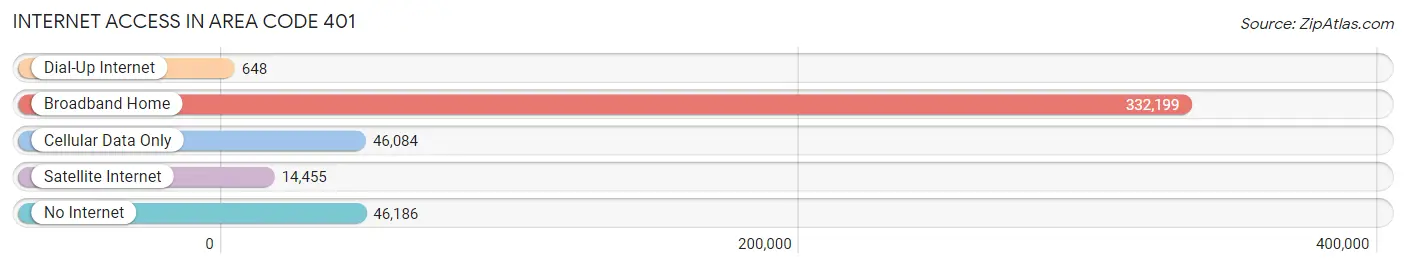
| Internet Type | # Households | % Households |
| Dial-Up Internet | 648 | 0.2% |
| Broadband Home | 332,199 | 76.9% |
| Cellular Data Only | 46,084 | 10.7% |
| Satellite Internet | 14,455 | 3.3% |
| No Internet | 46,186 | 10.7% |
| Total | 432,239 | 100.0% |
Area Code 401 Summary
Geography
Area code 401 is located in the state of Rhode Island. It covers the entire state, including the cities of Providence, Warwick, Cranston, and Pawtucket.
Social
Area code 401 is home to a diverse population of people from all walks of life. The area is known for its vibrant arts and culture scene, with many galleries, museums, and performing arts venues.
Economics
Area code 401 is a major economic hub in the region. It is home to a number of large corporations, including CVS Health, Citizens Bank, and Textron. The area also has a thriving tourism industry, with many popular attractions such as the Newport Mansions and the Roger Williams Park Zoo.
Demographics
Area code 401 is home to a population of over 1.1 million people. The population is largely white, with a significant Hispanic and African American population. The median household income is $60,000, and the median age is 38.
Common Questions
What is Per Capita Income in Area Code 401?
Per Capita income in Area Code 401 is $45,237.
What is the Median Family Income in Area Code 401?
Median Family Income in Area Code 401 is $111,793.
What is the Median Household income in Area Code 401?
Median Household Income in Area Code 401 is $92,091.
What is Income or Wage Gap in Area Code 401?
Income or Wage Gap in Area Code 401 is 27.2%.
Women in Area Code 401 earn 72.8 cents for every dollar earned by a man.
What is Family Income Deficit in Area Code 401?
Family Income Deficit in Area Code 401 is $9,672.
Families that are below poverty line in Area Code 401 earn $9,672 less on average than the poverty threshold level.
What is Inequality or Gini Index in Area Code 401?
Inequality or Gini Index in Area Code 401 is 30.75.
What is the Total Population of Area Code 401?
Total Population of Area Code 401 is 1,094,278.
What is the Total Male Population of Area Code 401?
Total Male Population of Area Code 401 is 537,229.
What is the Total Female Population of Area Code 401?
Total Female Population of Area Code 401 is 557,049.
What is the Ratio of Males per 100 Females in Area Code 401?
There are 96.44 Males per 100 Females in Area Code 401.
What is the Ratio of Females per 100 Males in Area Code 401?
There are 103.69 Females per 100 Males in Area Code 401.
What is the Median Population Age in Area Code 401?
Median Population Age in Area Code 401 is 42.9 Years.
What is the Average Family Size in Area Code 401
Average Family Size in Area Code 401 is 3.0 People.
What is the Average Household Size in Area Code 401
Average Household Size in Area Code 401 is 2.4 People.
How Large is the Labor Force in Area Code 401?
There are 588,477 People in the Labor Forcein in Area Code 401.
What is the Percentage of People in the Labor Force in Area Code 401?
64.5% of People are in the Labor Force in Area Code 401.
What is the Unemployment Rate in Area Code 401?
Unemployment Rate in Area Code 401 is 6.0%.