Area Code 336 Map & Demographics
Area Code 336 Map
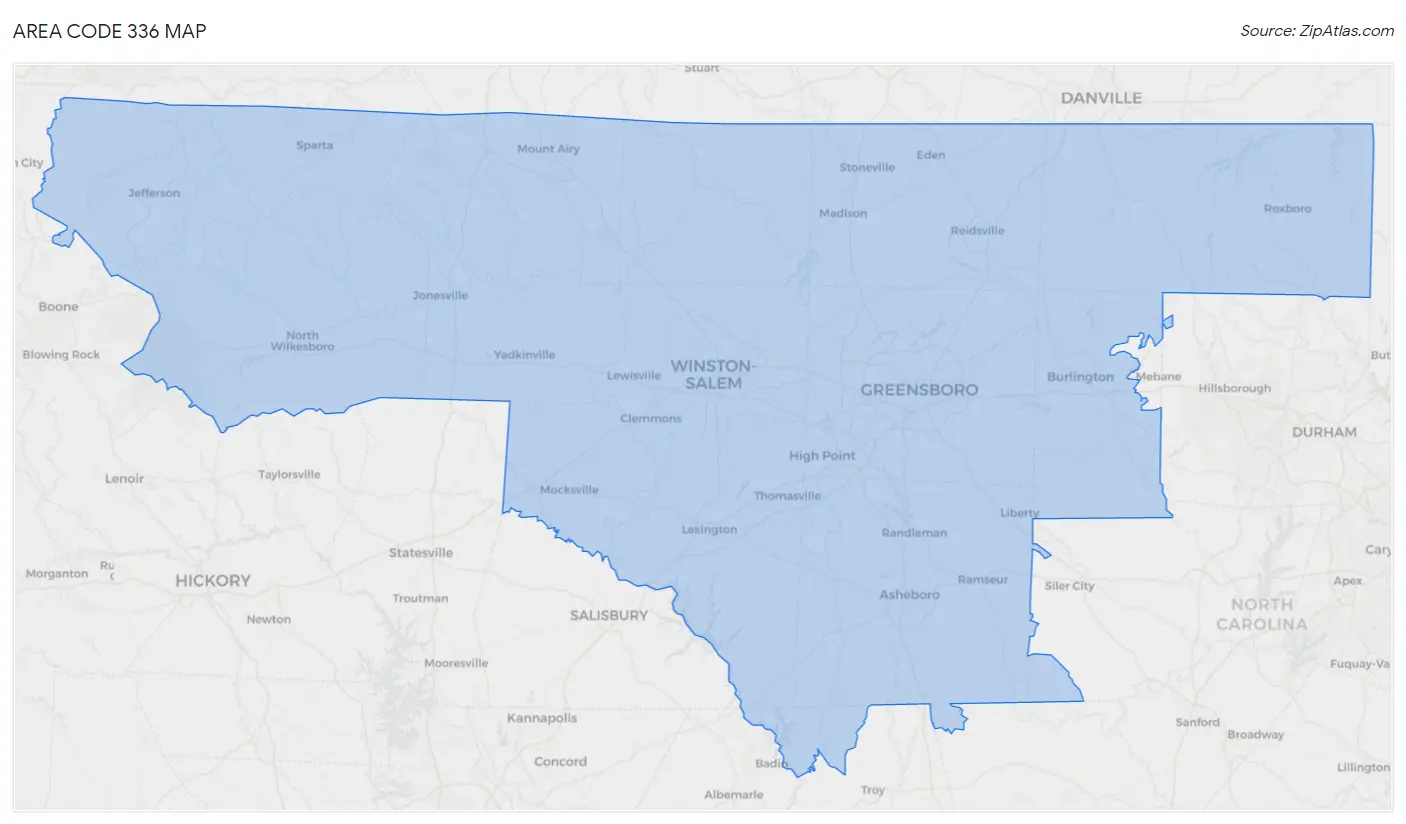
Area Code 336 Overview
$32,569
PER CAPITA INCOME
$76,094
AVG FAMILY INCOME
$61,840
AVG HOUSEHOLD INCOME
24.5%
WAGE / INCOME GAP [ % ]
75.5¢/ $1
WAGE / INCOME GAP [ $ ]
$10,582
FAMILY INCOME DEFICIT
60.61
INEQUALITY / GINI INDEX
1,909,585
TOTAL POPULATION
924,728
MALE POPULATION
984,857
FEMALE POPULATION
93.89
MALES / 100 FEMALES
106.50
FEMALES / 100 MALES
43.2
MEDIAN AGE
3.0
AVG FAMILY SIZE
2.5
AVG HOUSEHOLD SIZE
899,552
LABOR FORCE [ PEOPLE ]
58.2%
PERCENT IN LABOR FORCE
5.7%
UNEMPLOYMENT RATE
Income in Area Code 336
Income Overview in Area Code 336
Per Capita Income in Area Code 336 is $32,569, while median incomes of families and households are $76,094 and $61,840 respectively.
| Characteristic | Number | Measure |
| Per Capita Income | 1,909,585 | $32,569 |
| Median Family Income | 490,386 | $76,094 |
| Mean Family Income | 490,386 | $13,117,293 |
| Median Household Income | 761,333 | $61,840 |
| Mean Household Income | 761,333 | $11,317,494 |
| Income Deficit | 490,386 | $10,582 |
| Wage / Income Gap (%) | 1,909,585 | 24.50% |
| Wage / Income Gap ($) | 1,909,585 | 75.50¢ per $1 |
| Gini / Inequality Index | 1,909,585 | 60.61 |
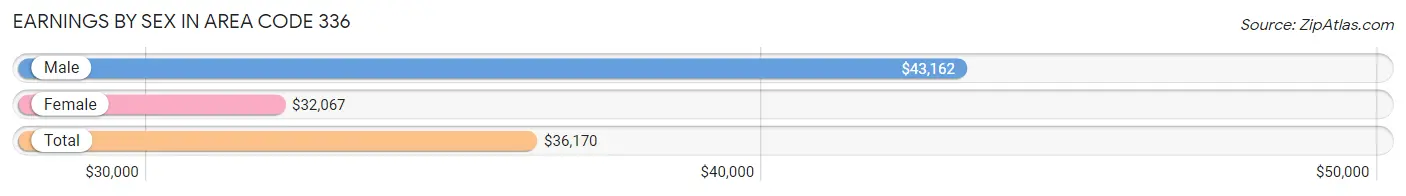
Earnings by Sex in Area Code 336
Average Earnings in Area Code 336 are $36,170, $43,162 for men and $32,067 for women, a difference of 25.7%.
| Sex | Number | Average Earnings |
| Male | 504,369 (51.5%) | $43,162 |
| Female | 474,329 (48.5%) | $32,067 |
| Total | 978,698 (100.0%) | $36,170 |
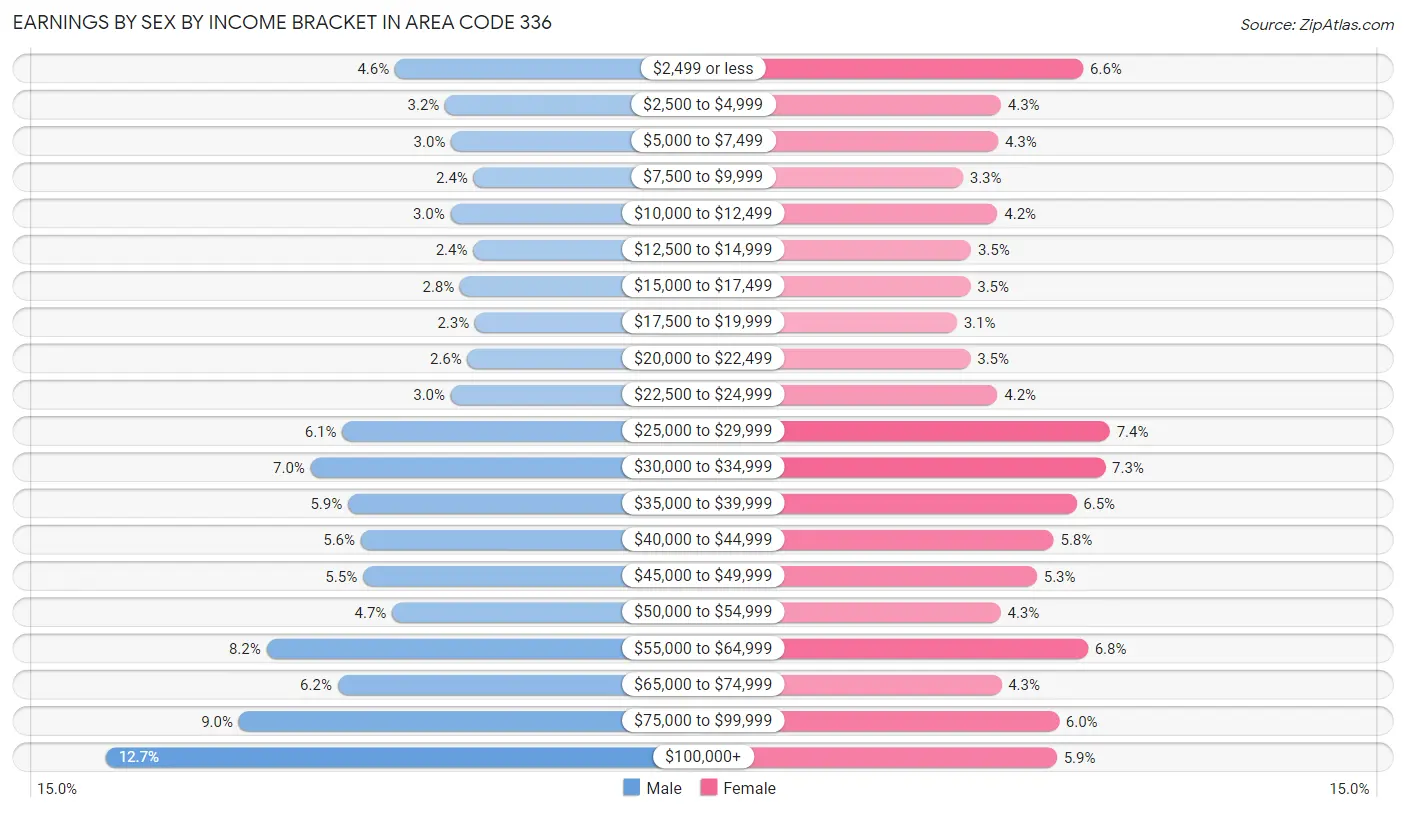
Earnings by Sex by Income Bracket in Area Code 336
The most common earnings brackets in Area Code 336 are $100,000+ for men (64,144 | 12.7%) and $25,000 to $29,999 for women (35,056 | 7.4%).
| Income | Male | Female |
| $2,499 or less | 23,164 (4.6%) | 31,518 (6.6%) |
| $2,500 to $4,999 | 16,034 (3.2%) | 20,527 (4.3%) |
| $5,000 to $7,499 | 15,182 (3.0%) | 20,156 (4.3%) |
| $7,500 to $9,999 | 11,983 (2.4%) | 15,458 (3.3%) |
| $10,000 to $12,499 | 15,295 (3.0%) | 20,065 (4.2%) |
| $12,500 to $14,999 | 12,036 (2.4%) | 16,573 (3.5%) |
| $15,000 to $17,499 | 13,900 (2.8%) | 16,442 (3.5%) |
| $17,500 to $19,999 | 11,814 (2.3%) | 14,649 (3.1%) |
| $20,000 to $22,499 | 12,858 (2.5%) | 16,467 (3.5%) |
| $22,500 to $24,999 | 15,232 (3.0%) | 20,050 (4.2%) |
| $25,000 to $29,999 | 30,611 (6.1%) | 35,056 (7.4%) |
| $30,000 to $34,999 | 35,084 (7.0%) | 34,420 (7.3%) |
| $35,000 to $39,999 | 29,810 (5.9%) | 30,583 (6.5%) |
| $40,000 to $44,999 | 28,012 (5.6%) | 27,559 (5.8%) |
| $45,000 to $49,999 | 27,711 (5.5%) | 25,347 (5.3%) |
| $50,000 to $54,999 | 23,566 (4.7%) | 20,482 (4.3%) |
| $55,000 to $64,999 | 41,374 (8.2%) | 32,131 (6.8%) |
| $65,000 to $74,999 | 31,280 (6.2%) | 20,579 (4.3%) |
| $75,000 to $99,999 | 45,279 (9.0%) | 28,260 (6.0%) |
| $100,000+ | 64,144 (12.7%) | 28,007 (5.9%) |
| Total | 504,369 (100.0%) | 474,329 (100.0%) |
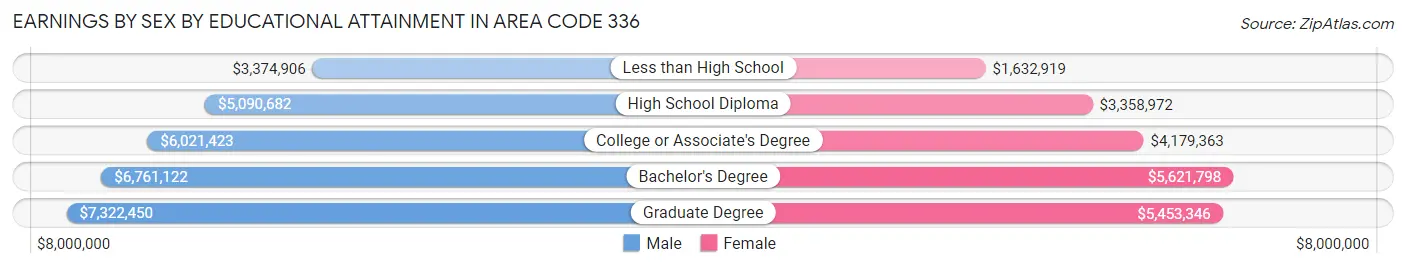
Earnings by Sex by Educational Attainment in Area Code 336
Average earnings in Area Code 336 are $6,646,125 for men and $4,991,852 for women, a difference of 24.9%. Men with an educational attainment of graduate degree enjoy the highest average annual earnings of $7,322,450, while those with less than high school education earn the least with $3,374,906. Women with an educational attainment of bachelor's degree earn the most with the average annual earnings of $5,621,798, while those with less than high school education have the smallest earnings of $1,632,919.
| Educational Attainment | Male Income | Female Income |
| Less than High School | $3,374,906 | $1,632,919 |
| High School Diploma | $5,090,682 | $3,358,972 |
| College or Associate's Degree | $6,021,423 | $4,179,363 |
| Bachelor's Degree | $6,761,122 | $5,621,798 |
| Graduate Degree | $7,322,450 | $5,453,346 |
| Total | $6,646,125 | $4,991,852 |
Family Income in Area Code 336
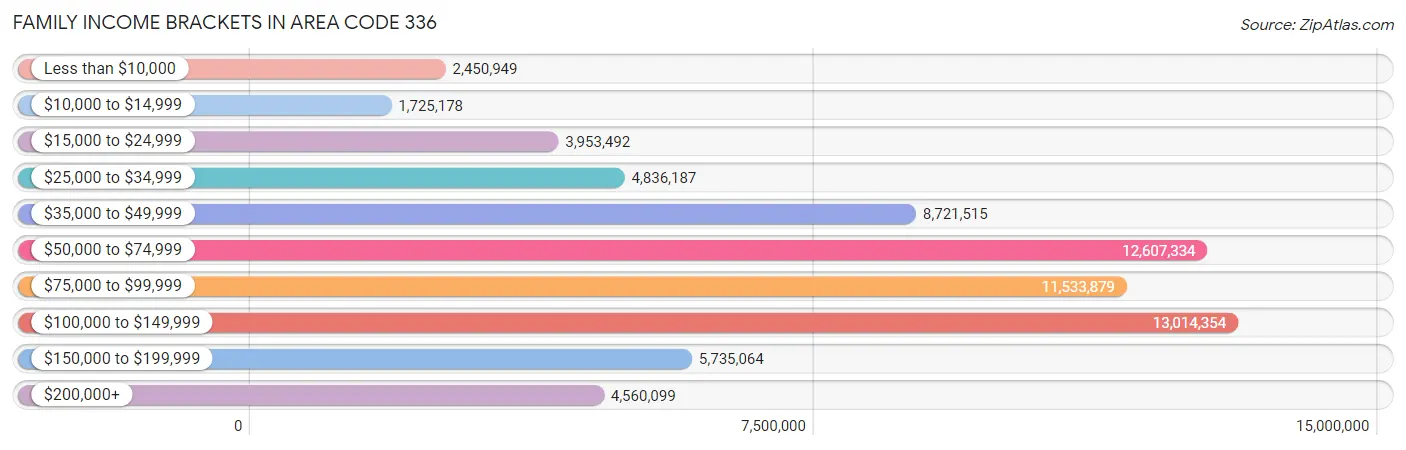
Family Income Brackets in Area Code 336
According to the Area Code 336 family income data, there are 13,014,354 families falling into the $100,000 to $149,999 income range, which is the most common income bracket and makes up 2,653.9% of all families. Conversely, the $10,000 to $14,999 income bracket is the least frequent group with only 1,725,178 families (351.8%) belonging to this category.
| Income Bracket | # Families | % Families |
| Less than $10,000 | 2,450,949 | 499.8% |
| $10,000 to $14,999 | 1,725,178 | 351.8% |
| $15,000 to $24,999 | 3,953,492 | 806.2% |
| $25,000 to $34,999 | 4,836,187 | 986.2% |
| $35,000 to $49,999 | 8,721,515 | 1,778.5% |
| $50,000 to $74,999 | 12,607,334 | 2,570.9% |
| $75,000 to $99,999 | 11,533,879 | 2,352.0% |
| $100,000 to $149,999 | 13,014,354 | 2,653.9% |
| $150,000 to $199,999 | 5,735,064 | 1,169.5% |
| $200,000+ | 4,560,099 | 929.9% |
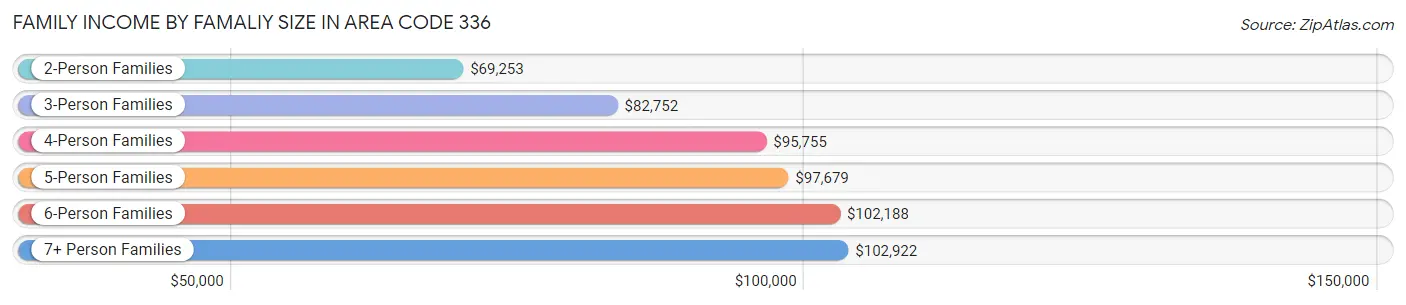
Family Income by Famaliy Size in Area Code 336
7+ person families (5,718 | 1.2%) account for the highest median family income in Area Code 336 with $102,922 per family, while 2-person families (249,749 | 50.9%) have the highest median income of $34,626 per family member.
| Income Bracket | # Families | Median Income |
| 2-Person Families | 249,749 (50.9%) | $69,253 |
| 3-Person Families | 111,238 (22.7%) | $82,752 |
| 4-Person Families | 78,188 (15.9%) | $95,755 |
| 5-Person Families | 32,490 (6.6%) | $97,679 |
| 6-Person Families | 13,003 (2.6%) | $102,188 |
| 7+ Person Families | 5,718 (1.2%) | $102,922 |
| Total | 490,386 (100.0%) | $76,094 |
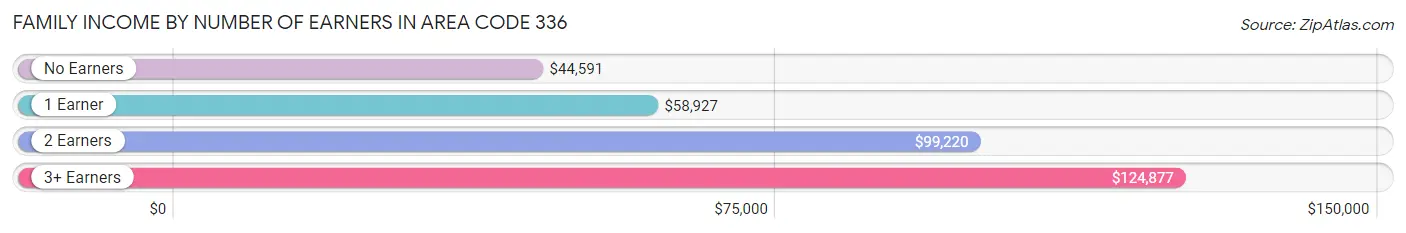
Family Income by Number of Earners in Area Code 336
The median family income in Area Code 336 is $76,094, with families comprising 3+ earners (46,675) having the highest median family income of $124,877, while families with no earners (85,042) have the lowest median family income of $44,591, accounting for 9.5% and 17.3% of families, respectively.
| Number of Earners | # Families | Median Income |
| No Earners | 85,042 (17.3%) | $44,591 |
| 1 Earner | 165,245 (33.7%) | $58,927 |
| 2 Earners | 193,424 (39.4%) | $99,220 |
| 3+ Earners | 46,675 (9.5%) | $124,877 |
| Total | 490,386 (100.0%) | $76,094 |
Household Income in Area Code 336
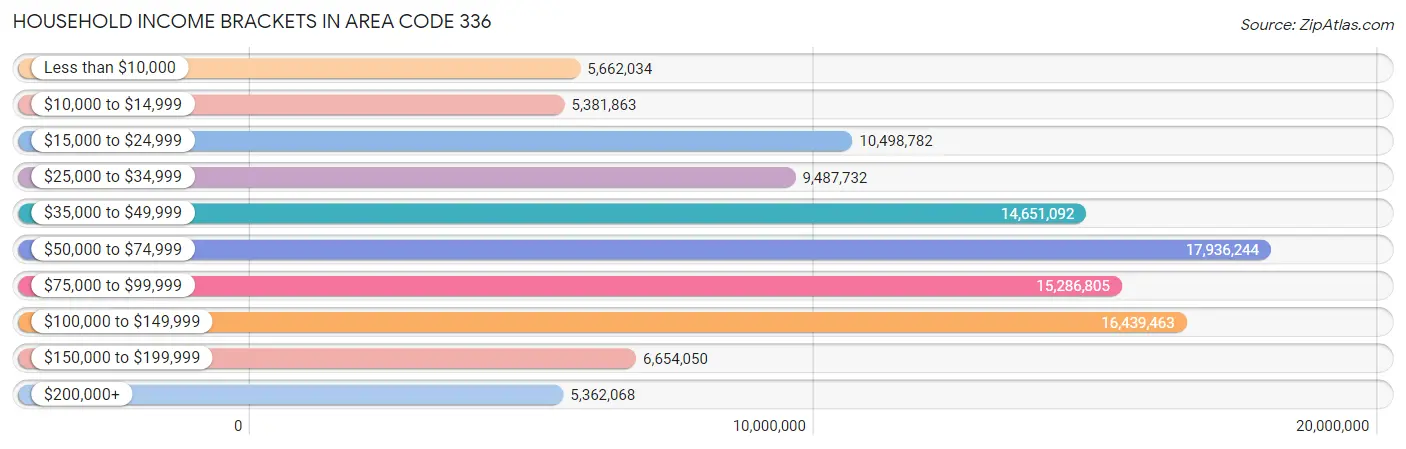
Household Income Brackets in Area Code 336
With 17,936,244 households falling in the category, the $50,000 to $74,999 income range is the most frequent in Area Code 336, accounting for 2,355.9% of all households. In contrast, only 5,362,068 households (704.3%) fall into the $200,000+ income bracket, making it the least populous group.
| Income Bracket | # Households | % Households |
| Less than $10,000 | 5,662,034 | 743.7% |
| $10,000 to $14,999 | 5,381,863 | 706.9% |
| $15,000 to $24,999 | 10,498,782 | 1,379.0% |
| $25,000 to $34,999 | 9,487,732 | 1,246.2% |
| $35,000 to $49,999 | 14,651,092 | 1,924.4% |
| $50,000 to $74,999 | 17,936,244 | 2,355.9% |
| $75,000 to $99,999 | 15,286,805 | 2,007.9% |
| $100,000 to $149,999 | 16,439,463 | 2,159.3% |
| $150,000 to $199,999 | 6,654,050 | 874.0% |
| $200,000+ | 5,362,068 | 704.3% |
Household Income by Householder Age in Area Code 336
The median household income in Area Code 336 is $61,840, with the highest median household income of $73,904 found in the 45 to 64 years age bracket for the primary householder. A total of 292,194 households (38.4%) fall into this category. Meanwhile, the 15 to 24 years age bracket for the primary householder has the lowest median household income of $42,573, with 28,099 households (3.7%) in this group.
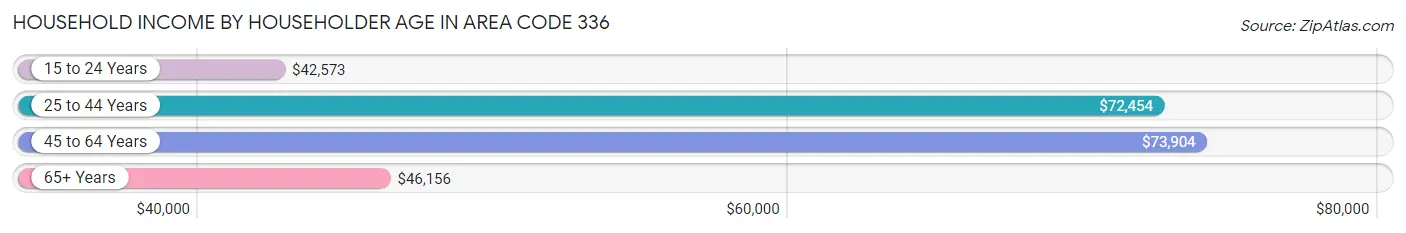
| Income Bracket | # Households | Median Income |
| 15 to 24 Years | 28,099 (3.7%) | $42,573 |
| 25 to 44 Years | 223,696 (29.4%) | $72,454 |
| 45 to 64 Years | 292,194 (38.4%) | $73,904 |
| 65+ Years | 217,344 (28.5%) | $46,156 |
| Total | 761,333 (100.0%) | $61,840 |
Poverty in Area Code 336
Income Below Poverty by Sex and Age in Area Code 336
With 13.6% poverty level for males and 16.8% for females among the residents of Area Code 336, 5 year old males and under 5 year old females are the most vulnerable to poverty, with 2,592 males (26.0%) and 13,061 females (26.2%) in their respective age groups living below the poverty level.
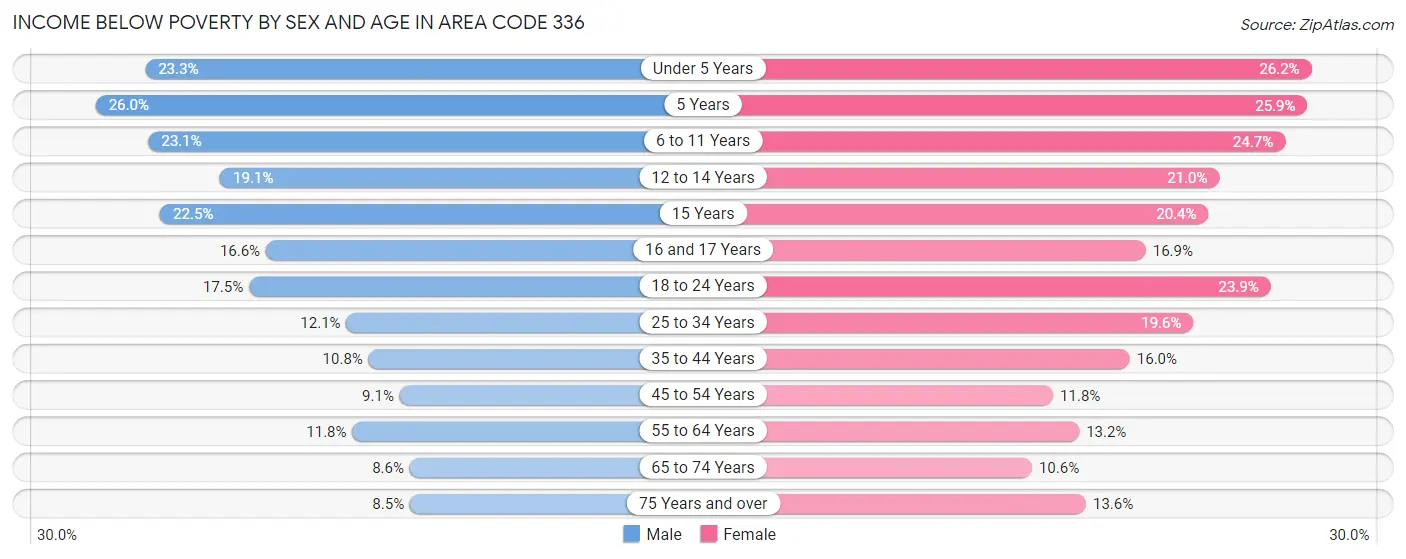
| Age Bracket | Male | Female |
| Under 5 Years | 12,087 (23.3%) | 13,061 (26.2%) |
| 5 Years | 2,592 (26.0%) | 2,385 (25.9%) |
| 6 to 11 Years | 16,282 (23.1%) | 16,212 (24.7%) |
| 12 to 14 Years | 7,041 (19.1%) | 7,812 (21.0%) |
| 15 Years | 2,931 (22.5%) | 2,531 (20.4%) |
| 16 and 17 Years | 4,129 (16.6%) | 4,128 (16.9%) |
| 18 to 24 Years | 13,725 (17.5%) | 18,730 (23.9%) |
| 25 to 34 Years | 13,766 (12.1%) | 23,636 (19.6%) |
| 35 to 44 Years | 11,541 (10.8%) | 18,230 (16.0%) |
| 45 to 54 Years | 11,070 (9.1%) | 15,031 (11.8%) |
| 55 to 64 Years | 14,831 (11.7%) | 17,628 (13.2%) |
| 65 to 74 Years | 7,793 (8.6%) | 11,238 (10.6%) |
| 75 Years and over | 4,700 (8.5%) | 10,907 (13.6%) |
| Total | 122,488 (13.6%) | 161,529 (16.8%) |
Income Above Poverty by Sex and Age in Area Code 336
According to the poverty statistics in Area Code 336, males aged 75 years and over and females aged 65 to 74 years are the age groups that are most secure financially, with 91.5% of males and 89.4% of females in these age groups living above the poverty line.
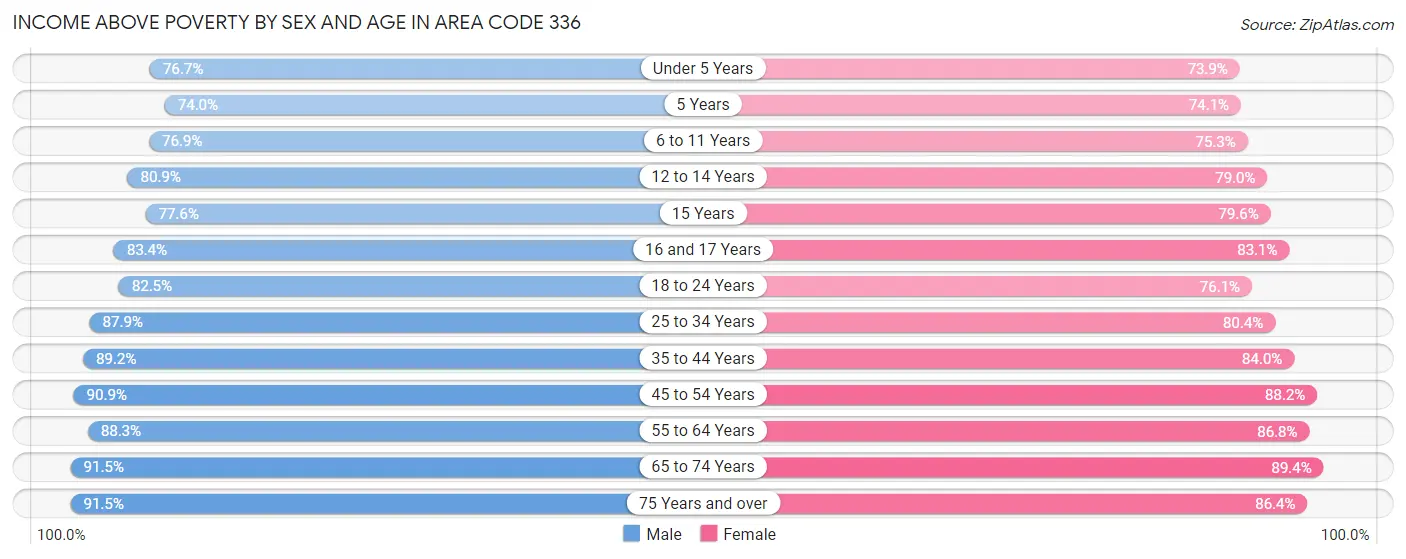
| Age Bracket | Male | Female |
| Under 5 Years | 39,835 (76.7%) | 36,892 (73.9%) |
| 5 Years | 7,363 (74.0%) | 6,818 (74.1%) |
| 6 to 11 Years | 54,179 (76.9%) | 49,474 (75.3%) |
| 12 to 14 Years | 29,809 (80.9%) | 29,356 (79.0%) |
| 15 Years | 10,126 (77.5%) | 9,868 (79.6%) |
| 16 and 17 Years | 20,798 (83.4%) | 20,251 (83.1%) |
| 18 to 24 Years | 64,698 (82.5%) | 59,708 (76.1%) |
| 25 to 34 Years | 100,203 (87.9%) | 97,140 (80.4%) |
| 35 to 44 Years | 94,973 (89.2%) | 95,458 (84.0%) |
| 45 to 54 Years | 110,419 (90.9%) | 112,631 (88.2%) |
| 55 to 64 Years | 111,356 (88.2%) | 115,735 (86.8%) |
| 65 to 74 Years | 83,354 (91.4%) | 94,884 (89.4%) |
| 75 Years and over | 50,334 (91.5%) | 69,270 (86.4%) |
| Total | 777,447 (86.4%) | 797,485 (83.2%) |
Income Below Poverty Among Married-Couple Families in Area Code 336
The poverty statistics for married-couple families in Area Code 336 show that 5.4% or 19,028 of the total 352,381 families live below the poverty line. Families with 5 or more children have the highest poverty rate of 30.8%, comprising of 648 families. On the other hand, families with no children have the lowest poverty rate of 3.9%, which includes 8,525 families.
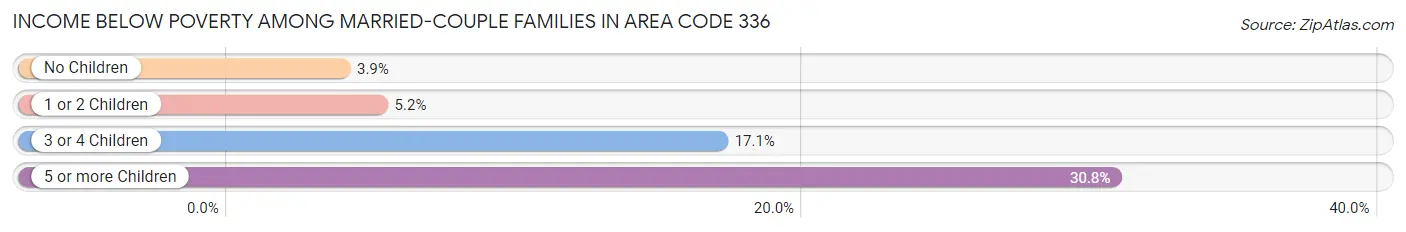
| Children | Above Poverty | Below Poverty |
| No Children | 210,190 (96.1%) | 8,525 (3.9%) |
| 1 or 2 Children | 100,711 (94.8%) | 5,540 (5.2%) |
| 3 or 4 Children | 20,995 (83.0%) | 4,315 (17.1%) |
| 5 or more Children | 1,457 (69.2%) | 648 (30.8%) |
| Total | 333,353 (94.6%) | 19,028 (5.4%) |
Income Below Poverty Among Single-Parent Households in Area Code 336
According to the poverty data in Area Code 336, 16.0% or 5,809 single-father households and 29.4% or 29,932 single-mother households are living below the poverty line. Among single-father households, those with 5 or more children have the highest poverty rate, with 123 households (62.1%) experiencing poverty. Likewise, among single-mother households, those with 5 or more children have the highest poverty rate, with 982 households (86.7%) falling below the poverty line.
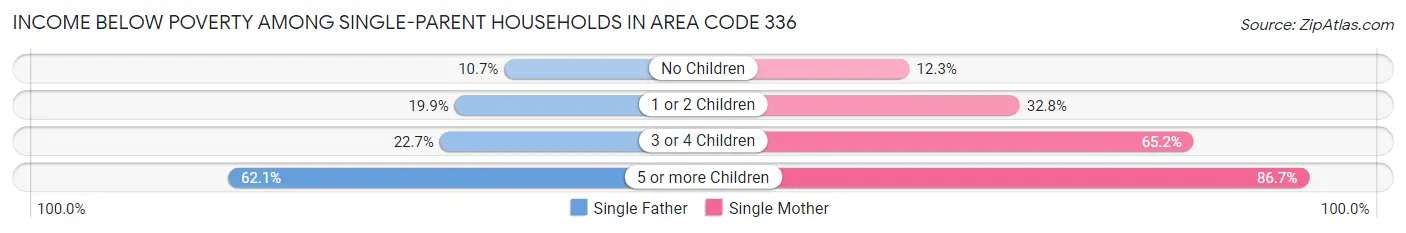
| Children | Single Father | Single Mother |
| No Children | 1,796 (10.7%) | 4,464 (12.3%) |
| 1 or 2 Children | 3,406 (19.9%) | 17,679 (32.8%) |
| 3 or 4 Children | 484 (22.7%) | 6,807 (65.2%) |
| 5 or more Children | 123 (62.1%) | 982 (86.7%) |
| Total | 5,809 (16.0%) | 29,932 (29.4%) |
Income Below Poverty Among Married-Couple vs Single-Parent Households in Area Code 336
The poverty data for Area Code 336 shows that 19,028 of the married-couple family households (5.4%) and 35,741 of the single-parent households (25.9%) are living below the poverty level. Within the married-couple family households, those with 5 or more children have the highest poverty rate, with 648 households (30.8%) falling below the poverty line. Among the single-parent households, those with 5 or more children have the highest poverty rate, with 1,105 household (83.0%) living below poverty.
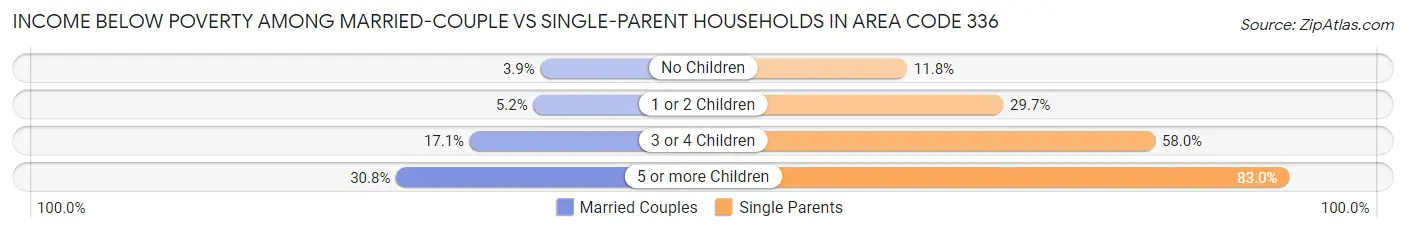
| Children | Married-Couple Families | Single-Parent Households |
| No Children | 8,525 (3.9%) | 6,260 (11.8%) |
| 1 or 2 Children | 5,540 (5.2%) | 21,085 (29.7%) |
| 3 or 4 Children | 4,315 (17.1%) | 7,291 (58.0%) |
| 5 or more Children | 648 (30.8%) | 1,105 (83.0%) |
| Total | 19,028 (5.4%) | 35,741 (25.9%) |
Race in Area Code 336
The most populous races in Area Code 336 are White / Caucasian (1,287,634 | 67.4%), Black / African American (395,052 | 20.7%), and Hispanic or Latino (189,406 | 9.9%).
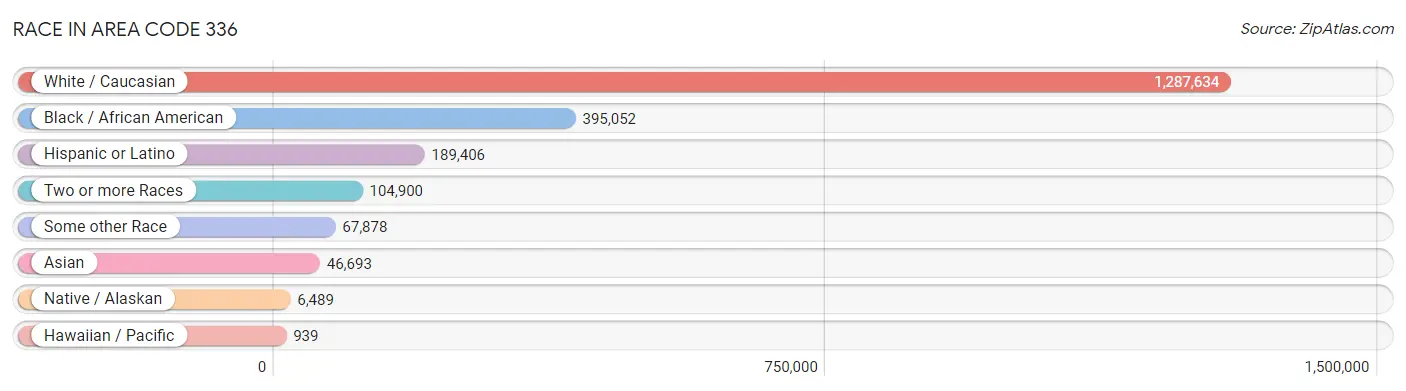
| Race | # Population | % Population |
| Asian | 46,693 | 2.5% |
| Black / African American | 395,052 | 20.7% |
| Hawaiian / Pacific | 939 | 0.1% |
| Hispanic or Latino | 189,406 | 9.9% |
| Native / Alaskan | 6,489 | 0.3% |
| White / Caucasian | 1,287,634 | 67.4% |
| Two or more Races | 104,900 | 5.5% |
| Some other Race | 67,878 | 3.5% |
| Total | 1,909,585 | 100.0% |
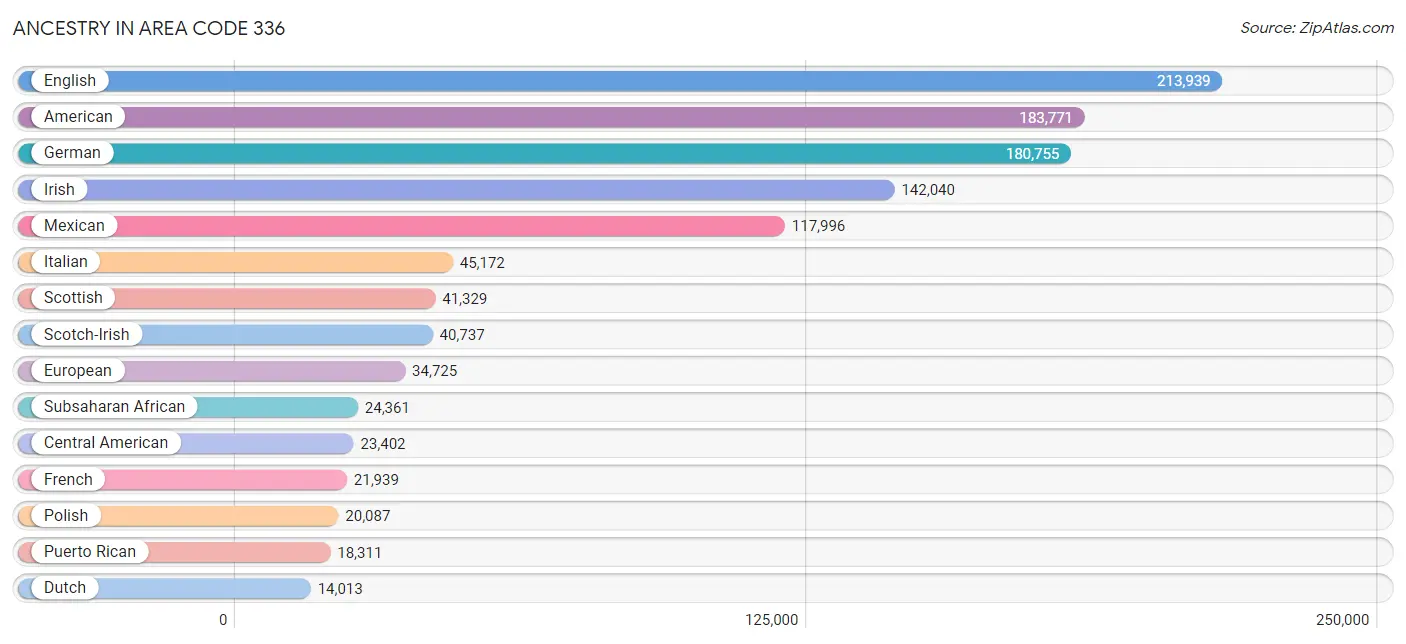
Ancestry in Area Code 336
The most populous ancestries reported in Area Code 336 are English (213,939 | 11.2%), American (183,771 | 9.6%), German (180,755 | 9.5%), Irish (142,040 | 7.4%), and Mexican (117,996 | 6.2%), together accounting for 43.9% of all Area Code 336 residents.
| Ancestry | # Population | % Population |
| Afghan | 282 | 0.0% |
| African | 12,358 | 0.6% |
| Alaska Native | 14 | 0.0% |
| Alaskan Athabascan | 4 | 0.0% |
| Albanian | 255 | 0.0% |
| Aleut | 21 | 0.0% |
| Alsatian | 31 | 0.0% |
| American | 183,771 | 9.6% |
| Apache | 318 | 0.0% |
| Arab | 6,127 | 0.3% |
| Argentinean | 832 | 0.0% |
| Armenian | 413 | 0.0% |
| Assyrian / Chaldean / Syriac | 34 | 0.0% |
| Australian | 458 | 0.0% |
| Austrian | 1,384 | 0.1% |
| Bahamian | 218 | 0.0% |
| Bangladeshi | 1,149 | 0.1% |
| Barbadian | 530 | 0.0% |
| Basque | 62 | 0.0% |
| Belgian | 845 | 0.0% |
| Belizean | 69 | 0.0% |
| Bermudan | 61 | 0.0% |
| Bhutanese | 2,278 | 0.1% |
| Blackfeet | 1,378 | 0.1% |
| Bolivian | 120 | 0.0% |
| Brazilian | 874 | 0.1% |
| British | 8,954 | 0.5% |
| British West Indian | 574 | 0.0% |
| Bulgarian | 311 | 0.0% |
| Burmese | 3,606 | 0.2% |
| Cajun | 106 | 0.0% |
| Cambodian | 45 | 0.0% |
| Canadian | 2,649 | 0.1% |
| Cape Verdean | 127 | 0.0% |
| Carpatho Rusyn | 8 | 0.0% |
| Celtic | 139 | 0.0% |
| Central American | 23,402 | 1.2% |
| Central American Indian | 1,139 | 0.1% |
| Cherokee | 9,166 | 0.5% |
| Chickasaw | 25 | 0.0% |
| Chilean | 433 | 0.0% |
| Chippewa | 227 | 0.0% |
| Choctaw | 386 | 0.0% |
| Colombian | 4,559 | 0.2% |
| Comanche | 24 | 0.0% |
| Costa Rican | 743 | 0.0% |
| Cree | 14 | 0.0% |
| Creek | 428 | 0.0% |
| Croatian | 1,013 | 0.1% |
| Crow | 18 | 0.0% |
| Cuban | 4,082 | 0.2% |
| Czech | 2,006 | 0.1% |
| Czechoslovakian | 841 | 0.0% |
| Danish | 2,074 | 0.1% |
| Delaware | 56 | 0.0% |
| Dominican | 4,783 | 0.3% |
| Dutch | 14,013 | 0.7% |
| Dutch West Indian | 20 | 0.0% |
| Eastern European | 2,403 | 0.1% |
| Ecuadorian | 1,292 | 0.1% |
| Egyptian | 1,164 | 0.1% |
| English | 213,939 | 11.2% |
| Estonian | 169 | 0.0% |
| Ethiopian | 498 | 0.0% |
| European | 34,725 | 1.8% |
| Filipino | 571 | 0.0% |
| Finnish | 1,301 | 0.1% |
| French | 21,939 | 1.1% |
| French American Indian | 39 | 0.0% |
| French Canadian | 5,319 | 0.3% |
| German | 180,755 | 9.5% |
| German Russian | 94 | 0.0% |
| Ghanaian | 594 | 0.0% |
| Greek | 4,489 | 0.2% |
| Guamanian / Chamorro | 611 | 0.0% |
| Guatemalan | 3,726 | 0.2% |
| Guyanese | 590 | 0.0% |
| Haitian | 1,035 | 0.1% |
| Hmong | 13 | 0.0% |
| Honduran | 4,476 | 0.2% |
| Hungarian | 3,270 | 0.2% |
| Icelander | 121 | 0.0% |
| Indian (Asian) | 8,098 | 0.4% |
| Indonesian | 976 | 0.1% |
| Inupiat | 16 | 0.0% |
| Iranian | 759 | 0.0% |
| Iraqi | 345 | 0.0% |
| Irish | 142,040 | 7.4% |
| Iroquois | 350 | 0.0% |
| Israeli | 343 | 0.0% |
| Italian | 45,172 | 2.4% |
| Jamaican | 3,146 | 0.2% |
| Japanese | 2,781 | 0.2% |
| Jordanian | 406 | 0.0% |
| Kenyan | 248 | 0.0% |
| Korean | 6,253 | 0.3% |
| Laotian | 151 | 0.0% |
| Latvian | 111 | 0.0% |
| Lebanese | 1,208 | 0.1% |
| Liberian | 459 | 0.0% |
| Lithuanian | 1,248 | 0.1% |
| Lumbee | 2,120 | 0.1% |
| Luxembourger | 42 | 0.0% |
| Macedonian | 69 | 0.0% |
| Malaysian | 2,085 | 0.1% |
| Maltese | 79 | 0.0% |
| Menominee | 8 | 0.0% |
| Mexican | 117,996 | 6.2% |
| Mexican American Indian | 1,663 | 0.1% |
| Mongolian | 261 | 0.0% |
| Moroccan | 681 | 0.0% |
| Native Hawaiian | 784 | 0.0% |
| Navajo | 269 | 0.0% |
| New Zealander | 140 | 0.0% |
| Nicaraguan | 1,135 | 0.1% |
| Nigerian | 3,872 | 0.2% |
| Northern European | 1,393 | 0.1% |
| Norwegian | 6,728 | 0.4% |
| Okinawan | 18 | 0.0% |
| Osage | 4 | 0.0% |
| Pakistani | 1,151 | 0.1% |
| Palestinian | 139 | 0.0% |
| Panamanian | 719 | 0.0% |
| Pennsylvania German | 426 | 0.0% |
| Peruvian | 1,079 | 0.1% |
| Polish | 20,087 | 1.1% |
| Portuguese | 2,145 | 0.1% |
| Potawatomi | 20 | 0.0% |
| Pueblo | 21 | 0.0% |
| Puerto Rican | 18,311 | 1.0% |
| Romanian | 1,220 | 0.1% |
| Russian | 3,714 | 0.2% |
| Salvadoran | 12,603 | 0.7% |
| Samoan | 89 | 0.0% |
| Scandinavian | 3,421 | 0.2% |
| Scotch-Irish | 40,737 | 2.1% |
| Scottish | 41,329 | 2.2% |
| Seminole | 109 | 0.0% |
| Senegalese | 1,075 | 0.1% |
| Serbian | 331 | 0.0% |
| Sierra Leonean | 270 | 0.0% |
| Sioux | 227 | 0.0% |
| Slavic | 804 | 0.0% |
| Slovak | 1,747 | 0.1% |
| Slovene | 341 | 0.0% |
| Somali | 264 | 0.0% |
| South African | 116 | 0.0% |
| South American | 10,393 | 0.5% |
| South American Indian | 101 | 0.0% |
| Spaniard | 2,555 | 0.1% |
| Spanish | 1,490 | 0.1% |
| Spanish American | 52 | 0.0% |
| Sri Lankan | 8,860 | 0.5% |
| Subsaharan African | 24,361 | 1.3% |
| Sudanese | 1,923 | 0.1% |
| Swedish | 7,895 | 0.4% |
| Swiss | 2,915 | 0.2% |
| Syrian | 428 | 0.0% |
| Thai | 11,597 | 0.6% |
| Tongan | 6 | 0.0% |
| Trinidadian and Tobagonian | 440 | 0.0% |
| Turkish | 626 | 0.0% |
| U.S. Virgin Islander | 142 | 0.0% |
| Ugandan | 160 | 0.0% |
| Ukrainian | 1,801 | 0.1% |
| Uruguayan | 401 | 0.0% |
| Venezuelan | 1,636 | 0.1% |
| Vietnamese | 163 | 0.0% |
| Welsh | 9,471 | 0.5% |
| West Indian | 1,077 | 0.1% |
| Yakama | 19 | 0.0% |
| Yaqui | 24 | 0.0% |
| Yugoslavian | 493 | 0.0% |
| Yuman | 25 | 0.0% |
| Zimbabwean | 117 | 0.0% | View All 175 Rows |
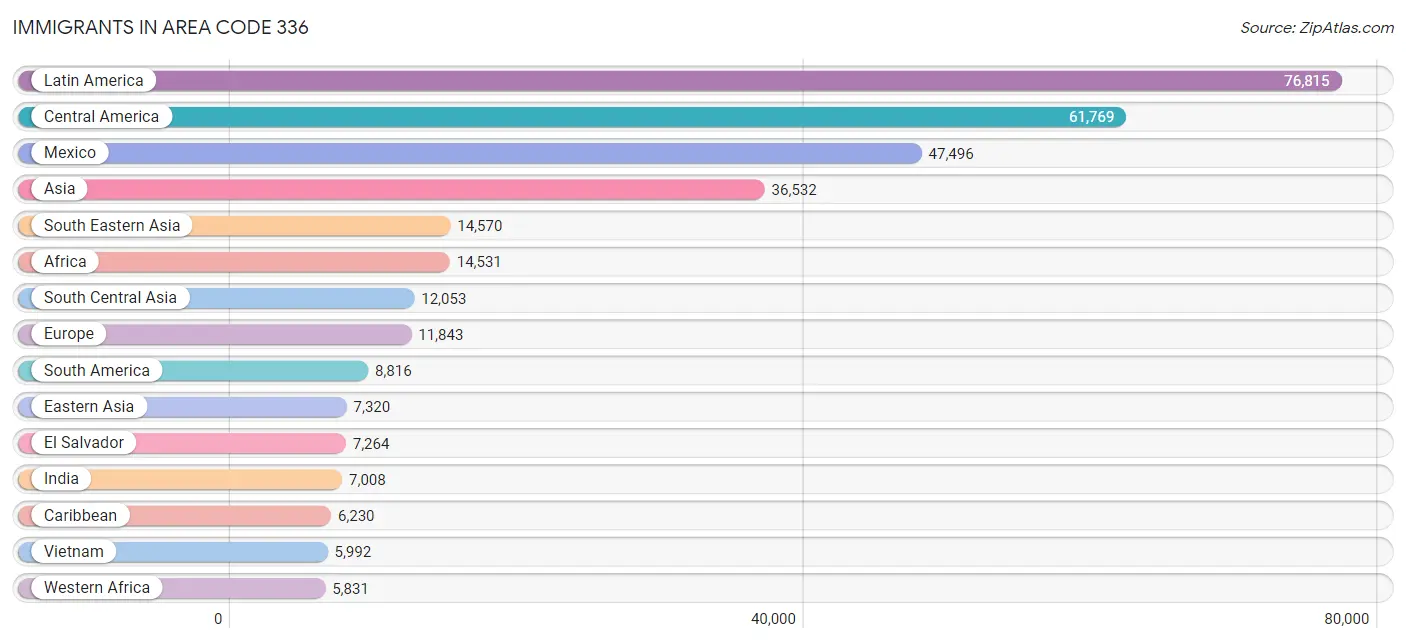
Immigrants in Area Code 336
The most numerous immigrant groups reported in Area Code 336 came from Latin America (76,815 | 4.0%), Central America (61,769 | 3.2%), Mexico (47,496 | 2.5%), Asia (36,532 | 1.9%), and South Eastern Asia (14,570 | 0.8%), together accounting for 12.4% of all Area Code 336 residents.
| Immigration Origin | # Population | % Population |
| Afghanistan | 317 | 0.0% |
| Africa | 14,531 | 0.8% |
| Albania | 154 | 0.0% |
| Argentina | 638 | 0.0% |
| Armenia | 26 | 0.0% |
| Asia | 36,532 | 1.9% |
| Australia | 209 | 0.0% |
| Austria | 102 | 0.0% |
| Azores | 5 | 0.0% |
| Bahamas | 260 | 0.0% |
| Bangladesh | 190 | 0.0% |
| Barbados | 209 | 0.0% |
| Belarus | 61 | 0.0% |
| Belgium | 41 | 0.0% |
| Bolivia | 47 | 0.0% |
| Bosnia and Herzegovina | 834 | 0.0% |
| Brazil | 1,167 | 0.1% |
| Bulgaria | 152 | 0.0% |
| Cambodia | 1,227 | 0.1% |
| Cameroon | 137 | 0.0% |
| Canada | 2,795 | 0.2% |
| Caribbean | 6,230 | 0.3% |
| Central America | 61,769 | 3.2% |
| Chile | 318 | 0.0% |
| China | 4,612 | 0.2% |
| Colombia | 3,040 | 0.2% |
| Congo | 235 | 0.0% |
| Costa Rica | 368 | 0.0% |
| Croatia | 15 | 0.0% |
| Cuba | 1,162 | 0.1% |
| Czechoslovakia | 88 | 0.0% |
| Denmark | 62 | 0.0% |
| Dominica | 213 | 0.0% |
| Dominican Republic | 2,241 | 0.1% |
| Eastern Africa | 2,269 | 0.1% |
| Eastern Asia | 7,320 | 0.4% |
| Eastern Europe | 3,755 | 0.2% |
| Ecuador | 750 | 0.0% |
| Egypt | 930 | 0.1% |
| El Salvador | 7,264 | 0.4% |
| England | 1,363 | 0.1% |
| Eritrea | 224 | 0.0% |
| Ethiopia | 189 | 0.0% |
| Europe | 11,843 | 0.6% |
| France | 334 | 0.0% |
| Germany | 1,982 | 0.1% |
| Ghana | 825 | 0.0% |
| Greece | 324 | 0.0% |
| Guatemala | 2,305 | 0.1% |
| Guyana | 797 | 0.0% |
| Haiti | 299 | 0.0% |
| Honduras | 3,455 | 0.2% |
| Hong Kong | 343 | 0.0% |
| Hungary | 136 | 0.0% |
| India | 7,008 | 0.4% |
| Indonesia | 241 | 0.0% |
| Iran | 567 | 0.0% |
| Iraq | 431 | 0.0% |
| Ireland | 318 | 0.0% |
| Israel | 125 | 0.0% |
| Italy | 1,202 | 0.1% |
| Jamaica | 981 | 0.1% |
| Japan | 912 | 0.1% |
| Jordan | 321 | 0.0% |
| Kazakhstan | 20 | 0.0% |
| Kenya | 472 | 0.0% |
| Korea | 1,773 | 0.1% |
| Kuwait | 115 | 0.0% |
| Laos | 759 | 0.0% |
| Latin America | 76,815 | 4.0% |
| Latvia | 13 | 0.0% |
| Lebanon | 145 | 0.0% |
| Liberia | 618 | 0.0% |
| Malaysia | 276 | 0.0% |
| Mexico | 47,496 | 2.5% |
| Middle Africa | 1,792 | 0.1% |
| Moldova | 73 | 0.0% |
| Morocco | 202 | 0.0% |
| Nepal | 1,098 | 0.1% |
| Netherlands | 197 | 0.0% |
| Nicaragua | 585 | 0.0% |
| Nigeria | 2,061 | 0.1% |
| Northern Africa | 3,192 | 0.2% |
| Northern Europe | 3,334 | 0.2% |
| Norway | 47 | 0.0% |
| Oceania | 298 | 0.0% |
| Pakistan | 2,150 | 0.1% |
| Panama | 296 | 0.0% |
| Peru | 670 | 0.0% |
| Philippines | 3,847 | 0.2% |
| Poland | 515 | 0.0% |
| Portugal | 88 | 0.0% |
| Romania | 468 | 0.0% |
| Russia | 853 | 0.0% |
| Saudi Arabia | 380 | 0.0% |
| Scotland | 194 | 0.0% |
| Senegal | 611 | 0.0% |
| Serbia | 44 | 0.0% |
| Sierra Leone | 239 | 0.0% |
| Singapore | 65 | 0.0% |
| Somalia | 213 | 0.0% |
| South Africa | 301 | 0.0% |
| South America | 8,816 | 0.5% |
| South Central Asia | 12,053 | 0.6% |
| South Eastern Asia | 14,570 | 0.8% |
| Southern Europe | 1,929 | 0.1% |
| Spain | 296 | 0.0% |
| Sri Lanka | 186 | 0.0% |
| St. Vincent and the Grenadines | 32 | 0.0% |
| Sudan | 1,709 | 0.1% |
| Sweden | 487 | 0.0% |
| Switzerland | 37 | 0.0% |
| Syria | 150 | 0.0% |
| Taiwan | 440 | 0.0% |
| Thailand | 1,511 | 0.1% |
| Trinidad and Tobago | 434 | 0.0% |
| Turkey | 483 | 0.0% |
| Uganda | 333 | 0.0% |
| Ukraine | 246 | 0.0% |
| Uruguay | 235 | 0.0% |
| Venezuela | 1,025 | 0.1% |
| Vietnam | 5,992 | 0.3% |
| West Indies | 34 | 0.0% |
| Western Africa | 5,831 | 0.3% |
| Western Asia | 2,495 | 0.1% |
| Western Europe | 2,721 | 0.1% |
| Yemen | 174 | 0.0% |
| Zaire | 931 | 0.1% |
| Zimbabwe | 142 | 0.0% | View All 129 Rows |
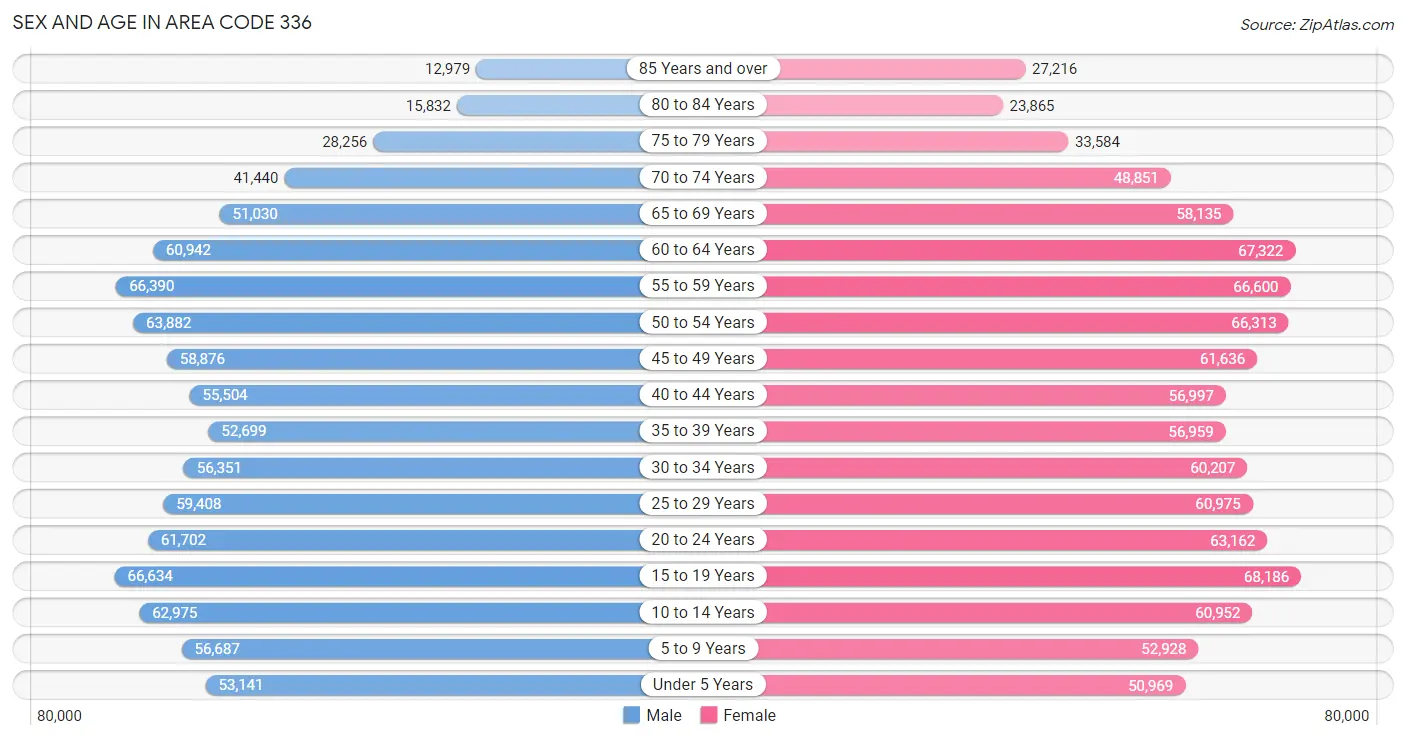
Sex and Age in Area Code 336
Sex and Age in Area Code 336
The most populous age groups in Area Code 336 are 15 to 19 Years (66,634 | 7.2%) for men and 15 to 19 Years (68,186 | 6.9%) for women.
| Age Bracket | Male | Female |
| Under 5 Years | 53,141 (5.8%) | 50,969 (5.2%) |
| 5 to 9 Years | 56,687 (6.1%) | 52,928 (5.4%) |
| 10 to 14 Years | 62,975 (6.8%) | 60,952 (6.2%) |
| 15 to 19 Years | 66,634 (7.2%) | 68,186 (6.9%) |
| 20 to 24 Years | 61,702 (6.7%) | 63,162 (6.4%) |
| 25 to 29 Years | 59,408 (6.4%) | 60,975 (6.2%) |
| 30 to 34 Years | 56,351 (6.1%) | 60,207 (6.1%) |
| 35 to 39 Years | 52,699 (5.7%) | 56,959 (5.8%) |
| 40 to 44 Years | 55,504 (6.0%) | 56,997 (5.8%) |
| 45 to 49 Years | 58,876 (6.4%) | 61,636 (6.3%) |
| 50 to 54 Years | 63,882 (6.9%) | 66,313 (6.7%) |
| 55 to 59 Years | 66,390 (7.2%) | 66,600 (6.8%) |
| 60 to 64 Years | 60,942 (6.6%) | 67,322 (6.8%) |
| 65 to 69 Years | 51,030 (5.5%) | 58,135 (5.9%) |
| 70 to 74 Years | 41,440 (4.5%) | 48,851 (5.0%) |
| 75 to 79 Years | 28,256 (3.1%) | 33,584 (3.4%) |
| 80 to 84 Years | 15,832 (1.7%) | 23,865 (2.4%) |
| 85 Years and over | 12,979 (1.4%) | 27,216 (2.8%) |
| Total | 924,728 (100.0%) | 984,857 (100.0%) |
Families and Households in Area Code 336
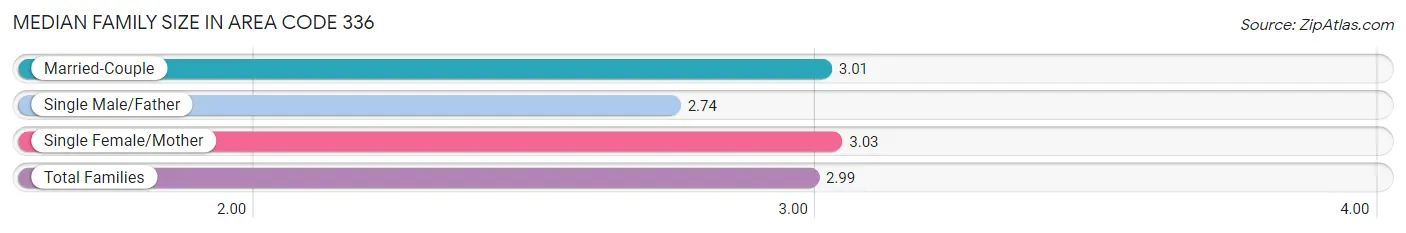
Median Family Size in Area Code 336
The median family size in Area Code 336 is 2.99 persons per family, with single female/mother families (101,758 | 20.7%) accounting for the largest median family size of 3.02886 persons per family. On the other hand, single male/father families (36,247 | 7.4%) represent the smallest median family size with 2.74 persons per family.
| Family Type | # Families | Family Size |
| Married-Couple | 352,381 (71.9%) | 3.01 |
| Single Male/Father | 36,247 (7.4%) | 2.74 |
| Single Female/Mother | 101,758 (20.7%) | 3.03 |
| Total Families | 490,386 (100.0%) | 2.99 |
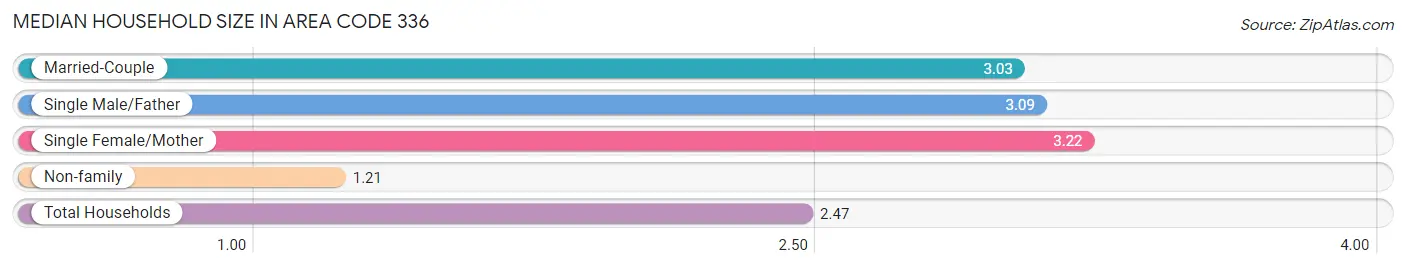
Median Household Size in Area Code 336
The median household size in Area Code 336 is 2.47 persons per household, with single female/mother households (101,758 | 13.4%) accounting for the largest median household size of 3.2175 persons per household. non-family households (270,947 | 35.6%) represent the smallest median household size with 1.21 persons per household.
| Household Type | # Households | Household Size |
| Married-Couple | 352,381 (46.3%) | 3.03 |
| Single Male/Father | 36,247 (4.8%) | 3.09 |
| Single Female/Mother | 101,758 (13.4%) | 3.22 |
| Non-family | 270,947 (35.6%) | 1.21 |
| Total Households | 761,333 (100.0%) | 2.47 |
Household Size by Marriage Status in Area Code 336
Out of a total of 761,333 households in Area Code 336, 490,386 (64.4%) are family households, while 270,947 (35.6%) are nonfamily households. The most numerous type of family households are 2-person households, comprising 235,246, and the most common type of nonfamily households are 1-person households, comprising 228,621.
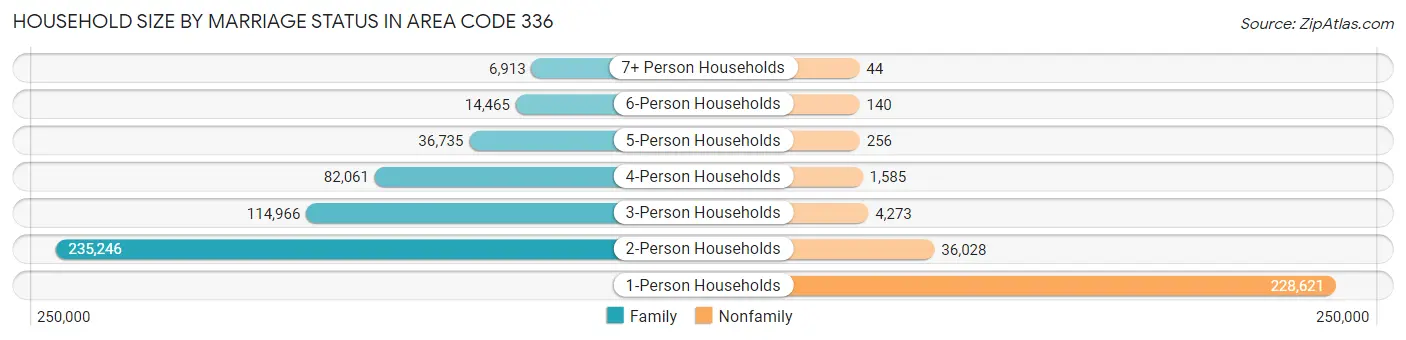
| Household Size | Family Households | Nonfamily Households |
| 1-Person Households | - | 228,621 (30.0%) |
| 2-Person Households | 235,246 (30.9%) | 36,028 (4.7%) |
| 3-Person Households | 114,966 (15.1%) | 4,273 (0.6%) |
| 4-Person Households | 82,061 (10.8%) | 1,585 (0.2%) |
| 5-Person Households | 36,735 (4.8%) | 256 (0.0%) |
| 6-Person Households | 14,465 (1.9%) | 140 (0.0%) |
| 7+ Person Households | 6,913 (0.9%) | 44 (0.0%) |
| Total | 490,386 (64.4%) | 270,947 (35.6%) |
Female Fertility in Area Code 336
Fertility by Age in Area Code 336
Average fertility rate in Area Code 336 is 64.2 births per 1,000 women. Women in the age bracket of 20 to 34 years have the highest fertility rate with 130.9 births per 1,000 women. Women in the age bracket of 20 to 34 years acount for 77.9% of all women with births.
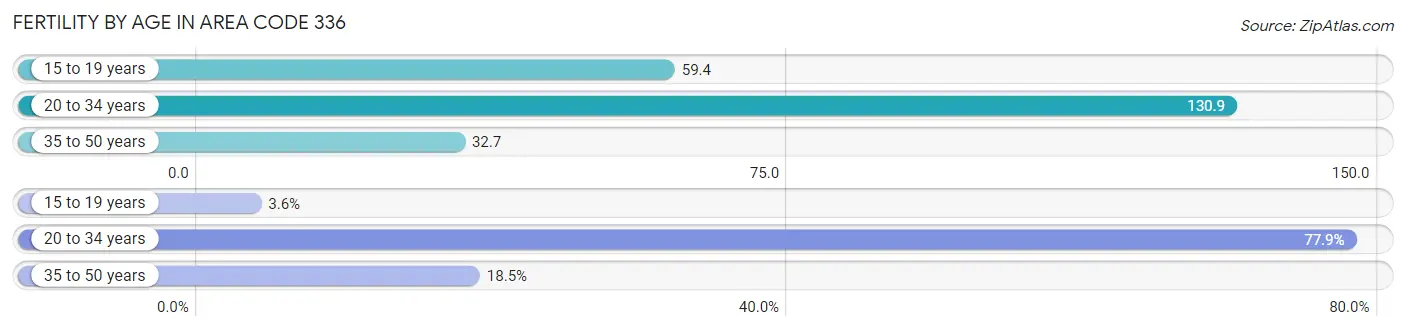
| Age Bracket | Women with Births | Births / 1,000 Women |
| 15 to 19 years | 826 (3.6%) | 59.4 |
| 20 to 34 years | 17,768 (77.9%) | 130.9 |
| 35 to 50 years | 4,206 (18.4%) | 32.7 |
| Total | 22,800 (100.0%) | 64.2 |
Fertility by Age by Marriage Status in Area Code 336
52.5% of women with births (22,800) in Area Code 336 are married. The highest percentage of unmarried women with births falls into 15 to 19 years age bracket with 93.6% of them unmarried at the time of birth, while the lowest percentage of unmarried women with births belong to 35 to 50 years age bracket with 41.6% of them unmarried.
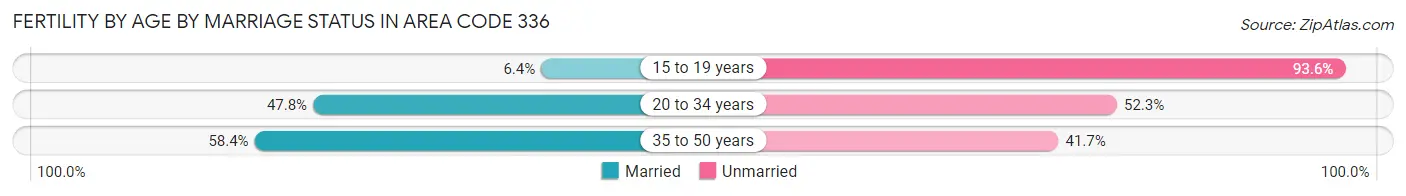
| Age Bracket | Married | Unmarried |
| 15 to 19 years | 53 (6.4%) | 773 (93.6%) |
| 20 to 34 years | 8,485 (47.7%) | 9,283 (52.2%) |
| 35 to 50 years | 2,454 (58.4%) | 1,752 (41.6%) |
| Total | 11,980 (52.5%) | 10,820 (47.5%) |
Fertility by Education in Area Code 336
Average fertility rate in Area Code 336 is 64.2 births per 1,000 women. Women with the education attainment of bachelor's degree have the highest fertility rate of 129.4 births per 1,000 women, while women with the education attainment of less than high school have the lowest fertility at 62.8 births per 1,000 women. Women with the education attainment of college or associate's degree represent 34.6% of all women with births.
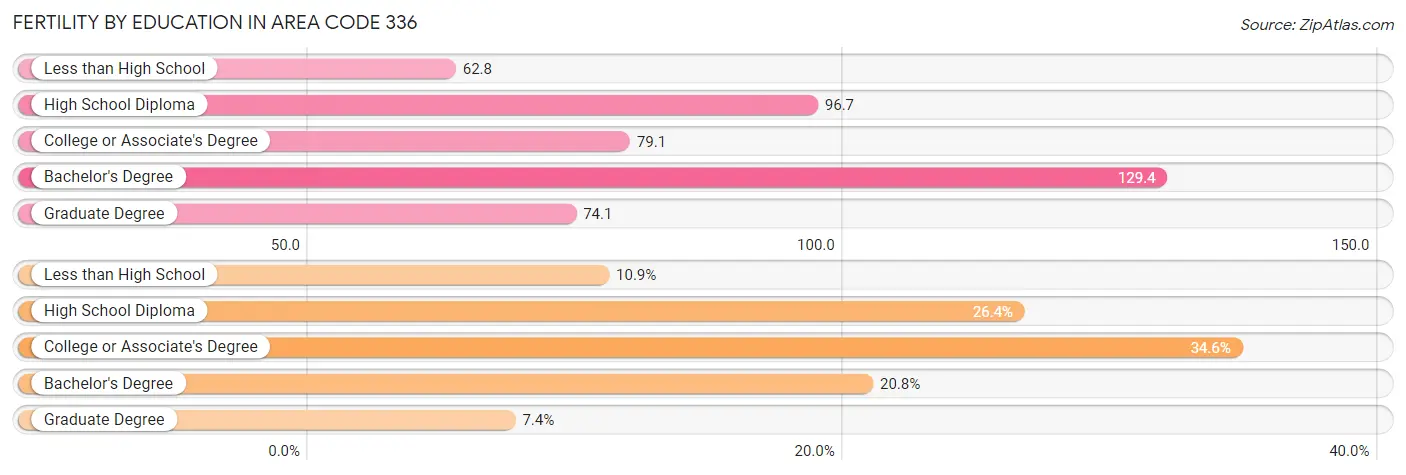
| Educational Attainment | Women with Births | Births / 1,000 Women |
| Less than High School | 2,477 (10.9%) | 62.8 |
| High School Diploma | 6,029 (26.4%) | 96.7 |
| College or Associate's Degree | 7,888 (34.6%) | 79.1 |
| Bachelor's Degree | 4,730 (20.7%) | 129.4 |
| Graduate Degree | 1,676 (7.3%) | 74.1 |
| Total | 22,800 (100.0%) | 64.2 |
Fertility by Education by Marriage Status in Area Code 336
47.5% of women with births in Area Code 336 are unmarried. Women with the educational attainment of graduate degree are most likely to be married with 56.4% of them married at childbirth, while women with the educational attainment of less than high school are least likely to be married with 83.7% of them unmarried at childbirth.
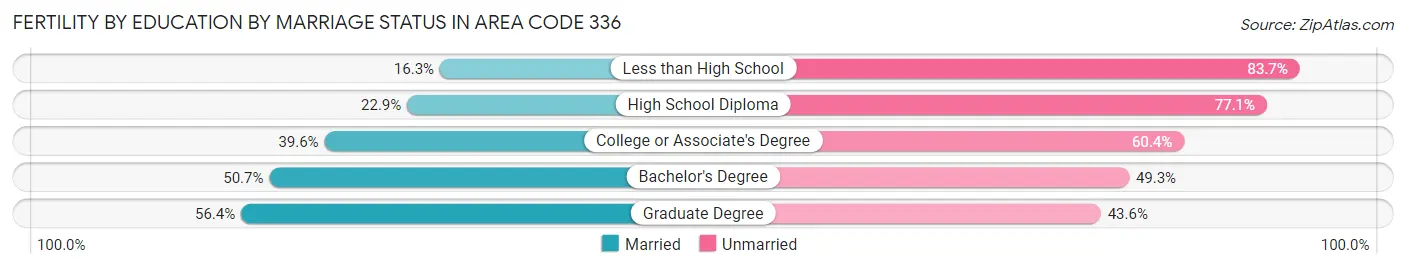
| Educational Attainment | Married | Unmarried |
| Less than High School | 404 (16.3%) | 2,073 (83.7%) |
| High School Diploma | 1,382 (22.9%) | 4,647 (77.1%) |
| College or Associate's Degree | 3,122 (39.6%) | 4,766 (60.4%) |
| Bachelor's Degree | 2,398 (50.7%) | 2,332 (49.3%) |
| Graduate Degree | 945 (56.4%) | 731 (43.6%) |
| Total | 11,980 (52.5%) | 10,820 (47.5%) |
Employment Characteristics in Area Code 336
Employment by Class of Employer in Area Code 336
Among the 869,115 employed individuals in Area Code 336, private company employees (609,042 | 70.1%), not-for-profit organizations (71,387 | 8.2%), and local government employees (54,340 | 6.2%) make up the most common classes of employment.
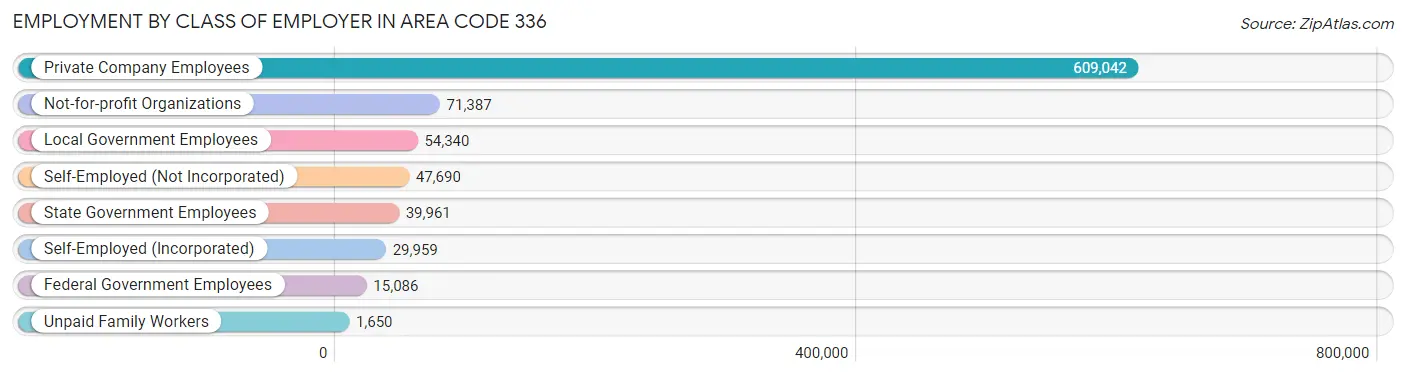
| Employer Class | # Employees | % Employees |
| Private Company Employees | 609,042 | 70.1% |
| Self-Employed (Incorporated) | 29,959 | 3.5% |
| Self-Employed (Not Incorporated) | 47,690 | 5.5% |
| Not-for-profit Organizations | 71,387 | 8.2% |
| Local Government Employees | 54,340 | 6.2% |
| State Government Employees | 39,961 | 4.6% |
| Federal Government Employees | 15,086 | 1.7% |
| Unpaid Family Workers | 1,650 | 0.2% |
| Total | 869,115 | 100.0% |
Employment Status by Age in Area Code 336
According to the labor force statistics for Area Code 336, out of the total population over 16 years of age (1,546,428), 58.2% or 899,557 individuals are in the labor force, with 5.7% or 50,825 of them unemployed. The age group with the highest labor force participation rate is 35 to 44 years, with 83.5% or 185,481 individuals in the labor force. Within the labor force, the 16 to 19 years age range has the highest percentage of unemployed individuals, with 2,025.9% or 939,876 of them being unemployed.
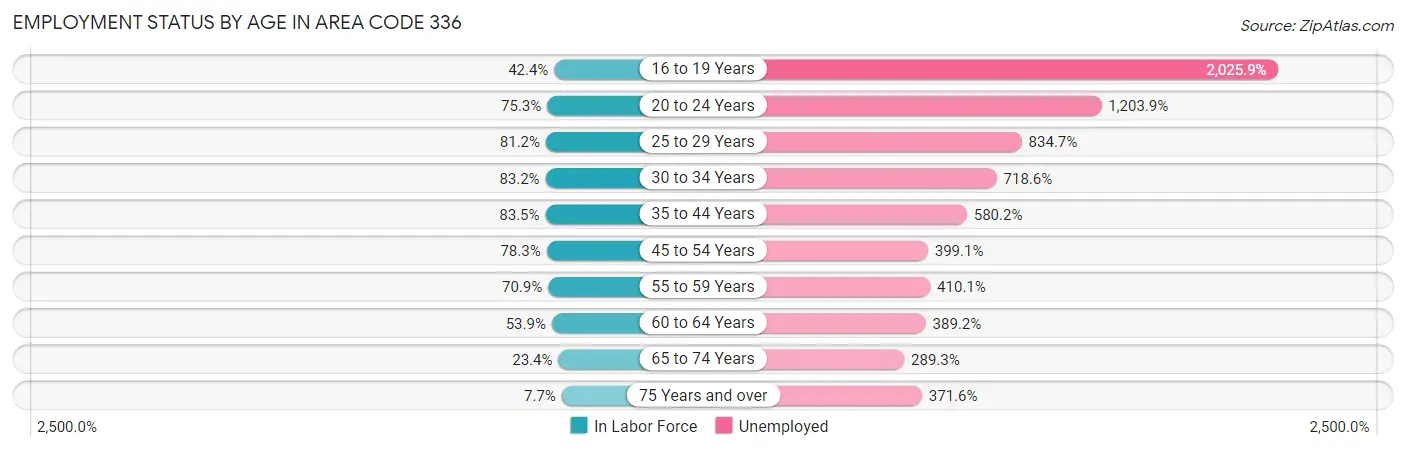
| Age Bracket | In Labor Force | Unemployed |
| 16 to 19 Years | 46,392 (42.4%) | 939,876 (2,025.9%) |
| 20 to 24 Years | 93,972 (75.3%) | 1,131,341 (1,203.9%) |
| 25 to 29 Years | 97,696 (81.1%) | 815,427 (834.7%) |
| 30 to 34 Years | 96,925 (83.2%) | 696,539 (718.6%) |
| 35 to 44 Years | 185,484 (83.5%) | 1,076,161 (580.2%) |
| 45 to 54 Years | 196,280 (78.3%) | 783,349 (399.1%) |
| 55 to 59 Years | 94,273 (70.9%) | 386,630 (410.1%) |
| 60 to 64 Years | 69,131 (53.9%) | 269,070 (389.2%) |
| 65 to 74 Years | 46,726 (23.4%) | 135,199 (289.3%) |
| 75 Years and over | 10,917 (7.7%) | 40,553 (371.6%) |
| Total | 899,552 (58.2%) | 50,868 (5.7%) |
Employment Status by Educational Attainment in Area Code 336
According to labor force statistics for Area Code 336, 75.8% of individuals (735,967) out of the total population between 25 and 64 years of age (971,061) are in the labor force, with 568.8% or 4,186,180 of them being unemployed. The group with the highest labor force participation rate are those with the educational attainment of bachelor's degree or higher, with 84.5% or 236,666 individuals in the labor force. Within the labor force, individuals with less than high school education have the highest percentage of unemployment, with 941.4% or 640,915 of them being unemployed.
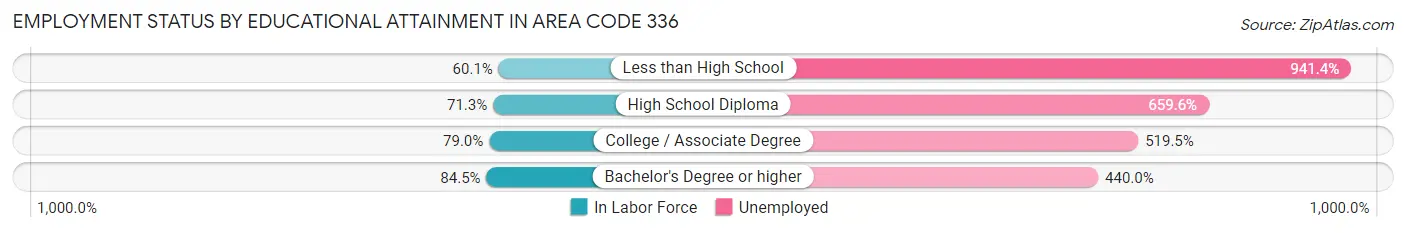
| Educational Attainment | In Labor Force | Unemployed |
| Less than High School | 68,076 (60.1%) | 1,066,230 (941.4%) |
| High School Diploma | 185,719 (71.3%) | 1,719,056 (659.6%) |
| College / Associate Degree | 250,409 (79.0%) | 1,646,483 (519.5%) |
| Bachelor's Degree or higher | 236,664 (84.5%) | 1,233,074 (440.0%) |
| Total | 735,942 (75.8%) | 5,523,395 (568.8%) |
Employment Occupations by Sex in Area Code 336
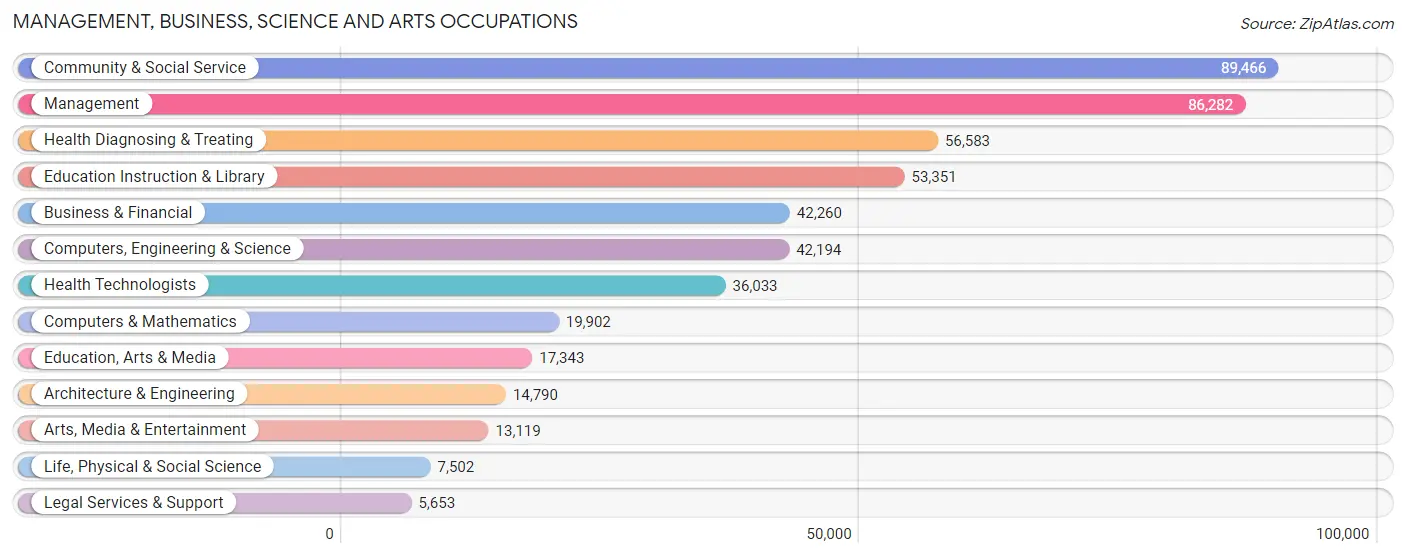
Management, Business, Science and Arts Occupations
The most common Management, Business, Science and Arts occupations in Area Code 336 are Community & Social Service (89,466 | 10.1%), Management (86,282 | 9.7%), Health Diagnosing & Treating (56,583 | 6.4%), Education Instruction & Library (53,351 | 6.0%), and Business & Financial (42,260 | 4.8%).
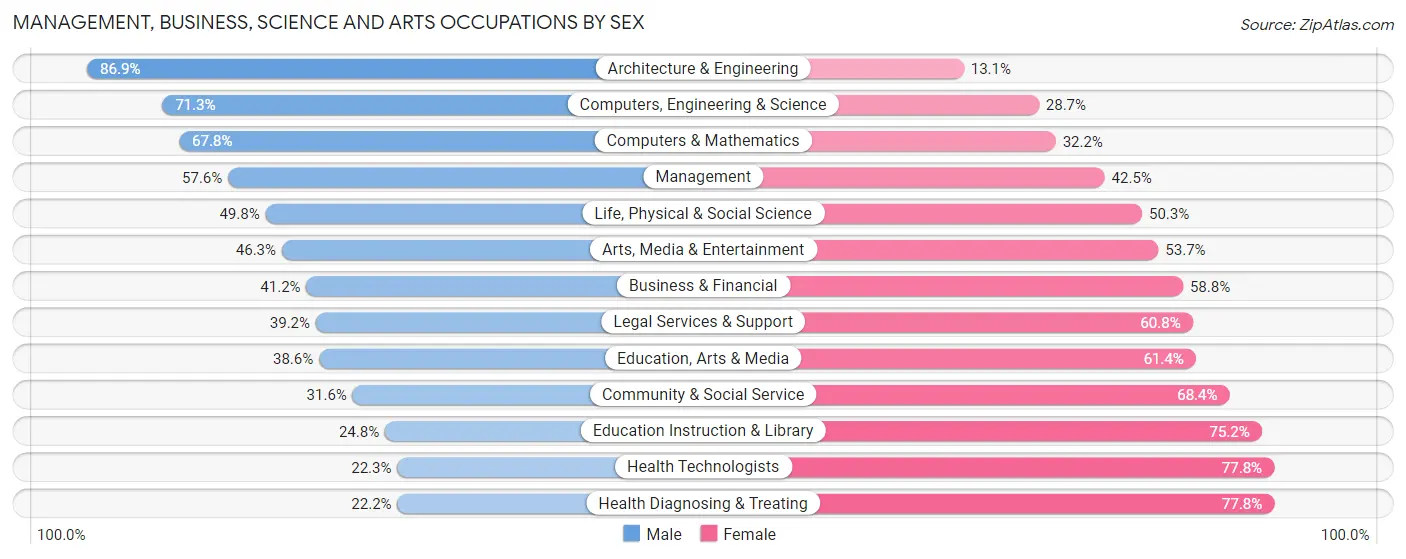
Management, Business, Science and Arts Occupations by Sex
Within the Management, Business, Science and Arts occupations in Area Code 336, the most male-oriented occupations are Architecture & Engineering (86.9%), Computers, Engineering & Science (71.3%), and Computers & Mathematics (67.8%), while the most female-oriented occupations are Health Diagnosing & Treating (77.8%), Health Technologists (77.7%), and Education Instruction & Library (75.2%).
| Occupation | Male | Female |
| Management | 49,656 (57.6%) | 36,626 (42.4%) |
| Business & Financial | 17,414 (41.2%) | 24,846 (58.8%) |
| Computers, Engineering & Science | 30,076 (71.3%) | 12,118 (28.7%) |
| Computers & Mathematics | 13,486 (67.8%) | 6,416 (32.2%) |
| Architecture & Engineering | 12,858 (86.9%) | 1,932 (13.1%) |
| Life, Physical & Social Science | 3,732 (49.7%) | 3,770 (50.2%) |
| Community & Social Service | 28,231 (31.6%) | 61,235 (68.4%) |
| Education, Arts & Media | 6,690 (38.6%) | 10,653 (61.4%) |
| Legal Services & Support | 2,218 (39.2%) | 3,435 (60.8%) |
| Education Instruction & Library | 13,244 (24.8%) | 40,107 (75.2%) |
| Arts, Media & Entertainment | 6,079 (46.3%) | 7,040 (53.7%) |
| Health Diagnosing & Treating | 12,578 (22.2%) | 44,005 (77.8%) |
| Health Technologists | 8,018 (22.3%) | 28,015 (77.7%) |
| Total (Category) | 137,955 (43.5%) | 178,830 (56.5%) |
| Total (Overall) | 460,098 (51.9%) | 426,865 (48.1%) |
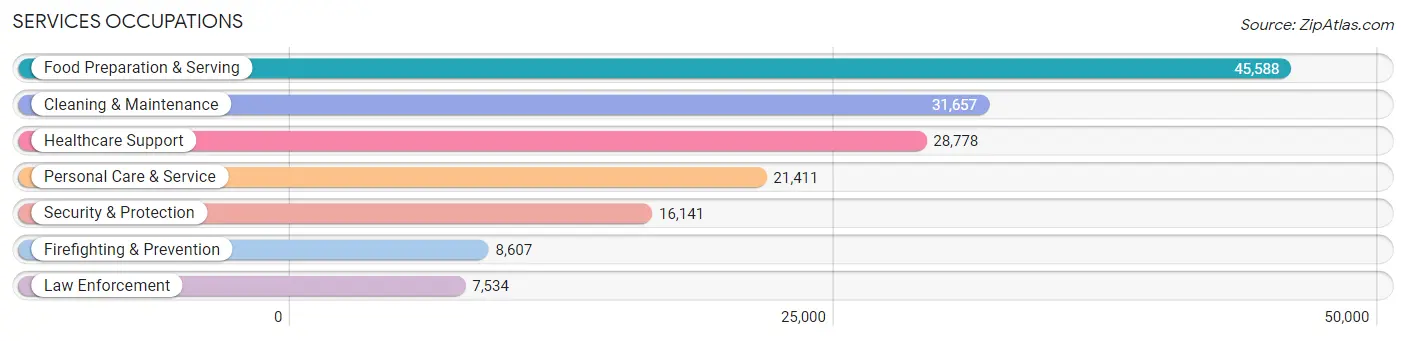
Services Occupations
The most common Services occupations in Area Code 336 are Food Preparation & Serving (45,588 | 5.1%), Cleaning & Maintenance (31,657 | 3.6%), Healthcare Support (28,778 | 3.2%), Personal Care & Service (21,411 | 2.4%), and Security & Protection (16,141 | 1.8%).
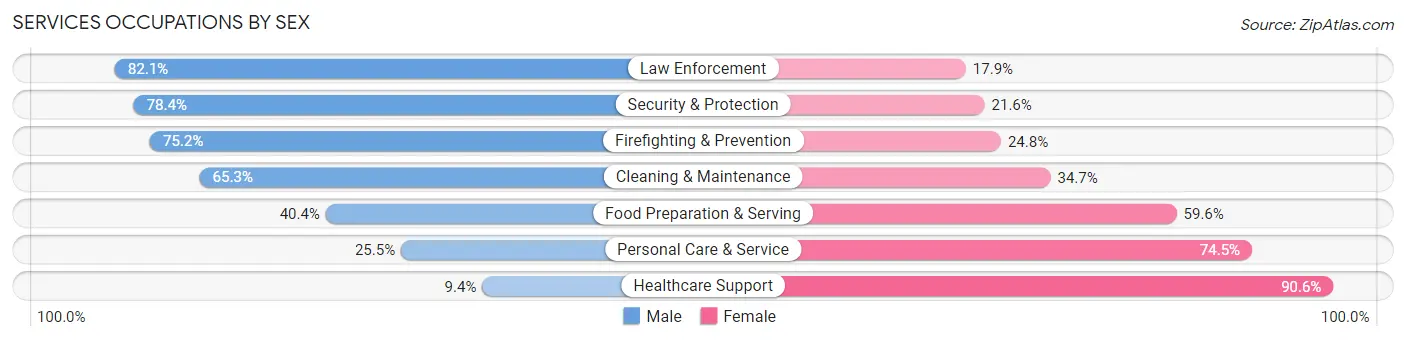
Services Occupations by Sex
Within the Services occupations in Area Code 336, the most male-oriented occupations are Law Enforcement (82.1%), Security & Protection (78.4%), and Firefighting & Prevention (75.2%), while the most female-oriented occupations are Healthcare Support (90.6%), Personal Care & Service (74.5%), and Food Preparation & Serving (59.6%).
| Occupation | Male | Female |
| Healthcare Support | 2,699 (9.4%) | 26,079 (90.6%) |
| Security & Protection | 12,655 (78.4%) | 3,486 (21.6%) |
| Firefighting & Prevention | 6,469 (75.2%) | 2,138 (24.8%) |
| Law Enforcement | 6,186 (82.1%) | 1,348 (17.9%) |
| Food Preparation & Serving | 18,409 (40.4%) | 27,179 (59.6%) |
| Cleaning & Maintenance | 20,685 (65.3%) | 10,972 (34.7%) |
| Personal Care & Service | 5,454 (25.5%) | 15,957 (74.5%) |
| Total (Category) | 59,902 (41.7%) | 83,673 (58.3%) |
| Total (Overall) | 460,098 (51.9%) | 426,865 (48.1%) |
Sales and Office Occupations
The most common Sales and Office occupations in Area Code 336 are Office & Administration (99,075 | 11.2%), and Sales & Related (88,504 | 10.0%).
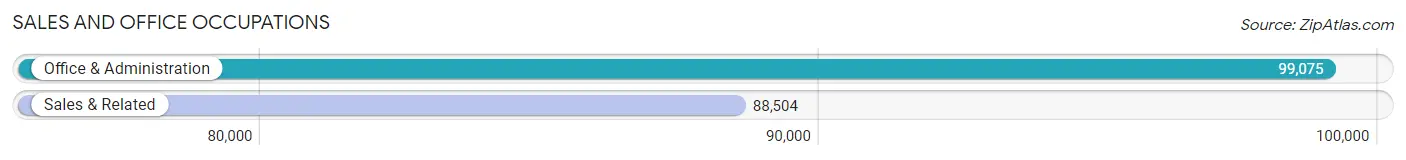
Sales and Office Occupations by Sex
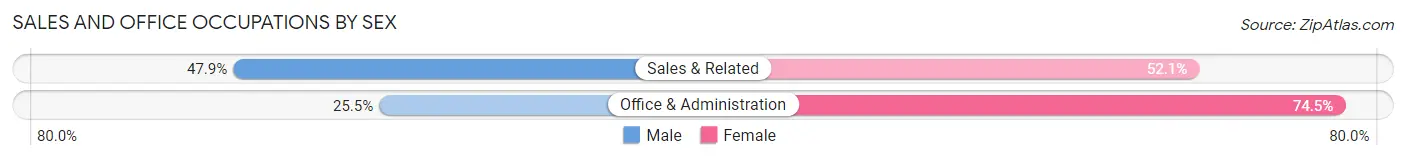
| Occupation | Male | Female |
| Sales & Related | 42,419 (47.9%) | 46,085 (52.1%) |
| Office & Administration | 25,236 (25.5%) | 73,839 (74.5%) |
| Total (Category) | 67,655 (36.1%) | 119,924 (63.9%) |
| Total (Overall) | 460,098 (51.9%) | 426,865 (48.1%) |
Natural Resources, Construction and Maintenance Occupations
The most common Natural Resources, Construction and Maintenance occupations in Area Code 336 are Construction & Extraction (44,746 | 5.0%), Installation, Maintenance & Repair (34,955 | 3.9%), and Farming, Fishing & Forestry (3,815 | 0.4%).
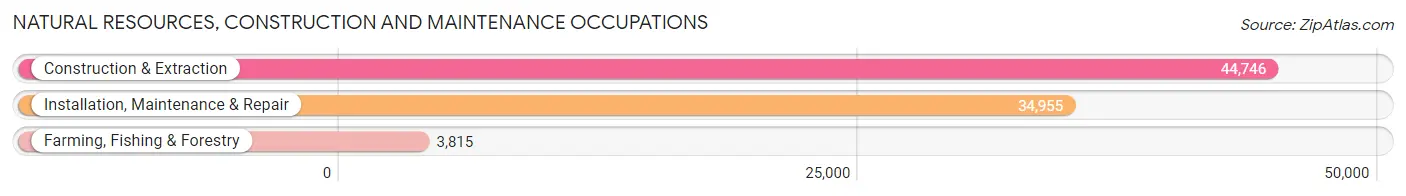
Natural Resources, Construction and Maintenance Occupations by Sex
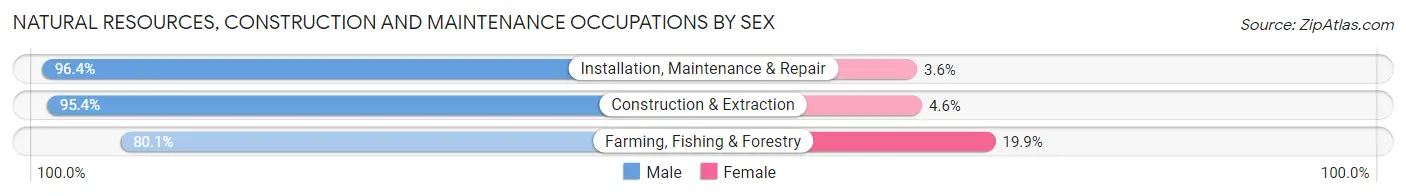
| Occupation | Male | Female |
| Farming, Fishing & Forestry | 3,056 (80.1%) | 759 (19.9%) |
| Construction & Extraction | 42,680 (95.4%) | 2,066 (4.6%) |
| Installation, Maintenance & Repair | 33,708 (96.4%) | 1,247 (3.6%) |
| Total (Category) | 79,444 (95.1%) | 4,072 (4.9%) |
| Total (Overall) | 460,098 (51.9%) | 426,865 (48.1%) |
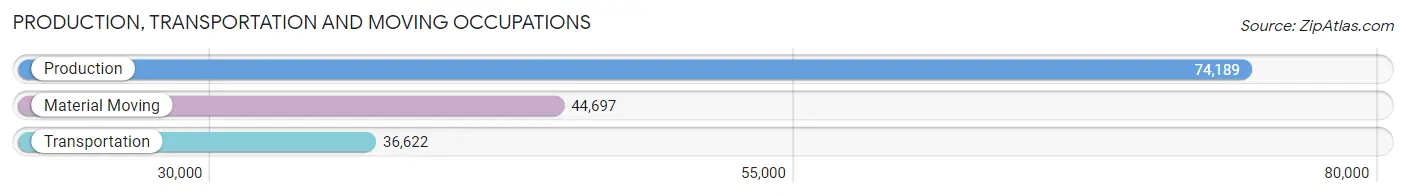
Production, Transportation and Moving Occupations
The most common Production, Transportation and Moving occupations in Area Code 336 are Production (74,189 | 8.4%), Material Moving (44,697 | 5.0%), and Transportation (36,622 | 4.1%).
Production, Transportation and Moving Occupations by Sex
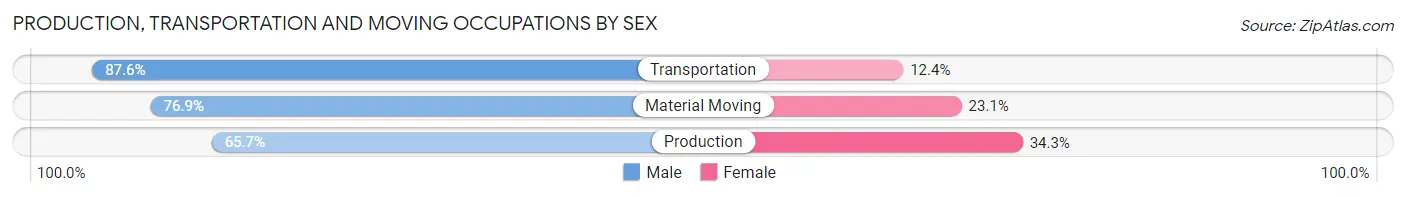
| Occupation | Male | Female |
| Production | 48,715 (65.7%) | 25,474 (34.3%) |
| Transportation | 32,075 (87.6%) | 4,547 (12.4%) |
| Material Moving | 34,352 (76.9%) | 10,345 (23.1%) |
| Total (Category) | 115,142 (74.0%) | 40,366 (26.0%) |
| Total (Overall) | 460,098 (51.9%) | 426,865 (48.1%) |
Employment Industries by Sex in Area Code 336
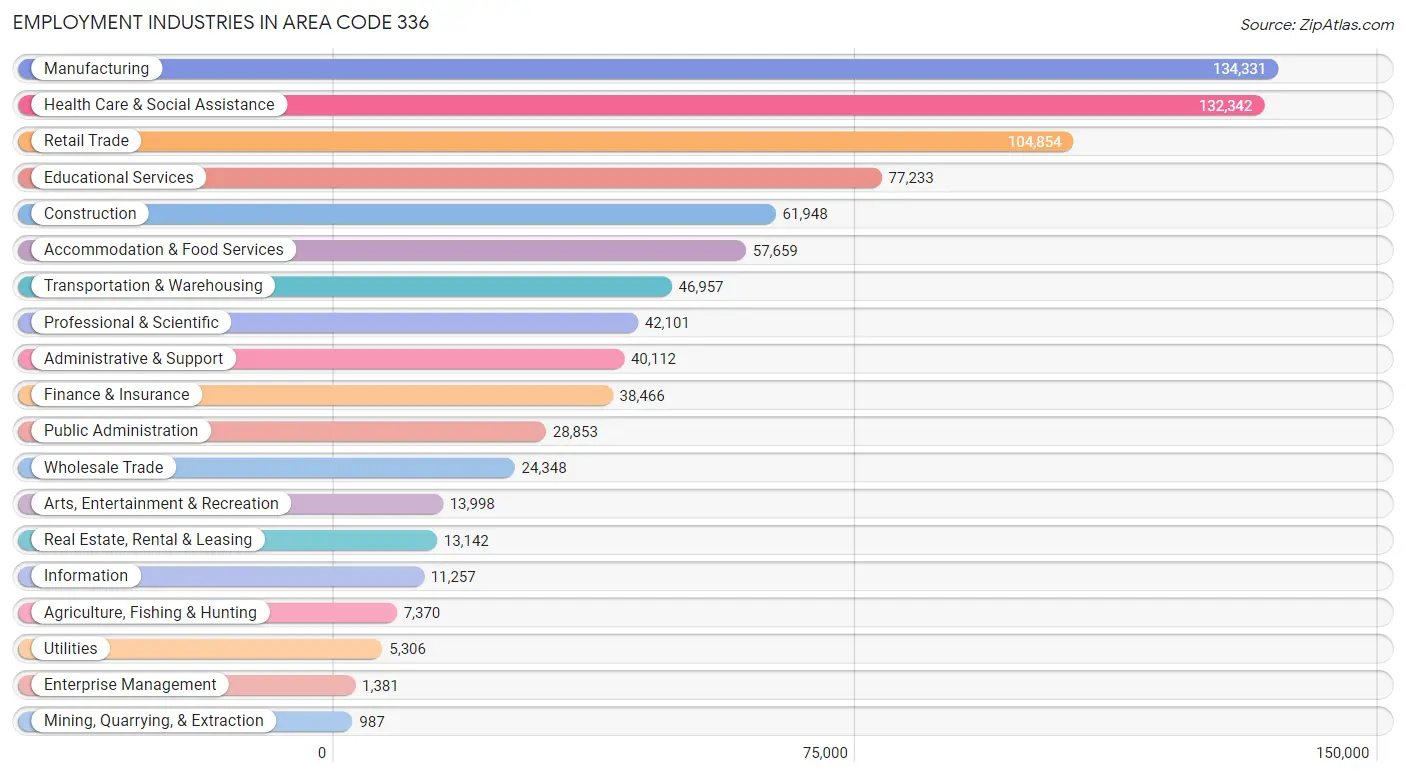
Employment Industries in Area Code 336
The major employment industries in Area Code 336 include Manufacturing (134,331 | 15.1%), Health Care & Social Assistance (132,342 | 14.9%), Retail Trade (104,854 | 11.8%), Educational Services (77,233 | 8.7%), and Construction (61,948 | 7.0%).
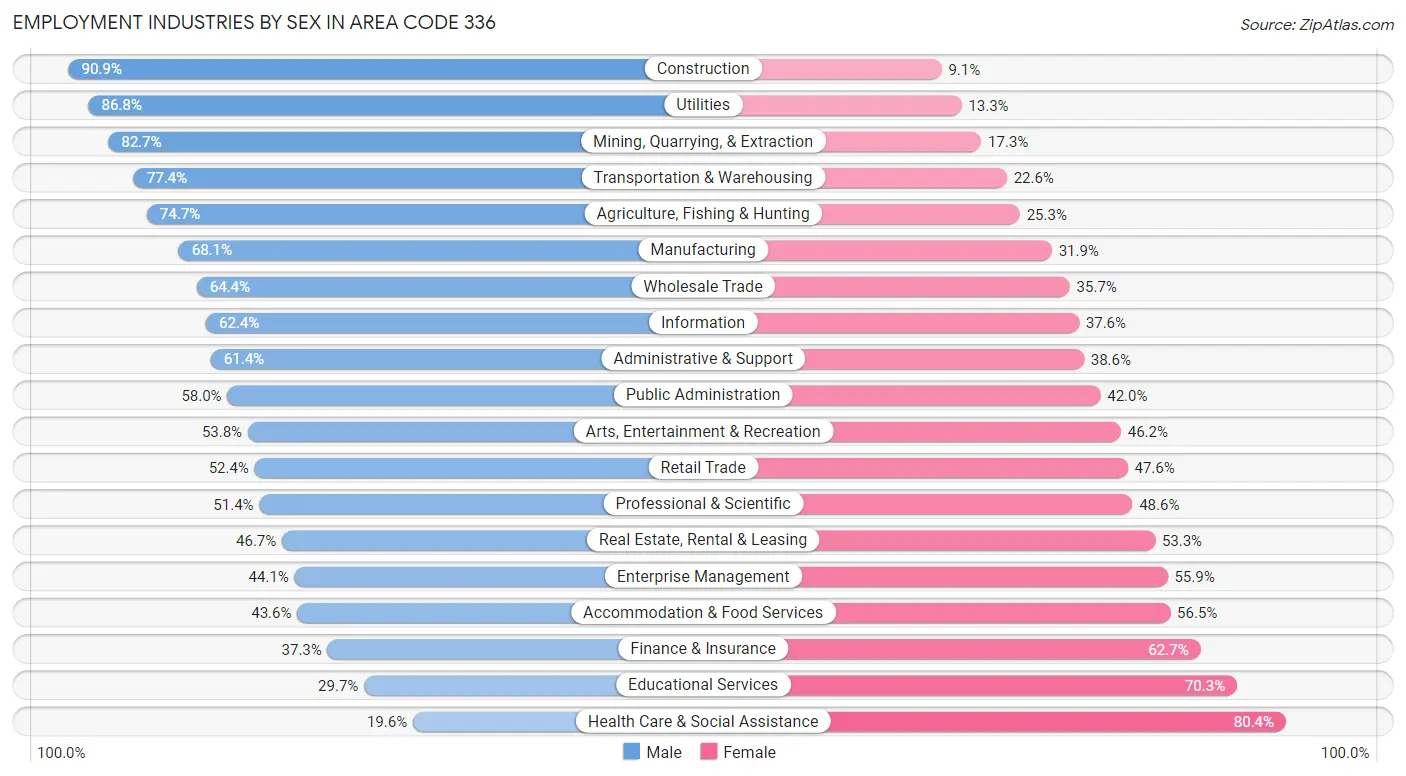
Employment Industries by Sex in Area Code 336
The Area Code 336 industries that see more men than women are Construction (90.9%), Utilities (86.8%), and Mining, Quarrying, & Extraction (82.7%), whereas the industries that tend to have a higher number of women are Health Care & Social Assistance (80.4%), Educational Services (70.3%), and Finance & Insurance (62.7%).
| Industry | Male | Female |
| Agriculture, Fishing & Hunting | 5,504 (74.7%) | 1,866 (25.3%) |
| Mining, Quarrying, & Extraction | 816 (82.7%) | 171 (17.3%) |
| Construction | 56,302 (90.9%) | 5,646 (9.1%) |
| Manufacturing | 91,445 (68.1%) | 42,886 (31.9%) |
| Wholesale Trade | 15,669 (64.3%) | 8,679 (35.6%) |
| Retail Trade | 54,916 (52.4%) | 49,938 (47.6%) |
| Transportation & Warehousing | 36,335 (77.4%) | 10,622 (22.6%) |
| Utilities | 4,603 (86.8%) | 703 (13.3%) |
| Information | 7,029 (62.4%) | 4,228 (37.6%) |
| Finance & Insurance | 14,341 (37.3%) | 24,125 (62.7%) |
| Real Estate, Rental & Leasing | 6,137 (46.7%) | 7,005 (53.3%) |
| Professional & Scientific | 21,639 (51.4%) | 20,462 (48.6%) |
| Enterprise Management | 609 (44.1%) | 772 (55.9%) |
| Administrative & Support | 24,639 (61.4%) | 15,473 (38.6%) |
| Educational Services | 22,951 (29.7%) | 54,282 (70.3%) |
| Health Care & Social Assistance | 25,958 (19.6%) | 106,384 (80.4%) |
| Arts, Entertainment & Recreation | 7,527 (53.8%) | 6,471 (46.2%) |
| Accommodation & Food Services | 25,111 (43.5%) | 32,548 (56.5%) |
| Public Administration | 16,737 (58.0%) | 12,116 (42.0%) |
| Total | 460,098 (51.9%) | 426,865 (48.1%) |
Education in Area Code 336
School Enrollment in Area Code 336
The most common levels of schooling among the 457,829 students in Area Code 336 are college / undergraduate (105,863 | 23.1%), high school (100,533 | 22.0%), and middle school (97,124 | 21.2%).
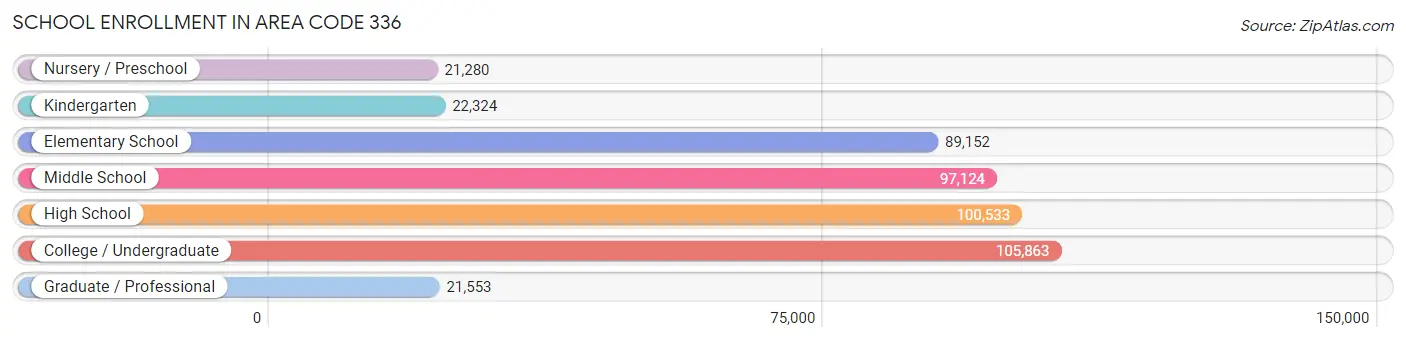
| School Level | # Students | % Students |
| Nursery / Preschool | 21,280 | 4.6% |
| Kindergarten | 22,324 | 4.9% |
| Elementary School | 89,152 | 19.5% |
| Middle School | 97,124 | 21.2% |
| High School | 100,533 | 22.0% |
| College / Undergraduate | 105,863 | 23.1% |
| Graduate / Professional | 21,553 | 4.7% |
| Total | 457,829 | 100.0% |
School Enrollment by Age by Funding Source in Area Code 336
Out of a total of 457,829 students who are enrolled in schools in Area Code 336, 82,595 (18.0%) attend a private institution, while the remaining 375,234 (82.0%) are enrolled in public schools. The age group of 3 to 4 year olds has the highest likelihood of being enrolled in private schools, with 7,697 (47.3% in the age bracket) enrolled. Conversely, the age group of 15 to 17 year olds has the lowest likelihood of being enrolled in a private school, with 63,886 (88.6% in the age bracket) attending a public institution.
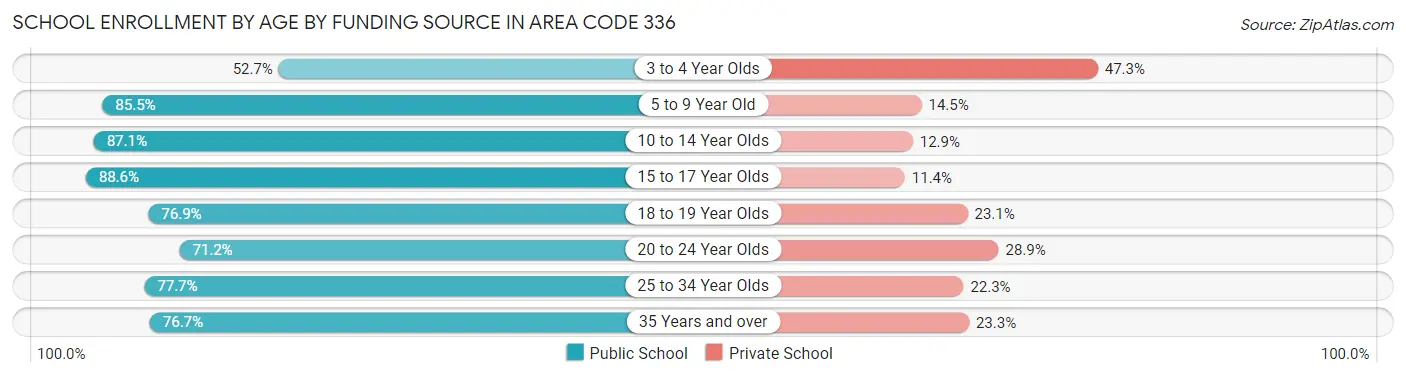
| Age Bracket | Public School | Private School |
| 3 to 4 Year Olds | 8,564 (52.7%) | 7,697 (47.3%) |
| 5 to 9 Year Old | 88,495 (85.5%) | 15,002 (14.5%) |
| 10 to 14 Year Olds | 105,299 (87.1%) | 15,570 (12.9%) |
| 15 to 17 Year Olds | 63,886 (88.6%) | 8,220 (11.4%) |
| 18 to 19 Year Olds | 34,168 (76.9%) | 10,244 (23.1%) |
| 20 to 24 Year Olds | 33,881 (71.2%) | 13,741 (28.8%) |
| 25 to 34 Year Olds | 19,675 (77.7%) | 5,651 (22.3%) |
| 35 Years and over | 21,262 (76.7%) | 6,474 (23.3%) |
| Total | 375,234 (82.0%) | 82,595 (18.0%) |
Educational Attainment by Field of Study in Area Code 336
Business (75,162 | 19.1%), education (50,589 | 12.9%), science & technology (41,373 | 10.5%), arts & humanities (29,867 | 7.6%), and social sciences (27,177 | 6.9%) are the most common fields of study among 393,655 individuals in Area Code 336 who have obtained a bachelor's degree or higher.
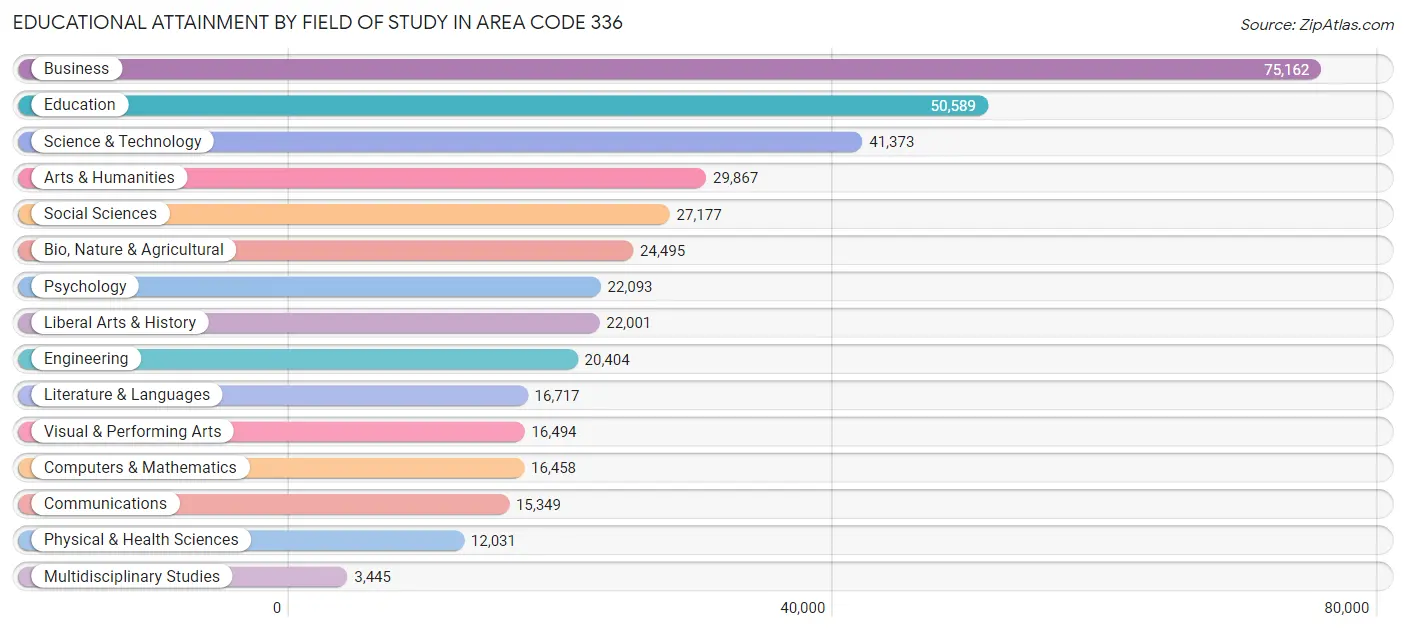
| Field of Study | # Graduates | % Graduates |
| Computers & Mathematics | 16,458 | 4.2% |
| Bio, Nature & Agricultural | 24,495 | 6.2% |
| Physical & Health Sciences | 12,031 | 3.1% |
| Psychology | 22,093 | 5.6% |
| Social Sciences | 27,177 | 6.9% |
| Engineering | 20,404 | 5.2% |
| Multidisciplinary Studies | 3,445 | 0.9% |
| Science & Technology | 41,373 | 10.5% |
| Business | 75,162 | 19.1% |
| Education | 50,589 | 12.9% |
| Literature & Languages | 16,717 | 4.3% |
| Liberal Arts & History | 22,001 | 5.6% |
| Visual & Performing Arts | 16,494 | 4.2% |
| Communications | 15,349 | 3.9% |
| Arts & Humanities | 29,867 | 7.6% |
| Total | 393,655 | 100.0% |
Transportation & Commute in Area Code 336
Vehicle Availability by Sex in Area Code 336
The most prevalent vehicle ownership categories in Area Code 336 are males with 2 vehicles (174,117, accounting for 38.8%) and females with 2 vehicles (149,118, making up 42.2%).
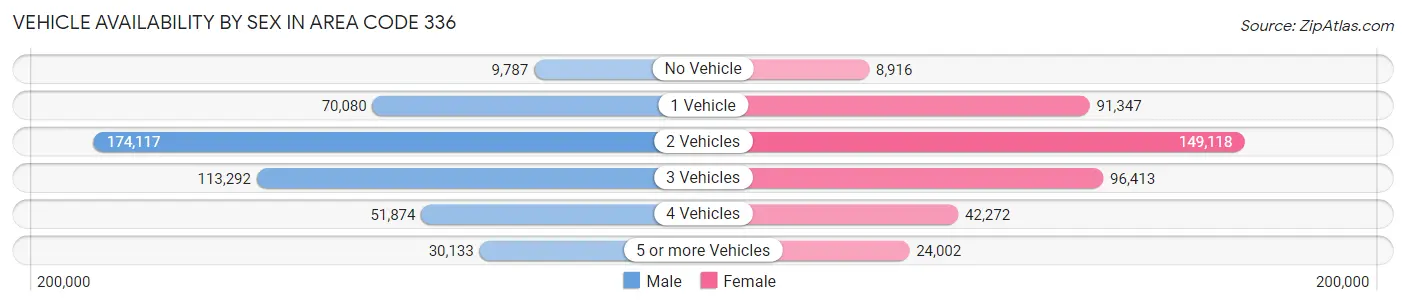
| Vehicles Available | Male | Female |
| No Vehicle | 9,787 (2.2%) | 8,916 (2.2%) |
| 1 Vehicle | 70,080 (15.6%) | 91,347 (22.2%) |
| 2 Vehicles | 174,117 (38.8%) | 149,118 (36.2%) |
| 3 Vehicles | 113,292 (25.2%) | 96,413 (23.4%) |
| 4 Vehicles | 51,874 (11.6%) | 42,272 (10.3%) |
| 5 or more Vehicles | 30,133 (6.7%) | 24,002 (5.8%) |
| Total | 449,283 (100.0%) | 412,068 (100.0%) |
Commute Time in Area Code 336
The most frequently occuring commute durations in Area Code 336 are 15 to 19 minutes (146,573 commuters, 18.4%), 20 to 24 minutes (126,703 commuters, 15.9%), and 10 to 14 minutes (116,340 commuters, 14.6%).
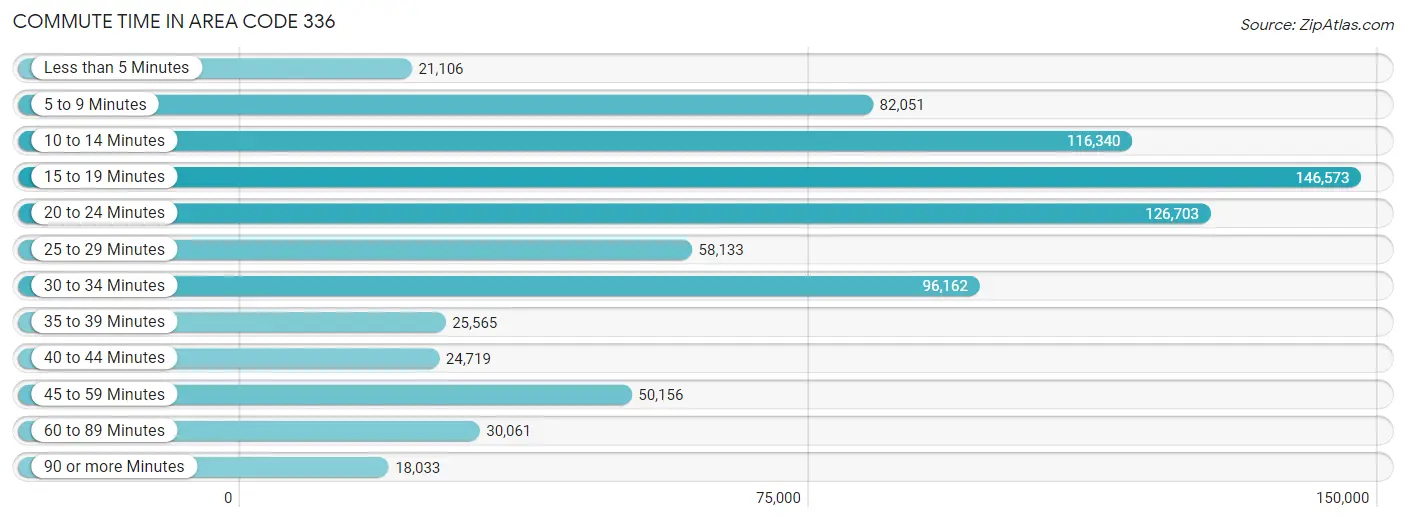
| Commute Time | # Commuters | % Commuters |
| Less than 5 Minutes | 21,106 | 2.6% |
| 5 to 9 Minutes | 82,051 | 10.3% |
| 10 to 14 Minutes | 116,340 | 14.6% |
| 15 to 19 Minutes | 146,573 | 18.4% |
| 20 to 24 Minutes | 126,703 | 15.9% |
| 25 to 29 Minutes | 58,133 | 7.3% |
| 30 to 34 Minutes | 96,162 | 12.1% |
| 35 to 39 Minutes | 25,565 | 3.2% |
| 40 to 44 Minutes | 24,719 | 3.1% |
| 45 to 59 Minutes | 50,156 | 6.3% |
| 60 to 89 Minutes | 30,061 | 3.8% |
| 90 or more Minutes | 18,033 | 2.3% |
Commute Time by Sex in Area Code 336
The most common commute times in Area Code 336 are 15 to 19 minutes (74,362 commuters, 17.8%) for males and 15 to 19 minutes (72,211 commuters, 19.1%) for females.
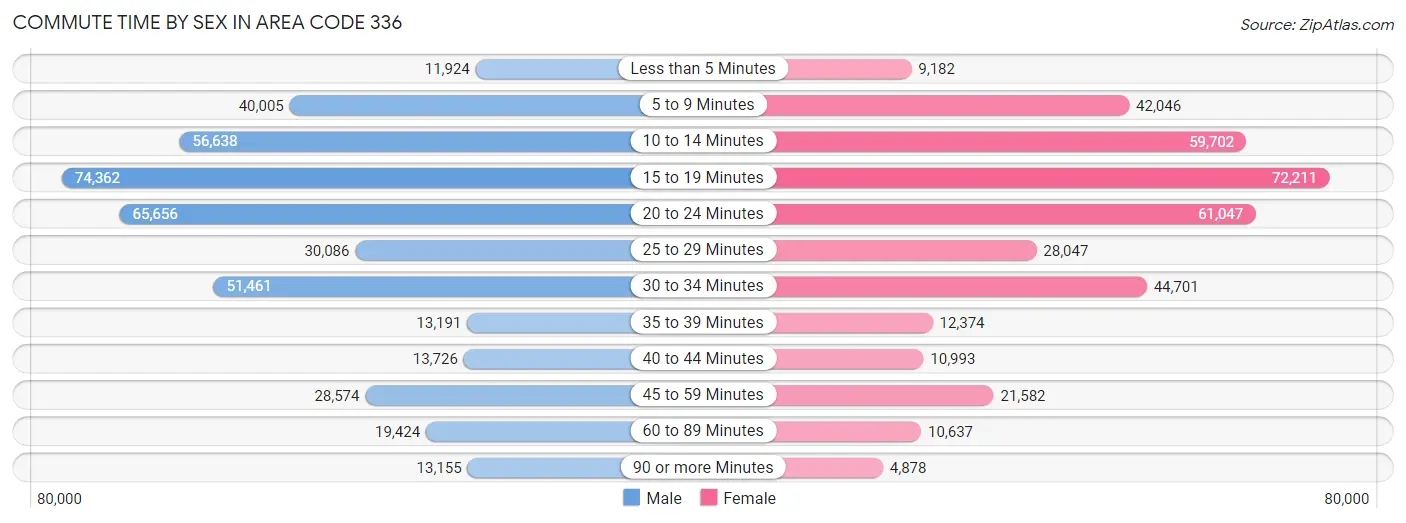
| Commute Time | Male | Female |
| Less than 5 Minutes | 11,924 (2.9%) | 9,182 (2.4%) |
| 5 to 9 Minutes | 40,005 (9.6%) | 42,046 (11.1%) |
| 10 to 14 Minutes | 56,638 (13.5%) | 59,702 (15.8%) |
| 15 to 19 Minutes | 74,362 (17.8%) | 72,211 (19.1%) |
| 20 to 24 Minutes | 65,656 (15.7%) | 61,047 (16.2%) |
| 25 to 29 Minutes | 30,086 (7.2%) | 28,047 (7.4%) |
| 30 to 34 Minutes | 51,461 (12.3%) | 44,701 (11.8%) |
| 35 to 39 Minutes | 13,191 (3.2%) | 12,374 (3.3%) |
| 40 to 44 Minutes | 13,726 (3.3%) | 10,993 (2.9%) |
| 45 to 59 Minutes | 28,574 (6.8%) | 21,582 (5.7%) |
| 60 to 89 Minutes | 19,424 (4.6%) | 10,637 (2.8%) |
| 90 or more Minutes | 13,155 (3.2%) | 4,878 (1.3%) |
Time of Departure to Work by Sex in Area Code 336
The most frequent times of departure to work in Area Code 336 are 7:00 AM to 7:29 AM (59,630, 14.3%) for males and 7:30 AM to 7:59 AM (61,120, 16.2%) for females.
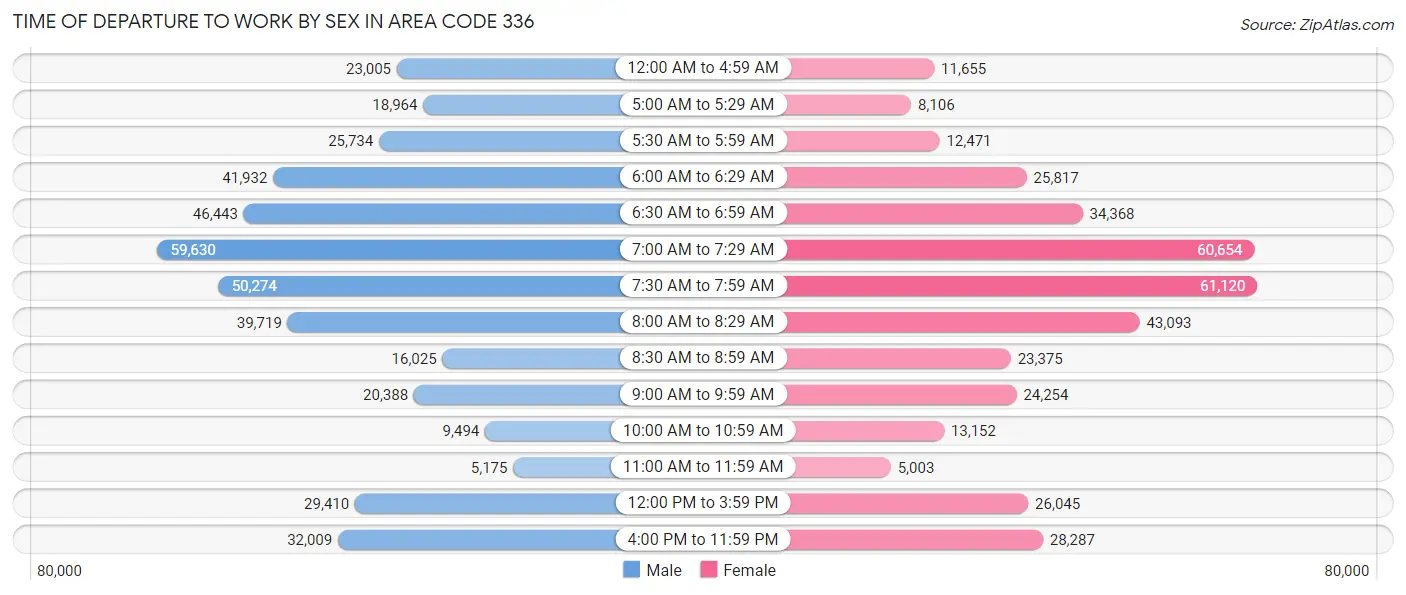
| Time of Departure | Male | Female |
| 12:00 AM to 4:59 AM | 23,005 (5.5%) | 11,655 (3.1%) |
| 5:00 AM to 5:29 AM | 18,964 (4.5%) | 8,106 (2.1%) |
| 5:30 AM to 5:59 AM | 25,734 (6.1%) | 12,471 (3.3%) |
| 6:00 AM to 6:29 AM | 41,932 (10.0%) | 25,817 (6.8%) |
| 6:30 AM to 6:59 AM | 46,443 (11.1%) | 34,368 (9.1%) |
| 7:00 AM to 7:29 AM | 59,630 (14.3%) | 60,654 (16.1%) |
| 7:30 AM to 7:59 AM | 50,274 (12.0%) | 61,120 (16.2%) |
| 8:00 AM to 8:29 AM | 39,719 (9.5%) | 43,093 (11.4%) |
| 8:30 AM to 8:59 AM | 16,025 (3.8%) | 23,375 (6.2%) |
| 9:00 AM to 9:59 AM | 20,388 (4.9%) | 24,254 (6.4%) |
| 10:00 AM to 10:59 AM | 9,494 (2.3%) | 13,152 (3.5%) |
| 11:00 AM to 11:59 AM | 5,175 (1.2%) | 5,003 (1.3%) |
| 12:00 PM to 3:59 PM | 29,410 (7.0%) | 26,045 (6.9%) |
| 4:00 PM to 11:59 PM | 32,009 (7.6%) | 28,287 (7.5%) |
| Total | 418,202 (100.0%) | 377,400 (100.0%) |
Housing Occupancy in Area Code 336
Occupancy by Ownership in Area Code 336
Of the total 761,333 dwellings in Area Code 336, owner-occupied units account for 509,943 (67.0%), while renter-occupied units make up 251,390 (33.0%).
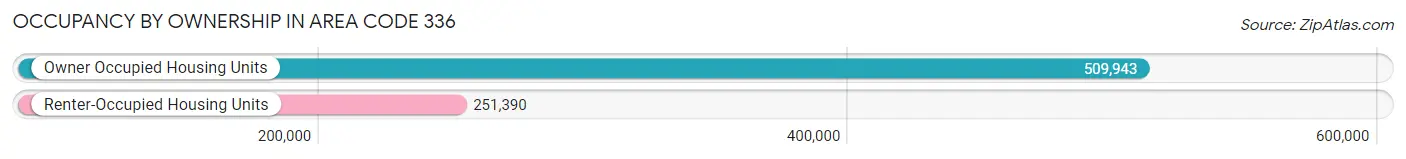
| Occupancy | # Housing Units | % Housing Units |
| Owner Occupied Housing Units | 509,943 | 67.0% |
| Renter-Occupied Housing Units | 251,390 | 33.0% |
| Total Occupied Housing Units | 761,333 | 100.0% |
Occupancy by Household Size in Area Code 336
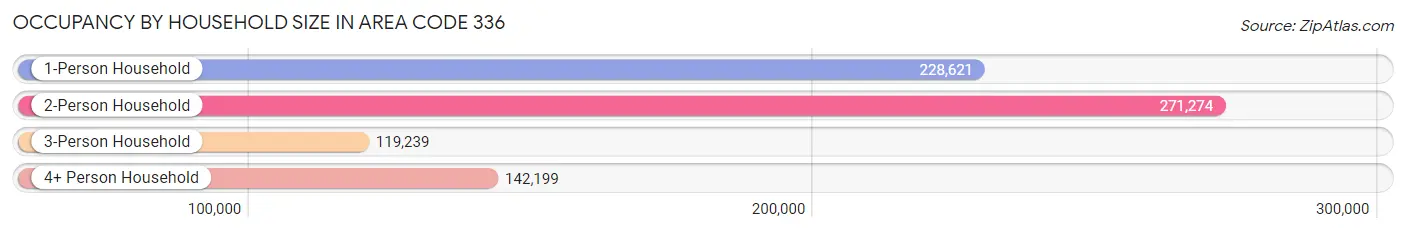
| Household Size | # Housing Units | % Housing Units |
| 1-Person Household | 228,621 | 30.0% |
| 2-Person Household | 271,274 | 35.6% |
| 3-Person Household | 119,239 | 15.7% |
| 4+ Person Household | 142,199 | 18.7% |
| Total Housing Units | 761,333 | 100.0% |
Occupancy by Ownership by Household Size in Area Code 336
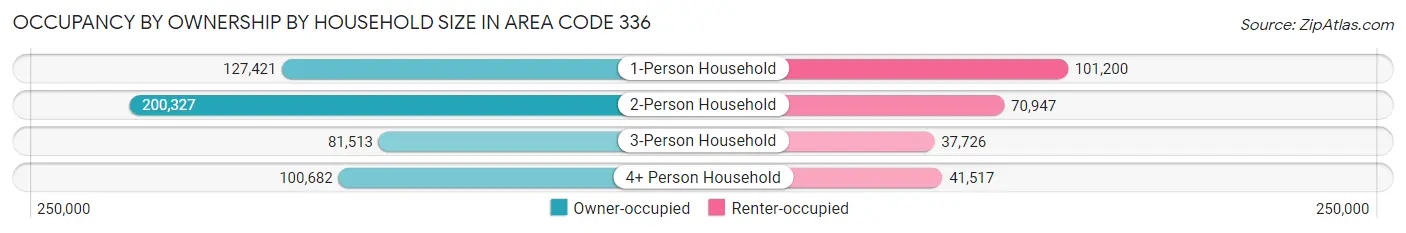
| Household Size | Owner-occupied | Renter-occupied |
| 1-Person Household | 127,421 (55.7%) | 101,200 (44.3%) |
| 2-Person Household | 200,327 (73.9%) | 70,947 (26.2%) |
| 3-Person Household | 81,513 (68.4%) | 37,726 (31.6%) |
| 4+ Person Household | 100,682 (70.8%) | 41,517 (29.2%) |
| Total Housing Units | 509,943 (67.0%) | 251,390 (33.0%) |
Occupancy by Educational Attainment in Area Code 336
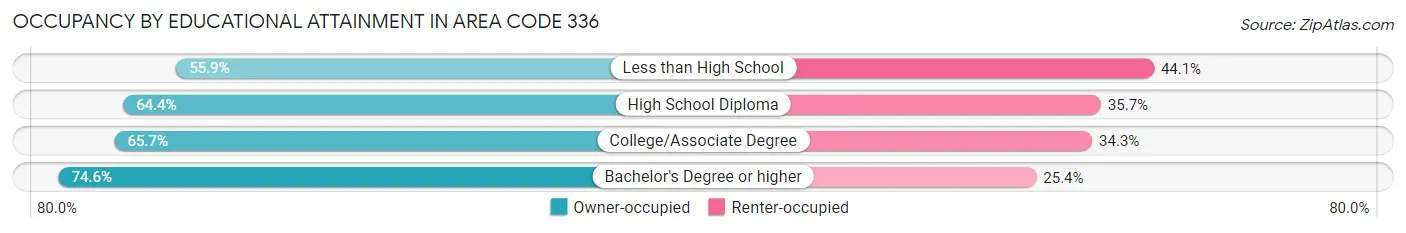
| Household Size | Owner-occupied | Renter-occupied |
| Less than High School | 44,660 (55.9%) | 35,174 (44.1%) |
| High School Diploma | 127,932 (64.3%) | 70,881 (35.6%) |
| College/Associate Degree | 168,347 (65.7%) | 87,748 (34.3%) |
| Bachelor's Degree or higher | 169,004 (74.6%) | 57,587 (25.4%) |
Occupancy by Age of Householder in Area Code 336
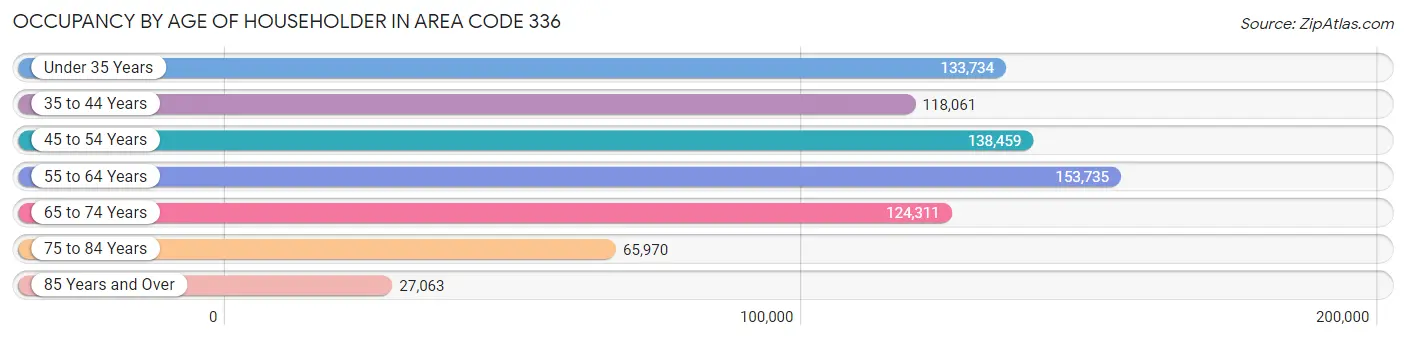
| Age Bracket | # Households | % Households |
| Under 35 Years | 133,734 | 17.6% |
| 35 to 44 Years | 118,061 | 15.5% |
| 45 to 54 Years | 138,459 | 18.2% |
| 55 to 64 Years | 153,735 | 20.2% |
| 65 to 74 Years | 124,311 | 16.3% |
| 75 to 84 Years | 65,970 | 8.7% |
| 85 Years and Over | 27,063 | 3.5% |
| Total | 761,333 | 100.0% |
Housing Finances in Area Code 336
Median Income by Occupancy in Area Code 336
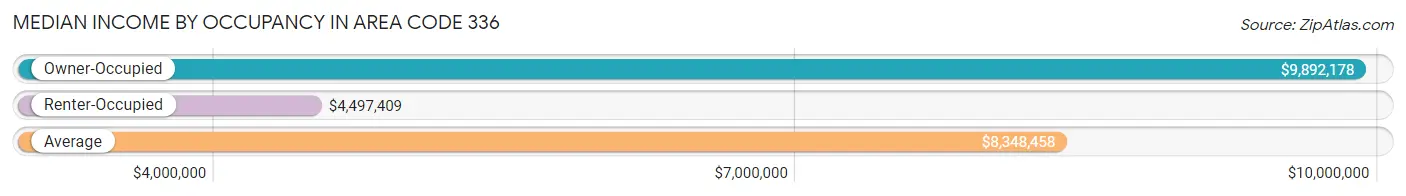
| Occupancy Type | # Households | Median Income |
| Owner-Occupied | 509,943 (67.0%) | $9,892,178 |
| Renter-Occupied | 251,390 (33.0%) | $4,497,409 |
| Average | 761,333 (100.0%) | $8,348,458 |
Occupancy by Householder Income Bracket in Area Code 336
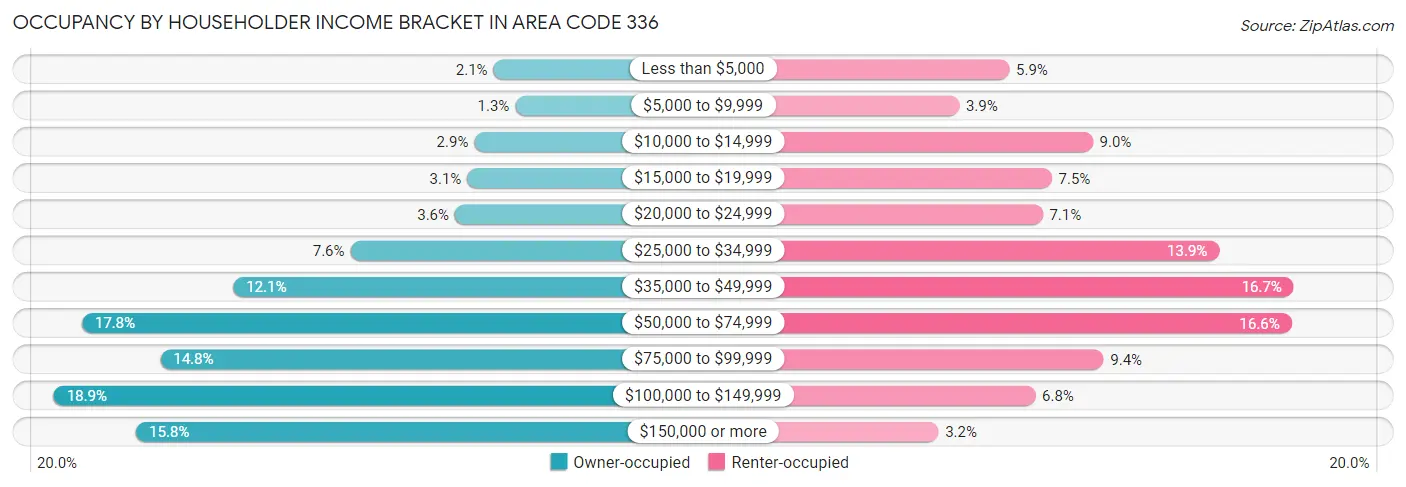
| Income Bracket | Owner-occupied | Renter-occupied |
| Less than $5,000 | 10,908 (2.1%) | 14,715 (5.9%) |
| $5,000 to $9,999 | 6,657 (1.3%) | 9,905 (3.9%) |
| $10,000 to $14,999 | 14,643 (2.9%) | 22,701 (9.0%) |
| $15,000 to $19,999 | 16,014 (3.1%) | 18,776 (7.5%) |
| $20,000 to $24,999 | 18,429 (3.6%) | 17,907 (7.1%) |
| $25,000 to $34,999 | 38,696 (7.6%) | 34,829 (13.9%) |
| $35,000 to $49,999 | 61,462 (12.0%) | 41,950 (16.7%) |
| $50,000 to $74,999 | 90,872 (17.8%) | 41,748 (16.6%) |
| $75,000 to $99,999 | 75,600 (14.8%) | 23,734 (9.4%) |
| $100,000 to $149,999 | 96,337 (18.9%) | 17,203 (6.8%) |
| $150,000 or more | 80,325 (15.8%) | 7,922 (3.2%) |
| Total | 509,943 (100.0%) | 251,390 (100.0%) |
Monthly Housing Cost Tiers in Area Code 336
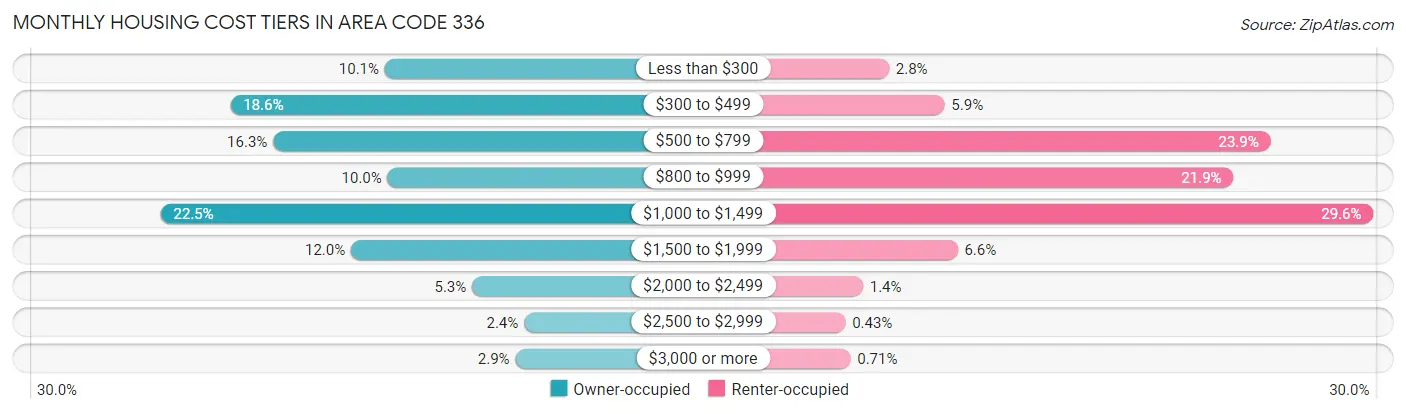
| Monthly Cost | Owner-occupied | Renter-occupied |
| Less than $300 | 51,517 (10.1%) | 7,131 (2.8%) |
| $300 to $499 | 95,074 (18.6%) | 14,860 (5.9%) |
| $500 to $799 | 82,965 (16.3%) | 60,134 (23.9%) |
| $800 to $999 | 50,720 (10.0%) | 54,968 (21.9%) |
| $1,000 to $1,499 | 114,713 (22.5%) | 74,405 (29.6%) |
| $1,500 to $1,999 | 61,034 (12.0%) | 16,659 (6.6%) |
| $2,000 to $2,499 | 26,906 (5.3%) | 3,528 (1.4%) |
| $2,500 to $2,999 | 12,296 (2.4%) | 1,073 (0.4%) |
| $3,000 or more | 14,718 (2.9%) | 1,791 (0.7%) |
| Total | 509,943 (100.0%) | 251,390 (100.0%) |
Physical Housing Characteristics in Area Code 336
Housing Structures in Area Code 336
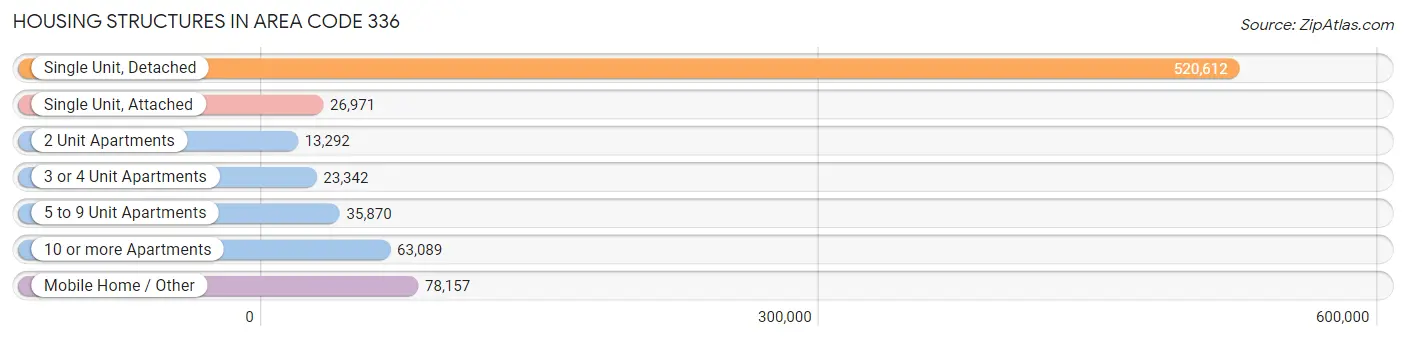
| Structure Type | # Housing Units | % Housing Units |
| Single Unit, Detached | 520,612 | 68.4% |
| Single Unit, Attached | 26,971 | 3.5% |
| 2 Unit Apartments | 13,292 | 1.8% |
| 3 or 4 Unit Apartments | 23,342 | 3.1% |
| 5 to 9 Unit Apartments | 35,870 | 4.7% |
| 10 or more Apartments | 63,089 | 8.3% |
| Mobile Home / Other | 78,157 | 10.3% |
| Total | 761,333 | 100.0% |
Housing Structures by Occupancy in Area Code 336
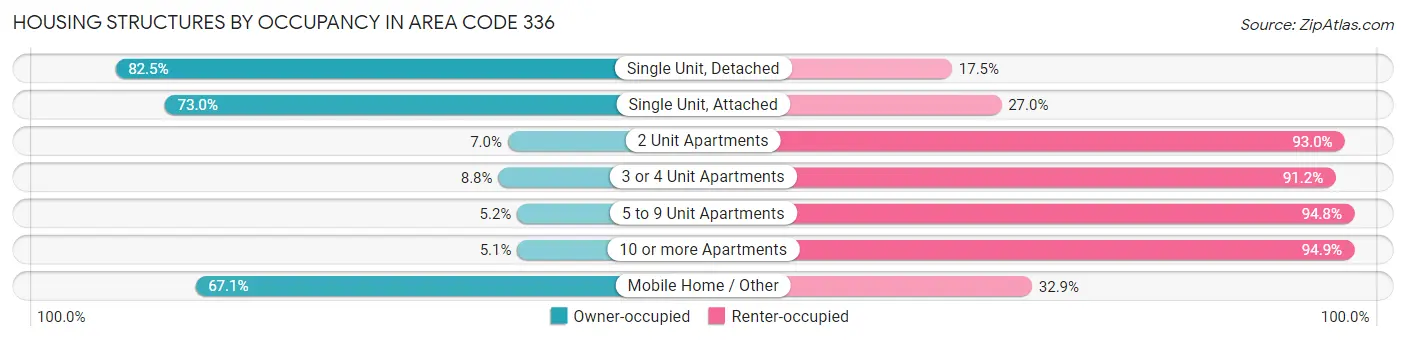
| Structure Type | Owner-occupied | Renter-occupied |
| Single Unit, Detached | 429,703 (82.5%) | 90,909 (17.5%) |
| Single Unit, Attached | 19,698 (73.0%) | 7,273 (27.0%) |
| 2 Unit Apartments | 925 (7.0%) | 12,367 (93.0%) |
| 3 or 4 Unit Apartments | 2,050 (8.8%) | 21,292 (91.2%) |
| 5 to 9 Unit Apartments | 1,852 (5.2%) | 34,018 (94.8%) |
| 10 or more Apartments | 3,243 (5.1%) | 59,846 (94.9%) |
| Mobile Home / Other | 52,472 (67.1%) | 25,685 (32.9%) |
| Total | 509,943 (67.0%) | 251,390 (33.0%) |
Housing Structures by Number of Rooms in Area Code 336
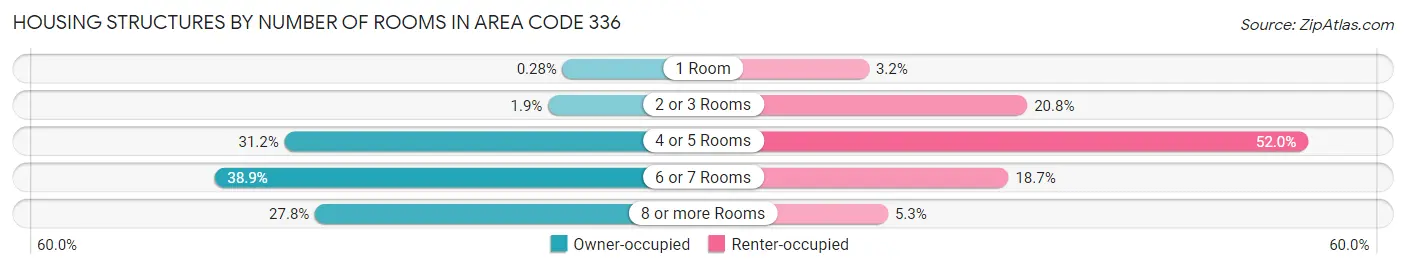
| Number of Rooms | Owner-occupied | Renter-occupied |
| 1 Room | 1,423 (0.3%) | 8,103 (3.2%) |
| 2 or 3 Rooms | 9,627 (1.9%) | 52,270 (20.8%) |
| 4 or 5 Rooms | 158,848 (31.1%) | 130,593 (51.9%) |
| 6 or 7 Rooms | 198,511 (38.9%) | 47,027 (18.7%) |
| 8 or more Rooms | 141,534 (27.8%) | 13,397 (5.3%) |
| Total | 509,943 (100.0%) | 251,390 (100.0%) |
Housing Structure by Heating Type in Area Code 336
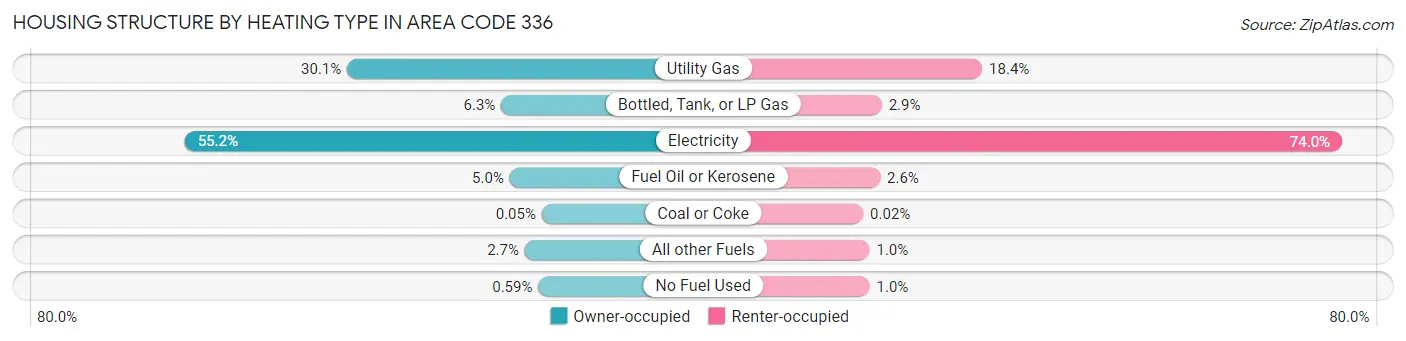
| Heating Type | Owner-occupied | Renter-occupied |
| Utility Gas | 153,700 (30.1%) | 46,291 (18.4%) |
| Bottled, Tank, or LP Gas | 32,212 (6.3%) | 7,270 (2.9%) |
| Electricity | 281,702 (55.2%) | 186,086 (74.0%) |
| Fuel Oil or Kerosene | 25,481 (5.0%) | 6,649 (2.6%) |
| Coal or Coke | 265 (0.1%) | 50 (0.0%) |
| All other Fuels | 13,590 (2.7%) | 2,506 (1.0%) |
| No Fuel Used | 2,993 (0.6%) | 2,538 (1.0%) |
| Total | 509,943 (100.0%) | 251,390 (100.0%) |
Household Vehicle Usage in Area Code 336
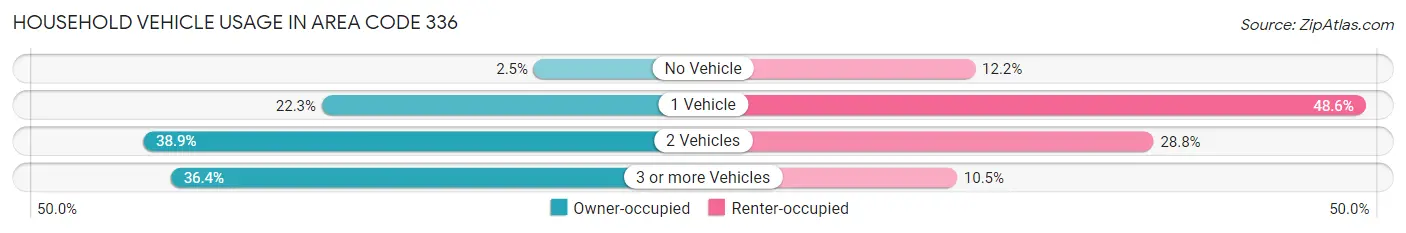
| Vehicles per Household | Owner-occupied | Renter-occupied |
| No Vehicle | 12,561 (2.5%) | 30,551 (12.1%) |
| 1 Vehicle | 113,439 (22.3%) | 122,178 (48.6%) |
| 2 Vehicles | 198,510 (38.9%) | 72,396 (28.8%) |
| 3 or more Vehicles | 185,433 (36.4%) | 26,265 (10.4%) |
| Total | 509,943 (100.0%) | 251,390 (100.0%) |
Real Estate & Mortgages in Area Code 336
Real Estate and Mortgage Overview in Area Code 336
| Characteristic | Without Mortgage | With Mortgage |
| Housing Units | 208,870 | 301,073 |
| Median Property Value | $21,048,500 | $26,159,600 |
| Median Household Income | $7,470,293 | $59,161 |
| Monthly Housing Costs | $54,358 | $14,117 |
| Real Estate Taxes | $161,261 | $5,388 |
Property Value by Mortgage Status in Area Code 336
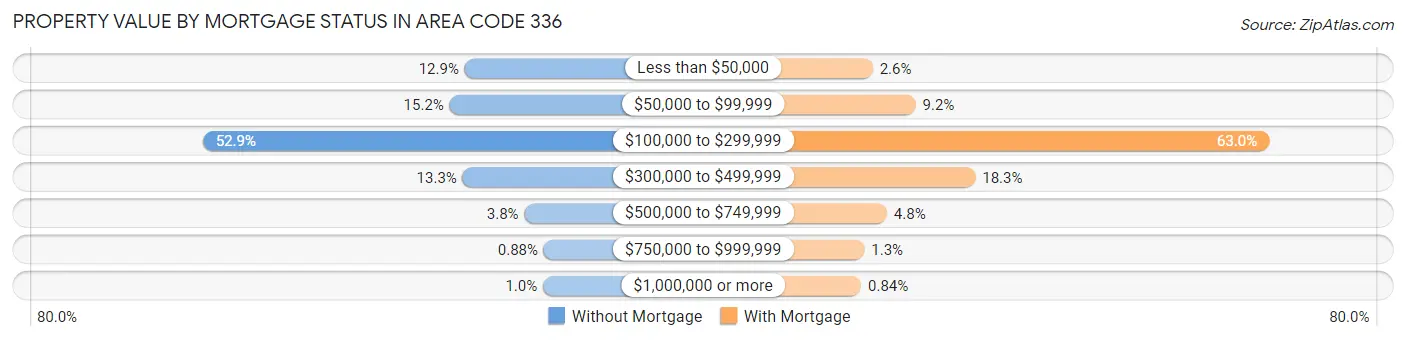
| Property Value | Without Mortgage | With Mortgage |
| Less than $50,000 | 27,007 (12.9%) | 7,901 (2.6%) |
| $50,000 to $99,999 | 31,802 (15.2%) | 27,551 (9.1%) |
| $100,000 to $299,999 | 110,418 (52.9%) | 189,707 (63.0%) |
| $300,000 to $499,999 | 27,681 (13.3%) | 54,932 (18.2%) |
| $500,000 to $749,999 | 8,018 (3.8%) | 14,399 (4.8%) |
| $750,000 to $999,999 | 1,846 (0.9%) | 4,047 (1.3%) |
| $1,000,000 or more | 2,098 (1.0%) | 2,536 (0.8%) |
| Total | 208,870 (100.0%) | 301,073 (100.0%) |
Household Income by Mortgage Status in Area Code 336
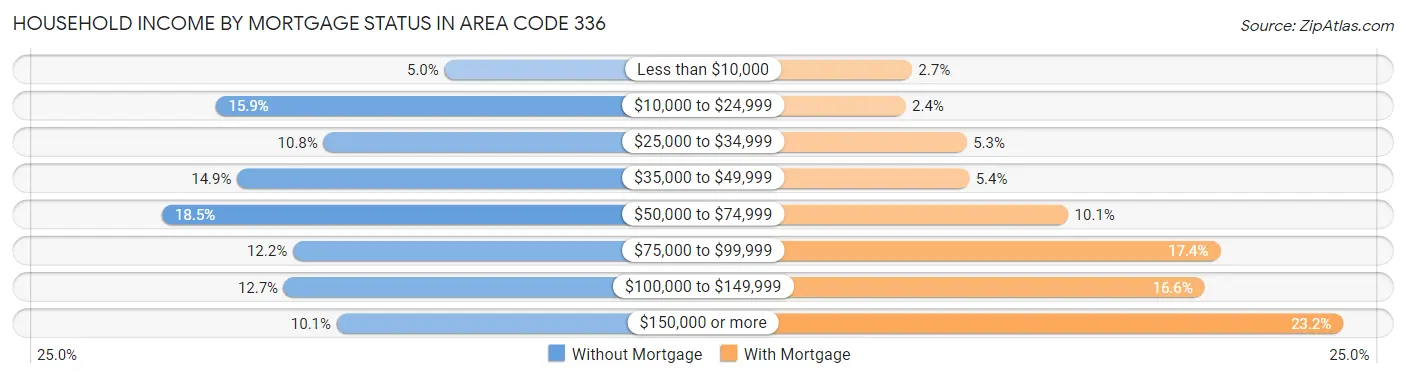
| Household Income | Without Mortgage | With Mortgage |
| Less than $10,000 | 10,453 (5.0%) | 8,022 (2.7%) |
| $10,000 to $24,999 | 33,226 (15.9%) | 7,112 (2.4%) |
| $25,000 to $34,999 | 22,465 (10.8%) | 15,860 (5.3%) |
| $35,000 to $49,999 | 31,049 (14.9%) | 16,231 (5.4%) |
| $50,000 to $74,999 | 38,565 (18.5%) | 30,413 (10.1%) |
| $75,000 to $99,999 | 25,527 (12.2%) | 52,307 (17.4%) |
| $100,000 to $149,999 | 26,421 (12.7%) | 50,073 (16.6%) |
| $150,000 or more | 21,164 (10.1%) | 69,916 (23.2%) |
| Total | 208,870 (100.0%) | 301,073 (100.0%) |
Property Value to Household Income Ratio in Area Code 336
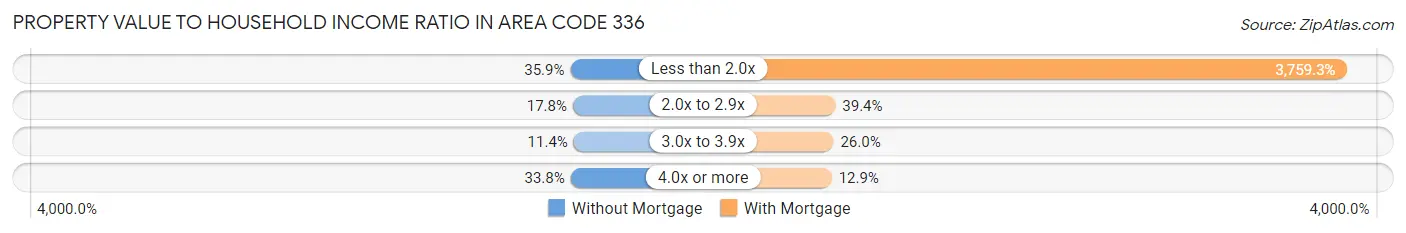
| Value-to-Income Ratio | Without Mortgage | With Mortgage |
| Less than 2.0x | 75,046 (35.9%) | 11,318,331 (3,759.3%) |
| 2.0x to 2.9x | 37,081 (17.7%) | 118,529 (39.4%) |
| 3.0x to 3.9x | 23,827 (11.4%) | 78,377 (26.0%) |
| 4.0x or more | 70,587 (33.8%) | 38,922 (12.9%) |
| Total | 208,870 (100.0%) | 301,073 (100.0%) |
Real Estate Taxes by Mortgage Status in Area Code 336
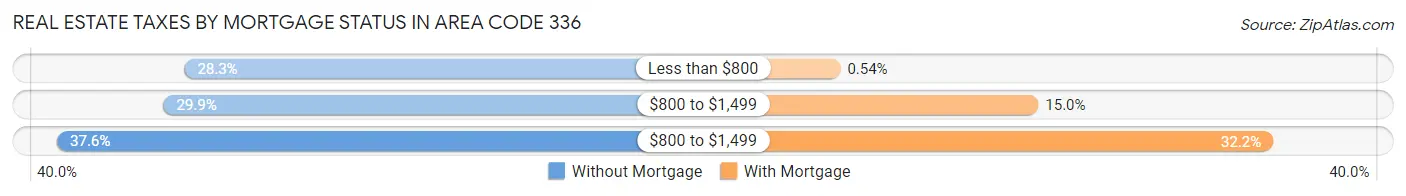
| Property Taxes | Without Mortgage | With Mortgage |
| Less than $800 | 59,142 (28.3%) | 1,632 (0.5%) |
| $800 to $1,499 | 62,344 (29.8%) | 45,149 (15.0%) |
| $800 to $1,499 | 78,577 (37.6%) | 96,807 (32.2%) |
| Total | 208,870 (100.0%) | 301,073 (100.0%) |
Health & Disability in Area Code 336
Health Insurance Coverage by Age in Area Code 336
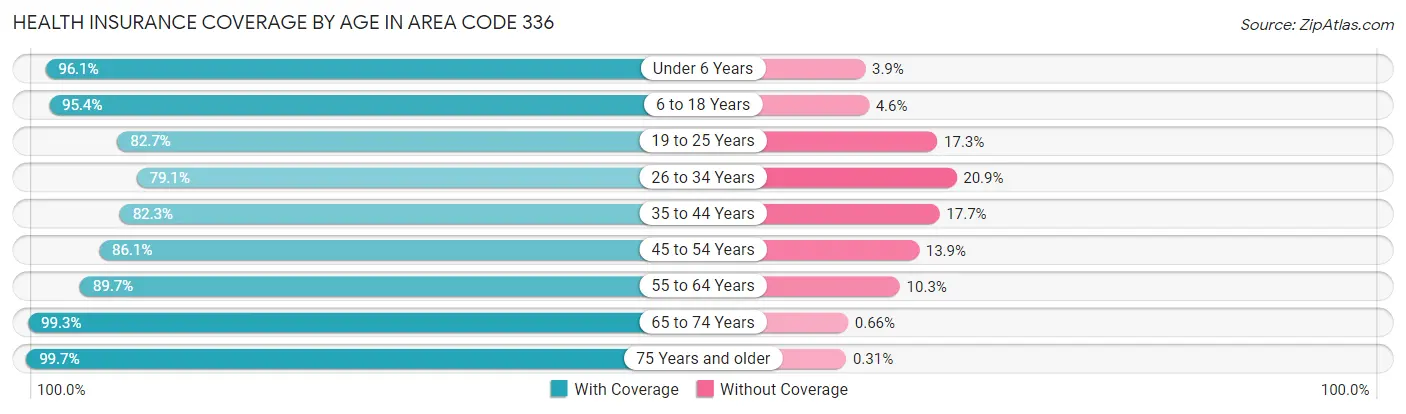
| Age Bracket | With Coverage | Without Coverage |
| Under 6 Years | 118,885 (96.1%) | 4,788 (3.9%) |
| 6 to 18 Years | 305,312 (95.4%) | 14,576 (4.6%) |
| 19 to 25 Years | 144,803 (82.7%) | 30,302 (17.3%) |
| 26 to 34 Years | 166,726 (79.1%) | 44,009 (20.9%) |
| 35 to 44 Years | 180,876 (82.3%) | 39,000 (17.7%) |
| 45 to 54 Years | 214,253 (86.1%) | 34,557 (13.9%) |
| 55 to 64 Years | 232,751 (89.7%) | 26,796 (10.3%) |
| 65 to 74 Years | 195,959 (99.3%) | 1,310 (0.7%) |
| 75 Years and older | 134,787 (99.7%) | 424 (0.3%) |
| Total | 1,694,352 (89.6%) | 195,762 (10.4%) |
Health Insurance Coverage by Citizenship Status in Area Code 336
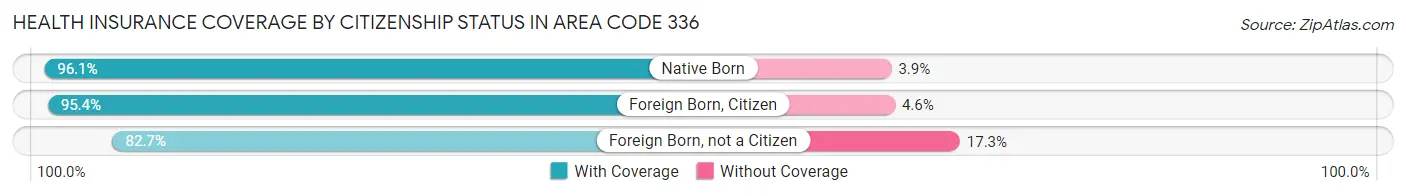
| Citizenship Status | With Coverage | Without Coverage |
| Native Born | 118,885 (96.1%) | 4,788 (3.9%) |
| Foreign Born, Citizen | 305,312 (95.4%) | 14,576 (4.6%) |
| Foreign Born, not a Citizen | 144,803 (82.7%) | 30,302 (17.3%) |
Health Insurance Coverage by Household Income in Area Code 336
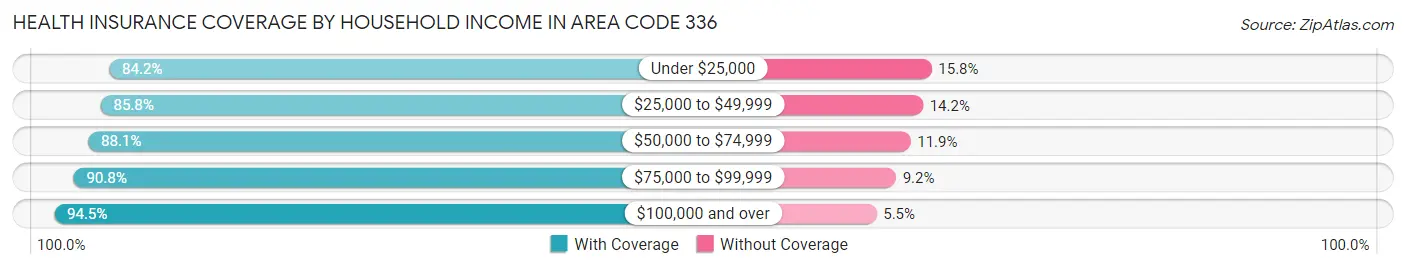
| Household Income | With Coverage | Without Coverage |
| Under $25,000 | 223,437 (84.2%) | 42,057 (15.8%) |
| $25,000 to $49,999 | 321,964 (85.8%) | 53,423 (14.2%) |
| $50,000 to $74,999 | 289,047 (88.1%) | 39,051 (11.9%) |
| $75,000 to $99,999 | 246,881 (90.8%) | 24,911 (9.2%) |
| $100,000 and over | 582,511 (94.5%) | 34,026 (5.5%) |
Public vs Private Health Insurance Coverage by Age in Area Code 336
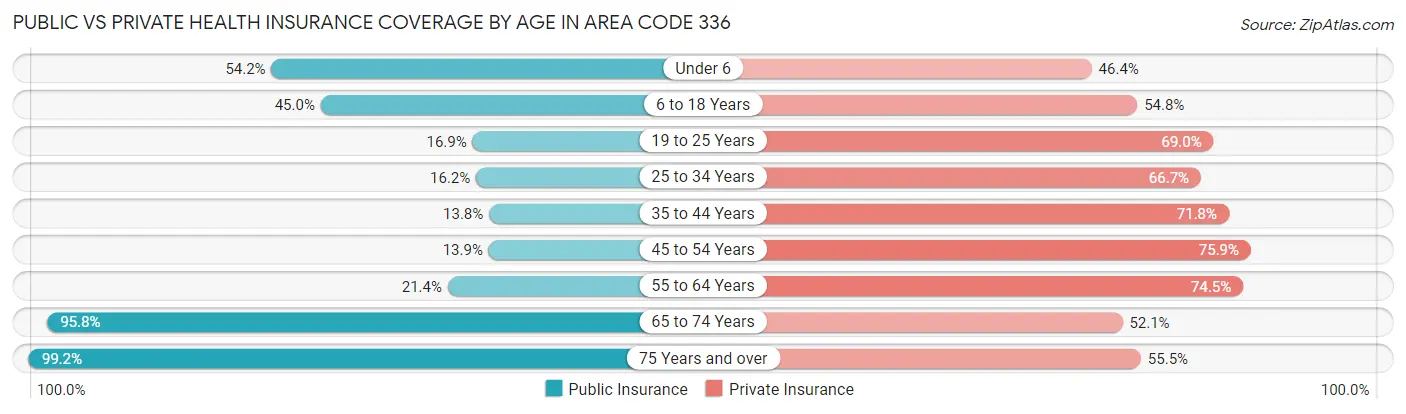
| Age Bracket | Public Insurance | Private Insurance |
| Under 6 | 67,004 (54.2%) | 57,363 (46.4%) |
| 6 to 18 Years | 144,036 (45.0%) | 175,393 (54.8%) |
| 19 to 25 Years | 29,515 (16.9%) | 120,828 (69.0%) |
| 25 to 34 Years | 34,125 (16.2%) | 140,447 (66.6%) |
| 35 to 44 Years | 30,292 (13.8%) | 157,954 (71.8%) |
| 45 to 54 Years | 34,466 (13.9%) | 188,905 (75.9%) |
| 55 to 64 Years | 55,650 (21.4%) | 193,298 (74.5%) |
| 65 to 74 Years | 188,992 (95.8%) | 102,766 (52.1%) |
| 75 Years and over | 134,141 (99.2%) | 75,070 (55.5%) |
| Total | 718,221 (38.0%) | 1,212,024 (64.1%) |
Disability Status by Sex by Age in Area Code 336
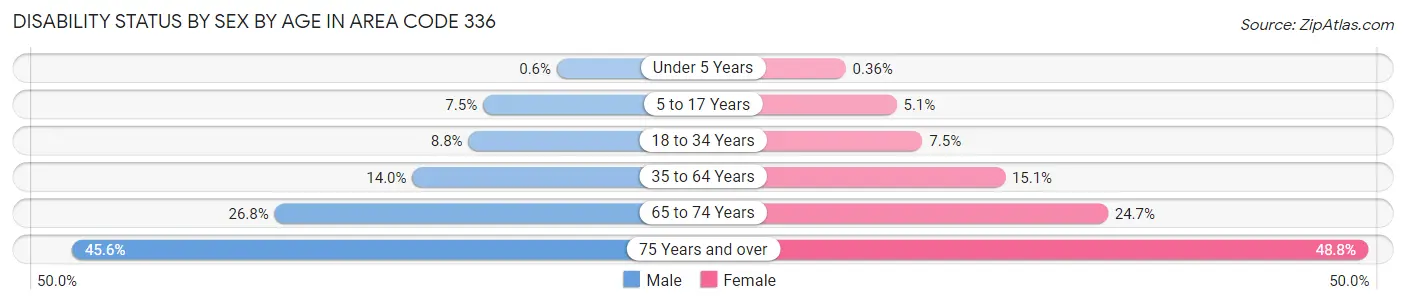
| Age Bracket | Male | Female |
| Under 5 Years | 321 (0.6%) | 184 (0.4%) |
| 5 to 17 Years | 11,762 (7.5%) | 7,655 (5.1%) |
| 18 to 34 Years | 17,827 (8.8%) | 16,074 (7.5%) |
| 35 to 64 Years | 49,545 (14.0%) | 56,728 (15.1%) |
| 65 to 74 Years | 24,425 (26.8%) | 26,202 (24.7%) |
| 75 Years and over | 25,095 (45.6%) | 39,138 (48.8%) |
Disability Class by Sex by Age in Area Code 336
Disability Class: Hearing Difficulty
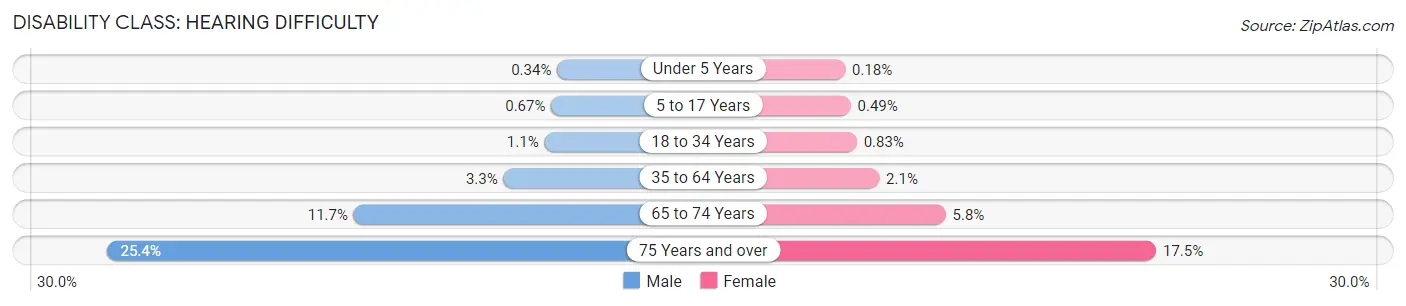
| Age Bracket | Male | Female |
| Under 5 Years | 180 (0.3%) | 91 (0.2%) |
| 5 to 17 Years | 1,055 (0.7%) | 733 (0.5%) |
| 18 to 34 Years | 2,126 (1.1%) | 1,777 (0.8%) |
| 35 to 64 Years | 11,785 (3.3%) | 7,777 (2.1%) |
| 65 to 74 Years | 10,633 (11.7%) | 6,136 (5.8%) |
| 75 Years and over | 13,966 (25.4%) | 14,028 (17.5%) |
Disability Class: Vision Difficulty
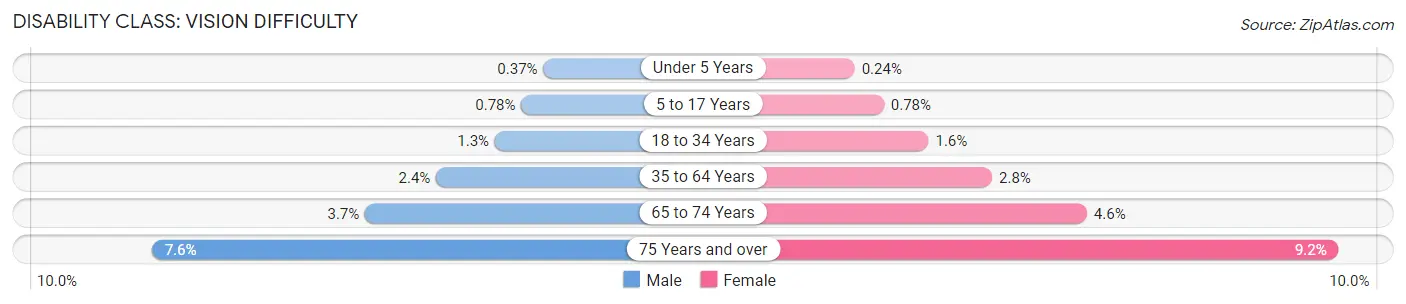
| Age Bracket | Male | Female |
| Under 5 Years | 199 (0.4%) | 120 (0.2%) |
| 5 to 17 Years | 1,236 (0.8%) | 1,174 (0.8%) |
| 18 to 34 Years | 2,576 (1.3%) | 3,463 (1.6%) |
| 35 to 64 Years | 8,345 (2.4%) | 10,445 (2.8%) |
| 65 to 74 Years | 3,358 (3.7%) | 4,824 (4.5%) |
| 75 Years and over | 4,203 (7.6%) | 7,389 (9.2%) |
Disability Class: Cognitive Difficulty
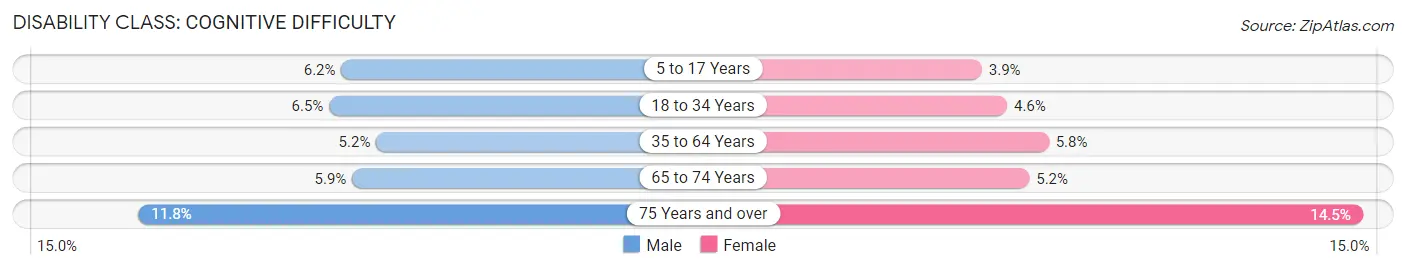
| Age Bracket | Male | Female |
| 5 to 17 Years | 9,735 (6.2%) | 5,871 (3.9%) |
| 18 to 34 Years | 13,185 (6.5%) | 9,883 (4.6%) |
| 35 to 64 Years | 18,441 (5.2%) | 21,568 (5.8%) |
| 65 to 74 Years | 5,364 (5.9%) | 5,543 (5.2%) |
| 75 Years and over | 6,513 (11.8%) | 11,627 (14.5%) |
Disability Class: Ambulatory Difficulty
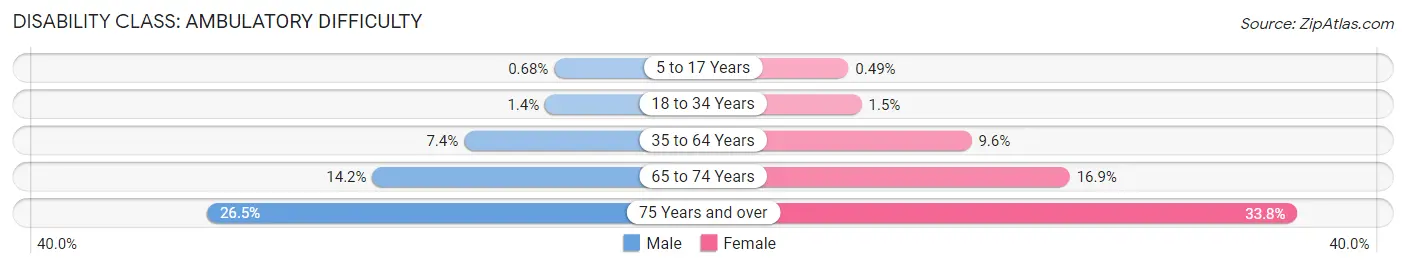
| Age Bracket | Male | Female |
| 5 to 17 Years | 1,068 (0.7%) | 740 (0.5%) |
| 18 to 34 Years | 2,754 (1.4%) | 3,165 (1.5%) |
| 35 to 64 Years | 26,056 (7.4%) | 36,058 (9.6%) |
| 65 to 74 Years | 12,927 (14.2%) | 17,957 (16.9%) |
| 75 Years and over | 14,562 (26.5%) | 27,116 (33.8%) |
Disability Class: Self-Care Difficulty
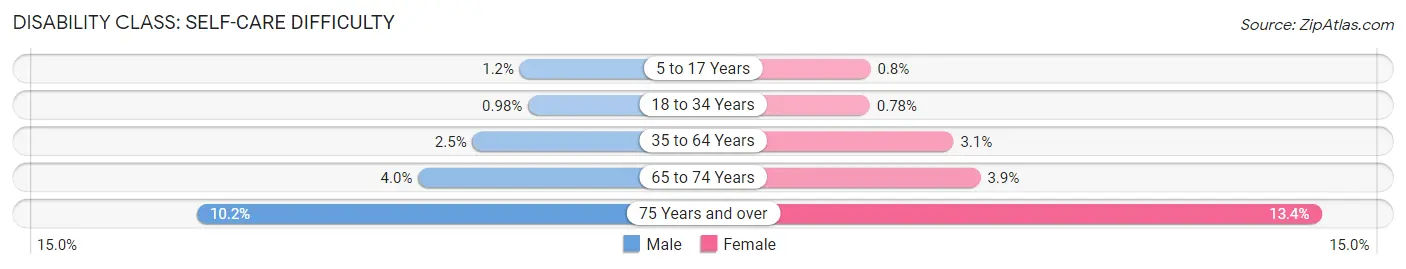
| Age Bracket | Male | Female |
| 5 to 17 Years | 1,914 (1.2%) | 1,210 (0.8%) |
| 18 to 34 Years | 1,975 (1.0%) | 1,669 (0.8%) |
| 35 to 64 Years | 8,932 (2.5%) | 11,668 (3.1%) |
| 65 to 74 Years | 3,680 (4.0%) | 4,099 (3.9%) |
| 75 Years and over | 5,611 (10.2%) | 10,700 (13.4%) |
Technology Access in Area Code 336
Computing Device Access in Area Code 336
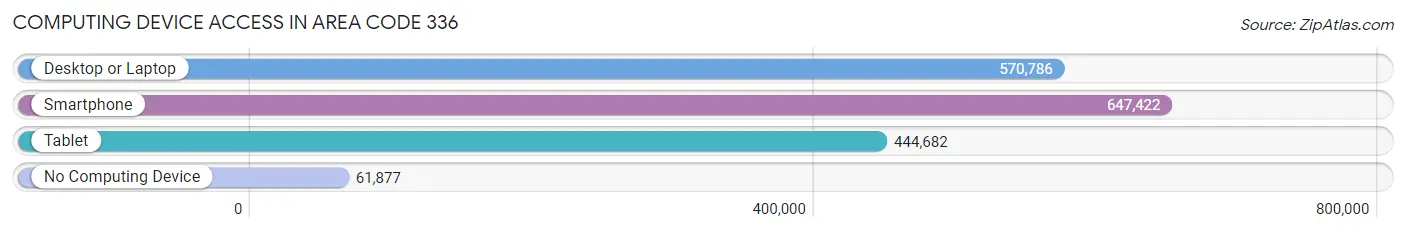
| Device Type | # Households | % Households |
| Desktop or Laptop | 570,786 | 75.0% |
| Smartphone | 647,422 | 85.0% |
| Tablet | 444,682 | 58.4% |
| No Computing Device | 61,877 | 8.1% |
| Total | 761,333 | 100.0% |
Internet Access in Area Code 336
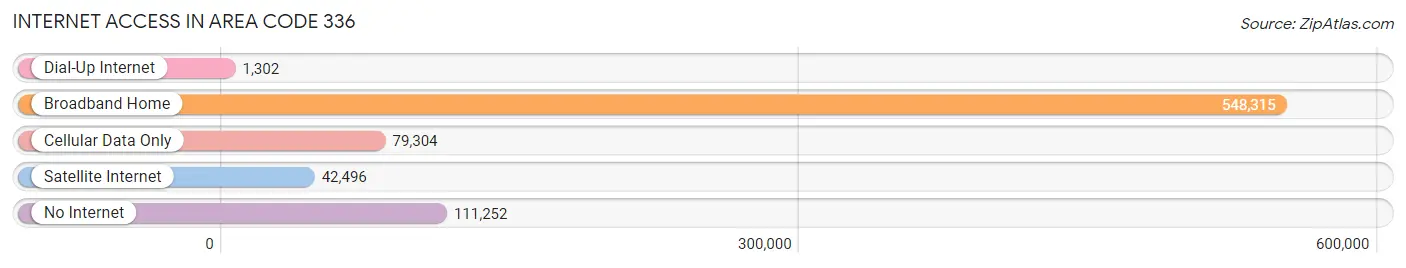
| Internet Type | # Households | % Households |
| Dial-Up Internet | 1,302 | 0.2% |
| Broadband Home | 548,315 | 72.0% |
| Cellular Data Only | 79,304 | 10.4% |
| Satellite Internet | 42,496 | 5.6% |
| No Internet | 111,252 | 14.6% |
| Total | 761,333 | 100.0% |
Area Code 336 Summary
Geography
Area code 336 is located in the state of North Carolina. It covers the Piedmont Triad region, which includes the cities of Greensboro, Winston-Salem, and High Point. It also covers parts of the counties of Alamance, Caswell, Davidson, Davie, Forsyth, Guilford, Randolph, Rockingham, Stokes, Surry, and Yadkin.
Social
Area code 336 is home to a diverse population of people from all walks of life. The area is known for its vibrant arts and culture scene, with a variety of museums, galleries, and performing arts venues. The area is also home to several universities and colleges, including Wake Forest University, University of North Carolina at Greensboro, and High Point University.
Economics
Area code 336 is a major economic hub in North Carolina. The area is home to a number of large corporations, including Volvo Trucks, Honda Aircraft Company, and Volvo Financial Services. The area is also home to a number of small businesses, including restaurants, retail stores, and service providers.
Demographics
Area code 336 is home to a diverse population of people from all walks of life. According to the U.S. Census Bureau, the population of the area is approximately 1.3 million people. The population is made up of a variety of ethnic and racial backgrounds, including African American, Hispanic, Asian, and White. The median household income in the area is approximately $50,000.
Common Questions
What is Per Capita Income in Area Code 336?
Per Capita income in Area Code 336 is $32,569.
What is the Median Family Income in Area Code 336?
Median Family Income in Area Code 336 is $76,094.
What is the Median Household income in Area Code 336?
Median Household Income in Area Code 336 is $61,840.
What is Income or Wage Gap in Area Code 336?
Income or Wage Gap in Area Code 336 is 24.5%.
Women in Area Code 336 earn 75.5 cents for every dollar earned by a man.
What is Family Income Deficit in Area Code 336?
Family Income Deficit in Area Code 336 is $10,582.
Families that are below poverty line in Area Code 336 earn $10,582 less on average than the poverty threshold level.
What is Inequality or Gini Index in Area Code 336?
Inequality or Gini Index in Area Code 336 is 60.61.
What is the Total Population of Area Code 336?
Total Population of Area Code 336 is 1,909,585.
What is the Total Male Population of Area Code 336?
Total Male Population of Area Code 336 is 924,728.
What is the Total Female Population of Area Code 336?
Total Female Population of Area Code 336 is 984,857.
What is the Ratio of Males per 100 Females in Area Code 336?
There are 93.89 Males per 100 Females in Area Code 336.
What is the Ratio of Females per 100 Males in Area Code 336?
There are 106.50 Females per 100 Males in Area Code 336.
What is the Median Population Age in Area Code 336?
Median Population Age in Area Code 336 is 43.2 Years.
What is the Average Family Size in Area Code 336
Average Family Size in Area Code 336 is 3.0 People.
What is the Average Household Size in Area Code 336
Average Household Size in Area Code 336 is 2.5 People.
How Large is the Labor Force in Area Code 336?
There are 899,552 People in the Labor Forcein in Area Code 336.
What is the Percentage of People in the Labor Force in Area Code 336?
58.2% of People are in the Labor Force in Area Code 336.
What is the Unemployment Rate in Area Code 336?
Unemployment Rate in Area Code 336 is 5.7%.