Area Code 256 Map & Demographics
Area Code 256 Map
Area Code 256 Overview
$32,058
PER CAPITA INCOME
$75,488
AVG FAMILY INCOME
$59,600
AVG HOUSEHOLD INCOME
34.0%
WAGE / INCOME GAP [ % ]
66.0¢/ $1
WAGE / INCOME GAP [ $ ]
$10,298
FAMILY INCOME DEFICIT
70.22
INEQUALITY / GINI INDEX
1,480,992
TOTAL POPULATION
727,277
MALE POPULATION
753,715
FEMALE POPULATION
96.49
MALES / 100 FEMALES
103.64
FEMALES / 100 MALES
42.3
MEDIAN AGE
3.2
AVG FAMILY SIZE
2.6
AVG HOUSEHOLD SIZE
660,787
LABOR FORCE [ PEOPLE ]
55.2%
PERCENT IN LABOR FORCE
5.2%
UNEMPLOYMENT RATE
Income in Area Code 256
Income Overview in Area Code 256
Per Capita Income in Area Code 256 is $32,058, while median incomes of families and households are $75,488 and $59,600 respectively.
| Characteristic | Number | Measure |
| Per Capita Income | 1,480,992 | $32,058 |
| Median Family Income | 383,041 | $75,488 |
| Mean Family Income | 383,041 | $14,870,368 |
| Median Household Income | 580,951 | $59,600 |
| Mean Household Income | 580,951 | $12,707,040 |
| Income Deficit | 383,041 | $10,298 |
| Wage / Income Gap (%) | 1,480,992 | 33.98% |
| Wage / Income Gap ($) | 1,480,992 | 66.02¢ per $1 |
| Gini / Inequality Index | 1,480,992 | 70.22 |
Earnings by Sex in Area Code 256
Average Earnings in Area Code 256 are $37,626, $46,267 for men and $30,273 for women, a difference of 34.6%.
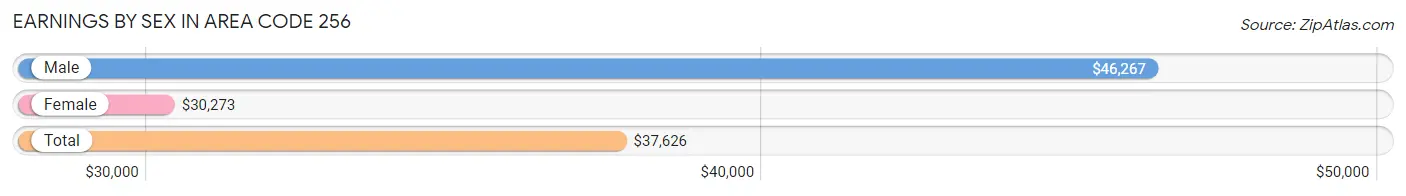
| Sex | Number | Average Earnings |
| Male | 391,136 (53.9%) | $46,267 |
| Female | 334,678 (46.1%) | $30,273 |
| Total | 725,814 (100.0%) | $37,626 |
Earnings by Sex by Income Bracket in Area Code 256
The most common earnings brackets in Area Code 256 are $100,000+ for men (65,568 | 16.8%) and $25,000 to $29,999 for women (26,238 | 7.8%).
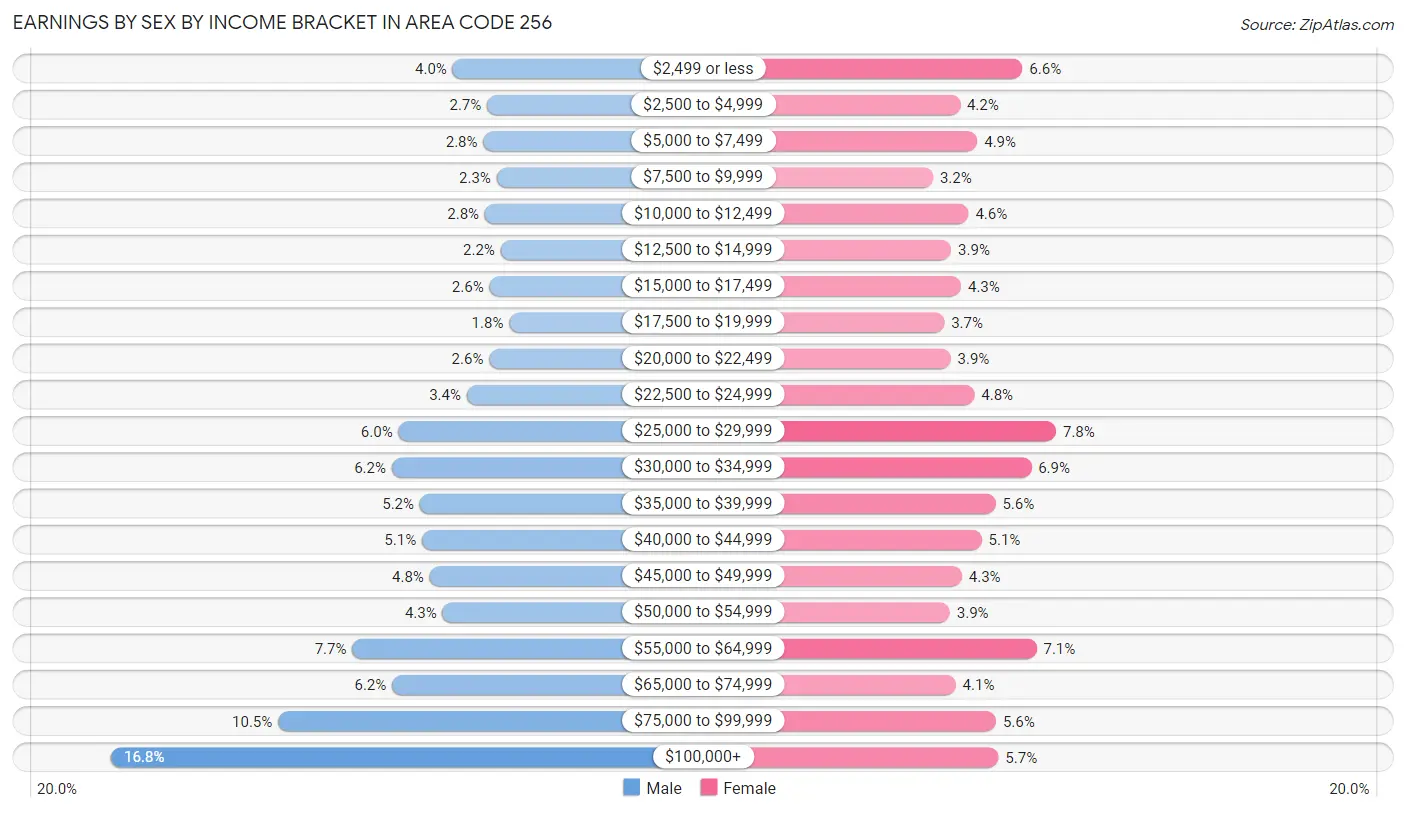
| Income | Male | Female |
| $2,499 or less | 15,496 (4.0%) | 22,006 (6.6%) |
| $2,500 to $4,999 | 10,455 (2.7%) | 14,184 (4.2%) |
| $5,000 to $7,499 | 10,993 (2.8%) | 16,350 (4.9%) |
| $7,500 to $9,999 | 9,024 (2.3%) | 10,802 (3.2%) |
| $10,000 to $12,499 | 10,749 (2.8%) | 15,264 (4.6%) |
| $12,500 to $14,999 | 8,451 (2.2%) | 13,091 (3.9%) |
| $15,000 to $17,499 | 10,099 (2.6%) | 14,331 (4.3%) |
| $17,500 to $19,999 | 7,214 (1.8%) | 12,205 (3.6%) |
| $20,000 to $22,499 | 10,139 (2.6%) | 13,019 (3.9%) |
| $22,500 to $24,999 | 13,399 (3.4%) | 16,013 (4.8%) |
| $25,000 to $29,999 | 23,437 (6.0%) | 26,238 (7.8%) |
| $30,000 to $34,999 | 24,400 (6.2%) | 23,133 (6.9%) |
| $35,000 to $39,999 | 20,288 (5.2%) | 18,658 (5.6%) |
| $40,000 to $44,999 | 19,989 (5.1%) | 16,888 (5.1%) |
| $45,000 to $49,999 | 18,839 (4.8%) | 14,431 (4.3%) |
| $50,000 to $54,999 | 16,979 (4.3%) | 12,925 (3.9%) |
| $55,000 to $64,999 | 30,199 (7.7%) | 23,799 (7.1%) |
| $65,000 to $74,999 | 24,351 (6.2%) | 13,647 (4.1%) |
| $75,000 to $99,999 | 41,067 (10.5%) | 18,695 (5.6%) |
| $100,000+ | 65,568 (16.8%) | 18,999 (5.7%) |
| Total | 391,136 (100.0%) | 334,678 (100.0%) |
Earnings by Sex by Educational Attainment in Area Code 256
Average earnings in Area Code 256 are $8,085,604 for men and $5,276,411 for women, a difference of 34.7%. Men with an educational attainment of graduate degree enjoy the highest average annual earnings of $9,595,362, while those with less than high school education earn the least with $3,972,356. Women with an educational attainment of graduate degree earn the most with the average annual earnings of $7,283,612, while those with less than high school education have the smallest earnings of $1,673,091.
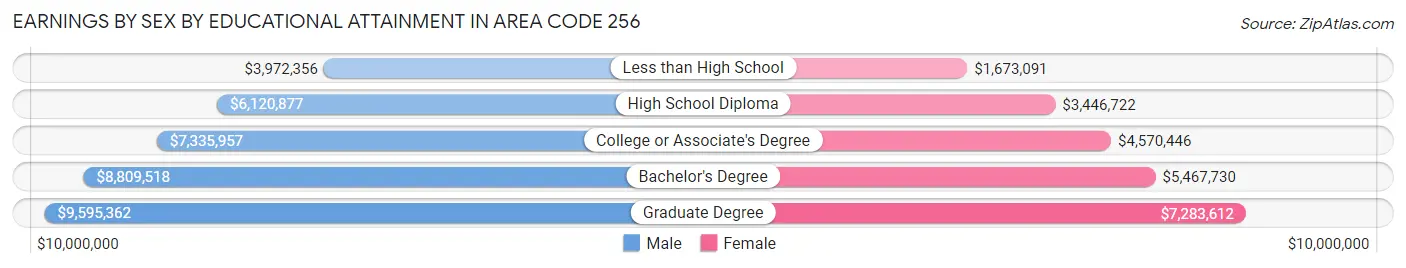
| Educational Attainment | Male Income | Female Income |
| Less than High School | $3,972,356 | $1,673,091 |
| High School Diploma | $6,120,877 | $3,446,722 |
| College or Associate's Degree | $7,335,957 | $4,570,446 |
| Bachelor's Degree | $8,809,518 | $5,467,730 |
| Graduate Degree | $9,595,362 | $7,283,612 |
| Total | $8,085,604 | $5,276,411 |
Family Income in Area Code 256
Family Income Brackets in Area Code 256
According to the Area Code 256 family income data, there are 10,995,958 families falling into the $50,000 to $74,999 income range, which is the most common income bracket and makes up 2,870.7% of all families. Conversely, the $10,000 to $14,999 income bracket is the least frequent group with only 1,678,486 families (438.2%) belonging to this category.
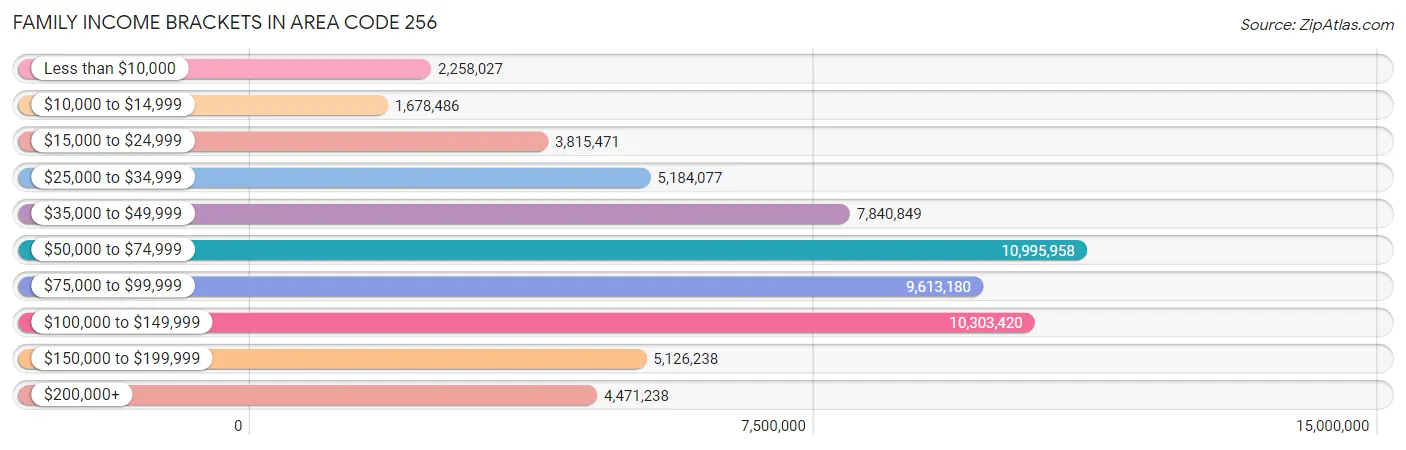
| Income Bracket | # Families | % Families |
| Less than $10,000 | 2,258,027 | 589.5% |
| $10,000 to $14,999 | 1,678,486 | 438.2% |
| $15,000 to $24,999 | 3,815,471 | 996.1% |
| $25,000 to $34,999 | 5,184,077 | 1,353.4% |
| $35,000 to $49,999 | 7,840,849 | 2,047.0% |
| $50,000 to $74,999 | 10,995,958 | 2,870.7% |
| $75,000 to $99,999 | 9,613,180 | 2,509.7% |
| $100,000 to $149,999 | 10,303,420 | 2,689.9% |
| $150,000 to $199,999 | 5,126,238 | 1,338.3% |
| $200,000+ | 4,471,238 | 1,167.3% |
Family Income by Famaliy Size in Area Code 256
7+ person families (4,157 | 1.1%) account for the highest median family income in Area Code 256 with $118,890 per family, while 2-person families (197,073 | 51.4%) have the highest median income of $34,072 per family member.
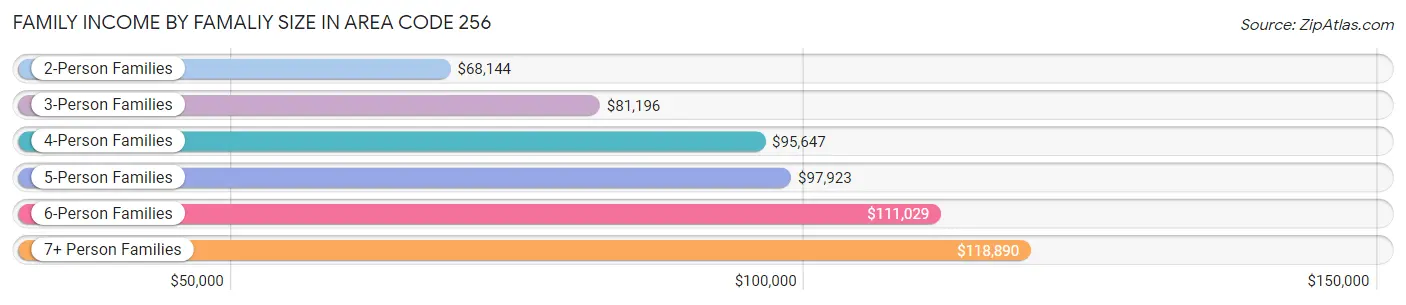
| Income Bracket | # Families | Median Income |
| 2-Person Families | 197,073 (51.4%) | $68,144 |
| 3-Person Families | 82,622 (21.6%) | $81,196 |
| 4-Person Families | 64,114 (16.7%) | $95,647 |
| 5-Person Families | 26,864 (7.0%) | $97,923 |
| 6-Person Families | 8,211 (2.1%) | $111,029 |
| 7+ Person Families | 4,157 (1.1%) | $118,890 |
| Total | 383,041 (100.0%) | $75,488 |
Family Income by Number of Earners in Area Code 256
The median family income in Area Code 256 is $75,488, with families comprising 3+ earners (33,212) having the highest median family income of $132,098, while families with no earners (73,010) have the lowest median family income of $45,067, accounting for 8.7% and 19.1% of families, respectively.
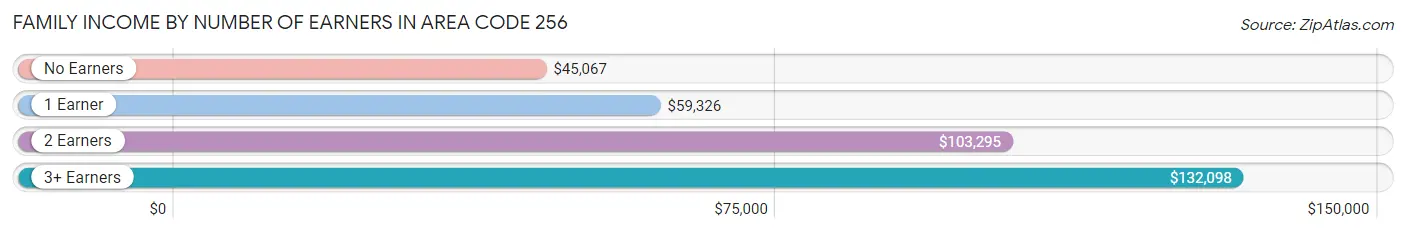
| Number of Earners | # Families | Median Income |
| No Earners | 73,010 (19.1%) | $45,067 |
| 1 Earner | 130,934 (34.2%) | $59,326 |
| 2 Earners | 145,885 (38.1%) | $103,295 |
| 3+ Earners | 33,212 (8.7%) | $132,098 |
| Total | 383,041 (100.0%) | $75,488 |
Household Income in Area Code 256
Household Income Brackets in Area Code 256
With 15,810,581 households falling in the category, the $50,000 to $74,999 income range is the most frequent in Area Code 256, accounting for 2,721.5% of all households. In contrast, only 5,158,845 households (888.0%) fall into the $10,000 to $14,999 income bracket, making it the least populous group.
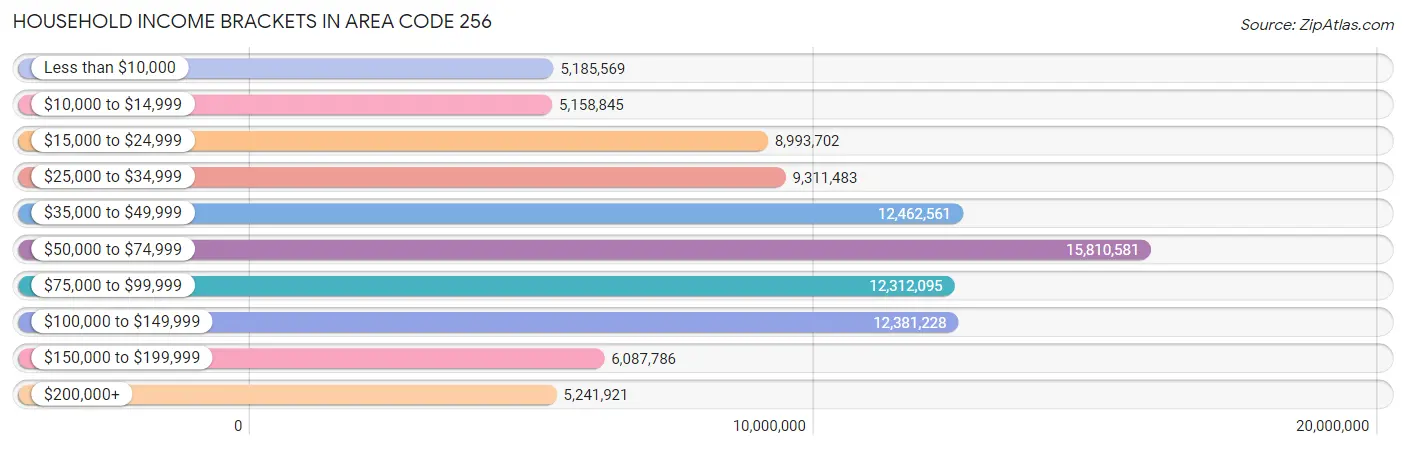
| Income Bracket | # Households | % Households |
| Less than $10,000 | 5,185,569 | 892.6% |
| $10,000 to $14,999 | 5,158,845 | 888.0% |
| $15,000 to $24,999 | 8,993,702 | 1,548.1% |
| $25,000 to $34,999 | 9,311,483 | 1,602.8% |
| $35,000 to $49,999 | 12,462,561 | 2,145.2% |
| $50,000 to $74,999 | 15,810,581 | 2,721.5% |
| $75,000 to $99,999 | 12,312,095 | 2,119.3% |
| $100,000 to $149,999 | 12,381,228 | 2,131.2% |
| $150,000 to $199,999 | 6,087,786 | 1,047.9% |
| $200,000+ | 5,241,921 | 902.3% |
Household Income by Householder Age in Area Code 256
The median household income in Area Code 256 is $59,600, with the highest median household income of $74,670 found in the 45 to 64 years age bracket for the primary householder. A total of 220,280 households (37.9%) fall into this category. Meanwhile, the 65+ years age bracket for the primary householder has the lowest median household income of $45,831, with 168,234 households (29.0%) in this group.
| Income Bracket | # Households | Median Income |
| 15 to 24 Years | 21,246 (3.7%) | $47,917 |
| 25 to 44 Years | 171,191 (29.5%) | $68,262 |
| 45 to 64 Years | 220,280 (37.9%) | $74,670 |
| 65+ Years | 168,234 (29.0%) | $45,831 |
| Total | 580,951 (100.0%) | $59,600 |
Poverty in Area Code 256
Income Below Poverty by Sex and Age in Area Code 256
With 12.7% poverty level for males and 16.4% for females among the residents of Area Code 256, under 5 year old males and under 5 year old females are the most vulnerable to poverty, with 11,144 males (26.1%) and 9,481 females (23.6%) in their respective age groups living below the poverty level.
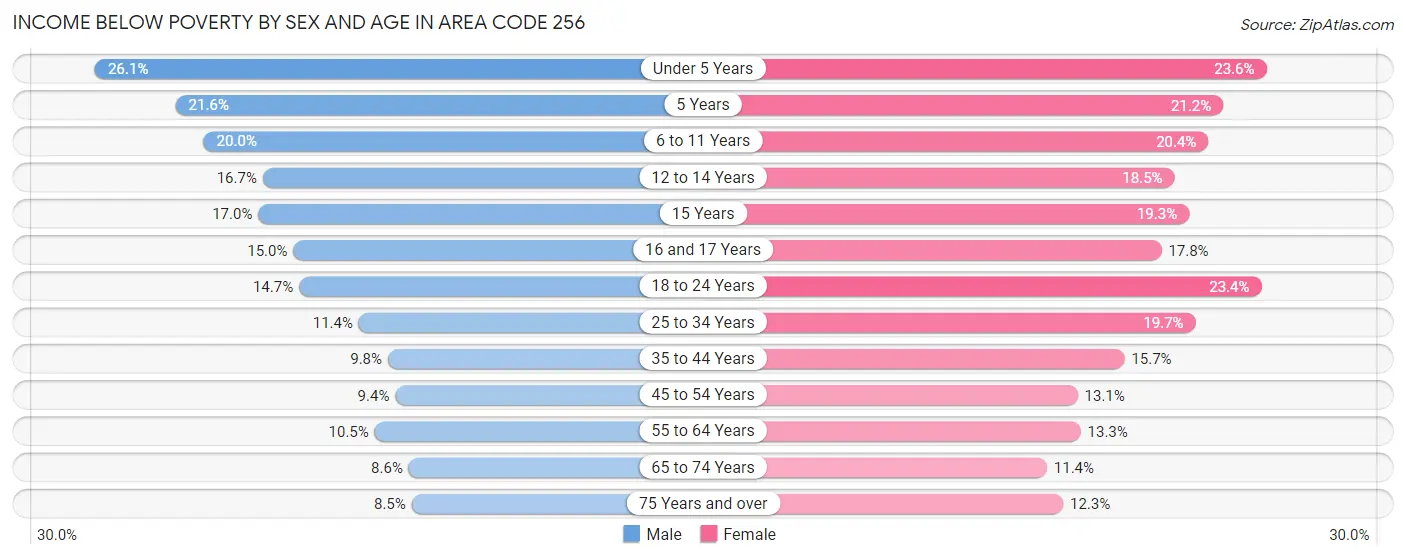
| Age Bracket | Male | Female |
| Under 5 Years | 11,144 (26.1%) | 9,481 (23.6%) |
| 5 Years | 1,842 (21.6%) | 1,836 (21.2%) |
| 6 to 11 Years | 10,716 (20.0%) | 10,359 (20.4%) |
| 12 to 14 Years | 4,784 (16.7%) | 5,110 (18.5%) |
| 15 Years | 1,672 (17.0%) | 1,787 (19.3%) |
| 16 and 17 Years | 2,809 (15.0%) | 3,253 (17.8%) |
| 18 to 24 Years | 9,155 (14.7%) | 14,072 (23.4%) |
| 25 to 34 Years | 10,336 (11.4%) | 18,047 (19.7%) |
| 35 to 44 Years | 8,441 (9.8%) | 14,096 (15.7%) |
| 45 to 54 Years | 8,675 (9.4%) | 12,279 (13.1%) |
| 55 to 64 Years | 10,477 (10.5%) | 13,893 (13.3%) |
| 65 to 74 Years | 6,267 (8.6%) | 9,417 (11.4%) |
| 75 Years and over | 3,578 (8.5%) | 7,579 (12.3%) |
| Total | 89,896 (12.7%) | 121,209 (16.4%) |
Income Above Poverty by Sex and Age in Area Code 256
According to the poverty statistics in Area Code 256, males aged 75 years and over and females aged 65 to 74 years are the age groups that are most secure financially, with 91.5% of males and 88.6% of females in these age groups living above the poverty line.
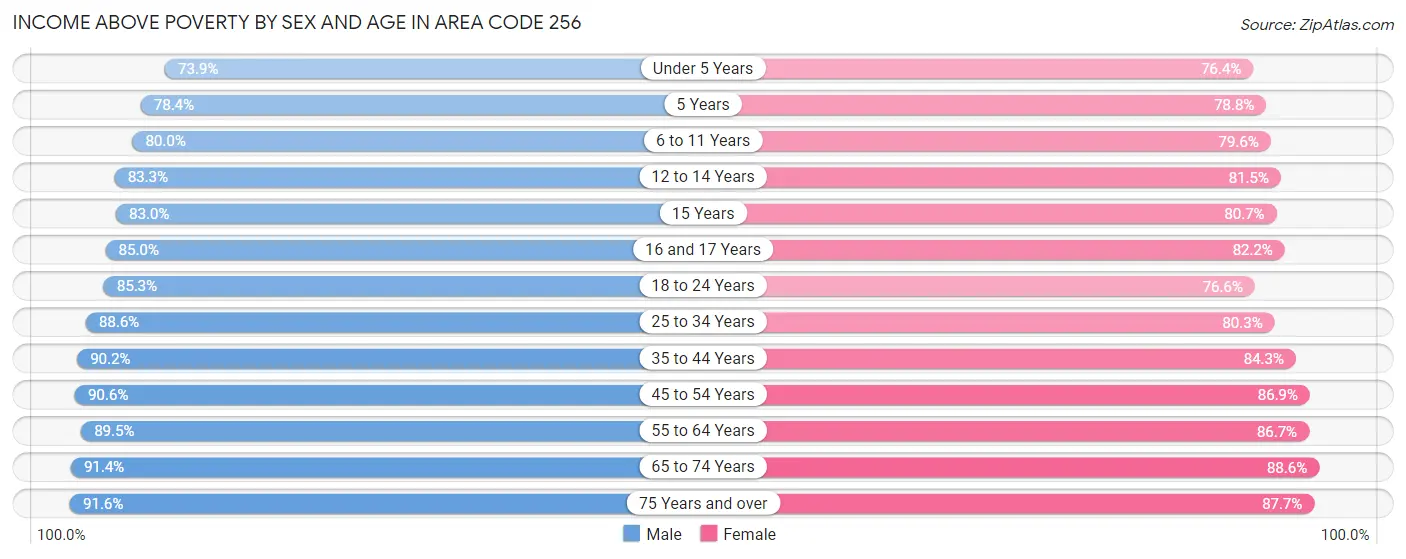
| Age Bracket | Male | Female |
| Under 5 Years | 31,584 (73.9%) | 30,617 (76.4%) |
| 5 Years | 6,688 (78.4%) | 6,811 (78.8%) |
| 6 to 11 Years | 42,771 (80.0%) | 40,425 (79.6%) |
| 12 to 14 Years | 23,801 (83.3%) | 22,484 (81.5%) |
| 15 Years | 8,170 (83.0%) | 7,456 (80.7%) |
| 16 and 17 Years | 15,862 (85.0%) | 15,025 (82.2%) |
| 18 to 24 Years | 53,020 (85.3%) | 46,159 (76.6%) |
| 25 to 34 Years | 80,380 (88.6%) | 73,590 (80.3%) |
| 35 to 44 Years | 77,953 (90.2%) | 75,471 (84.3%) |
| 45 to 54 Years | 84,011 (90.6%) | 81,248 (86.9%) |
| 55 to 64 Years | 89,184 (89.5%) | 90,557 (86.7%) |
| 65 to 74 Years | 66,509 (91.4%) | 73,075 (88.6%) |
| 75 Years and over | 38,780 (91.5%) | 53,932 (87.7%) |
| Total | 618,713 (87.3%) | 616,850 (83.6%) |
Income Below Poverty Among Married-Couple Families in Area Code 256
The poverty statistics for married-couple families in Area Code 256 show that 5.5% or 15,607 of the total 284,834 families live below the poverty line. Families with 5 or more children have the highest poverty rate of 25.7%, comprising of 435 families. On the other hand, families with no children have the lowest poverty rate of 4.2%, which includes 7,528 families.
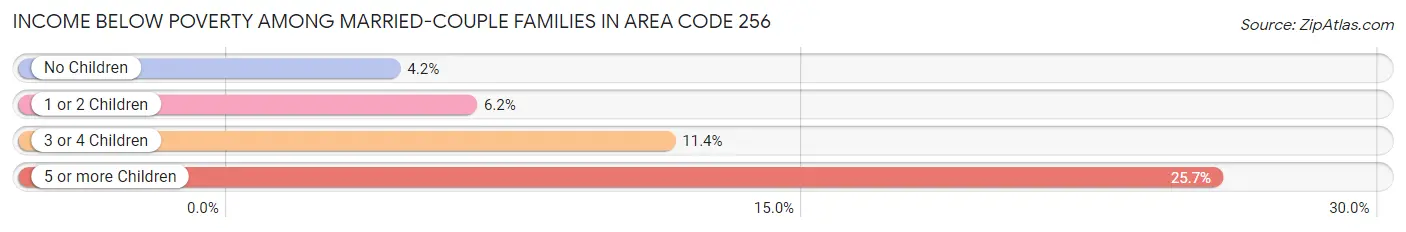
| Children | Above Poverty | Below Poverty |
| No Children | 170,024 (95.8%) | 7,528 (4.2%) |
| 1 or 2 Children | 79,864 (93.8%) | 5,312 (6.2%) |
| 3 or 4 Children | 18,083 (88.6%) | 2,332 (11.4%) |
| 5 or more Children | 1,256 (74.3%) | 435 (25.7%) |
| Total | 269,227 (94.5%) | 15,607 (5.5%) |
Income Below Poverty Among Single-Parent Households in Area Code 256
According to the poverty data in Area Code 256, 14.3% or 3,767 single-father households and 31.2% or 22,436 single-mother households are living below the poverty line. Among single-father households, those with 3 or 4 children have the highest poverty rate, with 487 households (26.0%) experiencing poverty. Likewise, among single-mother households, those with 5 or more children have the highest poverty rate, with 383 households (82.0%) falling below the poverty line.
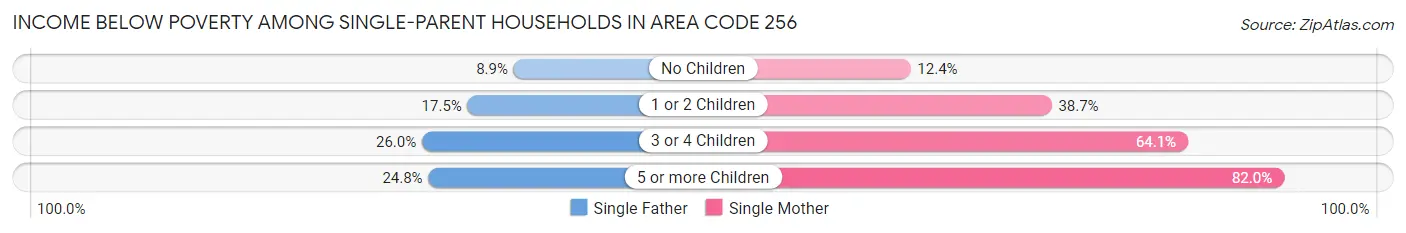
| Children | Single Father | Single Mother |
| No Children | 1,055 (8.9%) | 3,461 (12.4%) |
| 1 or 2 Children | 2,142 (17.5%) | 14,207 (38.7%) |
| 3 or 4 Children | 487 (26.0%) | 4,385 (64.1%) |
| 5 or more Children | 83 (24.8%) | 383 (82.0%) |
| Total | 3,767 (14.3%) | 22,436 (31.2%) |
Income Below Poverty Among Married-Couple vs Single-Parent Households in Area Code 256
The poverty data for Area Code 256 shows that 15,607 of the married-couple family households (5.5%) and 26,203 of the single-parent households (26.7%) are living below the poverty level. Within the married-couple family households, those with 5 or more children have the highest poverty rate, with 435 households (25.7%) falling below the poverty line. Among the single-parent households, those with 5 or more children have the highest poverty rate, with 466 household (58.1%) living below poverty.
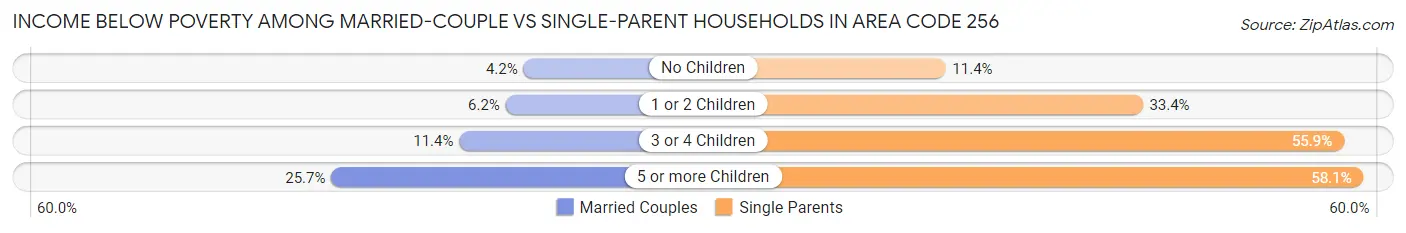
| Children | Married-Couple Families | Single-Parent Households |
| No Children | 7,528 (4.2%) | 4,516 (11.4%) |
| 1 or 2 Children | 5,312 (6.2%) | 16,349 (33.4%) |
| 3 or 4 Children | 2,332 (11.4%) | 4,872 (55.9%) |
| 5 or more Children | 435 (25.7%) | 466 (58.1%) |
| Total | 15,607 (5.5%) | 26,203 (26.7%) |
Race in Area Code 256
The most populous races in Area Code 256 are White / Caucasian (1,122,901 | 75.8%), Black / African American (227,425 | 15.4%), and Hispanic or Latino (90,983 | 6.1%).
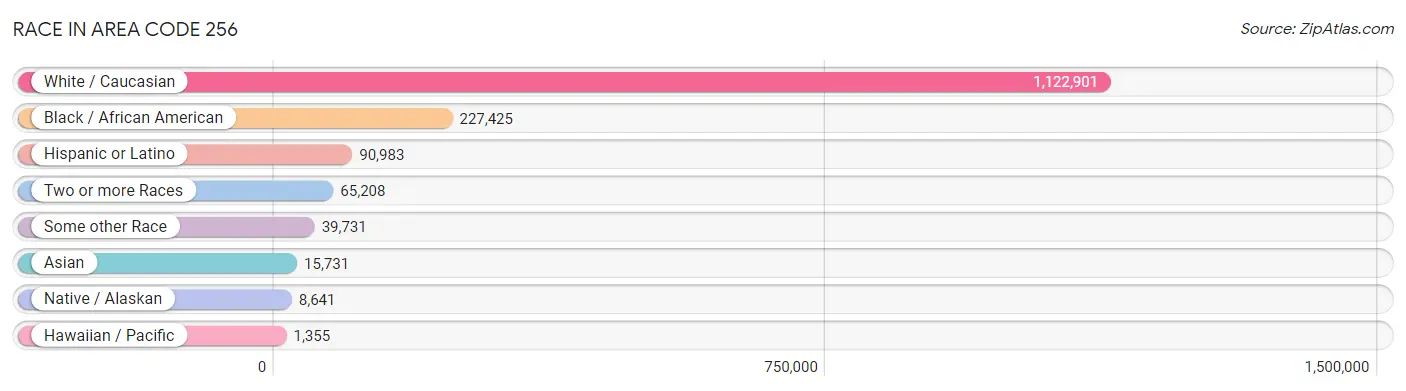
| Race | # Population | % Population |
| Asian | 15,731 | 1.1% |
| Black / African American | 227,425 | 15.4% |
| Hawaiian / Pacific | 1,355 | 0.1% |
| Hispanic or Latino | 90,983 | 6.1% |
| Native / Alaskan | 8,641 | 0.6% |
| White / Caucasian | 1,122,901 | 75.8% |
| Two or more Races | 65,208 | 4.4% |
| Some other Race | 39,731 | 2.7% |
| Total | 1,480,992 | 100.0% |
Ancestry in Area Code 256
The most populous ancestries reported in Area Code 256 are American (236,133 | 15.9%), English (167,232 | 11.3%), Irish (136,386 | 9.2%), German (108,225 | 7.3%), and Mexican (54,587 | 3.7%), together accounting for 47.4% of all Area Code 256 residents.
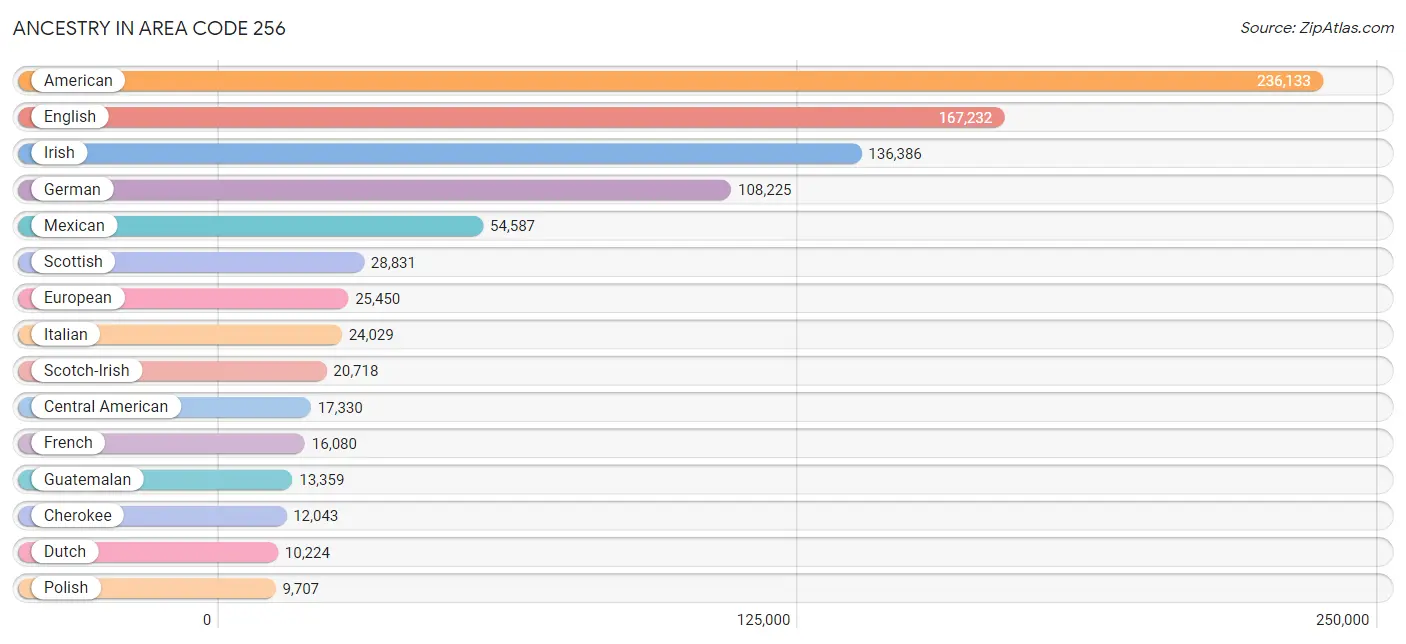
| Ancestry | # Population | % Population |
| Afghan | 10 | 0.0% |
| African | 5,350 | 0.4% |
| Alaska Native | 148 | 0.0% |
| Albanian | 58 | 0.0% |
| Aleut | 10 | 0.0% |
| American | 236,133 | 15.9% |
| Apache | 223 | 0.0% |
| Arab | 3,108 | 0.2% |
| Argentinean | 136 | 0.0% |
| Armenian | 107 | 0.0% |
| Australian | 209 | 0.0% |
| Austrian | 779 | 0.1% |
| Bahamian | 45 | 0.0% |
| Bangladeshi | 65 | 0.0% |
| Barbadian | 119 | 0.0% |
| Basque | 77 | 0.0% |
| Belgian | 210 | 0.0% |
| Belizean | 48 | 0.0% |
| Bermudan | 412 | 0.0% |
| Bhutanese | 2,428 | 0.2% |
| Blackfeet | 648 | 0.0% |
| Bolivian | 64 | 0.0% |
| Brazilian | 267 | 0.0% |
| British | 9,021 | 0.6% |
| British West Indian | 75 | 0.0% |
| Bulgarian | 114 | 0.0% |
| Burmese | 3,624 | 0.2% |
| Cajun | 235 | 0.0% |
| Cambodian | 22 | 0.0% |
| Canadian | 1,020 | 0.1% |
| Cape Verdean | 10 | 0.0% |
| Celtic | 237 | 0.0% |
| Central American | 17,330 | 1.2% |
| Central American Indian | 1,492 | 0.1% |
| Cherokee | 12,043 | 0.8% |
| Cheyenne | 30 | 0.0% |
| Chickasaw | 114 | 0.0% |
| Chilean | 146 | 0.0% |
| Chinese | 2 | 0.0% |
| Chippewa | 219 | 0.0% |
| Choctaw | 735 | 0.1% |
| Colombian | 1,306 | 0.1% |
| Comanche | 24 | 0.0% |
| Costa Rican | 119 | 0.0% |
| Cree | 54 | 0.0% |
| Creek | 1,225 | 0.1% |
| Croatian | 397 | 0.0% |
| Crow | 8 | 0.0% |
| Cuban | 2,121 | 0.1% |
| Czech | 1,140 | 0.1% |
| Czechoslovakian | 295 | 0.0% |
| Danish | 1,341 | 0.1% |
| Dominican | 1,202 | 0.1% |
| Dutch | 10,224 | 0.7% |
| Dutch West Indian | 49 | 0.0% |
| Eastern European | 1,537 | 0.1% |
| Ecuadorian | 143 | 0.0% |
| Egyptian | 129 | 0.0% |
| English | 167,232 | 11.3% |
| Estonian | 31 | 0.0% |
| Ethiopian | 153 | 0.0% |
| European | 25,450 | 1.7% |
| Fijian | 61 | 0.0% |
| Filipino | 251 | 0.0% |
| Finnish | 1,218 | 0.1% |
| French | 16,080 | 1.1% |
| French American Indian | 26 | 0.0% |
| French Canadian | 2,405 | 0.2% |
| German | 108,225 | 7.3% |
| German Russian | 55 | 0.0% |
| Ghanaian | 55 | 0.0% |
| Greek | 2,167 | 0.2% |
| Guamanian / Chamorro | 476 | 0.0% |
| Guatemalan | 13,359 | 0.9% |
| Guyanese | 32 | 0.0% |
| Haitian | 1,083 | 0.1% |
| Honduran | 1,722 | 0.1% |
| Hopi | 3 | 0.0% |
| Houma | 13 | 0.0% |
| Hungarian | 1,524 | 0.1% |
| Icelander | 47 | 0.0% |
| Indian (Asian) | 3,728 | 0.3% |
| Indonesian | 88 | 0.0% |
| Iranian | 790 | 0.1% |
| Iraqi | 18 | 0.0% |
| Irish | 136,386 | 9.2% |
| Iroquois | 170 | 0.0% |
| Israeli | 66 | 0.0% |
| Italian | 24,029 | 1.6% |
| Jamaican | 2,731 | 0.2% |
| Japanese | 249 | 0.0% |
| Jordanian | 40 | 0.0% |
| Kenyan | 257 | 0.0% |
| Korean | 4,394 | 0.3% |
| Laotian | 355 | 0.0% |
| Latvian | 320 | 0.0% |
| Lebanese | 994 | 0.1% |
| Liberian | 16 | 0.0% |
| Lithuanian | 645 | 0.0% |
| Lumbee | 29 | 0.0% |
| Luxembourger | 48 | 0.0% |
| Macedonian | 55 | 0.0% |
| Malaysian | 268 | 0.0% |
| Mexican | 54,587 | 3.7% |
| Mexican American Indian | 1,455 | 0.1% |
| Moroccan | 160 | 0.0% |
| Native Hawaiian | 1,506 | 0.1% |
| Navajo | 36 | 0.0% |
| New Zealander | 85 | 0.0% |
| Nicaraguan | 116 | 0.0% |
| Nigerian | 1,283 | 0.1% |
| Northern European | 1,465 | 0.1% |
| Norwegian | 5,232 | 0.4% |
| Osage | 81 | 0.0% |
| Ottawa | 39 | 0.0% |
| Pakistani | 917 | 0.1% |
| Palestinian | 54 | 0.0% |
| Panamanian | 567 | 0.0% |
| Paraguayan | 10 | 0.0% |
| Pennsylvania German | 203 | 0.0% |
| Peruvian | 563 | 0.0% |
| Polish | 9,707 | 0.7% |
| Portuguese | 1,888 | 0.1% |
| Potawatomi | 123 | 0.0% |
| Pueblo | 68 | 0.0% |
| Puerto Rican | 7,568 | 0.5% |
| Puget Sound Salish | 6 | 0.0% |
| Romanian | 757 | 0.1% |
| Russian | 1,908 | 0.1% |
| Salvadoran | 1,392 | 0.1% |
| Samoan | 320 | 0.0% |
| Scandinavian | 3,280 | 0.2% |
| Scotch-Irish | 20,718 | 1.4% |
| Scottish | 28,831 | 1.9% |
| Seminole | 103 | 0.0% |
| Serbian | 100 | 0.0% |
| Shoshone | 1 | 0.0% |
| Sierra Leonean | 97 | 0.0% |
| Sioux | 205 | 0.0% |
| Slavic | 161 | 0.0% |
| Slovak | 553 | 0.0% |
| Slovene | 146 | 0.0% |
| South African | 98 | 0.0% |
| South American | 2,945 | 0.2% |
| South American Indian | 86 | 0.0% |
| Spaniard | 899 | 0.1% |
| Spanish | 602 | 0.0% |
| Spanish American | 28 | 0.0% |
| Spanish American Indian | 10 | 0.0% |
| Sri Lankan | 1,953 | 0.1% |
| Subsaharan African | 7,610 | 0.5% |
| Sudanese | 28 | 0.0% |
| Swedish | 4,319 | 0.3% |
| Swiss | 1,264 | 0.1% |
| Syrian | 261 | 0.0% |
| Thai | 4,266 | 0.3% |
| Tlingit-Haida | 25 | 0.0% |
| Tohono O'Odham | 2 | 0.0% |
| Tongan | 2 | 0.0% |
| Trinidadian and Tobagonian | 228 | 0.0% |
| Turkish | 234 | 0.0% |
| U.S. Virgin Islander | 180 | 0.0% |
| Ugandan | 30 | 0.0% |
| Ukrainian | 962 | 0.1% |
| Uruguayan | 28 | 0.0% |
| Ute | 24 | 0.0% |
| Venezuelan | 532 | 0.0% |
| Vietnamese | 34 | 0.0% |
| Welsh | 7,487 | 0.5% |
| West Indian | 827 | 0.1% |
| Yugoslavian | 267 | 0.0% |
| Yup'ik | 21 | 0.0% | View All 172 Rows |
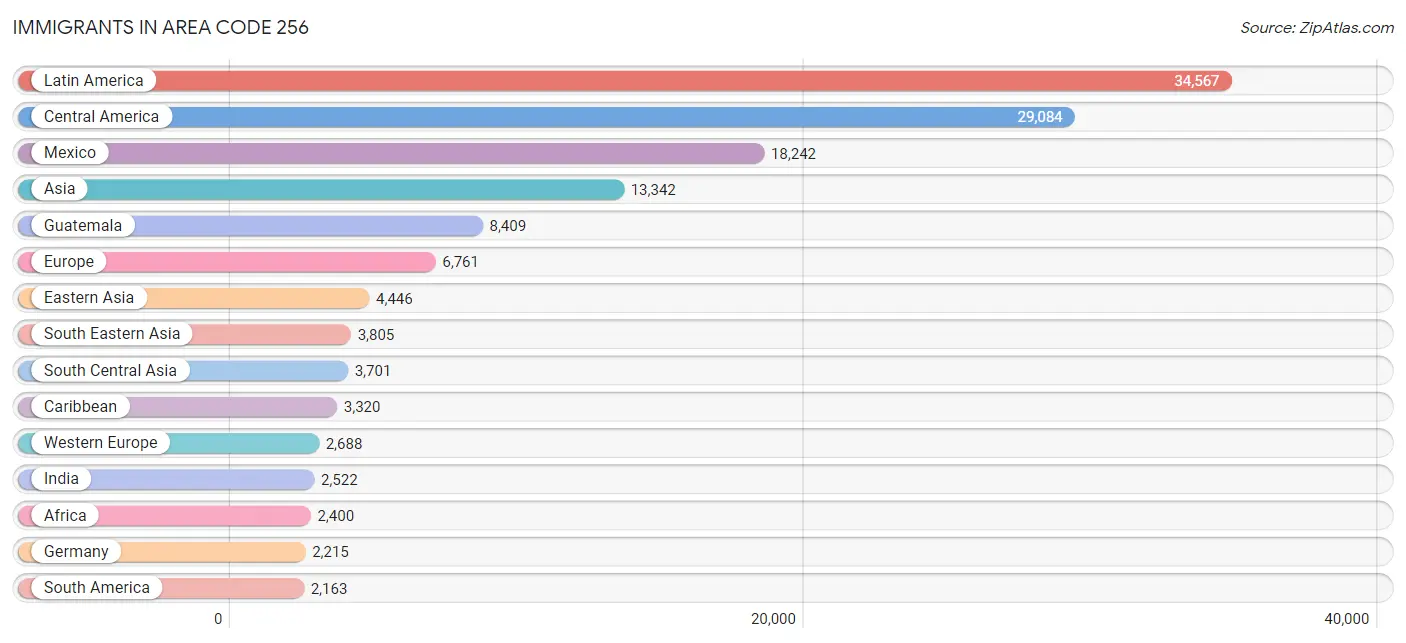
Immigrants in Area Code 256
The most numerous immigrant groups reported in Area Code 256 came from Latin America (34,567 | 2.3%), Central America (29,084 | 2.0%), Mexico (18,242 | 1.2%), Asia (13,342 | 0.9%), and Guatemala (8,409 | 0.6%), together accounting for 7.0% of all Area Code 256 residents.
| Immigration Origin | # Population | % Population |
| Africa | 2,400 | 0.2% |
| Argentina | 40 | 0.0% |
| Asia | 13,342 | 0.9% |
| Australia | 69 | 0.0% |
| Austria | 28 | 0.0% |
| Azores | 7 | 0.0% |
| Bahamas | 15 | 0.0% |
| Bangladesh | 220 | 0.0% |
| Belarus | 11 | 0.0% |
| Belgium | 71 | 0.0% |
| Belize | 28 | 0.0% |
| Bolivia | 3 | 0.0% |
| Bosnia and Herzegovina | 8 | 0.0% |
| Brazil | 279 | 0.0% |
| Bulgaria | 53 | 0.0% |
| Cambodia | 131 | 0.0% |
| Cameroon | 98 | 0.0% |
| Canada | 1,301 | 0.1% |
| Caribbean | 3,320 | 0.2% |
| Central America | 29,084 | 2.0% |
| Chile | 119 | 0.0% |
| China | 1,958 | 0.1% |
| Colombia | 877 | 0.1% |
| Congo | 52 | 0.0% |
| Costa Rica | 201 | 0.0% |
| Croatia | 58 | 0.0% |
| Cuba | 793 | 0.1% |
| Czechoslovakia | 34 | 0.0% |
| Denmark | 13 | 0.0% |
| Dominican Republic | 627 | 0.0% |
| Eastern Africa | 543 | 0.0% |
| Eastern Asia | 4,446 | 0.3% |
| Eastern Europe | 1,645 | 0.1% |
| Ecuador | 103 | 0.0% |
| Egypt | 99 | 0.0% |
| El Salvador | 632 | 0.0% |
| England | 499 | 0.0% |
| Ethiopia | 88 | 0.0% |
| Europe | 6,761 | 0.5% |
| France | 257 | 0.0% |
| Germany | 2,215 | 0.2% |
| Ghana | 39 | 0.0% |
| Greece | 82 | 0.0% |
| Grenada | 30 | 0.0% |
| Guatemala | 8,409 | 0.6% |
| Guyana | 112 | 0.0% |
| Haiti | 525 | 0.0% |
| Honduras | 1,195 | 0.1% |
| Hong Kong | 97 | 0.0% |
| Hungary | 32 | 0.0% |
| India | 2,522 | 0.2% |
| Indonesia | 126 | 0.0% |
| Iran | 288 | 0.0% |
| Iraq | 32 | 0.0% |
| Ireland | 61 | 0.0% |
| Israel | 13 | 0.0% |
| Italy | 110 | 0.0% |
| Jamaica | 875 | 0.1% |
| Japan | 993 | 0.1% |
| Jordan | 80 | 0.0% |
| Kazakhstan | 59 | 0.0% |
| Kenya | 272 | 0.0% |
| Korea | 1,495 | 0.1% |
| Kuwait | 2 | 0.0% |
| Laos | 111 | 0.0% |
| Latin America | 34,567 | 2.3% |
| Lebanon | 42 | 0.0% |
| Liberia | 16 | 0.0% |
| Malaysia | 96 | 0.0% |
| Mexico | 18,242 | 1.2% |
| Micronesia | 58 | 0.0% |
| Middle Africa | 150 | 0.0% |
| Morocco | 142 | 0.0% |
| Nepal | 168 | 0.0% |
| Netherlands | 109 | 0.0% |
| Nicaragua | 125 | 0.0% |
| Nigeria | 767 | 0.1% |
| North Macedonia | 55 | 0.0% |
| Northern Africa | 322 | 0.0% |
| Northern Europe | 1,639 | 0.1% |
| Norway | 27 | 0.0% |
| Oceania | 205 | 0.0% |
| Pakistan | 384 | 0.0% |
| Panama | 224 | 0.0% |
| Peru | 114 | 0.0% |
| Philippines | 1,567 | 0.1% |
| Poland | 53 | 0.0% |
| Portugal | 474 | 0.0% |
| Romania | 425 | 0.0% |
| Russia | 490 | 0.0% |
| Saudi Arabia | 81 | 0.0% |
| Scotland | 162 | 0.0% |
| Senegal | 21 | 0.0% |
| Sierra Leone | 14 | 0.0% |
| Singapore | 31 | 0.0% |
| South Africa | 237 | 0.0% |
| South America | 2,163 | 0.2% |
| South Central Asia | 3,701 | 0.3% |
| South Eastern Asia | 3,805 | 0.3% |
| Southern Europe | 789 | 0.1% |
| Spain | 123 | 0.0% |
| Sri Lanka | 42 | 0.0% |
| Sudan | 81 | 0.0% |
| Sweden | 97 | 0.0% |
| Switzerland | 8 | 0.0% |
| Syria | 76 | 0.0% |
| Taiwan | 399 | 0.0% |
| Thailand | 371 | 0.0% |
| Trinidad and Tobago | 258 | 0.0% |
| Turkey | 47 | 0.0% |
| Uganda | 49 | 0.0% |
| Ukraine | 377 | 0.0% |
| Venezuela | 455 | 0.0% |
| Vietnam | 1,329 | 0.1% |
| West Indies | 8 | 0.0% |
| Western Africa | 978 | 0.1% |
| Western Asia | 1,352 | 0.1% |
| Western Europe | 2,688 | 0.2% |
| Yemen | 905 | 0.1% |
| Zimbabwe | 39 | 0.0% | View All 120 Rows |
Sex and Age in Area Code 256
Sex and Age in Area Code 256
The most populous age groups in Area Code 256 are 60 to 64 Years (50,544 | 7.0%) for men and 60 to 64 Years (52,984 | 7.0%) for women.
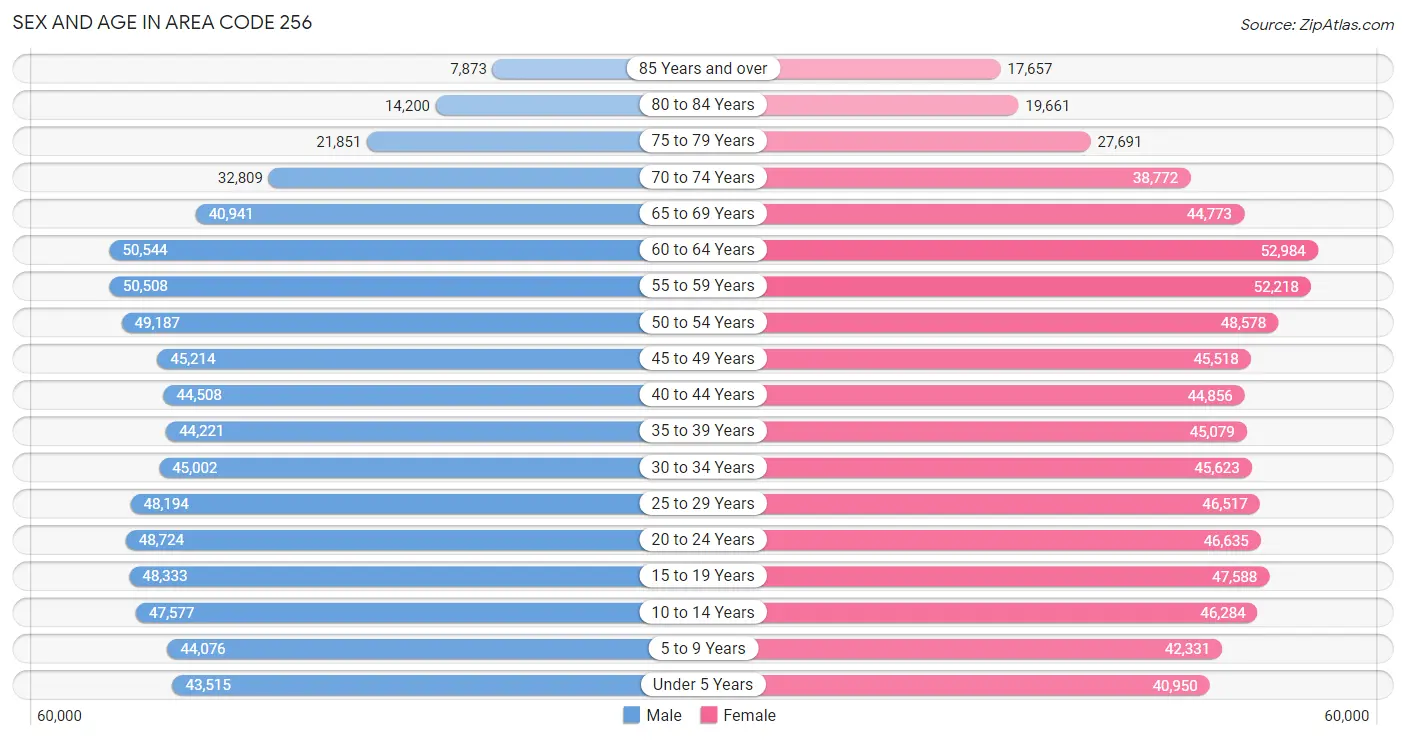
| Age Bracket | Male | Female |
| Under 5 Years | 43,515 (6.0%) | 40,950 (5.4%) |
| 5 to 9 Years | 44,076 (6.1%) | 42,331 (5.6%) |
| 10 to 14 Years | 47,577 (6.5%) | 46,284 (6.1%) |
| 15 to 19 Years | 48,333 (6.7%) | 47,588 (6.3%) |
| 20 to 24 Years | 48,724 (6.7%) | 46,635 (6.2%) |
| 25 to 29 Years | 48,194 (6.6%) | 46,517 (6.2%) |
| 30 to 34 Years | 45,002 (6.2%) | 45,623 (6.0%) |
| 35 to 39 Years | 44,221 (6.1%) | 45,079 (6.0%) |
| 40 to 44 Years | 44,508 (6.1%) | 44,856 (5.9%) |
| 45 to 49 Years | 45,214 (6.2%) | 45,518 (6.0%) |
| 50 to 54 Years | 49,187 (6.8%) | 48,578 (6.5%) |
| 55 to 59 Years | 50,508 (6.9%) | 52,218 (6.9%) |
| 60 to 64 Years | 50,544 (7.0%) | 52,984 (7.0%) |
| 65 to 69 Years | 40,941 (5.6%) | 44,773 (5.9%) |
| 70 to 74 Years | 32,809 (4.5%) | 38,772 (5.1%) |
| 75 to 79 Years | 21,851 (3.0%) | 27,691 (3.7%) |
| 80 to 84 Years | 14,200 (1.9%) | 19,661 (2.6%) |
| 85 Years and over | 7,873 (1.1%) | 17,657 (2.3%) |
| Total | 727,277 (100.0%) | 753,715 (100.0%) |
Families and Households in Area Code 256
Median Family Size in Area Code 256
The median family size in Area Code 256 is 3.19 persons per family, with single female/mother families (71,853 | 18.8%) accounting for the largest median family size of 3.34724 persons per family. On the other hand, single male/father families (26,354 | 6.9%) represent the smallest median family size with 3.11 persons per family.
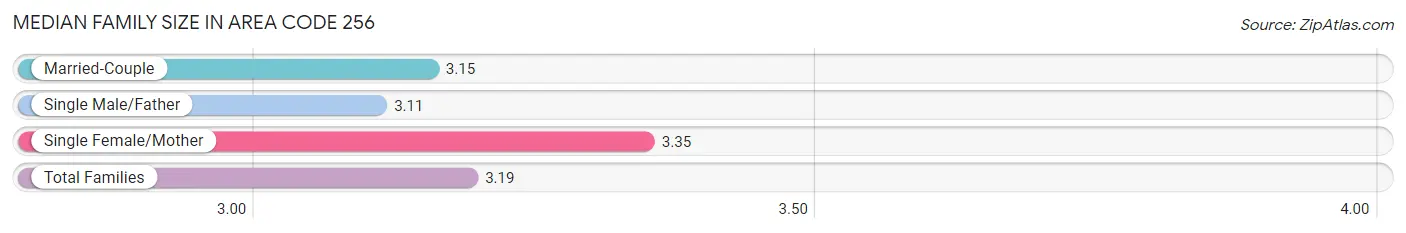
| Family Type | # Families | Family Size |
| Married-Couple | 284,834 (74.4%) | 3.15 |
| Single Male/Father | 26,354 (6.9%) | 3.11 |
| Single Female/Mother | 71,853 (18.8%) | 3.35 |
| Total Families | 383,041 (100.0%) | 3.19 |
Median Household Size in Area Code 256
The median household size in Area Code 256 is 2.63 persons per household, with single female/mother households (71,853 | 12.4%) accounting for the largest median household size of 3.60929 persons per household. non-family households (197,910 | 34.1%) represent the smallest median household size with 1.18 persons per household.
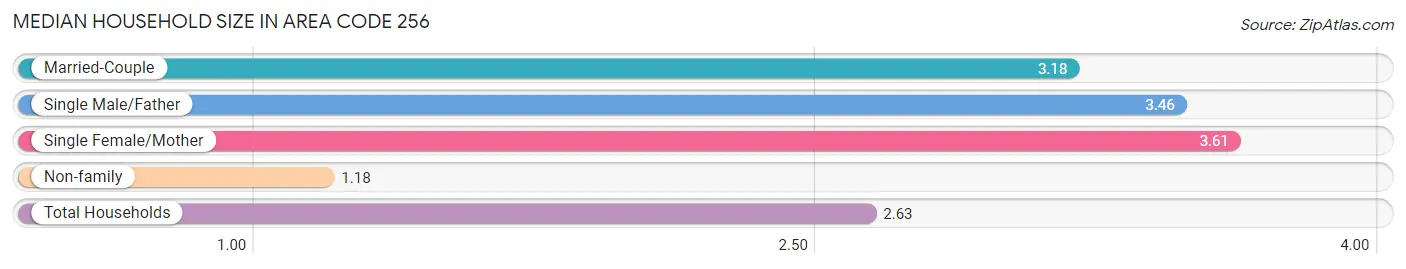
| Household Type | # Households | Household Size |
| Married-Couple | 284,834 (49.0%) | 3.18 |
| Single Male/Father | 26,354 (4.5%) | 3.46 |
| Single Female/Mother | 71,853 (12.4%) | 3.61 |
| Non-family | 197,910 (34.1%) | 1.18 |
| Total Households | 580,951 (100.0%) | 2.63 |
Household Size by Marriage Status in Area Code 256
Out of a total of 580,951 households in Area Code 256, 383,041 (65.9%) are family households, while 197,910 (34.1%) are nonfamily households. The most numerous type of family households are 2-person households, comprising 186,826, and the most common type of nonfamily households are 1-person households, comprising 170,171.
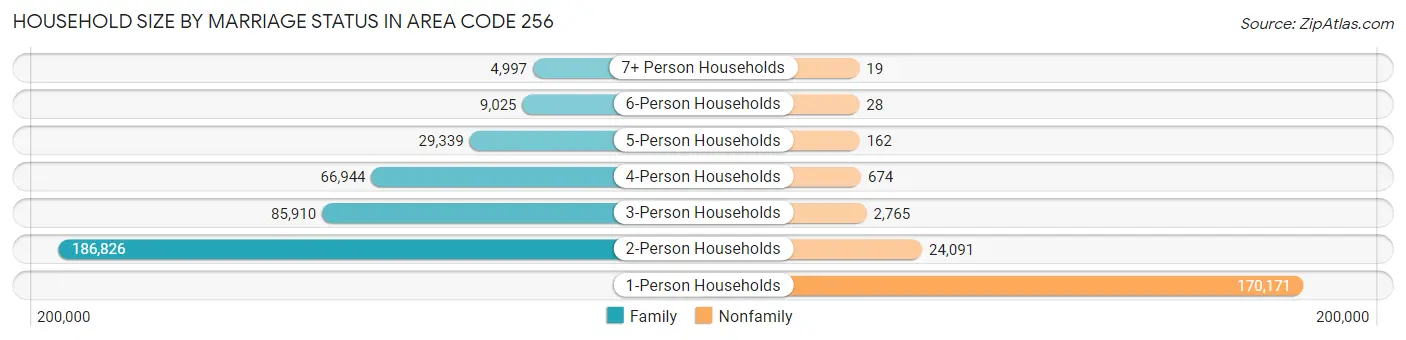
| Household Size | Family Households | Nonfamily Households |
| 1-Person Households | - | 170,171 (29.3%) |
| 2-Person Households | 186,826 (32.2%) | 24,091 (4.2%) |
| 3-Person Households | 85,910 (14.8%) | 2,765 (0.5%) |
| 4-Person Households | 66,944 (11.5%) | 674 (0.1%) |
| 5-Person Households | 29,339 (5.1%) | 162 (0.0%) |
| 6-Person Households | 9,025 (1.5%) | 28 (0.0%) |
| 7+ Person Households | 4,997 (0.9%) | 19 (0.0%) |
| Total | 383,041 (65.9%) | 197,910 (34.1%) |
Female Fertility in Area Code 256
Fertility by Age in Area Code 256
Average fertility rate in Area Code 256 is 66.1 births per 1,000 women. Women in the age bracket of 20 to 34 years have the highest fertility rate with 127.7 births per 1,000 women. Women in the age bracket of 20 to 34 years acount for 78.1% of all women with births.
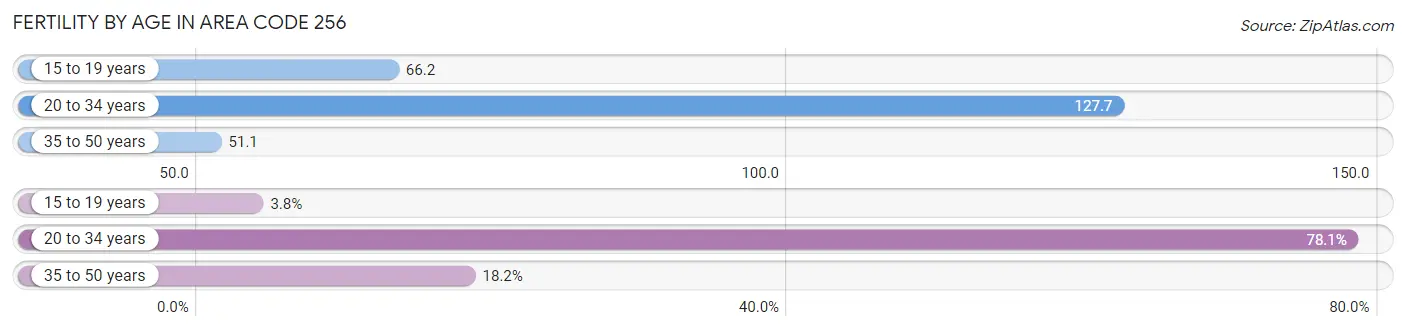
| Age Bracket | Women with Births | Births / 1,000 Women |
| 15 to 19 years | 670 (3.8%) | 66.2 |
| 20 to 34 years | 13,923 (78.1%) | 127.7 |
| 35 to 50 years | 3,239 (18.2%) | 51.1 |
| Total | 17,832 (100.0%) | 66.1 |
Fertility by Age by Marriage Status in Area Code 256
53.3% of women with births (17,832) in Area Code 256 are married. The highest percentage of unmarried women with births falls into 15 to 19 years age bracket with 90.7% of them unmarried at the time of birth, while the lowest percentage of unmarried women with births belong to 20 to 34 years age bracket with 49.7% of them unmarried.
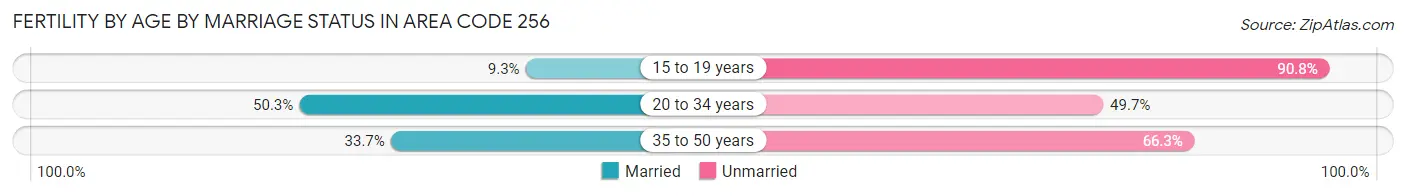
| Age Bracket | Married | Unmarried |
| 15 to 19 years | 62 (9.2%) | 608 (90.7%) |
| 20 to 34 years | 6,998 (50.3%) | 6,925 (49.7%) |
| 35 to 50 years | 1,091 (33.7%) | 2,148 (66.3%) |
| Total | 9,501 (53.3%) | 8,331 (46.7%) |
Fertility by Education in Area Code 256
Average fertility rate in Area Code 256 is 66.1 births per 1,000 women. Women with the education attainment of graduate degree have the highest fertility rate of 149.2 births per 1,000 women, while women with the education attainment of college or associate's degree have the lowest fertility at 88.5 births per 1,000 women. Women with the education attainment of college or associate's degree represent 32.9% of all women with births.
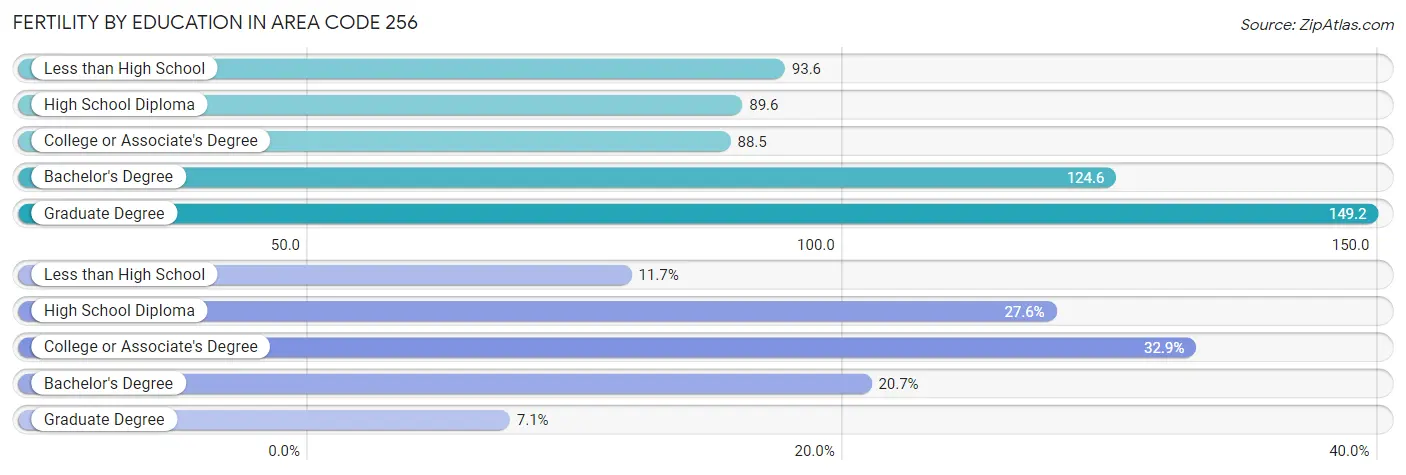
| Educational Attainment | Women with Births | Births / 1,000 Women |
| Less than High School | 2,086 (11.7%) | 93.6 |
| High School Diploma | 4,926 (27.6%) | 89.6 |
| College or Associate's Degree | 5,857 (32.9%) | 88.5 |
| Bachelor's Degree | 3,690 (20.7%) | 124.6 |
| Graduate Degree | 1,273 (7.1%) | 149.2 |
| Total | 17,832 (100.0%) | 66.1 |
Fertility by Education by Marriage Status in Area Code 256
46.7% of women with births in Area Code 256 are unmarried. Women with the educational attainment of bachelor's degree are most likely to be married with 47.2% of them married at childbirth, while women with the educational attainment of less than high school are least likely to be married with 88.1% of them unmarried at childbirth.
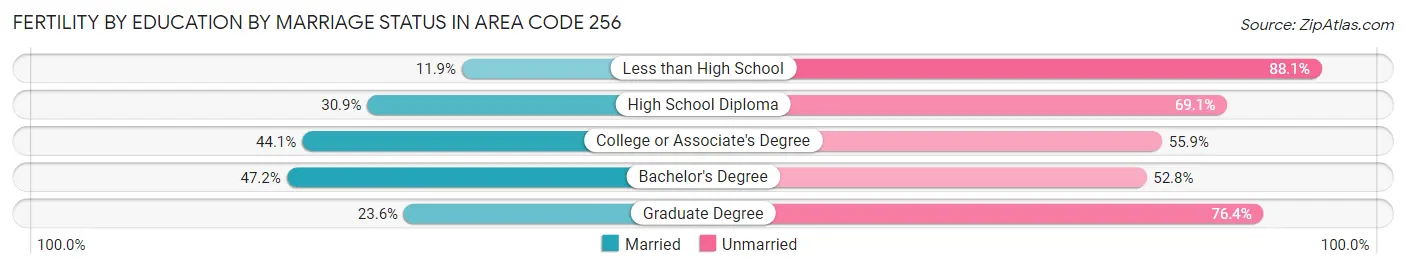
| Educational Attainment | Married | Unmarried |
| Less than High School | 248 (11.9%) | 1,838 (88.1%) |
| High School Diploma | 1,524 (30.9%) | 3,402 (69.1%) |
| College or Associate's Degree | 2,582 (44.1%) | 3,275 (55.9%) |
| Bachelor's Degree | 1,742 (47.2%) | 1,948 (52.8%) |
| Graduate Degree | 300 (23.6%) | 973 (76.4%) |
| Total | 9,501 (53.3%) | 8,331 (46.7%) |
Employment Characteristics in Area Code 256
Employment by Class of Employer in Area Code 256
Among the 650,916 employed individuals in Area Code 256, private company employees (451,310 | 69.3%), local government employees (41,746 | 6.4%), and not-for-profit organizations (38,543 | 5.9%) make up the most common classes of employment.
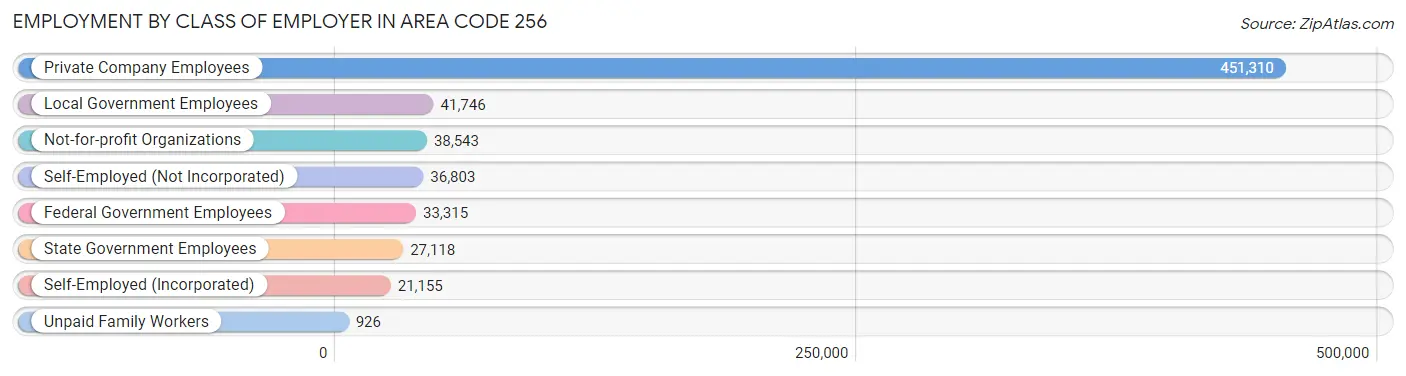
| Employer Class | # Employees | % Employees |
| Private Company Employees | 451,310 | 69.3% |
| Self-Employed (Incorporated) | 21,155 | 3.3% |
| Self-Employed (Not Incorporated) | 36,803 | 5.7% |
| Not-for-profit Organizations | 38,543 | 5.9% |
| Local Government Employees | 41,746 | 6.4% |
| State Government Employees | 27,118 | 4.2% |
| Federal Government Employees | 33,315 | 5.1% |
| Unpaid Family Workers | 926 | 0.1% |
| Total | 650,916 | 100.0% |
Employment Status by Age in Area Code 256
According to the labor force statistics for Area Code 256, out of the total population over 16 years of age (1,197,025), 55.2% or 660,758 individuals are in the labor force, with 5.2% or 34,690 of them unemployed. The age group with the highest labor force participation rate is 30 to 34 years, with 79.8% or 72,301 individuals in the labor force. Within the labor force, the 16 to 19 years age range has the highest percentage of unemployed individuals, with 1,915.6% or 584,086 of them being unemployed.
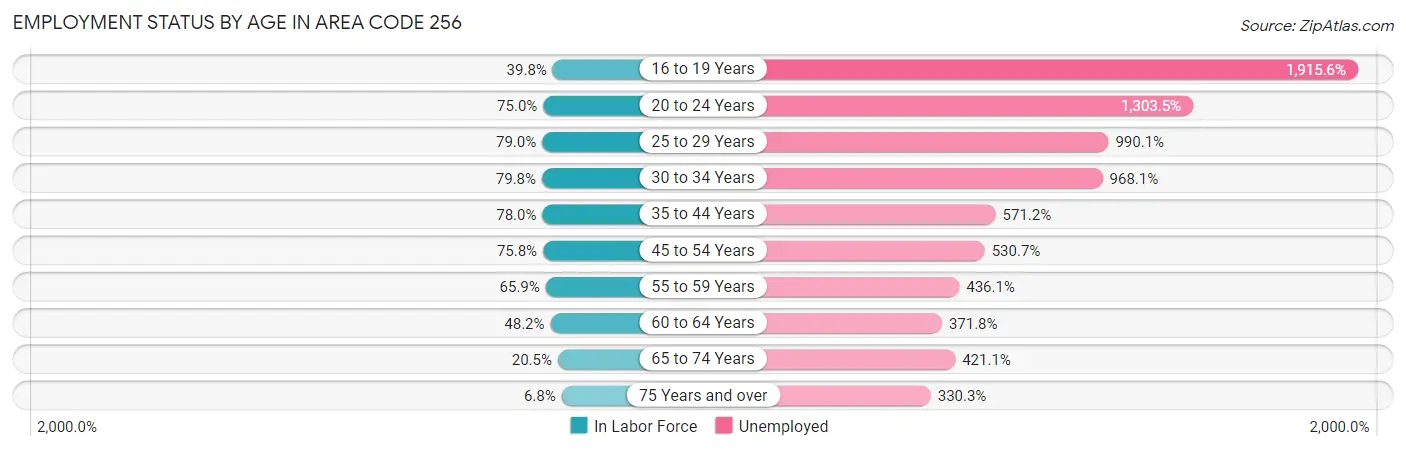
| Age Bracket | In Labor Force | Unemployed |
| 16 to 19 Years | 30,493 (39.8%) | 584,086 (1,915.6%) |
| 20 to 24 Years | 71,555 (75.0%) | 932,745 (1,303.5%) |
| 25 to 29 Years | 74,817 (79.0%) | 740,813 (990.1%) |
| 30 to 34 Years | 72,304 (79.8%) | 699,946 (968.1%) |
| 35 to 44 Years | 139,401 (78.0%) | 796,219 (571.2%) |
| 45 to 54 Years | 142,795 (75.7%) | 757,765 (530.7%) |
| 55 to 59 Years | 67,689 (65.9%) | 295,179 (436.1%) |
| 60 to 64 Years | 49,878 (48.2%) | 185,454 (371.8%) |
| 65 to 74 Years | 32,296 (20.5%) | 135,986 (421.1%) |
| 75 Years and over | 7,383 (6.8%) | 24,396 (330.3%) |
| Total | 660,787 (55.2%) | 34,685 (5.2%) |
Employment Status by Educational Attainment in Area Code 256
According to labor force statistics for Area Code 256, 70.8% of individuals (537,499) out of the total population between 25 and 64 years of age (758,751) are in the labor force, with 658.8% or 3,541,043 of them being unemployed. The group with the highest labor force participation rate are those with the educational attainment of bachelor's degree or higher, with 83.2% or 171,209 individuals in the labor force. Within the labor force, individuals with less than high school education have the highest percentage of unemployment, with 1,262.9% or 658,678 of them being unemployed.
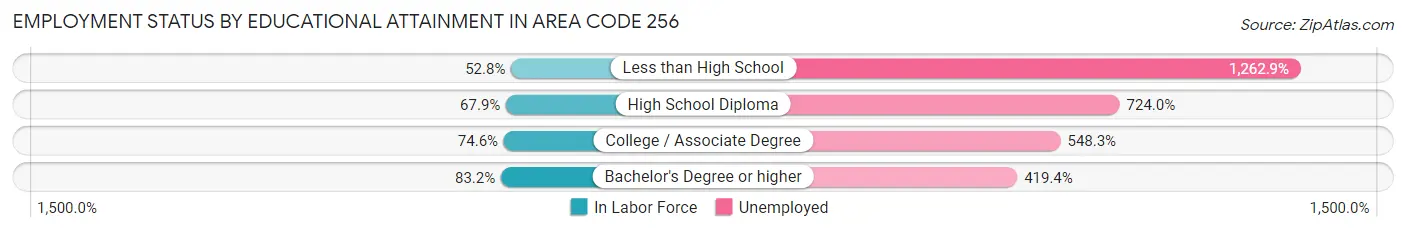
| Educational Attainment | In Labor Force | Unemployed |
| Less than High School | 52,157 (52.8%) | 1,247,733 (1,262.9%) |
| High School Diploma | 147,063 (67.9%) | 1,568,061 (724.0%) |
| College / Associate Degree | 177,156 (74.6%) | 1,302,021 (548.3%) |
| Bachelor's Degree or higher | 171,201 (83.2%) | 863,561 (419.4%) |
| Total | 537,497 (70.8%) | 4,998,652 (658.8%) |
Employment Occupations by Sex in Area Code 256
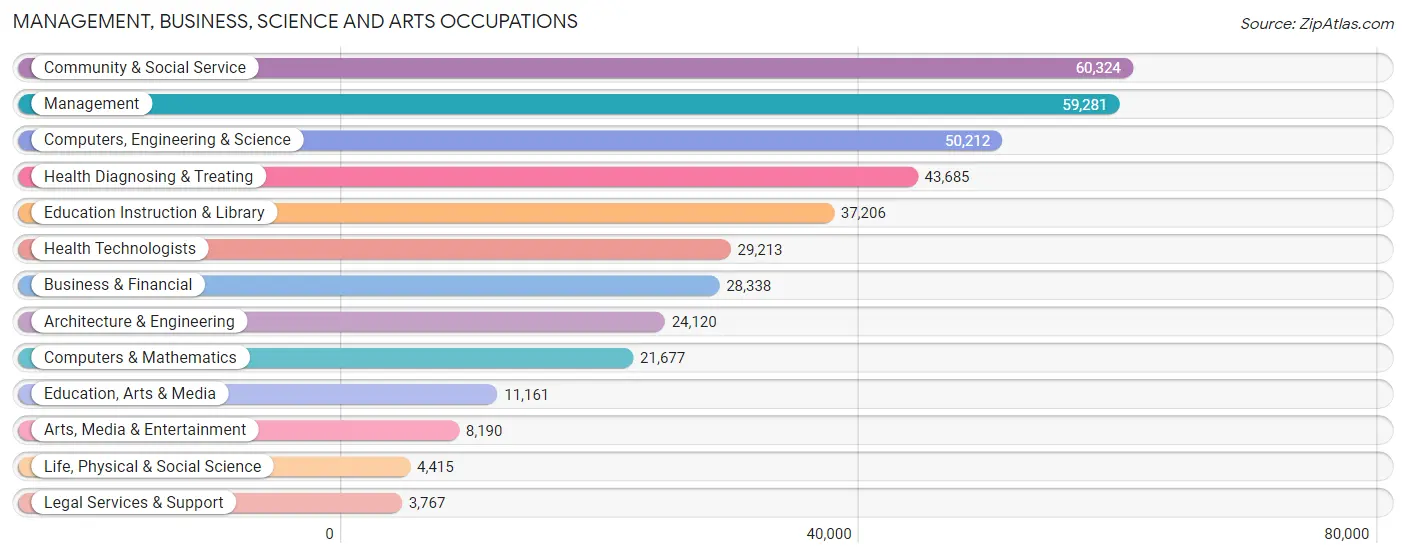
Management, Business, Science and Arts Occupations
The most common Management, Business, Science and Arts occupations in Area Code 256 are Community & Social Service (60,324 | 9.1%), Management (59,281 | 9.0%), Computers, Engineering & Science (50,212 | 7.6%), Health Diagnosing & Treating (43,685 | 6.6%), and Education Instruction & Library (37,206 | 5.6%).
Management, Business, Science and Arts Occupations by Sex
Within the Management, Business, Science and Arts occupations in Area Code 256, the most male-oriented occupations are Architecture & Engineering (82.8%), Computers, Engineering & Science (77.9%), and Computers & Mathematics (74.9%), while the most female-oriented occupations are Health Technologists (77.2%), Health Diagnosing & Treating (76.8%), and Education Instruction & Library (74.9%).
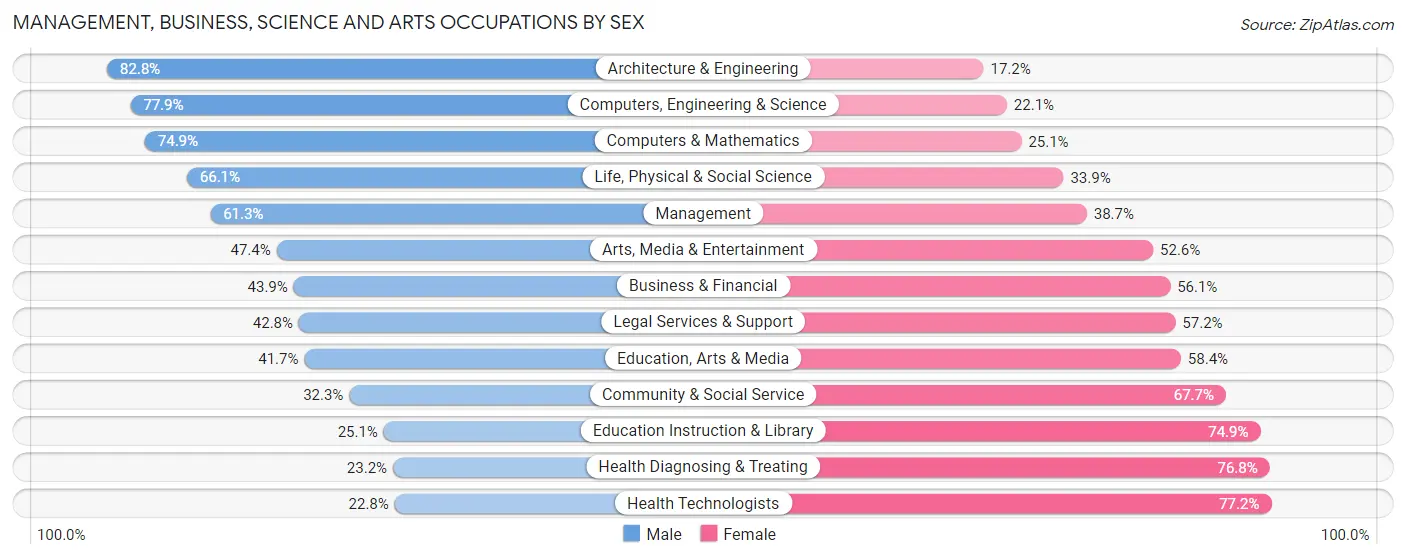
| Occupation | Male | Female |
| Management | 36,327 (61.3%) | 22,954 (38.7%) |
| Business & Financial | 12,436 (43.9%) | 15,902 (56.1%) |
| Computers, Engineering & Science | 39,133 (77.9%) | 11,079 (22.1%) |
| Computers & Mathematics | 16,238 (74.9%) | 5,439 (25.1%) |
| Architecture & Engineering | 19,975 (82.8%) | 4,145 (17.2%) |
| Life, Physical & Social Science | 2,920 (66.1%) | 1,495 (33.9%) |
| Community & Social Service | 19,480 (32.3%) | 40,844 (67.7%) |
| Education, Arts & Media | 4,648 (41.6%) | 6,513 (58.4%) |
| Legal Services & Support | 1,612 (42.8%) | 2,155 (57.2%) |
| Education Instruction & Library | 9,335 (25.1%) | 27,871 (74.9%) |
| Arts, Media & Entertainment | 3,885 (47.4%) | 4,305 (52.6%) |
| Health Diagnosing & Treating | 10,120 (23.2%) | 33,565 (76.8%) |
| Health Technologists | 6,664 (22.8%) | 22,549 (77.2%) |
| Total (Category) | 117,496 (48.6%) | 124,344 (51.4%) |
| Total (Overall) | 358,839 (54.4%) | 301,215 (45.6%) |
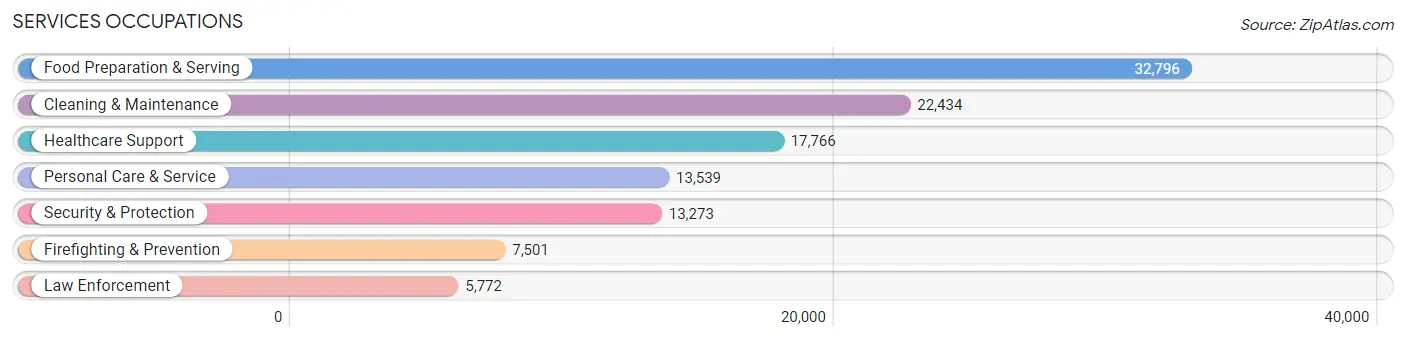
Services Occupations
The most common Services occupations in Area Code 256 are Food Preparation & Serving (32,796 | 5.0%), Cleaning & Maintenance (22,434 | 3.4%), Healthcare Support (17,766 | 2.7%), Personal Care & Service (13,539 | 2.1%), and Security & Protection (13,273 | 2.0%).
Services Occupations by Sex
Within the Services occupations in Area Code 256, the most male-oriented occupations are Law Enforcement (81.8%), Security & Protection (79.4%), and Firefighting & Prevention (77.6%), while the most female-oriented occupations are Healthcare Support (88.0%), Personal Care & Service (74.9%), and Food Preparation & Serving (58.8%).
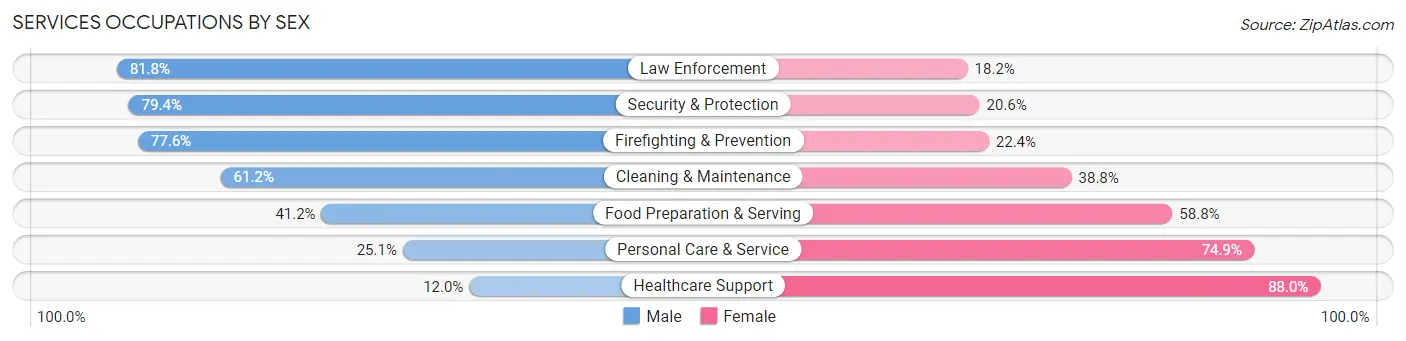
| Occupation | Male | Female |
| Healthcare Support | 2,124 (12.0%) | 15,642 (88.0%) |
| Security & Protection | 10,537 (79.4%) | 2,736 (20.6%) |
| Firefighting & Prevention | 5,818 (77.6%) | 1,683 (22.4%) |
| Law Enforcement | 4,719 (81.8%) | 1,053 (18.2%) |
| Food Preparation & Serving | 13,517 (41.2%) | 19,279 (58.8%) |
| Cleaning & Maintenance | 13,724 (61.2%) | 8,710 (38.8%) |
| Personal Care & Service | 3,401 (25.1%) | 10,138 (74.9%) |
| Total (Category) | 43,303 (43.4%) | 56,505 (56.6%) |
| Total (Overall) | 358,839 (54.4%) | 301,215 (45.6%) |
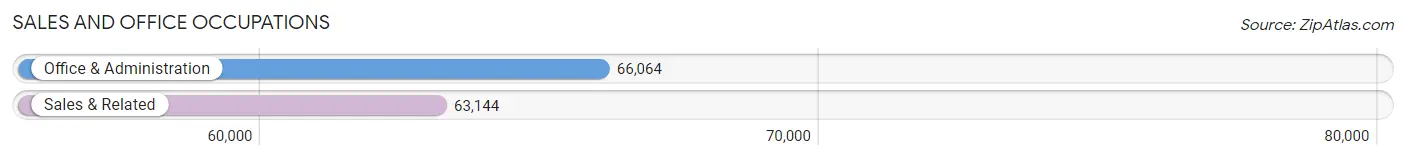
Sales and Office Occupations
The most common Sales and Office occupations in Area Code 256 are Office & Administration (66,064 | 10.0%), and Sales & Related (63,144 | 9.6%).
Sales and Office Occupations by Sex
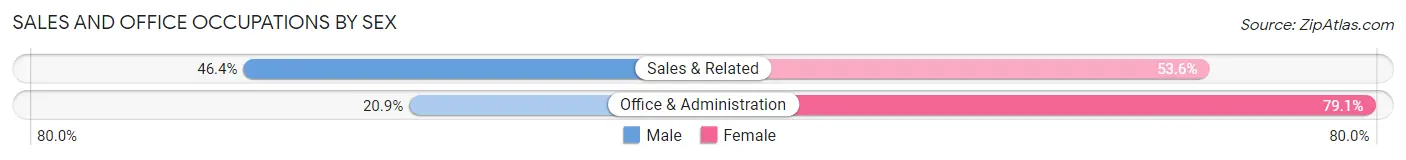
| Occupation | Male | Female |
| Sales & Related | 29,272 (46.4%) | 33,872 (53.6%) |
| Office & Administration | 13,779 (20.9%) | 52,285 (79.1%) |
| Total (Category) | 43,051 (33.3%) | 86,157 (66.7%) |
| Total (Overall) | 358,839 (54.4%) | 301,215 (45.6%) |
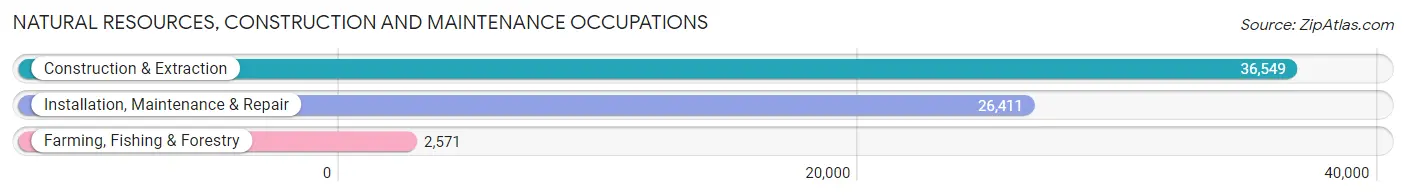
Natural Resources, Construction and Maintenance Occupations
The most common Natural Resources, Construction and Maintenance occupations in Area Code 256 are Construction & Extraction (36,549 | 5.5%), Installation, Maintenance & Repair (26,411 | 4.0%), and Farming, Fishing & Forestry (2,571 | 0.4%).
Natural Resources, Construction and Maintenance Occupations by Sex
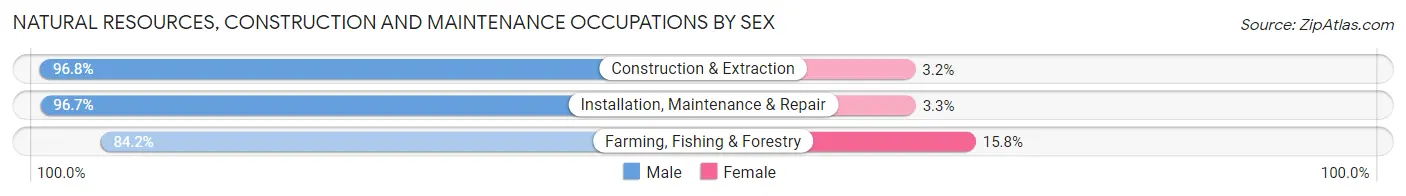
| Occupation | Male | Female |
| Farming, Fishing & Forestry | 2,165 (84.2%) | 406 (15.8%) |
| Construction & Extraction | 35,373 (96.8%) | 1,176 (3.2%) |
| Installation, Maintenance & Repair | 25,546 (96.7%) | 865 (3.3%) |
| Total (Category) | 63,084 (96.3%) | 2,447 (3.7%) |
| Total (Overall) | 358,839 (54.4%) | 301,215 (45.6%) |
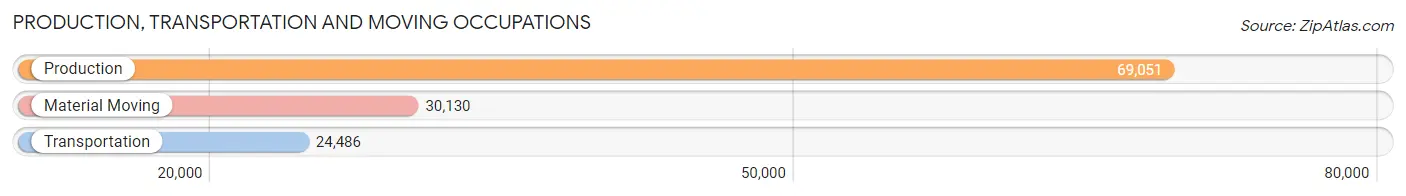
Production, Transportation and Moving Occupations
The most common Production, Transportation and Moving occupations in Area Code 256 are Production (69,051 | 10.5%), Material Moving (30,130 | 4.6%), and Transportation (24,486 | 3.7%).
Production, Transportation and Moving Occupations by Sex
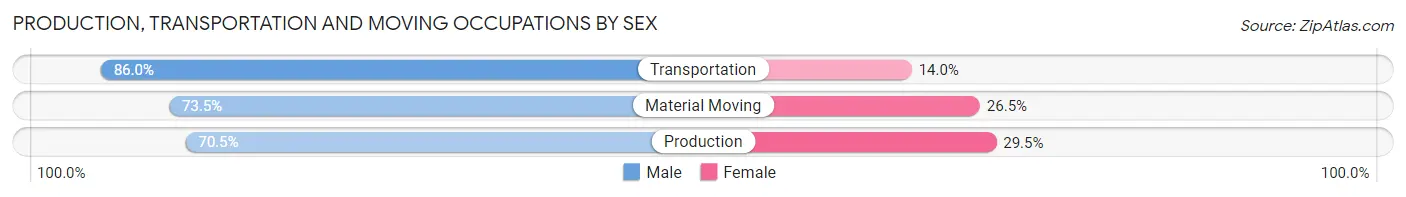
| Occupation | Male | Female |
| Production | 48,690 (70.5%) | 20,361 (29.5%) |
| Transportation | 21,066 (86.0%) | 3,420 (14.0%) |
| Material Moving | 22,149 (73.5%) | 7,981 (26.5%) |
| Total (Category) | 91,905 (74.3%) | 31,762 (25.7%) |
| Total (Overall) | 358,839 (54.4%) | 301,215 (45.6%) |
Employment Industries by Sex in Area Code 256
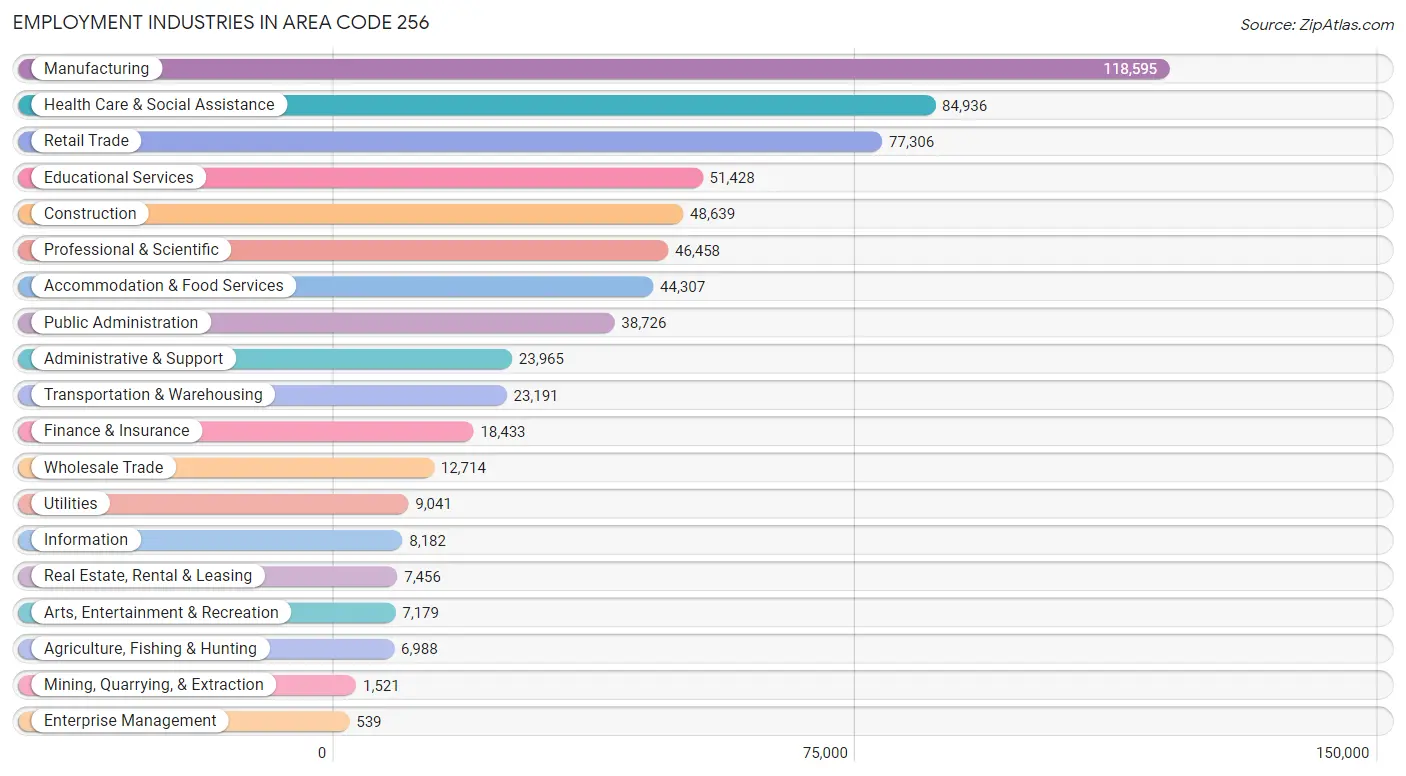
Employment Industries in Area Code 256
The major employment industries in Area Code 256 include Manufacturing (118,595 | 18.0%), Health Care & Social Assistance (84,936 | 12.9%), Retail Trade (77,306 | 11.7%), Educational Services (51,428 | 7.8%), and Construction (48,639 | 7.4%).
Employment Industries by Sex in Area Code 256
The Area Code 256 industries that see more men than women are Construction (89.7%), Mining, Quarrying, & Extraction (89.5%), and Agriculture, Fishing & Hunting (83.6%), whereas the industries that tend to have a higher number of women are Health Care & Social Assistance (80.0%), Educational Services (69.8%), and Finance & Insurance (68.5%).
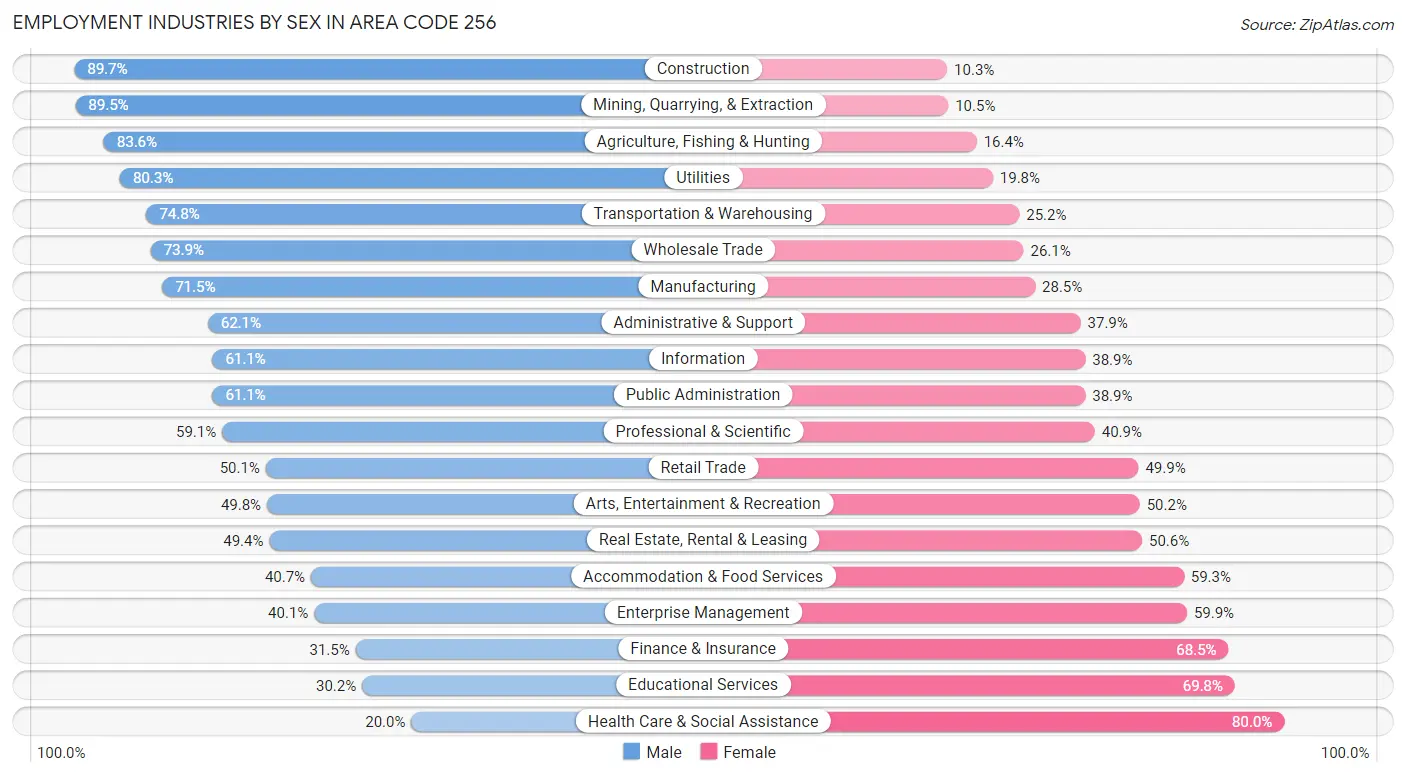
| Industry | Male | Female |
| Agriculture, Fishing & Hunting | 5,841 (83.6%) | 1,147 (16.4%) |
| Mining, Quarrying, & Extraction | 1,361 (89.5%) | 160 (10.5%) |
| Construction | 43,634 (89.7%) | 5,005 (10.3%) |
| Manufacturing | 84,796 (71.5%) | 33,799 (28.5%) |
| Wholesale Trade | 9,395 (73.9%) | 3,319 (26.1%) |
| Retail Trade | 38,733 (50.1%) | 38,573 (49.9%) |
| Transportation & Warehousing | 17,343 (74.8%) | 5,848 (25.2%) |
| Utilities | 7,255 (80.2%) | 1,786 (19.8%) |
| Information | 5,000 (61.1%) | 3,182 (38.9%) |
| Finance & Insurance | 5,807 (31.5%) | 12,626 (68.5%) |
| Real Estate, Rental & Leasing | 3,680 (49.4%) | 3,776 (50.6%) |
| Professional & Scientific | 27,474 (59.1%) | 18,984 (40.9%) |
| Enterprise Management | 216 (40.1%) | 323 (59.9%) |
| Administrative & Support | 14,877 (62.1%) | 9,088 (37.9%) |
| Educational Services | 15,510 (30.2%) | 35,918 (69.8%) |
| Health Care & Social Assistance | 16,953 (20.0%) | 67,983 (80.0%) |
| Arts, Entertainment & Recreation | 3,578 (49.8%) | 3,601 (50.2%) |
| Accommodation & Food Services | 18,047 (40.7%) | 26,260 (59.3%) |
| Public Administration | 23,667 (61.1%) | 15,059 (38.9%) |
| Total | 358,839 (54.4%) | 301,215 (45.6%) |
Education in Area Code 256
School Enrollment in Area Code 256
The most common levels of schooling among the 338,538 students in Area Code 256 are high school (74,328 | 22.0%), middle school (72,947 | 21.5%), and college / undergraduate (70,878 | 20.9%).
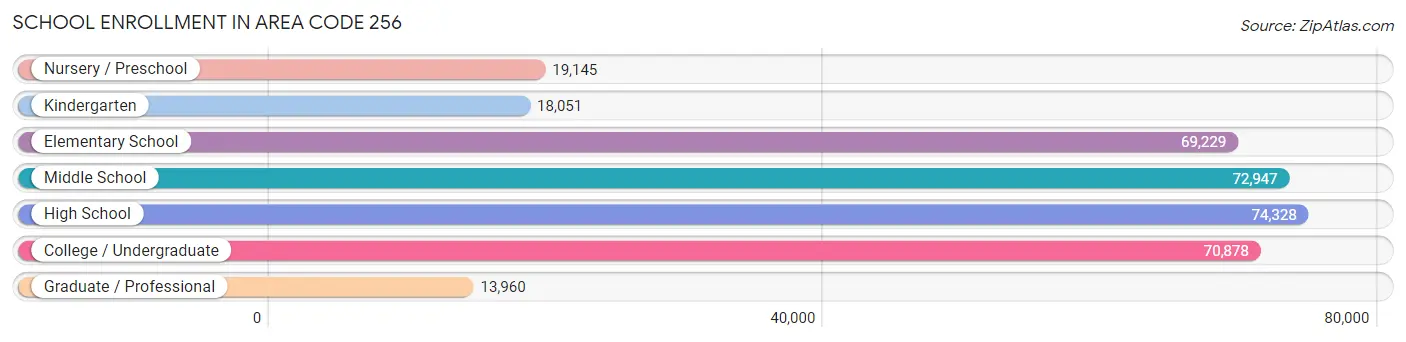
| School Level | # Students | % Students |
| Nursery / Preschool | 19,145 | 5.7% |
| Kindergarten | 18,051 | 5.3% |
| Elementary School | 69,229 | 20.4% |
| Middle School | 72,947 | 21.5% |
| High School | 74,328 | 22.0% |
| College / Undergraduate | 70,878 | 20.9% |
| Graduate / Professional | 13,960 | 4.1% |
| Total | 338,538 | 100.0% |
School Enrollment by Age by Funding Source in Area Code 256
Out of a total of 338,538 students who are enrolled in schools in Area Code 256, 45,830 (13.5%) attend a private institution, while the remaining 292,708 (86.5%) are enrolled in public schools. The age group of 3 to 4 year olds has the highest likelihood of being enrolled in private schools, with 4,698 (32.2% in the age bracket) enrolled. Conversely, the age group of 25 to 34 year olds has the lowest likelihood of being enrolled in a private school, with 15,352 (88.6% in the age bracket) attending a public institution.
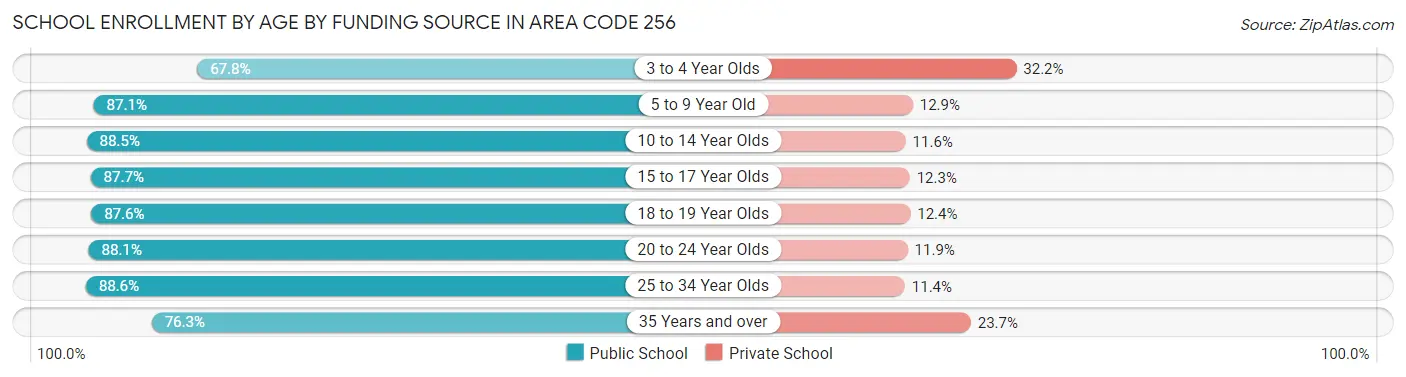
| Age Bracket | Public School | Private School |
| 3 to 4 Year Olds | 9,911 (67.8%) | 4,698 (32.2%) |
| 5 to 9 Year Old | 70,469 (87.1%) | 10,408 (12.9%) |
| 10 to 14 Year Olds | 80,929 (88.4%) | 10,572 (11.6%) |
| 15 to 17 Year Olds | 47,650 (87.7%) | 6,687 (12.3%) |
| 18 to 19 Year Olds | 24,358 (87.6%) | 3,451 (12.4%) |
| 20 to 24 Year Olds | 32,042 (88.1%) | 4,336 (11.9%) |
| 25 to 34 Year Olds | 15,352 (88.6%) | 1,976 (11.4%) |
| 35 Years and over | 11,982 (76.3%) | 3,717 (23.7%) |
| Total | 292,708 (86.5%) | 45,830 (13.5%) |
Educational Attainment by Field of Study in Area Code 256
Business (62,200 | 21.7%), education (47,594 | 16.6%), engineering (32,393 | 11.3%), science & technology (29,617 | 10.3%), and arts & humanities (18,437 | 6.4%) are the most common fields of study among 286,783 individuals in Area Code 256 who have obtained a bachelor's degree or higher.
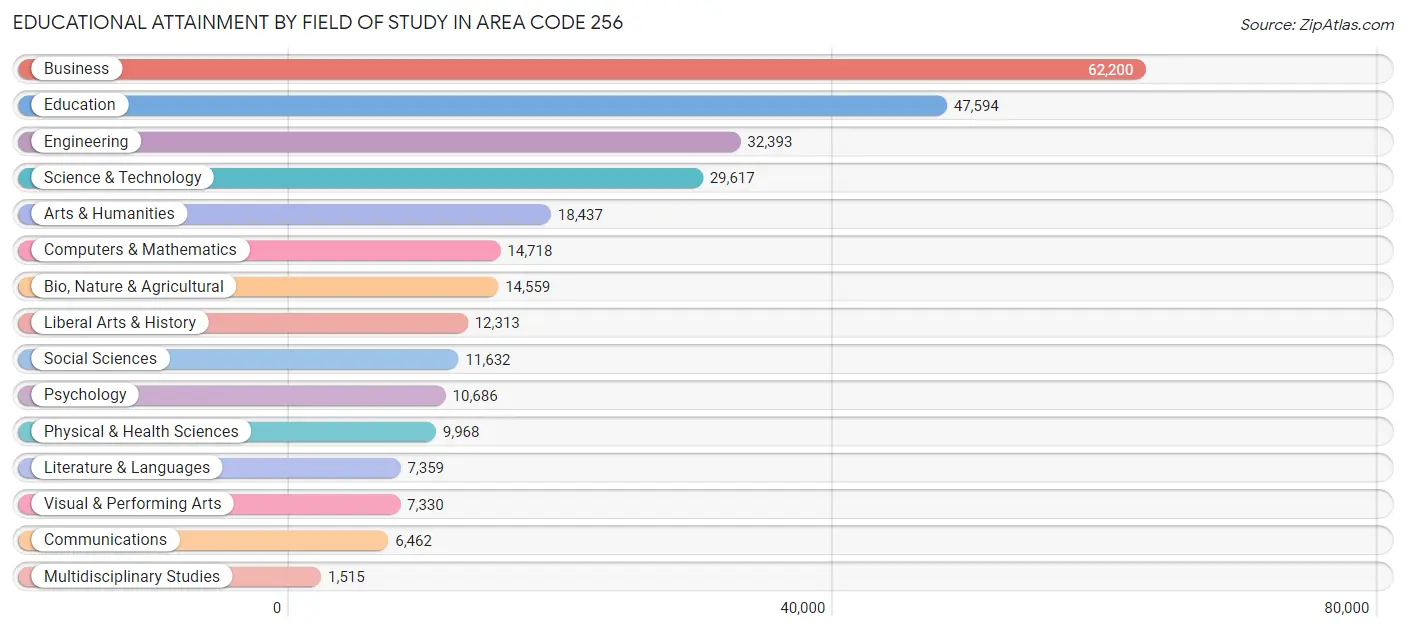
| Field of Study | # Graduates | % Graduates |
| Computers & Mathematics | 14,718 | 5.1% |
| Bio, Nature & Agricultural | 14,559 | 5.1% |
| Physical & Health Sciences | 9,968 | 3.5% |
| Psychology | 10,686 | 3.7% |
| Social Sciences | 11,632 | 4.1% |
| Engineering | 32,393 | 11.3% |
| Multidisciplinary Studies | 1,515 | 0.5% |
| Science & Technology | 29,617 | 10.3% |
| Business | 62,200 | 21.7% |
| Education | 47,594 | 16.6% |
| Literature & Languages | 7,359 | 2.6% |
| Liberal Arts & History | 12,313 | 4.3% |
| Visual & Performing Arts | 7,330 | 2.6% |
| Communications | 6,462 | 2.2% |
| Arts & Humanities | 18,437 | 6.4% |
| Total | 286,783 | 100.0% |
Transportation & Commute in Area Code 256
Vehicle Availability by Sex in Area Code 256
The most prevalent vehicle ownership categories in Area Code 256 are males with 2 vehicles (136,838, accounting for 38.7%) and females with 2 vehicles (108,682, making up 46.6%).
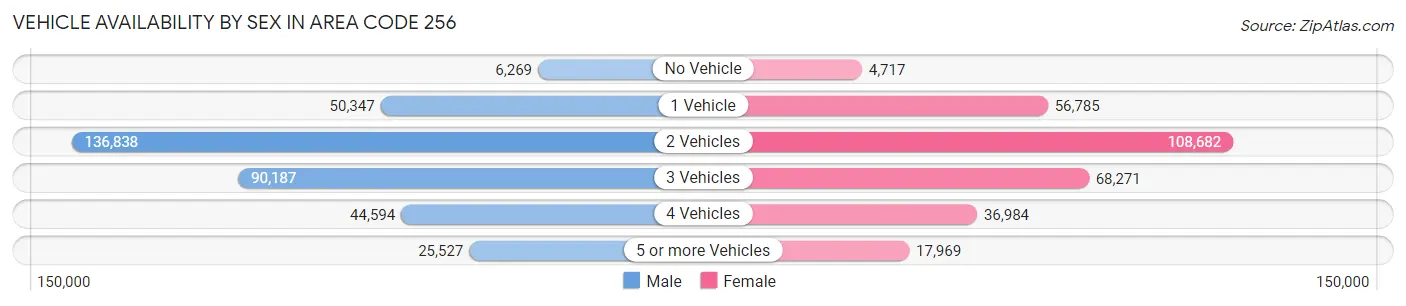
| Vehicles Available | Male | Female |
| No Vehicle | 6,269 (1.8%) | 4,717 (1.6%) |
| 1 Vehicle | 50,347 (14.2%) | 56,785 (19.4%) |
| 2 Vehicles | 136,838 (38.7%) | 108,682 (37.0%) |
| 3 Vehicles | 90,187 (25.5%) | 68,271 (23.3%) |
| 4 Vehicles | 44,594 (12.6%) | 36,984 (12.6%) |
| 5 or more Vehicles | 25,527 (7.2%) | 17,969 (6.1%) |
| Total | 353,762 (100.0%) | 293,408 (100.0%) |
Commute Time in Area Code 256
The most frequently occuring commute durations in Area Code 256 are 15 to 19 minutes (105,460 commuters, 17.3%), 20 to 24 minutes (91,815 commuters, 15.1%), and 10 to 14 minutes (87,416 commuters, 14.3%).
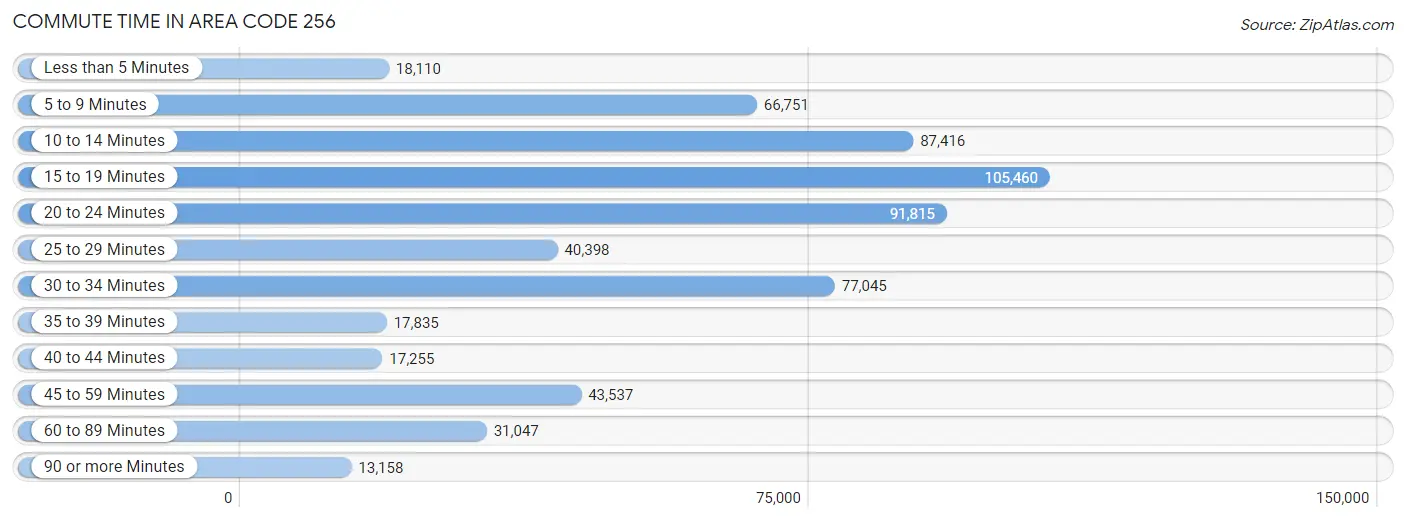
| Commute Time | # Commuters | % Commuters |
| Less than 5 Minutes | 18,110 | 3.0% |
| 5 to 9 Minutes | 66,751 | 11.0% |
| 10 to 14 Minutes | 87,416 | 14.3% |
| 15 to 19 Minutes | 105,460 | 17.3% |
| 20 to 24 Minutes | 91,815 | 15.1% |
| 25 to 29 Minutes | 40,398 | 6.6% |
| 30 to 34 Minutes | 77,045 | 12.6% |
| 35 to 39 Minutes | 17,835 | 2.9% |
| 40 to 44 Minutes | 17,255 | 2.8% |
| 45 to 59 Minutes | 43,537 | 7.1% |
| 60 to 89 Minutes | 31,047 | 5.1% |
| 90 or more Minutes | 13,158 | 2.2% |
Commute Time by Sex in Area Code 256
The most common commute times in Area Code 256 are 15 to 19 minutes (55,194 commuters, 16.5%) for males and 15 to 19 minutes (50,266 commuters, 18.2%) for females.
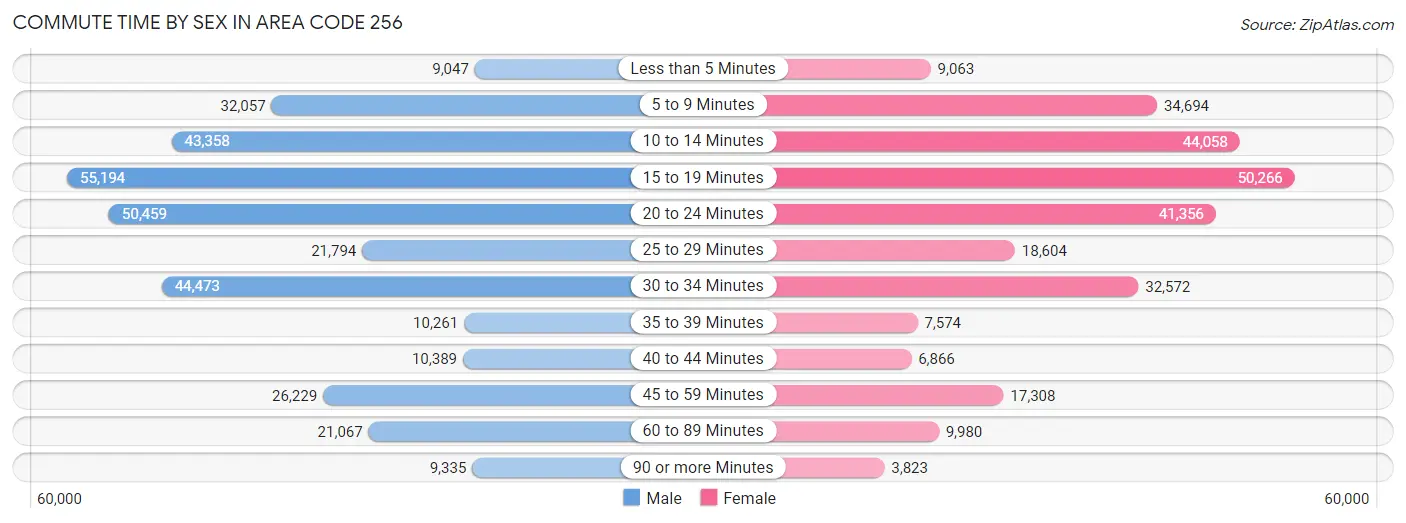
| Commute Time | Male | Female |
| Less than 5 Minutes | 9,047 (2.7%) | 9,063 (3.3%) |
| 5 to 9 Minutes | 32,057 (9.6%) | 34,694 (12.6%) |
| 10 to 14 Minutes | 43,358 (13.0%) | 44,058 (16.0%) |
| 15 to 19 Minutes | 55,194 (16.5%) | 50,266 (18.2%) |
| 20 to 24 Minutes | 50,459 (15.1%) | 41,356 (15.0%) |
| 25 to 29 Minutes | 21,794 (6.5%) | 18,604 (6.7%) |
| 30 to 34 Minutes | 44,473 (13.3%) | 32,572 (11.8%) |
| 35 to 39 Minutes | 10,261 (3.1%) | 7,574 (2.7%) |
| 40 to 44 Minutes | 10,389 (3.1%) | 6,866 (2.5%) |
| 45 to 59 Minutes | 26,229 (7.9%) | 17,308 (6.3%) |
| 60 to 89 Minutes | 21,067 (6.3%) | 9,980 (3.6%) |
| 90 or more Minutes | 9,335 (2.8%) | 3,823 (1.4%) |
Time of Departure to Work by Sex in Area Code 256
The most frequent times of departure to work in Area Code 256 are 7:00 AM to 7:29 AM (49,399, 14.8%) for males and 7:00 AM to 7:29 AM (49,901, 18.1%) for females.
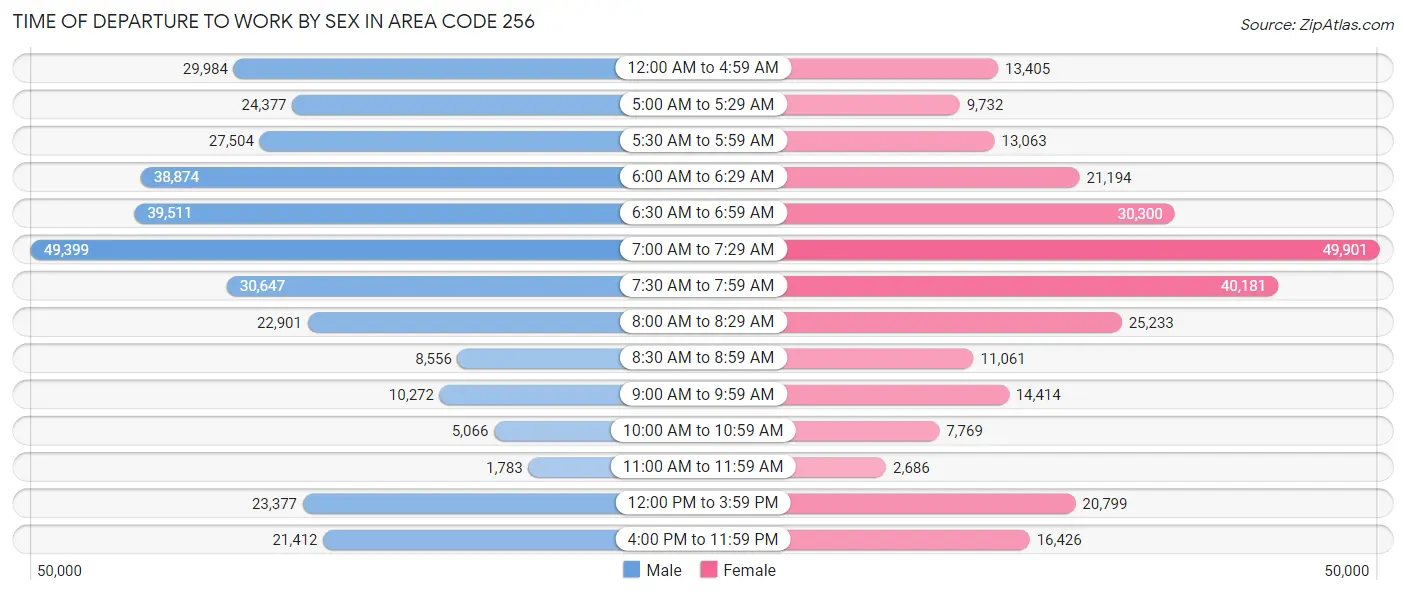
| Time of Departure | Male | Female |
| 12:00 AM to 4:59 AM | 29,984 (9.0%) | 13,405 (4.9%) |
| 5:00 AM to 5:29 AM | 24,377 (7.3%) | 9,732 (3.5%) |
| 5:30 AM to 5:59 AM | 27,504 (8.2%) | 13,063 (4.7%) |
| 6:00 AM to 6:29 AM | 38,874 (11.7%) | 21,194 (7.7%) |
| 6:30 AM to 6:59 AM | 39,511 (11.8%) | 30,300 (11.0%) |
| 7:00 AM to 7:29 AM | 49,399 (14.8%) | 49,901 (18.1%) |
| 7:30 AM to 7:59 AM | 30,647 (9.2%) | 40,181 (14.5%) |
| 8:00 AM to 8:29 AM | 22,901 (6.9%) | 25,233 (9.1%) |
| 8:30 AM to 8:59 AM | 8,556 (2.6%) | 11,061 (4.0%) |
| 9:00 AM to 9:59 AM | 10,272 (3.1%) | 14,414 (5.2%) |
| 10:00 AM to 10:59 AM | 5,066 (1.5%) | 7,769 (2.8%) |
| 11:00 AM to 11:59 AM | 1,783 (0.5%) | 2,686 (1.0%) |
| 12:00 PM to 3:59 PM | 23,377 (7.0%) | 20,799 (7.5%) |
| 4:00 PM to 11:59 PM | 21,412 (6.4%) | 16,426 (5.9%) |
| Total | 333,663 (100.0%) | 276,164 (100.0%) |
Housing Occupancy in Area Code 256
Occupancy by Ownership in Area Code 256
Of the total 580,951 dwellings in Area Code 256, owner-occupied units account for 416,894 (71.8%), while renter-occupied units make up 164,057 (28.2%).
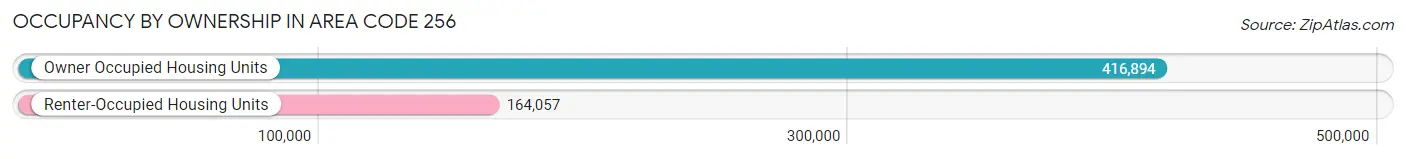
| Occupancy | # Housing Units | % Housing Units |
| Owner Occupied Housing Units | 416,894 | 71.8% |
| Renter-Occupied Housing Units | 164,057 | 28.2% |
| Total Occupied Housing Units | 580,951 | 100.0% |
Occupancy by Household Size in Area Code 256
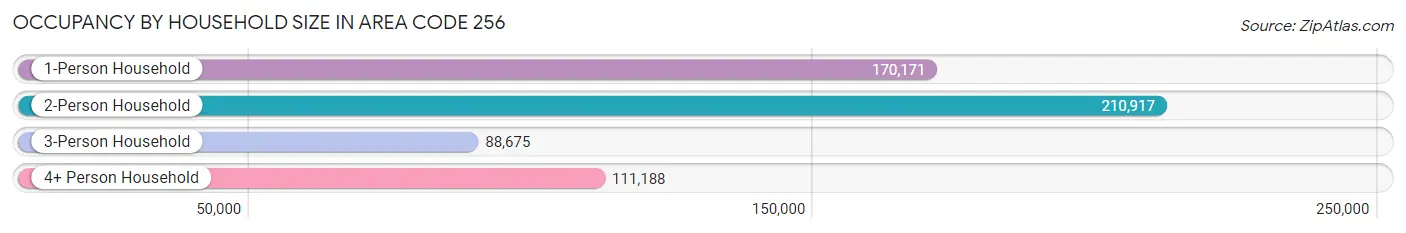
| Household Size | # Housing Units | % Housing Units |
| 1-Person Household | 170,171 | 29.3% |
| 2-Person Household | 210,917 | 36.3% |
| 3-Person Household | 88,675 | 15.3% |
| 4+ Person Household | 111,188 | 19.1% |
| Total Housing Units | 580,951 | 100.0% |
Occupancy by Ownership by Household Size in Area Code 256
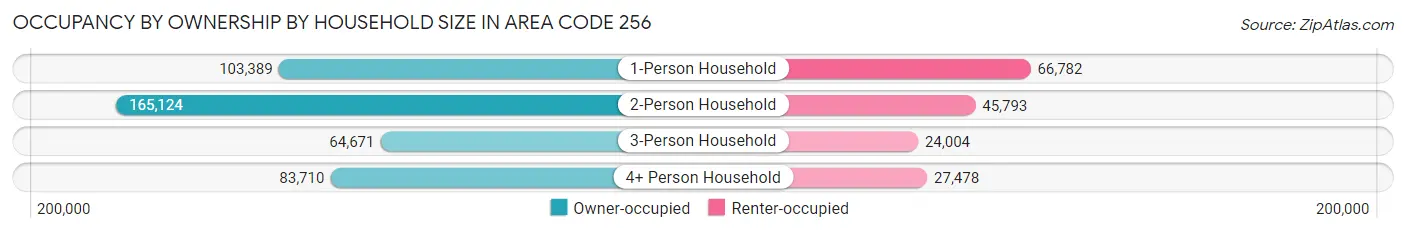
| Household Size | Owner-occupied | Renter-occupied |
| 1-Person Household | 103,389 (60.8%) | 66,782 (39.2%) |
| 2-Person Household | 165,124 (78.3%) | 45,793 (21.7%) |
| 3-Person Household | 64,671 (72.9%) | 24,004 (27.1%) |
| 4+ Person Household | 83,710 (75.3%) | 27,478 (24.7%) |
| Total Housing Units | 416,894 (71.8%) | 164,057 (28.2%) |
Occupancy by Educational Attainment in Area Code 256
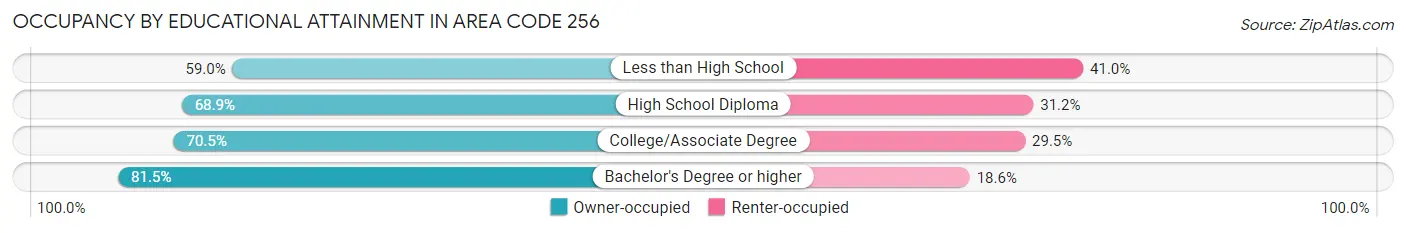
| Household Size | Owner-occupied | Renter-occupied |
| Less than High School | 41,539 (59.0%) | 28,896 (41.0%) |
| High School Diploma | 111,600 (68.9%) | 50,481 (31.1%) |
| College/Associate Degree | 128,673 (70.5%) | 53,917 (29.5%) |
| Bachelor's Degree or higher | 135,082 (81.5%) | 30,763 (18.5%) |
Occupancy by Age of Householder in Area Code 256
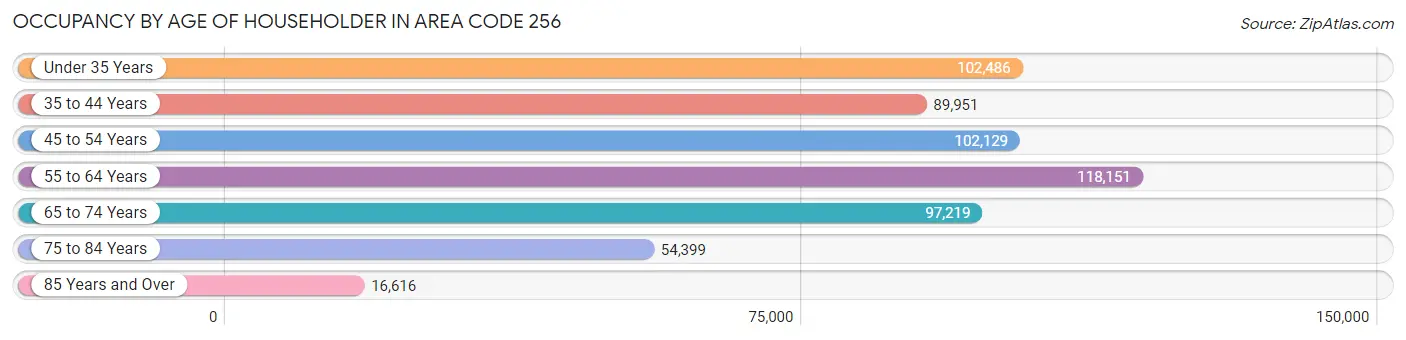
| Age Bracket | # Households | % Households |
| Under 35 Years | 102,486 | 17.6% |
| 35 to 44 Years | 89,951 | 15.5% |
| 45 to 54 Years | 102,129 | 17.6% |
| 55 to 64 Years | 118,151 | 20.3% |
| 65 to 74 Years | 97,219 | 16.7% |
| 75 to 84 Years | 54,399 | 9.4% |
| 85 Years and Over | 16,616 | 2.9% |
| Total | 580,951 | 100.0% |
Housing Finances in Area Code 256
Median Income by Occupancy in Area Code 256
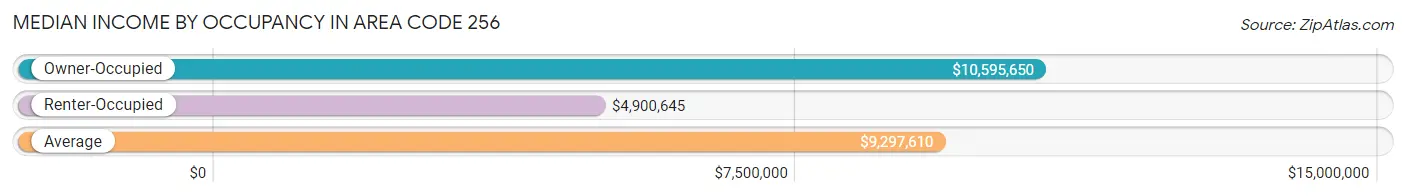
| Occupancy Type | # Households | Median Income |
| Owner-Occupied | 416,894 (71.8%) | $10,595,650 |
| Renter-Occupied | 164,057 (28.2%) | $4,900,645 |
| Average | 580,951 (100.0%) | $9,297,610 |
Occupancy by Householder Income Bracket in Area Code 256
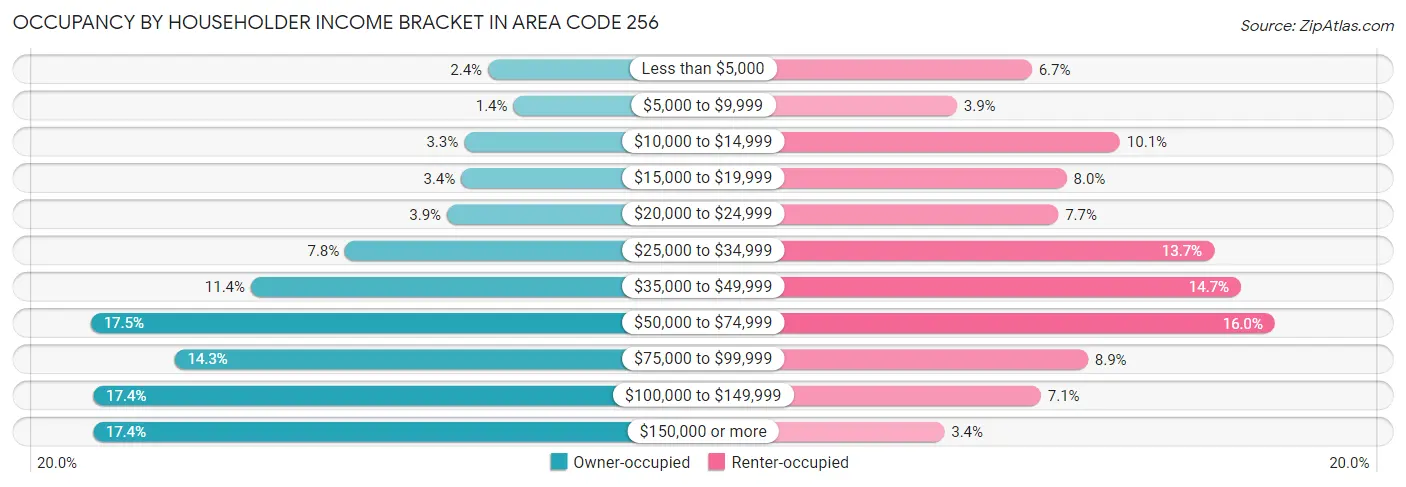
| Income Bracket | Owner-occupied | Renter-occupied |
| Less than $5,000 | 9,777 (2.4%) | 11,015 (6.7%) |
| $5,000 to $9,999 | 5,769 (1.4%) | 6,328 (3.9%) |
| $10,000 to $14,999 | 13,573 (3.3%) | 16,528 (10.1%) |
| $15,000 to $19,999 | 14,050 (3.4%) | 13,196 (8.0%) |
| $20,000 to $24,999 | 16,310 (3.9%) | 12,669 (7.7%) |
| $25,000 to $34,999 | 32,467 (7.8%) | 22,386 (13.7%) |
| $35,000 to $49,999 | 47,438 (11.4%) | 24,089 (14.7%) |
| $50,000 to $74,999 | 72,888 (17.5%) | 26,193 (16.0%) |
| $75,000 to $99,999 | 59,565 (14.3%) | 14,526 (8.8%) |
| $100,000 to $149,999 | 72,503 (17.4%) | 11,576 (7.1%) |
| $150,000 or more | 72,554 (17.4%) | 5,551 (3.4%) |
| Total | 416,894 (100.0%) | 164,057 (100.0%) |
Monthly Housing Cost Tiers in Area Code 256
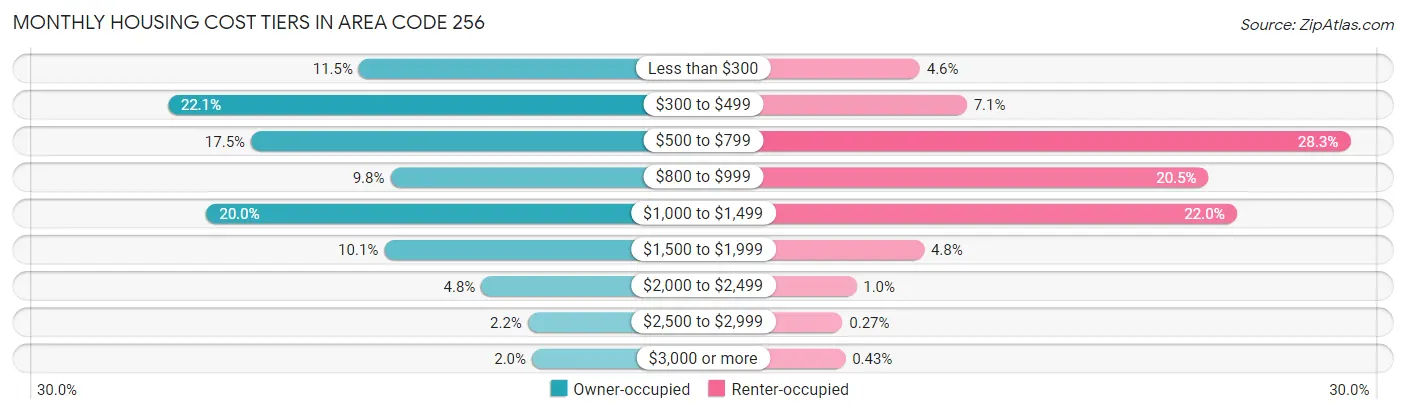
| Monthly Cost | Owner-occupied | Renter-occupied |
| Less than $300 | 48,123 (11.5%) | 7,470 (4.5%) |
| $300 to $499 | 92,108 (22.1%) | 11,712 (7.1%) |
| $500 to $799 | 72,936 (17.5%) | 46,463 (28.3%) |
| $800 to $999 | 40,854 (9.8%) | 33,609 (20.5%) |
| $1,000 to $1,499 | 83,226 (20.0%) | 36,164 (22.0%) |
| $1,500 to $1,999 | 42,288 (10.1%) | 7,840 (4.8%) |
| $2,000 to $2,499 | 19,914 (4.8%) | 1,699 (1.0%) |
| $2,500 to $2,999 | 9,195 (2.2%) | 447 (0.3%) |
| $3,000 or more | 8,250 (2.0%) | 703 (0.4%) |
| Total | 416,894 (100.0%) | 164,057 (100.0%) |
Physical Housing Characteristics in Area Code 256
Housing Structures in Area Code 256
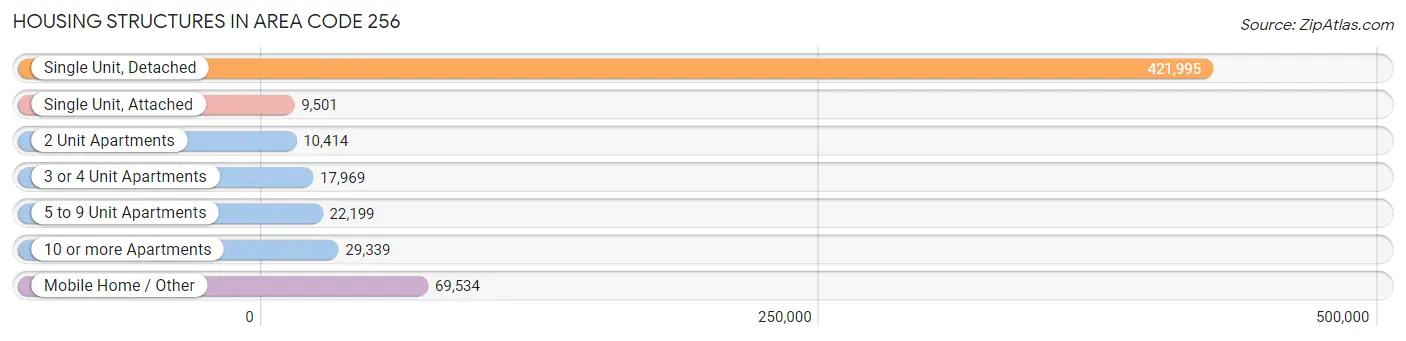
| Structure Type | # Housing Units | % Housing Units |
| Single Unit, Detached | 421,995 | 72.6% |
| Single Unit, Attached | 9,501 | 1.6% |
| 2 Unit Apartments | 10,414 | 1.8% |
| 3 or 4 Unit Apartments | 17,969 | 3.1% |
| 5 to 9 Unit Apartments | 22,199 | 3.8% |
| 10 or more Apartments | 29,339 | 5.1% |
| Mobile Home / Other | 69,534 | 12.0% |
| Total | 580,951 | 100.0% |
Housing Structures by Occupancy in Area Code 256
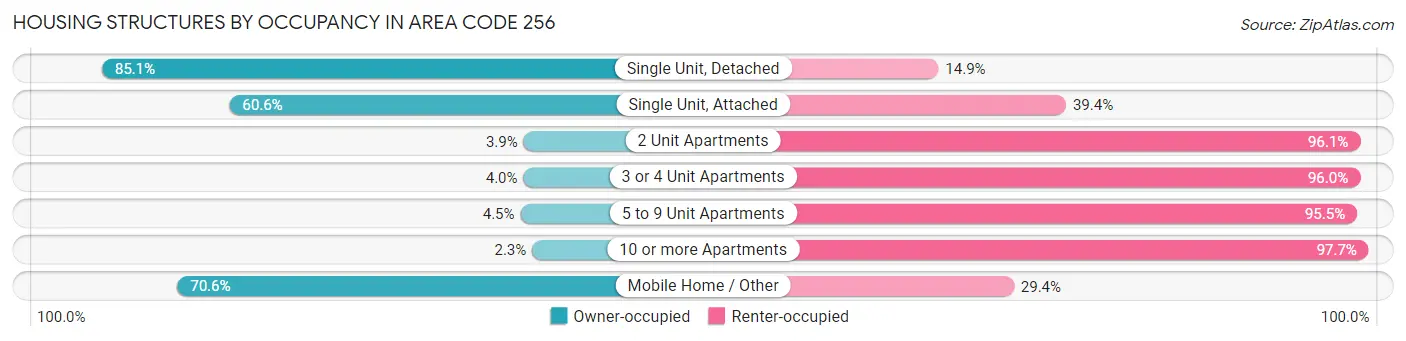
| Structure Type | Owner-occupied | Renter-occupied |
| Single Unit, Detached | 359,246 (85.1%) | 62,749 (14.9%) |
| Single Unit, Attached | 5,754 (60.6%) | 3,747 (39.4%) |
| 2 Unit Apartments | 409 (3.9%) | 10,005 (96.1%) |
| 3 or 4 Unit Apartments | 714 (4.0%) | 17,255 (96.0%) |
| 5 to 9 Unit Apartments | 1,008 (4.5%) | 21,191 (95.5%) |
| 10 or more Apartments | 672 (2.3%) | 28,667 (97.7%) |
| Mobile Home / Other | 49,091 (70.6%) | 20,443 (29.4%) |
| Total | 416,894 (71.8%) | 164,057 (28.2%) |
Housing Structures by Number of Rooms in Area Code 256
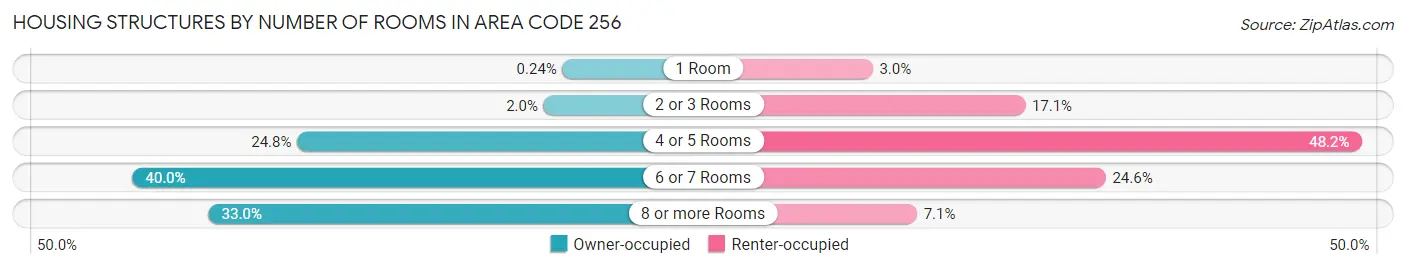
| Number of Rooms | Owner-occupied | Renter-occupied |
| 1 Room | 1,004 (0.2%) | 4,940 (3.0%) |
| 2 or 3 Rooms | 8,248 (2.0%) | 28,063 (17.1%) |
| 4 or 5 Rooms | 103,297 (24.8%) | 79,105 (48.2%) |
| 6 or 7 Rooms | 166,870 (40.0%) | 40,296 (24.6%) |
| 8 or more Rooms | 137,475 (33.0%) | 11,653 (7.1%) |
| Total | 416,894 (100.0%) | 164,057 (100.0%) |
Housing Structure by Heating Type in Area Code 256
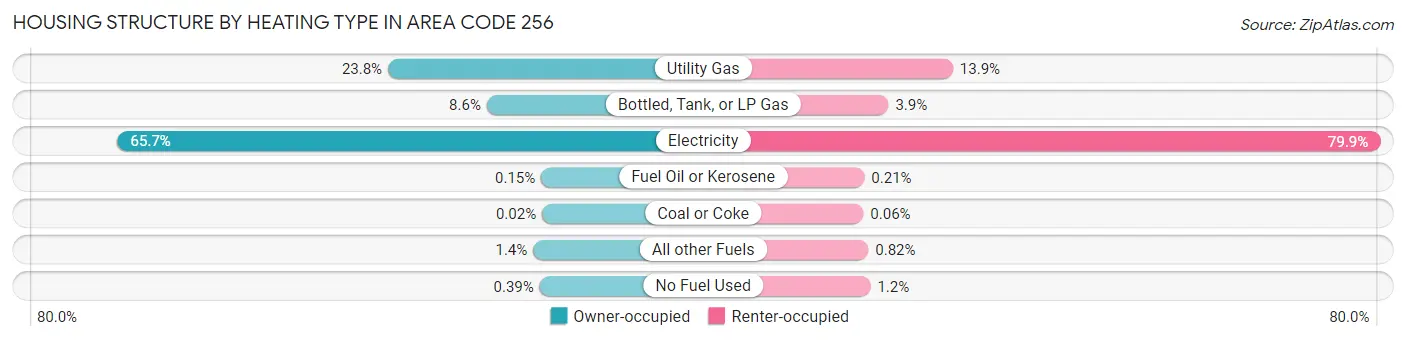
| Heating Type | Owner-occupied | Renter-occupied |
| Utility Gas | 99,344 (23.8%) | 22,795 (13.9%) |
| Bottled, Tank, or LP Gas | 35,706 (8.6%) | 6,445 (3.9%) |
| Electricity | 273,708 (65.6%) | 131,124 (79.9%) |
| Fuel Oil or Kerosene | 640 (0.2%) | 349 (0.2%) |
| Coal or Coke | 84 (0.0%) | 105 (0.1%) |
| All other Fuels | 5,775 (1.4%) | 1,352 (0.8%) |
| No Fuel Used | 1,637 (0.4%) | 1,887 (1.1%) |
| Total | 416,894 (100.0%) | 164,057 (100.0%) |
Household Vehicle Usage in Area Code 256
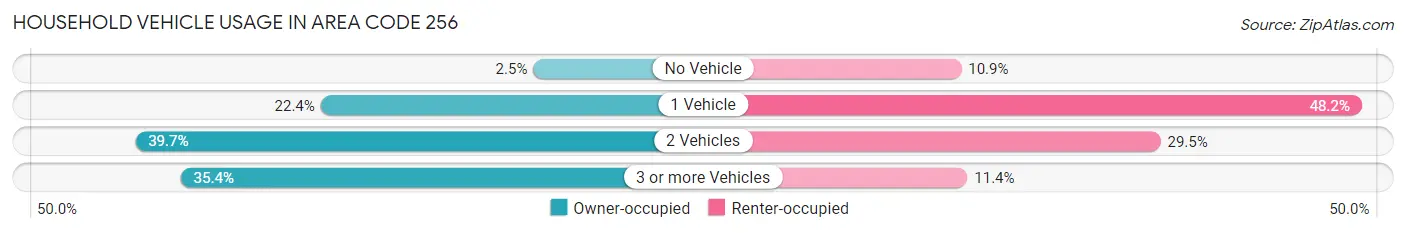
| Vehicles per Household | Owner-occupied | Renter-occupied |
| No Vehicle | 10,509 (2.5%) | 17,821 (10.9%) |
| 1 Vehicle | 93,280 (22.4%) | 79,149 (48.2%) |
| 2 Vehicles | 165,381 (39.7%) | 48,333 (29.5%) |
| 3 or more Vehicles | 147,724 (35.4%) | 18,754 (11.4%) |
| Total | 416,894 (100.0%) | 164,057 (100.0%) |
Real Estate & Mortgages in Area Code 256
Real Estate and Mortgage Overview in Area Code 256
| Characteristic | Without Mortgage | With Mortgage |
| Housing Units | 198,161 | 218,733 |
| Median Property Value | $21,696,000 | $27,647,100 |
| Median Household Income | $8,425,602 | $48,732 |
| Monthly Housing Costs | $62,502 | $8,012 |
| Real Estate Taxes | $75,274 | $23,885 |
Property Value by Mortgage Status in Area Code 256
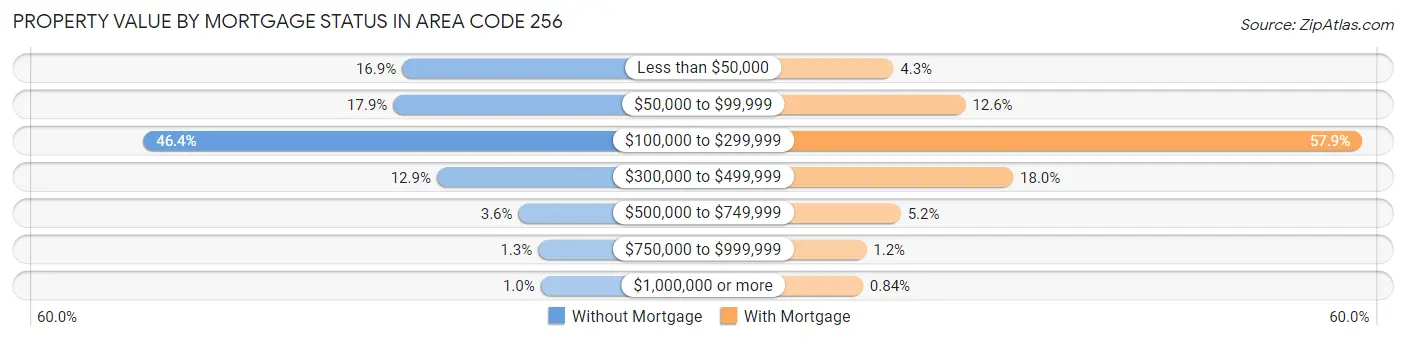
| Property Value | Without Mortgage | With Mortgage |
| Less than $50,000 | 33,429 (16.9%) | 9,440 (4.3%) |
| $50,000 to $99,999 | 35,432 (17.9%) | 27,467 (12.6%) |
| $100,000 to $299,999 | 91,999 (46.4%) | 126,631 (57.9%) |
| $300,000 to $499,999 | 25,569 (12.9%) | 39,383 (18.0%) |
| $500,000 to $749,999 | 7,083 (3.6%) | 11,290 (5.2%) |
| $750,000 to $999,999 | 2,613 (1.3%) | 2,681 (1.2%) |
| $1,000,000 or more | 2,036 (1.0%) | 1,841 (0.8%) |
| Total | 198,161 (100.0%) | 218,733 (100.0%) |
Household Income by Mortgage Status in Area Code 256
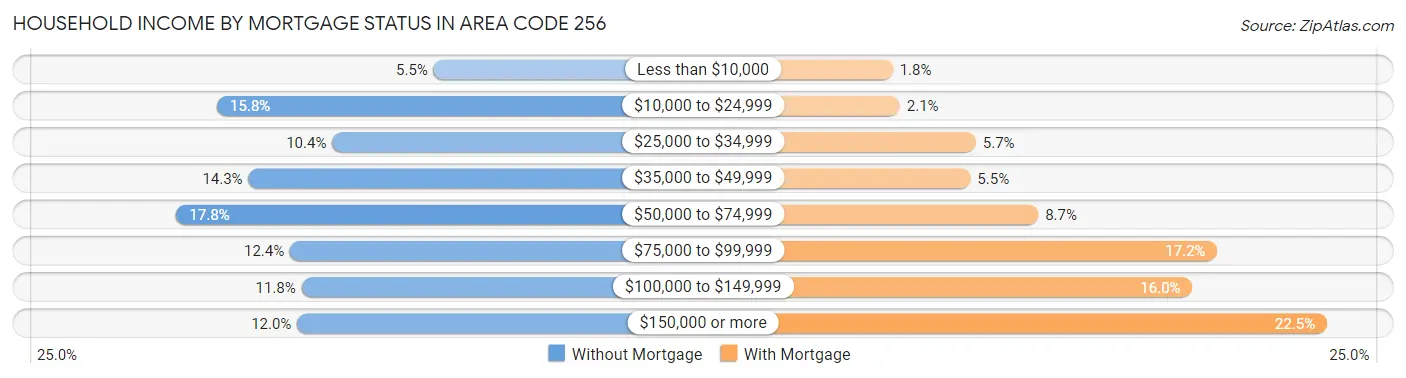
| Household Income | Without Mortgage | With Mortgage |
| Less than $10,000 | 10,931 (5.5%) | 3,871 (1.8%) |
| $10,000 to $24,999 | 31,398 (15.8%) | 4,615 (2.1%) |
| $25,000 to $34,999 | 20,510 (10.3%) | 12,535 (5.7%) |
| $35,000 to $49,999 | 28,415 (14.3%) | 11,957 (5.5%) |
| $50,000 to $74,999 | 35,206 (17.8%) | 19,023 (8.7%) |
| $75,000 to $99,999 | 24,485 (12.4%) | 37,682 (17.2%) |
| $100,000 to $149,999 | 23,394 (11.8%) | 35,080 (16.0%) |
| $150,000 or more | 23,822 (12.0%) | 49,109 (22.5%) |
| Total | 198,161 (100.0%) | 218,733 (100.0%) |
Property Value to Household Income Ratio in Area Code 256
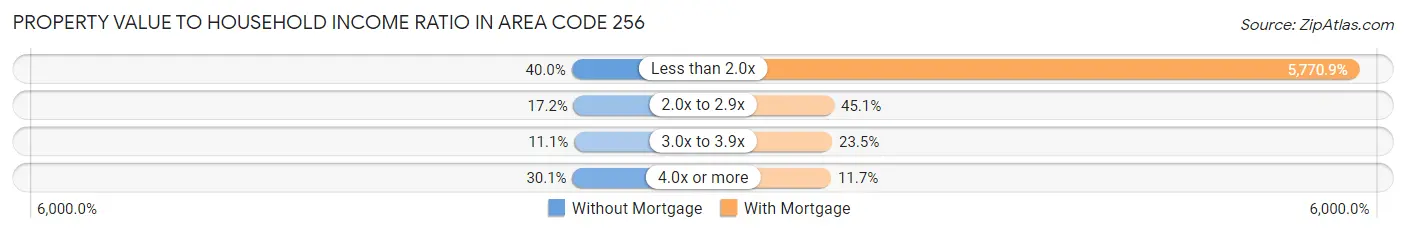
| Value-to-Income Ratio | Without Mortgage | With Mortgage |
| Less than 2.0x | 79,171 (40.0%) | 12,622,868 (5,770.9%) |
| 2.0x to 2.9x | 34,147 (17.2%) | 98,609 (45.1%) |
| 3.0x to 3.9x | 21,978 (11.1%) | 51,313 (23.5%) |
| 4.0x or more | 59,669 (30.1%) | 25,500 (11.7%) |
| Total | 198,161 (100.0%) | 218,733 (100.0%) |
Real Estate Taxes by Mortgage Status in Area Code 256
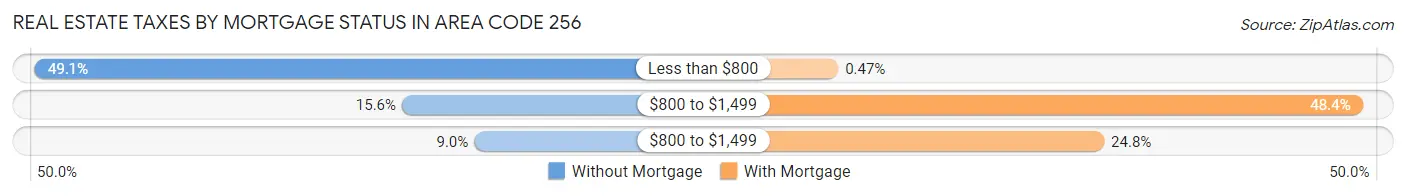
| Property Taxes | Without Mortgage | With Mortgage |
| Less than $800 | 97,209 (49.1%) | 1,025 (0.5%) |
| $800 to $1,499 | 30,822 (15.5%) | 105,753 (48.3%) |
| $800 to $1,499 | 17,738 (8.9%) | 54,163 (24.8%) |
| Total | 198,161 (100.0%) | 218,733 (100.0%) |
Health & Disability in Area Code 256
Health Insurance Coverage by Age in Area Code 256
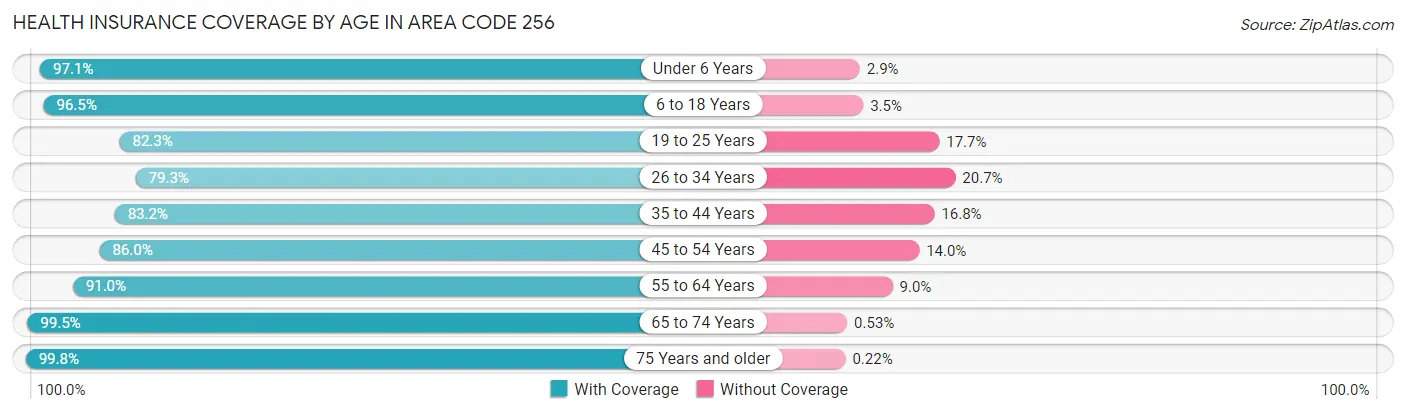
| Age Bracket | With Coverage | Without Coverage |
| Under 6 Years | 98,937 (97.1%) | 2,957 (2.9%) |
| 6 to 18 Years | 230,363 (96.5%) | 8,426 (3.5%) |
| 19 to 25 Years | 108,582 (82.3%) | 23,376 (17.7%) |
| 26 to 34 Years | 129,376 (79.3%) | 33,812 (20.7%) |
| 35 to 44 Years | 145,799 (83.2%) | 29,465 (16.8%) |
| 45 to 54 Years | 159,793 (86.0%) | 25,940 (14.0%) |
| 55 to 64 Years | 185,721 (91.0%) | 18,368 (9.0%) |
| 65 to 74 Years | 154,439 (99.5%) | 829 (0.5%) |
| 75 Years and older | 103,636 (99.8%) | 233 (0.2%) |
| Total | 1,316,646 (90.2%) | 143,406 (9.8%) |
Health Insurance Coverage by Citizenship Status in Area Code 256
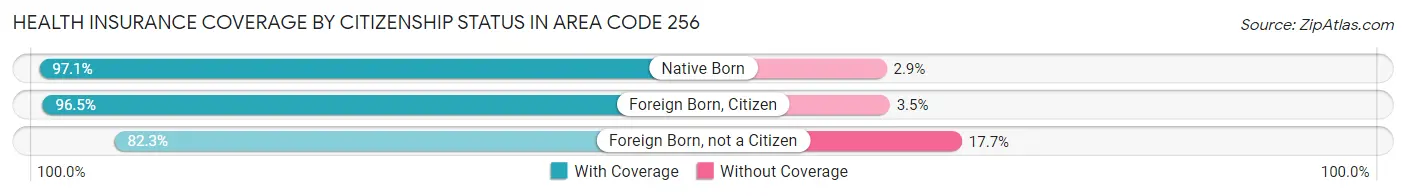
| Citizenship Status | With Coverage | Without Coverage |
| Native Born | 98,937 (97.1%) | 2,957 (2.9%) |
| Foreign Born, Citizen | 230,363 (96.5%) | 8,426 (3.5%) |
| Foreign Born, not a Citizen | 108,582 (82.3%) | 23,376 (17.7%) |
Health Insurance Coverage by Household Income in Area Code 256
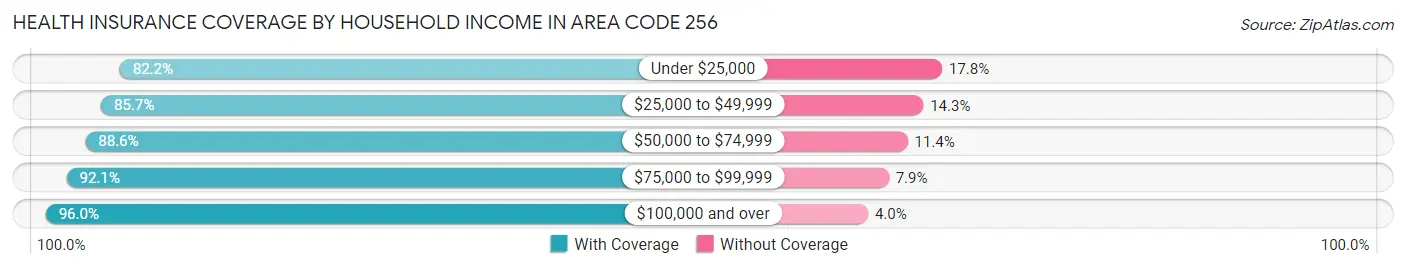
| Household Income | With Coverage | Without Coverage |
| Under $25,000 | 172,311 (82.2%) | 37,403 (17.8%) |
| $25,000 to $49,999 | 236,426 (85.7%) | 39,507 (14.3%) |
| $50,000 to $74,999 | 223,195 (88.6%) | 28,698 (11.4%) |
| $75,000 to $99,999 | 193,250 (92.1%) | 16,494 (7.9%) |
| $100,000 and over | 479,454 (96.0%) | 19,767 (4.0%) |
Public vs Private Health Insurance Coverage by Age in Area Code 256
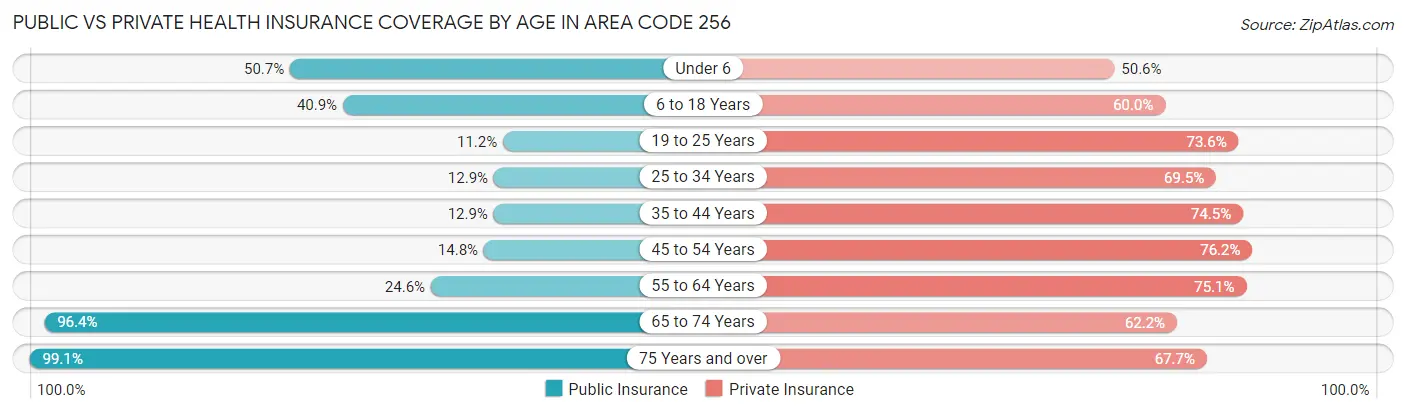
| Age Bracket | Public Insurance | Private Insurance |
| Under 6 | 51,692 (50.7%) | 51,552 (50.6%) |
| 6 to 18 Years | 97,682 (40.9%) | 143,346 (60.0%) |
| 19 to 25 Years | 14,782 (11.2%) | 97,172 (73.6%) |
| 25 to 34 Years | 21,036 (12.9%) | 113,388 (69.5%) |
| 35 to 44 Years | 22,669 (12.9%) | 130,514 (74.5%) |
| 45 to 54 Years | 27,398 (14.7%) | 141,515 (76.2%) |
| 55 to 64 Years | 50,160 (24.6%) | 153,243 (75.1%) |
| 65 to 74 Years | 149,611 (96.4%) | 96,570 (62.2%) |
| 75 Years and over | 102,920 (99.1%) | 70,363 (67.7%) |
| Total | 537,950 (36.8%) | 997,663 (68.3%) |
Disability Status by Sex by Age in Area Code 256
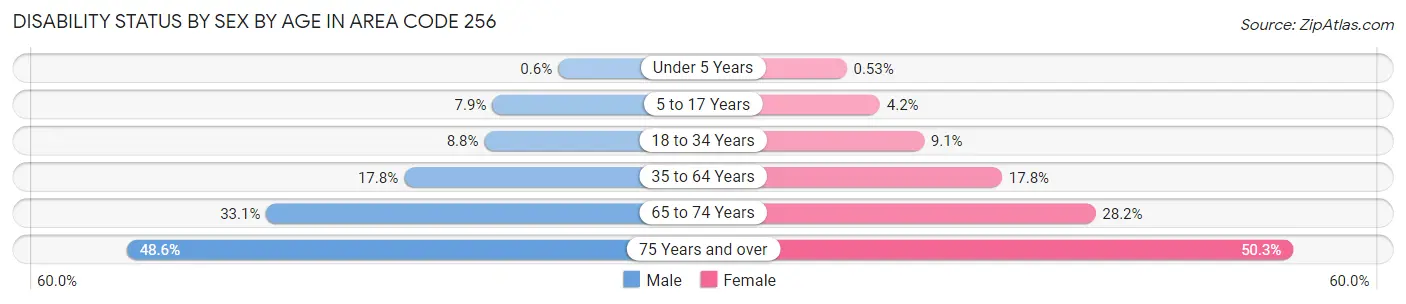
| Age Bracket | Male | Female |
| Under 5 Years | 259 (0.6%) | 217 (0.5%) |
| 5 to 17 Years | 9,513 (7.9%) | 4,921 (4.2%) |
| 18 to 34 Years | 13,871 (8.8%) | 14,422 (9.1%) |
| 35 to 64 Years | 49,284 (17.7%) | 51,246 (17.8%) |
| 65 to 74 Years | 24,081 (33.1%) | 23,297 (28.2%) |
| 75 Years and over | 20,596 (48.6%) | 30,919 (50.3%) |
Disability Class by Sex by Age in Area Code 256
Disability Class: Hearing Difficulty
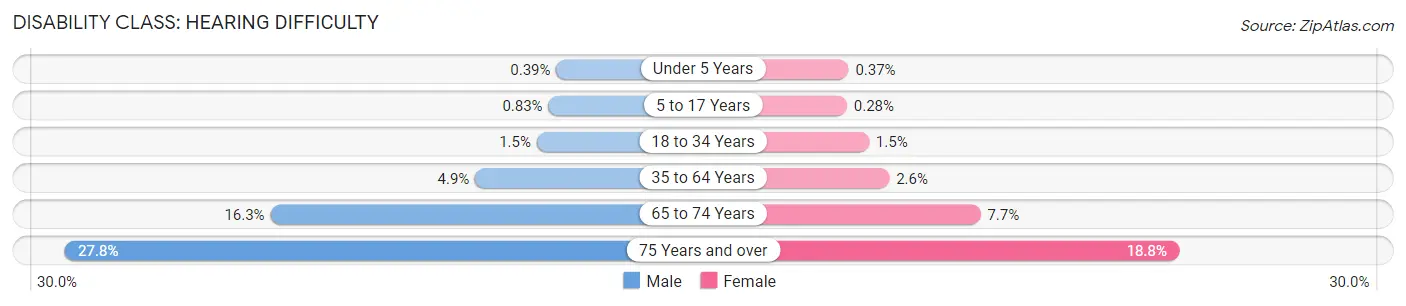
| Age Bracket | Male | Female |
| Under 5 Years | 171 (0.4%) | 153 (0.4%) |
| 5 to 17 Years | 996 (0.8%) | 328 (0.3%) |
| 18 to 34 Years | 2,328 (1.5%) | 2,378 (1.5%) |
| 35 to 64 Years | 13,631 (4.9%) | 7,580 (2.6%) |
| 65 to 74 Years | 11,870 (16.3%) | 6,365 (7.7%) |
| 75 Years and over | 11,753 (27.8%) | 11,540 (18.8%) |
Disability Class: Vision Difficulty
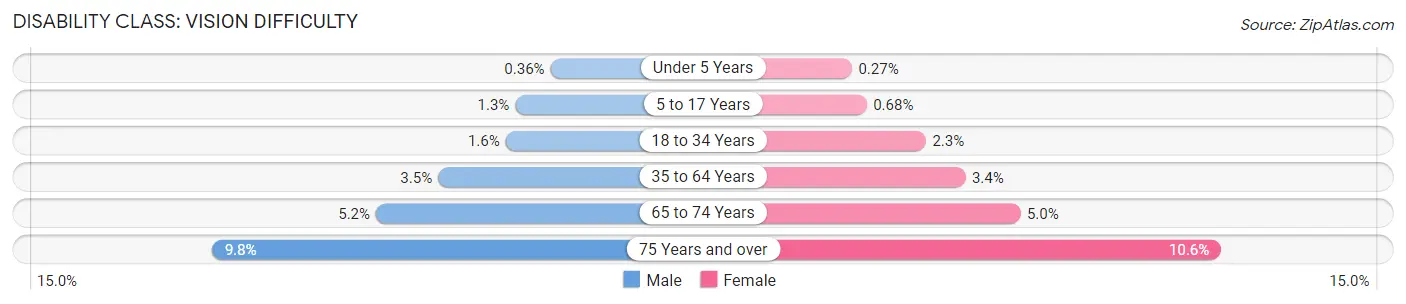
| Age Bracket | Male | Female |
| Under 5 Years | 157 (0.4%) | 112 (0.3%) |
| 5 to 17 Years | 1,605 (1.3%) | 786 (0.7%) |
| 18 to 34 Years | 2,545 (1.6%) | 3,671 (2.3%) |
| 35 to 64 Years | 9,695 (3.5%) | 9,870 (3.4%) |
| 65 to 74 Years | 3,798 (5.2%) | 4,093 (5.0%) |
| 75 Years and over | 4,145 (9.8%) | 6,497 (10.6%) |
Disability Class: Cognitive Difficulty
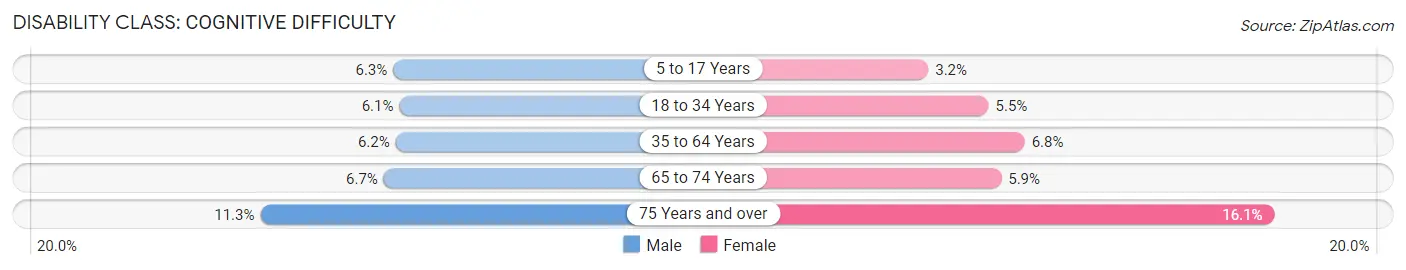
| Age Bracket | Male | Female |
| 5 to 17 Years | 7,585 (6.3%) | 3,723 (3.2%) |
| 18 to 34 Years | 9,596 (6.1%) | 8,596 (5.4%) |
| 35 to 64 Years | 17,309 (6.2%) | 19,511 (6.8%) |
| 65 to 74 Years | 4,852 (6.7%) | 4,886 (5.9%) |
| 75 Years and over | 4,764 (11.3%) | 9,880 (16.1%) |
Disability Class: Ambulatory Difficulty
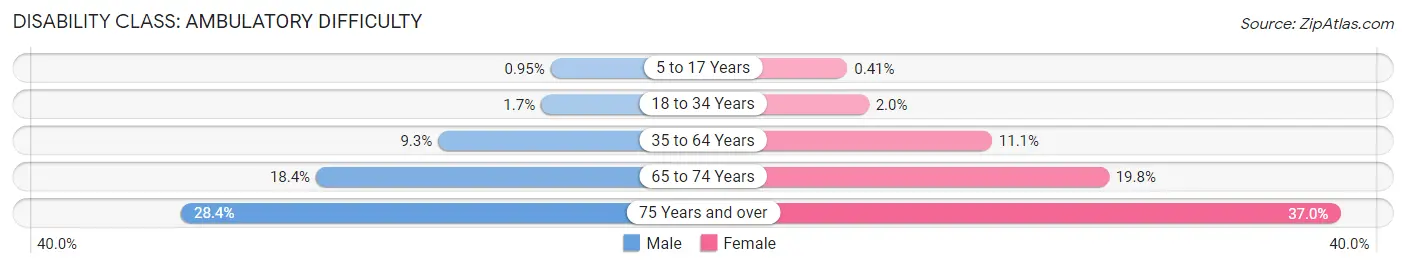
| Age Bracket | Male | Female |
| 5 to 17 Years | 1,141 (0.9%) | 473 (0.4%) |
| 18 to 34 Years | 2,621 (1.7%) | 3,156 (2.0%) |
| 35 to 64 Years | 25,833 (9.3%) | 32,006 (11.1%) |
| 65 to 74 Years | 13,370 (18.4%) | 16,350 (19.8%) |
| 75 Years and over | 12,021 (28.4%) | 22,761 (37.0%) |
Disability Class: Self-Care Difficulty
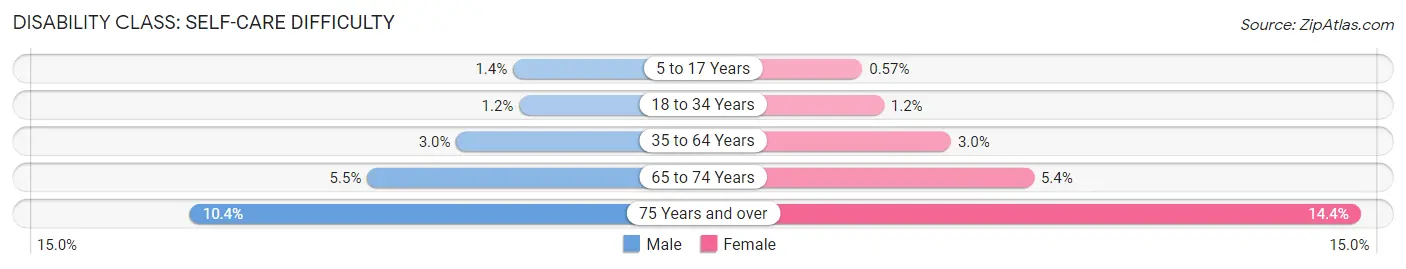
| Age Bracket | Male | Female |
| 5 to 17 Years | 1,676 (1.4%) | 657 (0.6%) |
| 18 to 34 Years | 1,946 (1.2%) | 1,851 (1.2%) |
| 35 to 64 Years | 8,275 (3.0%) | 8,730 (3.0%) |
| 65 to 74 Years | 3,975 (5.5%) | 4,417 (5.3%) |
| 75 Years and over | 4,405 (10.4%) | 8,882 (14.4%) |
Technology Access in Area Code 256
Computing Device Access in Area Code 256
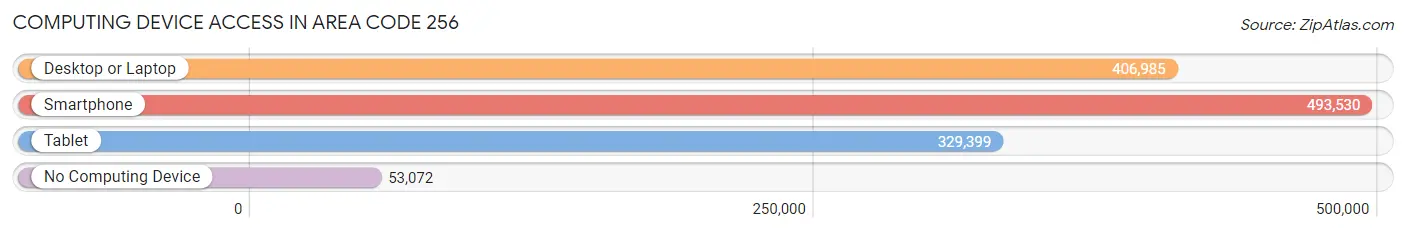
| Device Type | # Households | % Households |
| Desktop or Laptop | 406,985 | 70.1% |
| Smartphone | 493,530 | 85.0% |
| Tablet | 329,399 | 56.7% |
| No Computing Device | 53,072 | 9.1% |
| Total | 580,951 | 100.0% |
Internet Access in Area Code 256
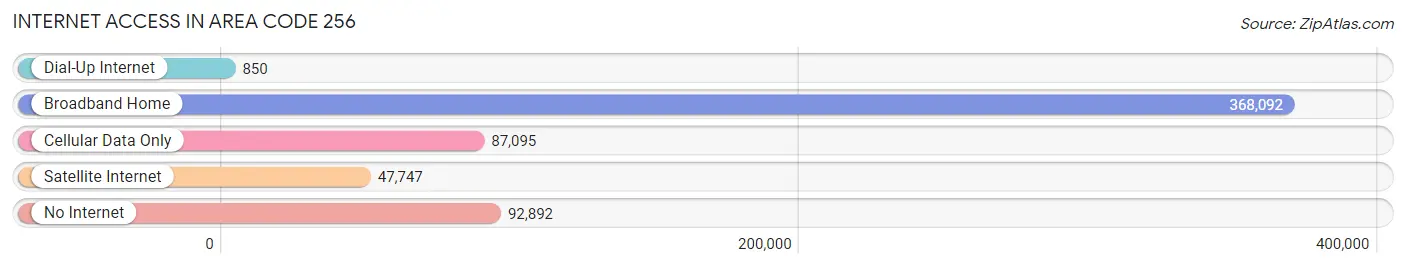
| Internet Type | # Households | % Households |
| Dial-Up Internet | 850 | 0.2% |
| Broadband Home | 368,092 | 63.4% |
| Cellular Data Only | 87,095 | 15.0% |
| Satellite Internet | 47,747 | 8.2% |
| No Internet | 92,892 | 16.0% |
| Total | 580,951 | 100.0% |
Area Code 256 Summary
Geography
Area code 256 is located in the northern part of Alabama, covering the cities of Huntsville, Decatur, Florence, and Gadsden. It also covers parts of the counties of Madison, Jackson, DeKalb, Marshall, and Etowah.
Social
Area code 256 is home to a diverse population of people from all walks of life. The area is known for its vibrant music and art scene, as well as its many outdoor activities. The area is also home to several universities, including the University of Alabama in Huntsville and the University of North Alabama in Florence.
Economics
Area code 256 is home to a thriving economy, with many businesses and industries located in the area. Huntsville is home to the Marshall Space Flight Center, a major NASA research center, and the Redstone Arsenal, a major military installation. The area is also home to several major corporations, such as Toyota, Boeing, and Lockheed Martin.
Demographics
Area code 256 is home to a population of over 1.2 million people. The population is diverse, with a mix of races and ethnicities. The median household income is around $50,000, and the unemployment rate is around 4%. The area is also home to a large number of college students, with over 30,000 enrolled in the area's universities.
Common Questions
What is Per Capita Income in Area Code 256?
Per Capita income in Area Code 256 is $32,058.
What is the Median Family Income in Area Code 256?
Median Family Income in Area Code 256 is $75,488.
What is the Median Household income in Area Code 256?
Median Household Income in Area Code 256 is $59,600.
What is Income or Wage Gap in Area Code 256?
Income or Wage Gap in Area Code 256 is 34.0%.
Women in Area Code 256 earn 66.0 cents for every dollar earned by a man.
What is Family Income Deficit in Area Code 256?
Family Income Deficit in Area Code 256 is $10,298.
Families that are below poverty line in Area Code 256 earn $10,298 less on average than the poverty threshold level.
What is Inequality or Gini Index in Area Code 256?
Inequality or Gini Index in Area Code 256 is 70.22.
What is the Total Population of Area Code 256?
Total Population of Area Code 256 is 1,480,992.
What is the Total Male Population of Area Code 256?
Total Male Population of Area Code 256 is 727,277.
What is the Total Female Population of Area Code 256?
Total Female Population of Area Code 256 is 753,715.
What is the Ratio of Males per 100 Females in Area Code 256?
There are 96.49 Males per 100 Females in Area Code 256.
What is the Ratio of Females per 100 Males in Area Code 256?
There are 103.64 Females per 100 Males in Area Code 256.
What is the Median Population Age in Area Code 256?
Median Population Age in Area Code 256 is 42.3 Years.
What is the Average Family Size in Area Code 256
Average Family Size in Area Code 256 is 3.2 People.
What is the Average Household Size in Area Code 256
Average Household Size in Area Code 256 is 2.6 People.
How Large is the Labor Force in Area Code 256?
There are 660,787 People in the Labor Forcein in Area Code 256.
What is the Percentage of People in the Labor Force in Area Code 256?
55.2% of People are in the Labor Force in Area Code 256.
What is the Unemployment Rate in Area Code 256?
Unemployment Rate in Area Code 256 is 5.2%.