Area Code 410 Map & Demographics
Area Code 410 Map
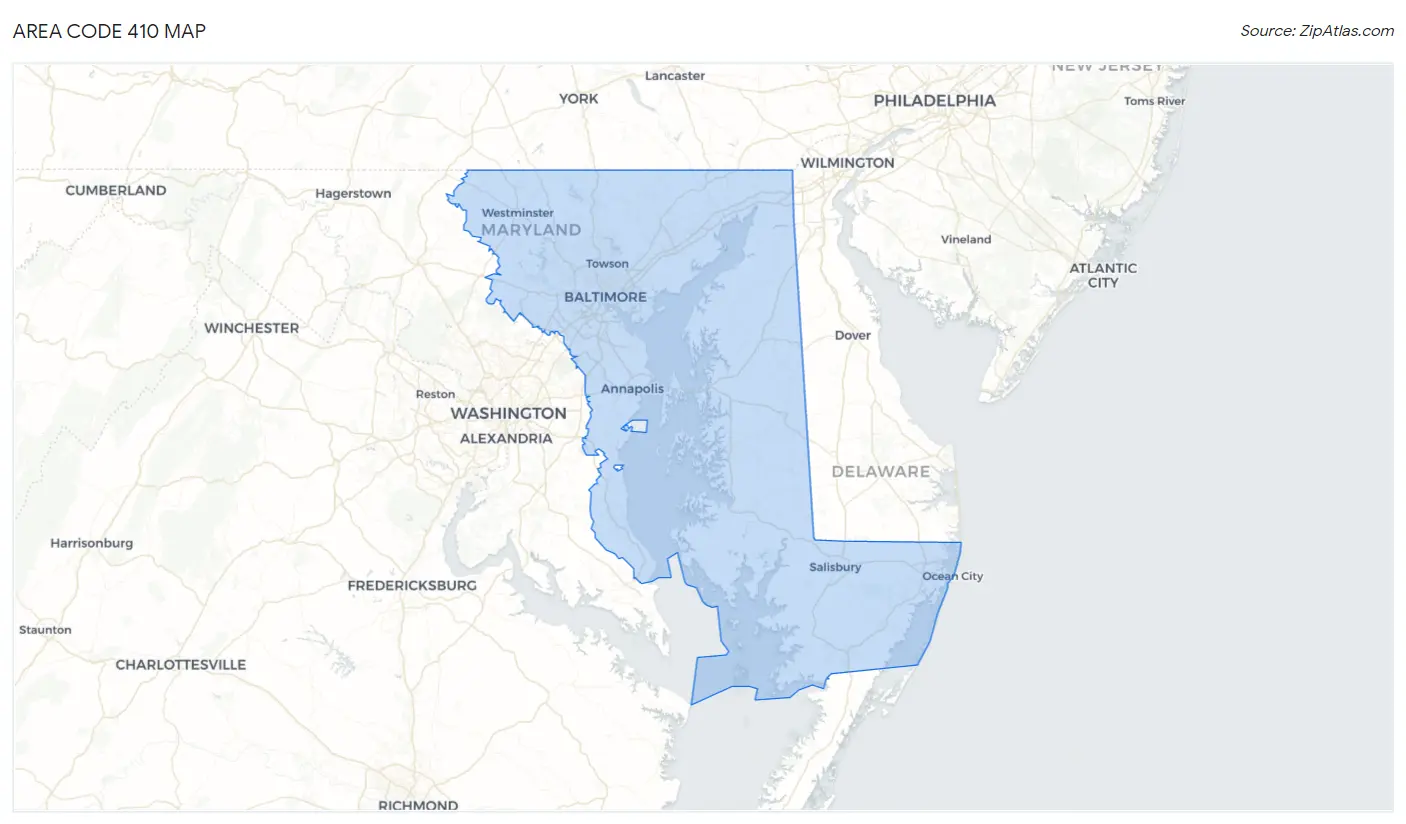
Area Code 410 Overview
$49,621
PER CAPITA INCOME
$118,184
AVG FAMILY INCOME
$99,718
AVG HOUSEHOLD INCOME
27.9%
WAGE / INCOME GAP [ % ]
72.1¢/ $1
WAGE / INCOME GAP [ $ ]
$11,601
FAMILY INCOME DEFICIT
97.86
INEQUALITY / GINI INDEX
3,248,729
TOTAL POPULATION
1,572,394
MALE POPULATION
1,676,335
FEMALE POPULATION
93.80
MALES / 100 FEMALES
106.61
FEMALES / 100 MALES
44.2
MEDIAN AGE
3.0
AVG FAMILY SIZE
2.5
AVG HOUSEHOLD SIZE
1,655,169
LABOR FORCE [ PEOPLE ]
63.1%
PERCENT IN LABOR FORCE
5.4%
UNEMPLOYMENT RATE
Nearby Area Codes
Income in Area Code 410
Income Overview in Area Code 410
Per Capita Income in Area Code 410 is $49,621, while median incomes of families and households are $118,184 and $99,718 respectively.
| Characteristic | Number | Measure |
| Per Capita Income | 3,248,729 | $49,621 |
| Median Family Income | 803,821 | $118,184 |
| Mean Family Income | 803,821 | $34,223,971 |
| Median Household Income | 1,260,286 | $99,718 |
| Mean Household Income | 1,260,286 | $30,005,903 |
| Income Deficit | 803,821 | $11,601 |
| Wage / Income Gap (%) | 3,248,729 | 27.86% |
| Wage / Income Gap ($) | 3,248,729 | 72.14¢ per $1 |
| Gini / Inequality Index | 3,248,729 | 97.86 |
Earnings by Sex in Area Code 410
Average Earnings in Area Code 410 are $55,322, $63,634 for men and $45,961 for women, a difference of 27.8%.
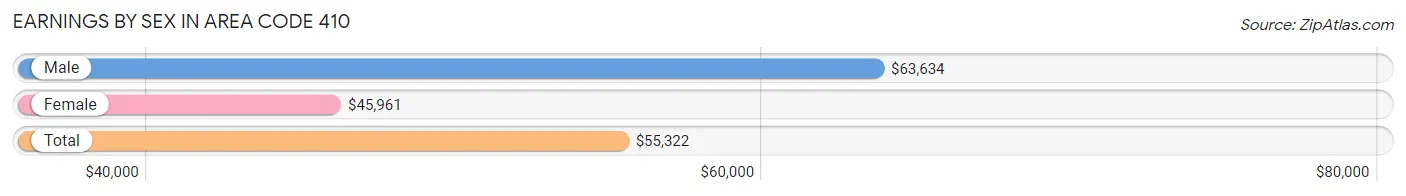
| Sex | Number | Average Earnings |
| Male | 907,836 (50.7%) | $63,634 |
| Female | 883,107 (49.3%) | $45,961 |
| Total | 1,790,943 (100.0%) | $55,322 |
Earnings by Sex by Income Bracket in Area Code 410
The most common earnings brackets in Area Code 410 are $100,000+ for men (238,399 | 26.3%) and $100,000+ for women (131,780 | 14.9%).
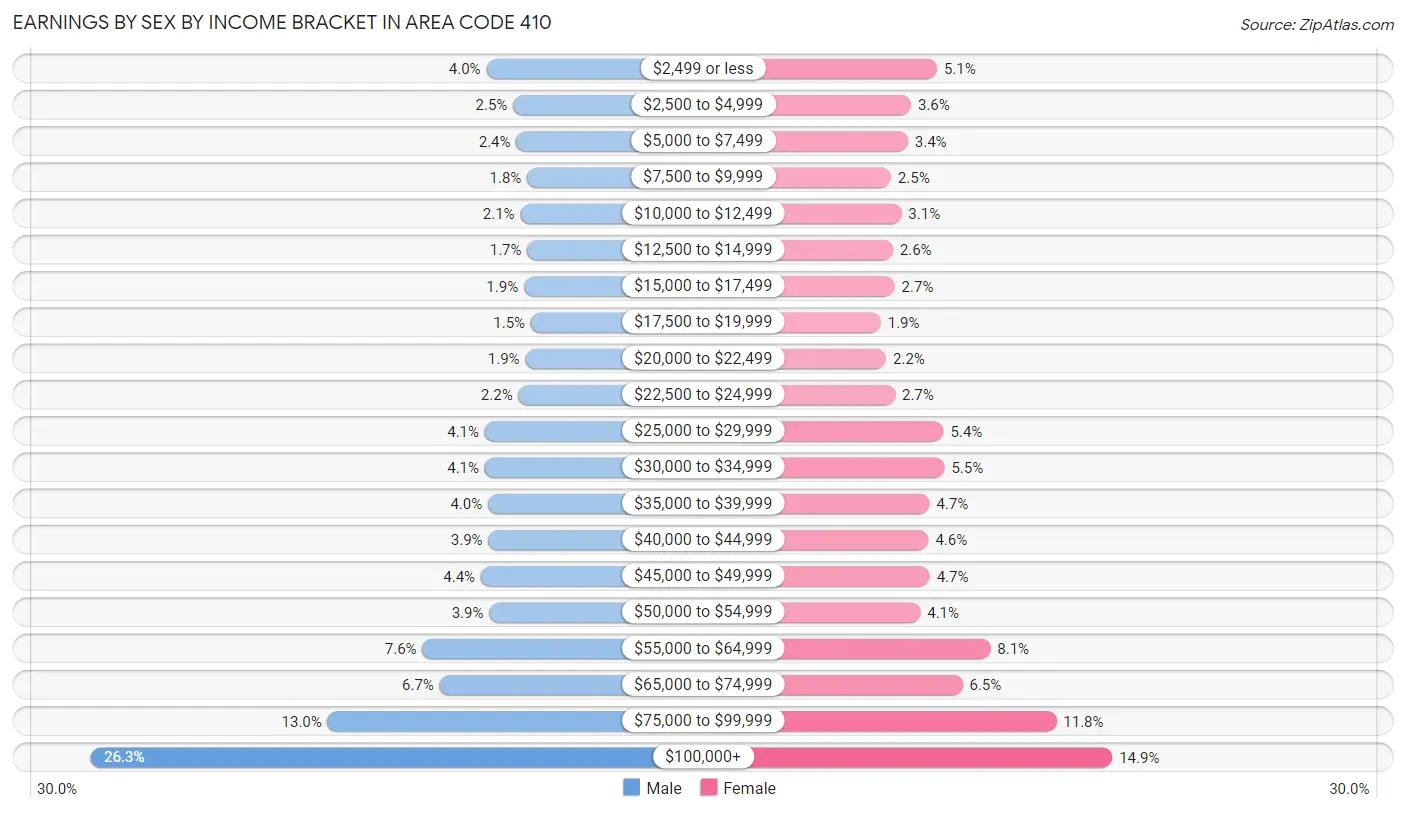
| Income | Male | Female |
| $2,499 or less | 36,677 (4.0%) | 44,812 (5.1%) |
| $2,500 to $4,999 | 23,017 (2.5%) | 31,916 (3.6%) |
| $5,000 to $7,499 | 21,434 (2.4%) | 30,265 (3.4%) |
| $7,500 to $9,999 | 15,851 (1.8%) | 21,884 (2.5%) |
| $10,000 to $12,499 | 19,311 (2.1%) | 27,125 (3.1%) |
| $12,500 to $14,999 | 15,760 (1.7%) | 22,847 (2.6%) |
| $15,000 to $17,499 | 17,495 (1.9%) | 23,725 (2.7%) |
| $17,500 to $19,999 | 13,967 (1.5%) | 16,869 (1.9%) |
| $20,000 to $22,499 | 16,765 (1.8%) | 19,546 (2.2%) |
| $22,500 to $24,999 | 20,377 (2.2%) | 23,970 (2.7%) |
| $25,000 to $29,999 | 37,456 (4.1%) | 48,034 (5.4%) |
| $30,000 to $34,999 | 37,531 (4.1%) | 48,516 (5.5%) |
| $35,000 to $39,999 | 35,840 (4.0%) | 41,049 (4.6%) |
| $40,000 to $44,999 | 35,666 (3.9%) | 40,492 (4.6%) |
| $45,000 to $49,999 | 39,497 (4.3%) | 41,112 (4.7%) |
| $50,000 to $54,999 | 35,219 (3.9%) | 36,496 (4.1%) |
| $55,000 to $64,999 | 69,317 (7.6%) | 71,247 (8.1%) |
| $65,000 to $74,999 | 60,526 (6.7%) | 57,367 (6.5%) |
| $75,000 to $99,999 | 117,731 (13.0%) | 104,055 (11.8%) |
| $100,000+ | 238,399 (26.3%) | 131,780 (14.9%) |
| Total | 907,836 (100.0%) | 883,107 (100.0%) |
Earnings by Sex by Educational Attainment in Area Code 410
Average earnings in Area Code 410 are $15,787,005 for men and $11,422,326 for women, a difference of 27.7%. Men with an educational attainment of graduate degree enjoy the highest average annual earnings of $19,490,812, while those with less than high school education earn the least with $4,951,471. Women with an educational attainment of graduate degree earn the most with the average annual earnings of $14,508,056, while those with less than high school education have the smallest earnings of $2,409,643.
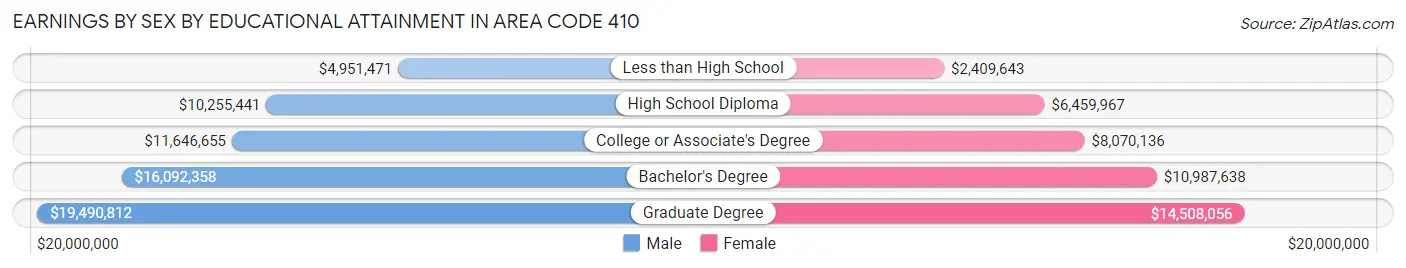
| Educational Attainment | Male Income | Female Income |
| Less than High School | $4,951,471 | $2,409,643 |
| High School Diploma | $10,255,441 | $6,459,967 |
| College or Associate's Degree | $11,646,655 | $8,070,136 |
| Bachelor's Degree | $16,092,358 | $10,987,638 |
| Graduate Degree | $19,490,812 | $14,508,056 |
| Total | $15,787,005 | $11,422,326 |
Family Income in Area Code 410
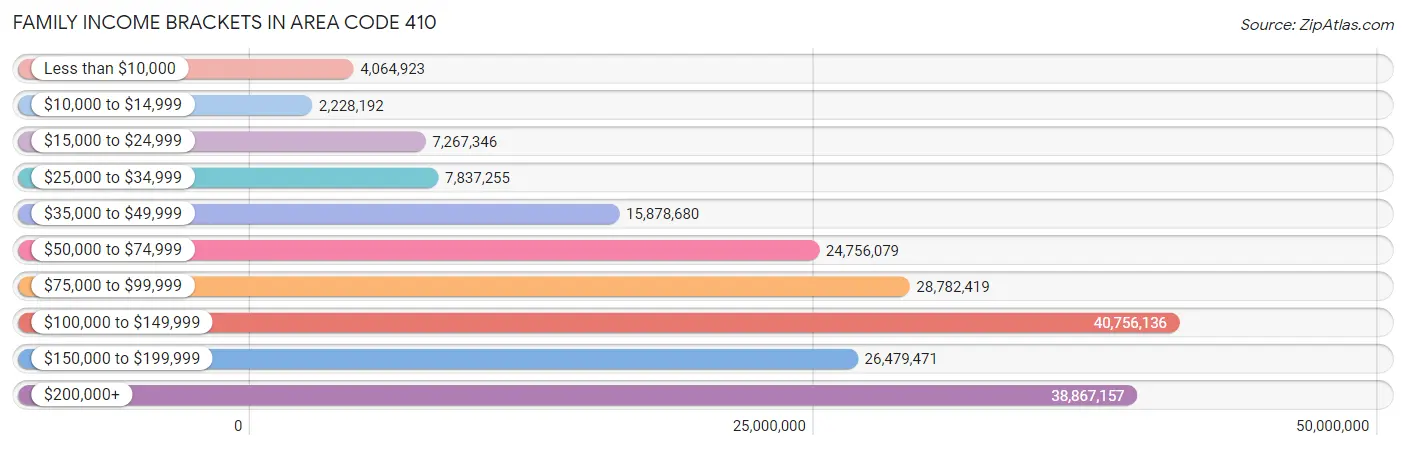
Family Income Brackets in Area Code 410
According to the Area Code 410 family income data, there are 40,756,136 families falling into the $100,000 to $149,999 income range, which is the most common income bracket and makes up 5,070.3% of all families. Conversely, the $10,000 to $14,999 income bracket is the least frequent group with only 2,228,192 families (277.2%) belonging to this category.
| Income Bracket | # Families | % Families |
| Less than $10,000 | 4,064,923 | 505.7% |
| $10,000 to $14,999 | 2,228,192 | 277.2% |
| $15,000 to $24,999 | 7,267,346 | 904.1% |
| $25,000 to $34,999 | 7,837,255 | 975.0% |
| $35,000 to $49,999 | 15,878,680 | 1,975.4% |
| $50,000 to $74,999 | 24,756,079 | 3,079.8% |
| $75,000 to $99,999 | 28,782,419 | 3,580.7% |
| $100,000 to $149,999 | 40,756,136 | 5,070.3% |
| $150,000 to $199,999 | 26,479,471 | 3,294.2% |
| $200,000+ | 38,867,157 | 4,835.3% |
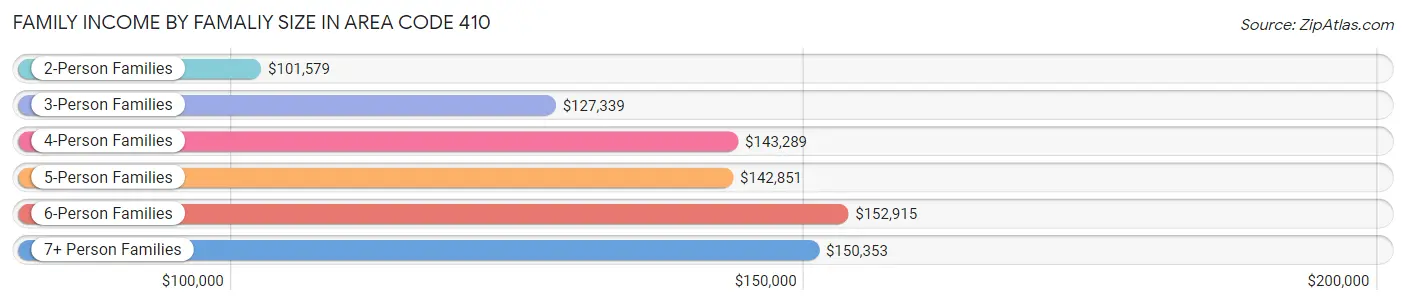
Family Income by Famaliy Size in Area Code 410
6-person families (22,294 | 2.8%) account for the highest median family income in Area Code 410 with $152,915 per family, while 2-person families (371,946 | 46.3%) have the highest median income of $50,789 per family member.
| Income Bracket | # Families | Median Income |
| 2-Person Families | 371,946 (46.3%) | $101,578 |
| 3-Person Families | 188,595 (23.5%) | $127,339 |
| 4-Person Families | 145,857 (18.1%) | $143,289 |
| 5-Person Families | 62,148 (7.7%) | $142,851 |
| 6-Person Families | 22,294 (2.8%) | $152,915 |
| 7+ Person Families | 12,981 (1.6%) | $150,353 |
| Total | 803,821 (100.0%) | $118,184 |
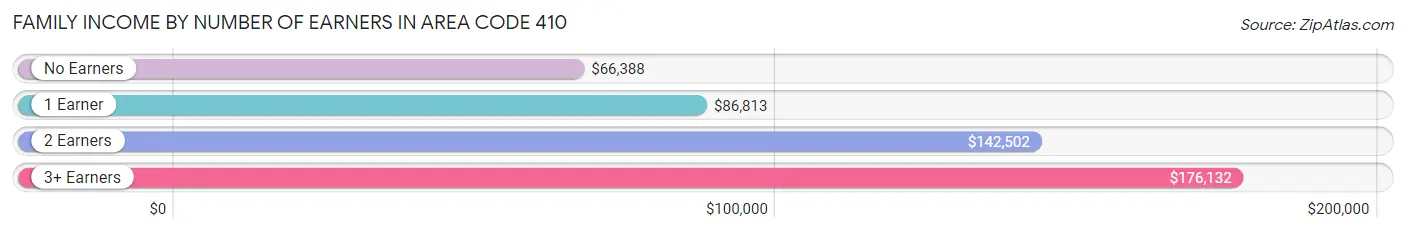
Family Income by Number of Earners in Area Code 410
The median family income in Area Code 410 is $118,184, with families comprising 3+ earners (102,629) having the highest median family income of $176,132, while families with no earners (101,256) have the lowest median family income of $66,388, accounting for 12.8% and 12.6% of families, respectively.
| Number of Earners | # Families | Median Income |
| No Earners | 101,256 (12.6%) | $66,388 |
| 1 Earner | 249,690 (31.1%) | $86,813 |
| 2 Earners | 350,246 (43.6%) | $142,502 |
| 3+ Earners | 102,629 (12.8%) | $176,132 |
| Total | 803,821 (100.0%) | $118,184 |
Household Income in Area Code 410
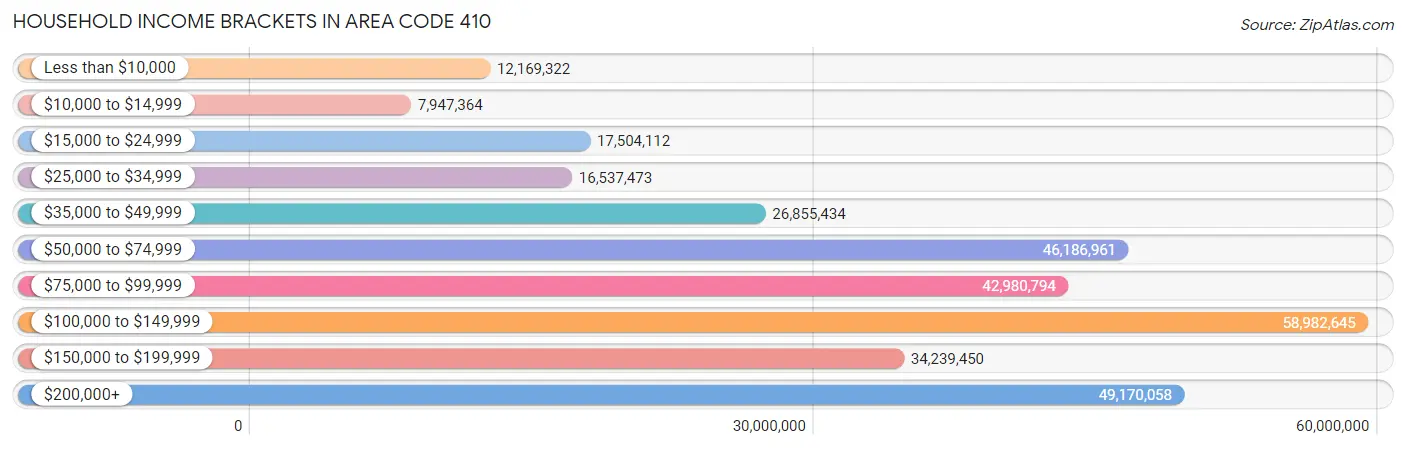
Household Income Brackets in Area Code 410
With 58,982,645 households falling in the category, the $100,000 to $149,999 income range is the most frequent in Area Code 410, accounting for 4,680.1% of all households. In contrast, only 7,947,364 households (630.6%) fall into the $10,000 to $14,999 income bracket, making it the least populous group.
| Income Bracket | # Households | % Households |
| Less than $10,000 | 12,169,322 | 965.6% |
| $10,000 to $14,999 | 7,947,364 | 630.6% |
| $15,000 to $24,999 | 17,504,112 | 1,388.9% |
| $25,000 to $34,999 | 16,537,473 | 1,312.2% |
| $35,000 to $49,999 | 26,855,434 | 2,130.9% |
| $50,000 to $74,999 | 46,186,961 | 3,664.8% |
| $75,000 to $99,999 | 42,980,794 | 3,410.4% |
| $100,000 to $149,999 | 58,982,645 | 4,680.1% |
| $150,000 to $199,999 | 34,239,450 | 2,716.8% |
| $200,000+ | 49,170,058 | 3,901.5% |
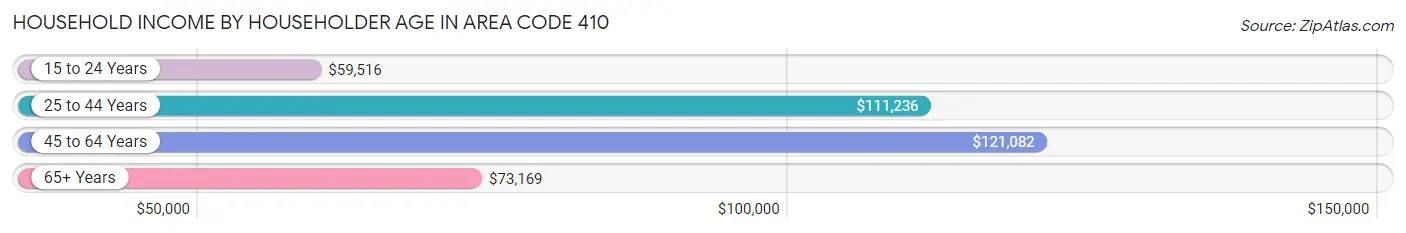
Household Income by Householder Age in Area Code 410
The median household income in Area Code 410 is $99,718, with the highest median household income of $121,082 found in the 45 to 64 years age bracket for the primary householder. A total of 478,031 households (37.9%) fall into this category. Meanwhile, the 15 to 24 years age bracket for the primary householder has the lowest median household income of $59,516, with 34,756 households (2.8%) in this group.
| Income Bracket | # Households | Median Income |
| 15 to 24 Years | 34,756 (2.8%) | $59,516 |
| 25 to 44 Years | 412,681 (32.8%) | $111,236 |
| 45 to 64 Years | 478,031 (37.9%) | $121,082 |
| 65+ Years | 334,818 (26.6%) | $73,169 |
| Total | 1,260,286 (100.0%) | $99,718 |
Poverty in Area Code 410
Income Below Poverty by Sex and Age in Area Code 410
With 9.2% poverty level for males and 11.4% for females among the residents of Area Code 410, 5 year old males and 18 to 24 year old females are the most vulnerable to poverty, with 3,078 males (16.6%) and 21,255 females (16.8%) in their respective age groups living below the poverty level.
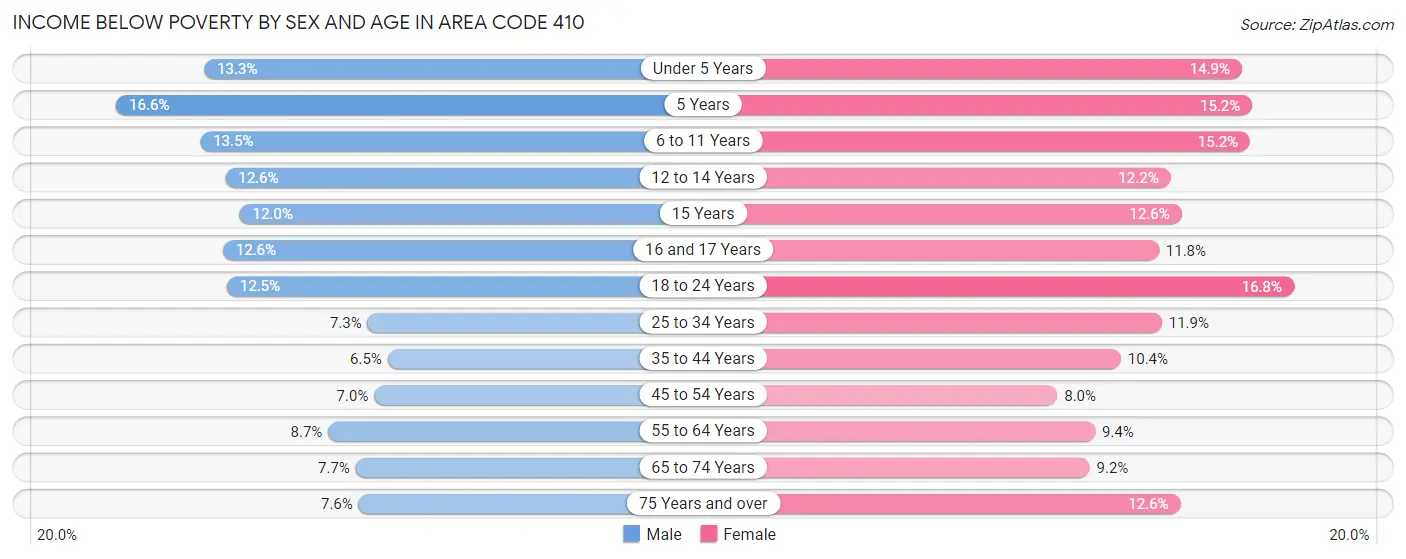
| Age Bracket | Male | Female |
| Under 5 Years | 12,485 (13.3%) | 13,395 (14.8%) |
| 5 Years | 3,078 (16.6%) | 2,807 (15.2%) |
| 6 to 11 Years | 16,114 (13.5%) | 17,078 (15.1%) |
| 12 to 14 Years | 7,788 (12.6%) | 7,396 (12.2%) |
| 15 Years | 2,399 (12.0%) | 2,592 (12.6%) |
| 16 and 17 Years | 5,244 (12.6%) | 4,551 (11.8%) |
| 18 to 24 Years | 16,062 (12.5%) | 21,255 (16.8%) |
| 25 to 34 Years | 15,764 (7.3%) | 27,120 (11.9%) |
| 35 to 44 Years | 13,097 (6.5%) | 22,369 (10.4%) |
| 45 to 54 Years | 13,714 (7.0%) | 16,633 (8.0%) |
| 55 to 64 Years | 18,210 (8.7%) | 21,433 (9.4%) |
| 65 to 74 Years | 10,898 (7.7%) | 15,457 (9.2%) |
| 75 Years and over | 6,514 (7.6%) | 15,928 (12.6%) |
| Total | 141,367 (9.2%) | 188,014 (11.4%) |
Income Above Poverty by Sex and Age in Area Code 410
According to the poverty statistics in Area Code 410, males aged 35 to 44 years and females aged 45 to 54 years are the age groups that are most secure financially, with 93.5% of males and 92.0% of females in these age groups living above the poverty line.
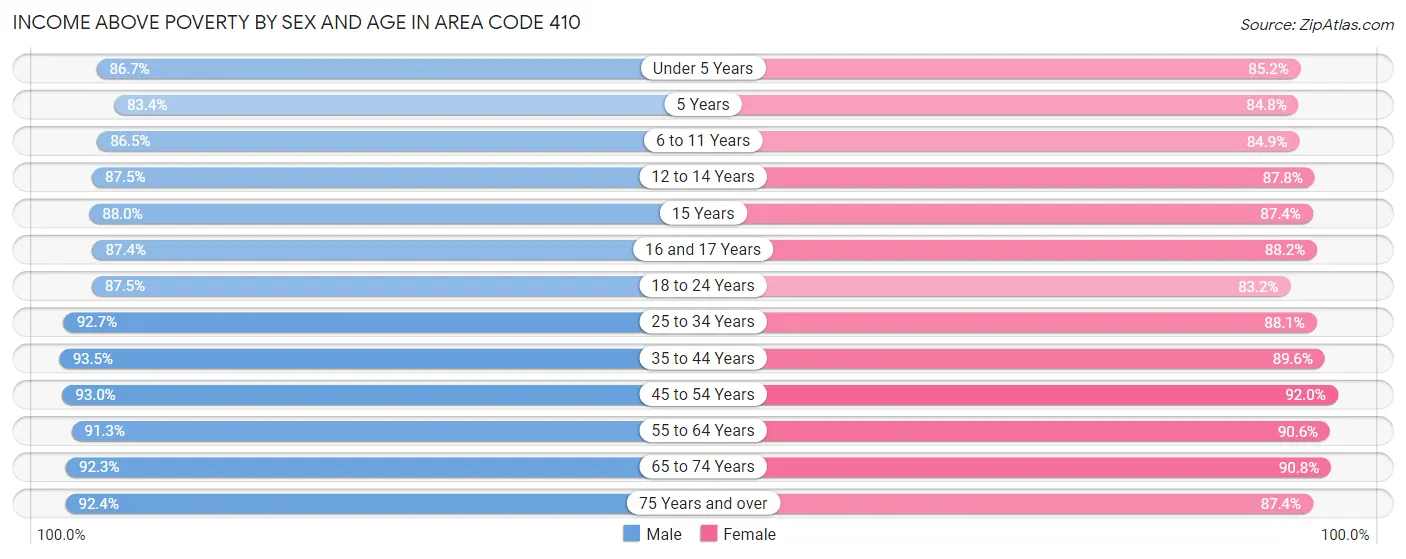
| Age Bracket | Male | Female |
| Under 5 Years | 81,105 (86.7%) | 76,788 (85.2%) |
| 5 Years | 15,465 (83.4%) | 15,624 (84.8%) |
| 6 to 11 Years | 103,444 (86.5%) | 95,626 (84.9%) |
| 12 to 14 Years | 54,254 (87.5%) | 53,250 (87.8%) |
| 15 Years | 17,561 (88.0%) | 17,960 (87.4%) |
| 16 and 17 Years | 36,246 (87.4%) | 34,111 (88.2%) |
| 18 to 24 Years | 112,570 (87.5%) | 105,428 (83.2%) |
| 25 to 34 Years | 201,155 (92.7%) | 201,216 (88.1%) |
| 35 to 44 Years | 187,830 (93.5%) | 193,465 (89.6%) |
| 45 to 54 Years | 181,744 (93.0%) | 191,341 (92.0%) |
| 55 to 64 Years | 190,297 (91.3%) | 206,637 (90.6%) |
| 65 to 74 Years | 130,501 (92.3%) | 152,645 (90.8%) |
| 75 Years and over | 79,165 (92.4%) | 110,752 (87.4%) |
| Total | 1,391,337 (90.8%) | 1,454,843 (88.6%) |
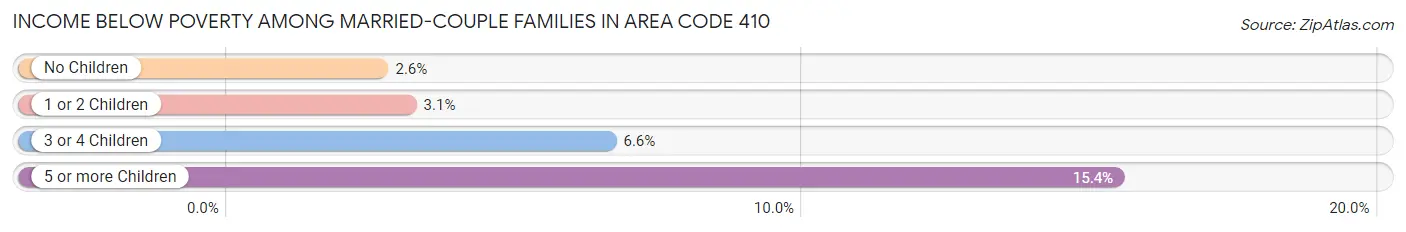
Income Below Poverty Among Married-Couple Families in Area Code 410
The poverty statistics for married-couple families in Area Code 410 show that 3.2% or 18,063 of the total 567,751 families live below the poverty line. Families with 5 or more children have the highest poverty rate of 15.4%, comprising of 630 families. On the other hand, families with no children have the lowest poverty rate of 2.6%, which includes 8,763 families.
| Children | Above Poverty | Below Poverty |
| No Children | 325,357 (97.4%) | 8,763 (2.6%) |
| 1 or 2 Children | 179,875 (96.9%) | 5,779 (3.1%) |
| 3 or 4 Children | 41,006 (93.4%) | 2,891 (6.6%) |
| 5 or more Children | 3,450 (84.6%) | 630 (15.4%) |
| Total | 549,688 (96.8%) | 18,063 (3.2%) |
Income Below Poverty Among Single-Parent Households in Area Code 410
According to the poverty data in Area Code 410, 8.7% or 5,102 single-father households and 18.5% or 32,878 single-mother households are living below the poverty line. Among single-father households, those with 3 or 4 children have the highest poverty rate, with 853 households (21.6%) experiencing poverty. Likewise, among single-mother households, those with 5 or more children have the highest poverty rate, with 843 households (61.3%) falling below the poverty line.
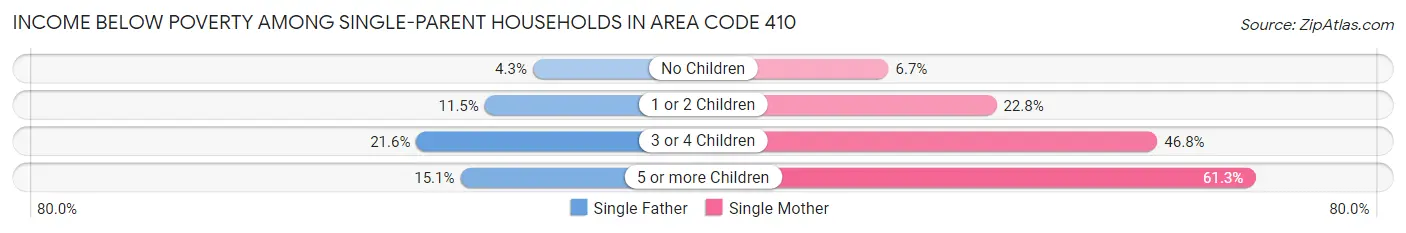
| Children | Single Father | Single Mother |
| No Children | 1,203 (4.3%) | 4,906 (6.7%) |
| 1 or 2 Children | 3,008 (11.5%) | 19,891 (22.8%) |
| 3 or 4 Children | 853 (21.6%) | 7,238 (46.8%) |
| 5 or more Children | 38 (15.1%) | 843 (61.3%) |
| Total | 5,102 (8.7%) | 32,878 (18.5%) |
Income Below Poverty Among Married-Couple vs Single-Parent Households in Area Code 410
The poverty data for Area Code 410 shows that 18,063 of the married-couple family households (3.2%) and 37,980 of the single-parent households (16.1%) are living below the poverty level. Within the married-couple family households, those with 5 or more children have the highest poverty rate, with 630 households (15.4%) falling below the poverty line. Among the single-parent households, those with 5 or more children have the highest poverty rate, with 881 household (54.1%) living below poverty.
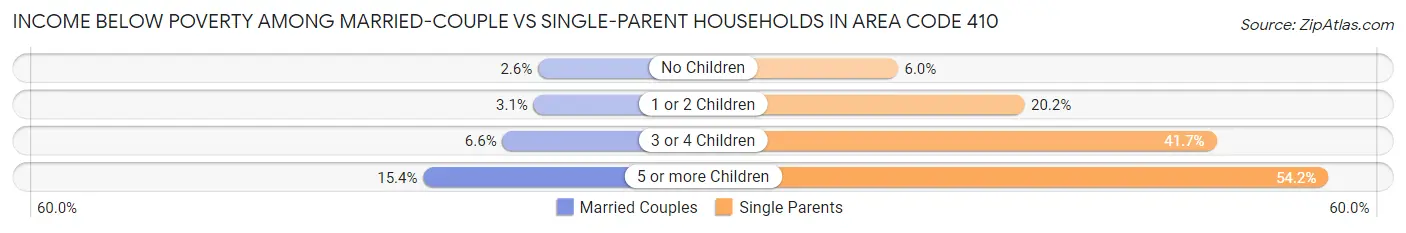
| Children | Married-Couple Families | Single-Parent Households |
| No Children | 8,763 (2.6%) | 6,109 (6.0%) |
| 1 or 2 Children | 5,779 (3.1%) | 22,899 (20.2%) |
| 3 or 4 Children | 2,891 (6.6%) | 8,091 (41.6%) |
| 5 or more Children | 630 (15.4%) | 881 (54.1%) |
| Total | 18,063 (3.2%) | 37,980 (16.1%) |
Race in Area Code 410
The most populous races in Area Code 410 are White / Caucasian (1,854,240 | 57.1%), Black / African American (935,967 | 28.8%), and Hispanic or Latino (221,776 | 6.8%).
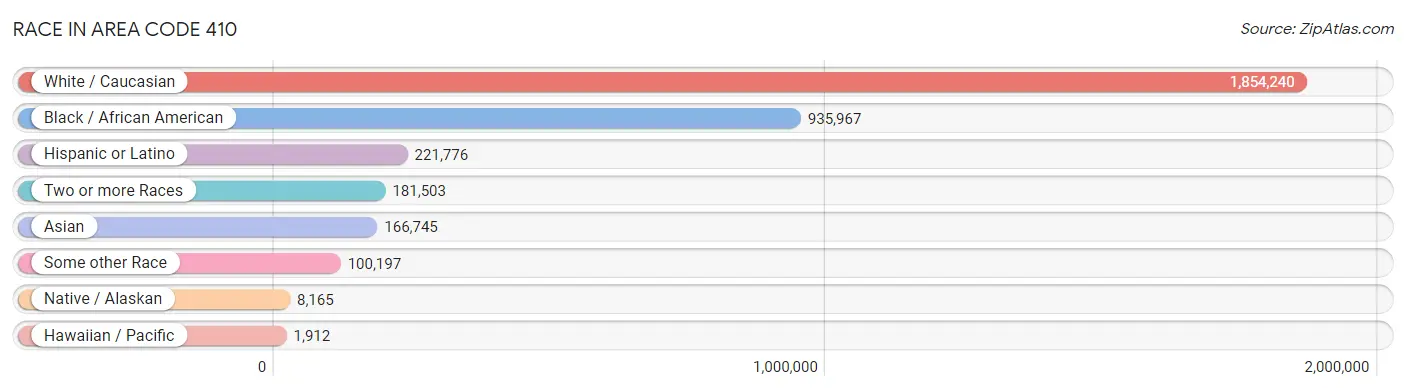
| Race | # Population | % Population |
| Asian | 166,745 | 5.1% |
| Black / African American | 935,967 | 28.8% |
| Hawaiian / Pacific | 1,912 | 0.1% |
| Hispanic or Latino | 221,776 | 6.8% |
| Native / Alaskan | 8,165 | 0.3% |
| White / Caucasian | 1,854,240 | 57.1% |
| Two or more Races | 181,503 | 5.6% |
| Some other Race | 100,197 | 3.1% |
| Total | 3,248,729 | 100.0% |
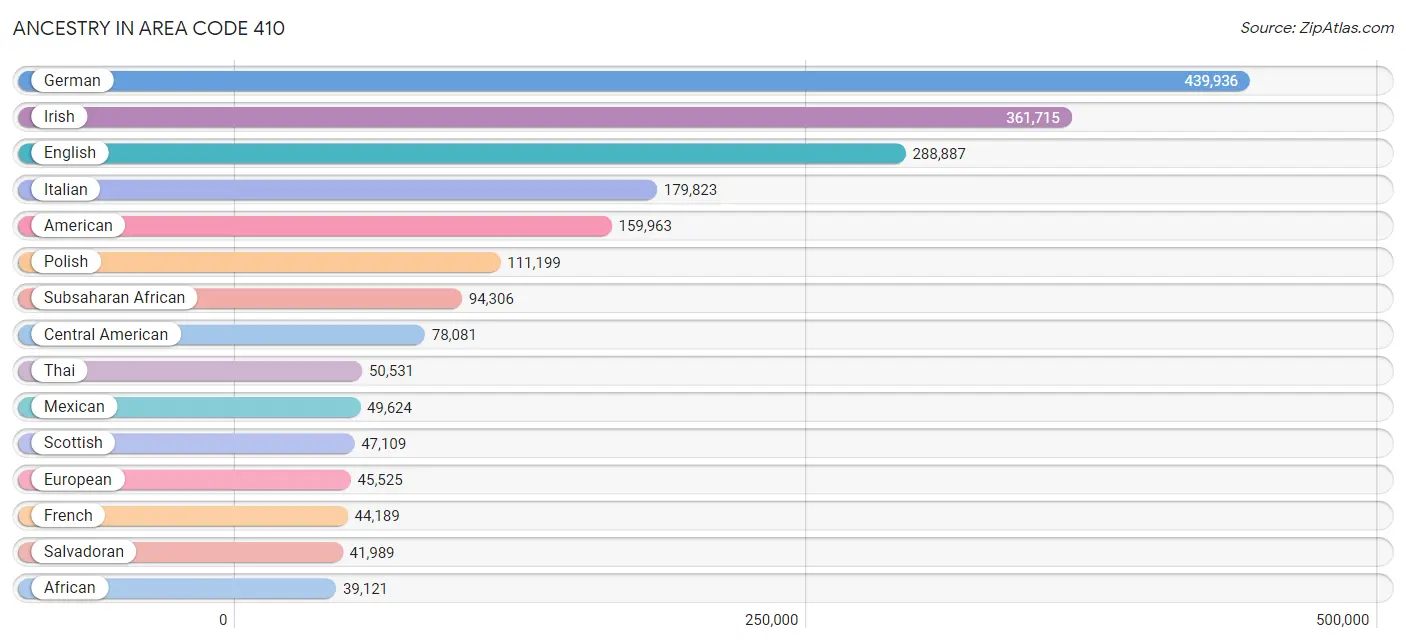
Ancestry in Area Code 410
The most populous ancestries reported in Area Code 410 are German (439,936 | 13.5%), Irish (361,715 | 11.1%), English (288,887 | 8.9%), Italian (179,823 | 5.5%), and American (159,963 | 4.9%), together accounting for 44.0% of all Area Code 410 residents.
| Ancestry | # Population | % Population |
| Afghan | 1,312 | 0.0% |
| African | 39,121 | 1.2% |
| Alaska Native | 45 | 0.0% |
| Albanian | 769 | 0.0% |
| Alsatian | 58 | 0.0% |
| American | 159,963 | 4.9% |
| Apache | 358 | 0.0% |
| Arab | 17,495 | 0.5% |
| Arapaho | 51 | 0.0% |
| Argentinean | 2,203 | 0.1% |
| Armenian | 1,371 | 0.0% |
| Assyrian / Chaldean / Syriac | 42 | 0.0% |
| Australian | 671 | 0.0% |
| Austrian | 6,652 | 0.2% |
| Bahamian | 288 | 0.0% |
| Bangladeshi | 58 | 0.0% |
| Barbadian | 1,288 | 0.0% |
| Basque | 196 | 0.0% |
| Belgian | 1,444 | 0.0% |
| Belizean | 94 | 0.0% |
| Bermudan | 145 | 0.0% |
| Bhutanese | 8,485 | 0.3% |
| Blackfeet | 1,759 | 0.1% |
| Bolivian | 1,085 | 0.0% |
| Brazilian | 3,549 | 0.1% |
| British | 20,004 | 0.6% |
| British West Indian | 1,943 | 0.1% |
| Bulgarian | 780 | 0.0% |
| Burmese | 27,641 | 0.9% |
| Cajun | 319 | 0.0% |
| Cambodian | 351 | 0.0% |
| Canadian | 3,207 | 0.1% |
| Cape Verdean | 639 | 0.0% |
| Carpatho Rusyn | 71 | 0.0% |
| Celtic | 445 | 0.0% |
| Central American | 78,081 | 2.4% |
| Central American Indian | 3,175 | 0.1% |
| Cherokee | 7,859 | 0.2% |
| Cheyenne | 84 | 0.0% |
| Chickasaw | 96 | 0.0% |
| Chilean | 1,291 | 0.0% |
| Chinese | 91 | 0.0% |
| Chippewa | 131 | 0.0% |
| Choctaw | 575 | 0.0% |
| Colombian | 6,082 | 0.2% |
| Colville | 18 | 0.0% |
| Comanche | 64 | 0.0% |
| Costa Rican | 1,312 | 0.0% |
| Cree | 99 | 0.0% |
| Creek | 394 | 0.0% |
| Croatian | 1,734 | 0.1% |
| Crow | 3 | 0.0% |
| Cuban | 7,831 | 0.2% |
| Cypriot | 75 | 0.0% |
| Czech | 10,789 | 0.3% |
| Czechoslovakian | 3,152 | 0.1% |
| Danish | 4,872 | 0.2% |
| Delaware | 53 | 0.0% |
| Dominican | 10,746 | 0.3% |
| Dutch | 18,893 | 0.6% |
| Dutch West Indian | 65 | 0.0% |
| Eastern European | 15,472 | 0.5% |
| Ecuadorian | 3,984 | 0.1% |
| Egyptian | 3,496 | 0.1% |
| English | 288,887 | 8.9% |
| Estonian | 751 | 0.0% |
| Ethiopian | 7,470 | 0.2% |
| European | 45,525 | 1.4% |
| Fijian | 15 | 0.0% |
| Filipino | 1,930 | 0.1% |
| Finnish | 3,148 | 0.1% |
| French | 44,189 | 1.4% |
| French American Indian | 152 | 0.0% |
| French Canadian | 8,270 | 0.3% |
| German | 439,936 | 13.5% |
| German Russian | 507 | 0.0% |
| Ghanaian | 5,418 | 0.2% |
| Greek | 18,596 | 0.6% |
| Guamanian / Chamorro | 673 | 0.0% |
| Guatemalan | 17,859 | 0.5% |
| Guyanese | 2,639 | 0.1% |
| Haitian | 8,066 | 0.3% |
| Hmong | 51 | 0.0% |
| Honduran | 11,838 | 0.4% |
| Hopi | 25 | 0.0% |
| Houma | 24 | 0.0% |
| Hungarian | 10,940 | 0.3% |
| Icelander | 439 | 0.0% |
| Indian (Asian) | 34,740 | 1.1% |
| Indonesian | 3,444 | 0.1% |
| Inupiat | 52 | 0.0% |
| Iranian | 5,625 | 0.2% |
| Iraqi | 552 | 0.0% |
| Irish | 361,715 | 11.1% |
| Iroquois | 509 | 0.0% |
| Israeli | 2,345 | 0.1% |
| Italian | 179,823 | 5.5% |
| Jamaican | 18,426 | 0.6% |
| Japanese | 1,542 | 0.1% |
| Jordanian | 573 | 0.0% |
| Kenyan | 3,512 | 0.1% |
| Kiowa | 23 | 0.0% |
| Korean | 33,335 | 1.0% |
| Laotian | 1,815 | 0.1% |
| Latvian | 1,296 | 0.0% |
| Lebanese | 2,905 | 0.1% |
| Liberian | 1,302 | 0.0% |
| Lithuanian | 9,979 | 0.3% |
| Lumbee | 1,341 | 0.0% |
| Luxembourger | 32 | 0.0% |
| Macedonian | 144 | 0.0% |
| Malaysian | 556 | 0.0% |
| Maltese | 324 | 0.0% |
| Mexican | 49,624 | 1.5% |
| Mexican American Indian | 879 | 0.0% |
| Mongolian | 175 | 0.0% |
| Moroccan | 1,097 | 0.0% |
| Native Hawaiian | 2,874 | 0.1% |
| Navajo | 523 | 0.0% |
| New Zealander | 129 | 0.0% |
| Nicaraguan | 2,071 | 0.1% |
| Nigerian | 25,549 | 0.8% |
| Northern European | 3,734 | 0.1% |
| Norwegian | 14,535 | 0.4% |
| Okinawan | 115 | 0.0% |
| Osage | 28 | 0.0% |
| Ottawa | 46 | 0.0% |
| Paiute | 6 | 0.0% |
| Pakistani | 3,295 | 0.1% |
| Palestinian | 1,551 | 0.1% |
| Panamanian | 2,875 | 0.1% |
| Paraguayan | 333 | 0.0% |
| Pennsylvania German | 1,635 | 0.1% |
| Peruvian | 6,292 | 0.2% |
| Polish | 111,199 | 3.4% |
| Portuguese | 5,092 | 0.2% |
| Potawatomi | 32 | 0.0% |
| Pueblo | 91 | 0.0% |
| Puerto Rican | 32,703 | 1.0% |
| Puget Sound Salish | 64 | 0.0% |
| Romanian | 3,008 | 0.1% |
| Russian | 29,075 | 0.9% |
| Salvadoran | 41,989 | 1.3% |
| Samoan | 491 | 0.0% |
| Scandinavian | 6,589 | 0.2% |
| Scotch-Irish | 21,780 | 0.7% |
| Scottish | 47,109 | 1.5% |
| Seminole | 182 | 0.0% |
| Senegalese | 318 | 0.0% |
| Serbian | 955 | 0.0% |
| Shoshone | 23 | 0.0% |
| Sierra Leonean | 1,595 | 0.1% |
| Sioux | 682 | 0.0% |
| Slavic | 1,206 | 0.0% |
| Slovak | 6,815 | 0.2% |
| Slovene | 974 | 0.0% |
| Somali | 97 | 0.0% |
| South African | 855 | 0.0% |
| South American | 24,394 | 0.7% |
| South American Indian | 964 | 0.0% |
| Soviet Union | 68 | 0.0% |
| Spaniard | 4,477 | 0.1% |
| Spanish | 5,250 | 0.2% |
| Spanish American | 100 | 0.0% |
| Sri Lankan | 12,660 | 0.4% |
| Subsaharan African | 94,306 | 2.9% |
| Sudanese | 1,379 | 0.0% |
| Swedish | 16,382 | 0.5% |
| Swiss | 5,275 | 0.2% |
| Syrian | 2,242 | 0.1% |
| Taiwanese | 18 | 0.0% |
| Thai | 50,531 | 1.6% |
| Tlingit-Haida | 5 | 0.0% |
| Tongan | 39 | 0.0% |
| Trinidadian and Tobagonian | 6,523 | 0.2% |
| Turkish | 3,170 | 0.1% |
| U.S. Virgin Islander | 249 | 0.0% |
| Ugandan | 302 | 0.0% |
| Ukrainian | 11,605 | 0.4% |
| Uruguayan | 279 | 0.0% |
| Venezuelan | 2,382 | 0.1% |
| Vietnamese | 2,613 | 0.1% |
| Welsh | 19,036 | 0.6% |
| West Indian | 4,623 | 0.1% |
| Yaqui | 66 | 0.0% |
| Yugoslavian | 700 | 0.0% |
| Yuman | 139 | 0.0% |
| Zimbabwean | 327 | 0.0% | View All 188 Rows |
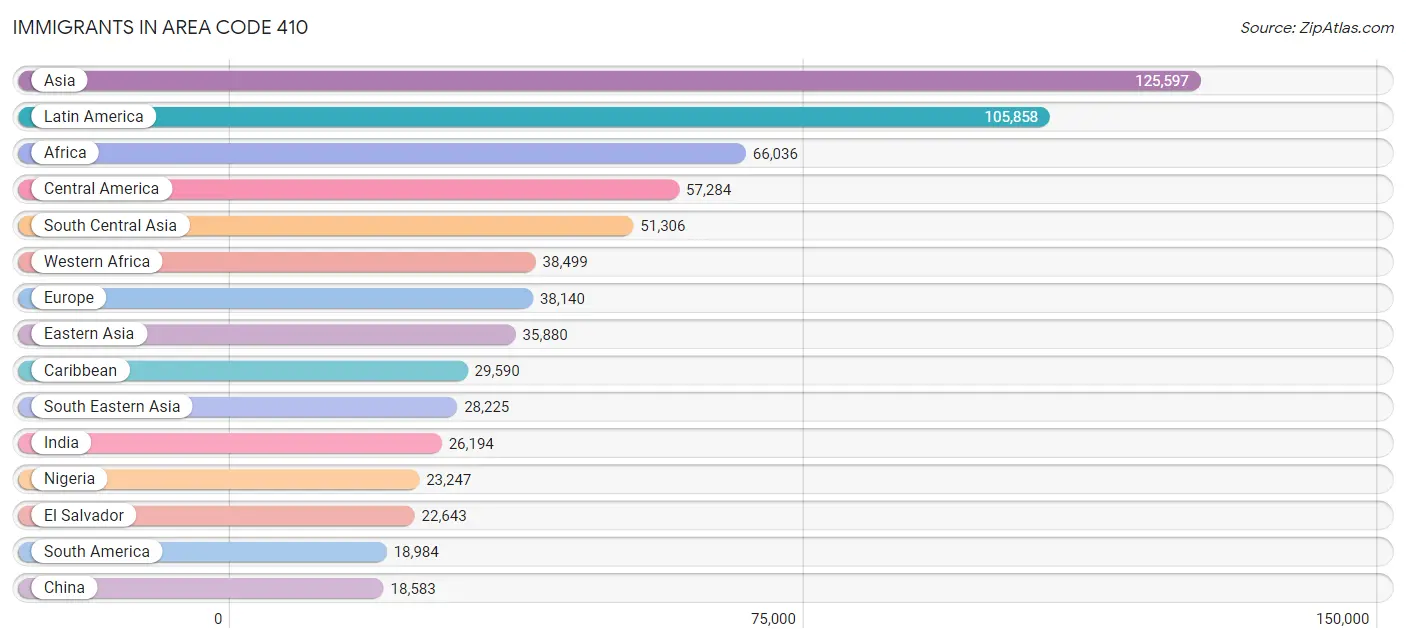
Immigrants in Area Code 410
The most numerous immigrant groups reported in Area Code 410 came from Asia (125,597 | 3.9%), Latin America (105,858 | 3.3%), Africa (66,036 | 2.0%), Central America (57,284 | 1.8%), and South Central Asia (51,306 | 1.6%), together accounting for 12.5% of all Area Code 410 residents.
| Immigration Origin | # Population | % Population |
| Afghanistan | 1,183 | 0.0% |
| Africa | 66,036 | 2.0% |
| Albania | 267 | 0.0% |
| Argentina | 1,642 | 0.1% |
| Armenia | 101 | 0.0% |
| Asia | 125,597 | 3.9% |
| Australia | 558 | 0.0% |
| Austria | 386 | 0.0% |
| Azores | 58 | 0.0% |
| Bahamas | 293 | 0.0% |
| Bangladesh | 2,540 | 0.1% |
| Barbados | 637 | 0.0% |
| Belarus | 756 | 0.0% |
| Belgium | 482 | 0.0% |
| Belize | 75 | 0.0% |
| Bolivia | 458 | 0.0% |
| Bosnia and Herzegovina | 245 | 0.0% |
| Brazil | 3,591 | 0.1% |
| Bulgaria | 646 | 0.0% |
| Cabo Verde | 77 | 0.0% |
| Cambodia | 513 | 0.0% |
| Cameroon | 5,593 | 0.2% |
| Canada | 4,027 | 0.1% |
| Caribbean | 29,590 | 0.9% |
| Central America | 57,284 | 1.8% |
| Chile | 440 | 0.0% |
| China | 18,583 | 0.6% |
| Colombia | 3,613 | 0.1% |
| Congo | 97 | 0.0% |
| Costa Rica | 457 | 0.0% |
| Croatia | 111 | 0.0% |
| Cuba | 1,456 | 0.0% |
| Czechoslovakia | 758 | 0.0% |
| Denmark | 230 | 0.0% |
| Dominica | 174 | 0.0% |
| Dominican Republic | 4,845 | 0.2% |
| Eastern Africa | 13,398 | 0.4% |
| Eastern Asia | 35,880 | 1.1% |
| Eastern Europe | 16,277 | 0.5% |
| Ecuador | 2,280 | 0.1% |
| Egypt | 2,284 | 0.1% |
| El Salvador | 22,643 | 0.7% |
| England | 2,990 | 0.1% |
| Eritrea | 527 | 0.0% |
| Ethiopia | 5,992 | 0.2% |
| Europe | 38,140 | 1.2% |
| Fiji | 107 | 0.0% |
| France | 864 | 0.0% |
| Germany | 5,673 | 0.2% |
| Ghana | 6,776 | 0.2% |
| Greece | 1,464 | 0.1% |
| Grenada | 439 | 0.0% |
| Guatemala | 10,633 | 0.3% |
| Guyana | 2,064 | 0.1% |
| Haiti | 4,108 | 0.1% |
| Honduras | 7,471 | 0.2% |
| Hong Kong | 1,712 | 0.1% |
| Hungary | 459 | 0.0% |
| India | 26,194 | 0.8% |
| Indonesia | 727 | 0.0% |
| Iran | 3,692 | 0.1% |
| Iraq | 848 | 0.0% |
| Ireland | 1,028 | 0.0% |
| Israel | 1,780 | 0.1% |
| Italy | 2,109 | 0.1% |
| Jamaica | 10,516 | 0.3% |
| Japan | 1,488 | 0.1% |
| Jordan | 707 | 0.0% |
| Kazakhstan | 307 | 0.0% |
| Kenya | 4,585 | 0.1% |
| Korea | 15,680 | 0.5% |
| Kuwait | 274 | 0.0% |
| Laos | 398 | 0.0% |
| Latin America | 105,858 | 3.3% |
| Latvia | 164 | 0.0% |
| Lebanon | 455 | 0.0% |
| Liberia | 2,282 | 0.1% |
| Lithuania | 140 | 0.0% |
| Malaysia | 421 | 0.0% |
| Mexico | 13,872 | 0.4% |
| Middle Africa | 6,541 | 0.2% |
| Moldova | 305 | 0.0% |
| Morocco | 905 | 0.0% |
| Nepal | 6,561 | 0.2% |
| Netherlands | 617 | 0.0% |
| Nicaragua | 1,111 | 0.0% |
| Nigeria | 23,247 | 0.7% |
| North Macedonia | 53 | 0.0% |
| Northern Africa | 4,630 | 0.1% |
| Northern Europe | 8,609 | 0.3% |
| Norway | 183 | 0.0% |
| Oceania | 918 | 0.0% |
| Pakistan | 9,021 | 0.3% |
| Panama | 1,022 | 0.0% |
| Peru | 3,021 | 0.1% |
| Philippines | 15,388 | 0.5% |
| Poland | 2,219 | 0.1% |
| Portugal | 432 | 0.0% |
| Romania | 1,116 | 0.0% |
| Russia | 4,146 | 0.1% |
| Saudi Arabia | 747 | 0.0% |
| Scotland | 422 | 0.0% |
| Senegal | 930 | 0.0% |
| Serbia | 242 | 0.0% |
| Sierra Leone | 2,506 | 0.1% |
| Singapore | 303 | 0.0% |
| Somalia | 80 | 0.0% |
| South Africa | 1,352 | 0.0% |
| South America | 18,984 | 0.6% |
| South Central Asia | 51,306 | 1.6% |
| South Eastern Asia | 28,225 | 0.9% |
| Southern Europe | 4,862 | 0.2% |
| Spain | 809 | 0.0% |
| Sri Lanka | 743 | 0.0% |
| St. Vincent and the Grenadines | 190 | 0.0% |
| Sudan | 1,154 | 0.0% |
| Sweden | 498 | 0.0% |
| Switzerland | 260 | 0.0% |
| Syria | 1,536 | 0.1% |
| Taiwan | 2,475 | 0.1% |
| Thailand | 1,559 | 0.1% |
| Trinidad and Tobago | 5,424 | 0.2% |
| Turkey | 1,928 | 0.1% |
| Uganda | 650 | 0.0% |
| Ukraine | 3,364 | 0.1% |
| Uruguay | 173 | 0.0% |
| Uzbekistan | 699 | 0.0% |
| Venezuela | 1,416 | 0.0% |
| Vietnam | 6,153 | 0.2% |
| West Indies | 453 | 0.0% |
| Western Africa | 38,499 | 1.2% |
| Western Asia | 9,876 | 0.3% |
| Western Europe | 8,381 | 0.3% |
| Yemen | 292 | 0.0% |
| Zaire | 728 | 0.0% |
| Zimbabwe | 434 | 0.0% | View All 136 Rows |
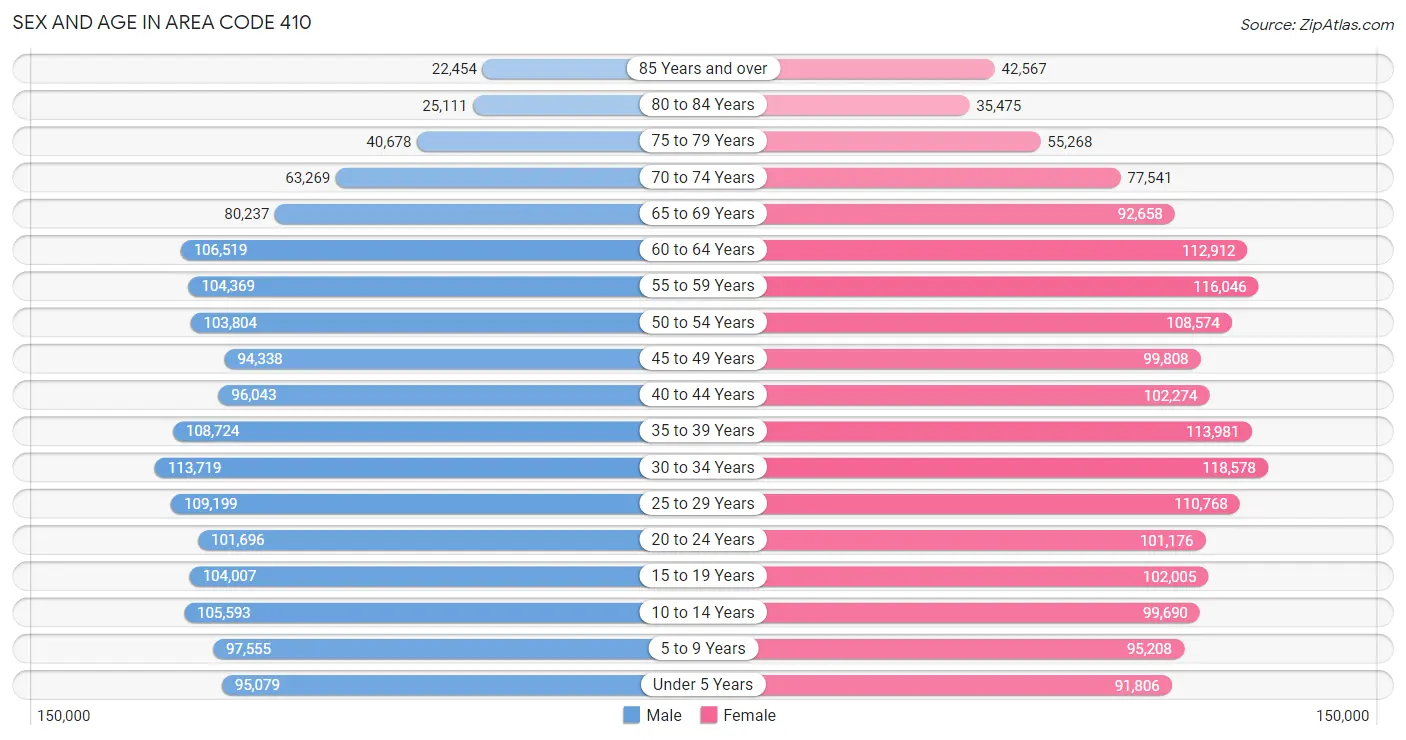
Sex and Age in Area Code 410
Sex and Age in Area Code 410
The most populous age groups in Area Code 410 are 30 to 34 Years (113,719 | 7.2%) for men and 30 to 34 Years (118,578 | 7.1%) for women.
| Age Bracket | Male | Female |
| Under 5 Years | 95,079 (6.0%) | 91,806 (5.5%) |
| 5 to 9 Years | 97,555 (6.2%) | 95,208 (5.7%) |
| 10 to 14 Years | 105,593 (6.7%) | 99,690 (5.9%) |
| 15 to 19 Years | 104,007 (6.6%) | 102,005 (6.1%) |
| 20 to 24 Years | 101,696 (6.5%) | 101,176 (6.0%) |
| 25 to 29 Years | 109,199 (6.9%) | 110,768 (6.6%) |
| 30 to 34 Years | 113,719 (7.2%) | 118,578 (7.1%) |
| 35 to 39 Years | 108,724 (6.9%) | 113,981 (6.8%) |
| 40 to 44 Years | 96,043 (6.1%) | 102,274 (6.1%) |
| 45 to 49 Years | 94,338 (6.0%) | 99,808 (5.9%) |
| 50 to 54 Years | 103,804 (6.6%) | 108,574 (6.5%) |
| 55 to 59 Years | 104,369 (6.6%) | 116,046 (6.9%) |
| 60 to 64 Years | 106,519 (6.8%) | 112,912 (6.7%) |
| 65 to 69 Years | 80,237 (5.1%) | 92,658 (5.5%) |
| 70 to 74 Years | 63,269 (4.0%) | 77,541 (4.6%) |
| 75 to 79 Years | 40,678 (2.6%) | 55,268 (3.3%) |
| 80 to 84 Years | 25,111 (1.6%) | 35,475 (2.1%) |
| 85 Years and over | 22,454 (1.4%) | 42,567 (2.5%) |
| Total | 1,572,394 (100.0%) | 1,676,335 (100.0%) |
Families and Households in Area Code 410
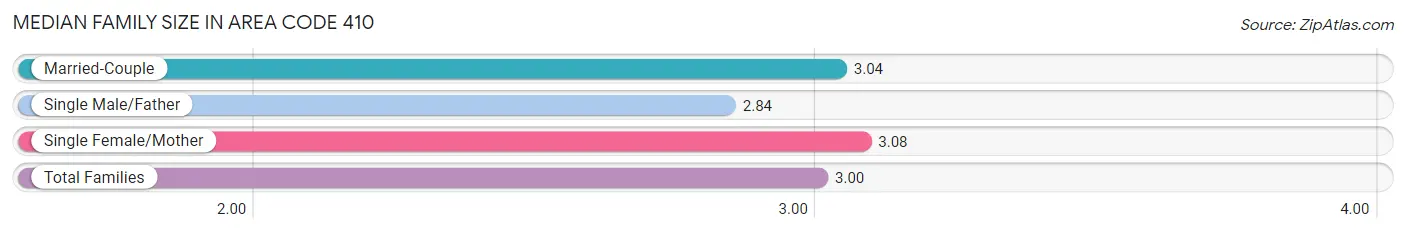
Median Family Size in Area Code 410
The median family size in Area Code 410 is 3.00 persons per family, with single female/mother families (177,536 | 22.1%) accounting for the largest median family size of 3.08061 persons per family. On the other hand, single male/father families (58,534 | 7.3%) represent the smallest median family size with 2.84 persons per family.
| Family Type | # Families | Family Size |
| Married-Couple | 567,751 (70.6%) | 3.04 |
| Single Male/Father | 58,534 (7.3%) | 2.84 |
| Single Female/Mother | 177,536 (22.1%) | 3.08 |
| Total Families | 803,821 (100.0%) | 3.00 |
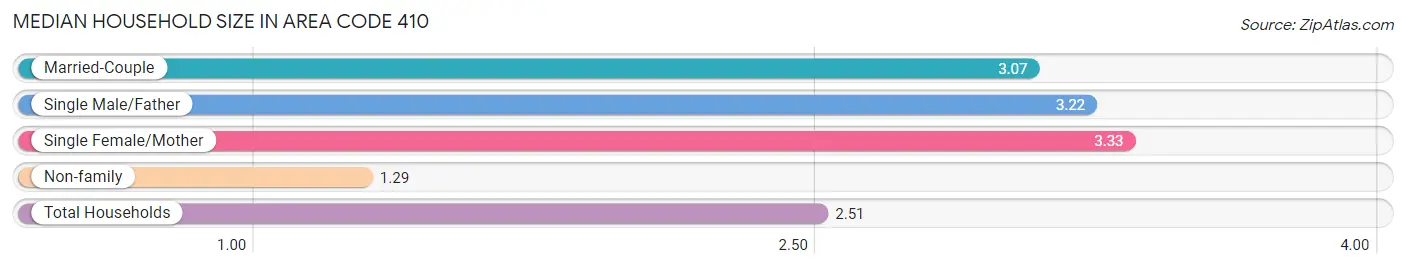
Median Household Size in Area Code 410
The median household size in Area Code 410 is 2.51 persons per household, with single female/mother households (177,536 | 14.1%) accounting for the largest median household size of 3.32704 persons per household. non-family households (456,465 | 36.2%) represent the smallest median household size with 1.29 persons per household.
| Household Type | # Households | Household Size |
| Married-Couple | 567,751 (45.1%) | 3.07 |
| Single Male/Father | 58,534 (4.6%) | 3.22 |
| Single Female/Mother | 177,536 (14.1%) | 3.33 |
| Non-family | 456,465 (36.2%) | 1.29 |
| Total Households | 1,260,286 (100.0%) | 2.51 |
Household Size by Marriage Status in Area Code 410
Out of a total of 1,260,286 households in Area Code 410, 803,821 (63.8%) are family households, while 456,465 (36.2%) are nonfamily households. The most numerous type of family households are 2-person households, comprising 347,733, and the most common type of nonfamily households are 1-person households, comprising 371,642.
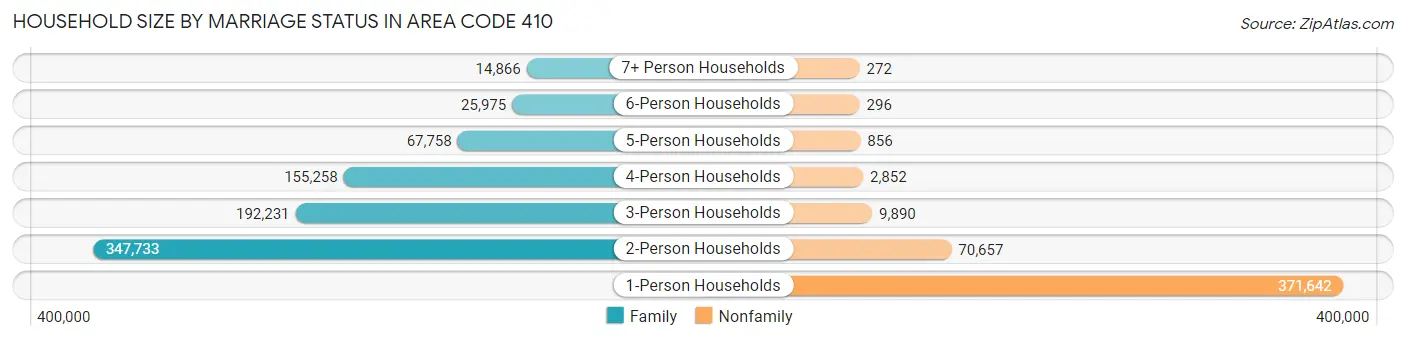
| Household Size | Family Households | Nonfamily Households |
| 1-Person Households | - | 371,642 (29.5%) |
| 2-Person Households | 347,733 (27.6%) | 70,657 (5.6%) |
| 3-Person Households | 192,231 (15.2%) | 9,890 (0.8%) |
| 4-Person Households | 155,258 (12.3%) | 2,852 (0.2%) |
| 5-Person Households | 67,758 (5.4%) | 856 (0.1%) |
| 6-Person Households | 25,975 (2.1%) | 296 (0.0%) |
| 7+ Person Households | 14,866 (1.2%) | 272 (0.0%) |
| Total | 803,821 (63.8%) | 456,465 (36.2%) |
Female Fertility in Area Code 410
Fertility by Age in Area Code 410
Average fertility rate in Area Code 410 is 59.9 births per 1,000 women. Women in the age bracket of 20 to 34 years have the highest fertility rate with 107.1 births per 1,000 women. Women in the age bracket of 20 to 34 years acount for 66.5% of all women with births.
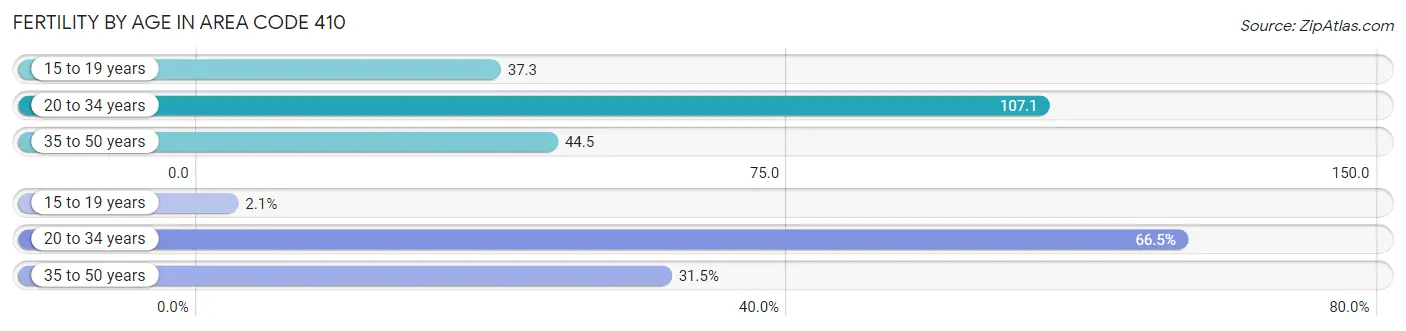
| Age Bracket | Women with Births | Births / 1,000 Women |
| 15 to 19 years | 774 (2.1%) | 37.2 |
| 20 to 34 years | 24,957 (66.5%) | 107.1 |
| 35 to 50 years | 11,814 (31.5%) | 44.5 |
| Total | 37,545 (100.0%) | 59.9 |
Fertility by Age by Marriage Status in Area Code 410
60.2% of women with births (37,545) in Area Code 410 are married. The highest percentage of unmarried women with births falls into 15 to 19 years age bracket with 96.1% of them unmarried at the time of birth, while the lowest percentage of unmarried women with births belong to 35 to 50 years age bracket with 38.2% of them unmarried.
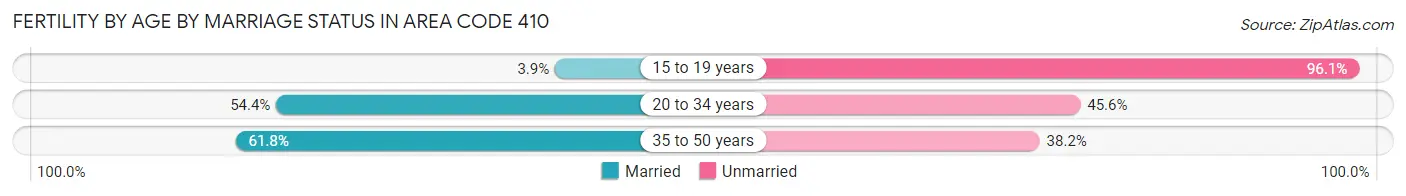
| Age Bracket | Married | Unmarried |
| 15 to 19 years | 30 (3.9%) | 744 (96.1%) |
| 20 to 34 years | 13,579 (54.4%) | 11,378 (45.6%) |
| 35 to 50 years | 7,297 (61.8%) | 4,517 (38.2%) |
| Total | 22,584 (60.2%) | 14,961 (39.9%) |
Fertility by Education in Area Code 410
Average fertility rate in Area Code 410 is 59.9 births per 1,000 women. Women with the education attainment of bachelor's degree have the highest fertility rate of 101.4 births per 1,000 women, while women with the education attainment of less than high school have the lowest fertility at 60.0 births per 1,000 women. Women with the education attainment of college or associate's degree represent 26.9% of all women with births.
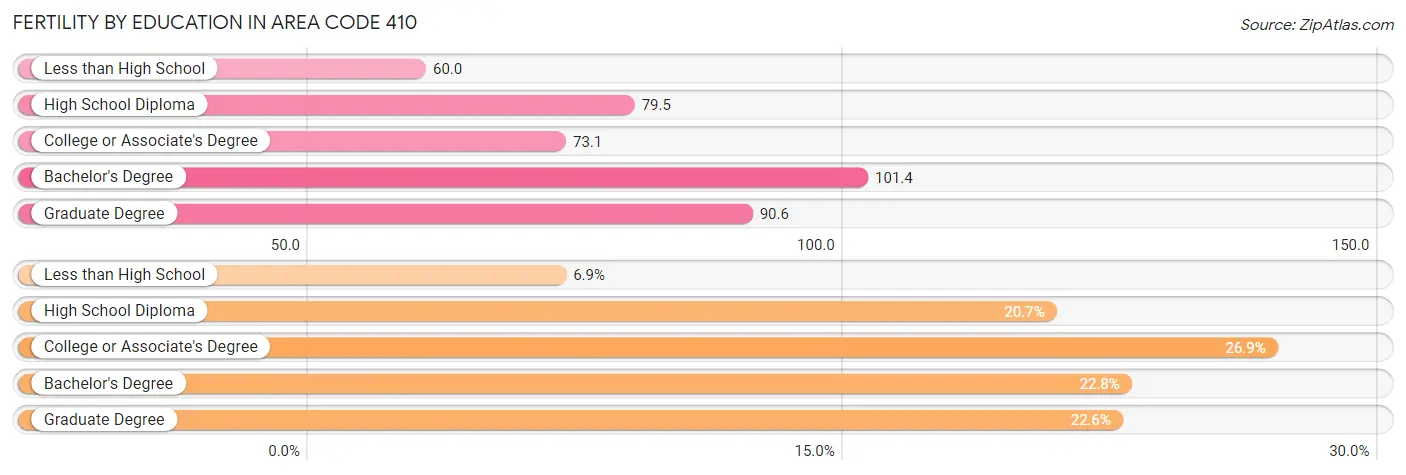
| Educational Attainment | Women with Births | Births / 1,000 Women |
| Less than High School | 2,604 (6.9%) | 60.0 |
| High School Diploma | 7,778 (20.7%) | 79.5 |
| College or Associate's Degree | 10,111 (26.9%) | 73.1 |
| Bachelor's Degree | 8,573 (22.8%) | 101.4 |
| Graduate Degree | 8,479 (22.6%) | 90.6 |
| Total | 37,545 (100.0%) | 59.9 |
Fertility by Education by Marriage Status in Area Code 410
39.9% of women with births in Area Code 410 are unmarried. Women with the educational attainment of bachelor's degree are most likely to be married with 60.3% of them married at childbirth, while women with the educational attainment of less than high school are least likely to be married with 78.2% of them unmarried at childbirth.
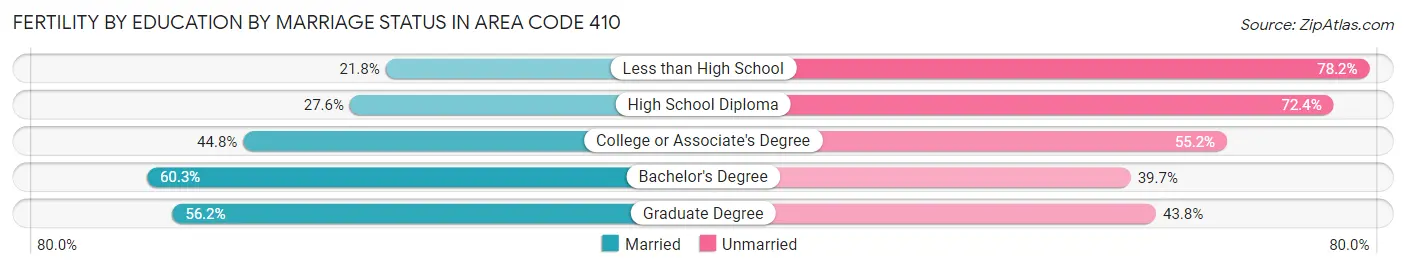
| Educational Attainment | Married | Unmarried |
| Less than High School | 568 (21.8%) | 2,036 (78.2%) |
| High School Diploma | 2,145 (27.6%) | 5,633 (72.4%) |
| College or Associate's Degree | 4,527 (44.8%) | 5,584 (55.2%) |
| Bachelor's Degree | 5,167 (60.3%) | 3,406 (39.7%) |
| Graduate Degree | 4,764 (56.2%) | 3,715 (43.8%) |
| Total | 22,584 (60.2%) | 14,961 (39.9%) |
Employment Characteristics in Area Code 410
Employment by Class of Employer in Area Code 410
Among the 1,615,360 employed individuals in Area Code 410, private company employees (965,990 | 59.8%), not-for-profit organizations (167,572 | 10.4%), and federal government employees (139,489 | 8.6%) make up the most common classes of employment.
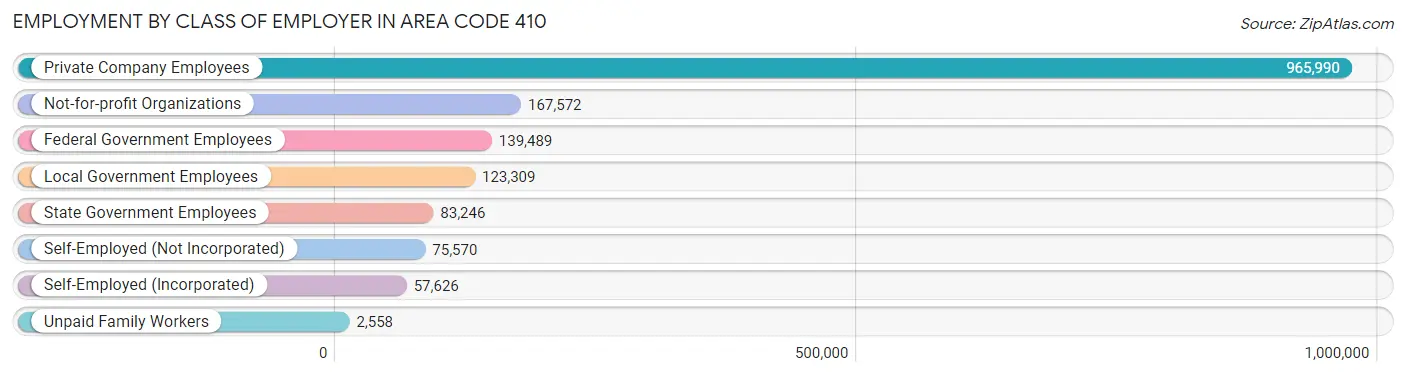
| Employer Class | # Employees | % Employees |
| Private Company Employees | 965,990 | 59.8% |
| Self-Employed (Incorporated) | 57,626 | 3.6% |
| Self-Employed (Not Incorporated) | 75,570 | 4.7% |
| Not-for-profit Organizations | 167,572 | 10.4% |
| Local Government Employees | 123,309 | 7.6% |
| State Government Employees | 83,246 | 5.1% |
| Federal Government Employees | 139,489 | 8.6% |
| Unpaid Family Workers | 2,558 | 0.2% |
| Total | 1,615,360 | 100.0% |
Employment Status by Age in Area Code 410
According to the labor force statistics for Area Code 410, out of the total population over 16 years of age (2,623,173), 63.1% or 1,655,222 individuals are in the labor force, with 5.4% or 89,713 of them unemployed. The age group with the highest labor force participation rate is 30 to 34 years, with 86.8% or 201,541 individuals in the labor force. Within the labor force, the 16 to 19 years age range has the highest percentage of unemployed individuals, with 2,711.3% or 2,008,450 of them being unemployed.
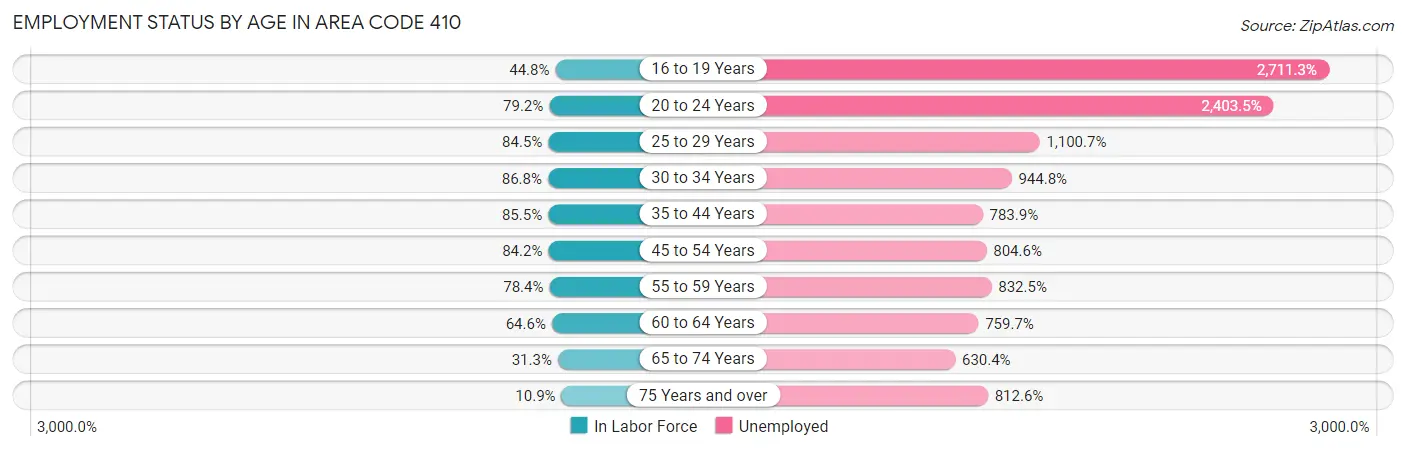
| Age Bracket | In Labor Force | Unemployed |
| 16 to 19 Years | 74,070 (44.8%) | 2,008,450 (2,711.3%) |
| 20 to 24 Years | 160,716 (79.2%) | 3,862,785 (2,403.5%) |
| 25 to 29 Years | 185,923 (84.5%) | 2,046,377 (1,100.7%) |
| 30 to 34 Years | 201,530 (86.8%) | 1,904,159 (944.8%) |
| 35 to 44 Years | 359,959 (85.5%) | 2,821,836 (783.9%) |
| 45 to 54 Years | 342,346 (84.2%) | 2,754,419 (804.6%) |
| 55 to 59 Years | 172,700 (78.3%) | 1,437,686 (832.5%) |
| 60 to 64 Years | 141,830 (64.6%) | 1,077,558 (759.7%) |
| 65 to 74 Years | 98,170 (31.3%) | 618,788 (630.4%) |
| 75 Years and over | 24,198 (10.9%) | 196,600 (812.6%) |
| Total | 1,655,169 (63.1%) | 89,686 (5.4%) |
Employment Status by Educational Attainment in Area Code 410
According to labor force statistics for Area Code 410, 79.8% of individuals (1,372,629) out of the total population between 25 and 64 years of age (1,719,656) are in the labor force, with 916.4% or 12,578,772 of them being unemployed. The group with the highest labor force participation rate are those with the educational attainment of bachelor's degree or higher, with 87.5% or 631,534 individuals in the labor force. Within the labor force, individuals with less than high school education have the highest percentage of unemployment, with 1,758.9% or 1,408,439 of them being unemployed.
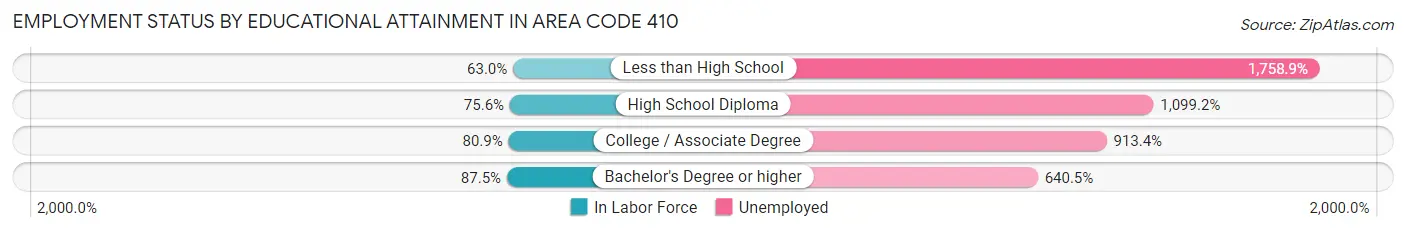
| Educational Attainment | In Labor Force | Unemployed |
| Less than High School | 80,080 (63.0%) | 2,234,559 (1,758.9%) |
| High School Diploma | 314,018 (75.6%) | 4,566,297 (1,099.2%) |
| College / Associate Degree | 368,271 (80.9%) | 4,159,989 (913.4%) |
| Bachelor's Degree or higher | 631,540 (87.5%) | 4,622,828 (640.5%) |
| Total | 1,372,691 (79.8%) | 15,758,928 (916.4%) |
Employment Occupations by Sex in Area Code 410
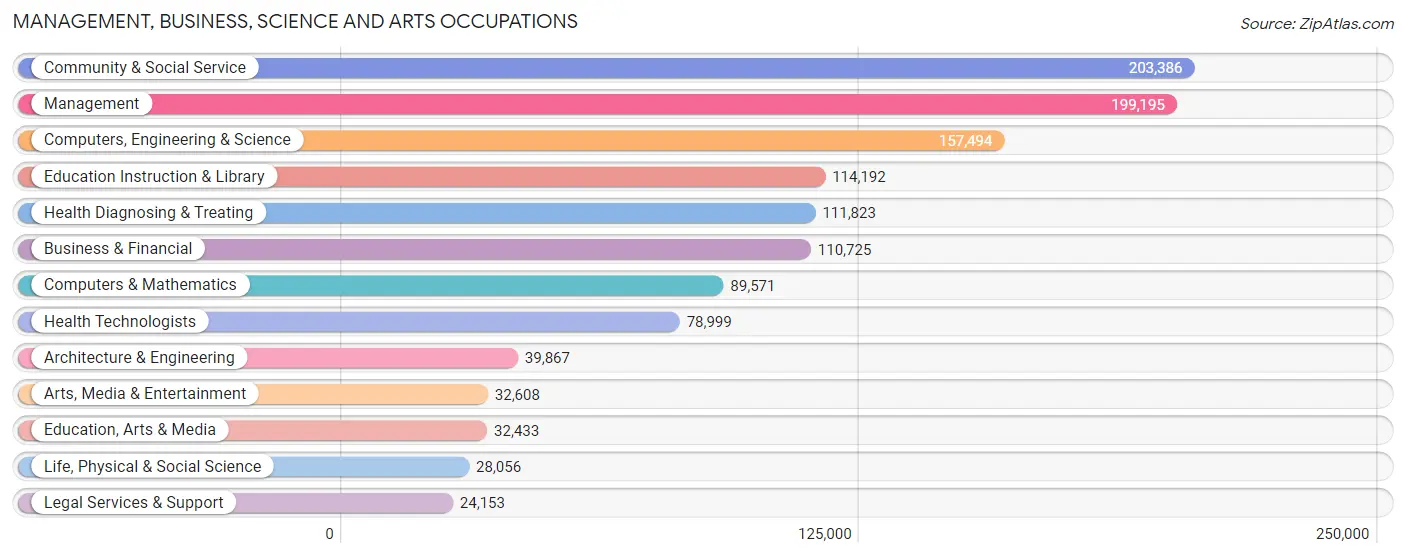
Management, Business, Science and Arts Occupations
The most common Management, Business, Science and Arts occupations in Area Code 410 are Community & Social Service (203,386 | 12.5%), Management (199,195 | 12.2%), Computers, Engineering & Science (157,494 | 9.7%), Education Instruction & Library (114,192 | 7.0%), and Health Diagnosing & Treating (111,823 | 6.9%).
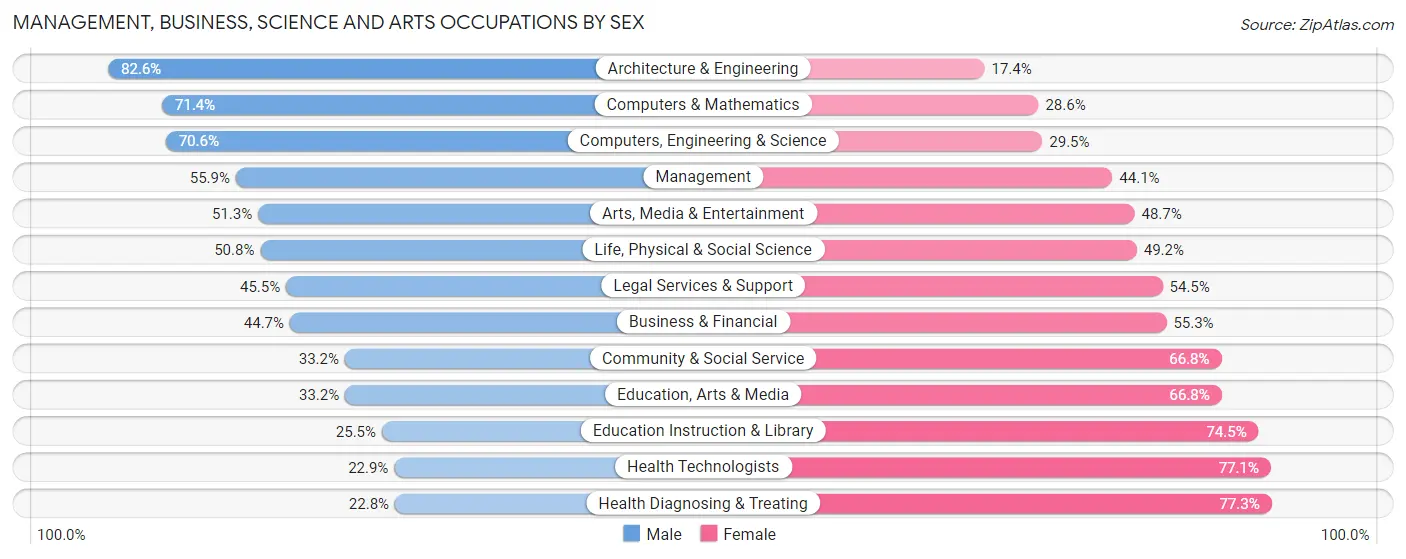
Management, Business, Science and Arts Occupations by Sex
Within the Management, Business, Science and Arts occupations in Area Code 410, the most male-oriented occupations are Architecture & Engineering (82.6%), Computers & Mathematics (71.4%), and Computers, Engineering & Science (70.6%), while the most female-oriented occupations are Health Diagnosing & Treating (77.2%), Health Technologists (77.1%), and Education Instruction & Library (74.5%).
| Occupation | Male | Female |
| Management | 111,434 (55.9%) | 87,761 (44.1%) |
| Business & Financial | 49,445 (44.7%) | 61,280 (55.3%) |
| Computers, Engineering & Science | 111,119 (70.6%) | 46,375 (29.4%) |
| Computers & Mathematics | 63,921 (71.4%) | 25,650 (28.6%) |
| Architecture & Engineering | 32,933 (82.6%) | 6,934 (17.4%) |
| Life, Physical & Social Science | 14,265 (50.8%) | 13,791 (49.2%) |
| Community & Social Service | 67,554 (33.2%) | 135,832 (66.8%) |
| Education, Arts & Media | 10,756 (33.2%) | 21,677 (66.8%) |
| Legal Services & Support | 10,981 (45.5%) | 13,172 (54.5%) |
| Education Instruction & Library | 29,086 (25.5%) | 85,106 (74.5%) |
| Arts, Media & Entertainment | 16,731 (51.3%) | 15,877 (48.7%) |
| Health Diagnosing & Treating | 25,437 (22.8%) | 86,386 (77.2%) |
| Health Technologists | 18,090 (22.9%) | 60,909 (77.1%) |
| Total (Category) | 364,989 (46.6%) | 417,634 (53.4%) |
| Total (Overall) | 823,466 (50.6%) | 803,162 (49.4%) |
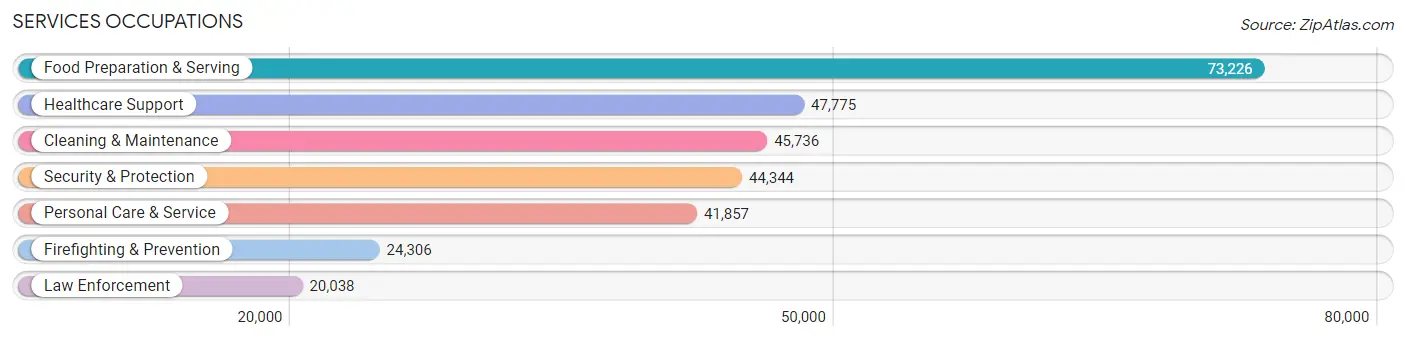
Services Occupations
The most common Services occupations in Area Code 410 are Food Preparation & Serving (73,226 | 4.5%), Healthcare Support (47,775 | 2.9%), Cleaning & Maintenance (45,736 | 2.8%), Security & Protection (44,344 | 2.7%), and Personal Care & Service (41,857 | 2.6%).
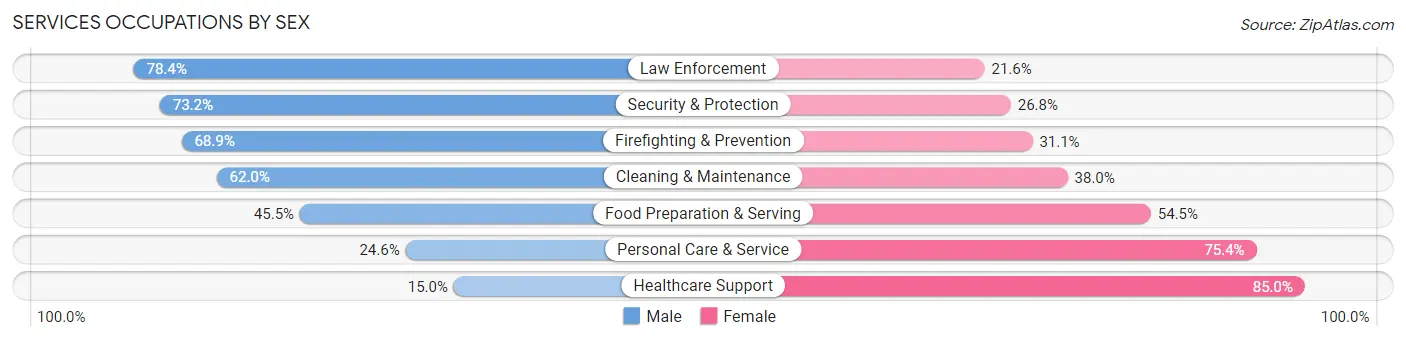
Services Occupations by Sex
Within the Services occupations in Area Code 410, the most male-oriented occupations are Law Enforcement (78.4%), Security & Protection (73.2%), and Firefighting & Prevention (68.9%), while the most female-oriented occupations are Healthcare Support (85.0%), Personal Care & Service (75.4%), and Food Preparation & Serving (54.5%).
| Occupation | Male | Female |
| Healthcare Support | 7,169 (15.0%) | 40,606 (85.0%) |
| Security & Protection | 32,468 (73.2%) | 11,876 (26.8%) |
| Firefighting & Prevention | 16,755 (68.9%) | 7,551 (31.1%) |
| Law Enforcement | 15,713 (78.4%) | 4,325 (21.6%) |
| Food Preparation & Serving | 33,301 (45.5%) | 39,925 (54.5%) |
| Cleaning & Maintenance | 28,344 (62.0%) | 17,392 (38.0%) |
| Personal Care & Service | 10,287 (24.6%) | 31,570 (75.4%) |
| Total (Category) | 111,569 (44.1%) | 141,369 (55.9%) |
| Total (Overall) | 823,466 (50.6%) | 803,162 (49.4%) |
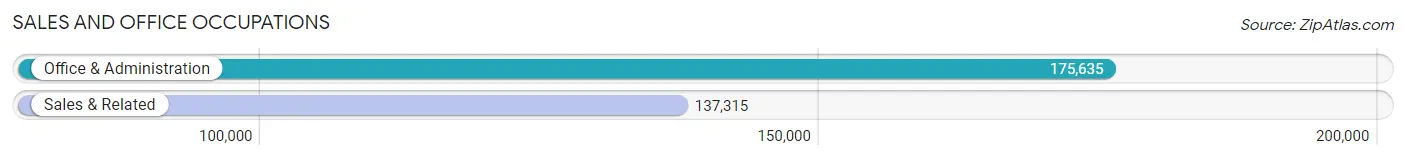
Sales and Office Occupations
The most common Sales and Office occupations in Area Code 410 are Office & Administration (175,635 | 10.8%), and Sales & Related (137,315 | 8.4%).
Sales and Office Occupations by Sex
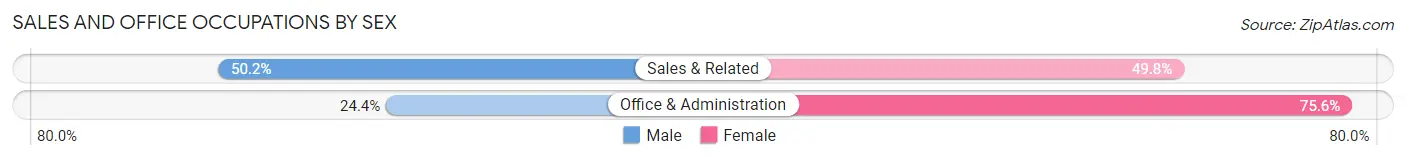
| Occupation | Male | Female |
| Sales & Related | 68,968 (50.2%) | 68,347 (49.8%) |
| Office & Administration | 42,822 (24.4%) | 132,813 (75.6%) |
| Total (Category) | 111,790 (35.7%) | 201,160 (64.3%) |
| Total (Overall) | 823,466 (50.6%) | 803,162 (49.4%) |
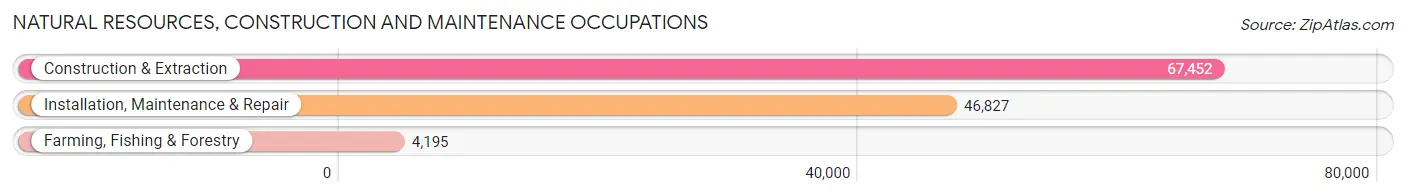
Natural Resources, Construction and Maintenance Occupations
The most common Natural Resources, Construction and Maintenance occupations in Area Code 410 are Construction & Extraction (67,452 | 4.2%), Installation, Maintenance & Repair (46,827 | 2.9%), and Farming, Fishing & Forestry (4,195 | 0.3%).
Natural Resources, Construction and Maintenance Occupations by Sex
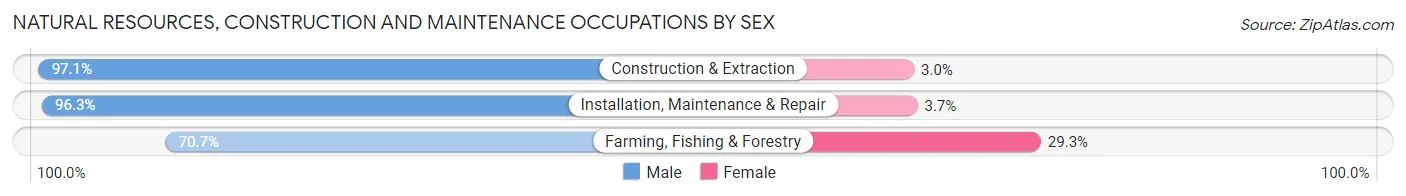
| Occupation | Male | Female |
| Farming, Fishing & Forestry | 2,964 (70.7%) | 1,231 (29.3%) |
| Construction & Extraction | 65,465 (97.1%) | 1,987 (2.9%) |
| Installation, Maintenance & Repair | 45,115 (96.3%) | 1,712 (3.7%) |
| Total (Category) | 113,544 (95.8%) | 4,930 (4.2%) |
| Total (Overall) | 823,466 (50.6%) | 803,162 (49.4%) |
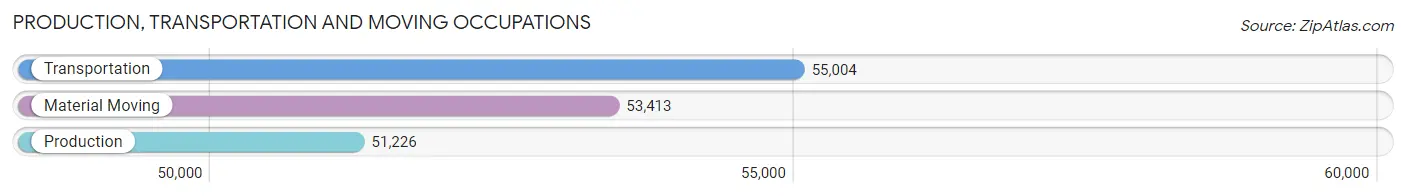
Production, Transportation and Moving Occupations
The most common Production, Transportation and Moving occupations in Area Code 410 are Transportation (55,004 | 3.4%), Material Moving (53,413 | 3.3%), and Production (51,226 | 3.2%).
Production, Transportation and Moving Occupations by Sex
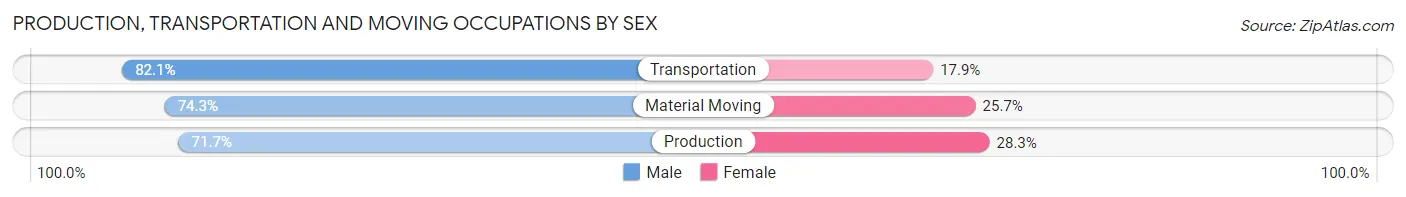
| Occupation | Male | Female |
| Production | 36,743 (71.7%) | 14,483 (28.3%) |
| Transportation | 45,148 (82.1%) | 9,856 (17.9%) |
| Material Moving | 39,683 (74.3%) | 13,730 (25.7%) |
| Total (Category) | 121,574 (76.1%) | 38,069 (23.8%) |
| Total (Overall) | 823,466 (50.6%) | 803,162 (49.4%) |
Employment Industries by Sex in Area Code 410
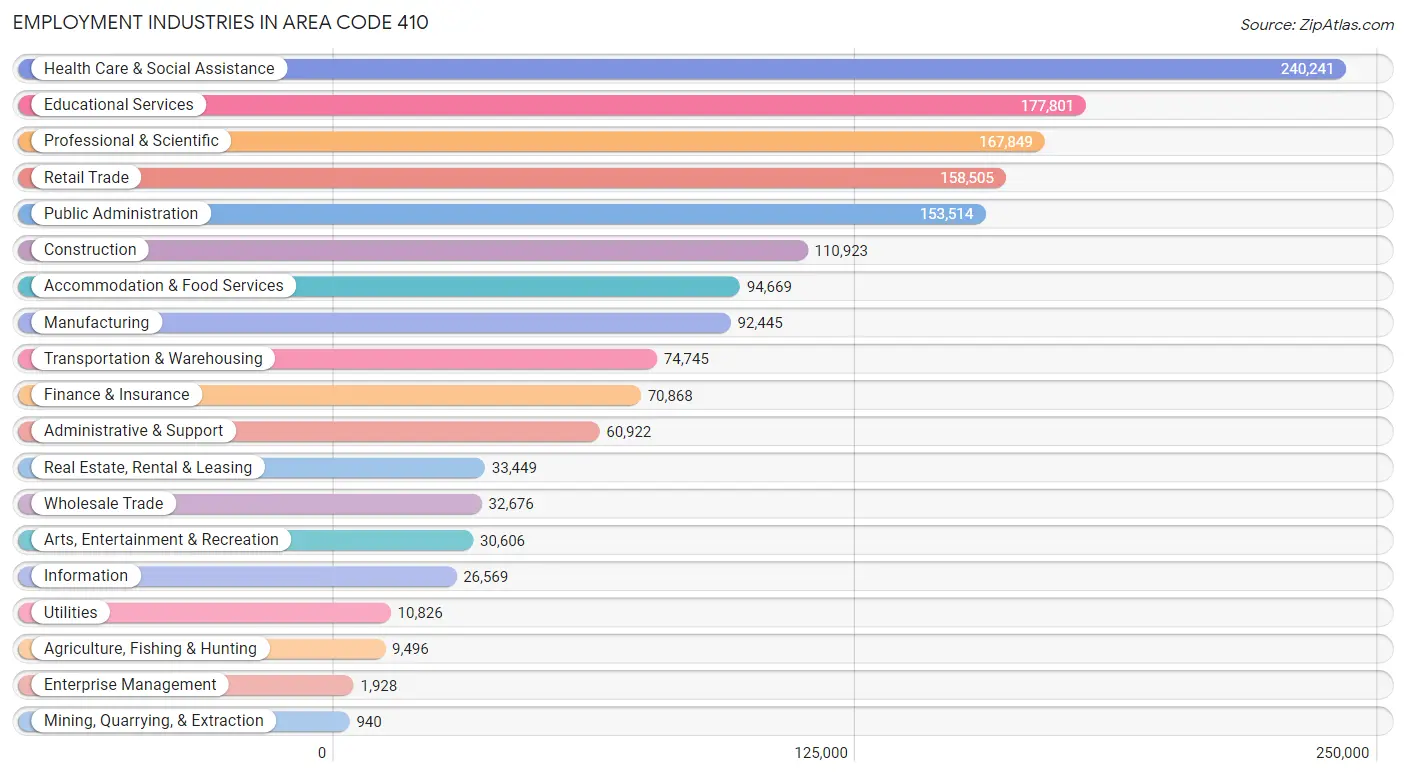
Employment Industries in Area Code 410
The major employment industries in Area Code 410 include Health Care & Social Assistance (240,241 | 14.8%), Educational Services (177,801 | 10.9%), Professional & Scientific (167,849 | 10.3%), Retail Trade (158,505 | 9.7%), and Public Administration (153,514 | 9.4%).
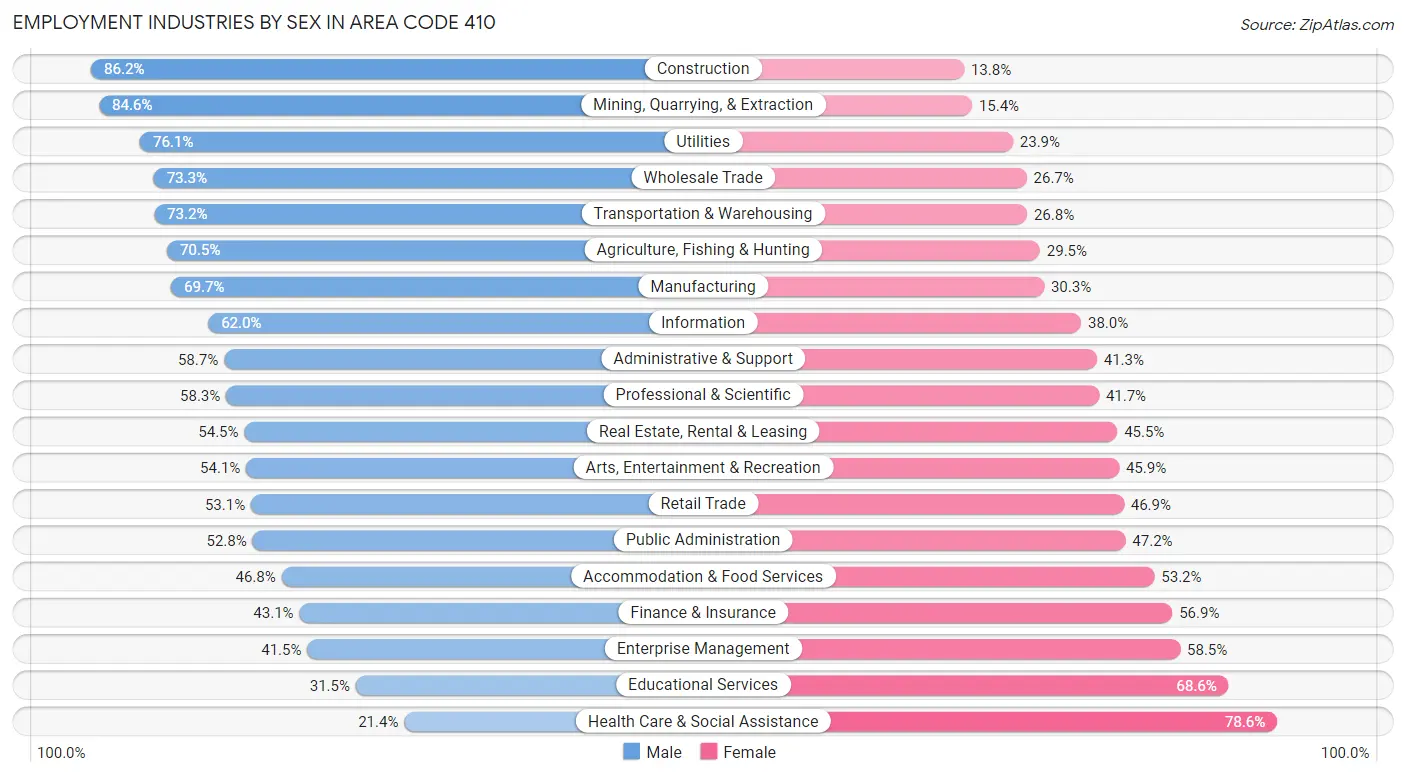
Employment Industries by Sex in Area Code 410
The Area Code 410 industries that see more men than women are Construction (86.2%), Mining, Quarrying, & Extraction (84.6%), and Utilities (76.1%), whereas the industries that tend to have a higher number of women are Health Care & Social Assistance (78.6%), Educational Services (68.5%), and Enterprise Management (58.5%).
| Industry | Male | Female |
| Agriculture, Fishing & Hunting | 6,697 (70.5%) | 2,799 (29.5%) |
| Mining, Quarrying, & Extraction | 795 (84.6%) | 145 (15.4%) |
| Construction | 95,641 (86.2%) | 15,282 (13.8%) |
| Manufacturing | 64,393 (69.7%) | 28,052 (30.3%) |
| Wholesale Trade | 23,940 (73.3%) | 8,736 (26.7%) |
| Retail Trade | 84,235 (53.1%) | 74,270 (46.9%) |
| Transportation & Warehousing | 54,699 (73.2%) | 20,046 (26.8%) |
| Utilities | 8,239 (76.1%) | 2,587 (23.9%) |
| Information | 16,469 (62.0%) | 10,100 (38.0%) |
| Finance & Insurance | 30,561 (43.1%) | 40,307 (56.9%) |
| Real Estate, Rental & Leasing | 18,234 (54.5%) | 15,215 (45.5%) |
| Professional & Scientific | 97,838 (58.3%) | 70,011 (41.7%) |
| Enterprise Management | 800 (41.5%) | 1,128 (58.5%) |
| Administrative & Support | 35,781 (58.7%) | 25,141 (41.3%) |
| Educational Services | 55,914 (31.5%) | 121,887 (68.5%) |
| Health Care & Social Assistance | 51,468 (21.4%) | 188,773 (78.6%) |
| Arts, Entertainment & Recreation | 16,570 (54.1%) | 14,036 (45.9%) |
| Accommodation & Food Services | 44,326 (46.8%) | 50,343 (53.2%) |
| Public Administration | 81,067 (52.8%) | 72,447 (47.2%) |
| Total | 823,466 (50.6%) | 803,162 (49.4%) |
Education in Area Code 410
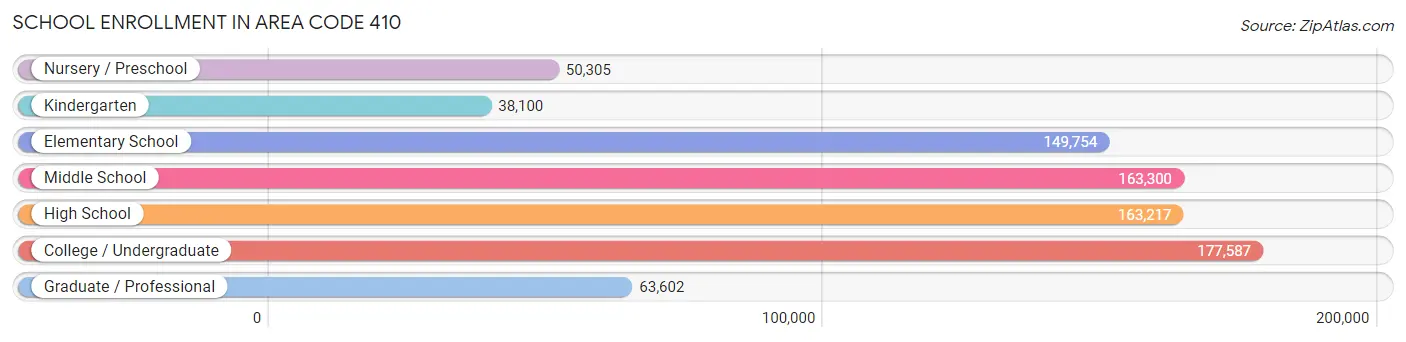
School Enrollment in Area Code 410
The most common levels of schooling among the 805,865 students in Area Code 410 are college / undergraduate (177,587 | 22.0%), middle school (163,300 | 20.3%), and high school (163,217 | 20.3%).
| School Level | # Students | % Students |
| Nursery / Preschool | 50,305 | 6.2% |
| Kindergarten | 38,100 | 4.7% |
| Elementary School | 149,754 | 18.6% |
| Middle School | 163,300 | 20.3% |
| High School | 163,217 | 20.3% |
| College / Undergraduate | 177,587 | 22.0% |
| Graduate / Professional | 63,602 | 7.9% |
| Total | 805,865 | 100.0% |
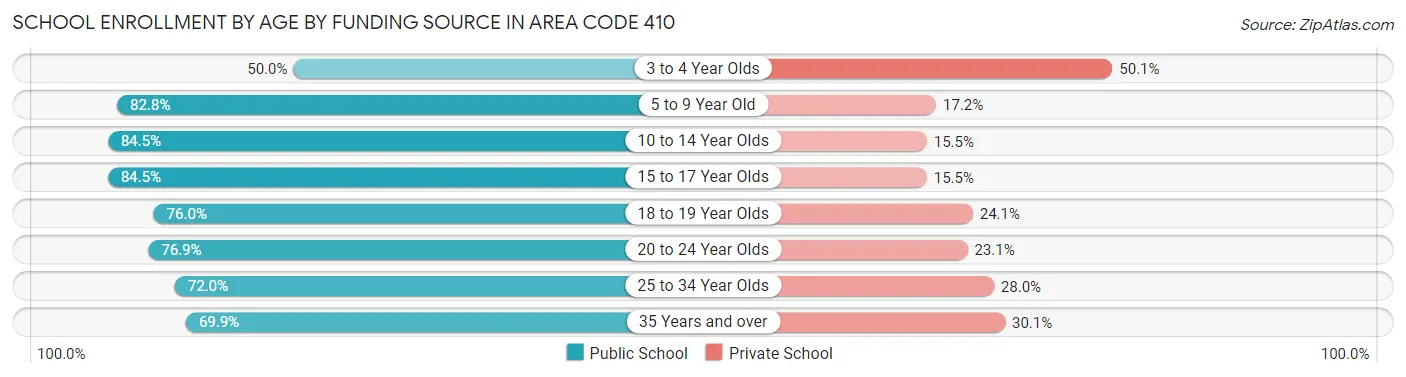
School Enrollment by Age by Funding Source in Area Code 410
Out of a total of 805,865 students who are enrolled in schools in Area Code 410, 169,270 (21.0%) attend a private institution, while the remaining 636,595 (79.0%) are enrolled in public schools. The age group of 3 to 4 year olds has the highest likelihood of being enrolled in private schools, with 19,462 (50.0% in the age bracket) enrolled. Conversely, the age group of 10 to 14 year olds has the lowest likelihood of being enrolled in a private school, with 168,837 (84.5% in the age bracket) attending a public institution.
| Age Bracket | Public School | Private School |
| 3 to 4 Year Olds | 19,422 (49.9%) | 19,462 (50.0%) |
| 5 to 9 Year Old | 150,214 (82.8%) | 31,239 (17.2%) |
| 10 to 14 Year Olds | 168,837 (84.5%) | 30,943 (15.5%) |
| 15 to 17 Year Olds | 99,012 (84.5%) | 18,149 (15.5%) |
| 18 to 19 Year Olds | 49,867 (75.9%) | 15,794 (24.0%) |
| 20 to 24 Year Olds | 66,484 (76.9%) | 19,921 (23.1%) |
| 25 to 34 Year Olds | 44,435 (72.0%) | 17,266 (28.0%) |
| 35 Years and over | 38,342 (69.9%) | 16,478 (30.1%) |
| Total | 636,599 (79.0%) | 169,270 (21.0%) |
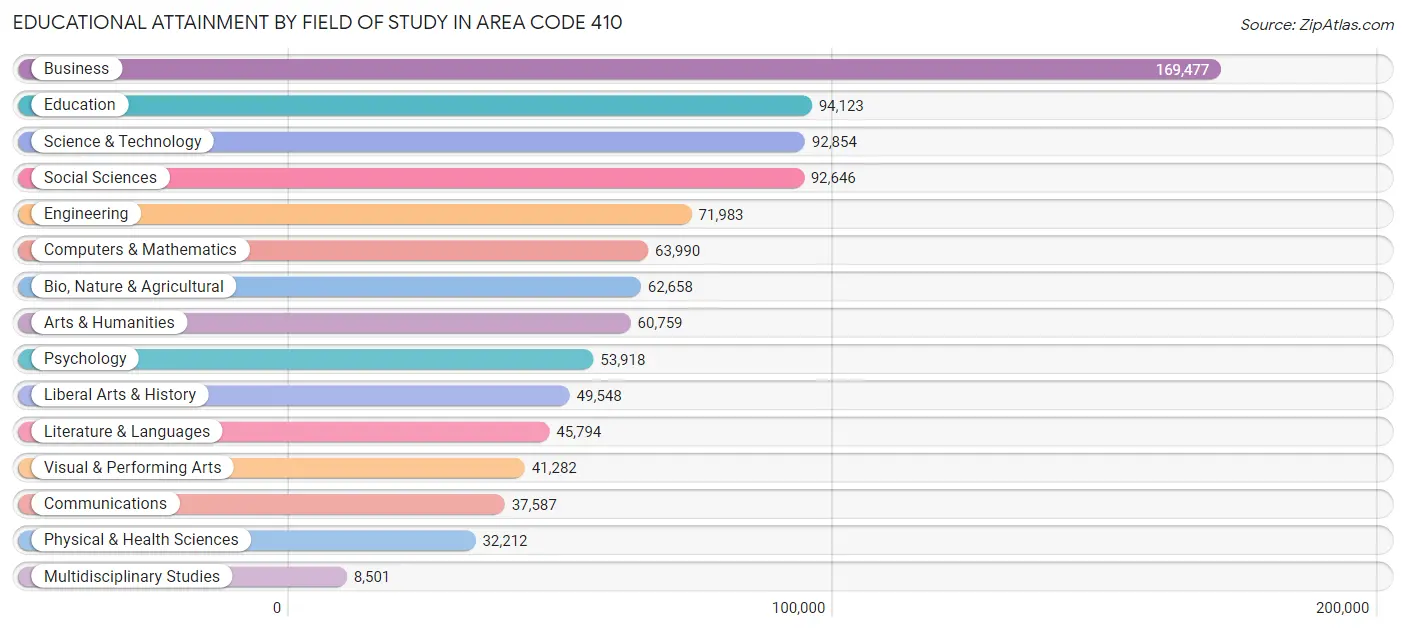
Educational Attainment by Field of Study in Area Code 410
Business (169,477 | 17.3%), education (94,123 | 9.6%), science & technology (92,854 | 9.5%), social sciences (92,646 | 9.5%), and engineering (71,983 | 7.4%) are the most common fields of study among 977,332 individuals in Area Code 410 who have obtained a bachelor's degree or higher.
| Field of Study | # Graduates | % Graduates |
| Computers & Mathematics | 63,990 | 6.6% |
| Bio, Nature & Agricultural | 62,658 | 6.4% |
| Physical & Health Sciences | 32,212 | 3.3% |
| Psychology | 53,918 | 5.5% |
| Social Sciences | 92,646 | 9.5% |
| Engineering | 71,983 | 7.4% |
| Multidisciplinary Studies | 8,501 | 0.9% |
| Science & Technology | 92,854 | 9.5% |
| Business | 169,477 | 17.3% |
| Education | 94,123 | 9.6% |
| Literature & Languages | 45,794 | 4.7% |
| Liberal Arts & History | 49,548 | 5.1% |
| Visual & Performing Arts | 41,282 | 4.2% |
| Communications | 37,587 | 3.8% |
| Arts & Humanities | 60,759 | 6.2% |
| Total | 977,332 | 100.0% |
Transportation & Commute in Area Code 410
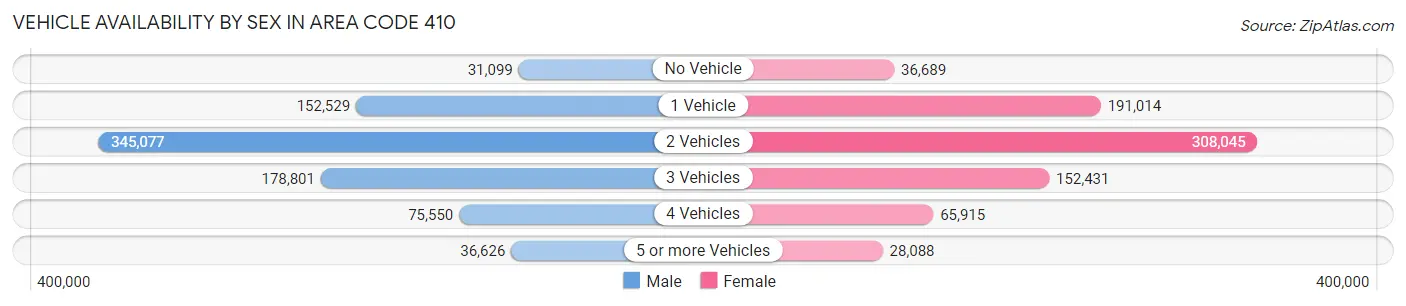
Vehicle Availability by Sex in Area Code 410
The most prevalent vehicle ownership categories in Area Code 410 are males with 2 vehicles (345,077, accounting for 42.1%) and females with 2 vehicles (308,045, making up 44.1%).
| Vehicles Available | Male | Female |
| No Vehicle | 31,099 (3.8%) | 36,689 (4.7%) |
| 1 Vehicle | 152,529 (18.6%) | 191,014 (24.4%) |
| 2 Vehicles | 345,077 (42.1%) | 308,045 (39.4%) |
| 3 Vehicles | 178,801 (21.8%) | 152,431 (19.5%) |
| 4 Vehicles | 75,550 (9.2%) | 65,915 (8.4%) |
| 5 or more Vehicles | 36,626 (4.5%) | 28,088 (3.6%) |
| Total | 819,682 (100.0%) | 782,182 (100.0%) |
Commute Time in Area Code 410
The most frequently occuring commute durations in Area Code 410 are 30 to 34 minutes (211,744 commuters, 15.0%), 20 to 24 minutes (195,904 commuters, 13.9%), and 15 to 19 minutes (193,555 commuters, 13.7%).
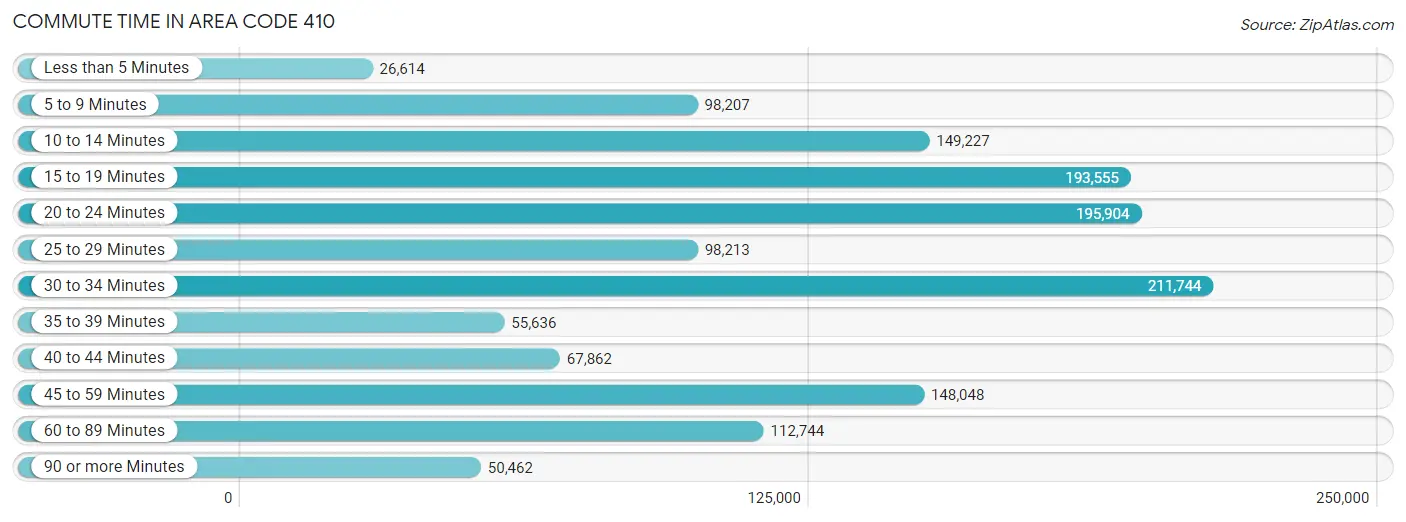
| Commute Time | # Commuters | % Commuters |
| Less than 5 Minutes | 26,614 | 1.9% |
| 5 to 9 Minutes | 98,207 | 7.0% |
| 10 to 14 Minutes | 149,227 | 10.6% |
| 15 to 19 Minutes | 193,555 | 13.7% |
| 20 to 24 Minutes | 195,904 | 13.9% |
| 25 to 29 Minutes | 98,213 | 7.0% |
| 30 to 34 Minutes | 211,744 | 15.0% |
| 35 to 39 Minutes | 55,636 | 4.0% |
| 40 to 44 Minutes | 67,862 | 4.8% |
| 45 to 59 Minutes | 148,048 | 10.5% |
| 60 to 89 Minutes | 112,744 | 8.0% |
| 90 or more Minutes | 50,462 | 3.6% |
Commute Time by Sex in Area Code 410
The most common commute times in Area Code 410 are 30 to 34 minutes (110,000 commuters, 15.1%) for males and 30 to 34 minutes (101,744 commuters, 15.0%) for females.
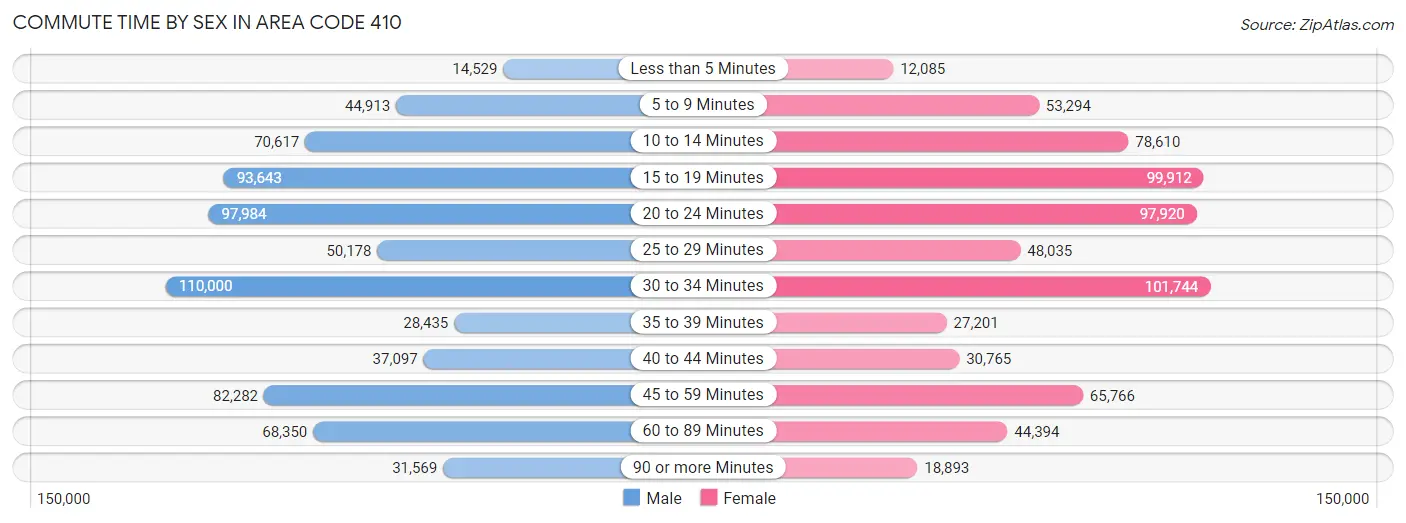
| Commute Time | Male | Female |
| Less than 5 Minutes | 14,529 (2.0%) | 12,085 (1.8%) |
| 5 to 9 Minutes | 44,913 (6.2%) | 53,294 (7.9%) |
| 10 to 14 Minutes | 70,617 (9.7%) | 78,610 (11.6%) |
| 15 to 19 Minutes | 93,643 (12.8%) | 99,912 (14.7%) |
| 20 to 24 Minutes | 97,984 (13.4%) | 97,920 (14.4%) |
| 25 to 29 Minutes | 50,178 (6.9%) | 48,035 (7.1%) |
| 30 to 34 Minutes | 110,000 (15.1%) | 101,744 (15.0%) |
| 35 to 39 Minutes | 28,435 (3.9%) | 27,201 (4.0%) |
| 40 to 44 Minutes | 37,097 (5.1%) | 30,765 (4.5%) |
| 45 to 59 Minutes | 82,282 (11.3%) | 65,766 (9.7%) |
| 60 to 89 Minutes | 68,350 (9.4%) | 44,394 (6.5%) |
| 90 or more Minutes | 31,569 (4.3%) | 18,893 (2.8%) |
Time of Departure to Work by Sex in Area Code 410
The most frequent times of departure to work in Area Code 410 are 7:00 AM to 7:29 AM (95,138, 13.0%) for males and 7:00 AM to 7:29 AM (103,314, 15.2%) for females.
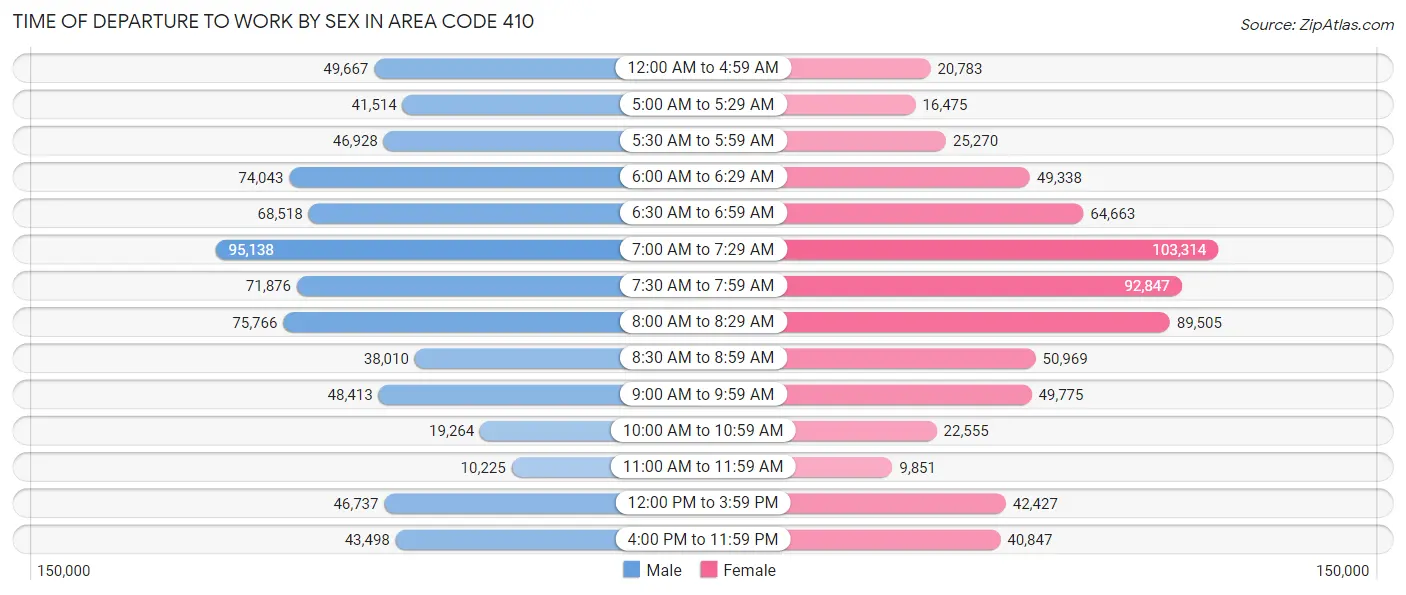
| Time of Departure | Male | Female |
| 12:00 AM to 4:59 AM | 49,667 (6.8%) | 20,783 (3.1%) |
| 5:00 AM to 5:29 AM | 41,514 (5.7%) | 16,475 (2.4%) |
| 5:30 AM to 5:59 AM | 46,928 (6.4%) | 25,270 (3.7%) |
| 6:00 AM to 6:29 AM | 74,043 (10.2%) | 49,338 (7.3%) |
| 6:30 AM to 6:59 AM | 68,518 (9.4%) | 64,663 (9.5%) |
| 7:00 AM to 7:29 AM | 95,138 (13.0%) | 103,314 (15.2%) |
| 7:30 AM to 7:59 AM | 71,876 (9.9%) | 92,847 (13.7%) |
| 8:00 AM to 8:29 AM | 75,766 (10.4%) | 89,505 (13.2%) |
| 8:30 AM to 8:59 AM | 38,010 (5.2%) | 50,969 (7.5%) |
| 9:00 AM to 9:59 AM | 48,413 (6.6%) | 49,775 (7.3%) |
| 10:00 AM to 10:59 AM | 19,264 (2.6%) | 22,555 (3.3%) |
| 11:00 AM to 11:59 AM | 10,225 (1.4%) | 9,851 (1.5%) |
| 12:00 PM to 3:59 PM | 46,737 (6.4%) | 42,427 (6.2%) |
| 4:00 PM to 11:59 PM | 43,498 (6.0%) | 40,847 (6.0%) |
| Total | 729,597 (100.0%) | 678,619 (100.0%) |
Housing Occupancy in Area Code 410
Occupancy by Ownership in Area Code 410
Of the total 1,260,286 dwellings in Area Code 410, owner-occupied units account for 839,564 (66.6%), while renter-occupied units make up 420,722 (33.4%).
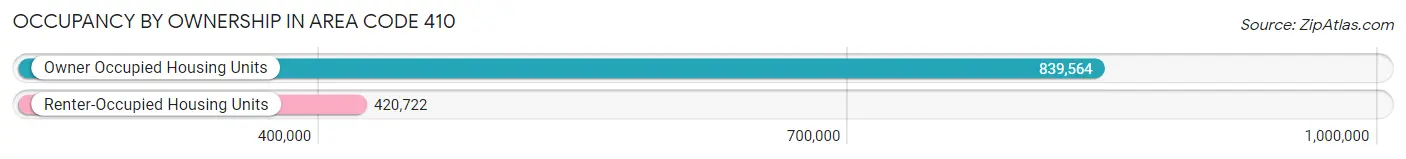
| Occupancy | # Housing Units | % Housing Units |
| Owner Occupied Housing Units | 839,564 | 66.6% |
| Renter-Occupied Housing Units | 420,722 | 33.4% |
| Total Occupied Housing Units | 1,260,286 | 100.0% |
Occupancy by Household Size in Area Code 410
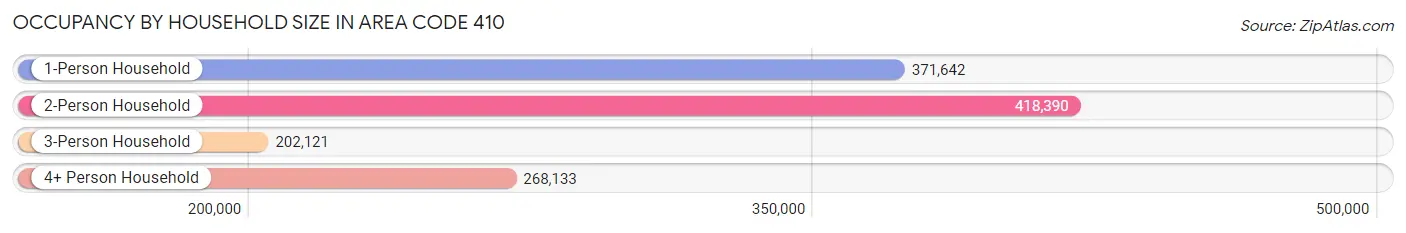
| Household Size | # Housing Units | % Housing Units |
| 1-Person Household | 371,642 | 29.5% |
| 2-Person Household | 418,390 | 33.2% |
| 3-Person Household | 202,121 | 16.0% |
| 4+ Person Household | 268,133 | 21.3% |
| Total Housing Units | 1,260,286 | 100.0% |
Occupancy by Ownership by Household Size in Area Code 410
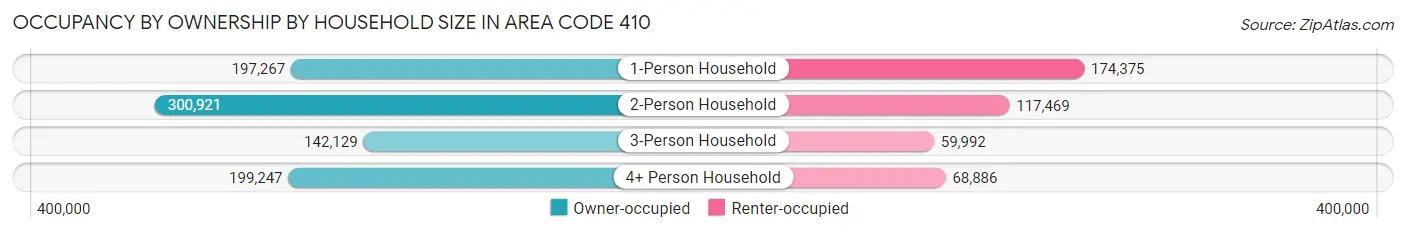
| Household Size | Owner-occupied | Renter-occupied |
| 1-Person Household | 197,267 (53.1%) | 174,375 (46.9%) |
| 2-Person Household | 300,921 (71.9%) | 117,469 (28.1%) |
| 3-Person Household | 142,129 (70.3%) | 59,992 (29.7%) |
| 4+ Person Household | 199,247 (74.3%) | 68,886 (25.7%) |
| Total Housing Units | 839,564 (66.6%) | 420,722 (33.4%) |
Occupancy by Educational Attainment in Area Code 410
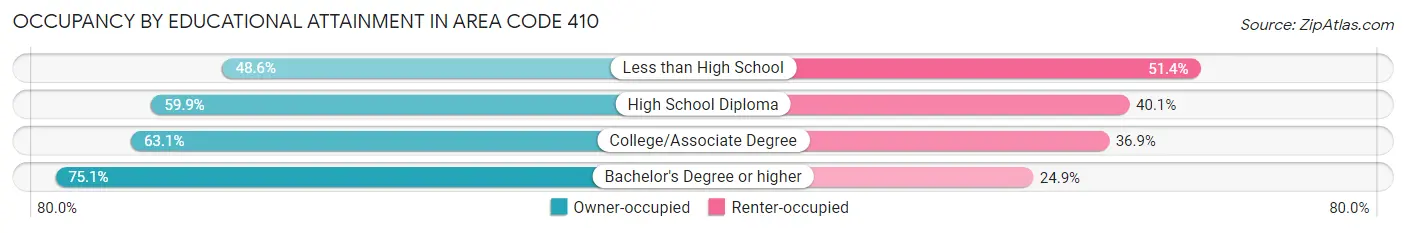
| Household Size | Owner-occupied | Renter-occupied |
| Less than High School | 42,531 (48.6%) | 44,996 (51.4%) |
| High School Diploma | 165,326 (59.9%) | 110,763 (40.1%) |
| College/Associate Degree | 220,717 (63.1%) | 128,960 (36.9%) |
| Bachelor's Degree or higher | 410,990 (75.1%) | 136,003 (24.9%) |
Occupancy by Age of Householder in Area Code 410
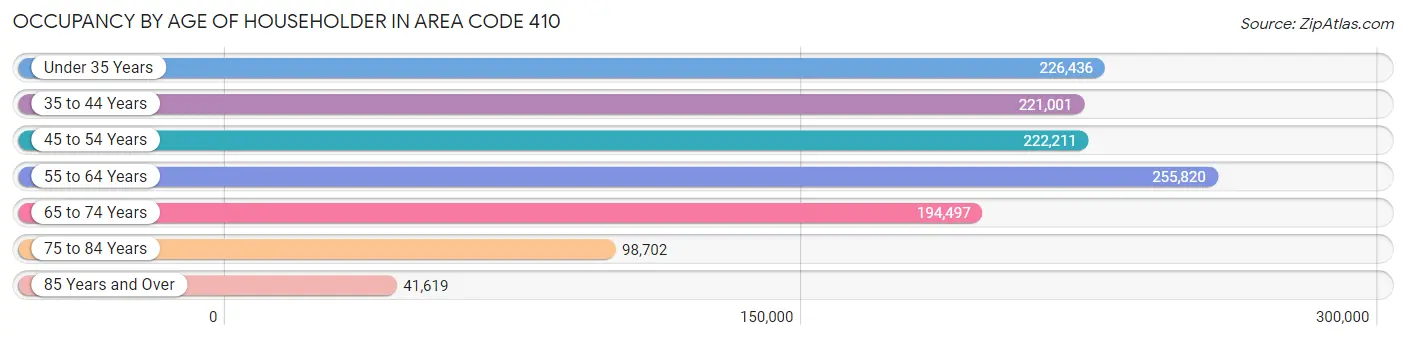
| Age Bracket | # Households | % Households |
| Under 35 Years | 226,436 | 18.0% |
| 35 to 44 Years | 221,001 | 17.5% |
| 45 to 54 Years | 222,211 | 17.6% |
| 55 to 64 Years | 255,820 | 20.3% |
| 65 to 74 Years | 194,497 | 15.4% |
| 75 to 84 Years | 98,702 | 7.8% |
| 85 Years and Over | 41,619 | 3.3% |
| Total | 1,260,286 | 100.0% |
Housing Finances in Area Code 410
Median Income by Occupancy in Area Code 410
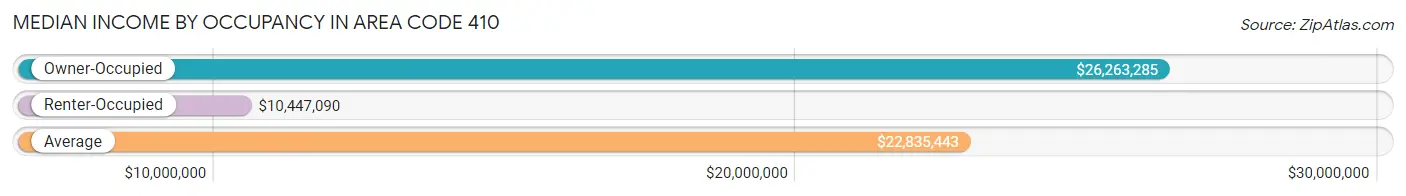
| Occupancy Type | # Households | Median Income |
| Owner-Occupied | 839,564 (66.6%) | $26,263,285 |
| Renter-Occupied | 420,722 (33.4%) | $10,447,090 |
| Average | 1,260,286 (100.0%) | $22,835,443 |
Occupancy by Householder Income Bracket in Area Code 410
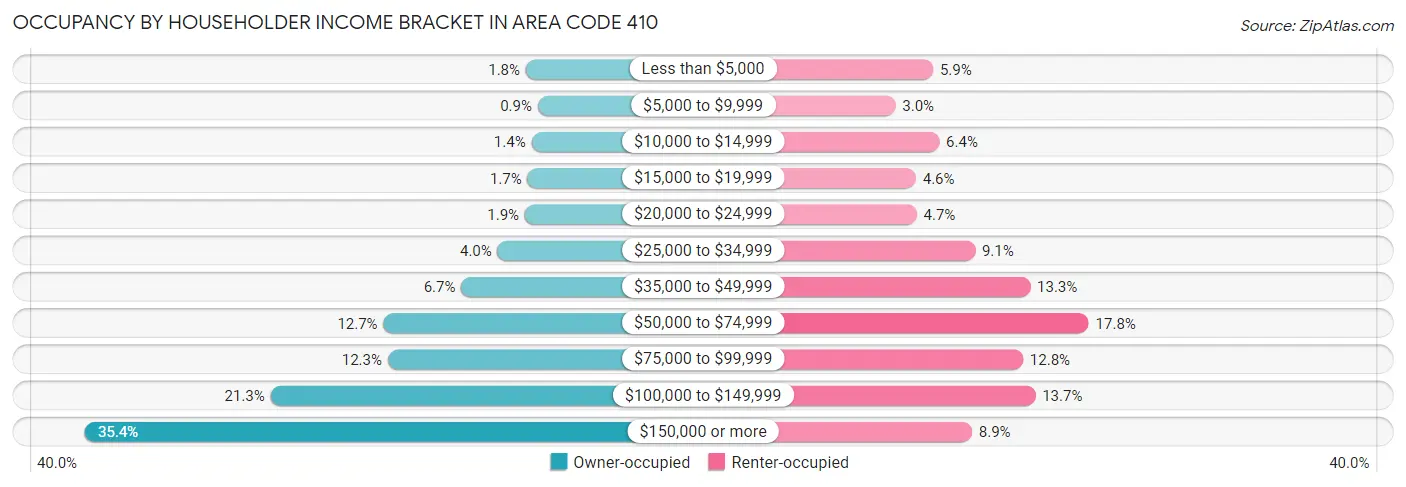
| Income Bracket | Owner-occupied | Renter-occupied |
| Less than $5,000 | 15,219 (1.8%) | 24,802 (5.9%) |
| $5,000 to $9,999 | 7,575 (0.9%) | 12,727 (3.0%) |
| $10,000 to $14,999 | 11,562 (1.4%) | 26,789 (6.4%) |
| $15,000 to $19,999 | 14,145 (1.7%) | 19,321 (4.6%) |
| $20,000 to $24,999 | 15,758 (1.9%) | 19,571 (4.6%) |
| $25,000 to $34,999 | 33,214 (4.0%) | 38,302 (9.1%) |
| $35,000 to $49,999 | 56,539 (6.7%) | 55,977 (13.3%) |
| $50,000 to $74,999 | 106,325 (12.7%) | 74,735 (17.8%) |
| $75,000 to $99,999 | 103,511 (12.3%) | 53,642 (12.8%) |
| $100,000 to $149,999 | 178,512 (21.3%) | 57,599 (13.7%) |
| $150,000 or more | 297,204 (35.4%) | 37,257 (8.9%) |
| Total | 839,564 (100.0%) | 420,722 (100.0%) |
Monthly Housing Cost Tiers in Area Code 410
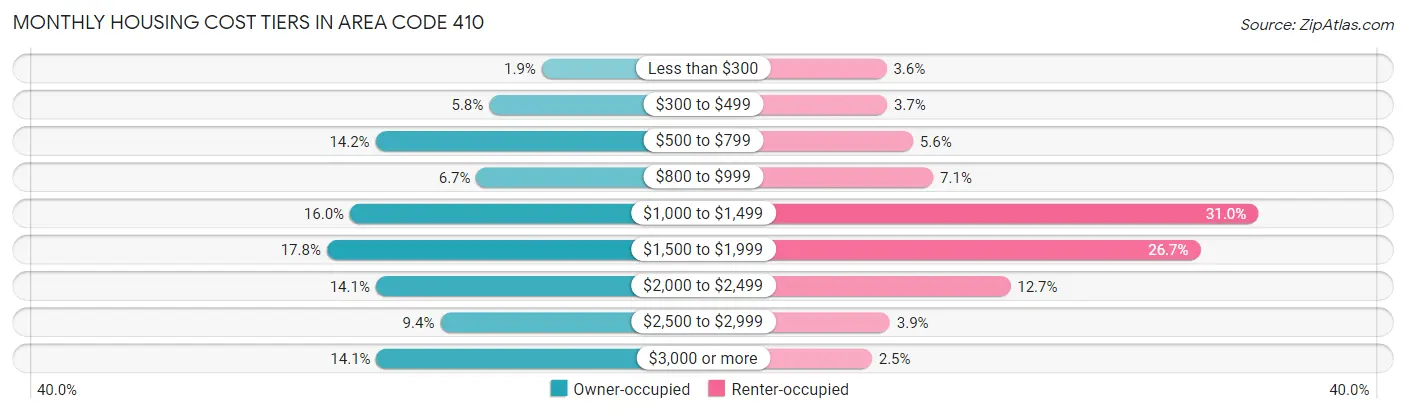
| Monthly Cost | Owner-occupied | Renter-occupied |
| Less than $300 | 16,138 (1.9%) | 15,183 (3.6%) |
| $300 to $499 | 48,633 (5.8%) | 15,349 (3.6%) |
| $500 to $799 | 118,851 (14.2%) | 23,378 (5.6%) |
| $800 to $999 | 56,474 (6.7%) | 29,650 (7.0%) |
| $1,000 to $1,499 | 134,625 (16.0%) | 130,339 (31.0%) |
| $1,500 to $1,999 | 149,056 (17.7%) | 112,420 (26.7%) |
| $2,000 to $2,499 | 118,673 (14.1%) | 53,559 (12.7%) |
| $2,500 to $2,999 | 78,806 (9.4%) | 16,245 (3.9%) |
| $3,000 or more | 118,308 (14.1%) | 10,627 (2.5%) |
| Total | 839,564 (100.0%) | 420,722 (100.0%) |
Physical Housing Characteristics in Area Code 410
Housing Structures in Area Code 410
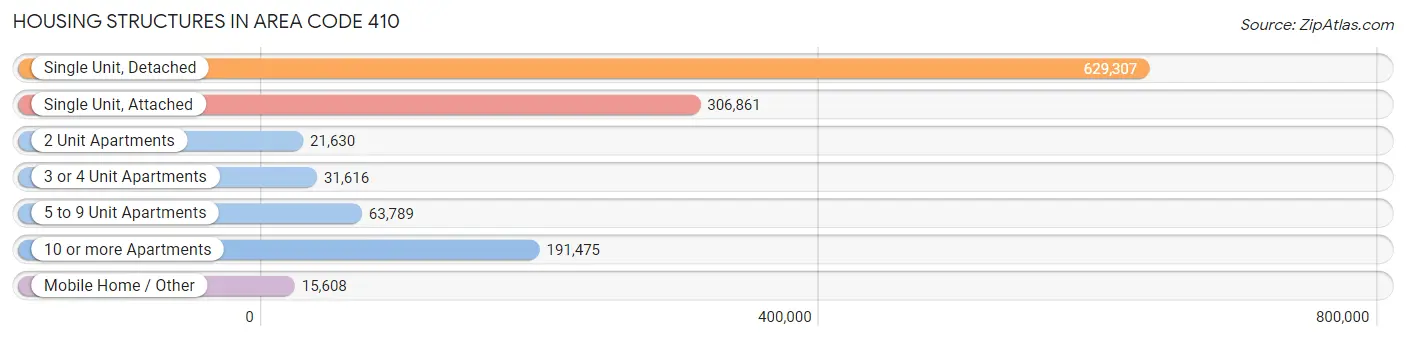
| Structure Type | # Housing Units | % Housing Units |
| Single Unit, Detached | 629,307 | 49.9% |
| Single Unit, Attached | 306,861 | 24.3% |
| 2 Unit Apartments | 21,630 | 1.7% |
| 3 or 4 Unit Apartments | 31,616 | 2.5% |
| 5 to 9 Unit Apartments | 63,789 | 5.1% |
| 10 or more Apartments | 191,475 | 15.2% |
| Mobile Home / Other | 15,608 | 1.2% |
| Total | 1,260,286 | 100.0% |
Housing Structures by Occupancy in Area Code 410
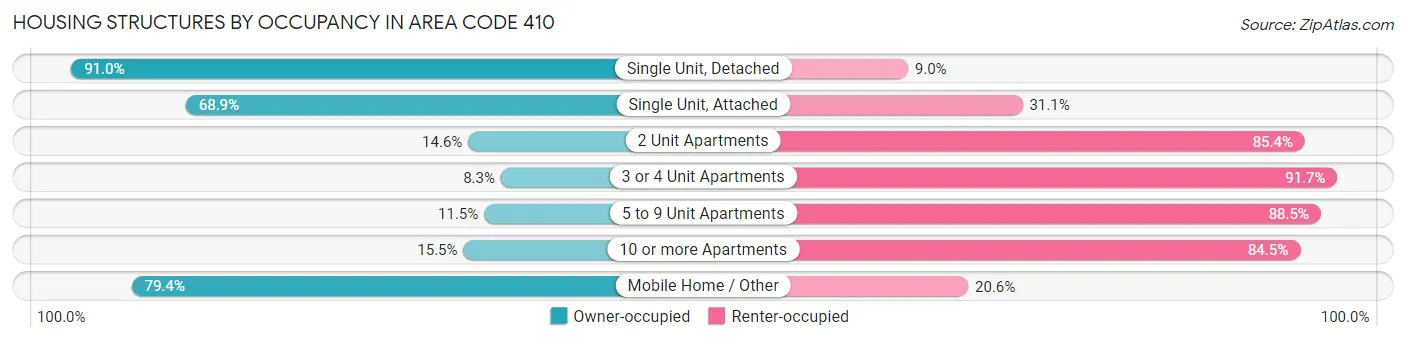
| Structure Type | Owner-occupied | Renter-occupied |
| Single Unit, Detached | 572,760 (91.0%) | 56,547 (9.0%) |
| Single Unit, Attached | 211,555 (68.9%) | 95,306 (31.1%) |
| 2 Unit Apartments | 3,158 (14.6%) | 18,472 (85.4%) |
| 3 or 4 Unit Apartments | 2,629 (8.3%) | 28,987 (91.7%) |
| 5 to 9 Unit Apartments | 7,354 (11.5%) | 56,435 (88.5%) |
| 10 or more Apartments | 29,713 (15.5%) | 161,762 (84.5%) |
| Mobile Home / Other | 12,395 (79.4%) | 3,213 (20.6%) |
| Total | 839,564 (66.6%) | 420,722 (33.4%) |
Housing Structures by Number of Rooms in Area Code 410
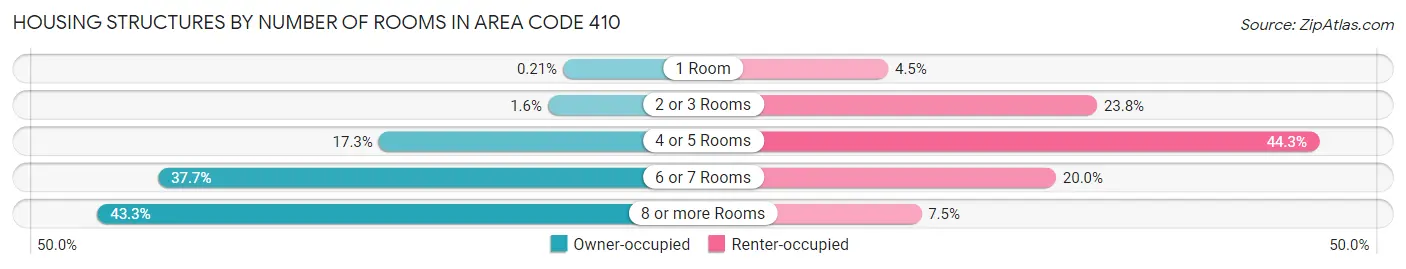
| Number of Rooms | Owner-occupied | Renter-occupied |
| 1 Room | 1,725 (0.2%) | 18,740 (4.4%) |
| 2 or 3 Rooms | 13,518 (1.6%) | 100,014 (23.8%) |
| 4 or 5 Rooms | 144,879 (17.3%) | 186,303 (44.3%) |
| 6 or 7 Rooms | 316,160 (37.7%) | 84,036 (20.0%) |
| 8 or more Rooms | 363,282 (43.3%) | 31,629 (7.5%) |
| Total | 839,564 (100.0%) | 420,722 (100.0%) |
Housing Structure by Heating Type in Area Code 410
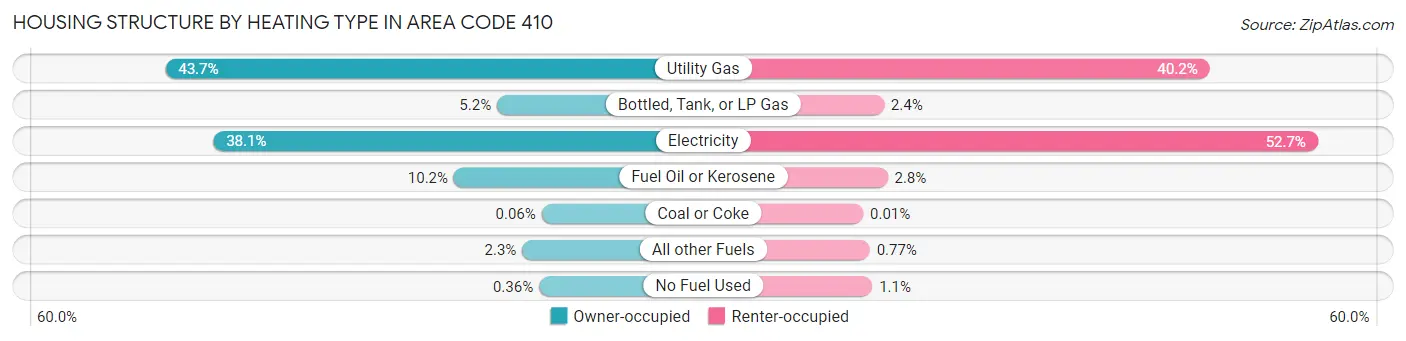
| Heating Type | Owner-occupied | Renter-occupied |
| Utility Gas | 366,740 (43.7%) | 169,050 (40.2%) |
| Bottled, Tank, or LP Gas | 43,880 (5.2%) | 10,196 (2.4%) |
| Electricity | 320,155 (38.1%) | 221,764 (52.7%) |
| Fuel Oil or Kerosene | 85,884 (10.2%) | 11,930 (2.8%) |
| Coal or Coke | 505 (0.1%) | 61 (0.0%) |
| All other Fuels | 19,382 (2.3%) | 3,249 (0.8%) |
| No Fuel Used | 3,018 (0.4%) | 4,472 (1.1%) |
| Total | 839,564 (100.0%) | 420,722 (100.0%) |
Household Vehicle Usage in Area Code 410
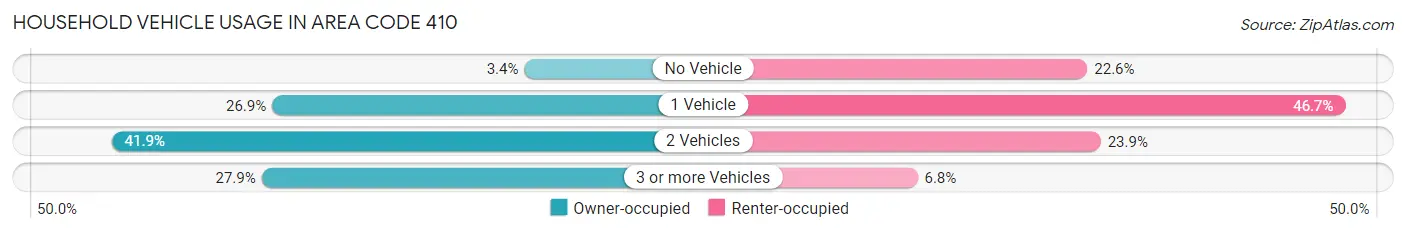
| Vehicles per Household | Owner-occupied | Renter-occupied |
| No Vehicle | 28,102 (3.4%) | 95,198 (22.6%) |
| 1 Vehicle | 225,860 (26.9%) | 196,516 (46.7%) |
| 2 Vehicles | 351,539 (41.9%) | 100,469 (23.9%) |
| 3 or more Vehicles | 234,063 (27.9%) | 28,539 (6.8%) |
| Total | 839,564 (100.0%) | 420,722 (100.0%) |
Real Estate & Mortgages in Area Code 410
Real Estate and Mortgage Overview in Area Code 410
| Characteristic | Without Mortgage | With Mortgage |
| Housing Units | 250,628 | 588,936 |
| Median Property Value | $74,463,501 | $86,155,700 |
| Median Household Income | $18,007,594 | $238,585 |
| Monthly Housing Costs | $153,855 | $116,655 |
| Real Estate Taxes | $751,177 | $14,081 |
Property Value by Mortgage Status in Area Code 410
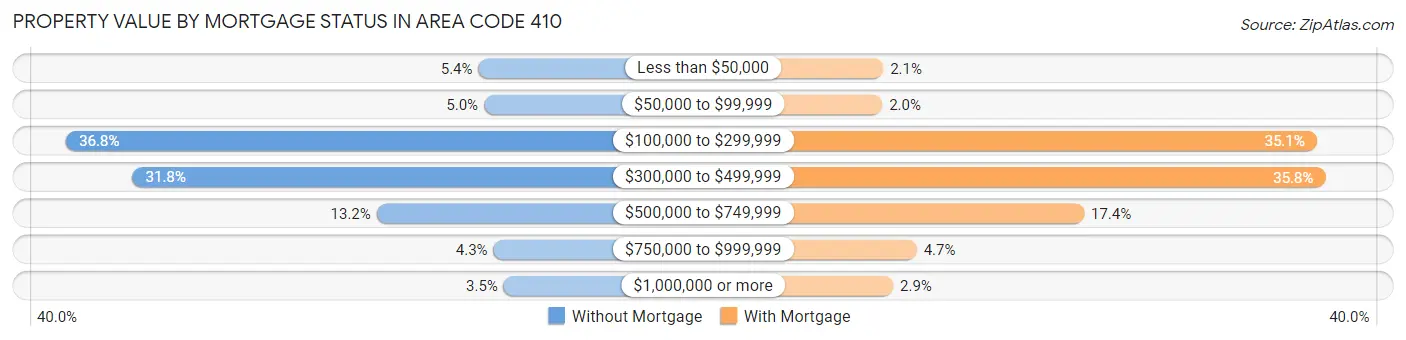
| Property Value | Without Mortgage | With Mortgage |
| Less than $50,000 | 13,599 (5.4%) | 12,443 (2.1%) |
| $50,000 to $99,999 | 12,532 (5.0%) | 11,954 (2.0%) |
| $100,000 to $299,999 | 92,341 (36.8%) | 206,979 (35.1%) |
| $300,000 to $499,999 | 79,615 (31.8%) | 210,764 (35.8%) |
| $500,000 to $749,999 | 33,039 (13.2%) | 102,528 (17.4%) |
| $750,000 to $999,999 | 10,721 (4.3%) | 27,431 (4.7%) |
| $1,000,000 or more | 8,781 (3.5%) | 16,837 (2.9%) |
| Total | 250,628 (100.0%) | 588,936 (100.0%) |
Household Income by Mortgage Status in Area Code 410
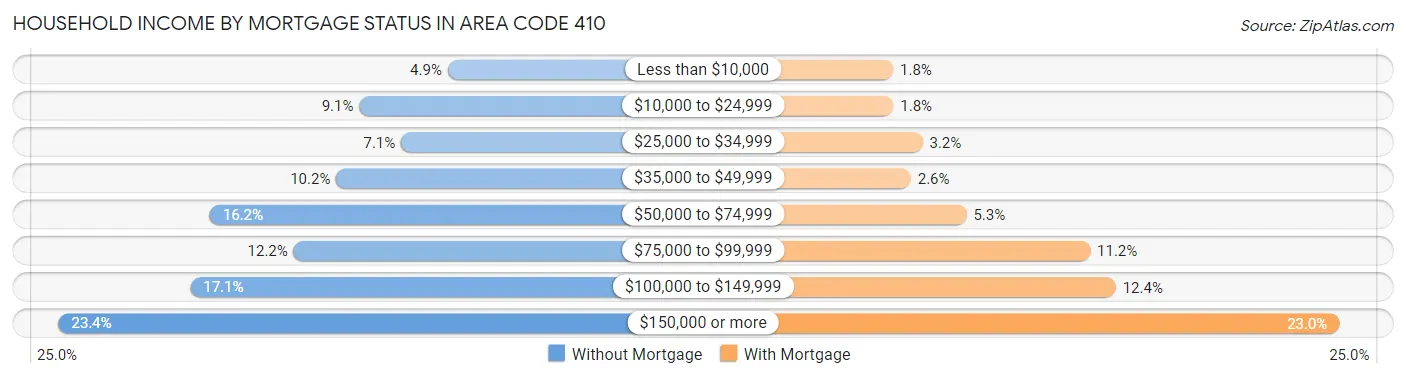
| Household Income | Without Mortgage | With Mortgage |
| Less than $10,000 | 12,167 (4.9%) | 10,528 (1.8%) |
| $10,000 to $24,999 | 22,705 (9.1%) | 10,627 (1.8%) |
| $25,000 to $34,999 | 17,707 (7.1%) | 18,760 (3.2%) |
| $35,000 to $49,999 | 25,468 (10.2%) | 15,507 (2.6%) |
| $50,000 to $74,999 | 40,544 (16.2%) | 31,071 (5.3%) |
| $75,000 to $99,999 | 30,543 (12.2%) | 65,781 (11.2%) |
| $100,000 to $149,999 | 42,875 (17.1%) | 72,968 (12.4%) |
| $150,000 or more | 58,619 (23.4%) | 135,637 (23.0%) |
| Total | 250,628 (100.0%) | 588,936 (100.0%) |
Property Value to Household Income Ratio in Area Code 410
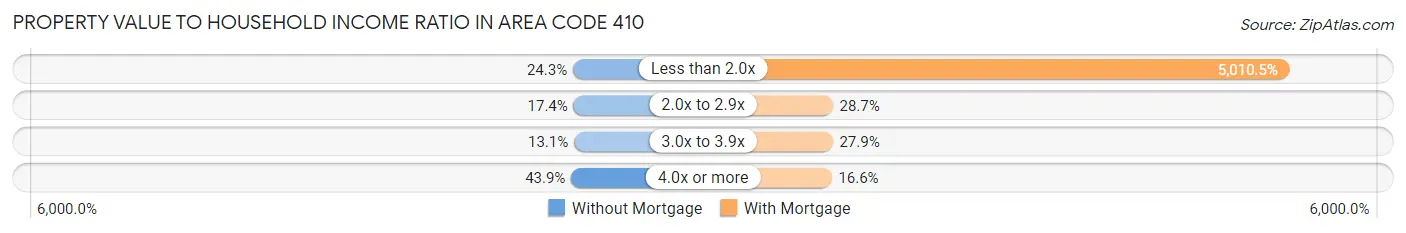
| Value-to-Income Ratio | Without Mortgage | With Mortgage |
| Less than 2.0x | 60,960 (24.3%) | 29,508,652 (5,010.5%) |
| 2.0x to 2.9x | 43,503 (17.4%) | 169,230 (28.7%) |
| 3.0x to 3.9x | 32,706 (13.1%) | 164,459 (27.9%) |
| 4.0x or more | 109,892 (43.9%) | 97,553 (16.6%) |
| Total | 250,628 (100.0%) | 588,936 (100.0%) |
Real Estate Taxes by Mortgage Status in Area Code 410
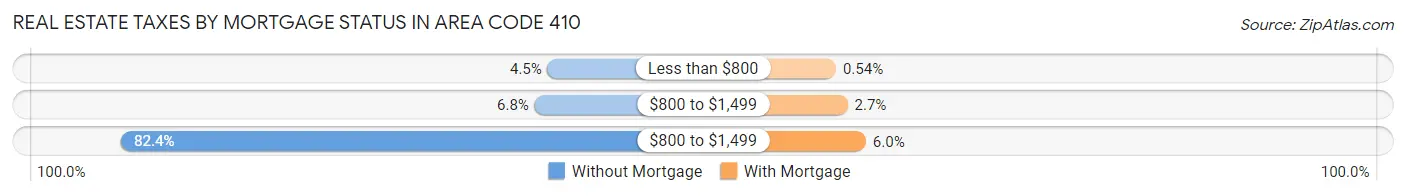
| Property Taxes | Without Mortgage | With Mortgage |
| Less than $800 | 11,201 (4.5%) | 3,165 (0.5%) |
| $800 to $1,499 | 17,117 (6.8%) | 15,646 (2.7%) |
| $800 to $1,499 | 206,419 (82.4%) | 35,319 (6.0%) |
| Total | 250,628 (100.0%) | 588,936 (100.0%) |
Health & Disability in Area Code 410
Health Insurance Coverage by Age in Area Code 410
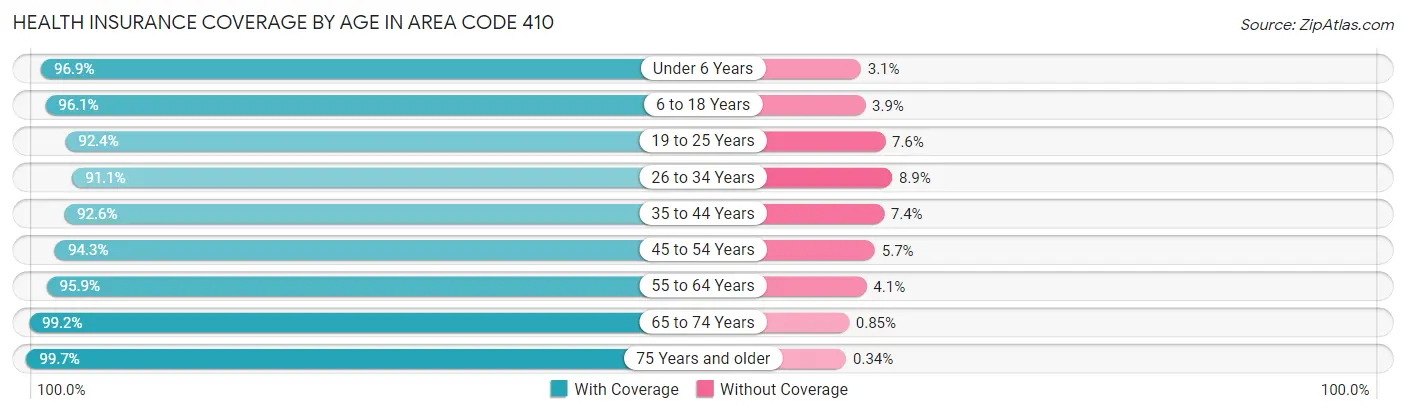
| Age Bracket | With Coverage | Without Coverage |
| Under 6 Years | 217,599 (96.9%) | 6,925 (3.1%) |
| 6 to 18 Years | 505,020 (96.1%) | 20,368 (3.9%) |
| 19 to 25 Years | 254,754 (92.4%) | 20,952 (7.6%) |
| 26 to 34 Years | 363,926 (91.1%) | 35,560 (8.9%) |
| 35 to 44 Years | 381,606 (92.6%) | 30,355 (7.4%) |
| 45 to 54 Years | 379,185 (94.3%) | 22,892 (5.7%) |
| 55 to 64 Years | 418,499 (95.9%) | 17,992 (4.1%) |
| 65 to 74 Years | 306,893 (99.2%) | 2,619 (0.9%) |
| 75 Years and older | 211,644 (99.7%) | 715 (0.3%) |
| Total | 3,039,126 (95.1%) | 158,378 (5.0%) |
Health Insurance Coverage by Citizenship Status in Area Code 410
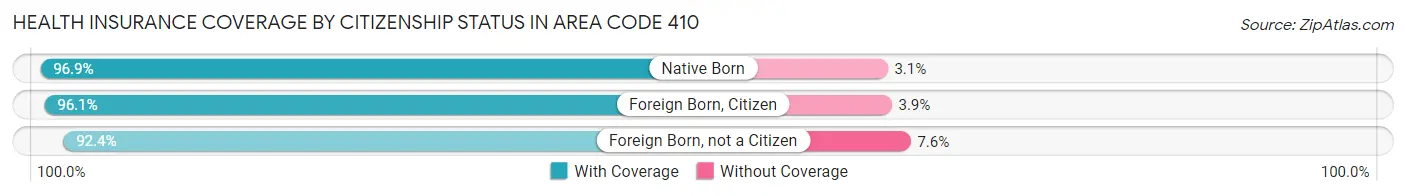
| Citizenship Status | With Coverage | Without Coverage |
| Native Born | 217,599 (96.9%) | 6,925 (3.1%) |
| Foreign Born, Citizen | 505,020 (96.1%) | 20,368 (3.9%) |
| Foreign Born, not a Citizen | 254,754 (92.4%) | 20,952 (7.6%) |
Health Insurance Coverage by Household Income in Area Code 410
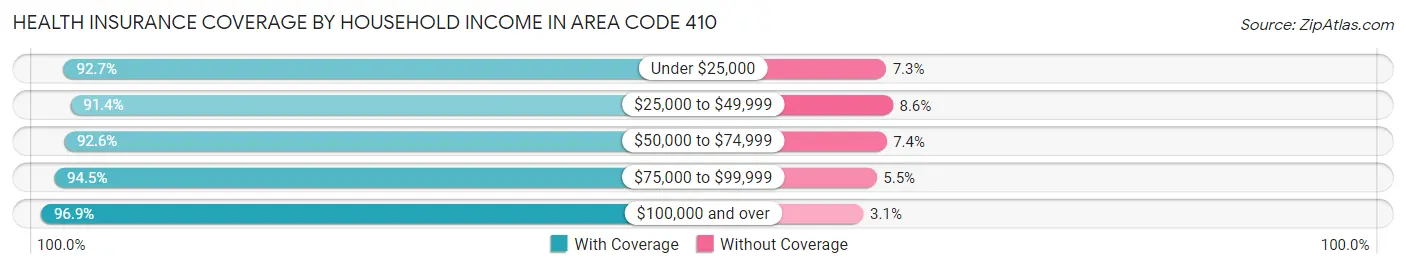
| Household Income | With Coverage | Without Coverage |
| Under $25,000 | 266,989 (92.7%) | 21,039 (7.3%) |
| $25,000 to $49,999 | 341,665 (91.4%) | 32,039 (8.6%) |
| $50,000 to $74,999 | 369,606 (92.6%) | 29,466 (7.4%) |
| $75,000 to $99,999 | 363,666 (94.5%) | 21,278 (5.5%) |
| $100,000 and over | 1,659,375 (96.9%) | 52,524 (3.1%) |
Public vs Private Health Insurance Coverage by Age in Area Code 410
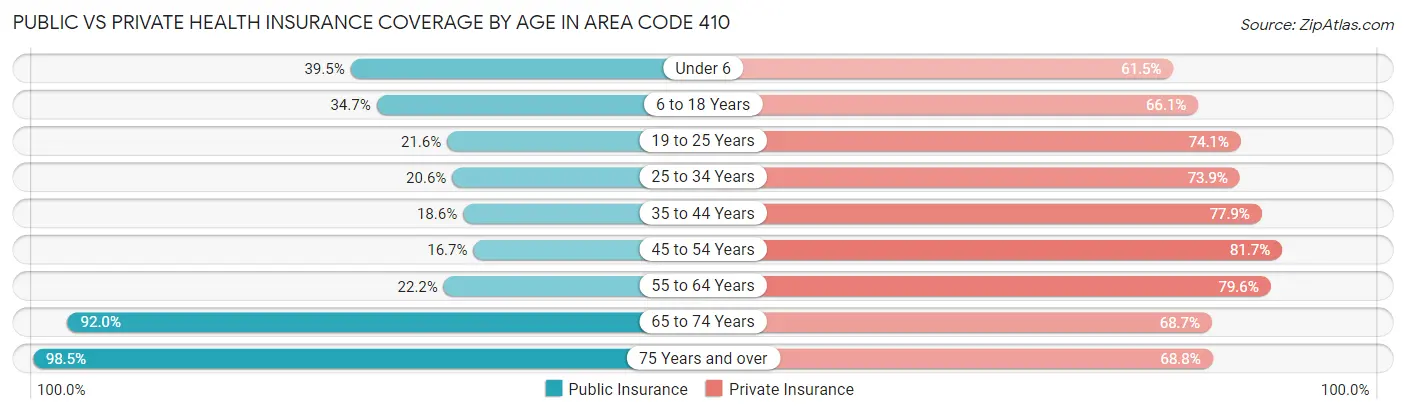
| Age Bracket | Public Insurance | Private Insurance |
| Under 6 | 88,707 (39.5%) | 138,178 (61.5%) |
| 6 to 18 Years | 182,215 (34.7%) | 347,484 (66.1%) |
| 19 to 25 Years | 59,521 (21.6%) | 204,211 (74.1%) |
| 25 to 34 Years | 82,445 (20.6%) | 295,004 (73.9%) |
| 35 to 44 Years | 76,762 (18.6%) | 321,048 (77.9%) |
| 45 to 54 Years | 67,208 (16.7%) | 328,536 (81.7%) |
| 55 to 64 Years | 97,043 (22.2%) | 347,360 (79.6%) |
| 65 to 74 Years | 284,769 (92.0%) | 212,538 (68.7%) |
| 75 Years and over | 209,101 (98.5%) | 146,114 (68.8%) |
| Total | 1,147,771 (35.9%) | 2,340,473 (73.2%) |
Disability Status by Sex by Age in Area Code 410
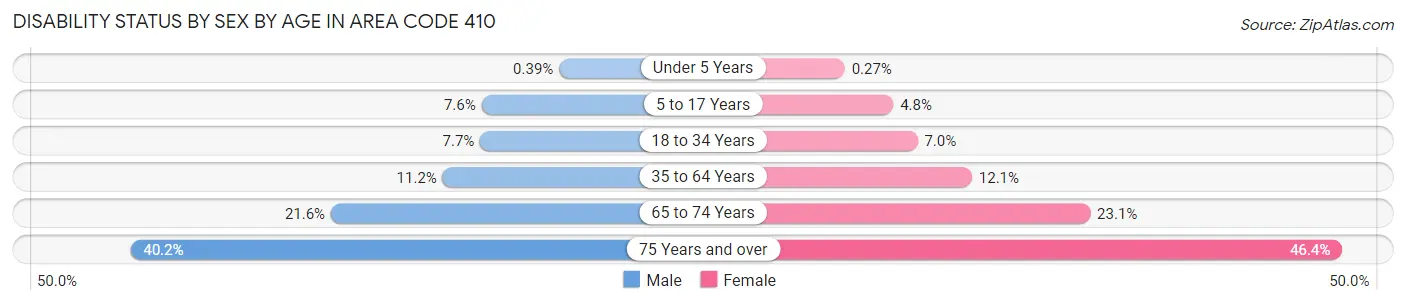
| Age Bracket | Male | Female |
| Under 5 Years | 371 (0.4%) | 245 (0.3%) |
| 5 to 17 Years | 20,098 (7.6%) | 12,126 (4.8%) |
| 18 to 34 Years | 27,050 (7.7%) | 25,904 (7.0%) |
| 35 to 64 Years | 67,191 (11.2%) | 78,585 (12.1%) |
| 65 to 74 Years | 30,494 (21.6%) | 38,746 (23.1%) |
| 75 Years and over | 34,435 (40.2%) | 58,827 (46.4%) |
Disability Class by Sex by Age in Area Code 410
Disability Class: Hearing Difficulty
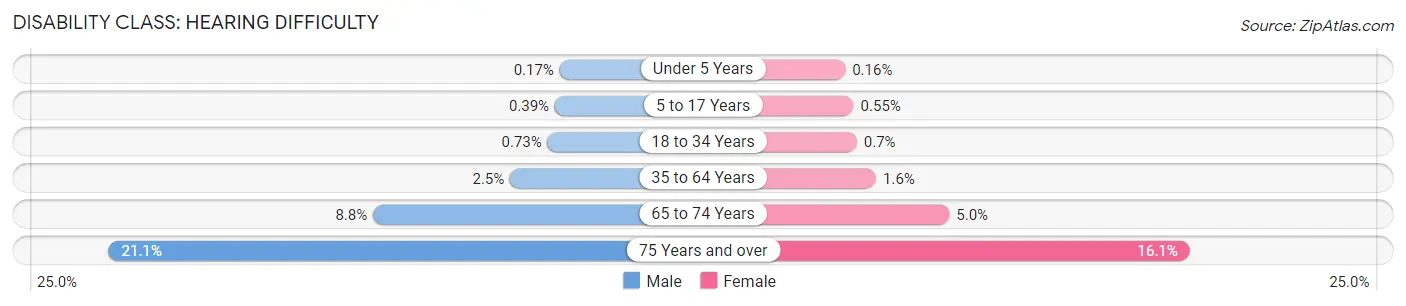
| Age Bracket | Male | Female |
| Under 5 Years | 159 (0.2%) | 143 (0.2%) |
| 5 to 17 Years | 1,042 (0.4%) | 1,408 (0.5%) |
| 18 to 34 Years | 2,540 (0.7%) | 2,578 (0.7%) |
| 35 to 64 Years | 14,822 (2.5%) | 10,344 (1.6%) |
| 65 to 74 Years | 12,490 (8.8%) | 8,395 (5.0%) |
| 75 Years and over | 18,075 (21.1%) | 20,451 (16.1%) |
Disability Class: Vision Difficulty
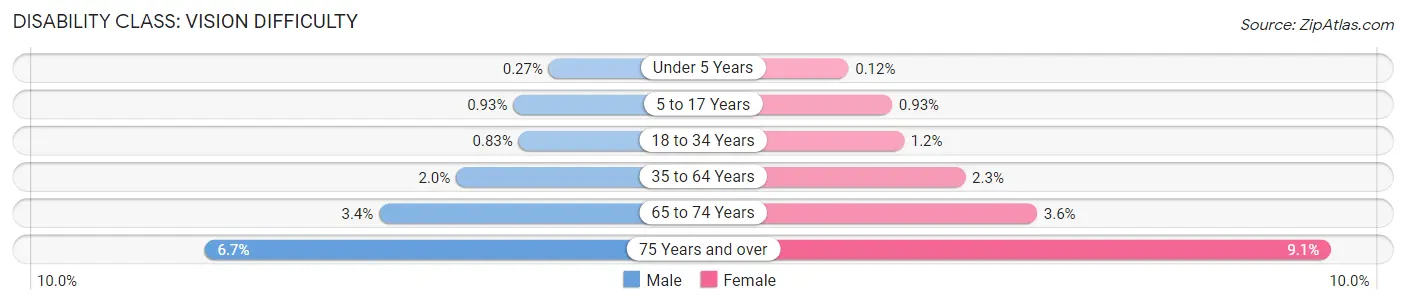
| Age Bracket | Male | Female |
| Under 5 Years | 257 (0.3%) | 112 (0.1%) |
| 5 to 17 Years | 2,466 (0.9%) | 2,368 (0.9%) |
| 18 to 34 Years | 2,922 (0.8%) | 4,258 (1.1%) |
| 35 to 64 Years | 11,938 (2.0%) | 14,880 (2.3%) |
| 65 to 74 Years | 4,835 (3.4%) | 6,094 (3.6%) |
| 75 Years and over | 5,710 (6.7%) | 11,497 (9.1%) |
Disability Class: Cognitive Difficulty
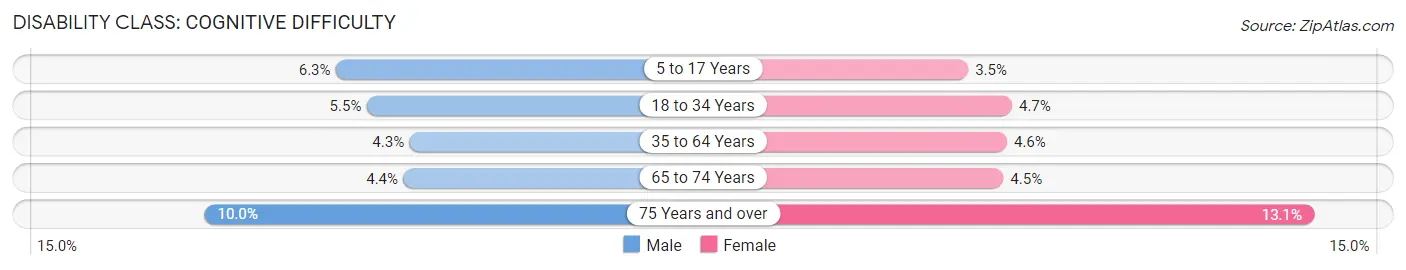
| Age Bracket | Male | Female |
| 5 to 17 Years | 16,718 (6.3%) | 8,946 (3.5%) |
| 18 to 34 Years | 19,118 (5.5%) | 17,480 (4.7%) |
| 35 to 64 Years | 25,588 (4.3%) | 29,910 (4.6%) |
| 65 to 74 Years | 6,276 (4.4%) | 7,570 (4.5%) |
| 75 Years and over | 8,557 (10.0%) | 16,641 (13.1%) |
Disability Class: Ambulatory Difficulty
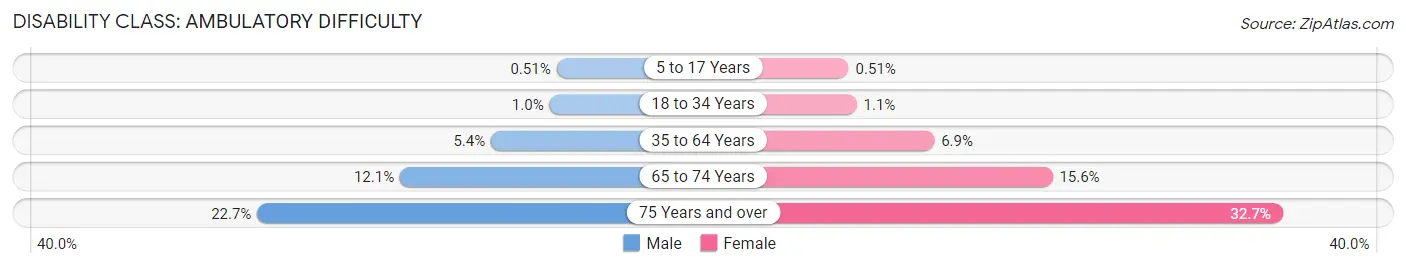
| Age Bracket | Male | Female |
| 5 to 17 Years | 1,360 (0.5%) | 1,288 (0.5%) |
| 18 to 34 Years | 3,590 (1.0%) | 4,054 (1.1%) |
| 35 to 64 Years | 32,200 (5.4%) | 44,658 (6.9%) |
| 65 to 74 Years | 17,147 (12.1%) | 26,285 (15.6%) |
| 75 Years and over | 19,474 (22.7%) | 41,461 (32.7%) |
Disability Class: Self-Care Difficulty
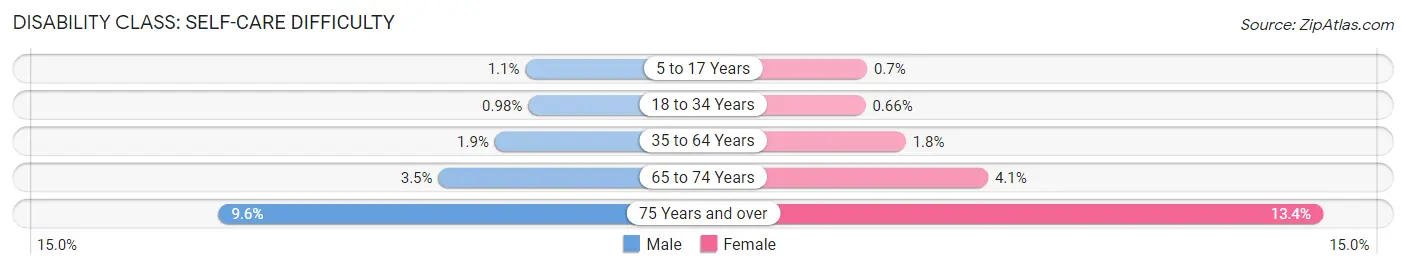
| Age Bracket | Male | Female |
| 5 to 17 Years | 2,811 (1.1%) | 1,791 (0.7%) |
| 18 to 34 Years | 3,425 (1.0%) | 2,418 (0.7%) |
| 35 to 64 Years | 11,444 (1.9%) | 11,575 (1.8%) |
| 65 to 74 Years | 4,924 (3.5%) | 6,836 (4.1%) |
| 75 Years and over | 8,223 (9.6%) | 16,963 (13.4%) |
Technology Access in Area Code 410
Computing Device Access in Area Code 410
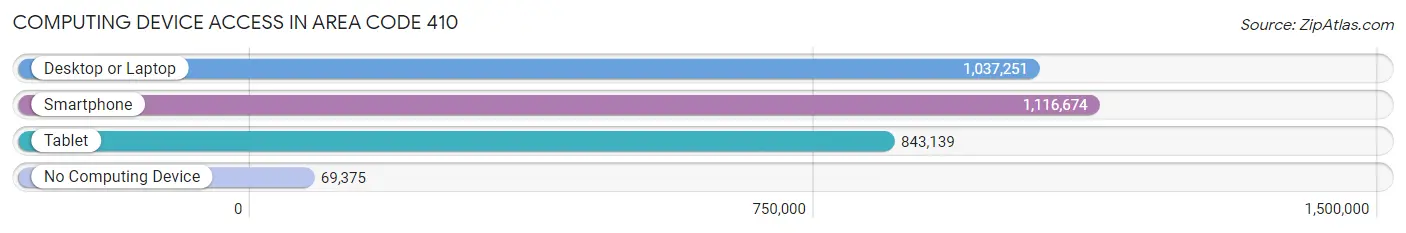
| Device Type | # Households | % Households |
| Desktop or Laptop | 1,037,251 | 82.3% |
| Smartphone | 1,116,674 | 88.6% |
| Tablet | 843,139 | 66.9% |
| No Computing Device | 69,375 | 5.5% |
| Total | 1,260,286 | 100.0% |
Internet Access in Area Code 410
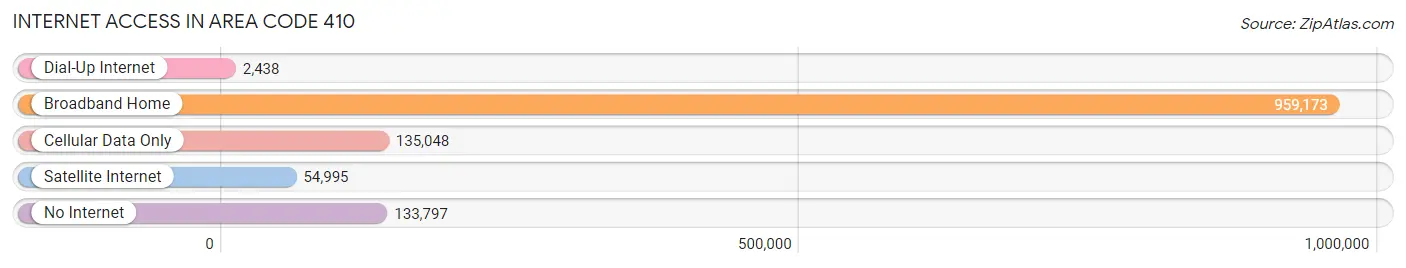
| Internet Type | # Households | % Households |
| Dial-Up Internet | 2,438 | 0.2% |
| Broadband Home | 959,173 | 76.1% |
| Cellular Data Only | 135,048 | 10.7% |
| Satellite Internet | 54,995 | 4.4% |
| No Internet | 133,797 | 10.6% |
| Total | 1,260,286 | 100.0% |
Area Code 410 Summary
Geography
Area code 410 is a telephone area code in the North American Numbering Plan (NANP) for the U.S. state of Maryland. It serves the eastern half of the state, including the Baltimore metropolitan area, the Eastern Shore, and the southern portion of the Delmarva Peninsula.
Social
Area code 410 is home to a diverse population of people from all walks of life. The area is known for its vibrant culture, with a variety of restaurants, museums, and other attractions. The area is also home to a number of universities and colleges, making it a great place for students to live and learn.
Economics
Area code 410 is a major economic hub in Maryland, with a number of large businesses and corporations based in the area. The area is also home to a number of government agencies, including the Social Security Administration and the National Institutes of Health.
Demographics
Area code 410 is home to a diverse population, with a variety of ethnic and racial backgrounds. According to the 2010 census, the population of the area was 1,821,244, with a median age of 37.7 years. The area is also home to a large number of immigrants, with a foreign-born population of 11.3%.
Common Questions
What is Per Capita Income in Area Code 410?
Per Capita income in Area Code 410 is $49,621.
What is the Median Family Income in Area Code 410?
Median Family Income in Area Code 410 is $118,184.
What is the Median Household income in Area Code 410?
Median Household Income in Area Code 410 is $99,718.
What is Income or Wage Gap in Area Code 410?
Income or Wage Gap in Area Code 410 is 27.9%.
Women in Area Code 410 earn 72.1 cents for every dollar earned by a man.
What is Family Income Deficit in Area Code 410?
Family Income Deficit in Area Code 410 is $11,601.
Families that are below poverty line in Area Code 410 earn $11,601 less on average than the poverty threshold level.
What is Inequality or Gini Index in Area Code 410?
Inequality or Gini Index in Area Code 410 is 97.86.
What is the Total Population of Area Code 410?
Total Population of Area Code 410 is 3,248,729.
What is the Total Male Population of Area Code 410?
Total Male Population of Area Code 410 is 1,572,394.
What is the Total Female Population of Area Code 410?
Total Female Population of Area Code 410 is 1,676,335.
What is the Ratio of Males per 100 Females in Area Code 410?
There are 93.80 Males per 100 Females in Area Code 410.
What is the Ratio of Females per 100 Males in Area Code 410?
There are 106.61 Females per 100 Males in Area Code 410.
What is the Median Population Age in Area Code 410?
Median Population Age in Area Code 410 is 44.2 Years.
What is the Average Family Size in Area Code 410
Average Family Size in Area Code 410 is 3.0 People.
What is the Average Household Size in Area Code 410
Average Household Size in Area Code 410 is 2.5 People.
How Large is the Labor Force in Area Code 410?
There are 1,655,169 People in the Labor Forcein in Area Code 410.
What is the Percentage of People in the Labor Force in Area Code 410?
63.1% of People are in the Labor Force in Area Code 410.
What is the Unemployment Rate in Area Code 410?
Unemployment Rate in Area Code 410 is 5.4%.