Area Code 309 Map & Demographics
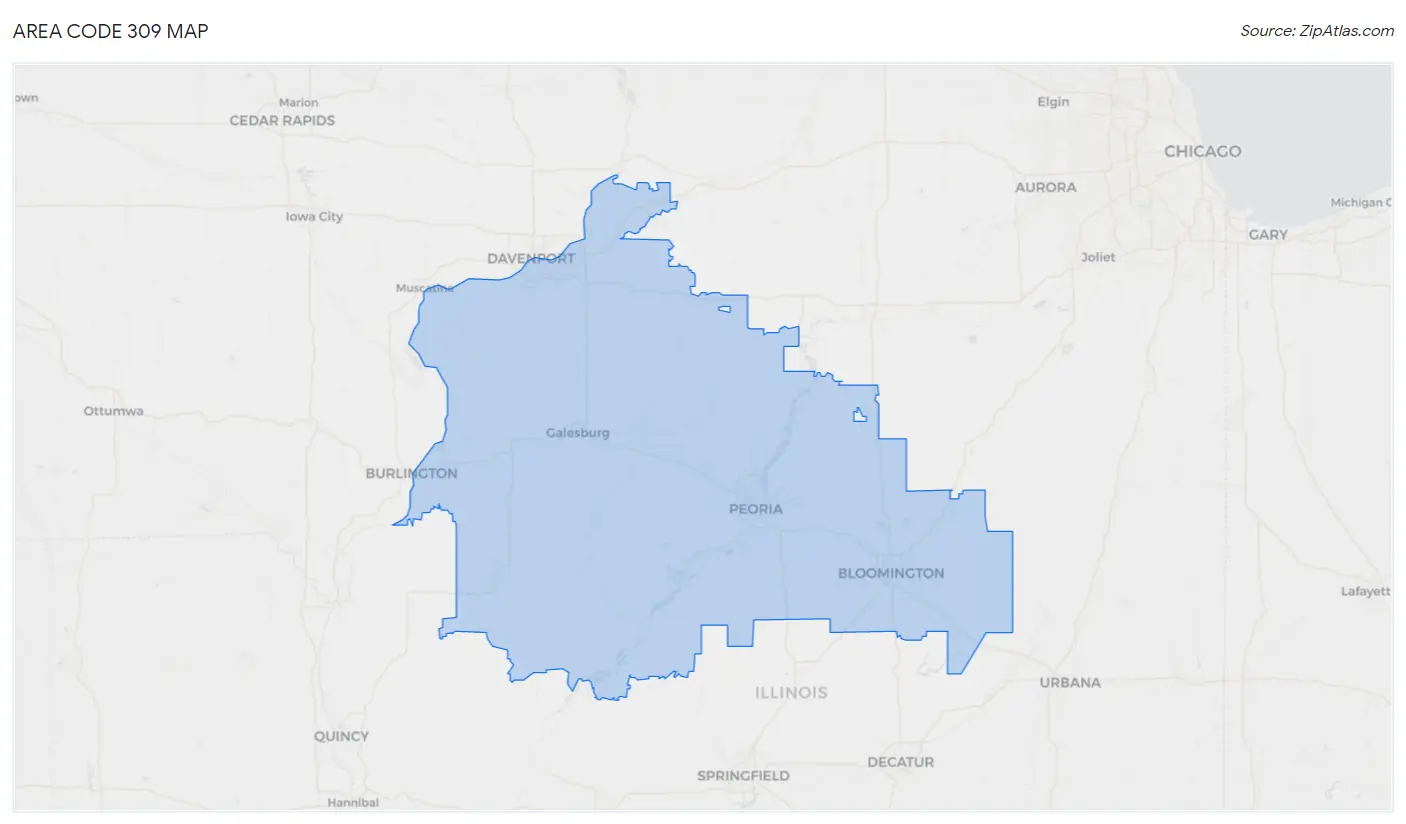
Area Code 309 Map
Area Code 309 Overview
$35,400
PER CAPITA INCOME
$86,527
AVG FAMILY INCOME
$71,096
AVG HOUSEHOLD INCOME
34.3%
WAGE / INCOME GAP [ % ]
65.7¢/ $1
WAGE / INCOME GAP [ $ ]
$11,451
FAMILY INCOME DEFICIT
81.30
INEQUALITY / GINI INDEX
899,351
TOTAL POPULATION
445,619
MALE POPULATION
453,732
FEMALE POPULATION
98.21
MALES / 100 FEMALES
101.82
FEMALES / 100 MALES
42.8
MEDIAN AGE
2.9
AVG FAMILY SIZE
2.4
AVG HOUSEHOLD SIZE
441,553
LABOR FORCE [ PEOPLE ]
61.0%
PERCENT IN LABOR FORCE
5.4%
UNEMPLOYMENT RATE
Income in Area Code 309
Income Overview in Area Code 309
Per Capita Income in Area Code 309 is $35,400, while median incomes of families and households are $86,527 and $71,096 respectively.
| Characteristic | Number | Measure |
| Per Capita Income | 899,351 | $35,400 |
| Median Family Income | 225,543 | $86,527 |
| Mean Family Income | 225,543 | $20,152,786 |
| Median Household Income | 371,721 | $71,096 |
| Mean Household Income | 371,721 | $17,662,183 |
| Income Deficit | 225,543 | $11,451 |
| Wage / Income Gap (%) | 899,351 | 34.32% |
| Wage / Income Gap ($) | 899,351 | 65.68¢ per $1 |
| Gini / Inequality Index | 899,351 | 81.30 |
Earnings by Sex in Area Code 309
Average Earnings in Area Code 309 are $41,741, $51,314 for men and $33,508 for women, a difference of 34.7%.
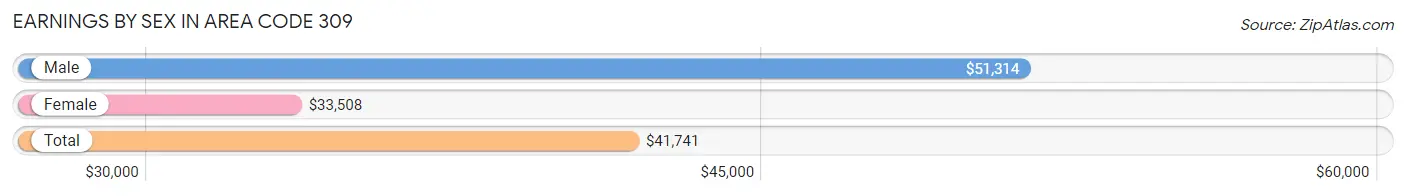
| Sex | Number | Average Earnings |
| Male | 242,279 (51.8%) | $51,314 |
| Female | 225,309 (48.2%) | $33,508 |
| Total | 467,588 (100.0%) | $41,741 |
Earnings by Sex by Income Bracket in Area Code 309
The most common earnings brackets in Area Code 309 are $100,000+ for men (39,224 | 16.2%) and $25,000 to $29,999 for women (16,686 | 7.4%).
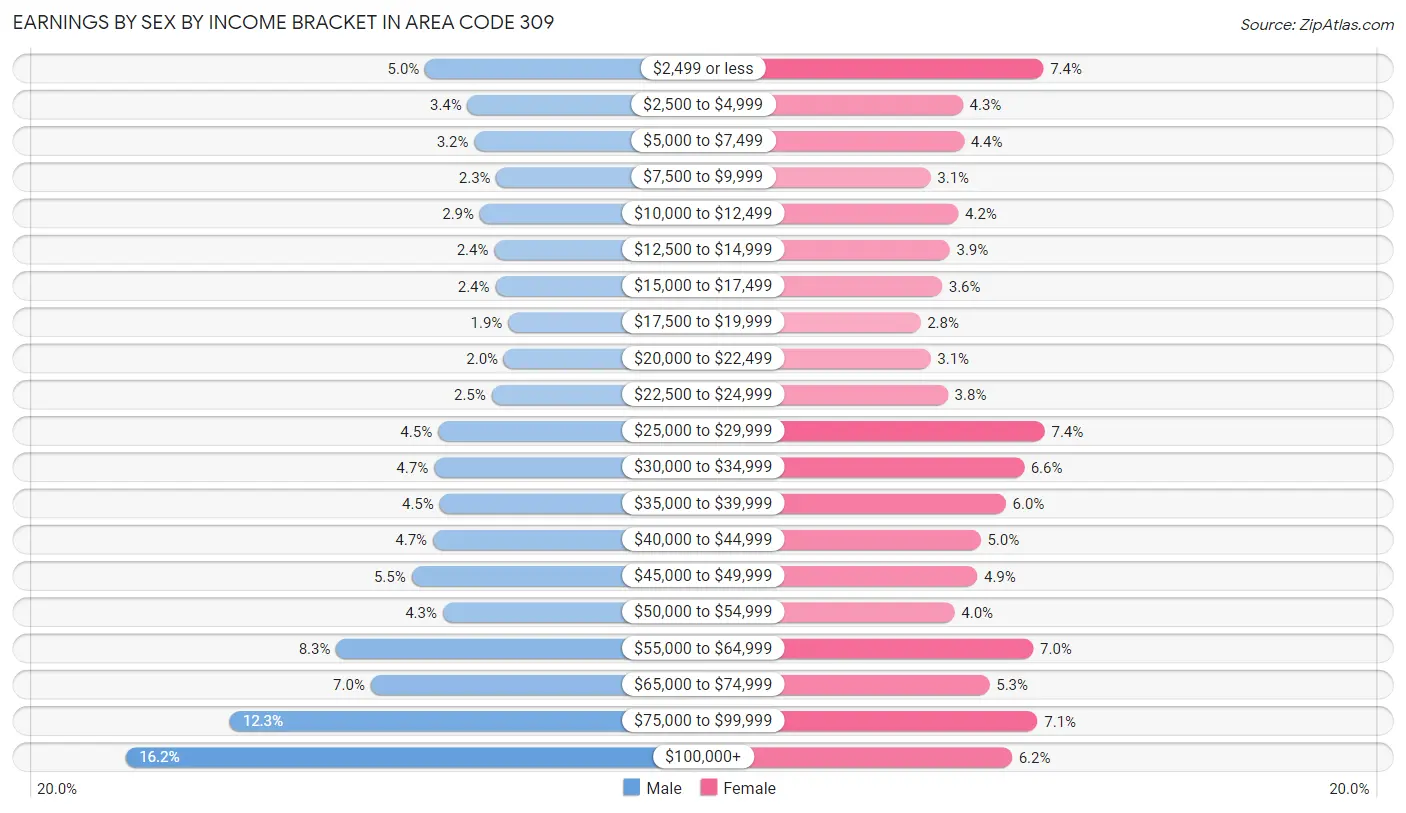
| Income | Male | Female |
| $2,499 or less | 12,087 (5.0%) | 16,574 (7.4%) |
| $2,500 to $4,999 | 8,247 (3.4%) | 9,787 (4.3%) |
| $5,000 to $7,499 | 7,641 (3.2%) | 9,874 (4.4%) |
| $7,500 to $9,999 | 5,632 (2.3%) | 7,050 (3.1%) |
| $10,000 to $12,499 | 7,123 (2.9%) | 9,395 (4.2%) |
| $12,500 to $14,999 | 5,803 (2.4%) | 8,672 (3.8%) |
| $15,000 to $17,499 | 5,721 (2.4%) | 8,031 (3.6%) |
| $17,500 to $19,999 | 4,558 (1.9%) | 6,203 (2.8%) |
| $20,000 to $22,499 | 4,939 (2.0%) | 7,063 (3.1%) |
| $22,500 to $24,999 | 6,067 (2.5%) | 8,526 (3.8%) |
| $25,000 to $29,999 | 10,936 (4.5%) | 16,686 (7.4%) |
| $30,000 to $34,999 | 11,301 (4.7%) | 14,933 (6.6%) |
| $35,000 to $39,999 | 10,792 (4.4%) | 13,397 (5.9%) |
| $40,000 to $44,999 | 11,393 (4.7%) | 11,280 (5.0%) |
| $45,000 to $49,999 | 13,327 (5.5%) | 10,992 (4.9%) |
| $50,000 to $54,999 | 10,496 (4.3%) | 9,088 (4.0%) |
| $55,000 to $64,999 | 20,150 (8.3%) | 15,720 (7.0%) |
| $65,000 to $74,999 | 17,028 (7.0%) | 12,036 (5.3%) |
| $75,000 to $99,999 | 29,814 (12.3%) | 16,076 (7.1%) |
| $100,000+ | 39,224 (16.2%) | 13,926 (6.2%) |
| Total | 242,279 (100.0%) | 225,309 (100.0%) |
Earnings by Sex by Educational Attainment in Area Code 309
Average earnings in Area Code 309 are $11,186,810 for men and $7,152,278 for women, a difference of 36.1%. Men with an educational attainment of bachelor's degree enjoy the highest average annual earnings of $10,944,639, while those with less than high school education earn the least with $3,501,354. Women with an educational attainment of bachelor's degree earn the most with the average annual earnings of $7,740,737, while those with less than high school education have the smallest earnings of $758,801.
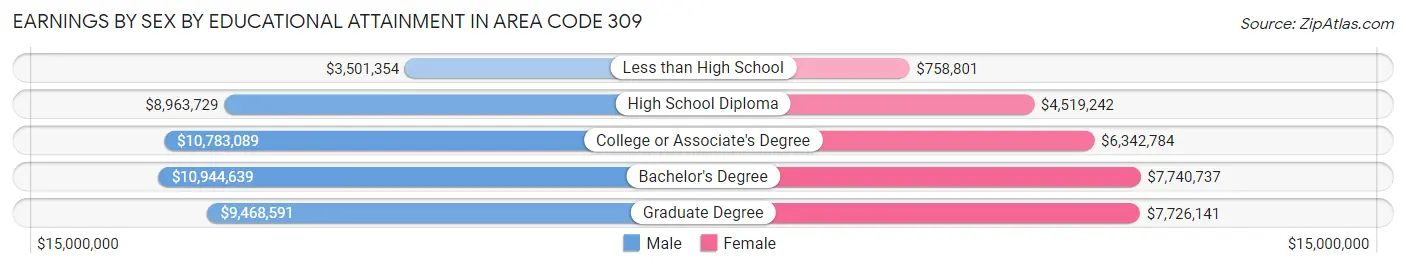
| Educational Attainment | Male Income | Female Income |
| Less than High School | $3,501,354 | $758,801 |
| High School Diploma | $8,963,729 | $4,519,242 |
| College or Associate's Degree | $10,783,089 | $6,342,784 |
| Bachelor's Degree | $10,944,639 | $7,740,737 |
| Graduate Degree | $9,468,591 | $7,726,141 |
| Total | $11,186,810 | $7,152,278 |
Family Income in Area Code 309
Family Income Brackets in Area Code 309
According to the Area Code 309 family income data, there are 10,383,098 families falling into the $100,000 to $149,999 income range, which is the most common income bracket and makes up 4,603.6% of all families. Conversely, the $10,000 to $14,999 income bracket is the least frequent group with only 736,398 families (326.5%) belonging to this category.
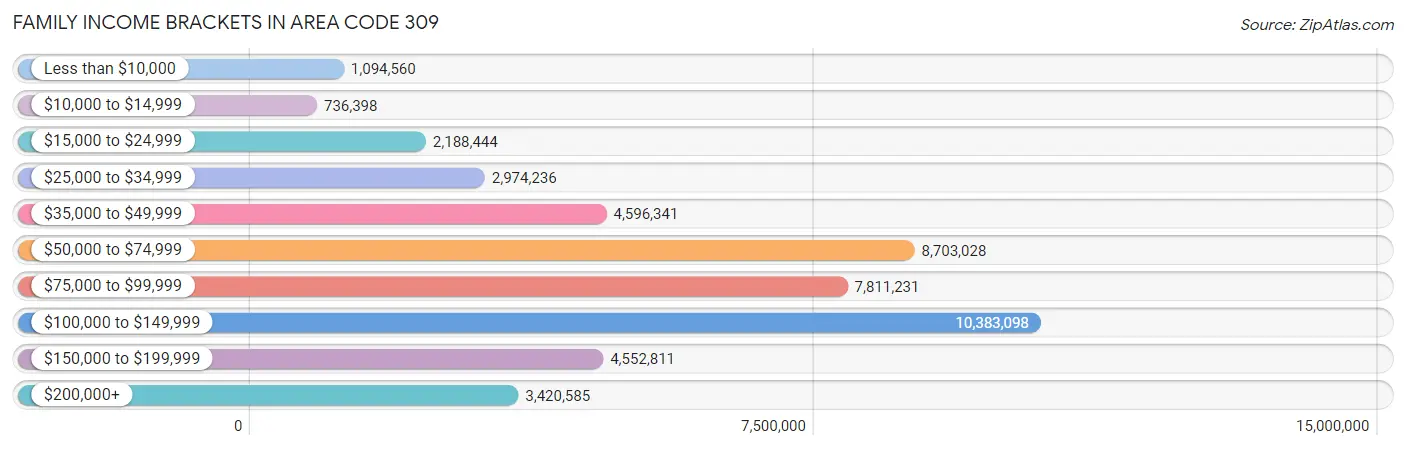
| Income Bracket | # Families | % Families |
| Less than $10,000 | 1,094,560 | 485.3% |
| $10,000 to $14,999 | 736,398 | 326.5% |
| $15,000 to $24,999 | 2,188,444 | 970.3% |
| $25,000 to $34,999 | 2,974,236 | 1,318.7% |
| $35,000 to $49,999 | 4,596,341 | 2,037.9% |
| $50,000 to $74,999 | 8,703,028 | 3,858.7% |
| $75,000 to $99,999 | 7,811,231 | 3,463.3% |
| $100,000 to $149,999 | 10,383,098 | 4,603.6% |
| $150,000 to $199,999 | 4,552,811 | 2,018.6% |
| $200,000+ | 3,420,585 | 1,516.6% |
Family Income by Famaliy Size in Area Code 309
6-person families (5,802 | 2.6%) account for the highest median family income in Area Code 309 with $117,042 per family, while 2-person families (119,238 | 52.9%) have the highest median income of $39,034 per family member.
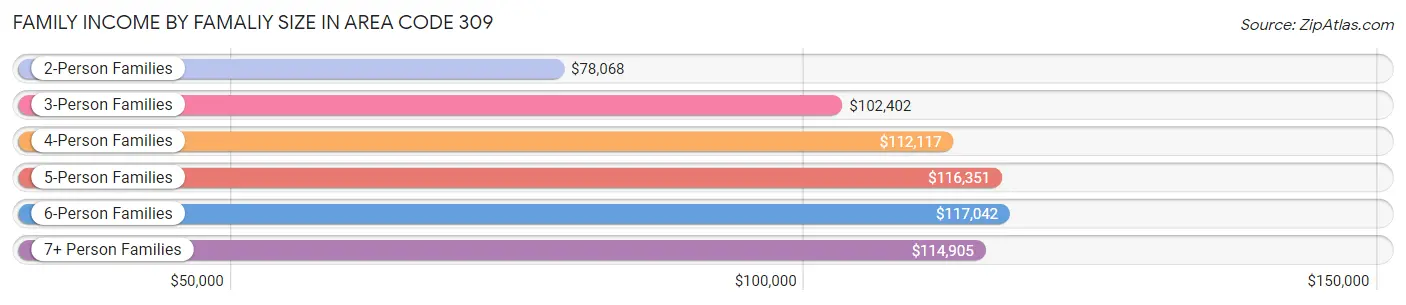
| Income Bracket | # Families | Median Income |
| 2-Person Families | 119,238 (52.9%) | $78,068 |
| 3-Person Families | 44,857 (19.9%) | $102,402 |
| 4-Person Families | 36,713 (16.3%) | $112,116 |
| 5-Person Families | 16,708 (7.4%) | $116,351 |
| 6-Person Families | 5,802 (2.6%) | $117,042 |
| 7+ Person Families | 2,225 (1.0%) | $114,905 |
| Total | 225,543 (100.0%) | $86,527 |
Family Income by Number of Earners in Area Code 309
The median family income in Area Code 309 is $86,527, with families comprising 3+ earners (21,940) having the highest median family income of $141,457, while families with no earners (39,472) have the lowest median family income of $60,085, accounting for 9.7% and 17.5% of families, respectively.
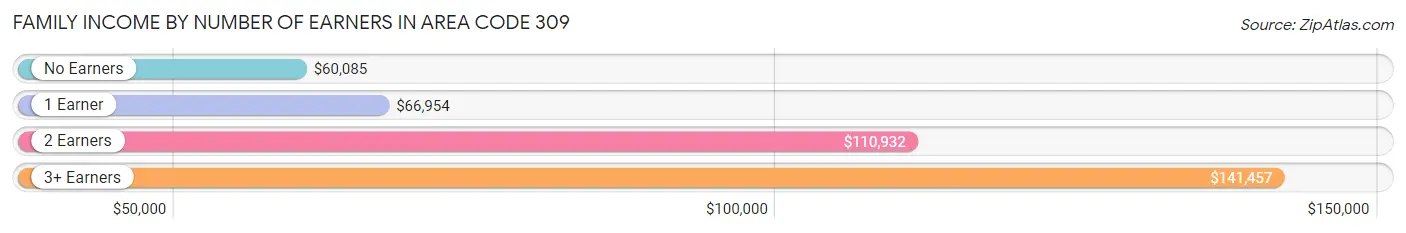
| Number of Earners | # Families | Median Income |
| No Earners | 39,472 (17.5%) | $60,085 |
| 1 Earner | 71,643 (31.8%) | $66,954 |
| 2 Earners | 92,488 (41.0%) | $110,932 |
| 3+ Earners | 21,940 (9.7%) | $141,457 |
| Total | 225,543 (100.0%) | $86,527 |
Household Income in Area Code 309
Household Income Brackets in Area Code 309
With 13,705,725 households falling in the category, the $50,000 to $74,999 income range is the most frequent in Area Code 309, accounting for 3,687.1% of all households. In contrast, only 2,638,104 households (709.7%) fall into the $10,000 to $14,999 income bracket, making it the least populous group.
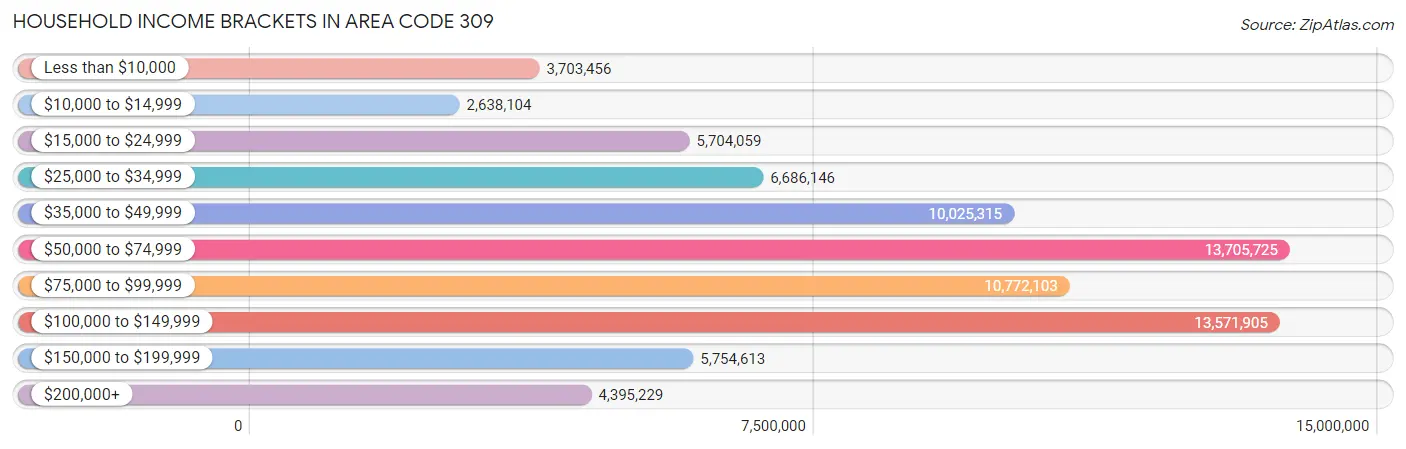
| Income Bracket | # Households | % Households |
| Less than $10,000 | 3,703,456 | 996.3% |
| $10,000 to $14,999 | 2,638,104 | 709.7% |
| $15,000 to $24,999 | 5,704,059 | 1,534.5% |
| $25,000 to $34,999 | 6,686,146 | 1,798.7% |
| $35,000 to $49,999 | 10,025,315 | 2,697.0% |
| $50,000 to $74,999 | 13,705,725 | 3,687.1% |
| $75,000 to $99,999 | 10,772,103 | 2,897.9% |
| $100,000 to $149,999 | 13,571,905 | 3,651.1% |
| $150,000 to $199,999 | 5,754,613 | 1,548.1% |
| $200,000+ | 4,395,229 | 1,182.4% |
Household Income by Householder Age in Area Code 309
The median household income in Area Code 309 is $71,096, with the highest median household income of $86,202 found in the 25 to 44 years age bracket for the primary householder. A total of 113,840 households (30.6%) fall into this category. Meanwhile, the 15 to 24 years age bracket for the primary householder has the lowest median household income of $48,479, with 21,356 households (5.8%) in this group.
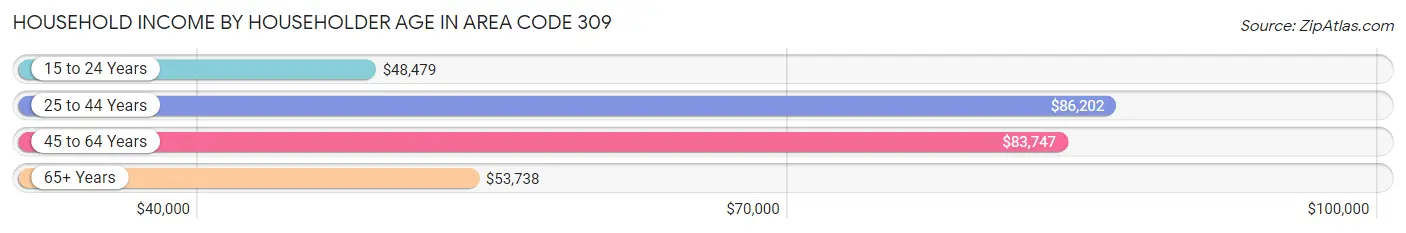
| Income Bracket | # Households | Median Income |
| 15 to 24 Years | 21,356 (5.8%) | $48,479 |
| 25 to 44 Years | 113,840 (30.6%) | $86,202 |
| 45 to 64 Years | 129,239 (34.8%) | $83,747 |
| 65+ Years | 107,286 (28.9%) | $53,738 |
| Total | 371,721 (100.0%) | $71,096 |
Poverty in Area Code 309
Income Below Poverty by Sex and Age in Area Code 309
With 12.2% poverty level for males and 14.2% for females among the residents of Area Code 309, 18 to 24 year old males and 18 to 24 year old females are the most vulnerable to poverty, with 9,004 males (22.7%) and 12,633 females (33.3%) in their respective age groups living below the poverty level.
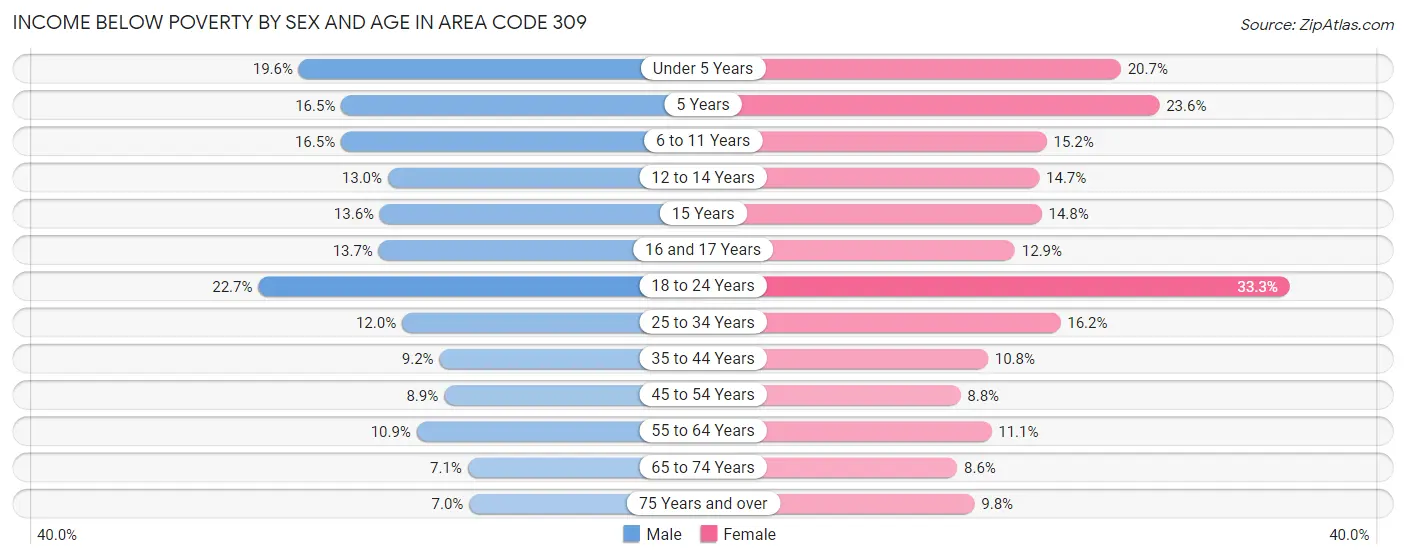
| Age Bracket | Male | Female |
| Under 5 Years | 5,110 (19.6%) | 5,070 (20.7%) |
| 5 Years | 783 (16.5%) | 1,262 (23.6%) |
| 6 to 11 Years | 5,598 (16.5%) | 4,844 (15.2%) |
| 12 to 14 Years | 2,277 (13.0%) | 2,396 (14.6%) |
| 15 Years | 794 (13.6%) | 938 (14.8%) |
| 16 and 17 Years | 1,606 (13.7%) | 1,357 (12.9%) |
| 18 to 24 Years | 9,004 (22.7%) | 12,633 (33.3%) |
| 25 to 34 Years | 6,299 (12.0%) | 8,575 (16.2%) |
| 35 to 44 Years | 4,995 (9.2%) | 5,831 (10.8%) |
| 45 to 54 Years | 4,614 (8.9%) | 4,564 (8.8%) |
| 55 to 64 Years | 6,174 (10.9%) | 6,590 (11.1%) |
| 65 to 74 Years | 3,181 (7.1%) | 4,204 (8.6%) |
| 75 Years and over | 1,931 (7.0%) | 3,765 (9.8%) |
| Total | 52,366 (12.2%) | 62,029 (14.2%) |
Income Above Poverty by Sex and Age in Area Code 309
According to the poverty statistics in Area Code 309, males aged 75 years and over and females aged 65 to 74 years are the age groups that are most secure financially, with 93.0% of males and 91.4% of females in these age groups living above the poverty line.
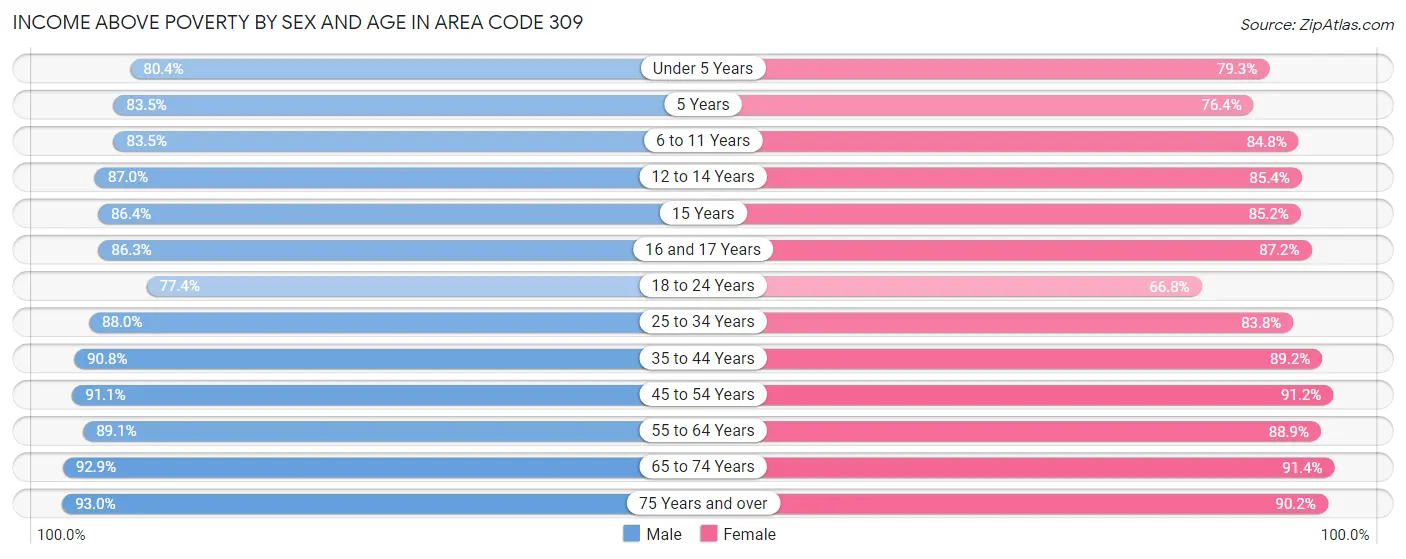
| Age Bracket | Male | Female |
| Under 5 Years | 20,904 (80.4%) | 19,413 (79.3%) |
| 5 Years | 3,964 (83.5%) | 4,092 (76.4%) |
| 6 to 11 Years | 28,316 (83.5%) | 27,019 (84.8%) |
| 12 to 14 Years | 15,197 (87.0%) | 13,958 (85.4%) |
| 15 Years | 5,035 (86.4%) | 5,386 (85.2%) |
| 16 and 17 Years | 10,104 (86.3%) | 9,200 (87.2%) |
| 18 to 24 Years | 30,747 (77.3%) | 25,361 (66.7%) |
| 25 to 34 Years | 46,269 (88.0%) | 44,283 (83.8%) |
| 35 to 44 Years | 49,278 (90.8%) | 47,943 (89.2%) |
| 45 to 54 Years | 47,487 (91.1%) | 47,299 (91.2%) |
| 55 to 64 Years | 50,545 (89.1%) | 52,803 (88.9%) |
| 65 to 74 Years | 41,599 (92.9%) | 44,920 (91.4%) |
| 75 Years and over | 25,694 (93.0%) | 34,483 (90.2%) |
| Total | 375,139 (87.7%) | 376,160 (85.8%) |
Income Below Poverty Among Married-Couple Families in Area Code 309
The poverty statistics for married-couple families in Area Code 309 show that 3.4% or 5,769 of the total 171,879 families live below the poverty line. Families with 5 or more children have the highest poverty rate of 15.1%, comprising of 171 families. On the other hand, families with 1 or 2 children have the lowest poverty rate of 2.8%, which includes 1,364 families.
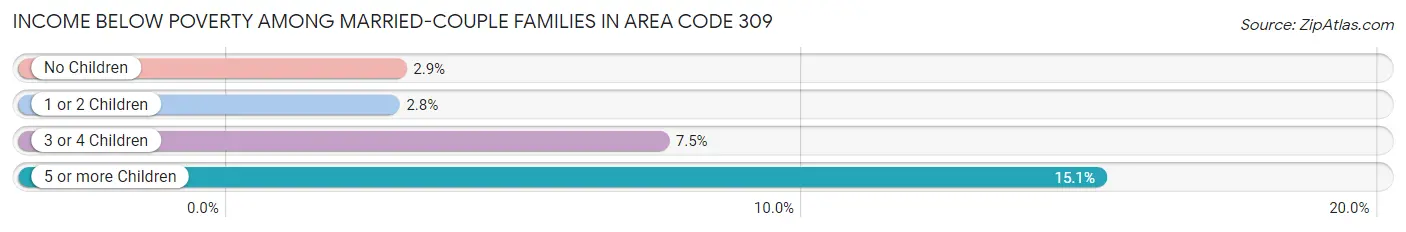
| Children | Above Poverty | Below Poverty |
| No Children | 104,734 (97.1%) | 3,163 (2.9%) |
| 1 or 2 Children | 47,215 (97.2%) | 1,364 (2.8%) |
| 3 or 4 Children | 13,201 (92.5%) | 1,071 (7.5%) |
| 5 or more Children | 960 (84.9%) | 171 (15.1%) |
| Total | 166,110 (96.6%) | 5,769 (3.4%) |
Income Below Poverty Among Single-Parent Households in Area Code 309
According to the poverty data in Area Code 309, 15.6% or 2,393 single-father households and 28.3% or 10,856 single-mother households are living below the poverty line. Among single-father households, those with 3 or 4 children have the highest poverty rate, with 372 households (30.1%) experiencing poverty. Likewise, among single-mother households, those with 5 or more children have the highest poverty rate, with 511 households (87.6%) falling below the poverty line.
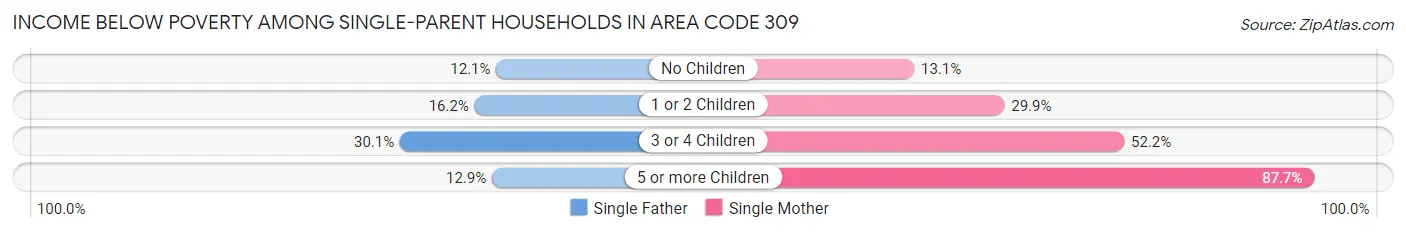
| Children | Single Father | Single Mother |
| No Children | 746 (12.1%) | 1,634 (13.1%) |
| 1 or 2 Children | 1,256 (16.2%) | 6,056 (29.9%) |
| 3 or 4 Children | 372 (30.1%) | 2,655 (52.2%) |
| 5 or more Children | 19 (12.9%) | 511 (87.6%) |
| Total | 2,393 (15.6%) | 10,856 (28.3%) |
Income Below Poverty Among Married-Couple vs Single-Parent Households in Area Code 309
The poverty data for Area Code 309 shows that 5,769 of the married-couple family households (3.4%) and 13,249 of the single-parent households (24.7%) are living below the poverty level. Within the married-couple family households, those with 5 or more children have the highest poverty rate, with 171 households (15.1%) falling below the poverty line. Among the single-parent households, those with 5 or more children have the highest poverty rate, with 530 household (72.6%) living below poverty.
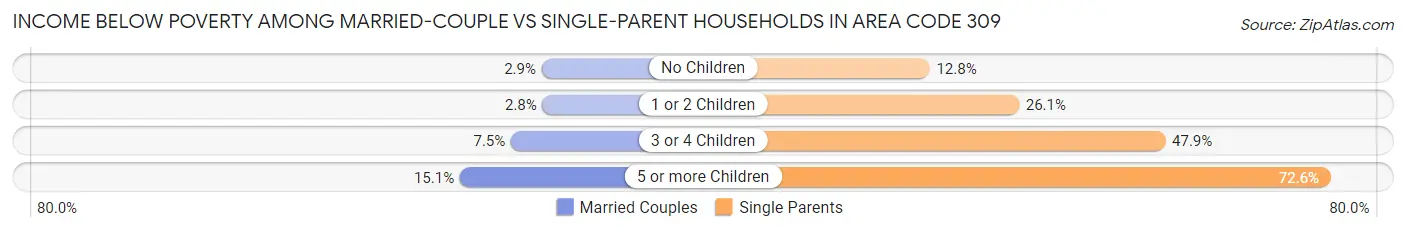
| Children | Married-Couple Families | Single-Parent Households |
| No Children | 3,163 (2.9%) | 2,380 (12.8%) |
| 1 or 2 Children | 1,364 (2.8%) | 7,312 (26.1%) |
| 3 or 4 Children | 1,071 (7.5%) | 3,027 (47.9%) |
| 5 or more Children | 171 (15.1%) | 530 (72.6%) |
| Total | 5,769 (3.4%) | 13,249 (24.7%) |
Race in Area Code 309
The most populous races in Area Code 309 are White / Caucasian (744,193 | 82.8%), Black / African American (72,009 | 8.0%), and Hispanic or Latino (53,125 | 5.9%).
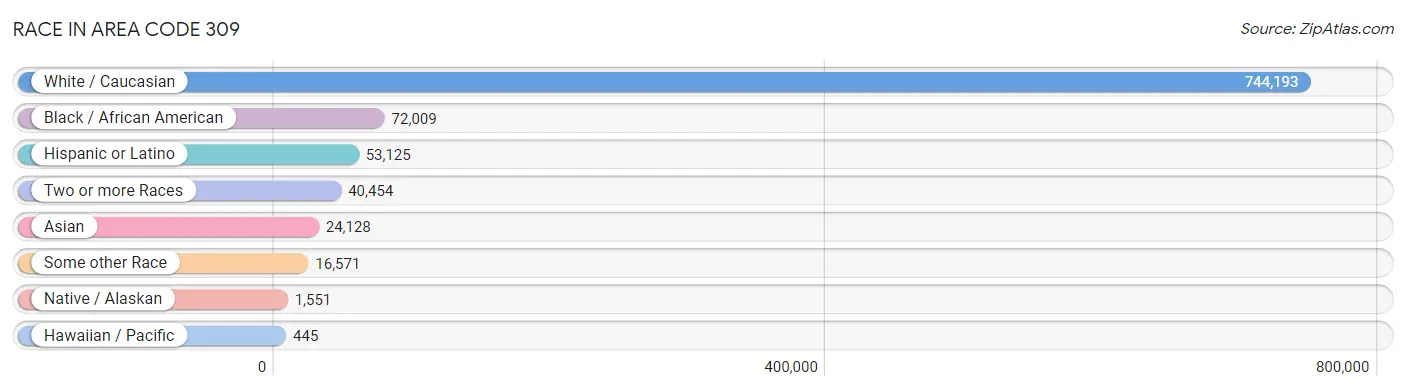
| Race | # Population | % Population |
| Asian | 24,128 | 2.7% |
| Black / African American | 72,009 | 8.0% |
| Hawaiian / Pacific | 445 | 0.1% |
| Hispanic or Latino | 53,125 | 5.9% |
| Native / Alaskan | 1,551 | 0.2% |
| White / Caucasian | 744,193 | 82.8% |
| Two or more Races | 40,454 | 4.5% |
| Some other Race | 16,571 | 1.8% |
| Total | 899,351 | 100.0% |
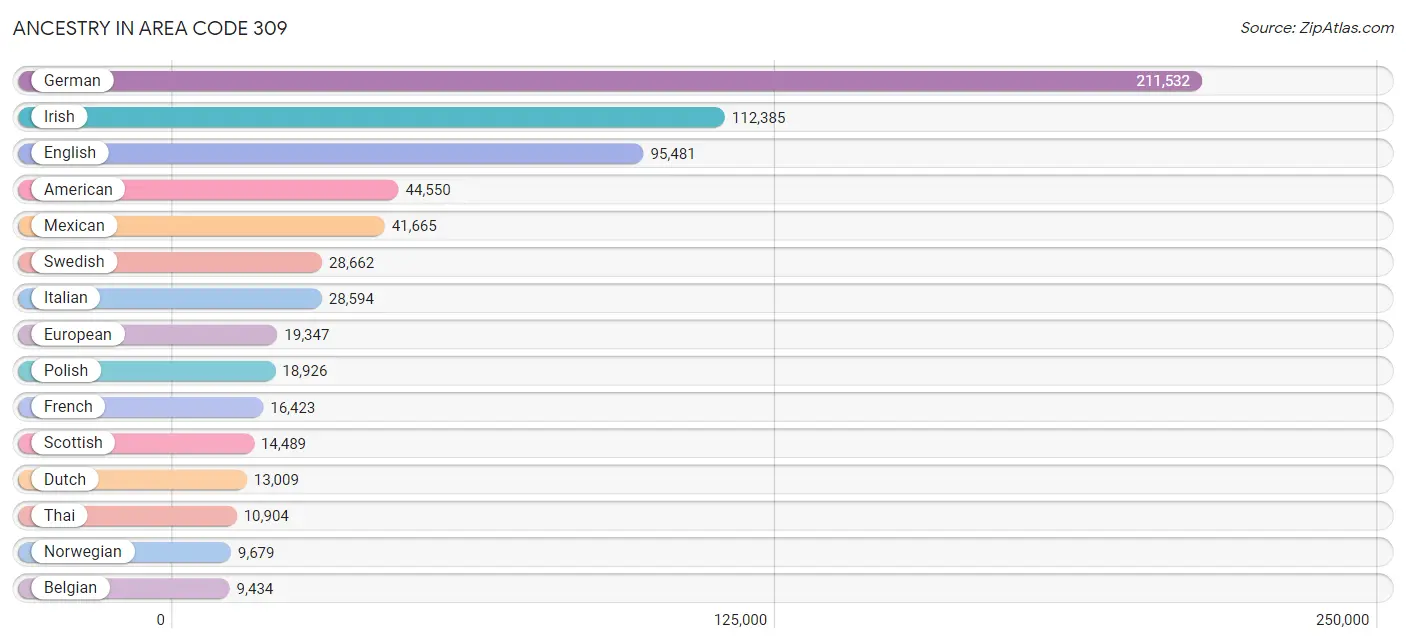
Ancestry in Area Code 309
The most populous ancestries reported in Area Code 309 are German (211,532 | 23.5%), Irish (112,385 | 12.5%), English (95,481 | 10.6%), American (44,550 | 5.0%), and Mexican (41,665 | 4.6%), together accounting for 56.2% of all Area Code 309 residents.
| Ancestry | # Population | % Population |
| African | 6,640 | 0.7% |
| Alaska Native | 59 | 0.0% |
| Albanian | 174 | 0.0% |
| Aleut | 8 | 0.0% |
| Alsatian | 34 | 0.0% |
| American | 44,550 | 5.0% |
| Apache | 71 | 0.0% |
| Arab | 3,458 | 0.4% |
| Arapaho | 17 | 0.0% |
| Argentinean | 40 | 0.0% |
| Armenian | 454 | 0.1% |
| Australian | 139 | 0.0% |
| Austrian | 1,308 | 0.2% |
| Bahamian | 4 | 0.0% |
| Bangladeshi | 4 | 0.0% |
| Barbadian | 13 | 0.0% |
| Basque | 8 | 0.0% |
| Belgian | 9,434 | 1.1% |
| Belizean | 89 | 0.0% |
| Bermudan | 10 | 0.0% |
| Bhutanese | 1,180 | 0.1% |
| Blackfeet | 339 | 0.0% |
| Bolivian | 114 | 0.0% |
| Brazilian | 130 | 0.0% |
| British | 4,493 | 0.5% |
| British West Indian | 1 | 0.0% |
| Bulgarian | 76 | 0.0% |
| Burmese | 2,021 | 0.2% |
| Cajun | 17 | 0.0% |
| Cambodian | 173 | 0.0% |
| Canadian | 1,050 | 0.1% |
| Cape Verdean | 23 | 0.0% |
| Celtic | 69 | 0.0% |
| Central American | 2,280 | 0.3% |
| Central American Indian | 331 | 0.0% |
| Cherokee | 1,698 | 0.2% |
| Cheyenne | 28 | 0.0% |
| Chickasaw | 7 | 0.0% |
| Chilean | 63 | 0.0% |
| Chinese | 2 | 0.0% |
| Chippewa | 95 | 0.0% |
| Choctaw | 155 | 0.0% |
| Colombian | 392 | 0.0% |
| Colville | 2 | 0.0% |
| Comanche | 28 | 0.0% |
| Costa Rican | 191 | 0.0% |
| Cree | 7 | 0.0% |
| Creek | 8 | 0.0% |
| Croatian | 1,752 | 0.2% |
| Crow | 1 | 0.0% |
| Cuban | 621 | 0.1% |
| Cypriot | 7 | 0.0% |
| Czech | 3,042 | 0.3% |
| Czechoslovakian | 821 | 0.1% |
| Danish | 3,708 | 0.4% |
| Delaware | 5 | 0.0% |
| Dominican | 97 | 0.0% |
| Dutch | 13,009 | 1.5% |
| Dutch West Indian | 7 | 0.0% |
| Eastern European | 1,301 | 0.1% |
| Ecuadorian | 172 | 0.0% |
| Egyptian | 173 | 0.0% |
| English | 95,481 | 10.6% |
| Estonian | 64 | 0.0% |
| Ethiopian | 318 | 0.0% |
| European | 19,347 | 2.1% |
| Fijian | 25 | 0.0% |
| Filipino | 184 | 0.0% |
| Finnish | 578 | 0.1% |
| French | 16,423 | 1.8% |
| French American Indian | 14 | 0.0% |
| French Canadian | 1,654 | 0.2% |
| German | 211,532 | 23.5% |
| German Russian | 51 | 0.0% |
| Ghanaian | 85 | 0.0% |
| Greek | 2,484 | 0.3% |
| Guamanian / Chamorro | 170 | 0.0% |
| Guatemalan | 802 | 0.1% |
| Guyanese | 49 | 0.0% |
| Haitian | 93 | 0.0% |
| Honduran | 765 | 0.1% |
| Hungarian | 1,918 | 0.2% |
| Icelander | 48 | 0.0% |
| Indian (Asian) | 4,729 | 0.5% |
| Indonesian | 1,935 | 0.2% |
| Inupiat | 19 | 0.0% |
| Iranian | 231 | 0.0% |
| Iraqi | 75 | 0.0% |
| Irish | 112,385 | 12.5% |
| Iroquois | 32 | 0.0% |
| Israeli | 24 | 0.0% |
| Italian | 28,594 | 3.2% |
| Jamaican | 318 | 0.0% |
| Japanese | 112 | 0.0% |
| Jordanian | 96 | 0.0% |
| Kenyan | 42 | 0.0% |
| Kiowa | 28 | 0.0% |
| Korean | 3,767 | 0.4% |
| Laotian | 43 | 0.0% |
| Latvian | 70 | 0.0% |
| Lebanese | 2,023 | 0.2% |
| Liberian | 18 | 0.0% |
| Lithuanian | 1,689 | 0.2% |
| Lumbee | 5 | 0.0% |
| Luxembourger | 170 | 0.0% |
| Macedonian | 35 | 0.0% |
| Malaysian | 167 | 0.0% |
| Maltese | 70 | 0.0% |
| Mexican | 41,665 | 4.6% |
| Mexican American Indian | 425 | 0.1% |
| Mongolian | 61 | 0.0% |
| Moroccan | 313 | 0.0% |
| Native Hawaiian | 594 | 0.1% |
| Navajo | 291 | 0.0% |
| New Zealander | 18 | 0.0% |
| Nicaraguan | 113 | 0.0% |
| Nigerian | 496 | 0.1% |
| Northern European | 1,295 | 0.1% |
| Norwegian | 9,679 | 1.1% |
| Osage | 1 | 0.0% |
| Ottawa | 7 | 0.0% |
| Paiute | 77 | 0.0% |
| Pakistani | 195 | 0.0% |
| Palestinian | 145 | 0.0% |
| Panamanian | 59 | 0.0% |
| Paraguayan | 5 | 0.0% |
| Pennsylvania German | 416 | 0.1% |
| Peruvian | 336 | 0.0% |
| Polish | 18,926 | 2.1% |
| Portuguese | 736 | 0.1% |
| Potawatomi | 12 | 0.0% |
| Pueblo | 9 | 0.0% |
| Puerto Rican | 3,325 | 0.4% |
| Puget Sound Salish | 26 | 0.0% |
| Romanian | 430 | 0.1% |
| Russian | 3,065 | 0.3% |
| Salvadoran | 350 | 0.0% |
| Samoan | 236 | 0.0% |
| Scandinavian | 2,972 | 0.3% |
| Scotch-Irish | 7,637 | 0.9% |
| Scottish | 14,489 | 1.6% |
| Senegalese | 15 | 0.0% |
| Serbian | 388 | 0.0% |
| Shoshone | 22 | 0.0% |
| Sioux | 170 | 0.0% |
| Slavic | 227 | 0.0% |
| Slovak | 958 | 0.1% |
| Slovene | 314 | 0.0% |
| Somali | 22 | 0.0% |
| South African | 18 | 0.0% |
| South American | 1,621 | 0.2% |
| South American Indian | 21 | 0.0% |
| Spaniard | 686 | 0.1% |
| Spanish | 529 | 0.1% |
| Spanish American | 32 | 0.0% |
| Sri Lankan | 2,238 | 0.3% |
| Subsaharan African | 9,314 | 1.0% |
| Sudanese | 27 | 0.0% |
| Swedish | 28,662 | 3.2% |
| Swiss | 4,692 | 0.5% |
| Syrian | 178 | 0.0% |
| Thai | 10,904 | 1.2% |
| Tlingit-Haida | 5 | 0.0% |
| Tohono O'Odham | 8 | 0.0% |
| Tongan | 36 | 0.0% |
| Trinidadian and Tobagonian | 112 | 0.0% |
| Turkish | 357 | 0.0% |
| Ugandan | 80 | 0.0% |
| Ukrainian | 632 | 0.1% |
| Uruguayan | 185 | 0.0% |
| Venezuelan | 314 | 0.0% |
| Welsh | 5,792 | 0.6% |
| West Indian | 37 | 0.0% |
| Yugoslavian | 438 | 0.1% |
| Yuman | 4 | 0.0% |
| Zimbabwean | 26 | 0.0% | View All 176 Rows |
Immigrants in Area Code 309
The most numerous immigrant groups reported in Area Code 309 came from Asia (18,874 | 2.1%), Latin America (12,620 | 1.4%), Central America (10,605 | 1.2%), Mexico (9,347 | 1.0%), and South Central Asia (8,834 | 1.0%), together accounting for 6.7% of all Area Code 309 residents.
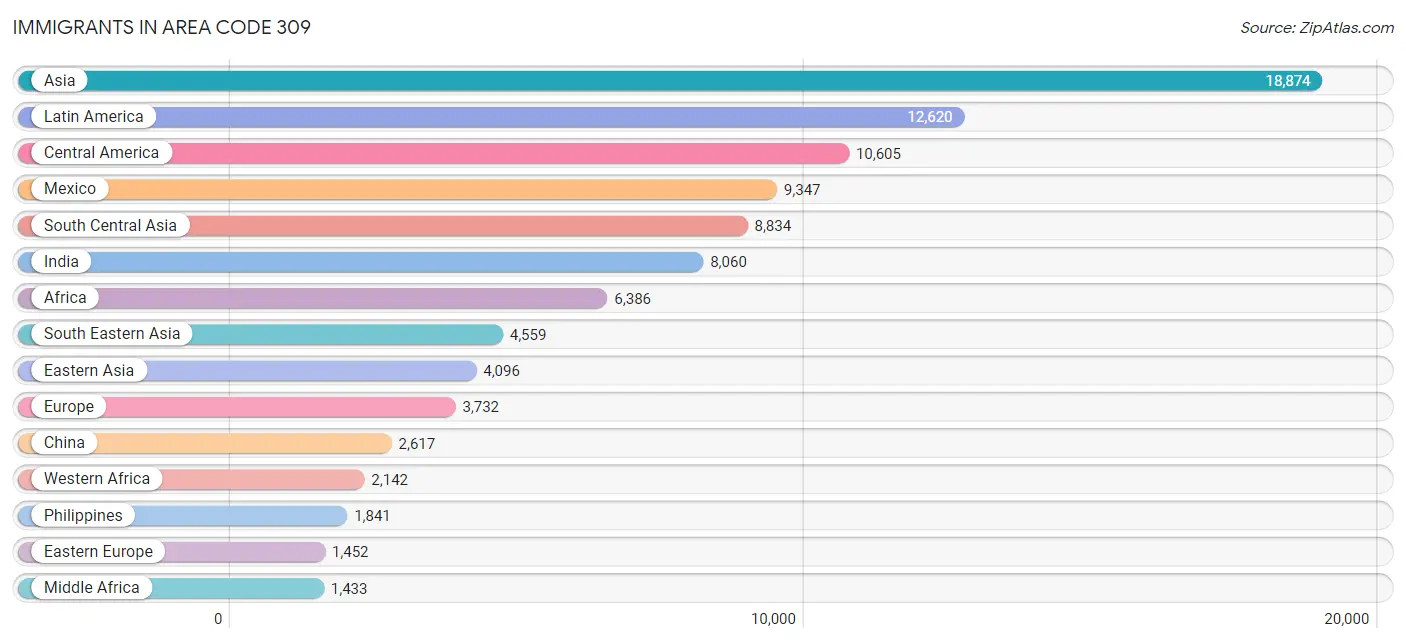
| Immigration Origin | # Population | % Population |
| Africa | 6,386 | 0.7% |
| Albania | 95 | 0.0% |
| Argentina | 19 | 0.0% |
| Armenia | 250 | 0.0% |
| Asia | 18,874 | 2.1% |
| Australia | 137 | 0.0% |
| Austria | 54 | 0.0% |
| Bahamas | 4 | 0.0% |
| Bangladesh | 14 | 0.0% |
| Belarus | 38 | 0.0% |
| Belgium | 19 | 0.0% |
| Belize | 72 | 0.0% |
| Bolivia | 20 | 0.0% |
| Bosnia and Herzegovina | 23 | 0.0% |
| Brazil | 214 | 0.0% |
| Bulgaria | 47 | 0.0% |
| Cambodia | 51 | 0.0% |
| Cameroon | 55 | 0.0% |
| Canada | 799 | 0.1% |
| Caribbean | 1,125 | 0.1% |
| Central America | 10,605 | 1.2% |
| Chile | 28 | 0.0% |
| China | 2,617 | 0.3% |
| Colombia | 235 | 0.0% |
| Congo | 502 | 0.1% |
| Costa Rica | 74 | 0.0% |
| Croatia | 33 | 0.0% |
| Cuba | 91 | 0.0% |
| Czechoslovakia | 15 | 0.0% |
| Denmark | 2 | 0.0% |
| Dominican Republic | 58 | 0.0% |
| Eastern Africa | 646 | 0.1% |
| Eastern Asia | 4,096 | 0.5% |
| Eastern Europe | 1,452 | 0.2% |
| Ecuador | 101 | 0.0% |
| Egypt | 89 | 0.0% |
| El Salvador | 145 | 0.0% |
| England | 469 | 0.1% |
| Ethiopia | 253 | 0.0% |
| Europe | 3,732 | 0.4% |
| France | 171 | 0.0% |
| Germany | 894 | 0.1% |
| Ghana | 110 | 0.0% |
| Greece | 23 | 0.0% |
| Guatemala | 468 | 0.1% |
| Guyana | 100 | 0.0% |
| Haiti | 8 | 0.0% |
| Honduras | 344 | 0.0% |
| Hong Kong | 25 | 0.0% |
| Hungary | 22 | 0.0% |
| India | 8,060 | 0.9% |
| Indonesia | 10 | 0.0% |
| Iran | 95 | 0.0% |
| Iraq | 62 | 0.0% |
| Ireland | 58 | 0.0% |
| Italy | 100 | 0.0% |
| Jamaica | 723 | 0.1% |
| Japan | 396 | 0.0% |
| Jordan | 78 | 0.0% |
| Kazakhstan | 67 | 0.0% |
| Kenya | 52 | 0.0% |
| Korea | 990 | 0.1% |
| Kuwait | 201 | 0.0% |
| Laos | 105 | 0.0% |
| Latin America | 12,620 | 1.4% |
| Latvia | 10 | 0.0% |
| Lebanon | 353 | 0.0% |
| Liberia | 80 | 0.0% |
| Lithuania | 39 | 0.0% |
| Malaysia | 184 | 0.0% |
| Mexico | 9,347 | 1.0% |
| Middle Africa | 1,433 | 0.2% |
| Moldova | 11 | 0.0% |
| Morocco | 108 | 0.0% |
| Nepal | 73 | 0.0% |
| Netherlands | 134 | 0.0% |
| Nicaragua | 142 | 0.0% |
| Nigeria | 938 | 0.1% |
| North Macedonia | 17 | 0.0% |
| Northern Africa | 303 | 0.0% |
| Northern Europe | 680 | 0.1% |
| Norway | 11 | 0.0% |
| Oceania | 174 | 0.0% |
| Pakistan | 449 | 0.1% |
| Panama | 13 | 0.0% |
| Peru | 68 | 0.0% |
| Philippines | 1,841 | 0.2% |
| Poland | 365 | 0.0% |
| Portugal | 72 | 0.0% |
| Romania | 70 | 0.0% |
| Russia | 418 | 0.1% |
| Saudi Arabia | 49 | 0.0% |
| Scotland | 40 | 0.0% |
| Senegal | 132 | 0.0% |
| Serbia | 22 | 0.0% |
| Somalia | 22 | 0.0% |
| South Africa | 42 | 0.0% |
| South America | 890 | 0.1% |
| South Central Asia | 8,834 | 1.0% |
| South Eastern Asia | 4,559 | 0.5% |
| Southern Europe | 315 | 0.0% |
| Spain | 105 | 0.0% |
| Sri Lanka | 69 | 0.0% |
| St. Vincent and the Grenadines | 18 | 0.0% |
| Sudan | 33 | 0.0% |
| Sweden | 31 | 0.0% |
| Switzerland | 13 | 0.0% |
| Syria | 119 | 0.0% |
| Taiwan | 191 | 0.0% |
| Thailand | 165 | 0.0% |
| Trinidad and Tobago | 196 | 0.0% |
| Turkey | 174 | 0.0% |
| Uganda | 37 | 0.0% |
| Ukraine | 87 | 0.0% |
| Uruguay | 64 | 0.0% |
| Venezuela | 38 | 0.0% |
| Vietnam | 1,178 | 0.1% |
| Western Africa | 2,142 | 0.2% |
| Western Asia | 1,329 | 0.2% |
| Western Europe | 1,285 | 0.1% |
| Zaire | 864 | 0.1% | View All 121 Rows |
Sex and Age in Area Code 309
Sex and Age in Area Code 309
The most populous age groups in Area Code 309 are 20 to 24 Years (33,878 | 7.6%) for men and 20 to 24 Years (32,317 | 7.1%) for women.
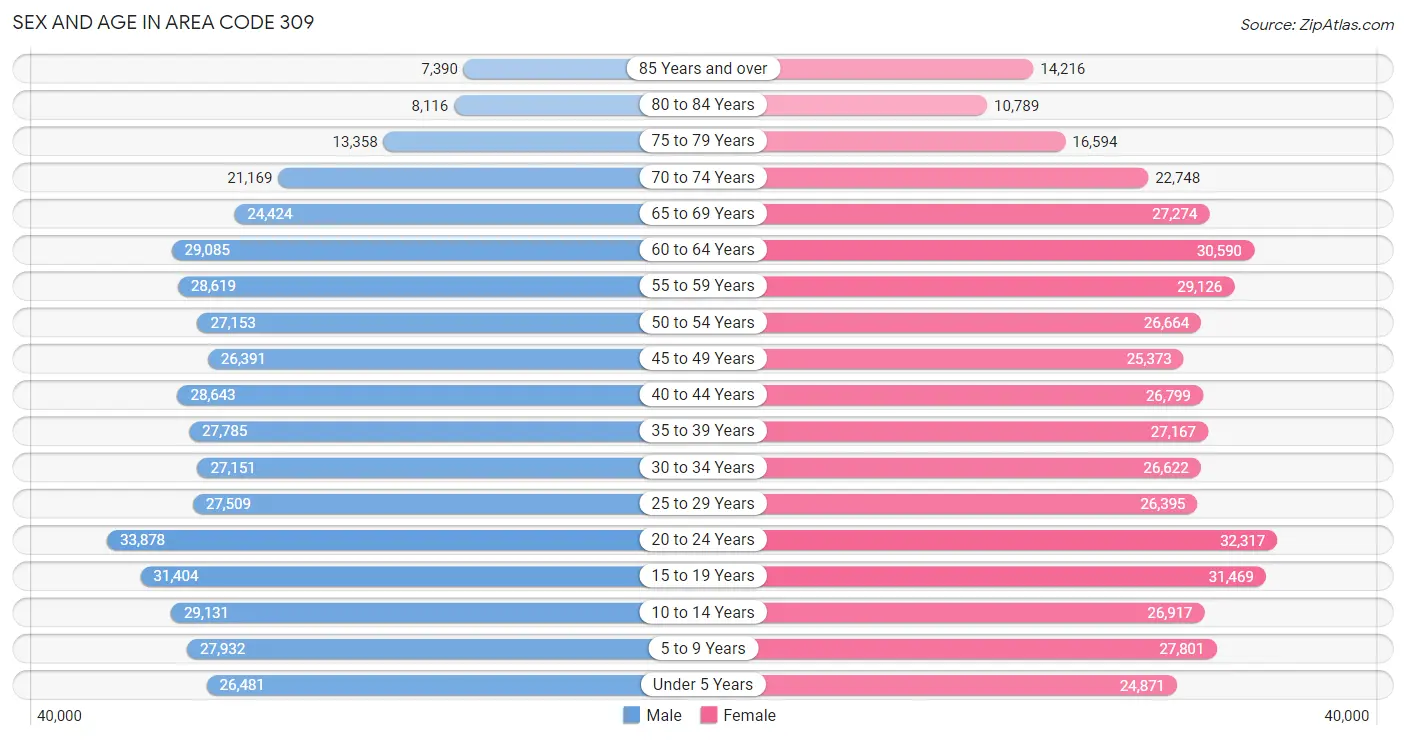
| Age Bracket | Male | Female |
| Under 5 Years | 26,481 (5.9%) | 24,871 (5.5%) |
| 5 to 9 Years | 27,932 (6.3%) | 27,801 (6.1%) |
| 10 to 14 Years | 29,131 (6.5%) | 26,917 (5.9%) |
| 15 to 19 Years | 31,404 (7.0%) | 31,469 (6.9%) |
| 20 to 24 Years | 33,878 (7.6%) | 32,317 (7.1%) |
| 25 to 29 Years | 27,509 (6.2%) | 26,395 (5.8%) |
| 30 to 34 Years | 27,151 (6.1%) | 26,622 (5.9%) |
| 35 to 39 Years | 27,785 (6.2%) | 27,167 (6.0%) |
| 40 to 44 Years | 28,643 (6.4%) | 26,799 (5.9%) |
| 45 to 49 Years | 26,391 (5.9%) | 25,373 (5.6%) |
| 50 to 54 Years | 27,153 (6.1%) | 26,664 (5.9%) |
| 55 to 59 Years | 28,619 (6.4%) | 29,126 (6.4%) |
| 60 to 64 Years | 29,085 (6.5%) | 30,590 (6.7%) |
| 65 to 69 Years | 24,424 (5.5%) | 27,274 (6.0%) |
| 70 to 74 Years | 21,169 (4.8%) | 22,748 (5.0%) |
| 75 to 79 Years | 13,358 (3.0%) | 16,594 (3.7%) |
| 80 to 84 Years | 8,116 (1.8%) | 10,789 (2.4%) |
| 85 Years and over | 7,390 (1.7%) | 14,216 (3.1%) |
| Total | 445,619 (100.0%) | 453,732 (100.0%) |
Families and Households in Area Code 309
Median Family Size in Area Code 309
The median family size in Area Code 309 is 2.94 persons per family, with married-couple families (171,879 | 76.2%) accounting for the largest median family size of 2.97404 persons per family. On the other hand, single male/father families (15,305 | 6.8%) represent the smallest median family size with 2.66 persons per family.
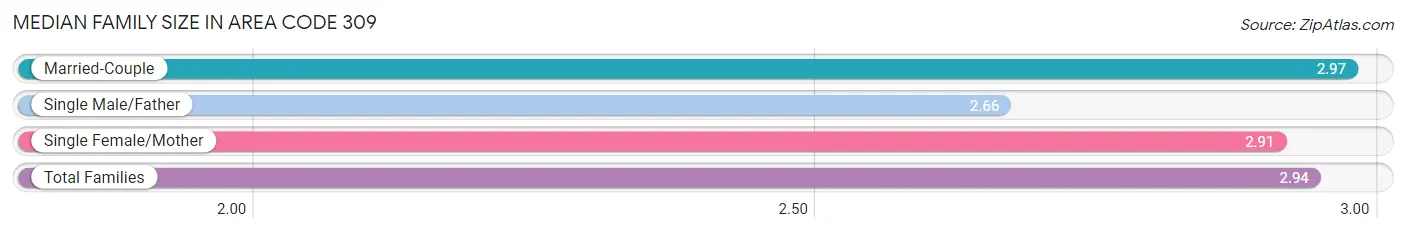
| Family Type | # Families | Family Size |
| Married-Couple | 171,879 (76.2%) | 2.97 |
| Single Male/Father | 15,305 (6.8%) | 2.66 |
| Single Female/Mother | 38,359 (17.0%) | 2.91 |
| Total Families | 225,543 (100.0%) | 2.94 |
Median Household Size in Area Code 309
The median household size in Area Code 309 is 2.41 persons per household, with single male/father households (15,305 | 4.1%) accounting for the largest median household size of 3.20668 persons per household. non-family households (146,178 | 39.3%) represent the smallest median household size with 1.22 persons per household.
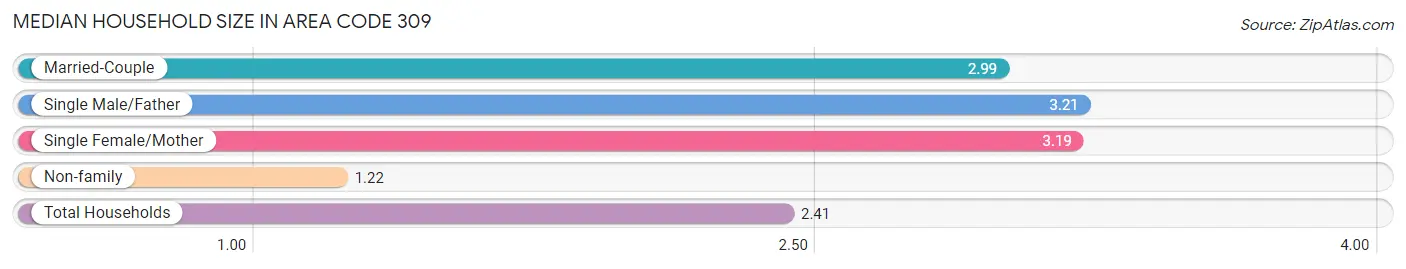
| Household Type | # Households | Household Size |
| Married-Couple | 171,879 (46.2%) | 2.99 |
| Single Male/Father | 15,305 (4.1%) | 3.21 |
| Single Female/Mother | 38,359 (10.3%) | 3.19 |
| Non-family | 146,178 (39.3%) | 1.22 |
| Total Households | 371,721 (100.0%) | 2.41 |
Household Size by Marriage Status in Area Code 309
Out of a total of 371,721 households in Area Code 309, 225,543 (60.7%) are family households, while 146,178 (39.3%) are nonfamily households. The most numerous type of family households are 2-person households, comprising 111,996, and the most common type of nonfamily households are 1-person households, comprising 121,766.
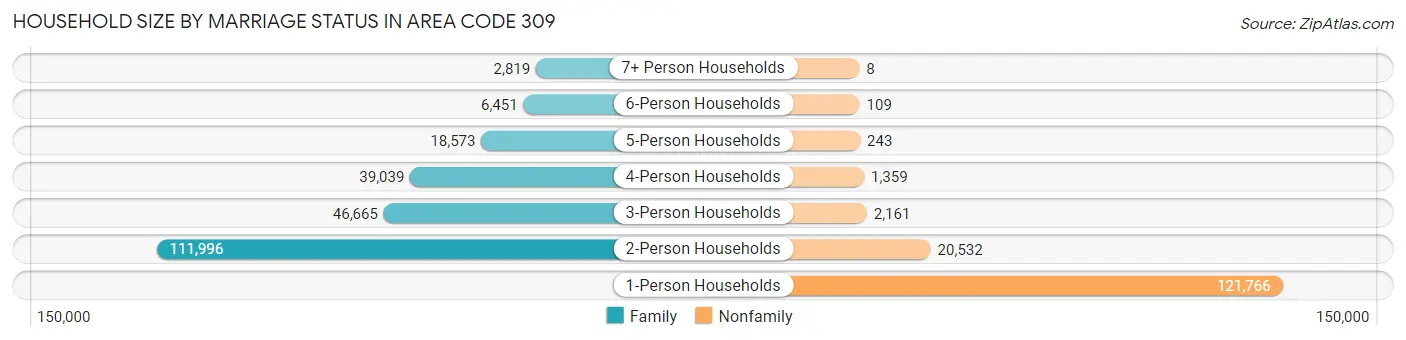
| Household Size | Family Households | Nonfamily Households |
| 1-Person Households | - | 121,766 (32.8%) |
| 2-Person Households | 111,996 (30.1%) | 20,532 (5.5%) |
| 3-Person Households | 46,665 (12.6%) | 2,161 (0.6%) |
| 4-Person Households | 39,039 (10.5%) | 1,359 (0.4%) |
| 5-Person Households | 18,573 (5.0%) | 243 (0.1%) |
| 6-Person Households | 6,451 (1.7%) | 109 (0.0%) |
| 7+ Person Households | 2,819 (0.8%) | 8 (0.0%) |
| Total | 225,543 (60.7%) | 146,178 (39.3%) |
Female Fertility in Area Code 309
Fertility by Age in Area Code 309
Average fertility rate in Area Code 309 is 70.6 births per 1,000 women. Women in the age bracket of 20 to 34 years have the highest fertility rate with 154.5 births per 1,000 women. Women in the age bracket of 20 to 34 years acount for 76.4% of all women with births.
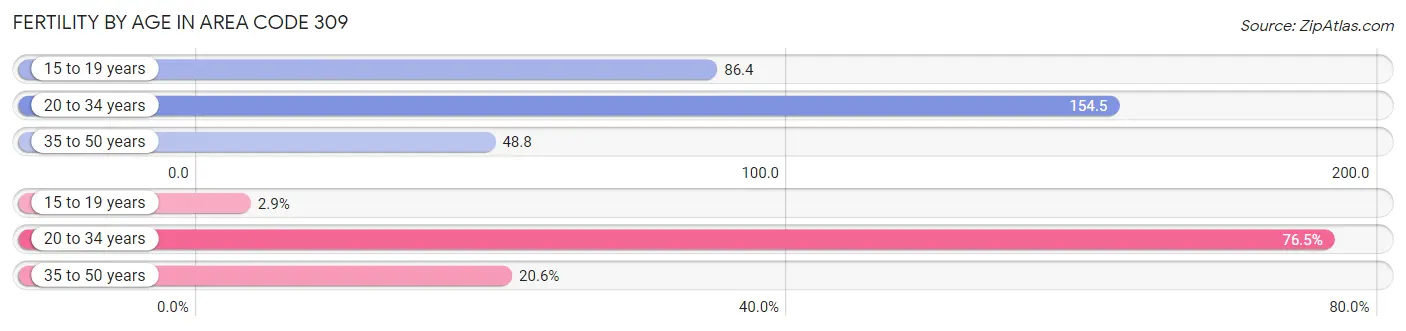
| Age Bracket | Women with Births | Births / 1,000 Women |
| 15 to 19 years | 300 (2.9%) | 86.4 |
| 20 to 34 years | 7,890 (76.4%) | 154.5 |
| 35 to 50 years | 2,130 (20.6%) | 48.8 |
| Total | 10,320 (100.0%) | 70.6 |
Fertility by Age by Marriage Status in Area Code 309
46.9% of women with births (10,320) in Area Code 309 are married. The highest percentage of unmarried women with births falls into 15 to 19 years age bracket with 98.3% of them unmarried at the time of birth, while the lowest percentage of unmarried women with births belong to 20 to 34 years age bracket with 56.9% of them unmarried.
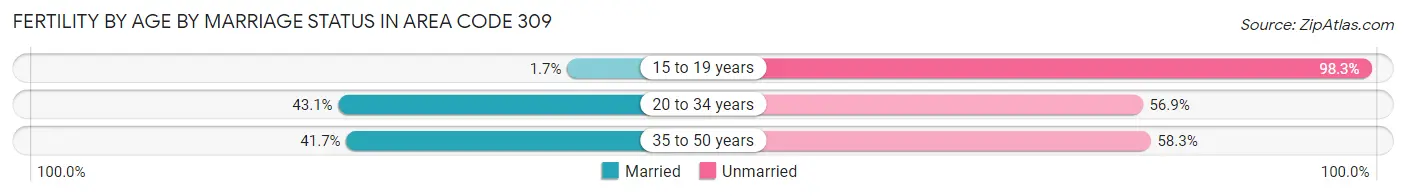
| Age Bracket | Married | Unmarried |
| 15 to 19 years | 5 (1.7%) | 295 (98.3%) |
| 20 to 34 years | 3,404 (43.1%) | 4,486 (56.9%) |
| 35 to 50 years | 888 (41.7%) | 1,242 (58.3%) |
| Total | 4,843 (46.9%) | 5,477 (53.1%) |
Fertility by Education in Area Code 309
Average fertility rate in Area Code 309 is 70.6 births per 1,000 women. Women with the education attainment of graduate degree have the highest fertility rate of 241.3 births per 1,000 women, while women with the education attainment of college or associate's degree have the lowest fertility at 82.9 births per 1,000 women. Women with the education attainment of college or associate's degree represent 33.7% of all women with births.
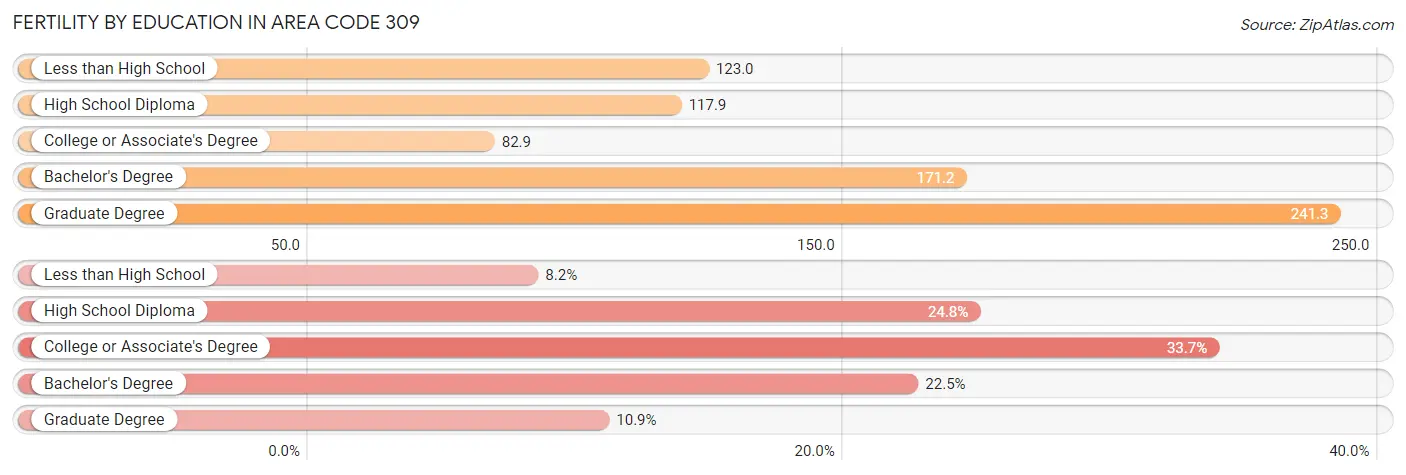
| Educational Attainment | Women with Births | Births / 1,000 Women |
| Less than High School | 847 (8.2%) | 123.0 |
| High School Diploma | 2,555 (24.8%) | 117.9 |
| College or Associate's Degree | 3,479 (33.7%) | 82.9 |
| Bachelor's Degree | 2,317 (22.5%) | 171.2 |
| Graduate Degree | 1,122 (10.9%) | 241.3 |
| Total | 10,320 (100.0%) | 70.6 |
Fertility by Education by Marriage Status in Area Code 309
53.1% of women with births in Area Code 309 are unmarried. Women with the educational attainment of graduate degree are most likely to be married with 58.5% of them married at childbirth, while women with the educational attainment of less than high school are least likely to be married with 87.8% of them unmarried at childbirth.
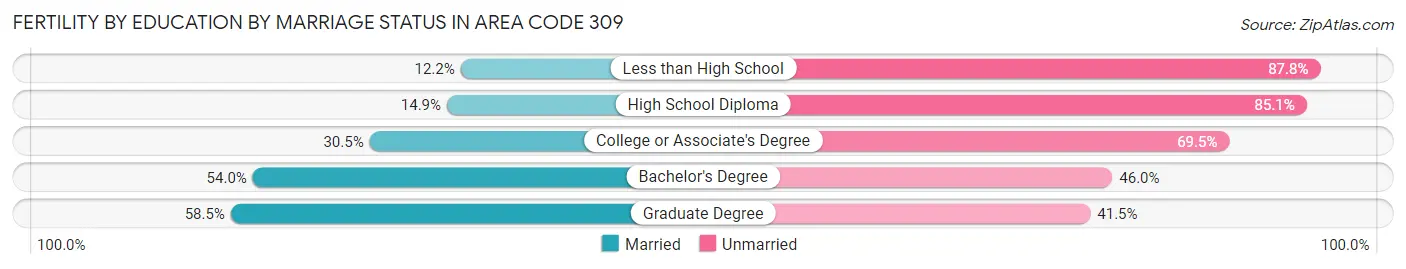
| Educational Attainment | Married | Unmarried |
| Less than High School | 103 (12.2%) | 744 (87.8%) |
| High School Diploma | 381 (14.9%) | 2,174 (85.1%) |
| College or Associate's Degree | 1,061 (30.5%) | 2,418 (69.5%) |
| Bachelor's Degree | 1,252 (54.0%) | 1,065 (46.0%) |
| Graduate Degree | 656 (58.5%) | 466 (41.5%) |
| Total | 4,843 (46.9%) | 5,477 (53.1%) |
Employment Characteristics in Area Code 309
Employment by Class of Employer in Area Code 309
Among the 412,627 employed individuals in Area Code 309, private company employees (282,518 | 68.5%), not-for-profit organizations (43,638 | 10.6%), and local government employees (30,858 | 7.5%) make up the most common classes of employment.
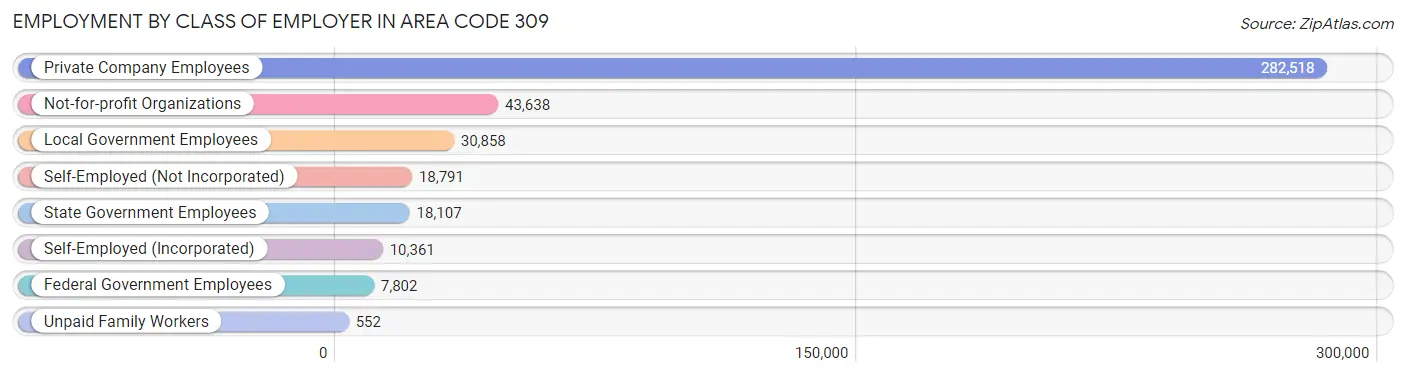
| Employer Class | # Employees | % Employees |
| Private Company Employees | 282,518 | 68.5% |
| Self-Employed (Incorporated) | 10,361 | 2.5% |
| Self-Employed (Not Incorporated) | 18,791 | 4.5% |
| Not-for-profit Organizations | 43,638 | 10.6% |
| Local Government Employees | 30,858 | 7.5% |
| State Government Employees | 18,107 | 4.4% |
| Federal Government Employees | 7,802 | 1.9% |
| Unpaid Family Workers | 552 | 0.1% |
| Total | 412,627 | 100.0% |
Employment Status by Age in Area Code 309
According to the labor force statistics for Area Code 309, out of the total population over 16 years of age (724,048), 61.0% or 441,524 individuals are in the labor force, with 5.4% or 23,886 of them unemployed. The age group with the highest labor force participation rate is 25 to 29 years, with 87.7% or 47,285 individuals in the labor force. Within the labor force, the 16 to 19 years age range has the highest percentage of unemployed individuals, with 2,899.3% or 730,450 of them being unemployed.
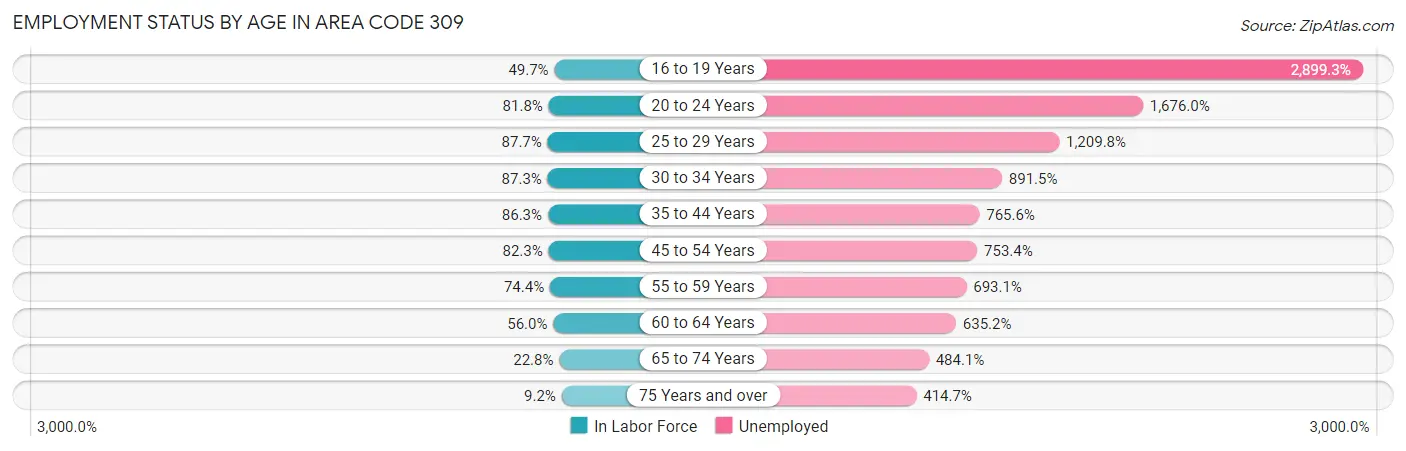
| Age Bracket | In Labor Force | Unemployed |
| 16 to 19 Years | 25,193 (49.7%) | 730,450 (2,899.3%) |
| 20 to 24 Years | 54,129 (81.8%) | 907,185 (1,676.0%) |
| 25 to 29 Years | 47,284 (87.7%) | 572,054 (1,209.8%) |
| 30 to 34 Years | 46,935 (87.3%) | 418,408 (891.5%) |
| 35 to 44 Years | 95,261 (86.3%) | 729,303 (765.6%) |
| 45 to 54 Years | 86,899 (82.3%) | 654,735 (753.4%) |
| 55 to 59 Years | 42,974 (74.4%) | 297,853 (693.1%) |
| 60 to 64 Years | 33,416 (56.0%) | 212,271 (635.2%) |
| 65 to 74 Years | 21,808 (22.8%) | 105,582 (484.1%) |
| 75 Years and over | 6,473 (9.2%) | 26,856 (414.7%) |
| Total | 441,553 (61.0%) | 23,892 (5.4%) |
Employment Status by Educational Attainment in Area Code 309
According to labor force statistics for Area Code 309, 78.6% of individuals (346,683) out of the total population between 25 and 64 years of age (441,072) are in the labor force, with 817.5% or 2,834,134 of them being unemployed. The group with the highest labor force participation rate are those with the educational attainment of bachelor's degree or higher, with 87.3% or 125,034 individuals in the labor force. Within the labor force, individuals with less than high school education have the highest percentage of unemployment, with 1,912.8% or 365,785 of them being unemployed.
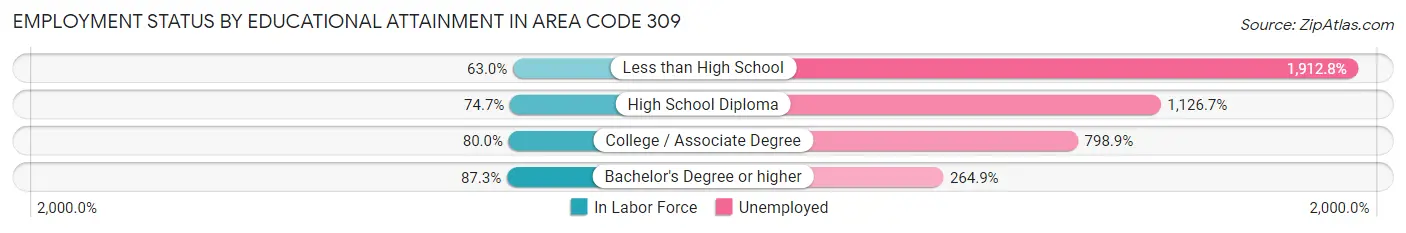
| Educational Attainment | In Labor Force | Unemployed |
| Less than High School | 19,124 (63.0%) | 580,611 (1,912.8%) |
| High School Diploma | 89,741 (74.7%) | 1,353,550 (1,126.7%) |
| College / Associate Degree | 117,818 (80.0%) | 1,176,868 (798.9%) |
| Bachelor's Degree or higher | 125,036 (87.3%) | 379,530 (264.9%) |
| Total | 346,661 (78.6%) | 3,605,764 (817.5%) |
Employment Occupations by Sex in Area Code 309
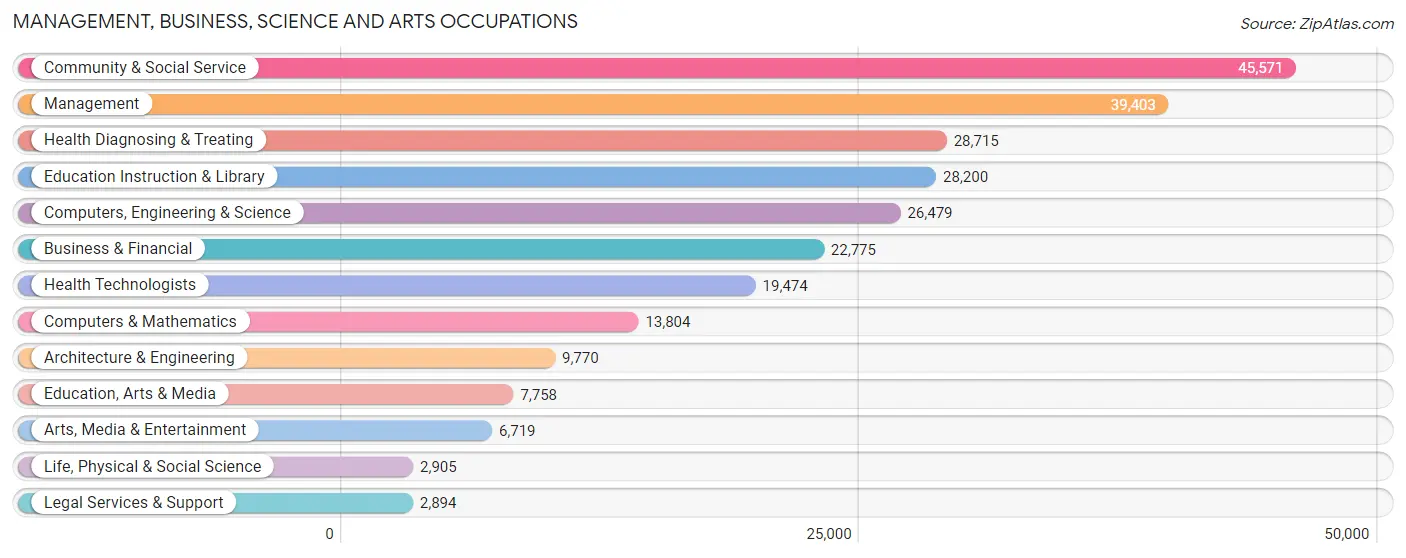
Management, Business, Science and Arts Occupations
The most common Management, Business, Science and Arts occupations in Area Code 309 are Community & Social Service (45,571 | 10.8%), Management (39,403 | 9.4%), Health Diagnosing & Treating (28,715 | 6.8%), Education Instruction & Library (28,200 | 6.7%), and Computers, Engineering & Science (26,479 | 6.3%).
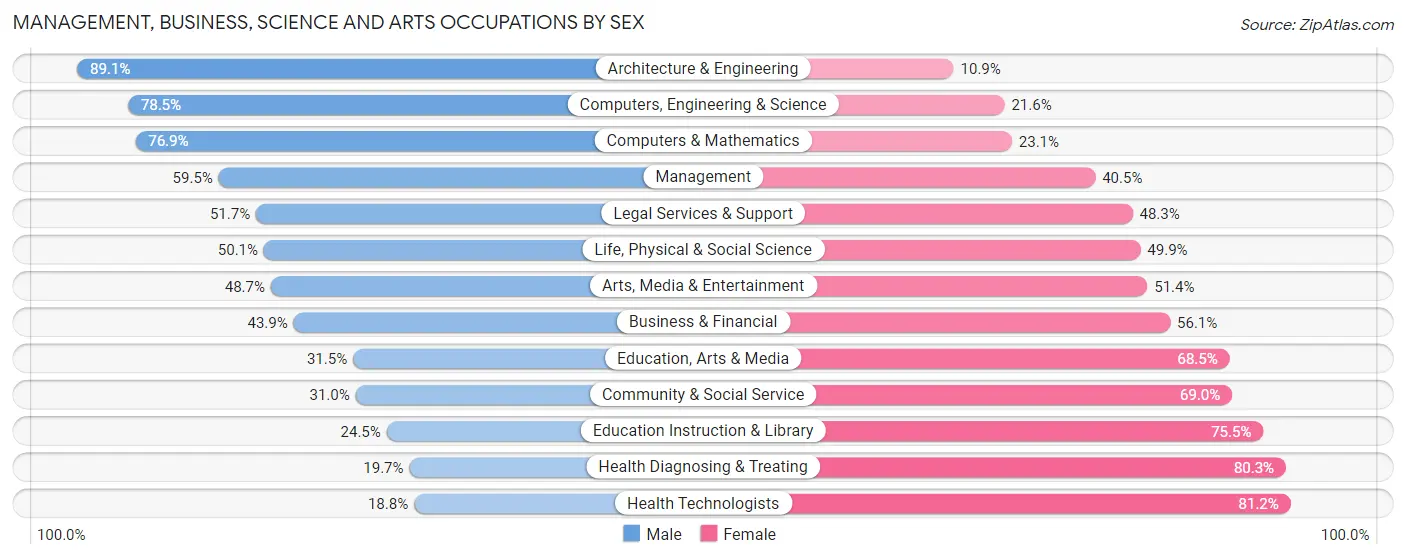
Management, Business, Science and Arts Occupations by Sex
Within the Management, Business, Science and Arts occupations in Area Code 309, the most male-oriented occupations are Architecture & Engineering (89.1%), Computers, Engineering & Science (78.4%), and Computers & Mathematics (76.9%), while the most female-oriented occupations are Health Technologists (81.2%), Health Diagnosing & Treating (80.3%), and Education Instruction & Library (75.5%).
| Occupation | Male | Female |
| Management | 23,454 (59.5%) | 15,949 (40.5%) |
| Business & Financial | 9,998 (43.9%) | 12,777 (56.1%) |
| Computers, Engineering & Science | 20,772 (78.4%) | 5,707 (21.5%) |
| Computers & Mathematics | 10,616 (76.9%) | 3,188 (23.1%) |
| Architecture & Engineering | 8,701 (89.1%) | 1,069 (10.9%) |
| Life, Physical & Social Science | 1,455 (50.1%) | 1,450 (49.9%) |
| Community & Social Service | 14,112 (31.0%) | 31,459 (69.0%) |
| Education, Arts & Media | 2,444 (31.5%) | 5,314 (68.5%) |
| Legal Services & Support | 1,497 (51.7%) | 1,397 (48.3%) |
| Education Instruction & Library | 6,902 (24.5%) | 21,298 (75.5%) |
| Arts, Media & Entertainment | 3,269 (48.6%) | 3,450 (51.3%) |
| Health Diagnosing & Treating | 5,669 (19.7%) | 23,046 (80.3%) |
| Health Technologists | 3,655 (18.8%) | 15,819 (81.2%) |
| Total (Category) | 74,005 (45.4%) | 88,938 (54.6%) |
| Total (Overall) | 217,397 (51.7%) | 203,161 (48.3%) |
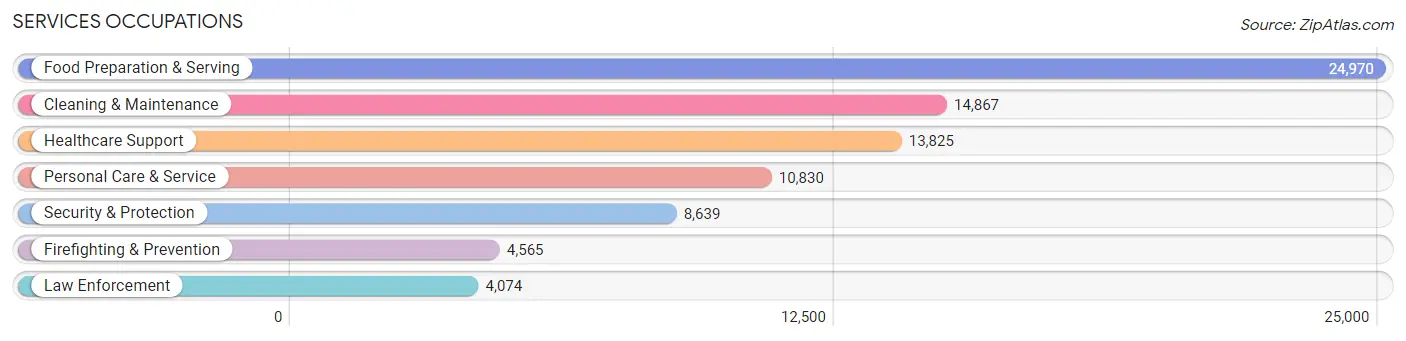
Services Occupations
The most common Services occupations in Area Code 309 are Food Preparation & Serving (24,970 | 5.9%), Cleaning & Maintenance (14,867 | 3.5%), Healthcare Support (13,825 | 3.3%), Personal Care & Service (10,830 | 2.6%), and Security & Protection (8,639 | 2.1%).
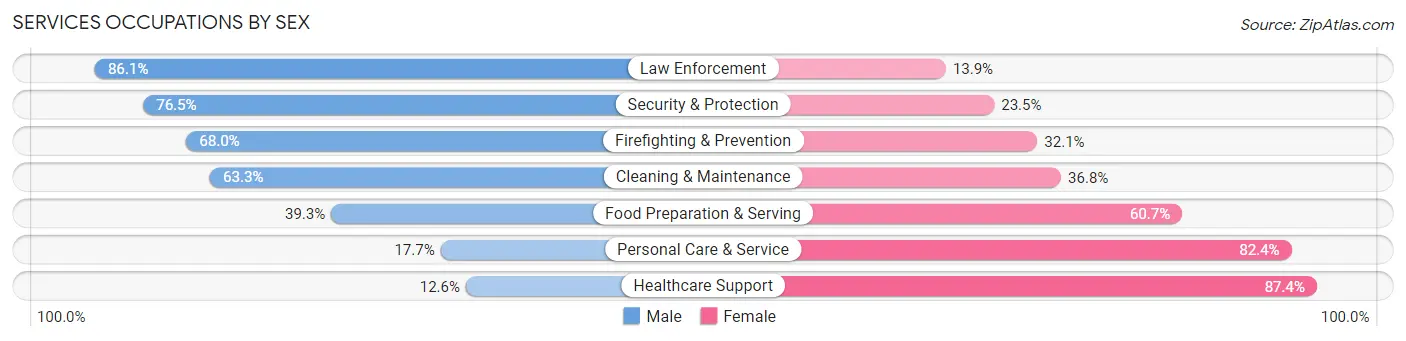
Services Occupations by Sex
Within the Services occupations in Area Code 309, the most male-oriented occupations are Law Enforcement (86.1%), Security & Protection (76.5%), and Firefighting & Prevention (67.9%), while the most female-oriented occupations are Healthcare Support (87.4%), Personal Care & Service (82.4%), and Food Preparation & Serving (60.7%).
| Occupation | Male | Female |
| Healthcare Support | 1,748 (12.6%) | 12,077 (87.4%) |
| Security & Protection | 6,608 (76.5%) | 2,031 (23.5%) |
| Firefighting & Prevention | 3,102 (67.9%) | 1,463 (32.1%) |
| Law Enforcement | 3,506 (86.1%) | 568 (13.9%) |
| Food Preparation & Serving | 9,819 (39.3%) | 15,151 (60.7%) |
| Cleaning & Maintenance | 9,404 (63.2%) | 5,463 (36.7%) |
| Personal Care & Service | 1,911 (17.6%) | 8,919 (82.4%) |
| Total (Category) | 29,490 (40.3%) | 43,641 (59.7%) |
| Total (Overall) | 217,397 (51.7%) | 203,161 (48.3%) |
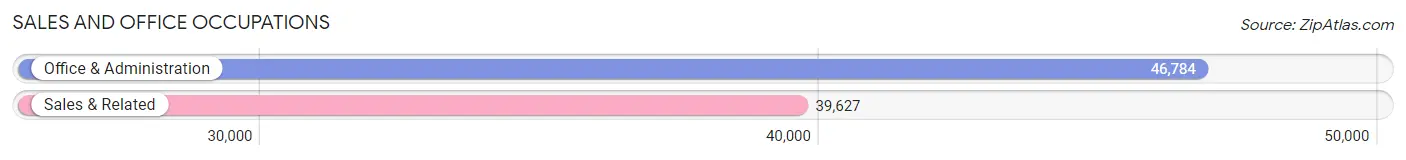
Sales and Office Occupations
The most common Sales and Office occupations in Area Code 309 are Office & Administration (46,784 | 11.1%), and Sales & Related (39,627 | 9.4%).
Sales and Office Occupations by Sex
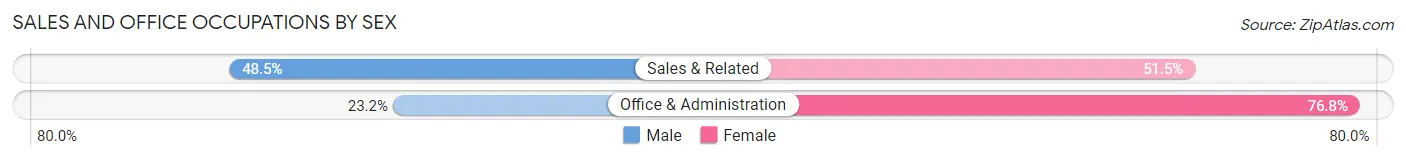
| Occupation | Male | Female |
| Sales & Related | 19,226 (48.5%) | 20,401 (51.5%) |
| Office & Administration | 10,854 (23.2%) | 35,930 (76.8%) |
| Total (Category) | 30,080 (34.8%) | 56,331 (65.2%) |
| Total (Overall) | 217,397 (51.7%) | 203,161 (48.3%) |
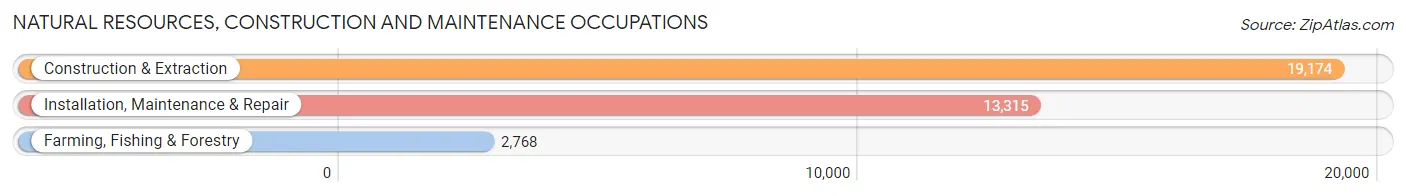
Natural Resources, Construction and Maintenance Occupations
The most common Natural Resources, Construction and Maintenance occupations in Area Code 309 are Construction & Extraction (19,174 | 4.6%), Installation, Maintenance & Repair (13,315 | 3.2%), and Farming, Fishing & Forestry (2,768 | 0.7%).
Natural Resources, Construction and Maintenance Occupations by Sex
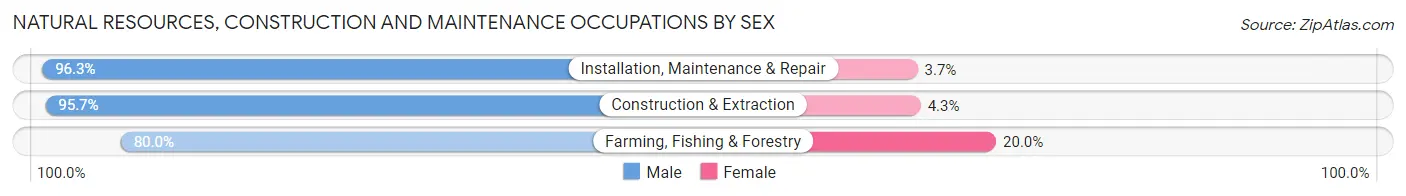
| Occupation | Male | Female |
| Farming, Fishing & Forestry | 2,214 (80.0%) | 554 (20.0%) |
| Construction & Extraction | 18,343 (95.7%) | 831 (4.3%) |
| Installation, Maintenance & Repair | 12,827 (96.3%) | 488 (3.7%) |
| Total (Category) | 33,384 (94.7%) | 1,873 (5.3%) |
| Total (Overall) | 217,397 (51.7%) | 203,161 (48.3%) |
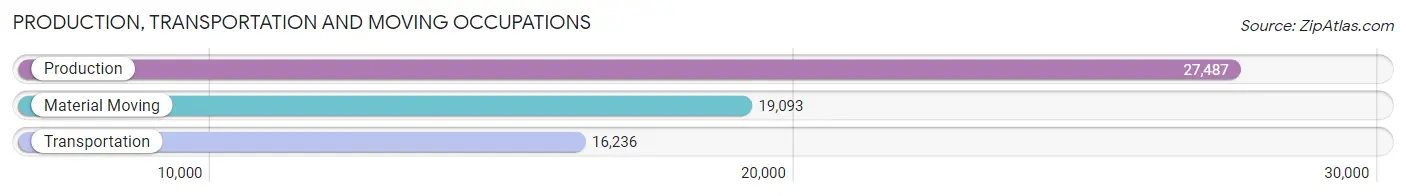
Production, Transportation and Moving Occupations
The most common Production, Transportation and Moving occupations in Area Code 309 are Production (27,487 | 6.5%), Material Moving (19,093 | 4.5%), and Transportation (16,236 | 3.9%).
Production, Transportation and Moving Occupations by Sex
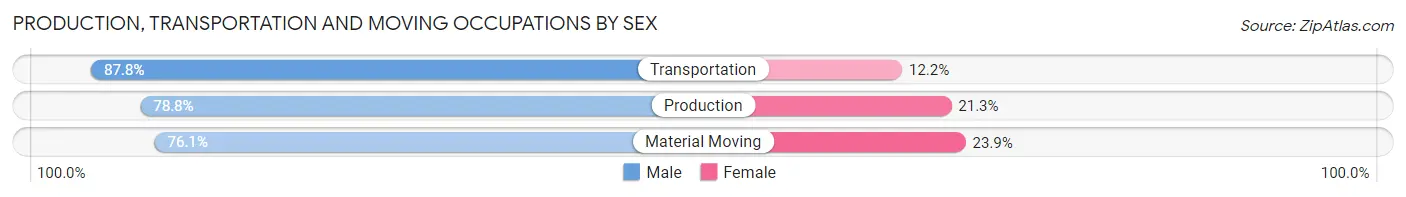
| Occupation | Male | Female |
| Production | 21,645 (78.7%) | 5,842 (21.2%) |
| Transportation | 14,256 (87.8%) | 1,980 (12.2%) |
| Material Moving | 14,537 (76.1%) | 4,556 (23.9%) |
| Total (Category) | 50,438 (80.3%) | 12,378 (19.7%) |
| Total (Overall) | 217,397 (51.7%) | 203,161 (48.3%) |
Employment Industries by Sex in Area Code 309
Employment Industries in Area Code 309
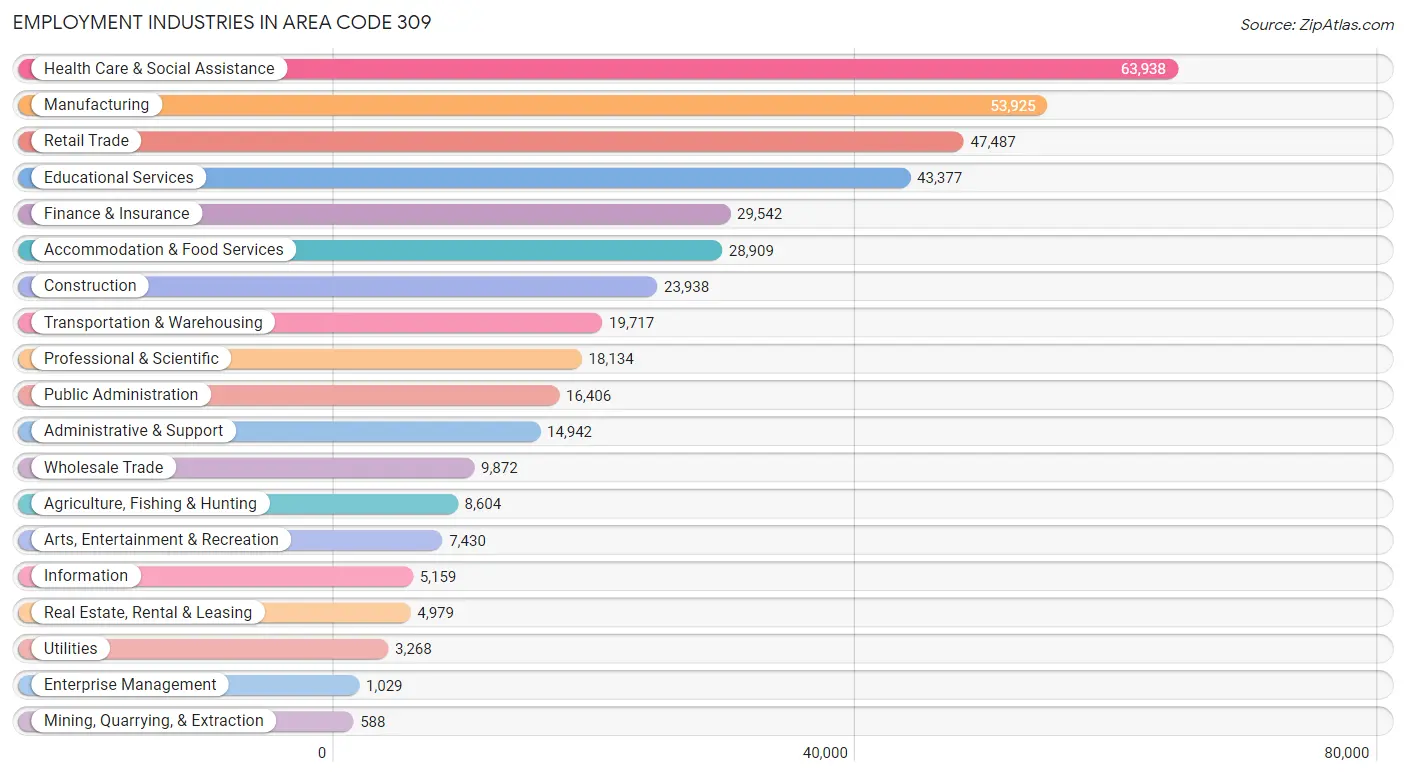
The major employment industries in Area Code 309 include Health Care & Social Assistance (63,938 | 15.2%), Manufacturing (53,925 | 12.8%), Retail Trade (47,487 | 11.3%), Educational Services (43,377 | 10.3%), and Finance & Insurance (29,542 | 7.0%).
Employment Industries by Sex in Area Code 309
The Area Code 309 industries that see more men than women are Construction (89.8%), Agriculture, Fishing & Hunting (83.3%), and Transportation & Warehousing (78.1%), whereas the industries that tend to have a higher number of women are Health Care & Social Assistance (82.5%), Educational Services (67.5%), and Finance & Insurance (57.8%).
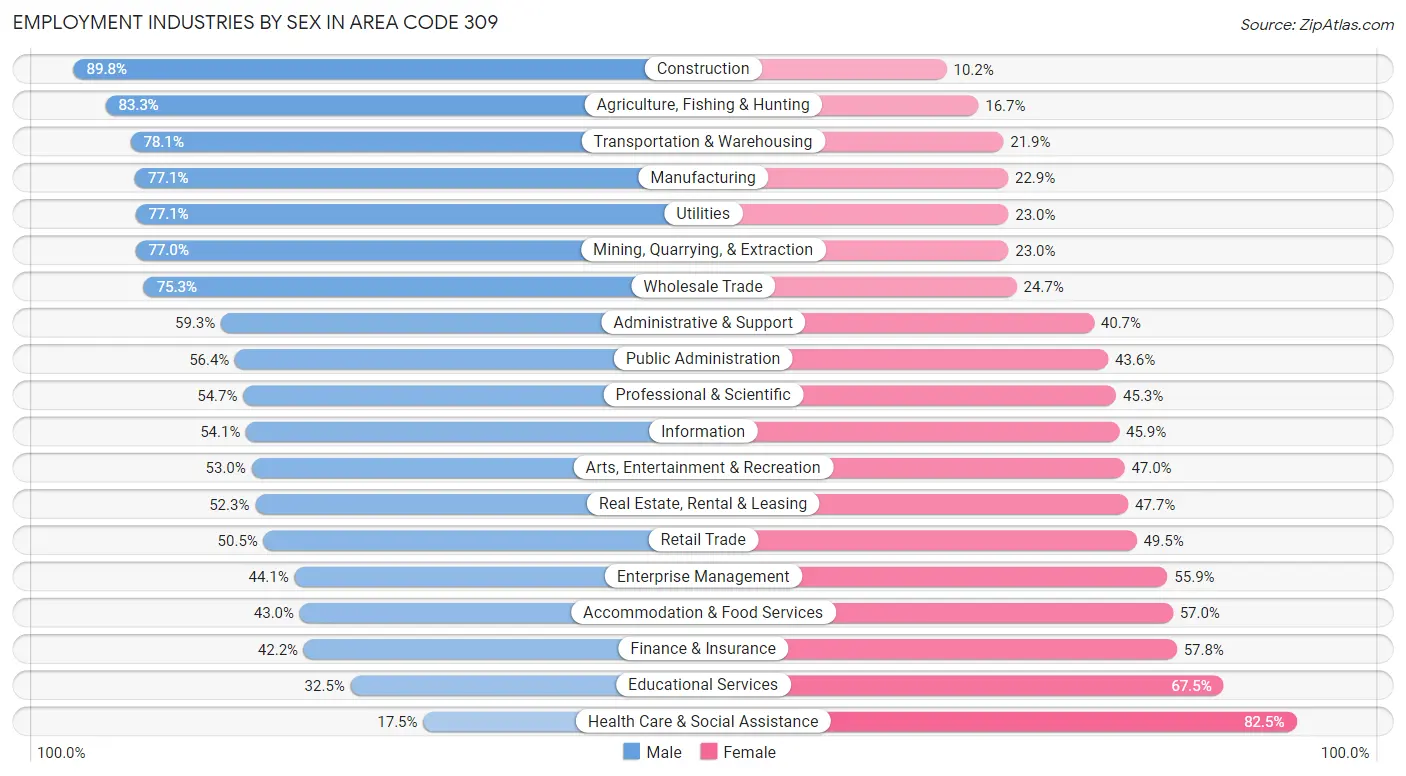
| Industry | Male | Female |
| Agriculture, Fishing & Hunting | 7,164 (83.3%) | 1,440 (16.7%) |
| Mining, Quarrying, & Extraction | 453 (77.0%) | 135 (23.0%) |
| Construction | 21,506 (89.8%) | 2,432 (10.2%) |
| Manufacturing | 41,583 (77.1%) | 12,342 (22.9%) |
| Wholesale Trade | 7,438 (75.3%) | 2,434 (24.7%) |
| Retail Trade | 23,991 (50.5%) | 23,496 (49.5%) |
| Transportation & Warehousing | 15,395 (78.1%) | 4,322 (21.9%) |
| Utilities | 2,518 (77.0%) | 750 (23.0%) |
| Information | 2,792 (54.1%) | 2,367 (45.9%) |
| Finance & Insurance | 12,464 (42.2%) | 17,078 (57.8%) |
| Real Estate, Rental & Leasing | 2,602 (52.3%) | 2,377 (47.7%) |
| Professional & Scientific | 9,924 (54.7%) | 8,210 (45.3%) |
| Enterprise Management | 454 (44.1%) | 575 (55.9%) |
| Administrative & Support | 8,866 (59.3%) | 6,076 (40.7%) |
| Educational Services | 14,100 (32.5%) | 29,277 (67.5%) |
| Health Care & Social Assistance | 11,161 (17.5%) | 52,777 (82.5%) |
| Arts, Entertainment & Recreation | 3,939 (53.0%) | 3,491 (47.0%) |
| Accommodation & Food Services | 12,437 (43.0%) | 16,472 (57.0%) |
| Public Administration | 9,254 (56.4%) | 7,152 (43.6%) |
| Total | 217,397 (51.7%) | 203,161 (48.3%) |
Education in Area Code 309
School Enrollment in Area Code 309
The most common levels of schooling among the 224,870 students in Area Code 309 are college / undergraduate (56,978 | 25.3%), middle school (44,912 | 20.0%), and high school (44,525 | 19.8%).
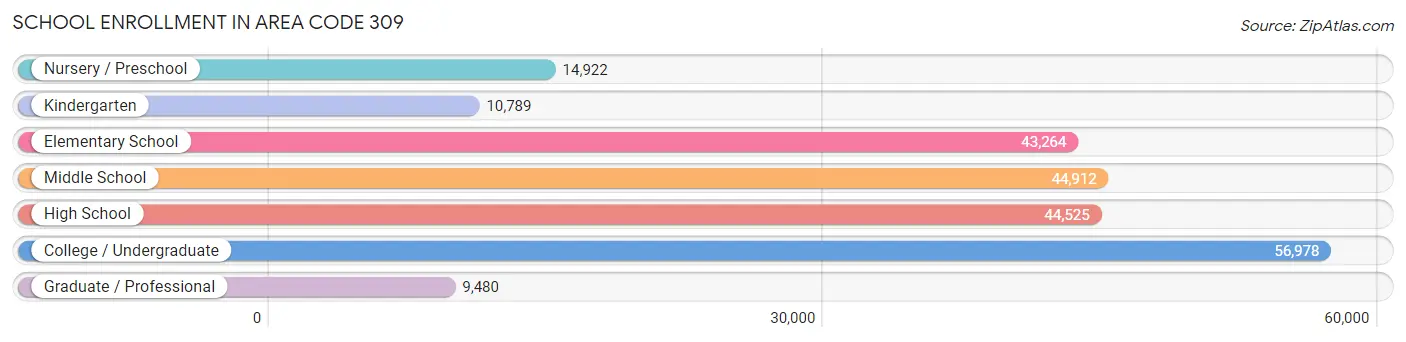
| School Level | # Students | % Students |
| Nursery / Preschool | 14,922 | 6.6% |
| Kindergarten | 10,789 | 4.8% |
| Elementary School | 43,264 | 19.2% |
| Middle School | 44,912 | 20.0% |
| High School | 44,525 | 19.8% |
| College / Undergraduate | 56,978 | 25.3% |
| Graduate / Professional | 9,480 | 4.2% |
| Total | 224,870 | 100.0% |
School Enrollment by Age by Funding Source in Area Code 309
Out of a total of 224,870 students who are enrolled in schools in Area Code 309, 37,156 (16.5%) attend a private institution, while the remaining 187,714 (83.5%) are enrolled in public schools. The age group of 3 to 4 year olds has the highest likelihood of being enrolled in private schools, with 3,679 (32.0% in the age bracket) enrolled. Conversely, the age group of 15 to 17 year olds has the lowest likelihood of being enrolled in a private school, with 29,946 (90.0% in the age bracket) attending a public institution.
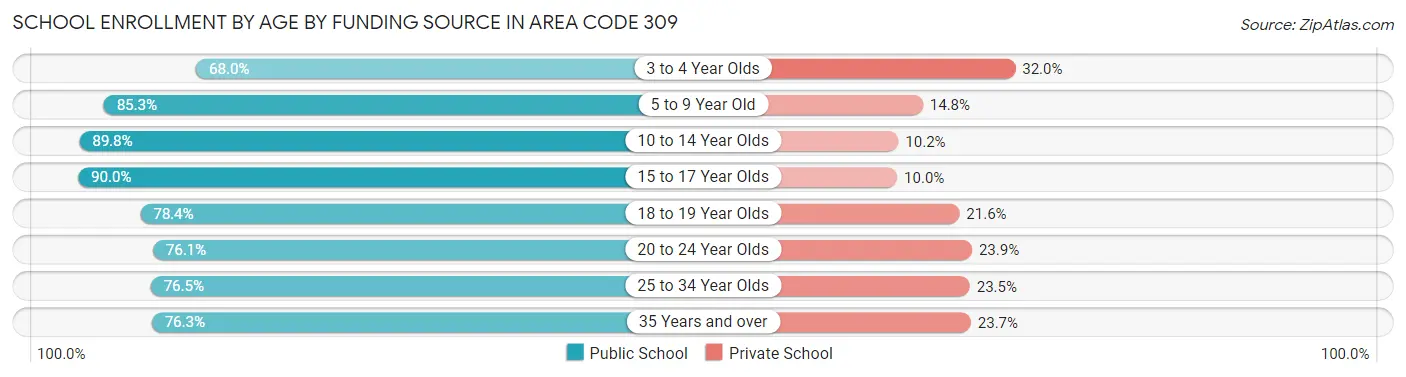
| Age Bracket | Public School | Private School |
| 3 to 4 Year Olds | 7,832 (68.0%) | 3,679 (32.0%) |
| 5 to 9 Year Old | 44,662 (85.3%) | 7,726 (14.7%) |
| 10 to 14 Year Olds | 49,267 (89.8%) | 5,599 (10.2%) |
| 15 to 17 Year Olds | 29,946 (90.0%) | 3,313 (10.0%) |
| 18 to 19 Year Olds | 17,122 (78.4%) | 4,707 (21.6%) |
| 20 to 24 Year Olds | 23,468 (76.1%) | 7,371 (23.9%) |
| 25 to 34 Year Olds | 7,807 (76.5%) | 2,398 (23.5%) |
| 35 Years and over | 7,610 (76.3%) | 2,363 (23.7%) |
| Total | 187,714 (83.5%) | 37,156 (16.5%) |
Educational Attainment by Field of Study in Area Code 309
Business (35,512 | 18.0%), education (32,536 | 16.5%), science & technology (22,877 | 11.6%), engineering (13,518 | 6.9%), and bio, nature & agricultural (13,434 | 6.8%) are the most common fields of study among 196,881 individuals in Area Code 309 who have obtained a bachelor's degree or higher.
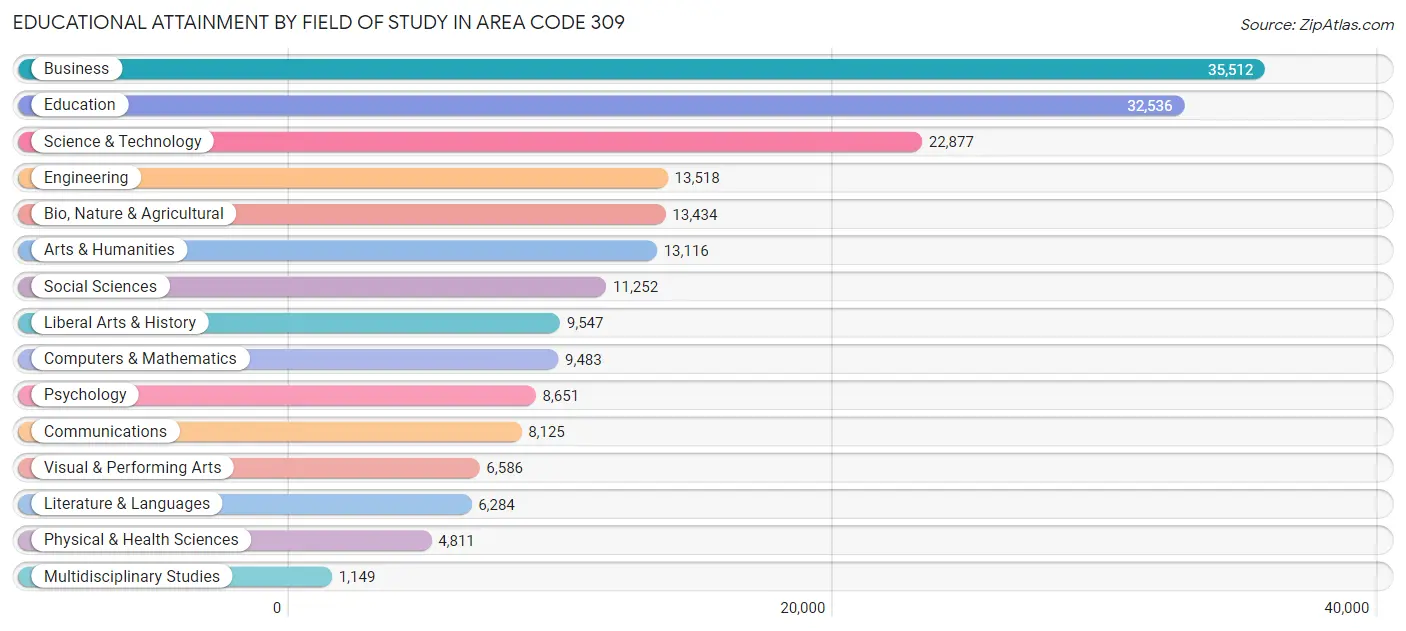
| Field of Study | # Graduates | % Graduates |
| Computers & Mathematics | 9,483 | 4.8% |
| Bio, Nature & Agricultural | 13,434 | 6.8% |
| Physical & Health Sciences | 4,811 | 2.4% |
| Psychology | 8,651 | 4.4% |
| Social Sciences | 11,252 | 5.7% |
| Engineering | 13,518 | 6.9% |
| Multidisciplinary Studies | 1,149 | 0.6% |
| Science & Technology | 22,877 | 11.6% |
| Business | 35,512 | 18.0% |
| Education | 32,536 | 16.5% |
| Literature & Languages | 6,284 | 3.2% |
| Liberal Arts & History | 9,547 | 4.9% |
| Visual & Performing Arts | 6,586 | 3.4% |
| Communications | 8,125 | 4.1% |
| Arts & Humanities | 13,116 | 6.7% |
| Total | 196,881 | 100.0% |
Transportation & Commute in Area Code 309
Vehicle Availability by Sex in Area Code 309
The most prevalent vehicle ownership categories in Area Code 309 are males with 2 vehicles (97,180, accounting for 45.9%) and females with 2 vehicles (81,502, making up 50.0%).
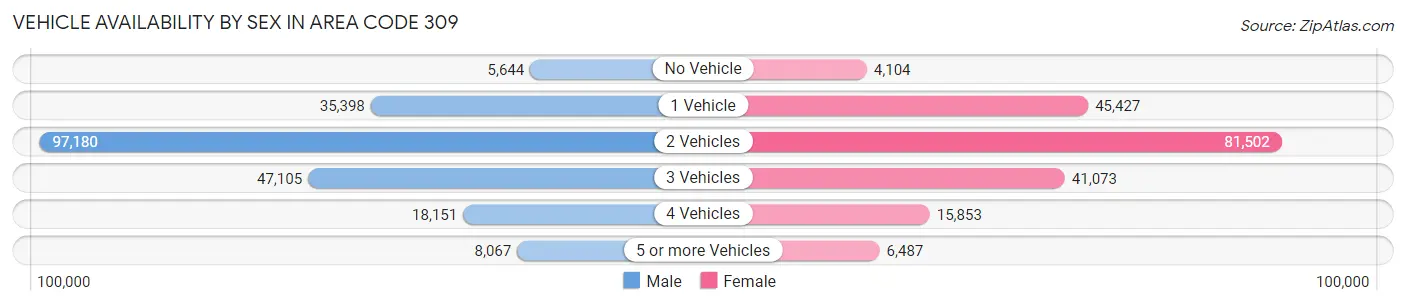
| Vehicles Available | Male | Female |
| No Vehicle | 5,644 (2.7%) | 4,104 (2.1%) |
| 1 Vehicle | 35,398 (16.7%) | 45,427 (23.4%) |
| 2 Vehicles | 97,180 (45.9%) | 81,502 (41.9%) |
| 3 Vehicles | 47,105 (22.3%) | 41,073 (21.1%) |
| 4 Vehicles | 18,151 (8.6%) | 15,853 (8.2%) |
| 5 or more Vehicles | 8,067 (3.8%) | 6,487 (3.3%) |
| Total | 211,545 (100.0%) | 194,446 (100.0%) |
Commute Time in Area Code 309
The most frequently occuring commute durations in Area Code 309 are 15 to 19 minutes (68,119 commuters, 18.0%), 10 to 14 minutes (66,540 commuters, 17.6%), and 5 to 9 minutes (58,316 commuters, 15.4%).
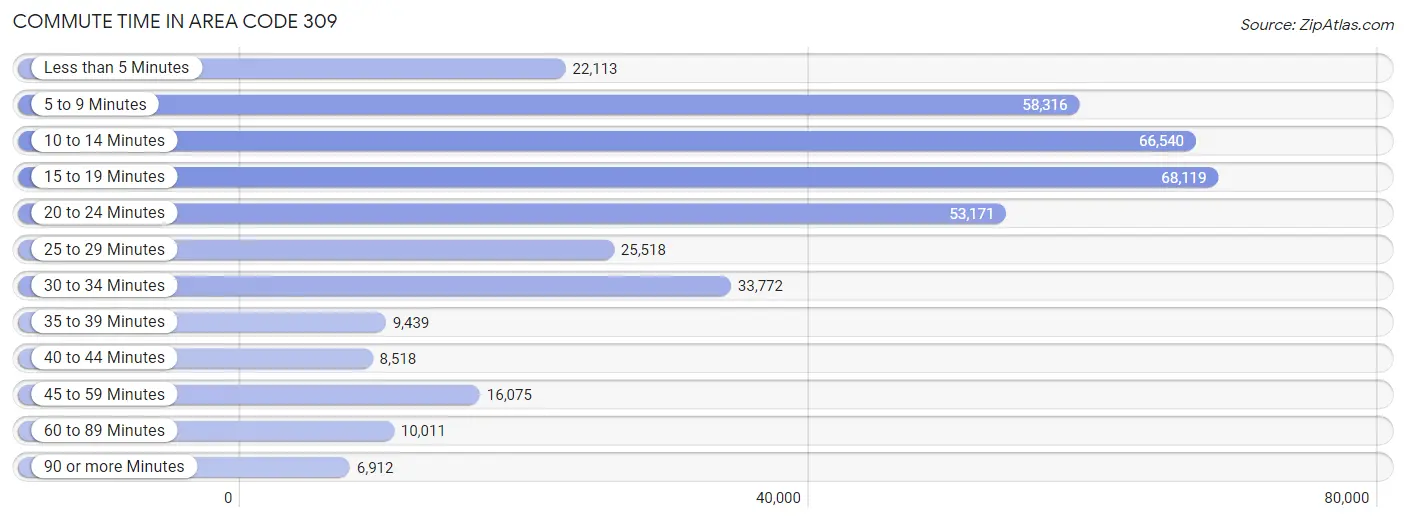
| Commute Time | # Commuters | % Commuters |
| Less than 5 Minutes | 22,113 | 5.8% |
| 5 to 9 Minutes | 58,316 | 15.4% |
| 10 to 14 Minutes | 66,540 | 17.6% |
| 15 to 19 Minutes | 68,119 | 18.0% |
| 20 to 24 Minutes | 53,171 | 14.1% |
| 25 to 29 Minutes | 25,518 | 6.7% |
| 30 to 34 Minutes | 33,772 | 8.9% |
| 35 to 39 Minutes | 9,439 | 2.5% |
| 40 to 44 Minutes | 8,518 | 2.2% |
| 45 to 59 Minutes | 16,075 | 4.3% |
| 60 to 89 Minutes | 10,011 | 2.6% |
| 90 or more Minutes | 6,912 | 1.8% |
Commute Time by Sex in Area Code 309
The most common commute times in Area Code 309 are 15 to 19 minutes (35,375 commuters, 17.9%) for males and 10 to 14 minutes (34,114 commuters, 18.9%) for females.
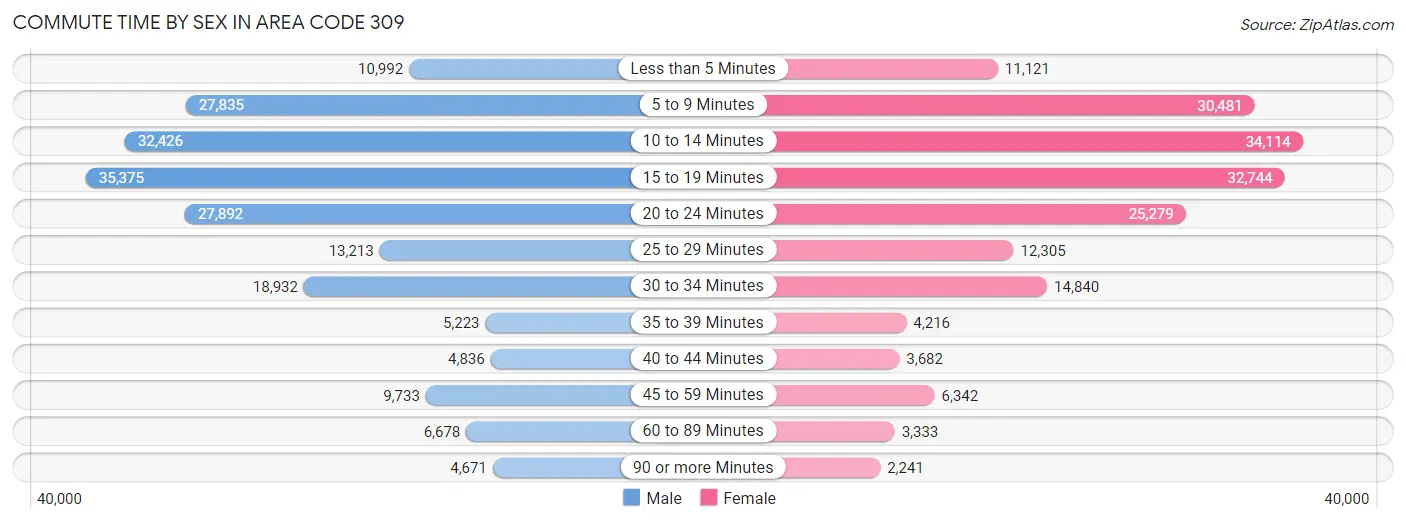
| Commute Time | Male | Female |
| Less than 5 Minutes | 10,992 (5.6%) | 11,121 (6.1%) |
| 5 to 9 Minutes | 27,835 (14.1%) | 30,481 (16.9%) |
| 10 to 14 Minutes | 32,426 (16.4%) | 34,114 (18.9%) |
| 15 to 19 Minutes | 35,375 (17.9%) | 32,744 (18.1%) |
| 20 to 24 Minutes | 27,892 (14.1%) | 25,279 (14.0%) |
| 25 to 29 Minutes | 13,213 (6.7%) | 12,305 (6.8%) |
| 30 to 34 Minutes | 18,932 (9.6%) | 14,840 (8.2%) |
| 35 to 39 Minutes | 5,223 (2.6%) | 4,216 (2.3%) |
| 40 to 44 Minutes | 4,836 (2.4%) | 3,682 (2.0%) |
| 45 to 59 Minutes | 9,733 (4.9%) | 6,342 (3.5%) |
| 60 to 89 Minutes | 6,678 (3.4%) | 3,333 (1.8%) |
| 90 or more Minutes | 4,671 (2.4%) | 2,241 (1.2%) |
Time of Departure to Work by Sex in Area Code 309
The most frequent times of departure to work in Area Code 309 are 7:00 AM to 7:29 AM (25,262, 12.8%) for males and 7:30 AM to 7:59 AM (31,406, 17.4%) for females.
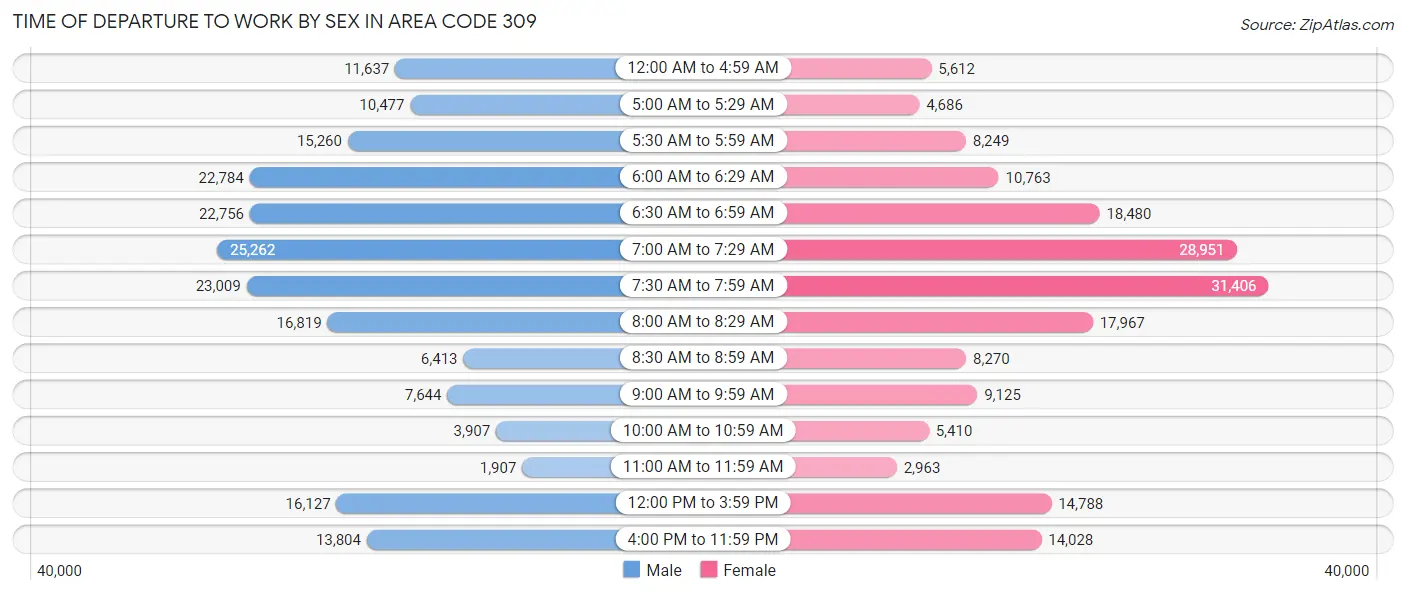
| Time of Departure | Male | Female |
| 12:00 AM to 4:59 AM | 11,637 (5.9%) | 5,612 (3.1%) |
| 5:00 AM to 5:29 AM | 10,477 (5.3%) | 4,686 (2.6%) |
| 5:30 AM to 5:59 AM | 15,260 (7.7%) | 8,249 (4.6%) |
| 6:00 AM to 6:29 AM | 22,784 (11.5%) | 10,763 (6.0%) |
| 6:30 AM to 6:59 AM | 22,756 (11.5%) | 18,480 (10.2%) |
| 7:00 AM to 7:29 AM | 25,262 (12.8%) | 28,951 (16.0%) |
| 7:30 AM to 7:59 AM | 23,009 (11.6%) | 31,406 (17.4%) |
| 8:00 AM to 8:29 AM | 16,819 (8.5%) | 17,967 (9.9%) |
| 8:30 AM to 8:59 AM | 6,413 (3.2%) | 8,270 (4.6%) |
| 9:00 AM to 9:59 AM | 7,644 (3.9%) | 9,125 (5.1%) |
| 10:00 AM to 10:59 AM | 3,907 (2.0%) | 5,410 (3.0%) |
| 11:00 AM to 11:59 AM | 1,907 (1.0%) | 2,963 (1.6%) |
| 12:00 PM to 3:59 PM | 16,127 (8.2%) | 14,788 (8.2%) |
| 4:00 PM to 11:59 PM | 13,804 (7.0%) | 14,028 (7.8%) |
| Total | 197,806 (100.0%) | 180,698 (100.0%) |
Housing Occupancy in Area Code 309
Occupancy by Ownership in Area Code 309
Of the total 371,721 dwellings in Area Code 309, owner-occupied units account for 263,106 (70.8%), while renter-occupied units make up 108,615 (29.2%).
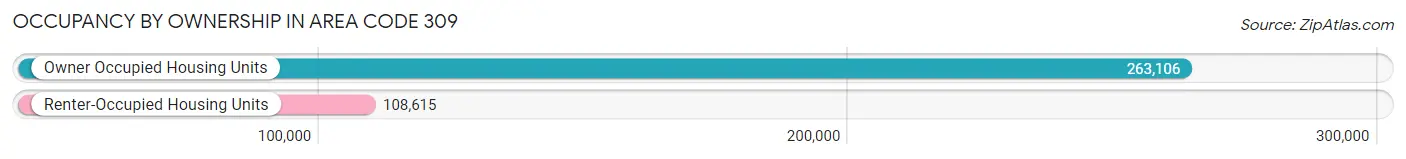
| Occupancy | # Housing Units | % Housing Units |
| Owner Occupied Housing Units | 263,106 | 70.8% |
| Renter-Occupied Housing Units | 108,615 | 29.2% |
| Total Occupied Housing Units | 371,721 | 100.0% |
Occupancy by Household Size in Area Code 309
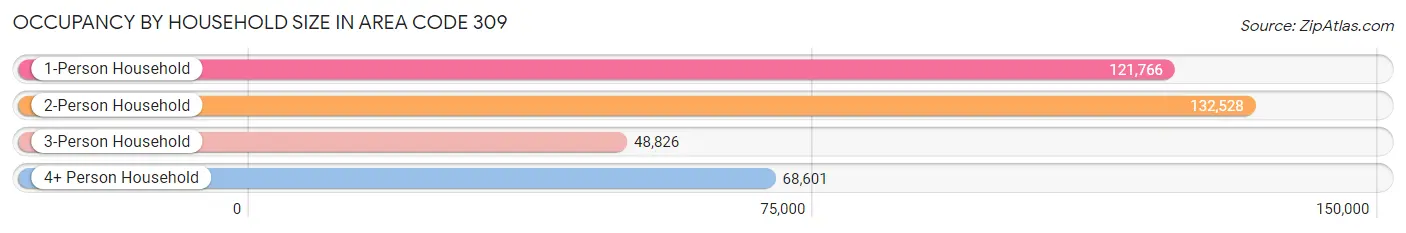
| Household Size | # Housing Units | % Housing Units |
| 1-Person Household | 121,766 | 32.8% |
| 2-Person Household | 132,528 | 35.6% |
| 3-Person Household | 48,826 | 13.1% |
| 4+ Person Household | 68,601 | 18.4% |
| Total Housing Units | 371,721 | 100.0% |
Occupancy by Ownership by Household Size in Area Code 309
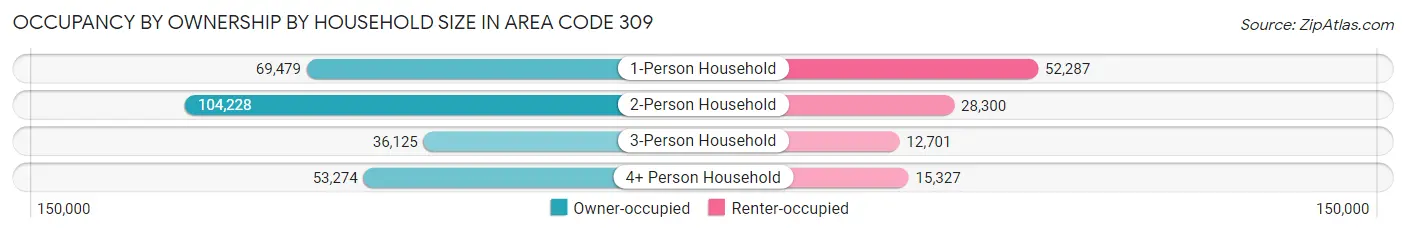
| Household Size | Owner-occupied | Renter-occupied |
| 1-Person Household | 69,479 (57.1%) | 52,287 (42.9%) |
| 2-Person Household | 104,228 (78.6%) | 28,300 (21.3%) |
| 3-Person Household | 36,125 (74.0%) | 12,701 (26.0%) |
| 4+ Person Household | 53,274 (77.7%) | 15,327 (22.3%) |
| Total Housing Units | 263,106 (70.8%) | 108,615 (29.2%) |
Occupancy by Educational Attainment in Area Code 309
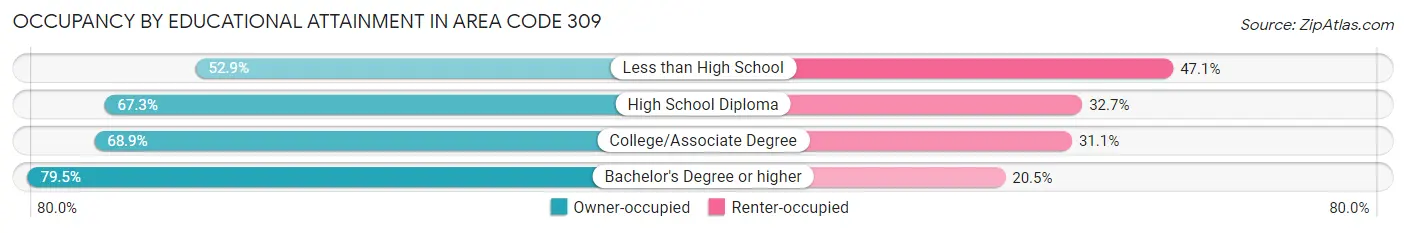
| Household Size | Owner-occupied | Renter-occupied |
| Less than High School | 12,645 (52.9%) | 11,269 (47.1%) |
| High School Diploma | 68,500 (67.3%) | 33,257 (32.7%) |
| College/Associate Degree | 89,283 (68.9%) | 40,216 (31.1%) |
| Bachelor's Degree or higher | 92,678 (79.5%) | 23,873 (20.5%) |
Occupancy by Age of Householder in Area Code 309
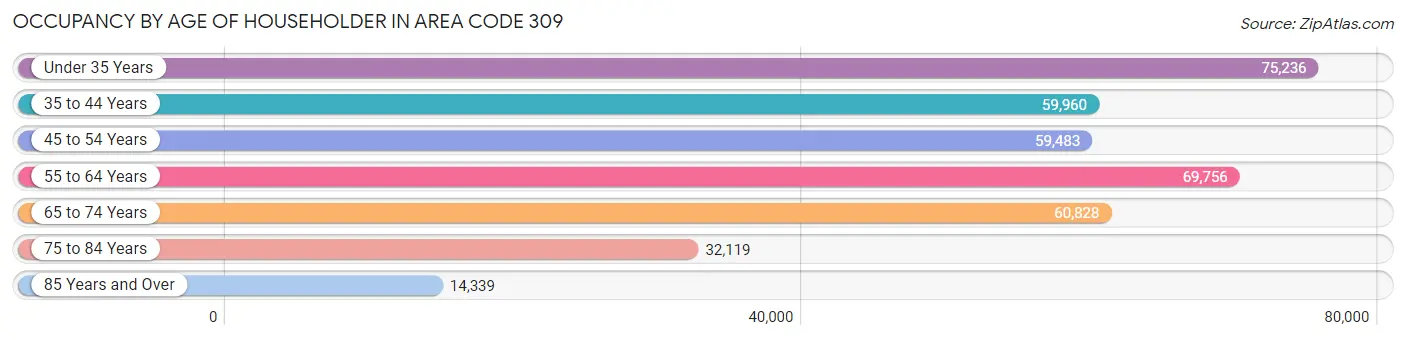
| Age Bracket | # Households | % Households |
| Under 35 Years | 75,236 | 20.2% |
| 35 to 44 Years | 59,960 | 16.1% |
| 45 to 54 Years | 59,483 | 16.0% |
| 55 to 64 Years | 69,756 | 18.8% |
| 65 to 74 Years | 60,828 | 16.4% |
| 75 to 84 Years | 32,119 | 8.6% |
| 85 Years and Over | 14,339 | 3.9% |
| Total | 371,721 | 100.0% |
Housing Finances in Area Code 309
Median Income by Occupancy in Area Code 309
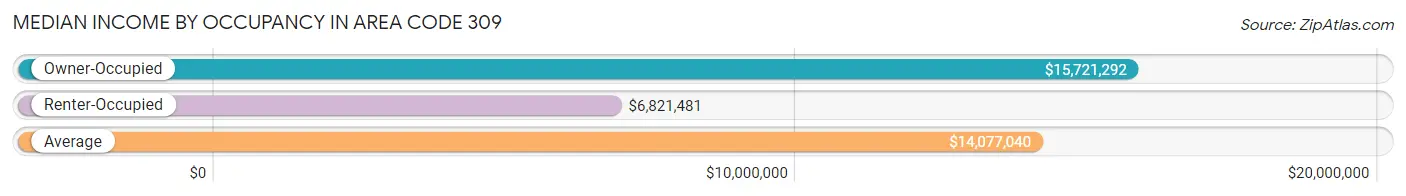
| Occupancy Type | # Households | Median Income |
| Owner-Occupied | 263,106 (70.8%) | $15,721,292 |
| Renter-Occupied | 108,615 (29.2%) | $6,821,481 |
| Average | 371,721 (100.0%) | $14,077,040 |
Occupancy by Householder Income Bracket in Area Code 309
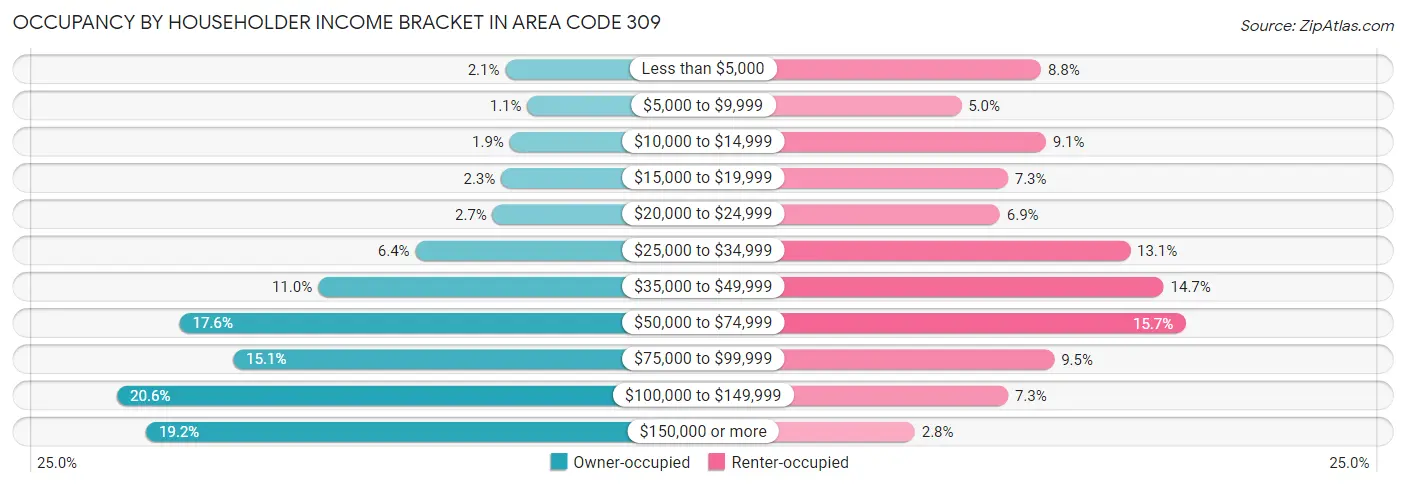
| Income Bracket | Owner-occupied | Renter-occupied |
| Less than $5,000 | 5,539 (2.1%) | 9,587 (8.8%) |
| $5,000 to $9,999 | 2,780 (1.1%) | 5,466 (5.0%) |
| $10,000 to $14,999 | 4,998 (1.9%) | 9,845 (9.1%) |
| $15,000 to $19,999 | 6,070 (2.3%) | 7,873 (7.2%) |
| $20,000 to $24,999 | 7,124 (2.7%) | 7,463 (6.9%) |
| $25,000 to $34,999 | 16,807 (6.4%) | 14,195 (13.1%) |
| $35,000 to $49,999 | 29,031 (11.0%) | 15,934 (14.7%) |
| $50,000 to $74,999 | 46,370 (17.6%) | 17,042 (15.7%) |
| $75,000 to $99,999 | 39,637 (15.1%) | 10,270 (9.5%) |
| $100,000 to $149,999 | 54,171 (20.6%) | 7,881 (7.3%) |
| $150,000 or more | 50,579 (19.2%) | 3,059 (2.8%) |
| Total | 263,106 (100.0%) | 108,615 (100.0%) |
Monthly Housing Cost Tiers in Area Code 309
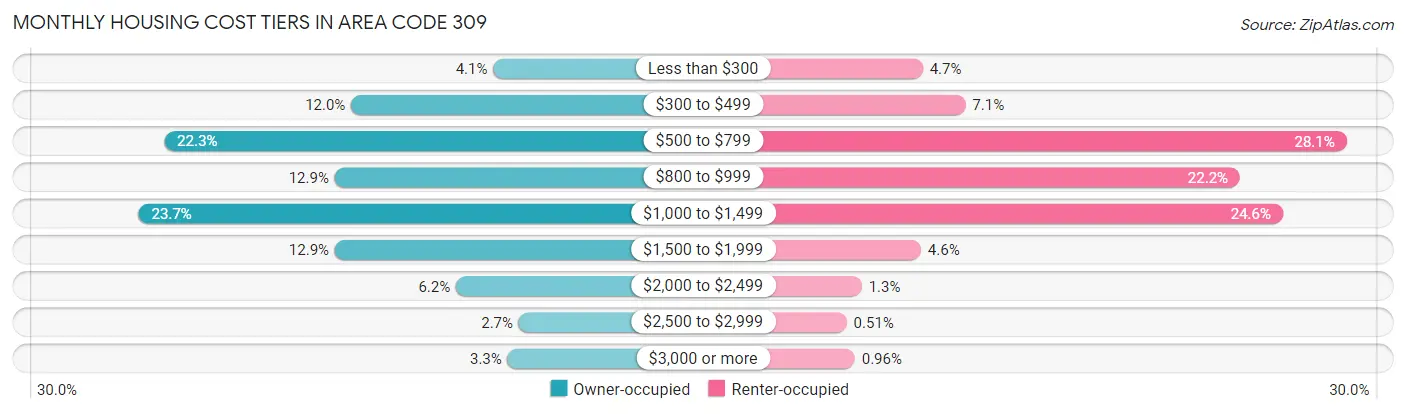
| Monthly Cost | Owner-occupied | Renter-occupied |
| Less than $300 | 10,818 (4.1%) | 5,114 (4.7%) |
| $300 to $499 | 31,461 (12.0%) | 7,682 (7.1%) |
| $500 to $799 | 58,658 (22.3%) | 30,538 (28.1%) |
| $800 to $999 | 33,862 (12.9%) | 24,150 (22.2%) |
| $1,000 to $1,499 | 62,379 (23.7%) | 26,721 (24.6%) |
| $1,500 to $1,999 | 33,837 (12.9%) | 5,006 (4.6%) |
| $2,000 to $2,499 | 16,232 (6.2%) | 1,460 (1.3%) |
| $2,500 to $2,999 | 7,113 (2.7%) | 555 (0.5%) |
| $3,000 or more | 8,746 (3.3%) | 1,042 (1.0%) |
| Total | 263,106 (100.0%) | 108,615 (100.0%) |
Physical Housing Characteristics in Area Code 309
Housing Structures in Area Code 309
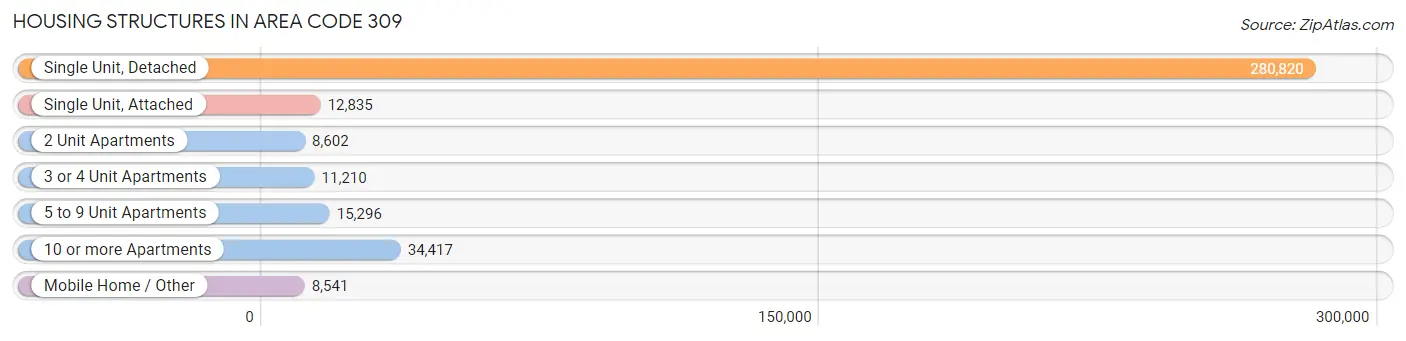
| Structure Type | # Housing Units | % Housing Units |
| Single Unit, Detached | 280,820 | 75.5% |
| Single Unit, Attached | 12,835 | 3.5% |
| 2 Unit Apartments | 8,602 | 2.3% |
| 3 or 4 Unit Apartments | 11,210 | 3.0% |
| 5 to 9 Unit Apartments | 15,296 | 4.1% |
| 10 or more Apartments | 34,417 | 9.3% |
| Mobile Home / Other | 8,541 | 2.3% |
| Total | 371,721 | 100.0% |
Housing Structures by Occupancy in Area Code 309
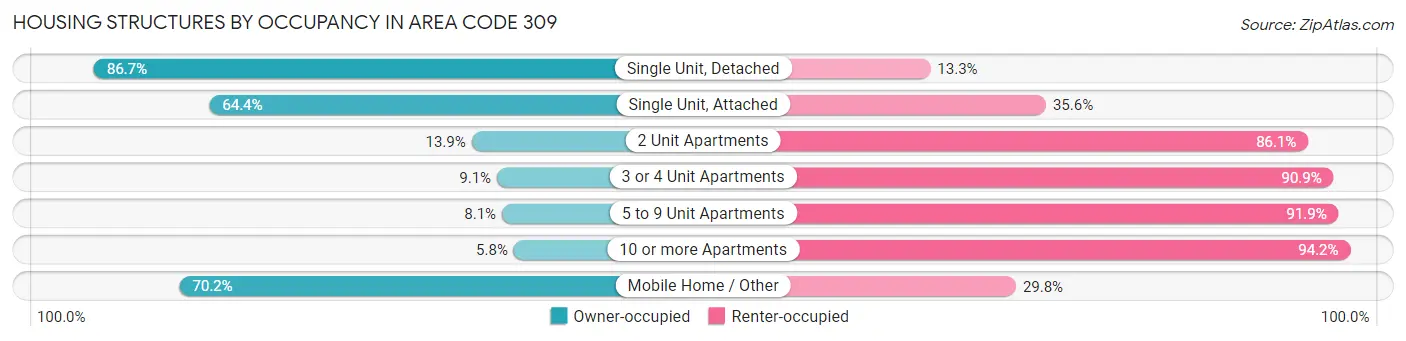
| Structure Type | Owner-occupied | Renter-occupied |
| Single Unit, Detached | 243,388 (86.7%) | 37,432 (13.3%) |
| Single Unit, Attached | 8,268 (64.4%) | 4,567 (35.6%) |
| 2 Unit Apartments | 1,199 (13.9%) | 7,403 (86.1%) |
| 3 or 4 Unit Apartments | 1,016 (9.1%) | 10,194 (90.9%) |
| 5 to 9 Unit Apartments | 1,237 (8.1%) | 14,059 (91.9%) |
| 10 or more Apartments | 2,002 (5.8%) | 32,415 (94.2%) |
| Mobile Home / Other | 5,996 (70.2%) | 2,545 (29.8%) |
| Total | 263,106 (70.8%) | 108,615 (29.2%) |
Housing Structures by Number of Rooms in Area Code 309
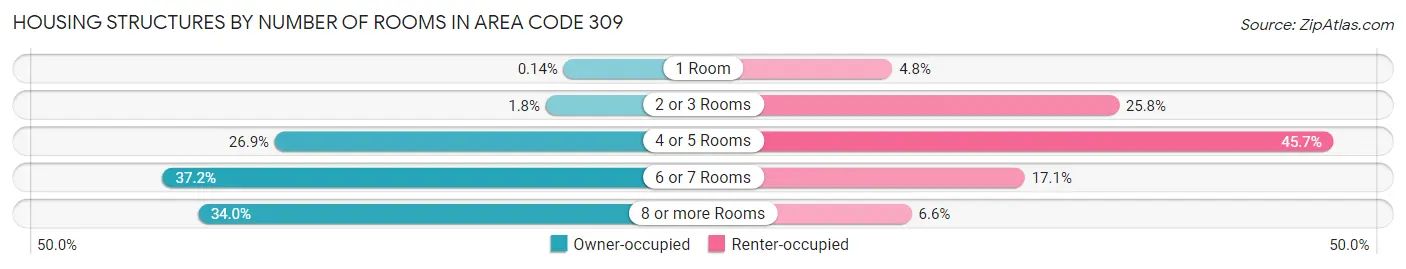
| Number of Rooms | Owner-occupied | Renter-occupied |
| 1 Room | 377 (0.1%) | 5,258 (4.8%) |
| 2 or 3 Rooms | 4,716 (1.8%) | 28,020 (25.8%) |
| 4 or 5 Rooms | 70,651 (26.9%) | 49,578 (45.7%) |
| 6 or 7 Rooms | 97,944 (37.2%) | 18,558 (17.1%) |
| 8 or more Rooms | 89,418 (34.0%) | 7,201 (6.6%) |
| Total | 263,106 (100.0%) | 108,615 (100.0%) |
Housing Structure by Heating Type in Area Code 309
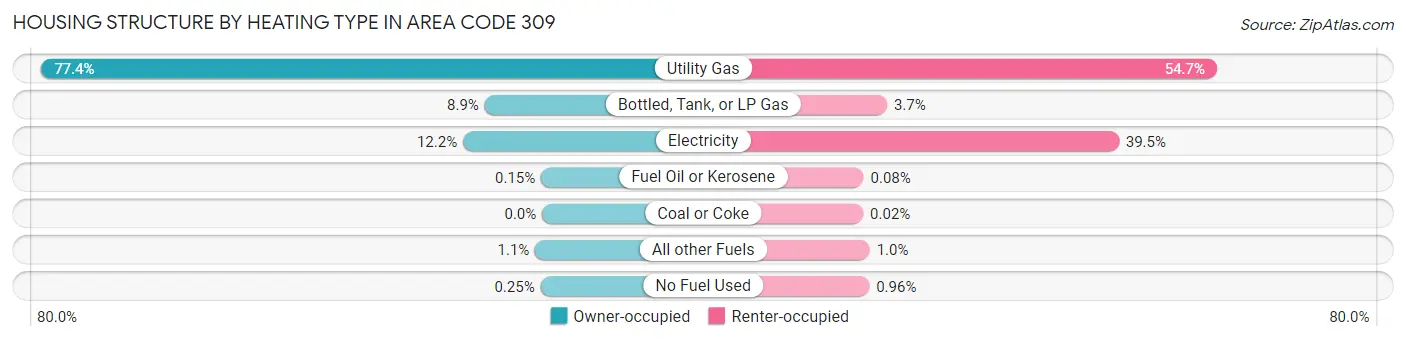
| Heating Type | Owner-occupied | Renter-occupied |
| Utility Gas | 203,714 (77.4%) | 59,394 (54.7%) |
| Bottled, Tank, or LP Gas | 23,370 (8.9%) | 4,024 (3.7%) |
| Electricity | 32,167 (12.2%) | 42,932 (39.5%) |
| Fuel Oil or Kerosene | 388 (0.2%) | 87 (0.1%) |
| Coal or Coke | 2 (0.0%) | 21 (0.0%) |
| All other Fuels | 2,814 (1.1%) | 1,114 (1.0%) |
| No Fuel Used | 651 (0.3%) | 1,043 (1.0%) |
| Total | 263,106 (100.0%) | 108,615 (100.0%) |
Household Vehicle Usage in Area Code 309
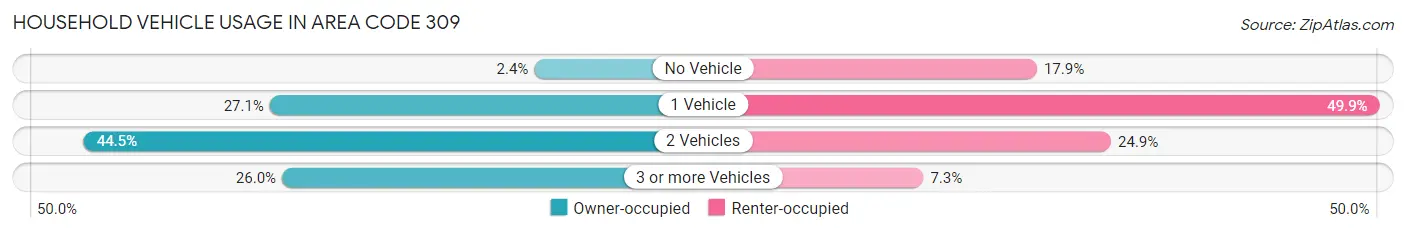
| Vehicles per Household | Owner-occupied | Renter-occupied |
| No Vehicle | 6,400 (2.4%) | 19,473 (17.9%) |
| 1 Vehicle | 71,357 (27.1%) | 54,186 (49.9%) |
| 2 Vehicles | 116,993 (44.5%) | 26,996 (24.8%) |
| 3 or more Vehicles | 68,356 (26.0%) | 7,960 (7.3%) |
| Total | 263,106 (100.0%) | 108,615 (100.0%) |
Real Estate & Mortgages in Area Code 309
Real Estate and Mortgage Overview in Area Code 309
| Characteristic | Without Mortgage | With Mortgage |
| Housing Units | 110,376 | 152,730 |
| Median Property Value | $25,018,000 | $28,114,100 |
| Median Household Income | $12,045,314 | $35,448 |
| Monthly Housing Costs | $109,190 | $8,551 |
| Real Estate Taxes | $491,697 | $2,277 |
Property Value by Mortgage Status in Area Code 309
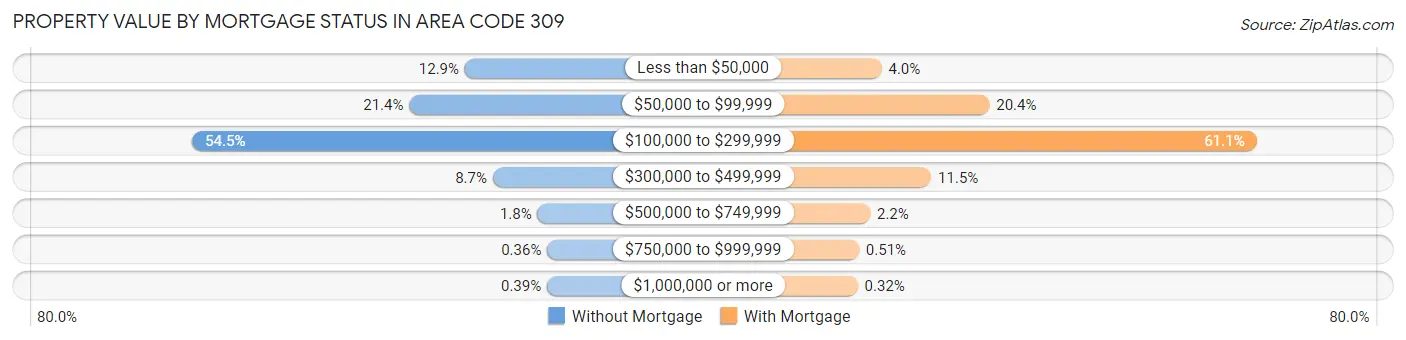
| Property Value | Without Mortgage | With Mortgage |
| Less than $50,000 | 14,245 (12.9%) | 6,050 (4.0%) |
| $50,000 to $99,999 | 23,594 (21.4%) | 31,130 (20.4%) |
| $100,000 to $299,999 | 60,114 (54.5%) | 93,309 (61.1%) |
| $300,000 to $499,999 | 9,559 (8.7%) | 17,602 (11.5%) |
| $500,000 to $749,999 | 2,036 (1.8%) | 3,381 (2.2%) |
| $750,000 to $999,999 | 398 (0.4%) | 773 (0.5%) |
| $1,000,000 or more | 430 (0.4%) | 485 (0.3%) |
| Total | 110,376 (100.0%) | 152,730 (100.0%) |
Household Income by Mortgage Status in Area Code 309
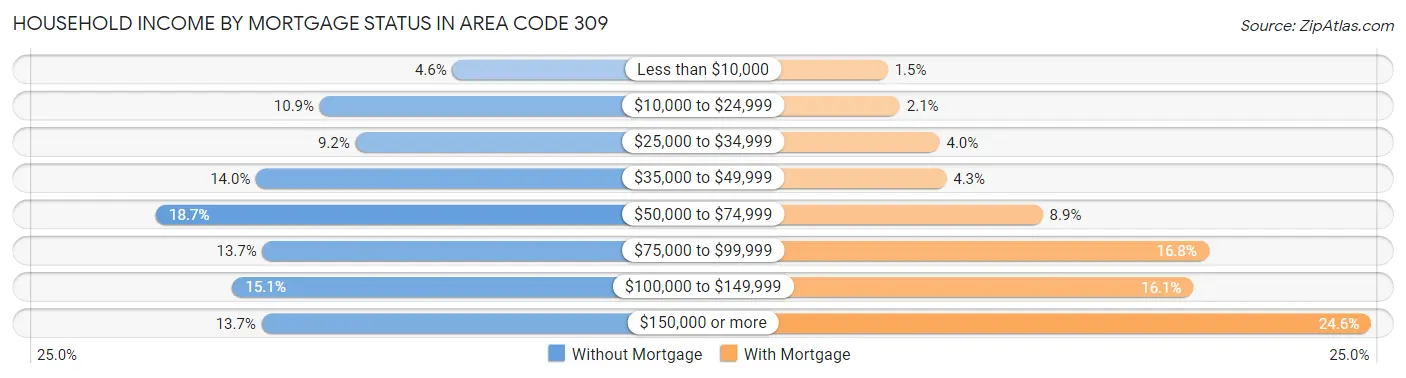
| Household Income | Without Mortgage | With Mortgage |
| Less than $10,000 | 5,100 (4.6%) | 2,332 (1.5%) |
| $10,000 to $24,999 | 12,076 (10.9%) | 3,219 (2.1%) |
| $25,000 to $34,999 | 10,204 (9.2%) | 6,116 (4.0%) |
| $35,000 to $49,999 | 15,421 (14.0%) | 6,603 (4.3%) |
| $50,000 to $74,999 | 20,688 (18.7%) | 13,610 (8.9%) |
| $75,000 to $99,999 | 15,085 (13.7%) | 25,682 (16.8%) |
| $100,000 to $149,999 | 16,671 (15.1%) | 24,552 (16.1%) |
| $150,000 or more | 15,131 (13.7%) | 37,500 (24.5%) |
| Total | 110,376 (100.0%) | 152,730 (100.0%) |
Property Value to Household Income Ratio in Area Code 309
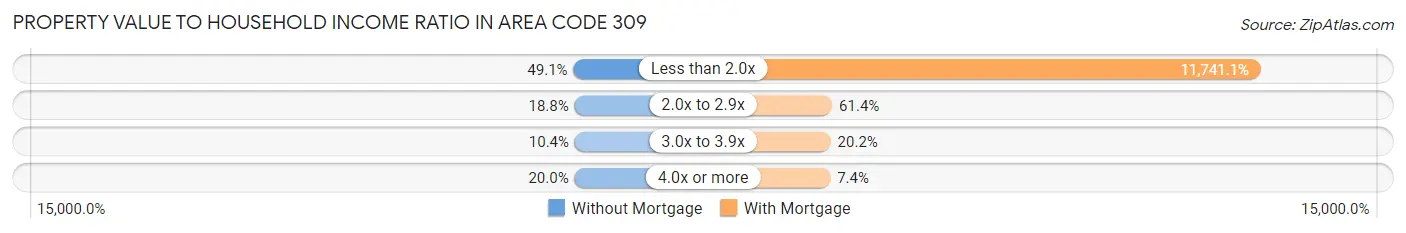
| Value-to-Income Ratio | Without Mortgage | With Mortgage |
| Less than 2.0x | 54,157 (49.1%) | 17,932,105 (11,741.0%) |
| 2.0x to 2.9x | 20,772 (18.8%) | 93,767 (61.4%) |
| 3.0x to 3.9x | 11,476 (10.4%) | 30,821 (20.2%) |
| 4.0x or more | 22,038 (20.0%) | 11,263 (7.4%) |
| Total | 110,376 (100.0%) | 152,730 (100.0%) |
Real Estate Taxes by Mortgage Status in Area Code 309
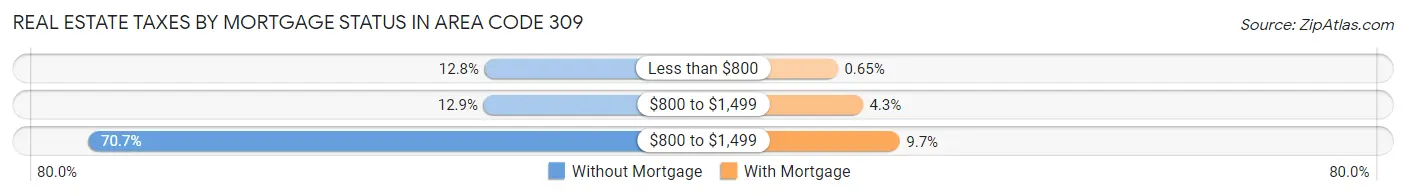
| Property Taxes | Without Mortgage | With Mortgage |
| Less than $800 | 14,077 (12.8%) | 992 (0.6%) |
| $800 to $1,499 | 14,244 (12.9%) | 6,575 (4.3%) |
| $800 to $1,499 | 78,061 (70.7%) | 14,796 (9.7%) |
| Total | 110,376 (100.0%) | 152,730 (100.0%) |
Health & Disability in Area Code 309
Health Insurance Coverage by Age in Area Code 309
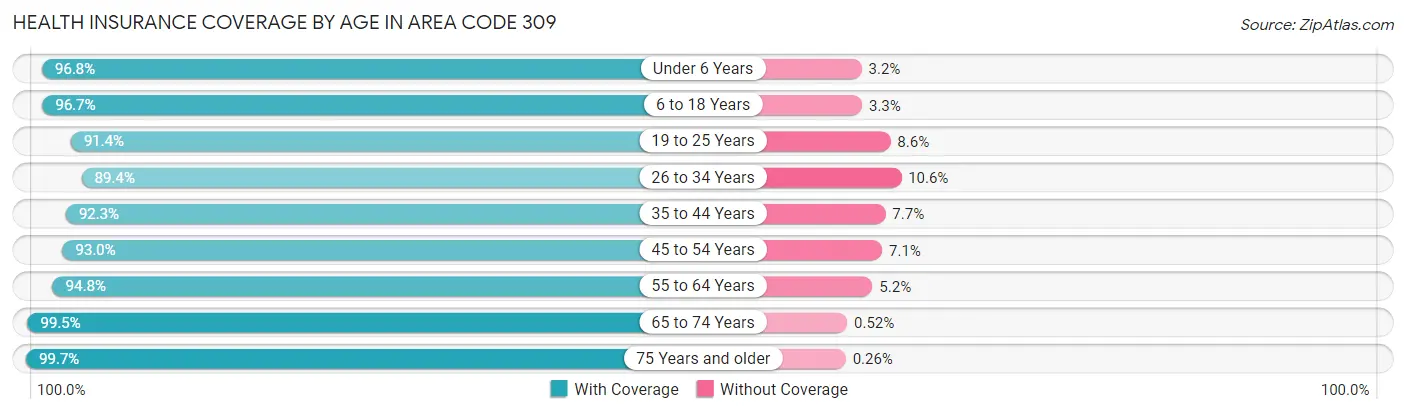
| Age Bracket | With Coverage | Without Coverage |
| Under 6 Years | 59,690 (96.8%) | 1,984 (3.2%) |
| 6 to 18 Years | 144,837 (96.7%) | 4,956 (3.3%) |
| 19 to 25 Years | 82,156 (91.4%) | 7,733 (8.6%) |
| 26 to 34 Years | 85,032 (89.4%) | 10,095 (10.6%) |
| 35 to 44 Years | 99,372 (92.3%) | 8,255 (7.7%) |
| 45 to 54 Years | 96,582 (92.9%) | 7,328 (7.0%) |
| 55 to 64 Years | 110,020 (94.8%) | 6,089 (5.2%) |
| 65 to 74 Years | 93,414 (99.5%) | 490 (0.5%) |
| 75 Years and older | 65,705 (99.7%) | 168 (0.3%) |
| Total | 836,808 (94.7%) | 47,098 (5.3%) |
Health Insurance Coverage by Citizenship Status in Area Code 309
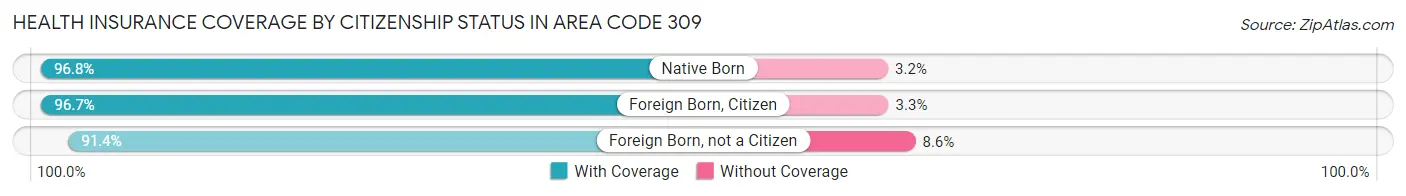
| Citizenship Status | With Coverage | Without Coverage |
| Native Born | 59,690 (96.8%) | 1,984 (3.2%) |
| Foreign Born, Citizen | 144,837 (96.7%) | 4,956 (3.3%) |
| Foreign Born, not a Citizen | 82,156 (91.4%) | 7,733 (8.6%) |
Health Insurance Coverage by Household Income in Area Code 309
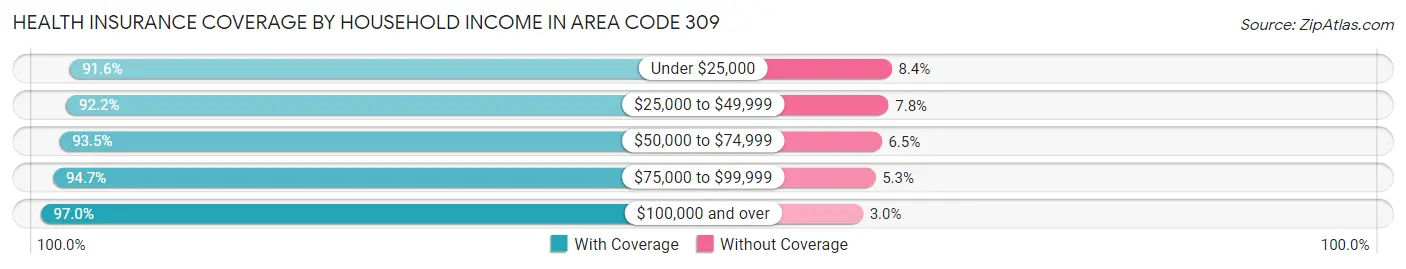
| Household Income | With Coverage | Without Coverage |
| Under $25,000 | 98,777 (91.6%) | 9,026 (8.4%) |
| $25,000 to $49,999 | 133,351 (92.2%) | 11,268 (7.8%) |
| $50,000 to $74,999 | 133,735 (93.5%) | 9,281 (6.5%) |
| $75,000 to $99,999 | 119,516 (94.7%) | 6,709 (5.3%) |
| $100,000 and over | 333,659 (97.0%) | 10,237 (3.0%) |
Public vs Private Health Insurance Coverage by Age in Area Code 309
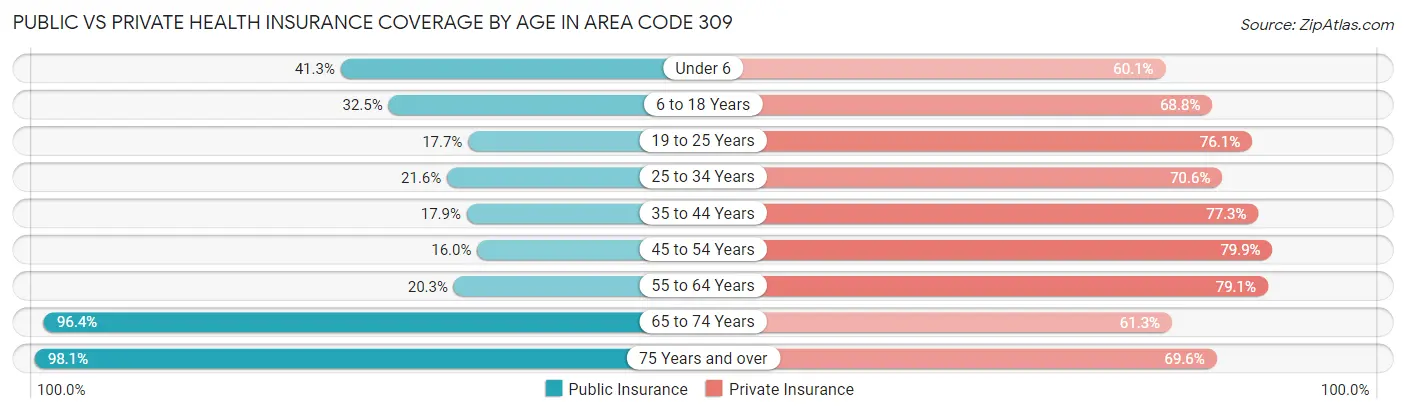
| Age Bracket | Public Insurance | Private Insurance |
| Under 6 | 25,481 (41.3%) | 37,043 (60.1%) |
| 6 to 18 Years | 48,606 (32.5%) | 102,990 (68.8%) |
| 19 to 25 Years | 15,870 (17.7%) | 68,440 (76.1%) |
| 25 to 34 Years | 20,526 (21.6%) | 67,171 (70.6%) |
| 35 to 44 Years | 19,284 (17.9%) | 83,212 (77.3%) |
| 45 to 54 Years | 16,600 (16.0%) | 83,051 (79.9%) |
| 55 to 64 Years | 23,601 (20.3%) | 91,794 (79.1%) |
| 65 to 74 Years | 90,529 (96.4%) | 57,534 (61.3%) |
| 75 Years and over | 64,622 (98.1%) | 45,818 (69.6%) |
| Total | 325,119 (36.8%) | 637,053 (72.1%) |
Disability Status by Sex by Age in Area Code 309
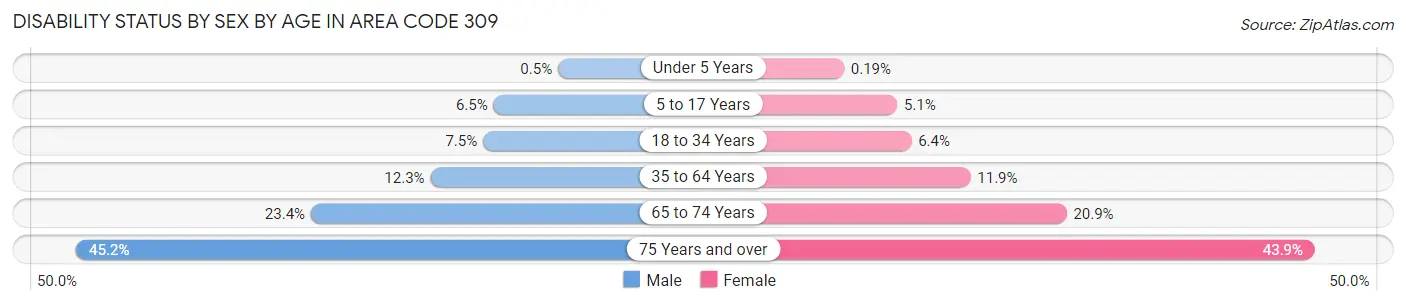
| Age Bracket | Male | Female |
| Under 5 Years | 132 (0.5%) | 47 (0.2%) |
| 5 to 17 Years | 4,839 (6.5%) | 3,667 (5.1%) |
| 18 to 34 Years | 7,390 (7.4%) | 6,415 (6.4%) |
| 35 to 64 Years | 20,081 (12.3%) | 19,673 (11.9%) |
| 65 to 74 Years | 10,494 (23.4%) | 10,243 (20.8%) |
| 75 Years and over | 12,491 (45.2%) | 16,791 (43.9%) |
Disability Class by Sex by Age in Area Code 309
Disability Class: Hearing Difficulty
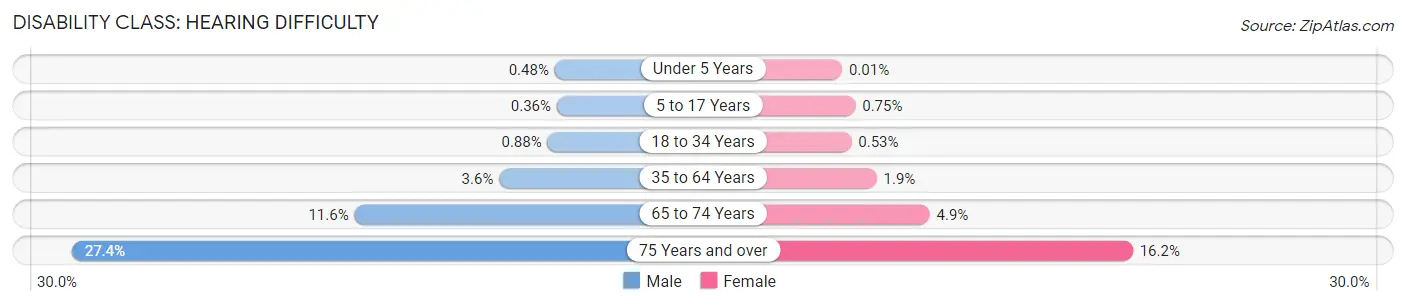
| Age Bracket | Male | Female |
| Under 5 Years | 128 (0.5%) | 3 (0.0%) |
| 5 to 17 Years | 268 (0.4%) | 539 (0.7%) |
| 18 to 34 Years | 873 (0.9%) | 531 (0.5%) |
| 35 to 64 Years | 5,814 (3.6%) | 3,199 (1.9%) |
| 65 to 74 Years | 5,209 (11.6%) | 2,402 (4.9%) |
| 75 Years and over | 7,562 (27.4%) | 6,195 (16.2%) |
Disability Class: Vision Difficulty
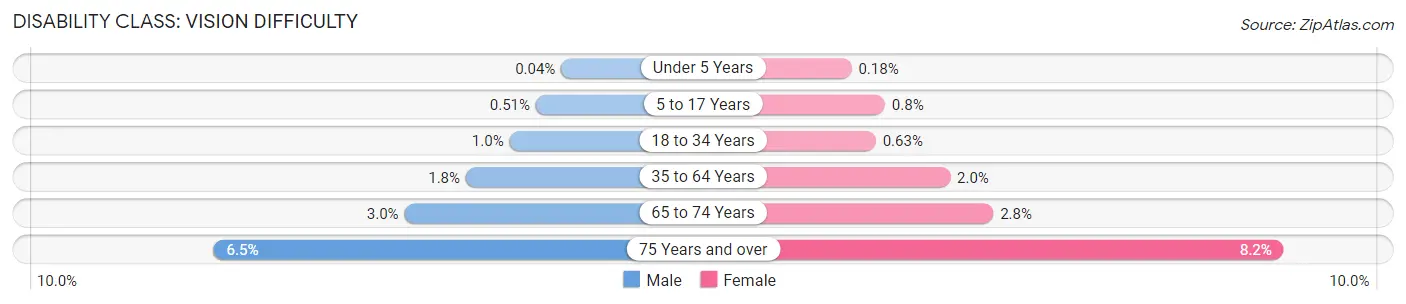
| Age Bracket | Male | Female |
| Under 5 Years | 11 (0.0%) | 44 (0.2%) |
| 5 to 17 Years | 380 (0.5%) | 574 (0.8%) |
| 18 to 34 Years | 996 (1.0%) | 623 (0.6%) |
| 35 to 64 Years | 2,937 (1.8%) | 3,321 (2.0%) |
| 65 to 74 Years | 1,323 (2.9%) | 1,382 (2.8%) |
| 75 Years and over | 1,792 (6.5%) | 3,138 (8.2%) |
Disability Class: Cognitive Difficulty
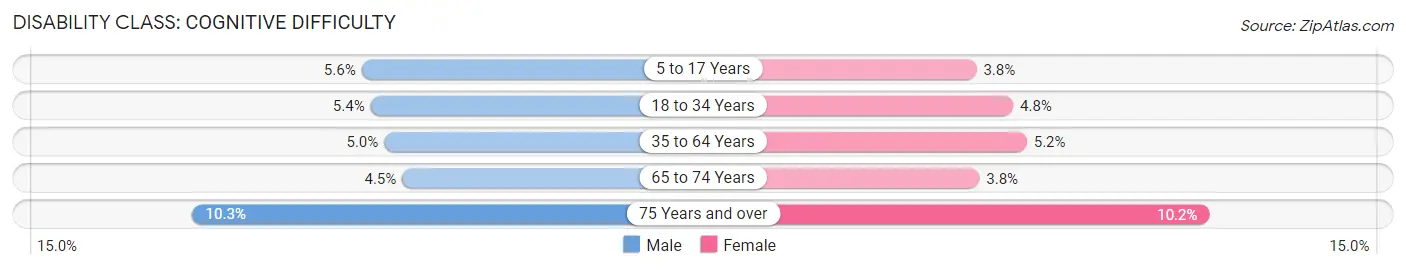
| Age Bracket | Male | Female |
| 5 to 17 Years | 4,192 (5.6%) | 2,682 (3.7%) |
| 18 to 34 Years | 5,328 (5.4%) | 4,755 (4.8%) |
| 35 to 64 Years | 8,115 (5.0%) | 8,497 (5.1%) |
| 65 to 74 Years | 2,011 (4.5%) | 1,881 (3.8%) |
| 75 Years and over | 2,850 (10.3%) | 3,913 (10.2%) |
Disability Class: Ambulatory Difficulty
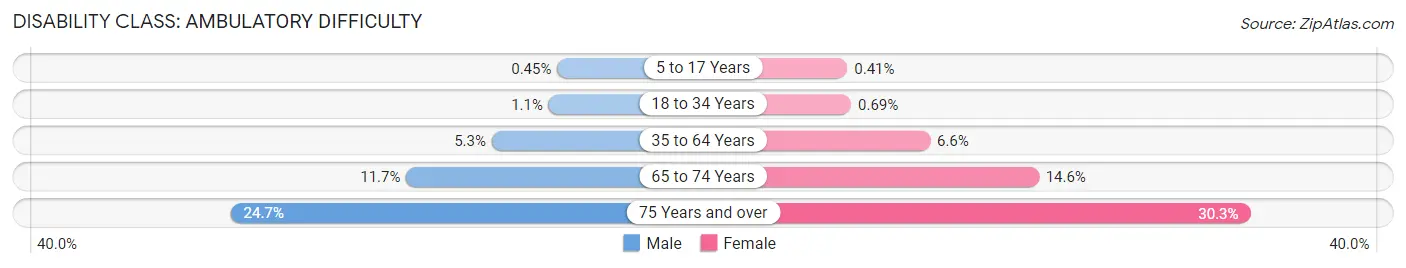
| Age Bracket | Male | Female |
| 5 to 17 Years | 338 (0.4%) | 297 (0.4%) |
| 18 to 34 Years | 1,073 (1.1%) | 684 (0.7%) |
| 35 to 64 Years | 8,632 (5.3%) | 10,799 (6.6%) |
| 65 to 74 Years | 5,221 (11.7%) | 7,182 (14.6%) |
| 75 Years and over | 6,824 (24.7%) | 11,601 (30.3%) |
Disability Class: Self-Care Difficulty
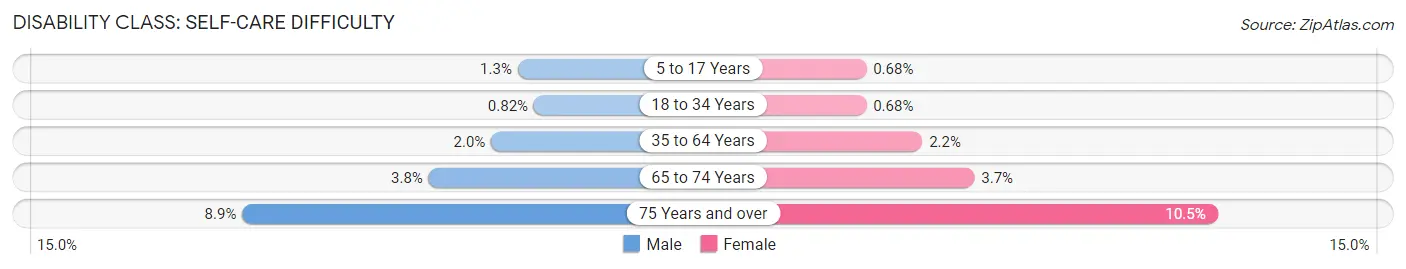
| Age Bracket | Male | Female |
| 5 to 17 Years | 945 (1.3%) | 488 (0.7%) |
| 18 to 34 Years | 816 (0.8%) | 677 (0.7%) |
| 35 to 64 Years | 3,273 (2.0%) | 3,702 (2.2%) |
| 65 to 74 Years | 1,679 (3.7%) | 1,811 (3.7%) |
| 75 Years and over | 2,469 (8.9%) | 4,001 (10.5%) |
Technology Access in Area Code 309
Computing Device Access in Area Code 309
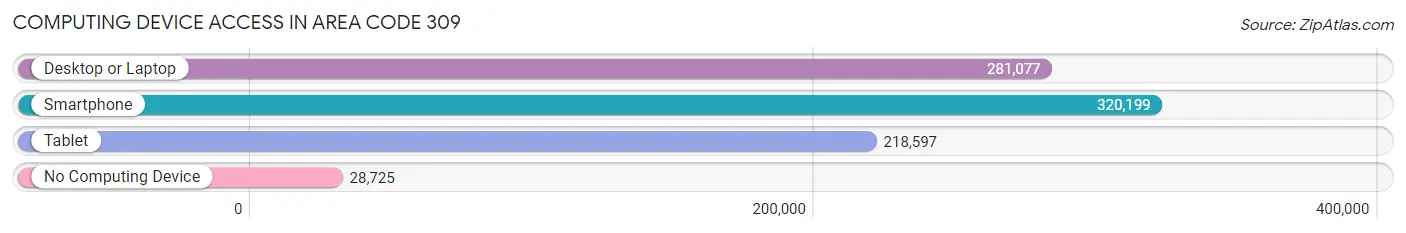
| Device Type | # Households | % Households |
| Desktop or Laptop | 281,077 | 75.6% |
| Smartphone | 320,199 | 86.1% |
| Tablet | 218,597 | 58.8% |
| No Computing Device | 28,725 | 7.7% |
| Total | 371,721 | 100.0% |
Internet Access in Area Code 309
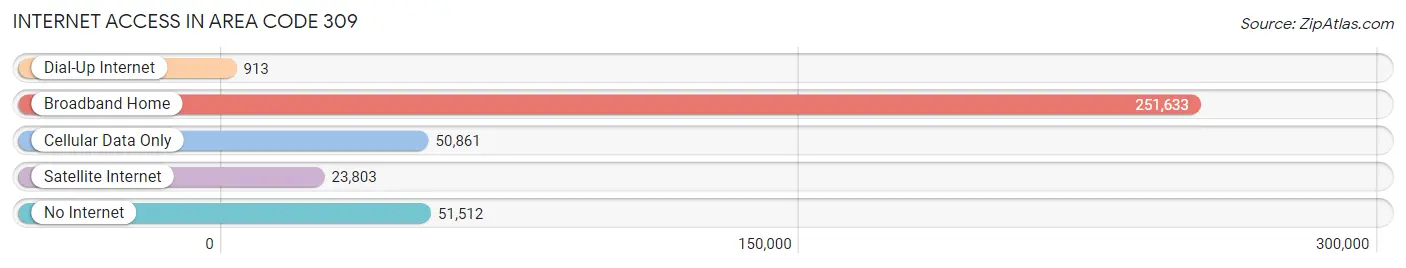
| Internet Type | # Households | % Households |
| Dial-Up Internet | 913 | 0.3% |
| Broadband Home | 251,633 | 67.7% |
| Cellular Data Only | 50,861 | 13.7% |
| Satellite Internet | 23,803 | 6.4% |
| No Internet | 51,512 | 13.9% |
| Total | 371,721 | 100.0% |
Area Code 309 Summary
Geography
Area code 309 is an area code in the North American Numbering Plan (NANP) for the western third of Illinois, including the cities of Peoria, Bloomington, Galesburg, and Rock Island. It was created in 1957 as one of the original area codes.
Social
Area code 309 is a major hub for social activity in the state of Illinois. It is home to a variety of cultural attractions, including the Peoria Riverfront Museum, the Peoria Zoo, and the Peoria Civic Center. It is also home to a number of universities, including Bradley University, Illinois State University, and Western Illinois University.
Economics
Area code 309 is a major economic center in the state of Illinois. It is home to a number of major corporations, including Caterpillar, State Farm Insurance, and OSF Healthcare. It is also home to a number of smaller businesses, including restaurants, retail stores, and service providers.
Demographics
Area code 309 is home to a diverse population. According to the 2010 census, the population of the area code was 1,072,878. The population is largely white, with African Americans making up the largest minority group at 11.3%. The median household income is $50,945, and the median age is 37.7.
Common Questions
What is Per Capita Income in Area Code 309?
Per Capita income in Area Code 309 is $35,400.
What is the Median Family Income in Area Code 309?
Median Family Income in Area Code 309 is $86,527.
What is the Median Household income in Area Code 309?
Median Household Income in Area Code 309 is $71,096.
What is Income or Wage Gap in Area Code 309?
Income or Wage Gap in Area Code 309 is 34.3%.
Women in Area Code 309 earn 65.7 cents for every dollar earned by a man.
What is Family Income Deficit in Area Code 309?
Family Income Deficit in Area Code 309 is $11,451.
Families that are below poverty line in Area Code 309 earn $11,451 less on average than the poverty threshold level.
What is Inequality or Gini Index in Area Code 309?
Inequality or Gini Index in Area Code 309 is 81.30.
What is the Total Population of Area Code 309?
Total Population of Area Code 309 is 899,351.
What is the Total Male Population of Area Code 309?
Total Male Population of Area Code 309 is 445,619.
What is the Total Female Population of Area Code 309?
Total Female Population of Area Code 309 is 453,732.
What is the Ratio of Males per 100 Females in Area Code 309?
There are 98.21 Males per 100 Females in Area Code 309.
What is the Ratio of Females per 100 Males in Area Code 309?
There are 101.82 Females per 100 Males in Area Code 309.
What is the Median Population Age in Area Code 309?
Median Population Age in Area Code 309 is 42.8 Years.
What is the Average Family Size in Area Code 309
Average Family Size in Area Code 309 is 2.9 People.
What is the Average Household Size in Area Code 309
Average Household Size in Area Code 309 is 2.4 People.
How Large is the Labor Force in Area Code 309?
There are 441,553 People in the Labor Forcein in Area Code 309.
What is the Percentage of People in the Labor Force in Area Code 309?
61.0% of People are in the Labor Force in Area Code 309.
What is the Unemployment Rate in Area Code 309?
Unemployment Rate in Area Code 309 is 5.4%.