Area Code 414 Map & Demographics
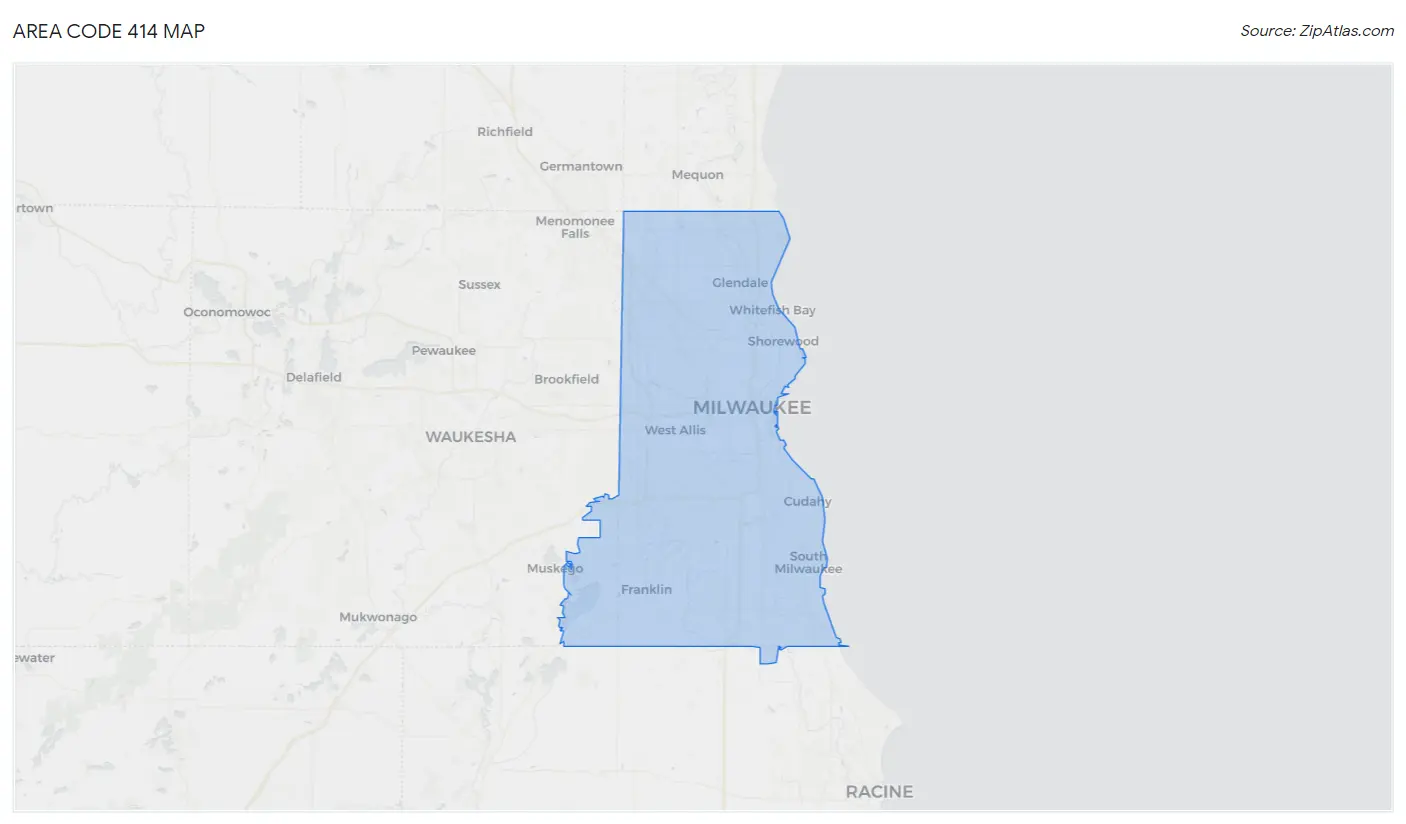
Area Code 414 Map
Area Code 414 Overview
$38,925
PER CAPITA INCOME
$90,509
AVG FAMILY INCOME
$68,476
AVG HOUSEHOLD INCOME
22.3%
WAGE / INCOME GAP [ % ]
77.7¢/ $1
WAGE / INCOME GAP [ $ ]
$10,682
FAMILY INCOME DEFICIT
17.76
INEQUALITY / GINI INDEX
1,053,614
TOTAL POPULATION
515,649
MALE POPULATION
537,965
FEMALE POPULATION
95.85
MALES / 100 FEMALES
104.33
FEMALES / 100 MALES
37.6
MEDIAN AGE
3.1
AVG FAMILY SIZE
2.3
AVG HOUSEHOLD SIZE
526,301
LABOR FORCE [ PEOPLE ]
63.0%
PERCENT IN LABOR FORCE
6.7%
UNEMPLOYMENT RATE
Income in Area Code 414
Income Overview in Area Code 414
Per Capita Income in Area Code 414 is $38,925, while median incomes of families and households are $90,509 and $68,476 respectively.
| Characteristic | Number | Measure |
| Per Capita Income | 1,053,614 | $38,925 |
| Median Family Income | 244,683 | $90,509 |
| Mean Family Income | 244,683 | $4,456,758 |
| Median Household Income | 438,871 | $68,476 |
| Mean Household Income | 438,871 | $3,572,595 |
| Income Deficit | 244,683 | $10,682 |
| Wage / Income Gap (%) | 1,053,614 | 22.25% |
| Wage / Income Gap ($) | 1,053,614 | 77.75¢ per $1 |
| Gini / Inequality Index | 1,053,614 | 17.76 |
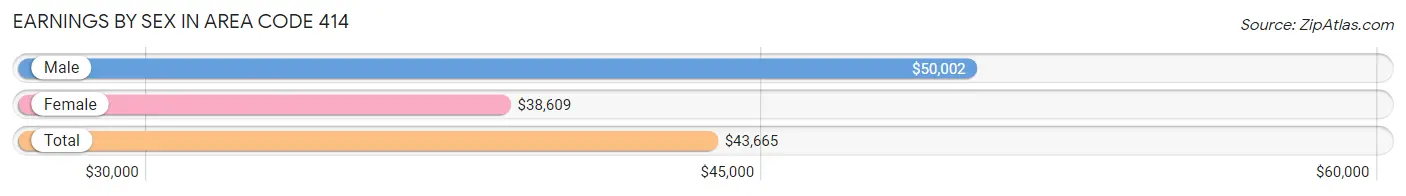
Earnings by Sex in Area Code 414
Average Earnings in Area Code 414 are $43,665, $50,002 for men and $38,609 for women, a difference of 22.8%.
| Sex | Number | Average Earnings |
| Male | 288,473 (50.7%) | $50,002 |
| Female | 280,949 (49.3%) | $38,609 |
| Total | 569,422 (100.0%) | $43,665 |
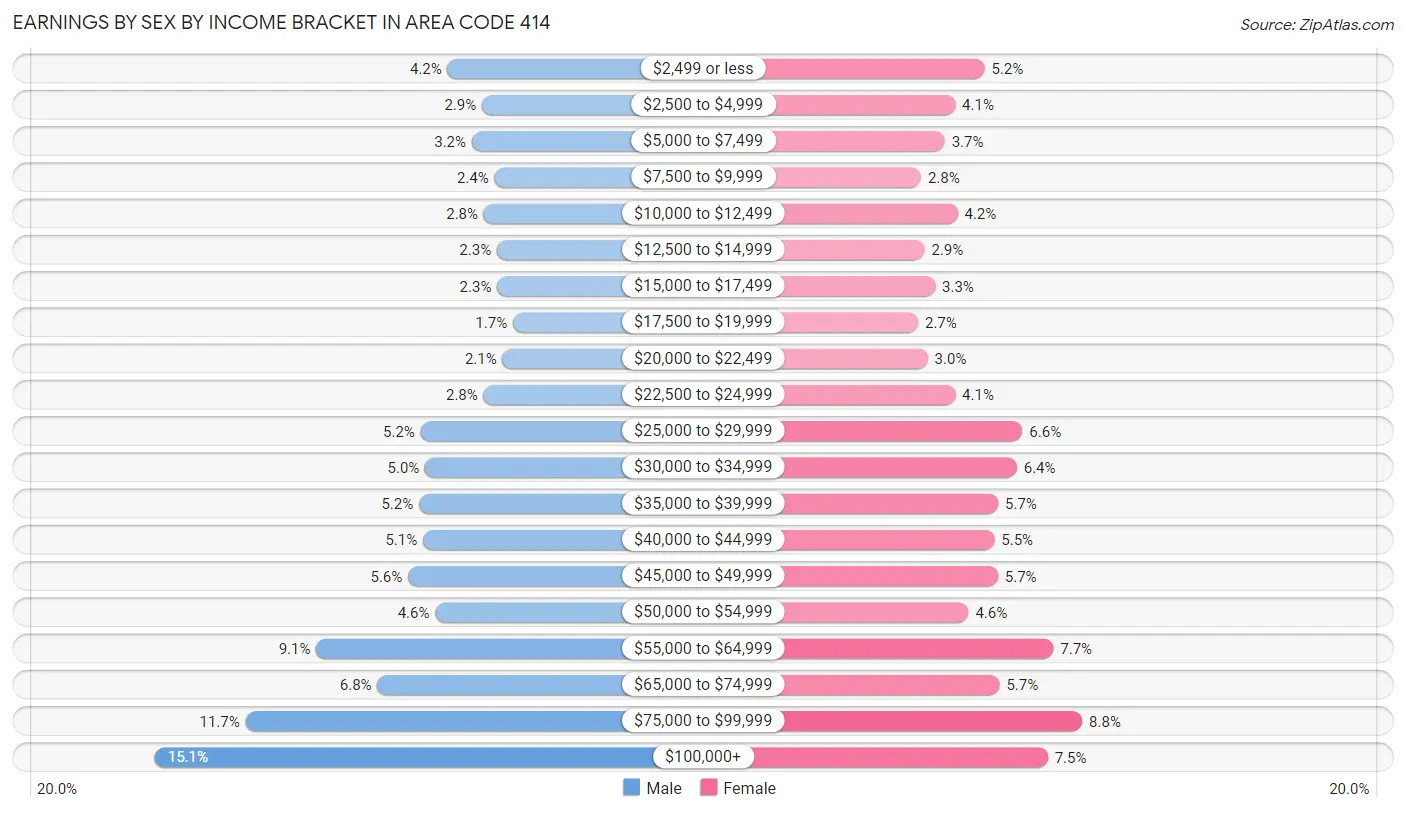
Earnings by Sex by Income Bracket in Area Code 414
The most common earnings brackets in Area Code 414 are $100,000+ for men (43,617 | 15.1%) and $75,000 to $99,999 for women (24,779 | 8.8%).
| Income | Male | Female |
| $2,499 or less | 11,984 (4.2%) | 14,498 (5.2%) |
| $2,500 to $4,999 | 8,261 (2.9%) | 11,407 (4.1%) |
| $5,000 to $7,499 | 9,344 (3.2%) | 10,317 (3.7%) |
| $7,500 to $9,999 | 6,901 (2.4%) | 7,813 (2.8%) |
| $10,000 to $12,499 | 8,049 (2.8%) | 11,661 (4.2%) |
| $12,500 to $14,999 | 6,645 (2.3%) | 8,184 (2.9%) |
| $15,000 to $17,499 | 6,608 (2.3%) | 9,309 (3.3%) |
| $17,500 to $19,999 | 4,911 (1.7%) | 7,515 (2.7%) |
| $20,000 to $22,499 | 6,027 (2.1%) | 8,508 (3.0%) |
| $22,500 to $24,999 | 8,070 (2.8%) | 11,416 (4.1%) |
| $25,000 to $29,999 | 14,893 (5.2%) | 18,492 (6.6%) |
| $30,000 to $34,999 | 14,394 (5.0%) | 17,892 (6.4%) |
| $35,000 to $39,999 | 15,061 (5.2%) | 15,934 (5.7%) |
| $40,000 to $44,999 | 14,627 (5.1%) | 15,540 (5.5%) |
| $45,000 to $49,999 | 16,240 (5.6%) | 15,904 (5.7%) |
| $50,000 to $54,999 | 13,301 (4.6%) | 12,799 (4.6%) |
| $55,000 to $64,999 | 26,162 (9.1%) | 21,732 (7.7%) |
| $65,000 to $74,999 | 19,561 (6.8%) | 16,083 (5.7%) |
| $75,000 to $99,999 | 33,817 (11.7%) | 24,779 (8.8%) |
| $100,000+ | 43,617 (15.1%) | 21,166 (7.5%) |
| Total | 288,473 (100.0%) | 280,949 (100.0%) |
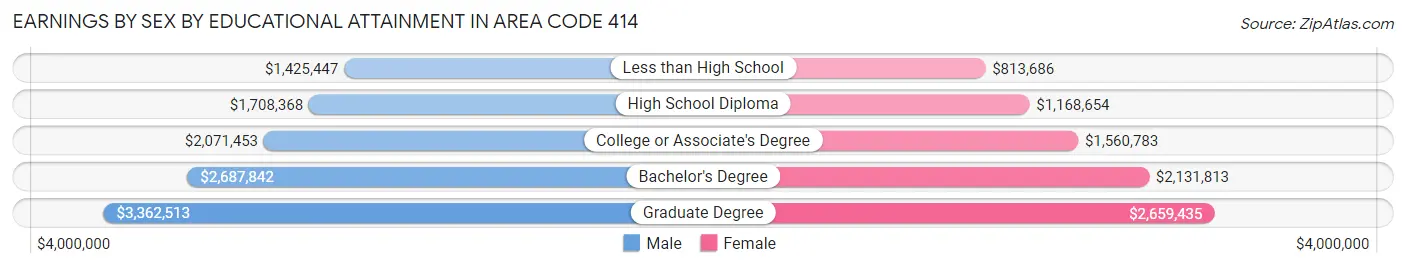
Earnings by Sex by Educational Attainment in Area Code 414
Average earnings in Area Code 414 are $2,327,462 for men and $1,754,681 for women, a difference of 24.6%. Men with an educational attainment of graduate degree enjoy the highest average annual earnings of $3,362,513, while those with less than high school education earn the least with $1,425,447. Women with an educational attainment of graduate degree earn the most with the average annual earnings of $2,659,435, while those with less than high school education have the smallest earnings of $813,686.
| Educational Attainment | Male Income | Female Income |
| Less than High School | $1,425,447 | $813,686 |
| High School Diploma | $1,708,368 | $1,168,654 |
| College or Associate's Degree | $2,071,453 | $1,560,783 |
| Bachelor's Degree | $2,687,842 | $2,131,813 |
| Graduate Degree | $3,362,513 | $2,659,435 |
| Total | $2,327,462 | $1,754,681 |
Family Income in Area Code 414
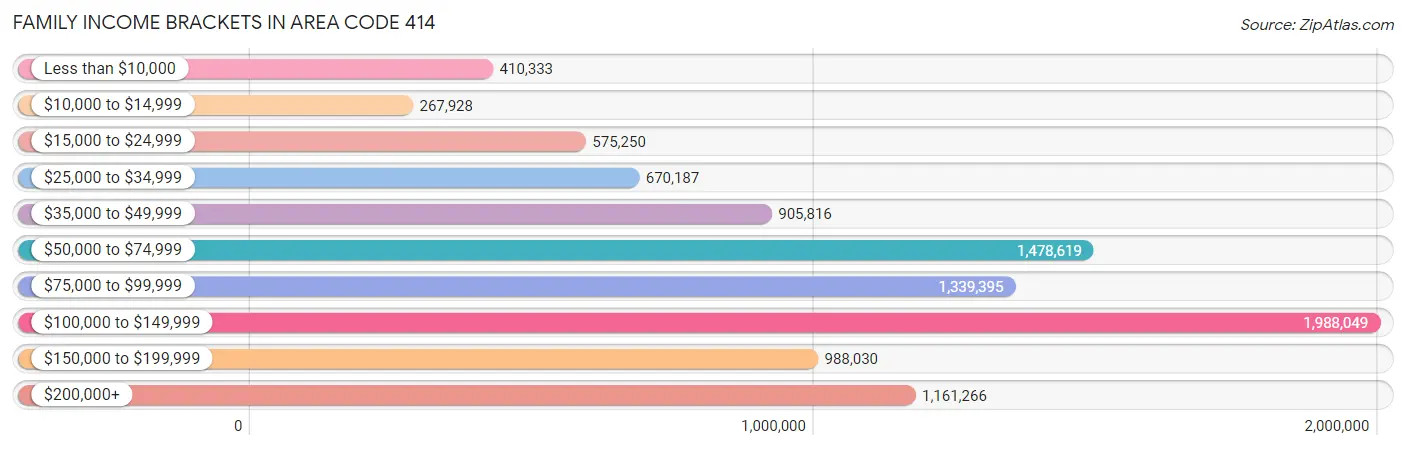
Family Income Brackets in Area Code 414
According to the Area Code 414 family income data, there are 1,988,049 families falling into the $100,000 to $149,999 income range, which is the most common income bracket and makes up 812.5% of all families. Conversely, the $10,000 to $14,999 income bracket is the least frequent group with only 267,928 families (109.5%) belonging to this category.
| Income Bracket | # Families | % Families |
| Less than $10,000 | 410,333 | 167.7% |
| $10,000 to $14,999 | 267,928 | 109.5% |
| $15,000 to $24,999 | 575,250 | 235.1% |
| $25,000 to $34,999 | 670,187 | 273.9% |
| $35,000 to $49,999 | 905,816 | 370.2% |
| $50,000 to $74,999 | 1,478,619 | 604.3% |
| $75,000 to $99,999 | 1,339,395 | 547.4% |
| $100,000 to $149,999 | 1,988,049 | 812.5% |
| $150,000 to $199,999 | 988,030 | 403.8% |
| $200,000+ | 1,161,266 | 474.6% |
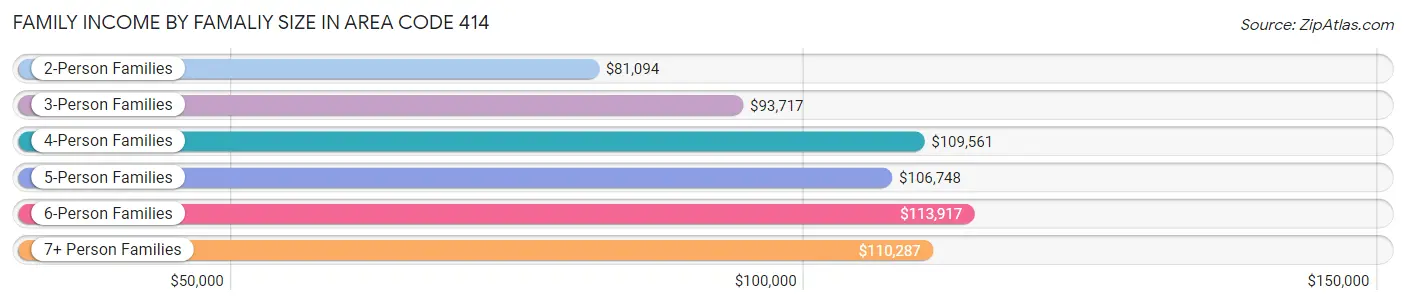
Family Income by Famaliy Size in Area Code 414
6-person families (7,087 | 2.9%) account for the highest median family income in Area Code 414 with $113,917 per family, while 2-person families (118,112 | 48.3%) have the highest median income of $40,547 per family member.
| Income Bracket | # Families | Median Income |
| 2-Person Families | 118,112 (48.3%) | $81,094 |
| 3-Person Families | 54,460 (22.3%) | $93,717 |
| 4-Person Families | 42,314 (17.3%) | $109,561 |
| 5-Person Families | 18,766 (7.7%) | $106,748 |
| 6-Person Families | 7,087 (2.9%) | $113,917 |
| 7+ Person Families | 3,944 (1.6%) | $110,287 |
| Total | 244,683 (100.0%) | $90,509 |
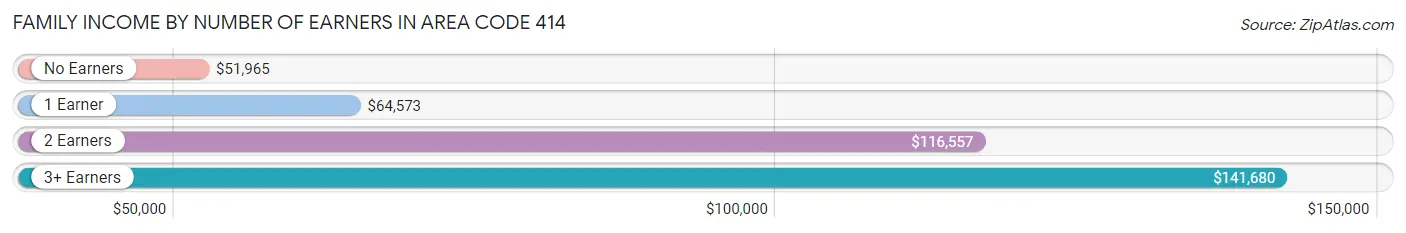
Family Income by Number of Earners in Area Code 414
The median family income in Area Code 414 is $90,509, with families comprising 3+ earners (26,060) having the highest median family income of $141,680, while families with no earners (35,748) have the lowest median family income of $51,965, accounting for 10.6% and 14.6% of families, respectively.
| Number of Earners | # Families | Median Income |
| No Earners | 35,748 (14.6%) | $51,965 |
| 1 Earner | 83,257 (34.0%) | $64,573 |
| 2 Earners | 99,618 (40.7%) | $116,557 |
| 3+ Earners | 26,060 (10.6%) | $141,680 |
| Total | 244,683 (100.0%) | $90,509 |
Household Income in Area Code 414
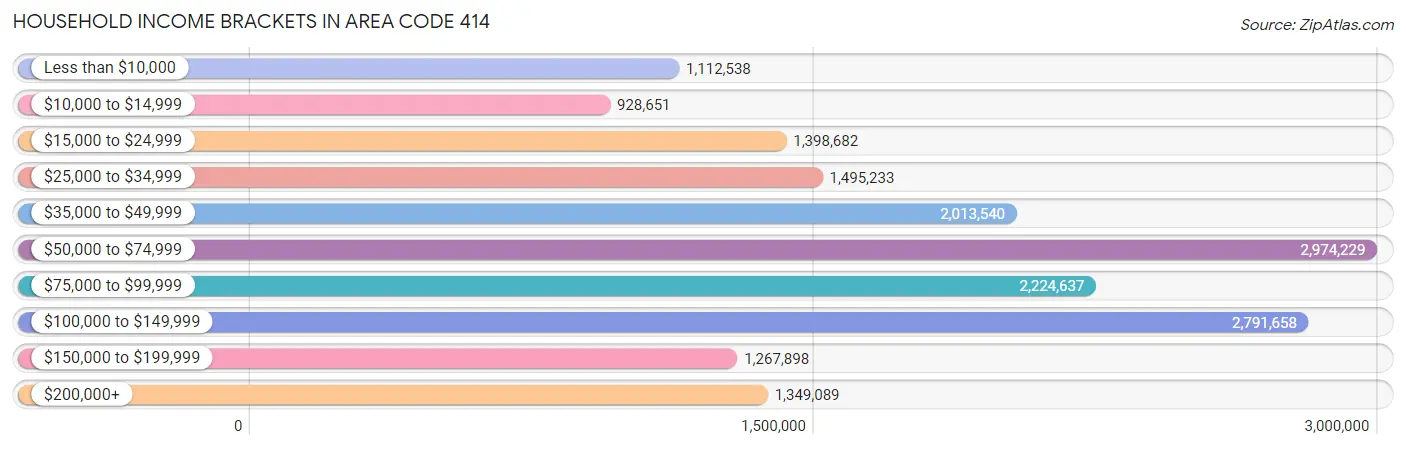
Household Income Brackets in Area Code 414
With 2,974,229 households falling in the category, the $50,000 to $74,999 income range is the most frequent in Area Code 414, accounting for 677.7% of all households. In contrast, only 928,651 households (211.6%) fall into the $10,000 to $14,999 income bracket, making it the least populous group.
| Income Bracket | # Households | % Households |
| Less than $10,000 | 1,112,538 | 253.5% |
| $10,000 to $14,999 | 928,651 | 211.6% |
| $15,000 to $24,999 | 1,398,682 | 318.7% |
| $25,000 to $34,999 | 1,495,233 | 340.7% |
| $35,000 to $49,999 | 2,013,540 | 458.8% |
| $50,000 to $74,999 | 2,974,229 | 677.7% |
| $75,000 to $99,999 | 2,224,637 | 506.9% |
| $100,000 to $149,999 | 2,791,658 | 636.1% |
| $150,000 to $199,999 | 1,267,898 | 288.9% |
| $200,000+ | 1,349,089 | 307.4% |
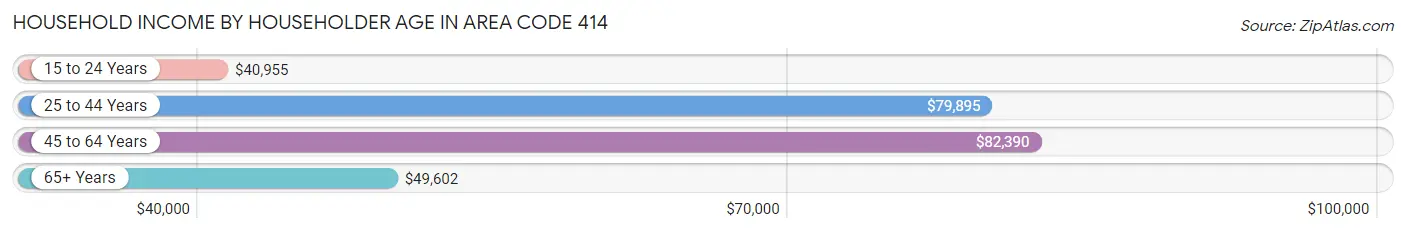
Household Income by Householder Age in Area Code 414
The median household income in Area Code 414 is $68,476, with the highest median household income of $82,390 found in the 45 to 64 years age bracket for the primary householder. A total of 150,149 households (34.2%) fall into this category. Meanwhile, the 15 to 24 years age bracket for the primary householder has the lowest median household income of $40,955, with 21,520 households (4.9%) in this group.
| Income Bracket | # Households | Median Income |
| 15 to 24 Years | 21,520 (4.9%) | $40,955 |
| 25 to 44 Years | 161,754 (36.9%) | $79,895 |
| 45 to 64 Years | 150,149 (34.2%) | $82,390 |
| 65+ Years | 105,448 (24.0%) | $49,602 |
| Total | 438,871 (100.0%) | $68,476 |
Poverty in Area Code 414
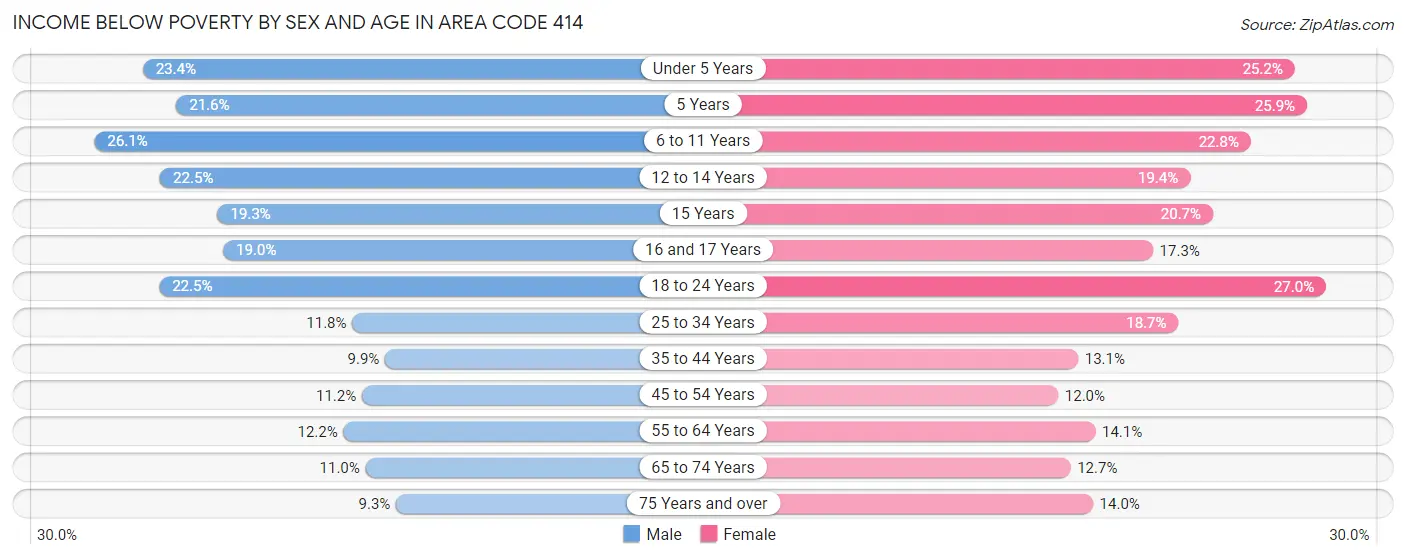
Income Below Poverty by Sex and Age in Area Code 414
With 15.1% poverty level for males and 17.2% for females among the residents of Area Code 414, 6 to 11 year old males and 18 to 24 year old females are the most vulnerable to poverty, with 10,992 males (26.1%) and 12,004 females (27.0%) in their respective age groups living below the poverty level.
| Age Bracket | Male | Female |
| Under 5 Years | 7,832 (23.4%) | 8,095 (25.2%) |
| 5 Years | 1,345 (21.5%) | 1,568 (25.9%) |
| 6 to 11 Years | 10,992 (26.1%) | 8,965 (22.8%) |
| 12 to 14 Years | 4,623 (22.5%) | 3,916 (19.4%) |
| 15 Years | 1,429 (19.3%) | 1,405 (20.7%) |
| 16 and 17 Years | 2,605 (19.0%) | 2,333 (17.3%) |
| 18 to 24 Years | 10,349 (22.5%) | 12,004 (27.0%) |
| 25 to 34 Years | 9,212 (11.7%) | 15,170 (18.7%) |
| 35 to 44 Years | 6,666 (9.9%) | 9,243 (13.1%) |
| 45 to 54 Years | 6,696 (11.2%) | 7,334 (12.0%) |
| 55 to 64 Years | 7,585 (12.2%) | 9,253 (14.1%) |
| 65 to 74 Years | 4,847 (11.0%) | 6,176 (12.7%) |
| 75 Years and over | 2,264 (9.3%) | 5,247 (14.0%) |
| Total | 76,445 (15.1%) | 90,709 (17.2%) |
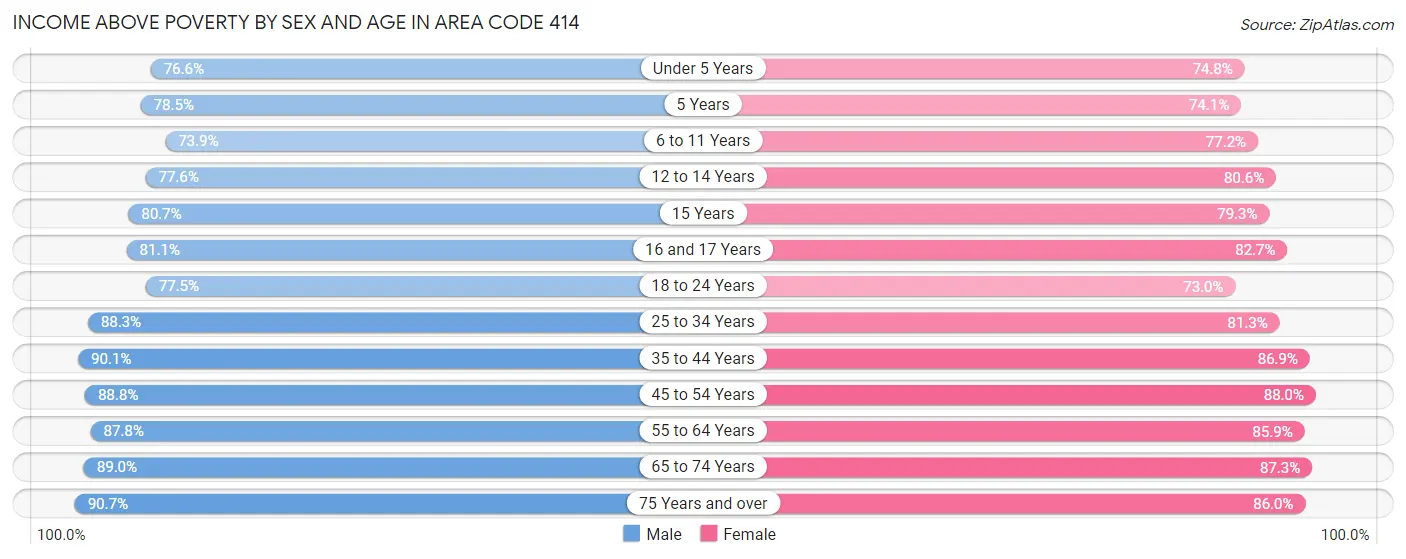
Income Above Poverty by Sex and Age in Area Code 414
According to the poverty statistics in Area Code 414, males aged 75 years and over and females aged 45 to 54 years are the age groups that are most secure financially, with 90.7% of males and 88.0% of females in these age groups living above the poverty line.
| Age Bracket | Male | Female |
| Under 5 Years | 25,608 (76.6%) | 24,007 (74.8%) |
| 5 Years | 4,897 (78.4%) | 4,486 (74.1%) |
| 6 to 11 Years | 31,099 (73.9%) | 30,411 (77.2%) |
| 12 to 14 Years | 15,970 (77.5%) | 16,277 (80.6%) |
| 15 Years | 5,989 (80.7%) | 5,397 (79.3%) |
| 16 and 17 Years | 11,139 (81.0%) | 11,143 (82.7%) |
| 18 to 24 Years | 35,652 (77.5%) | 32,527 (73.0%) |
| 25 to 34 Years | 69,161 (88.2%) | 65,770 (81.3%) |
| 35 to 44 Years | 60,528 (90.1%) | 61,093 (86.9%) |
| 45 to 54 Years | 53,036 (88.8%) | 53,620 (88.0%) |
| 55 to 64 Years | 54,404 (87.8%) | 56,374 (85.9%) |
| 65 to 74 Years | 39,194 (89.0%) | 42,371 (87.3%) |
| 75 Years and over | 22,044 (90.7%) | 32,301 (86.0%) |
| Total | 428,721 (84.9%) | 435,777 (82.8%) |
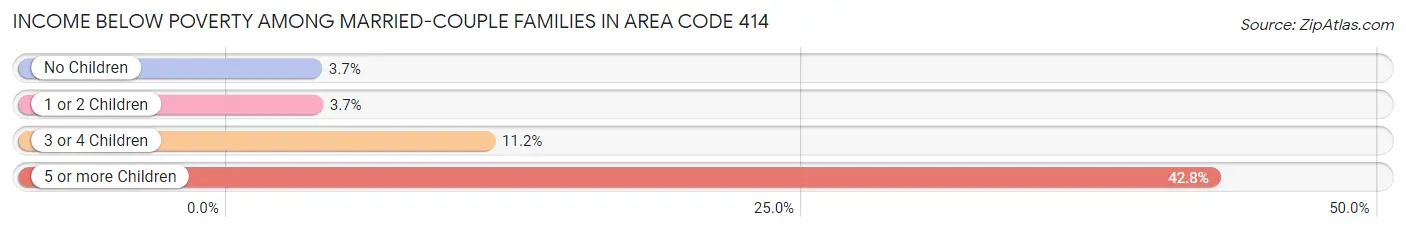
Income Below Poverty Among Married-Couple Families in Area Code 414
The poverty statistics for married-couple families in Area Code 414 show that 4.7% or 7,525 of the total 159,771 families live below the poverty line. Families with 5 or more children have the highest poverty rate of 42.8%, comprising of 720 families. On the other hand, families with no children have the lowest poverty rate of 3.6%, which includes 3,473 families.
| Children | Above Poverty | Below Poverty |
| No Children | 91,791 (96.4%) | 3,473 (3.6%) |
| 1 or 2 Children | 47,504 (96.3%) | 1,821 (3.7%) |
| 3 or 4 Children | 11,987 (88.8%) | 1,511 (11.2%) |
| 5 or more Children | 964 (57.2%) | 720 (42.8%) |
| Total | 152,246 (95.3%) | 7,525 (4.7%) |
Income Below Poverty Among Single-Parent Households in Area Code 414
According to the poverty data in Area Code 414, 16.2% or 3,612 single-father households and 27.5% or 17,241 single-mother households are living below the poverty line. Among single-father households, those with 5 or more children have the highest poverty rate, with 79 households (38.7%) experiencing poverty. Likewise, among single-mother households, those with 5 or more children have the highest poverty rate, with 735 households (68.5%) falling below the poverty line.

| Children | Single Father | Single Mother |
| No Children | 966 (10.0%) | 2,125 (10.6%) |
| 1 or 2 Children | 1,760 (17.1%) | 9,568 (29.6%) |
| 3 or 4 Children | 807 (38.0%) | 4,813 (51.9%) |
| 5 or more Children | 79 (38.7%) | 735 (68.5%) |
| Total | 3,612 (16.2%) | 17,241 (27.5%) |
Income Below Poverty Among Married-Couple vs Single-Parent Households in Area Code 414
The poverty data for Area Code 414 shows that 7,525 of the married-couple family households (4.7%) and 20,853 of the single-parent households (24.6%) are living below the poverty level. Within the married-couple family households, those with 5 or more children have the highest poverty rate, with 720 households (42.8%) falling below the poverty line. Among the single-parent households, those with 5 or more children have the highest poverty rate, with 814 household (63.7%) living below poverty.
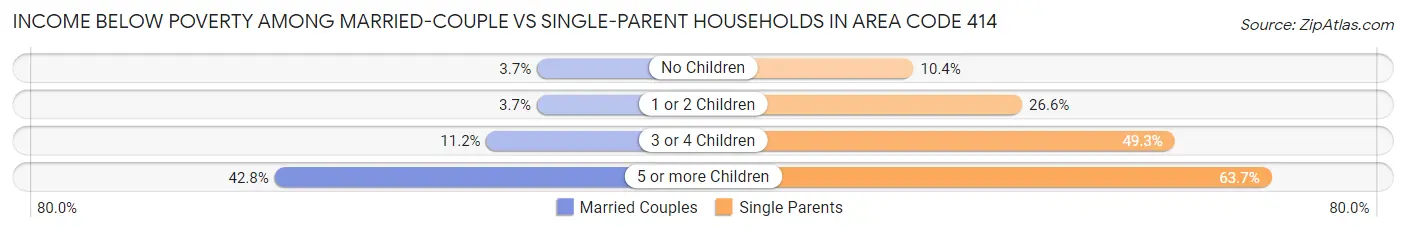
| Children | Married-Couple Families | Single-Parent Households |
| No Children | 3,473 (3.6%) | 3,091 (10.4%) |
| 1 or 2 Children | 1,821 (3.7%) | 11,328 (26.6%) |
| 3 or 4 Children | 1,511 (11.2%) | 5,620 (49.3%) |
| 5 or more Children | 720 (42.8%) | 814 (63.7%) |
| Total | 7,525 (4.7%) | 20,853 (24.6%) |
Race in Area Code 414
The most populous races in Area Code 414 are White / Caucasian (619,010 | 58.8%), Black / African American (237,508 | 22.5%), and Hispanic or Latino (156,688 | 14.9%).
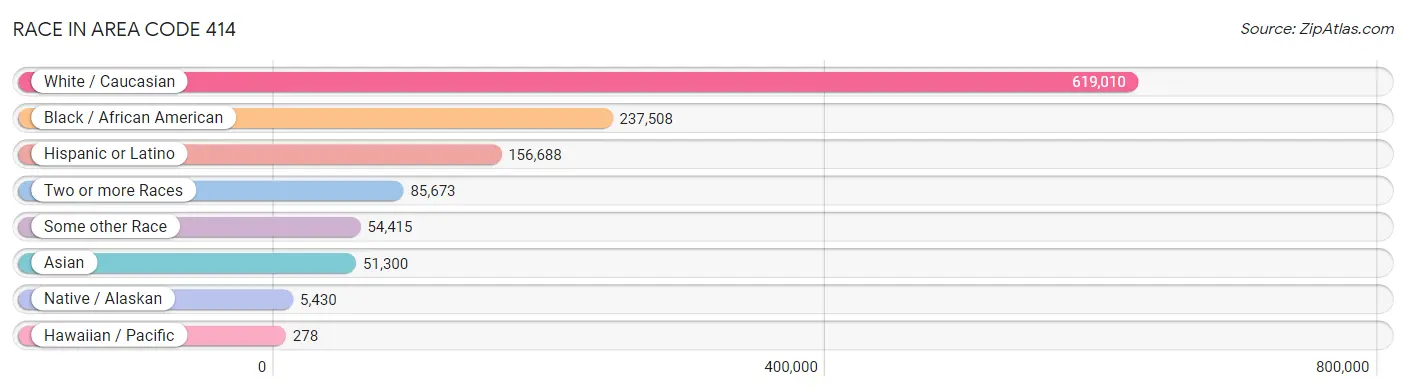
| Race | # Population | % Population |
| Asian | 51,300 | 4.9% |
| Black / African American | 237,508 | 22.5% |
| Hawaiian / Pacific | 278 | 0.0% |
| Hispanic or Latino | 156,688 | 14.9% |
| Native / Alaskan | 5,430 | 0.5% |
| White / Caucasian | 619,010 | 58.8% |
| Two or more Races | 85,673 | 8.1% |
| Some other Race | 54,415 | 5.2% |
| Total | 1,053,614 | 100.0% |
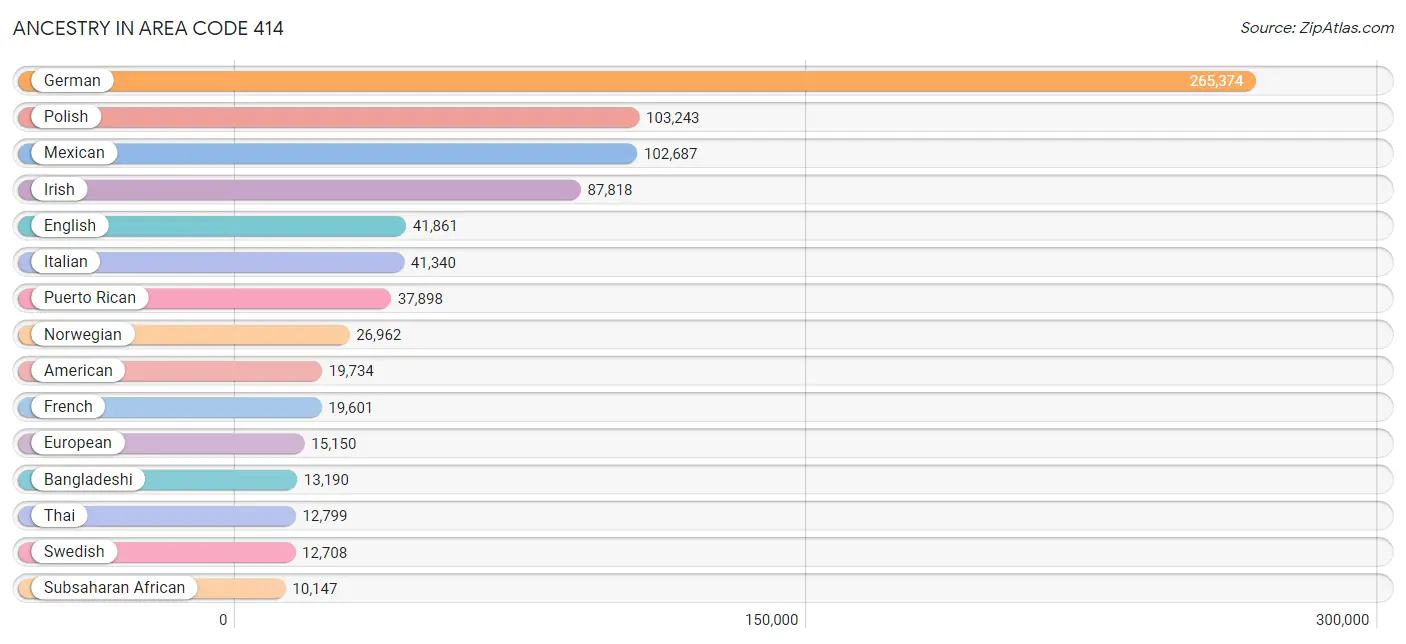
Ancestry in Area Code 414
The most populous ancestries reported in Area Code 414 are German (265,374 | 25.2%), Polish (103,243 | 9.8%), Mexican (102,687 | 9.8%), Irish (87,818 | 8.3%), and English (41,861 | 4.0%), together accounting for 57.0% of all Area Code 414 residents.
| Ancestry | # Population | % Population |
| Afghan | 9 | 0.0% |
| African | 5,497 | 0.5% |
| Alaska Native | 14 | 0.0% |
| Alaskan Athabascan | 26 | 0.0% |
| Albanian | 1,545 | 0.2% |
| Aleut | 126 | 0.0% |
| Alsatian | 60 | 0.0% |
| American | 19,734 | 1.9% |
| Apache | 212 | 0.0% |
| Arab | 7,936 | 0.7% |
| Argentinean | 589 | 0.1% |
| Armenian | 1,174 | 0.1% |
| Assyrian / Chaldean / Syriac | 136 | 0.0% |
| Australian | 228 | 0.0% |
| Austrian | 4,454 | 0.4% |
| Bahamian | 25 | 0.0% |
| Bangladeshi | 13,190 | 1.3% |
| Barbadian | 13 | 0.0% |
| Basque | 33 | 0.0% |
| Belgian | 2,153 | 0.2% |
| Belizean | 38 | 0.0% |
| Bhutanese | 2,595 | 0.3% |
| Blackfeet | 546 | 0.1% |
| Bolivian | 343 | 0.0% |
| Brazilian | 160 | 0.0% |
| British | 2,899 | 0.3% |
| British West Indian | 41 | 0.0% |
| Bulgarian | 282 | 0.0% |
| Burmese | 2,763 | 0.3% |
| Cajun | 14 | 0.0% |
| Cambodian | 19 | 0.0% |
| Canadian | 1,095 | 0.1% |
| Cape Verdean | 34 | 0.0% |
| Carpatho Rusyn | 26 | 0.0% |
| Celtic | 65 | 0.0% |
| Central American | 5,336 | 0.5% |
| Central American Indian | 1,140 | 0.1% |
| Cherokee | 1,458 | 0.1% |
| Cheyenne | 14 | 0.0% |
| Chickasaw | 22 | 0.0% |
| Chilean | 328 | 0.0% |
| Chippewa | 2,209 | 0.2% |
| Choctaw | 270 | 0.0% |
| Colombian | 1,209 | 0.1% |
| Comanche | 54 | 0.0% |
| Costa Rican | 304 | 0.0% |
| Cree | 111 | 0.0% |
| Creek | 122 | 0.0% |
| Croatian | 4,137 | 0.4% |
| Crow | 14 | 0.0% |
| Cuban | 1,469 | 0.1% |
| Czech | 7,523 | 0.7% |
| Czechoslovakian | 1,381 | 0.1% |
| Danish | 4,765 | 0.4% |
| Dominican | 1,569 | 0.2% |
| Dutch | 10,066 | 1.0% |
| Eastern European | 2,442 | 0.2% |
| Ecuadorian | 319 | 0.0% |
| Egyptian | 625 | 0.1% |
| English | 41,861 | 4.0% |
| Estonian | 69 | 0.0% |
| Ethiopian | 119 | 0.0% |
| European | 15,150 | 1.4% |
| Fijian | 13 | 0.0% |
| Filipino | 267 | 0.0% |
| Finnish | 3,443 | 0.3% |
| French | 19,601 | 1.9% |
| French American Indian | 95 | 0.0% |
| French Canadian | 4,954 | 0.5% |
| German | 265,374 | 25.2% |
| German Russian | 1,255 | 0.1% |
| Ghanaian | 348 | 0.0% |
| Greek | 4,387 | 0.4% |
| Guamanian / Chamorro | 52 | 0.0% |
| Guatemalan | 1,284 | 0.1% |
| Guyanese | 19 | 0.0% |
| Haitian | 274 | 0.0% |
| Honduran | 632 | 0.1% |
| Hungarian | 4,722 | 0.4% |
| Icelander | 72 | 0.0% |
| Indian (Asian) | 8,014 | 0.8% |
| Indonesian | 5,637 | 0.5% |
| Iranian | 410 | 0.0% |
| Iraqi | 461 | 0.0% |
| Irish | 87,818 | 8.3% |
| Iroquois | 1,386 | 0.1% |
| Israeli | 225 | 0.0% |
| Italian | 41,340 | 3.9% |
| Jamaican | 1,777 | 0.2% |
| Japanese | 227 | 0.0% |
| Jordanian | 420 | 0.0% |
| Kenyan | 182 | 0.0% |
| Kiowa | 17 | 0.0% |
| Korean | 4,667 | 0.4% |
| Laotian | 376 | 0.0% |
| Latvian | 657 | 0.1% |
| Lebanese | 470 | 0.0% |
| Liberian | 57 | 0.0% |
| Lithuanian | 2,163 | 0.2% |
| Luxembourger | 919 | 0.1% |
| Macedonian | 158 | 0.0% |
| Malaysian | 2,536 | 0.2% |
| Maltese | 14 | 0.0% |
| Menominee | 1,018 | 0.1% |
| Mexican | 102,687 | 9.8% |
| Mexican American Indian | 1,115 | 0.1% |
| Mongolian | 764 | 0.1% |
| Moroccan | 684 | 0.1% |
| Native Hawaiian | 399 | 0.0% |
| Navajo | 126 | 0.0% |
| New Zealander | 9 | 0.0% |
| Nicaraguan | 957 | 0.1% |
| Nigerian | 1,815 | 0.2% |
| Northern European | 992 | 0.1% |
| Norwegian | 26,962 | 2.6% |
| Okinawan | 9 | 0.0% |
| Osage | 12 | 0.0% |
| Ottawa | 47 | 0.0% |
| Pakistani | 1,149 | 0.1% |
| Palestinian | 2,032 | 0.2% |
| Panamanian | 444 | 0.0% |
| Paraguayan | 48 | 0.0% |
| Pennsylvania German | 69 | 0.0% |
| Peruvian | 752 | 0.1% |
| Pima | 19 | 0.0% |
| Polish | 103,243 | 9.8% |
| Portuguese | 504 | 0.1% |
| Potawatomi | 303 | 0.0% |
| Puerto Rican | 37,898 | 3.6% |
| Romanian | 962 | 0.1% |
| Russian | 7,305 | 0.7% |
| Salvadoran | 1,695 | 0.2% |
| Samoan | 102 | 0.0% |
| Scandinavian | 2,916 | 0.3% |
| Scotch-Irish | 2,910 | 0.3% |
| Scottish | 7,204 | 0.7% |
| Seminole | 46 | 0.0% |
| Senegalese | 126 | 0.0% |
| Serbian | 3,804 | 0.4% |
| Sierra Leonean | 37 | 0.0% |
| Sioux | 299 | 0.0% |
| Slavic | 484 | 0.1% |
| Slovak | 3,283 | 0.3% |
| Slovene | 2,720 | 0.3% |
| Somali | 1,097 | 0.1% |
| South African | 165 | 0.0% |
| South American | 4,478 | 0.4% |
| South American Indian | 53 | 0.0% |
| Spaniard | 829 | 0.1% |
| Spanish | 792 | 0.1% |
| Spanish American | 15 | 0.0% |
| Sri Lankan | 2,673 | 0.3% |
| Subsaharan African | 10,147 | 1.0% |
| Swedish | 12,708 | 1.2% |
| Swiss | 3,869 | 0.4% |
| Syrian | 419 | 0.0% |
| Taiwanese | 11 | 0.0% |
| Thai | 12,799 | 1.2% |
| Tongan | 57 | 0.0% |
| Trinidadian and Tobagonian | 32 | 0.0% |
| Turkish | 382 | 0.0% |
| U.S. Virgin Islander | 46 | 0.0% |
| Ugandan | 33 | 0.0% |
| Ukrainian | 2,020 | 0.2% |
| Uruguayan | 70 | 0.0% |
| Venezuelan | 783 | 0.1% |
| Vietnamese | 132 | 0.0% |
| Welsh | 3,018 | 0.3% |
| West Indian | 351 | 0.0% |
| Yaqui | 10 | 0.0% |
| Yugoslavian | 710 | 0.1% | View All 171 Rows |
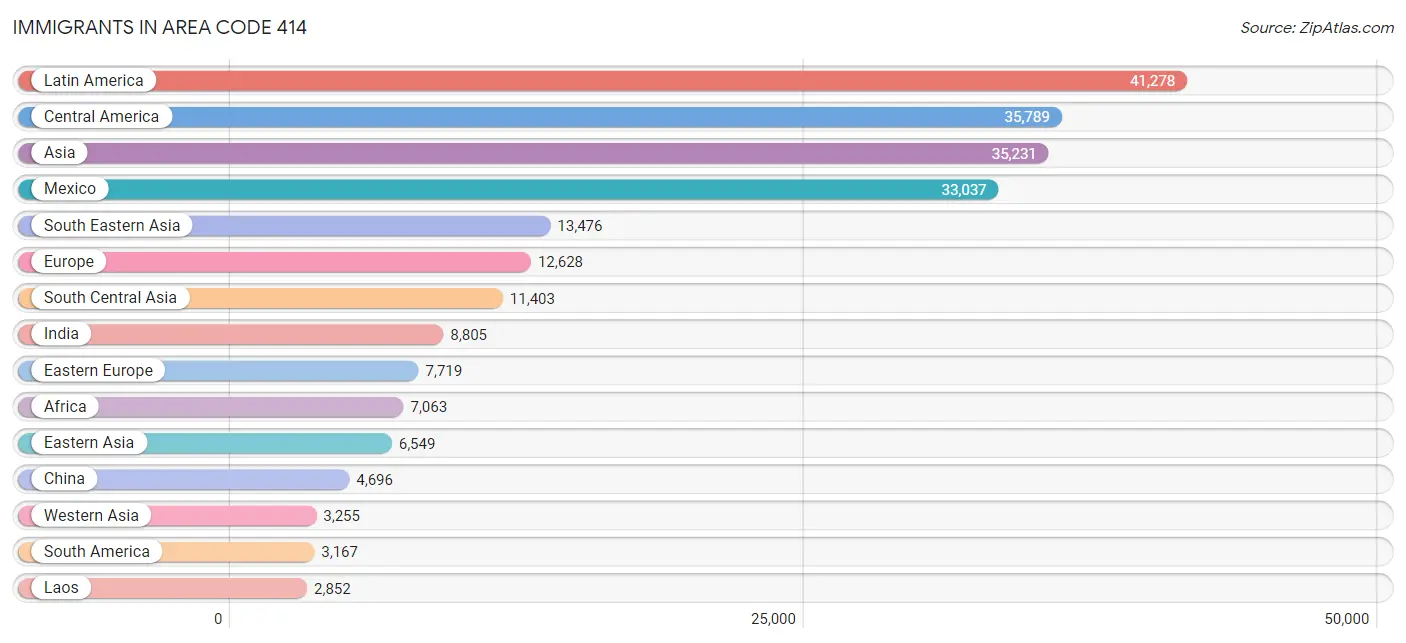
Immigrants in Area Code 414
The most numerous immigrant groups reported in Area Code 414 came from Latin America (41,278 | 3.9%), Central America (35,789 | 3.4%), Asia (35,231 | 3.3%), Mexico (33,037 | 3.1%), and South Eastern Asia (13,476 | 1.3%), together accounting for 15.1% of all Area Code 414 residents.
| Immigration Origin | # Population | % Population |
| Afghanistan | 9 | 0.0% |
| Africa | 7,063 | 0.7% |
| Albania | 793 | 0.1% |
| Argentina | 420 | 0.0% |
| Asia | 35,231 | 3.3% |
| Australia | 148 | 0.0% |
| Austria | 193 | 0.0% |
| Bahamas | 19 | 0.0% |
| Bangladesh | 251 | 0.0% |
| Barbados | 9 | 0.0% |
| Belarus | 186 | 0.0% |
| Belgium | 99 | 0.0% |
| Belize | 33 | 0.0% |
| Bolivia | 235 | 0.0% |
| Bosnia and Herzegovina | 369 | 0.0% |
| Brazil | 299 | 0.0% |
| Bulgaria | 108 | 0.0% |
| Cambodia | 133 | 0.0% |
| Cameroon | 273 | 0.0% |
| Canada | 1,220 | 0.1% |
| Caribbean | 2,322 | 0.2% |
| Central America | 35,789 | 3.4% |
| Chile | 187 | 0.0% |
| China | 4,696 | 0.4% |
| Colombia | 627 | 0.1% |
| Congo | 367 | 0.0% |
| Costa Rica | 101 | 0.0% |
| Croatia | 554 | 0.1% |
| Cuba | 442 | 0.0% |
| Czechoslovakia | 298 | 0.0% |
| Denmark | 21 | 0.0% |
| Dominica | 57 | 0.0% |
| Dominican Republic | 784 | 0.1% |
| Eastern Africa | 1,635 | 0.2% |
| Eastern Asia | 6,549 | 0.6% |
| Eastern Europe | 7,719 | 0.7% |
| Ecuador | 122 | 0.0% |
| Egypt | 505 | 0.1% |
| El Salvador | 757 | 0.1% |
| England | 415 | 0.0% |
| Eritrea | 62 | 0.0% |
| Ethiopia | 132 | 0.0% |
| Europe | 12,628 | 1.2% |
| France | 196 | 0.0% |
| Germany | 1,763 | 0.2% |
| Ghana | 442 | 0.0% |
| Greece | 332 | 0.0% |
| Guatemala | 695 | 0.1% |
| Guyana | 8 | 0.0% |
| Haiti | 88 | 0.0% |
| Honduras | 374 | 0.0% |
| Hong Kong | 271 | 0.0% |
| Hungary | 335 | 0.0% |
| India | 8,805 | 0.8% |
| Indonesia | 210 | 0.0% |
| Iran | 342 | 0.0% |
| Iraq | 648 | 0.1% |
| Ireland | 128 | 0.0% |
| Israel | 175 | 0.0% |
| Italy | 704 | 0.1% |
| Jamaica | 865 | 0.1% |
| Japan | 382 | 0.0% |
| Jordan | 927 | 0.1% |
| Kazakhstan | 57 | 0.0% |
| Kenya | 580 | 0.1% |
| Korea | 1,452 | 0.1% |
| Kuwait | 335 | 0.0% |
| Laos | 2,852 | 0.3% |
| Latin America | 41,278 | 3.9% |
| Latvia | 63 | 0.0% |
| Lebanon | 72 | 0.0% |
| Liberia | 39 | 0.0% |
| Lithuania | 100 | 0.0% |
| Malaysia | 869 | 0.1% |
| Mexico | 33,037 | 3.1% |
| Middle Africa | 1,096 | 0.1% |
| Moldova | 16 | 0.0% |
| Morocco | 559 | 0.1% |
| Nepal | 469 | 0.0% |
| Netherlands | 174 | 0.0% |
| Nicaragua | 679 | 0.1% |
| Nigeria | 1,135 | 0.1% |
| North Macedonia | 249 | 0.0% |
| Northern Africa | 1,215 | 0.1% |
| Northern Europe | 1,139 | 0.1% |
| Norway | 9 | 0.0% |
| Oceania | 196 | 0.0% |
| Pakistan | 1,296 | 0.1% |
| Panama | 113 | 0.0% |
| Peru | 567 | 0.1% |
| Philippines | 1,886 | 0.2% |
| Poland | 1,250 | 0.1% |
| Portugal | 25 | 0.0% |
| Romania | 388 | 0.0% |
| Russia | 1,137 | 0.1% |
| Saudi Arabia | 544 | 0.1% |
| Scotland | 89 | 0.0% |
| Senegal | 111 | 0.0% |
| Serbia | 278 | 0.0% |
| Sierra Leone | 79 | 0.0% |
| Singapore | 12 | 0.0% |
| Somalia | 664 | 0.1% |
| South Africa | 417 | 0.0% |
| South America | 3,167 | 0.3% |
| South Central Asia | 11,403 | 1.1% |
| South Eastern Asia | 13,476 | 1.3% |
| Southern Europe | 1,298 | 0.1% |
| Spain | 200 | 0.0% |
| Sri Lanka | 75 | 0.0% |
| Sudan | 27 | 0.0% |
| Sweden | 65 | 0.0% |
| Switzerland | 19 | 0.0% |
| Syria | 174 | 0.0% |
| Taiwan | 406 | 0.0% |
| Thailand | 2,702 | 0.3% |
| Trinidad and Tobago | 58 | 0.0% |
| Turkey | 300 | 0.0% |
| Uganda | 23 | 0.0% |
| Ukraine | 913 | 0.1% |
| Uzbekistan | 39 | 0.0% |
| Venezuela | 667 | 0.1% |
| Vietnam | 1,232 | 0.1% |
| Western Africa | 2,158 | 0.2% |
| Western Asia | 3,255 | 0.3% |
| Western Europe | 2,444 | 0.2% |
| Yemen | 4 | 0.0% |
| Zaire | 456 | 0.0% | View All 127 Rows |
Sex and Age in Area Code 414
Sex and Age in Area Code 414
The most populous age groups in Area Code 414 are 25 to 29 Years (40,556 | 7.9%) for men and 25 to 29 Years (41,417 | 7.7%) for women.
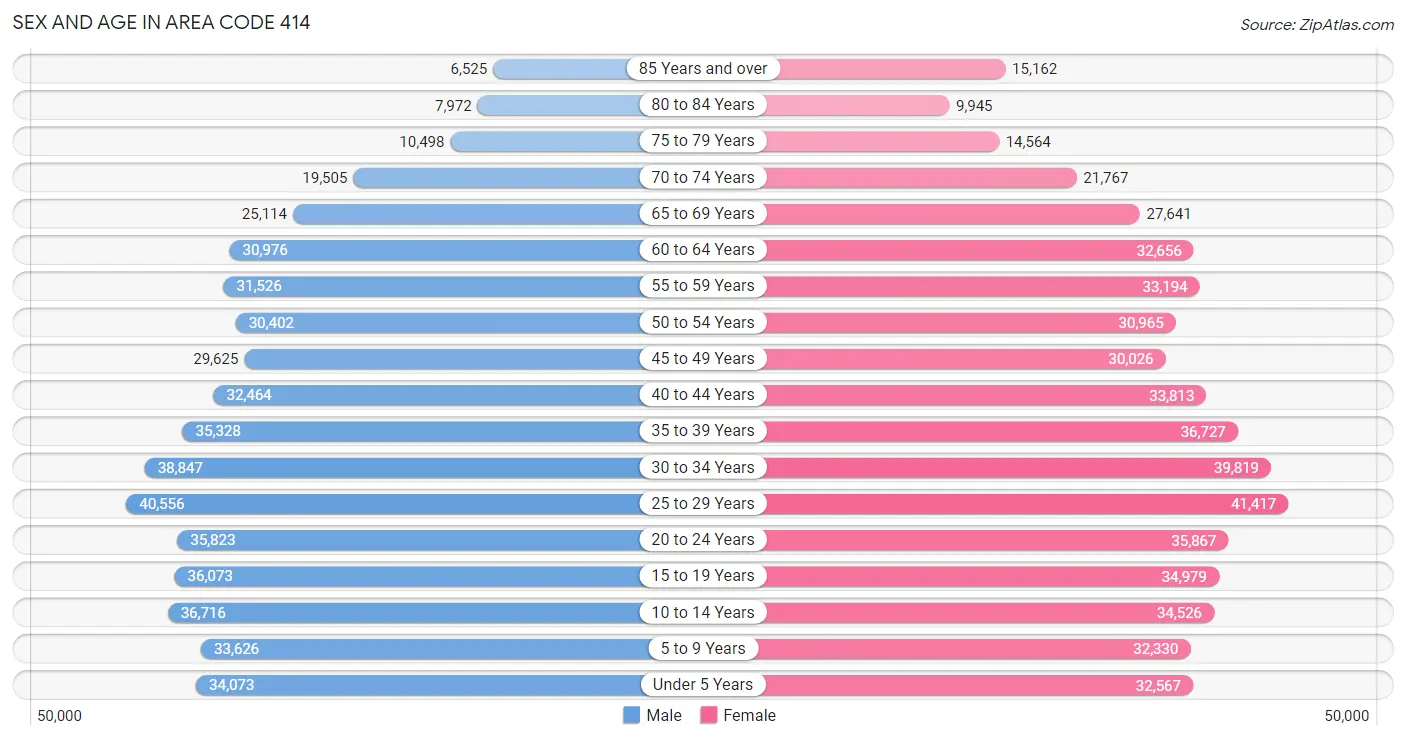
| Age Bracket | Male | Female |
| Under 5 Years | 34,073 (6.6%) | 32,567 (6.0%) |
| 5 to 9 Years | 33,626 (6.5%) | 32,330 (6.0%) |
| 10 to 14 Years | 36,716 (7.1%) | 34,526 (6.4%) |
| 15 to 19 Years | 36,073 (7.0%) | 34,979 (6.5%) |
| 20 to 24 Years | 35,823 (7.0%) | 35,867 (6.7%) |
| 25 to 29 Years | 40,556 (7.9%) | 41,417 (7.7%) |
| 30 to 34 Years | 38,847 (7.5%) | 39,819 (7.4%) |
| 35 to 39 Years | 35,328 (6.9%) | 36,727 (6.8%) |
| 40 to 44 Years | 32,464 (6.3%) | 33,813 (6.3%) |
| 45 to 49 Years | 29,625 (5.8%) | 30,026 (5.6%) |
| 50 to 54 Years | 30,402 (5.9%) | 30,965 (5.8%) |
| 55 to 59 Years | 31,526 (6.1%) | 33,194 (6.2%) |
| 60 to 64 Years | 30,976 (6.0%) | 32,656 (6.1%) |
| 65 to 69 Years | 25,114 (4.9%) | 27,641 (5.1%) |
| 70 to 74 Years | 19,505 (3.8%) | 21,767 (4.1%) |
| 75 to 79 Years | 10,498 (2.0%) | 14,564 (2.7%) |
| 80 to 84 Years | 7,972 (1.5%) | 9,945 (1.8%) |
| 85 Years and over | 6,525 (1.3%) | 15,162 (2.8%) |
| Total | 515,649 (100.0%) | 537,965 (100.0%) |
Families and Households in Area Code 414
Median Family Size in Area Code 414
The median family size in Area Code 414 is 3.06 persons per family, with married-couple families (159,771 | 65.3%) accounting for the largest median family size of 3.116 persons per family. On the other hand, single male/father families (22,308 | 9.1%) represent the smallest median family size with 2.81 persons per family.
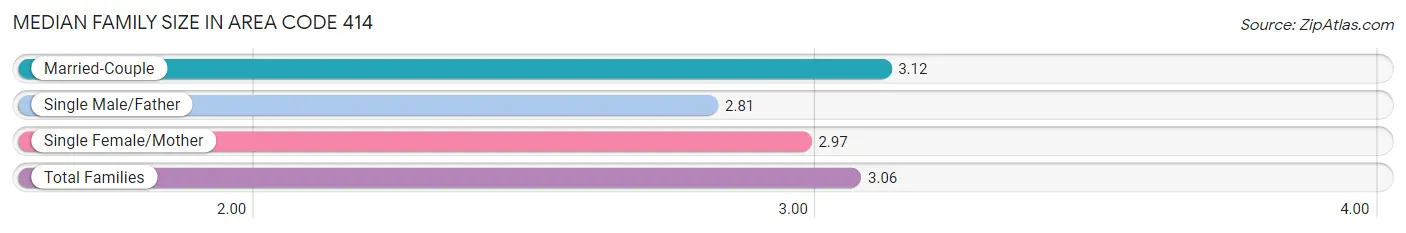
| Family Type | # Families | Family Size |
| Married-Couple | 159,771 (65.3%) | 3.12 |
| Single Male/Father | 22,308 (9.1%) | 2.81 |
| Single Female/Mother | 62,604 (25.6%) | 2.97 |
| Total Families | 244,683 (100.0%) | 3.06 |
Median Household Size in Area Code 414
The median household size in Area Code 414 is 2.33 persons per household, with single male/father households (22,308 | 5.1%) accounting for the largest median household size of 3.18325 persons per household. non-family households (194,188 | 44.3%) represent the smallest median household size with 1.24 persons per household.
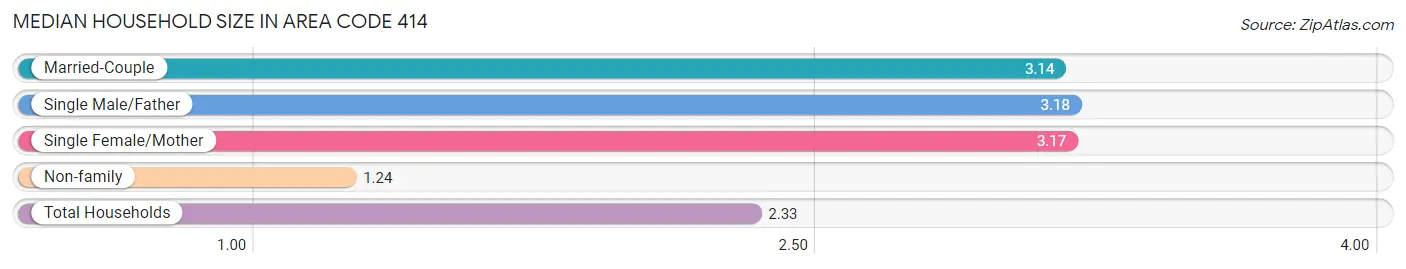
| Household Type | # Households | Household Size |
| Married-Couple | 159,771 (36.4%) | 3.14 |
| Single Male/Father | 22,308 (5.1%) | 3.18 |
| Single Female/Mother | 62,604 (14.3%) | 3.17 |
| Non-family | 194,188 (44.3%) | 1.24 |
| Total Households | 438,871 (100.0%) | 2.33 |
Household Size by Marriage Status in Area Code 414
Out of a total of 438,871 households in Area Code 414, 244,683 (55.7%) are family households, while 194,188 (44.3%) are nonfamily households. The most numerous type of family households are 2-person households, comprising 109,445, and the most common type of nonfamily households are 1-person households, comprising 157,658.
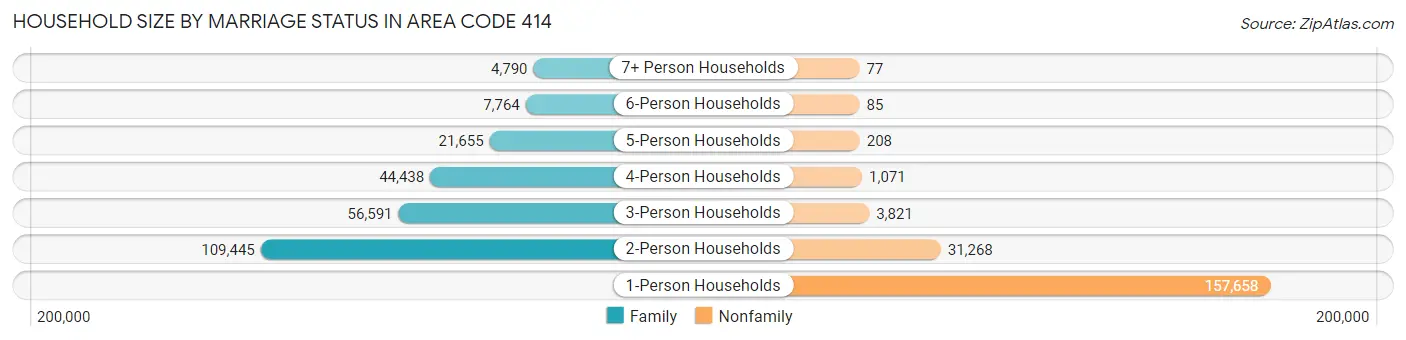
| Household Size | Family Households | Nonfamily Households |
| 1-Person Households | - | 157,658 (35.9%) |
| 2-Person Households | 109,445 (24.9%) | 31,268 (7.1%) |
| 3-Person Households | 56,591 (12.9%) | 3,821 (0.9%) |
| 4-Person Households | 44,438 (10.1%) | 1,071 (0.2%) |
| 5-Person Households | 21,655 (4.9%) | 208 (0.1%) |
| 6-Person Households | 7,764 (1.8%) | 85 (0.0%) |
| 7+ Person Households | 4,790 (1.1%) | 77 (0.0%) |
| Total | 244,683 (55.7%) | 194,188 (44.3%) |
Female Fertility in Area Code 414
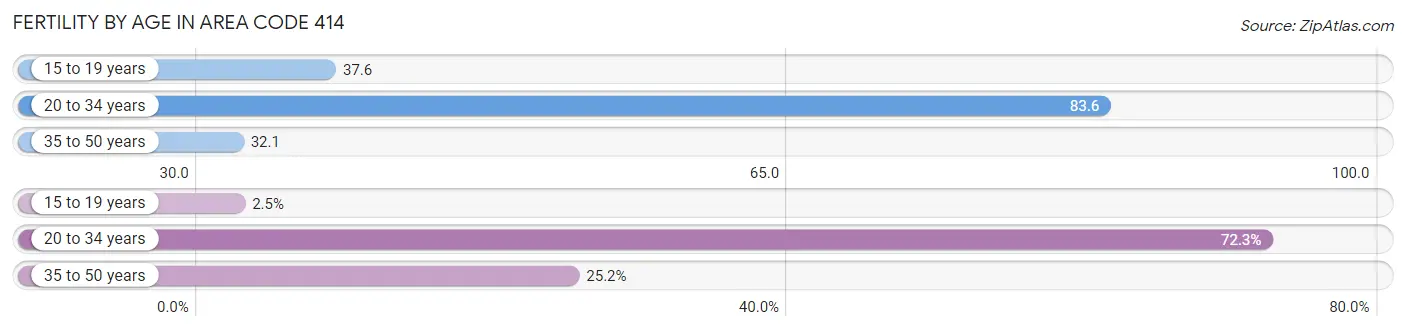
Fertility by Age in Area Code 414
Average fertility rate in Area Code 414 is 46.4 births per 1,000 women. Women in the age bracket of 20 to 34 years have the highest fertility rate with 83.6 births per 1,000 women. Women in the age bracket of 20 to 34 years acount for 72.3% of all women with births.
| Age Bracket | Women with Births | Births / 1,000 Women |
| 15 to 19 years | 310 (2.5%) | 37.6 |
| 20 to 34 years | 8,881 (72.3%) | 83.6 |
| 35 to 50 years | 3,096 (25.2%) | 32.1 |
| Total | 12,287 (100.0%) | 46.4 |
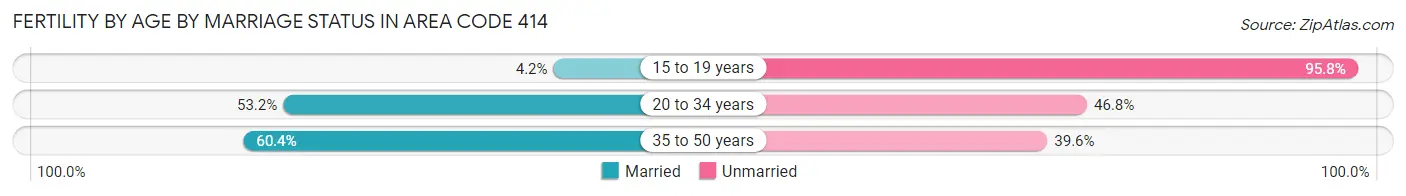
Fertility by Age by Marriage Status in Area Code 414
56.5% of women with births (12,287) in Area Code 414 are married. The highest percentage of unmarried women with births falls into 15 to 19 years age bracket with 95.8% of them unmarried at the time of birth, while the lowest percentage of unmarried women with births belong to 35 to 50 years age bracket with 39.6% of them unmarried.
| Age Bracket | Married | Unmarried |
| 15 to 19 years | 13 (4.2%) | 297 (95.8%) |
| 20 to 34 years | 4,722 (53.2%) | 4,159 (46.8%) |
| 35 to 50 years | 1,869 (60.4%) | 1,227 (39.6%) |
| Total | 6,945 (56.5%) | 5,342 (43.5%) |
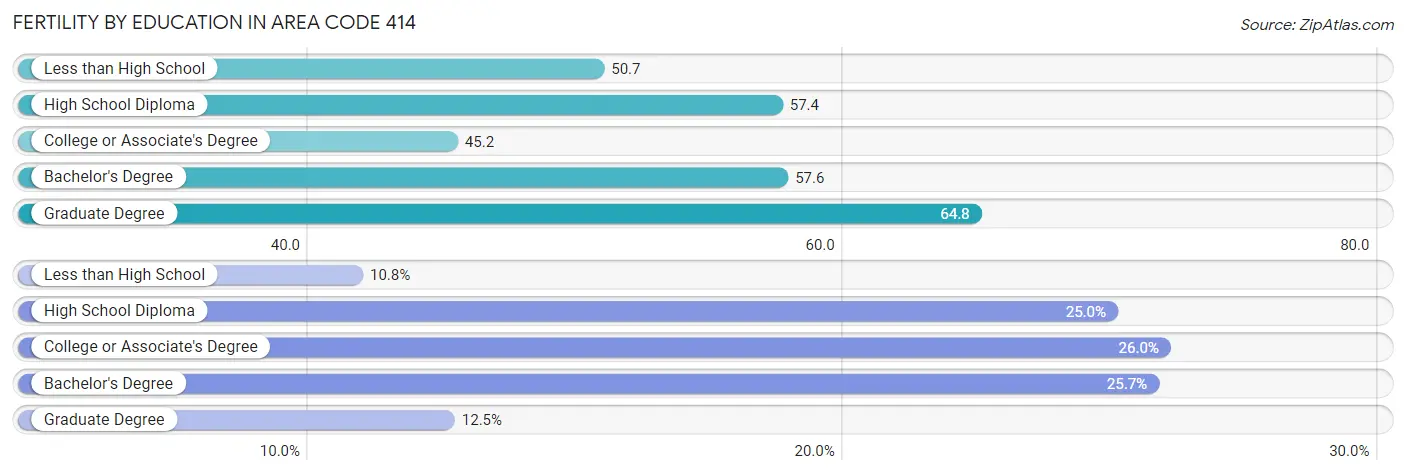
Fertility by Education in Area Code 414
Average fertility rate in Area Code 414 is 46.4 births per 1,000 women. Women with the education attainment of graduate degree have the highest fertility rate of 64.8 births per 1,000 women, while women with the education attainment of college or associate's degree have the lowest fertility at 45.2 births per 1,000 women. Women with the education attainment of college or associate's degree represent 26.0% of all women with births.
| Educational Attainment | Women with Births | Births / 1,000 Women |
| Less than High School | 1,329 (10.8%) | 50.7 |
| High School Diploma | 3,067 (25.0%) | 57.4 |
| College or Associate's Degree | 3,188 (26.0%) | 45.2 |
| Bachelor's Degree | 3,162 (25.7%) | 57.6 |
| Graduate Degree | 1,541 (12.5%) | 64.8 |
| Total | 12,287 (100.0%) | 46.4 |
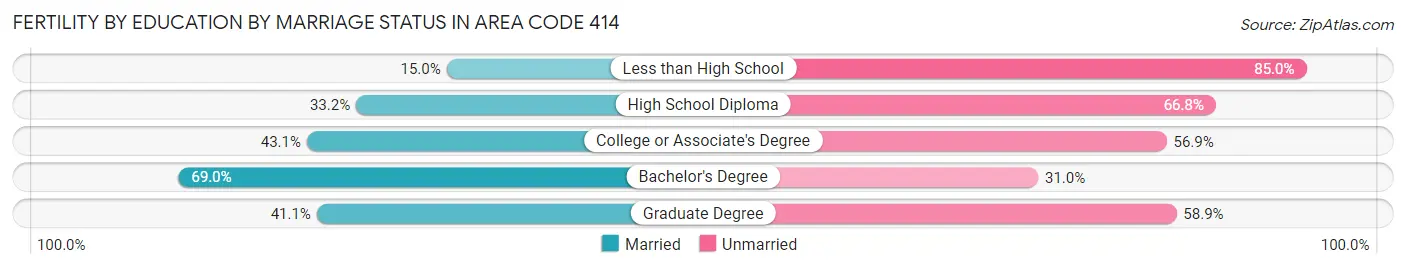
Fertility by Education by Marriage Status in Area Code 414
43.5% of women with births in Area Code 414 are unmarried. Women with the educational attainment of bachelor's degree are most likely to be married with 69.0% of them married at childbirth, while women with the educational attainment of less than high school are least likely to be married with 85.0% of them unmarried at childbirth.
| Educational Attainment | Married | Unmarried |
| Less than High School | 199 (15.0%) | 1,130 (85.0%) |
| High School Diploma | 1,019 (33.2%) | 2,048 (66.8%) |
| College or Associate's Degree | 1,375 (43.1%) | 1,813 (56.9%) |
| Bachelor's Degree | 2,182 (69.0%) | 980 (31.0%) |
| Graduate Degree | 634 (41.1%) | 907 (58.9%) |
| Total | 6,945 (56.5%) | 5,342 (43.5%) |
Employment Characteristics in Area Code 414
Employment by Class of Employer in Area Code 414
Among the 508,444 employed individuals in Area Code 414, private company employees (359,120 | 70.6%), not-for-profit organizations (61,238 | 12.0%), and local government employees (32,237 | 6.3%) make up the most common classes of employment.
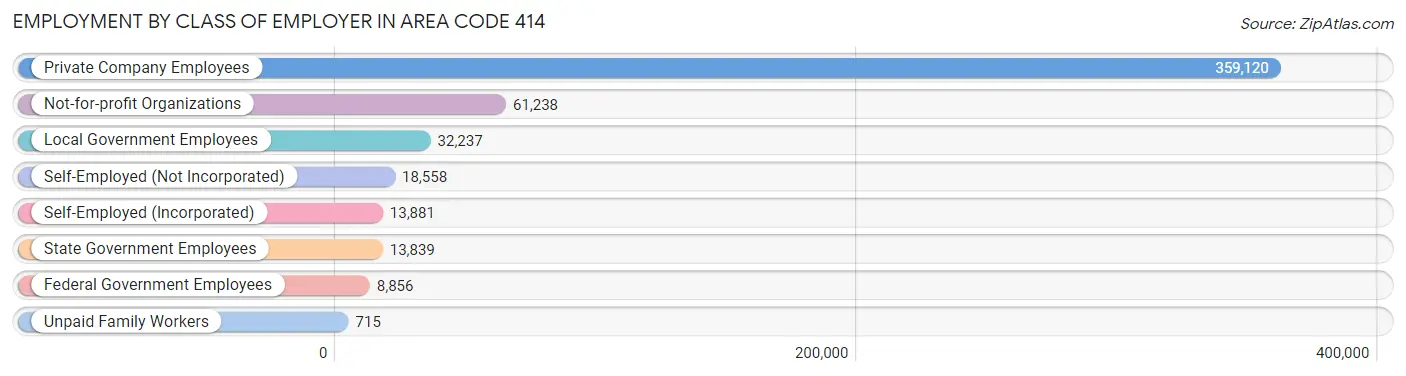
| Employer Class | # Employees | % Employees |
| Private Company Employees | 359,120 | 70.6% |
| Self-Employed (Incorporated) | 13,881 | 2.7% |
| Self-Employed (Not Incorporated) | 18,558 | 3.6% |
| Not-for-profit Organizations | 61,238 | 12.0% |
| Local Government Employees | 32,237 | 6.3% |
| State Government Employees | 13,839 | 2.7% |
| Federal Government Employees | 8,856 | 1.7% |
| Unpaid Family Workers | 715 | 0.1% |
| Total | 508,444 | 100.0% |
Employment Status by Age in Area Code 414
According to the labor force statistics for Area Code 414, out of the total population over 16 years of age (835,528), 63.0% or 526,299 individuals are in the labor force, with 6.7% or 35,315 of them unemployed. The age group with the highest labor force participation rate is 30 to 34 years, with 85.6% or 67,338 individuals in the labor force. Within the labor force, the 16 to 19 years age range has the highest percentage of unemployed individuals, with 356.6% or 93,016 of them being unemployed.
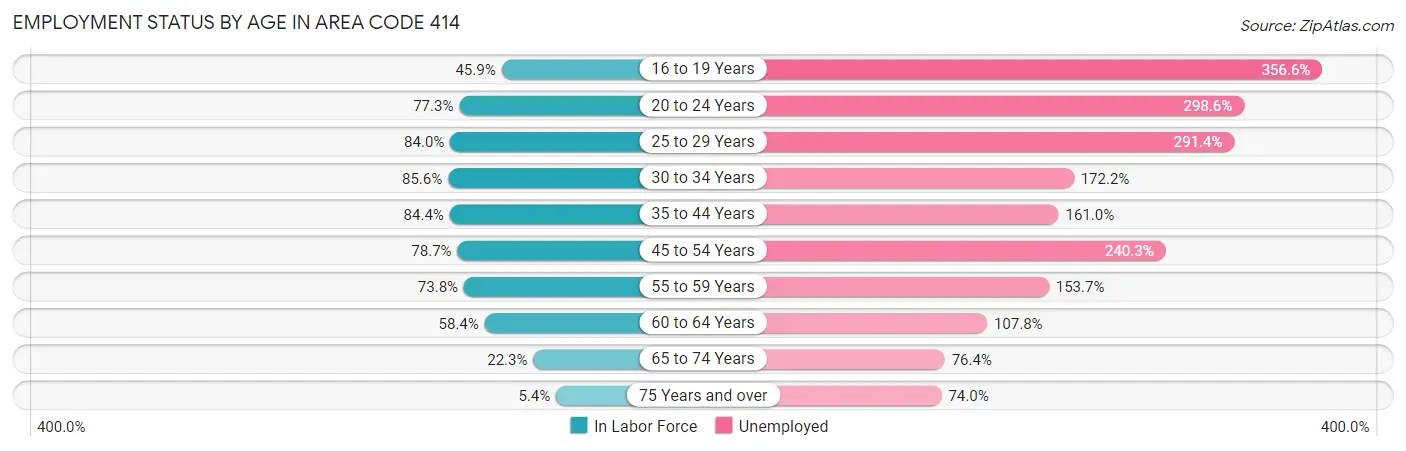
| Age Bracket | In Labor Force | Unemployed |
| 16 to 19 Years | 26,083 (45.9%) | 93,016 (356.6%) |
| 20 to 24 Years | 55,425 (77.3%) | 165,496 (298.6%) |
| 25 to 29 Years | 68,893 (84.0%) | 200,745 (291.4%) |
| 30 to 34 Years | 67,336 (85.6%) | 115,956 (172.2%) |
| 35 to 44 Years | 116,763 (84.4%) | 187,993 (161.0%) |
| 45 to 54 Years | 95,182 (78.6%) | 228,720 (240.3%) |
| 55 to 59 Years | 47,775 (73.8%) | 73,432 (153.7%) |
| 60 to 64 Years | 37,190 (58.5%) | 40,088 (107.8%) |
| 65 to 74 Years | 21,001 (22.3%) | 16,049 (76.4%) |
| 75 Years and over | 3,511 (5.4%) | 2,598 (74.0%) |
| Total | 526,301 (63.0%) | 35,339 (6.7%) |
Employment Status by Educational Attainment in Area Code 414
According to labor force statistics for Area Code 414, 77.7% of individuals (426,116) out of the total population between 25 and 64 years of age (548,341) are in the labor force, with 259.2% or 1,104,493 of them being unemployed. The group with the highest labor force participation rate are those with the educational attainment of bachelor's degree or higher, with 88.0% or 177,421 individuals in the labor force. Within the labor force, individuals with high school diploma education have the highest percentage of unemployment, with 349.2% or 345,554 of them being unemployed.
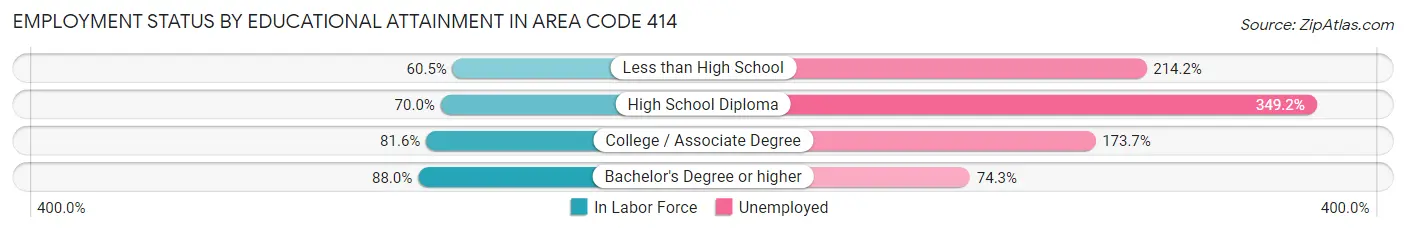
| Educational Attainment | In Labor Force | Unemployed |
| Less than High School | 30,637 (60.5%) | 108,394 (214.2%) |
| High School Diploma | 98,955 (70.0%) | 493,437 (349.2%) |
| College / Associate Degree | 126,182 (81.6%) | 268,757 (173.7%) |
| Bachelor's Degree or higher | 177,421 (88.0%) | 149,868 (74.3%) |
| Total | 426,128 (77.7%) | 1,421,300 (259.2%) |
Employment Occupations by Sex in Area Code 414
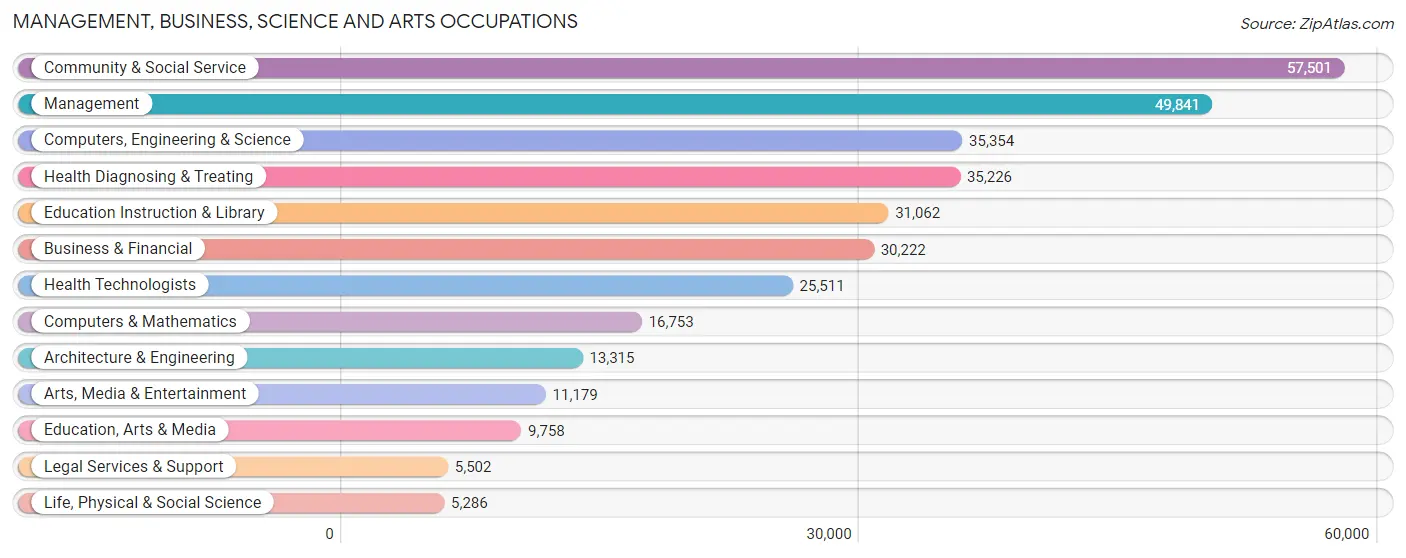
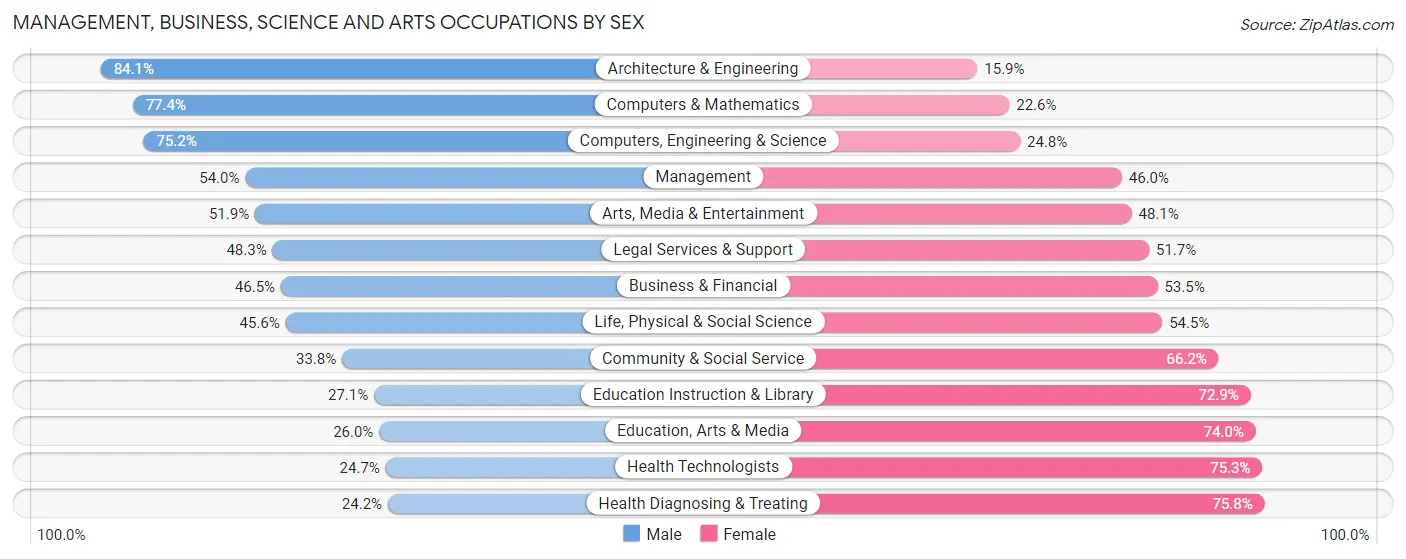
Management, Business, Science and Arts Occupations
The most common Management, Business, Science and Arts occupations in Area Code 414 are Community & Social Service (57,501 | 11.1%), Management (49,841 | 9.7%), Computers, Engineering & Science (35,354 | 6.9%), Health Diagnosing & Treating (35,226 | 6.8%), and Education Instruction & Library (31,062 | 6.0%).
Management, Business, Science and Arts Occupations by Sex
Within the Management, Business, Science and Arts occupations in Area Code 414, the most male-oriented occupations are Architecture & Engineering (84.1%), Computers & Mathematics (77.4%), and Computers, Engineering & Science (75.2%), while the most female-oriented occupations are Health Diagnosing & Treating (75.8%), Health Technologists (75.3%), and Education, Arts & Media (74.0%).
| Occupation | Male | Female |
| Management | 26,894 (54.0%) | 22,947 (46.0%) |
| Business & Financial | 14,062 (46.5%) | 16,160 (53.5%) |
| Computers, Engineering & Science | 26,581 (75.2%) | 8,773 (24.8%) |
| Computers & Mathematics | 12,974 (77.4%) | 3,779 (22.6%) |
| Architecture & Engineering | 11,199 (84.1%) | 2,116 (15.9%) |
| Life, Physical & Social Science | 2,408 (45.6%) | 2,878 (54.4%) |
| Community & Social Service | 19,422 (33.8%) | 38,079 (66.2%) |
| Education, Arts & Media | 2,540 (26.0%) | 7,218 (74.0%) |
| Legal Services & Support | 2,657 (48.3%) | 2,845 (51.7%) |
| Education Instruction & Library | 8,419 (27.1%) | 22,643 (72.9%) |
| Arts, Media & Entertainment | 5,806 (51.9%) | 5,373 (48.1%) |
| Health Diagnosing & Treating | 8,528 (24.2%) | 26,698 (75.8%) |
| Health Technologists | 6,295 (24.7%) | 19,216 (75.3%) |
| Total (Category) | 95,487 (45.9%) | 112,657 (54.1%) |
| Total (Overall) | 261,824 (50.7%) | 254,137 (49.3%) |
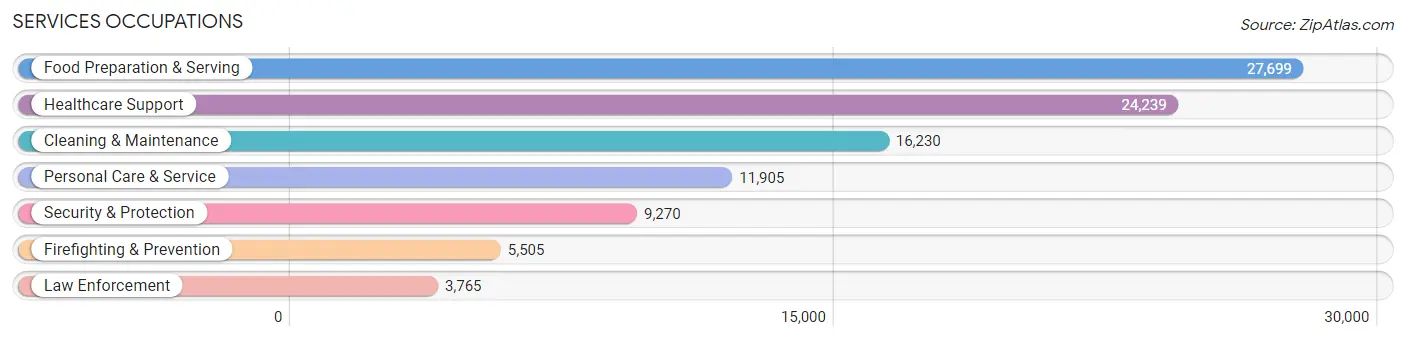
Services Occupations
The most common Services occupations in Area Code 414 are Food Preparation & Serving (27,699 | 5.4%), Healthcare Support (24,239 | 4.7%), Cleaning & Maintenance (16,230 | 3.2%), Personal Care & Service (11,905 | 2.3%), and Security & Protection (9,270 | 1.8%).
Services Occupations by Sex
Within the Services occupations in Area Code 414, the most male-oriented occupations are Law Enforcement (83.6%), Security & Protection (79.5%), and Firefighting & Prevention (76.7%), while the most female-oriented occupations are Healthcare Support (84.0%), Personal Care & Service (79.2%), and Food Preparation & Serving (51.8%).
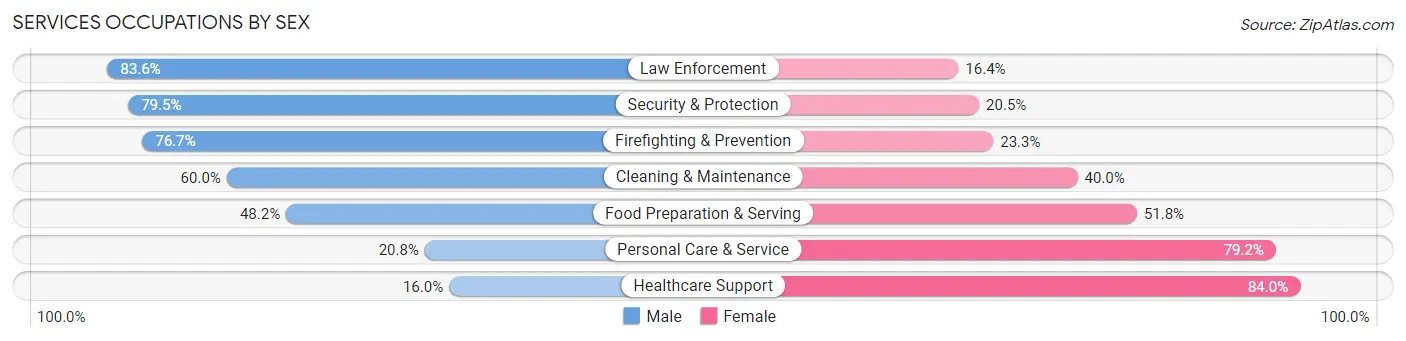
| Occupation | Male | Female |
| Healthcare Support | 3,868 (16.0%) | 20,371 (84.0%) |
| Security & Protection | 7,368 (79.5%) | 1,902 (20.5%) |
| Firefighting & Prevention | 4,221 (76.7%) | 1,284 (23.3%) |
| Law Enforcement | 3,147 (83.6%) | 618 (16.4%) |
| Food Preparation & Serving | 13,363 (48.2%) | 14,336 (51.8%) |
| Cleaning & Maintenance | 9,737 (60.0%) | 6,493 (40.0%) |
| Personal Care & Service | 2,473 (20.8%) | 9,432 (79.2%) |
| Total (Category) | 36,809 (41.2%) | 52,534 (58.8%) |
| Total (Overall) | 261,824 (50.7%) | 254,137 (49.3%) |
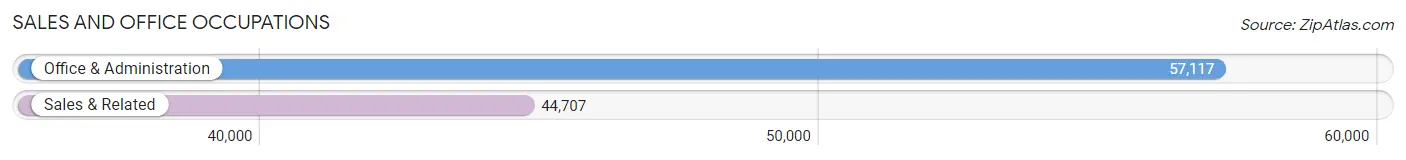
Sales and Office Occupations
The most common Sales and Office occupations in Area Code 414 are Office & Administration (57,117 | 11.1%), and Sales & Related (44,707 | 8.7%).
Sales and Office Occupations by Sex
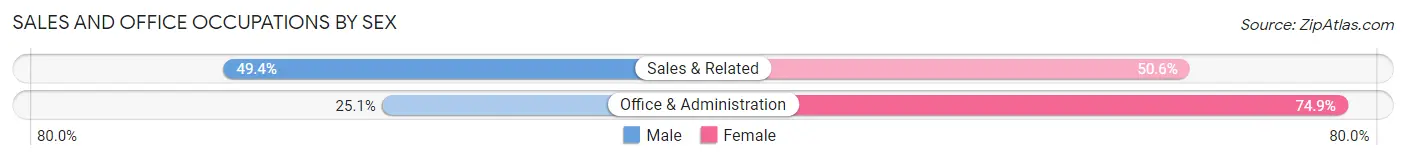
| Occupation | Male | Female |
| Sales & Related | 22,082 (49.4%) | 22,625 (50.6%) |
| Office & Administration | 14,318 (25.1%) | 42,799 (74.9%) |
| Total (Category) | 36,400 (35.7%) | 65,424 (64.2%) |
| Total (Overall) | 261,824 (50.7%) | 254,137 (49.3%) |
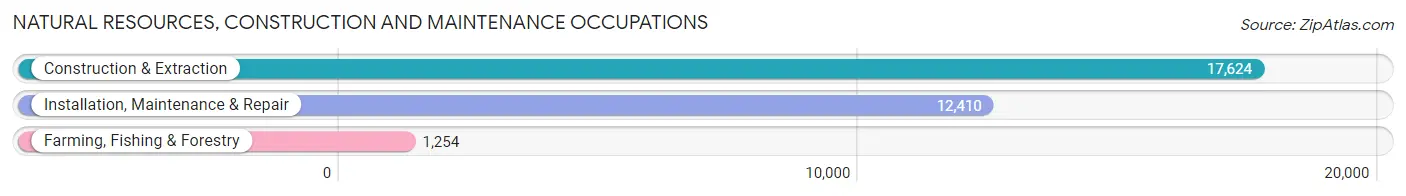
Natural Resources, Construction and Maintenance Occupations
The most common Natural Resources, Construction and Maintenance occupations in Area Code 414 are Construction & Extraction (17,624 | 3.4%), Installation, Maintenance & Repair (12,410 | 2.4%), and Farming, Fishing & Forestry (1,254 | 0.2%).
Natural Resources, Construction and Maintenance Occupations by Sex
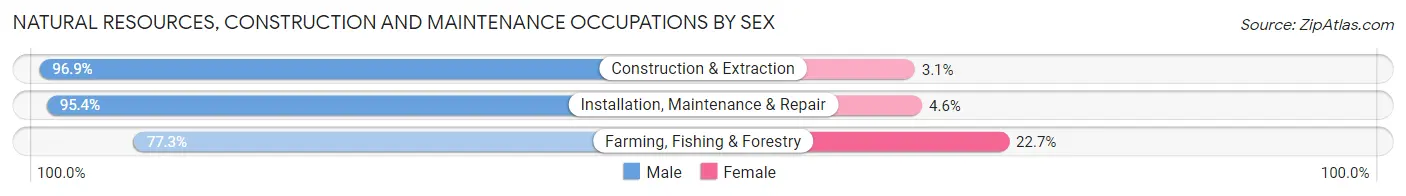
| Occupation | Male | Female |
| Farming, Fishing & Forestry | 969 (77.3%) | 285 (22.7%) |
| Construction & Extraction | 17,079 (96.9%) | 545 (3.1%) |
| Installation, Maintenance & Repair | 11,837 (95.4%) | 573 (4.6%) |
| Total (Category) | 29,885 (95.5%) | 1,403 (4.5%) |
| Total (Overall) | 261,824 (50.7%) | 254,137 (49.3%) |
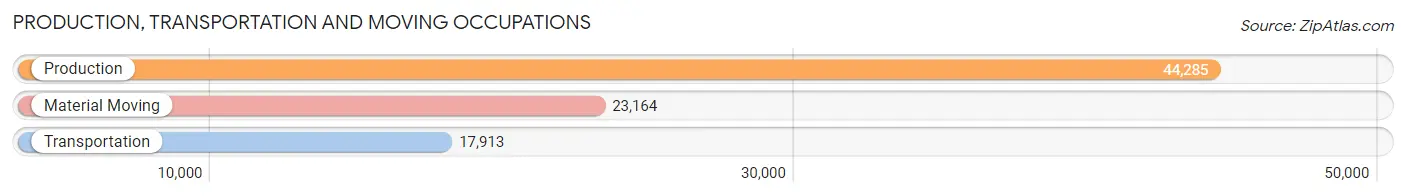
Production, Transportation and Moving Occupations
The most common Production, Transportation and Moving occupations in Area Code 414 are Production (44,285 | 8.6%), Material Moving (23,164 | 4.5%), and Transportation (17,913 | 3.5%).
Production, Transportation and Moving Occupations by Sex
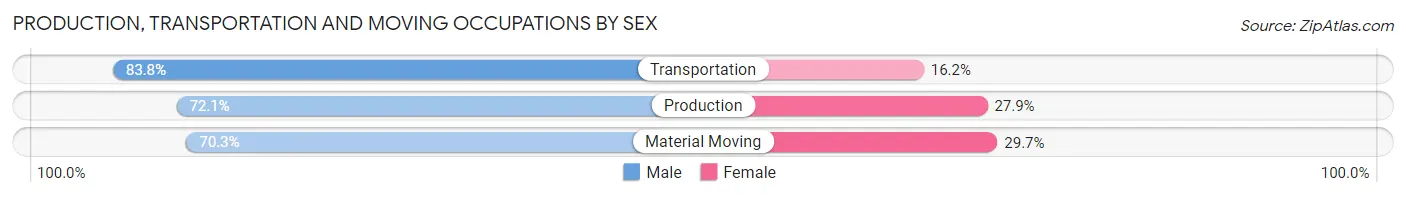
| Occupation | Male | Female |
| Production | 31,943 (72.1%) | 12,342 (27.9%) |
| Transportation | 15,013 (83.8%) | 2,900 (16.2%) |
| Material Moving | 16,287 (70.3%) | 6,877 (29.7%) |
| Total (Category) | 63,243 (74.1%) | 22,119 (25.9%) |
| Total (Overall) | 261,824 (50.7%) | 254,137 (49.3%) |
Employment Industries by Sex in Area Code 414
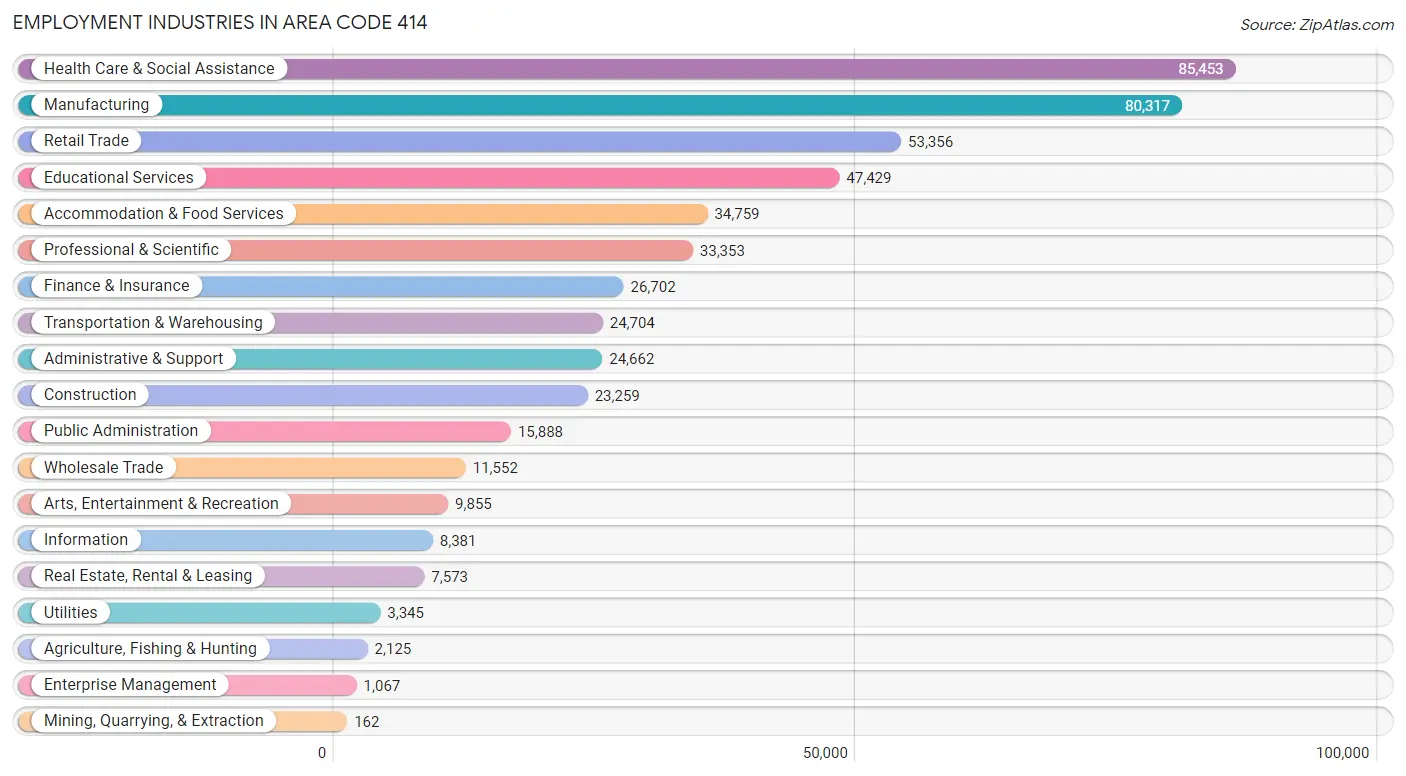
Employment Industries in Area Code 414
The major employment industries in Area Code 414 include Health Care & Social Assistance (85,453 | 16.6%), Manufacturing (80,317 | 15.6%), Retail Trade (53,356 | 10.3%), Educational Services (47,429 | 9.2%), and Accommodation & Food Services (34,759 | 6.7%).
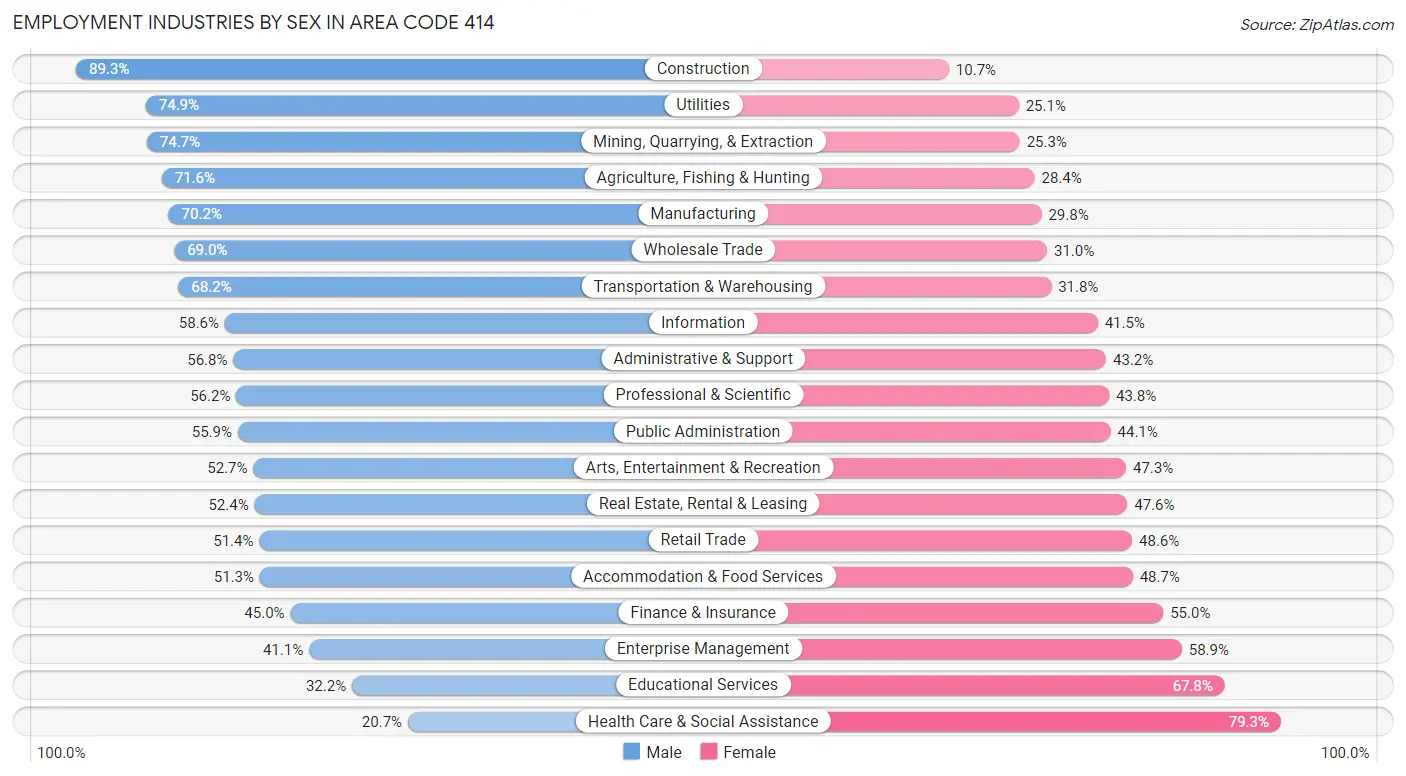
Employment Industries by Sex in Area Code 414
The Area Code 414 industries that see more men than women are Construction (89.3%), Utilities (74.9%), and Mining, Quarrying, & Extraction (74.7%), whereas the industries that tend to have a higher number of women are Health Care & Social Assistance (79.3%), Educational Services (67.8%), and Enterprise Management (58.9%).
| Industry | Male | Female |
| Agriculture, Fishing & Hunting | 1,522 (71.6%) | 603 (28.4%) |
| Mining, Quarrying, & Extraction | 121 (74.7%) | 41 (25.3%) |
| Construction | 20,780 (89.3%) | 2,479 (10.7%) |
| Manufacturing | 56,366 (70.2%) | 23,951 (29.8%) |
| Wholesale Trade | 7,974 (69.0%) | 3,578 (31.0%) |
| Retail Trade | 27,437 (51.4%) | 25,919 (48.6%) |
| Transportation & Warehousing | 16,840 (68.2%) | 7,864 (31.8%) |
| Utilities | 2,505 (74.9%) | 840 (25.1%) |
| Information | 4,907 (58.6%) | 3,474 (41.4%) |
| Finance & Insurance | 12,010 (45.0%) | 14,692 (55.0%) |
| Real Estate, Rental & Leasing | 3,970 (52.4%) | 3,603 (47.6%) |
| Professional & Scientific | 18,741 (56.2%) | 14,612 (43.8%) |
| Enterprise Management | 439 (41.1%) | 628 (58.9%) |
| Administrative & Support | 14,008 (56.8%) | 10,654 (43.2%) |
| Educational Services | 15,293 (32.2%) | 32,136 (67.8%) |
| Health Care & Social Assistance | 17,651 (20.7%) | 67,802 (79.3%) |
| Arts, Entertainment & Recreation | 5,191 (52.7%) | 4,664 (47.3%) |
| Accommodation & Food Services | 17,831 (51.3%) | 16,928 (48.7%) |
| Public Administration | 8,877 (55.9%) | 7,011 (44.1%) |
| Total | 261,824 (50.7%) | 254,137 (49.3%) |
Education in Area Code 414
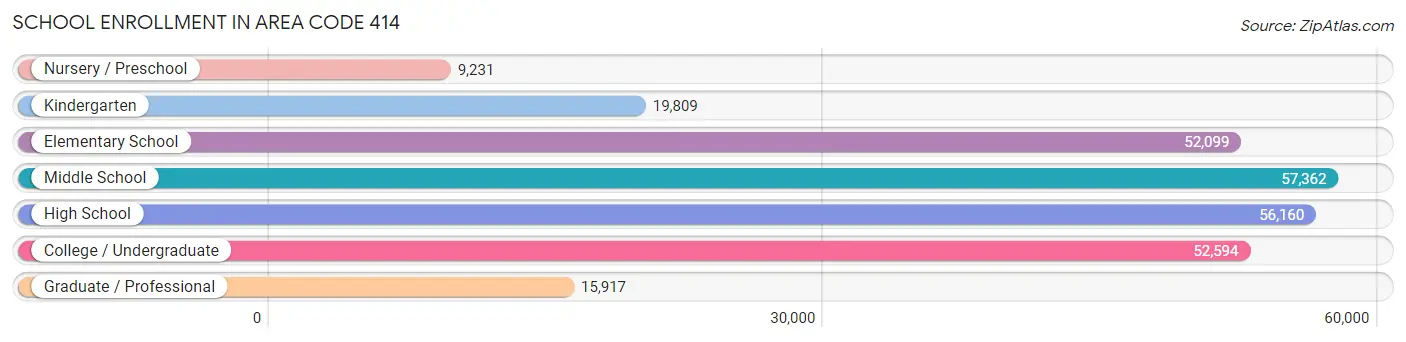
School Enrollment in Area Code 414
The most common levels of schooling among the 263,172 students in Area Code 414 are middle school (57,362 | 21.8%), high school (56,160 | 21.3%), and college / undergraduate (52,594 | 20.0%).
| School Level | # Students | % Students |
| Nursery / Preschool | 9,231 | 3.5% |
| Kindergarten | 19,809 | 7.5% |
| Elementary School | 52,099 | 19.8% |
| Middle School | 57,362 | 21.8% |
| High School | 56,160 | 21.3% |
| College / Undergraduate | 52,594 | 20.0% |
| Graduate / Professional | 15,917 | 6.0% |
| Total | 263,172 | 100.0% |
School Enrollment by Age by Funding Source in Area Code 414
Out of a total of 263,172 students who are enrolled in schools in Area Code 414, 67,201 (25.5%) attend a private institution, while the remaining 195,971 (74.5%) are enrolled in public schools. The age group of 20 to 24 year olds has the highest likelihood of being enrolled in private schools, with 10,376 (38.5% in the age bracket) enrolled. Conversely, the age group of 15 to 17 year olds has the lowest likelihood of being enrolled in a private school, with 33,546 (82.9% in the age bracket) attending a public institution.
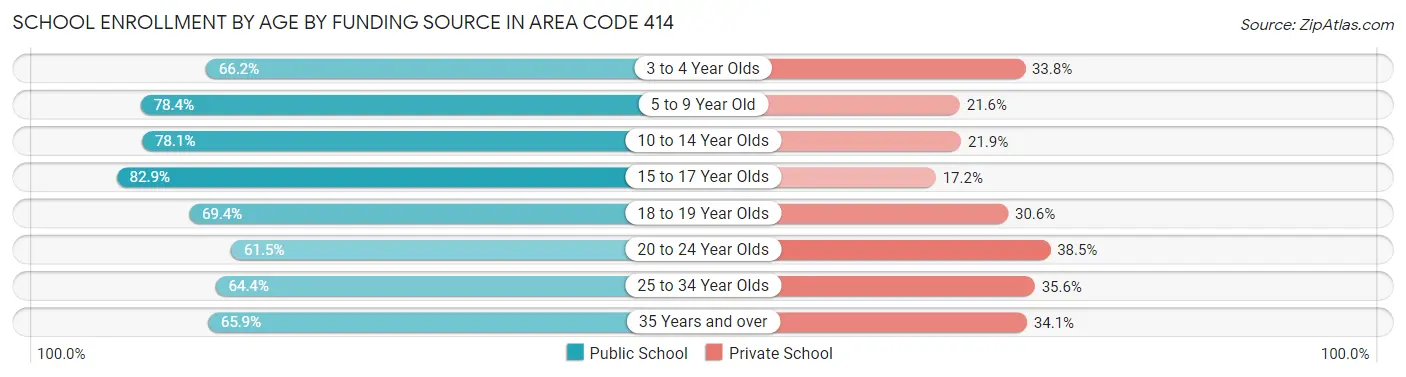
| Age Bracket | Public School | Private School |
| 3 to 4 Year Olds | 7,965 (66.2%) | 4,062 (33.8%) |
| 5 to 9 Year Old | 49,588 (78.4%) | 13,691 (21.6%) |
| 10 to 14 Year Olds | 54,088 (78.1%) | 15,142 (21.9%) |
| 15 to 17 Year Olds | 33,546 (82.9%) | 6,944 (17.2%) |
| 18 to 19 Year Olds | 14,825 (69.4%) | 6,544 (30.6%) |
| 20 to 24 Year Olds | 16,593 (61.5%) | 10,376 (38.5%) |
| 25 to 34 Year Olds | 11,765 (64.4%) | 6,499 (35.6%) |
| 35 Years and over | 7,604 (65.9%) | 3,940 (34.1%) |
| Total | 195,971 (74.5%) | 67,201 (25.5%) |
Educational Attainment by Field of Study in Area Code 414
Business (52,096 | 19.1%), science & technology (30,393 | 11.1%), education (30,046 | 11.0%), social sciences (20,490 | 7.5%), and engineering (18,736 | 6.9%) are the most common fields of study among 273,342 individuals in Area Code 414 who have obtained a bachelor's degree or higher.
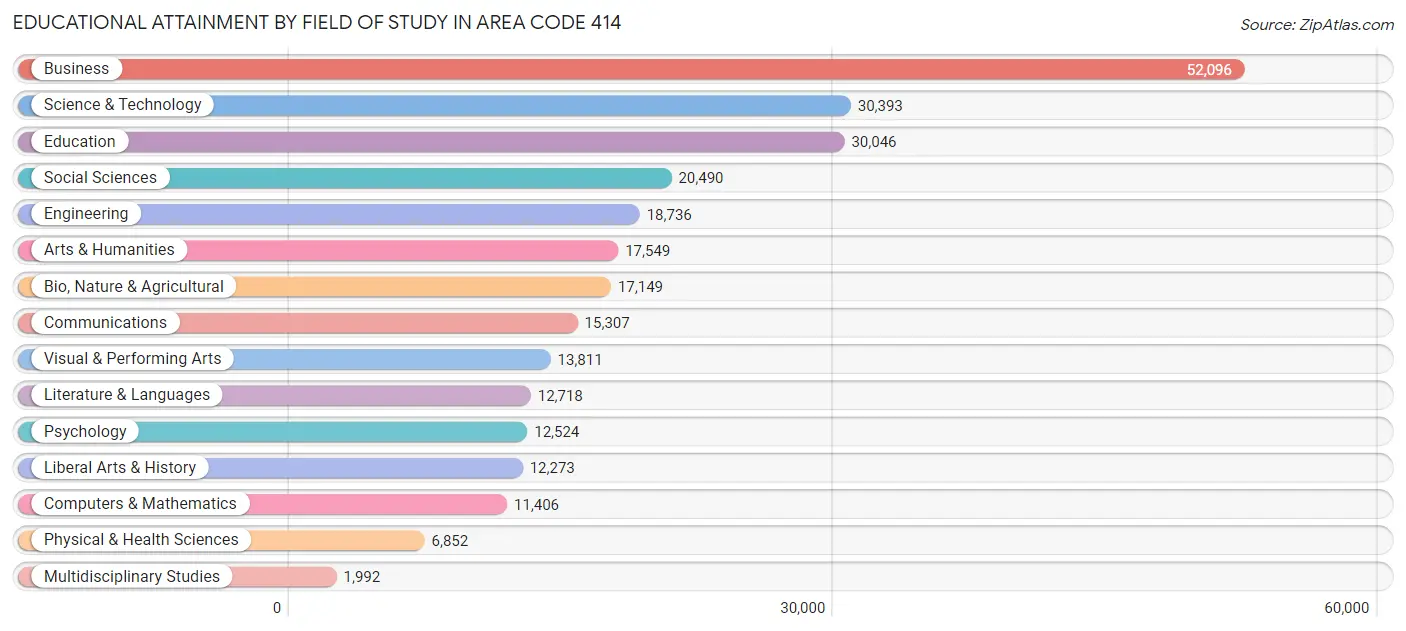
| Field of Study | # Graduates | % Graduates |
| Computers & Mathematics | 11,406 | 4.2% |
| Bio, Nature & Agricultural | 17,149 | 6.3% |
| Physical & Health Sciences | 6,852 | 2.5% |
| Psychology | 12,524 | 4.6% |
| Social Sciences | 20,490 | 7.5% |
| Engineering | 18,736 | 6.9% |
| Multidisciplinary Studies | 1,992 | 0.7% |
| Science & Technology | 30,393 | 11.1% |
| Business | 52,096 | 19.1% |
| Education | 30,046 | 11.0% |
| Literature & Languages | 12,718 | 4.6% |
| Liberal Arts & History | 12,273 | 4.5% |
| Visual & Performing Arts | 13,811 | 5.1% |
| Communications | 15,307 | 5.6% |
| Arts & Humanities | 17,549 | 6.4% |
| Total | 273,342 | 100.0% |
Transportation & Commute in Area Code 414
Vehicle Availability by Sex in Area Code 414
The most prevalent vehicle ownership categories in Area Code 414 are males with 2 vehicles (117,857, accounting for 45.9%) and females with 2 vehicles (104,181, making up 47.7%).
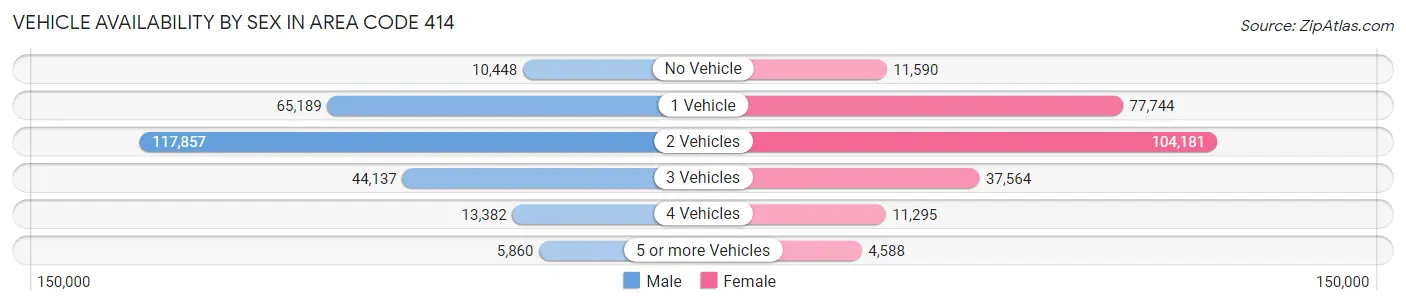
| Vehicles Available | Male | Female |
| No Vehicle | 10,448 (4.1%) | 11,590 (4.7%) |
| 1 Vehicle | 65,189 (25.4%) | 77,744 (31.5%) |
| 2 Vehicles | 117,857 (45.9%) | 104,181 (42.2%) |
| 3 Vehicles | 44,137 (17.2%) | 37,564 (15.2%) |
| 4 Vehicles | 13,382 (5.2%) | 11,295 (4.6%) |
| 5 or more Vehicles | 5,860 (2.3%) | 4,588 (1.9%) |
| Total | 256,873 (100.0%) | 246,962 (100.0%) |
Commute Time in Area Code 414
The most frequently occuring commute durations in Area Code 414 are 15 to 19 minutes (87,692 commuters, 19.4%), 20 to 24 minutes (85,956 commuters, 19.0%), and 10 to 14 minutes (68,230 commuters, 15.1%).
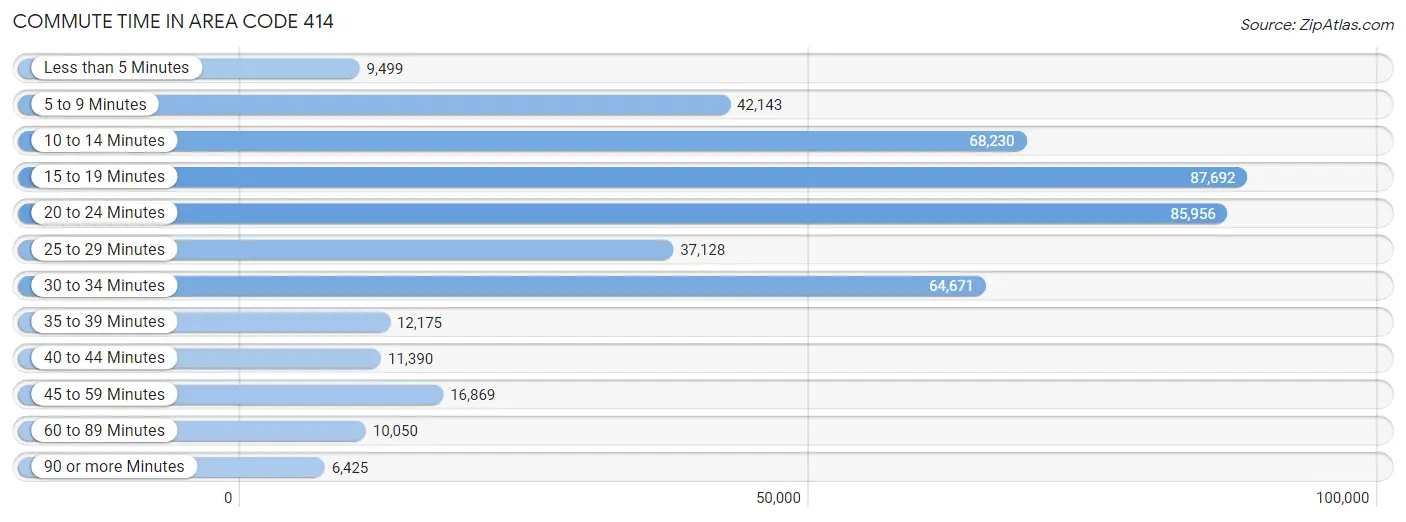
| Commute Time | # Commuters | % Commuters |
| Less than 5 Minutes | 9,499 | 2.1% |
| 5 to 9 Minutes | 42,143 | 9.3% |
| 10 to 14 Minutes | 68,230 | 15.1% |
| 15 to 19 Minutes | 87,692 | 19.4% |
| 20 to 24 Minutes | 85,956 | 19.0% |
| 25 to 29 Minutes | 37,128 | 8.2% |
| 30 to 34 Minutes | 64,671 | 14.3% |
| 35 to 39 Minutes | 12,175 | 2.7% |
| 40 to 44 Minutes | 11,390 | 2.5% |
| 45 to 59 Minutes | 16,869 | 3.7% |
| 60 to 89 Minutes | 10,050 | 2.2% |
| 90 or more Minutes | 6,425 | 1.4% |
Commute Time by Sex in Area Code 414
The most common commute times in Area Code 414 are 20 to 24 minutes (44,328 commuters, 19.2%) for males and 15 to 19 minutes (43,964 commuters, 19.9%) for females.
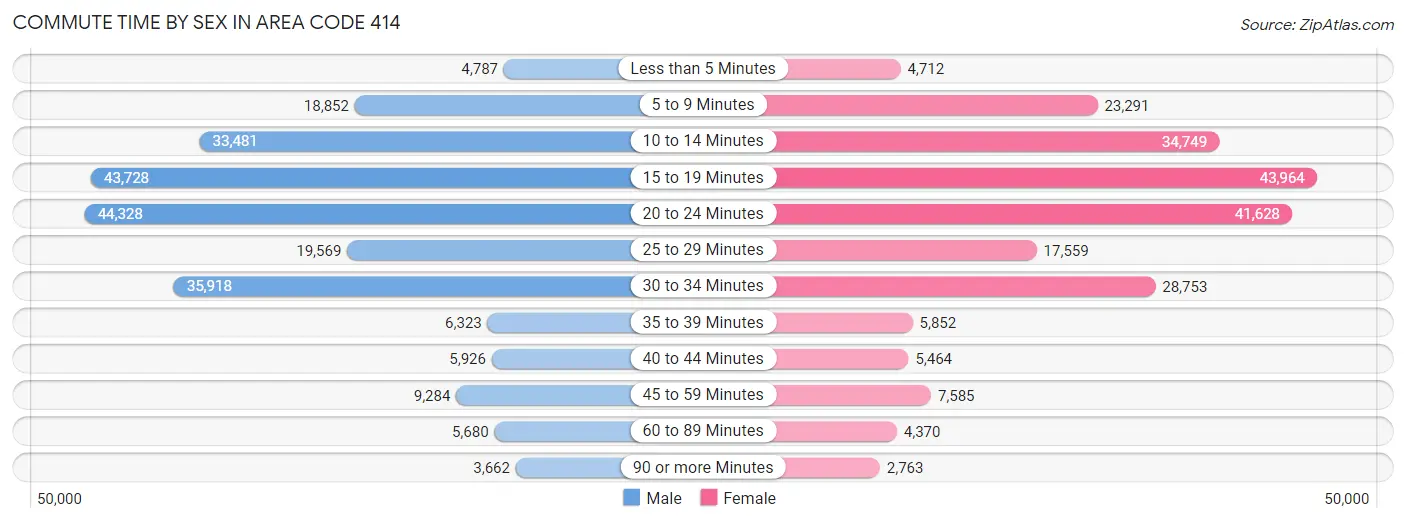
| Commute Time | Male | Female |
| Less than 5 Minutes | 4,787 (2.1%) | 4,712 (2.1%) |
| 5 to 9 Minutes | 18,852 (8.1%) | 23,291 (10.5%) |
| 10 to 14 Minutes | 33,481 (14.5%) | 34,749 (15.8%) |
| 15 to 19 Minutes | 43,728 (18.9%) | 43,964 (19.9%) |
| 20 to 24 Minutes | 44,328 (19.2%) | 41,628 (18.9%) |
| 25 to 29 Minutes | 19,569 (8.5%) | 17,559 (8.0%) |
| 30 to 34 Minutes | 35,918 (15.5%) | 28,753 (13.0%) |
| 35 to 39 Minutes | 6,323 (2.7%) | 5,852 (2.6%) |
| 40 to 44 Minutes | 5,926 (2.6%) | 5,464 (2.5%) |
| 45 to 59 Minutes | 9,284 (4.0%) | 7,585 (3.4%) |
| 60 to 89 Minutes | 5,680 (2.5%) | 4,370 (2.0%) |
| 90 or more Minutes | 3,662 (1.6%) | 2,763 (1.3%) |
Time of Departure to Work by Sex in Area Code 414
The most frequent times of departure to work in Area Code 414 are 7:00 AM to 7:29 AM (33,561, 14.5%) for males and 7:00 AM to 7:29 AM (36,401, 16.5%) for females.
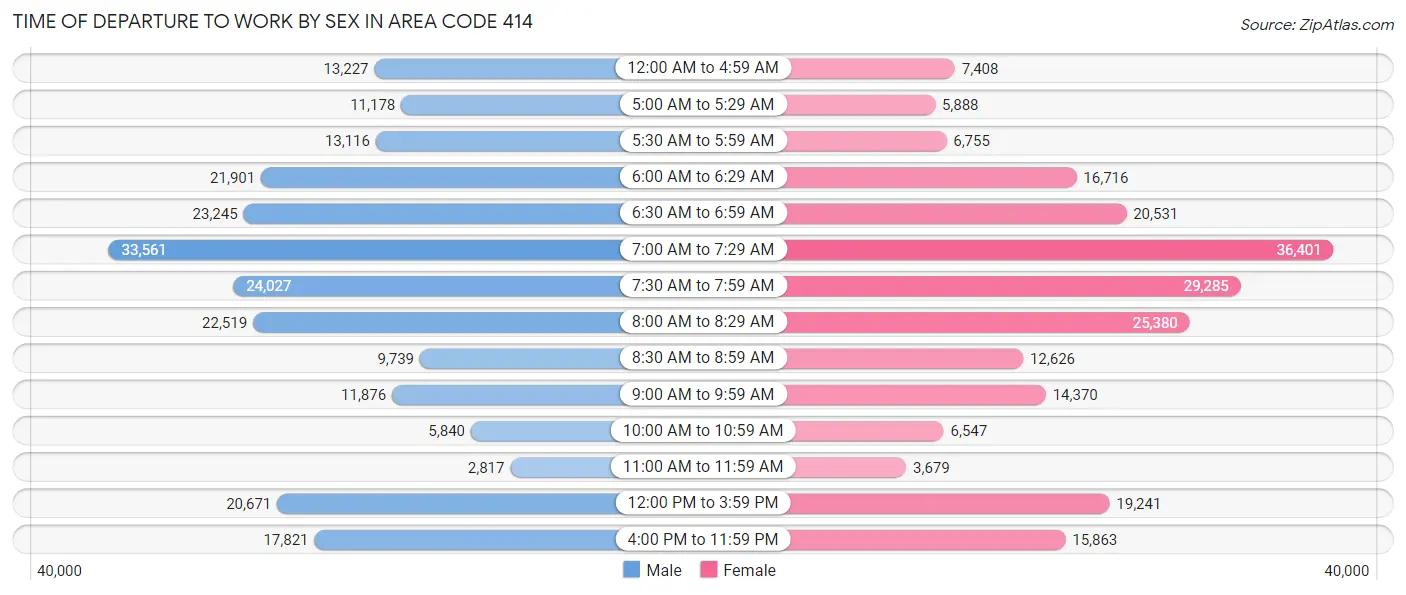
| Time of Departure | Male | Female |
| 12:00 AM to 4:59 AM | 13,227 (5.7%) | 7,408 (3.4%) |
| 5:00 AM to 5:29 AM | 11,178 (4.8%) | 5,888 (2.7%) |
| 5:30 AM to 5:59 AM | 13,116 (5.7%) | 6,755 (3.1%) |
| 6:00 AM to 6:29 AM | 21,901 (9.5%) | 16,716 (7.6%) |
| 6:30 AM to 6:59 AM | 23,245 (10.0%) | 20,531 (9.3%) |
| 7:00 AM to 7:29 AM | 33,561 (14.5%) | 36,401 (16.5%) |
| 7:30 AM to 7:59 AM | 24,027 (10.4%) | 29,285 (13.3%) |
| 8:00 AM to 8:29 AM | 22,519 (9.7%) | 25,380 (11.5%) |
| 8:30 AM to 8:59 AM | 9,739 (4.2%) | 12,626 (5.7%) |
| 9:00 AM to 9:59 AM | 11,876 (5.1%) | 14,370 (6.5%) |
| 10:00 AM to 10:59 AM | 5,840 (2.5%) | 6,547 (3.0%) |
| 11:00 AM to 11:59 AM | 2,817 (1.2%) | 3,679 (1.7%) |
| 12:00 PM to 3:59 PM | 20,671 (8.9%) | 19,241 (8.7%) |
| 4:00 PM to 11:59 PM | 17,821 (7.7%) | 15,863 (7.2%) |
| Total | 231,538 (100.0%) | 220,690 (100.0%) |
Housing Occupancy in Area Code 414
Occupancy by Ownership in Area Code 414
Of the total 438,871 dwellings in Area Code 414, owner-occupied units account for 230,193 (52.4%), while renter-occupied units make up 208,678 (47.5%).
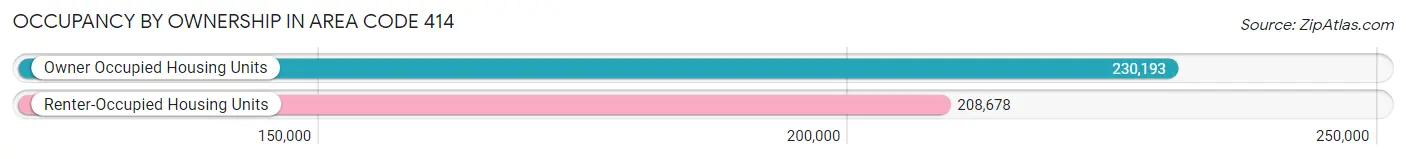
| Occupancy | # Housing Units | % Housing Units |
| Owner Occupied Housing Units | 230,193 | 52.4% |
| Renter-Occupied Housing Units | 208,678 | 47.5% |
| Total Occupied Housing Units | 438,871 | 100.0% |
Occupancy by Household Size in Area Code 414
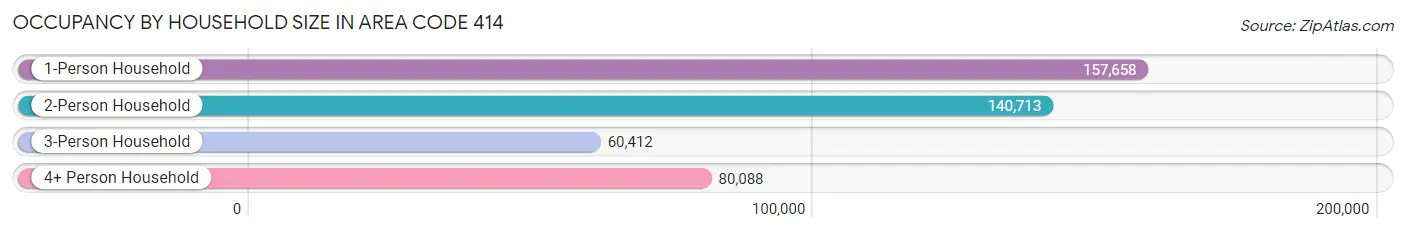
| Household Size | # Housing Units | % Housing Units |
| 1-Person Household | 157,658 | 35.9% |
| 2-Person Household | 140,713 | 32.1% |
| 3-Person Household | 60,412 | 13.8% |
| 4+ Person Household | 80,088 | 18.2% |
| Total Housing Units | 438,871 | 100.0% |
Occupancy by Ownership by Household Size in Area Code 414
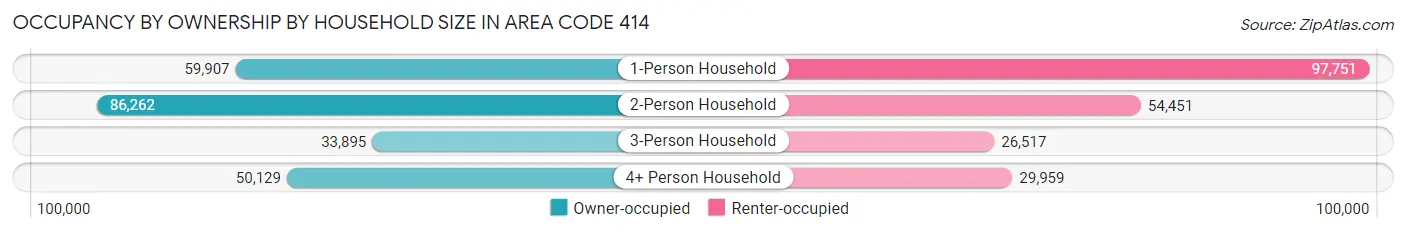
| Household Size | Owner-occupied | Renter-occupied |
| 1-Person Household | 59,907 (38.0%) | 97,751 (62.0%) |
| 2-Person Household | 86,262 (61.3%) | 54,451 (38.7%) |
| 3-Person Household | 33,895 (56.1%) | 26,517 (43.9%) |
| 4+ Person Household | 50,129 (62.6%) | 29,959 (37.4%) |
| Total Housing Units | 230,193 (52.4%) | 208,678 (47.5%) |
Occupancy by Educational Attainment in Area Code 414
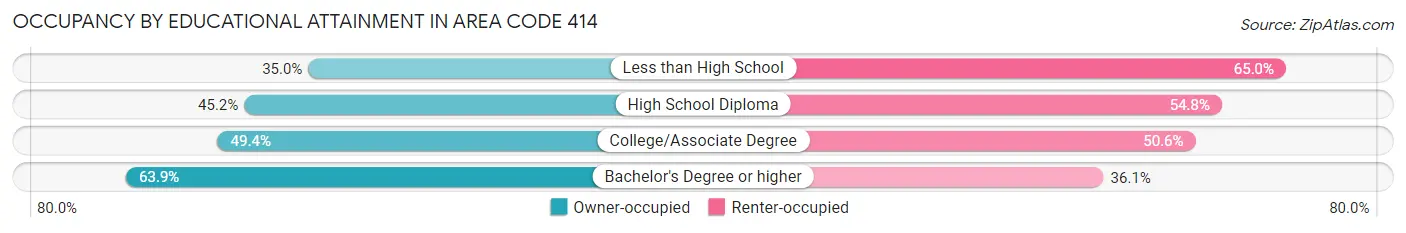
| Household Size | Owner-occupied | Renter-occupied |
| Less than High School | 13,057 (35.0%) | 24,224 (65.0%) |
| High School Diploma | 48,738 (45.2%) | 59,134 (54.8%) |
| College/Associate Degree | 65,736 (49.4%) | 67,376 (50.6%) |
| Bachelor's Degree or higher | 102,662 (63.9%) | 57,944 (36.1%) |
Occupancy by Age of Householder in Area Code 414
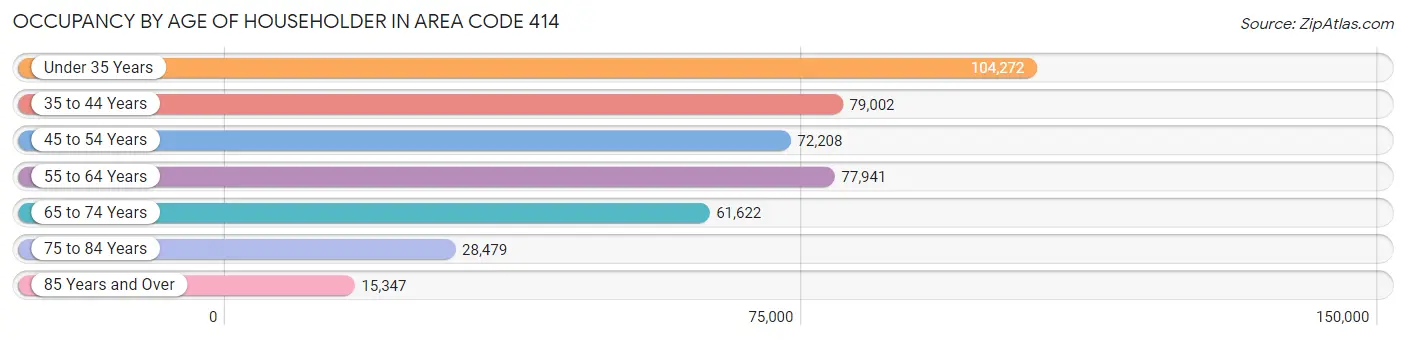
| Age Bracket | # Households | % Households |
| Under 35 Years | 104,272 | 23.8% |
| 35 to 44 Years | 79,002 | 18.0% |
| 45 to 54 Years | 72,208 | 16.5% |
| 55 to 64 Years | 77,941 | 17.8% |
| 65 to 74 Years | 61,622 | 14.0% |
| 75 to 84 Years | 28,479 | 6.5% |
| 85 Years and Over | 15,347 | 3.5% |
| Total | 438,871 | 100.0% |
Housing Finances in Area Code 414
Median Income by Occupancy in Area Code 414
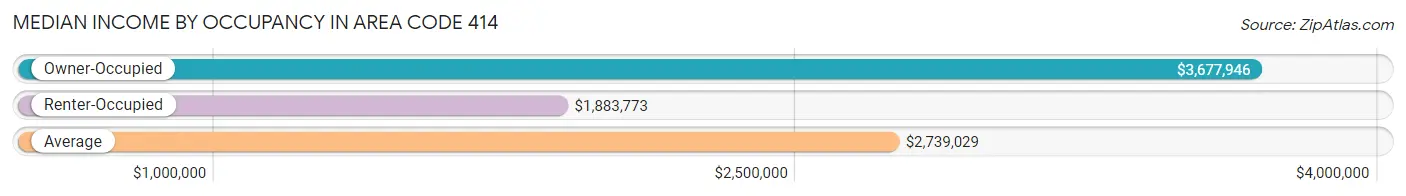
| Occupancy Type | # Households | Median Income |
| Owner-Occupied | 230,193 (52.4%) | $3,677,946 |
| Renter-Occupied | 208,678 (47.5%) | $1,883,773 |
| Average | 438,871 (100.0%) | $2,739,029 |
Occupancy by Householder Income Bracket in Area Code 414
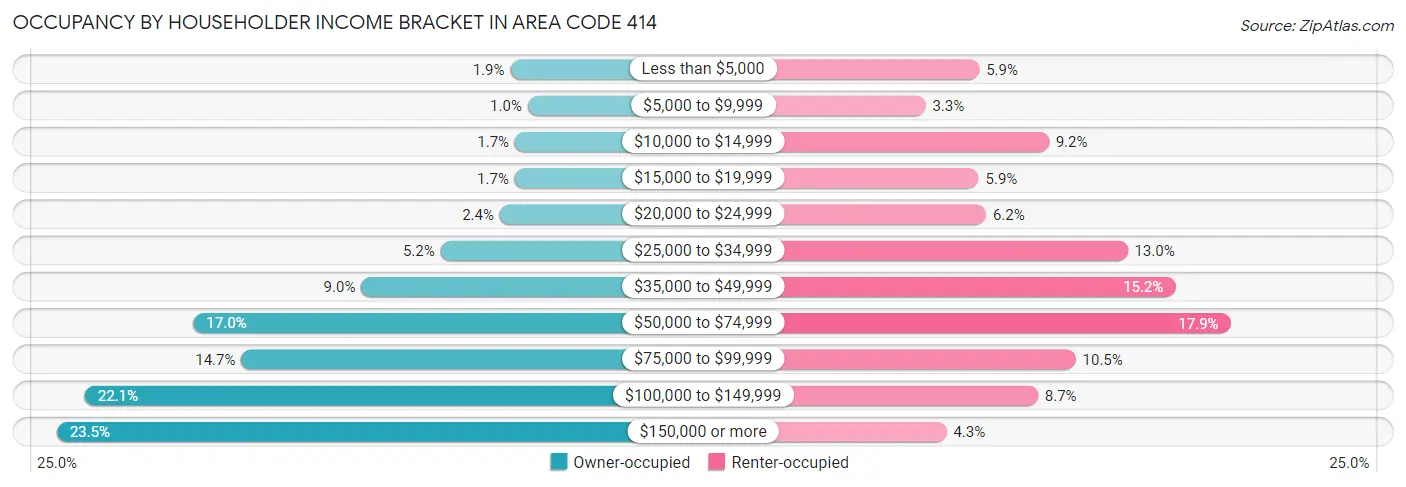
| Income Bracket | Owner-occupied | Renter-occupied |
| Less than $5,000 | 4,311 (1.9%) | 12,297 (5.9%) |
| $5,000 to $9,999 | 2,399 (1.0%) | 6,949 (3.3%) |
| $10,000 to $14,999 | 3,807 (1.7%) | 19,188 (9.2%) |
| $15,000 to $19,999 | 3,832 (1.7%) | 12,232 (5.9%) |
| $20,000 to $24,999 | 5,467 (2.4%) | 12,969 (6.2%) |
| $25,000 to $34,999 | 11,950 (5.2%) | 27,022 (13.0%) |
| $35,000 to $49,999 | 20,639 (9.0%) | 31,764 (15.2%) |
| $50,000 to $74,999 | 39,043 (17.0%) | 37,241 (17.8%) |
| $75,000 to $99,999 | 33,786 (14.7%) | 21,861 (10.5%) |
| $100,000 to $149,999 | 50,935 (22.1%) | 18,113 (8.7%) |
| $150,000 or more | 54,024 (23.5%) | 9,042 (4.3%) |
| Total | 230,193 (100.0%) | 208,678 (100.0%) |
Monthly Housing Cost Tiers in Area Code 414
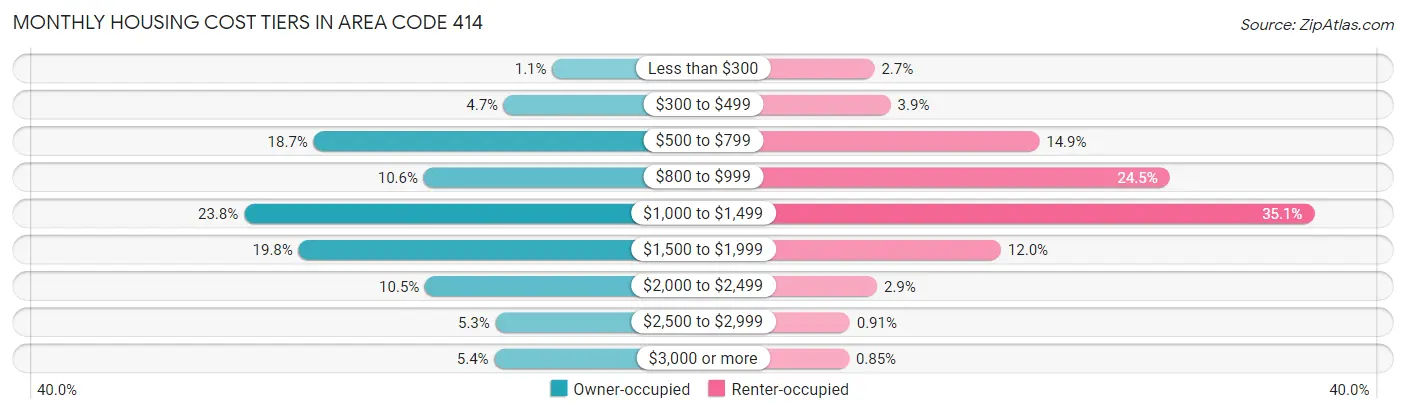
| Monthly Cost | Owner-occupied | Renter-occupied |
| Less than $300 | 2,605 (1.1%) | 5,703 (2.7%) |
| $300 to $499 | 10,811 (4.7%) | 8,186 (3.9%) |
| $500 to $799 | 43,066 (18.7%) | 31,032 (14.9%) |
| $800 to $999 | 24,393 (10.6%) | 51,035 (24.5%) |
| $1,000 to $1,499 | 54,881 (23.8%) | 73,265 (35.1%) |
| $1,500 to $1,999 | 45,634 (19.8%) | 25,123 (12.0%) |
| $2,000 to $2,499 | 24,163 (10.5%) | 6,083 (2.9%) |
| $2,500 to $2,999 | 12,219 (5.3%) | 1,893 (0.9%) |
| $3,000 or more | 12,421 (5.4%) | 1,770 (0.9%) |
| Total | 230,193 (100.0%) | 208,678 (100.0%) |
Physical Housing Characteristics in Area Code 414
Housing Structures in Area Code 414
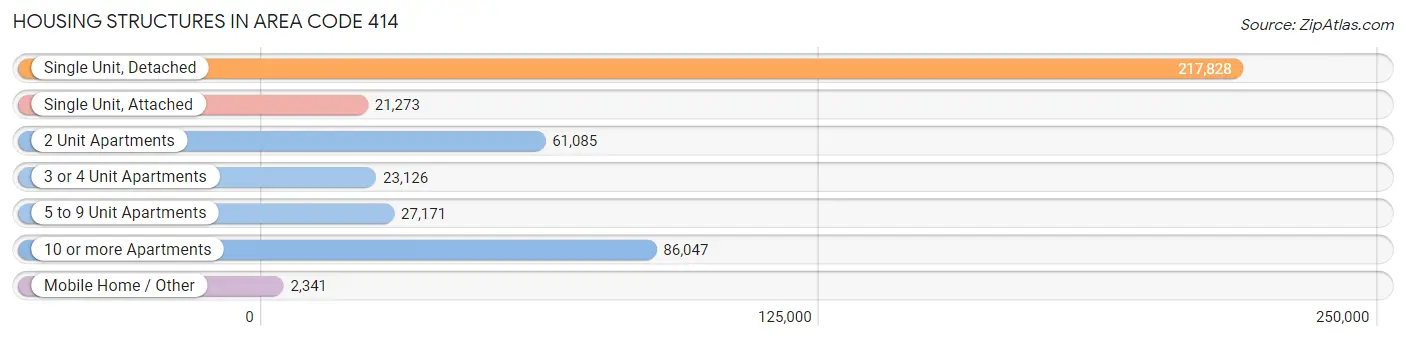
| Structure Type | # Housing Units | % Housing Units |
| Single Unit, Detached | 217,828 | 49.6% |
| Single Unit, Attached | 21,273 | 4.9% |
| 2 Unit Apartments | 61,085 | 13.9% |
| 3 or 4 Unit Apartments | 23,126 | 5.3% |
| 5 to 9 Unit Apartments | 27,171 | 6.2% |
| 10 or more Apartments | 86,047 | 19.6% |
| Mobile Home / Other | 2,341 | 0.5% |
| Total | 438,871 | 100.0% |
Housing Structures by Occupancy in Area Code 414
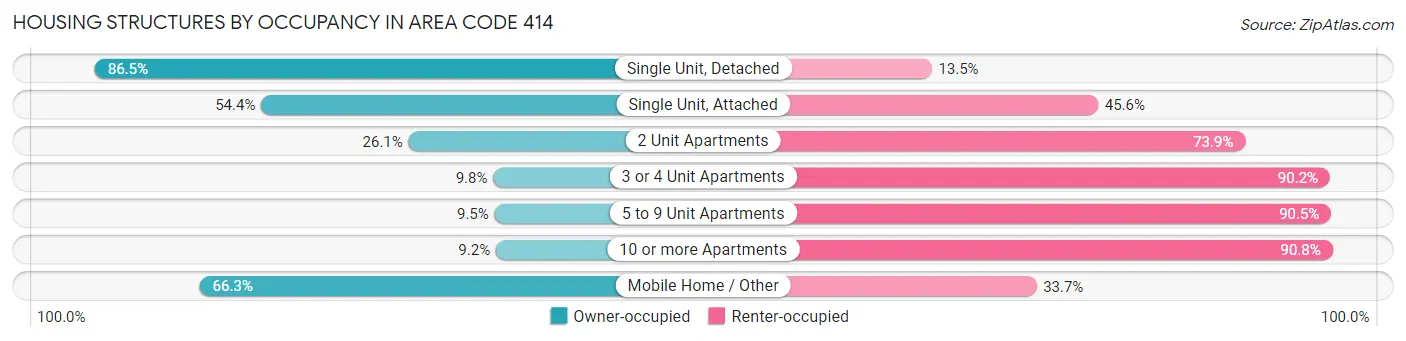
| Structure Type | Owner-occupied | Renter-occupied |
| Single Unit, Detached | 188,345 (86.5%) | 29,483 (13.5%) |
| Single Unit, Attached | 11,581 (54.4%) | 9,692 (45.6%) |
| 2 Unit Apartments | 15,917 (26.1%) | 45,168 (73.9%) |
| 3 or 4 Unit Apartments | 2,258 (9.8%) | 20,868 (90.2%) |
| 5 to 9 Unit Apartments | 2,585 (9.5%) | 24,586 (90.5%) |
| 10 or more Apartments | 7,955 (9.2%) | 78,092 (90.8%) |
| Mobile Home / Other | 1,552 (66.3%) | 789 (33.7%) |
| Total | 230,193 (52.4%) | 208,678 (47.5%) |
Housing Structures by Number of Rooms in Area Code 414
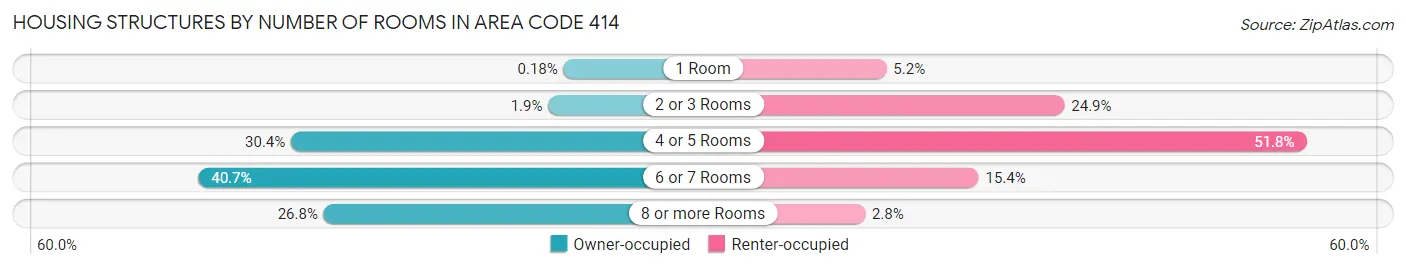
| Number of Rooms | Owner-occupied | Renter-occupied |
| 1 Room | 414 (0.2%) | 10,763 (5.2%) |
| 2 or 3 Rooms | 4,325 (1.9%) | 51,976 (24.9%) |
| 4 or 5 Rooms | 70,024 (30.4%) | 108,016 (51.8%) |
| 6 or 7 Rooms | 93,737 (40.7%) | 32,123 (15.4%) |
| 8 or more Rooms | 61,693 (26.8%) | 5,800 (2.8%) |
| Total | 230,193 (100.0%) | 208,678 (100.0%) |
Housing Structure by Heating Type in Area Code 414
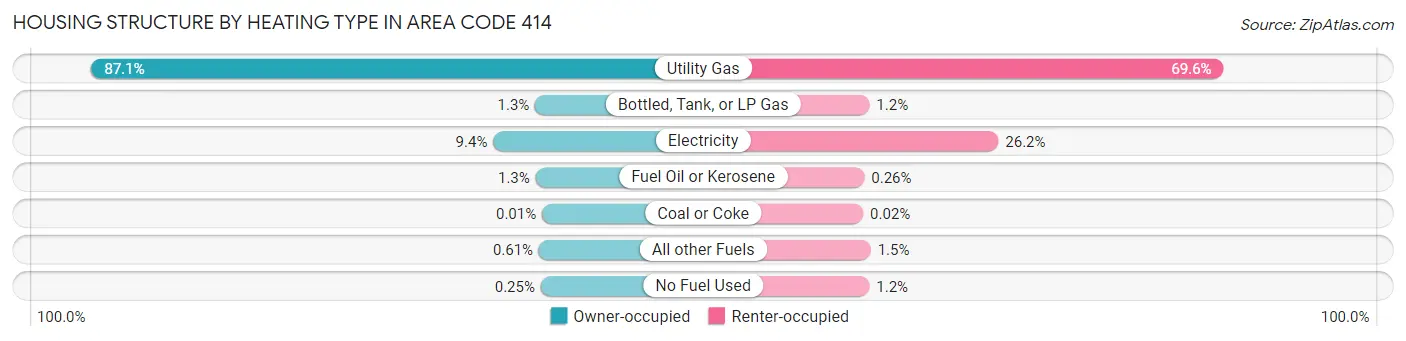
| Heating Type | Owner-occupied | Renter-occupied |
| Utility Gas | 200,499 (87.1%) | 145,315 (69.6%) |
| Bottled, Tank, or LP Gas | 3,077 (1.3%) | 2,559 (1.2%) |
| Electricity | 21,741 (9.4%) | 54,576 (26.2%) |
| Fuel Oil or Kerosene | 2,873 (1.3%) | 540 (0.3%) |
| Coal or Coke | 14 (0.0%) | 52 (0.0%) |
| All other Fuels | 1,411 (0.6%) | 3,098 (1.5%) |
| No Fuel Used | 578 (0.3%) | 2,538 (1.2%) |
| Total | 230,193 (100.0%) | 208,678 (100.0%) |
Household Vehicle Usage in Area Code 414
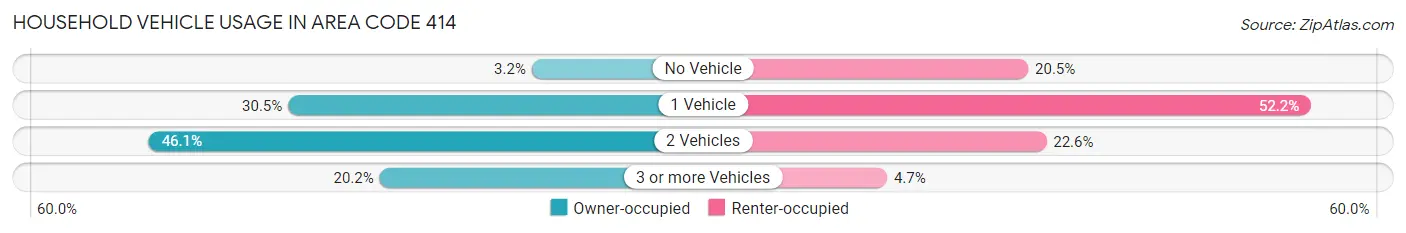
| Vehicles per Household | Owner-occupied | Renter-occupied |
| No Vehicle | 7,348 (3.2%) | 42,818 (20.5%) |
| 1 Vehicle | 70,152 (30.5%) | 108,951 (52.2%) |
| 2 Vehicles | 106,097 (46.1%) | 47,085 (22.6%) |
| 3 or more Vehicles | 46,596 (20.2%) | 9,824 (4.7%) |
| Total | 230,193 (100.0%) | 208,678 (100.0%) |
Real Estate & Mortgages in Area Code 414
Real Estate and Mortgage Overview in Area Code 414
| Characteristic | Without Mortgage | With Mortgage |
| Housing Units | 81,570 | 148,623 |
| Median Property Value | $8,578,400 | $9,269,400 |
| Median Household Income | $2,846,935 | $40,265 |
| Monthly Housing Costs | $28,810 | $12,004 |
| Real Estate Taxes | $169,445 | $1,139 |
Property Value by Mortgage Status in Area Code 414
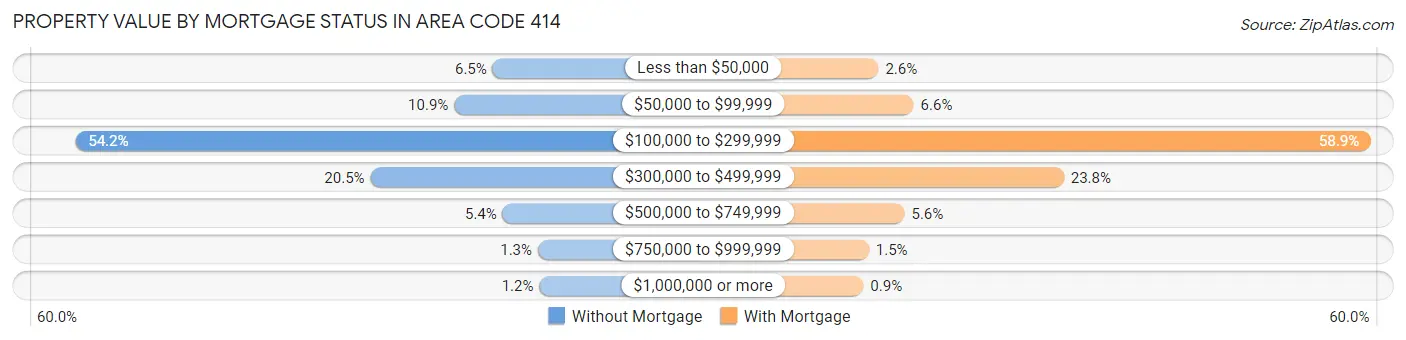
| Property Value | Without Mortgage | With Mortgage |
| Less than $50,000 | 5,310 (6.5%) | 3,899 (2.6%) |
| $50,000 to $99,999 | 8,902 (10.9%) | 9,867 (6.6%) |
| $100,000 to $299,999 | 44,215 (54.2%) | 87,569 (58.9%) |
| $300,000 to $499,999 | 16,703 (20.5%) | 35,374 (23.8%) |
| $500,000 to $749,999 | 4,380 (5.4%) | 8,316 (5.6%) |
| $750,000 to $999,999 | 1,095 (1.3%) | 2,263 (1.5%) |
| $1,000,000 or more | 965 (1.2%) | 1,335 (0.9%) |
| Total | 81,570 (100.0%) | 148,623 (100.0%) |
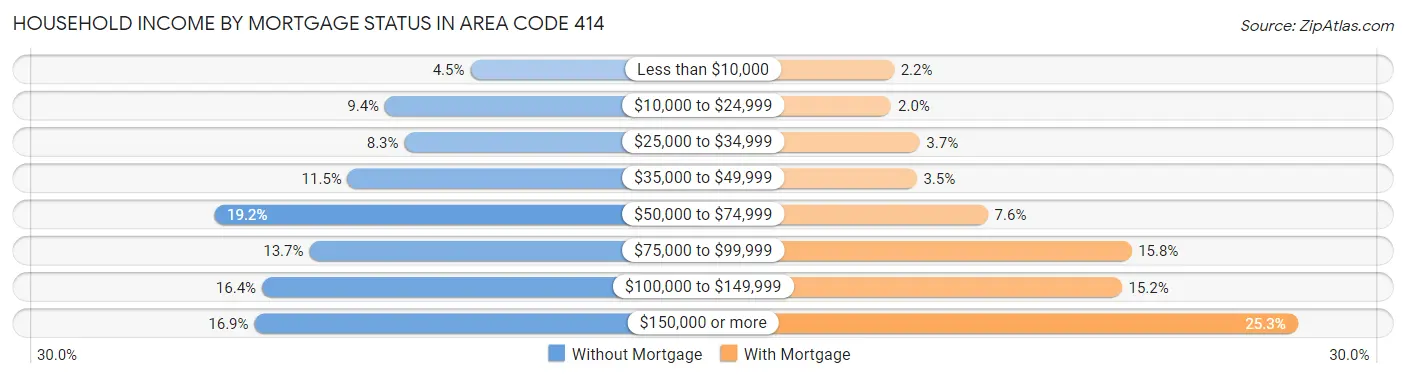
Household Income by Mortgage Status in Area Code 414
| Household Income | Without Mortgage | With Mortgage |
| Less than $10,000 | 3,699 (4.5%) | 3,235 (2.2%) |
| $10,000 to $24,999 | 7,675 (9.4%) | 3,011 (2.0%) |
| $25,000 to $34,999 | 6,774 (8.3%) | 5,431 (3.6%) |
| $35,000 to $49,999 | 9,414 (11.5%) | 5,176 (3.5%) |
| $50,000 to $74,999 | 15,638 (19.2%) | 11,225 (7.5%) |
| $75,000 to $99,999 | 11,199 (13.7%) | 23,405 (15.8%) |
| $100,000 to $149,999 | 13,412 (16.4%) | 22,587 (15.2%) |
| $150,000 or more | 13,759 (16.9%) | 37,523 (25.3%) |
| Total | 81,570 (100.0%) | 148,623 (100.0%) |
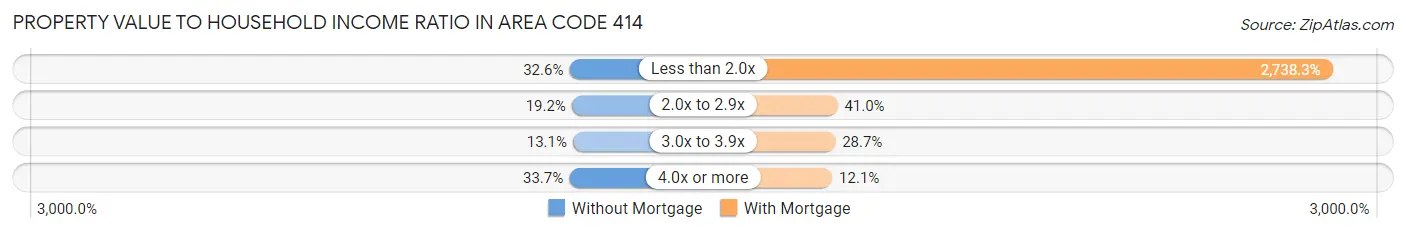
Property Value to Household Income Ratio in Area Code 414
| Value-to-Income Ratio | Without Mortgage | With Mortgage |
| Less than 2.0x | 26,608 (32.6%) | 4,069,682 (2,738.3%) |
| 2.0x to 2.9x | 15,679 (19.2%) | 60,857 (40.9%) |
| 3.0x to 3.9x | 10,681 (13.1%) | 42,673 (28.7%) |
| 4.0x or more | 27,445 (33.7%) | 17,960 (12.1%) |
| Total | 81,570 (100.0%) | 148,623 (100.0%) |
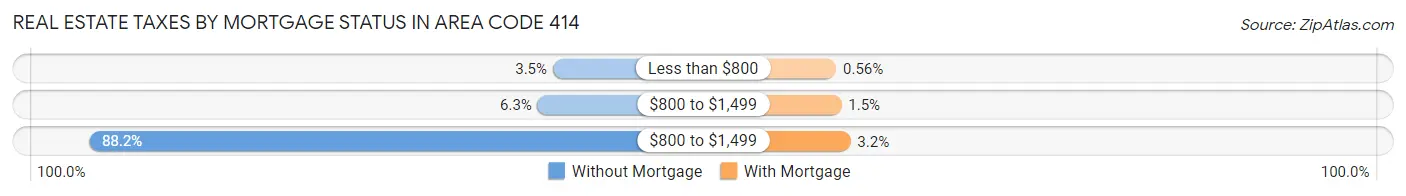
Real Estate Taxes by Mortgage Status in Area Code 414
| Property Taxes | Without Mortgage | With Mortgage |
| Less than $800 | 2,867 (3.5%) | 826 (0.6%) |
| $800 to $1,499 | 5,127 (6.3%) | 2,245 (1.5%) |
| $800 to $1,499 | 71,980 (88.2%) | 4,707 (3.2%) |
| Total | 81,570 (100.0%) | 148,623 (100.0%) |
Health & Disability in Area Code 414
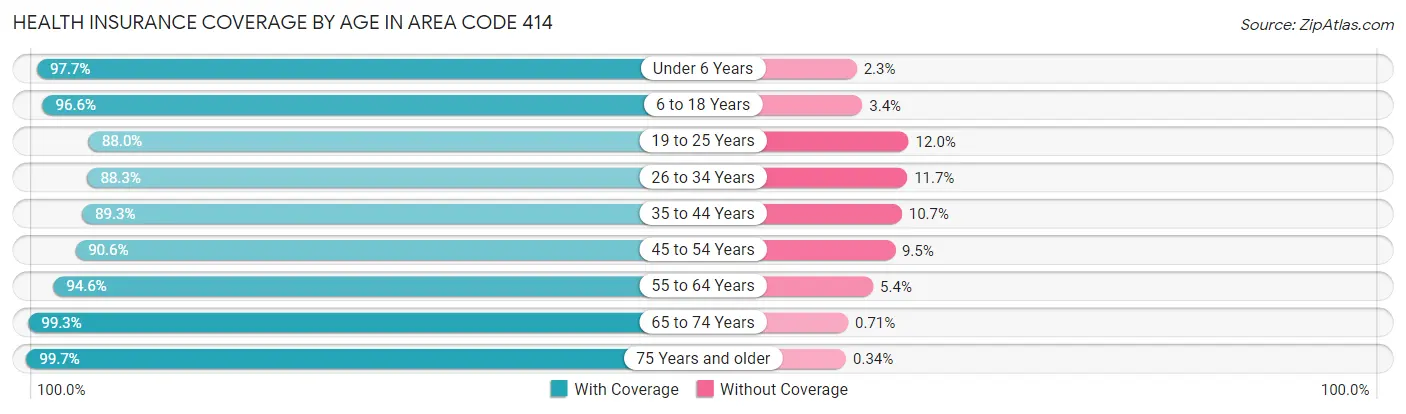
Health Insurance Coverage by Age in Area Code 414
| Age Bracket | With Coverage | Without Coverage |
| Under 6 Years | 77,447 (97.7%) | 1,843 (2.3%) |
| 6 to 18 Years | 175,114 (96.6%) | 6,114 (3.4%) |
| 19 to 25 Years | 88,735 (88.0%) | 12,102 (12.0%) |
| 26 to 34 Years | 126,748 (88.3%) | 16,838 (11.7%) |
| 35 to 44 Years | 122,732 (89.3%) | 14,743 (10.7%) |
| 45 to 54 Years | 109,211 (90.5%) | 11,394 (9.5%) |
| 55 to 64 Years | 120,748 (94.6%) | 6,868 (5.4%) |
| 65 to 74 Years | 91,935 (99.3%) | 653 (0.7%) |
| 75 Years and older | 61,645 (99.7%) | 211 (0.3%) |
| Total | 974,315 (93.2%) | 70,766 (6.8%) |
Health Insurance Coverage by Citizenship Status in Area Code 414
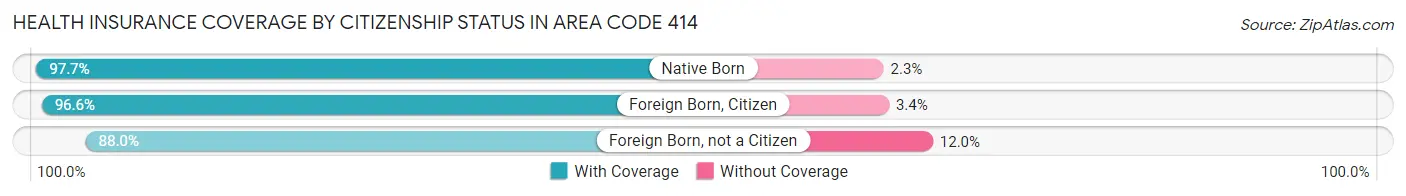
| Citizenship Status | With Coverage | Without Coverage |
| Native Born | 77,447 (97.7%) | 1,843 (2.3%) |
| Foreign Born, Citizen | 175,114 (96.6%) | 6,114 (3.4%) |
| Foreign Born, not a Citizen | 88,735 (88.0%) | 12,102 (12.0%) |
Health Insurance Coverage by Household Income in Area Code 414
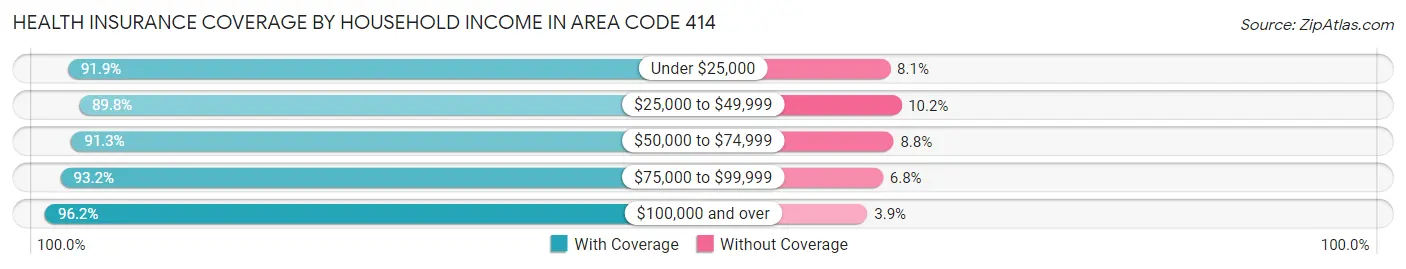
| Household Income | With Coverage | Without Coverage |
| Under $25,000 | 132,726 (91.9%) | 11,731 (8.1%) |
| $25,000 to $49,999 | 169,752 (89.8%) | 19,267 (10.2%) |
| $50,000 to $74,999 | 152,852 (91.2%) | 14,663 (8.7%) |
| $75,000 to $99,999 | 132,129 (93.2%) | 9,574 (6.8%) |
| $100,000 and over | 372,301 (96.2%) | 14,917 (3.8%) |
Public vs Private Health Insurance Coverage by Age in Area Code 414
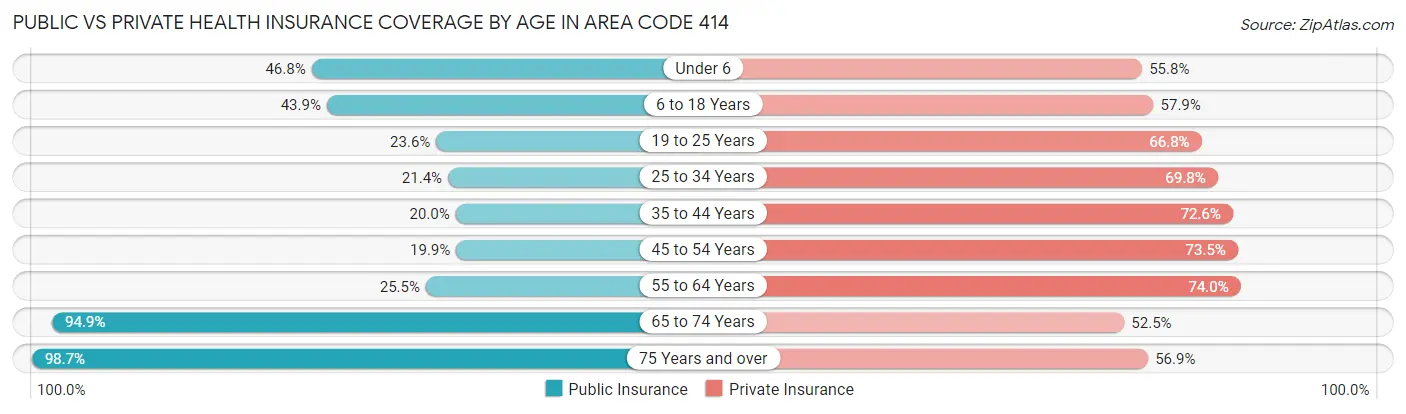
| Age Bracket | Public Insurance | Private Insurance |
| Under 6 | 37,068 (46.8%) | 44,221 (55.8%) |
| 6 to 18 Years | 79,597 (43.9%) | 104,888 (57.9%) |
| 19 to 25 Years | 23,812 (23.6%) | 67,310 (66.7%) |
| 25 to 34 Years | 30,777 (21.4%) | 100,146 (69.8%) |
| 35 to 44 Years | 27,504 (20.0%) | 99,757 (72.6%) |
| 45 to 54 Years | 24,015 (19.9%) | 88,608 (73.5%) |
| 55 to 64 Years | 32,593 (25.5%) | 94,431 (74.0%) |
| 65 to 74 Years | 87,868 (94.9%) | 48,570 (52.5%) |
| 75 Years and over | 61,039 (98.7%) | 35,183 (56.9%) |
| Total | 404,273 (38.7%) | 683,114 (65.4%) |
Disability Status by Sex by Age in Area Code 414
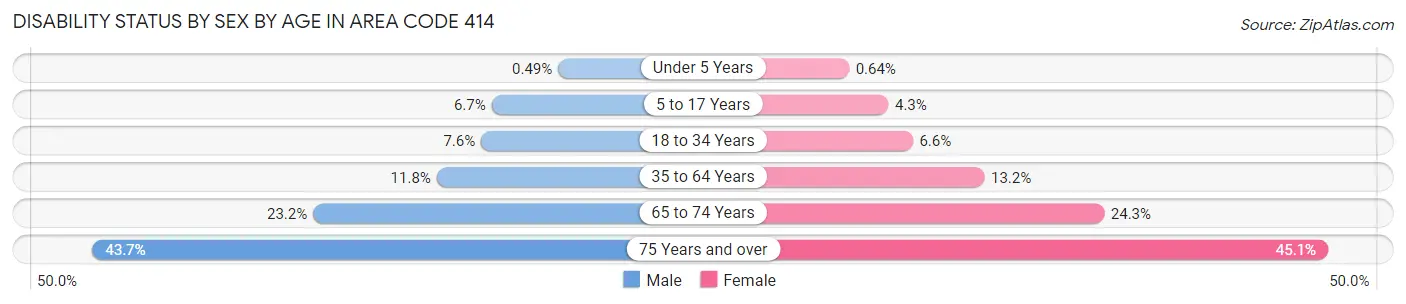
| Age Bracket | Male | Female |
| Under 5 Years | 168 (0.5%) | 207 (0.6%) |
| 5 to 17 Years | 6,091 (6.7%) | 3,740 (4.3%) |
| 18 to 34 Years | 9,795 (7.6%) | 8,627 (6.6%) |
| 35 to 64 Years | 22,196 (11.8%) | 25,996 (13.2%) |
| 65 to 74 Years | 10,231 (23.2%) | 11,808 (24.3%) |
| 75 Years and over | 10,624 (43.7%) | 16,938 (45.1%) |
Disability Class by Sex by Age in Area Code 414
Disability Class: Hearing Difficulty
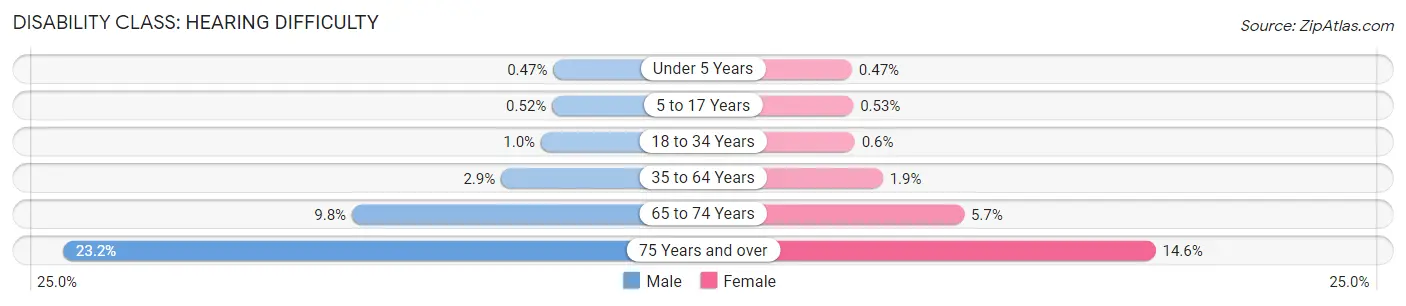
| Age Bracket | Male | Female |
| Under 5 Years | 160 (0.5%) | 154 (0.5%) |
| 5 to 17 Years | 479 (0.5%) | 466 (0.5%) |
| 18 to 34 Years | 1,338 (1.0%) | 788 (0.6%) |
| 35 to 64 Years | 5,449 (2.9%) | 3,741 (1.9%) |
| 65 to 74 Years | 4,319 (9.8%) | 2,752 (5.7%) |
| 75 Years and over | 5,645 (23.2%) | 5,466 (14.6%) |
Disability Class: Vision Difficulty
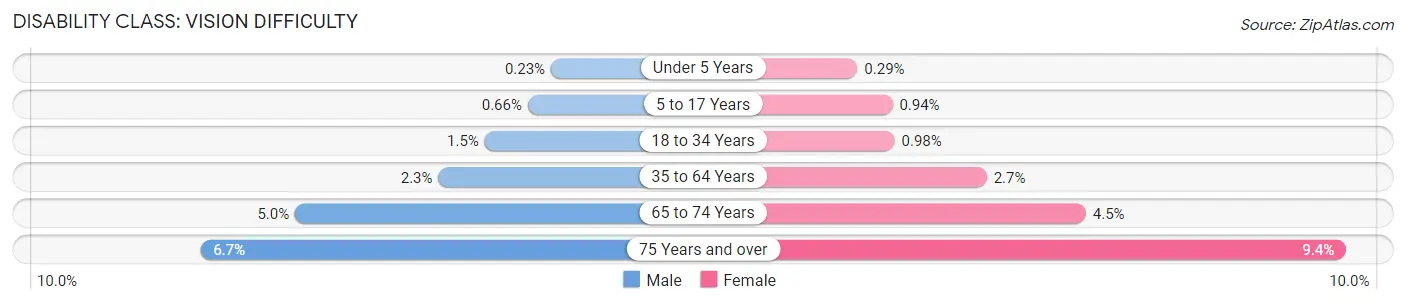
| Age Bracket | Male | Female |
| Under 5 Years | 77 (0.2%) | 96 (0.3%) |
| 5 to 17 Years | 605 (0.7%) | 818 (0.9%) |
| 18 to 34 Years | 1,868 (1.5%) | 1,288 (1.0%) |
| 35 to 64 Years | 4,380 (2.3%) | 5,297 (2.7%) |
| 65 to 74 Years | 2,193 (5.0%) | 2,200 (4.5%) |
| 75 Years and over | 1,639 (6.7%) | 3,516 (9.4%) |
Disability Class: Cognitive Difficulty
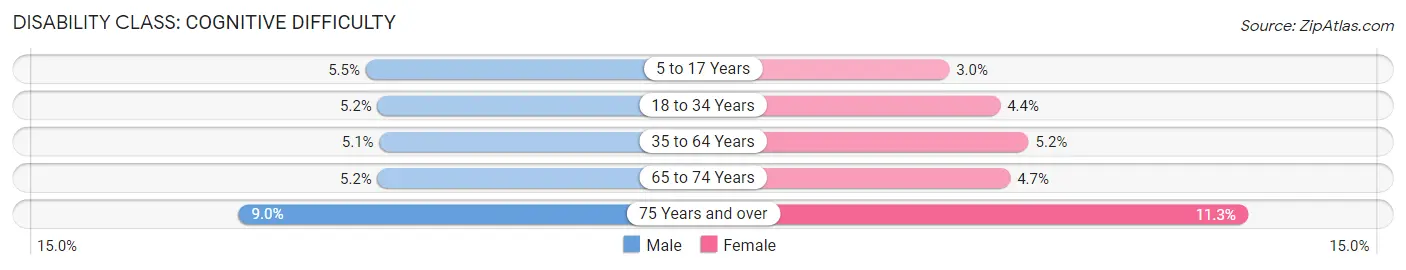
| Age Bracket | Male | Female |
| 5 to 17 Years | 5,028 (5.5%) | 2,608 (3.0%) |
| 18 to 34 Years | 6,629 (5.2%) | 5,800 (4.4%) |
| 35 to 64 Years | 9,669 (5.1%) | 10,248 (5.2%) |
| 65 to 74 Years | 2,279 (5.2%) | 2,275 (4.7%) |
| 75 Years and over | 2,197 (9.0%) | 4,244 (11.3%) |
Disability Class: Ambulatory Difficulty
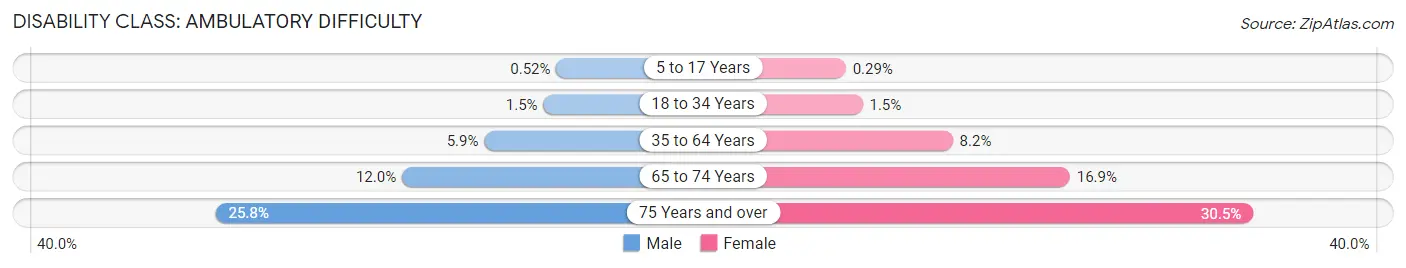
| Age Bracket | Male | Female |
| 5 to 17 Years | 475 (0.5%) | 254 (0.3%) |
| 18 to 34 Years | 1,894 (1.5%) | 2,027 (1.5%) |
| 35 to 64 Years | 11,075 (5.9%) | 16,207 (8.2%) |
| 65 to 74 Years | 5,275 (12.0%) | 8,218 (16.9%) |
| 75 Years and over | 6,277 (25.8%) | 11,469 (30.5%) |
Disability Class: Self-Care Difficulty
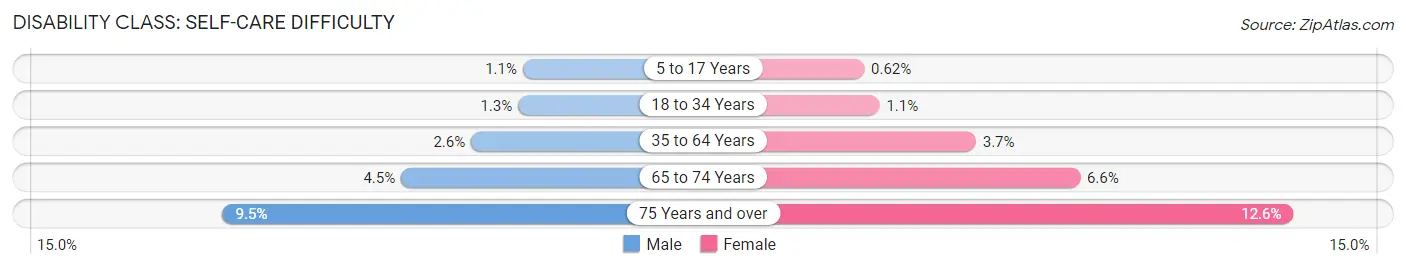
| Age Bracket | Male | Female |
| 5 to 17 Years | 1,032 (1.1%) | 536 (0.6%) |
| 18 to 34 Years | 1,613 (1.3%) | 1,383 (1.1%) |
| 35 to 64 Years | 4,855 (2.6%) | 7,342 (3.7%) |
| 65 to 74 Years | 1,991 (4.5%) | 3,221 (6.6%) |
| 75 Years and over | 2,307 (9.5%) | 4,718 (12.6%) |
Technology Access in Area Code 414
Computing Device Access in Area Code 414
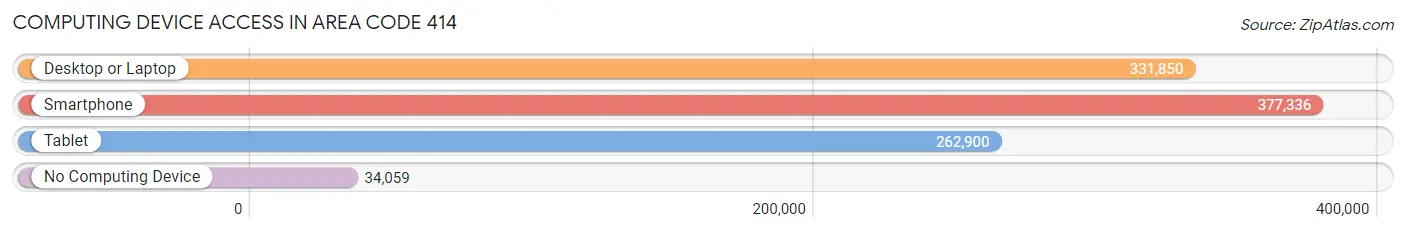
| Device Type | # Households | % Households |
| Desktop or Laptop | 331,850 | 75.6% |
| Smartphone | 377,336 | 86.0% |
| Tablet | 262,900 | 59.9% |
| No Computing Device | 34,059 | 7.8% |
| Total | 438,871 | 100.0% |
Internet Access in Area Code 414
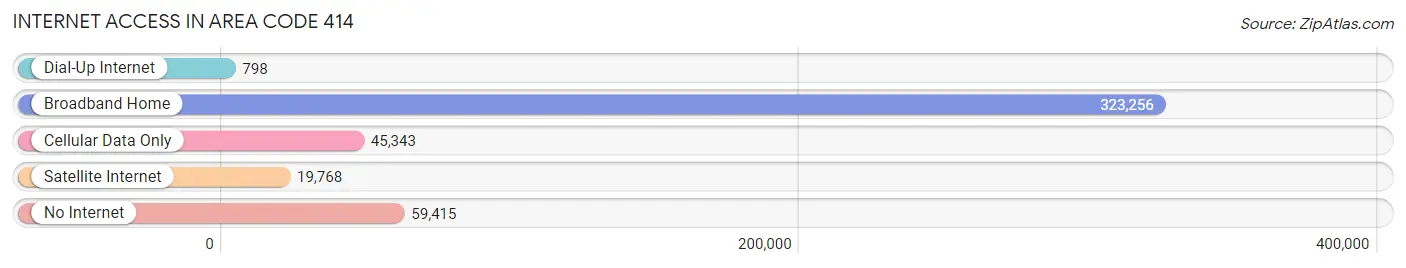
| Internet Type | # Households | % Households |
| Dial-Up Internet | 798 | 0.2% |
| Broadband Home | 323,256 | 73.7% |
| Cellular Data Only | 45,343 | 10.3% |
| Satellite Internet | 19,768 | 4.5% |
| No Internet | 59,415 | 13.5% |
| Total | 438,871 | 100.0% |
Area Code 414 Summary
Geography
Area code 414 is an area code in the North American Numbering Plan (NANP) for the city of Milwaukee, Wisconsin and its surrounding areas. It is one of the original 86 area codes created in 1947.
Social
Area code 414 is a major hub for social activity in the Milwaukee area. It is home to a variety of cultural attractions, including the Milwaukee Art Museum, the Milwaukee County Zoo, and the Milwaukee Public Museum. It is also home to a number of professional sports teams, including the Milwaukee Brewers and the Milwaukee Bucks.
Economics
Area code 414 is an important economic center in the Midwest. It is home to a number of major corporations, including Harley-Davidson, MillerCoors, and Johnson Controls. It is also home to a number of universities and colleges, including the University of Wisconsin-Milwaukee and Marquette University.
Demographics
Area code 414 is home to a diverse population. According to the 2010 census, the population of the area code was 594,833, with a median age of 34.7 years. The racial makeup of the area code was 63.2% White, 25.3% African American, 5.2% Hispanic or Latino, and 5.3% Asian.
Common Questions
What is Per Capita Income in Area Code 414?
Per Capita income in Area Code 414 is $38,925.
What is the Median Family Income in Area Code 414?
Median Family Income in Area Code 414 is $90,509.
What is the Median Household income in Area Code 414?
Median Household Income in Area Code 414 is $68,476.
What is Income or Wage Gap in Area Code 414?
Income or Wage Gap in Area Code 414 is 22.3%.
Women in Area Code 414 earn 77.7 cents for every dollar earned by a man.
What is Family Income Deficit in Area Code 414?
Family Income Deficit in Area Code 414 is $10,682.
Families that are below poverty line in Area Code 414 earn $10,682 less on average than the poverty threshold level.
What is Inequality or Gini Index in Area Code 414?
Inequality or Gini Index in Area Code 414 is 17.76.
What is the Total Population of Area Code 414?
Total Population of Area Code 414 is 1,053,614.
What is the Total Male Population of Area Code 414?
Total Male Population of Area Code 414 is 515,649.
What is the Total Female Population of Area Code 414?
Total Female Population of Area Code 414 is 537,965.
What is the Ratio of Males per 100 Females in Area Code 414?
There are 95.85 Males per 100 Females in Area Code 414.
What is the Ratio of Females per 100 Males in Area Code 414?
There are 104.33 Females per 100 Males in Area Code 414.
What is the Median Population Age in Area Code 414?
Median Population Age in Area Code 414 is 37.6 Years.
What is the Average Family Size in Area Code 414
Average Family Size in Area Code 414 is 3.1 People.
What is the Average Household Size in Area Code 414
Average Household Size in Area Code 414 is 2.3 People.
How Large is the Labor Force in Area Code 414?
There are 526,301 People in the Labor Forcein in Area Code 414.
What is the Percentage of People in the Labor Force in Area Code 414?
63.0% of People are in the Labor Force in Area Code 414.
What is the Unemployment Rate in Area Code 414?
Unemployment Rate in Area Code 414 is 6.7%.