Area Code 774 Map & Demographics
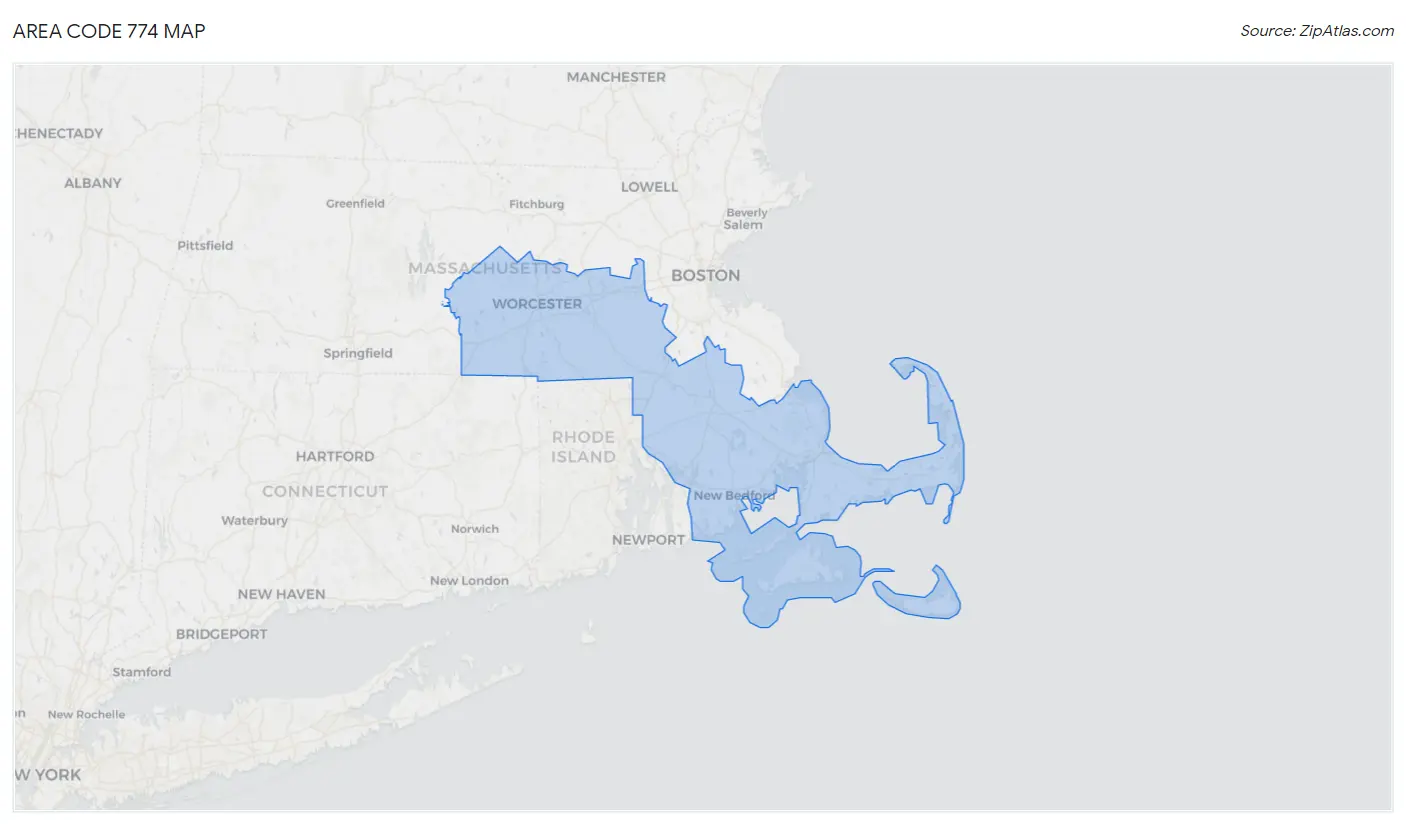
Area Code 774 Map
Area Code 774 Overview
$58,107
PER CAPITA INCOME
$133,968
AVG FAMILY INCOME
$112,173
AVG HOUSEHOLD INCOME
31.1%
WAGE / INCOME GAP [ % ]
68.9¢/ $1
WAGE / INCOME GAP [ $ ]
$10,635
FAMILY INCOME DEFICIT
48.28
INEQUALITY / GINI INDEX
1,680,160
TOTAL POPULATION
825,803
MALE POPULATION
854,357
FEMALE POPULATION
96.66
MALES / 100 FEMALES
103.46
FEMALES / 100 MALES
44.2
MEDIAN AGE
3.0
AVG FAMILY SIZE
2.5
AVG HOUSEHOLD SIZE
910,065
LABOR FORCE [ PEOPLE ]
66.3%
PERCENT IN LABOR FORCE
5.2%
UNEMPLOYMENT RATE
Income in Area Code 774
Income Overview in Area Code 774
Per Capita Income in Area Code 774 is $58,107, while median incomes of families and households are $133,968 and $112,173 respectively.
| Characteristic | Number | Measure |
| Per Capita Income | 1,680,160 | $58,107 |
| Median Family Income | 432,112 | $133,968 |
| Mean Family Income | 432,112 | $19,075,868 |
| Median Household Income | 652,007 | $112,173 |
| Mean Household Income | 652,007 | $16,408,014 |
| Income Deficit | 432,112 | $10,635 |
| Wage / Income Gap (%) | 1,680,160 | 31.09% |
| Wage / Income Gap ($) | 1,680,160 | 68.91¢ per $1 |
| Gini / Inequality Index | 1,680,160 | 48.28 |
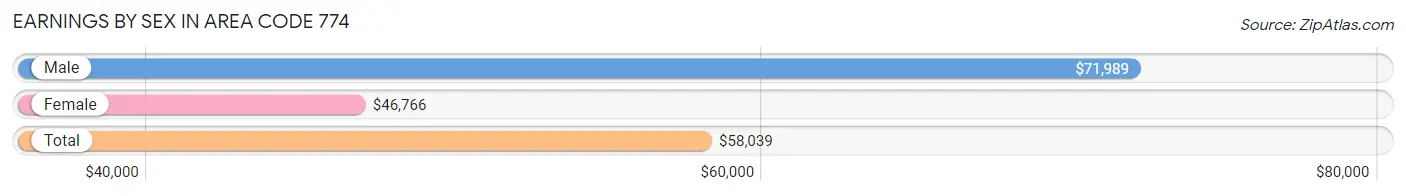
Earnings by Sex in Area Code 774
Average Earnings in Area Code 774 are $58,039, $71,989 for men and $46,766 for women, a difference of 35.0%.
| Sex | Number | Average Earnings |
| Male | 496,275 (51.7%) | $71,989 |
| Female | 464,215 (48.3%) | $46,766 |
| Total | 960,490 (100.0%) | $58,039 |
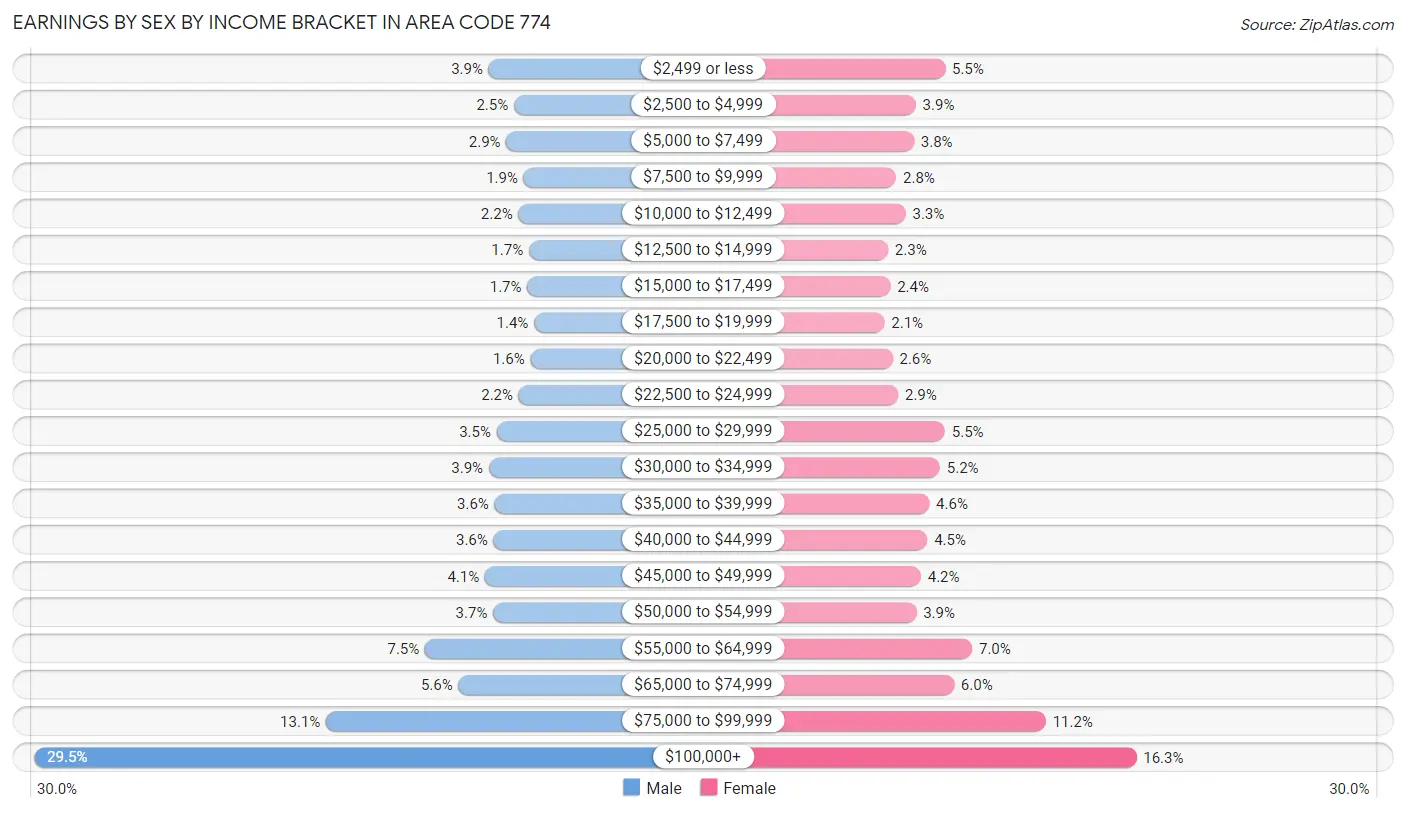
Earnings by Sex by Income Bracket in Area Code 774
The most common earnings brackets in Area Code 774 are $100,000+ for men (146,212 | 29.5%) and $100,000+ for women (75,542 | 16.3%).
| Income | Male | Female |
| $2,499 or less | 19,393 (3.9%) | 25,626 (5.5%) |
| $2,500 to $4,999 | 12,338 (2.5%) | 17,979 (3.9%) |
| $5,000 to $7,499 | 14,500 (2.9%) | 17,501 (3.8%) |
| $7,500 to $9,999 | 9,628 (1.9%) | 12,872 (2.8%) |
| $10,000 to $12,499 | 11,099 (2.2%) | 15,321 (3.3%) |
| $12,500 to $14,999 | 8,200 (1.7%) | 10,706 (2.3%) |
| $15,000 to $17,499 | 8,619 (1.7%) | 11,319 (2.4%) |
| $17,500 to $19,999 | 6,760 (1.4%) | 9,784 (2.1%) |
| $20,000 to $22,499 | 7,739 (1.6%) | 11,926 (2.6%) |
| $22,500 to $24,999 | 11,003 (2.2%) | 13,350 (2.9%) |
| $25,000 to $29,999 | 17,155 (3.5%) | 25,589 (5.5%) |
| $30,000 to $34,999 | 19,376 (3.9%) | 24,260 (5.2%) |
| $35,000 to $39,999 | 17,769 (3.6%) | 21,494 (4.6%) |
| $40,000 to $44,999 | 18,070 (3.6%) | 20,963 (4.5%) |
| $45,000 to $49,999 | 20,463 (4.1%) | 19,309 (4.2%) |
| $50,000 to $54,999 | 18,148 (3.7%) | 18,127 (3.9%) |
| $55,000 to $64,999 | 37,189 (7.5%) | 32,696 (7.0%) |
| $65,000 to $74,999 | 27,835 (5.6%) | 27,930 (6.0%) |
| $75,000 to $99,999 | 64,779 (13.1%) | 51,921 (11.2%) |
| $100,000+ | 146,212 (29.5%) | 75,542 (16.3%) |
| Total | 496,275 (100.0%) | 464,215 (100.0%) |
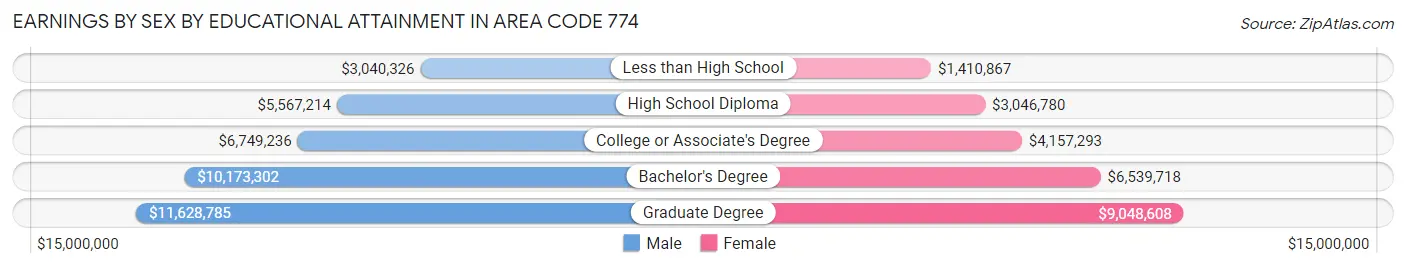
Earnings by Sex by Educational Attainment in Area Code 774
Average earnings in Area Code 774 are $9,203,798 for men and $6,069,445 for women, a difference of 34.1%. Men with an educational attainment of graduate degree enjoy the highest average annual earnings of $11,628,785, while those with less than high school education earn the least with $3,040,326. Women with an educational attainment of graduate degree earn the most with the average annual earnings of $9,048,608, while those with less than high school education have the smallest earnings of $1,410,867.
| Educational Attainment | Male Income | Female Income |
| Less than High School | $3,040,326 | $1,410,867 |
| High School Diploma | $5,567,214 | $3,046,780 |
| College or Associate's Degree | $6,749,236 | $4,157,293 |
| Bachelor's Degree | $10,173,302 | $6,539,718 |
| Graduate Degree | $11,628,785 | $9,048,608 |
| Total | $9,203,798 | $6,069,445 |
Family Income in Area Code 774
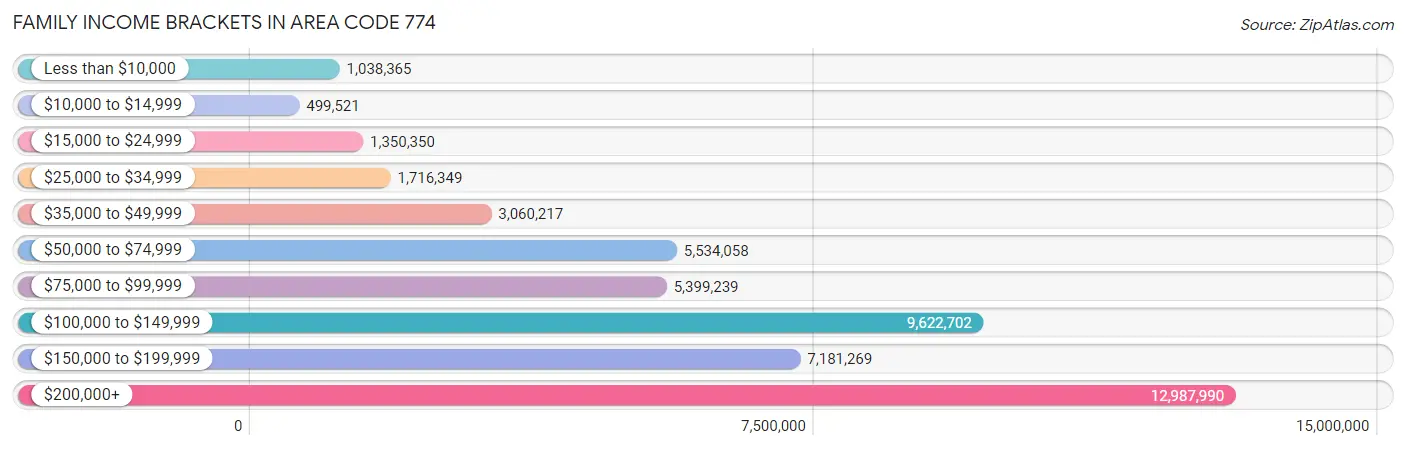
Family Income Brackets in Area Code 774
According to the Area Code 774 family income data, there are 12,987,990 families falling into the $200,000+ income range, which is the most common income bracket and makes up 3,005.7% of all families. Conversely, the $10,000 to $14,999 income bracket is the least frequent group with only 499,521 families (115.6%) belonging to this category.
| Income Bracket | # Families | % Families |
| Less than $10,000 | 1,038,365 | 240.3% |
| $10,000 to $14,999 | 499,521 | 115.6% |
| $15,000 to $24,999 | 1,350,350 | 312.5% |
| $25,000 to $34,999 | 1,716,349 | 397.2% |
| $35,000 to $49,999 | 3,060,217 | 708.2% |
| $50,000 to $74,999 | 5,534,058 | 1,280.7% |
| $75,000 to $99,999 | 5,399,239 | 1,249.5% |
| $100,000 to $149,999 | 9,622,702 | 2,226.9% |
| $150,000 to $199,999 | 7,181,269 | 1,661.9% |
| $200,000+ | 12,987,990 | 3,005.7% |
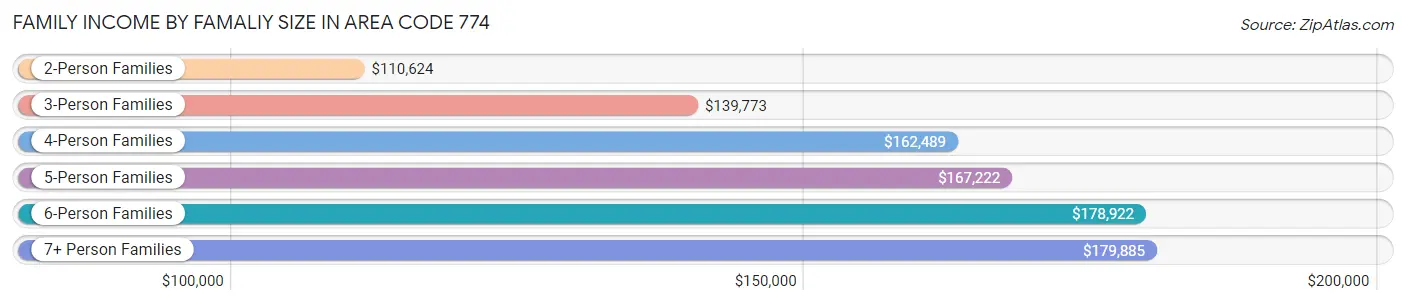
Family Income by Famaliy Size in Area Code 774
7+ person families (5,153 | 1.2%) account for the highest median family income in Area Code 774 with $179,885 per family, while 2-person families (193,641 | 44.8%) have the highest median income of $55,312 per family member.
| Income Bracket | # Families | Median Income |
| 2-Person Families | 193,641 (44.8%) | $110,624 |
| 3-Person Families | 103,326 (23.9%) | $139,773 |
| 4-Person Families | 87,212 (20.2%) | $162,489 |
| 5-Person Families | 33,560 (7.8%) | $167,222 |
| 6-Person Families | 9,220 (2.1%) | $178,922 |
| 7+ Person Families | 5,153 (1.2%) | $179,885 |
| Total | 432,112 (100.0%) | $133,968 |
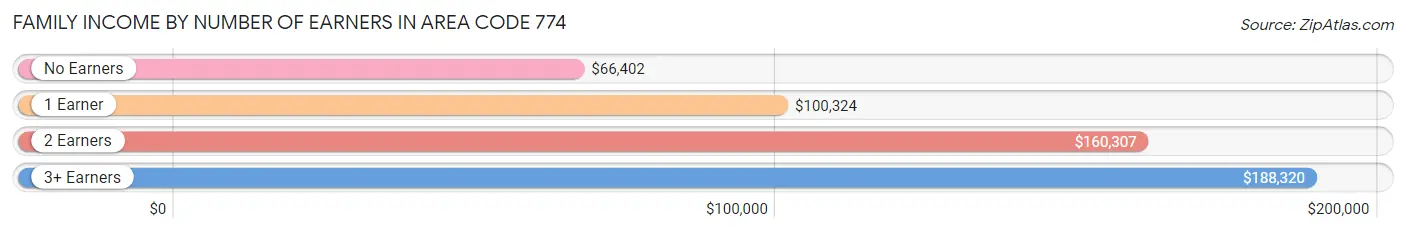
Family Income by Number of Earners in Area Code 774
The median family income in Area Code 774 is $133,968, with families comprising 3+ earners (67,561) having the highest median family income of $188,320, while families with no earners (55,969) have the lowest median family income of $66,402, accounting for 15.6% and 13.0% of families, respectively.
| Number of Earners | # Families | Median Income |
| No Earners | 55,969 (13.0%) | $66,402 |
| 1 Earner | 117,571 (27.2%) | $100,324 |
| 2 Earners | 191,011 (44.2%) | $160,307 |
| 3+ Earners | 67,561 (15.6%) | $188,320 |
| Total | 432,112 (100.0%) | $133,968 |
Household Income in Area Code 774
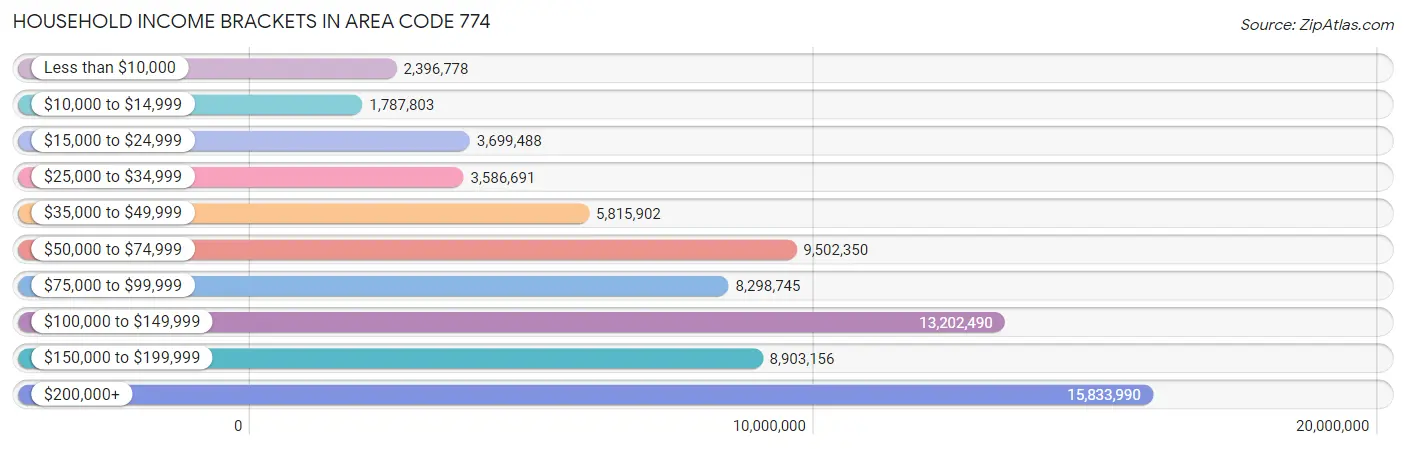
Household Income Brackets in Area Code 774
With 15,833,990 households falling in the category, the $200,000+ income range is the most frequent in Area Code 774, accounting for 2,428.5% of all households. In contrast, only 1,787,803 households (274.2%) fall into the $10,000 to $14,999 income bracket, making it the least populous group.
| Income Bracket | # Households | % Households |
| Less than $10,000 | 2,396,778 | 367.6% |
| $10,000 to $14,999 | 1,787,803 | 274.2% |
| $15,000 to $24,999 | 3,699,488 | 567.4% |
| $25,000 to $34,999 | 3,586,691 | 550.1% |
| $35,000 to $49,999 | 5,815,902 | 892.0% |
| $50,000 to $74,999 | 9,502,350 | 1,457.4% |
| $75,000 to $99,999 | 8,298,745 | 1,272.8% |
| $100,000 to $149,999 | 13,202,490 | 2,024.9% |
| $150,000 to $199,999 | 8,903,156 | 1,365.5% |
| $200,000+ | 15,833,990 | 2,428.5% |
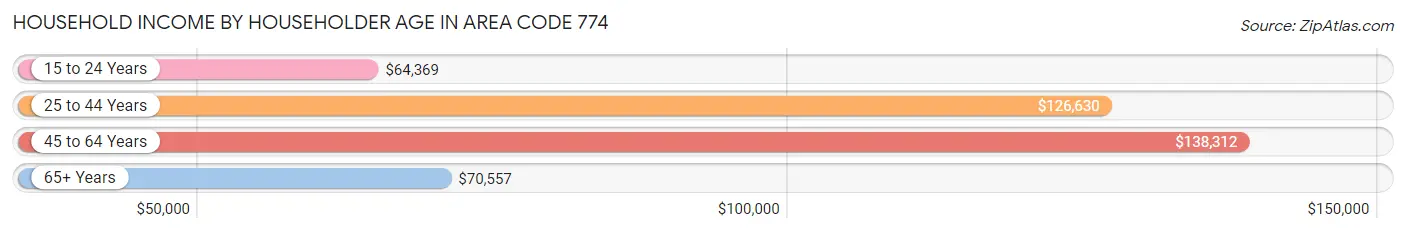
Household Income by Householder Age in Area Code 774
The median household income in Area Code 774 is $112,173, with the highest median household income of $138,312 found in the 45 to 64 years age bracket for the primary householder. A total of 264,831 households (40.6%) fall into this category. Meanwhile, the 15 to 24 years age bracket for the primary householder has the lowest median household income of $64,369, with 13,764 households (2.1%) in this group.
| Income Bracket | # Households | Median Income |
| 15 to 24 Years | 13,764 (2.1%) | $64,369 |
| 25 to 44 Years | 191,443 (29.4%) | $126,630 |
| 45 to 64 Years | 264,831 (40.6%) | $138,312 |
| 65+ Years | 181,969 (27.9%) | $70,557 |
| Total | 652,007 (100.0%) | $112,173 |
Poverty in Area Code 774
Income Below Poverty by Sex and Age in Area Code 774
With 7.9% poverty level for males and 9.5% for females among the residents of Area Code 774, under 5 year old males and 18 to 24 year old females are the most vulnerable to poverty, with 5,440 males (12.7%) and 7,656 females (12.2%) in their respective age groups living below the poverty level.
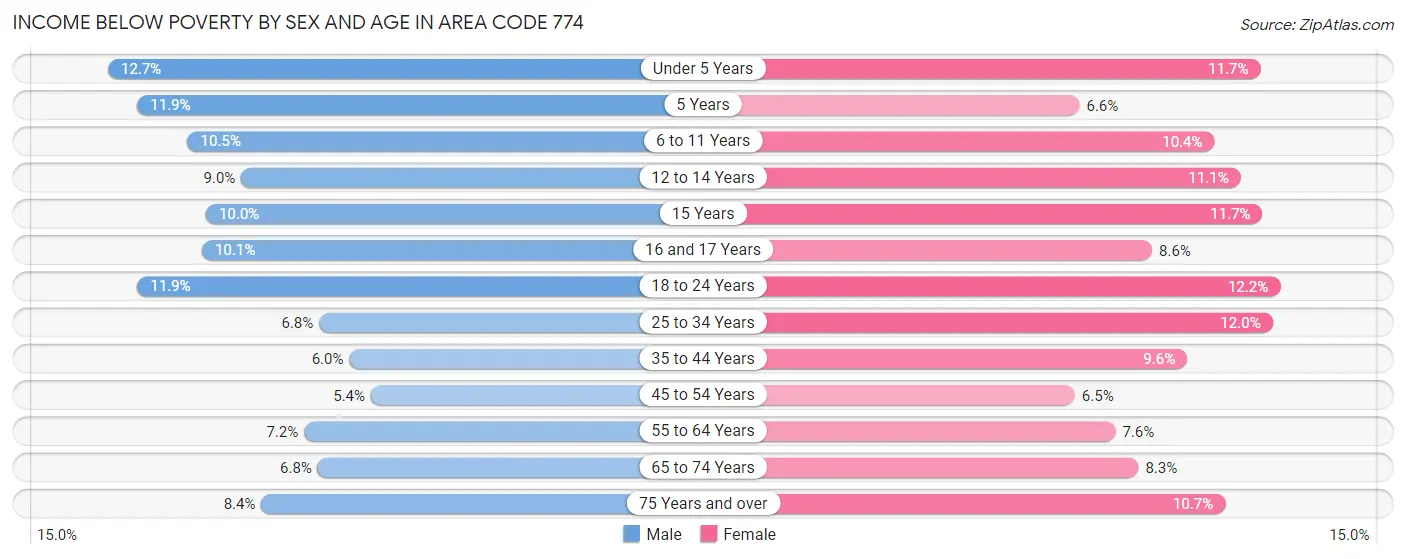
| Age Bracket | Male | Female |
| Under 5 Years | 5,440 (12.7%) | 4,885 (11.7%) |
| 5 Years | 1,189 (11.9%) | 565 (6.6%) |
| 6 to 11 Years | 6,176 (10.5%) | 5,734 (10.4%) |
| 12 to 14 Years | 2,962 (9.0%) | 3,291 (11.1%) |
| 15 Years | 1,153 (10.0%) | 1,265 (11.7%) |
| 16 and 17 Years | 2,220 (10.1%) | 1,801 (8.6%) |
| 18 to 24 Years | 8,041 (11.9%) | 7,656 (12.2%) |
| 25 to 34 Years | 7,038 (6.8%) | 12,732 (12.0%) |
| 35 to 44 Years | 6,116 (6.0%) | 10,063 (9.6%) |
| 45 to 54 Years | 5,959 (5.4%) | 7,391 (6.5%) |
| 55 to 64 Years | 8,498 (7.2%) | 9,306 (7.6%) |
| 65 to 74 Years | 5,592 (6.8%) | 7,513 (8.3%) |
| 75 Years and over | 3,906 (8.4%) | 7,229 (10.7%) |
| Total | 64,290 (7.9%) | 79,431 (9.5%) |
Income Above Poverty by Sex and Age in Area Code 774
According to the poverty statistics in Area Code 774, males aged 45 to 54 years and females aged 45 to 54 years are the age groups that are most secure financially, with 94.6% of males and 93.5% of females in these age groups living above the poverty line.
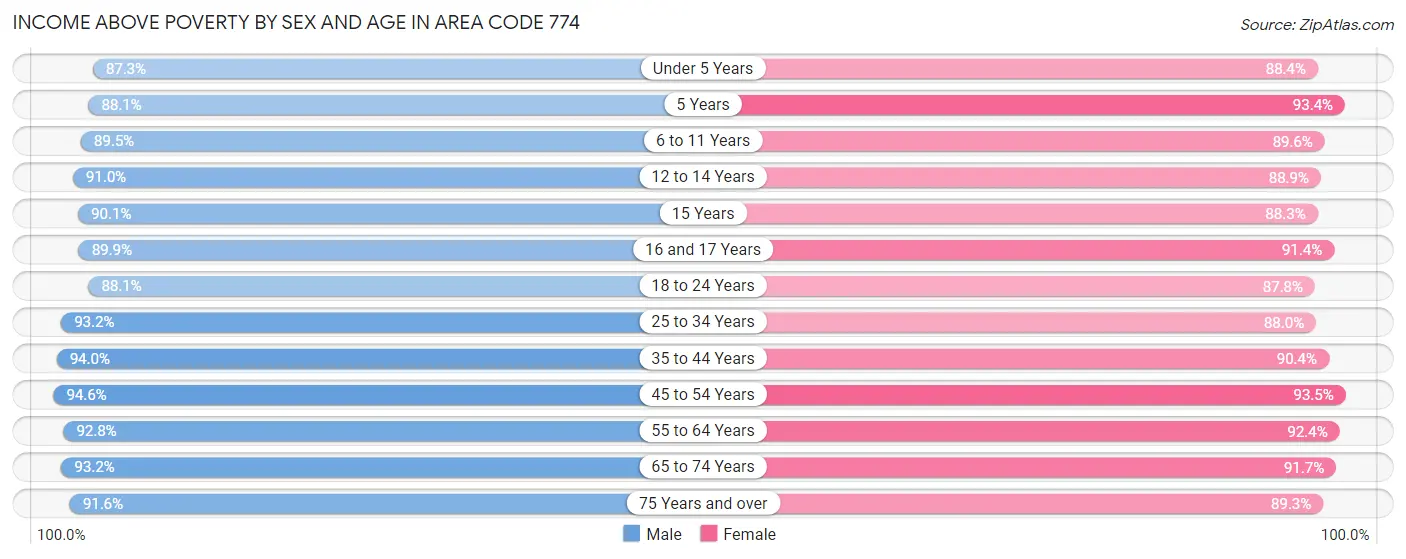
| Age Bracket | Male | Female |
| Under 5 Years | 37,468 (87.3%) | 37,046 (88.3%) |
| 5 Years | 8,839 (88.1%) | 7,965 (93.4%) |
| 6 to 11 Years | 52,871 (89.5%) | 49,534 (89.6%) |
| 12 to 14 Years | 30,060 (91.0%) | 26,348 (88.9%) |
| 15 Years | 10,430 (90.0%) | 9,540 (88.3%) |
| 16 and 17 Years | 19,858 (89.9%) | 19,040 (91.4%) |
| 18 to 24 Years | 59,736 (88.1%) | 55,091 (87.8%) |
| 25 to 34 Years | 96,388 (93.2%) | 93,445 (88.0%) |
| 35 to 44 Years | 96,541 (94.0%) | 94,661 (90.4%) |
| 45 to 54 Years | 105,244 (94.6%) | 106,519 (93.5%) |
| 55 to 64 Years | 109,233 (92.8%) | 112,765 (92.4%) |
| 65 to 74 Years | 76,219 (93.2%) | 83,487 (91.7%) |
| 75 Years and over | 42,561 (91.6%) | 60,525 (89.3%) |
| Total | 745,448 (92.1%) | 755,966 (90.5%) |
Income Below Poverty Among Married-Couple Families in Area Code 774
The poverty statistics for married-couple families in Area Code 774 show that 2.5% or 8,005 of the total 323,909 families live below the poverty line. Families with 5 or more children have the highest poverty rate of 17.1%, comprising of 125 families. On the other hand, families with 1 or 2 children have the lowest poverty rate of 2.3%, which includes 2,544 families.
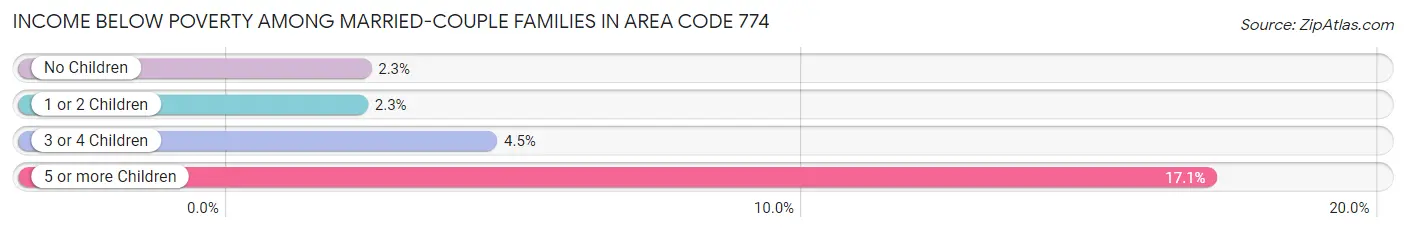
| Children | Above Poverty | Below Poverty |
| No Children | 185,139 (97.7%) | 4,390 (2.3%) |
| 1 or 2 Children | 110,141 (97.7%) | 2,544 (2.3%) |
| 3 or 4 Children | 20,016 (95.5%) | 946 (4.5%) |
| 5 or more Children | 608 (83.0%) | 125 (17.1%) |
| Total | 315,904 (97.5%) | 8,005 (2.5%) |
Income Below Poverty Among Single-Parent Households in Area Code 774
According to the poverty data in Area Code 774, 9.5% or 2,876 single-father households and 19.1% or 14,890 single-mother households are living below the poverty line. Among single-father households, those with 1 or 2 children have the highest poverty rate, with 1,857 households (12.4%) experiencing poverty. Likewise, among single-mother households, those with 5 or more children have the highest poverty rate, with 255 households (56.8%) falling below the poverty line.
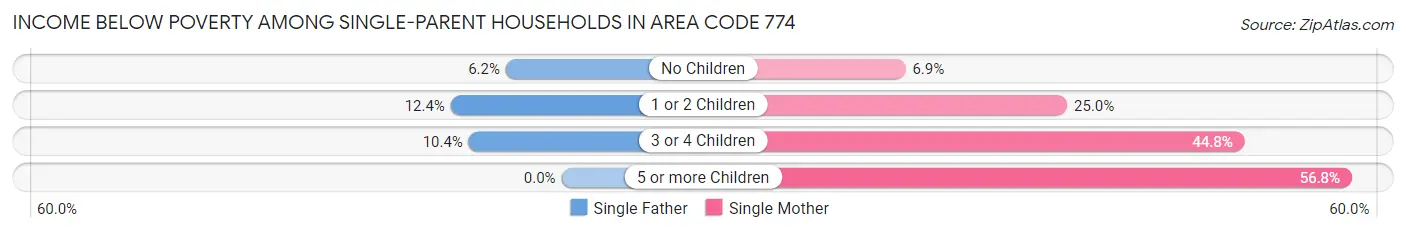
| Children | Single Father | Single Mother |
| No Children | 819 (6.2%) | 2,235 (6.9%) |
| 1 or 2 Children | 1,857 (12.4%) | 9,874 (25.0%) |
| 3 or 4 Children | 200 (10.4%) | 2,526 (44.8%) |
| 5 or more Children | 0 (0.0%) | 255 (56.8%) |
| Total | 2,876 (9.5%) | 14,890 (19.1%) |
Income Below Poverty Among Married-Couple vs Single-Parent Households in Area Code 774
The poverty data for Area Code 774 shows that 8,005 of the married-couple family households (2.5%) and 17,766 of the single-parent households (16.4%) are living below the poverty level. Within the married-couple family households, those with 5 or more children have the highest poverty rate, with 125 households (17.1%) falling below the poverty line. Among the single-parent households, those with 5 or more children have the highest poverty rate, with 255 household (43.7%) living below poverty.
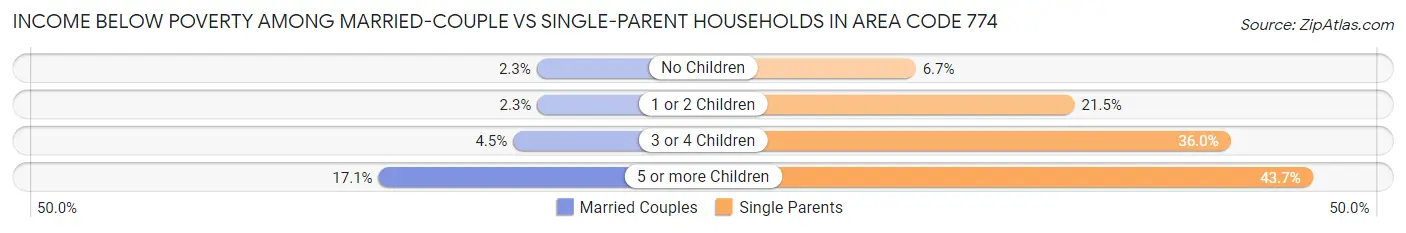
| Children | Married-Couple Families | Single-Parent Households |
| No Children | 4,390 (2.3%) | 3,054 (6.7%) |
| 1 or 2 Children | 2,544 (2.3%) | 11,731 (21.5%) |
| 3 or 4 Children | 946 (4.5%) | 2,726 (36.0%) |
| 5 or more Children | 125 (17.1%) | 255 (43.7%) |
| Total | 8,005 (2.5%) | 17,766 (16.4%) |
Race in Area Code 774
The most populous races in Area Code 774 are White / Caucasian (1,293,767 | 77.0%), Hispanic or Latino (145,925 | 8.7%), and Two or more Races (126,903 | 7.5%).
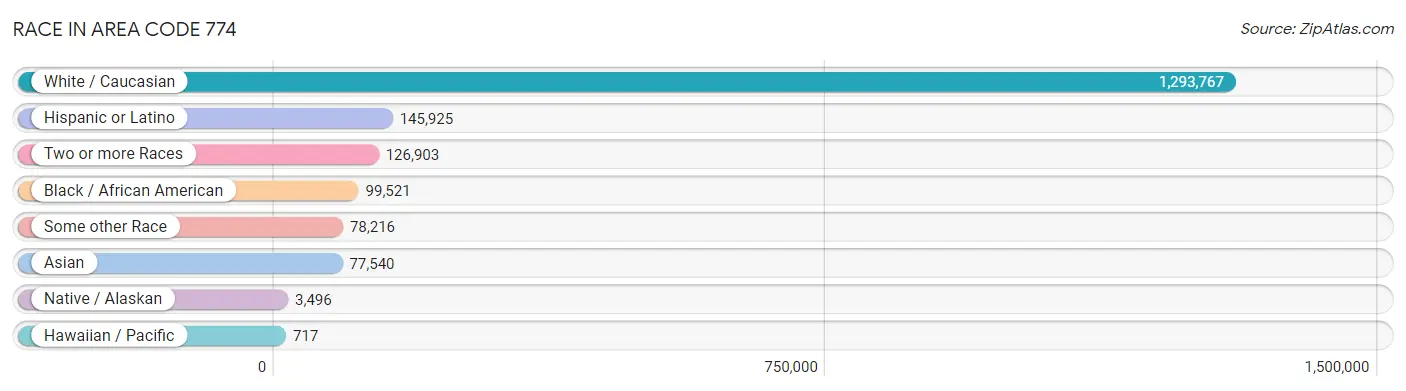
| Race | # Population | % Population |
| Asian | 77,540 | 4.6% |
| Black / African American | 99,521 | 5.9% |
| Hawaiian / Pacific | 717 | 0.0% |
| Hispanic or Latino | 145,925 | 8.7% |
| Native / Alaskan | 3,496 | 0.2% |
| White / Caucasian | 1,293,767 | 77.0% |
| Two or more Races | 126,903 | 7.5% |
| Some other Race | 78,216 | 4.7% |
| Total | 1,680,160 | 100.0% |
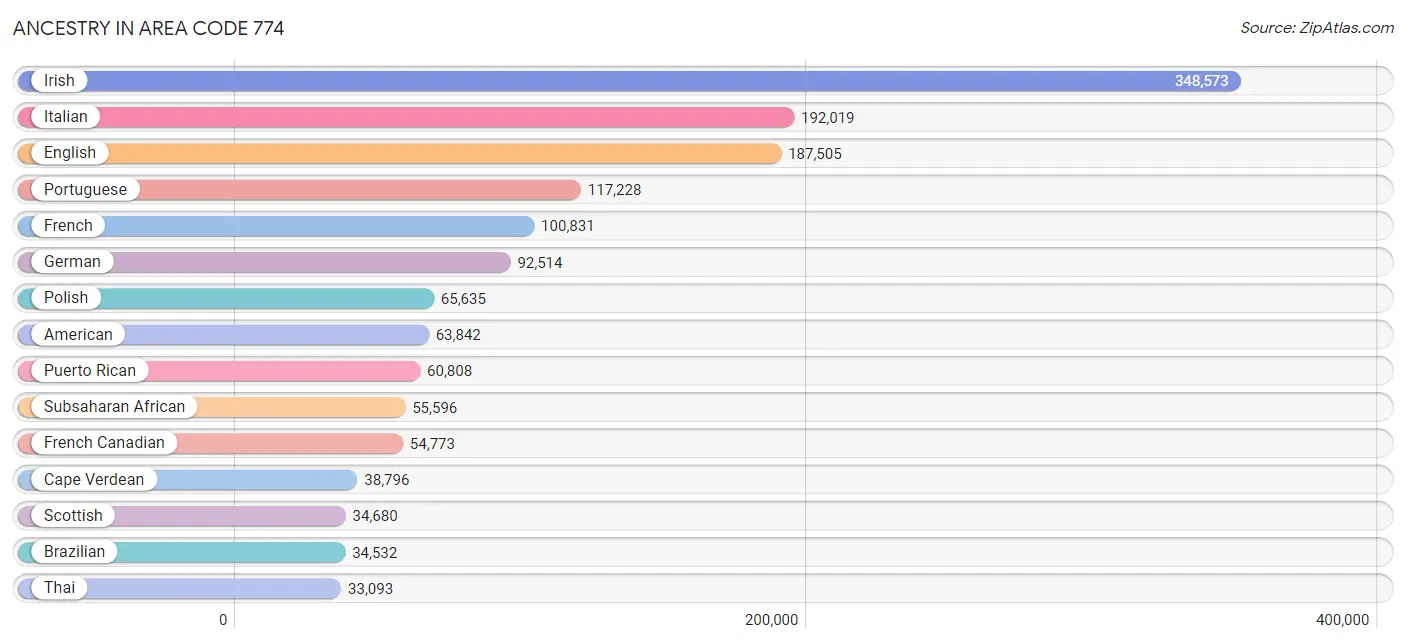
Ancestry in Area Code 774
The most populous ancestries reported in Area Code 774 are Irish (348,573 | 20.7%), Italian (192,019 | 11.4%), English (187,505 | 11.2%), Portuguese (117,228 | 7.0%), and French (100,831 | 6.0%), together accounting for 56.3% of all Area Code 774 residents.
| Ancestry | # Population | % Population |
| Afghan | 211 | 0.0% |
| African | 6,678 | 0.4% |
| Albanian | 3,837 | 0.2% |
| Alsatian | 30 | 0.0% |
| American | 63,842 | 3.8% |
| Apache | 103 | 0.0% |
| Arab | 15,284 | 0.9% |
| Argentinean | 1,430 | 0.1% |
| Armenian | 6,913 | 0.4% |
| Assyrian / Chaldean / Syriac | 146 | 0.0% |
| Australian | 781 | 0.1% |
| Austrian | 3,266 | 0.2% |
| Bahamian | 293 | 0.0% |
| Bangladeshi | 393 | 0.0% |
| Barbadian | 913 | 0.1% |
| Basque | 149 | 0.0% |
| Belgian | 1,100 | 0.1% |
| Belizean | 13 | 0.0% |
| Bermudan | 81 | 0.0% |
| Bhutanese | 4,022 | 0.2% |
| Blackfeet | 549 | 0.0% |
| Bolivian | 506 | 0.0% |
| Brazilian | 34,532 | 2.1% |
| British | 6,960 | 0.4% |
| British West Indian | 541 | 0.0% |
| Bulgarian | 1,236 | 0.1% |
| Burmese | 4,764 | 0.3% |
| Cajun | 141 | 0.0% |
| Cambodian | 382 | 0.0% |
| Canadian | 8,643 | 0.5% |
| Cape Verdean | 38,796 | 2.3% |
| Carpatho Rusyn | 29 | 0.0% |
| Celtic | 259 | 0.0% |
| Central American | 25,945 | 1.5% |
| Central American Indian | 1,653 | 0.1% |
| Cherokee | 1,242 | 0.1% |
| Chickasaw | 70 | 0.0% |
| Chilean | 629 | 0.0% |
| Chinese | 18 | 0.0% |
| Chippewa | 115 | 0.0% |
| Choctaw | 38 | 0.0% |
| Colombian | 4,332 | 0.3% |
| Comanche | 9 | 0.0% |
| Costa Rican | 534 | 0.0% |
| Cree | 56 | 0.0% |
| Creek | 56 | 0.0% |
| Croatian | 822 | 0.1% |
| Cuban | 3,250 | 0.2% |
| Cypriot | 244 | 0.0% |
| Czech | 2,206 | 0.1% |
| Czechoslovakian | 1,140 | 0.1% |
| Danish | 3,273 | 0.2% |
| Delaware | 9 | 0.0% |
| Dominican | 15,979 | 0.9% |
| Dutch | 8,229 | 0.5% |
| Eastern European | 8,628 | 0.5% |
| Ecuadorian | 7,743 | 0.5% |
| Egyptian | 2,646 | 0.2% |
| English | 187,505 | 11.2% |
| Estonian | 306 | 0.0% |
| Ethiopian | 585 | 0.0% |
| European | 19,054 | 1.1% |
| Fijian | 7 | 0.0% |
| Filipino | 1,370 | 0.1% |
| Finnish | 4,953 | 0.3% |
| French | 100,831 | 6.0% |
| French American Indian | 249 | 0.0% |
| French Canadian | 54,773 | 3.3% |
| German | 92,514 | 5.5% |
| Ghanaian | 1,959 | 0.1% |
| Greek | 14,278 | 0.9% |
| Guamanian / Chamorro | 487 | 0.0% |
| Guatemalan | 11,291 | 0.7% |
| Guyanese | 351 | 0.0% |
| Haitian | 21,879 | 1.3% |
| Honduran | 3,643 | 0.2% |
| Hopi | 37 | 0.0% |
| Hungarian | 3,957 | 0.2% |
| Icelander | 235 | 0.0% |
| Indian (Asian) | 26,393 | 1.6% |
| Indonesian | 212 | 0.0% |
| Inupiat | 11 | 0.0% |
| Iranian | 2,001 | 0.1% |
| Iraqi | 223 | 0.0% |
| Irish | 348,573 | 20.7% |
| Iroquois | 162 | 0.0% |
| Israeli | 1,144 | 0.1% |
| Italian | 192,019 | 11.4% |
| Jamaican | 6,640 | 0.4% |
| Japanese | 2,416 | 0.1% |
| Jordanian | 264 | 0.0% |
| Kenyan | 1,038 | 0.1% |
| Kiowa | 39 | 0.0% |
| Korean | 5,487 | 0.3% |
| Laotian | 531 | 0.0% |
| Latvian | 898 | 0.1% |
| Lebanese | 7,989 | 0.5% |
| Liberian | 311 | 0.0% |
| Lithuanian | 11,055 | 0.7% |
| Luxembourger | 60 | 0.0% |
| Macedonian | 149 | 0.0% |
| Malaysian | 744 | 0.0% |
| Maltese | 134 | 0.0% |
| Menominee | 11 | 0.0% |
| Mexican | 10,538 | 0.6% |
| Mexican American Indian | 308 | 0.0% |
| Mongolian | 97 | 0.0% |
| Moroccan | 834 | 0.1% |
| Native Hawaiian | 594 | 0.0% |
| Navajo | 115 | 0.0% |
| New Zealander | 75 | 0.0% |
| Nicaraguan | 307 | 0.0% |
| Nigerian | 2,603 | 0.2% |
| Northern European | 1,969 | 0.1% |
| Norwegian | 8,643 | 0.5% |
| Okinawan | 8 | 0.0% |
| Ottawa | 7 | 0.0% |
| Pakistani | 1,265 | 0.1% |
| Palestinian | 236 | 0.0% |
| Panamanian | 1,237 | 0.1% |
| Paraguayan | 107 | 0.0% |
| Pennsylvania German | 148 | 0.0% |
| Peruvian | 2,643 | 0.2% |
| Polish | 65,635 | 3.9% |
| Portuguese | 117,228 | 7.0% |
| Potawatomi | 150 | 0.0% |
| Pueblo | 19 | 0.0% |
| Puerto Rican | 60,808 | 3.6% |
| Romanian | 2,198 | 0.1% |
| Russian | 19,842 | 1.2% |
| Salvadoran | 8,771 | 0.5% |
| Samoan | 361 | 0.0% |
| Scandinavian | 2,673 | 0.2% |
| Scotch-Irish | 10,592 | 0.6% |
| Scottish | 34,680 | 2.1% |
| Seminole | 74 | 0.0% |
| Senegalese | 174 | 0.0% |
| Serbian | 1,196 | 0.1% |
| Shoshone | 10 | 0.0% |
| Sierra Leonean | 131 | 0.0% |
| Sioux | 134 | 0.0% |
| Slavic | 523 | 0.0% |
| Slovak | 2,000 | 0.1% |
| Slovene | 373 | 0.0% |
| Somali | 229 | 0.0% |
| South African | 685 | 0.0% |
| South American | 19,428 | 1.2% |
| South American Indian | 308 | 0.0% |
| Spaniard | 2,119 | 0.1% |
| Spanish | 2,657 | 0.2% |
| Spanish American | 9 | 0.0% |
| Spanish American Indian | 9 | 0.0% |
| Sri Lankan | 7,011 | 0.4% |
| Subsaharan African | 55,596 | 3.3% |
| Sudanese | 4 | 0.0% |
| Swedish | 32,560 | 1.9% |
| Swiss | 1,854 | 0.1% |
| Syrian | 2,008 | 0.1% |
| Thai | 33,093 | 2.0% |
| Tongan | 52 | 0.0% |
| Trinidadian and Tobagonian | 1,047 | 0.1% |
| Turkish | 925 | 0.1% |
| U.S. Virgin Islander | 111 | 0.0% |
| Ugandan | 619 | 0.0% |
| Ukrainian | 5,384 | 0.3% |
| Uruguayan | 199 | 0.0% |
| Ute | 15 | 0.0% |
| Venezuelan | 1,702 | 0.1% |
| Vietnamese | 718 | 0.0% |
| Welsh | 5,218 | 0.3% |
| West Indian | 1,208 | 0.1% |
| Yugoslavian | 333 | 0.0% |
| Zimbabwean | 26 | 0.0% | View All 173 Rows |
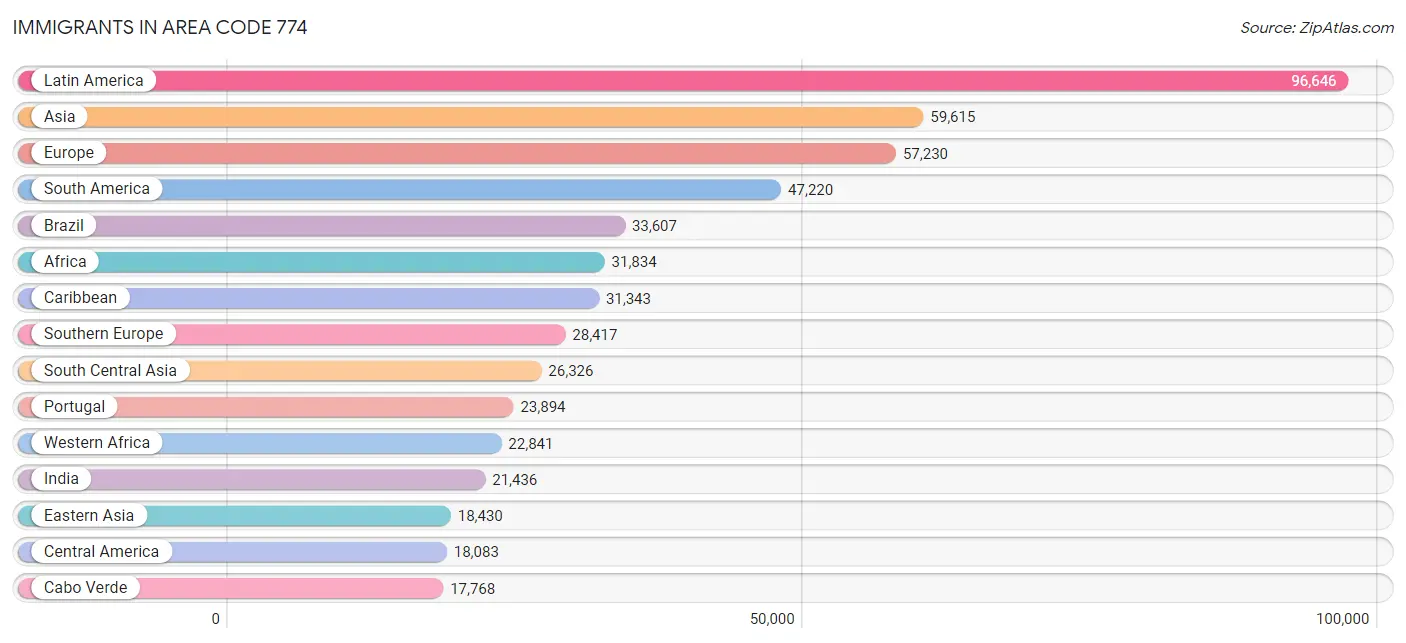
Immigrants in Area Code 774
The most numerous immigrant groups reported in Area Code 774 came from Latin America (96,646 | 5.8%), Asia (59,615 | 3.5%), Europe (57,230 | 3.4%), South America (47,220 | 2.8%), and Brazil (33,607 | 2.0%), together accounting for 17.5% of all Area Code 774 residents.
| Immigration Origin | # Population | % Population |
| Africa | 31,834 | 1.9% |
| Albania | 1,504 | 0.1% |
| Argentina | 769 | 0.1% |
| Armenia | 537 | 0.0% |
| Asia | 59,615 | 3.5% |
| Australia | 594 | 0.0% |
| Austria | 208 | 0.0% |
| Azores | 5,724 | 0.3% |
| Bahamas | 253 | 0.0% |
| Bangladesh | 719 | 0.0% |
| Barbados | 299 | 0.0% |
| Belarus | 682 | 0.0% |
| Belgium | 110 | 0.0% |
| Bolivia | 309 | 0.0% |
| Bosnia and Herzegovina | 203 | 0.0% |
| Brazil | 33,607 | 2.0% |
| Bulgaria | 794 | 0.1% |
| Cabo Verde | 17,768 | 1.1% |
| Cambodia | 1,034 | 0.1% |
| Cameroon | 899 | 0.1% |
| Canada | 5,132 | 0.3% |
| Caribbean | 31,343 | 1.9% |
| Central America | 18,083 | 1.1% |
| Chile | 348 | 0.0% |
| China | 15,017 | 0.9% |
| Colombia | 2,775 | 0.2% |
| Congo | 18 | 0.0% |
| Costa Rica | 292 | 0.0% |
| Croatia | 124 | 0.0% |
| Cuba | 695 | 0.0% |
| Czechoslovakia | 183 | 0.0% |
| Denmark | 175 | 0.0% |
| Dominica | 431 | 0.0% |
| Dominican Republic | 7,706 | 0.5% |
| Eastern Africa | 2,983 | 0.2% |
| Eastern Asia | 18,430 | 1.1% |
| Eastern Europe | 14,617 | 0.9% |
| Ecuador | 5,824 | 0.4% |
| Egypt | 2,283 | 0.1% |
| El Salvador | 5,087 | 0.3% |
| England | 3,094 | 0.2% |
| Eritrea | 63 | 0.0% |
| Ethiopia | 461 | 0.0% |
| Europe | 57,230 | 3.4% |
| France | 932 | 0.1% |
| Germany | 2,361 | 0.1% |
| Ghana | 2,157 | 0.1% |
| Greece | 1,811 | 0.1% |
| Grenada | 55 | 0.0% |
| Guatemala | 7,389 | 0.4% |
| Guyana | 324 | 0.0% |
| Haiti | 16,241 | 1.0% |
| Honduras | 2,187 | 0.1% |
| Hong Kong | 1,242 | 0.1% |
| Hungary | 173 | 0.0% |
| India | 21,436 | 1.3% |
| Indonesia | 170 | 0.0% |
| Iran | 1,397 | 0.1% |
| Iraq | 363 | 0.0% |
| Ireland | 2,751 | 0.2% |
| Israel | 1,136 | 0.1% |
| Italy | 2,040 | 0.1% |
| Jamaica | 4,334 | 0.3% |
| Japan | 1,101 | 0.1% |
| Jordan | 161 | 0.0% |
| Kazakhstan | 159 | 0.0% |
| Kenya | 1,377 | 0.1% |
| Korea | 2,296 | 0.1% |
| Kuwait | 44 | 0.0% |
| Laos | 443 | 0.0% |
| Latin America | 96,646 | 5.8% |
| Latvia | 253 | 0.0% |
| Lebanon | 1,241 | 0.1% |
| Liberia | 338 | 0.0% |
| Lithuania | 369 | 0.0% |
| Malaysia | 307 | 0.0% |
| Mexico | 2,595 | 0.2% |
| Middle Africa | 1,535 | 0.1% |
| Moldova | 389 | 0.0% |
| Morocco | 605 | 0.0% |
| Nepal | 318 | 0.0% |
| Netherlands | 439 | 0.0% |
| Nicaragua | 147 | 0.0% |
| Nigeria | 1,813 | 0.1% |
| North Macedonia | 158 | 0.0% |
| Northern Africa | 2,979 | 0.2% |
| Northern Europe | 9,910 | 0.6% |
| Norway | 81 | 0.0% |
| Oceania | 765 | 0.1% |
| Pakistan | 1,876 | 0.1% |
| Panama | 238 | 0.0% |
| Peru | 1,306 | 0.1% |
| Philippines | 1,736 | 0.1% |
| Poland | 3,033 | 0.2% |
| Portugal | 23,894 | 1.4% |
| Romania | 841 | 0.1% |
| Russia | 3,268 | 0.2% |
| Saudi Arabia | 311 | 0.0% |
| Scotland | 551 | 0.0% |
| Senegal | 306 | 0.0% |
| Serbia | 168 | 0.0% |
| Sierra Leone | 109 | 0.0% |
| Singapore | 171 | 0.0% |
| Somalia | 128 | 0.0% |
| South Africa | 714 | 0.0% |
| South America | 47,220 | 2.8% |
| South Central Asia | 26,326 | 1.6% |
| South Eastern Asia | 9,198 | 0.5% |
| Southern Europe | 28,417 | 1.7% |
| Spain | 659 | 0.0% |
| Sri Lanka | 242 | 0.0% |
| St. Vincent and the Grenadines | 78 | 0.0% |
| Sudan | 1 | 0.0% |
| Sweden | 237 | 0.0% |
| Switzerland | 207 | 0.0% |
| Syria | 613 | 0.0% |
| Taiwan | 1,144 | 0.1% |
| Thailand | 902 | 0.1% |
| Trinidad and Tobago | 597 | 0.0% |
| Turkey | 486 | 0.0% |
| Uganda | 585 | 0.0% |
| Ukraine | 1,804 | 0.1% |
| Uruguay | 351 | 0.0% |
| Uzbekistan | 130 | 0.0% |
| Venezuela | 1,355 | 0.1% |
| Vietnam | 4,246 | 0.3% |
| West Indies | 16 | 0.0% |
| Western Africa | 22,841 | 1.4% |
| Western Asia | 5,499 | 0.3% |
| Western Europe | 4,257 | 0.3% |
| Yemen | 10 | 0.0% |
| Zaire | 95 | 0.0% |
| Zimbabwe | 118 | 0.0% | View All 133 Rows |
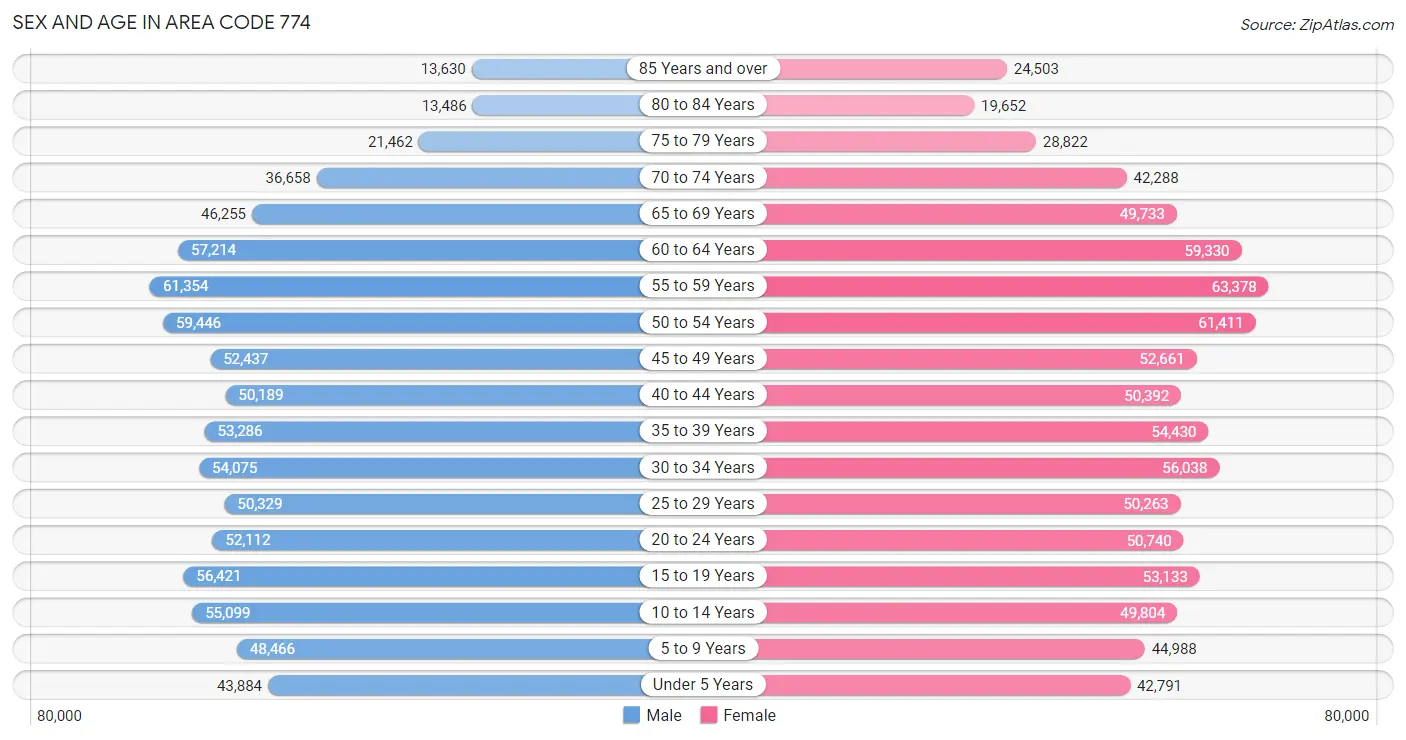
Sex and Age in Area Code 774
Sex and Age in Area Code 774
The most populous age groups in Area Code 774 are 55 to 59 Years (61,354 | 7.4%) for men and 55 to 59 Years (63,378 | 7.4%) for women.
| Age Bracket | Male | Female |
| Under 5 Years | 43,884 (5.3%) | 42,791 (5.0%) |
| 5 to 9 Years | 48,466 (5.9%) | 44,988 (5.3%) |
| 10 to 14 Years | 55,099 (6.7%) | 49,804 (5.8%) |
| 15 to 19 Years | 56,421 (6.8%) | 53,133 (6.2%) |
| 20 to 24 Years | 52,112 (6.3%) | 50,740 (5.9%) |
| 25 to 29 Years | 50,329 (6.1%) | 50,263 (5.9%) |
| 30 to 34 Years | 54,075 (6.6%) | 56,038 (6.6%) |
| 35 to 39 Years | 53,286 (6.5%) | 54,430 (6.4%) |
| 40 to 44 Years | 50,189 (6.1%) | 50,392 (5.9%) |
| 45 to 49 Years | 52,437 (6.4%) | 52,661 (6.2%) |
| 50 to 54 Years | 59,446 (7.2%) | 61,411 (7.2%) |
| 55 to 59 Years | 61,354 (7.4%) | 63,378 (7.4%) |
| 60 to 64 Years | 57,214 (6.9%) | 59,330 (6.9%) |
| 65 to 69 Years | 46,255 (5.6%) | 49,733 (5.8%) |
| 70 to 74 Years | 36,658 (4.4%) | 42,288 (5.0%) |
| 75 to 79 Years | 21,462 (2.6%) | 28,822 (3.4%) |
| 80 to 84 Years | 13,486 (1.6%) | 19,652 (2.3%) |
| 85 Years and over | 13,630 (1.7%) | 24,503 (2.9%) |
| Total | 825,803 (100.0%) | 854,357 (100.0%) |
Families and Households in Area Code 774
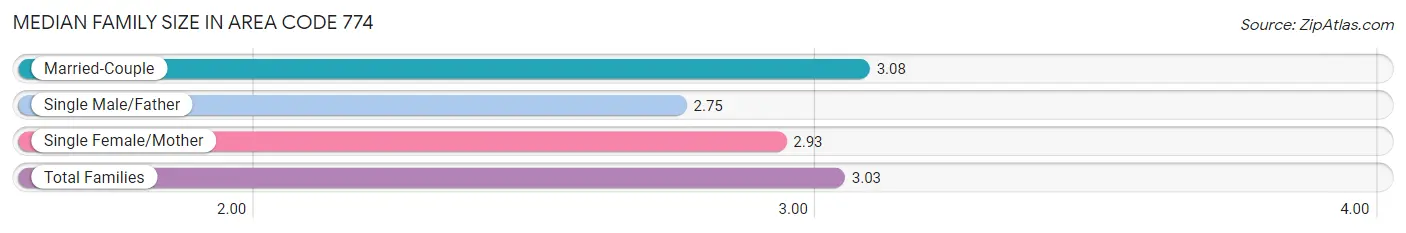
Median Family Size in Area Code 774
The median family size in Area Code 774 is 3.03 persons per family, with married-couple families (323,909 | 75.0%) accounting for the largest median family size of 3.07767 persons per family. On the other hand, single male/father families (30,223 | 7.0%) represent the smallest median family size with 2.75 persons per family.
| Family Type | # Families | Family Size |
| Married-Couple | 323,909 (75.0%) | 3.08 |
| Single Male/Father | 30,223 (7.0%) | 2.75 |
| Single Female/Mother | 77,980 (18.0%) | 2.93 |
| Total Families | 432,112 (100.0%) | 3.03 |
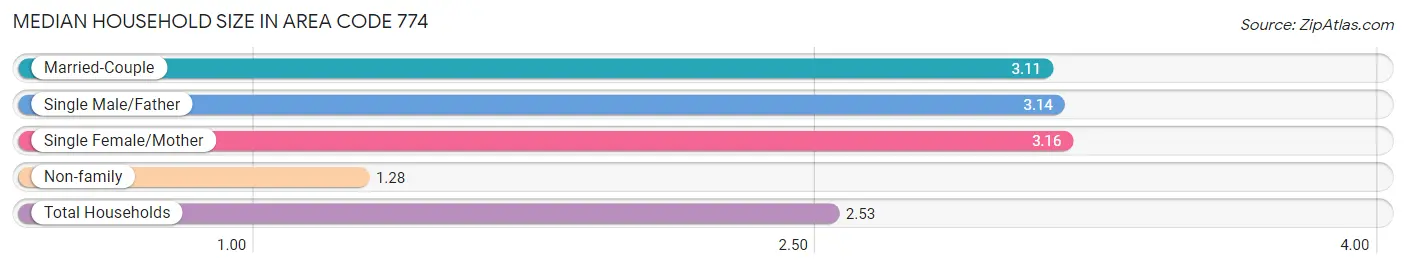
Median Household Size in Area Code 774
The median household size in Area Code 774 is 2.53 persons per household, with single female/mother households (77,980 | 12.0%) accounting for the largest median household size of 3.16081 persons per household. non-family households (219,895 | 33.7%) represent the smallest median household size with 1.28 persons per household.
| Household Type | # Households | Household Size |
| Married-Couple | 323,909 (49.7%) | 3.11 |
| Single Male/Father | 30,223 (4.6%) | 3.14 |
| Single Female/Mother | 77,980 (12.0%) | 3.16 |
| Non-family | 219,895 (33.7%) | 1.28 |
| Total Households | 652,007 (100.0%) | 2.53 |
Household Size by Marriage Status in Area Code 774
Out of a total of 652,007 households in Area Code 774, 432,112 (66.3%) are family households, while 219,895 (33.7%) are nonfamily households. The most numerous type of family households are 2-person households, comprising 180,218, and the most common type of nonfamily households are 1-person households, comprising 174,288.
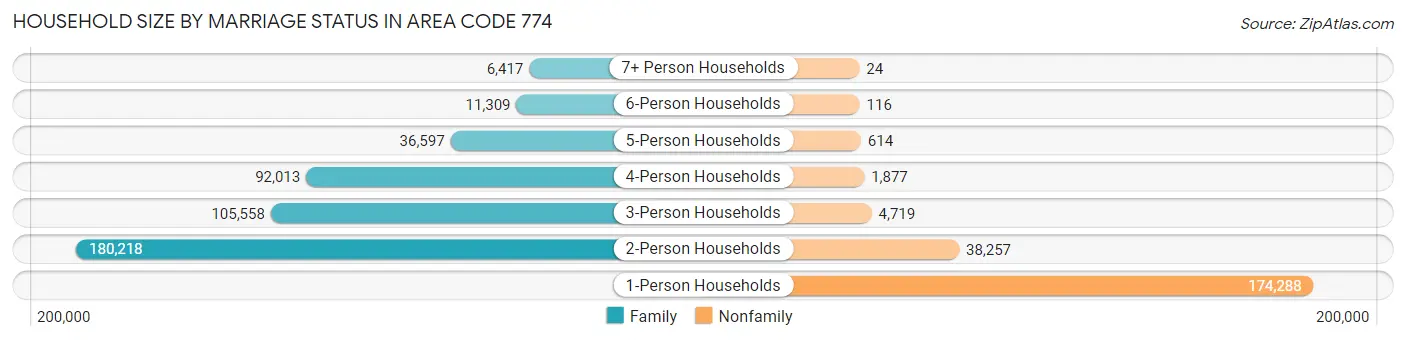
| Household Size | Family Households | Nonfamily Households |
| 1-Person Households | - | 174,288 (26.7%) |
| 2-Person Households | 180,218 (27.6%) | 38,257 (5.9%) |
| 3-Person Households | 105,558 (16.2%) | 4,719 (0.7%) |
| 4-Person Households | 92,013 (14.1%) | 1,877 (0.3%) |
| 5-Person Households | 36,597 (5.6%) | 614 (0.1%) |
| 6-Person Households | 11,309 (1.7%) | 116 (0.0%) |
| 7+ Person Households | 6,417 (1.0%) | 24 (0.0%) |
| Total | 432,112 (66.3%) | 219,895 (33.7%) |
Female Fertility in Area Code 774
Fertility by Age in Area Code 774
Average fertility rate in Area Code 774 is 46.3 births per 1,000 women. Women in the age bracket of 20 to 34 years have the highest fertility rate with 82.8 births per 1,000 women. Women in the age bracket of 20 to 34 years acount for 67.2% of all women with births.
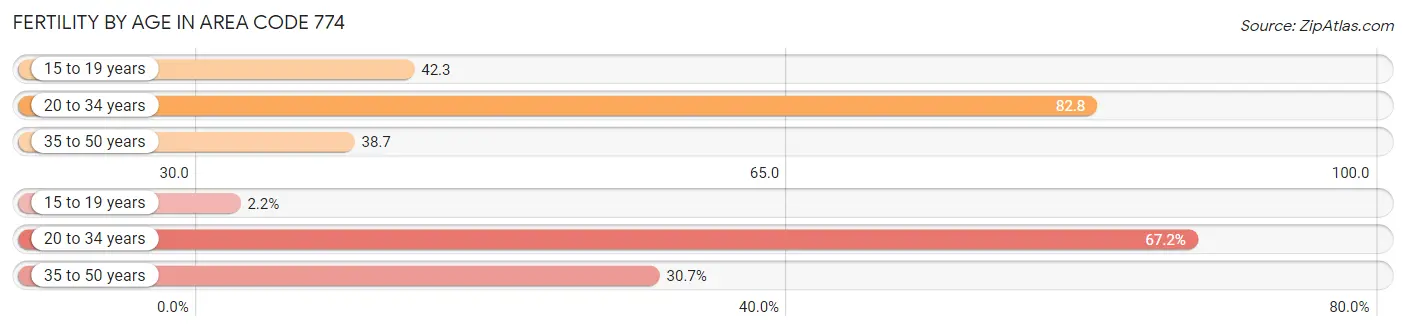
| Age Bracket | Women with Births | Births / 1,000 Women |
| 15 to 19 years | 383 (2.2%) | 42.2 |
| 20 to 34 years | 11,708 (67.2%) | 82.8 |
| 35 to 50 years | 5,343 (30.6%) | 38.7 |
| Total | 17,434 (100.0%) | 46.3 |
Fertility by Age by Marriage Status in Area Code 774
64.0% of women with births (17,434) in Area Code 774 are married. The highest percentage of unmarried women with births falls into 15 to 19 years age bracket with 94.5% of them unmarried at the time of birth, while the lowest percentage of unmarried women with births belong to 35 to 50 years age bracket with 40.3% of them unmarried.
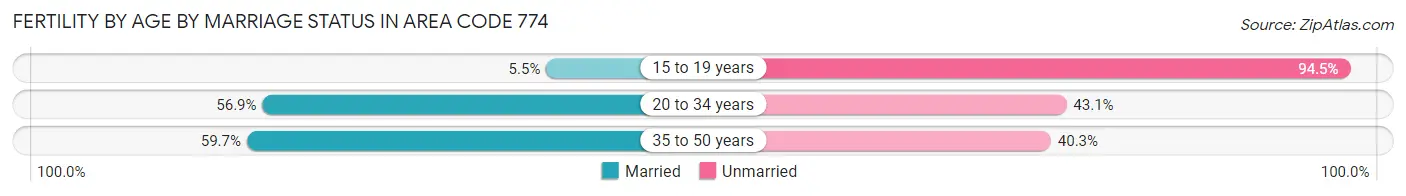
| Age Bracket | Married | Unmarried |
| 15 to 19 years | 21 (5.5%) | 362 (94.5%) |
| 20 to 34 years | 6,664 (56.9%) | 5,044 (43.1%) |
| 35 to 50 years | 3,192 (59.7%) | 2,151 (40.3%) |
| Total | 11,166 (64.0%) | 6,268 (35.9%) |
Fertility by Education in Area Code 774
Average fertility rate in Area Code 774 is 46.3 births per 1,000 women. Women with the education attainment of graduate degree have the highest fertility rate of 90.8 births per 1,000 women, while women with the education attainment of college or associate's degree have the lowest fertility at 57.6 births per 1,000 women. Women with the education attainment of bachelor's degree represent 29.9% of all women with births.
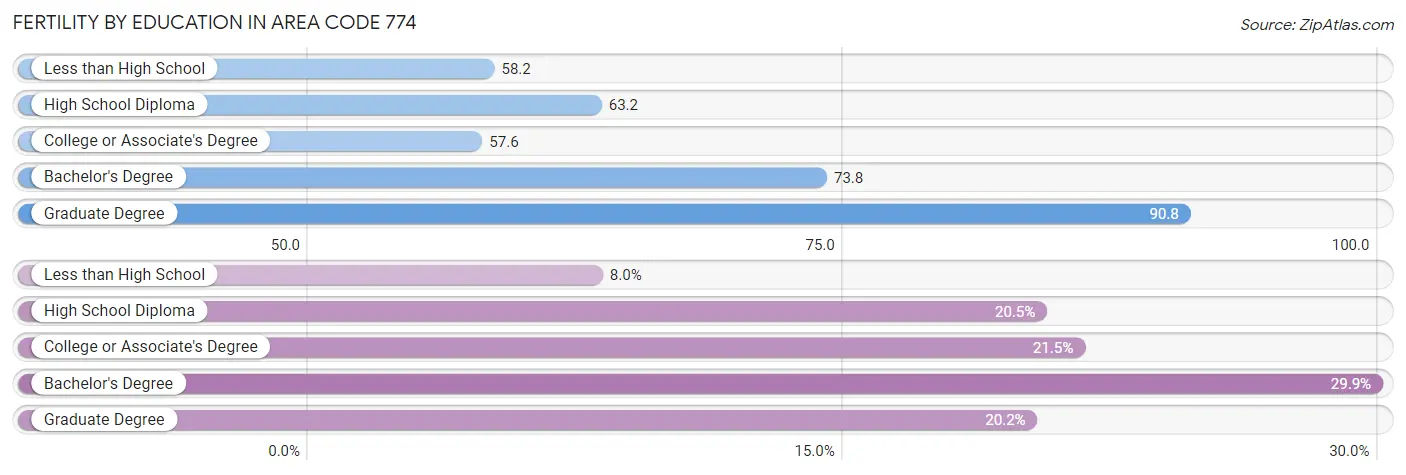
| Educational Attainment | Women with Births | Births / 1,000 Women |
| Less than High School | 1,389 (8.0%) | 58.2 |
| High School Diploma | 3,565 (20.4%) | 63.2 |
| College or Associate's Degree | 3,751 (21.5%) | 57.6 |
| Bachelor's Degree | 5,211 (29.9%) | 73.8 |
| Graduate Degree | 3,518 (20.2%) | 90.8 |
| Total | 17,434 (100.0%) | 46.3 |
Fertility by Education by Marriage Status in Area Code 774
35.9% of women with births in Area Code 774 are unmarried. Women with the educational attainment of bachelor's degree are most likely to be married with 52.7% of them married at childbirth, while women with the educational attainment of less than high school are least likely to be married with 81.2% of them unmarried at childbirth.
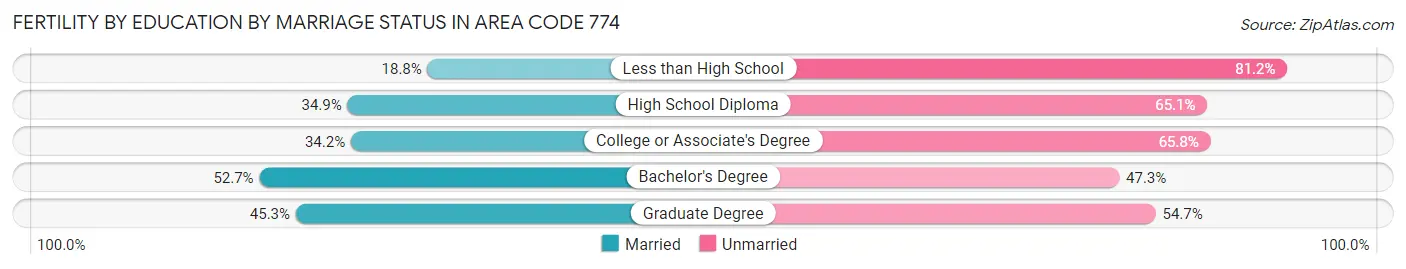
| Educational Attainment | Married | Unmarried |
| Less than High School | 261 (18.8%) | 1,128 (81.2%) |
| High School Diploma | 1,245 (34.9%) | 2,320 (65.1%) |
| College or Associate's Degree | 1,284 (34.2%) | 2,467 (65.8%) |
| Bachelor's Degree | 2,745 (52.7%) | 2,466 (47.3%) |
| Graduate Degree | 1,595 (45.3%) | 1,923 (54.7%) |
| Total | 11,166 (64.0%) | 6,268 (35.9%) |
Employment Characteristics in Area Code 774
Employment by Class of Employer in Area Code 774
Among the 853,022 employed individuals in Area Code 774, private company employees (575,608 | 67.5%), not-for-profit organizations (90,839 | 10.6%), and local government employees (61,758 | 7.2%) make up the most common classes of employment.
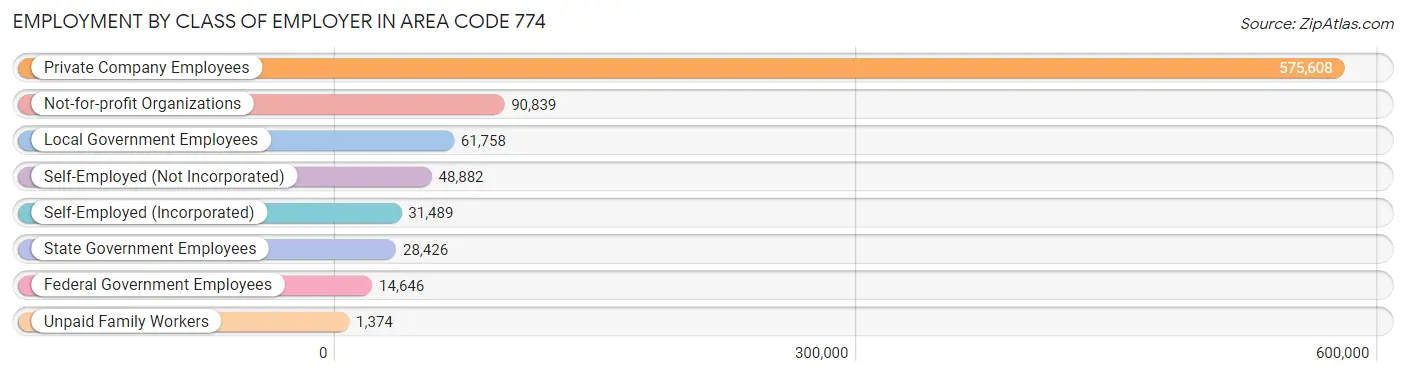
| Employer Class | # Employees | % Employees |
| Private Company Employees | 575,608 | 67.5% |
| Self-Employed (Incorporated) | 31,489 | 3.7% |
| Self-Employed (Not Incorporated) | 48,882 | 5.7% |
| Not-for-profit Organizations | 90,839 | 10.6% |
| Local Government Employees | 61,758 | 7.2% |
| State Government Employees | 28,426 | 3.3% |
| Federal Government Employees | 14,646 | 1.7% |
| Unpaid Family Workers | 1,374 | 0.2% |
| Total | 853,022 | 100.0% |
Employment Status by Age in Area Code 774
According to the labor force statistics for Area Code 774, out of the total population over 16 years of age (1,372,610), 66.3% or 910,040 individuals are in the labor force, with 5.2% or 47,686 of them unemployed. The age group with the highest labor force participation rate is 35 to 44 years, with 87.4% or 182,114 individuals in the labor force. Within the labor force, the 16 to 19 years age range has the highest percentage of unemployed individuals, with 1,587.6% or 624,435 of them being unemployed.
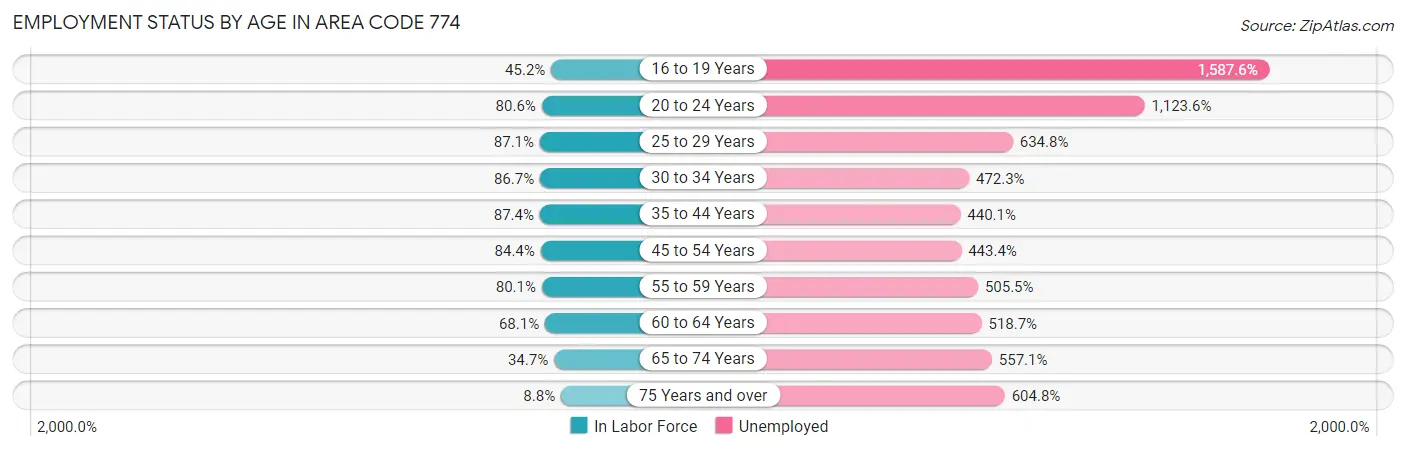
| Age Bracket | In Labor Force | Unemployed |
| 16 to 19 Years | 39,332 (45.2%) | 624,435 (1,587.6%) |
| 20 to 24 Years | 82,904 (80.6%) | 931,566 (1,123.6%) |
| 25 to 29 Years | 87,604 (87.1%) | 556,123 (634.8%) |
| 30 to 34 Years | 95,471 (86.7%) | 450,895 (472.3%) |
| 35 to 44 Years | 182,111 (87.4%) | 801,484 (440.1%) |
| 45 to 54 Years | 190,597 (84.4%) | 845,089 (443.4%) |
| 55 to 59 Years | 99,849 (80.0%) | 504,732 (505.5%) |
| 60 to 64 Years | 79,417 (68.1%) | 411,915 (518.7%) |
| 65 to 74 Years | 60,719 (34.7%) | 338,271 (557.1%) |
| 75 Years and over | 10,689 (8.8%) | 64,623 (604.8%) |
| Total | 910,065 (66.3%) | 47,642 (5.2%) |
Employment Status by Educational Attainment in Area Code 774
According to labor force statistics for Area Code 774, 82.8% of individuals (734,067) out of the total population between 25 and 64 years of age (886,233) are in the labor force, with 473.8% or 3,478,009 of them being unemployed. The group with the highest labor force participation rate are those with the educational attainment of bachelor's degree or higher, with 88.8% or 357,093 individuals in the labor force. Within the labor force, individuals with less than high school education have the highest percentage of unemployment, with 759.7% or 340,095 of them being unemployed.
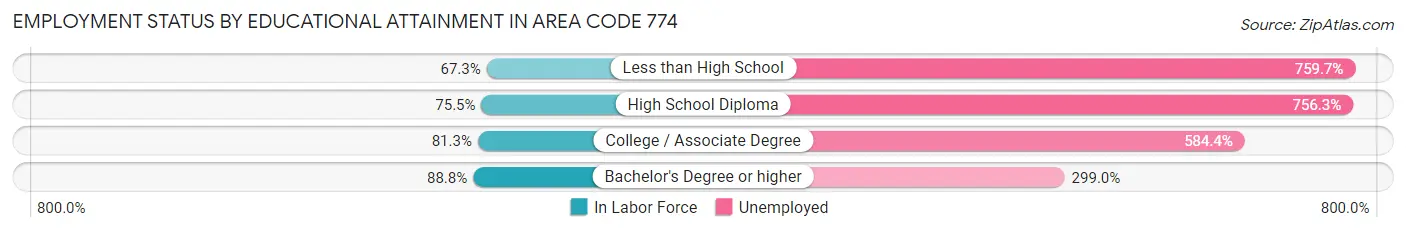
| Educational Attainment | In Labor Force | Unemployed |
| Less than High School | 44,768 (67.3%) | 505,261 (759.7%) |
| High School Diploma | 157,382 (75.5%) | 1,575,668 (756.3%) |
| College / Associate Degree | 169,941 (81.3%) | 1,221,823 (584.4%) |
| Bachelor's Degree or higher | 357,085 (88.8%) | 1,202,916 (299.0%) |
| Total | 734,086 (82.8%) | 4,198,972 (473.8%) |
Employment Occupations by Sex in Area Code 774
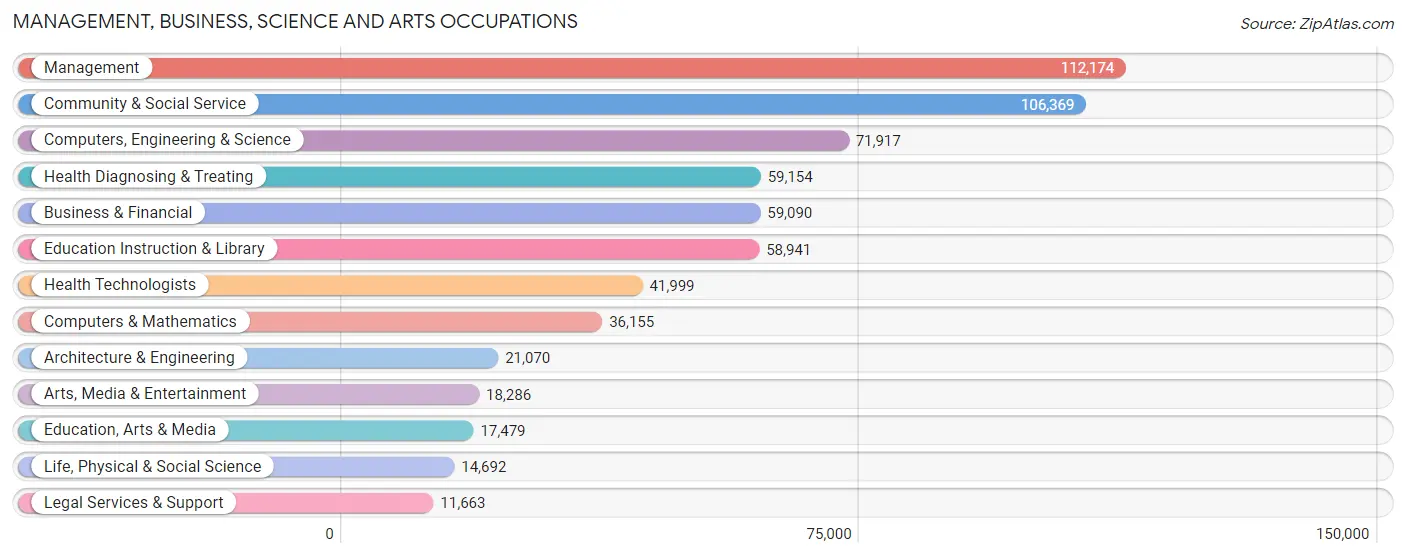
Management, Business, Science and Arts Occupations
The most common Management, Business, Science and Arts occupations in Area Code 774 are Management (112,174 | 12.9%), Community & Social Service (106,369 | 12.2%), Computers, Engineering & Science (71,917 | 8.3%), Health Diagnosing & Treating (59,154 | 6.8%), and Business & Financial (59,090 | 6.8%).
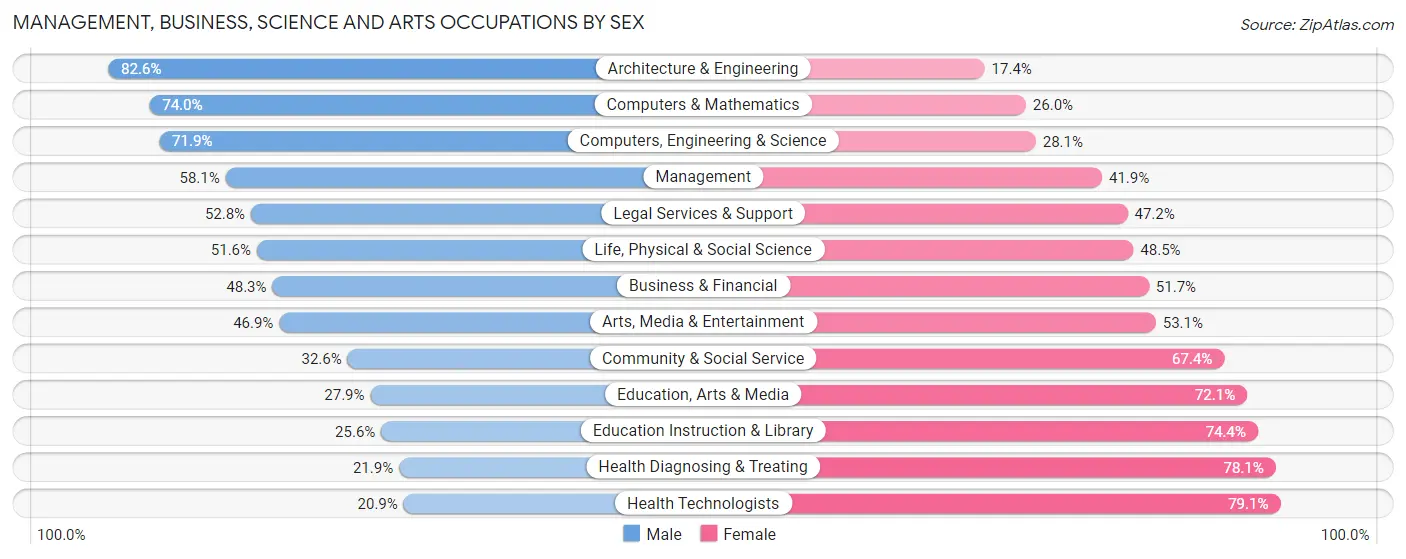
Management, Business, Science and Arts Occupations by Sex
Within the Management, Business, Science and Arts occupations in Area Code 774, the most male-oriented occupations are Architecture & Engineering (82.6%), Computers & Mathematics (74.0%), and Computers, Engineering & Science (71.9%), while the most female-oriented occupations are Health Technologists (79.1%), Health Diagnosing & Treating (78.1%), and Education Instruction & Library (74.4%).
| Occupation | Male | Female |
| Management | 65,157 (58.1%) | 47,017 (41.9%) |
| Business & Financial | 28,553 (48.3%) | 30,537 (51.7%) |
| Computers, Engineering & Science | 51,721 (71.9%) | 20,196 (28.1%) |
| Computers & Mathematics | 26,748 (74.0%) | 9,407 (26.0%) |
| Architecture & Engineering | 17,400 (82.6%) | 3,670 (17.4%) |
| Life, Physical & Social Science | 7,573 (51.5%) | 7,119 (48.4%) |
| Community & Social Service | 34,706 (32.6%) | 71,663 (67.4%) |
| Education, Arts & Media | 4,872 (27.9%) | 12,607 (72.1%) |
| Legal Services & Support | 6,156 (52.8%) | 5,507 (47.2%) |
| Education Instruction & Library | 15,103 (25.6%) | 43,838 (74.4%) |
| Arts, Media & Entertainment | 8,575 (46.9%) | 9,711 (53.1%) |
| Health Diagnosing & Treating | 12,953 (21.9%) | 46,201 (78.1%) |
| Health Technologists | 8,791 (20.9%) | 33,208 (79.1%) |
| Total (Category) | 193,090 (47.2%) | 215,614 (52.8%) |
| Total (Overall) | 451,280 (51.7%) | 420,886 (48.3%) |
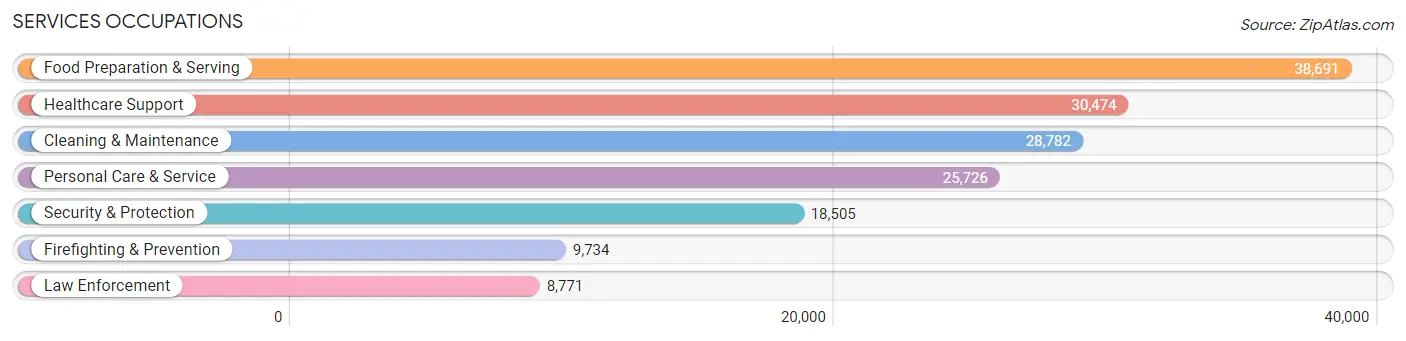
Services Occupations
The most common Services occupations in Area Code 774 are Food Preparation & Serving (38,691 | 4.4%), Healthcare Support (30,474 | 3.5%), Cleaning & Maintenance (28,782 | 3.3%), Personal Care & Service (25,726 | 2.9%), and Security & Protection (18,505 | 2.1%).
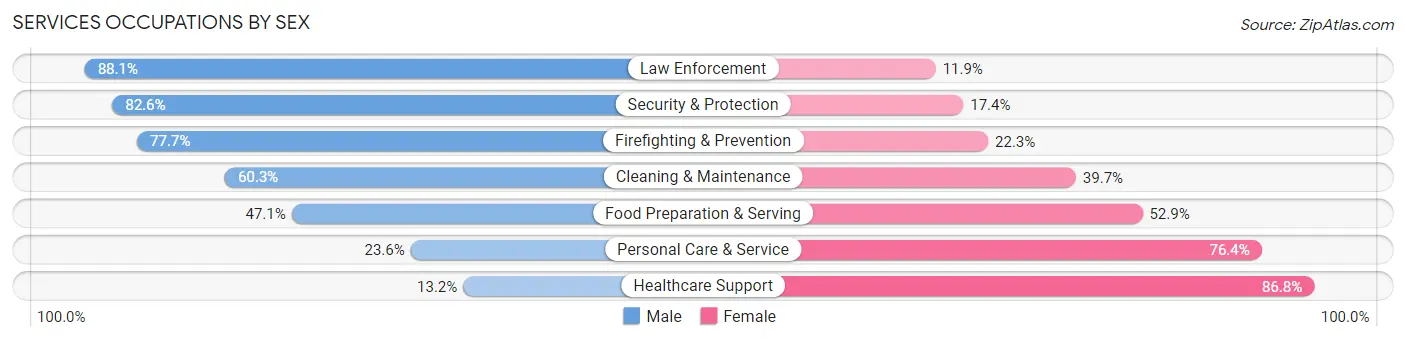
Services Occupations by Sex
Within the Services occupations in Area Code 774, the most male-oriented occupations are Law Enforcement (88.1%), Security & Protection (82.6%), and Firefighting & Prevention (77.7%), while the most female-oriented occupations are Healthcare Support (86.8%), Personal Care & Service (76.4%), and Food Preparation & Serving (52.9%).
| Occupation | Male | Female |
| Healthcare Support | 4,012 (13.2%) | 26,462 (86.8%) |
| Security & Protection | 15,290 (82.6%) | 3,215 (17.4%) |
| Firefighting & Prevention | 7,564 (77.7%) | 2,170 (22.3%) |
| Law Enforcement | 7,726 (88.1%) | 1,045 (11.9%) |
| Food Preparation & Serving | 18,239 (47.1%) | 20,452 (52.9%) |
| Cleaning & Maintenance | 17,361 (60.3%) | 11,421 (39.7%) |
| Personal Care & Service | 6,064 (23.6%) | 19,662 (76.4%) |
| Total (Category) | 60,966 (42.9%) | 81,212 (57.1%) |
| Total (Overall) | 451,280 (51.7%) | 420,886 (48.3%) |
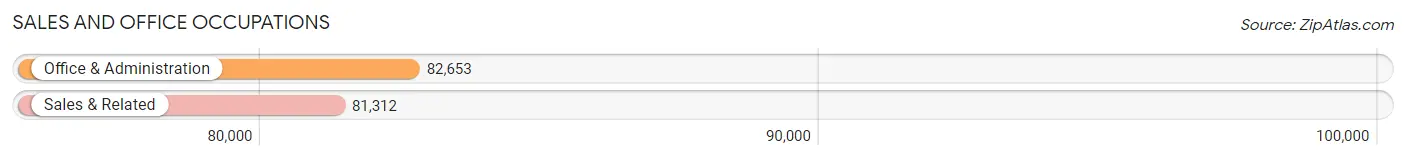
Sales and Office Occupations
The most common Sales and Office occupations in Area Code 774 are Office & Administration (82,653 | 9.5%), and Sales & Related (81,312 | 9.3%).
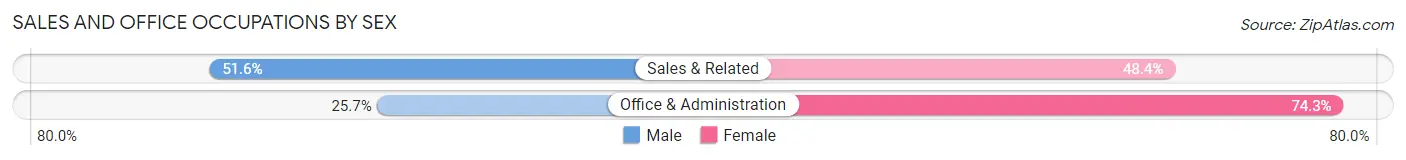
Sales and Office Occupations by Sex
| Occupation | Male | Female |
| Sales & Related | 41,952 (51.6%) | 39,360 (48.4%) |
| Office & Administration | 21,253 (25.7%) | 61,400 (74.3%) |
| Total (Category) | 63,205 (38.6%) | 100,760 (61.5%) |
| Total (Overall) | 451,280 (51.7%) | 420,886 (48.3%) |
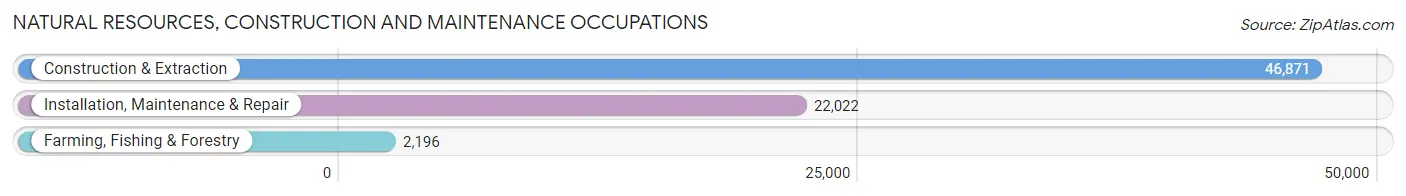
Natural Resources, Construction and Maintenance Occupations
The most common Natural Resources, Construction and Maintenance occupations in Area Code 774 are Construction & Extraction (46,871 | 5.4%), Installation, Maintenance & Repair (22,022 | 2.5%), and Farming, Fishing & Forestry (2,196 | 0.3%).
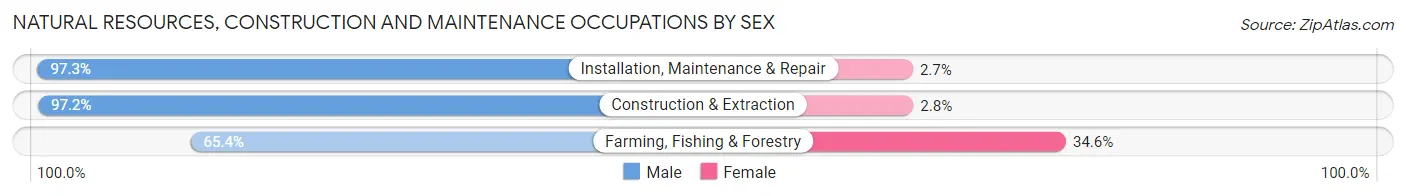
Natural Resources, Construction and Maintenance Occupations by Sex
| Occupation | Male | Female |
| Farming, Fishing & Forestry | 1,437 (65.4%) | 759 (34.6%) |
| Construction & Extraction | 45,554 (97.2%) | 1,317 (2.8%) |
| Installation, Maintenance & Repair | 21,422 (97.3%) | 600 (2.7%) |
| Total (Category) | 68,413 (96.2%) | 2,676 (3.8%) |
| Total (Overall) | 451,280 (51.7%) | 420,886 (48.3%) |
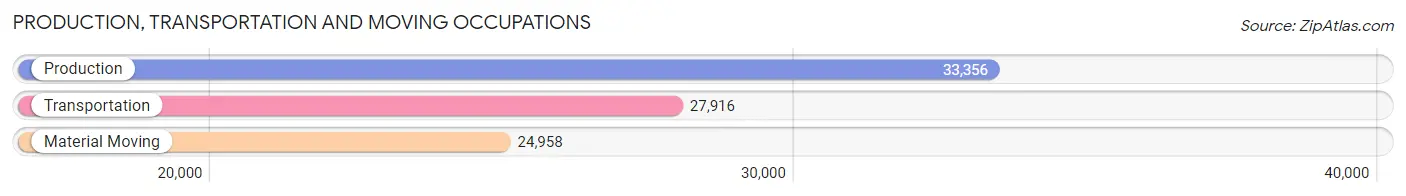
Production, Transportation and Moving Occupations
The most common Production, Transportation and Moving occupations in Area Code 774 are Production (33,356 | 3.8%), Transportation (27,916 | 3.2%), and Material Moving (24,958 | 2.9%).
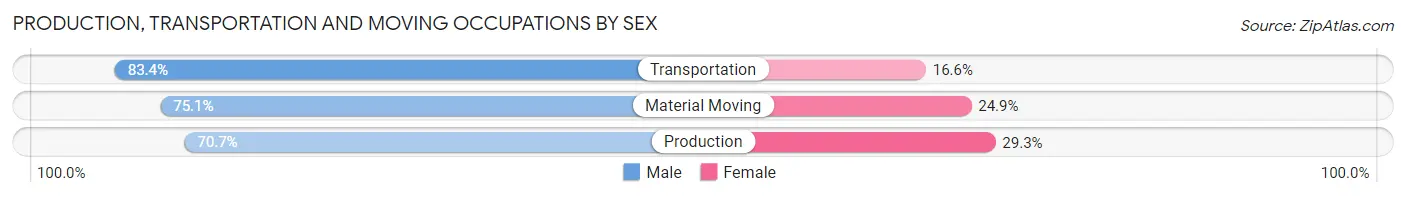
Production, Transportation and Moving Occupations by Sex
| Occupation | Male | Female |
| Production | 23,572 (70.7%) | 9,784 (29.3%) |
| Transportation | 23,292 (83.4%) | 4,624 (16.6%) |
| Material Moving | 18,742 (75.1%) | 6,216 (24.9%) |
| Total (Category) | 65,606 (76.1%) | 20,624 (23.9%) |
| Total (Overall) | 451,280 (51.7%) | 420,886 (48.3%) |
Employment Industries by Sex in Area Code 774
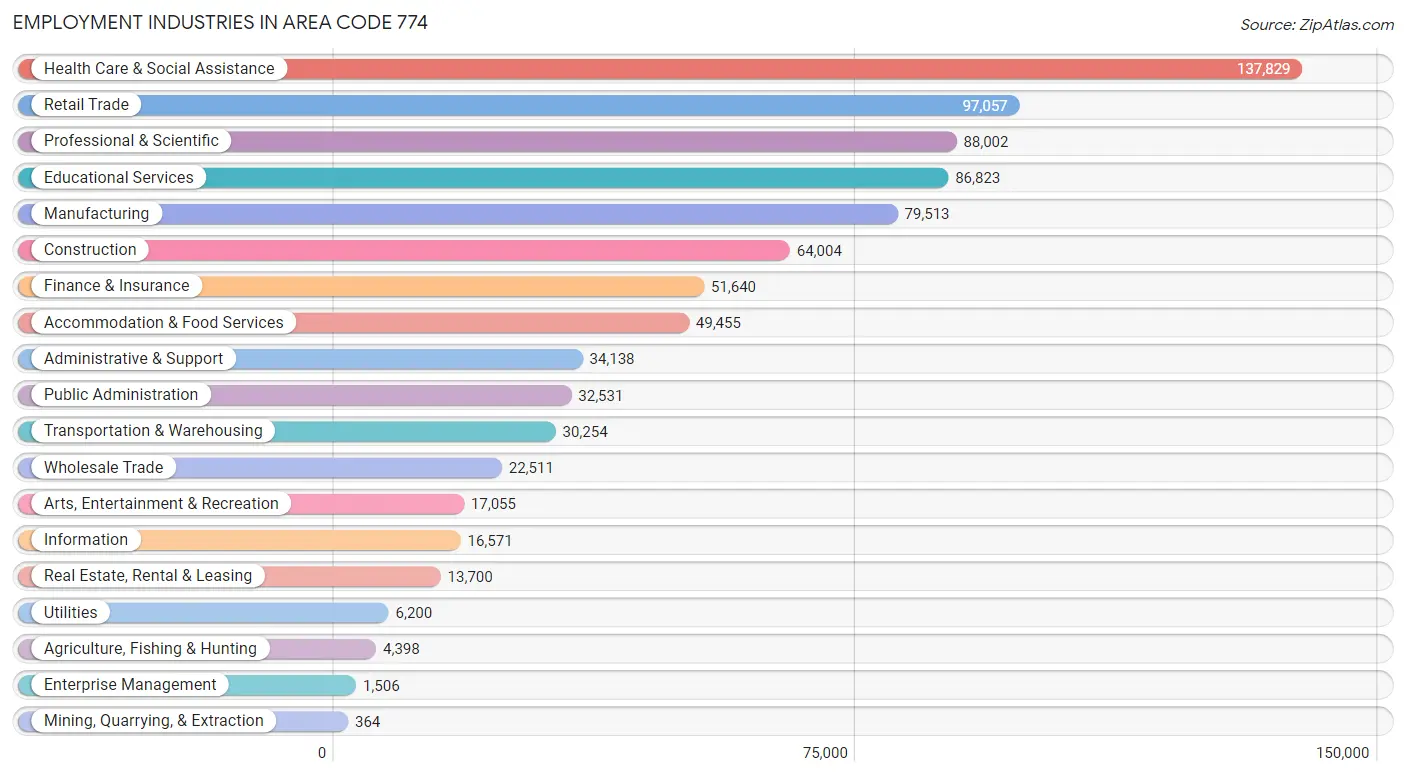
Employment Industries in Area Code 774
The major employment industries in Area Code 774 include Health Care & Social Assistance (137,829 | 15.8%), Retail Trade (97,057 | 11.1%), Professional & Scientific (88,002 | 10.1%), Educational Services (86,823 | 10.0%), and Manufacturing (79,513 | 9.1%).
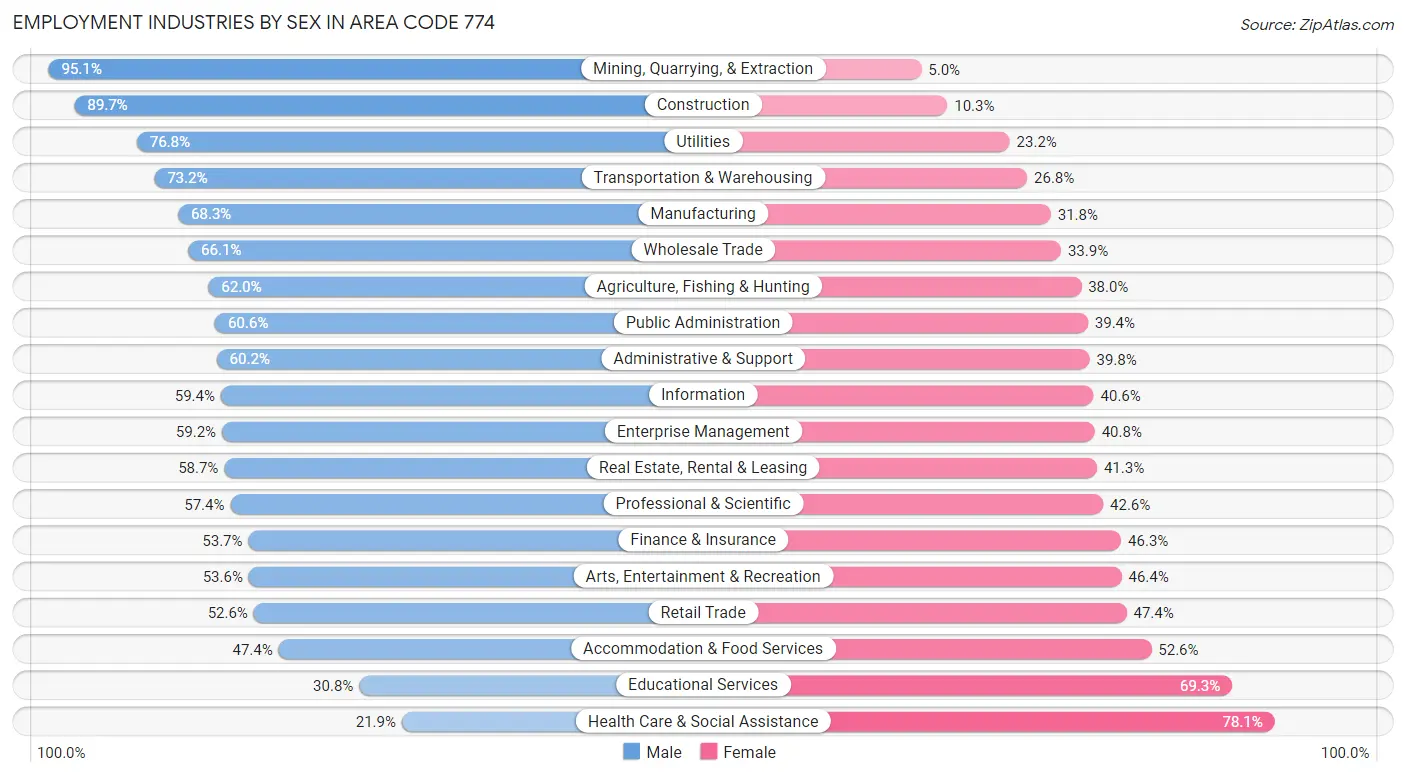
Employment Industries by Sex in Area Code 774
The Area Code 774 industries that see more men than women are Mining, Quarrying, & Extraction (95.1%), Construction (89.7%), and Utilities (76.8%), whereas the industries that tend to have a higher number of women are Health Care & Social Assistance (78.1%), Educational Services (69.3%), and Accommodation & Food Services (52.6%).
| Industry | Male | Female |
| Agriculture, Fishing & Hunting | 2,725 (62.0%) | 1,673 (38.0%) |
| Mining, Quarrying, & Extraction | 346 (95.1%) | 18 (5.0%) |
| Construction | 57,399 (89.7%) | 6,605 (10.3%) |
| Manufacturing | 54,266 (68.2%) | 25,247 (31.8%) |
| Wholesale Trade | 14,889 (66.1%) | 7,622 (33.9%) |
| Retail Trade | 51,030 (52.6%) | 46,027 (47.4%) |
| Transportation & Warehousing | 22,133 (73.2%) | 8,121 (26.8%) |
| Utilities | 4,760 (76.8%) | 1,440 (23.2%) |
| Information | 9,842 (59.4%) | 6,729 (40.6%) |
| Finance & Insurance | 27,726 (53.7%) | 23,914 (46.3%) |
| Real Estate, Rental & Leasing | 8,041 (58.7%) | 5,659 (41.3%) |
| Professional & Scientific | 50,532 (57.4%) | 37,470 (42.6%) |
| Enterprise Management | 891 (59.2%) | 615 (40.8%) |
| Administrative & Support | 20,565 (60.2%) | 13,573 (39.8%) |
| Educational Services | 26,696 (30.7%) | 60,127 (69.3%) |
| Health Care & Social Assistance | 30,206 (21.9%) | 107,623 (78.1%) |
| Arts, Entertainment & Recreation | 9,143 (53.6%) | 7,912 (46.4%) |
| Accommodation & Food Services | 23,461 (47.4%) | 25,994 (52.6%) |
| Public Administration | 19,708 (60.6%) | 12,823 (39.4%) |
| Total | 451,280 (51.7%) | 420,886 (48.3%) |
Education in Area Code 774
School Enrollment in Area Code 774
The most common levels of schooling among the 393,720 students in Area Code 774 are high school (90,234 | 22.9%), middle school (82,457 | 20.9%), and college / undergraduate (79,154 | 20.1%).
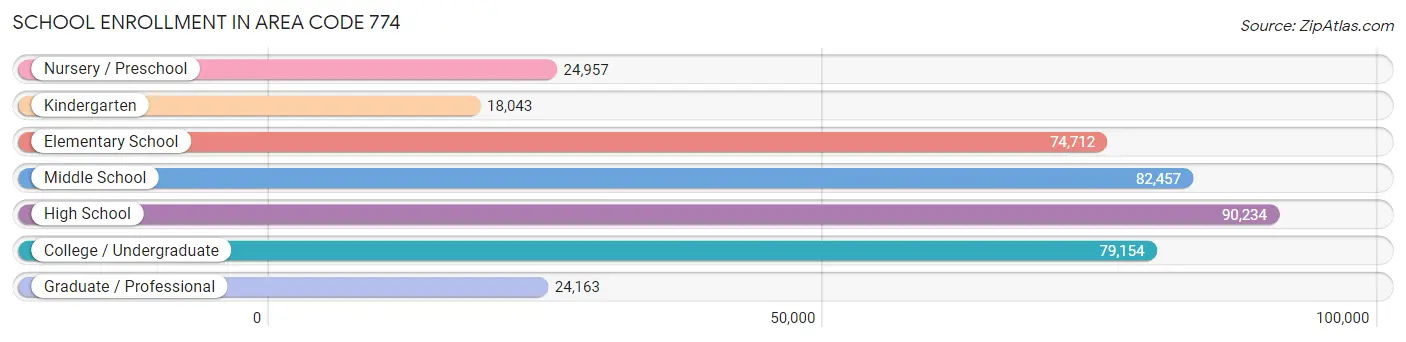
| School Level | # Students | % Students |
| Nursery / Preschool | 24,957 | 6.3% |
| Kindergarten | 18,043 | 4.6% |
| Elementary School | 74,712 | 19.0% |
| Middle School | 82,457 | 20.9% |
| High School | 90,234 | 22.9% |
| College / Undergraduate | 79,154 | 20.1% |
| Graduate / Professional | 24,163 | 6.1% |
| Total | 393,720 | 100.0% |
School Enrollment by Age by Funding Source in Area Code 774
Out of a total of 393,720 students who are enrolled in schools in Area Code 774, 87,326 (22.2%) attend a private institution, while the remaining 306,394 (77.8%) are enrolled in public schools. The age group of 3 to 4 year olds has the highest likelihood of being enrolled in private schools, with 10,276 (53.8% in the age bracket) enrolled. Conversely, the age group of 10 to 14 year olds has the lowest likelihood of being enrolled in a private school, with 94,401 (91.8% in the age bracket) attending a public institution.
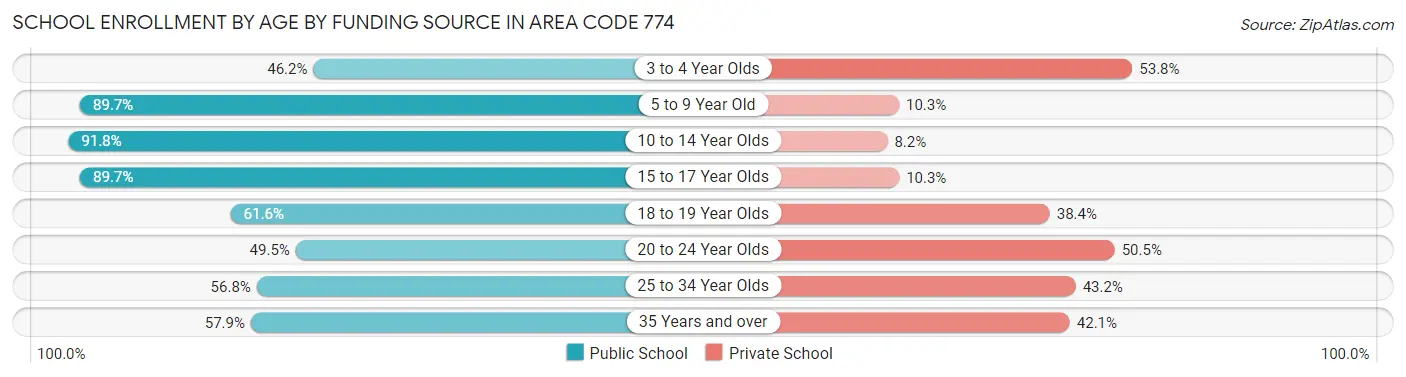
| Age Bracket | Public School | Private School |
| 3 to 4 Year Olds | 8,834 (46.2%) | 10,276 (53.8%) |
| 5 to 9 Year Old | 78,947 (89.7%) | 9,074 (10.3%) |
| 10 to 14 Year Olds | 94,401 (91.8%) | 8,393 (8.2%) |
| 15 to 17 Year Olds | 57,595 (89.7%) | 6,639 (10.3%) |
| 18 to 19 Year Olds | 21,284 (61.6%) | 13,263 (38.4%) |
| 20 to 24 Year Olds | 21,524 (49.5%) | 21,952 (50.5%) |
| 25 to 34 Year Olds | 12,333 (56.8%) | 9,389 (43.2%) |
| 35 Years and over | 11,467 (57.9%) | 8,349 (42.1%) |
| Total | 306,394 (77.8%) | 87,326 (22.2%) |
Educational Attainment by Field of Study in Area Code 774
Business (103,465 | 18.8%), social sciences (53,739 | 9.8%), education (51,860 | 9.4%), science & technology (50,128 | 9.1%), and engineering (46,282 | 8.4%) are the most common fields of study among 550,750 individuals in Area Code 774 who have obtained a bachelor's degree or higher.
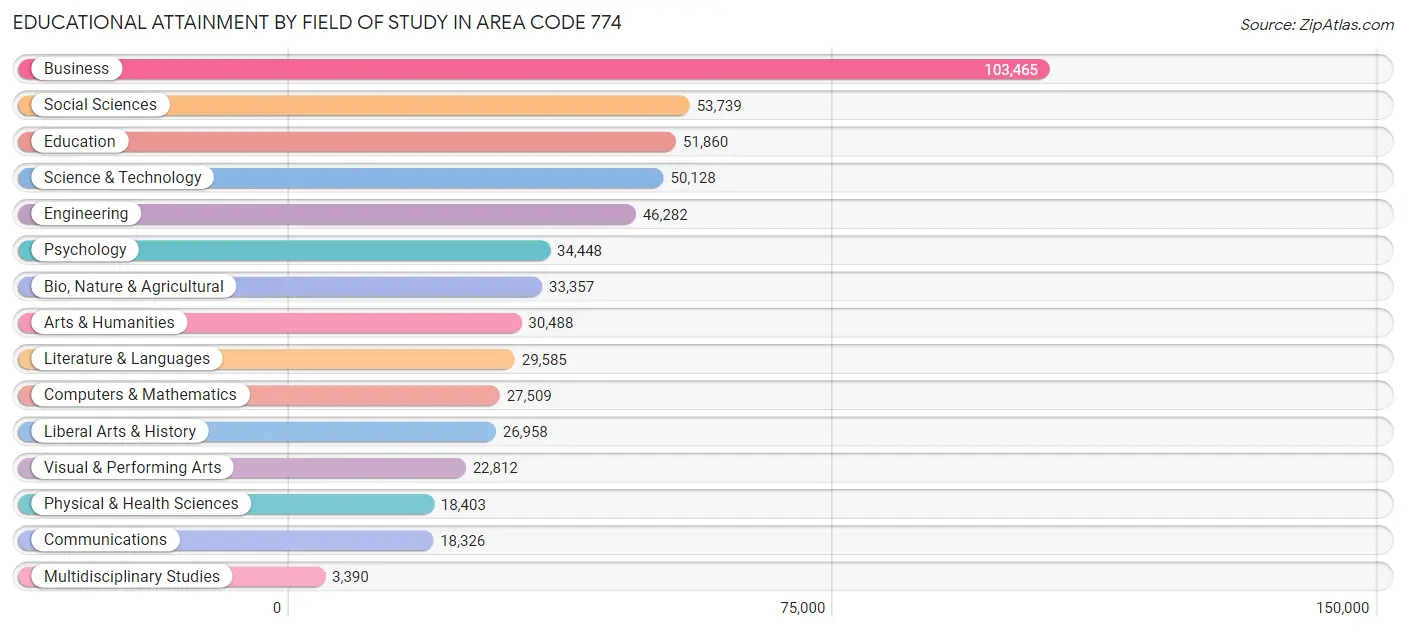
| Field of Study | # Graduates | % Graduates |
| Computers & Mathematics | 27,509 | 5.0% |
| Bio, Nature & Agricultural | 33,357 | 6.1% |
| Physical & Health Sciences | 18,403 | 3.3% |
| Psychology | 34,448 | 6.2% |
| Social Sciences | 53,739 | 9.8% |
| Engineering | 46,282 | 8.4% |
| Multidisciplinary Studies | 3,390 | 0.6% |
| Science & Technology | 50,128 | 9.1% |
| Business | 103,465 | 18.8% |
| Education | 51,860 | 9.4% |
| Literature & Languages | 29,585 | 5.4% |
| Liberal Arts & History | 26,958 | 4.9% |
| Visual & Performing Arts | 22,812 | 4.1% |
| Communications | 18,326 | 3.3% |
| Arts & Humanities | 30,488 | 5.5% |
| Total | 550,750 | 100.0% |
Transportation & Commute in Area Code 774
Vehicle Availability by Sex in Area Code 774
The most prevalent vehicle ownership categories in Area Code 774 are males with 2 vehicles (192,420, accounting for 43.7%) and females with 2 vehicles (173,202, making up 47.5%).
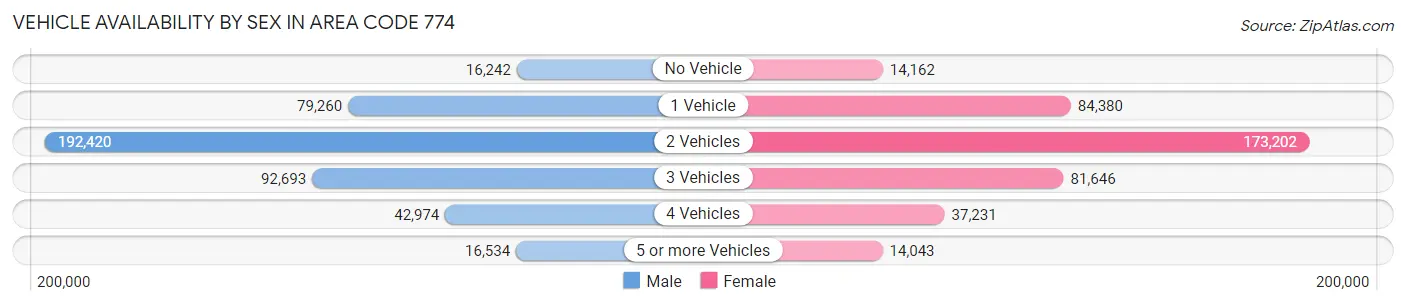
| Vehicles Available | Male | Female |
| No Vehicle | 16,242 (3.7%) | 14,162 (3.5%) |
| 1 Vehicle | 79,260 (18.0%) | 84,380 (20.8%) |
| 2 Vehicles | 192,420 (43.7%) | 173,202 (42.8%) |
| 3 Vehicles | 92,693 (21.1%) | 81,646 (20.2%) |
| 4 Vehicles | 42,974 (9.8%) | 37,231 (9.2%) |
| 5 or more Vehicles | 16,534 (3.8%) | 14,043 (3.5%) |
| Total | 440,123 (100.0%) | 404,664 (100.0%) |
Commute Time in Area Code 774
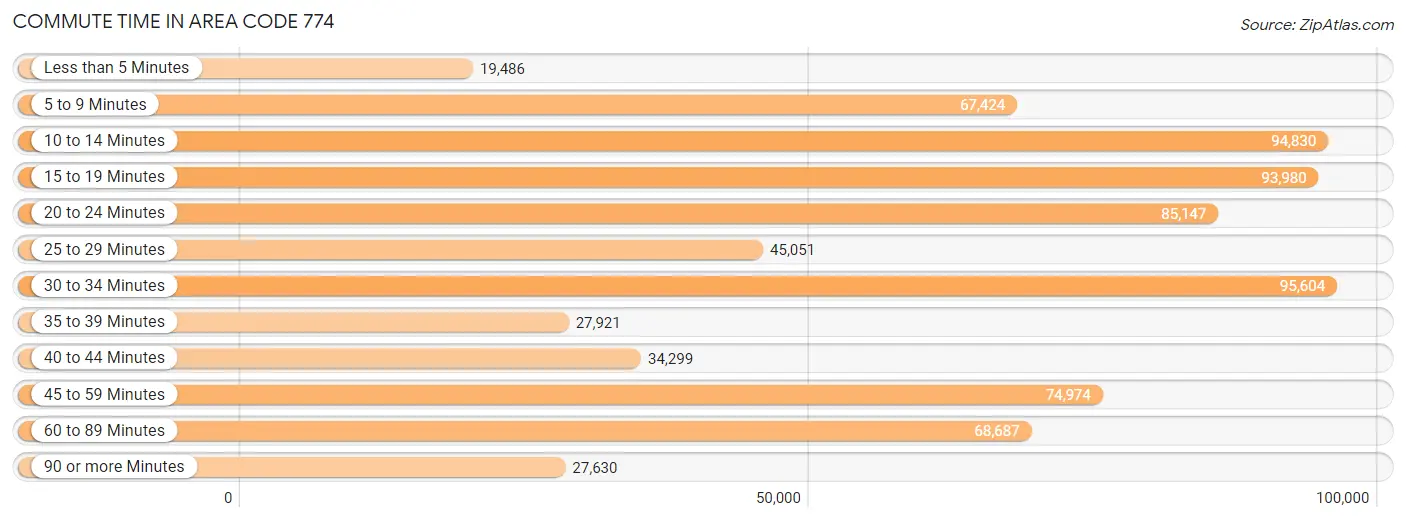
The most frequently occuring commute durations in Area Code 774 are 30 to 34 minutes (95,604 commuters, 13.0%), 10 to 14 minutes (94,830 commuters, 12.9%), and 15 to 19 minutes (93,980 commuters, 12.8%).
| Commute Time | # Commuters | % Commuters |
| Less than 5 Minutes | 19,486 | 2.6% |
| 5 to 9 Minutes | 67,424 | 9.2% |
| 10 to 14 Minutes | 94,830 | 12.9% |
| 15 to 19 Minutes | 93,980 | 12.8% |
| 20 to 24 Minutes | 85,147 | 11.6% |
| 25 to 29 Minutes | 45,051 | 6.1% |
| 30 to 34 Minutes | 95,604 | 13.0% |
| 35 to 39 Minutes | 27,921 | 3.8% |
| 40 to 44 Minutes | 34,299 | 4.7% |
| 45 to 59 Minutes | 74,974 | 10.2% |
| 60 to 89 Minutes | 68,687 | 9.3% |
| 90 or more Minutes | 27,630 | 3.8% |
Commute Time by Sex in Area Code 774
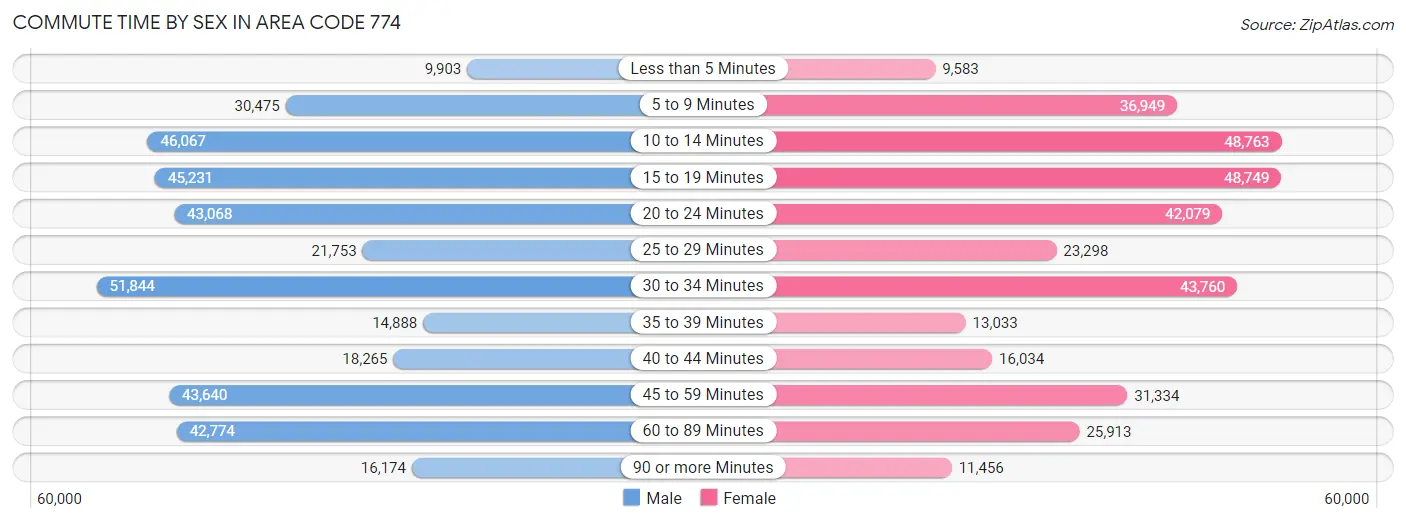
The most common commute times in Area Code 774 are 30 to 34 minutes (51,844 commuters, 13.5%) for males and 10 to 14 minutes (48,763 commuters, 13.9%) for females.
| Commute Time | Male | Female |
| Less than 5 Minutes | 9,903 (2.6%) | 9,583 (2.7%) |
| 5 to 9 Minutes | 30,475 (7.9%) | 36,949 (10.5%) |
| 10 to 14 Minutes | 46,067 (12.0%) | 48,763 (13.9%) |
| 15 to 19 Minutes | 45,231 (11.8%) | 48,749 (13.9%) |
| 20 to 24 Minutes | 43,068 (11.2%) | 42,079 (12.0%) |
| 25 to 29 Minutes | 21,753 (5.7%) | 23,298 (6.6%) |
| 30 to 34 Minutes | 51,844 (13.5%) | 43,760 (12.5%) |
| 35 to 39 Minutes | 14,888 (3.9%) | 13,033 (3.7%) |
| 40 to 44 Minutes | 18,265 (4.8%) | 16,034 (4.6%) |
| 45 to 59 Minutes | 43,640 (11.4%) | 31,334 (8.9%) |
| 60 to 89 Minutes | 42,774 (11.1%) | 25,913 (7.4%) |
| 90 or more Minutes | 16,174 (4.2%) | 11,456 (3.3%) |
Time of Departure to Work by Sex in Area Code 774
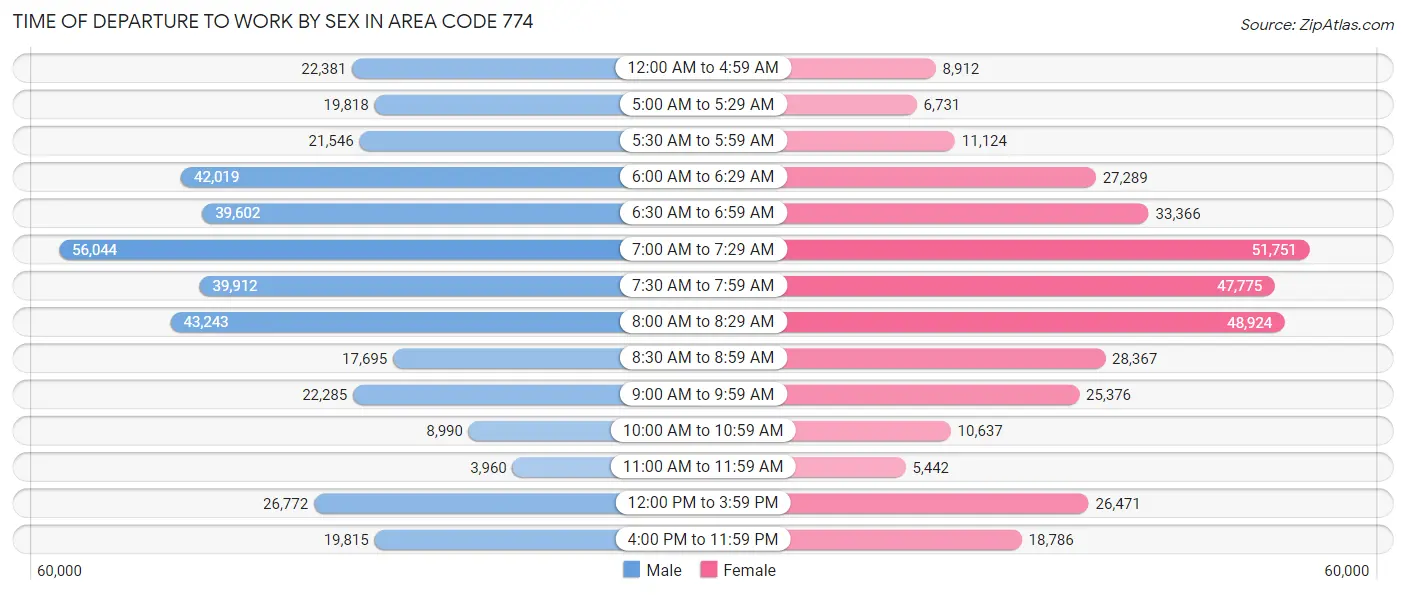
The most frequent times of departure to work in Area Code 774 are 7:00 AM to 7:29 AM (56,044, 14.6%) for males and 7:00 AM to 7:29 AM (51,751, 14.7%) for females.
| Time of Departure | Male | Female |
| 12:00 AM to 4:59 AM | 22,381 (5.8%) | 8,912 (2.5%) |
| 5:00 AM to 5:29 AM | 19,818 (5.2%) | 6,731 (1.9%) |
| 5:30 AM to 5:59 AM | 21,546 (5.6%) | 11,124 (3.2%) |
| 6:00 AM to 6:29 AM | 42,019 (10.9%) | 27,289 (7.8%) |
| 6:30 AM to 6:59 AM | 39,602 (10.3%) | 33,366 (9.5%) |
| 7:00 AM to 7:29 AM | 56,044 (14.6%) | 51,751 (14.7%) |
| 7:30 AM to 7:59 AM | 39,912 (10.4%) | 47,775 (13.6%) |
| 8:00 AM to 8:29 AM | 43,243 (11.3%) | 48,924 (13.9%) |
| 8:30 AM to 8:59 AM | 17,695 (4.6%) | 28,367 (8.1%) |
| 9:00 AM to 9:59 AM | 22,285 (5.8%) | 25,376 (7.2%) |
| 10:00 AM to 10:59 AM | 8,990 (2.3%) | 10,637 (3.0%) |
| 11:00 AM to 11:59 AM | 3,960 (1.0%) | 5,442 (1.5%) |
| 12:00 PM to 3:59 PM | 26,772 (7.0%) | 26,471 (7.5%) |
| 4:00 PM to 11:59 PM | 19,815 (5.2%) | 18,786 (5.3%) |
| Total | 384,082 (100.0%) | 350,951 (100.0%) |
Housing Occupancy in Area Code 774
Occupancy by Ownership in Area Code 774
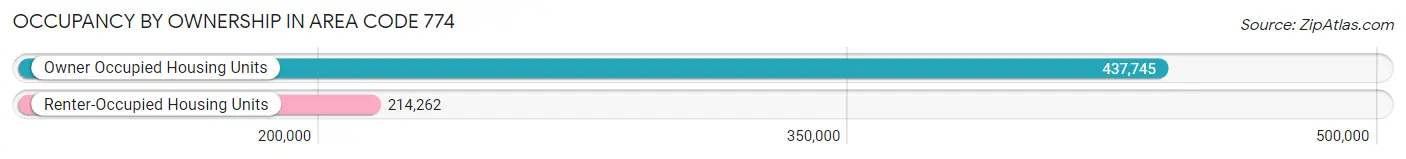
Of the total 652,007 dwellings in Area Code 774, owner-occupied units account for 437,745 (67.1%), while renter-occupied units make up 214,262 (32.9%).
| Occupancy | # Housing Units | % Housing Units |
| Owner Occupied Housing Units | 437,745 | 67.1% |
| Renter-Occupied Housing Units | 214,262 | 32.9% |
| Total Occupied Housing Units | 652,007 | 100.0% |
Occupancy by Household Size in Area Code 774
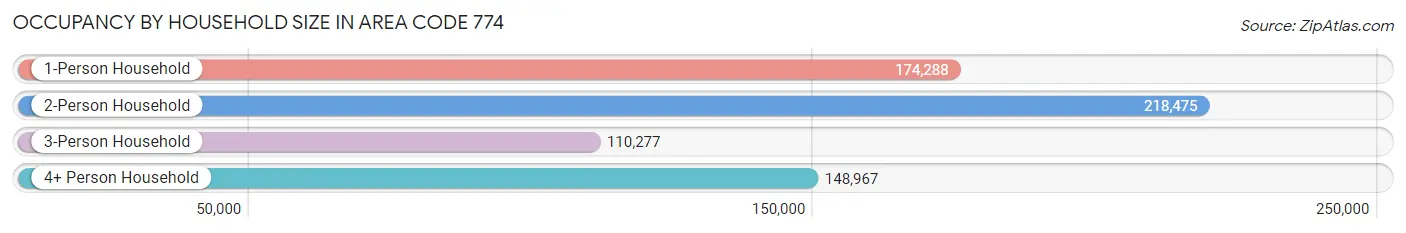
| Household Size | # Housing Units | % Housing Units |
| 1-Person Household | 174,288 | 26.7% |
| 2-Person Household | 218,475 | 33.5% |
| 3-Person Household | 110,277 | 16.9% |
| 4+ Person Household | 148,967 | 22.9% |
| Total Housing Units | 652,007 | 100.0% |
Occupancy by Ownership by Household Size in Area Code 774
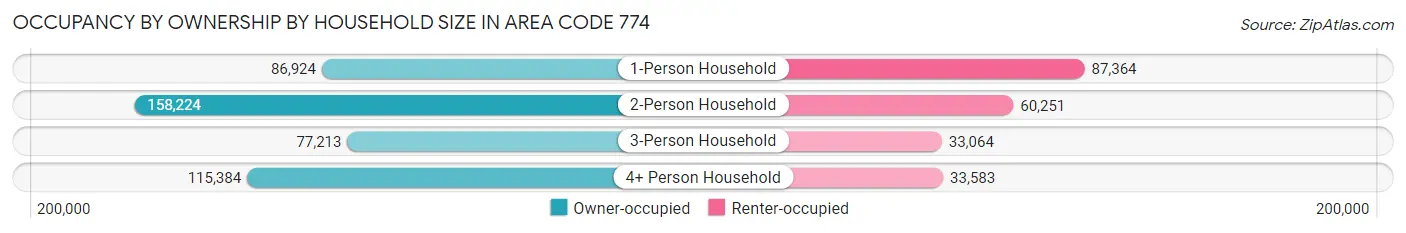
| Household Size | Owner-occupied | Renter-occupied |
| 1-Person Household | 86,924 (49.9%) | 87,364 (50.1%) |
| 2-Person Household | 158,224 (72.4%) | 60,251 (27.6%) |
| 3-Person Household | 77,213 (70.0%) | 33,064 (30.0%) |
| 4+ Person Household | 115,384 (77.5%) | 33,583 (22.5%) |
| Total Housing Units | 437,745 (67.1%) | 214,262 (32.9%) |
Occupancy by Educational Attainment in Area Code 774
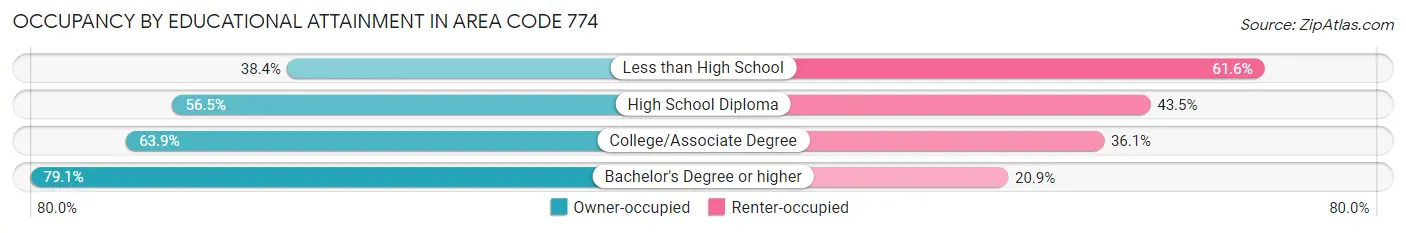
| Household Size | Owner-occupied | Renter-occupied |
| Less than High School | 19,663 (38.4%) | 31,548 (61.6%) |
| High School Diploma | 79,858 (56.5%) | 61,444 (43.5%) |
| College/Associate Degree | 105,653 (63.9%) | 59,755 (36.1%) |
| Bachelor's Degree or higher | 232,571 (79.1%) | 61,515 (20.9%) |
Occupancy by Age of Householder in Area Code 774
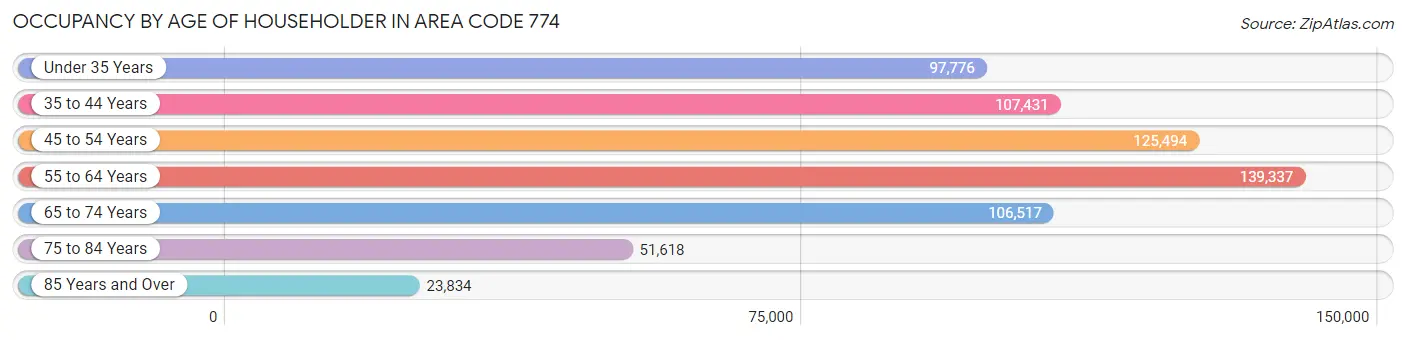
| Age Bracket | # Households | % Households |
| Under 35 Years | 97,776 | 15.0% |
| 35 to 44 Years | 107,431 | 16.5% |
| 45 to 54 Years | 125,494 | 19.3% |
| 55 to 64 Years | 139,337 | 21.4% |
| 65 to 74 Years | 106,517 | 16.3% |
| 75 to 84 Years | 51,618 | 7.9% |
| 85 Years and Over | 23,834 | 3.7% |
| Total | 652,007 | 100.0% |
Housing Finances in Area Code 774
Median Income by Occupancy in Area Code 774
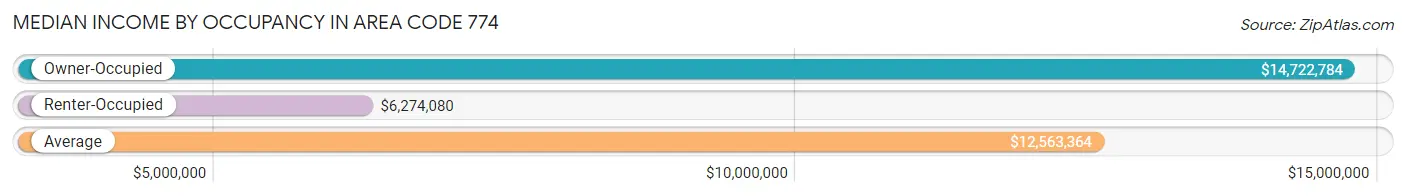
| Occupancy Type | # Households | Median Income |
| Owner-Occupied | 437,745 (67.1%) | $14,722,784 |
| Renter-Occupied | 214,262 (32.9%) | $6,274,080 |
| Average | 652,007 (100.0%) | $12,563,364 |
Occupancy by Householder Income Bracket in Area Code 774
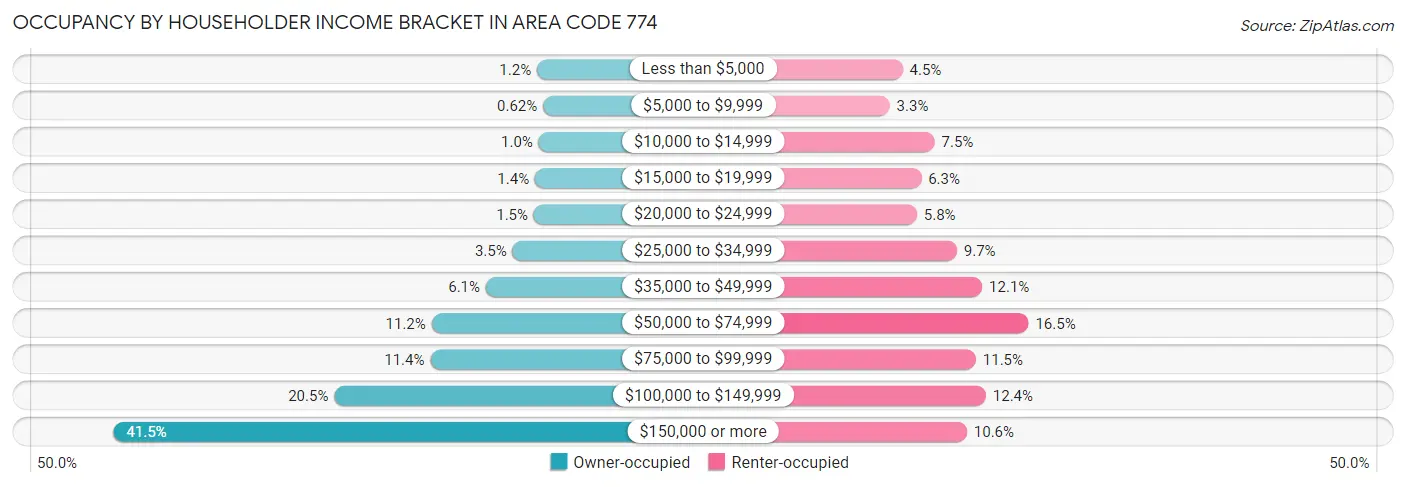
| Income Bracket | Owner-occupied | Renter-occupied |
| Less than $5,000 | 5,269 (1.2%) | 9,593 (4.5%) |
| $5,000 to $9,999 | 2,705 (0.6%) | 6,970 (3.3%) |
| $10,000 to $14,999 | 4,532 (1.0%) | 16,126 (7.5%) |
| $15,000 to $19,999 | 6,072 (1.4%) | 13,389 (6.2%) |
| $20,000 to $24,999 | 6,582 (1.5%) | 12,519 (5.8%) |
| $25,000 to $34,999 | 15,455 (3.5%) | 20,684 (9.7%) |
| $35,000 to $49,999 | 26,576 (6.1%) | 25,830 (12.1%) |
| $50,000 to $74,999 | 49,223 (11.2%) | 35,290 (16.5%) |
| $75,000 to $99,999 | 49,715 (11.4%) | 24,564 (11.5%) |
| $100,000 to $149,999 | 89,787 (20.5%) | 26,592 (12.4%) |
| $150,000 or more | 181,829 (41.5%) | 22,705 (10.6%) |
| Total | 437,745 (100.0%) | 214,262 (100.0%) |
Monthly Housing Cost Tiers in Area Code 774
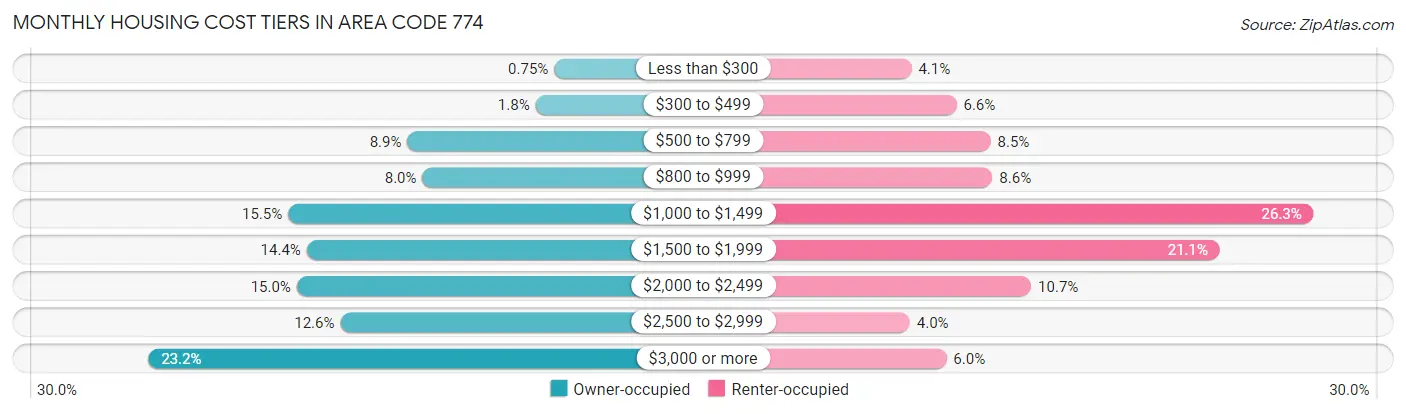
| Monthly Cost | Owner-occupied | Renter-occupied |
| Less than $300 | 3,302 (0.7%) | 8,756 (4.1%) |
| $300 to $499 | 7,809 (1.8%) | 14,088 (6.6%) |
| $500 to $799 | 38,768 (8.9%) | 18,119 (8.5%) |
| $800 to $999 | 35,167 (8.0%) | 18,346 (8.6%) |
| $1,000 to $1,499 | 67,622 (15.4%) | 56,348 (26.3%) |
| $1,500 to $1,999 | 63,129 (14.4%) | 45,255 (21.1%) |
| $2,000 to $2,499 | 65,550 (15.0%) | 22,935 (10.7%) |
| $2,500 to $2,999 | 54,993 (12.6%) | 8,567 (4.0%) |
| $3,000 or more | 101,405 (23.2%) | 12,895 (6.0%) |
| Total | 437,745 (100.0%) | 214,262 (100.0%) |
Physical Housing Characteristics in Area Code 774
Housing Structures in Area Code 774
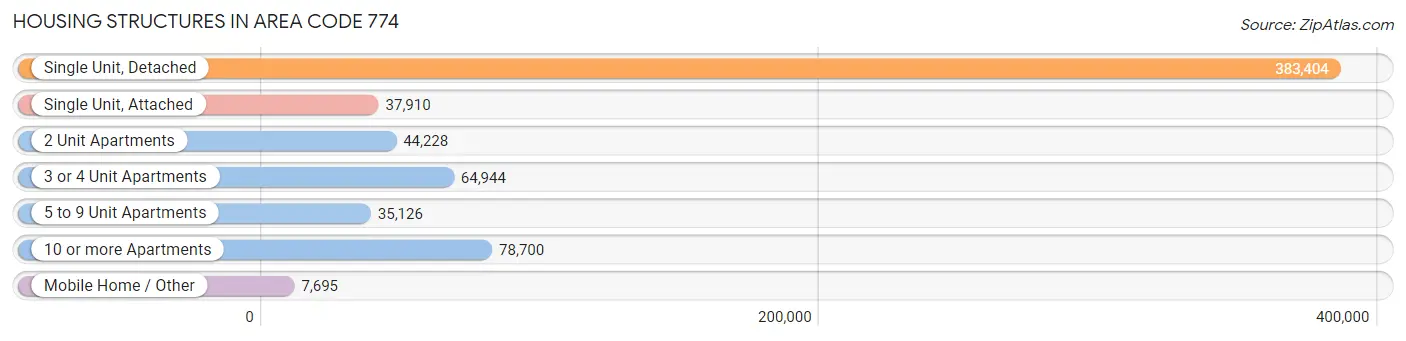
| Structure Type | # Housing Units | % Housing Units |
| Single Unit, Detached | 383,404 | 58.8% |
| Single Unit, Attached | 37,910 | 5.8% |
| 2 Unit Apartments | 44,228 | 6.8% |
| 3 or 4 Unit Apartments | 64,944 | 10.0% |
| 5 to 9 Unit Apartments | 35,126 | 5.4% |
| 10 or more Apartments | 78,700 | 12.1% |
| Mobile Home / Other | 7,695 | 1.2% |
| Total | 652,007 | 100.0% |
Housing Structures by Occupancy in Area Code 774
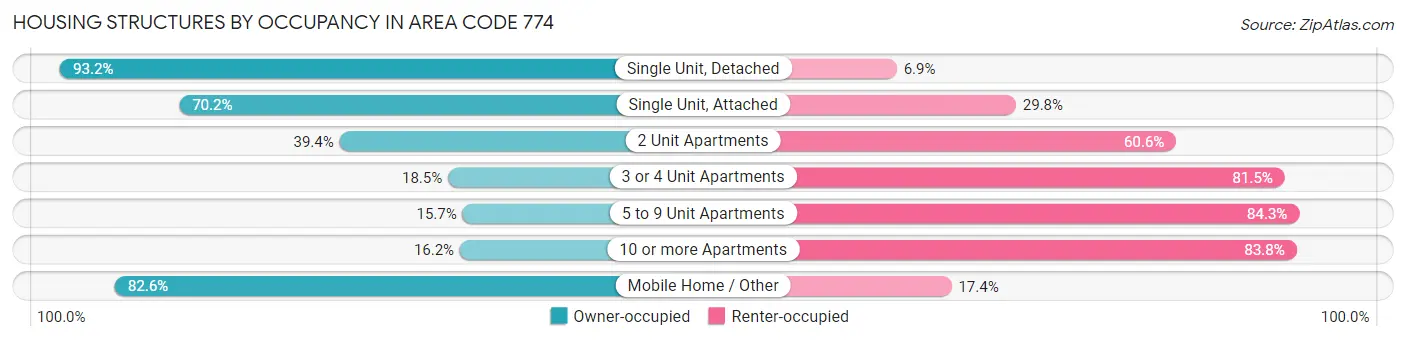
| Structure Type | Owner-occupied | Renter-occupied |
| Single Unit, Detached | 357,125 (93.1%) | 26,279 (6.9%) |
| Single Unit, Attached | 26,620 (70.2%) | 11,290 (29.8%) |
| 2 Unit Apartments | 17,410 (39.4%) | 26,818 (60.6%) |
| 3 or 4 Unit Apartments | 11,994 (18.5%) | 52,950 (81.5%) |
| 5 to 9 Unit Apartments | 5,507 (15.7%) | 29,619 (84.3%) |
| 10 or more Apartments | 12,732 (16.2%) | 65,968 (83.8%) |
| Mobile Home / Other | 6,357 (82.6%) | 1,338 (17.4%) |
| Total | 437,745 (67.1%) | 214,262 (32.9%) |
Housing Structures by Number of Rooms in Area Code 774
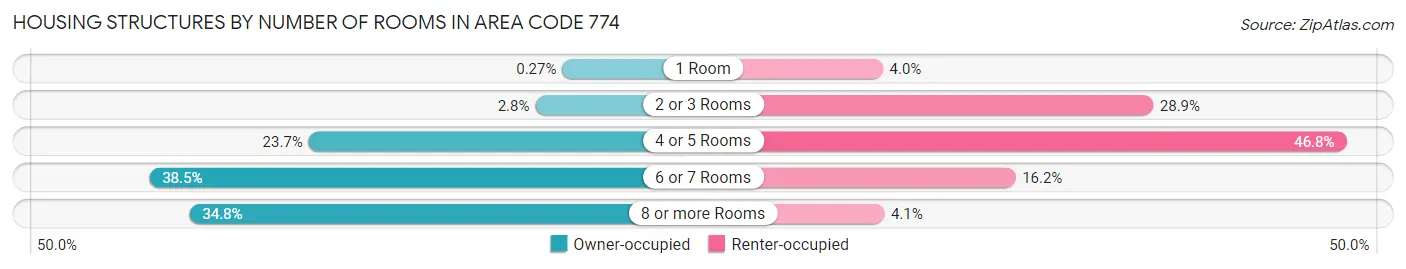
| Number of Rooms | Owner-occupied | Renter-occupied |
| 1 Room | 1,195 (0.3%) | 8,472 (4.0%) |
| 2 or 3 Rooms | 12,147 (2.8%) | 62,017 (28.9%) |
| 4 or 5 Rooms | 103,856 (23.7%) | 100,330 (46.8%) |
| 6 or 7 Rooms | 168,407 (38.5%) | 34,723 (16.2%) |
| 8 or more Rooms | 152,140 (34.8%) | 8,720 (4.1%) |
| Total | 437,745 (100.0%) | 214,262 (100.0%) |
Housing Structure by Heating Type in Area Code 774
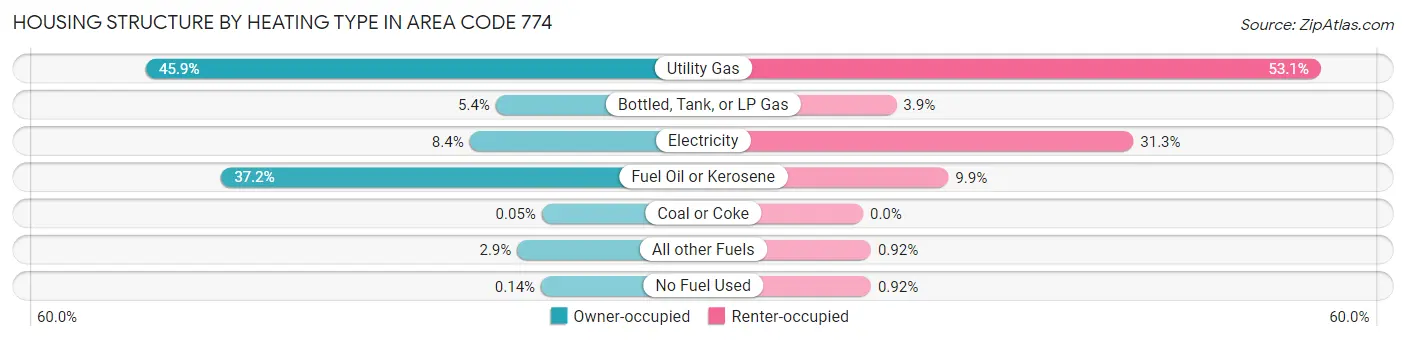
| Heating Type | Owner-occupied | Renter-occupied |
| Utility Gas | 200,994 (45.9%) | 113,667 (53.0%) |
| Bottled, Tank, or LP Gas | 23,532 (5.4%) | 8,302 (3.9%) |
| Electricity | 36,867 (8.4%) | 67,148 (31.3%) |
| Fuel Oil or Kerosene | 162,837 (37.2%) | 21,204 (9.9%) |
| Coal or Coke | 225 (0.1%) | 0 (0.0%) |
| All other Fuels | 12,674 (2.9%) | 1,969 (0.9%) |
| No Fuel Used | 616 (0.1%) | 1,972 (0.9%) |
| Total | 437,745 (100.0%) | 214,262 (100.0%) |
Household Vehicle Usage in Area Code 774
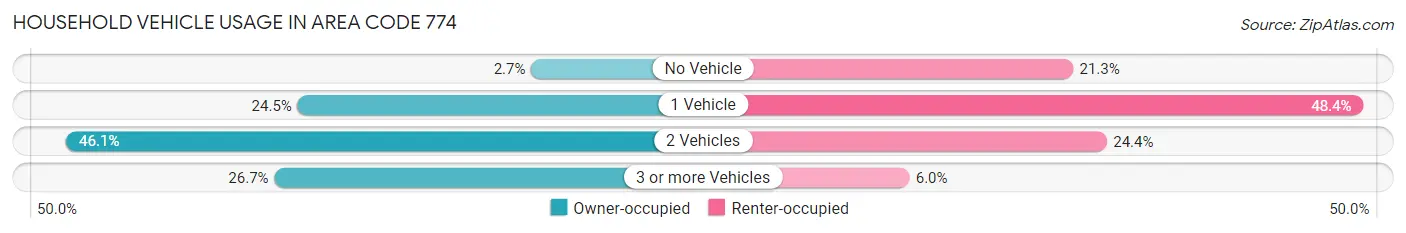
| Vehicles per Household | Owner-occupied | Renter-occupied |
| No Vehicle | 11,831 (2.7%) | 45,522 (21.2%) |
| 1 Vehicle | 107,270 (24.5%) | 103,702 (48.4%) |
| 2 Vehicles | 201,872 (46.1%) | 52,276 (24.4%) |
| 3 or more Vehicles | 116,772 (26.7%) | 12,762 (6.0%) |
| Total | 437,745 (100.0%) | 214,262 (100.0%) |
Real Estate & Mortgages in Area Code 774
Real Estate and Mortgage Overview in Area Code 774
| Characteristic | Without Mortgage | With Mortgage |
| Housing Units | 139,881 | 297,864 |
| Median Property Value | $57,749,100 | $60,851,200 |
| Median Household Income | $10,594,655 | $143,477 |
| Monthly Housing Costs | $107,333 | $99,401 |
| Real Estate Taxes | $619,598 | $3,998 |
Property Value by Mortgage Status in Area Code 774
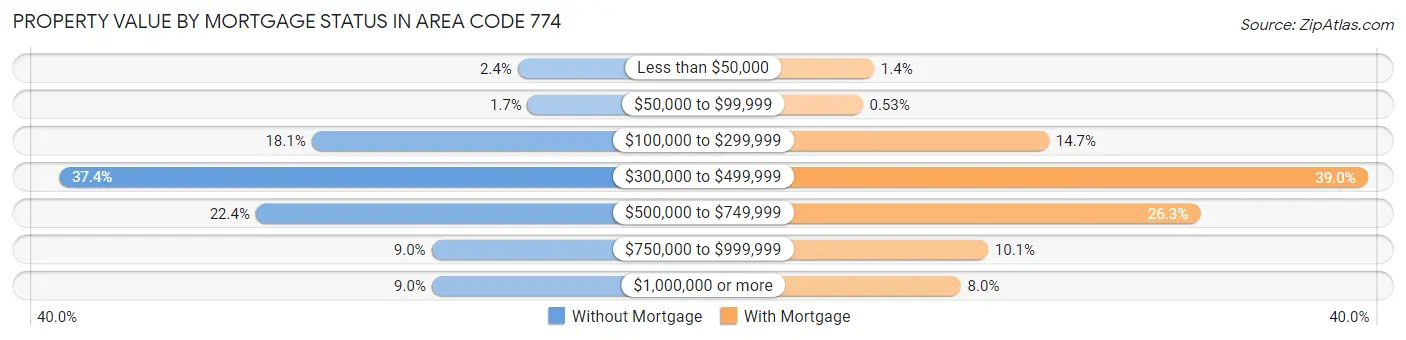
| Property Value | Without Mortgage | With Mortgage |
| Less than $50,000 | 3,405 (2.4%) | 4,164 (1.4%) |
| $50,000 to $99,999 | 2,337 (1.7%) | 1,578 (0.5%) |
| $100,000 to $299,999 | 25,377 (18.1%) | 43,883 (14.7%) |
| $300,000 to $499,999 | 52,293 (37.4%) | 116,185 (39.0%) |
| $500,000 to $749,999 | 31,316 (22.4%) | 78,199 (26.3%) |
| $750,000 to $999,999 | 12,587 (9.0%) | 30,010 (10.1%) |
| $1,000,000 or more | 12,566 (9.0%) | 23,845 (8.0%) |
| Total | 139,881 (100.0%) | 297,864 (100.0%) |
Household Income by Mortgage Status in Area Code 774
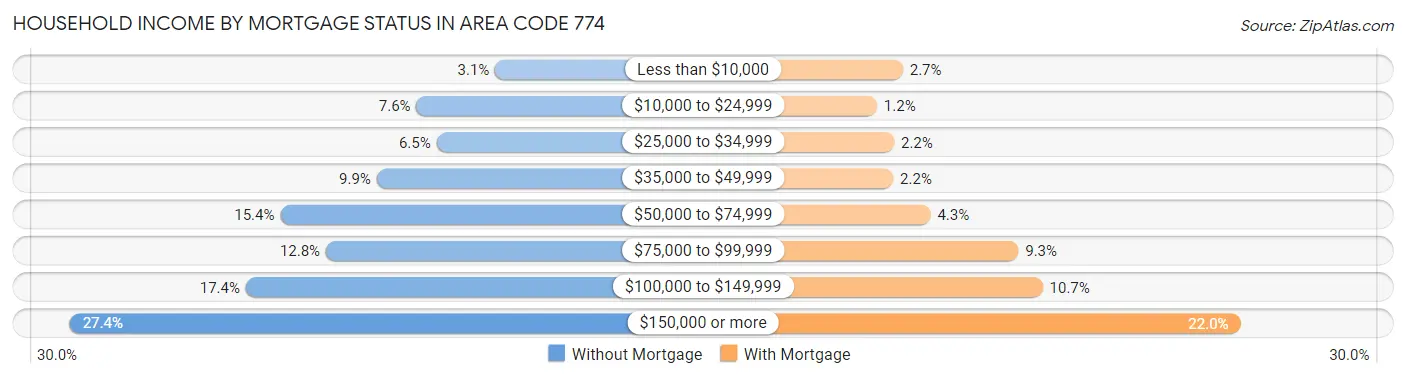
| Household Income | Without Mortgage | With Mortgage |
| Less than $10,000 | 4,344 (3.1%) | 8,041 (2.7%) |
| $10,000 to $24,999 | 10,640 (7.6%) | 3,630 (1.2%) |
| $25,000 to $34,999 | 9,038 (6.5%) | 6,546 (2.2%) |
| $35,000 to $49,999 | 13,816 (9.9%) | 6,417 (2.1%) |
| $50,000 to $74,999 | 21,526 (15.4%) | 12,760 (4.3%) |
| $75,000 to $99,999 | 17,881 (12.8%) | 27,697 (9.3%) |
| $100,000 to $149,999 | 24,284 (17.4%) | 31,834 (10.7%) |
| $150,000 or more | 38,352 (27.4%) | 65,503 (22.0%) |
| Total | 139,881 (100.0%) | 297,864 (100.0%) |
Property Value to Household Income Ratio in Area Code 774
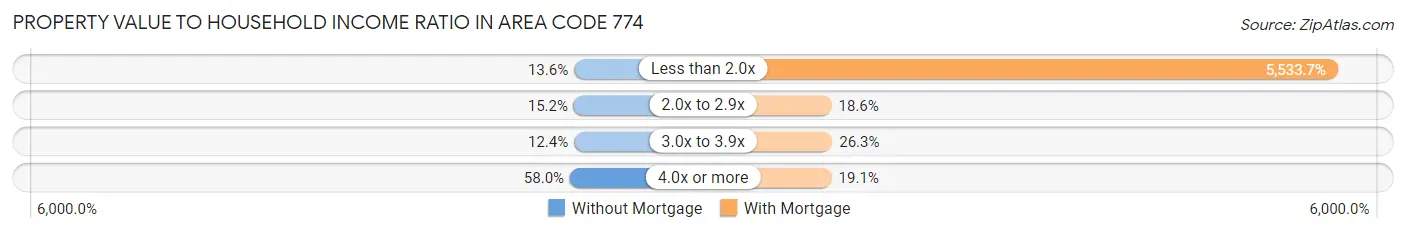
| Value-to-Income Ratio | Without Mortgage | With Mortgage |
| Less than 2.0x | 18,951 (13.6%) | 16,482,847 (5,533.7%) |
| 2.0x to 2.9x | 21,202 (15.2%) | 55,283 (18.6%) |
| 3.0x to 3.9x | 17,374 (12.4%) | 78,264 (26.3%) |
| 4.0x or more | 81,108 (58.0%) | 56,743 (19.1%) |
| Total | 139,881 (100.0%) | 297,864 (100.0%) |
Real Estate Taxes by Mortgage Status in Area Code 774
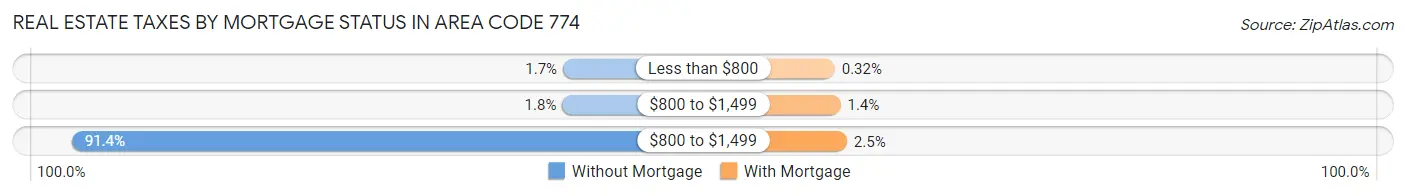
| Property Taxes | Without Mortgage | With Mortgage |
| Less than $800 | 2,354 (1.7%) | 960 (0.3%) |
| $800 to $1,499 | 2,523 (1.8%) | 4,067 (1.4%) |
| $800 to $1,499 | 127,804 (91.4%) | 7,546 (2.5%) |
| Total | 139,881 (100.0%) | 297,864 (100.0%) |
Health & Disability in Area Code 774
Health Insurance Coverage by Age in Area Code 774
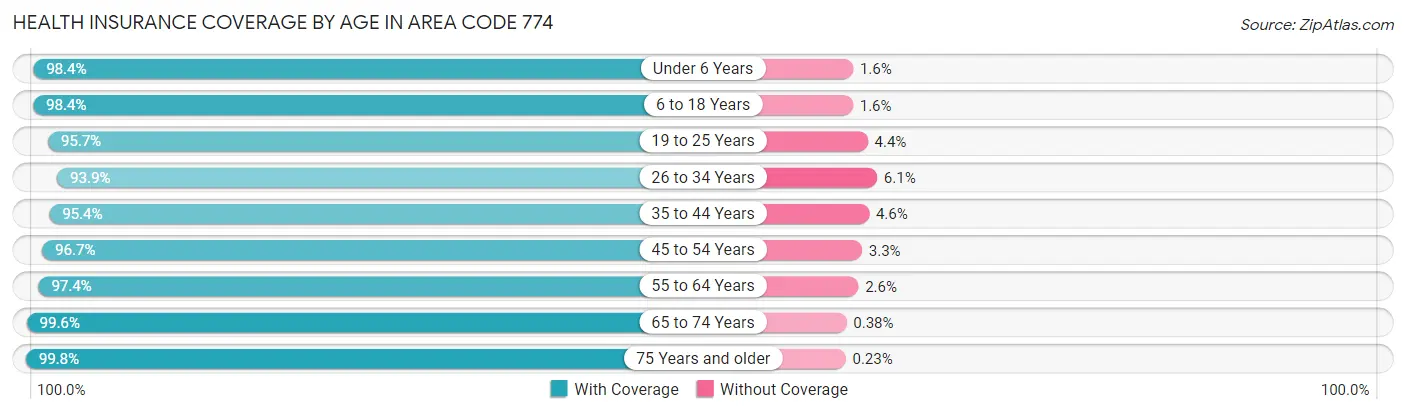
| Age Bracket | With Coverage | Without Coverage |
| Under 6 Years | 103,698 (98.4%) | 1,710 (1.6%) |
| 6 to 18 Years | 263,039 (98.4%) | 4,229 (1.6%) |
| 19 to 25 Years | 135,850 (95.7%) | 6,180 (4.3%) |
| 26 to 34 Years | 178,418 (93.9%) | 11,548 (6.1%) |
| 35 to 44 Years | 197,603 (95.4%) | 9,521 (4.6%) |
| 45 to 54 Years | 217,603 (96.7%) | 7,387 (3.3%) |
| 55 to 64 Years | 233,566 (97.4%) | 6,221 (2.6%) |
| 65 to 74 Years | 172,147 (99.6%) | 664 (0.4%) |
| 75 Years and older | 113,962 (99.8%) | 259 (0.2%) |
| Total | 1,615,886 (97.1%) | 47,719 (2.9%) |
Health Insurance Coverage by Citizenship Status in Area Code 774
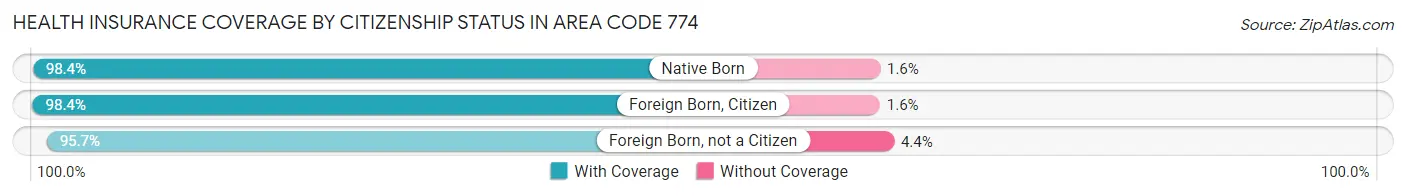
| Citizenship Status | With Coverage | Without Coverage |
| Native Born | 103,698 (98.4%) | 1,710 (1.6%) |
| Foreign Born, Citizen | 263,039 (98.4%) | 4,229 (1.6%) |
| Foreign Born, not a Citizen | 135,850 (95.7%) | 6,180 (4.3%) |
Health Insurance Coverage by Household Income in Area Code 774
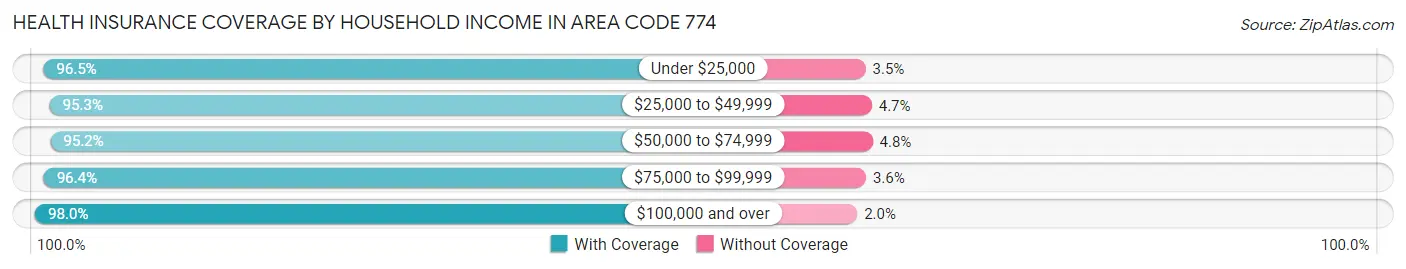
| Household Income | With Coverage | Without Coverage |
| Under $25,000 | 128,704 (96.5%) | 4,705 (3.5%) |
| $25,000 to $49,999 | 161,558 (95.3%) | 7,927 (4.7%) |
| $50,000 to $74,999 | 175,114 (95.2%) | 8,894 (4.8%) |
| $75,000 to $99,999 | 173,698 (96.4%) | 6,468 (3.6%) |
| $100,000 and over | 954,029 (98.0%) | 19,082 (2.0%) |
Public vs Private Health Insurance Coverage by Age in Area Code 774
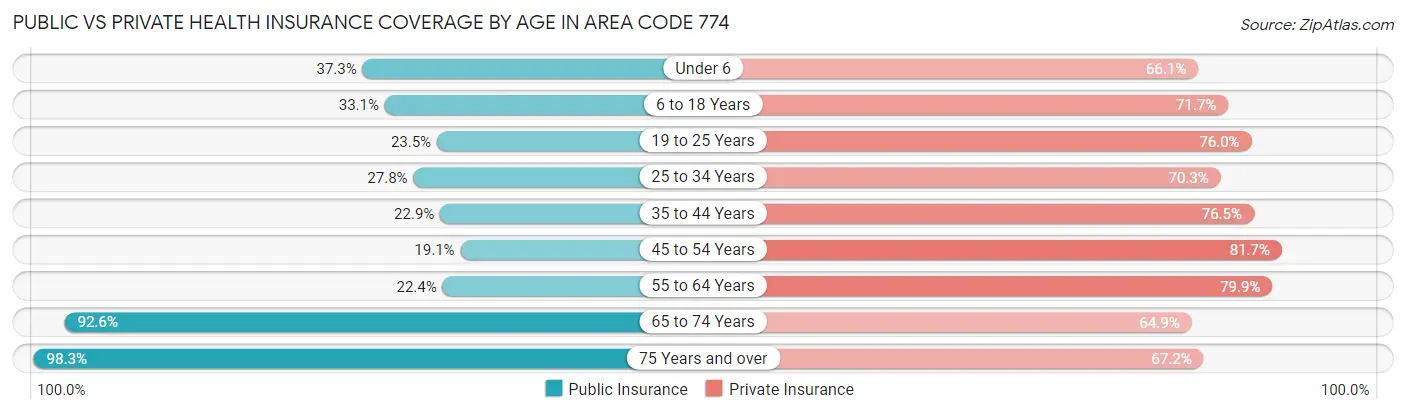
| Age Bracket | Public Insurance | Private Insurance |
| Under 6 | 39,286 (37.3%) | 69,716 (66.1%) |
| 6 to 18 Years | 88,572 (33.1%) | 191,669 (71.7%) |
| 19 to 25 Years | 33,322 (23.5%) | 107,983 (76.0%) |
| 25 to 34 Years | 52,863 (27.8%) | 133,571 (70.3%) |
| 35 to 44 Years | 47,373 (22.9%) | 158,394 (76.5%) |
| 45 to 54 Years | 42,990 (19.1%) | 183,759 (81.7%) |
| 55 to 64 Years | 53,750 (22.4%) | 191,555 (79.9%) |
| 65 to 74 Years | 159,995 (92.6%) | 112,183 (64.9%) |
| 75 Years and over | 112,296 (98.3%) | 76,712 (67.2%) |
| Total | 630,447 (37.9%) | 1,225,542 (73.7%) |
Disability Status by Sex by Age in Area Code 774
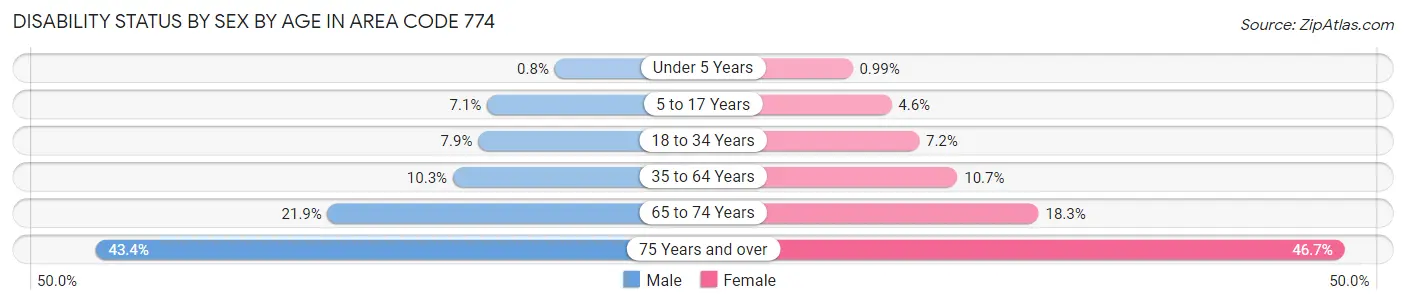
| Age Bracket | Male | Female |
| Under 5 Years | 350 (0.8%) | 425 (1.0%) |
| 5 to 17 Years | 9,683 (7.1%) | 5,821 (4.6%) |
| 18 to 34 Years | 13,946 (7.9%) | 12,750 (7.2%) |
| 35 to 64 Years | 33,973 (10.2%) | 36,497 (10.7%) |
| 65 to 74 Years | 17,901 (21.9%) | 16,621 (18.3%) |
| 75 Years and over | 20,172 (43.4%) | 31,605 (46.7%) |
Disability Class by Sex by Age in Area Code 774
Disability Class: Hearing Difficulty
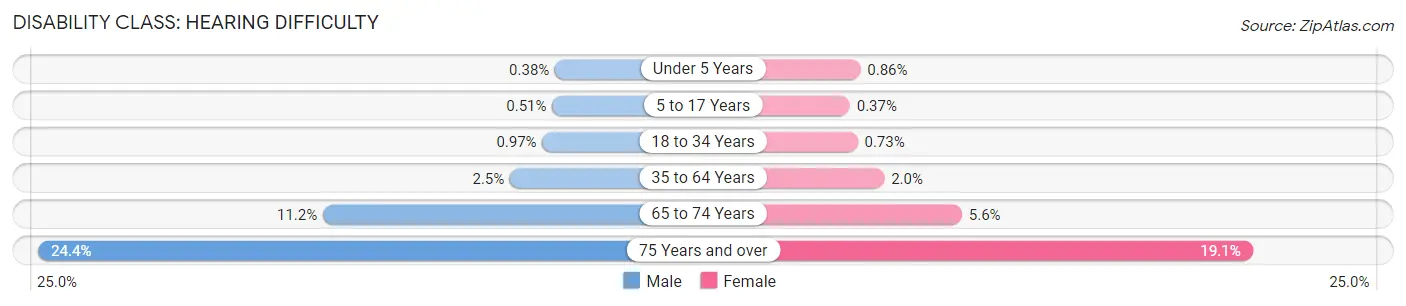
| Age Bracket | Male | Female |
| Under 5 Years | 168 (0.4%) | 367 (0.9%) |
| 5 to 17 Years | 696 (0.5%) | 469 (0.4%) |
| 18 to 34 Years | 1,714 (1.0%) | 1,305 (0.7%) |
| 35 to 64 Years | 8,175 (2.5%) | 6,693 (2.0%) |
| 65 to 74 Years | 9,121 (11.2%) | 5,073 (5.6%) |
| 75 Years and over | 11,326 (24.4%) | 12,916 (19.1%) |
Disability Class: Vision Difficulty
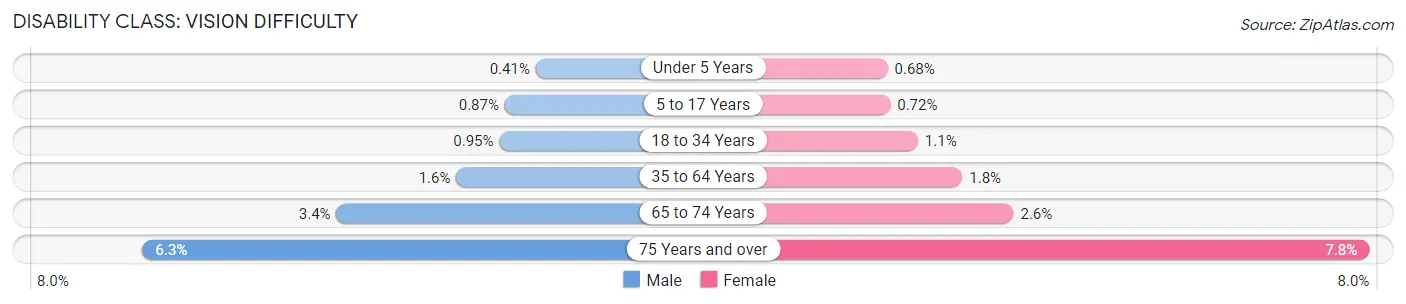
| Age Bracket | Male | Female |
| Under 5 Years | 182 (0.4%) | 291 (0.7%) |
| 5 to 17 Years | 1,193 (0.9%) | 905 (0.7%) |
| 18 to 34 Years | 1,676 (0.9%) | 2,017 (1.1%) |
| 35 to 64 Years | 5,275 (1.6%) | 6,079 (1.8%) |
| 65 to 74 Years | 2,753 (3.4%) | 2,325 (2.5%) |
| 75 Years and over | 2,903 (6.2%) | 5,308 (7.8%) |
Disability Class: Cognitive Difficulty
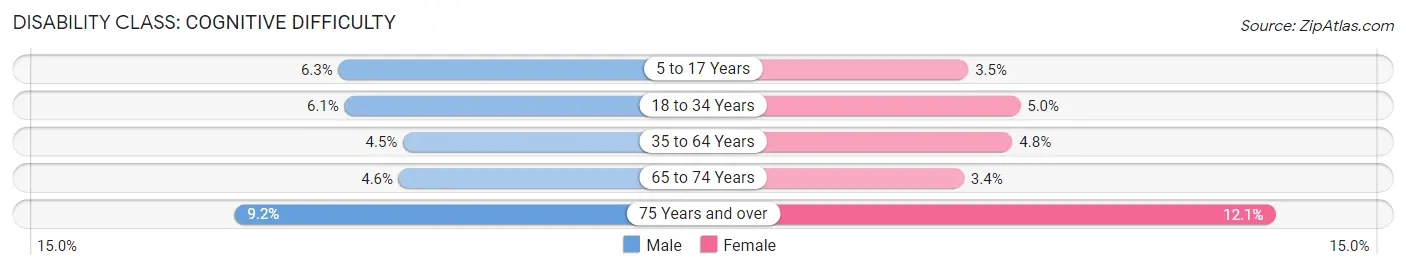
| Age Bracket | Male | Female |
| 5 to 17 Years | 8,567 (6.3%) | 4,448 (3.5%) |
| 18 to 34 Years | 10,761 (6.1%) | 8,836 (5.0%) |
| 35 to 64 Years | 14,794 (4.5%) | 16,161 (4.8%) |
| 65 to 74 Years | 3,744 (4.6%) | 3,094 (3.4%) |
| 75 Years and over | 4,257 (9.2%) | 8,181 (12.1%) |
Disability Class: Ambulatory Difficulty
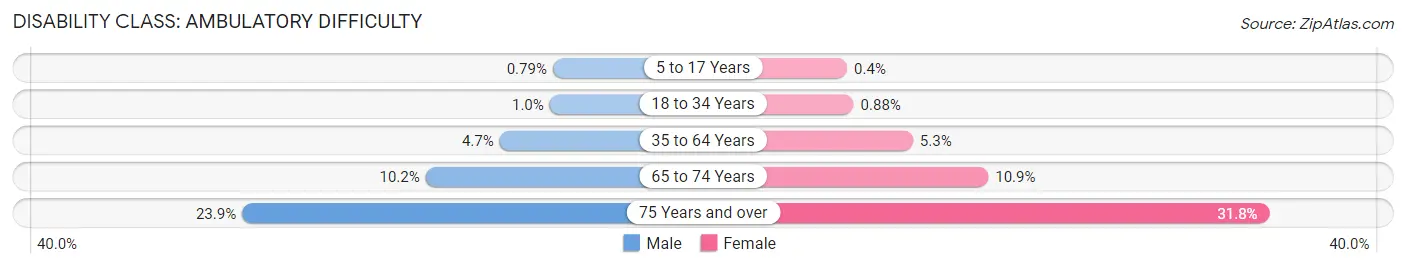
| Age Bracket | Male | Female |
| 5 to 17 Years | 1,084 (0.8%) | 503 (0.4%) |
| 18 to 34 Years | 1,802 (1.0%) | 1,566 (0.9%) |
| 35 to 64 Years | 15,713 (4.7%) | 17,981 (5.3%) |
| 65 to 74 Years | 8,367 (10.2%) | 9,905 (10.9%) |
| 75 Years and over | 11,085 (23.9%) | 21,513 (31.8%) |
Disability Class: Self-Care Difficulty
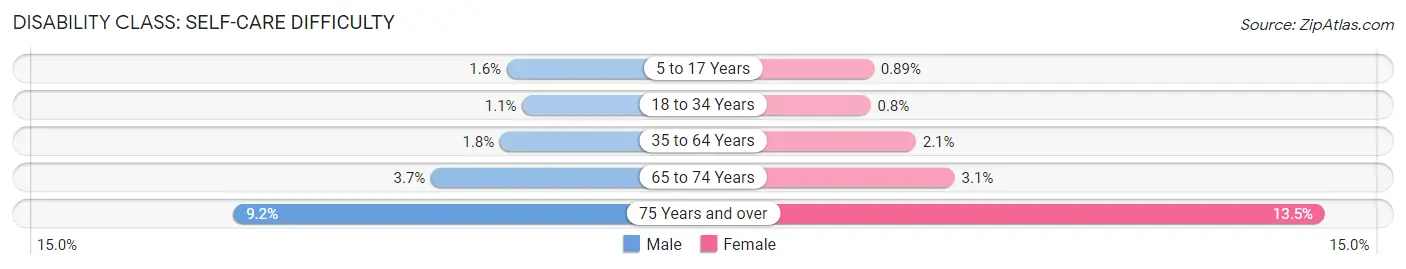
| Age Bracket | Male | Female |
| 5 to 17 Years | 2,150 (1.6%) | 1,127 (0.9%) |
| 18 to 34 Years | 2,012 (1.1%) | 1,417 (0.8%) |
| 35 to 64 Years | 5,824 (1.8%) | 7,028 (2.1%) |
| 65 to 74 Years | 3,014 (3.7%) | 2,855 (3.1%) |
| 75 Years and over | 4,270 (9.2%) | 9,110 (13.5%) |
Technology Access in Area Code 774
Computing Device Access in Area Code 774
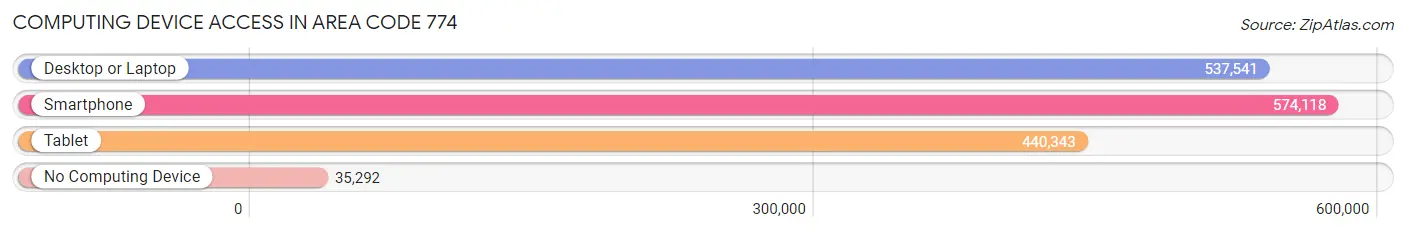
| Device Type | # Households | % Households |
| Desktop or Laptop | 537,541 | 82.4% |
| Smartphone | 574,118 | 88.0% |
| Tablet | 440,343 | 67.5% |
| No Computing Device | 35,292 | 5.4% |
| Total | 652,007 | 100.0% |
Internet Access in Area Code 774
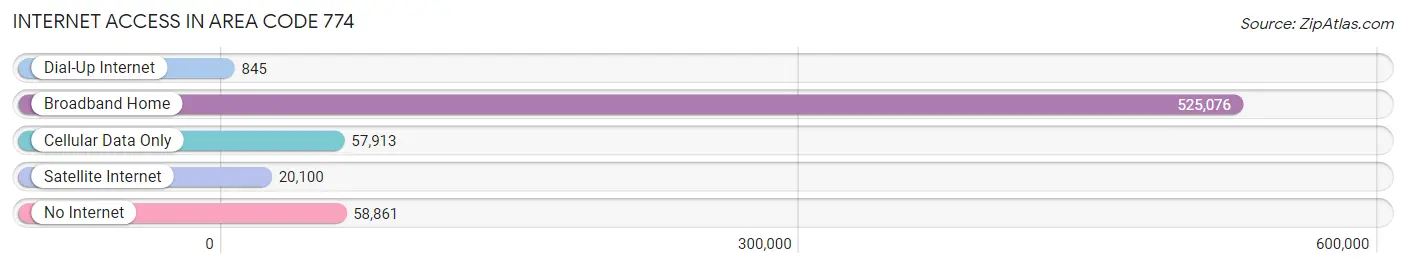
| Internet Type | # Households | % Households |
| Dial-Up Internet | 845 | 0.1% |
| Broadband Home | 525,076 | 80.5% |
| Cellular Data Only | 57,913 | 8.9% |
| Satellite Internet | 20,100 | 3.1% |
| No Internet | 58,861 | 9.0% |
| Total | 652,007 | 100.0% |
Area Code 774 Summary
Geography
Area code 774 is a telephone area code in the North American Numbering Plan (NANP) for the U.S. state of Massachusetts. It was created in 2001 as an overlay to area code 508. It serves the south-central portion of the state, including the cities of Attleboro, Brockton, Fall River, New Bedford, Taunton, and Wareham.
Social
Area code 774 is a popular area code for Massachusetts residents, as it is home to many of the state's largest cities. It is also home to a diverse population, with a mix of cultures and backgrounds.
Economics
Area code 774 is an important economic hub for the state of Massachusetts. It is home to many of the state's largest employers, including the University of Massachusetts, the Massachusetts Institute of Technology, and the Massachusetts General Hospital. It is also home to a number of major corporations, such as Raytheon, General Electric, and Fidelity Investments.
Demographics
Area code 774 is home to a diverse population, with a mix of cultures and backgrounds. According to the U.S. Census Bureau, the population of the area code is approximately 1.3 million people. The median age is 38.7 years, and the median household income is $63,845. The population is predominantly white, with a smaller percentage of African Americans, Asians, and Hispanics.
Common Questions
What is Per Capita Income in Area Code 774?
Per Capita income in Area Code 774 is $58,107.
What is the Median Family Income in Area Code 774?
Median Family Income in Area Code 774 is $133,968.
What is the Median Household income in Area Code 774?
Median Household Income in Area Code 774 is $112,173.
What is Income or Wage Gap in Area Code 774?
Income or Wage Gap in Area Code 774 is 31.1%.
Women in Area Code 774 earn 68.9 cents for every dollar earned by a man.
What is Family Income Deficit in Area Code 774?
Family Income Deficit in Area Code 774 is $10,635.
Families that are below poverty line in Area Code 774 earn $10,635 less on average than the poverty threshold level.
What is Inequality or Gini Index in Area Code 774?
Inequality or Gini Index in Area Code 774 is 48.28.
What is the Total Population of Area Code 774?
Total Population of Area Code 774 is 1,680,160.
What is the Total Male Population of Area Code 774?
Total Male Population of Area Code 774 is 825,803.
What is the Total Female Population of Area Code 774?
Total Female Population of Area Code 774 is 854,357.
What is the Ratio of Males per 100 Females in Area Code 774?
There are 96.66 Males per 100 Females in Area Code 774.
What is the Ratio of Females per 100 Males in Area Code 774?
There are 103.46 Females per 100 Males in Area Code 774.
What is the Median Population Age in Area Code 774?
Median Population Age in Area Code 774 is 44.2 Years.
What is the Average Family Size in Area Code 774
Average Family Size in Area Code 774 is 3.0 People.
What is the Average Household Size in Area Code 774
Average Household Size in Area Code 774 is 2.5 People.
How Large is the Labor Force in Area Code 774?
There are 910,065 People in the Labor Forcein in Area Code 774.
What is the Percentage of People in the Labor Force in Area Code 774?
66.3% of People are in the Labor Force in Area Code 774.
What is the Unemployment Rate in Area Code 774?
Unemployment Rate in Area Code 774 is 5.2%.