Area Code 386 Map & Demographics
Area Code 386 Map
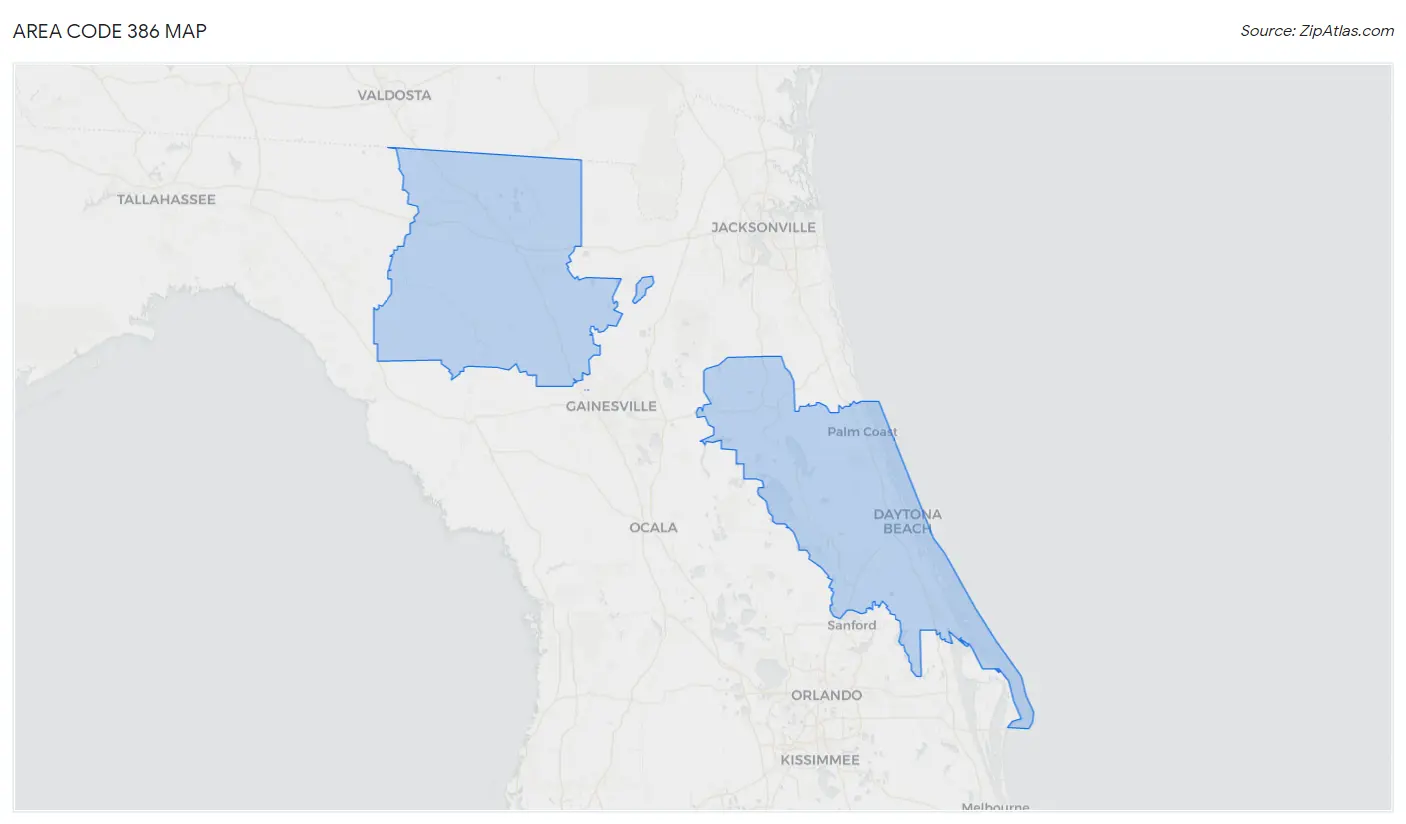
Area Code 386 Overview
$30,861
PER CAPITA INCOME
$71,211
AVG FAMILY INCOME
$58,605
AVG HOUSEHOLD INCOME
21.3%
WAGE / INCOME GAP [ % ]
78.7¢/ $1
WAGE / INCOME GAP [ $ ]
$9,989
FAMILY INCOME DEFICIT
27.93
INEQUALITY / GINI INDEX
944,529
TOTAL POPULATION
469,513
MALE POPULATION
475,016
FEMALE POPULATION
98.84
MALES / 100 FEMALES
101.17
FEMALES / 100 MALES
45.4
MEDIAN AGE
3.1
AVG FAMILY SIZE
2.6
AVG HOUSEHOLD SIZE
389,425
LABOR FORCE [ PEOPLE ]
49.3%
PERCENT IN LABOR FORCE
5.4%
UNEMPLOYMENT RATE
Income in Area Code 386
Income Overview in Area Code 386
Per Capita Income in Area Code 386 is $30,861, while median incomes of families and households are $71,211 and $58,605 respectively.
| Characteristic | Number | Measure |
| Per Capita Income | 944,529 | $30,861 |
| Median Family Income | 242,075 | $71,211 |
| Mean Family Income | 242,075 | $5,388,481 |
| Median Household Income | 377,877 | $58,605 |
| Mean Household Income | 377,877 | $4,594,796 |
| Income Deficit | 242,075 | $9,989 |
| Wage / Income Gap (%) | 944,529 | 21.35% |
| Wage / Income Gap ($) | 944,529 | 78.65¢ per $1 |
| Gini / Inequality Index | 944,529 | 27.93 |
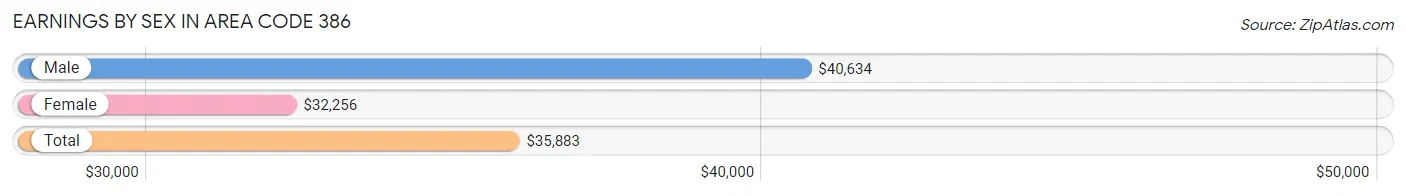
Earnings by Sex in Area Code 386
Average Earnings in Area Code 386 are $35,883, $40,634 for men and $32,256 for women, a difference of 20.6%.
| Sex | Number | Average Earnings |
| Male | 224,154 (52.0%) | $40,634 |
| Female | 206,857 (48.0%) | $32,256 |
| Total | 431,011 (100.0%) | $35,883 |
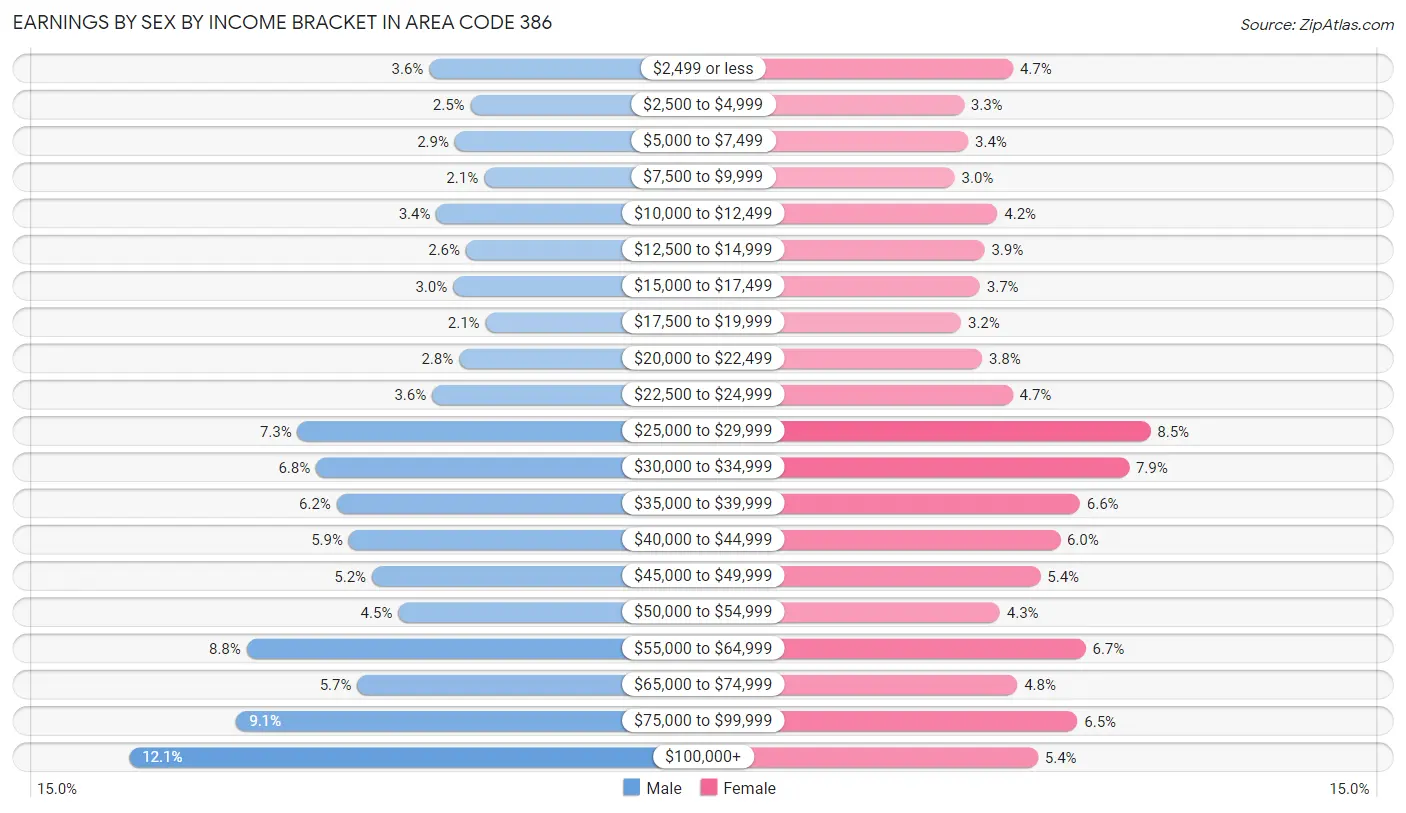
Earnings by Sex by Income Bracket in Area Code 386
The most common earnings brackets in Area Code 386 are $100,000+ for men (27,034 | 12.1%) and $25,000 to $29,999 for women (17,655 | 8.5%).
| Income | Male | Female |
| $2,499 or less | 8,140 (3.6%) | 9,667 (4.7%) |
| $2,500 to $4,999 | 5,529 (2.5%) | 6,798 (3.3%) |
| $5,000 to $7,499 | 6,524 (2.9%) | 7,062 (3.4%) |
| $7,500 to $9,999 | 4,685 (2.1%) | 6,264 (3.0%) |
| $10,000 to $12,499 | 7,679 (3.4%) | 8,741 (4.2%) |
| $12,500 to $14,999 | 5,824 (2.6%) | 8,009 (3.9%) |
| $15,000 to $17,499 | 6,637 (3.0%) | 7,740 (3.7%) |
| $17,500 to $19,999 | 4,599 (2.1%) | 6,630 (3.2%) |
| $20,000 to $22,499 | 6,251 (2.8%) | 7,867 (3.8%) |
| $22,500 to $24,999 | 7,952 (3.5%) | 9,649 (4.7%) |
| $25,000 to $29,999 | 16,434 (7.3%) | 17,655 (8.5%) |
| $30,000 to $34,999 | 15,274 (6.8%) | 16,396 (7.9%) |
| $35,000 to $39,999 | 13,961 (6.2%) | 13,544 (6.6%) |
| $40,000 to $44,999 | 13,211 (5.9%) | 12,399 (6.0%) |
| $45,000 to $49,999 | 11,736 (5.2%) | 11,251 (5.4%) |
| $50,000 to $54,999 | 10,092 (4.5%) | 8,888 (4.3%) |
| $55,000 to $64,999 | 19,646 (8.8%) | 13,879 (6.7%) |
| $65,000 to $74,999 | 12,663 (5.7%) | 9,904 (4.8%) |
| $75,000 to $99,999 | 20,283 (9.0%) | 13,399 (6.5%) |
| $100,000+ | 27,034 (12.1%) | 11,115 (5.4%) |
| Total | 224,154 (100.0%) | 206,857 (100.0%) |
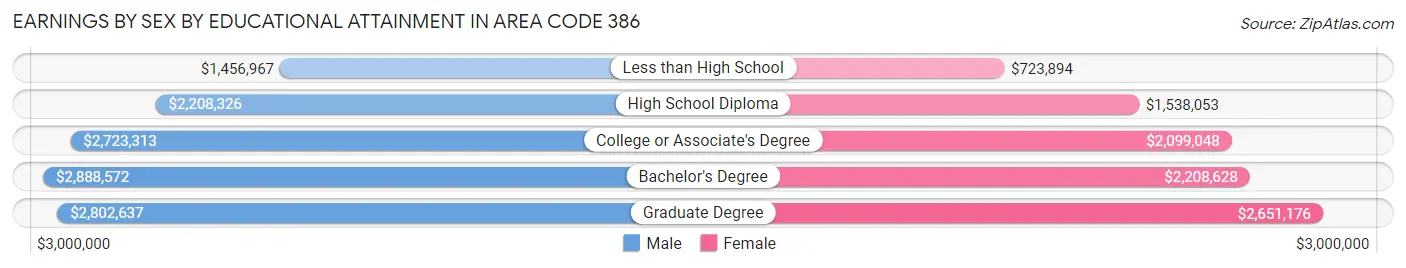
Earnings by Sex by Educational Attainment in Area Code 386
Average earnings in Area Code 386 are $2,565,499 for men and $2,054,919 for women, a difference of 19.9%. Men with an educational attainment of bachelor's degree enjoy the highest average annual earnings of $2,888,572, while those with less than high school education earn the least with $1,456,967. Women with an educational attainment of graduate degree earn the most with the average annual earnings of $2,651,176, while those with less than high school education have the smallest earnings of $723,894.
| Educational Attainment | Male Income | Female Income |
| Less than High School | $1,456,967 | $723,894 |
| High School Diploma | $2,208,326 | $1,538,053 |
| College or Associate's Degree | $2,723,313 | $2,099,048 |
| Bachelor's Degree | $2,888,572 | $2,208,628 |
| Graduate Degree | $2,802,637 | $2,651,176 |
| Total | $2,565,499 | $2,054,919 |
Family Income in Area Code 386
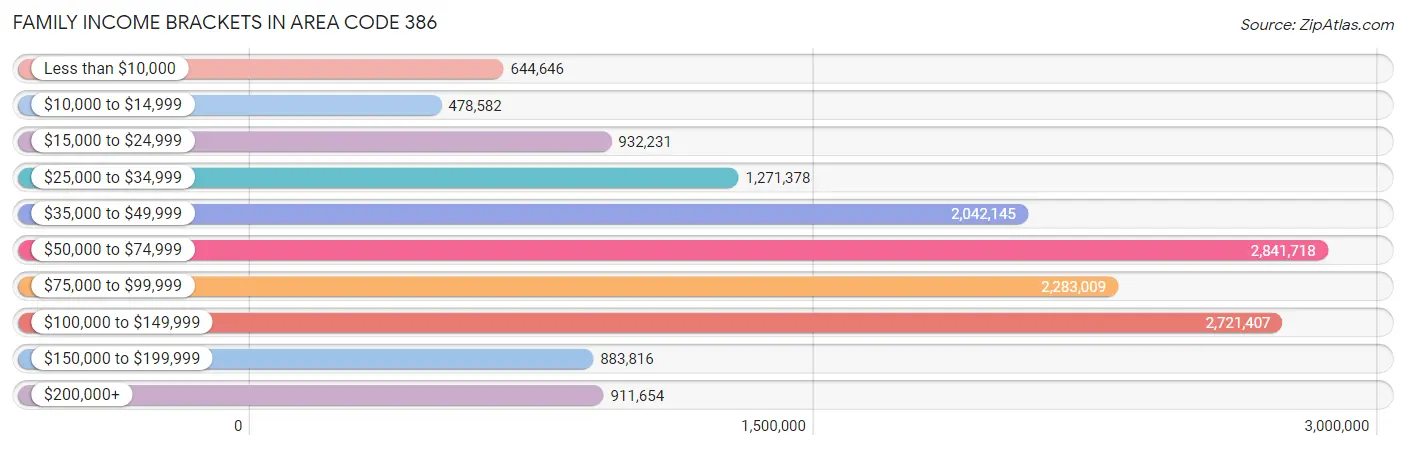
Family Income Brackets in Area Code 386
According to the Area Code 386 family income data, there are 2,841,718 families falling into the $50,000 to $74,999 income range, which is the most common income bracket and makes up 1,173.9% of all families. Conversely, the $10,000 to $14,999 income bracket is the least frequent group with only 478,582 families (197.7%) belonging to this category.
| Income Bracket | # Families | % Families |
| Less than $10,000 | 644,646 | 266.3% |
| $10,000 to $14,999 | 478,582 | 197.7% |
| $15,000 to $24,999 | 932,231 | 385.1% |
| $25,000 to $34,999 | 1,271,378 | 525.2% |
| $35,000 to $49,999 | 2,042,145 | 843.6% |
| $50,000 to $74,999 | 2,841,718 | 1,173.9% |
| $75,000 to $99,999 | 2,283,009 | 943.1% |
| $100,000 to $149,999 | 2,721,407 | 1,124.2% |
| $150,000 to $199,999 | 883,816 | 365.1% |
| $200,000+ | 911,654 | 376.6% |
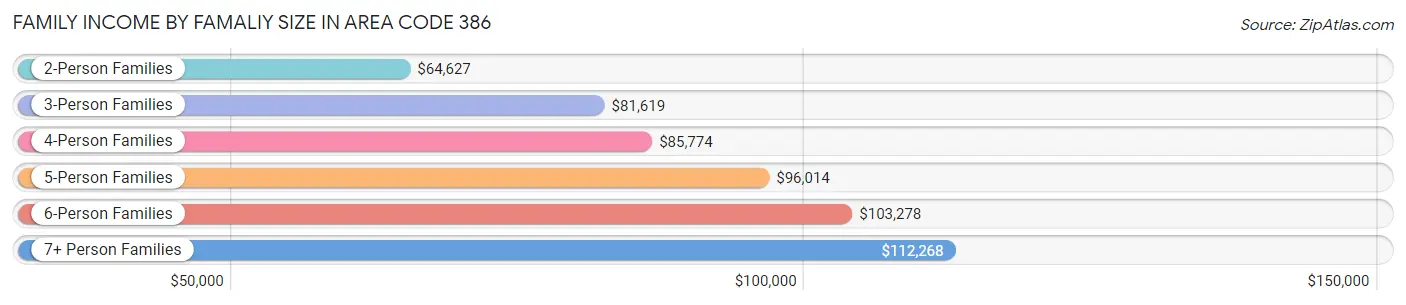
Family Income by Famaliy Size in Area Code 386
7+ person families (2,778 | 1.1%) account for the highest median family income in Area Code 386 with $112,268 per family, while 2-person families (136,610 | 56.4%) have the highest median income of $32,313 per family member.
| Income Bracket | # Families | Median Income |
| 2-Person Families | 136,610 (56.4%) | $64,627 |
| 3-Person Families | 48,495 (20.0%) | $81,619 |
| 4-Person Families | 33,549 (13.9%) | $85,774 |
| 5-Person Families | 15,076 (6.2%) | $96,014 |
| 6-Person Families | 5,567 (2.3%) | $103,278 |
| 7+ Person Families | 2,778 (1.1%) | $112,268 |
| Total | 242,075 (100.0%) | $71,211 |
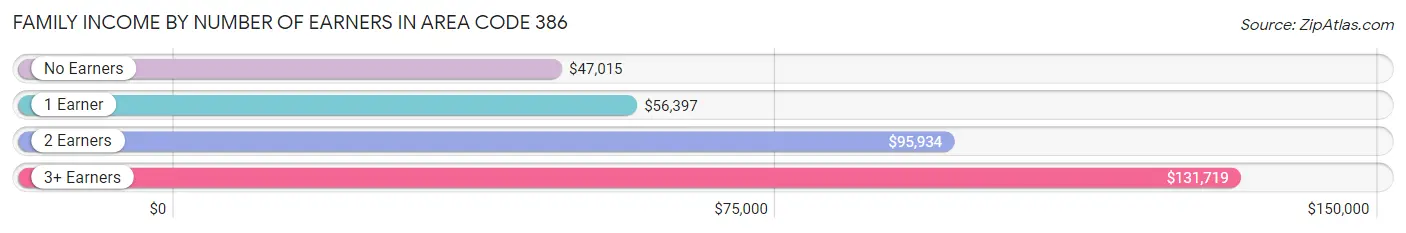
Family Income by Number of Earners in Area Code 386
The median family income in Area Code 386 is $71,211, with families comprising 3+ earners (21,323) having the highest median family income of $131,719, while families with no earners (59,662) have the lowest median family income of $47,015, accounting for 8.8% and 24.6% of families, respectively.
| Number of Earners | # Families | Median Income |
| No Earners | 59,662 (24.6%) | $47,015 |
| 1 Earner | 80,398 (33.2%) | $56,397 |
| 2 Earners | 80,692 (33.3%) | $95,934 |
| 3+ Earners | 21,323 (8.8%) | $131,719 |
| Total | 242,075 (100.0%) | $71,211 |
Household Income in Area Code 386
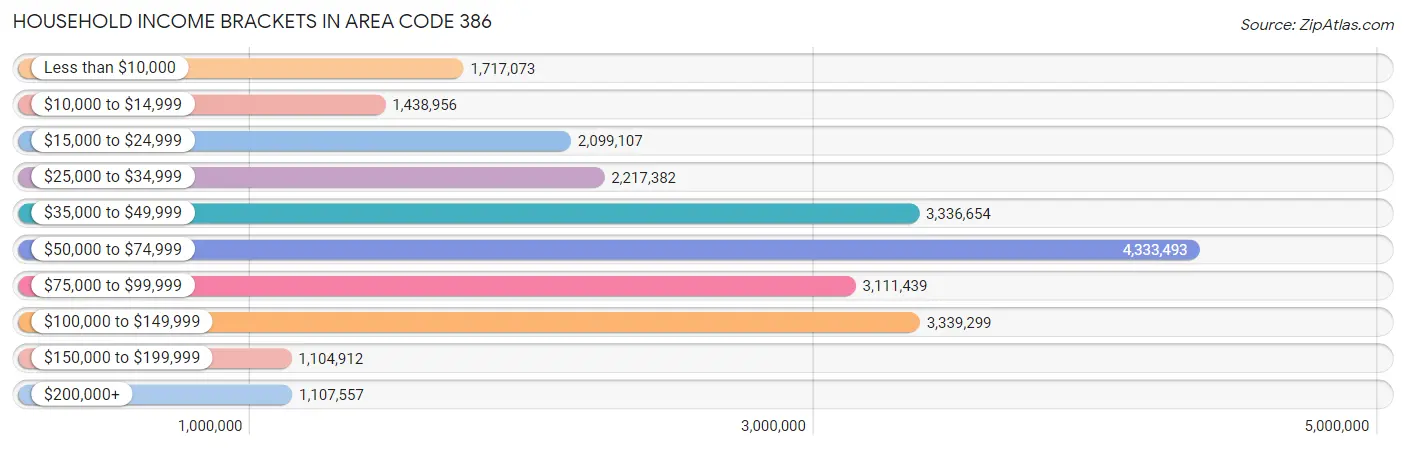
Household Income Brackets in Area Code 386
With 4,333,493 households falling in the category, the $50,000 to $74,999 income range is the most frequent in Area Code 386, accounting for 1,146.8% of all households. In contrast, only 1,104,912 households (292.4%) fall into the $150,000 to $199,999 income bracket, making it the least populous group.
| Income Bracket | # Households | % Households |
| Less than $10,000 | 1,717,073 | 454.4% |
| $10,000 to $14,999 | 1,438,956 | 380.8% |
| $15,000 to $24,999 | 2,099,107 | 555.5% |
| $25,000 to $34,999 | 2,217,382 | 586.8% |
| $35,000 to $49,999 | 3,336,654 | 883.0% |
| $50,000 to $74,999 | 4,333,493 | 1,146.8% |
| $75,000 to $99,999 | 3,111,439 | 823.4% |
| $100,000 to $149,999 | 3,339,299 | 883.7% |
| $150,000 to $199,999 | 1,104,912 | 292.4% |
| $200,000+ | 1,107,557 | 293.1% |
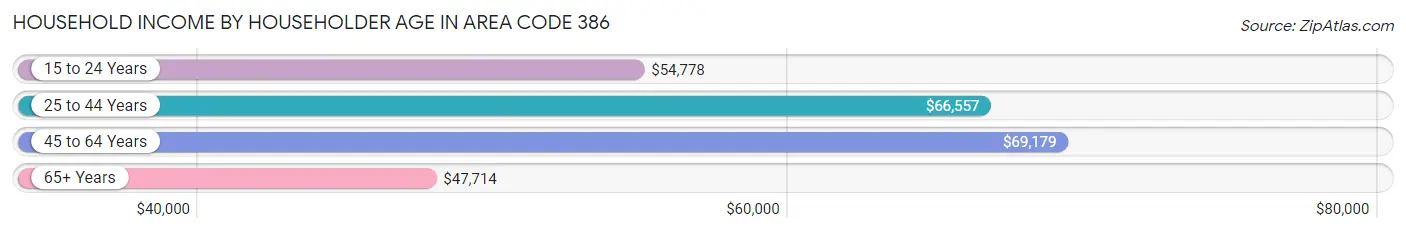
Household Income by Householder Age in Area Code 386
The median household income in Area Code 386 is $58,605, with the highest median household income of $69,179 found in the 45 to 64 years age bracket for the primary householder. A total of 136,131 households (36.0%) fall into this category. Meanwhile, the 65+ years age bracket for the primary householder has the lowest median household income of $47,714, with 139,063 households (36.8%) in this group.
| Income Bracket | # Households | Median Income |
| 15 to 24 Years | 10,157 (2.7%) | $54,778 |
| 25 to 44 Years | 92,526 (24.5%) | $66,557 |
| 45 to 64 Years | 136,131 (36.0%) | $69,179 |
| 65+ Years | 139,063 (36.8%) | $47,714 |
| Total | 377,877 (100.0%) | $58,605 |
Poverty in Area Code 386
Income Below Poverty by Sex and Age in Area Code 386
With 12.6% poverty level for males and 14.5% for females among the residents of Area Code 386, under 5 year old males and under 5 year old females are the most vulnerable to poverty, with 4,589 males (21.3%) and 4,390 females (20.5%) in their respective age groups living below the poverty level.
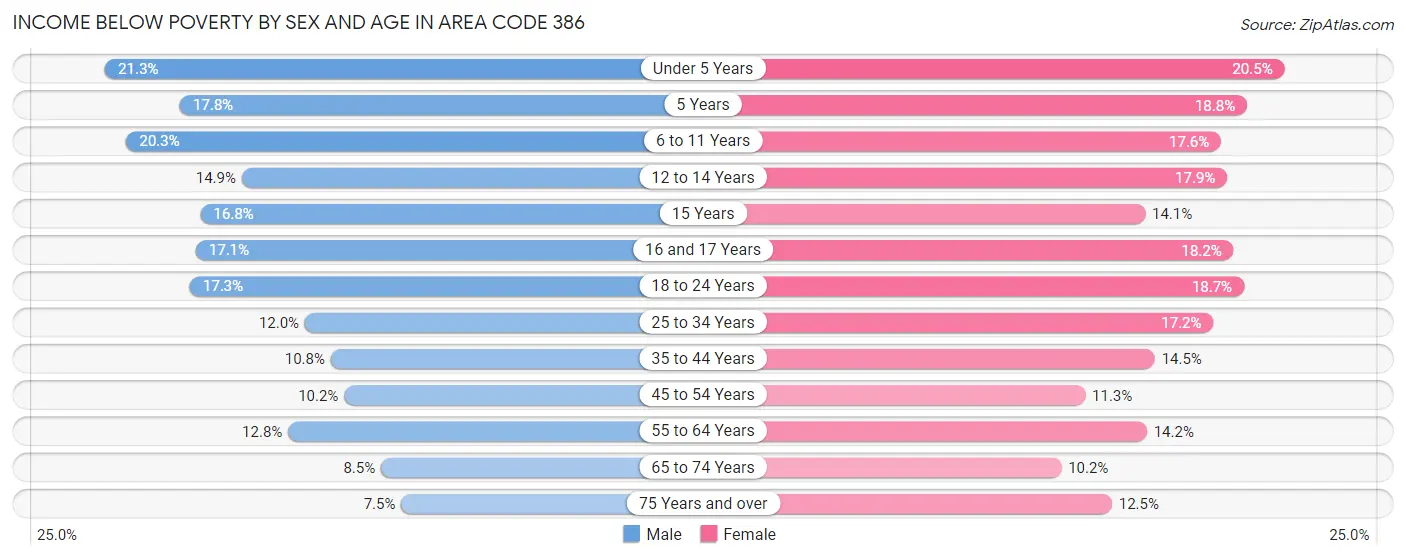
| Age Bracket | Male | Female |
| Under 5 Years | 4,589 (21.3%) | 4,390 (20.5%) |
| 5 Years | 810 (17.8%) | 764 (18.8%) |
| 6 to 11 Years | 6,284 (20.3%) | 5,047 (17.6%) |
| 12 to 14 Years | 2,160 (14.9%) | 2,623 (17.9%) |
| 15 Years | 958 (16.8%) | 633 (14.1%) |
| 16 and 17 Years | 1,713 (17.1%) | 1,884 (18.2%) |
| 18 to 24 Years | 5,915 (17.3%) | 5,911 (18.7%) |
| 25 to 34 Years | 6,157 (12.0%) | 8,891 (17.2%) |
| 35 to 44 Years | 5,425 (10.8%) | 7,326 (14.5%) |
| 45 to 54 Years | 5,393 (10.2%) | 6,273 (11.3%) |
| 55 to 64 Years | 8,298 (12.8%) | 10,401 (14.1%) |
| 65 to 74 Years | 5,176 (8.5%) | 6,872 (10.2%) |
| 75 Years and over | 3,153 (7.5%) | 6,443 (12.5%) |
| Total | 56,031 (12.6%) | 67,458 (14.5%) |
Income Above Poverty by Sex and Age in Area Code 386
According to the poverty statistics in Area Code 386, males aged 75 years and over and females aged 65 to 74 years are the age groups that are most secure financially, with 92.5% of males and 89.8% of females in these age groups living above the poverty line.
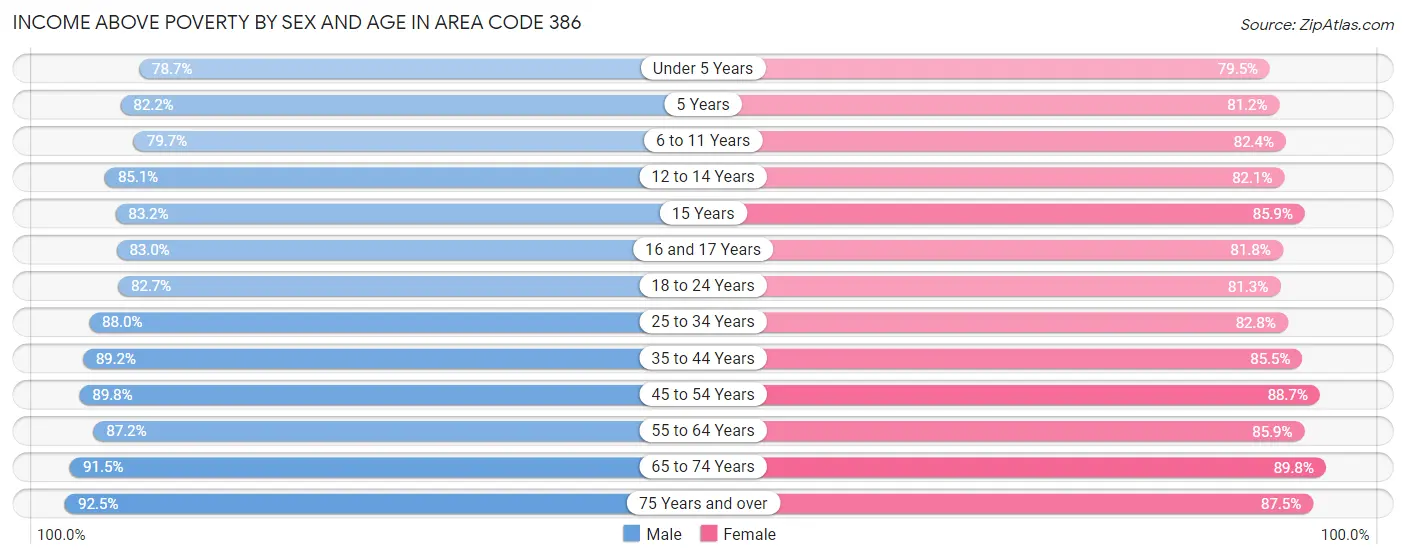
| Age Bracket | Male | Female |
| Under 5 Years | 16,999 (78.7%) | 16,981 (79.5%) |
| 5 Years | 3,744 (82.2%) | 3,300 (81.2%) |
| 6 to 11 Years | 24,702 (79.7%) | 23,631 (82.4%) |
| 12 to 14 Years | 12,315 (85.1%) | 12,045 (82.1%) |
| 15 Years | 4,731 (83.2%) | 3,866 (85.9%) |
| 16 and 17 Years | 8,335 (83.0%) | 8,478 (81.8%) |
| 18 to 24 Years | 28,223 (82.7%) | 25,758 (81.3%) |
| 25 to 34 Years | 45,199 (88.0%) | 42,692 (82.8%) |
| 35 to 44 Years | 44,867 (89.2%) | 43,113 (85.5%) |
| 45 to 54 Years | 47,639 (89.8%) | 49,268 (88.7%) |
| 55 to 64 Years | 56,693 (87.2%) | 63,129 (85.9%) |
| 65 to 74 Years | 55,982 (91.5%) | 60,652 (89.8%) |
| 75 Years and over | 38,793 (92.5%) | 44,978 (87.5%) |
| Total | 388,222 (87.4%) | 397,891 (85.5%) |
Income Below Poverty Among Married-Couple Families in Area Code 386
The poverty statistics for married-couple families in Area Code 386 show that 5.1% or 8,991 of the total 177,666 families live below the poverty line. Families with 5 or more children have the highest poverty rate of 31.2%, comprising of 333 families. On the other hand, families with no children have the lowest poverty rate of 4.5%, which includes 5,567 families.
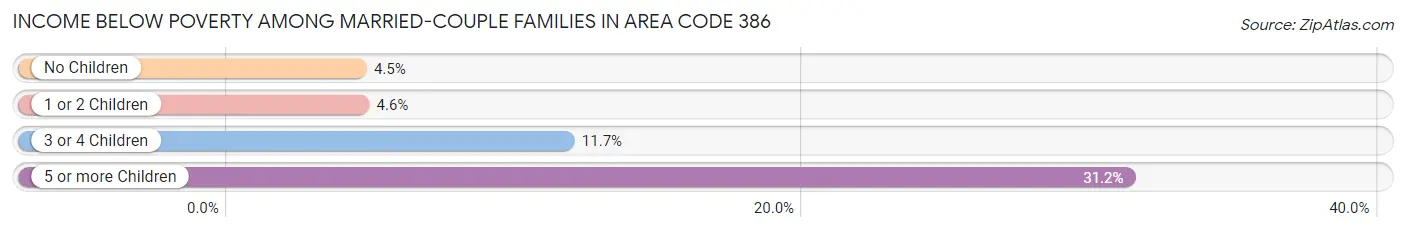
| Children | Above Poverty | Below Poverty |
| No Children | 118,390 (95.5%) | 5,567 (4.5%) |
| 1 or 2 Children | 41,128 (95.4%) | 1,972 (4.6%) |
| 3 or 4 Children | 8,424 (88.3%) | 1,119 (11.7%) |
| 5 or more Children | 733 (68.8%) | 333 (31.2%) |
| Total | 168,675 (94.9%) | 8,991 (5.1%) |
Income Below Poverty Among Single-Parent Households in Area Code 386
According to the poverty data in Area Code 386, 13.9% or 2,746 single-father households and 22.7% or 10,131 single-mother households are living below the poverty line. Among single-father households, those with 3 or 4 children have the highest poverty rate, with 623 households (35.5%) experiencing poverty. Likewise, among single-mother households, those with 5 or more children have the highest poverty rate, with 303 households (86.8%) falling below the poverty line.
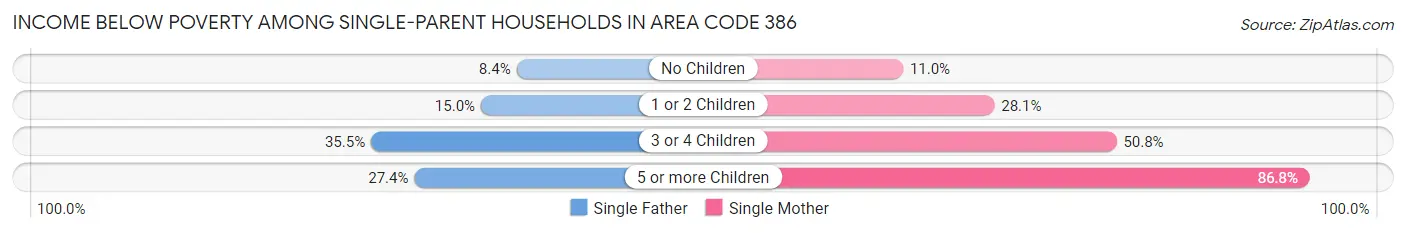
| Children | Single Father | Single Mother |
| No Children | 738 (8.4%) | 2,187 (11.0%) |
| 1 or 2 Children | 1,368 (15.0%) | 5,924 (28.1%) |
| 3 or 4 Children | 623 (35.5%) | 1,717 (50.8%) |
| 5 or more Children | 17 (27.4%) | 303 (86.8%) |
| Total | 2,746 (13.9%) | 10,131 (22.7%) |
Income Below Poverty Among Married-Couple vs Single-Parent Households in Area Code 386
The poverty data for Area Code 386 shows that 8,991 of the married-couple family households (5.1%) and 12,877 of the single-parent households (20.0%) are living below the poverty level. Within the married-couple family households, those with 5 or more children have the highest poverty rate, with 333 households (31.2%) falling below the poverty line. Among the single-parent households, those with 5 or more children have the highest poverty rate, with 320 household (77.9%) living below poverty.
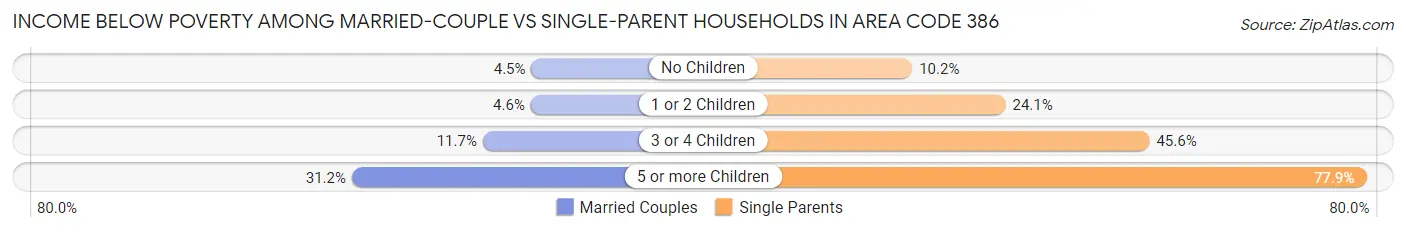
| Children | Married-Couple Families | Single-Parent Households |
| No Children | 5,567 (4.5%) | 2,925 (10.2%) |
| 1 or 2 Children | 1,972 (4.6%) | 7,292 (24.1%) |
| 3 or 4 Children | 1,119 (11.7%) | 2,340 (45.6%) |
| 5 or more Children | 333 (31.2%) | 320 (77.9%) |
| Total | 8,991 (5.1%) | 12,877 (20.0%) |
Race in Area Code 386
The most populous races in Area Code 386 are White / Caucasian (707,282 | 74.9%), Hispanic or Latino (124,187 | 13.2%), and Black / African American (115,619 | 12.2%).
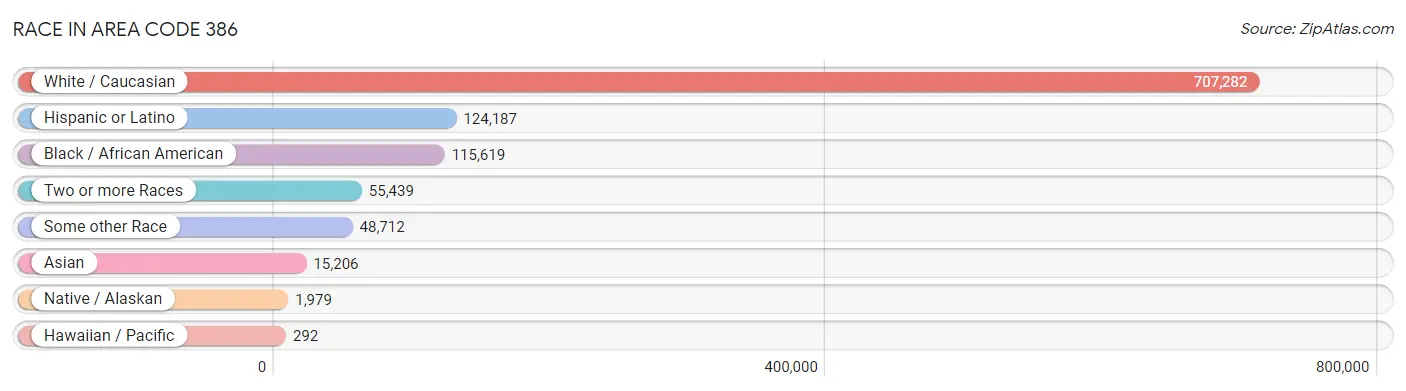
| Race | # Population | % Population |
| Asian | 15,206 | 1.6% |
| Black / African American | 115,619 | 12.2% |
| Hawaiian / Pacific | 292 | 0.0% |
| Hispanic or Latino | 124,187 | 13.2% |
| Native / Alaskan | 1,979 | 0.2% |
| White / Caucasian | 707,282 | 74.9% |
| Two or more Races | 55,439 | 5.9% |
| Some other Race | 48,712 | 5.2% |
| Total | 944,529 | 100.0% |
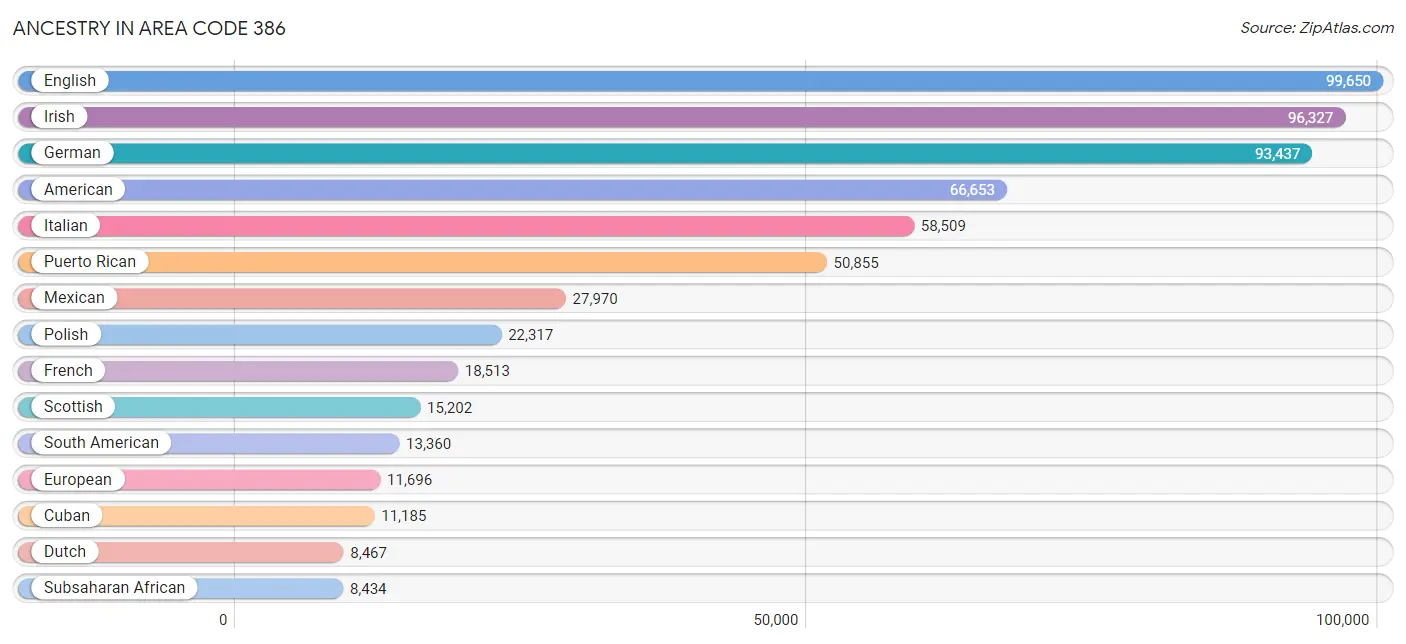
Ancestry in Area Code 386
The most populous ancestries reported in Area Code 386 are English (99,650 | 10.5%), Irish (96,327 | 10.2%), German (93,437 | 9.9%), American (66,653 | 7.1%), and Italian (58,509 | 6.2%), together accounting for 43.9% of all Area Code 386 residents.
| Ancestry | # Population | % Population |
| African | 6,531 | 0.7% |
| Alaska Native | 12 | 0.0% |
| Albanian | 201 | 0.0% |
| American | 66,653 | 7.1% |
| Apache | 109 | 0.0% |
| Arab | 3,292 | 0.4% |
| Argentinean | 662 | 0.1% |
| Armenian | 318 | 0.0% |
| Australian | 188 | 0.0% |
| Austrian | 1,664 | 0.2% |
| Bahamian | 452 | 0.1% |
| Bangladeshi | 129 | 0.0% |
| Barbadian | 106 | 0.0% |
| Basque | 53 | 0.0% |
| Belgian | 713 | 0.1% |
| Belizean | 121 | 0.0% |
| Bermudan | 26 | 0.0% |
| Bhutanese | 1,084 | 0.1% |
| Blackfeet | 372 | 0.0% |
| Bolivian | 324 | 0.0% |
| Brazilian | 1,304 | 0.1% |
| British | 5,129 | 0.5% |
| British West Indian | 263 | 0.0% |
| Bulgarian | 54 | 0.0% |
| Burmese | 1,627 | 0.2% |
| Cajun | 80 | 0.0% |
| Cambodian | 97 | 0.0% |
| Canadian | 2,647 | 0.3% |
| Cape Verdean | 300 | 0.0% |
| Carpatho Rusyn | 6 | 0.0% |
| Celtic | 135 | 0.0% |
| Central American | 5,855 | 0.6% |
| Central American Indian | 350 | 0.0% |
| Cherokee | 2,780 | 0.3% |
| Chickasaw | 3 | 0.0% |
| Chilean | 312 | 0.0% |
| Chinese | 197 | 0.0% |
| Chippewa | 168 | 0.0% |
| Choctaw | 88 | 0.0% |
| Colombian | 5,698 | 0.6% |
| Comanche | 42 | 0.0% |
| Costa Rican | 740 | 0.1% |
| Creek | 85 | 0.0% |
| Croatian | 773 | 0.1% |
| Crow | 23 | 0.0% |
| Cuban | 11,185 | 1.2% |
| Czech | 2,846 | 0.3% |
| Czechoslovakian | 895 | 0.1% |
| Danish | 1,790 | 0.2% |
| Delaware | 7 | 0.0% |
| Dominican | 5,654 | 0.6% |
| Dutch | 8,467 | 0.9% |
| Dutch West Indian | 10 | 0.0% |
| Eastern European | 1,569 | 0.2% |
| Ecuadorian | 1,443 | 0.2% |
| Egyptian | 852 | 0.1% |
| English | 99,650 | 10.5% |
| Estonian | 52 | 0.0% |
| Ethiopian | 73 | 0.0% |
| European | 11,696 | 1.2% |
| Filipino | 136 | 0.0% |
| Finnish | 759 | 0.1% |
| French | 18,513 | 2.0% |
| French American Indian | 174 | 0.0% |
| French Canadian | 5,162 | 0.5% |
| German | 93,437 | 9.9% |
| German Russian | 40 | 0.0% |
| Ghanaian | 33 | 0.0% |
| Greek | 3,311 | 0.4% |
| Guamanian / Chamorro | 17 | 0.0% |
| Guatemalan | 1,485 | 0.2% |
| Guyanese | 781 | 0.1% |
| Haitian | 1,845 | 0.2% |
| Honduran | 1,306 | 0.1% |
| Hopi | 16 | 0.0% |
| Hungarian | 5,356 | 0.6% |
| Icelander | 192 | 0.0% |
| Indian (Asian) | 3,134 | 0.3% |
| Indonesian | 137 | 0.0% |
| Inupiat | 44 | 0.0% |
| Iranian | 525 | 0.1% |
| Iraqi | 10 | 0.0% |
| Irish | 96,327 | 10.2% |
| Iroquois | 203 | 0.0% |
| Israeli | 109 | 0.0% |
| Italian | 58,509 | 6.2% |
| Jamaican | 4,070 | 0.4% |
| Japanese | 80 | 0.0% |
| Jordanian | 20 | 0.0% |
| Korean | 5,033 | 0.5% |
| Laotian | 307 | 0.0% |
| Latvian | 261 | 0.0% |
| Lebanese | 888 | 0.1% |
| Liberian | 61 | 0.0% |
| Lithuanian | 1,868 | 0.2% |
| Lumbee | 12 | 0.0% |
| Luxembourger | 93 | 0.0% |
| Macedonian | 20 | 0.0% |
| Malaysian | 340 | 0.0% |
| Maltese | 240 | 0.0% |
| Mexican | 27,970 | 3.0% |
| Mexican American Indian | 316 | 0.0% |
| Mongolian | 35 | 0.0% |
| Moroccan | 372 | 0.0% |
| Native Hawaiian | 395 | 0.0% |
| Navajo | 93 | 0.0% |
| New Zealander | 122 | 0.0% |
| Nicaraguan | 684 | 0.1% |
| Nigerian | 767 | 0.1% |
| Northern European | 833 | 0.1% |
| Norwegian | 6,083 | 0.6% |
| Osage | 11 | 0.0% |
| Ottawa | 14 | 0.0% |
| Pakistani | 706 | 0.1% |
| Palestinian | 73 | 0.0% |
| Panamanian | 500 | 0.1% |
| Paraguayan | 27 | 0.0% |
| Pennsylvania German | 444 | 0.1% |
| Peruvian | 2,435 | 0.3% |
| Polish | 22,317 | 2.4% |
| Portuguese | 4,580 | 0.5% |
| Potawatomi | 28 | 0.0% |
| Puerto Rican | 50,855 | 5.4% |
| Romanian | 808 | 0.1% |
| Russian | 4,995 | 0.5% |
| Salvadoran | 1,128 | 0.1% |
| Samoan | 267 | 0.0% |
| Scandinavian | 2,397 | 0.3% |
| Scotch-Irish | 8,341 | 0.9% |
| Scottish | 15,202 | 1.6% |
| Seminole | 106 | 0.0% |
| Serbian | 181 | 0.0% |
| Shoshone | 4 | 0.0% |
| Sioux | 192 | 0.0% |
| Slavic | 367 | 0.0% |
| Slovak | 1,429 | 0.2% |
| Slovene | 553 | 0.1% |
| Somali | 28 | 0.0% |
| South African | 672 | 0.1% |
| South American | 13,360 | 1.4% |
| South American Indian | 59 | 0.0% |
| Soviet Union | 39 | 0.0% |
| Spaniard | 1,600 | 0.2% |
| Spanish | 1,332 | 0.1% |
| Spanish American | 6 | 0.0% |
| Spanish American Indian | 6 | 0.0% |
| Sri Lankan | 3,313 | 0.4% |
| Subsaharan African | 8,434 | 0.9% |
| Swedish | 6,528 | 0.7% |
| Swiss | 1,613 | 0.2% |
| Syrian | 559 | 0.1% |
| Thai | 3,335 | 0.4% |
| Trinidadian and Tobagonian | 417 | 0.0% |
| Turkish | 189 | 0.0% |
| U.S. Virgin Islander | 3 | 0.0% |
| Ukrainian | 3,215 | 0.3% |
| Uruguayan | 414 | 0.0% |
| Venezuelan | 1,994 | 0.2% |
| Vietnamese | 163 | 0.0% |
| Welsh | 5,422 | 0.6% |
| West Indian | 769 | 0.1% |
| Yugoslavian | 316 | 0.0% | View All 162 Rows |
Immigrants in Area Code 386
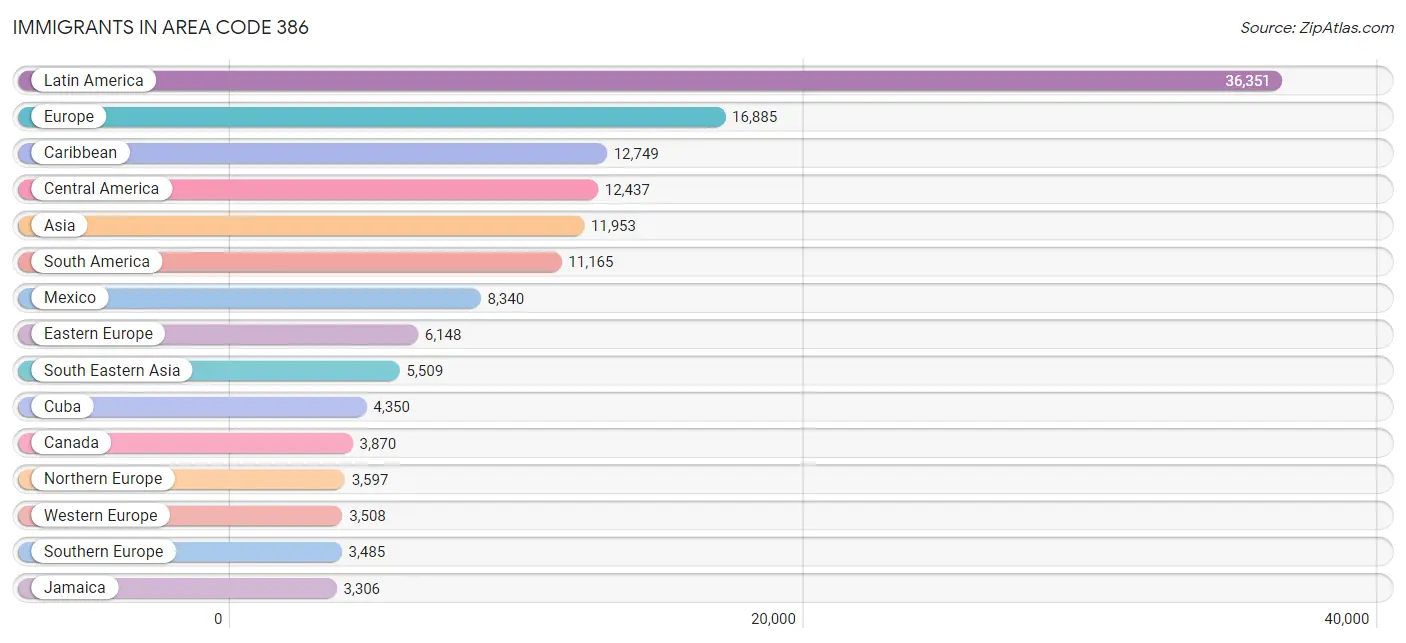
The most numerous immigrant groups reported in Area Code 386 came from Latin America (36,351 | 3.8%), Europe (16,885 | 1.8%), Caribbean (12,749 | 1.3%), Central America (12,437 | 1.3%), and Asia (11,953 | 1.3%), together accounting for 9.6% of all Area Code 386 residents.
| Immigration Origin | # Population | % Population |
| Afghanistan | 15 | 0.0% |
| Africa | 2,965 | 0.3% |
| Albania | 98 | 0.0% |
| Argentina | 453 | 0.1% |
| Armenia | 19 | 0.0% |
| Asia | 11,953 | 1.3% |
| Australia | 233 | 0.0% |
| Austria | 106 | 0.0% |
| Azores | 38 | 0.0% |
| Bahamas | 313 | 0.0% |
| Bangladesh | 249 | 0.0% |
| Barbados | 145 | 0.0% |
| Belarus | 106 | 0.0% |
| Belgium | 103 | 0.0% |
| Belize | 69 | 0.0% |
| Bolivia | 92 | 0.0% |
| Bosnia and Herzegovina | 23 | 0.0% |
| Brazil | 1,803 | 0.2% |
| Bulgaria | 21 | 0.0% |
| Cambodia | 61 | 0.0% |
| Cameroon | 46 | 0.0% |
| Canada | 3,870 | 0.4% |
| Caribbean | 12,749 | 1.3% |
| Central America | 12,437 | 1.3% |
| Chile | 186 | 0.0% |
| China | 1,443 | 0.2% |
| Colombia | 2,632 | 0.3% |
| Costa Rica | 304 | 0.0% |
| Croatia | 259 | 0.0% |
| Cuba | 4,350 | 0.5% |
| Czechoslovakia | 468 | 0.1% |
| Denmark | 67 | 0.0% |
| Dominica | 256 | 0.0% |
| Dominican Republic | 1,728 | 0.2% |
| Eastern Africa | 331 | 0.0% |
| Eastern Asia | 3,163 | 0.3% |
| Eastern Europe | 6,148 | 0.6% |
| Ecuador | 1,050 | 0.1% |
| Egypt | 910 | 0.1% |
| El Salvador | 825 | 0.1% |
| England | 1,371 | 0.2% |
| Ethiopia | 9 | 0.0% |
| Europe | 16,885 | 1.8% |
| Fiji | 64 | 0.0% |
| France | 239 | 0.0% |
| Germany | 2,575 | 0.3% |
| Ghana | 13 | 0.0% |
| Greece | 222 | 0.0% |
| Grenada | 148 | 0.0% |
| Guatemala | 773 | 0.1% |
| Guyana | 1,097 | 0.1% |
| Haiti | 1,377 | 0.2% |
| Honduras | 907 | 0.1% |
| Hong Kong | 59 | 0.0% |
| Hungary | 640 | 0.1% |
| India | 1,169 | 0.1% |
| Indonesia | 80 | 0.0% |
| Iran | 365 | 0.0% |
| Iraq | 59 | 0.0% |
| Ireland | 198 | 0.0% |
| Israel | 96 | 0.0% |
| Italy | 1,112 | 0.1% |
| Jamaica | 3,306 | 0.4% |
| Japan | 388 | 0.0% |
| Jordan | 48 | 0.0% |
| Kazakhstan | 247 | 0.0% |
| Kenya | 103 | 0.0% |
| Korea | 1,235 | 0.1% |
| Kuwait | 34 | 0.0% |
| Laos | 215 | 0.0% |
| Latin America | 36,351 | 3.8% |
| Latvia | 68 | 0.0% |
| Lebanon | 61 | 0.0% |
| Lithuania | 118 | 0.0% |
| Malaysia | 54 | 0.0% |
| Mexico | 8,340 | 0.9% |
| Middle Africa | 463 | 0.1% |
| Moldova | 24 | 0.0% |
| Morocco | 98 | 0.0% |
| Netherlands | 303 | 0.0% |
| Nicaragua | 645 | 0.1% |
| Nigeria | 512 | 0.1% |
| North Macedonia | 84 | 0.0% |
| Northern Africa | 1,053 | 0.1% |
| Northern Europe | 3,597 | 0.4% |
| Norway | 74 | 0.0% |
| Oceania | 384 | 0.0% |
| Pakistan | 237 | 0.0% |
| Panama | 569 | 0.1% |
| Peru | 1,793 | 0.2% |
| Philippines | 2,753 | 0.3% |
| Poland | 1,043 | 0.1% |
| Portugal | 1,550 | 0.2% |
| Romania | 504 | 0.1% |
| Russia | 1,415 | 0.2% |
| Saudi Arabia | 251 | 0.0% |
| Scotland | 318 | 0.0% |
| Serbia | 75 | 0.0% |
| Sierra Leone | 58 | 0.0% |
| Somalia | 39 | 0.0% |
| South Africa | 235 | 0.0% |
| South America | 11,165 | 1.2% |
| South Central Asia | 2,398 | 0.3% |
| South Eastern Asia | 5,509 | 0.6% |
| Southern Europe | 3,485 | 0.4% |
| Spain | 585 | 0.1% |
| Sri Lanka | 56 | 0.0% |
| St. Vincent and the Grenadines | 45 | 0.0% |
| Sweden | 138 | 0.0% |
| Switzerland | 141 | 0.0% |
| Syria | 151 | 0.0% |
| Taiwan | 161 | 0.0% |
| Thailand | 470 | 0.1% |
| Trinidad and Tobago | 706 | 0.1% |
| Turkey | 68 | 0.0% |
| Uganda | 2 | 0.0% |
| Ukraine | 979 | 0.1% |
| Uruguay | 188 | 0.0% |
| Uzbekistan | 60 | 0.0% |
| Venezuela | 1,606 | 0.2% |
| Vietnam | 1,827 | 0.2% |
| West Indies | 88 | 0.0% |
| Western Africa | 658 | 0.1% |
| Western Asia | 819 | 0.1% |
| Western Europe | 3,508 | 0.4% | View All 125 Rows |
Sex and Age in Area Code 386
Sex and Age in Area Code 386
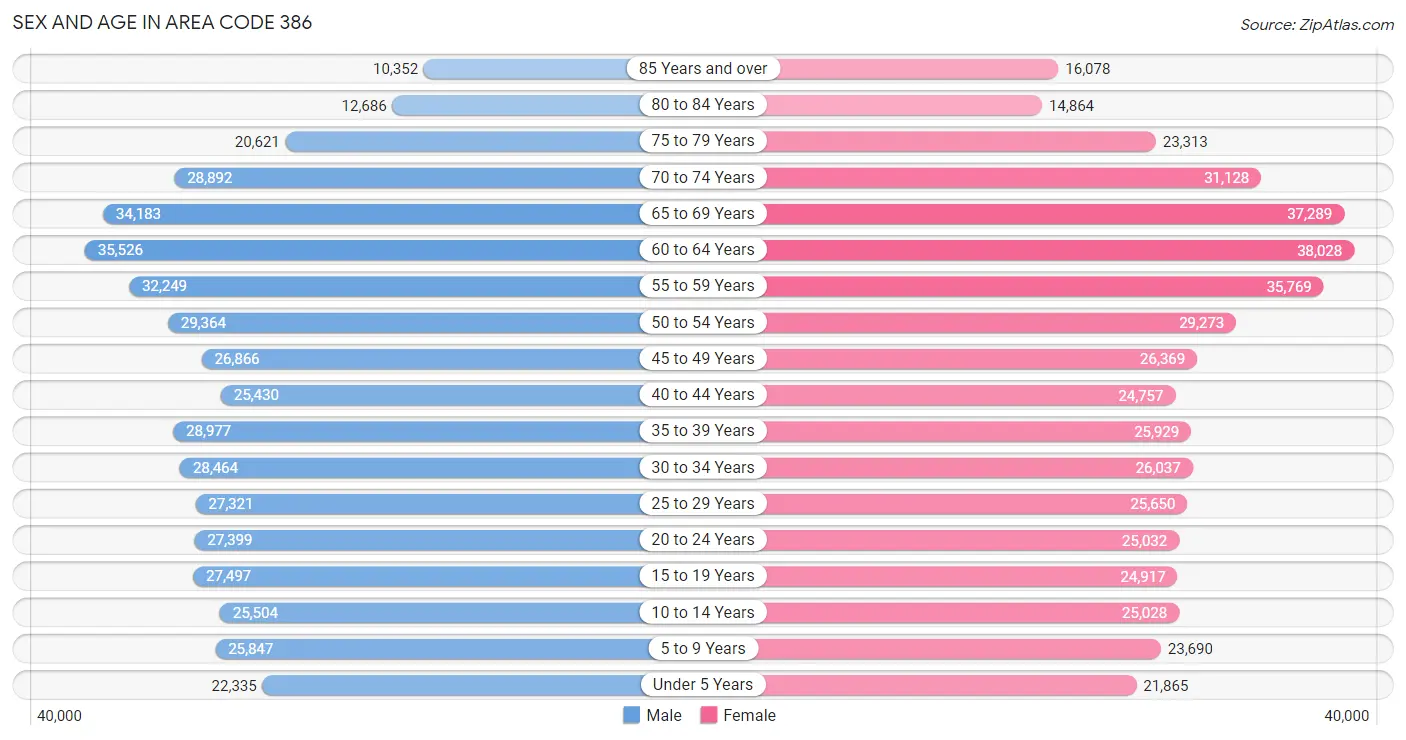
The most populous age groups in Area Code 386 are 60 to 64 Years (35,526 | 7.6%) for men and 60 to 64 Years (38,028 | 8.0%) for women.
| Age Bracket | Male | Female |
| Under 5 Years | 22,335 (4.8%) | 21,865 (4.6%) |
| 5 to 9 Years | 25,847 (5.5%) | 23,690 (5.0%) |
| 10 to 14 Years | 25,504 (5.4%) | 25,028 (5.3%) |
| 15 to 19 Years | 27,497 (5.9%) | 24,917 (5.2%) |
| 20 to 24 Years | 27,399 (5.8%) | 25,032 (5.3%) |
| 25 to 29 Years | 27,321 (5.8%) | 25,650 (5.4%) |
| 30 to 34 Years | 28,464 (6.1%) | 26,037 (5.5%) |
| 35 to 39 Years | 28,977 (6.2%) | 25,929 (5.5%) |
| 40 to 44 Years | 25,430 (5.4%) | 24,757 (5.2%) |
| 45 to 49 Years | 26,866 (5.7%) | 26,369 (5.6%) |
| 50 to 54 Years | 29,364 (6.2%) | 29,273 (6.2%) |
| 55 to 59 Years | 32,249 (6.9%) | 35,769 (7.5%) |
| 60 to 64 Years | 35,526 (7.6%) | 38,028 (8.0%) |
| 65 to 69 Years | 34,183 (7.3%) | 37,289 (7.9%) |
| 70 to 74 Years | 28,892 (6.1%) | 31,128 (6.6%) |
| 75 to 79 Years | 20,621 (4.4%) | 23,313 (4.9%) |
| 80 to 84 Years | 12,686 (2.7%) | 14,864 (3.1%) |
| 85 Years and over | 10,352 (2.2%) | 16,078 (3.4%) |
| Total | 469,513 (100.0%) | 475,016 (100.0%) |
Families and Households in Area Code 386
Median Family Size in Area Code 386
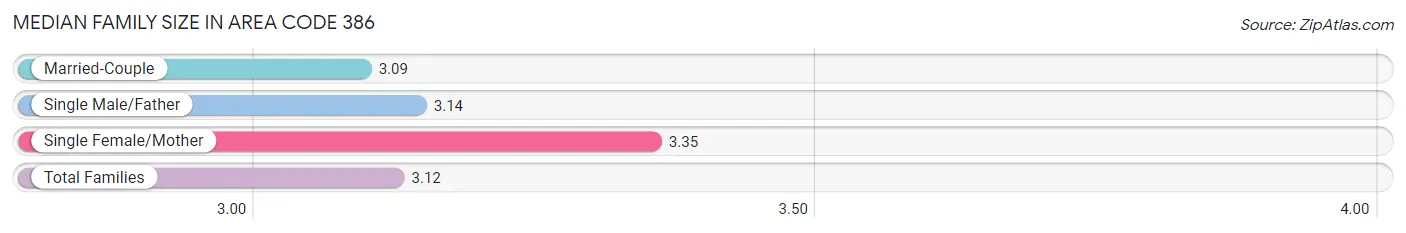
The median family size in Area Code 386 is 3.12 persons per family, with single female/mother families (44,668 | 18.4%) accounting for the largest median family size of 3.3535 persons per family. On the other hand, married-couple families (177,666 | 73.4%) represent the smallest median family size with 3.09 persons per family.
| Family Type | # Families | Family Size |
| Married-Couple | 177,666 (73.4%) | 3.09 |
| Single Male/Father | 19,741 (8.2%) | 3.14 |
| Single Female/Mother | 44,668 (18.4%) | 3.35 |
| Total Families | 242,075 (100.0%) | 3.12 |
Median Household Size in Area Code 386
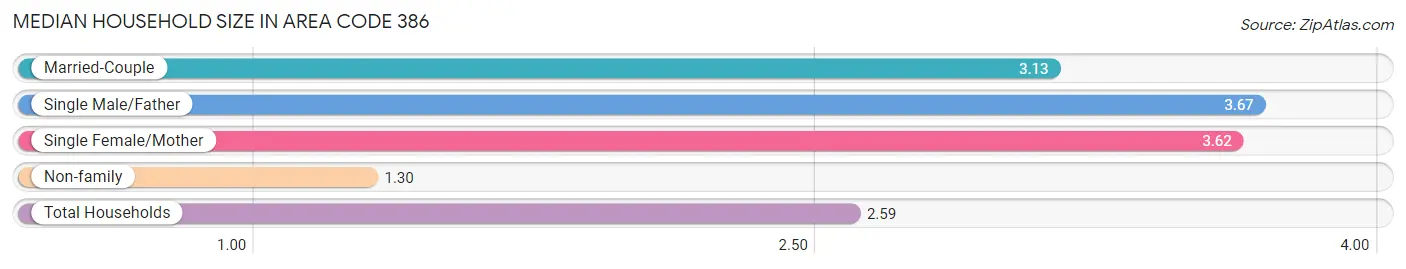
The median household size in Area Code 386 is 2.59 persons per household, with single male/father households (19,741 | 5.2%) accounting for the largest median household size of 3.67491 persons per household. non-family households (135,802 | 35.9%) represent the smallest median household size with 1.30 persons per household.
| Household Type | # Households | Household Size |
| Married-Couple | 177,666 (47.0%) | 3.13 |
| Single Male/Father | 19,741 (5.2%) | 3.67 |
| Single Female/Mother | 44,668 (11.8%) | 3.62 |
| Non-family | 135,802 (35.9%) | 1.30 |
| Total Households | 377,877 (100.0%) | 2.59 |
Household Size by Marriage Status in Area Code 386
Out of a total of 377,877 households in Area Code 386, 242,075 (64.1%) are family households, while 135,802 (35.9%) are nonfamily households. The most numerous type of family households are 2-person households, comprising 127,106, and the most common type of nonfamily households are 1-person households, comprising 108,048.
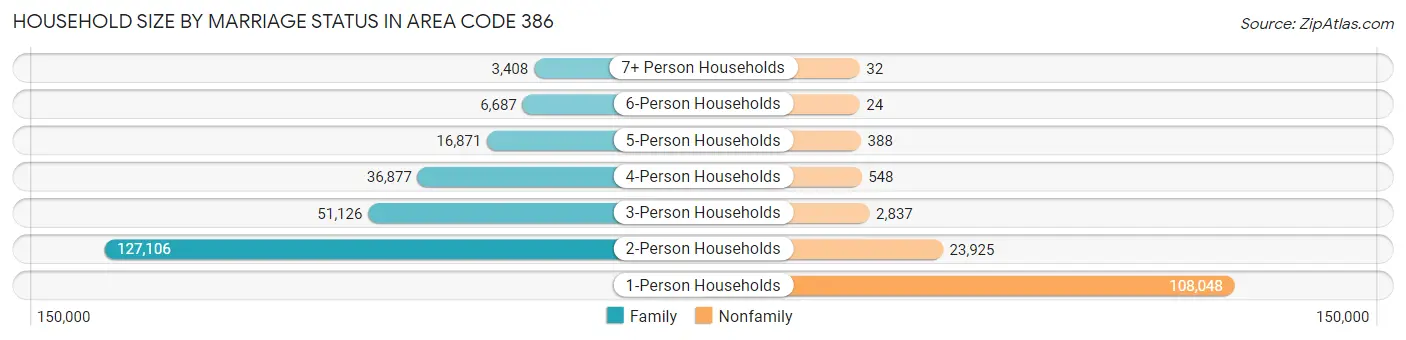
| Household Size | Family Households | Nonfamily Households |
| 1-Person Households | - | 108,048 (28.6%) |
| 2-Person Households | 127,106 (33.6%) | 23,925 (6.3%) |
| 3-Person Households | 51,126 (13.5%) | 2,837 (0.7%) |
| 4-Person Households | 36,877 (9.8%) | 548 (0.2%) |
| 5-Person Households | 16,871 (4.5%) | 388 (0.1%) |
| 6-Person Households | 6,687 (1.8%) | 24 (0.0%) |
| 7+ Person Households | 3,408 (0.9%) | 32 (0.0%) |
| Total | 242,075 (64.1%) | 135,802 (35.9%) |
Female Fertility in Area Code 386
Fertility by Age in Area Code 386
Average fertility rate in Area Code 386 is 61.9 births per 1,000 women. Women in the age bracket of 20 to 34 years have the highest fertility rate with 118.1 births per 1,000 women. Women in the age bracket of 20 to 34 years acount for 72.7% of all women with births.
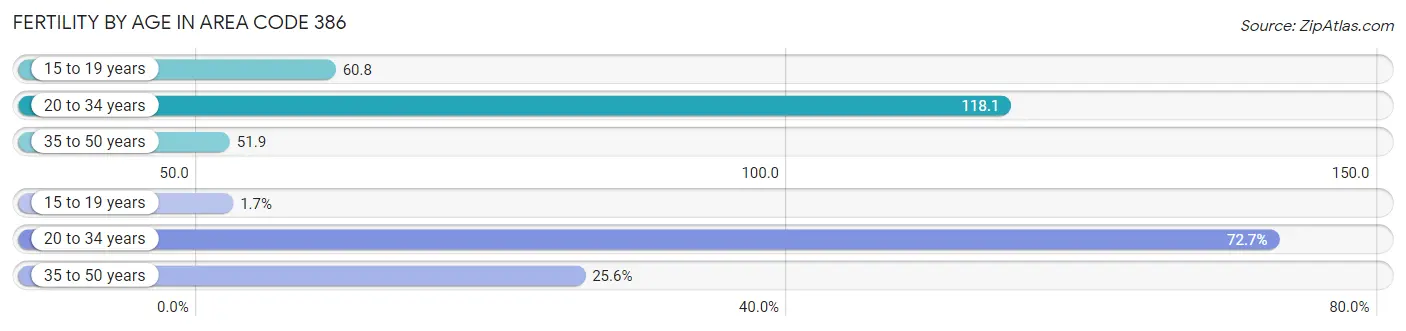
| Age Bracket | Women with Births | Births / 1,000 Women |
| 15 to 19 years | 143 (1.7%) | 60.8 |
| 20 to 34 years | 6,088 (72.7%) | 118.1 |
| 35 to 50 years | 2,144 (25.6%) | 51.9 |
| Total | 8,375 (100.0%) | 61.9 |
Fertility by Age by Marriage Status in Area Code 386
48.0% of women with births (8,375) in Area Code 386 are married. The highest percentage of unmarried women with births falls into 15 to 19 years age bracket with 100.0% of them unmarried at the time of birth, while the lowest percentage of unmarried women with births belong to 20 to 34 years age bracket with 60.0% of them unmarried.
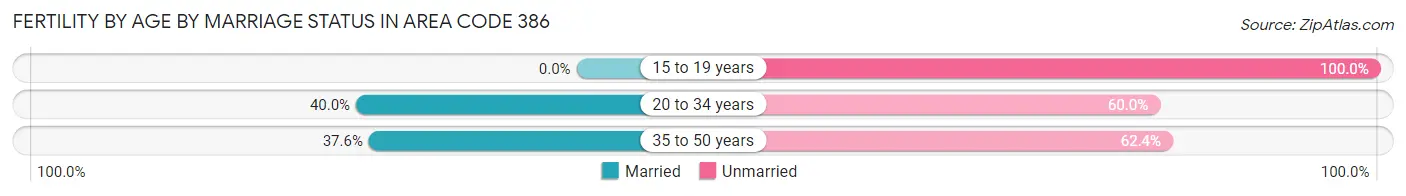
| Age Bracket | Married | Unmarried |
| 15 to 19 years | 0 (0.0%) | 143 (100.0%) |
| 20 to 34 years | 2,433 (40.0%) | 3,655 (60.0%) |
| 35 to 50 years | 807 (37.6%) | 1,337 (62.4%) |
| Total | 4,020 (48.0%) | 4,355 (52.0%) |
Fertility by Education in Area Code 386
Average fertility rate in Area Code 386 is 61.9 births per 1,000 women. Women with the education attainment of less than high school have the highest fertility rate of 167.4 births per 1,000 women, while women with the education attainment of college or associate's degree have the lowest fertility at 69.9 births per 1,000 women. Women with the education attainment of high school diploma represent 34.9% of all women with births.
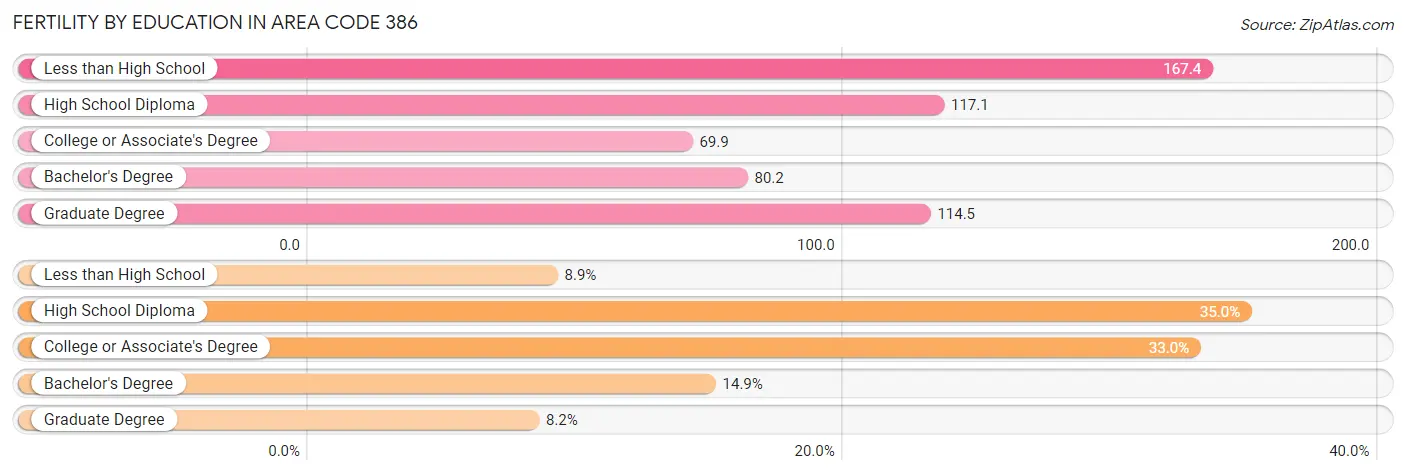
| Educational Attainment | Women with Births | Births / 1,000 Women |
| Less than High School | 748 (8.9%) | 167.4 |
| High School Diploma | 2,927 (34.9%) | 117.1 |
| College or Associate's Degree | 2,767 (33.0%) | 69.9 |
| Bachelor's Degree | 1,244 (14.8%) | 80.2 |
| Graduate Degree | 689 (8.2%) | 114.5 |
| Total | 8,375 (100.0%) | 61.9 |
Fertility by Education by Marriage Status in Area Code 386
52.0% of women with births in Area Code 386 are unmarried. Women with the educational attainment of bachelor's degree are most likely to be married with 44.8% of them married at childbirth, while women with the educational attainment of less than high school are least likely to be married with 89.8% of them unmarried at childbirth.
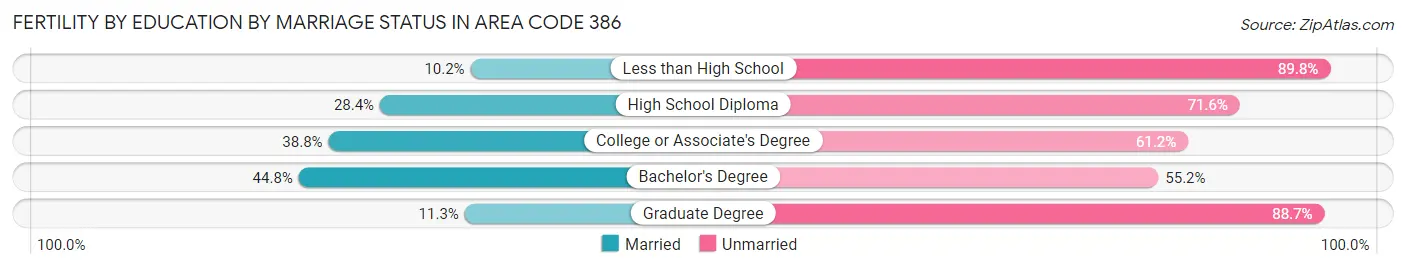
| Educational Attainment | Married | Unmarried |
| Less than High School | 76 (10.2%) | 672 (89.8%) |
| High School Diploma | 831 (28.4%) | 2,096 (71.6%) |
| College or Associate's Degree | 1,073 (38.8%) | 1,694 (61.2%) |
| Bachelor's Degree | 557 (44.8%) | 687 (55.2%) |
| Graduate Degree | 78 (11.3%) | 611 (88.7%) |
| Total | 4,020 (48.0%) | 4,355 (52.0%) |
Employment Characteristics in Area Code 386
Employment by Class of Employer in Area Code 386
Among the 387,552 employed individuals in Area Code 386, private company employees (262,332 | 67.7%), local government employees (29,140 | 7.5%), and not-for-profit organizations (24,950 | 6.4%) make up the most common classes of employment.
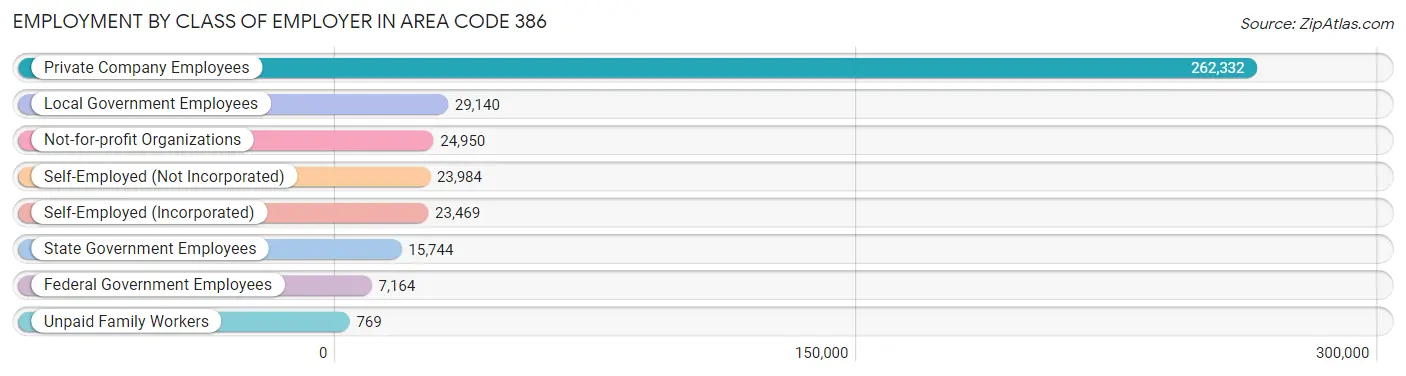
| Employer Class | # Employees | % Employees |
| Private Company Employees | 262,332 | 67.7% |
| Self-Employed (Incorporated) | 23,469 | 6.1% |
| Self-Employed (Not Incorporated) | 23,984 | 6.2% |
| Not-for-profit Organizations | 24,950 | 6.4% |
| Local Government Employees | 29,140 | 7.5% |
| State Government Employees | 15,744 | 4.1% |
| Federal Government Employees | 7,164 | 1.8% |
| Unpaid Family Workers | 769 | 0.2% |
| Total | 387,552 | 100.0% |
Employment Status by Age in Area Code 386
According to the labor force statistics for Area Code 386, out of the total population over 16 years of age (790,035), 49.3% or 389,408 individuals are in the labor force, with 5.4% or 20,989 of them unemployed. The age group with the highest labor force participation rate is 25 to 29 years, with 77.8% or 41,211 individuals in the labor force. Within the labor force, the 16 to 19 years age range has the highest percentage of unemployed individuals, with 889.2% or 142,814 of them being unemployed.
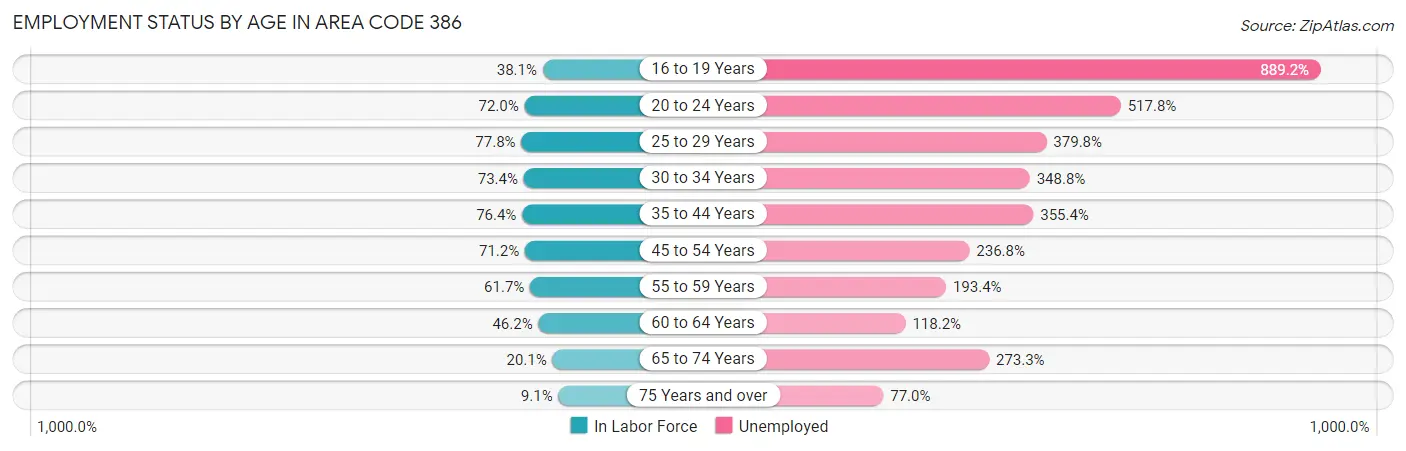
| Age Bracket | In Labor Force | Unemployed |
| 16 to 19 Years | 16,060 (38.1%) | 142,814 (889.2%) |
| 20 to 24 Years | 37,742 (72.0%) | 195,418 (517.8%) |
| 25 to 29 Years | 41,210 (77.8%) | 156,519 (379.8%) |
| 30 to 34 Years | 40,014 (73.4%) | 139,572 (348.8%) |
| 35 to 44 Years | 80,284 (76.4%) | 285,319 (355.4%) |
| 45 to 54 Years | 79,599 (71.2%) | 188,486 (236.8%) |
| 55 to 59 Years | 41,941 (61.7%) | 81,112 (193.4%) |
| 60 to 64 Years | 33,963 (46.2%) | 40,141 (118.2%) |
| 65 to 74 Years | 26,390 (20.1%) | 72,124 (273.3%) |
| 75 Years and over | 8,866 (9.1%) | 6,831 (77.0%) |
| Total | 389,425 (49.3%) | 20,980 (5.4%) |
Employment Status by Educational Attainment in Area Code 386
According to labor force statistics for Area Code 386, 66.8% of individuals (311,341) out of the total population between 25 and 64 years of age (466,009) are in the labor force, with 275.8% or 858,678 of them being unemployed. The group with the highest labor force participation rate are those with the educational attainment of bachelor's degree or higher, with 78.8% or 85,398 individuals in the labor force. Within the labor force, individuals with less than high school education have the highest percentage of unemployment, with 477.4% or 123,709 of them being unemployed.
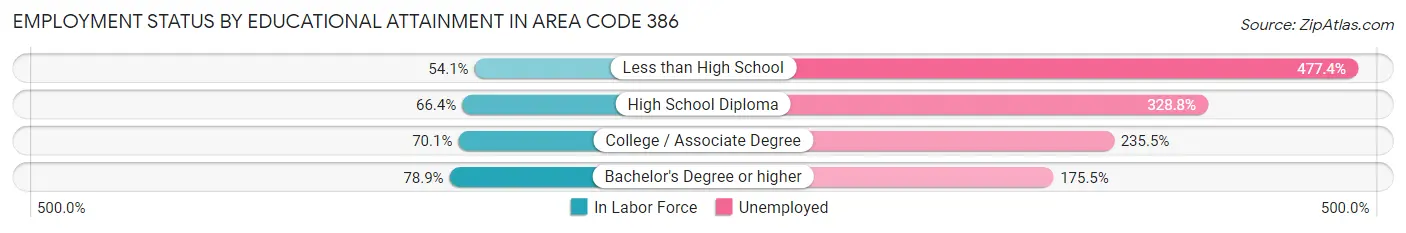
| Educational Attainment | In Labor Force | Unemployed |
| Less than High School | 25,913 (54.1%) | 228,622 (477.4%) |
| High School Diploma | 100,406 (66.4%) | 497,409 (328.8%) |
| College / Associate Degree | 111,181 (70.1%) | 373,352 (235.5%) |
| Bachelor's Degree or higher | 85,393 (78.8%) | 190,074 (175.5%) |
| Total | 311,361 (66.8%) | 1,285,253 (275.8%) |
Employment Occupations by Sex in Area Code 386
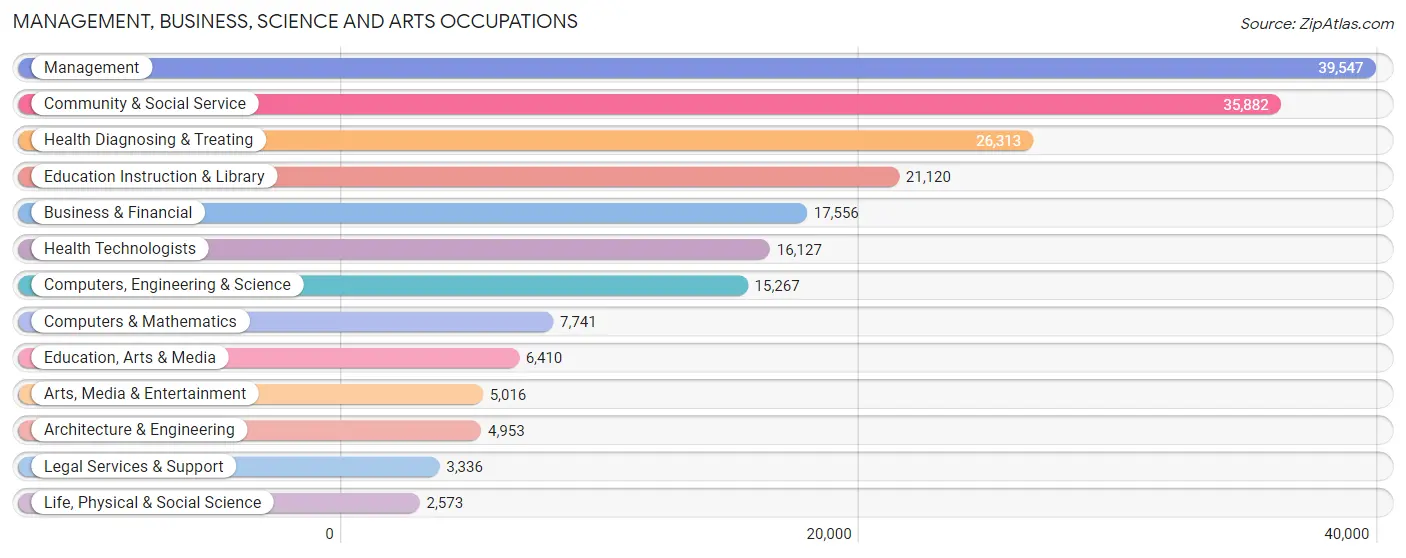
Management, Business, Science and Arts Occupations
The most common Management, Business, Science and Arts occupations in Area Code 386 are Management (39,547 | 10.1%), Community & Social Service (35,882 | 9.1%), Health Diagnosing & Treating (26,313 | 6.7%), Education Instruction & Library (21,120 | 5.4%), and Business & Financial (17,556 | 4.5%).
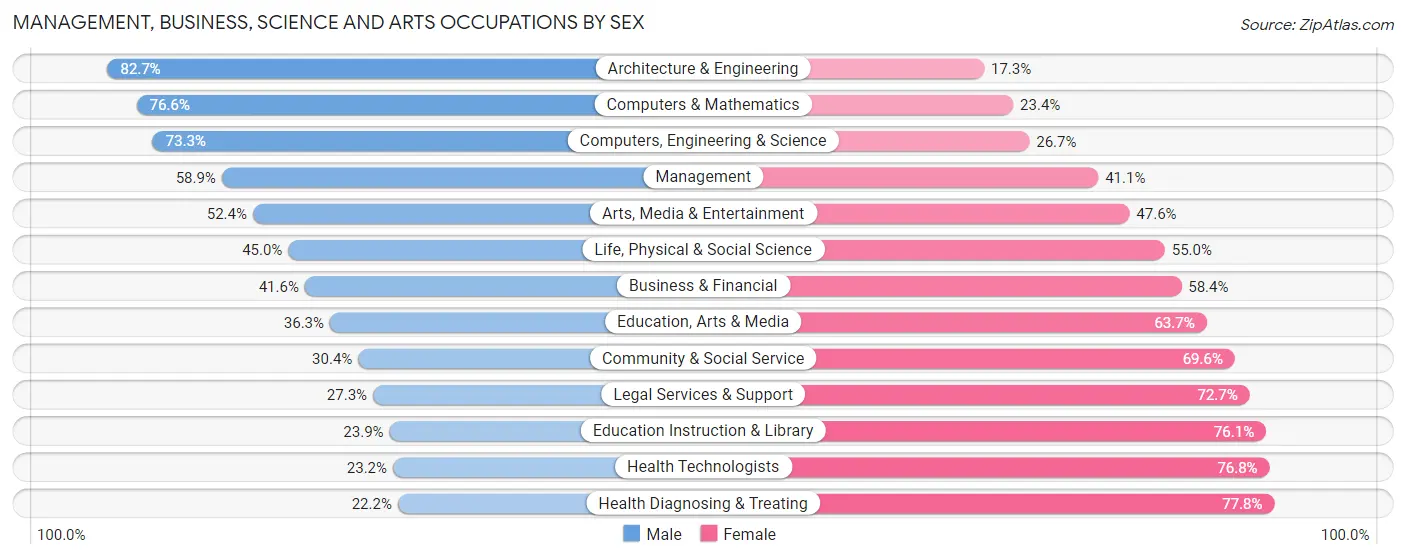
Management, Business, Science and Arts Occupations by Sex
Within the Management, Business, Science and Arts occupations in Area Code 386, the most male-oriented occupations are Architecture & Engineering (82.7%), Computers & Mathematics (76.6%), and Computers, Engineering & Science (73.3%), while the most female-oriented occupations are Health Diagnosing & Treating (77.8%), Health Technologists (76.8%), and Education Instruction & Library (76.1%).
| Occupation | Male | Female |
| Management | 23,289 (58.9%) | 16,258 (41.1%) |
| Business & Financial | 7,297 (41.6%) | 10,259 (58.4%) |
| Computers, Engineering & Science | 11,188 (73.3%) | 4,079 (26.7%) |
| Computers & Mathematics | 5,933 (76.6%) | 1,808 (23.4%) |
| Architecture & Engineering | 4,097 (82.7%) | 856 (17.3%) |
| Life, Physical & Social Science | 1,158 (45.0%) | 1,415 (55.0%) |
| Community & Social Service | 10,915 (30.4%) | 24,967 (69.6%) |
| Education, Arts & Media | 2,328 (36.3%) | 4,082 (63.7%) |
| Legal Services & Support | 912 (27.3%) | 2,424 (72.7%) |
| Education Instruction & Library | 5,047 (23.9%) | 16,073 (76.1%) |
| Arts, Media & Entertainment | 2,628 (52.4%) | 2,388 (47.6%) |
| Health Diagnosing & Treating | 5,831 (22.2%) | 20,482 (77.8%) |
| Health Technologists | 3,739 (23.2%) | 12,388 (76.8%) |
| Total (Category) | 58,520 (43.5%) | 76,045 (56.5%) |
| Total (Overall) | 202,945 (51.6%) | 190,071 (48.4%) |
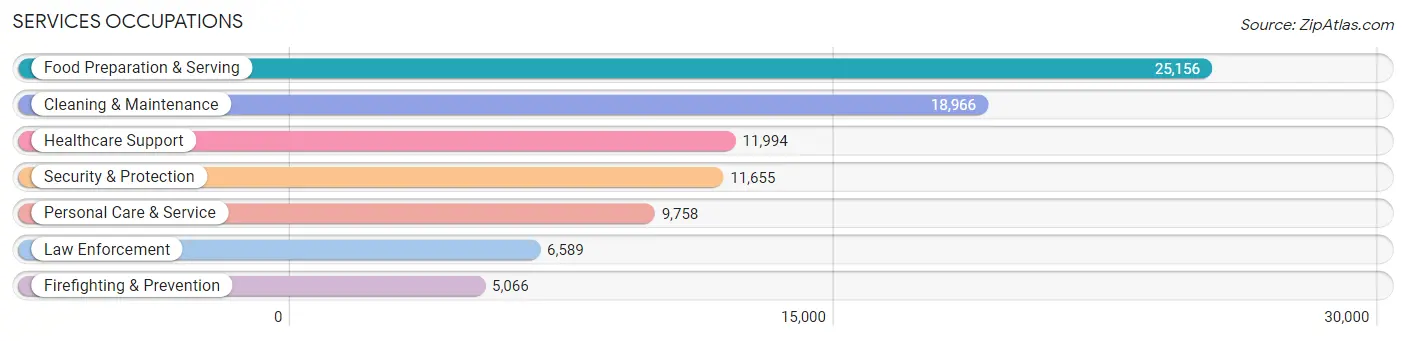
Services Occupations
The most common Services occupations in Area Code 386 are Food Preparation & Serving (25,156 | 6.4%), Cleaning & Maintenance (18,966 | 4.8%), Healthcare Support (11,994 | 3.0%), Security & Protection (11,655 | 3.0%), and Personal Care & Service (9,758 | 2.5%).
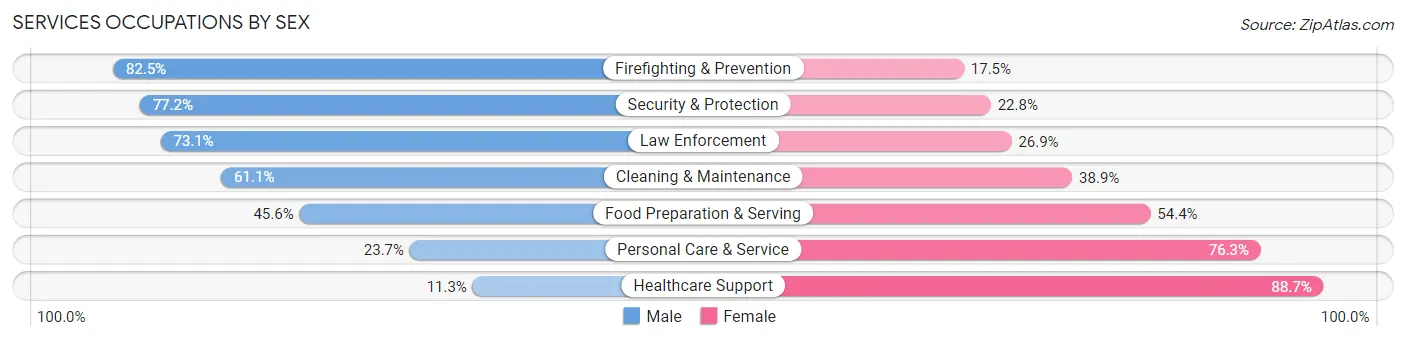
Services Occupations by Sex
Within the Services occupations in Area Code 386, the most male-oriented occupations are Firefighting & Prevention (82.5%), Security & Protection (77.2%), and Law Enforcement (73.1%), while the most female-oriented occupations are Healthcare Support (88.7%), Personal Care & Service (76.3%), and Food Preparation & Serving (54.4%).
| Occupation | Male | Female |
| Healthcare Support | 1,352 (11.3%) | 10,642 (88.7%) |
| Security & Protection | 8,996 (77.2%) | 2,659 (22.8%) |
| Firefighting & Prevention | 4,180 (82.5%) | 886 (17.5%) |
| Law Enforcement | 4,816 (73.1%) | 1,773 (26.9%) |
| Food Preparation & Serving | 11,464 (45.6%) | 13,692 (54.4%) |
| Cleaning & Maintenance | 11,582 (61.1%) | 7,384 (38.9%) |
| Personal Care & Service | 2,314 (23.7%) | 7,444 (76.3%) |
| Total (Category) | 35,708 (46.1%) | 41,821 (53.9%) |
| Total (Overall) | 202,945 (51.6%) | 190,071 (48.4%) |
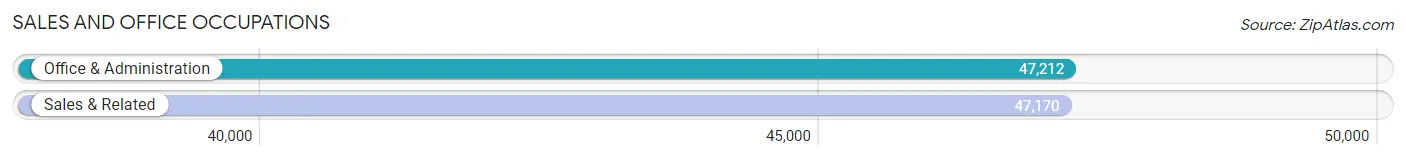
Sales and Office Occupations
The most common Sales and Office occupations in Area Code 386 are Office & Administration (47,212 | 12.0%), and Sales & Related (47,170 | 12.0%).
Sales and Office Occupations by Sex
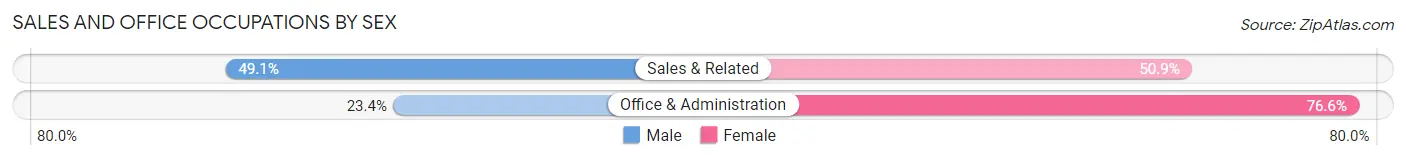
| Occupation | Male | Female |
| Sales & Related | 23,157 (49.1%) | 24,013 (50.9%) |
| Office & Administration | 11,027 (23.4%) | 36,185 (76.6%) |
| Total (Category) | 34,184 (36.2%) | 60,198 (63.8%) |
| Total (Overall) | 202,945 (51.6%) | 190,071 (48.4%) |
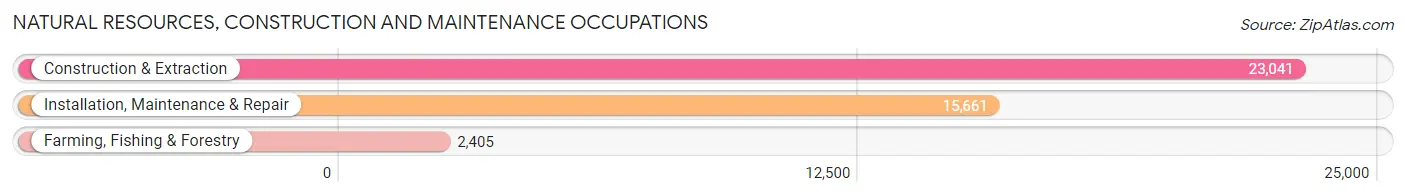
Natural Resources, Construction and Maintenance Occupations
The most common Natural Resources, Construction and Maintenance occupations in Area Code 386 are Construction & Extraction (23,041 | 5.9%), Installation, Maintenance & Repair (15,661 | 4.0%), and Farming, Fishing & Forestry (2,405 | 0.6%).
Natural Resources, Construction and Maintenance Occupations by Sex
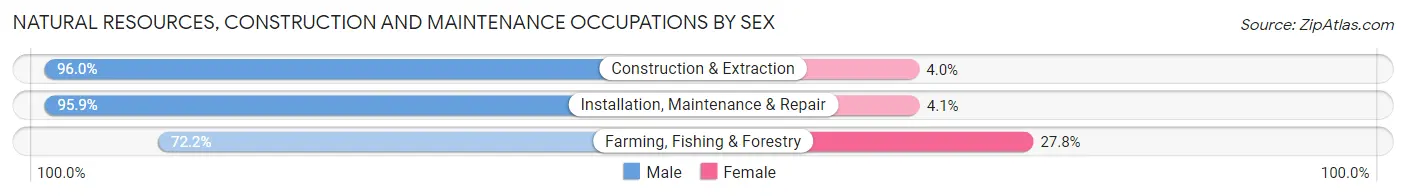
| Occupation | Male | Female |
| Farming, Fishing & Forestry | 1,737 (72.2%) | 668 (27.8%) |
| Construction & Extraction | 22,111 (96.0%) | 930 (4.0%) |
| Installation, Maintenance & Repair | 15,013 (95.9%) | 648 (4.1%) |
| Total (Category) | 38,861 (94.5%) | 2,246 (5.5%) |
| Total (Overall) | 202,945 (51.6%) | 190,071 (48.4%) |
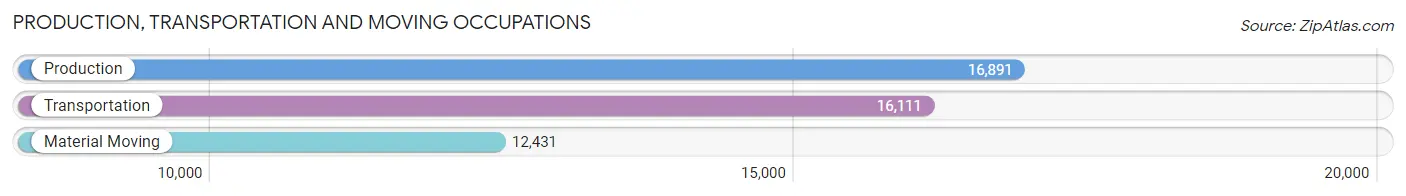
Production, Transportation and Moving Occupations
The most common Production, Transportation and Moving occupations in Area Code 386 are Production (16,891 | 4.3%), Transportation (16,111 | 4.1%), and Material Moving (12,431 | 3.2%).
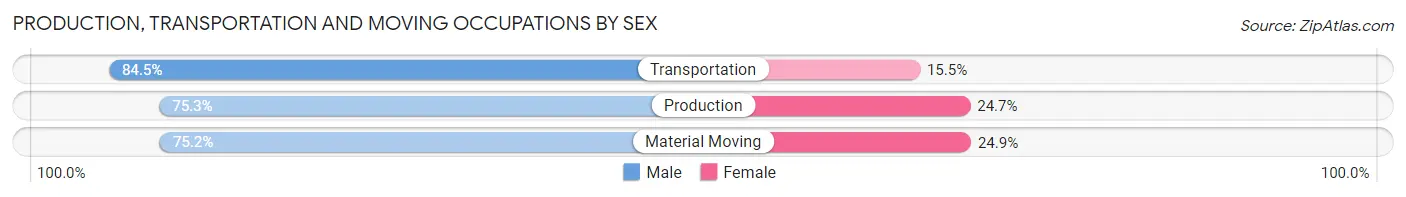
Production, Transportation and Moving Occupations by Sex
| Occupation | Male | Female |
| Production | 12,715 (75.3%) | 4,176 (24.7%) |
| Transportation | 13,615 (84.5%) | 2,496 (15.5%) |
| Material Moving | 9,342 (75.1%) | 3,089 (24.8%) |
| Total (Category) | 35,672 (78.5%) | 9,761 (21.5%) |
| Total (Overall) | 202,945 (51.6%) | 190,071 (48.4%) |
Employment Industries by Sex in Area Code 386
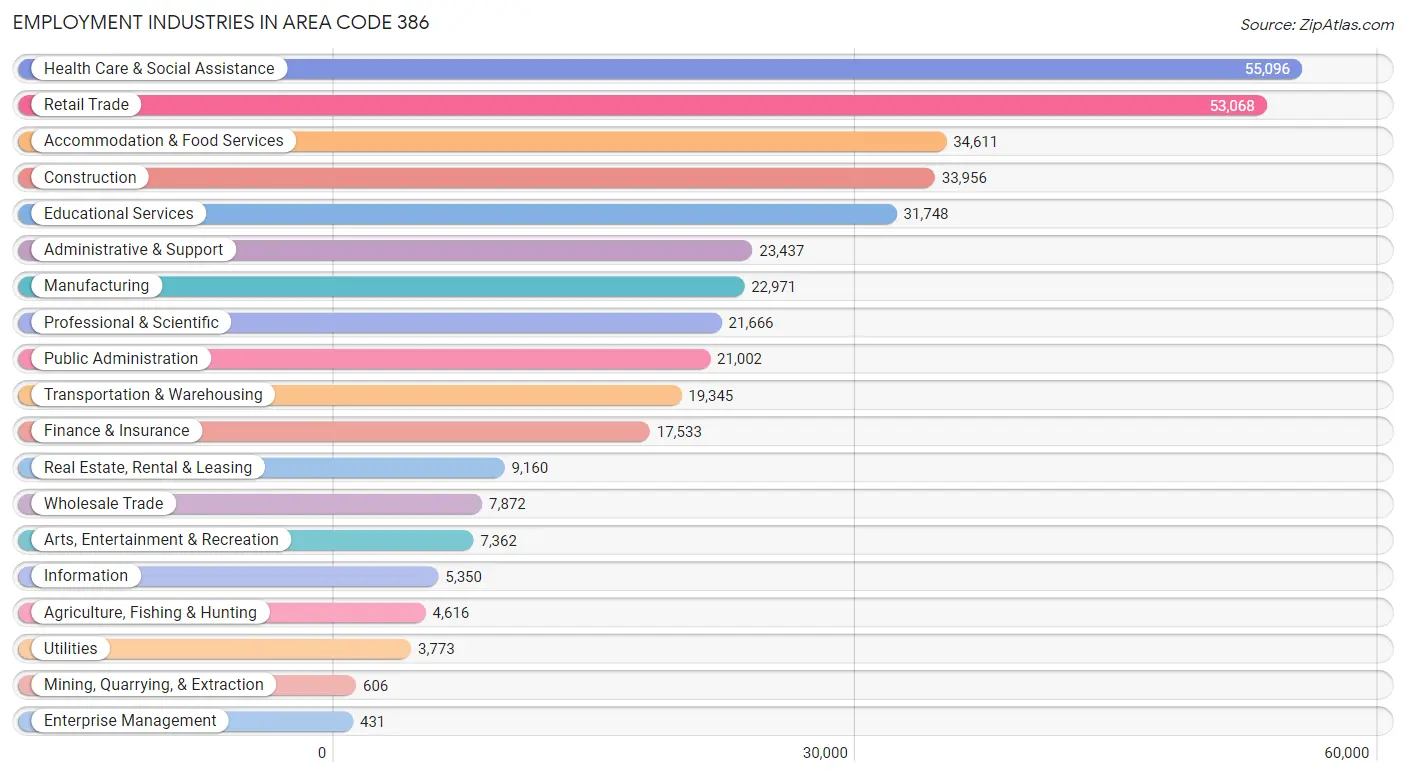
Employment Industries in Area Code 386
The major employment industries in Area Code 386 include Health Care & Social Assistance (55,096 | 14.0%), Retail Trade (53,068 | 13.5%), Accommodation & Food Services (34,611 | 8.8%), Construction (33,956 | 8.6%), and Educational Services (31,748 | 8.1%).
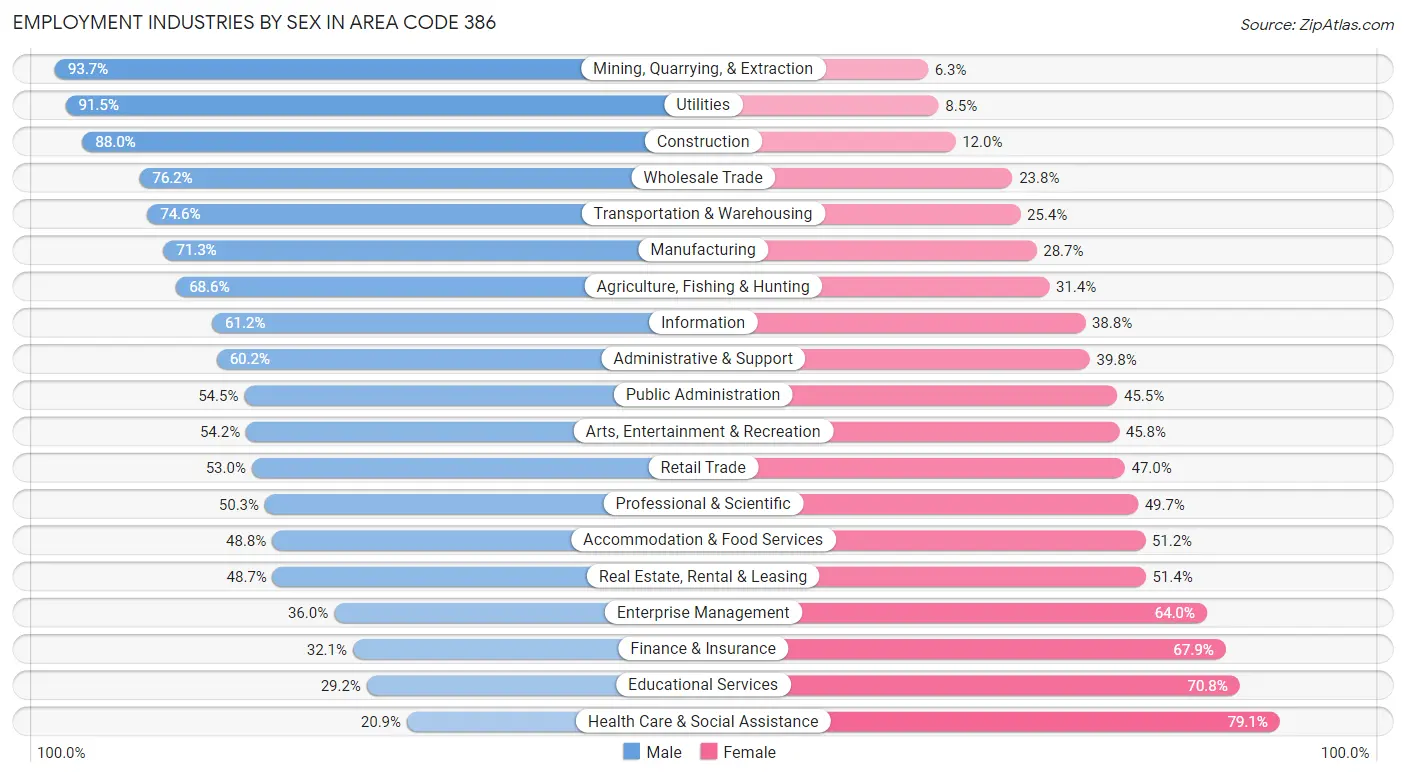
Employment Industries by Sex in Area Code 386
The Area Code 386 industries that see more men than women are Mining, Quarrying, & Extraction (93.7%), Utilities (91.5%), and Construction (88.0%), whereas the industries that tend to have a higher number of women are Health Care & Social Assistance (79.1%), Educational Services (70.8%), and Finance & Insurance (67.9%).
| Industry | Male | Female |
| Agriculture, Fishing & Hunting | 3,167 (68.6%) | 1,449 (31.4%) |
| Mining, Quarrying, & Extraction | 568 (93.7%) | 38 (6.3%) |
| Construction | 29,892 (88.0%) | 4,064 (12.0%) |
| Manufacturing | 16,369 (71.3%) | 6,602 (28.7%) |
| Wholesale Trade | 6,002 (76.2%) | 1,870 (23.8%) |
| Retail Trade | 28,122 (53.0%) | 24,946 (47.0%) |
| Transportation & Warehousing | 14,431 (74.6%) | 4,914 (25.4%) |
| Utilities | 3,453 (91.5%) | 320 (8.5%) |
| Information | 3,273 (61.2%) | 2,077 (38.8%) |
| Finance & Insurance | 5,622 (32.1%) | 11,911 (67.9%) |
| Real Estate, Rental & Leasing | 4,456 (48.6%) | 4,704 (51.3%) |
| Professional & Scientific | 10,891 (50.3%) | 10,775 (49.7%) |
| Enterprise Management | 155 (36.0%) | 276 (64.0%) |
| Administrative & Support | 14,115 (60.2%) | 9,322 (39.8%) |
| Educational Services | 9,268 (29.2%) | 22,480 (70.8%) |
| Health Care & Social Assistance | 11,503 (20.9%) | 43,593 (79.1%) |
| Arts, Entertainment & Recreation | 3,989 (54.2%) | 3,373 (45.8%) |
| Accommodation & Food Services | 16,879 (48.8%) | 17,732 (51.2%) |
| Public Administration | 11,454 (54.5%) | 9,548 (45.5%) |
| Total | 202,945 (51.6%) | 190,071 (48.4%) |
Education in Area Code 386
School Enrollment in Area Code 386
The most common levels of schooling among the 191,959 students in Area Code 386 are college / undergraduate (42,262 | 22.0%), high school (42,196 | 22.0%), and elementary school (40,571 | 21.1%).
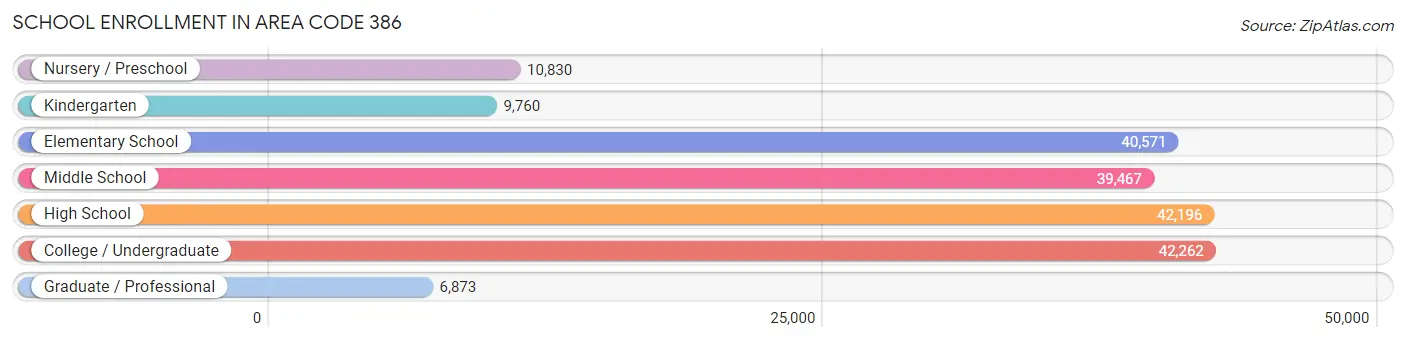
| School Level | # Students | % Students |
| Nursery / Preschool | 10,830 | 5.6% |
| Kindergarten | 9,760 | 5.1% |
| Elementary School | 40,571 | 21.1% |
| Middle School | 39,467 | 20.6% |
| High School | 42,196 | 22.0% |
| College / Undergraduate | 42,262 | 22.0% |
| Graduate / Professional | 6,873 | 3.6% |
| Total | 191,959 | 100.0% |
School Enrollment by Age by Funding Source in Area Code 386
Out of a total of 191,959 students who are enrolled in schools in Area Code 386, 42,046 (21.9%) attend a private institution, while the remaining 149,913 (78.1%) are enrolled in public schools. The age group of 20 to 24 year olds has the highest likelihood of being enrolled in private schools, with 7,430 (38.7% in the age bracket) enrolled. Conversely, the age group of 15 to 17 year olds has the lowest likelihood of being enrolled in a private school, with 26,437 (89.1% in the age bracket) attending a public institution.
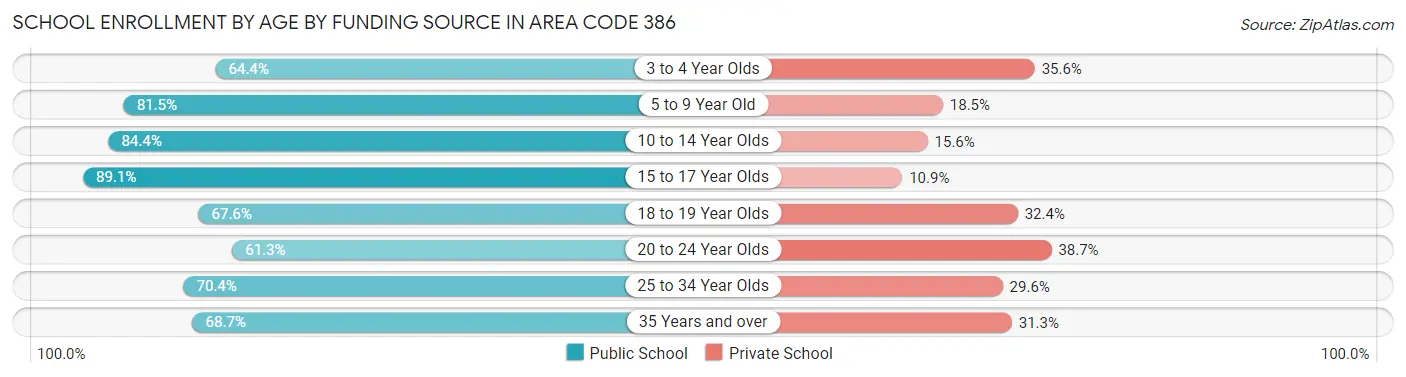
| Age Bracket | Public School | Private School |
| 3 to 4 Year Olds | 5,507 (64.4%) | 3,041 (35.6%) |
| 5 to 9 Year Old | 38,254 (81.5%) | 8,672 (18.5%) |
| 10 to 14 Year Olds | 41,569 (84.4%) | 7,702 (15.6%) |
| 15 to 17 Year Olds | 26,437 (89.1%) | 3,236 (10.9%) |
| 18 to 19 Year Olds | 10,440 (67.6%) | 5,008 (32.4%) |
| 20 to 24 Year Olds | 11,769 (61.3%) | 7,430 (38.7%) |
| 25 to 34 Year Olds | 8,151 (70.4%) | 3,429 (29.6%) |
| 35 Years and over | 7,772 (68.7%) | 3,542 (31.3%) |
| Total | 149,913 (78.1%) | 42,046 (21.9%) |
Educational Attainment by Field of Study in Area Code 386
Business (38,818 | 22.1%), education (25,851 | 14.7%), science & technology (20,408 | 11.6%), arts & humanities (12,735 | 7.2%), and engineering (10,692 | 6.1%) are the most common fields of study among 175,933 individuals in Area Code 386 who have obtained a bachelor's degree or higher.
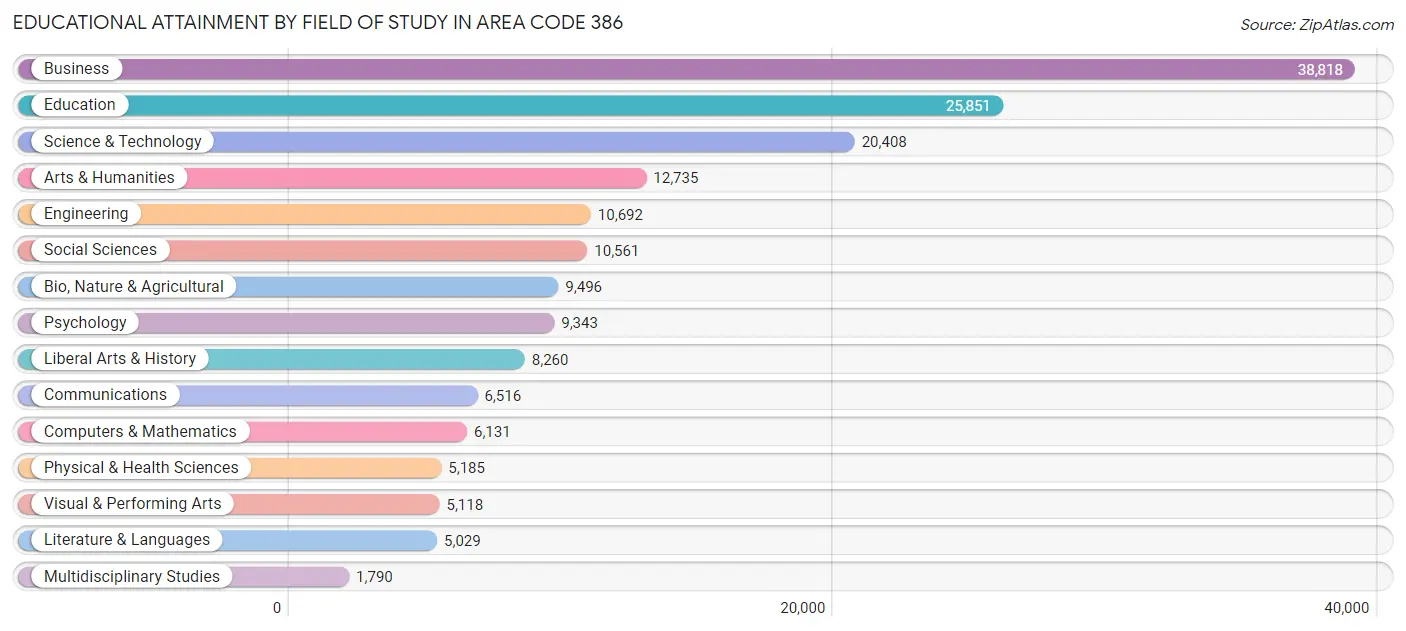
| Field of Study | # Graduates | % Graduates |
| Computers & Mathematics | 6,131 | 3.5% |
| Bio, Nature & Agricultural | 9,496 | 5.4% |
| Physical & Health Sciences | 5,185 | 2.9% |
| Psychology | 9,343 | 5.3% |
| Social Sciences | 10,561 | 6.0% |
| Engineering | 10,692 | 6.1% |
| Multidisciplinary Studies | 1,790 | 1.0% |
| Science & Technology | 20,408 | 11.6% |
| Business | 38,818 | 22.1% |
| Education | 25,851 | 14.7% |
| Literature & Languages | 5,029 | 2.9% |
| Liberal Arts & History | 8,260 | 4.7% |
| Visual & Performing Arts | 5,118 | 2.9% |
| Communications | 6,516 | 3.7% |
| Arts & Humanities | 12,735 | 7.2% |
| Total | 175,933 | 100.0% |
Transportation & Commute in Area Code 386
Vehicle Availability by Sex in Area Code 386
The most prevalent vehicle ownership categories in Area Code 386 are males with 2 vehicles (88,688, accounting for 44.2%) and females with 2 vehicles (81,274, making up 47.5%).
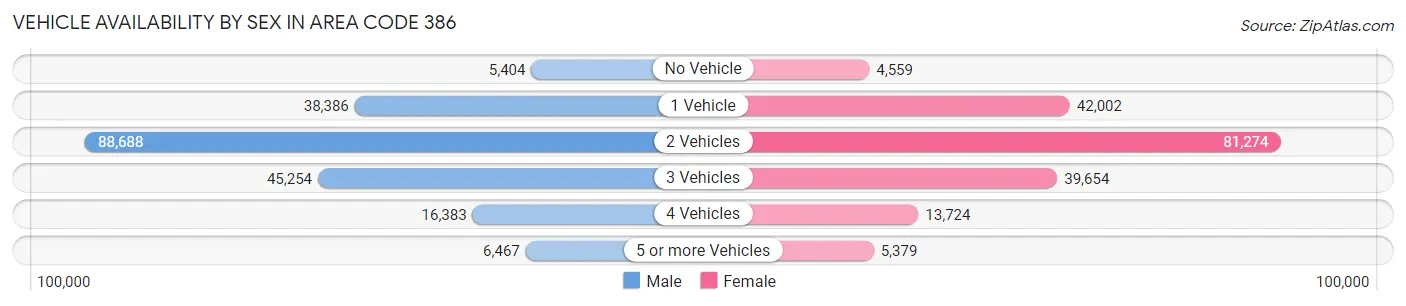
| Vehicles Available | Male | Female |
| No Vehicle | 5,404 (2.7%) | 4,559 (2.4%) |
| 1 Vehicle | 38,386 (19.1%) | 42,002 (22.5%) |
| 2 Vehicles | 88,688 (44.2%) | 81,274 (43.6%) |
| 3 Vehicles | 45,254 (22.6%) | 39,654 (21.2%) |
| 4 Vehicles | 16,383 (8.2%) | 13,724 (7.4%) |
| 5 or more Vehicles | 6,467 (3.2%) | 5,379 (2.9%) |
| Total | 200,582 (100.0%) | 186,592 (100.0%) |
Commute Time in Area Code 386
The most frequently occuring commute durations in Area Code 386 are 15 to 19 minutes (54,666 commuters, 15.8%), 10 to 14 minutes (49,025 commuters, 14.2%), and 30 to 34 minutes (47,469 commuters, 13.7%).
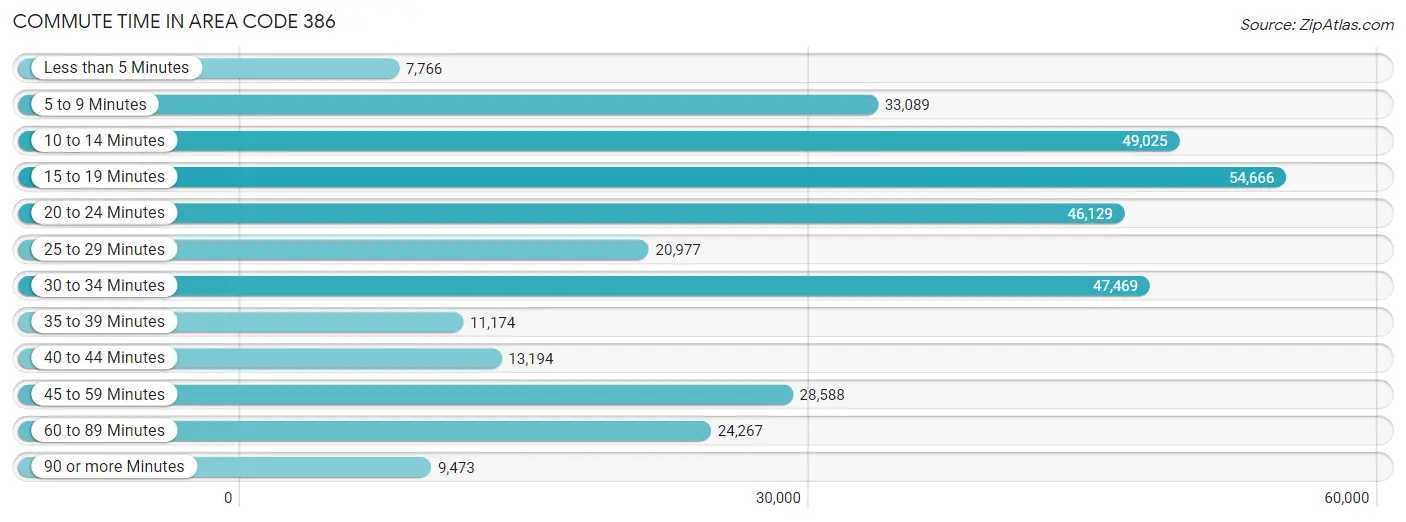
| Commute Time | # Commuters | % Commuters |
| Less than 5 Minutes | 7,766 | 2.2% |
| 5 to 9 Minutes | 33,089 | 9.6% |
| 10 to 14 Minutes | 49,025 | 14.2% |
| 15 to 19 Minutes | 54,666 | 15.8% |
| 20 to 24 Minutes | 46,129 | 13.3% |
| 25 to 29 Minutes | 20,977 | 6.1% |
| 30 to 34 Minutes | 47,469 | 13.7% |
| 35 to 39 Minutes | 11,174 | 3.2% |
| 40 to 44 Minutes | 13,194 | 3.8% |
| 45 to 59 Minutes | 28,588 | 8.3% |
| 60 to 89 Minutes | 24,267 | 7.0% |
| 90 or more Minutes | 9,473 | 2.7% |
Commute Time by Sex in Area Code 386
The most common commute times in Area Code 386 are 15 to 19 minutes (27,059 commuters, 14.9%) for males and 15 to 19 minutes (27,607 commuters, 16.8%) for females.
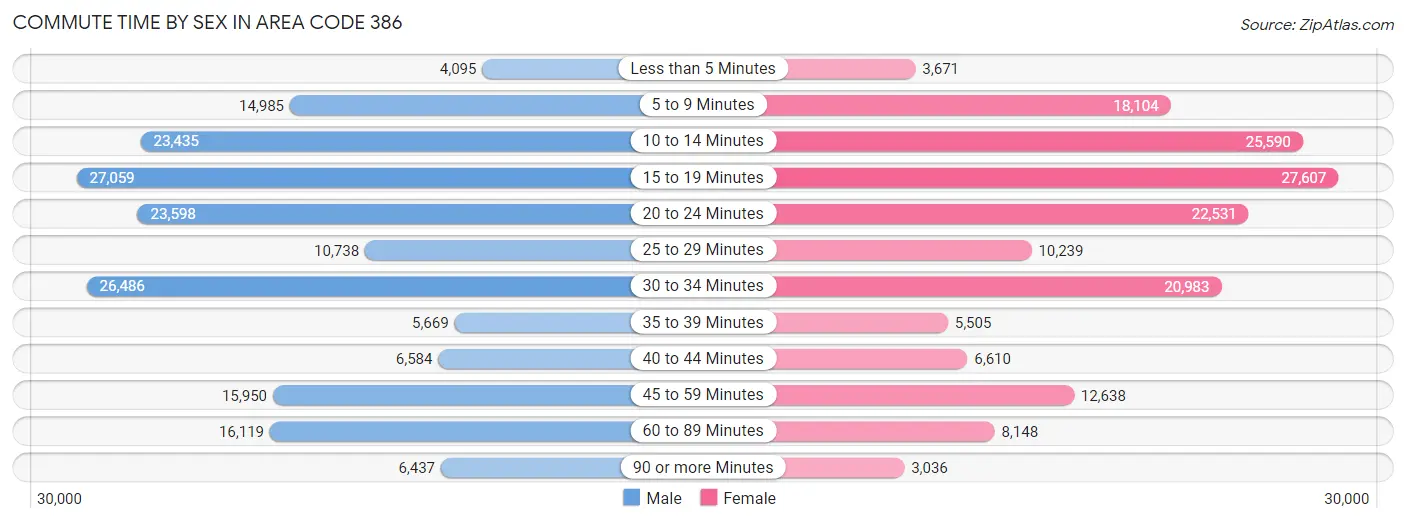
| Commute Time | Male | Female |
| Less than 5 Minutes | 4,095 (2.3%) | 3,671 (2.2%) |
| 5 to 9 Minutes | 14,985 (8.3%) | 18,104 (11.0%) |
| 10 to 14 Minutes | 23,435 (12.9%) | 25,590 (15.5%) |
| 15 to 19 Minutes | 27,059 (14.9%) | 27,607 (16.8%) |
| 20 to 24 Minutes | 23,598 (13.0%) | 22,531 (13.7%) |
| 25 to 29 Minutes | 10,738 (5.9%) | 10,239 (6.2%) |
| 30 to 34 Minutes | 26,486 (14.6%) | 20,983 (12.7%) |
| 35 to 39 Minutes | 5,669 (3.1%) | 5,505 (3.3%) |
| 40 to 44 Minutes | 6,584 (3.6%) | 6,610 (4.0%) |
| 45 to 59 Minutes | 15,950 (8.8%) | 12,638 (7.7%) |
| 60 to 89 Minutes | 16,119 (8.9%) | 8,148 (5.0%) |
| 90 or more Minutes | 6,437 (3.5%) | 3,036 (1.8%) |
Time of Departure to Work by Sex in Area Code 386
The most frequent times of departure to work in Area Code 386 are 7:00 AM to 7:29 AM (25,073, 13.8%) for males and 7:00 AM to 7:29 AM (27,663, 16.8%) for females.
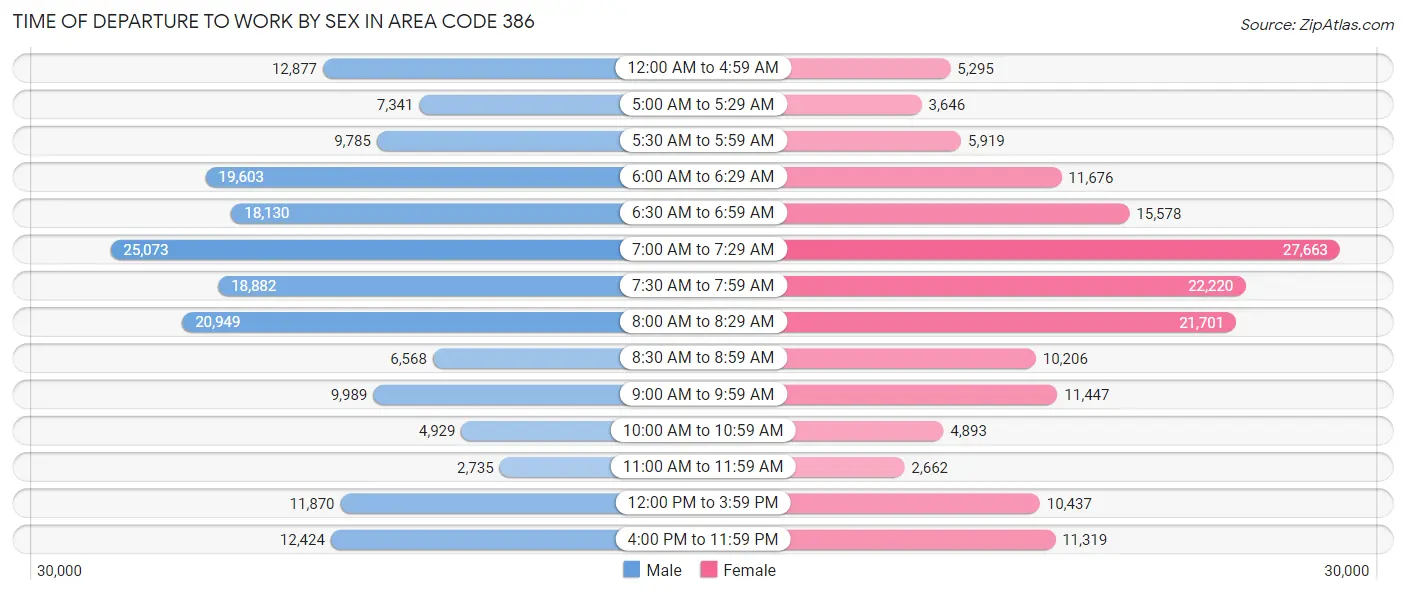
| Time of Departure | Male | Female |
| 12:00 AM to 4:59 AM | 12,877 (7.1%) | 5,295 (3.2%) |
| 5:00 AM to 5:29 AM | 7,341 (4.1%) | 3,646 (2.2%) |
| 5:30 AM to 5:59 AM | 9,785 (5.4%) | 5,919 (3.6%) |
| 6:00 AM to 6:29 AM | 19,603 (10.8%) | 11,676 (7.1%) |
| 6:30 AM to 6:59 AM | 18,130 (10.0%) | 15,578 (9.5%) |
| 7:00 AM to 7:29 AM | 25,073 (13.8%) | 27,663 (16.8%) |
| 7:30 AM to 7:59 AM | 18,882 (10.4%) | 22,220 (13.5%) |
| 8:00 AM to 8:29 AM | 20,949 (11.6%) | 21,701 (13.2%) |
| 8:30 AM to 8:59 AM | 6,568 (3.6%) | 10,206 (6.2%) |
| 9:00 AM to 9:59 AM | 9,989 (5.5%) | 11,447 (7.0%) |
| 10:00 AM to 10:59 AM | 4,929 (2.7%) | 4,893 (3.0%) |
| 11:00 AM to 11:59 AM | 2,735 (1.5%) | 2,662 (1.6%) |
| 12:00 PM to 3:59 PM | 11,870 (6.6%) | 10,437 (6.3%) |
| 4:00 PM to 11:59 PM | 12,424 (6.9%) | 11,319 (6.9%) |
| Total | 181,155 (100.0%) | 164,662 (100.0%) |
Housing Occupancy in Area Code 386
Occupancy by Ownership in Area Code 386
Of the total 377,877 dwellings in Area Code 386, owner-occupied units account for 276,340 (73.1%), while renter-occupied units make up 101,537 (26.9%).
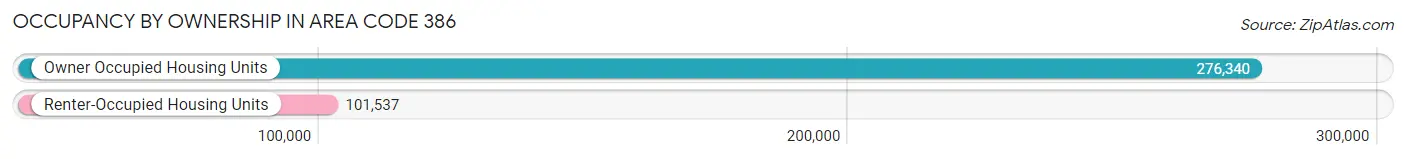
| Occupancy | # Housing Units | % Housing Units |
| Owner Occupied Housing Units | 276,340 | 73.1% |
| Renter-Occupied Housing Units | 101,537 | 26.9% |
| Total Occupied Housing Units | 377,877 | 100.0% |
Occupancy by Household Size in Area Code 386
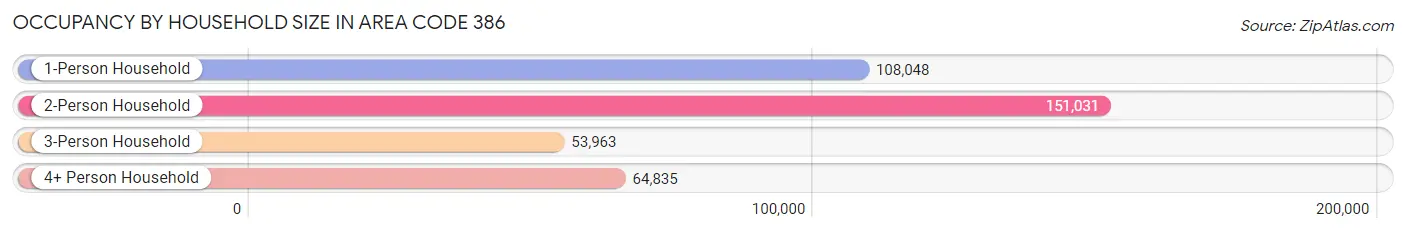
| Household Size | # Housing Units | % Housing Units |
| 1-Person Household | 108,048 | 28.6% |
| 2-Person Household | 151,031 | 40.0% |
| 3-Person Household | 53,963 | 14.3% |
| 4+ Person Household | 64,835 | 17.2% |
| Total Housing Units | 377,877 | 100.0% |
Occupancy by Ownership by Household Size in Area Code 386
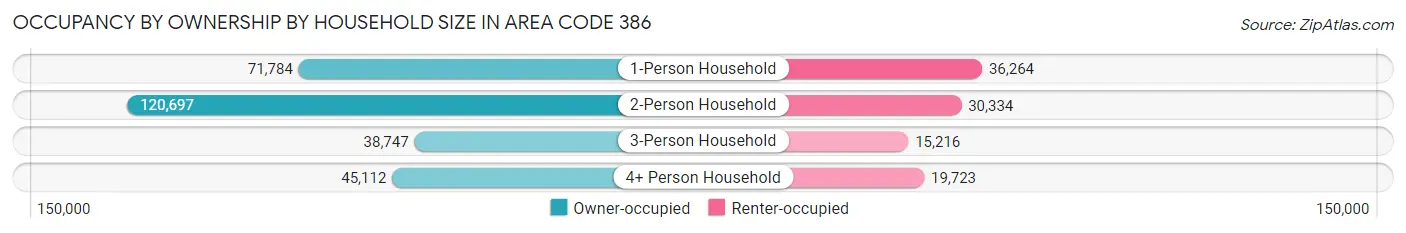
| Household Size | Owner-occupied | Renter-occupied |
| 1-Person Household | 71,784 (66.4%) | 36,264 (33.6%) |
| 2-Person Household | 120,697 (79.9%) | 30,334 (20.1%) |
| 3-Person Household | 38,747 (71.8%) | 15,216 (28.2%) |
| 4+ Person Household | 45,112 (69.6%) | 19,723 (30.4%) |
| Total Housing Units | 276,340 (73.1%) | 101,537 (26.9%) |
Occupancy by Educational Attainment in Area Code 386
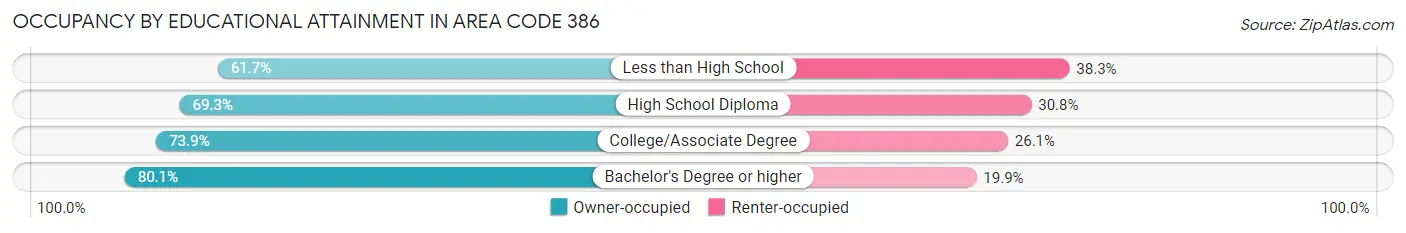
| Household Size | Owner-occupied | Renter-occupied |
| Less than High School | 19,999 (61.7%) | 12,418 (38.3%) |
| High School Diploma | 76,529 (69.3%) | 33,982 (30.7%) |
| College/Associate Degree | 100,033 (73.9%) | 35,355 (26.1%) |
| Bachelor's Degree or higher | 79,779 (80.1%) | 19,782 (19.9%) |
Occupancy by Age of Householder in Area Code 386
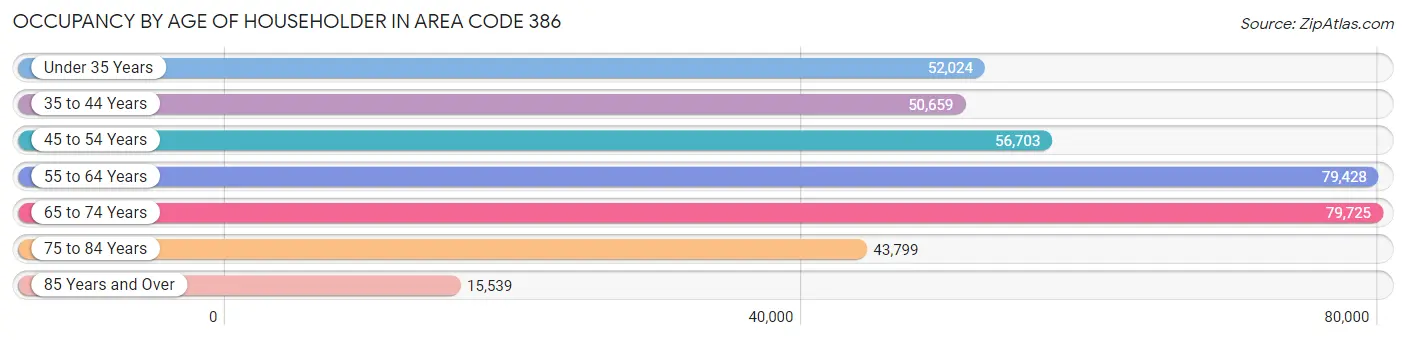
| Age Bracket | # Households | % Households |
| Under 35 Years | 52,024 | 13.8% |
| 35 to 44 Years | 50,659 | 13.4% |
| 45 to 54 Years | 56,703 | 15.0% |
| 55 to 64 Years | 79,428 | 21.0% |
| 65 to 74 Years | 79,725 | 21.1% |
| 75 to 84 Years | 43,799 | 11.6% |
| 85 Years and Over | 15,539 | 4.1% |
| Total | 377,877 | 100.0% |
Housing Finances in Area Code 386
Median Income by Occupancy in Area Code 386
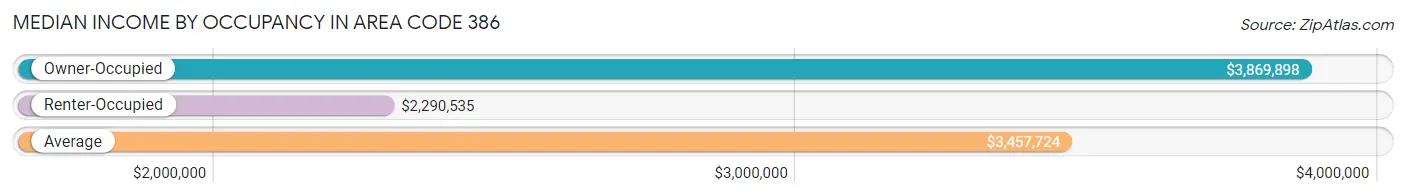
| Occupancy Type | # Households | Median Income |
| Owner-Occupied | 276,340 (73.1%) | $3,869,898 |
| Renter-Occupied | 101,537 (26.9%) | $2,290,535 |
| Average | 377,877 (100.0%) | $3,457,724 |
Occupancy by Householder Income Bracket in Area Code 386
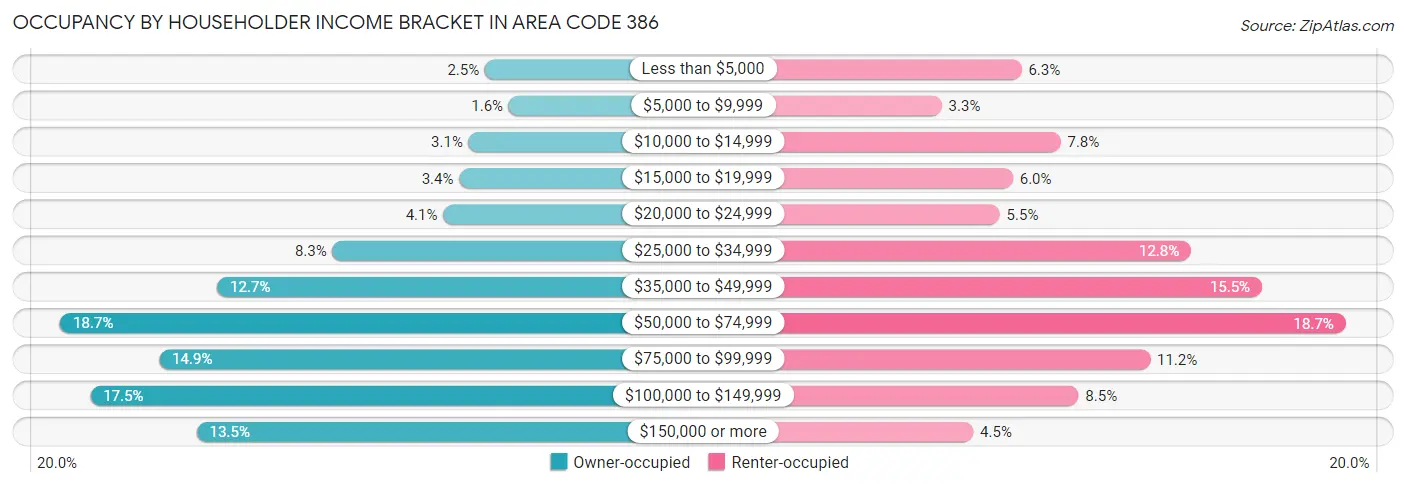
| Income Bracket | Owner-occupied | Renter-occupied |
| Less than $5,000 | 6,796 (2.5%) | 6,417 (6.3%) |
| $5,000 to $9,999 | 4,293 (1.5%) | 3,330 (3.3%) |
| $10,000 to $14,999 | 8,502 (3.1%) | 7,931 (7.8%) |
| $15,000 to $19,999 | 9,499 (3.4%) | 6,083 (6.0%) |
| $20,000 to $24,999 | 11,196 (4.1%) | 5,578 (5.5%) |
| $25,000 to $34,999 | 22,847 (8.3%) | 12,972 (12.8%) |
| $35,000 to $49,999 | 35,026 (12.7%) | 15,715 (15.5%) |
| $50,000 to $74,999 | 51,544 (18.6%) | 18,953 (18.7%) |
| $75,000 to $99,999 | 41,108 (14.9%) | 11,390 (11.2%) |
| $100,000 to $149,999 | 48,362 (17.5%) | 8,621 (8.5%) |
| $150,000 or more | 37,167 (13.5%) | 4,547 (4.5%) |
| Total | 276,340 (100.0%) | 101,537 (100.0%) |
Monthly Housing Cost Tiers in Area Code 386
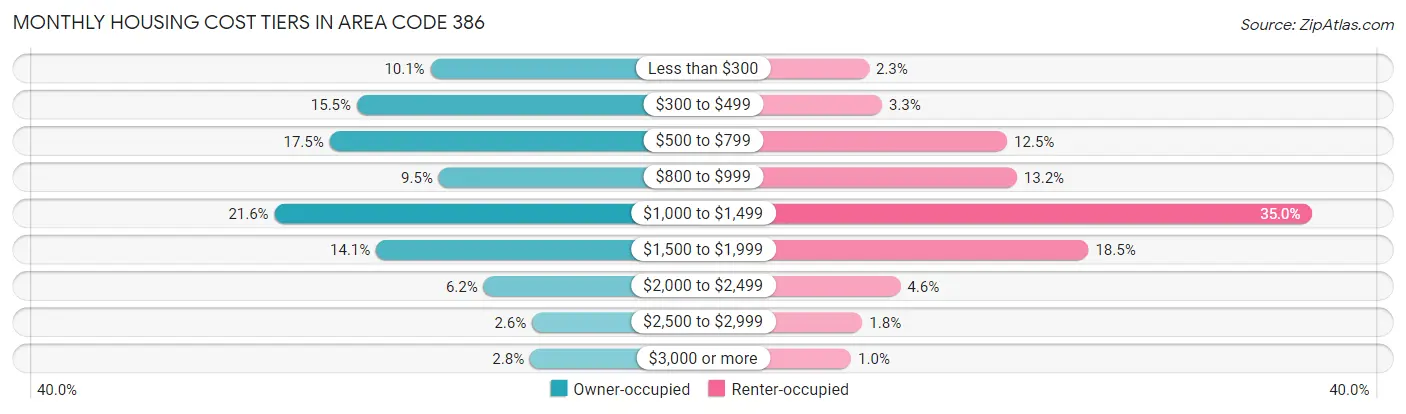
| Monthly Cost | Owner-occupied | Renter-occupied |
| Less than $300 | 27,932 (10.1%) | 2,363 (2.3%) |
| $300 to $499 | 42,928 (15.5%) | 3,328 (3.3%) |
| $500 to $799 | 48,469 (17.5%) | 12,692 (12.5%) |
| $800 to $999 | 26,245 (9.5%) | 13,419 (13.2%) |
| $1,000 to $1,499 | 59,677 (21.6%) | 35,511 (35.0%) |
| $1,500 to $1,999 | 38,984 (14.1%) | 18,776 (18.5%) |
| $2,000 to $2,499 | 17,145 (6.2%) | 4,714 (4.6%) |
| $2,500 to $2,999 | 7,270 (2.6%) | 1,873 (1.8%) |
| $3,000 or more | 7,690 (2.8%) | 1,021 (1.0%) |
| Total | 276,340 (100.0%) | 101,537 (100.0%) |
Physical Housing Characteristics in Area Code 386
Housing Structures in Area Code 386
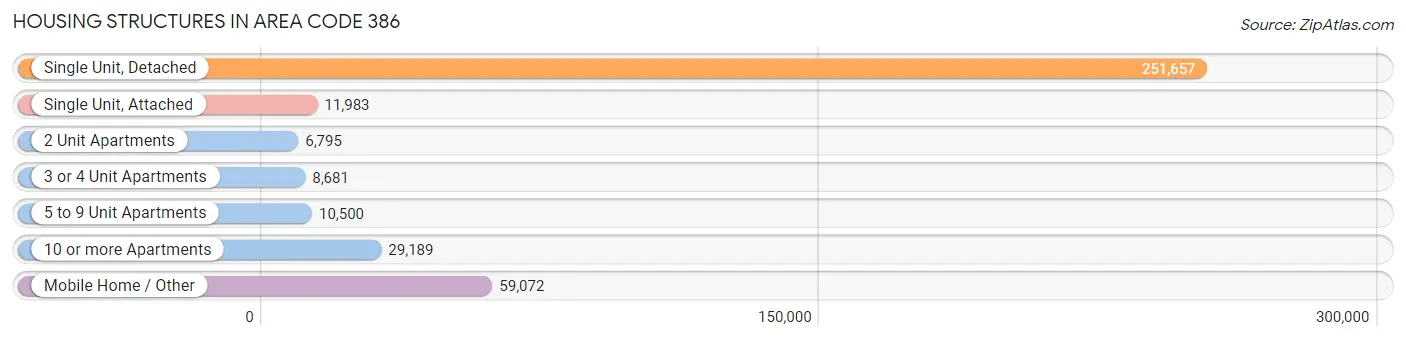
| Structure Type | # Housing Units | % Housing Units |
| Single Unit, Detached | 251,657 | 66.6% |
| Single Unit, Attached | 11,983 | 3.2% |
| 2 Unit Apartments | 6,795 | 1.8% |
| 3 or 4 Unit Apartments | 8,681 | 2.3% |
| 5 to 9 Unit Apartments | 10,500 | 2.8% |
| 10 or more Apartments | 29,189 | 7.7% |
| Mobile Home / Other | 59,072 | 15.6% |
| Total | 377,877 | 100.0% |
Housing Structures by Occupancy in Area Code 386
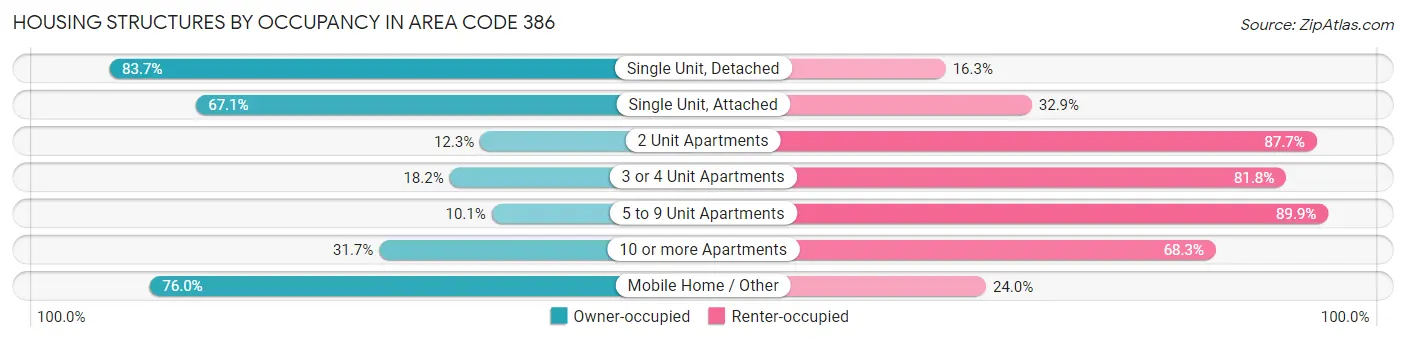
| Structure Type | Owner-occupied | Renter-occupied |
| Single Unit, Detached | 210,686 (83.7%) | 40,971 (16.3%) |
| Single Unit, Attached | 8,044 (67.1%) | 3,939 (32.9%) |
| 2 Unit Apartments | 837 (12.3%) | 5,958 (87.7%) |
| 3 or 4 Unit Apartments | 1,579 (18.2%) | 7,102 (81.8%) |
| 5 to 9 Unit Apartments | 1,059 (10.1%) | 9,441 (89.9%) |
| 10 or more Apartments | 9,265 (31.7%) | 19,924 (68.3%) |
| Mobile Home / Other | 44,870 (76.0%) | 14,202 (24.0%) |
| Total | 276,340 (73.1%) | 101,537 (26.9%) |
Housing Structures by Number of Rooms in Area Code 386
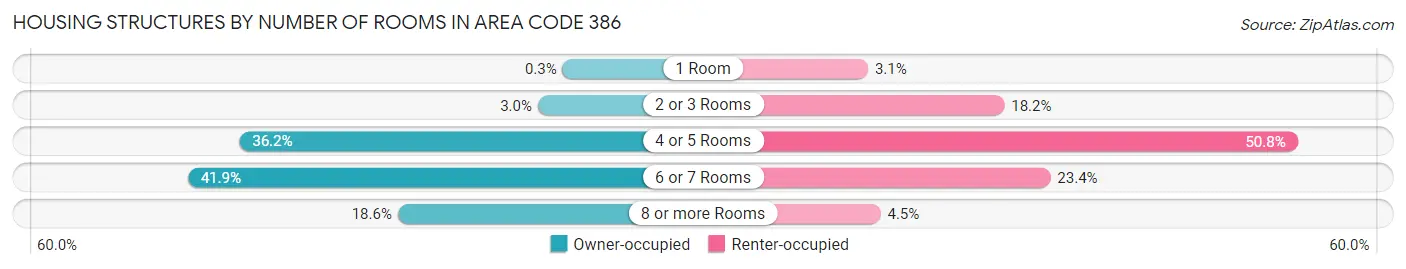
| Number of Rooms | Owner-occupied | Renter-occupied |
| 1 Room | 840 (0.3%) | 3,156 (3.1%) |
| 2 or 3 Rooms | 8,411 (3.0%) | 18,522 (18.2%) |
| 4 or 5 Rooms | 99,956 (36.2%) | 51,557 (50.8%) |
| 6 or 7 Rooms | 115,772 (41.9%) | 23,723 (23.4%) |
| 8 or more Rooms | 51,361 (18.6%) | 4,579 (4.5%) |
| Total | 276,340 (100.0%) | 101,537 (100.0%) |
Housing Structure by Heating Type in Area Code 386
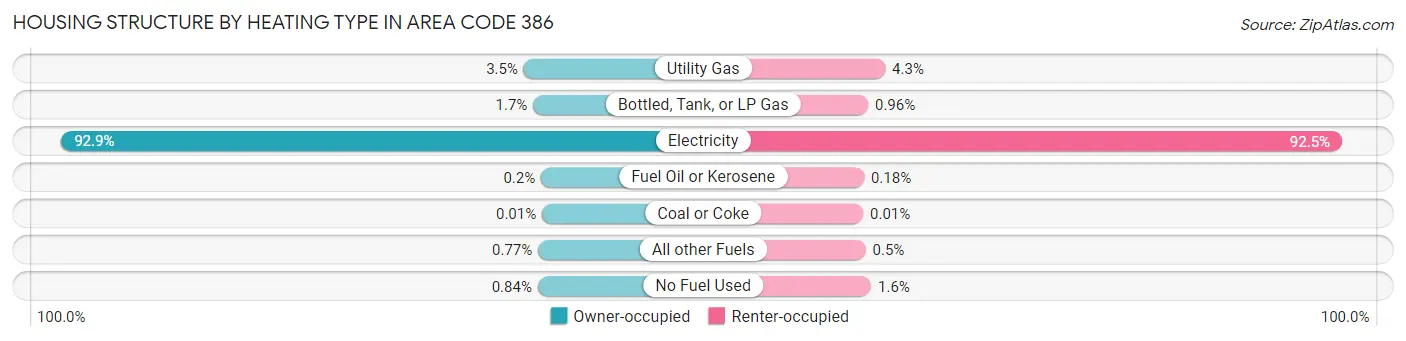
| Heating Type | Owner-occupied | Renter-occupied |
| Utility Gas | 9,768 (3.5%) | 4,333 (4.3%) |
| Bottled, Tank, or LP Gas | 4,764 (1.7%) | 976 (1.0%) |
| Electricity | 256,787 (92.9%) | 93,948 (92.5%) |
| Fuel Oil or Kerosene | 555 (0.2%) | 181 (0.2%) |
| Coal or Coke | 18 (0.0%) | 7 (0.0%) |
| All other Fuels | 2,128 (0.8%) | 509 (0.5%) |
| No Fuel Used | 2,320 (0.8%) | 1,583 (1.6%) |
| Total | 276,340 (100.0%) | 101,537 (100.0%) |
Household Vehicle Usage in Area Code 386
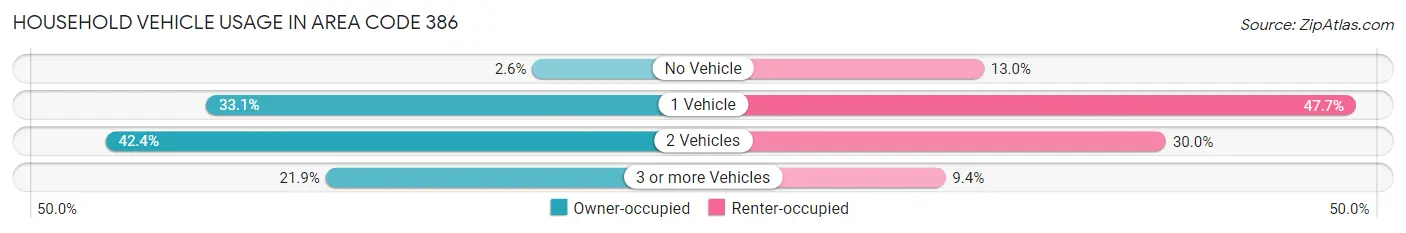
| Vehicles per Household | Owner-occupied | Renter-occupied |
| No Vehicle | 7,186 (2.6%) | 13,162 (13.0%) |
| 1 Vehicle | 91,325 (33.1%) | 48,420 (47.7%) |
| 2 Vehicles | 117,271 (42.4%) | 30,434 (30.0%) |
| 3 or more Vehicles | 60,558 (21.9%) | 9,521 (9.4%) |
| Total | 276,340 (100.0%) | 101,537 (100.0%) |
Real Estate & Mortgages in Area Code 386
Real Estate and Mortgage Overview in Area Code 386
| Characteristic | Without Mortgage | With Mortgage |
| Housing Units | 130,373 | 145,967 |
| Median Property Value | $10,240,700 | $12,755,700 |
| Median Household Income | $3,085,787 | $24,801 |
| Monthly Housing Costs | $26,513 | $7,280 |
| Real Estate Taxes | $84,614 | $5,063 |
Property Value by Mortgage Status in Area Code 386
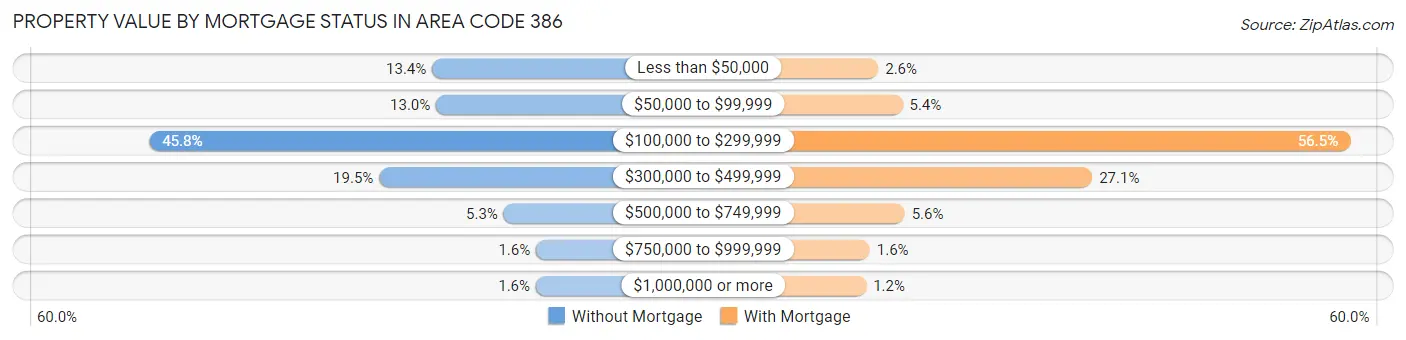
| Property Value | Without Mortgage | With Mortgage |
| Less than $50,000 | 17,507 (13.4%) | 3,799 (2.6%) |
| $50,000 to $99,999 | 16,912 (13.0%) | 7,838 (5.4%) |
| $100,000 to $299,999 | 59,641 (45.8%) | 82,477 (56.5%) |
| $300,000 to $499,999 | 25,395 (19.5%) | 39,478 (27.1%) |
| $500,000 to $749,999 | 6,850 (5.2%) | 8,206 (5.6%) |
| $750,000 to $999,999 | 2,026 (1.5%) | 2,386 (1.6%) |
| $1,000,000 or more | 2,042 (1.6%) | 1,783 (1.2%) |
| Total | 130,373 (100.0%) | 145,967 (100.0%) |
Household Income by Mortgage Status in Area Code 386
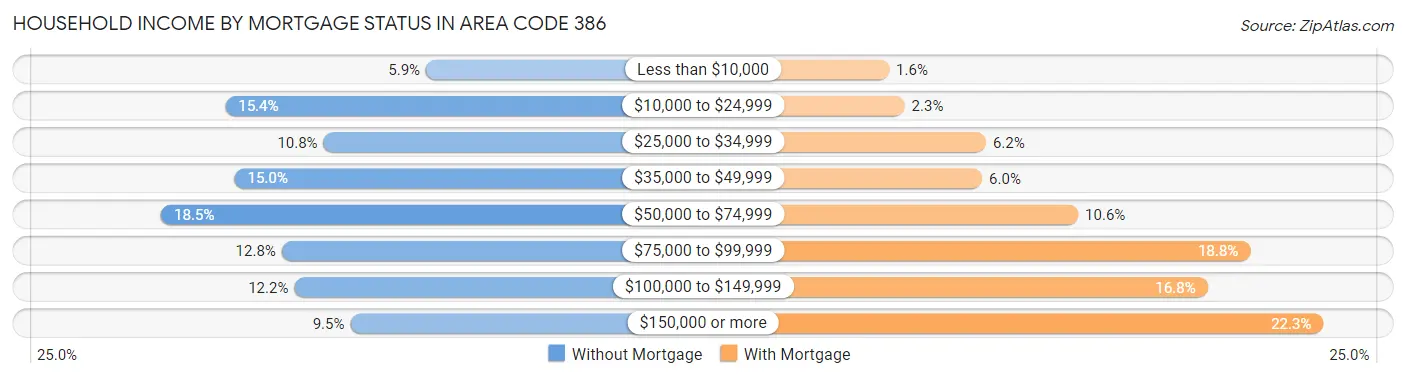
| Household Income | Without Mortgage | With Mortgage |
| Less than $10,000 | 7,680 (5.9%) | 2,339 (1.6%) |
| $10,000 to $24,999 | 20,130 (15.4%) | 3,409 (2.3%) |
| $25,000 to $34,999 | 14,041 (10.8%) | 9,067 (6.2%) |
| $35,000 to $49,999 | 19,551 (15.0%) | 8,806 (6.0%) |
| $50,000 to $74,999 | 24,116 (18.5%) | 15,475 (10.6%) |
| $75,000 to $99,999 | 16,640 (12.8%) | 27,428 (18.8%) |
| $100,000 to $149,999 | 15,849 (12.2%) | 24,468 (16.8%) |
| $150,000 or more | 12,366 (9.5%) | 32,513 (22.3%) |
| Total | 130,373 (100.0%) | 145,967 (100.0%) |
Property Value to Household Income Ratio in Area Code 386
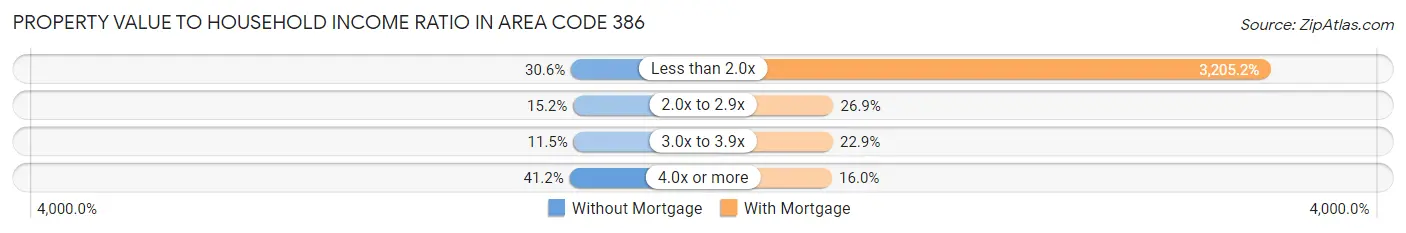
| Value-to-Income Ratio | Without Mortgage | With Mortgage |
| Less than 2.0x | 39,858 (30.6%) | 4,678,472 (3,205.2%) |
| 2.0x to 2.9x | 19,822 (15.2%) | 39,327 (26.9%) |
| 3.0x to 3.9x | 15,048 (11.5%) | 33,415 (22.9%) |
| 4.0x or more | 53,722 (41.2%) | 23,413 (16.0%) |
| Total | 130,373 (100.0%) | 145,967 (100.0%) |
Real Estate Taxes by Mortgage Status in Area Code 386
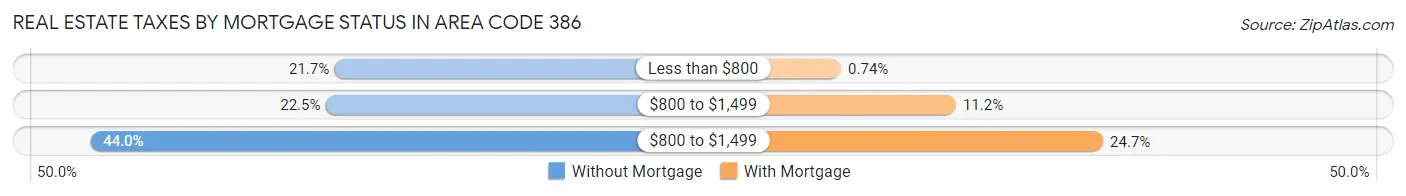
| Property Taxes | Without Mortgage | With Mortgage |
| Less than $800 | 28,231 (21.6%) | 1,074 (0.7%) |
| $800 to $1,499 | 29,268 (22.5%) | 16,395 (11.2%) |
| $800 to $1,499 | 57,351 (44.0%) | 36,012 (24.7%) |
| Total | 130,373 (100.0%) | 145,967 (100.0%) |
Health & Disability in Area Code 386
Health Insurance Coverage by Age in Area Code 386
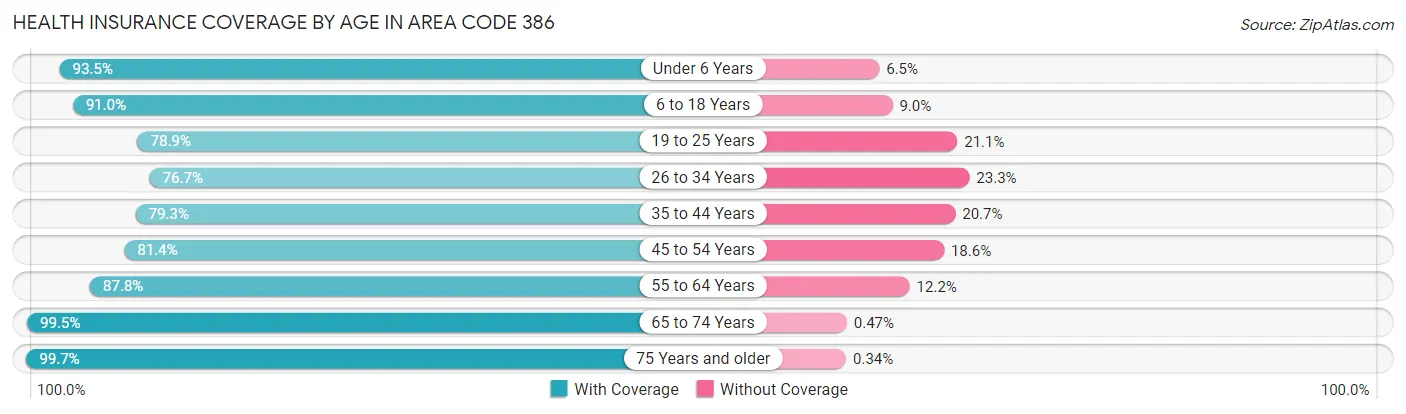
| Age Bracket | With Coverage | Without Coverage |
| Under 6 Years | 49,639 (93.5%) | 3,460 (6.5%) |
| 6 to 18 Years | 121,784 (91.0%) | 12,014 (9.0%) |
| 19 to 25 Years | 54,284 (78.9%) | 14,503 (21.1%) |
| 26 to 34 Years | 71,694 (76.7%) | 21,812 (23.3%) |
| 35 to 44 Years | 79,573 (79.3%) | 20,768 (20.7%) |
| 45 to 54 Years | 88,257 (81.4%) | 20,158 (18.6%) |
| 55 to 64 Years | 121,641 (87.8%) | 16,880 (12.2%) |
| 65 to 74 Years | 128,079 (99.5%) | 603 (0.5%) |
| 75 Years and older | 93,049 (99.7%) | 318 (0.3%) |
| Total | 808,000 (88.0%) | 110,516 (12.0%) |
Health Insurance Coverage by Citizenship Status in Area Code 386
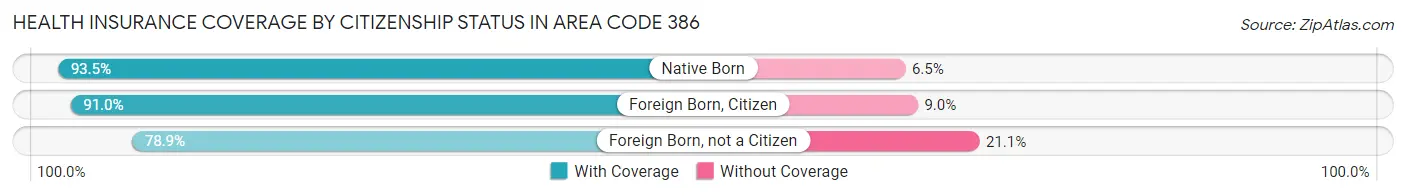
| Citizenship Status | With Coverage | Without Coverage |
| Native Born | 49,639 (93.5%) | 3,460 (6.5%) |
| Foreign Born, Citizen | 121,784 (91.0%) | 12,014 (9.0%) |
| Foreign Born, not a Citizen | 54,284 (78.9%) | 14,503 (21.1%) |
Health Insurance Coverage by Household Income in Area Code 386
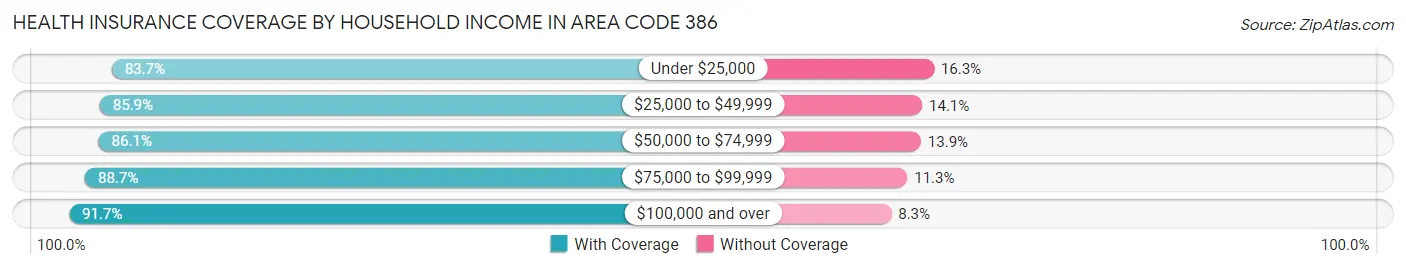
| Household Income | With Coverage | Without Coverage |
| Under $25,000 | 96,563 (83.7%) | 18,847 (16.3%) |
| $25,000 to $49,999 | 155,993 (85.9%) | 25,625 (14.1%) |
| $50,000 to $74,999 | 147,135 (86.1%) | 23,706 (13.9%) |
| $75,000 to $99,999 | 127,510 (88.7%) | 16,287 (11.3%) |
| $100,000 and over | 273,841 (91.7%) | 24,888 (8.3%) |
Public vs Private Health Insurance Coverage by Age in Area Code 386
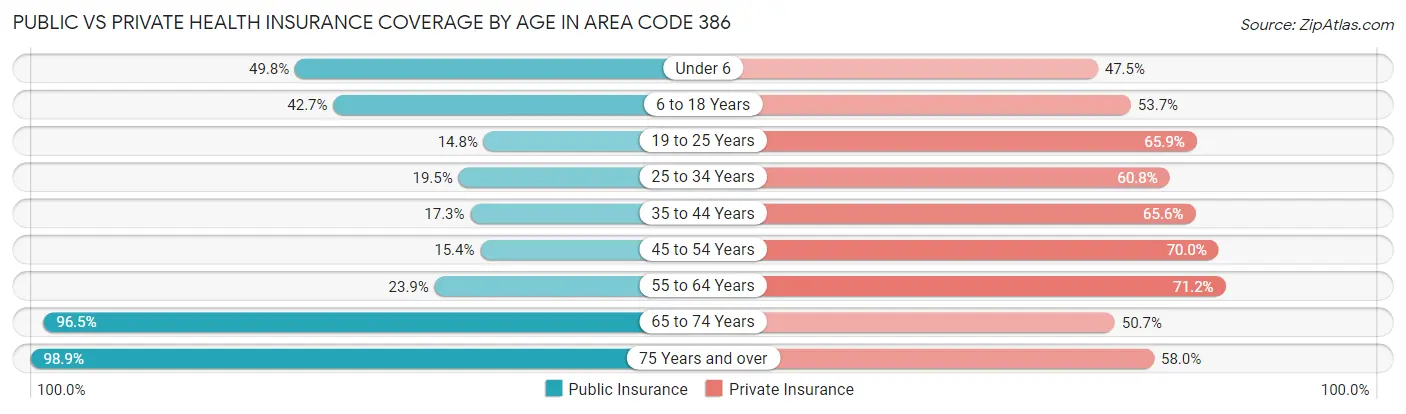
| Age Bracket | Public Insurance | Private Insurance |
| Under 6 | 26,445 (49.8%) | 25,229 (47.5%) |
| 6 to 18 Years | 57,119 (42.7%) | 71,797 (53.7%) |
| 19 to 25 Years | 10,166 (14.8%) | 45,305 (65.9%) |
| 25 to 34 Years | 18,192 (19.5%) | 56,883 (60.8%) |
| 35 to 44 Years | 17,316 (17.3%) | 65,799 (65.6%) |
| 45 to 54 Years | 16,708 (15.4%) | 75,835 (70.0%) |
| 55 to 64 Years | 33,106 (23.9%) | 98,632 (71.2%) |
| 65 to 74 Years | 124,199 (96.5%) | 65,217 (50.7%) |
| 75 Years and over | 92,336 (98.9%) | 54,119 (58.0%) |
| Total | 395,587 (43.1%) | 558,816 (60.8%) |
Disability Status by Sex by Age in Area Code 386
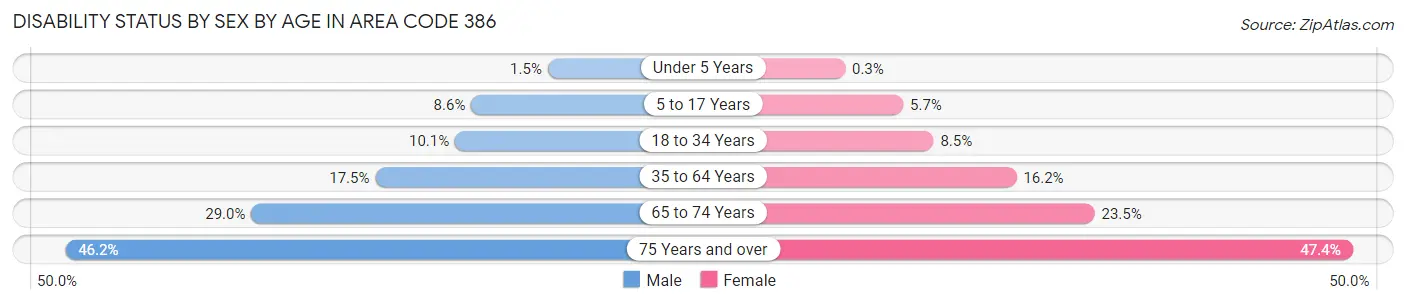
| Age Bracket | Male | Female |
| Under 5 Years | 323 (1.5%) | 65 (0.3%) |
| 5 to 17 Years | 5,730 (8.6%) | 3,614 (5.7%) |
| 18 to 34 Years | 8,825 (10.1%) | 7,370 (8.5%) |
| 35 to 64 Years | 29,284 (17.4%) | 29,089 (16.2%) |
| 65 to 74 Years | 17,710 (29.0%) | 15,840 (23.5%) |
| 75 Years and over | 19,393 (46.2%) | 24,369 (47.4%) |
Disability Class by Sex by Age in Area Code 386
Disability Class: Hearing Difficulty
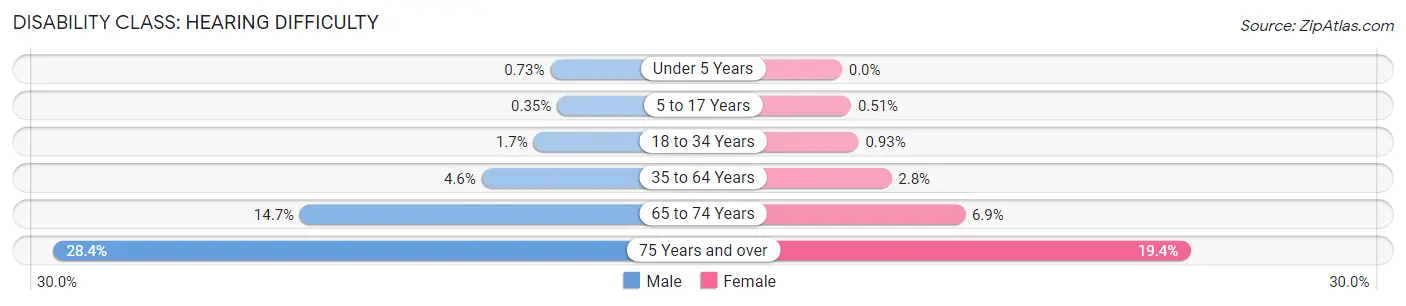
| Age Bracket | Male | Female |
| Under 5 Years | 164 (0.7%) | 0 (0.0%) |
| 5 to 17 Years | 234 (0.4%) | 324 (0.5%) |
| 18 to 34 Years | 1,460 (1.7%) | 803 (0.9%) |
| 35 to 64 Years | 7,636 (4.5%) | 4,951 (2.8%) |
| 65 to 74 Years | 8,972 (14.7%) | 4,633 (6.9%) |
| 75 Years and over | 11,903 (28.4%) | 9,972 (19.4%) |
Disability Class: Vision Difficulty
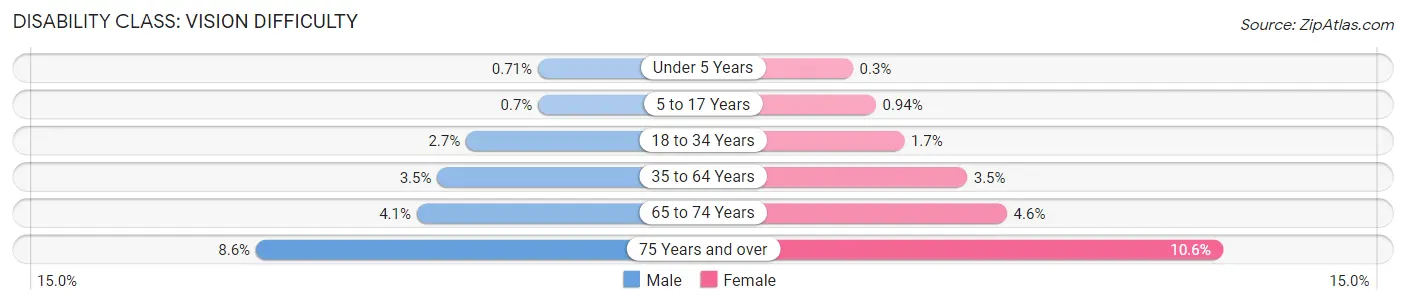
| Age Bracket | Male | Female |
| Under 5 Years | 159 (0.7%) | 65 (0.3%) |
| 5 to 17 Years | 467 (0.7%) | 600 (0.9%) |
| 18 to 34 Years | 2,382 (2.7%) | 1,500 (1.7%) |
| 35 to 64 Years | 5,890 (3.5%) | 6,254 (3.5%) |
| 65 to 74 Years | 2,493 (4.1%) | 3,102 (4.6%) |
| 75 Years and over | 3,589 (8.6%) | 5,451 (10.6%) |
Disability Class: Cognitive Difficulty
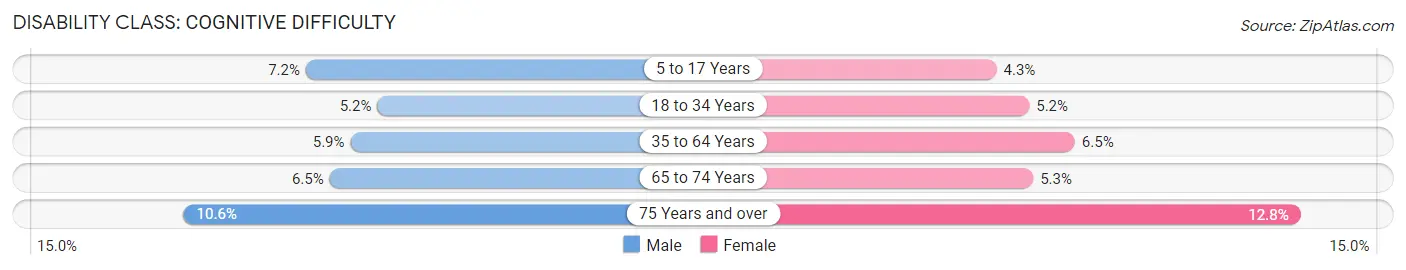
| Age Bracket | Male | Female |
| 5 to 17 Years | 4,806 (7.2%) | 2,736 (4.3%) |
| 18 to 34 Years | 4,548 (5.2%) | 4,522 (5.2%) |
| 35 to 64 Years | 9,953 (5.9%) | 11,643 (6.5%) |
| 65 to 74 Years | 3,980 (6.5%) | 3,602 (5.3%) |
| 75 Years and over | 4,433 (10.6%) | 6,568 (12.8%) |
Disability Class: Ambulatory Difficulty
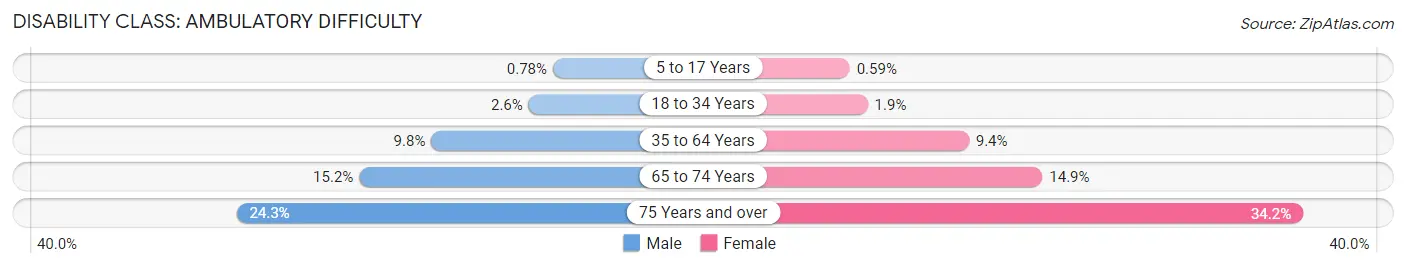
| Age Bracket | Male | Female |
| 5 to 17 Years | 525 (0.8%) | 378 (0.6%) |
| 18 to 34 Years | 2,262 (2.6%) | 1,666 (1.9%) |
| 35 to 64 Years | 16,462 (9.8%) | 16,933 (9.4%) |
| 65 to 74 Years | 9,272 (15.2%) | 10,054 (14.9%) |
| 75 Years and over | 10,181 (24.3%) | 17,604 (34.2%) |
Disability Class: Self-Care Difficulty
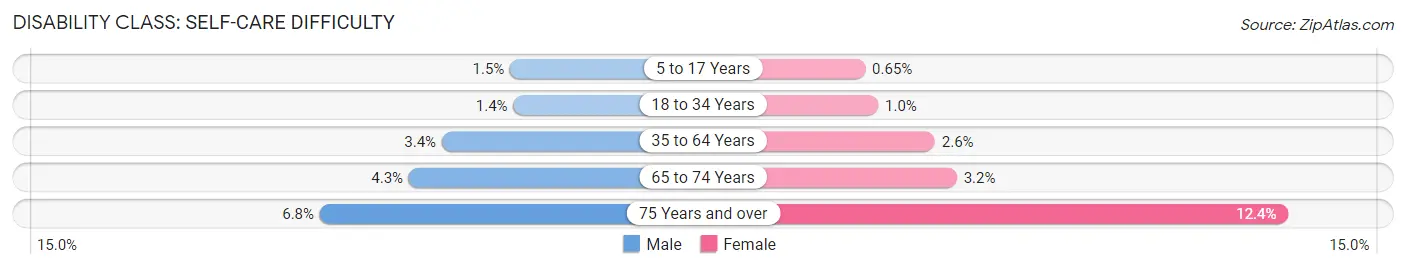
| Age Bracket | Male | Female |
| 5 to 17 Years | 992 (1.5%) | 416 (0.6%) |
| 18 to 34 Years | 1,221 (1.4%) | 877 (1.0%) |
| 35 to 64 Years | 5,664 (3.4%) | 4,650 (2.6%) |
| 65 to 74 Years | 2,627 (4.3%) | 2,160 (3.2%) |
| 75 Years and over | 2,845 (6.8%) | 6,392 (12.4%) |
Technology Access in Area Code 386
Computing Device Access in Area Code 386
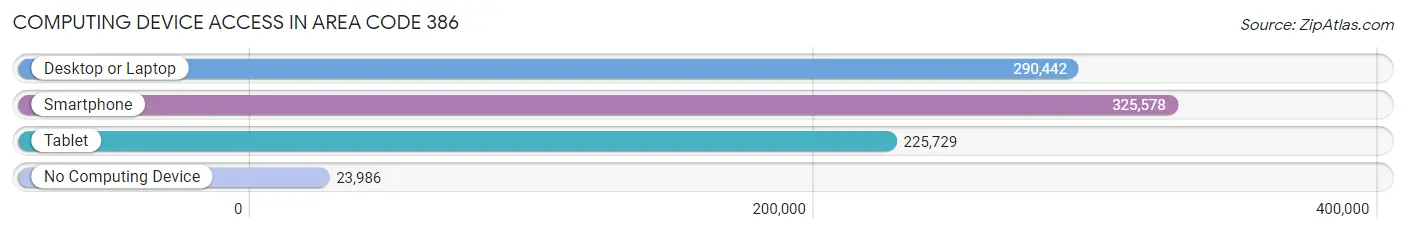
| Device Type | # Households | % Households |
| Desktop or Laptop | 290,442 | 76.9% |
| Smartphone | 325,578 | 86.2% |
| Tablet | 225,729 | 59.7% |
| No Computing Device | 23,986 | 6.4% |
| Total | 377,877 | 100.0% |
Internet Access in Area Code 386
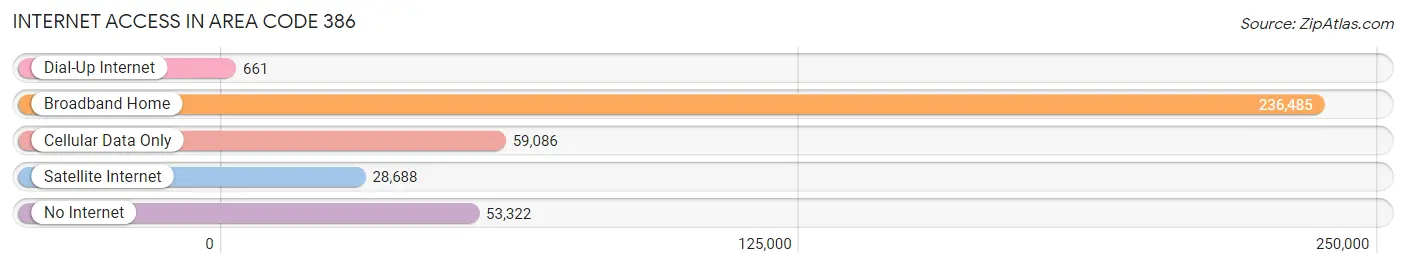
| Internet Type | # Households | % Households |
| Dial-Up Internet | 661 | 0.2% |
| Broadband Home | 236,485 | 62.6% |
| Cellular Data Only | 59,086 | 15.6% |
| Satellite Internet | 28,688 | 7.6% |
| No Internet | 53,322 | 14.1% |
| Total | 377,877 | 100.0% |
Area Code 386 Summary
Geography
Area code 386 is a telephone area code in the North American Numbering Plan (NANP) for the state of Florida. It serves the east-central part of the state, including the cities of Daytona Beach, Deltona, and Palm Coast.
Social
Area code 386 is a vibrant and diverse area, with a wide range of cultural and recreational activities. The area is home to a number of universities and colleges, as well as a variety of museums, galleries, and other attractions.
Economics
Area code 386 is an economically diverse area, with a mix of industries ranging from tourism to manufacturing. The area is home to a number of large companies, including Embraer, the world's third-largest aircraft manufacturer.
Demographics
Area code 386 is home to a population of over 1.2 million people, with a median age of 38. The area is racially diverse, with a population that is roughly evenly split between white, black, and Hispanic residents.
Common Questions
What is Per Capita Income in Area Code 386?
Per Capita income in Area Code 386 is $30,861.
What is the Median Family Income in Area Code 386?
Median Family Income in Area Code 386 is $71,211.
What is the Median Household income in Area Code 386?
Median Household Income in Area Code 386 is $58,605.
What is Income or Wage Gap in Area Code 386?
Income or Wage Gap in Area Code 386 is 21.3%.
Women in Area Code 386 earn 78.7 cents for every dollar earned by a man.
What is Family Income Deficit in Area Code 386?
Family Income Deficit in Area Code 386 is $9,989.
Families that are below poverty line in Area Code 386 earn $9,989 less on average than the poverty threshold level.
What is Inequality or Gini Index in Area Code 386?
Inequality or Gini Index in Area Code 386 is 27.93.
What is the Total Population of Area Code 386?
Total Population of Area Code 386 is 944,529.
What is the Total Male Population of Area Code 386?
Total Male Population of Area Code 386 is 469,513.
What is the Total Female Population of Area Code 386?
Total Female Population of Area Code 386 is 475,016.
What is the Ratio of Males per 100 Females in Area Code 386?
There are 98.84 Males per 100 Females in Area Code 386.
What is the Ratio of Females per 100 Males in Area Code 386?
There are 101.17 Females per 100 Males in Area Code 386.
What is the Median Population Age in Area Code 386?
Median Population Age in Area Code 386 is 45.4 Years.
What is the Average Family Size in Area Code 386
Average Family Size in Area Code 386 is 3.1 People.
What is the Average Household Size in Area Code 386
Average Household Size in Area Code 386 is 2.6 People.
How Large is the Labor Force in Area Code 386?
There are 389,425 People in the Labor Forcein in Area Code 386.
What is the Percentage of People in the Labor Force in Area Code 386?
49.3% of People are in the Labor Force in Area Code 386.
What is the Unemployment Rate in Area Code 386?
Unemployment Rate in Area Code 386 is 5.4%.