Area Code 901 Map & Demographics
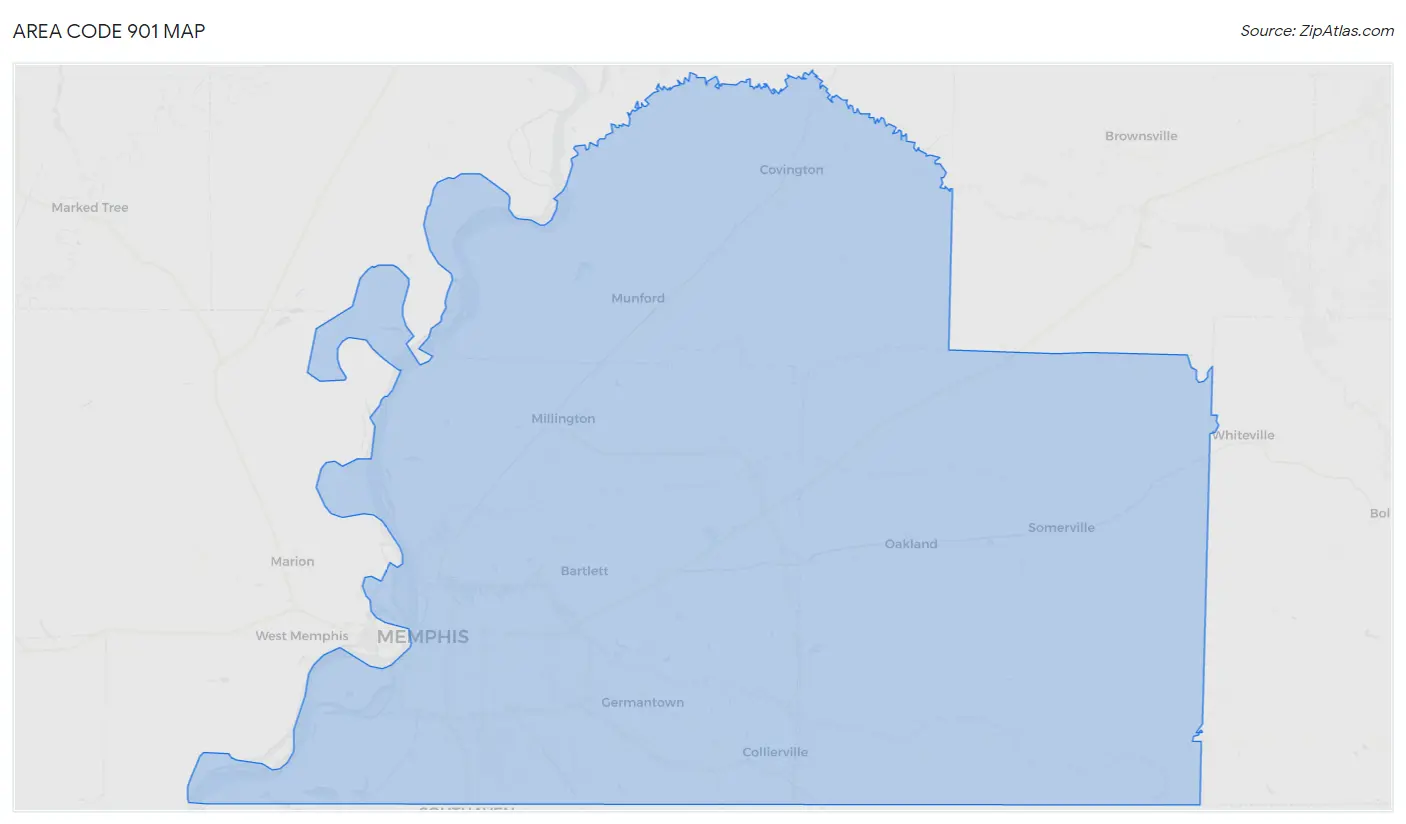
Area Code 901 Map
Area Code 901 Overview
$34,755
PER CAPITA INCOME
$81,118
AVG FAMILY INCOME
$65,642
AVG HOUSEHOLD INCOME
22.5%
WAGE / INCOME GAP [ % ]
77.5¢/ $1
WAGE / INCOME GAP [ $ ]
$11,625
FAMILY INCOME DEFICIT
21.97
INEQUALITY / GINI INDEX
1,032,035
TOTAL POPULATION
495,446
MALE POPULATION
536,589
FEMALE POPULATION
92.33
MALES / 100 FEMALES
108.30
FEMALES / 100 MALES
39.9
MEDIAN AGE
3.1
AVG FAMILY SIZE
2.5
AVG HOUSEHOLD SIZE
490,754
LABOR FORCE [ PEOPLE ]
60.8%
PERCENT IN LABOR FORCE
9.0%
UNEMPLOYMENT RATE
Income in Area Code 901
Income Overview in Area Code 901
Per Capita Income in Area Code 901 is $34,755, while median incomes of families and households are $81,118 and $65,642 respectively.
| Characteristic | Number | Measure |
| Per Capita Income | 1,032,035 | $34,755 |
| Median Family Income | 246,048 | $81,118 |
| Mean Family Income | 246,048 | $5,079,983 |
| Median Household Income | 396,271 | $65,642 |
| Mean Household Income | 396,271 | $4,321,743 |
| Income Deficit | 246,048 | $11,625 |
| Wage / Income Gap (%) | 1,032,035 | 22.53% |
| Wage / Income Gap ($) | 1,032,035 | 77.47¢ per $1 |
| Gini / Inequality Index | 1,032,035 | 21.97 |
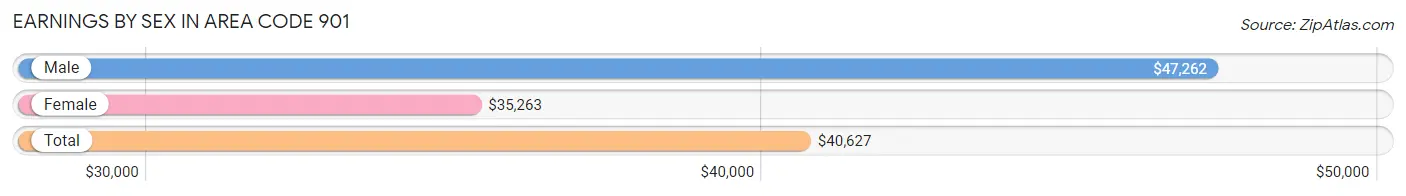
Earnings by Sex in Area Code 901
Average Earnings in Area Code 901 are $40,627, $47,262 for men and $35,263 for women, a difference of 25.4%.
| Sex | Number | Average Earnings |
| Male | 263,450 (50.1%) | $47,262 |
| Female | 262,335 (49.9%) | $35,263 |
| Total | 525,785 (100.0%) | $40,627 |
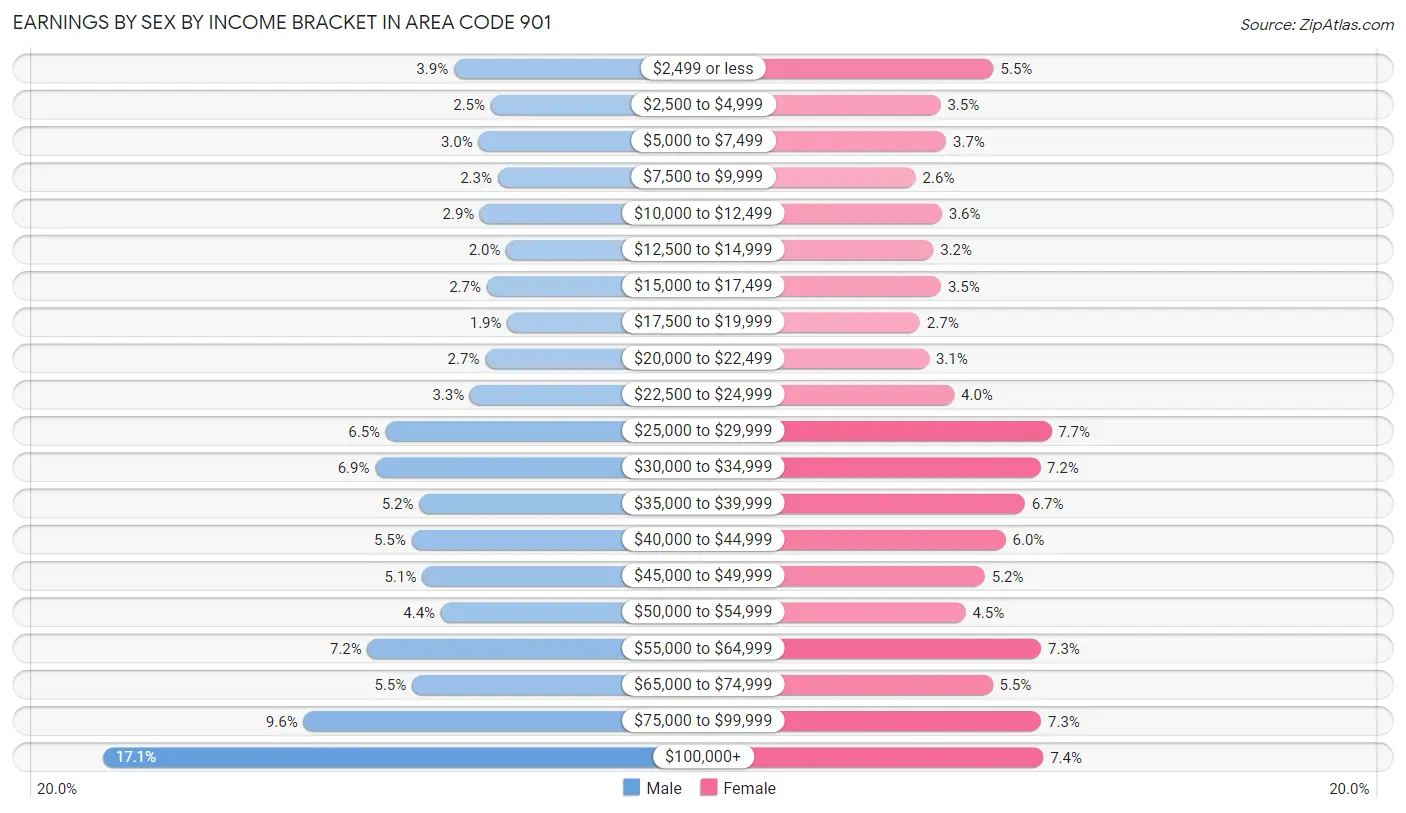
Earnings by Sex by Income Bracket in Area Code 901
The most common earnings brackets in Area Code 901 are $100,000+ for men (44,960 | 17.1%) and $25,000 to $29,999 for women (20,100 | 7.7%).
| Income | Male | Female |
| $2,499 or less | 10,310 (3.9%) | 14,418 (5.5%) |
| $2,500 to $4,999 | 6,678 (2.5%) | 9,204 (3.5%) |
| $5,000 to $7,499 | 7,874 (3.0%) | 9,767 (3.7%) |
| $7,500 to $9,999 | 5,981 (2.3%) | 6,767 (2.6%) |
| $10,000 to $12,499 | 7,726 (2.9%) | 9,349 (3.6%) |
| $12,500 to $14,999 | 5,135 (1.9%) | 8,488 (3.2%) |
| $15,000 to $17,499 | 7,064 (2.7%) | 9,263 (3.5%) |
| $17,500 to $19,999 | 5,035 (1.9%) | 7,177 (2.7%) |
| $20,000 to $22,499 | 7,213 (2.7%) | 8,082 (3.1%) |
| $22,500 to $24,999 | 8,731 (3.3%) | 10,552 (4.0%) |
| $25,000 to $29,999 | 17,013 (6.5%) | 20,100 (7.7%) |
| $30,000 to $34,999 | 18,067 (6.9%) | 19,004 (7.2%) |
| $35,000 to $39,999 | 13,715 (5.2%) | 17,510 (6.7%) |
| $40,000 to $44,999 | 14,495 (5.5%) | 15,598 (5.9%) |
| $45,000 to $49,999 | 13,442 (5.1%) | 13,570 (5.2%) |
| $50,000 to $54,999 | 11,580 (4.4%) | 11,669 (4.4%) |
| $55,000 to $64,999 | 18,834 (7.1%) | 19,089 (7.3%) |
| $65,000 to $74,999 | 14,439 (5.5%) | 14,320 (5.5%) |
| $75,000 to $99,999 | 25,158 (9.6%) | 19,101 (7.3%) |
| $100,000+ | 44,960 (17.1%) | 19,307 (7.4%) |
| Total | 263,450 (100.0%) | 262,335 (100.0%) |
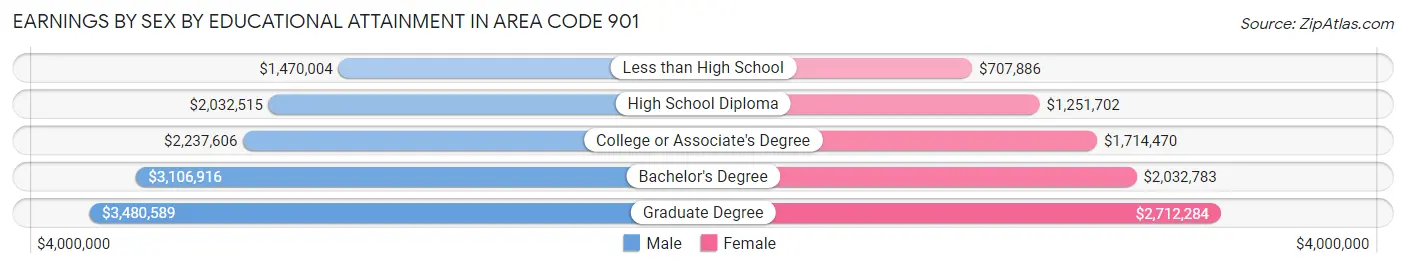
Earnings by Sex by Educational Attainment in Area Code 901
Average earnings in Area Code 901 are $2,590,429 for men and $1,896,249 for women, a difference of 26.8%. Men with an educational attainment of graduate degree enjoy the highest average annual earnings of $3,480,589, while those with less than high school education earn the least with $1,470,004. Women with an educational attainment of graduate degree earn the most with the average annual earnings of $2,712,284, while those with less than high school education have the smallest earnings of $707,886.
| Educational Attainment | Male Income | Female Income |
| Less than High School | $1,470,004 | $707,886 |
| High School Diploma | $2,032,515 | $1,251,702 |
| College or Associate's Degree | $2,237,606 | $1,714,470 |
| Bachelor's Degree | $3,106,916 | $2,032,783 |
| Graduate Degree | $3,480,589 | $2,712,284 |
| Total | $2,590,429 | $1,896,249 |
Family Income in Area Code 901
Family Income Brackets in Area Code 901
According to the Area Code 901 family income data, there are 2,280,127 families falling into the $100,000 to $149,999 income range, which is the most common income bracket and makes up 926.7% of all families. Conversely, the $10,000 to $14,999 income bracket is the least frequent group with only 327,736 families (133.2%) belonging to this category.
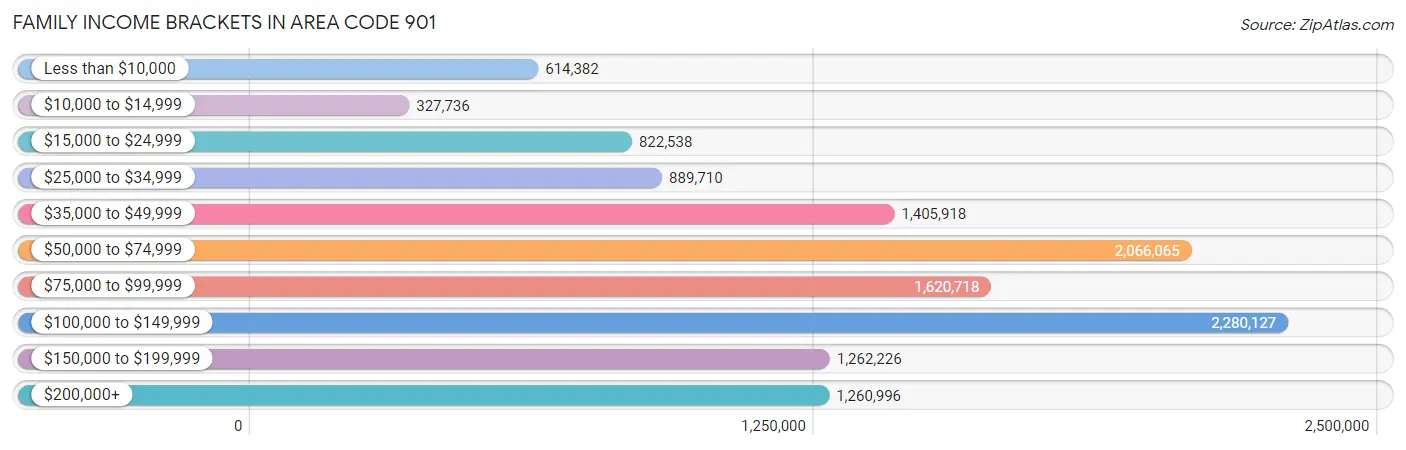
| Income Bracket | # Families | % Families |
| Less than $10,000 | 614,382 | 249.7% |
| $10,000 to $14,999 | 327,736 | 133.2% |
| $15,000 to $24,999 | 822,538 | 334.3% |
| $25,000 to $34,999 | 889,710 | 361.6% |
| $35,000 to $49,999 | 1,405,918 | 571.4% |
| $50,000 to $74,999 | 2,066,065 | 839.7% |
| $75,000 to $99,999 | 1,620,718 | 658.7% |
| $100,000 to $149,999 | 2,280,127 | 926.7% |
| $150,000 to $199,999 | 1,262,226 | 513.0% |
| $200,000+ | 1,260,996 | 512.5% |
Family Income by Famaliy Size in Area Code 901
7+ person families (4,631 | 1.9%) account for the highest median family income in Area Code 901 with $116,395 per family, while 2-person families (115,929 | 47.1%) have the highest median income of $38,213 per family member.
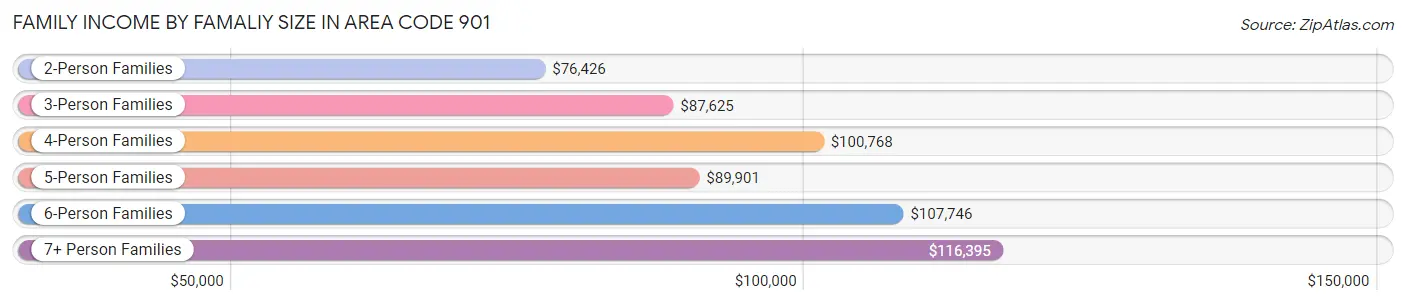
| Income Bracket | # Families | Median Income |
| 2-Person Families | 115,929 (47.1%) | $76,426 |
| 3-Person Families | 58,315 (23.7%) | $87,625 |
| 4-Person Families | 42,190 (17.2%) | $100,768 |
| 5-Person Families | 17,356 (7.0%) | $89,901 |
| 6-Person Families | 7,627 (3.1%) | $107,746 |
| 7+ Person Families | 4,631 (1.9%) | $116,395 |
| Total | 246,048 (100.0%) | $81,118 |
Family Income by Number of Earners in Area Code 901
The median family income in Area Code 901 is $81,118, with families comprising 3+ earners (24,420) having the highest median family income of $137,340, while families with no earners (33,613) have the lowest median family income of $40,595, accounting for 9.9% and 13.7% of families, respectively.
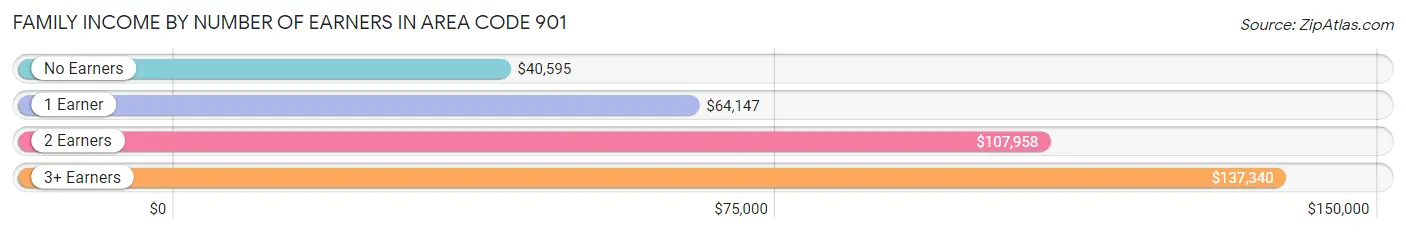
| Number of Earners | # Families | Median Income |
| No Earners | 33,613 (13.7%) | $40,595 |
| 1 Earner | 93,009 (37.8%) | $64,147 |
| 2 Earners | 95,006 (38.6%) | $107,958 |
| 3+ Earners | 24,420 (9.9%) | $137,340 |
| Total | 246,048 (100.0%) | $81,118 |
Household Income in Area Code 901
Household Income Brackets in Area Code 901
With 3,436,066 households falling in the category, the $50,000 to $74,999 income range is the most frequent in Area Code 901, accounting for 867.1% of all households. In contrast, only 1,043,778 households (263.4%) fall into the $10,000 to $14,999 income bracket, making it the least populous group.
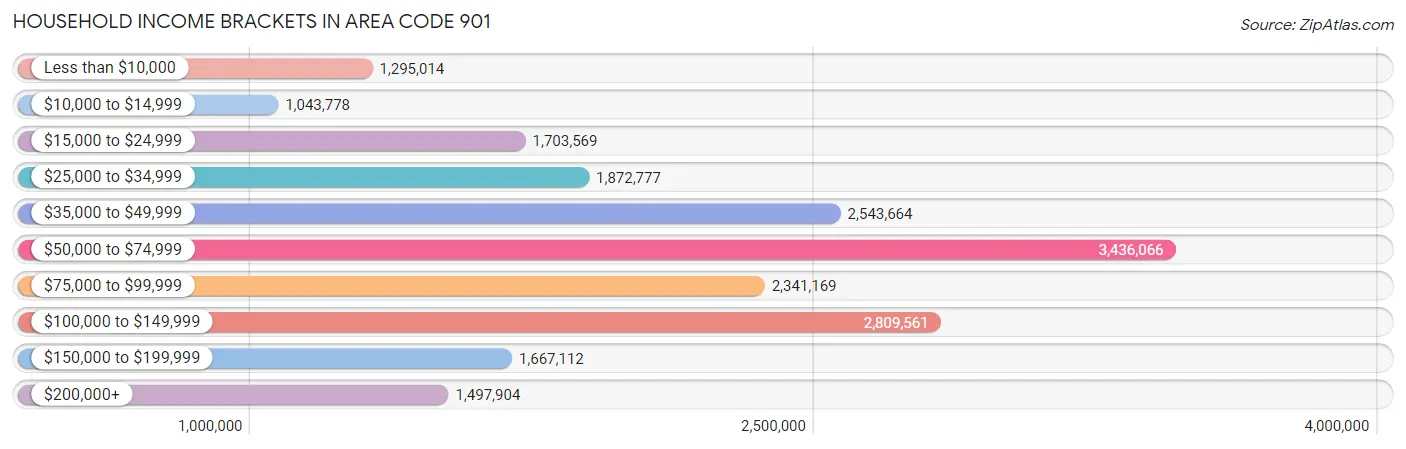
| Income Bracket | # Households | % Households |
| Less than $10,000 | 1,295,014 | 326.8% |
| $10,000 to $14,999 | 1,043,778 | 263.4% |
| $15,000 to $24,999 | 1,703,569 | 429.9% |
| $25,000 to $34,999 | 1,872,777 | 472.6% |
| $35,000 to $49,999 | 2,543,664 | 641.9% |
| $50,000 to $74,999 | 3,436,066 | 867.1% |
| $75,000 to $99,999 | 2,341,169 | 590.8% |
| $100,000 to $149,999 | 2,809,561 | 709.0% |
| $150,000 to $199,999 | 1,667,112 | 420.7% |
| $200,000+ | 1,497,904 | 378.0% |
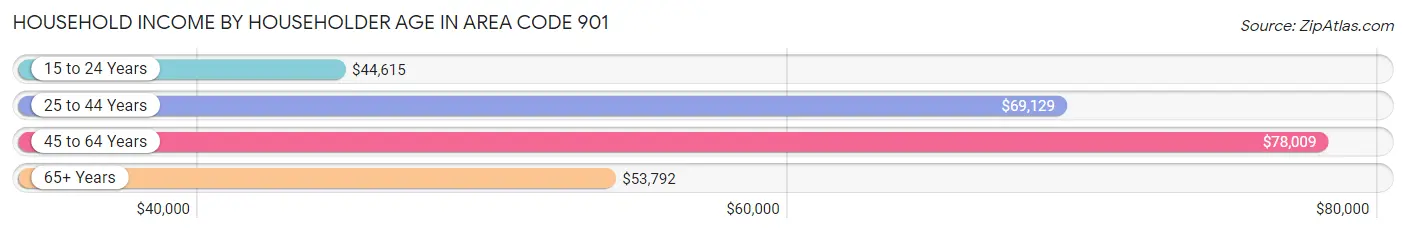
Household Income by Householder Age in Area Code 901
The median household income in Area Code 901 is $65,642, with the highest median household income of $78,009 found in the 45 to 64 years age bracket for the primary householder. A total of 147,850 households (37.3%) fall into this category. Meanwhile, the 15 to 24 years age bracket for the primary householder has the lowest median household income of $44,615, with 15,594 households (3.9%) in this group.
| Income Bracket | # Households | Median Income |
| 15 to 24 Years | 15,594 (3.9%) | $44,615 |
| 25 to 44 Years | 135,657 (34.2%) | $69,129 |
| 45 to 64 Years | 147,850 (37.3%) | $78,009 |
| 65+ Years | 97,170 (24.5%) | $53,792 |
| Total | 396,271 (100.0%) | $65,642 |
Poverty in Area Code 901
Income Below Poverty by Sex and Age in Area Code 901
With 15.7% poverty level for males and 19.0% for females among the residents of Area Code 901, 5 year old males and 5 year old females are the most vulnerable to poverty, with 2,635 males (37.2%) and 2,315 females (31.9%) in their respective age groups living below the poverty level.
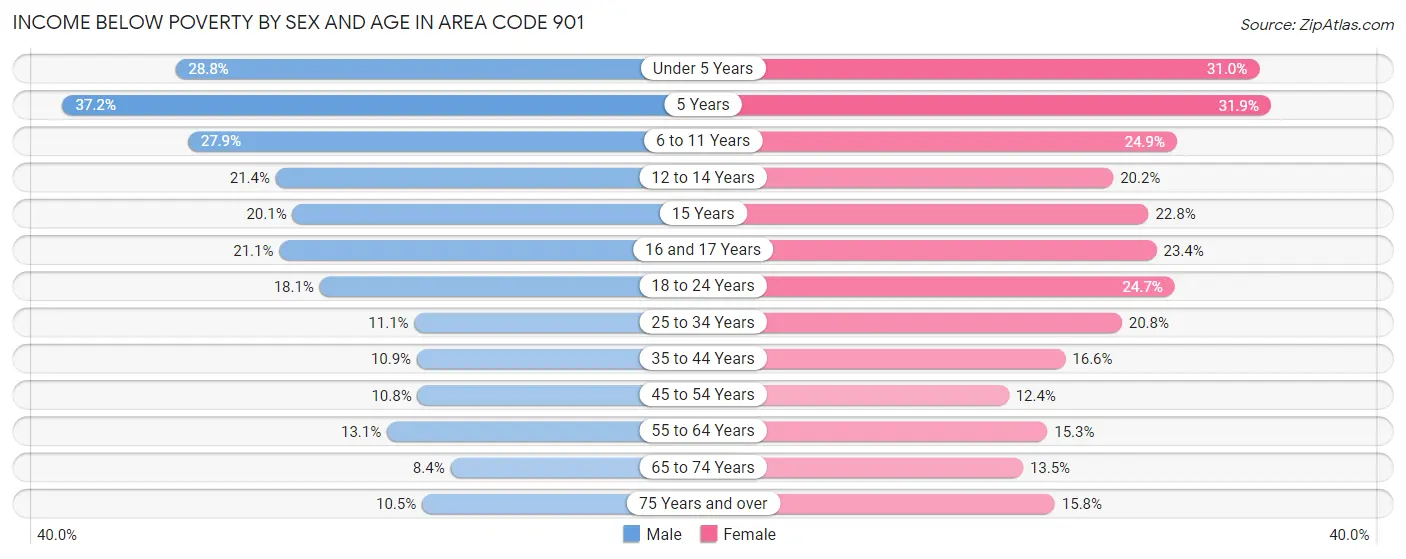
| Age Bracket | Male | Female |
| Under 5 Years | 9,697 (28.8%) | 10,230 (31.0%) |
| 5 Years | 2,635 (37.2%) | 2,315 (31.9%) |
| 6 to 11 Years | 11,999 (27.9%) | 10,150 (24.9%) |
| 12 to 14 Years | 4,747 (21.3%) | 4,313 (20.2%) |
| 15 Years | 1,349 (20.1%) | 1,362 (22.8%) |
| 16 and 17 Years | 3,000 (21.1%) | 3,437 (23.4%) |
| 18 to 24 Years | 7,936 (18.1%) | 10,915 (24.7%) |
| 25 to 34 Years | 7,755 (11.1%) | 16,025 (20.8%) |
| 35 to 44 Years | 6,500 (10.9%) | 11,134 (16.6%) |
| 45 to 54 Years | 6,387 (10.8%) | 8,101 (12.4%) |
| 55 to 64 Years | 7,777 (13.1%) | 10,365 (15.3%) |
| 65 to 74 Years | 3,472 (8.4%) | 6,851 (13.5%) |
| 75 Years and over | 2,164 (10.5%) | 5,304 (15.8%) |
| Total | 75,418 (15.7%) | 100,502 (19.0%) |
Income Above Poverty by Sex and Age in Area Code 901
According to the poverty statistics in Area Code 901, males aged 65 to 74 years and females aged 45 to 54 years are the age groups that are most secure financially, with 91.6% of males and 87.6% of females in these age groups living above the poverty line.
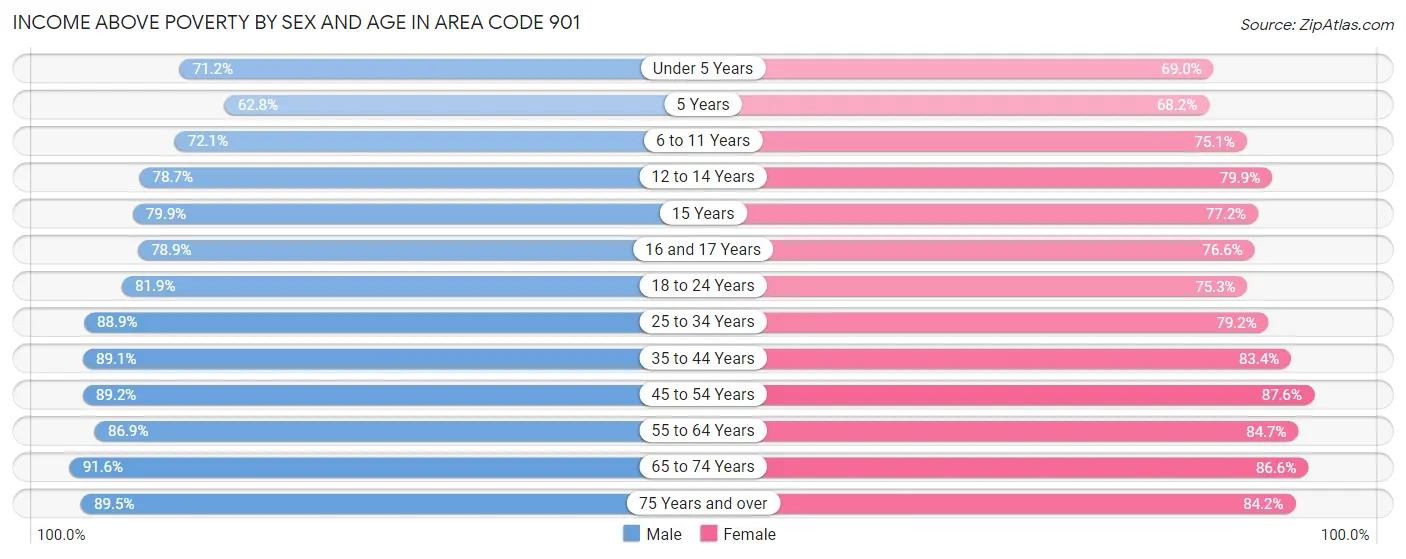
| Age Bracket | Male | Female |
| Under 5 Years | 23,975 (71.2%) | 22,790 (69.0%) |
| 5 Years | 4,452 (62.8%) | 4,953 (68.1%) |
| 6 to 11 Years | 31,034 (72.1%) | 30,667 (75.1%) |
| 12 to 14 Years | 17,484 (78.6%) | 17,088 (79.8%) |
| 15 Years | 5,360 (79.9%) | 4,620 (77.2%) |
| 16 and 17 Years | 11,223 (78.9%) | 11,271 (76.6%) |
| 18 to 24 Years | 35,943 (81.9%) | 33,251 (75.3%) |
| 25 to 34 Years | 62,368 (88.9%) | 61,068 (79.2%) |
| 35 to 44 Years | 53,322 (89.1%) | 55,958 (83.4%) |
| 45 to 54 Years | 52,589 (89.2%) | 57,277 (87.6%) |
| 55 to 64 Years | 51,631 (86.9%) | 57,536 (84.7%) |
| 65 to 74 Years | 37,955 (91.6%) | 44,076 (86.6%) |
| 75 Years and over | 18,456 (89.5%) | 28,218 (84.2%) |
| Total | 405,792 (84.3%) | 428,773 (81.0%) |
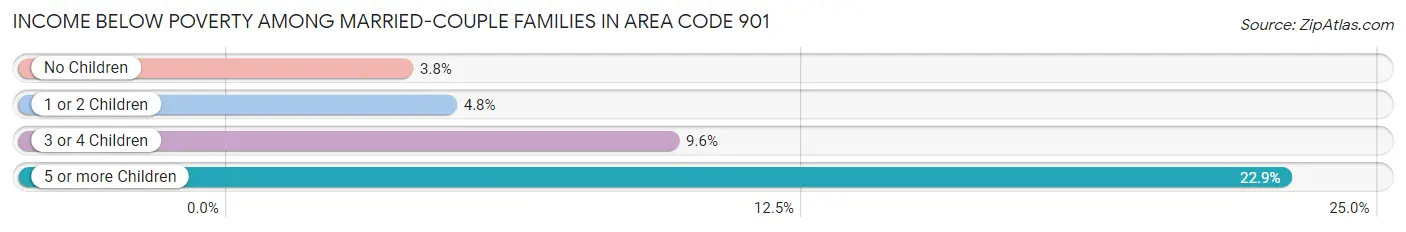
Income Below Poverty Among Married-Couple Families in Area Code 901
The poverty statistics for married-couple families in Area Code 901 show that 4.7% or 7,130 of the total 151,423 families live below the poverty line. Families with 5 or more children have the highest poverty rate of 22.9%, comprising of 278 families. On the other hand, families with no children have the lowest poverty rate of 3.8%, which includes 3,456 families.
| Children | Above Poverty | Below Poverty |
| No Children | 87,156 (96.2%) | 3,456 (3.8%) |
| 1 or 2 Children | 45,811 (95.2%) | 2,292 (4.8%) |
| 3 or 4 Children | 10,392 (90.4%) | 1,104 (9.6%) |
| 5 or more Children | 934 (77.1%) | 278 (22.9%) |
| Total | 144,293 (95.3%) | 7,130 (4.7%) |
Income Below Poverty Among Single-Parent Households in Area Code 901
According to the poverty data in Area Code 901, 16.4% or 3,194 single-father households and 28.7% or 21,575 single-mother households are living below the poverty line. Among single-father households, those with 3 or 4 children have the highest poverty rate, with 642 households (42.0%) experiencing poverty. Likewise, among single-mother households, those with 5 or more children have the highest poverty rate, with 1,190 households (86.7%) falling below the poverty line.
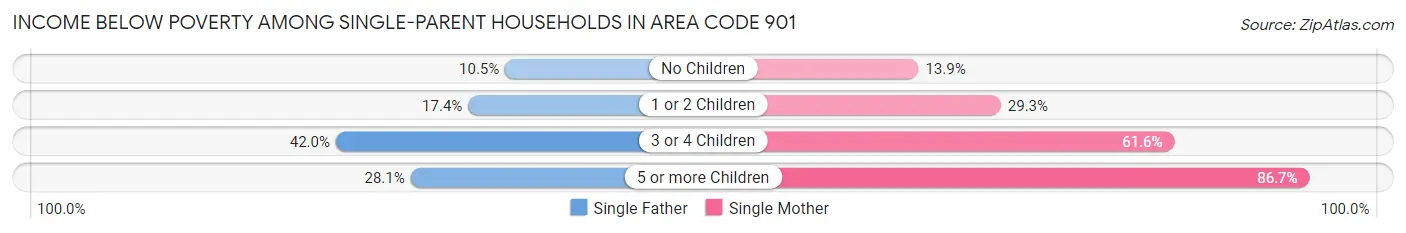
| Children | Single Father | Single Mother |
| No Children | 933 (10.5%) | 3,752 (13.9%) |
| 1 or 2 Children | 1,529 (17.4%) | 11,054 (29.3%) |
| 3 or 4 Children | 642 (42.0%) | 5,579 (61.6%) |
| 5 or more Children | 90 (28.1%) | 1,190 (86.7%) |
| Total | 3,194 (16.4%) | 21,575 (28.7%) |
Income Below Poverty Among Married-Couple vs Single-Parent Households in Area Code 901
The poverty data for Area Code 901 shows that 7,130 of the married-couple family households (4.7%) and 24,769 of the single-parent households (26.2%) are living below the poverty level. Within the married-couple family households, those with 5 or more children have the highest poverty rate, with 278 households (22.9%) falling below the poverty line. Among the single-parent households, those with 5 or more children have the highest poverty rate, with 1,280 household (75.6%) living below poverty.
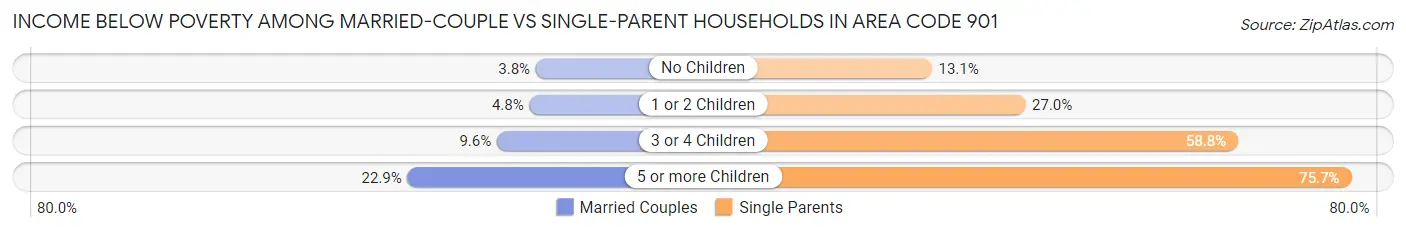
| Children | Married-Couple Families | Single-Parent Households |
| No Children | 3,456 (3.8%) | 4,685 (13.1%) |
| 1 or 2 Children | 2,292 (4.8%) | 12,583 (27.0%) |
| 3 or 4 Children | 1,104 (9.6%) | 6,221 (58.8%) |
| 5 or more Children | 278 (22.9%) | 1,280 (75.6%) |
| Total | 7,130 (4.7%) | 24,769 (26.2%) |
Race in Area Code 901
The most populous races in Area Code 901 are Black / African American (523,186 | 50.7%), White / Caucasian (414,586 | 40.2%), and Hispanic or Latino (65,976 | 6.4%).
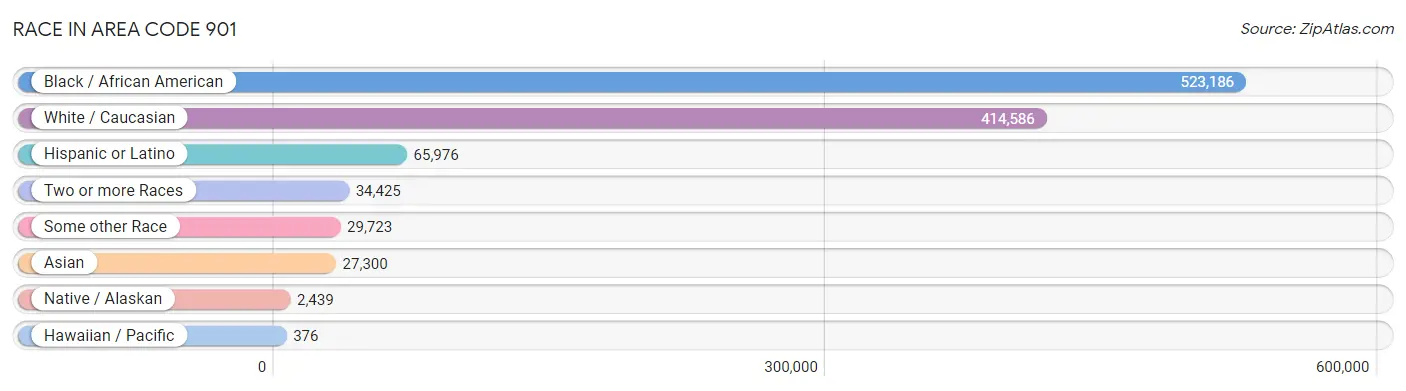
| Race | # Population | % Population |
| Asian | 27,300 | 2.6% |
| Black / African American | 523,186 | 50.7% |
| Hawaiian / Pacific | 376 | 0.0% |
| Hispanic or Latino | 65,976 | 6.4% |
| Native / Alaskan | 2,439 | 0.2% |
| White / Caucasian | 414,586 | 40.2% |
| Two or more Races | 34,425 | 3.3% |
| Some other Race | 29,723 | 2.9% |
| Total | 1,032,035 | 100.0% |
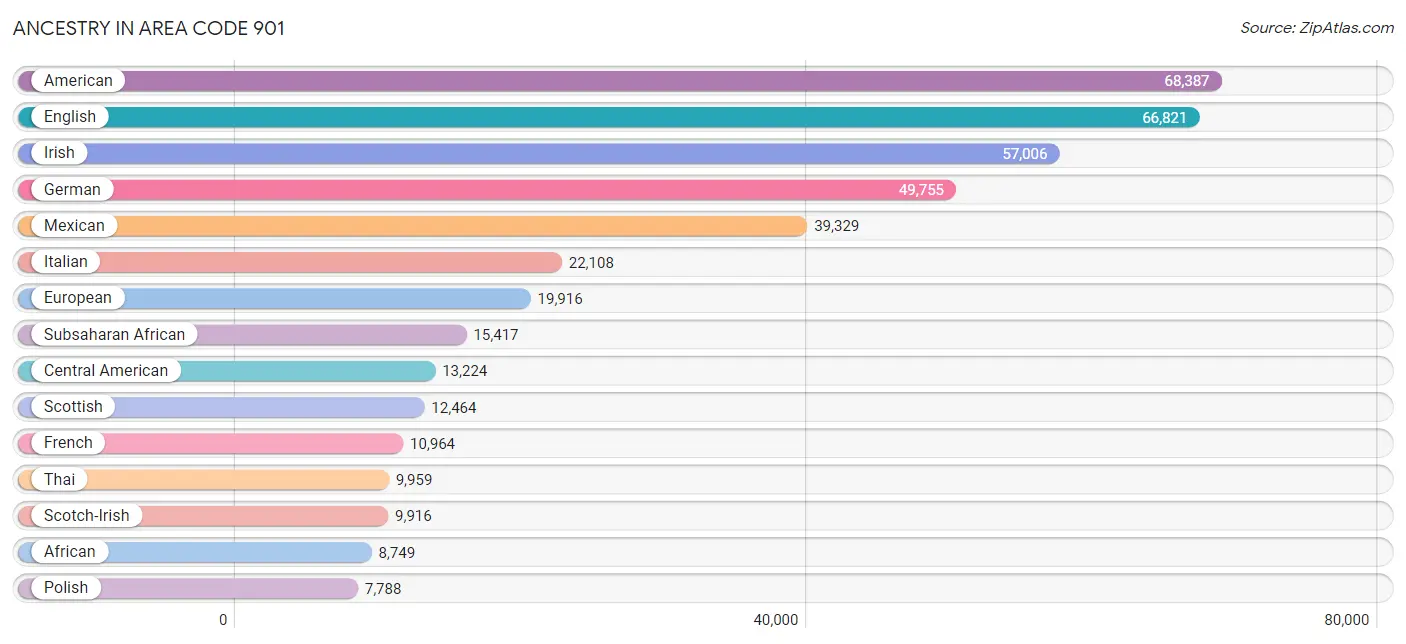
Ancestry in Area Code 901
The most populous ancestries reported in Area Code 901 are American (68,387 | 6.6%), English (66,821 | 6.5%), Irish (57,006 | 5.5%), German (49,755 | 4.8%), and Mexican (39,329 | 3.8%), together accounting for 27.3% of all Area Code 901 residents.
| Ancestry | # Population | % Population |
| Afghan | 5 | 0.0% |
| African | 8,749 | 0.9% |
| Alaskan Athabascan | 5 | 0.0% |
| Albanian | 36 | 0.0% |
| Alsatian | 7 | 0.0% |
| American | 68,387 | 6.6% |
| Apache | 180 | 0.0% |
| Arab | 6,573 | 0.6% |
| Argentinean | 279 | 0.0% |
| Armenian | 173 | 0.0% |
| Assyrian / Chaldean / Syriac | 8 | 0.0% |
| Australian | 77 | 0.0% |
| Austrian | 922 | 0.1% |
| Bahamian | 51 | 0.0% |
| Bangladeshi | 148 | 0.0% |
| Barbadian | 19 | 0.0% |
| Basque | 29 | 0.0% |
| Belgian | 245 | 0.0% |
| Belizean | 44 | 0.0% |
| Bermudan | 7 | 0.0% |
| Bhutanese | 936 | 0.1% |
| Blackfeet | 205 | 0.0% |
| Bolivian | 12 | 0.0% |
| Brazilian | 275 | 0.0% |
| British | 3,771 | 0.4% |
| British West Indian | 49 | 0.0% |
| Bulgarian | 34 | 0.0% |
| Burmese | 1,800 | 0.2% |
| Cajun | 102 | 0.0% |
| Cambodian | 166 | 0.0% |
| Canadian | 654 | 0.1% |
| Cape Verdean | 57 | 0.0% |
| Celtic | 31 | 0.0% |
| Central American | 13,224 | 1.3% |
| Central American Indian | 234 | 0.0% |
| Cherokee | 2,414 | 0.2% |
| Cheyenne | 16 | 0.0% |
| Chickasaw | 64 | 0.0% |
| Chilean | 247 | 0.0% |
| Chinese | 4 | 0.0% |
| Chippewa | 11 | 0.0% |
| Choctaw | 163 | 0.0% |
| Colombian | 848 | 0.1% |
| Comanche | 2 | 0.0% |
| Costa Rican | 60 | 0.0% |
| Creek | 143 | 0.0% |
| Croatian | 671 | 0.1% |
| Crow | 20 | 0.0% |
| Cuban | 1,817 | 0.2% |
| Czech | 1,389 | 0.1% |
| Czechoslovakian | 232 | 0.0% |
| Danish | 1,070 | 0.1% |
| Delaware | 2 | 0.0% |
| Dominican | 749 | 0.1% |
| Dutch | 4,308 | 0.4% |
| Dutch West Indian | 28 | 0.0% |
| Eastern European | 1,574 | 0.2% |
| Ecuadorian | 121 | 0.0% |
| Egyptian | 539 | 0.1% |
| English | 66,821 | 6.5% |
| Estonian | 9 | 0.0% |
| Ethiopian | 1,104 | 0.1% |
| European | 19,916 | 1.9% |
| Filipino | 278 | 0.0% |
| Finnish | 481 | 0.1% |
| French | 10,964 | 1.1% |
| French American Indian | 2 | 0.0% |
| French Canadian | 1,389 | 0.1% |
| German | 49,755 | 4.8% |
| German Russian | 18 | 0.0% |
| Ghanaian | 479 | 0.1% |
| Greek | 1,611 | 0.2% |
| Guamanian / Chamorro | 60 | 0.0% |
| Guatemalan | 5,704 | 0.5% |
| Guyanese | 38 | 0.0% |
| Haitian | 110 | 0.0% |
| Honduran | 4,002 | 0.4% |
| Houma | 27 | 0.0% |
| Hungarian | 921 | 0.1% |
| Icelander | 31 | 0.0% |
| Indian (Asian) | 5,850 | 0.6% |
| Indonesian | 146 | 0.0% |
| Inupiat | 1 | 0.0% |
| Iranian | 414 | 0.0% |
| Iraqi | 99 | 0.0% |
| Irish | 57,006 | 5.5% |
| Iroquois | 46 | 0.0% |
| Israeli | 132 | 0.0% |
| Italian | 22,108 | 2.1% |
| Jamaican | 845 | 0.1% |
| Japanese | 413 | 0.0% |
| Jordanian | 158 | 0.0% |
| Kenyan | 116 | 0.0% |
| Kiowa | 11 | 0.0% |
| Korean | 4,533 | 0.4% |
| Laotian | 112 | 0.0% |
| Latvian | 77 | 0.0% |
| Lebanese | 1,372 | 0.1% |
| Liberian | 10 | 0.0% |
| Lithuanian | 694 | 0.1% |
| Lumbee | 5 | 0.0% |
| Luxembourger | 50 | 0.0% |
| Malaysian | 648 | 0.1% |
| Maltese | 5 | 0.0% |
| Menominee | 43 | 0.0% |
| Mexican | 39,329 | 3.8% |
| Mexican American Indian | 671 | 0.1% |
| Mongolian | 30 | 0.0% |
| Moroccan | 118 | 0.0% |
| Native Hawaiian | 541 | 0.1% |
| Navajo | 65 | 0.0% |
| Nicaraguan | 598 | 0.1% |
| Nigerian | 3,009 | 0.3% |
| Northern European | 760 | 0.1% |
| Norwegian | 3,215 | 0.3% |
| Okinawan | 2 | 0.0% |
| Pakistani | 303 | 0.0% |
| Palestinian | 776 | 0.1% |
| Panamanian | 407 | 0.0% |
| Paraguayan | 6 | 0.0% |
| Pennsylvania German | 35 | 0.0% |
| Peruvian | 546 | 0.1% |
| Polish | 7,788 | 0.7% |
| Portuguese | 770 | 0.1% |
| Potawatomi | 44 | 0.0% |
| Pueblo | 58 | 0.0% |
| Puerto Rican | 3,445 | 0.3% |
| Puget Sound Salish | 1 | 0.0% |
| Romanian | 307 | 0.0% |
| Russian | 2,073 | 0.2% |
| Salvadoran | 2,341 | 0.2% |
| Samoan | 168 | 0.0% |
| Scandinavian | 1,672 | 0.2% |
| Scotch-Irish | 9,916 | 1.0% |
| Scottish | 12,464 | 1.2% |
| Seminole | 13 | 0.0% |
| Senegalese | 406 | 0.0% |
| Serbian | 134 | 0.0% |
| Sierra Leonean | 16 | 0.0% |
| Sioux | 130 | 0.0% |
| Slavic | 123 | 0.0% |
| Slovak | 163 | 0.0% |
| Slovene | 21 | 0.0% |
| Somali | 172 | 0.0% |
| South African | 106 | 0.0% |
| South American | 3,889 | 0.4% |
| South American Indian | 6 | 0.0% |
| Spaniard | 590 | 0.1% |
| Spanish | 719 | 0.1% |
| Spanish American | 22 | 0.0% |
| Sri Lankan | 5,575 | 0.5% |
| Subsaharan African | 15,417 | 1.5% |
| Sudanese | 168 | 0.0% |
| Swedish | 2,844 | 0.3% |
| Swiss | 1,250 | 0.1% |
| Syrian | 321 | 0.0% |
| Thai | 9,959 | 1.0% |
| Tlingit-Haida | 8 | 0.0% |
| Tongan | 12 | 0.0% |
| Trinidadian and Tobagonian | 400 | 0.0% |
| Turkish | 165 | 0.0% |
| U.S. Virgin Islander | 18 | 0.0% |
| Ugandan | 14 | 0.0% |
| Ukrainian | 590 | 0.1% |
| Uruguayan | 44 | 0.0% |
| Venezuelan | 1,607 | 0.2% |
| Vietnamese | 129 | 0.0% |
| Welsh | 3,646 | 0.4% |
| West Indian | 127 | 0.0% |
| Yaqui | 10 | 0.0% |
| Yugoslavian | 142 | 0.0% | View All 171 Rows |
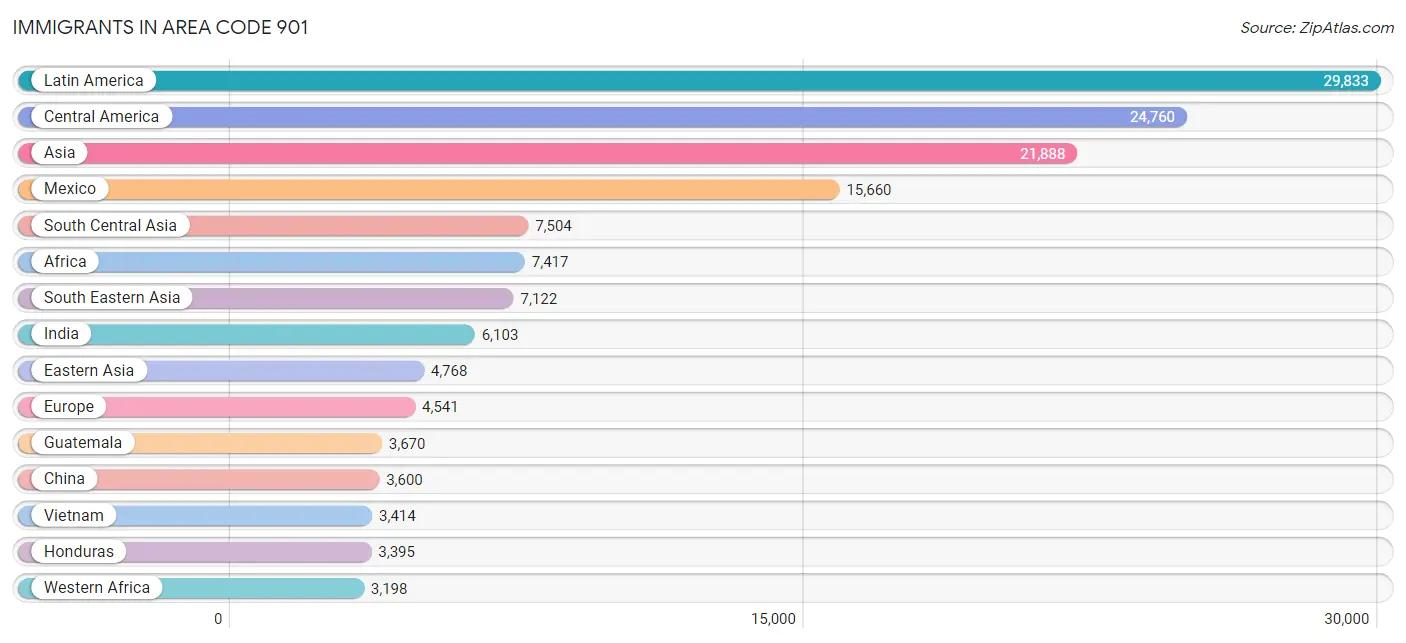
Immigrants in Area Code 901
The most numerous immigrant groups reported in Area Code 901 came from Latin America (29,833 | 2.9%), Central America (24,760 | 2.4%), Asia (21,888 | 2.1%), Mexico (15,660 | 1.5%), and South Central Asia (7,504 | 0.7%), together accounting for 9.7% of all Area Code 901 residents.
| Immigration Origin | # Population | % Population |
| Afghanistan | 5 | 0.0% |
| Africa | 7,417 | 0.7% |
| Albania | 11 | 0.0% |
| Argentina | 136 | 0.0% |
| Armenia | 10 | 0.0% |
| Asia | 21,888 | 2.1% |
| Australia | 68 | 0.0% |
| Austria | 89 | 0.0% |
| Bahamas | 43 | 0.0% |
| Bangladesh | 156 | 0.0% |
| Barbados | 6 | 0.0% |
| Belarus | 33 | 0.0% |
| Belgium | 39 | 0.0% |
| Belize | 161 | 0.0% |
| Bolivia | 6 | 0.0% |
| Bosnia and Herzegovina | 80 | 0.0% |
| Brazil | 347 | 0.0% |
| Bulgaria | 34 | 0.0% |
| Cambodia | 234 | 0.0% |
| Cameroon | 18 | 0.0% |
| Canada | 910 | 0.1% |
| Caribbean | 2,020 | 0.2% |
| Central America | 24,760 | 2.4% |
| Chile | 59 | 0.0% |
| China | 3,600 | 0.4% |
| Colombia | 466 | 0.1% |
| Congo | 339 | 0.0% |
| Costa Rica | 32 | 0.0% |
| Cuba | 672 | 0.1% |
| Czechoslovakia | 48 | 0.0% |
| Dominica | 44 | 0.0% |
| Dominican Republic | 322 | 0.0% |
| Eastern Africa | 1,667 | 0.2% |
| Eastern Asia | 4,768 | 0.5% |
| Eastern Europe | 1,352 | 0.1% |
| Ecuador | 37 | 0.0% |
| Egypt | 767 | 0.1% |
| El Salvador | 1,399 | 0.1% |
| England | 611 | 0.1% |
| Eritrea | 37 | 0.0% |
| Ethiopia | 1,149 | 0.1% |
| Europe | 4,541 | 0.4% |
| France | 77 | 0.0% |
| Germany | 803 | 0.1% |
| Ghana | 254 | 0.0% |
| Greece | 102 | 0.0% |
| Guatemala | 3,670 | 0.4% |
| Guyana | 158 | 0.0% |
| Haiti | 24 | 0.0% |
| Honduras | 3,395 | 0.3% |
| Hong Kong | 95 | 0.0% |
| India | 6,103 | 0.6% |
| Indonesia | 132 | 0.0% |
| Iran | 401 | 0.0% |
| Iraq | 155 | 0.0% |
| Ireland | 216 | 0.0% |
| Israel | 164 | 0.0% |
| Italy | 197 | 0.0% |
| Jamaica | 332 | 0.0% |
| Japan | 306 | 0.0% |
| Jordan | 241 | 0.0% |
| Kazakhstan | 25 | 0.0% |
| Kenya | 153 | 0.0% |
| Korea | 783 | 0.1% |
| Kuwait | 75 | 0.0% |
| Laos | 228 | 0.0% |
| Latin America | 29,833 | 2.9% |
| Lebanon | 455 | 0.0% |
| Liberia | 11 | 0.0% |
| Lithuania | 29 | 0.0% |
| Malaysia | 126 | 0.0% |
| Mexico | 15,660 | 1.5% |
| Middle Africa | 458 | 0.0% |
| Morocco | 10 | 0.0% |
| Nepal | 143 | 0.0% |
| Netherlands | 104 | 0.0% |
| Nicaragua | 241 | 0.0% |
| Nigeria | 1,439 | 0.1% |
| Northern Africa | 1,116 | 0.1% |
| Northern Europe | 1,559 | 0.2% |
| Oceania | 117 | 0.0% |
| Pakistan | 640 | 0.1% |
| Panama | 183 | 0.0% |
| Peru | 229 | 0.0% |
| Philippines | 2,746 | 0.3% |
| Poland | 428 | 0.0% |
| Portugal | 25 | 0.0% |
| Romania | 112 | 0.0% |
| Russia | 272 | 0.0% |
| Saudi Arabia | 593 | 0.1% |
| Scotland | 62 | 0.0% |
| Senegal | 576 | 0.1% |
| Serbia | 21 | 0.0% |
| Sierra Leone | 96 | 0.0% |
| Singapore | 40 | 0.0% |
| Somalia | 50 | 0.0% |
| South Africa | 143 | 0.0% |
| South America | 3,053 | 0.3% |
| South Central Asia | 7,504 | 0.7% |
| South Eastern Asia | 7,122 | 0.7% |
| Southern Europe | 510 | 0.1% |
| Spain | 186 | 0.0% |
| St. Vincent and the Grenadines | 16 | 0.0% |
| Sudan | 283 | 0.0% |
| Sweden | 62 | 0.0% |
| Switzerland | 8 | 0.0% |
| Syria | 91 | 0.0% |
| Taiwan | 324 | 0.0% |
| Thailand | 119 | 0.0% |
| Trinidad and Tobago | 476 | 0.1% |
| Turkey | 140 | 0.0% |
| Uganda | 28 | 0.0% |
| Ukraine | 200 | 0.0% |
| Uruguay | 31 | 0.0% |
| Uzbekistan | 31 | 0.0% |
| Venezuela | 1,565 | 0.2% |
| Vietnam | 3,414 | 0.3% |
| West Indies | 34 | 0.0% |
| Western Africa | 3,198 | 0.3% |
| Western Asia | 2,298 | 0.2% |
| Western Europe | 1,120 | 0.1% |
| Yemen | 348 | 0.0% |
| Zaire | 101 | 0.0% | View All 123 Rows |
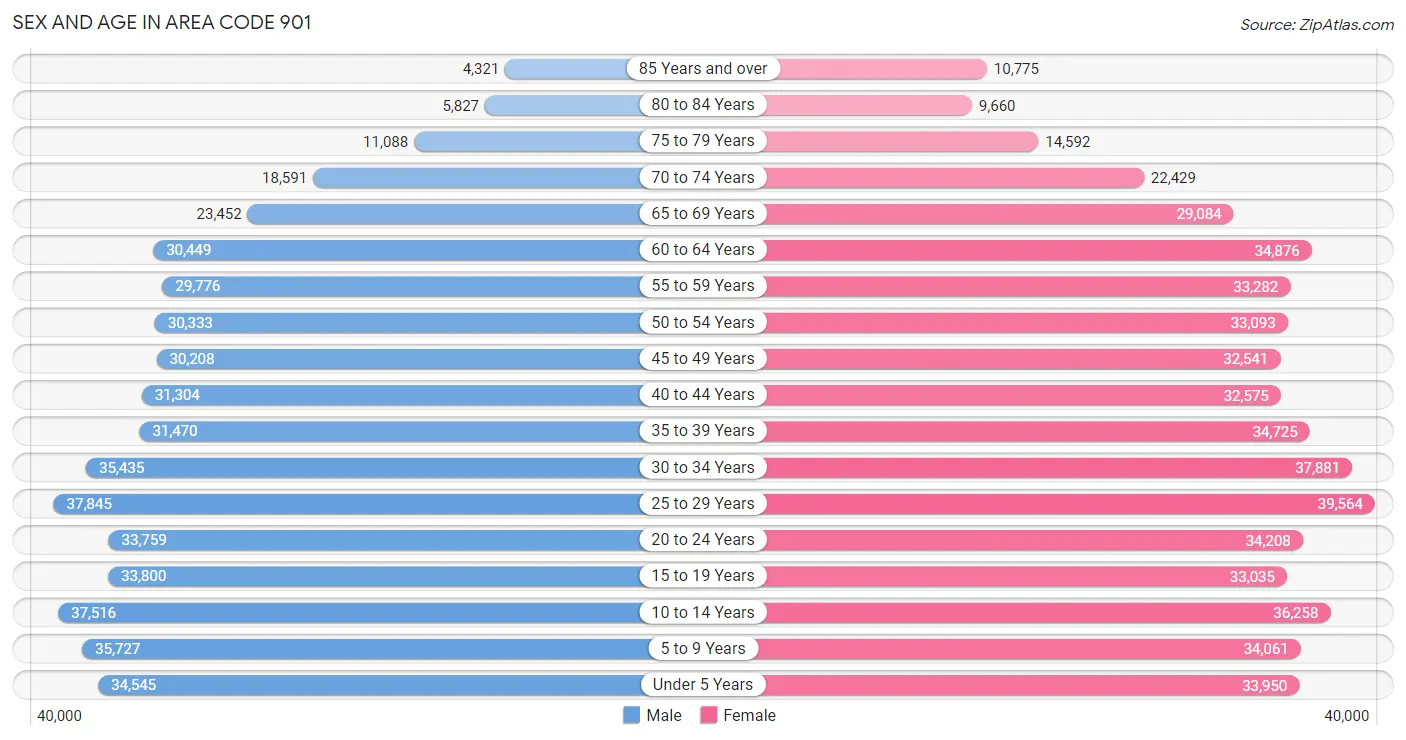
Sex and Age in Area Code 901
Sex and Age in Area Code 901
The most populous age groups in Area Code 901 are 25 to 29 Years (37,845 | 7.6%) for men and 25 to 29 Years (39,564 | 7.4%) for women.
| Age Bracket | Male | Female |
| Under 5 Years | 34,545 (7.0%) | 33,950 (6.3%) |
| 5 to 9 Years | 35,727 (7.2%) | 34,061 (6.4%) |
| 10 to 14 Years | 37,516 (7.6%) | 36,258 (6.8%) |
| 15 to 19 Years | 33,800 (6.8%) | 33,035 (6.2%) |
| 20 to 24 Years | 33,759 (6.8%) | 34,208 (6.4%) |
| 25 to 29 Years | 37,845 (7.6%) | 39,564 (7.4%) |
| 30 to 34 Years | 35,435 (7.1%) | 37,881 (7.1%) |
| 35 to 39 Years | 31,470 (6.4%) | 34,725 (6.5%) |
| 40 to 44 Years | 31,304 (6.3%) | 32,575 (6.1%) |
| 45 to 49 Years | 30,208 (6.1%) | 32,541 (6.1%) |
| 50 to 54 Years | 30,333 (6.1%) | 33,093 (6.2%) |
| 55 to 59 Years | 29,776 (6.0%) | 33,282 (6.2%) |
| 60 to 64 Years | 30,449 (6.1%) | 34,876 (6.5%) |
| 65 to 69 Years | 23,452 (4.7%) | 29,084 (5.4%) |
| 70 to 74 Years | 18,591 (3.7%) | 22,429 (4.2%) |
| 75 to 79 Years | 11,088 (2.2%) | 14,592 (2.7%) |
| 80 to 84 Years | 5,827 (1.2%) | 9,660 (1.8%) |
| 85 Years and over | 4,321 (0.9%) | 10,775 (2.0%) |
| Total | 495,446 (100.0%) | 536,589 (100.0%) |
Families and Households in Area Code 901
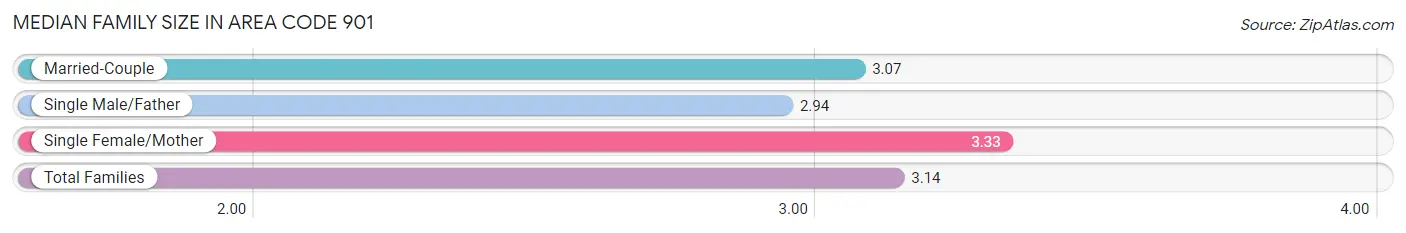
Median Family Size in Area Code 901
The median family size in Area Code 901 is 3.14 persons per family, with single female/mother families (75,098 | 30.5%) accounting for the largest median family size of 3.33224 persons per family. On the other hand, single male/father families (19,527 | 7.9%) represent the smallest median family size with 2.94 persons per family.
| Family Type | # Families | Family Size |
| Married-Couple | 151,423 (61.5%) | 3.07 |
| Single Male/Father | 19,527 (7.9%) | 2.94 |
| Single Female/Mother | 75,098 (30.5%) | 3.33 |
| Total Families | 246,048 (100.0%) | 3.14 |
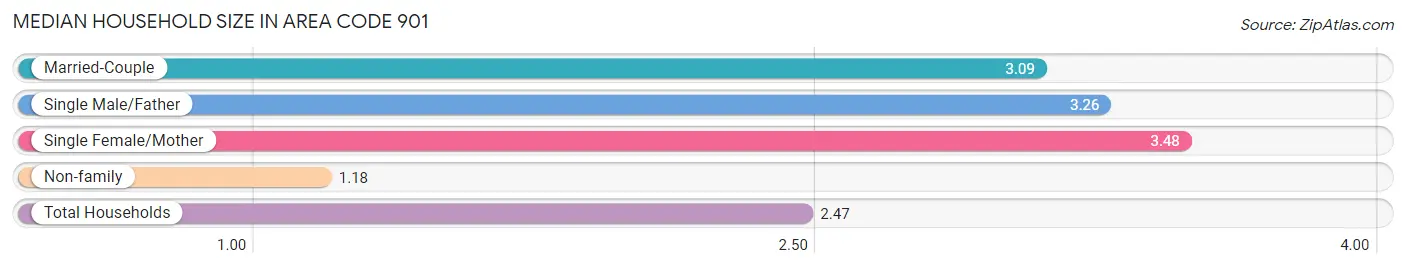
Median Household Size in Area Code 901
The median household size in Area Code 901 is 2.47 persons per household, with single female/mother households (75,098 | 19.0%) accounting for the largest median household size of 3.47755 persons per household. non-family households (150,223 | 37.9%) represent the smallest median household size with 1.18 persons per household.
| Household Type | # Households | Household Size |
| Married-Couple | 151,423 (38.2%) | 3.09 |
| Single Male/Father | 19,527 (4.9%) | 3.26 |
| Single Female/Mother | 75,098 (19.0%) | 3.48 |
| Non-family | 150,223 (37.9%) | 1.18 |
| Total Households | 396,271 (100.0%) | 2.47 |
Household Size by Marriage Status in Area Code 901
Out of a total of 396,271 households in Area Code 901, 246,048 (62.1%) are family households, while 150,223 (37.9%) are nonfamily households. The most numerous type of family households are 2-person households, comprising 109,020, and the most common type of nonfamily households are 1-person households, comprising 129,289.
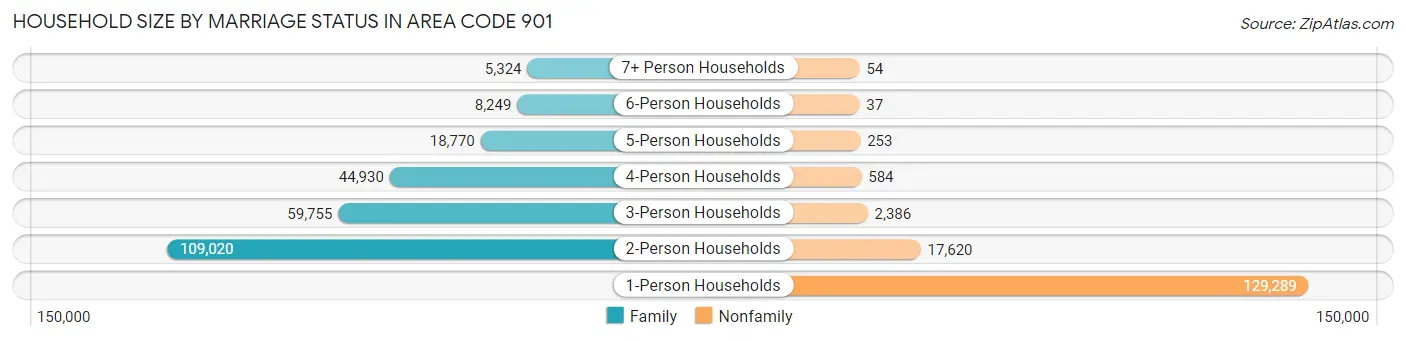
| Household Size | Family Households | Nonfamily Households |
| 1-Person Households | - | 129,289 (32.6%) |
| 2-Person Households | 109,020 (27.5%) | 17,620 (4.4%) |
| 3-Person Households | 59,755 (15.1%) | 2,386 (0.6%) |
| 4-Person Households | 44,930 (11.3%) | 584 (0.2%) |
| 5-Person Households | 18,770 (4.7%) | 253 (0.1%) |
| 6-Person Households | 8,249 (2.1%) | 37 (0.0%) |
| 7+ Person Households | 5,324 (1.3%) | 54 (0.0%) |
| Total | 246,048 (62.1%) | 150,223 (37.9%) |
Female Fertility in Area Code 901
Fertility by Age in Area Code 901
Average fertility rate in Area Code 901 is 51.3 births per 1,000 women. Women in the age bracket of 20 to 34 years have the highest fertility rate with 79.8 births per 1,000 women. Women in the age bracket of 20 to 34 years acount for 71.8% of all women with births.
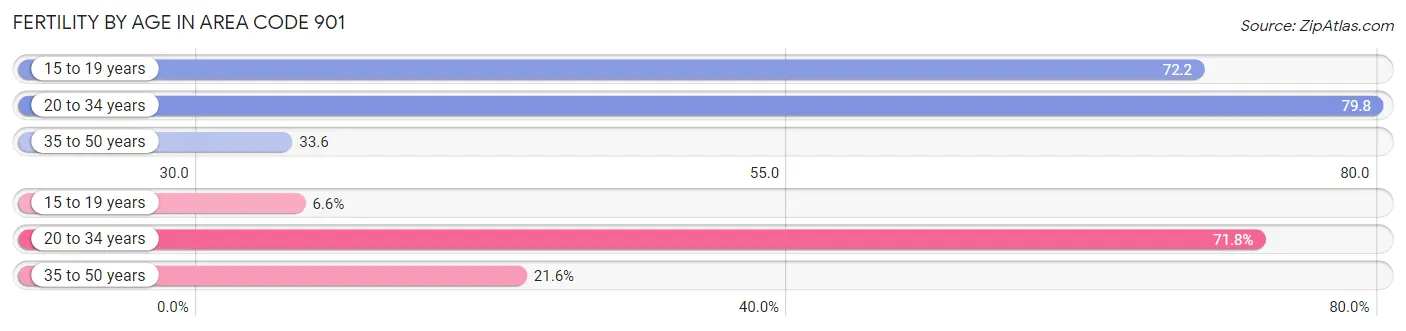
| Age Bracket | Women with Births | Births / 1,000 Women |
| 15 to 19 years | 778 (6.6%) | 72.2 |
| 20 to 34 years | 8,443 (71.8%) | 79.8 |
| 35 to 50 years | 2,546 (21.6%) | 33.6 |
| Total | 11,767 (100.0%) | 51.3 |
Fertility by Age by Marriage Status in Area Code 901
48.6% of women with births (11,767) in Area Code 901 are married. The highest percentage of unmarried women with births falls into 15 to 19 years age bracket with 100.0% of them unmarried at the time of birth, while the lowest percentage of unmarried women with births belong to 20 to 34 years age bracket with 55.4% of them unmarried.
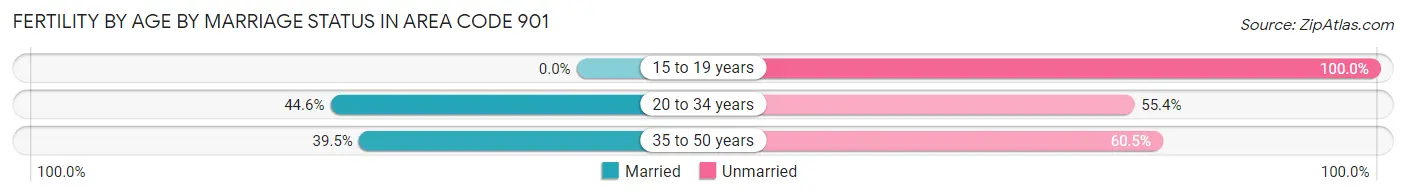
| Age Bracket | Married | Unmarried |
| 15 to 19 years | 0 (0.0%) | 778 (100.0%) |
| 20 to 34 years | 3,767 (44.6%) | 4,676 (55.4%) |
| 35 to 50 years | 1,005 (39.5%) | 1,541 (60.5%) |
| Total | 5,722 (48.6%) | 6,045 (51.4%) |
Fertility by Education in Area Code 901
Average fertility rate in Area Code 901 is 51.3 births per 1,000 women. Women with the education attainment of bachelor's degree have the highest fertility rate of 82.9 births per 1,000 women, while women with the education attainment of college or associate's degree have the lowest fertility at 49.6 births per 1,000 women. Women with the education attainment of college or associate's degree represent 28.2% of all women with births.
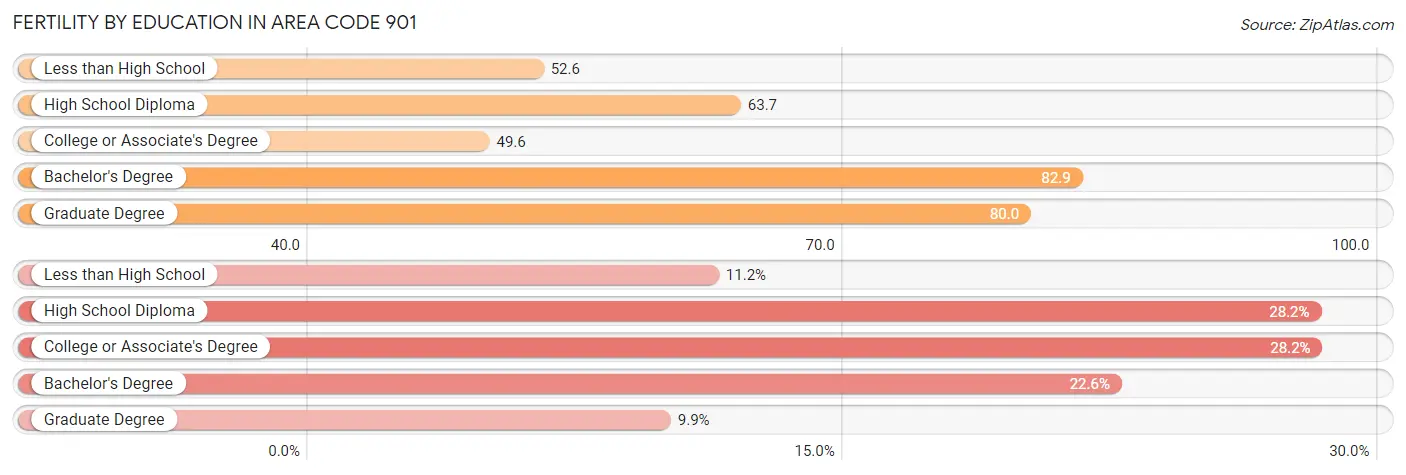
| Educational Attainment | Women with Births | Births / 1,000 Women |
| Less than High School | 1,321 (11.2%) | 52.6 |
| High School Diploma | 3,313 (28.2%) | 63.7 |
| College or Associate's Degree | 3,317 (28.2%) | 49.6 |
| Bachelor's Degree | 2,654 (22.6%) | 82.9 |
| Graduate Degree | 1,162 (9.9%) | 80.0 |
| Total | 11,767 (100.0%) | 51.3 |
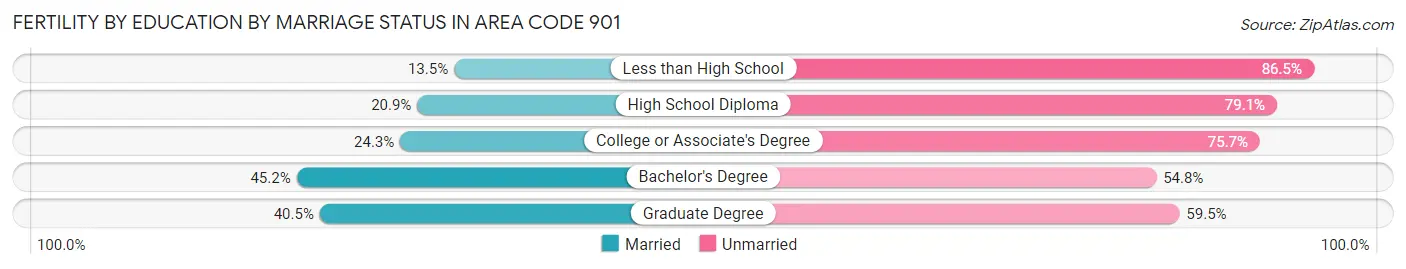
Fertility by Education by Marriage Status in Area Code 901
51.4% of women with births in Area Code 901 are unmarried. Women with the educational attainment of bachelor's degree are most likely to be married with 45.2% of them married at childbirth, while women with the educational attainment of less than high school are least likely to be married with 86.5% of them unmarried at childbirth.
| Educational Attainment | Married | Unmarried |
| Less than High School | 178 (13.5%) | 1,143 (86.5%) |
| High School Diploma | 692 (20.9%) | 2,621 (79.1%) |
| College or Associate's Degree | 807 (24.3%) | 2,510 (75.7%) |
| Bachelor's Degree | 1,200 (45.2%) | 1,454 (54.8%) |
| Graduate Degree | 471 (40.5%) | 691 (59.5%) |
| Total | 5,722 (48.6%) | 6,045 (51.4%) |
Employment Characteristics in Area Code 901
Employment by Class of Employer in Area Code 901
Among the 467,803 employed individuals in Area Code 901, private company employees (325,645 | 69.6%), not-for-profit organizations (41,680 | 8.9%), and local government employees (32,351 | 6.9%) make up the most common classes of employment.
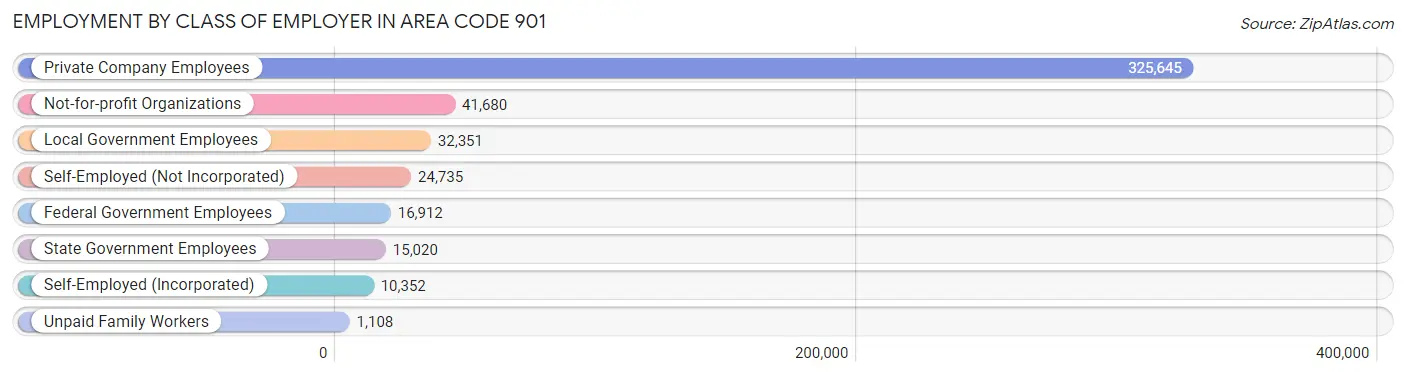
| Employer Class | # Employees | % Employees |
| Private Company Employees | 325,645 | 69.6% |
| Self-Employed (Incorporated) | 10,352 | 2.2% |
| Self-Employed (Not Incorporated) | 24,735 | 5.3% |
| Not-for-profit Organizations | 41,680 | 8.9% |
| Local Government Employees | 32,351 | 6.9% |
| State Government Employees | 15,020 | 3.2% |
| Federal Government Employees | 16,912 | 3.6% |
| Unpaid Family Workers | 1,108 | 0.2% |
| Total | 467,803 | 100.0% |
Employment Status by Age in Area Code 901
According to the labor force statistics for Area Code 901, out of the total population over 16 years of age (807,187), 60.8% or 490,770 individuals are in the labor force, with 9.0% or 44,267 of them unemployed. The age group with the highest labor force participation rate is 25 to 29 years, with 81.4% or 62,995 individuals in the labor force. Within the labor force, the 16 to 19 years age range has the highest percentage of unemployed individuals, with 1,271.9% or 257,700 of them being unemployed.
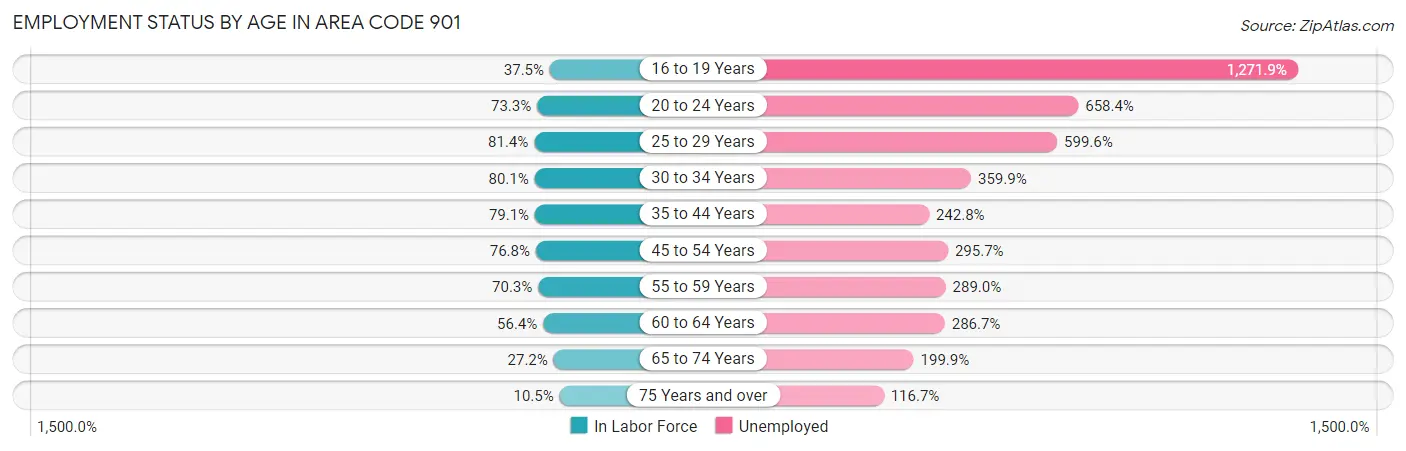
| Age Bracket | In Labor Force | Unemployed |
| 16 to 19 Years | 20,261 (37.5%) | 257,700 (1,271.9%) |
| 20 to 24 Years | 49,847 (73.3%) | 328,193 (658.4%) |
| 25 to 29 Years | 62,992 (81.4%) | 377,718 (599.6%) |
| 30 to 34 Years | 58,732 (80.1%) | 211,380 (359.9%) |
| 35 to 44 Years | 102,889 (79.1%) | 249,814 (242.8%) |
| 45 to 54 Years | 96,877 (76.8%) | 286,465 (295.7%) |
| 55 to 59 Years | 44,341 (70.3%) | 128,148 (289.0%) |
| 60 to 64 Years | 36,815 (56.4%) | 105,554 (286.7%) |
| 65 to 74 Years | 25,410 (27.2%) | 50,795 (199.9%) |
| 75 Years and over | 5,920 (10.5%) | 6,907 (116.7%) |
| Total | 490,754 (60.8%) | 44,256 (9.0%) |
Employment Status by Educational Attainment in Area Code 901
According to labor force statistics for Area Code 901, 74.7% of individuals (399,965) out of the total population between 25 and 64 years of age (535,357) are in the labor force, with 378.4% or 1,513,468 of them being unemployed. The group with the highest labor force participation rate are those with the educational attainment of bachelor's degree or higher, with 86.5% or 153,180 individuals in the labor force. Within the labor force, individuals with less than high school education have the highest percentage of unemployment, with 482.6% or 138,313 of them being unemployed.
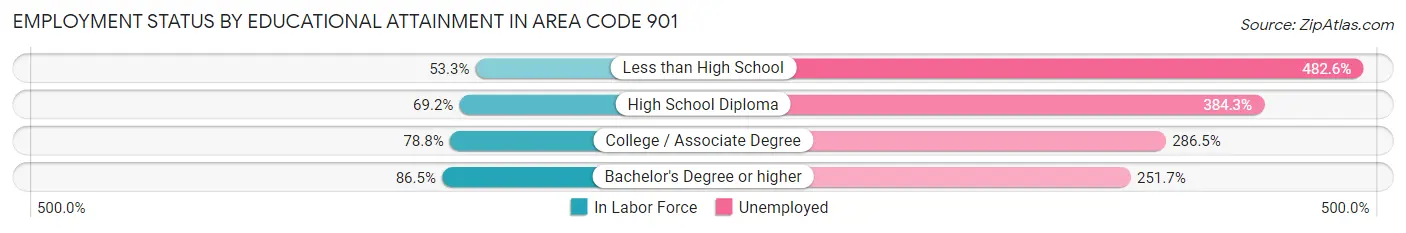
| Educational Attainment | In Labor Force | Unemployed |
| Less than High School | 28,657 (53.3%) | 259,595 (482.6%) |
| High School Diploma | 104,475 (69.2%) | 580,201 (384.3%) |
| College / Associate Degree | 120,955 (78.8%) | 439,669 (286.5%) |
| Bachelor's Degree or higher | 153,180 (86.5%) | 445,831 (251.7%) |
| Total | 399,962 (74.7%) | 2,025,791 (378.4%) |
Employment Occupations by Sex in Area Code 901
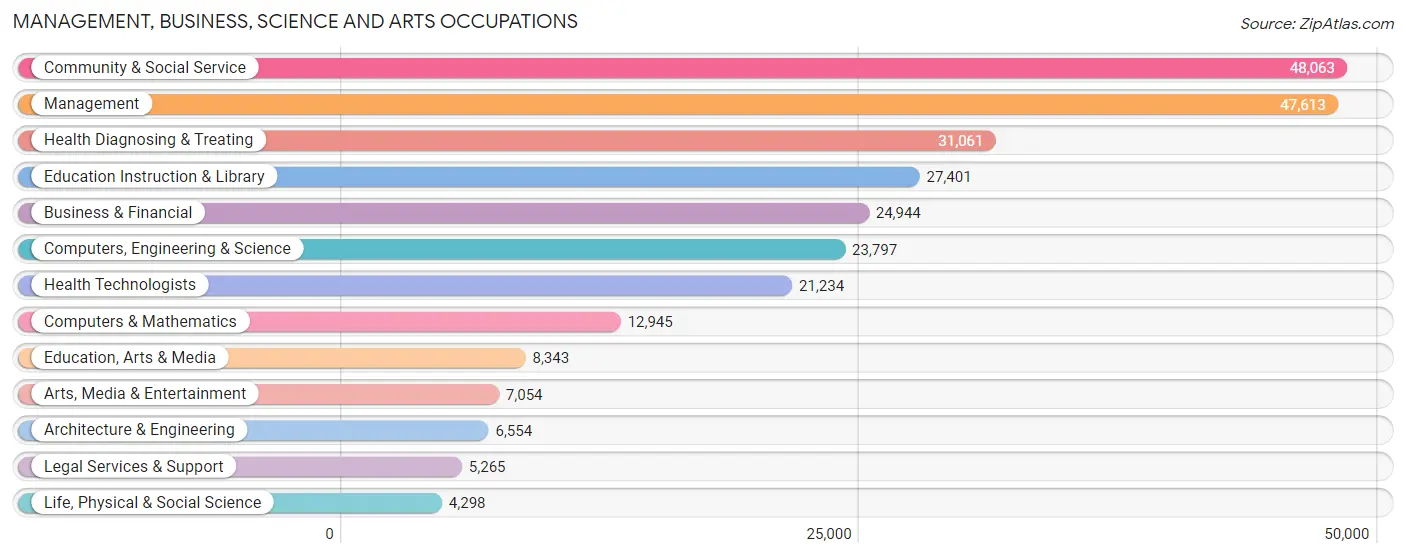
Management, Business, Science and Arts Occupations
The most common Management, Business, Science and Arts occupations in Area Code 901 are Community & Social Service (48,063 | 10.1%), Management (47,613 | 10.0%), Health Diagnosing & Treating (31,061 | 6.5%), Education Instruction & Library (27,401 | 5.8%), and Business & Financial (24,944 | 5.2%).
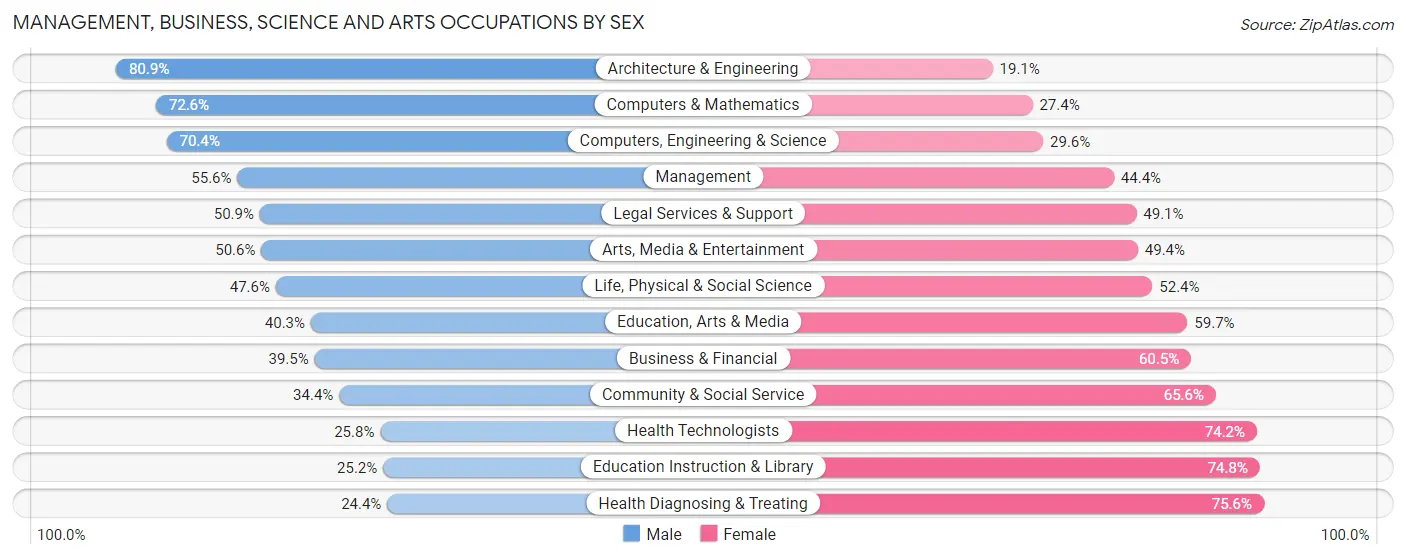
Management, Business, Science and Arts Occupations by Sex
Within the Management, Business, Science and Arts occupations in Area Code 901, the most male-oriented occupations are Architecture & Engineering (80.9%), Computers & Mathematics (72.6%), and Computers, Engineering & Science (70.4%), while the most female-oriented occupations are Health Diagnosing & Treating (75.6%), Education Instruction & Library (74.8%), and Health Technologists (74.2%).
| Occupation | Male | Female |
| Management | 26,484 (55.6%) | 21,129 (44.4%) |
| Business & Financial | 9,858 (39.5%) | 15,086 (60.5%) |
| Computers, Engineering & Science | 16,750 (70.4%) | 7,047 (29.6%) |
| Computers & Mathematics | 9,400 (72.6%) | 3,545 (27.4%) |
| Architecture & Engineering | 5,304 (80.9%) | 1,250 (19.1%) |
| Life, Physical & Social Science | 2,046 (47.6%) | 2,252 (52.4%) |
| Community & Social Service | 16,522 (34.4%) | 31,541 (65.6%) |
| Education, Arts & Media | 3,361 (40.3%) | 4,982 (59.7%) |
| Legal Services & Support | 2,682 (50.9%) | 2,583 (49.1%) |
| Education Instruction & Library | 6,908 (25.2%) | 20,493 (74.8%) |
| Arts, Media & Entertainment | 3,571 (50.6%) | 3,483 (49.4%) |
| Health Diagnosing & Treating | 7,568 (24.4%) | 23,493 (75.6%) |
| Health Technologists | 5,480 (25.8%) | 15,754 (74.2%) |
| Total (Category) | 77,182 (44.0%) | 98,296 (56.0%) |
| Total (Overall) | 239,223 (50.3%) | 235,970 (49.7%) |
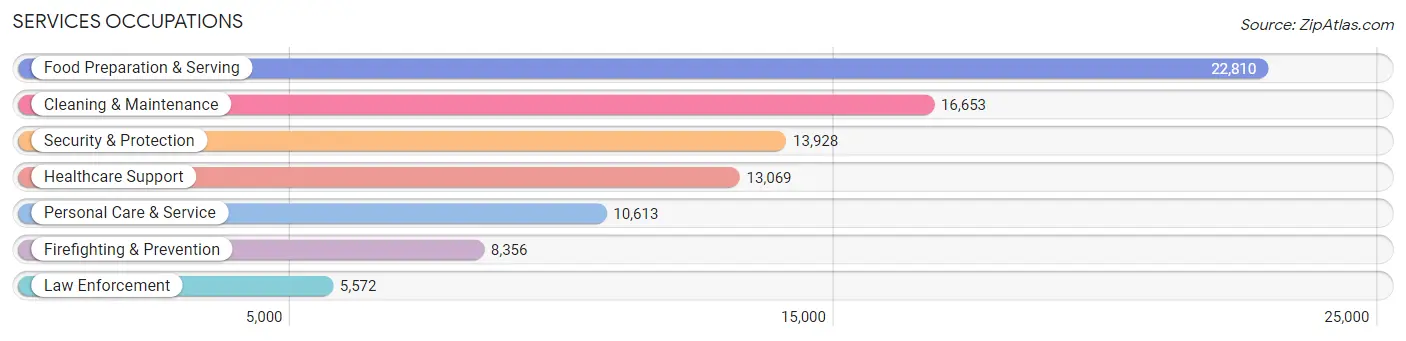
Services Occupations
The most common Services occupations in Area Code 901 are Food Preparation & Serving (22,810 | 4.8%), Cleaning & Maintenance (16,653 | 3.5%), Security & Protection (13,928 | 2.9%), Healthcare Support (13,069 | 2.8%), and Personal Care & Service (10,613 | 2.2%).
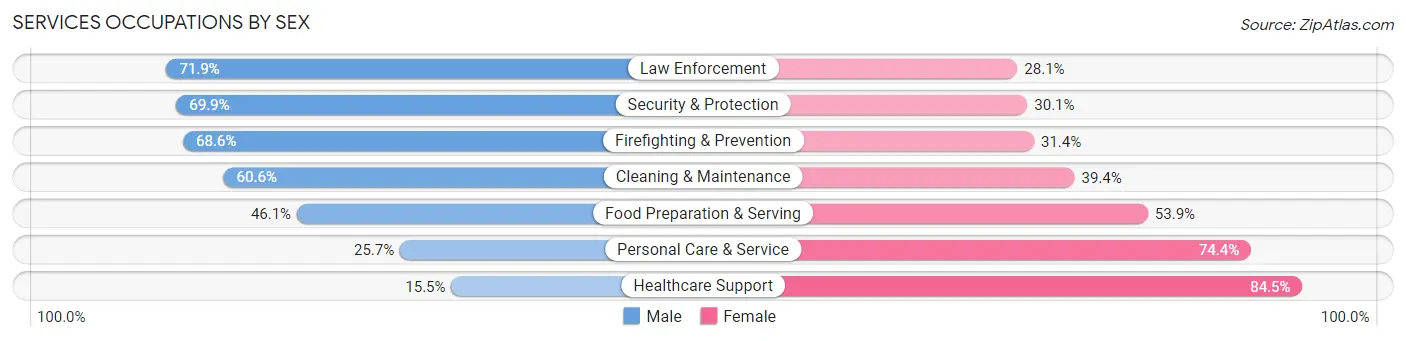
Services Occupations by Sex
Within the Services occupations in Area Code 901, the most male-oriented occupations are Law Enforcement (71.9%), Security & Protection (69.9%), and Firefighting & Prevention (68.6%), while the most female-oriented occupations are Healthcare Support (84.5%), Personal Care & Service (74.4%), and Food Preparation & Serving (53.9%).
| Occupation | Male | Female |
| Healthcare Support | 2,024 (15.5%) | 11,045 (84.5%) |
| Security & Protection | 9,741 (69.9%) | 4,187 (30.1%) |
| Firefighting & Prevention | 5,734 (68.6%) | 2,622 (31.4%) |
| Law Enforcement | 4,007 (71.9%) | 1,565 (28.1%) |
| Food Preparation & Serving | 10,508 (46.1%) | 12,302 (53.9%) |
| Cleaning & Maintenance | 10,088 (60.6%) | 6,565 (39.4%) |
| Personal Care & Service | 2,722 (25.7%) | 7,891 (74.4%) |
| Total (Category) | 35,083 (45.5%) | 41,990 (54.5%) |
| Total (Overall) | 239,223 (50.3%) | 235,970 (49.7%) |
Sales and Office Occupations
The most common Sales and Office occupations in Area Code 901 are Office & Administration (59,686 | 12.6%), and Sales & Related (42,380 | 8.9%).
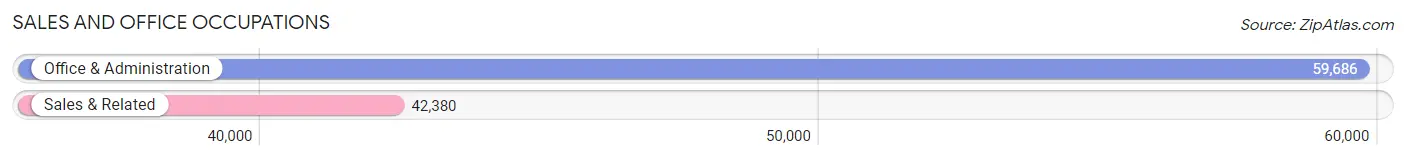
Sales and Office Occupations by Sex
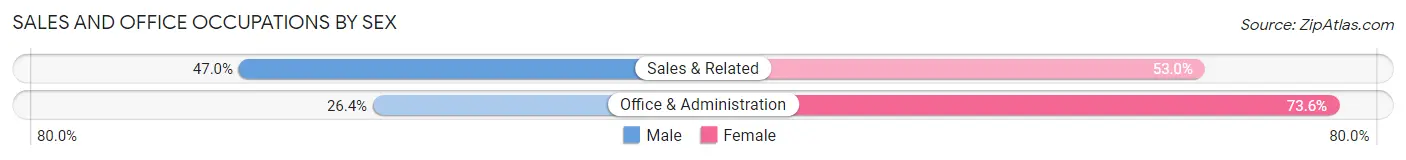
| Occupation | Male | Female |
| Sales & Related | 19,936 (47.0%) | 22,444 (53.0%) |
| Office & Administration | 15,765 (26.4%) | 43,921 (73.6%) |
| Total (Category) | 35,701 (35.0%) | 66,365 (65.0%) |
| Total (Overall) | 239,223 (50.3%) | 235,970 (49.7%) |
Natural Resources, Construction and Maintenance Occupations
The most common Natural Resources, Construction and Maintenance occupations in Area Code 901 are Construction & Extraction (18,535 | 3.9%), Installation, Maintenance & Repair (12,760 | 2.7%), and Farming, Fishing & Forestry (942 | 0.2%).
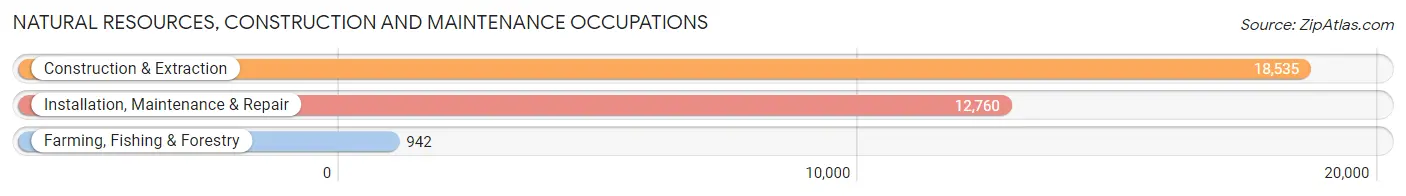
Natural Resources, Construction and Maintenance Occupations by Sex
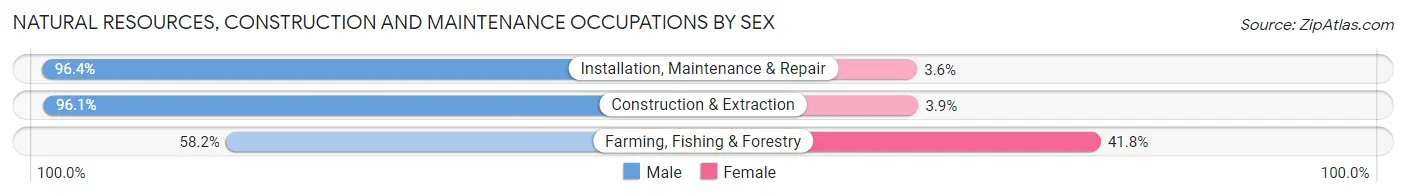
| Occupation | Male | Female |
| Farming, Fishing & Forestry | 548 (58.2%) | 394 (41.8%) |
| Construction & Extraction | 17,820 (96.1%) | 715 (3.9%) |
| Installation, Maintenance & Repair | 12,300 (96.4%) | 460 (3.6%) |
| Total (Category) | 30,668 (95.1%) | 1,569 (4.9%) |
| Total (Overall) | 239,223 (50.3%) | 235,970 (49.7%) |
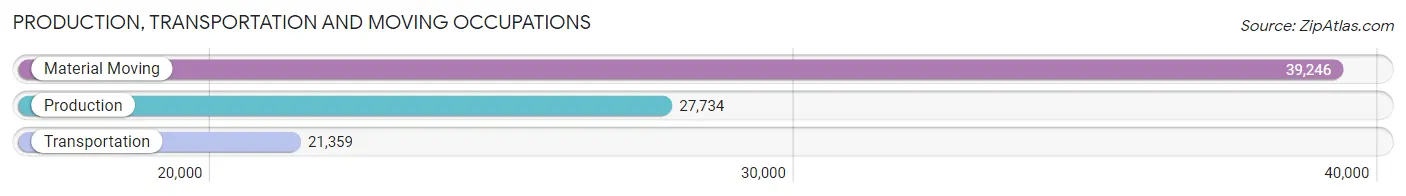
Production, Transportation and Moving Occupations
The most common Production, Transportation and Moving occupations in Area Code 901 are Material Moving (39,246 | 8.3%), Production (27,734 | 5.8%), and Transportation (21,359 | 4.5%).
Production, Transportation and Moving Occupations by Sex
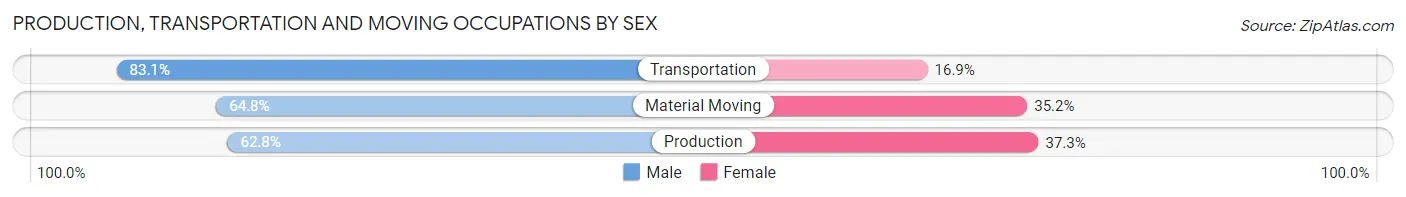
| Occupation | Male | Female |
| Production | 17,402 (62.7%) | 10,332 (37.2%) |
| Transportation | 17,751 (83.1%) | 3,608 (16.9%) |
| Material Moving | 25,436 (64.8%) | 13,810 (35.2%) |
| Total (Category) | 60,589 (68.6%) | 27,750 (31.4%) |
| Total (Overall) | 239,223 (50.3%) | 235,970 (49.7%) |
Employment Industries by Sex in Area Code 901
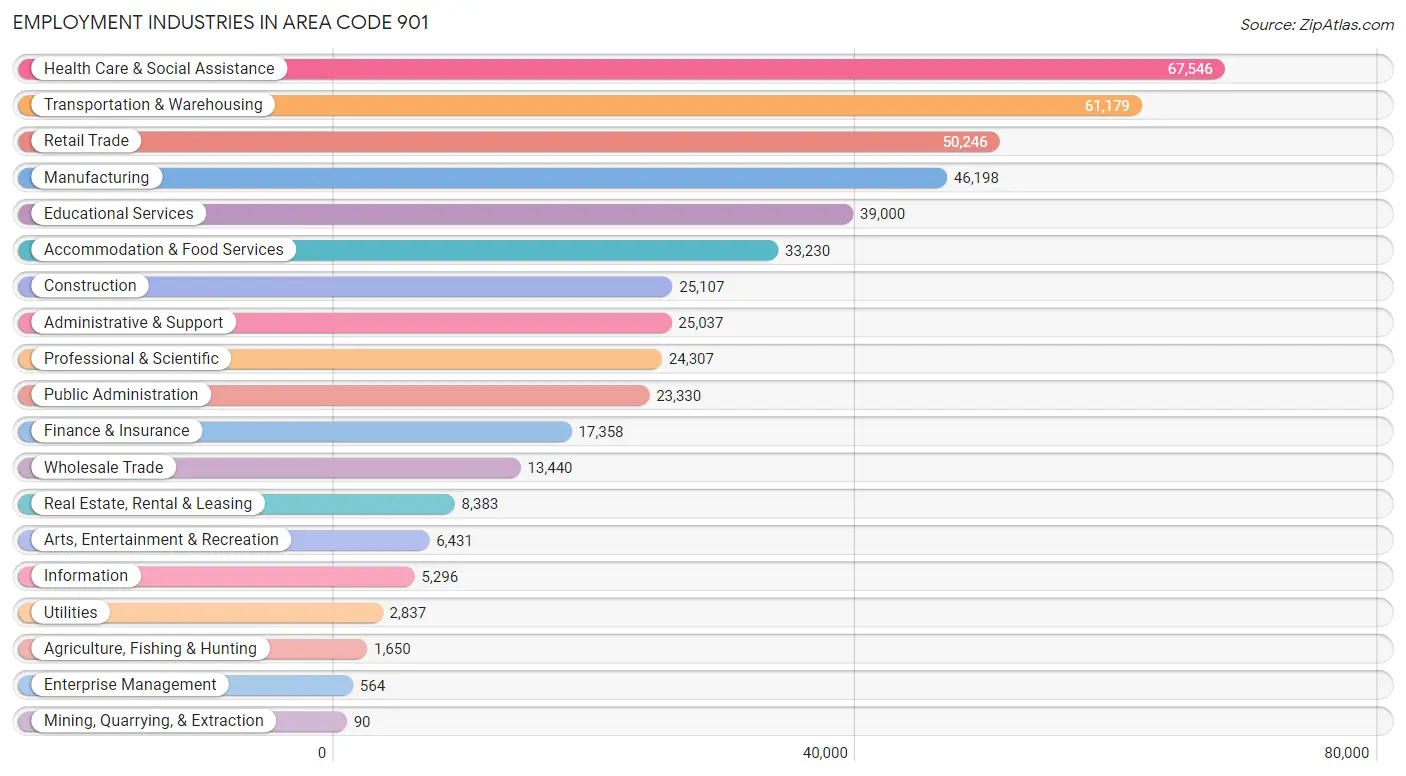
Employment Industries in Area Code 901
The major employment industries in Area Code 901 include Health Care & Social Assistance (67,546 | 14.2%), Transportation & Warehousing (61,179 | 12.9%), Retail Trade (50,246 | 10.6%), Manufacturing (46,198 | 9.7%), and Educational Services (39,000 | 8.2%).
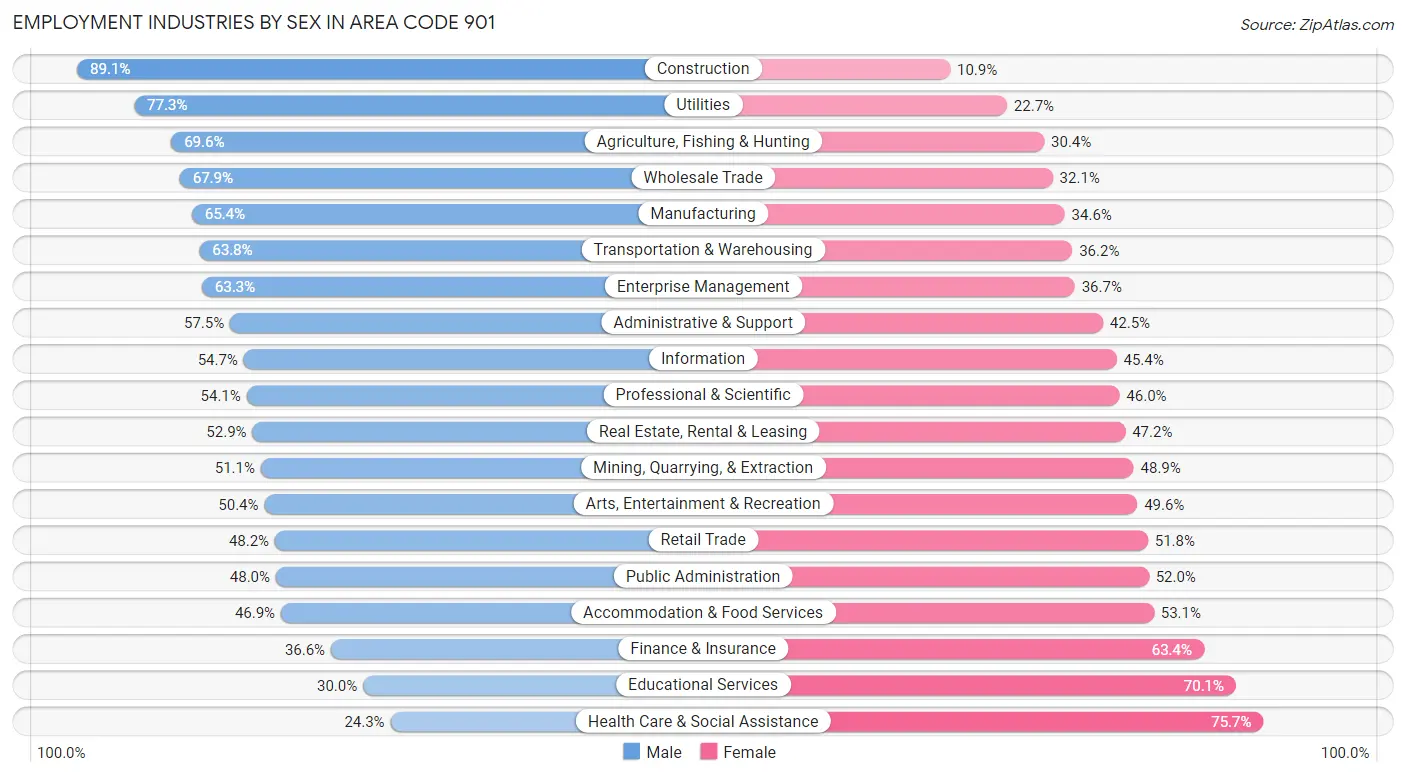
Employment Industries by Sex in Area Code 901
The Area Code 901 industries that see more men than women are Construction (89.1%), Utilities (77.3%), and Agriculture, Fishing & Hunting (69.6%), whereas the industries that tend to have a higher number of women are Health Care & Social Assistance (75.7%), Educational Services (70.1%), and Finance & Insurance (63.4%).
| Industry | Male | Female |
| Agriculture, Fishing & Hunting | 1,149 (69.6%) | 501 (30.4%) |
| Mining, Quarrying, & Extraction | 46 (51.1%) | 44 (48.9%) |
| Construction | 22,372 (89.1%) | 2,735 (10.9%) |
| Manufacturing | 30,206 (65.4%) | 15,992 (34.6%) |
| Wholesale Trade | 9,122 (67.9%) | 4,318 (32.1%) |
| Retail Trade | 24,209 (48.2%) | 26,037 (51.8%) |
| Transportation & Warehousing | 39,047 (63.8%) | 22,132 (36.2%) |
| Utilities | 2,194 (77.3%) | 643 (22.7%) |
| Information | 2,894 (54.6%) | 2,402 (45.4%) |
| Finance & Insurance | 6,351 (36.6%) | 11,007 (63.4%) |
| Real Estate, Rental & Leasing | 4,430 (52.8%) | 3,953 (47.1%) |
| Professional & Scientific | 13,138 (54.0%) | 11,169 (46.0%) |
| Enterprise Management | 357 (63.3%) | 207 (36.7%) |
| Administrative & Support | 14,390 (57.5%) | 10,647 (42.5%) |
| Educational Services | 11,681 (29.9%) | 27,319 (70.1%) |
| Health Care & Social Assistance | 16,397 (24.3%) | 51,149 (75.7%) |
| Arts, Entertainment & Recreation | 3,239 (50.4%) | 3,192 (49.6%) |
| Accommodation & Food Services | 15,599 (46.9%) | 17,631 (53.1%) |
| Public Administration | 11,197 (48.0%) | 12,133 (52.0%) |
| Total | 239,223 (50.3%) | 235,970 (49.7%) |
Education in Area Code 901
School Enrollment in Area Code 901
The most common levels of schooling among the 255,072 students in Area Code 901 are middle school (57,657 | 22.6%), high school (55,706 | 21.8%), and elementary school (52,473 | 20.6%).
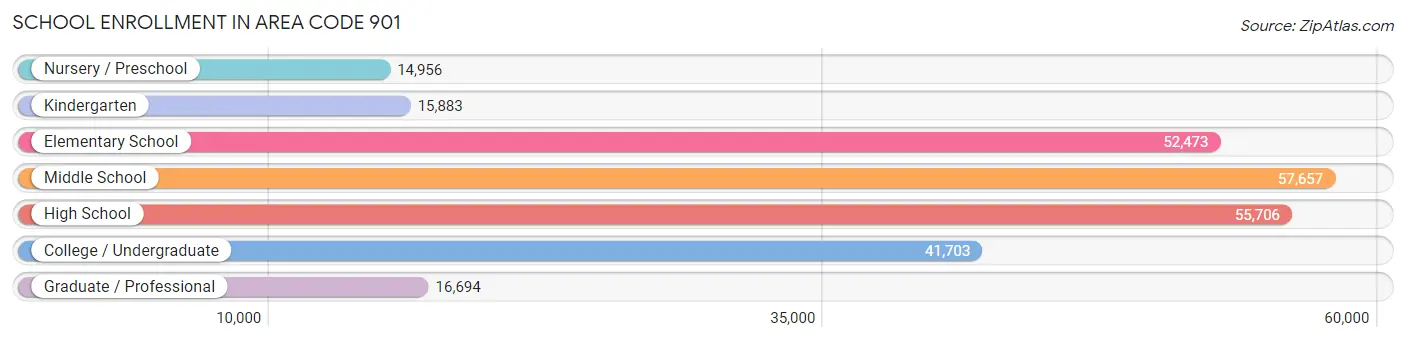
| School Level | # Students | % Students |
| Nursery / Preschool | 14,956 | 5.9% |
| Kindergarten | 15,883 | 6.2% |
| Elementary School | 52,473 | 20.6% |
| Middle School | 57,657 | 22.6% |
| High School | 55,706 | 21.8% |
| College / Undergraduate | 41,703 | 16.4% |
| Graduate / Professional | 16,694 | 6.5% |
| Total | 255,072 | 100.0% |
School Enrollment by Age by Funding Source in Area Code 901
Out of a total of 255,072 students who are enrolled in schools in Area Code 901, 46,455 (18.2%) attend a private institution, while the remaining 208,617 (81.8%) are enrolled in public schools. The age group of 3 to 4 year olds has the highest likelihood of being enrolled in private schools, with 5,266 (43.8% in the age bracket) enrolled. Conversely, the age group of 5 to 9 year old has the lowest likelihood of being enrolled in a private school, with 56,095 (86.6% in the age bracket) attending a public institution.
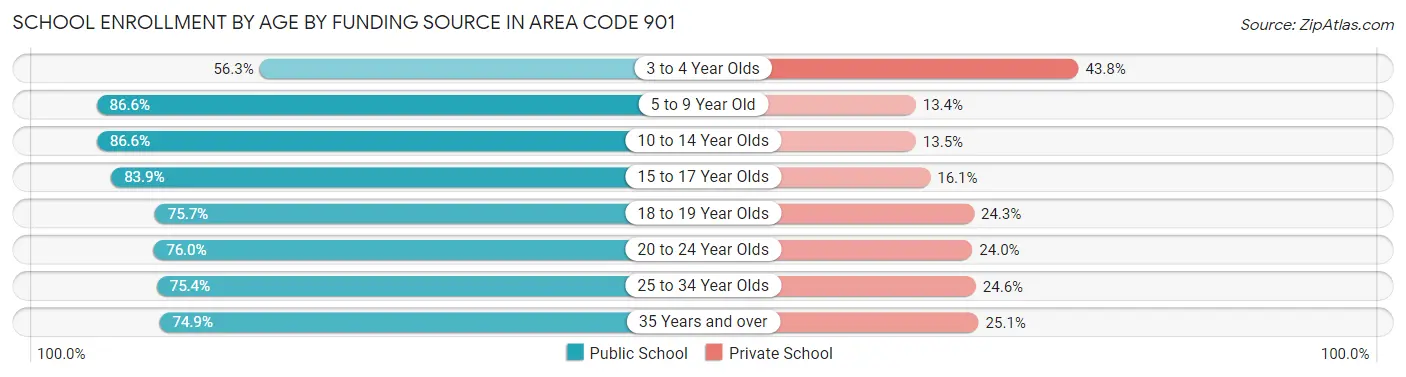
| Age Bracket | Public School | Private School |
| 3 to 4 Year Olds | 6,771 (56.2%) | 5,266 (43.8%) |
| 5 to 9 Year Old | 56,095 (86.6%) | 8,705 (13.4%) |
| 10 to 14 Year Olds | 61,105 (86.6%) | 9,493 (13.5%) |
| 15 to 17 Year Olds | 33,535 (83.9%) | 6,456 (16.1%) |
| 18 to 19 Year Olds | 12,014 (75.7%) | 3,853 (24.3%) |
| 20 to 24 Year Olds | 16,374 (76.0%) | 5,166 (24.0%) |
| 25 to 34 Year Olds | 12,858 (75.4%) | 4,202 (24.6%) |
| 35 Years and over | 9,866 (74.9%) | 3,313 (25.1%) |
| Total | 208,617 (81.8%) | 46,455 (18.2%) |
Educational Attainment by Field of Study in Area Code 901
Business (58,287 | 24.7%), education (27,669 | 11.7%), science & technology (24,411 | 10.3%), arts & humanities (15,870 | 6.7%), and social sciences (15,616 | 6.6%) are the most common fields of study among 236,101 individuals in Area Code 901 who have obtained a bachelor's degree or higher.
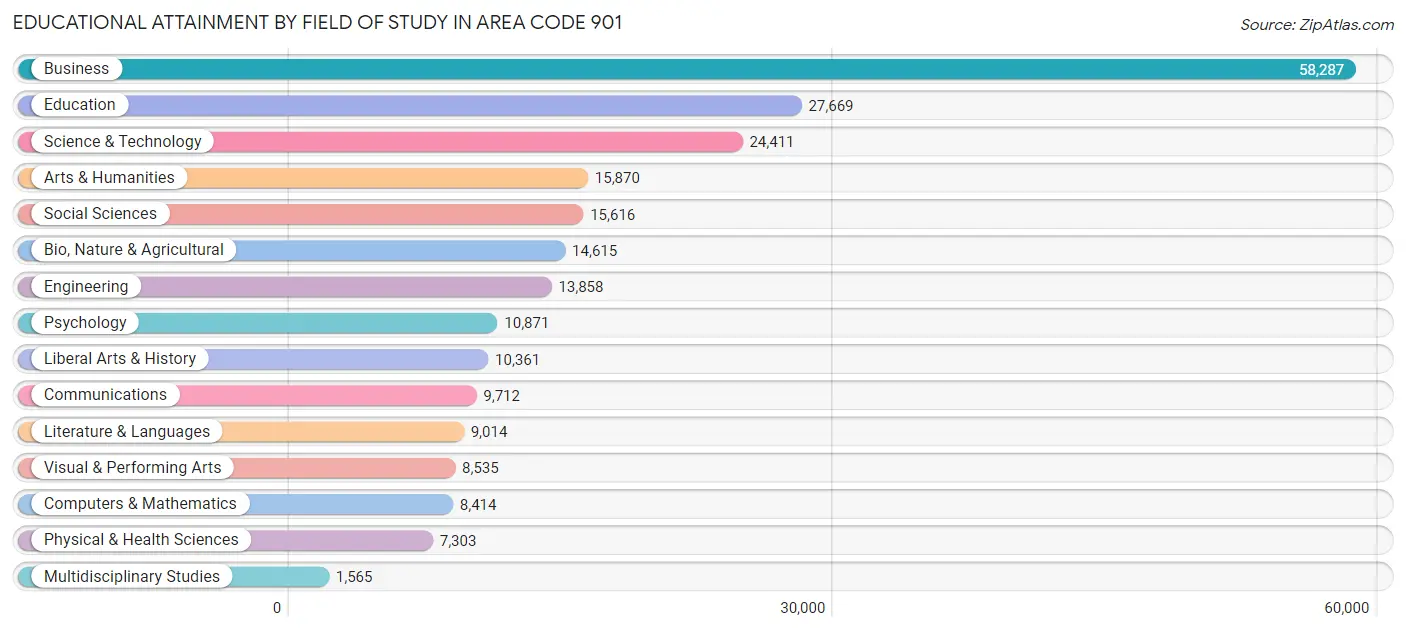
| Field of Study | # Graduates | % Graduates |
| Computers & Mathematics | 8,414 | 3.6% |
| Bio, Nature & Agricultural | 14,615 | 6.2% |
| Physical & Health Sciences | 7,303 | 3.1% |
| Psychology | 10,871 | 4.6% |
| Social Sciences | 15,616 | 6.6% |
| Engineering | 13,858 | 5.9% |
| Multidisciplinary Studies | 1,565 | 0.7% |
| Science & Technology | 24,411 | 10.3% |
| Business | 58,287 | 24.7% |
| Education | 27,669 | 11.7% |
| Literature & Languages | 9,014 | 3.8% |
| Liberal Arts & History | 10,361 | 4.4% |
| Visual & Performing Arts | 8,535 | 3.6% |
| Communications | 9,712 | 4.1% |
| Arts & Humanities | 15,870 | 6.7% |
| Total | 236,101 | 100.0% |
Transportation & Commute in Area Code 901
Vehicle Availability by Sex in Area Code 901
The most prevalent vehicle ownership categories in Area Code 901 are males with 2 vehicles (101,921, accounting for 43.2%) and females with 2 vehicles (91,577, making up 44.4%).
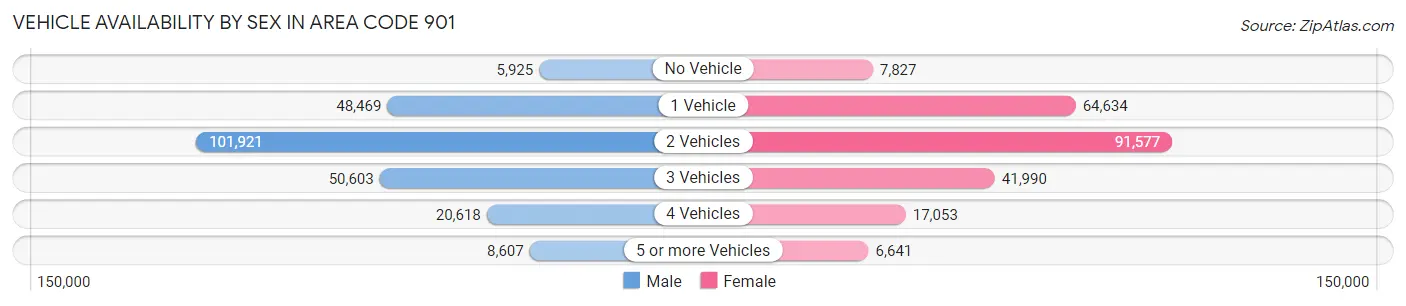
| Vehicles Available | Male | Female |
| No Vehicle | 5,925 (2.5%) | 7,827 (3.4%) |
| 1 Vehicle | 48,469 (20.5%) | 64,634 (28.1%) |
| 2 Vehicles | 101,921 (43.2%) | 91,577 (39.9%) |
| 3 Vehicles | 50,603 (21.4%) | 41,990 (18.3%) |
| 4 Vehicles | 20,618 (8.7%) | 17,053 (7.4%) |
| 5 or more Vehicles | 8,607 (3.6%) | 6,641 (2.9%) |
| Total | 236,143 (100.0%) | 229,722 (100.0%) |
Commute Time in Area Code 901
The most frequently occuring commute durations in Area Code 901 are 20 to 24 minutes (92,893 commuters, 21.5%), 30 to 34 minutes (71,470 commuters, 16.5%), and 15 to 19 minutes (70,133 commuters, 16.2%).
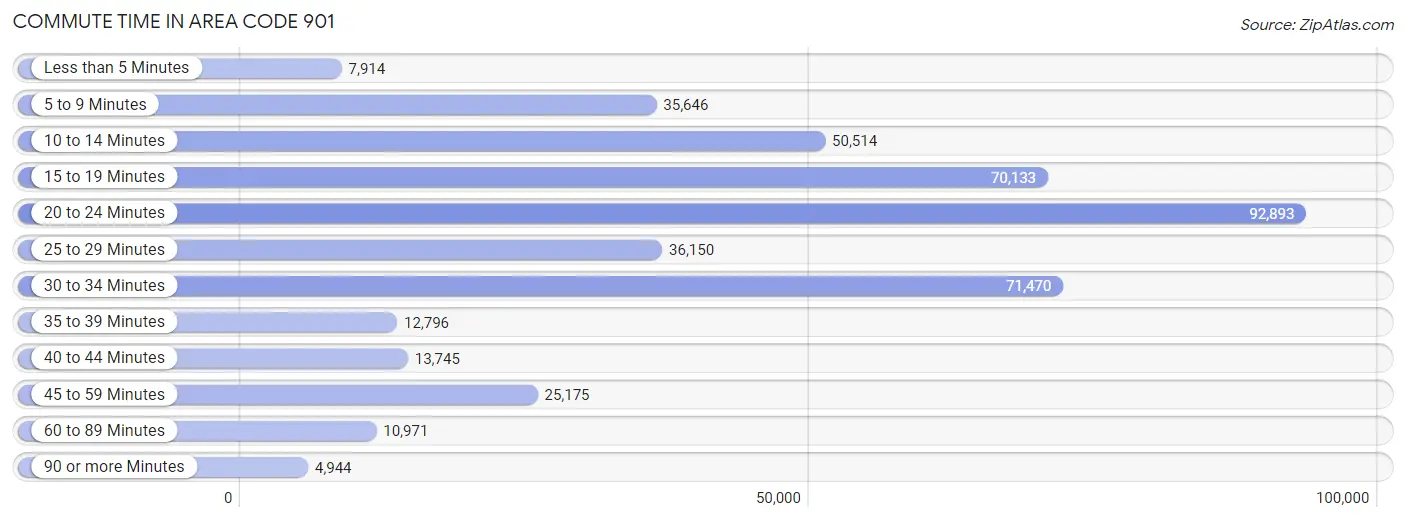
| Commute Time | # Commuters | % Commuters |
| Less than 5 Minutes | 7,914 | 1.8% |
| 5 to 9 Minutes | 35,646 | 8.2% |
| 10 to 14 Minutes | 50,514 | 11.7% |
| 15 to 19 Minutes | 70,133 | 16.2% |
| 20 to 24 Minutes | 92,893 | 21.5% |
| 25 to 29 Minutes | 36,150 | 8.4% |
| 30 to 34 Minutes | 71,470 | 16.5% |
| 35 to 39 Minutes | 12,796 | 3.0% |
| 40 to 44 Minutes | 13,745 | 3.2% |
| 45 to 59 Minutes | 25,175 | 5.8% |
| 60 to 89 Minutes | 10,971 | 2.5% |
| 90 or more Minutes | 4,944 | 1.1% |
Commute Time by Sex in Area Code 901
The most common commute times in Area Code 901 are 20 to 24 minutes (46,585 commuters, 21.1%) for males and 20 to 24 minutes (46,308 commuters, 21.9%) for females.
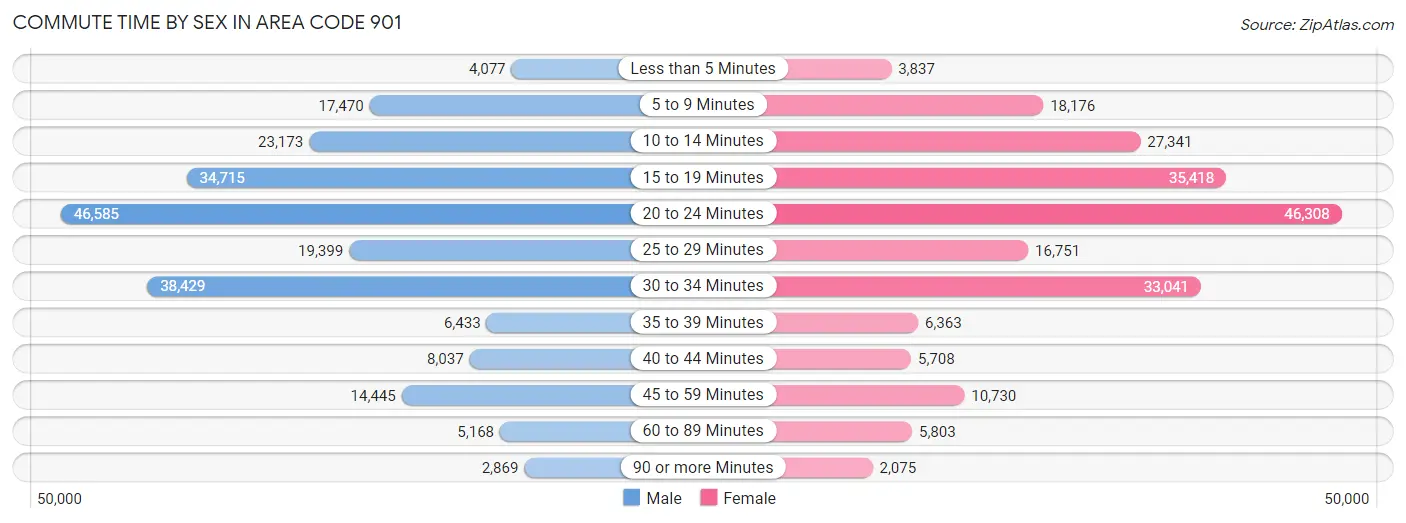
| Commute Time | Male | Female |
| Less than 5 Minutes | 4,077 (1.8%) | 3,837 (1.8%) |
| 5 to 9 Minutes | 17,470 (7.9%) | 18,176 (8.6%) |
| 10 to 14 Minutes | 23,173 (10.5%) | 27,341 (12.9%) |
| 15 to 19 Minutes | 34,715 (15.7%) | 35,418 (16.7%) |
| 20 to 24 Minutes | 46,585 (21.1%) | 46,308 (21.9%) |
| 25 to 29 Minutes | 19,399 (8.8%) | 16,751 (7.9%) |
| 30 to 34 Minutes | 38,429 (17.4%) | 33,041 (15.6%) |
| 35 to 39 Minutes | 6,433 (2.9%) | 6,363 (3.0%) |
| 40 to 44 Minutes | 8,037 (3.6%) | 5,708 (2.7%) |
| 45 to 59 Minutes | 14,445 (6.5%) | 10,730 (5.1%) |
| 60 to 89 Minutes | 5,168 (2.3%) | 5,803 (2.7%) |
| 90 or more Minutes | 2,869 (1.3%) | 2,075 (1.0%) |
Time of Departure to Work by Sex in Area Code 901
The most frequent times of departure to work in Area Code 901 are 7:00 AM to 7:29 AM (30,556, 13.8%) for males and 7:00 AM to 7:29 AM (37,082, 17.5%) for females.
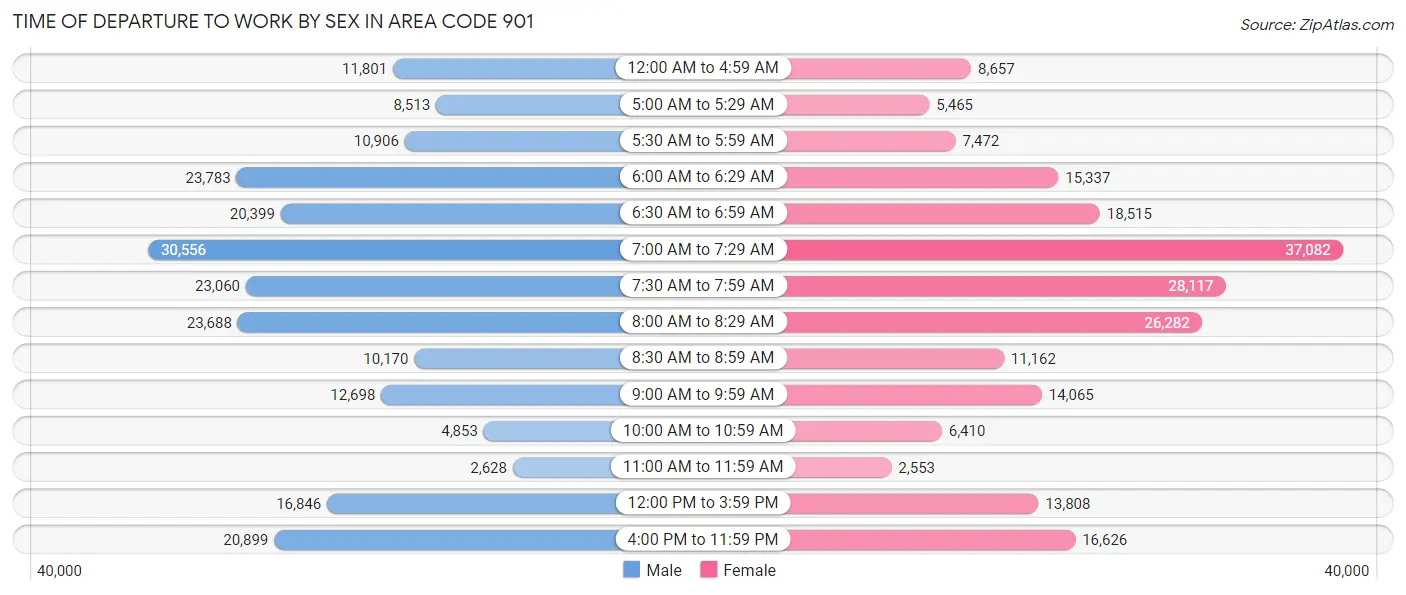
| Time of Departure | Male | Female |
| 12:00 AM to 4:59 AM | 11,801 (5.3%) | 8,657 (4.1%) |
| 5:00 AM to 5:29 AM | 8,513 (3.9%) | 5,465 (2.6%) |
| 5:30 AM to 5:59 AM | 10,906 (4.9%) | 7,472 (3.5%) |
| 6:00 AM to 6:29 AM | 23,783 (10.8%) | 15,337 (7.2%) |
| 6:30 AM to 6:59 AM | 20,399 (9.2%) | 18,515 (8.7%) |
| 7:00 AM to 7:29 AM | 30,556 (13.8%) | 37,082 (17.5%) |
| 7:30 AM to 7:59 AM | 23,060 (10.4%) | 28,117 (13.3%) |
| 8:00 AM to 8:29 AM | 23,688 (10.7%) | 26,282 (12.4%) |
| 8:30 AM to 8:59 AM | 10,170 (4.6%) | 11,162 (5.3%) |
| 9:00 AM to 9:59 AM | 12,698 (5.8%) | 14,065 (6.7%) |
| 10:00 AM to 10:59 AM | 4,853 (2.2%) | 6,410 (3.0%) |
| 11:00 AM to 11:59 AM | 2,628 (1.2%) | 2,553 (1.2%) |
| 12:00 PM to 3:59 PM | 16,846 (7.6%) | 13,808 (6.5%) |
| 4:00 PM to 11:59 PM | 20,899 (9.5%) | 16,626 (7.9%) |
| Total | 220,800 (100.0%) | 211,551 (100.0%) |
Housing Occupancy in Area Code 901
Occupancy by Ownership in Area Code 901
Of the total 396,271 dwellings in Area Code 901, owner-occupied units account for 226,846 (57.3%), while renter-occupied units make up 169,425 (42.7%).
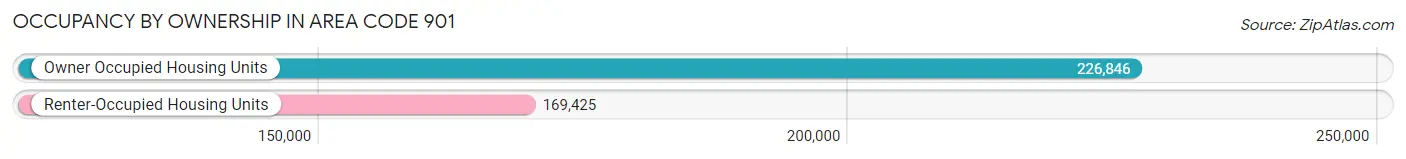
| Occupancy | # Housing Units | % Housing Units |
| Owner Occupied Housing Units | 226,846 | 57.3% |
| Renter-Occupied Housing Units | 169,425 | 42.7% |
| Total Occupied Housing Units | 396,271 | 100.0% |
Occupancy by Household Size in Area Code 901
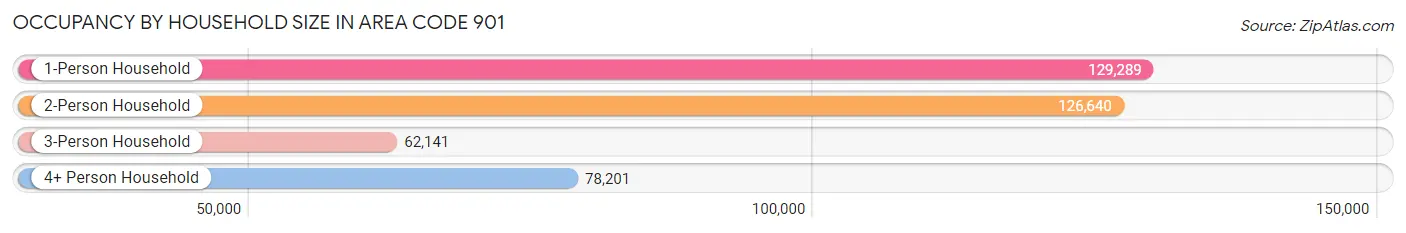
| Household Size | # Housing Units | % Housing Units |
| 1-Person Household | 129,289 | 32.6% |
| 2-Person Household | 126,640 | 32.0% |
| 3-Person Household | 62,141 | 15.7% |
| 4+ Person Household | 78,201 | 19.7% |
| Total Housing Units | 396,271 | 100.0% |
Occupancy by Ownership by Household Size in Area Code 901
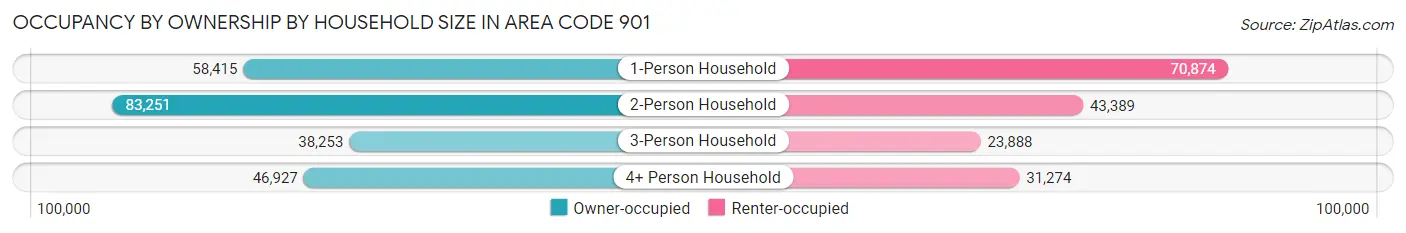
| Household Size | Owner-occupied | Renter-occupied |
| 1-Person Household | 58,415 (45.2%) | 70,874 (54.8%) |
| 2-Person Household | 83,251 (65.7%) | 43,389 (34.3%) |
| 3-Person Household | 38,253 (61.6%) | 23,888 (38.4%) |
| 4+ Person Household | 46,927 (60.0%) | 31,274 (40.0%) |
| Total Housing Units | 226,846 (57.3%) | 169,425 (42.7%) |
Occupancy by Educational Attainment in Area Code 901
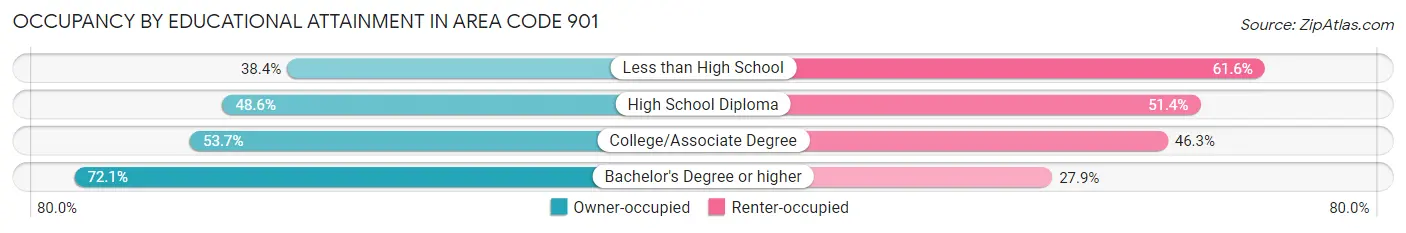
| Household Size | Owner-occupied | Renter-occupied |
| Less than High School | 13,866 (38.4%) | 22,260 (61.6%) |
| High School Diploma | 50,177 (48.6%) | 53,051 (51.4%) |
| College/Associate Degree | 65,571 (53.7%) | 56,446 (46.3%) |
| Bachelor's Degree or higher | 97,232 (72.1%) | 37,668 (27.9%) |
Occupancy by Age of Householder in Area Code 901
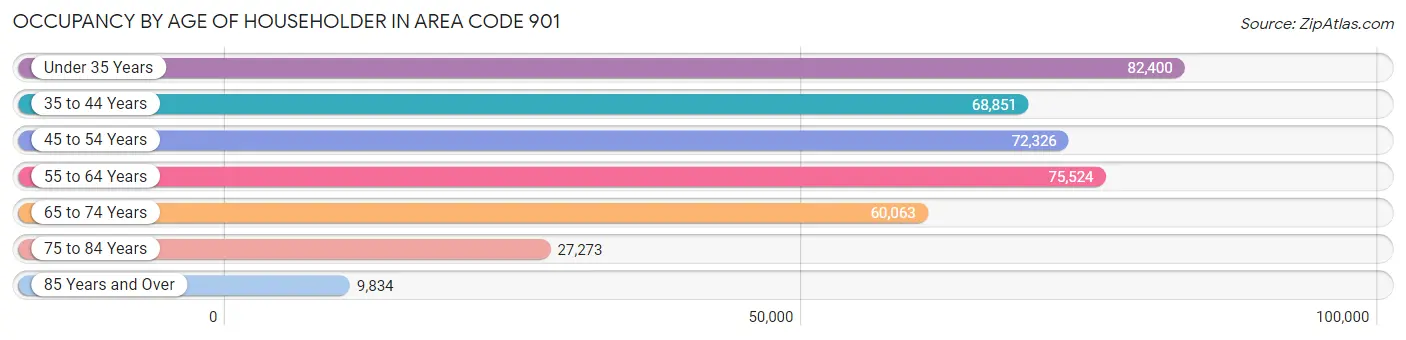
| Age Bracket | # Households | % Households |
| Under 35 Years | 82,400 | 20.8% |
| 35 to 44 Years | 68,851 | 17.4% |
| 45 to 54 Years | 72,326 | 18.2% |
| 55 to 64 Years | 75,524 | 19.1% |
| 65 to 74 Years | 60,063 | 15.2% |
| 75 to 84 Years | 27,273 | 6.9% |
| 85 Years and Over | 9,834 | 2.5% |
| Total | 396,271 | 100.0% |
Housing Finances in Area Code 901
Median Income by Occupancy in Area Code 901
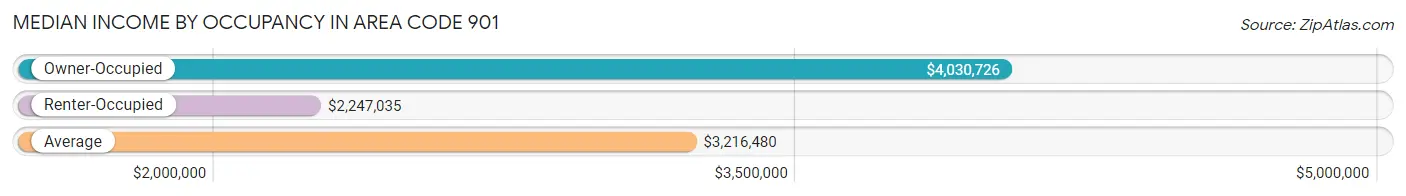
| Occupancy Type | # Households | Median Income |
| Owner-Occupied | 226,846 (57.3%) | $4,030,726 |
| Renter-Occupied | 169,425 (42.7%) | $2,247,035 |
| Average | 396,271 (100.0%) | $3,216,480 |
Occupancy by Householder Income Bracket in Area Code 901
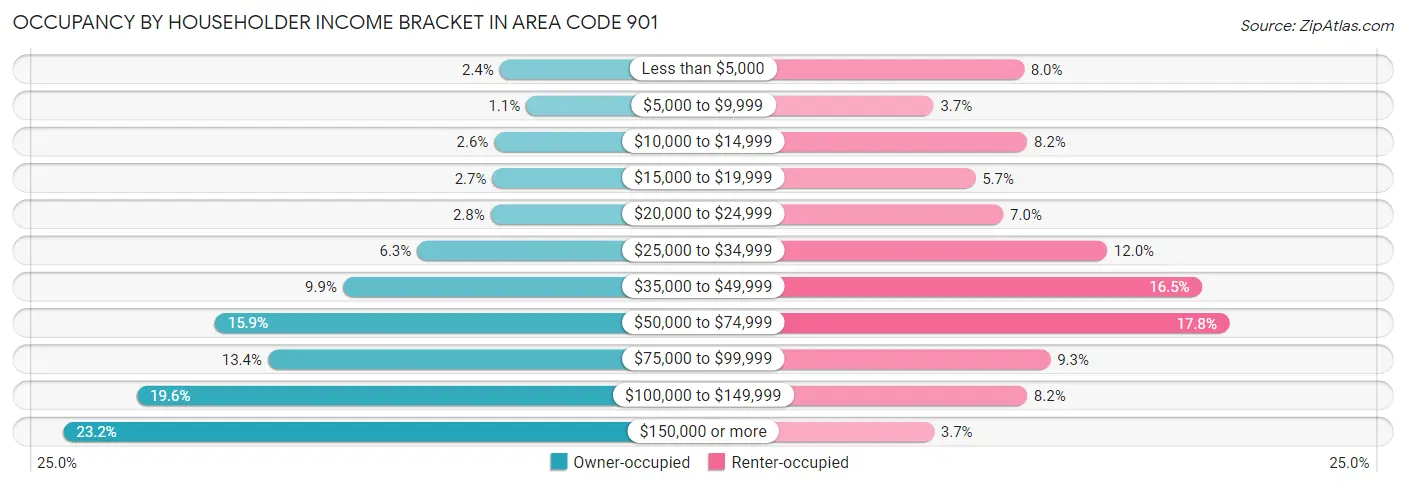
| Income Bracket | Owner-occupied | Renter-occupied |
| Less than $5,000 | 5,394 (2.4%) | 13,569 (8.0%) |
| $5,000 to $9,999 | 2,552 (1.1%) | 6,279 (3.7%) |
| $10,000 to $14,999 | 5,998 (2.6%) | 13,844 (8.2%) |
| $15,000 to $19,999 | 6,191 (2.7%) | 9,653 (5.7%) |
| $20,000 to $24,999 | 6,379 (2.8%) | 11,913 (7.0%) |
| $25,000 to $34,999 | 14,320 (6.3%) | 20,283 (12.0%) |
| $35,000 to $49,999 | 22,335 (9.9%) | 27,908 (16.5%) |
| $50,000 to $74,999 | 36,154 (15.9%) | 30,114 (17.8%) |
| $75,000 to $99,999 | 30,443 (13.4%) | 15,709 (9.3%) |
| $100,000 to $149,999 | 44,561 (19.6%) | 13,829 (8.2%) |
| $150,000 or more | 52,519 (23.2%) | 6,324 (3.7%) |
| Total | 226,846 (100.0%) | 169,425 (100.0%) |
Monthly Housing Cost Tiers in Area Code 901
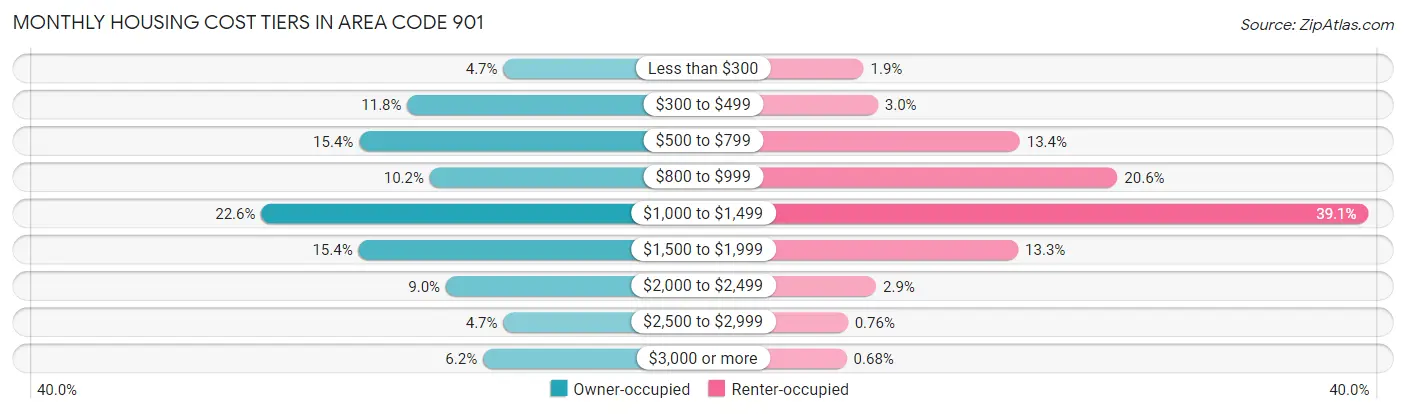
| Monthly Cost | Owner-occupied | Renter-occupied |
| Less than $300 | 10,754 (4.7%) | 3,265 (1.9%) |
| $300 to $499 | 26,786 (11.8%) | 5,046 (3.0%) |
| $500 to $799 | 34,838 (15.4%) | 22,752 (13.4%) |
| $800 to $999 | 23,054 (10.2%) | 34,938 (20.6%) |
| $1,000 to $1,499 | 51,195 (22.6%) | 66,241 (39.1%) |
| $1,500 to $1,999 | 34,962 (15.4%) | 22,551 (13.3%) |
| $2,000 to $2,499 | 20,354 (9.0%) | 4,836 (2.9%) |
| $2,500 to $2,999 | 10,748 (4.7%) | 1,292 (0.8%) |
| $3,000 or more | 14,155 (6.2%) | 1,146 (0.7%) |
| Total | 226,846 (100.0%) | 169,425 (100.0%) |
Physical Housing Characteristics in Area Code 901
Housing Structures in Area Code 901
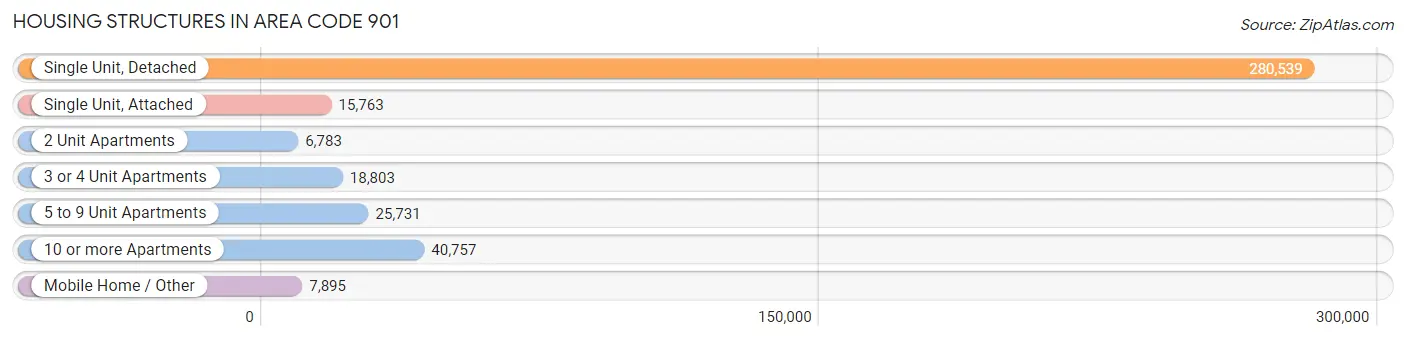
| Structure Type | # Housing Units | % Housing Units |
| Single Unit, Detached | 280,539 | 70.8% |
| Single Unit, Attached | 15,763 | 4.0% |
| 2 Unit Apartments | 6,783 | 1.7% |
| 3 or 4 Unit Apartments | 18,803 | 4.7% |
| 5 to 9 Unit Apartments | 25,731 | 6.5% |
| 10 or more Apartments | 40,757 | 10.3% |
| Mobile Home / Other | 7,895 | 2.0% |
| Total | 396,271 | 100.0% |
Housing Structures by Occupancy in Area Code 901
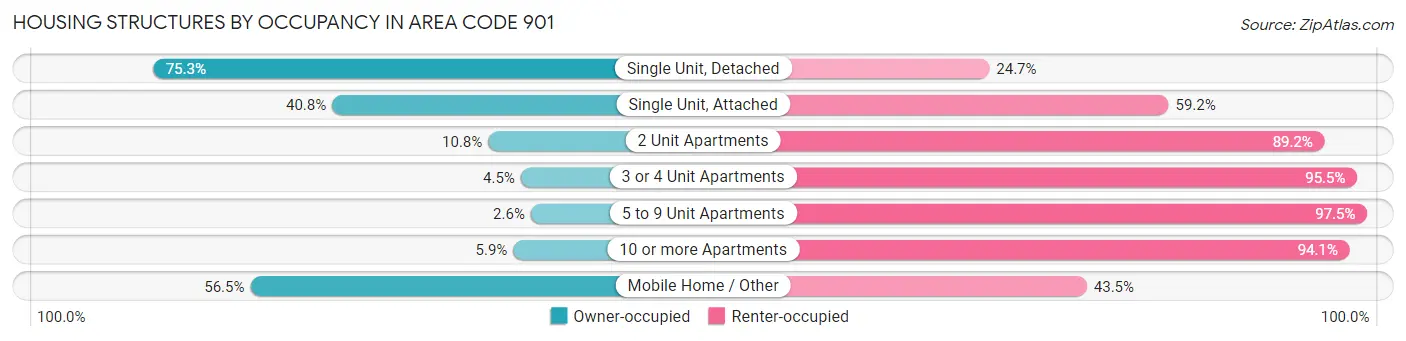
| Structure Type | Owner-occupied | Renter-occupied |
| Single Unit, Detached | 211,303 (75.3%) | 69,236 (24.7%) |
| Single Unit, Attached | 6,433 (40.8%) | 9,330 (59.2%) |
| 2 Unit Apartments | 730 (10.8%) | 6,053 (89.2%) |
| 3 or 4 Unit Apartments | 844 (4.5%) | 17,959 (95.5%) |
| 5 to 9 Unit Apartments | 655 (2.5%) | 25,076 (97.5%) |
| 10 or more Apartments | 2,417 (5.9%) | 38,340 (94.1%) |
| Mobile Home / Other | 4,464 (56.5%) | 3,431 (43.5%) |
| Total | 226,846 (57.3%) | 169,425 (42.7%) |
Housing Structures by Number of Rooms in Area Code 901
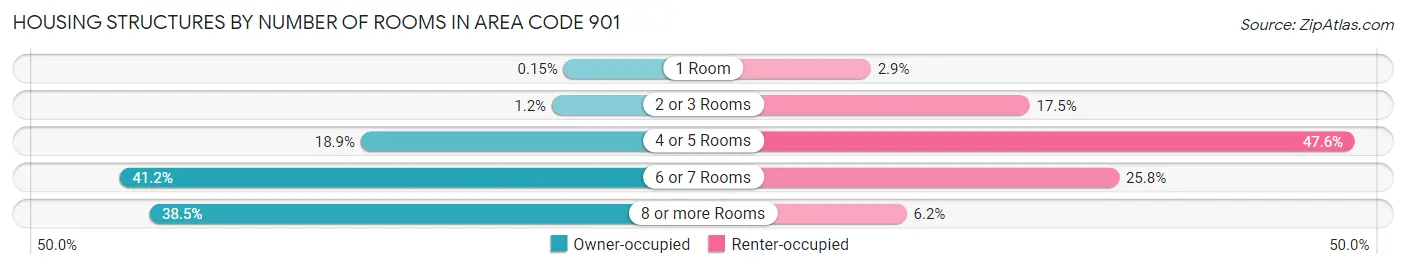
| Number of Rooms | Owner-occupied | Renter-occupied |
| 1 Room | 351 (0.2%) | 4,835 (2.9%) |
| 2 or 3 Rooms | 2,792 (1.2%) | 29,715 (17.5%) |
| 4 or 5 Rooms | 42,890 (18.9%) | 80,698 (47.6%) |
| 6 or 7 Rooms | 93,499 (41.2%) | 43,729 (25.8%) |
| 8 or more Rooms | 87,314 (38.5%) | 10,448 (6.2%) |
| Total | 226,846 (100.0%) | 169,425 (100.0%) |
Housing Structure by Heating Type in Area Code 901
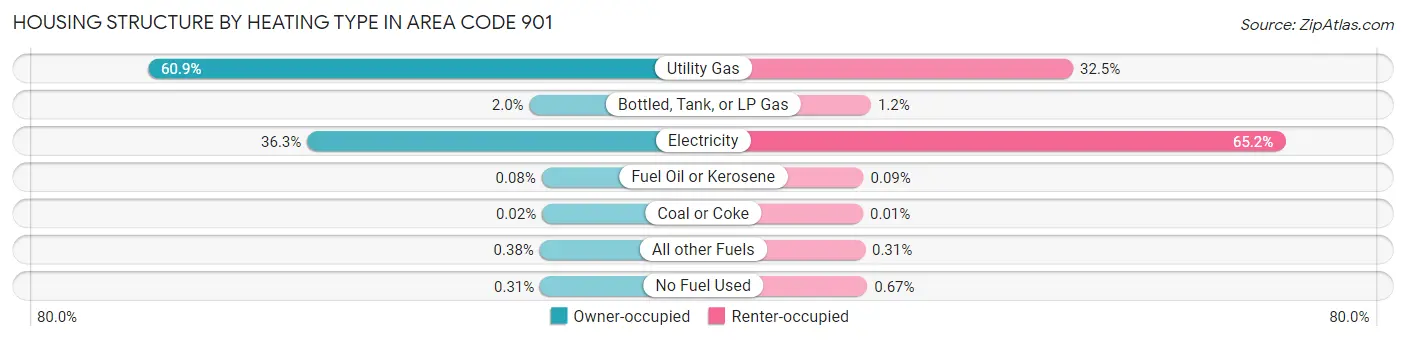
| Heating Type | Owner-occupied | Renter-occupied |
| Utility Gas | 138,189 (60.9%) | 55,018 (32.5%) |
| Bottled, Tank, or LP Gas | 4,449 (2.0%) | 2,065 (1.2%) |
| Electricity | 82,419 (36.3%) | 110,516 (65.2%) |
| Fuel Oil or Kerosene | 189 (0.1%) | 145 (0.1%) |
| Coal or Coke | 46 (0.0%) | 24 (0.0%) |
| All other Fuels | 861 (0.4%) | 520 (0.3%) |
| No Fuel Used | 693 (0.3%) | 1,137 (0.7%) |
| Total | 226,846 (100.0%) | 169,425 (100.0%) |
Household Vehicle Usage in Area Code 901
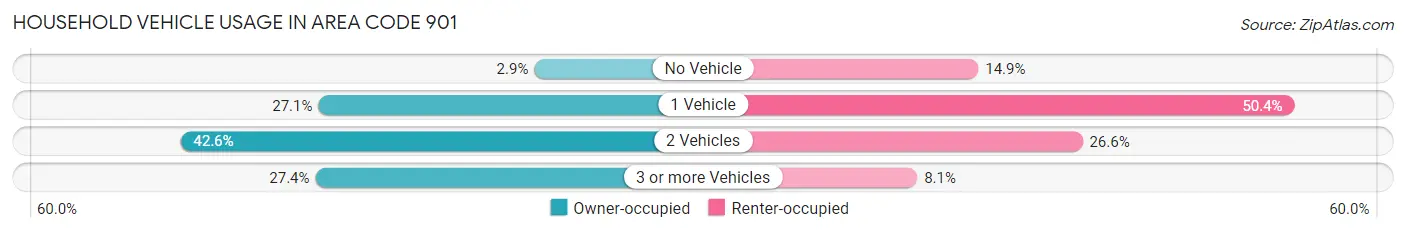
| Vehicles per Household | Owner-occupied | Renter-occupied |
| No Vehicle | 6,611 (2.9%) | 25,305 (14.9%) |
| 1 Vehicle | 61,486 (27.1%) | 85,312 (50.3%) |
| 2 Vehicles | 96,526 (42.5%) | 45,082 (26.6%) |
| 3 or more Vehicles | 62,223 (27.4%) | 13,726 (8.1%) |
| Total | 226,846 (100.0%) | 169,425 (100.0%) |
Real Estate & Mortgages in Area Code 901
Real Estate and Mortgage Overview in Area Code 901
| Characteristic | Without Mortgage | With Mortgage |
| Housing Units | 81,924 | 144,922 |
| Median Property Value | $8,749,600 | $10,290,600 |
| Median Household Income | $3,124,263 | $39,356 |
| Monthly Housing Costs | $25,838 | $13,422 |
| Real Estate Taxes | $87,044 | $5,233 |
Property Value by Mortgage Status in Area Code 901
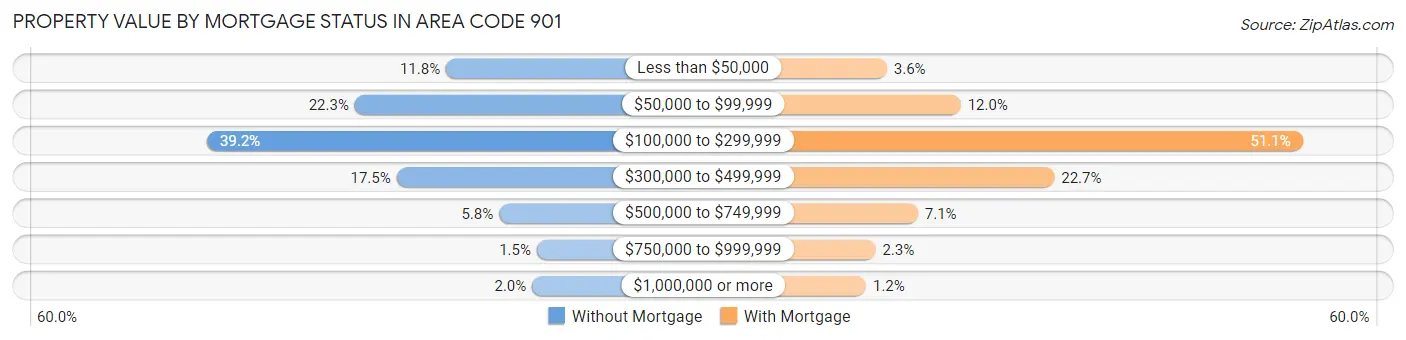
| Property Value | Without Mortgage | With Mortgage |
| Less than $50,000 | 9,702 (11.8%) | 5,186 (3.6%) |
| $50,000 to $99,999 | 18,245 (22.3%) | 17,426 (12.0%) |
| $100,000 to $299,999 | 32,080 (39.2%) | 74,028 (51.1%) |
| $300,000 to $499,999 | 14,325 (17.5%) | 32,918 (22.7%) |
| $500,000 to $749,999 | 4,736 (5.8%) | 10,325 (7.1%) |
| $750,000 to $999,999 | 1,194 (1.5%) | 3,297 (2.3%) |
| $1,000,000 or more | 1,642 (2.0%) | 1,742 (1.2%) |
| Total | 81,924 (100.0%) | 144,922 (100.0%) |
Household Income by Mortgage Status in Area Code 901
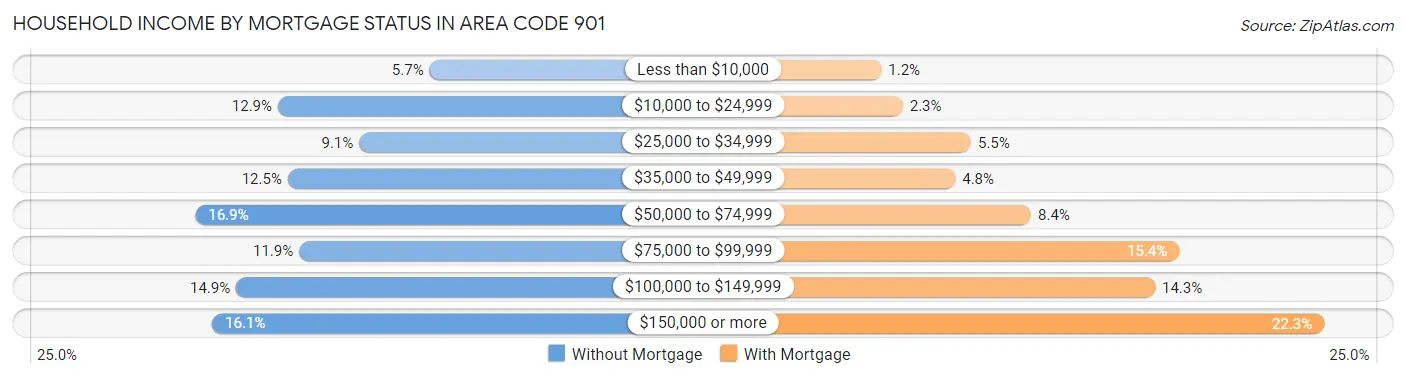
| Household Income | Without Mortgage | With Mortgage |
| Less than $10,000 | 4,687 (5.7%) | 1,788 (1.2%) |
| $10,000 to $24,999 | 10,598 (12.9%) | 3,259 (2.2%) |
| $25,000 to $34,999 | 7,432 (9.1%) | 7,970 (5.5%) |
| $35,000 to $49,999 | 10,218 (12.5%) | 6,888 (4.8%) |
| $50,000 to $74,999 | 13,817 (16.9%) | 12,117 (8.4%) |
| $75,000 to $99,999 | 9,775 (11.9%) | 22,337 (15.4%) |
| $100,000 to $149,999 | 12,234 (14.9%) | 20,668 (14.3%) |
| $150,000 or more | 13,163 (16.1%) | 32,327 (22.3%) |
| Total | 81,924 (100.0%) | 144,922 (100.0%) |
Property Value to Household Income Ratio in Area Code 901
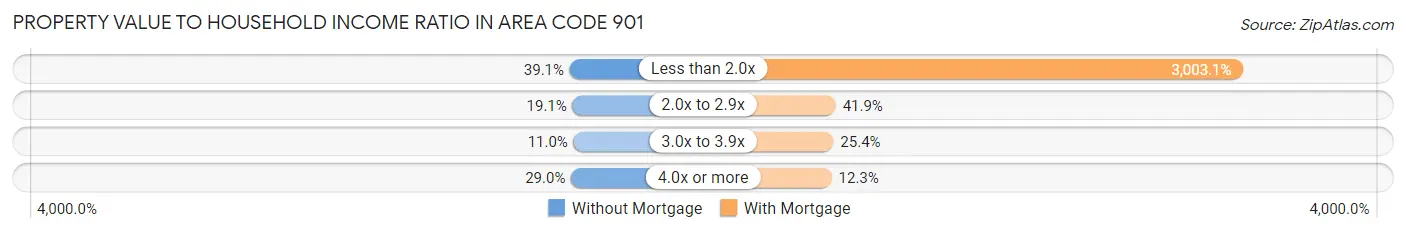
| Value-to-Income Ratio | Without Mortgage | With Mortgage |
| Less than 2.0x | 32,056 (39.1%) | 4,352,173 (3,003.1%) |
| 2.0x to 2.9x | 15,666 (19.1%) | 60,739 (41.9%) |
| 3.0x to 3.9x | 8,970 (11.0%) | 36,844 (25.4%) |
| 4.0x or more | 23,747 (29.0%) | 17,765 (12.3%) |
| Total | 81,924 (100.0%) | 144,922 (100.0%) |
Real Estate Taxes by Mortgage Status in Area Code 901
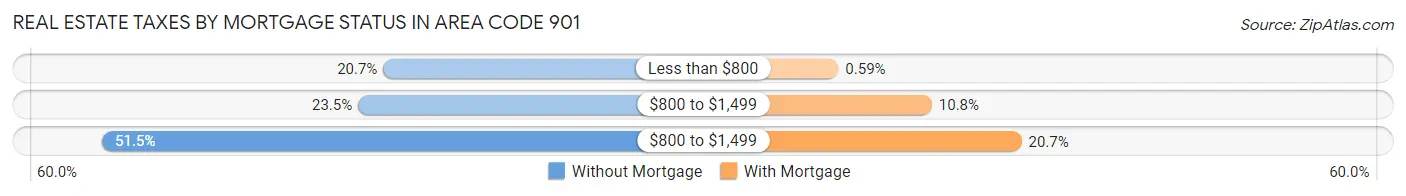
| Property Taxes | Without Mortgage | With Mortgage |
| Less than $800 | 16,957 (20.7%) | 848 (0.6%) |
| $800 to $1,499 | 19,219 (23.5%) | 15,691 (10.8%) |
| $800 to $1,499 | 42,192 (51.5%) | 29,947 (20.7%) |
| Total | 81,924 (100.0%) | 144,922 (100.0%) |
Health & Disability in Area Code 901
Health Insurance Coverage by Age in Area Code 901
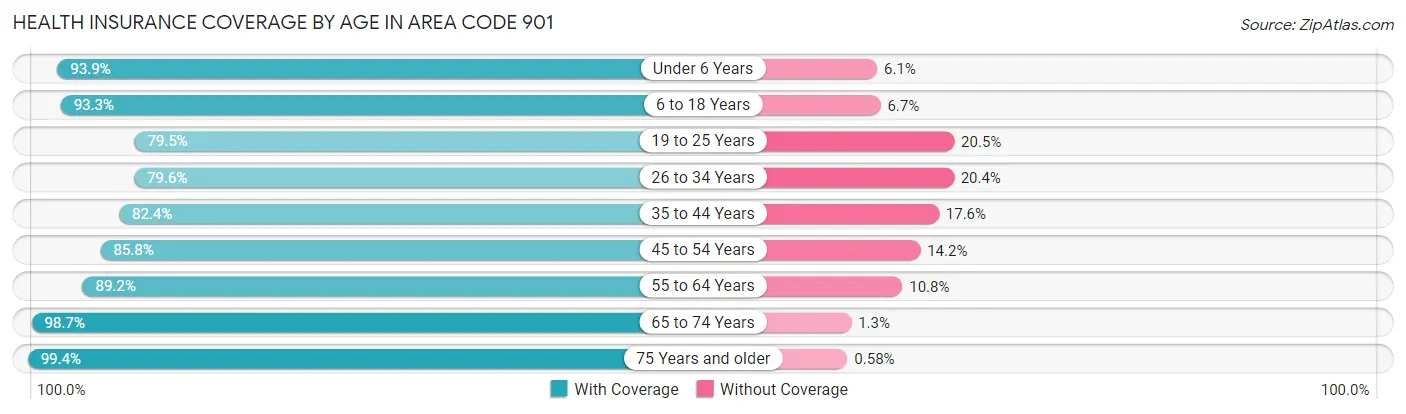
| Age Bracket | With Coverage | Without Coverage |
| Under 6 Years | 77,835 (93.9%) | 5,070 (6.1%) |
| 6 to 18 Years | 170,925 (93.3%) | 12,361 (6.7%) |
| 19 to 25 Years | 73,925 (79.5%) | 19,052 (20.5%) |
| 26 to 34 Years | 105,111 (79.6%) | 26,945 (20.4%) |
| 35 to 44 Years | 103,763 (82.4%) | 22,207 (17.6%) |
| 45 to 54 Years | 106,586 (85.8%) | 17,580 (14.2%) |
| 55 to 64 Years | 113,506 (89.2%) | 13,778 (10.8%) |
| 65 to 74 Years | 91,166 (98.7%) | 1,188 (1.3%) |
| 75 Years and older | 53,827 (99.4%) | 315 (0.6%) |
| Total | 896,644 (88.3%) | 118,496 (11.7%) |
Health Insurance Coverage by Citizenship Status in Area Code 901
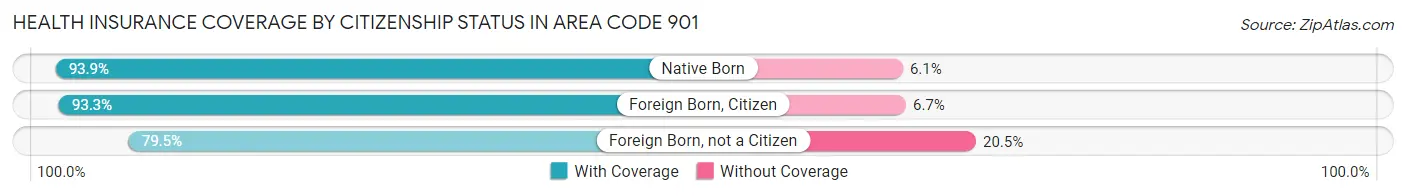
| Citizenship Status | With Coverage | Without Coverage |
| Native Born | 77,835 (93.9%) | 5,070 (6.1%) |
| Foreign Born, Citizen | 170,925 (93.3%) | 12,361 (6.7%) |
| Foreign Born, not a Citizen | 73,925 (79.5%) | 19,052 (20.5%) |
Health Insurance Coverage by Household Income in Area Code 901
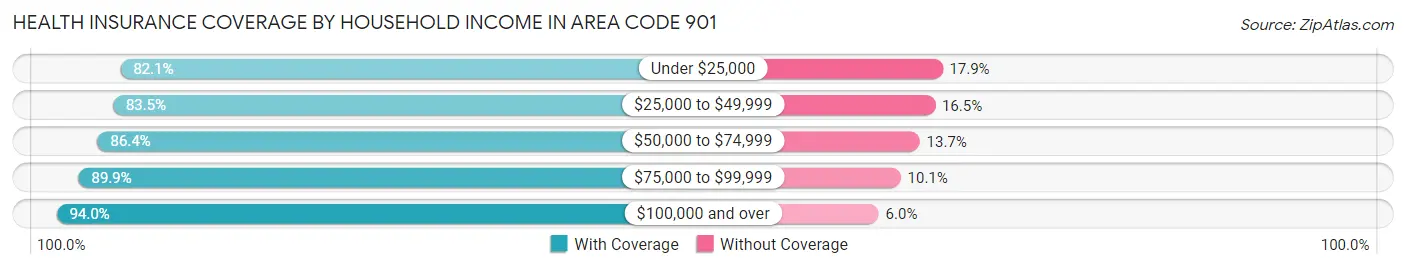
| Household Income | With Coverage | Without Coverage |
| Under $25,000 | 131,635 (82.1%) | 28,742 (17.9%) |
| $25,000 to $49,999 | 158,538 (83.5%) | 31,365 (16.5%) |
| $50,000 to $74,999 | 145,937 (86.4%) | 23,062 (13.7%) |
| $75,000 to $99,999 | 113,591 (89.9%) | 12,738 (10.1%) |
| $100,000 and over | 342,205 (94.0%) | 21,723 (6.0%) |
Public vs Private Health Insurance Coverage by Age in Area Code 901
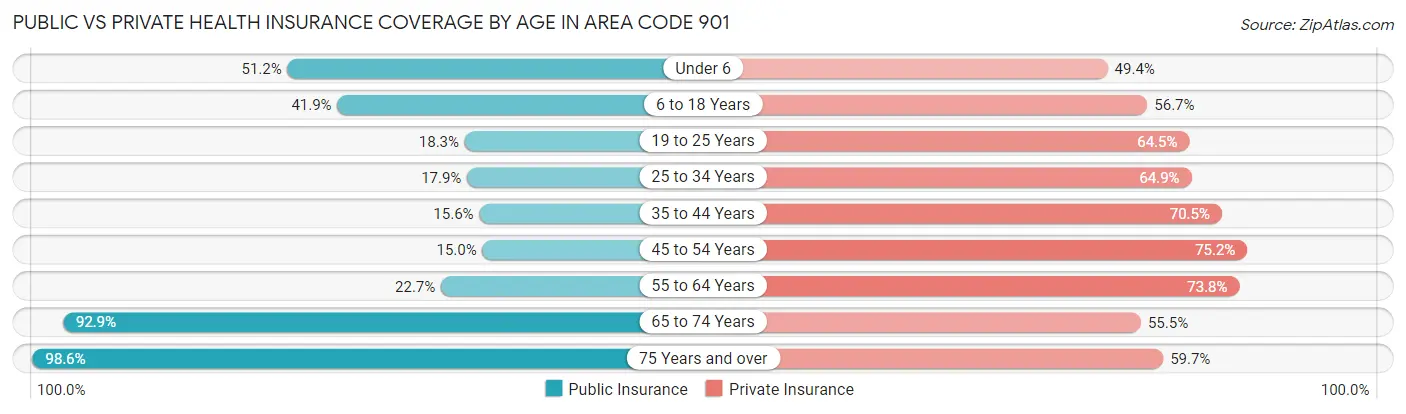
| Age Bracket | Public Insurance | Private Insurance |
| Under 6 | 42,435 (51.2%) | 40,910 (49.3%) |
| 6 to 18 Years | 76,856 (41.9%) | 103,961 (56.7%) |
| 19 to 25 Years | 16,993 (18.3%) | 59,963 (64.5%) |
| 25 to 34 Years | 23,573 (17.8%) | 85,687 (64.9%) |
| 35 to 44 Years | 19,627 (15.6%) | 88,839 (70.5%) |
| 45 to 54 Years | 18,629 (15.0%) | 93,423 (75.2%) |
| 55 to 64 Years | 28,885 (22.7%) | 93,928 (73.8%) |
| 65 to 74 Years | 85,795 (92.9%) | 51,285 (55.5%) |
| 75 Years and over | 53,359 (98.6%) | 32,302 (59.7%) |
| Total | 366,152 (36.1%) | 650,298 (64.1%) |
Disability Status by Sex by Age in Area Code 901
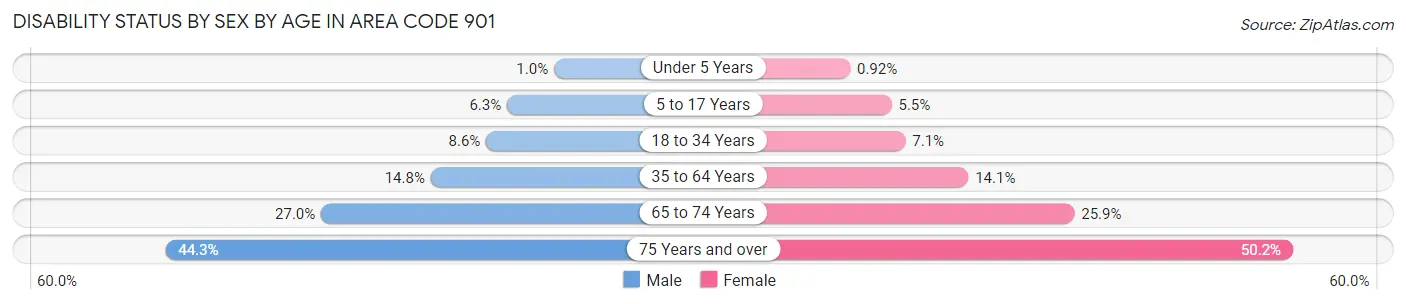
| Age Bracket | Male | Female |
| Under 5 Years | 358 (1.0%) | 313 (0.9%) |
| 5 to 17 Years | 5,891 (6.3%) | 5,036 (5.5%) |
| 18 to 34 Years | 9,851 (8.6%) | 8,715 (7.1%) |
| 35 to 64 Years | 26,182 (14.8%) | 28,169 (14.1%) |
| 65 to 74 Years | 11,179 (27.0%) | 13,185 (25.9%) |
| 75 Years and over | 9,141 (44.3%) | 16,843 (50.2%) |
Disability Class by Sex by Age in Area Code 901
Disability Class: Hearing Difficulty
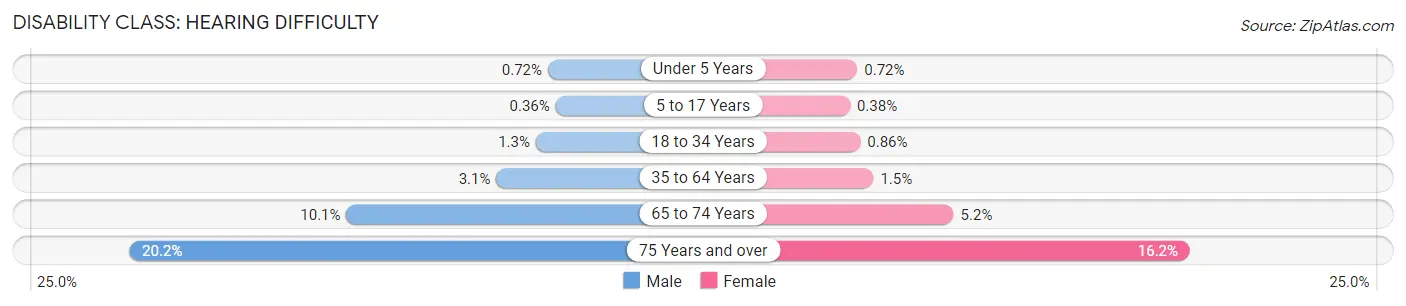
| Age Bracket | Male | Female |
| Under 5 Years | 250 (0.7%) | 244 (0.7%) |
| 5 to 17 Years | 341 (0.4%) | 343 (0.4%) |
| 18 to 34 Years | 1,466 (1.3%) | 1,063 (0.9%) |
| 35 to 64 Years | 5,515 (3.1%) | 2,951 (1.5%) |
| 65 to 74 Years | 4,172 (10.1%) | 2,642 (5.2%) |
| 75 Years and over | 4,154 (20.2%) | 5,414 (16.2%) |
Disability Class: Vision Difficulty
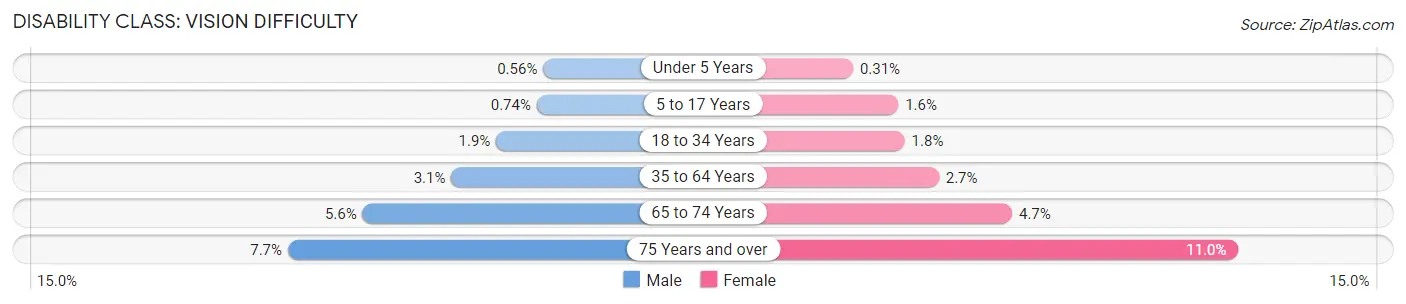
| Age Bracket | Male | Female |
| Under 5 Years | 192 (0.6%) | 104 (0.3%) |
| 5 to 17 Years | 697 (0.7%) | 1,429 (1.6%) |
| 18 to 34 Years | 2,140 (1.9%) | 2,152 (1.8%) |
| 35 to 64 Years | 5,532 (3.1%) | 5,410 (2.7%) |
| 65 to 74 Years | 2,315 (5.6%) | 2,414 (4.7%) |
| 75 Years and over | 1,582 (7.7%) | 3,700 (11.0%) |
Disability Class: Cognitive Difficulty
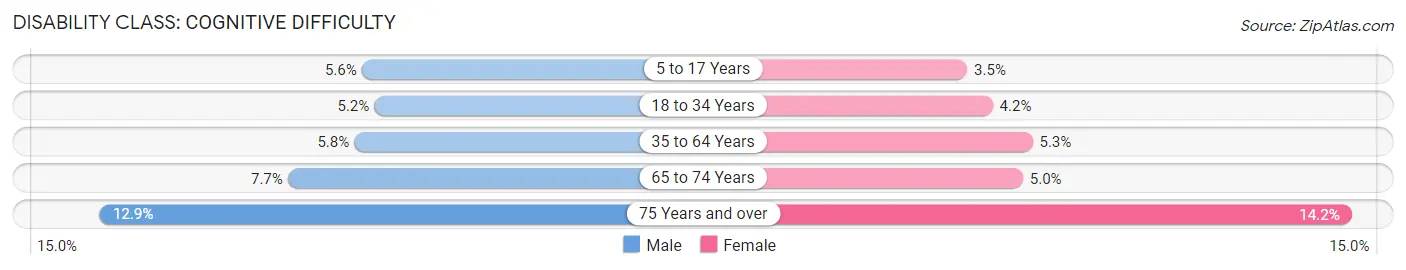
| Age Bracket | Male | Female |
| 5 to 17 Years | 5,253 (5.6%) | 3,174 (3.5%) |
| 18 to 34 Years | 6,015 (5.2%) | 5,178 (4.2%) |
| 35 to 64 Years | 10,289 (5.8%) | 10,628 (5.3%) |
| 65 to 74 Years | 3,171 (7.6%) | 2,566 (5.0%) |
| 75 Years and over | 2,661 (12.9%) | 4,758 (14.2%) |
Disability Class: Ambulatory Difficulty
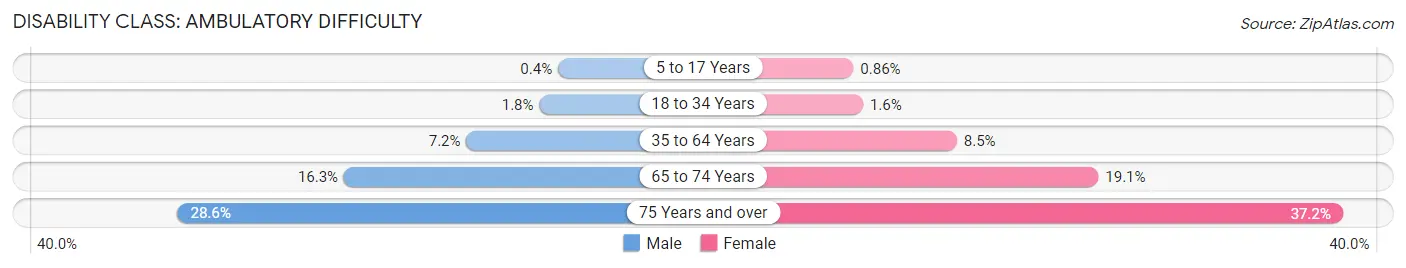
| Age Bracket | Male | Female |
| 5 to 17 Years | 372 (0.4%) | 779 (0.9%) |
| 18 to 34 Years | 2,041 (1.8%) | 1,938 (1.6%) |
| 35 to 64 Years | 12,771 (7.2%) | 17,094 (8.5%) |
| 65 to 74 Years | 6,749 (16.3%) | 9,700 (19.1%) |
| 75 Years and over | 5,905 (28.6%) | 12,468 (37.2%) |
Disability Class: Self-Care Difficulty
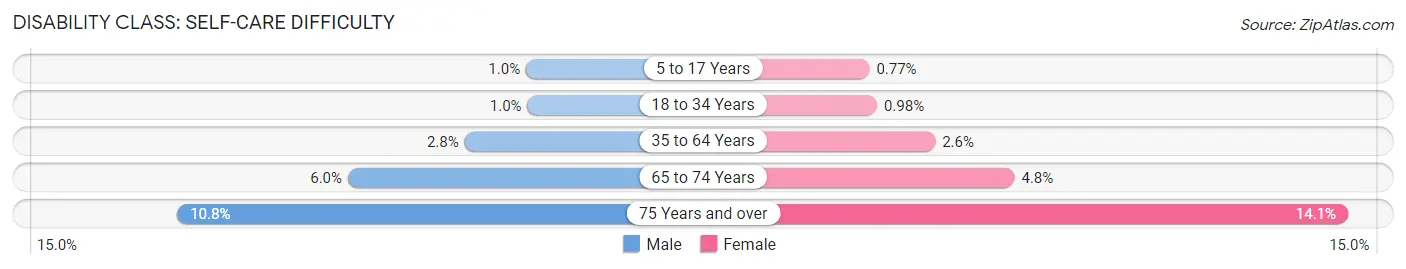
| Age Bracket | Male | Female |
| 5 to 17 Years | 977 (1.0%) | 704 (0.8%) |
| 18 to 34 Years | 1,143 (1.0%) | 1,209 (1.0%) |
| 35 to 64 Years | 4,877 (2.8%) | 5,195 (2.6%) |
| 65 to 74 Years | 2,487 (6.0%) | 2,452 (4.8%) |
| 75 Years and over | 2,217 (10.7%) | 4,722 (14.1%) |
Technology Access in Area Code 901
Computing Device Access in Area Code 901
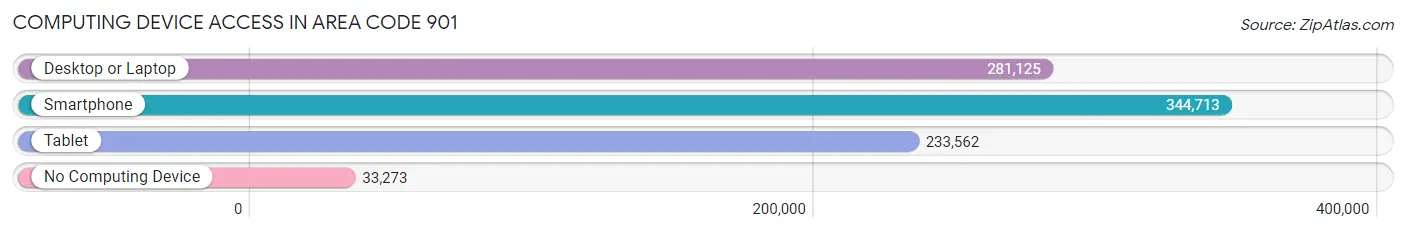
| Device Type | # Households | % Households |
| Desktop or Laptop | 281,125 | 70.9% |
| Smartphone | 344,713 | 87.0% |
| Tablet | 233,562 | 58.9% |
| No Computing Device | 33,273 | 8.4% |
| Total | 396,271 | 100.0% |
Internet Access in Area Code 901
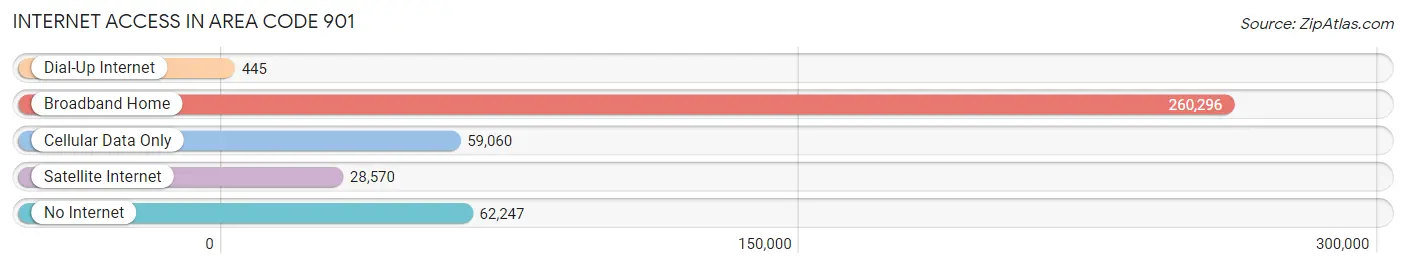
| Internet Type | # Households | % Households |
| Dial-Up Internet | 445 | 0.1% |
| Broadband Home | 260,296 | 65.7% |
| Cellular Data Only | 59,060 | 14.9% |
| Satellite Internet | 28,570 | 7.2% |
| No Internet | 62,247 | 15.7% |
| Total | 396,271 | 100.0% |
Area Code 901 Summary
Geography
Area code 901 is located in the state of Tennessee and covers the greater Memphis metropolitan area. It includes all of Shelby County, as well as parts of Fayette, Tipton, and Lauderdale counties.
Social
The area code 901 is home to a diverse population of people from all walks of life. The city of Memphis is known for its vibrant music and culture, and the area code 901 is home to many of the city's most iconic landmarks, including Beale Street, the National Civil Rights Museum, and the Stax Museum of American Soul Music.
Economics
The area code 901 is home to a thriving economy, with many businesses and industries located in the region. The city of Memphis is a major hub for transportation, logistics, and healthcare, and the area code 901 is home to many of the city's major employers, including FedEx, St. Jude Children's Research Hospital, and the University of Memphis.
Demographics
The area code 901 is home to a diverse population of people from all walks of life. According to the U.S. Census Bureau, the population of the area code 901 is approximately 1.3 million people, with a median age of 35. The population is predominantly African American, with a large Hispanic population as well.
Common Questions
What is Per Capita Income in Area Code 901?
Per Capita income in Area Code 901 is $34,755.
What is the Median Family Income in Area Code 901?
Median Family Income in Area Code 901 is $81,118.
What is the Median Household income in Area Code 901?
Median Household Income in Area Code 901 is $65,642.
What is Income or Wage Gap in Area Code 901?
Income or Wage Gap in Area Code 901 is 22.5%.
Women in Area Code 901 earn 77.5 cents for every dollar earned by a man.
What is Family Income Deficit in Area Code 901?
Family Income Deficit in Area Code 901 is $11,625.
Families that are below poverty line in Area Code 901 earn $11,625 less on average than the poverty threshold level.
What is Inequality or Gini Index in Area Code 901?
Inequality or Gini Index in Area Code 901 is 21.97.
What is the Total Population of Area Code 901?
Total Population of Area Code 901 is 1,032,035.
What is the Total Male Population of Area Code 901?
Total Male Population of Area Code 901 is 495,446.
What is the Total Female Population of Area Code 901?
Total Female Population of Area Code 901 is 536,589.
What is the Ratio of Males per 100 Females in Area Code 901?
There are 92.33 Males per 100 Females in Area Code 901.
What is the Ratio of Females per 100 Males in Area Code 901?
There are 108.30 Females per 100 Males in Area Code 901.
What is the Median Population Age in Area Code 901?
Median Population Age in Area Code 901 is 39.9 Years.
What is the Average Family Size in Area Code 901
Average Family Size in Area Code 901 is 3.1 People.
What is the Average Household Size in Area Code 901
Average Household Size in Area Code 901 is 2.5 People.
How Large is the Labor Force in Area Code 901?
There are 490,754 People in the Labor Forcein in Area Code 901.
What is the Percentage of People in the Labor Force in Area Code 901?
60.8% of People are in the Labor Force in Area Code 901.
What is the Unemployment Rate in Area Code 901?
Unemployment Rate in Area Code 901 is 9.0%.