Area Code 980 Map & Demographics
Area Code 980 Map
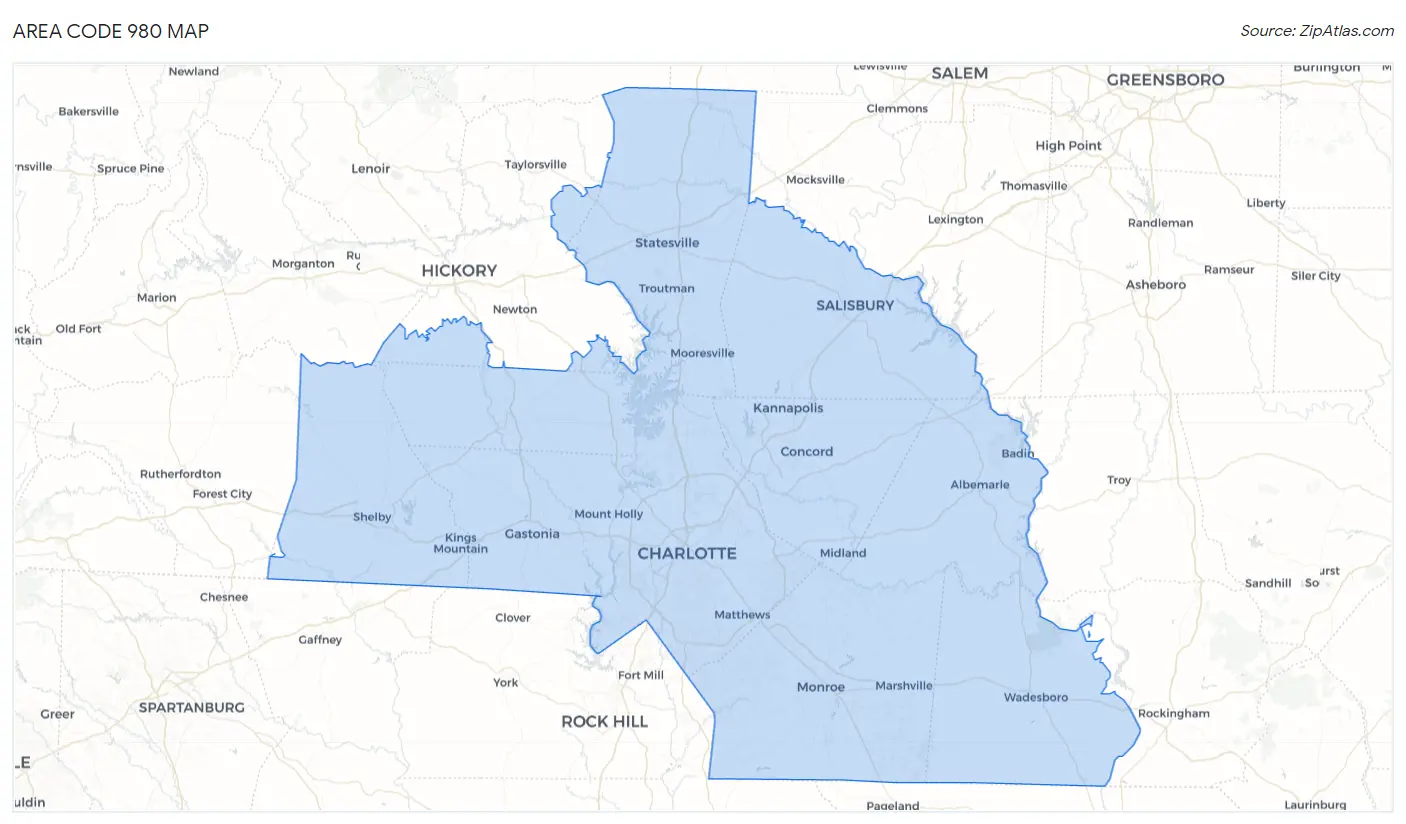
Area Code 980 Overview
$39,991
PER CAPITA INCOME
$92,902
AVG FAMILY INCOME
$74,107
AVG HOUSEHOLD INCOME
27.1%
WAGE / INCOME GAP [ % ]
72.9¢/ $1
WAGE / INCOME GAP [ $ ]
$10,366
FAMILY INCOME DEFICIT
23.01
INEQUALITY / GINI INDEX
1,497,267
TOTAL POPULATION
733,180
MALE POPULATION
764,087
FEMALE POPULATION
95.96
MALES / 100 FEMALES
104.22
FEMALES / 100 MALES
39.1
MEDIAN AGE
3.1
AVG FAMILY SIZE
2.6
AVG HOUSEHOLD SIZE
776,185
LABOR FORCE [ PEOPLE ]
64.8%
PERCENT IN LABOR FORCE
4.7%
UNEMPLOYMENT RATE
Income in Area Code 980
Income Overview in Area Code 980
Per Capita Income in Area Code 980 is $39,991, while median incomes of families and households are $92,902 and $74,107 respectively.
| Characteristic | Number | Measure |
| Per Capita Income | 1,497,267 | $39,991 |
| Median Family Income | 373,503 | $92,902 |
| Mean Family Income | 373,503 | $6,163,049 |
| Median Household Income | 578,916 | $74,107 |
| Mean Household Income | 578,916 | $5,134,261 |
| Income Deficit | 373,503 | $10,366 |
| Wage / Income Gap (%) | 1,497,267 | 27.15% |
| Wage / Income Gap ($) | 1,497,267 | 72.86¢ per $1 |
| Gini / Inequality Index | 1,497,267 | 23.01 |
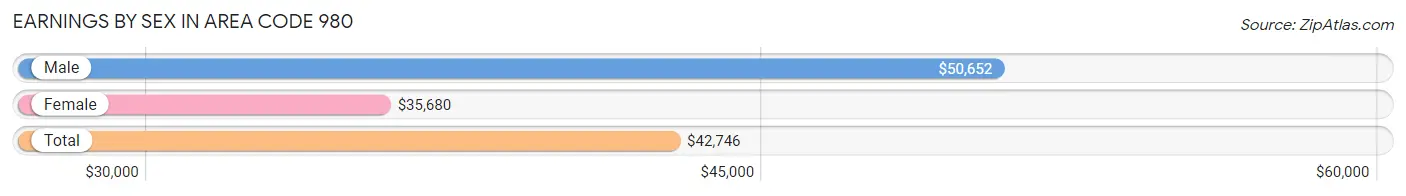
Earnings by Sex in Area Code 980
Average Earnings in Area Code 980 are $42,746, $50,652 for men and $35,680 for women, a difference of 29.6%.
| Sex | Number | Average Earnings |
| Male | 434,712 (52.6%) | $50,652 |
| Female | 391,320 (47.4%) | $35,680 |
| Total | 826,032 (100.0%) | $42,746 |
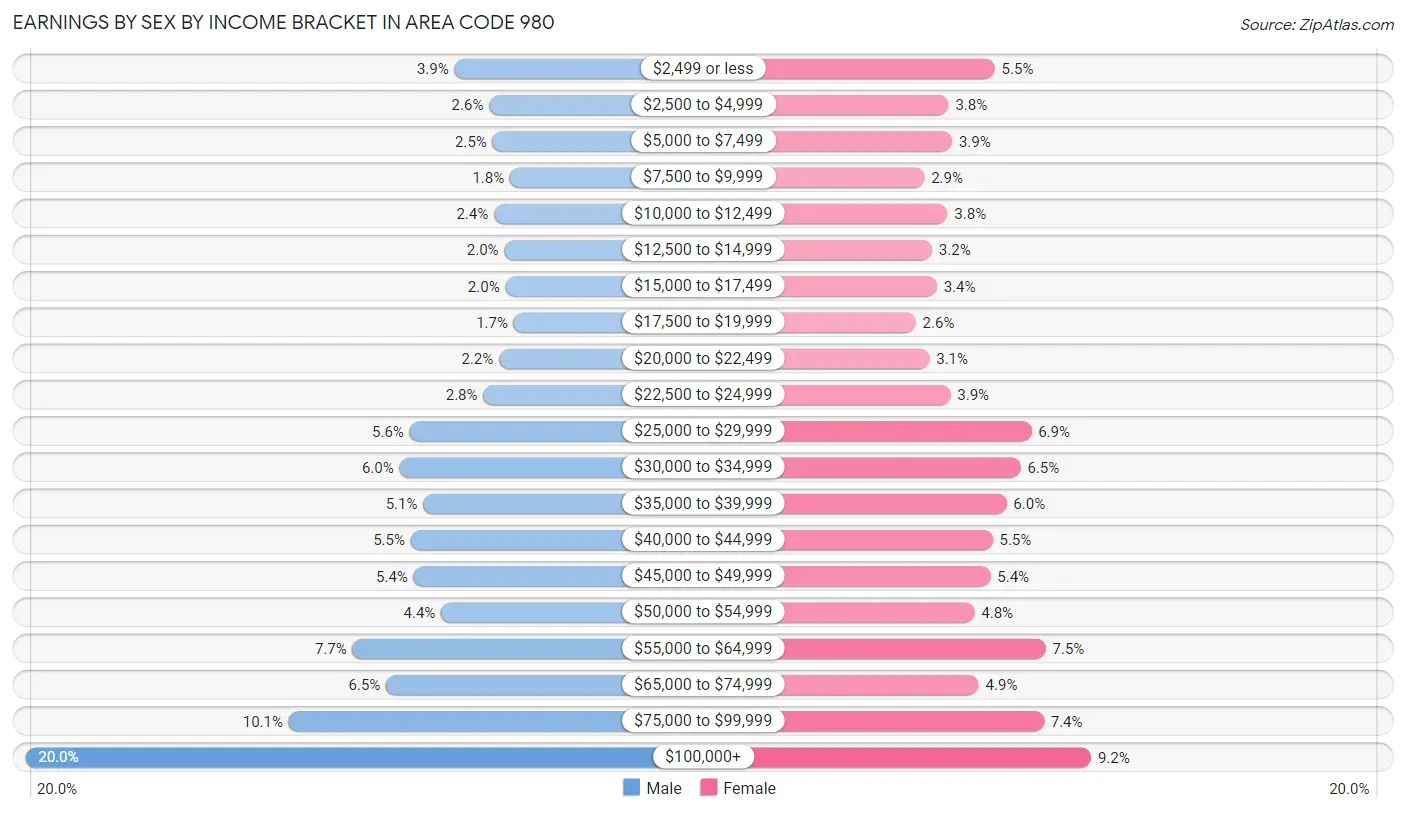
Earnings by Sex by Income Bracket in Area Code 980
The most common earnings brackets in Area Code 980 are $100,000+ for men (86,825 | 20.0%) and $100,000+ for women (35,799 | 9.1%).
| Income | Male | Female |
| $2,499 or less | 16,909 (3.9%) | 21,668 (5.5%) |
| $2,500 to $4,999 | 11,247 (2.6%) | 14,907 (3.8%) |
| $5,000 to $7,499 | 10,701 (2.5%) | 15,436 (3.9%) |
| $7,500 to $9,999 | 7,875 (1.8%) | 11,348 (2.9%) |
| $10,000 to $12,499 | 10,472 (2.4%) | 14,745 (3.8%) |
| $12,500 to $14,999 | 8,782 (2.0%) | 12,465 (3.2%) |
| $15,000 to $17,499 | 8,593 (2.0%) | 13,203 (3.4%) |
| $17,500 to $19,999 | 7,264 (1.7%) | 10,092 (2.6%) |
| $20,000 to $22,499 | 9,669 (2.2%) | 12,084 (3.1%) |
| $22,500 to $24,999 | 12,198 (2.8%) | 15,192 (3.9%) |
| $25,000 to $29,999 | 24,206 (5.6%) | 27,027 (6.9%) |
| $30,000 to $34,999 | 25,844 (5.9%) | 25,482 (6.5%) |
| $35,000 to $39,999 | 21,994 (5.1%) | 23,395 (6.0%) |
| $40,000 to $44,999 | 24,037 (5.5%) | 21,372 (5.5%) |
| $45,000 to $49,999 | 23,564 (5.4%) | 21,067 (5.4%) |
| $50,000 to $54,999 | 19,075 (4.4%) | 18,695 (4.8%) |
| $55,000 to $64,999 | 33,527 (7.7%) | 29,149 (7.4%) |
| $65,000 to $74,999 | 28,042 (6.5%) | 19,317 (4.9%) |
| $75,000 to $99,999 | 43,888 (10.1%) | 28,877 (7.4%) |
| $100,000+ | 86,825 (20.0%) | 35,799 (9.1%) |
| Total | 434,712 (100.0%) | 391,320 (100.0%) |
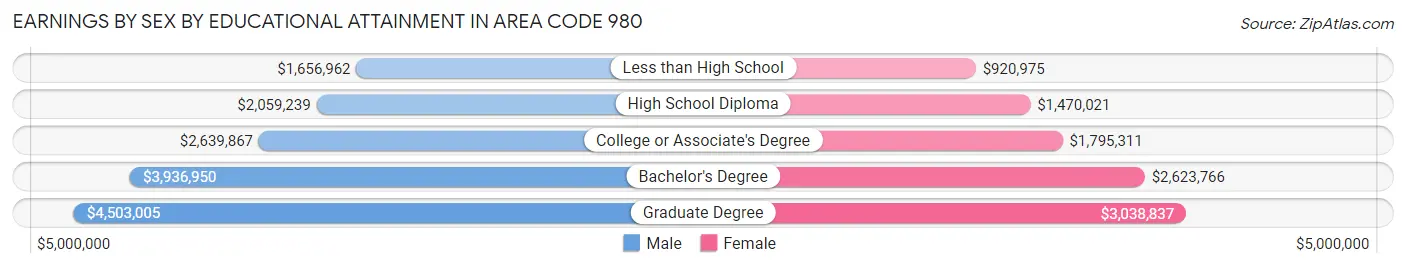
Earnings by Sex by Educational Attainment in Area Code 980
Average earnings in Area Code 980 are $2,992,979 for men and $2,124,825 for women, a difference of 29.0%. Men with an educational attainment of graduate degree enjoy the highest average annual earnings of $4,503,005, while those with less than high school education earn the least with $1,656,962. Women with an educational attainment of graduate degree earn the most with the average annual earnings of $3,038,837, while those with less than high school education have the smallest earnings of $920,975.
| Educational Attainment | Male Income | Female Income |
| Less than High School | $1,656,962 | $920,975 |
| High School Diploma | $2,059,239 | $1,470,021 |
| College or Associate's Degree | $2,639,867 | $1,795,311 |
| Bachelor's Degree | $3,936,950 | $2,623,766 |
| Graduate Degree | $4,503,005 | $3,038,837 |
| Total | $2,992,979 | $2,124,825 |
Family Income in Area Code 980
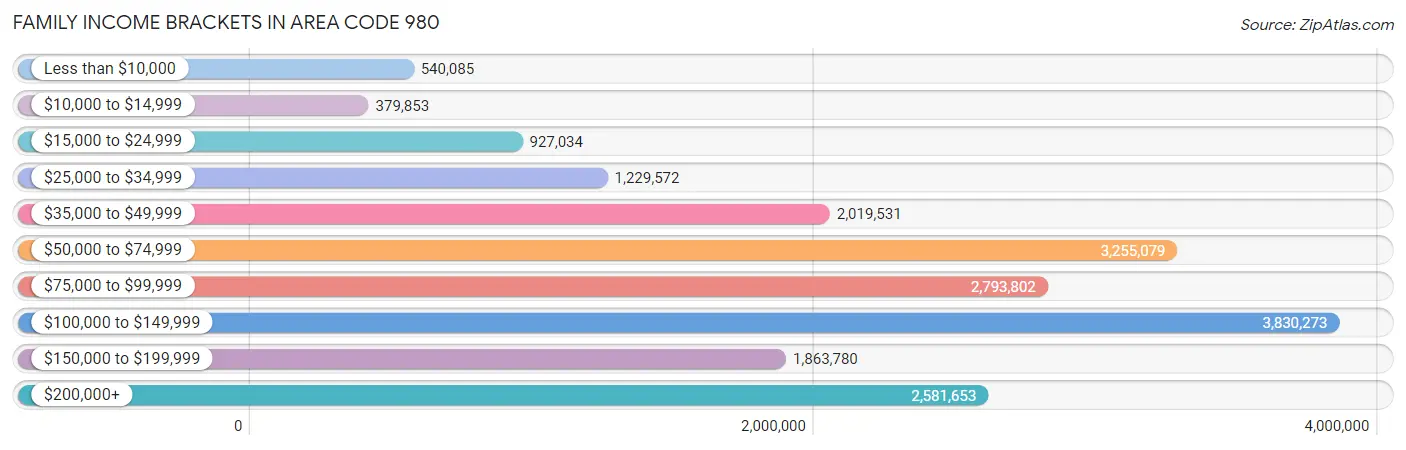
Family Income Brackets in Area Code 980
According to the Area Code 980 family income data, there are 3,830,273 families falling into the $100,000 to $149,999 income range, which is the most common income bracket and makes up 1,025.5% of all families. Conversely, the $10,000 to $14,999 income bracket is the least frequent group with only 379,853 families (101.7%) belonging to this category.
| Income Bracket | # Families | % Families |
| Less than $10,000 | 540,085 | 144.6% |
| $10,000 to $14,999 | 379,853 | 101.7% |
| $15,000 to $24,999 | 927,034 | 248.2% |
| $25,000 to $34,999 | 1,229,572 | 329.2% |
| $35,000 to $49,999 | 2,019,531 | 540.7% |
| $50,000 to $74,999 | 3,255,079 | 871.5% |
| $75,000 to $99,999 | 2,793,802 | 748.0% |
| $100,000 to $149,999 | 3,830,273 | 1,025.5% |
| $150,000 to $199,999 | 1,863,780 | 499.0% |
| $200,000+ | 2,581,653 | 691.2% |
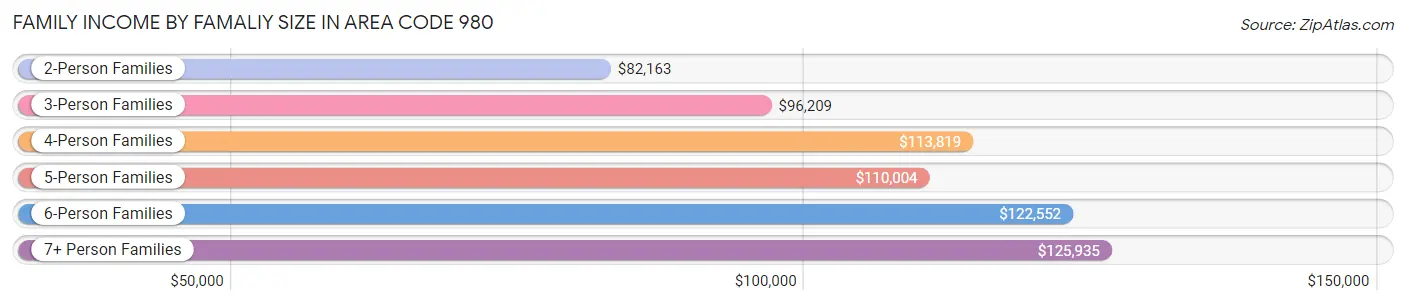
Family Income by Famaliy Size in Area Code 980
7+ person families (5,245 | 1.4%) account for the highest median family income in Area Code 980 with $125,935 per family, while 2-person families (177,474 | 47.5%) have the highest median income of $41,082 per family member.
| Income Bracket | # Families | Median Income |
| 2-Person Families | 177,474 (47.5%) | $82,163 |
| 3-Person Families | 85,026 (22.8%) | $96,209 |
| 4-Person Families | 68,100 (18.2%) | $113,819 |
| 5-Person Families | 27,983 (7.5%) | $110,004 |
| 6-Person Families | 9,675 (2.6%) | $122,552 |
| 7+ Person Families | 5,245 (1.4%) | $125,935 |
| Total | 373,503 (100.0%) | $92,902 |
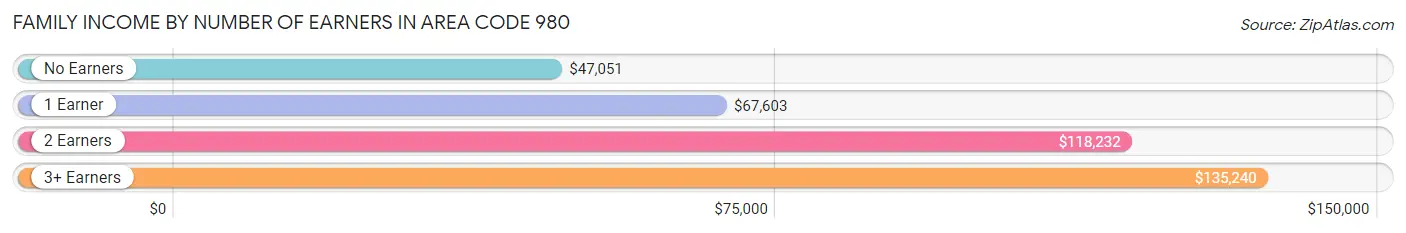
Family Income by Number of Earners in Area Code 980
The median family income in Area Code 980 is $92,902, with families comprising 3+ earners (40,826) having the highest median family income of $135,240, while families with no earners (48,231) have the lowest median family income of $47,051, accounting for 10.9% and 12.9% of families, respectively.
| Number of Earners | # Families | Median Income |
| No Earners | 48,231 (12.9%) | $47,051 |
| 1 Earner | 123,035 (32.9%) | $67,603 |
| 2 Earners | 161,411 (43.2%) | $118,232 |
| 3+ Earners | 40,826 (10.9%) | $135,240 |
| Total | 373,503 (100.0%) | $92,902 |
Household Income in Area Code 980
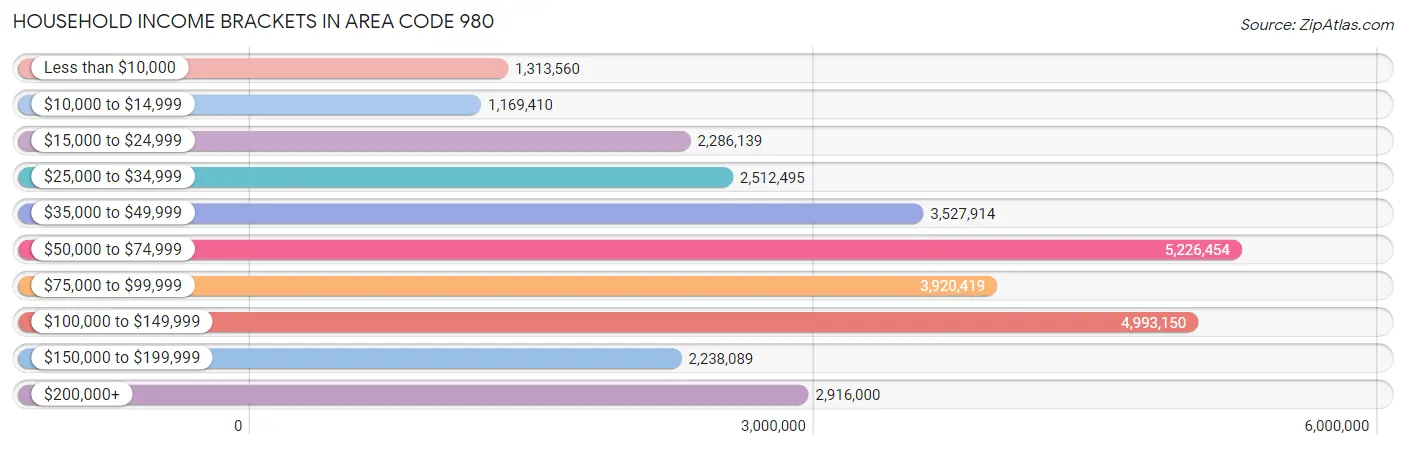
Household Income Brackets in Area Code 980
With 5,226,454 households falling in the category, the $50,000 to $74,999 income range is the most frequent in Area Code 980, accounting for 902.8% of all households. In contrast, only 1,169,410 households (202.0%) fall into the $10,000 to $14,999 income bracket, making it the least populous group.
| Income Bracket | # Households | % Households |
| Less than $10,000 | 1,313,560 | 226.9% |
| $10,000 to $14,999 | 1,169,410 | 202.0% |
| $15,000 to $24,999 | 2,286,139 | 394.9% |
| $25,000 to $34,999 | 2,512,495 | 434.0% |
| $35,000 to $49,999 | 3,527,914 | 609.4% |
| $50,000 to $74,999 | 5,226,454 | 902.8% |
| $75,000 to $99,999 | 3,920,419 | 677.2% |
| $100,000 to $149,999 | 4,993,150 | 862.5% |
| $150,000 to $199,999 | 2,238,089 | 386.6% |
| $200,000+ | 2,916,000 | 503.7% |
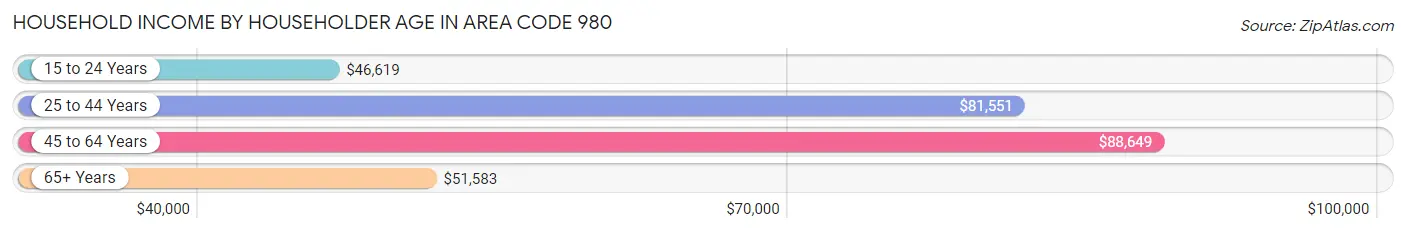
Household Income by Householder Age in Area Code 980
The median household income in Area Code 980 is $74,107, with the highest median household income of $88,649 found in the 45 to 64 years age bracket for the primary householder. A total of 218,314 households (37.7%) fall into this category. Meanwhile, the 15 to 24 years age bracket for the primary householder has the lowest median household income of $46,619, with 23,554 households (4.1%) in this group.
| Income Bracket | # Households | Median Income |
| 15 to 24 Years | 23,554 (4.1%) | $46,619 |
| 25 to 44 Years | 204,349 (35.3%) | $81,551 |
| 45 to 64 Years | 218,314 (37.7%) | $88,649 |
| 65+ Years | 132,699 (22.9%) | $51,583 |
| Total | 578,916 (100.0%) | $74,107 |
Poverty in Area Code 980
Income Below Poverty by Sex and Age in Area Code 980
With 10.0% poverty level for males and 12.5% for females among the residents of Area Code 980, 5 year old males and 18 to 24 year old females are the most vulnerable to poverty, with 1,925 males (22.1%) and 12,504 females (19.1%) in their respective age groups living below the poverty level.
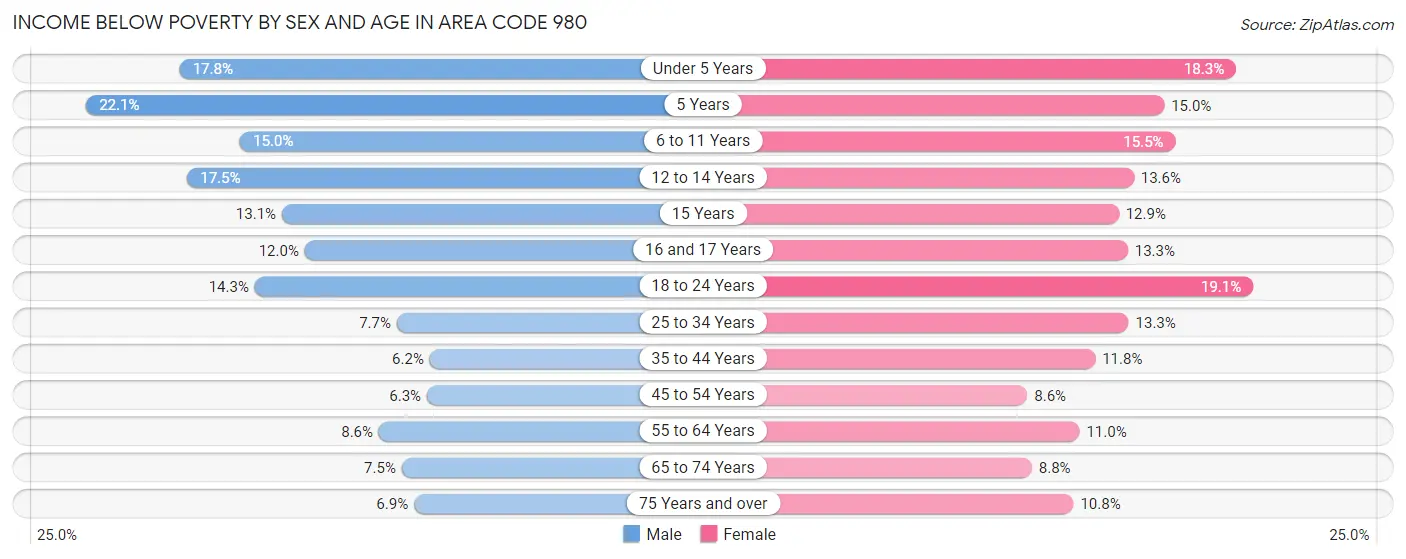
| Age Bracket | Male | Female |
| Under 5 Years | 8,214 (17.8%) | 7,659 (18.3%) |
| 5 Years | 1,925 (22.1%) | 1,270 (15.0%) |
| 6 to 11 Years | 8,413 (15.0%) | 8,282 (15.5%) |
| 12 to 14 Years | 5,189 (17.4%) | 3,908 (13.6%) |
| 15 Years | 1,412 (13.1%) | 1,266 (12.9%) |
| 16 and 17 Years | 2,301 (12.0%) | 2,754 (13.3%) |
| 18 to 24 Years | 9,634 (14.3%) | 12,504 (19.1%) |
| 25 to 34 Years | 8,190 (7.7%) | 14,380 (13.3%) |
| 35 to 44 Years | 5,923 (6.2%) | 11,721 (11.8%) |
| 45 to 54 Years | 6,250 (6.3%) | 9,011 (8.6%) |
| 55 to 64 Years | 7,626 (8.6%) | 10,252 (11.0%) |
| 65 to 74 Years | 4,395 (7.5%) | 6,057 (8.8%) |
| 75 Years and over | 2,251 (6.9%) | 5,373 (10.7%) |
| Total | 71,723 (10.0%) | 94,437 (12.5%) |
Income Above Poverty by Sex and Age in Area Code 980
According to the poverty statistics in Area Code 980, males aged 35 to 44 years and females aged 45 to 54 years are the age groups that are most secure financially, with 93.8% of males and 91.4% of females in these age groups living above the poverty line.
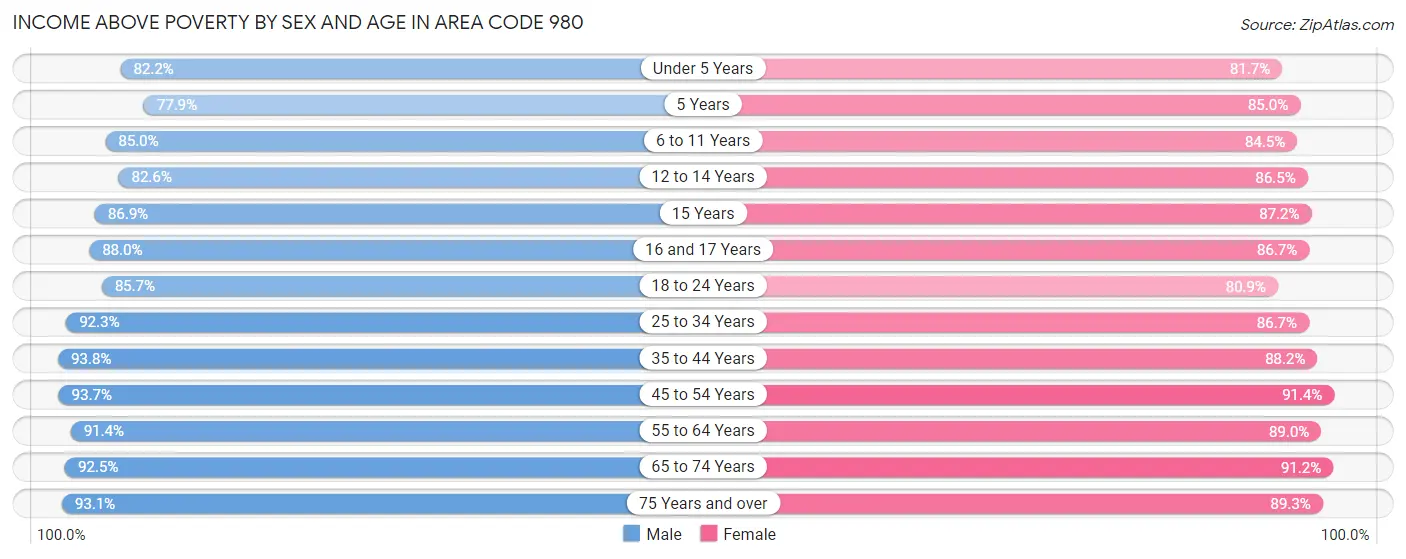
| Age Bracket | Male | Female |
| Under 5 Years | 37,940 (82.2%) | 34,217 (81.7%) |
| 5 Years | 6,769 (77.9%) | 7,219 (85.0%) |
| 6 to 11 Years | 47,680 (85.0%) | 45,203 (84.5%) |
| 12 to 14 Years | 24,545 (82.6%) | 24,938 (86.5%) |
| 15 Years | 9,398 (86.9%) | 8,589 (87.2%) |
| 16 and 17 Years | 16,875 (88.0%) | 17,998 (86.7%) |
| 18 to 24 Years | 57,622 (85.7%) | 53,035 (80.9%) |
| 25 to 34 Years | 97,714 (92.3%) | 93,651 (86.7%) |
| 35 to 44 Years | 89,591 (93.8%) | 87,951 (88.2%) |
| 45 to 54 Years | 92,506 (93.7%) | 95,634 (91.4%) |
| 55 to 64 Years | 81,463 (91.4%) | 82,736 (89.0%) |
| 65 to 74 Years | 54,226 (92.5%) | 62,607 (91.2%) |
| 75 Years and over | 30,247 (93.1%) | 44,625 (89.2%) |
| Total | 646,576 (90.0%) | 658,403 (87.5%) |
Income Below Poverty Among Married-Couple Families in Area Code 980
The poverty statistics for married-couple families in Area Code 980 show that 3.6% or 9,901 of the total 273,825 families live below the poverty line. Families with 5 or more children have the highest poverty rate of 14.9%, comprising of 194 families. On the other hand, families with no children have the lowest poverty rate of 2.9%, which includes 4,668 families.
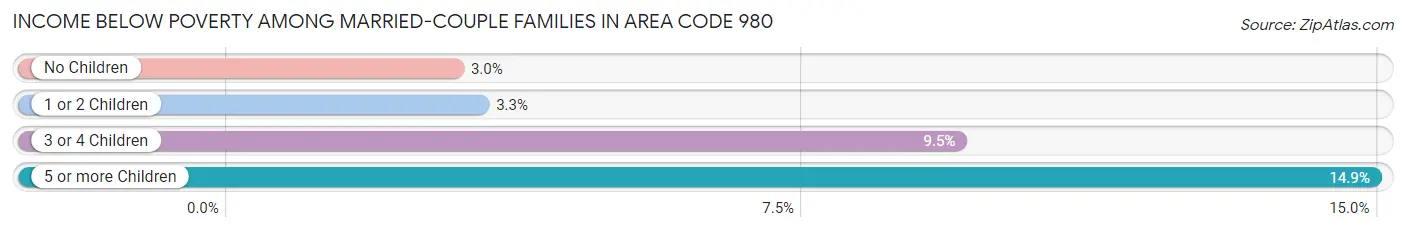
| Children | Above Poverty | Below Poverty |
| No Children | 153,599 (97.1%) | 4,668 (2.9%) |
| 1 or 2 Children | 90,429 (96.7%) | 3,062 (3.3%) |
| 3 or 4 Children | 18,791 (90.5%) | 1,977 (9.5%) |
| 5 or more Children | 1,105 (85.1%) | 194 (14.9%) |
| Total | 263,924 (96.4%) | 9,901 (3.6%) |
Income Below Poverty Among Single-Parent Households in Area Code 980
According to the poverty data in Area Code 980, 10.9% or 2,905 single-father households and 24.5% or 17,878 single-mother households are living below the poverty line. Among single-father households, those with 3 or 4 children have the highest poverty rate, with 524 households (25.6%) experiencing poverty. Likewise, among single-mother households, those with 3 or 4 children have the highest poverty rate, with 3,801 households (55.5%) falling below the poverty line.
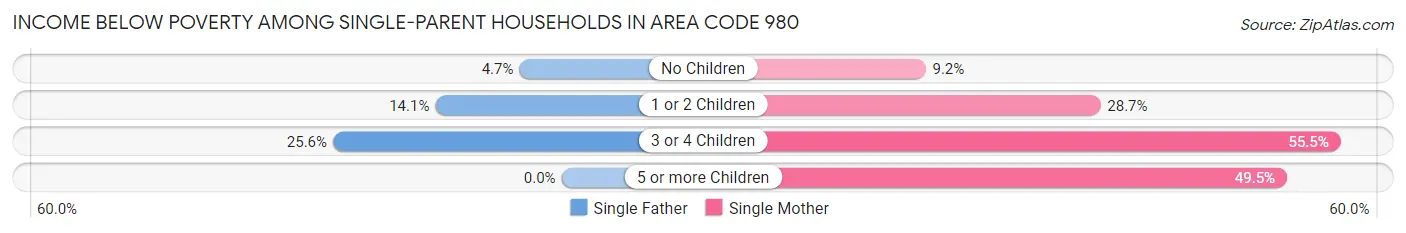
| Children | Single Father | Single Mother |
| No Children | 542 (4.7%) | 2,355 (9.1%) |
| 1 or 2 Children | 1,839 (14.1%) | 11,457 (28.7%) |
| 3 or 4 Children | 524 (25.6%) | 3,801 (55.5%) |
| 5 or more Children | 0 (0.0%) | 265 (49.5%) |
| Total | 2,905 (10.9%) | 17,878 (24.5%) |
Income Below Poverty Among Married-Couple vs Single-Parent Households in Area Code 980
The poverty data for Area Code 980 shows that 9,901 of the married-couple family households (3.6%) and 20,783 of the single-parent households (20.8%) are living below the poverty level. Within the married-couple family households, those with 5 or more children have the highest poverty rate, with 194 households (14.9%) falling below the poverty line. Among the single-parent households, those with 3 or 4 children have the highest poverty rate, with 4,325 household (48.6%) living below poverty.
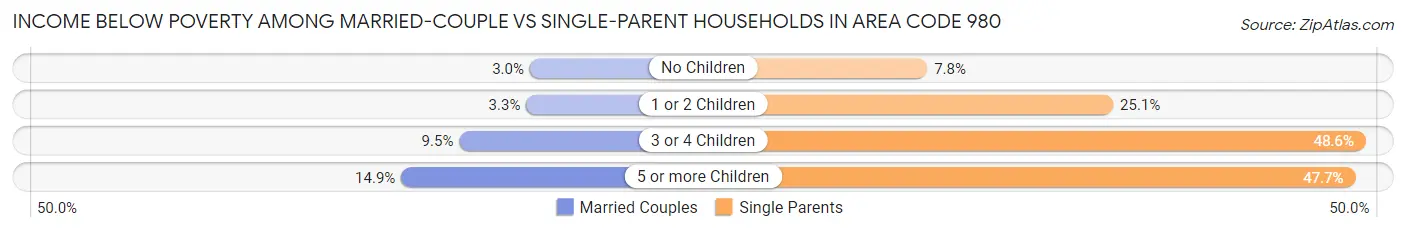
| Children | Married-Couple Families | Single-Parent Households |
| No Children | 4,668 (2.9%) | 2,897 (7.8%) |
| 1 or 2 Children | 3,062 (3.3%) | 13,296 (25.1%) |
| 3 or 4 Children | 1,977 (9.5%) | 4,325 (48.6%) |
| 5 or more Children | 194 (14.9%) | 265 (47.7%) |
| Total | 9,901 (3.6%) | 20,783 (20.8%) |
Race in Area Code 980
The most populous races in Area Code 980 are White / Caucasian (952,485 | 63.6%), Black / African American (317,249 | 21.2%), and Hispanic or Latino (172,422 | 11.5%).
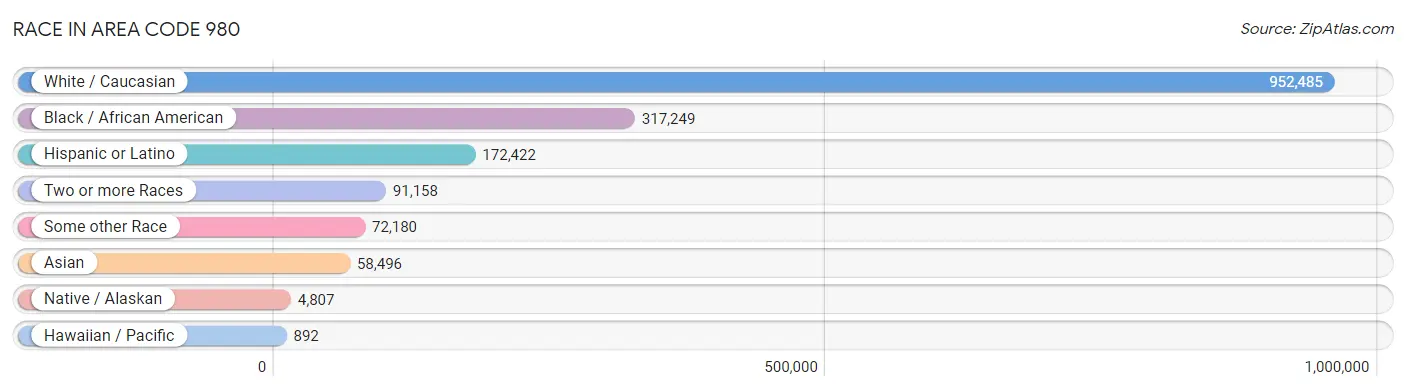
| Race | # Population | % Population |
| Asian | 58,496 | 3.9% |
| Black / African American | 317,249 | 21.2% |
| Hawaiian / Pacific | 892 | 0.1% |
| Hispanic or Latino | 172,422 | 11.5% |
| Native / Alaskan | 4,807 | 0.3% |
| White / Caucasian | 952,485 | 63.6% |
| Two or more Races | 91,158 | 6.1% |
| Some other Race | 72,180 | 4.8% |
| Total | 1,497,267 | 100.0% |
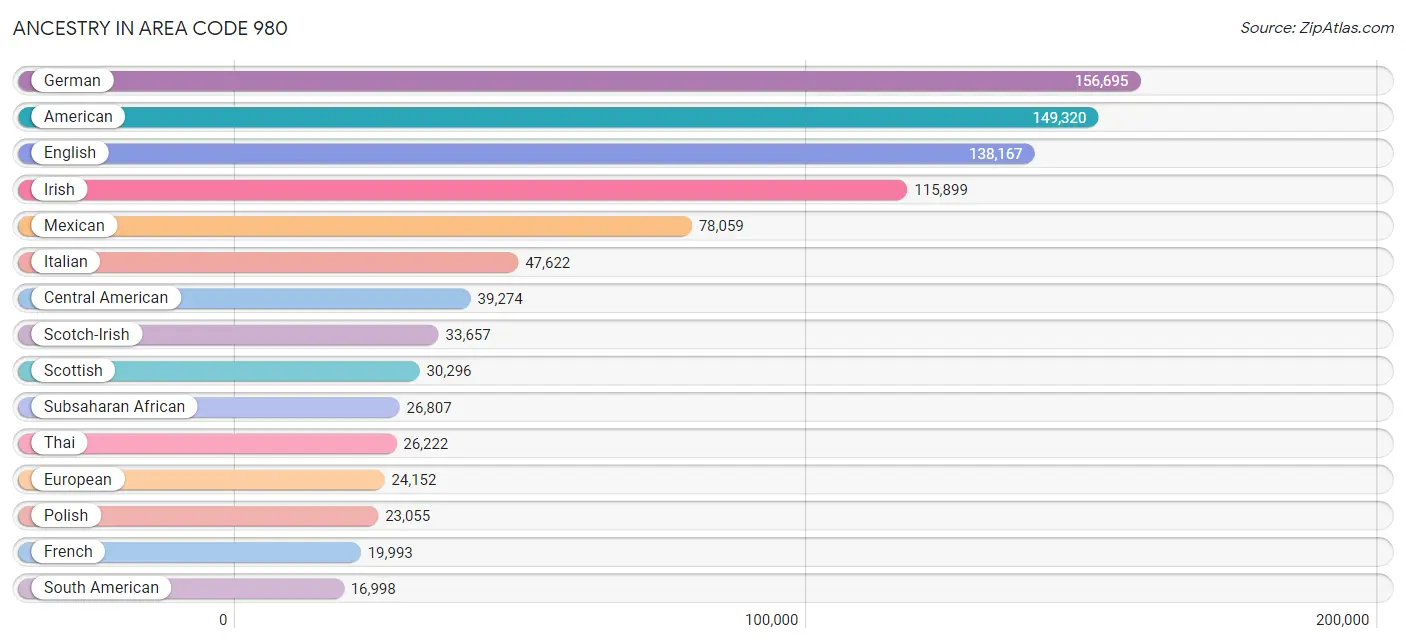
Ancestry in Area Code 980
The most populous ancestries reported in Area Code 980 are German (156,695 | 10.5%), American (149,320 | 10.0%), English (138,167 | 9.2%), Irish (115,899 | 7.7%), and Mexican (78,059 | 5.2%), together accounting for 42.6% of all Area Code 980 residents.
| Ancestry | # Population | % Population |
| Afghan | 148 | 0.0% |
| African | 16,371 | 1.1% |
| Alaska Native | 8 | 0.0% |
| Alaskan Athabascan | 15 | 0.0% |
| Albanian | 379 | 0.0% |
| Aleut | 7 | 0.0% |
| Alsatian | 36 | 0.0% |
| American | 149,320 | 10.0% |
| Apache | 289 | 0.0% |
| Arab | 6,355 | 0.4% |
| Argentinean | 758 | 0.1% |
| Armenian | 439 | 0.0% |
| Assyrian / Chaldean / Syriac | 19 | 0.0% |
| Australian | 171 | 0.0% |
| Austrian | 1,131 | 0.1% |
| Bahamian | 130 | 0.0% |
| Bangladeshi | 3,119 | 0.2% |
| Barbadian | 346 | 0.0% |
| Basque | 24 | 0.0% |
| Belgian | 427 | 0.0% |
| Belizean | 75 | 0.0% |
| Bermudan | 22 | 0.0% |
| Bhutanese | 2,565 | 0.2% |
| Blackfeet | 434 | 0.0% |
| Bolivian | 218 | 0.0% |
| Brazilian | 1,225 | 0.1% |
| British | 8,559 | 0.6% |
| British West Indian | 178 | 0.0% |
| Bulgarian | 374 | 0.0% |
| Burmese | 3,610 | 0.2% |
| Cajun | 73 | 0.0% |
| Cambodian | 48 | 0.0% |
| Canadian | 1,232 | 0.1% |
| Cape Verdean | 132 | 0.0% |
| Celtic | 175 | 0.0% |
| Central American | 39,274 | 2.6% |
| Central American Indian | 1,800 | 0.1% |
| Cherokee | 5,202 | 0.4% |
| Cheyenne | 24 | 0.0% |
| Chickasaw | 61 | 0.0% |
| Chilean | 468 | 0.0% |
| Chippewa | 79 | 0.0% |
| Choctaw | 304 | 0.0% |
| Colombian | 7,028 | 0.5% |
| Costa Rican | 1,292 | 0.1% |
| Cree | 14 | 0.0% |
| Creek | 172 | 0.0% |
| Croatian | 622 | 0.0% |
| Crow | 1 | 0.0% |
| Cuban | 5,155 | 0.3% |
| Cypriot | 17 | 0.0% |
| Czech | 2,611 | 0.2% |
| Czechoslovakian | 620 | 0.0% |
| Danish | 1,619 | 0.1% |
| Delaware | 81 | 0.0% |
| Dominican | 8,236 | 0.5% |
| Dutch | 11,481 | 0.8% |
| Dutch West Indian | 45 | 0.0% |
| Eastern European | 2,497 | 0.2% |
| Ecuadorian | 3,585 | 0.2% |
| Egyptian | 774 | 0.1% |
| English | 138,167 | 9.2% |
| Estonian | 23 | 0.0% |
| Ethiopian | 1,801 | 0.1% |
| European | 24,152 | 1.6% |
| Filipino | 165 | 0.0% |
| Finnish | 1,190 | 0.1% |
| French | 19,993 | 1.3% |
| French American Indian | 121 | 0.0% |
| French Canadian | 4,715 | 0.3% |
| German | 156,695 | 10.5% |
| German Russian | 73 | 0.0% |
| Ghanaian | 558 | 0.0% |
| Greek | 5,867 | 0.4% |
| Guamanian / Chamorro | 140 | 0.0% |
| Guatemalan | 6,098 | 0.4% |
| Guyanese | 413 | 0.0% |
| Haitian | 2,104 | 0.1% |
| Honduran | 16,479 | 1.1% |
| Houma | 12 | 0.0% |
| Hungarian | 4,340 | 0.3% |
| Icelander | 31 | 0.0% |
| Indian (Asian) | 8,375 | 0.6% |
| Indonesian | 1,295 | 0.1% |
| Inupiat | 50 | 0.0% |
| Iranian | 989 | 0.1% |
| Iraqi | 216 | 0.0% |
| Irish | 115,899 | 7.7% |
| Iroquois | 173 | 0.0% |
| Israeli | 158 | 0.0% |
| Italian | 47,622 | 3.2% |
| Jamaican | 4,094 | 0.3% |
| Japanese | 1,269 | 0.1% |
| Jordanian | 360 | 0.0% |
| Kenyan | 217 | 0.0% |
| Kiowa | 30 | 0.0% |
| Korean | 6,570 | 0.4% |
| Laotian | 315 | 0.0% |
| Latvian | 269 | 0.0% |
| Lebanese | 2,005 | 0.1% |
| Liberian | 1,263 | 0.1% |
| Lithuanian | 1,443 | 0.1% |
| Lumbee | 1,668 | 0.1% |
| Macedonian | 72 | 0.0% |
| Malaysian | 1,610 | 0.1% |
| Maltese | 128 | 0.0% |
| Marshallese | 26 | 0.0% |
| Mexican | 78,059 | 5.2% |
| Mexican American Indian | 1,079 | 0.1% |
| Mongolian | 37 | 0.0% |
| Moroccan | 610 | 0.0% |
| Native Hawaiian | 377 | 0.0% |
| Navajo | 201 | 0.0% |
| Nicaraguan | 1,868 | 0.1% |
| Nigerian | 1,795 | 0.1% |
| Northern European | 1,223 | 0.1% |
| Norwegian | 5,193 | 0.4% |
| Okinawan | 2 | 0.0% |
| Osage | 17 | 0.0% |
| Ottawa | 12 | 0.0% |
| Paiute | 3 | 0.0% |
| Pakistani | 422 | 0.0% |
| Palestinian | 458 | 0.0% |
| Panamanian | 872 | 0.1% |
| Paraguayan | 37 | 0.0% |
| Pennsylvania German | 169 | 0.0% |
| Peruvian | 2,237 | 0.2% |
| Polish | 23,055 | 1.5% |
| Portuguese | 2,207 | 0.2% |
| Potawatomi | 5 | 0.0% |
| Pueblo | 3 | 0.0% |
| Puerto Rican | 15,407 | 1.0% |
| Romanian | 2,068 | 0.1% |
| Russian | 5,898 | 0.4% |
| Salvadoran | 12,648 | 0.8% |
| Samoan | 335 | 0.0% |
| Scandinavian | 2,940 | 0.2% |
| Scotch-Irish | 33,657 | 2.2% |
| Scottish | 30,296 | 2.0% |
| Seminole | 154 | 0.0% |
| Senegalese | 262 | 0.0% |
| Serbian | 351 | 0.0% |
| Shoshone | 4 | 0.0% |
| Sierra Leonean | 184 | 0.0% |
| Sioux | 174 | 0.0% |
| Slavic | 478 | 0.0% |
| Slovak | 2,112 | 0.1% |
| Slovene | 593 | 0.0% |
| Somali | 103 | 0.0% |
| South African | 795 | 0.1% |
| South American | 16,998 | 1.1% |
| South American Indian | 260 | 0.0% |
| Spaniard | 1,930 | 0.1% |
| Spanish | 2,359 | 0.2% |
| Sri Lankan | 6,994 | 0.5% |
| Subsaharan African | 26,807 | 1.8% |
| Sudanese | 194 | 0.0% |
| Swedish | 7,361 | 0.5% |
| Swiss | 2,413 | 0.2% |
| Syrian | 662 | 0.0% |
| Taiwanese | 82 | 0.0% |
| Thai | 26,222 | 1.8% |
| Tlingit-Haida | 15 | 0.0% |
| Tongan | 53 | 0.0% |
| Trinidadian and Tobagonian | 631 | 0.0% |
| Turkish | 1,048 | 0.1% |
| U.S. Virgin Islander | 49 | 0.0% |
| Ugandan | 136 | 0.0% |
| Ukrainian | 3,961 | 0.3% |
| Uruguayan | 534 | 0.0% |
| Venezuelan | 1,949 | 0.1% |
| Vietnamese | 72 | 0.0% |
| Welsh | 7,748 | 0.5% |
| West Indian | 1,400 | 0.1% |
| Yaqui | 39 | 0.0% |
| Yugoslavian | 858 | 0.1% |
| Yuman | 30 | 0.0% |
| Yup'ik | 160 | 0.0% |
| Zimbabwean | 111 | 0.0% | View All 179 Rows |
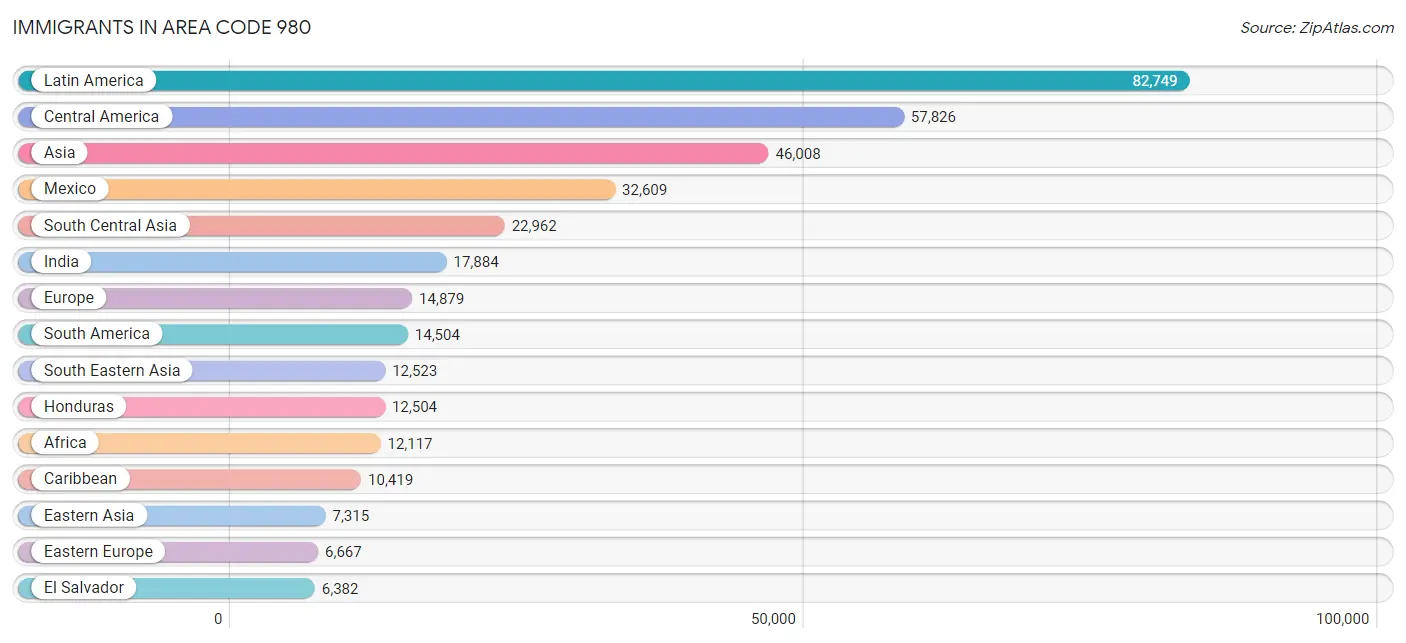
Immigrants in Area Code 980
The most numerous immigrant groups reported in Area Code 980 came from Latin America (82,749 | 5.5%), Central America (57,826 | 3.9%), Asia (46,008 | 3.1%), Mexico (32,609 | 2.2%), and South Central Asia (22,962 | 1.5%), together accounting for 16.2% of all Area Code 980 residents.
| Immigration Origin | # Population | % Population |
| Afghanistan | 301 | 0.0% |
| Africa | 12,117 | 0.8% |
| Albania | 205 | 0.0% |
| Argentina | 458 | 0.0% |
| Armenia | 25 | 0.0% |
| Asia | 46,008 | 3.1% |
| Australia | 229 | 0.0% |
| Austria | 160 | 0.0% |
| Bahamas | 182 | 0.0% |
| Bangladesh | 100 | 0.0% |
| Barbados | 409 | 0.0% |
| Belarus | 277 | 0.0% |
| Belgium | 152 | 0.0% |
| Belize | 47 | 0.0% |
| Bolivia | 181 | 0.0% |
| Bosnia and Herzegovina | 379 | 0.0% |
| Brazil | 1,582 | 0.1% |
| Bulgaria | 200 | 0.0% |
| Cabo Verde | 64 | 0.0% |
| Cambodia | 359 | 0.0% |
| Cameroon | 401 | 0.0% |
| Canada | 2,689 | 0.2% |
| Caribbean | 10,419 | 0.7% |
| Central America | 57,826 | 3.9% |
| Chile | 332 | 0.0% |
| China | 4,452 | 0.3% |
| Colombia | 4,698 | 0.3% |
| Congo | 322 | 0.0% |
| Costa Rica | 927 | 0.1% |
| Croatia | 133 | 0.0% |
| Cuba | 1,794 | 0.1% |
| Czechoslovakia | 139 | 0.0% |
| Denmark | 68 | 0.0% |
| Dominican Republic | 3,758 | 0.3% |
| Eastern Africa | 2,778 | 0.2% |
| Eastern Asia | 7,315 | 0.5% |
| Eastern Europe | 6,667 | 0.4% |
| Ecuador | 2,678 | 0.2% |
| Egypt | 423 | 0.0% |
| El Salvador | 6,382 | 0.4% |
| England | 1,481 | 0.1% |
| Eritrea | 411 | 0.0% |
| Ethiopia | 1,059 | 0.1% |
| Europe | 14,879 | 1.0% |
| France | 271 | 0.0% |
| Germany | 1,879 | 0.1% |
| Ghana | 488 | 0.0% |
| Greece | 750 | 0.1% |
| Grenada | 39 | 0.0% |
| Guatemala | 3,901 | 0.3% |
| Guyana | 409 | 0.0% |
| Haiti | 792 | 0.1% |
| Honduras | 12,504 | 0.8% |
| Hong Kong | 364 | 0.0% |
| Hungary | 116 | 0.0% |
| India | 17,884 | 1.2% |
| Indonesia | 433 | 0.0% |
| Iran | 719 | 0.1% |
| Iraq | 204 | 0.0% |
| Ireland | 193 | 0.0% |
| Israel | 206 | 0.0% |
| Italy | 596 | 0.0% |
| Jamaica | 2,054 | 0.1% |
| Japan | 971 | 0.1% |
| Jordan | 317 | 0.0% |
| Kazakhstan | 100 | 0.0% |
| Kenya | 369 | 0.0% |
| Korea | 1,892 | 0.1% |
| Kuwait | 196 | 0.0% |
| Laos | 1,417 | 0.1% |
| Latin America | 82,749 | 5.5% |
| Latvia | 103 | 0.0% |
| Lebanon | 634 | 0.0% |
| Liberia | 1,760 | 0.1% |
| Lithuania | 9 | 0.0% |
| Malaysia | 580 | 0.0% |
| Mexico | 32,609 | 2.2% |
| Micronesia | 65 | 0.0% |
| Middle Africa | 2,090 | 0.1% |
| Moldova | 633 | 0.0% |
| Morocco | 442 | 0.0% |
| Nepal | 1,439 | 0.1% |
| Netherlands | 140 | 0.0% |
| Nicaragua | 1,120 | 0.1% |
| Nigeria | 848 | 0.1% |
| North Macedonia | 13 | 0.0% |
| Northern Africa | 1,149 | 0.1% |
| Northern Europe | 3,399 | 0.2% |
| Norway | 47 | 0.0% |
| Oceania | 364 | 0.0% |
| Pakistan | 1,218 | 0.1% |
| Panama | 319 | 0.0% |
| Peru | 1,616 | 0.1% |
| Philippines | 2,865 | 0.2% |
| Poland | 591 | 0.0% |
| Portugal | 129 | 0.0% |
| Romania | 609 | 0.0% |
| Russia | 1,386 | 0.1% |
| Saudi Arabia | 107 | 0.0% |
| Scotland | 202 | 0.0% |
| Senegal | 208 | 0.0% |
| Serbia | 29 | 0.0% |
| Sierra Leone | 146 | 0.0% |
| Singapore | 40 | 0.0% |
| Somalia | 167 | 0.0% |
| South Africa | 1,062 | 0.1% |
| South America | 14,504 | 1.0% |
| South Central Asia | 22,962 | 1.5% |
| South Eastern Asia | 12,523 | 0.8% |
| Southern Europe | 1,976 | 0.1% |
| Spain | 495 | 0.0% |
| Sri Lanka | 108 | 0.0% |
| St. Vincent and the Grenadines | 24 | 0.0% |
| Sudan | 258 | 0.0% |
| Sweden | 136 | 0.0% |
| Switzerland | 161 | 0.0% |
| Syria | 343 | 0.0% |
| Taiwan | 347 | 0.0% |
| Thailand | 1,009 | 0.1% |
| Trinidad and Tobago | 1,065 | 0.1% |
| Turkey | 522 | 0.0% |
| Uganda | 244 | 0.0% |
| Ukraine | 1,659 | 0.1% |
| Uruguay | 274 | 0.0% |
| Uzbekistan | 237 | 0.0% |
| Venezuela | 2,201 | 0.2% |
| Vietnam | 4,663 | 0.3% |
| West Indies | 77 | 0.0% |
| Western Africa | 4,151 | 0.3% |
| Western Asia | 3,099 | 0.2% |
| Western Europe | 2,763 | 0.2% |
| Yemen | 237 | 0.0% |
| Zaire | 1,337 | 0.1% |
| Zimbabwe | 279 | 0.0% | View All 134 Rows |
Sex and Age in Area Code 980
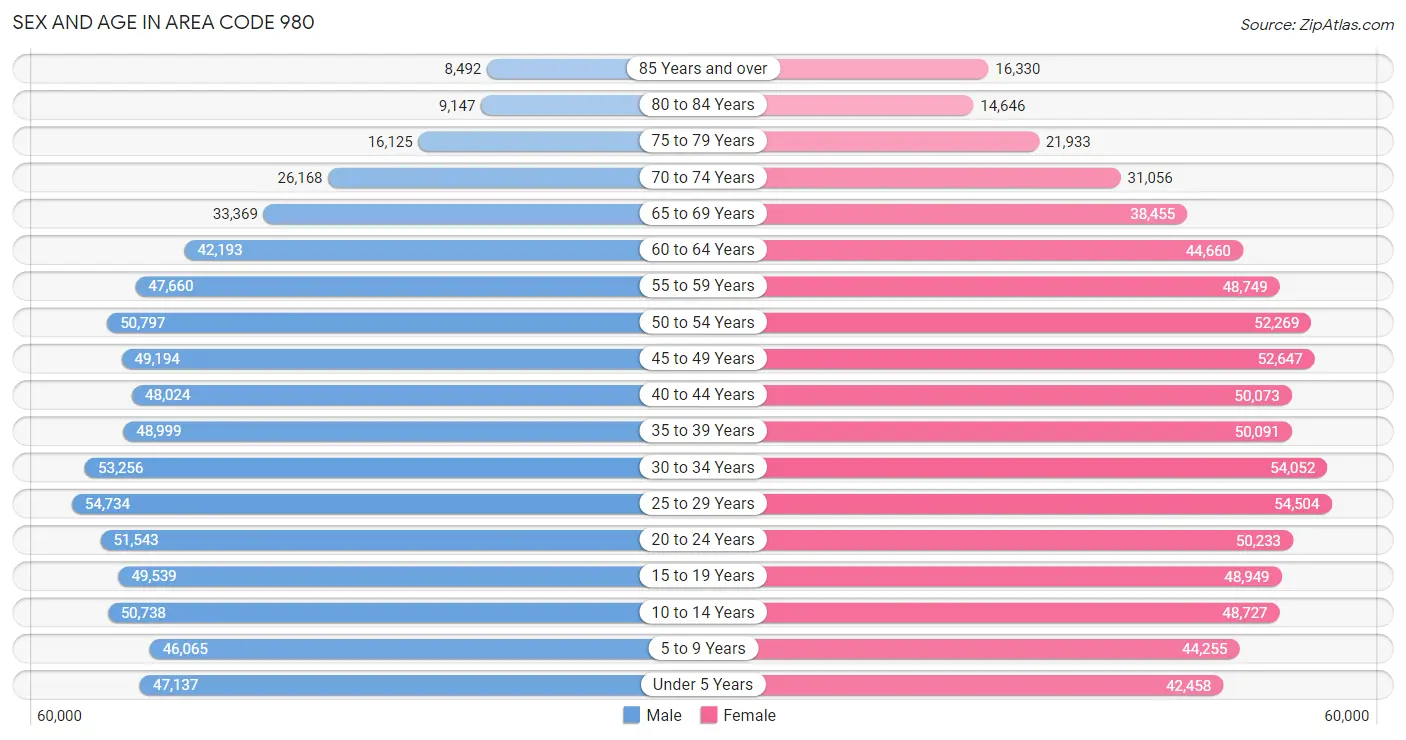
Sex and Age in Area Code 980
The most populous age groups in Area Code 980 are 25 to 29 Years (54,734 | 7.5%) for men and 25 to 29 Years (54,504 | 7.1%) for women.
| Age Bracket | Male | Female |
| Under 5 Years | 47,137 (6.4%) | 42,458 (5.6%) |
| 5 to 9 Years | 46,065 (6.3%) | 44,255 (5.8%) |
| 10 to 14 Years | 50,738 (6.9%) | 48,727 (6.4%) |
| 15 to 19 Years | 49,539 (6.8%) | 48,949 (6.4%) |
| 20 to 24 Years | 51,543 (7.0%) | 50,233 (6.6%) |
| 25 to 29 Years | 54,734 (7.5%) | 54,504 (7.1%) |
| 30 to 34 Years | 53,256 (7.3%) | 54,052 (7.1%) |
| 35 to 39 Years | 48,999 (6.7%) | 50,091 (6.6%) |
| 40 to 44 Years | 48,024 (6.6%) | 50,073 (6.6%) |
| 45 to 49 Years | 49,194 (6.7%) | 52,647 (6.9%) |
| 50 to 54 Years | 50,797 (6.9%) | 52,269 (6.8%) |
| 55 to 59 Years | 47,660 (6.5%) | 48,749 (6.4%) |
| 60 to 64 Years | 42,193 (5.8%) | 44,660 (5.8%) |
| 65 to 69 Years | 33,369 (4.5%) | 38,455 (5.0%) |
| 70 to 74 Years | 26,168 (3.6%) | 31,056 (4.1%) |
| 75 to 79 Years | 16,125 (2.2%) | 21,933 (2.9%) |
| 80 to 84 Years | 9,147 (1.3%) | 14,646 (1.9%) |
| 85 Years and over | 8,492 (1.2%) | 16,330 (2.1%) |
| Total | 733,180 (100.0%) | 764,087 (100.0%) |
Families and Households in Area Code 980
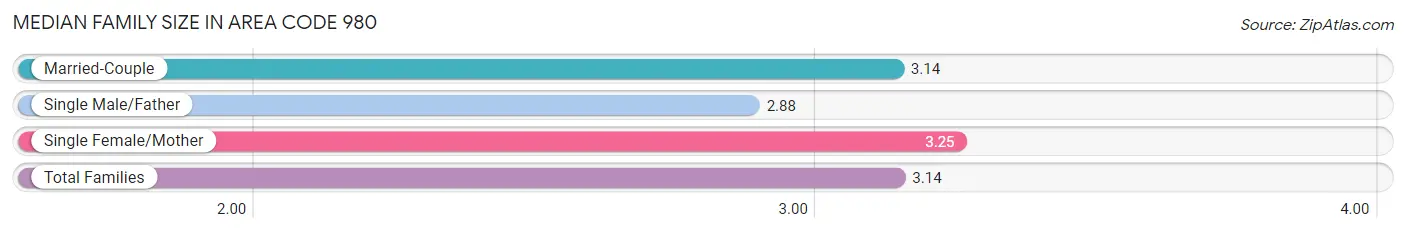
Median Family Size in Area Code 980
The median family size in Area Code 980 is 3.14 persons per family, with single female/mother families (73,054 | 19.6%) accounting for the largest median family size of 3.25 persons per family. On the other hand, single male/father families (26,624 | 7.1%) represent the smallest median family size with 2.88 persons per family.
| Family Type | # Families | Family Size |
| Married-Couple | 273,825 (73.3%) | 3.14 |
| Single Male/Father | 26,624 (7.1%) | 2.88 |
| Single Female/Mother | 73,054 (19.6%) | 3.25 |
| Total Families | 373,503 (100.0%) | 3.14 |
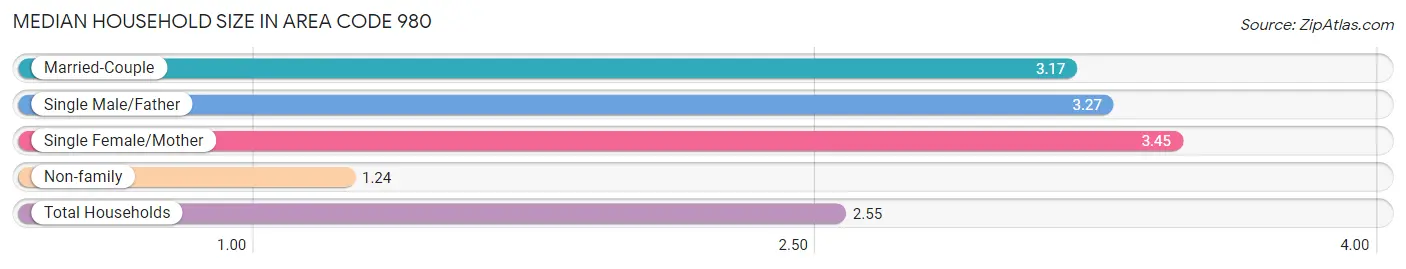
Median Household Size in Area Code 980
The median household size in Area Code 980 is 2.55 persons per household, with single female/mother households (73,054 | 12.6%) accounting for the largest median household size of 3.45384 persons per household. non-family households (205,413 | 35.5%) represent the smallest median household size with 1.24 persons per household.
| Household Type | # Households | Household Size |
| Married-Couple | 273,825 (47.3%) | 3.17 |
| Single Male/Father | 26,624 (4.6%) | 3.27 |
| Single Female/Mother | 73,054 (12.6%) | 3.45 |
| Non-family | 205,413 (35.5%) | 1.24 |
| Total Households | 578,916 (100.0%) | 2.55 |
Household Size by Marriage Status in Area Code 980
Out of a total of 578,916 households in Area Code 980, 373,503 (64.5%) are family households, while 205,413 (35.5%) are nonfamily households. The most numerous type of family households are 2-person households, comprising 166,877, and the most common type of nonfamily households are 1-person households, comprising 168,009.
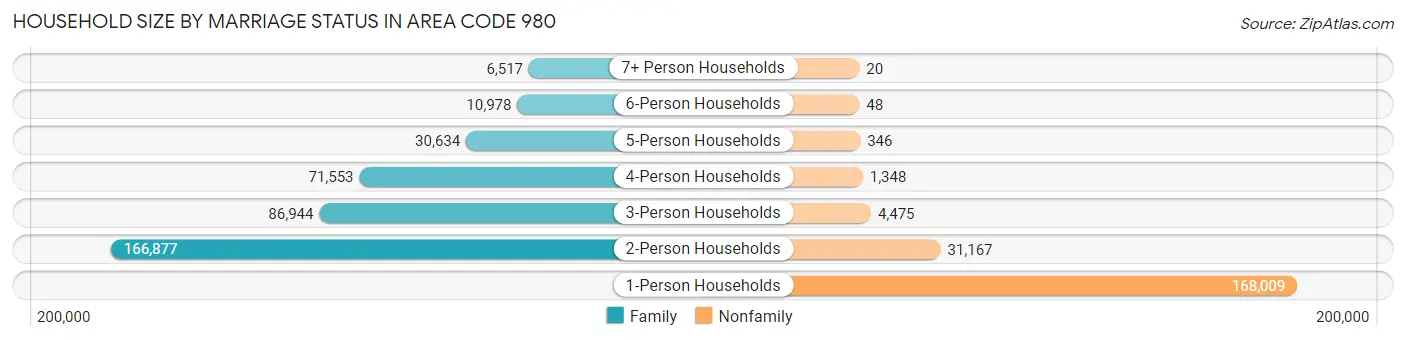
| Household Size | Family Households | Nonfamily Households |
| 1-Person Households | - | 168,009 (29.0%) |
| 2-Person Households | 166,877 (28.8%) | 31,167 (5.4%) |
| 3-Person Households | 86,944 (15.0%) | 4,475 (0.8%) |
| 4-Person Households | 71,553 (12.4%) | 1,348 (0.2%) |
| 5-Person Households | 30,634 (5.3%) | 346 (0.1%) |
| 6-Person Households | 10,978 (1.9%) | 48 (0.0%) |
| 7+ Person Households | 6,517 (1.1%) | 20 (0.0%) |
| Total | 373,503 (64.5%) | 205,413 (35.5%) |
Female Fertility in Area Code 980
Fertility by Age in Area Code 980
Average fertility rate in Area Code 980 is 56.3 births per 1,000 women. Women in the age bracket of 20 to 34 years have the highest fertility rate with 99.9 births per 1,000 women. Women in the age bracket of 20 to 34 years acount for 72.7% of all women with births.
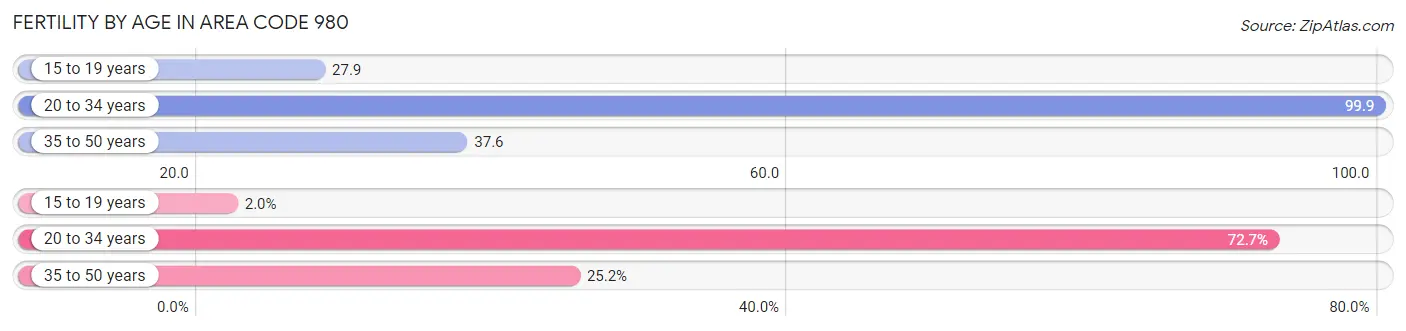
| Age Bracket | Women with Births | Births / 1,000 Women |
| 15 to 19 years | 416 (2.0%) | 27.9 |
| 20 to 34 years | 14,986 (72.7%) | 99.9 |
| 35 to 50 years | 5,199 (25.2%) | 37.6 |
| Total | 20,601 (100.0%) | 56.3 |
Fertility by Age by Marriage Status in Area Code 980
60.0% of women with births (20,601) in Area Code 980 are married. The highest percentage of unmarried women with births falls into 15 to 19 years age bracket with 97.4% of them unmarried at the time of birth, while the lowest percentage of unmarried women with births belong to 35 to 50 years age bracket with 35.7% of them unmarried.
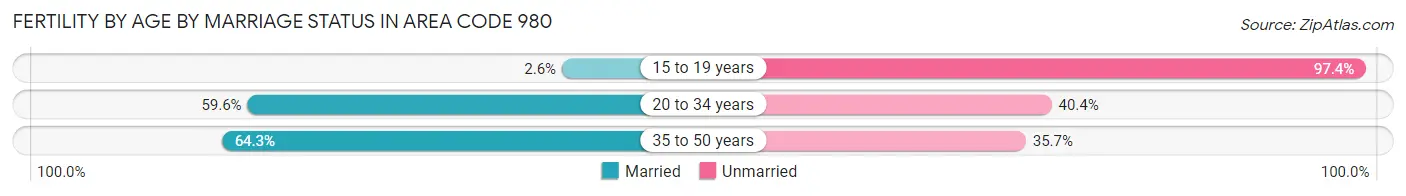
| Age Bracket | Married | Unmarried |
| 15 to 19 years | 11 (2.6%) | 405 (97.4%) |
| 20 to 34 years | 8,935 (59.6%) | 6,051 (40.4%) |
| 35 to 50 years | 3,342 (64.3%) | 1,857 (35.7%) |
| Total | 12,365 (60.0%) | 8,236 (40.0%) |
Fertility by Education in Area Code 980
Average fertility rate in Area Code 980 is 56.3 births per 1,000 women. Women with the education attainment of bachelor's degree have the highest fertility rate of 92.9 births per 1,000 women, while women with the education attainment of less than high school have the lowest fertility at 49.1 births per 1,000 women. Women with the education attainment of college or associate's degree represent 26.3% of all women with births.
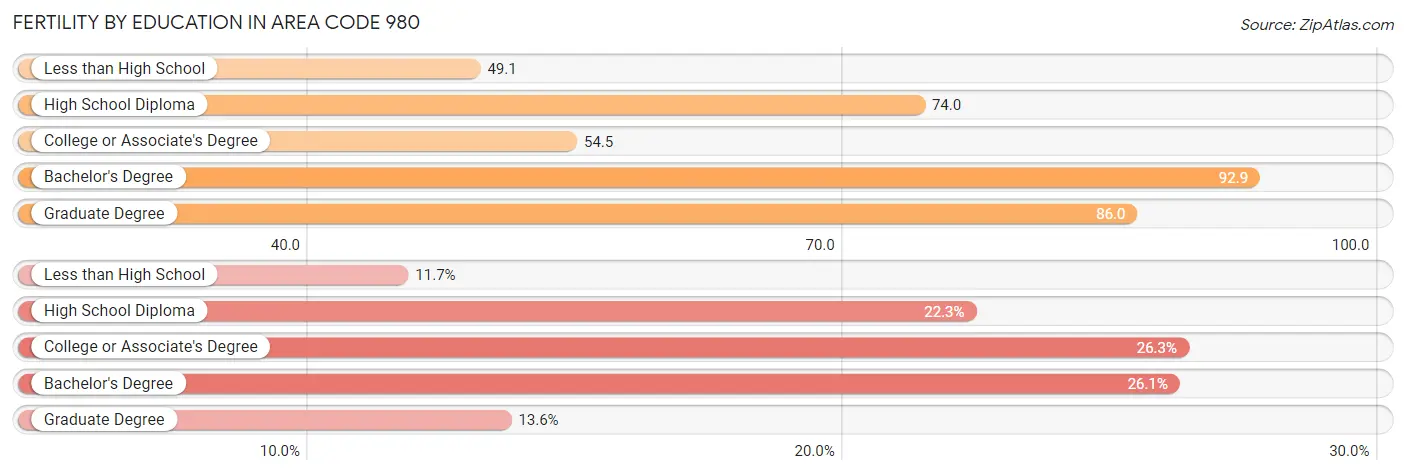
| Educational Attainment | Women with Births | Births / 1,000 Women |
| Less than High School | 2,404 (11.7%) | 49.1 |
| High School Diploma | 4,597 (22.3%) | 74.0 |
| College or Associate's Degree | 5,416 (26.3%) | 54.5 |
| Bachelor's Degree | 5,382 (26.1%) | 92.9 |
| Graduate Degree | 2,802 (13.6%) | 86.0 |
| Total | 20,601 (100.0%) | 56.3 |
Fertility by Education by Marriage Status in Area Code 980
40.0% of women with births in Area Code 980 are unmarried. Women with the educational attainment of bachelor's degree are most likely to be married with 67.5% of them married at childbirth, while women with the educational attainment of less than high school are least likely to be married with 76.0% of them unmarried at childbirth.
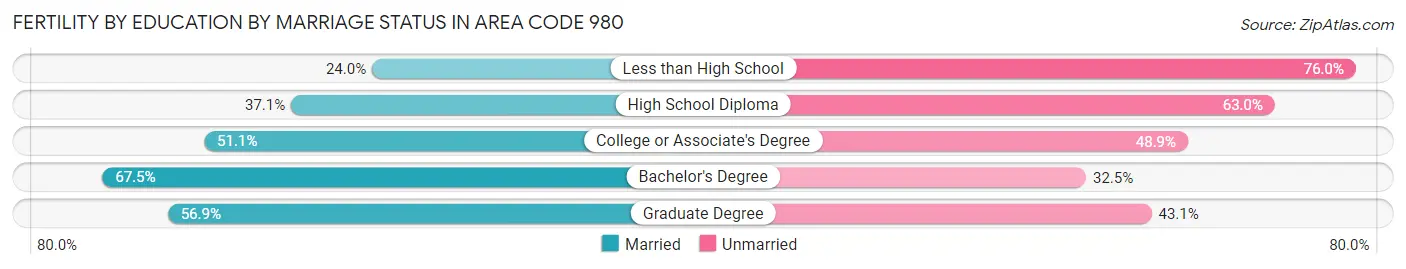
| Educational Attainment | Married | Unmarried |
| Less than High School | 577 (24.0%) | 1,827 (76.0%) |
| High School Diploma | 1,703 (37.0%) | 2,894 (62.9%) |
| College or Associate's Degree | 2,766 (51.1%) | 2,650 (48.9%) |
| Bachelor's Degree | 3,631 (67.5%) | 1,751 (32.5%) |
| Graduate Degree | 1,595 (56.9%) | 1,207 (43.1%) |
| Total | 12,365 (60.0%) | 8,236 (40.0%) |
Employment Characteristics in Area Code 980
Employment by Class of Employer in Area Code 980
Among the 743,413 employed individuals in Area Code 980, private company employees (548,760 | 73.8%), not-for-profit organizations (52,284 | 7.0%), and local government employees (40,948 | 5.5%) make up the most common classes of employment.
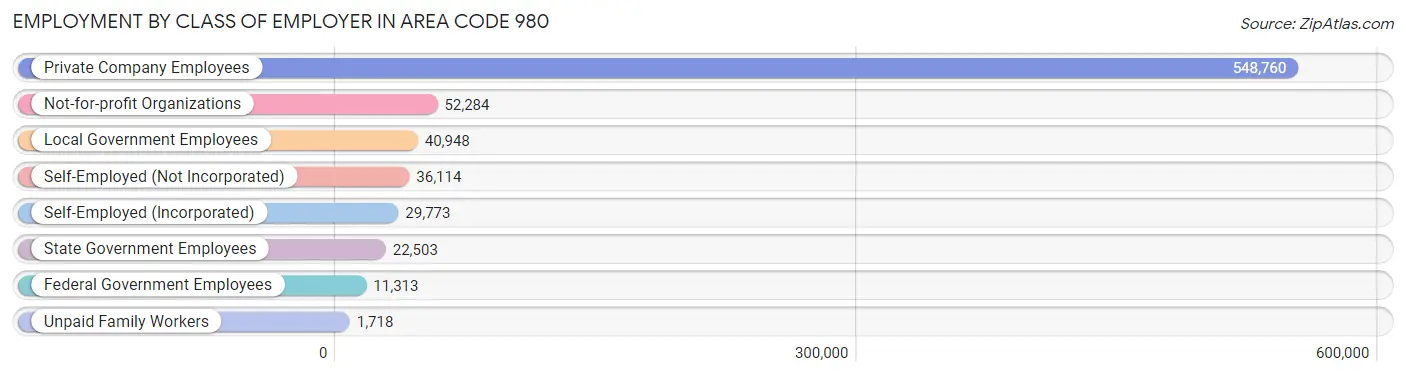
| Employer Class | # Employees | % Employees |
| Private Company Employees | 548,760 | 73.8% |
| Self-Employed (Incorporated) | 29,773 | 4.0% |
| Self-Employed (Not Incorporated) | 36,114 | 4.9% |
| Not-for-profit Organizations | 52,284 | 7.0% |
| Local Government Employees | 40,948 | 5.5% |
| State Government Employees | 22,503 | 3.0% |
| Federal Government Employees | 11,313 | 1.5% |
| Unpaid Family Workers | 1,718 | 0.2% |
| Total | 743,413 | 100.0% |
Employment Status by Age in Area Code 980
According to the labor force statistics for Area Code 980, out of the total population over 16 years of age (1,197,177), 64.8% or 776,130 individuals are in the labor force, with 4.7% or 36,478 of them unemployed. The age group with the highest labor force participation rate is 25 to 29 years, with 85.0% or 92,852 individuals in the labor force. Within the labor force, the 16 to 19 years age range has the highest percentage of unemployed individuals, with 785.6% or 274,779 of them being unemployed.
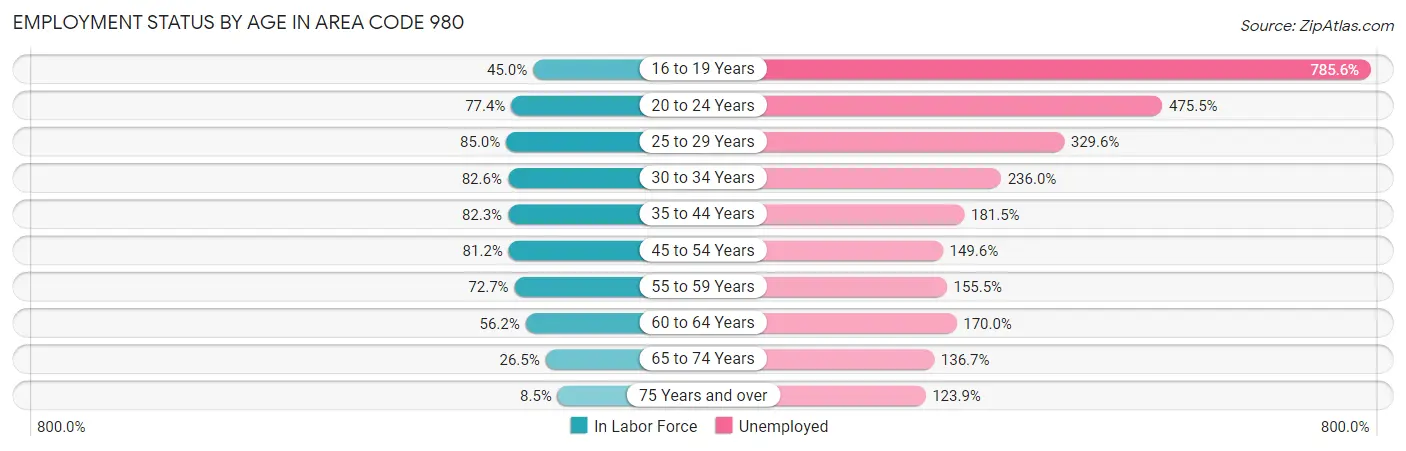
| Age Bracket | In Labor Force | Unemployed |
| 16 to 19 Years | 34,978 (45.0%) | 274,779 (785.6%) |
| 20 to 24 Years | 78,804 (77.4%) | 374,718 (475.5%) |
| 25 to 29 Years | 92,852 (85.0%) | 306,040 (329.6%) |
| 30 to 34 Years | 88,659 (82.6%) | 209,233 (236.0%) |
| 35 to 44 Years | 162,289 (82.3%) | 294,547 (181.5%) |
| 45 to 54 Years | 166,369 (81.2%) | 248,881 (149.6%) |
| 55 to 59 Years | 70,086 (72.7%) | 108,988 (155.5%) |
| 60 to 64 Years | 48,808 (56.2%) | 82,979 (170.0%) |
| 65 to 74 Years | 34,188 (26.5%) | 46,731 (136.7%) |
| 75 Years and over | 7,323 (8.5%) | 9,074 (123.9%) |
| Total | 776,185 (64.8%) | 36,478 (4.7%) |
Employment Status by Educational Attainment in Area Code 980
According to labor force statistics for Area Code 980, 78.1% of individuals (626,446) out of the total population between 25 and 64 years of age (801,902) are in the labor force, with 193.8% or 1,214,052 of them being unemployed. The group with the highest labor force participation rate are those with the educational attainment of bachelor's degree or higher, with 87.3% or 269,261 individuals in the labor force. Within the labor force, individuals with less than high school education have the highest percentage of unemployment, with 358.6% or 165,985 of them being unemployed.
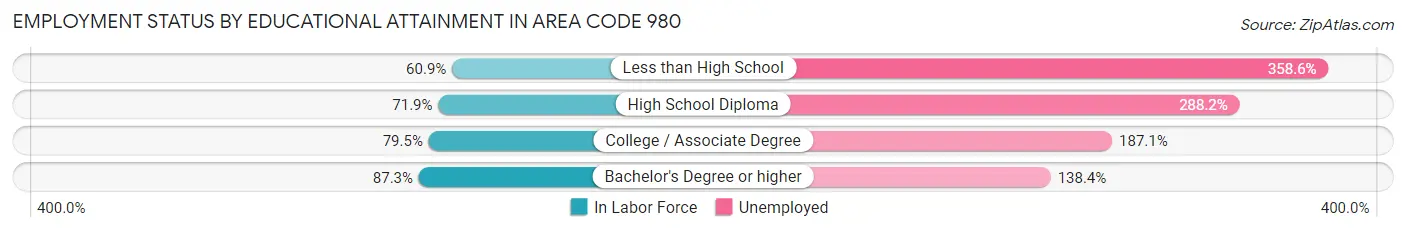
| Educational Attainment | In Labor Force | Unemployed |
| Less than High School | 46,289 (60.9%) | 272,507 (358.6%) |
| High School Diploma | 126,975 (71.9%) | 509,261 (288.2%) |
| College / Associate Degree | 191,504 (79.5%) | 450,686 (187.1%) |
| Bachelor's Degree or higher | 269,263 (87.3%) | 426,723 (138.4%) |
| Total | 626,409 (78.1%) | 1,554,086 (193.8%) |
Employment Occupations by Sex in Area Code 980
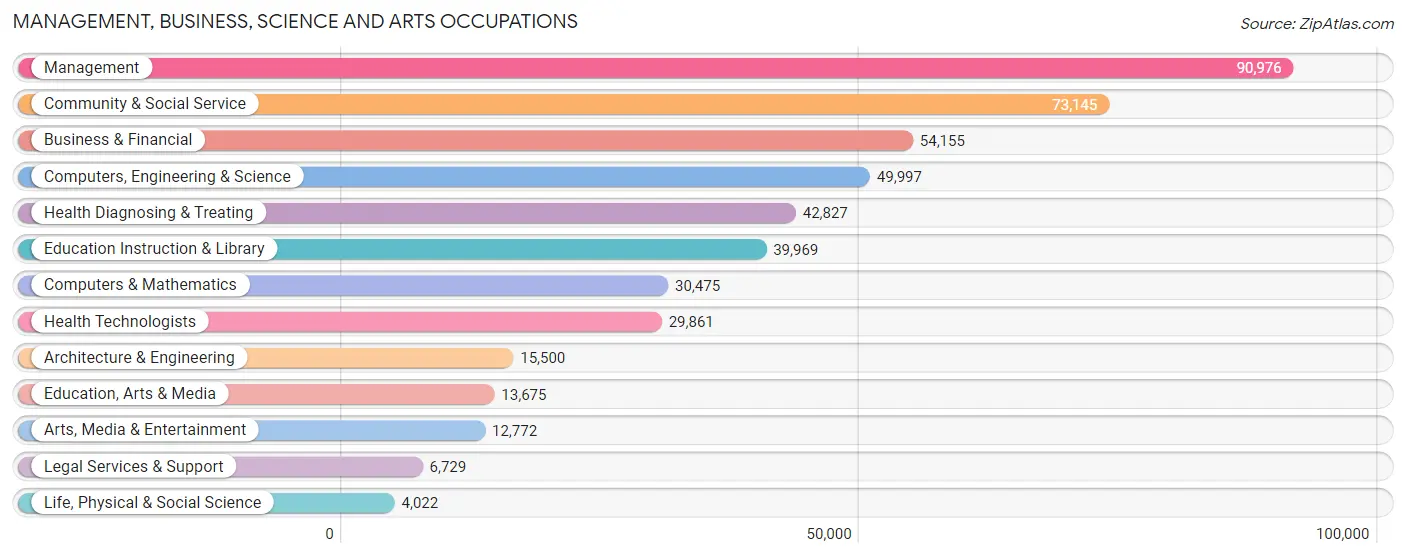
Management, Business, Science and Arts Occupations
The most common Management, Business, Science and Arts occupations in Area Code 980 are Management (90,976 | 12.0%), Community & Social Service (73,145 | 9.6%), Business & Financial (54,155 | 7.1%), Computers, Engineering & Science (49,997 | 6.6%), and Health Diagnosing & Treating (42,827 | 5.6%).
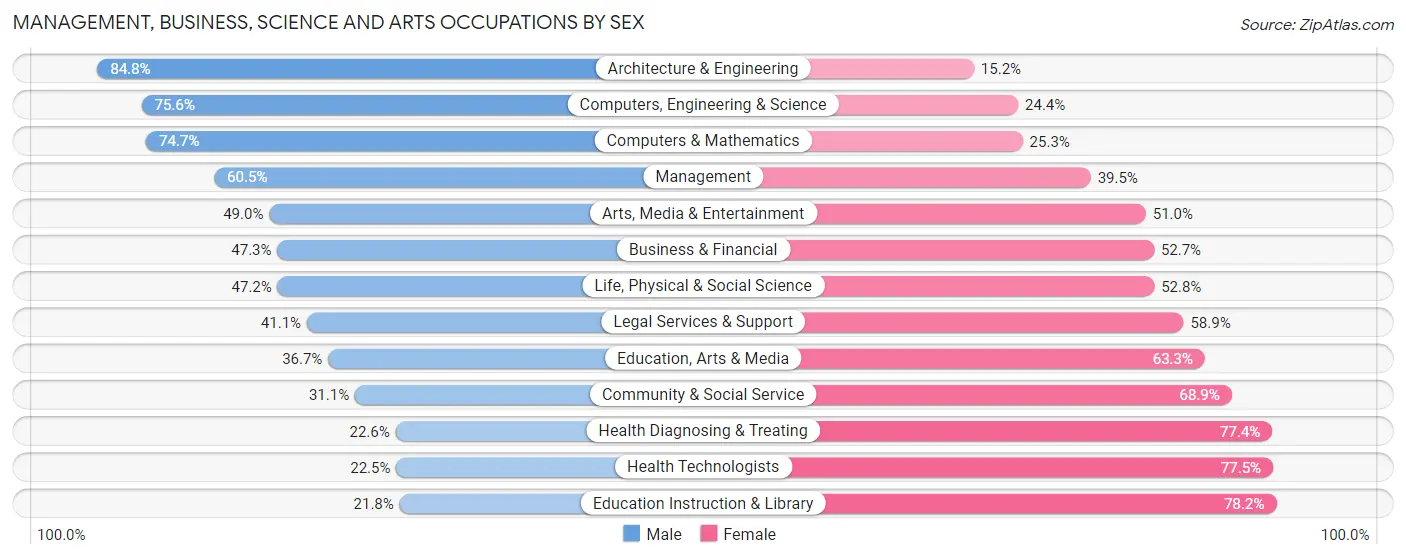
Management, Business, Science and Arts Occupations by Sex
Within the Management, Business, Science and Arts occupations in Area Code 980, the most male-oriented occupations are Architecture & Engineering (84.8%), Computers, Engineering & Science (75.6%), and Computers & Mathematics (74.7%), while the most female-oriented occupations are Education Instruction & Library (78.2%), Health Technologists (77.5%), and Health Diagnosing & Treating (77.4%).
| Occupation | Male | Female |
| Management | 55,003 (60.5%) | 35,973 (39.5%) |
| Business & Financial | 25,599 (47.3%) | 28,556 (52.7%) |
| Computers, Engineering & Science | 37,802 (75.6%) | 12,195 (24.4%) |
| Computers & Mathematics | 22,754 (74.7%) | 7,721 (25.3%) |
| Architecture & Engineering | 13,149 (84.8%) | 2,351 (15.2%) |
| Life, Physical & Social Science | 1,899 (47.2%) | 2,123 (52.8%) |
| Community & Social Service | 22,736 (31.1%) | 50,409 (68.9%) |
| Education, Arts & Media | 5,014 (36.7%) | 8,661 (63.3%) |
| Legal Services & Support | 2,766 (41.1%) | 3,963 (58.9%) |
| Education Instruction & Library | 8,701 (21.8%) | 31,268 (78.2%) |
| Arts, Media & Entertainment | 6,255 (49.0%) | 6,517 (51.0%) |
| Health Diagnosing & Treating | 9,687 (22.6%) | 33,140 (77.4%) |
| Health Technologists | 6,708 (22.5%) | 23,153 (77.5%) |
| Total (Category) | 150,827 (48.5%) | 160,273 (51.5%) |
| Total (Overall) | 401,973 (53.0%) | 357,111 (47.0%) |
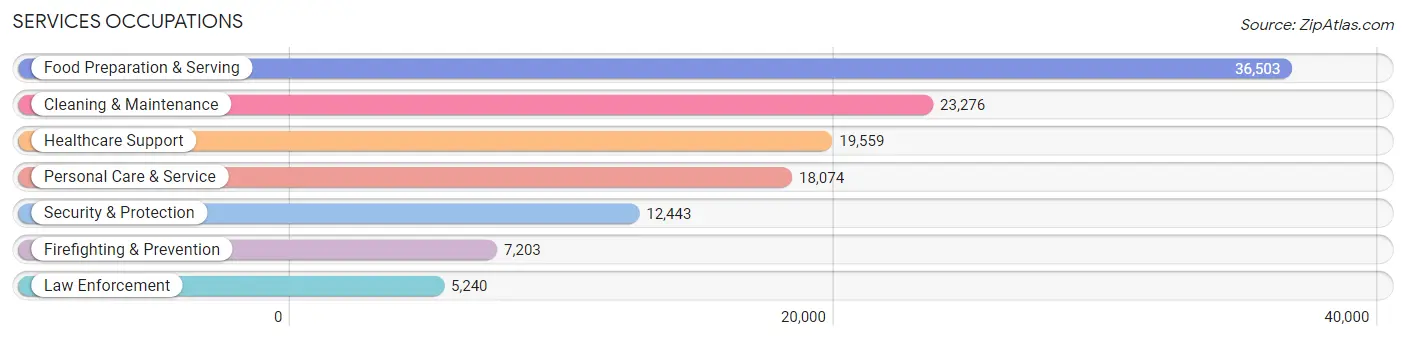
Services Occupations
The most common Services occupations in Area Code 980 are Food Preparation & Serving (36,503 | 4.8%), Cleaning & Maintenance (23,276 | 3.1%), Healthcare Support (19,559 | 2.6%), Personal Care & Service (18,074 | 2.4%), and Security & Protection (12,443 | 1.6%).
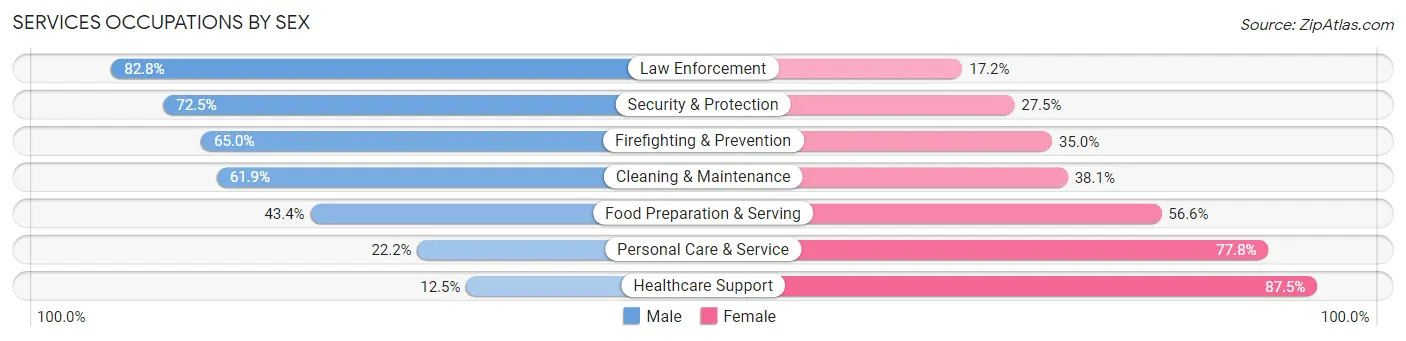
Services Occupations by Sex
Within the Services occupations in Area Code 980, the most male-oriented occupations are Law Enforcement (82.8%), Security & Protection (72.5%), and Firefighting & Prevention (65.0%), while the most female-oriented occupations are Healthcare Support (87.5%), Personal Care & Service (77.8%), and Food Preparation & Serving (56.6%).
| Occupation | Male | Female |
| Healthcare Support | 2,450 (12.5%) | 17,109 (87.5%) |
| Security & Protection | 9,025 (72.5%) | 3,418 (27.5%) |
| Firefighting & Prevention | 4,685 (65.0%) | 2,518 (35.0%) |
| Law Enforcement | 4,340 (82.8%) | 900 (17.2%) |
| Food Preparation & Serving | 15,843 (43.4%) | 20,660 (56.6%) |
| Cleaning & Maintenance | 14,416 (61.9%) | 8,860 (38.1%) |
| Personal Care & Service | 4,014 (22.2%) | 14,060 (77.8%) |
| Total (Category) | 45,748 (41.6%) | 64,107 (58.4%) |
| Total (Overall) | 401,973 (53.0%) | 357,111 (47.0%) |
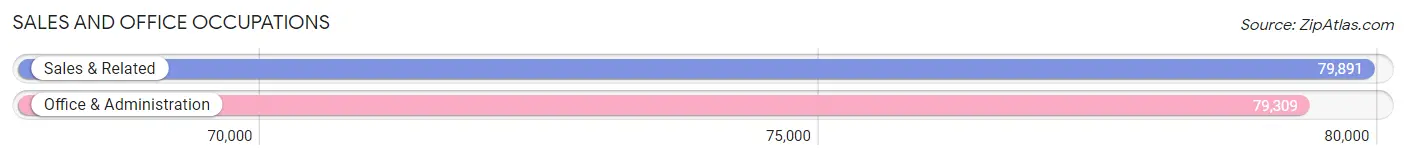
Sales and Office Occupations
The most common Sales and Office occupations in Area Code 980 are Sales & Related (79,891 | 10.5%), and Office & Administration (79,309 | 10.4%).
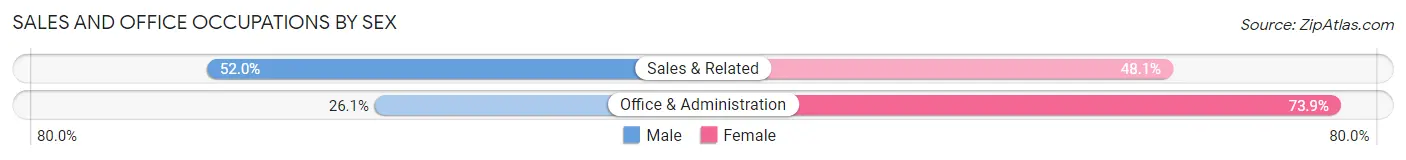
Sales and Office Occupations by Sex
| Occupation | Male | Female |
| Sales & Related | 41,503 (51.9%) | 38,388 (48.0%) |
| Office & Administration | 20,713 (26.1%) | 58,596 (73.9%) |
| Total (Category) | 62,216 (39.1%) | 96,984 (60.9%) |
| Total (Overall) | 401,973 (53.0%) | 357,111 (47.0%) |
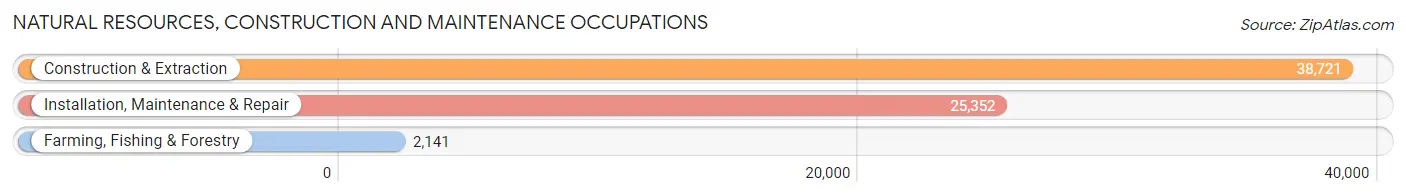
Natural Resources, Construction and Maintenance Occupations
The most common Natural Resources, Construction and Maintenance occupations in Area Code 980 are Construction & Extraction (38,721 | 5.1%), Installation, Maintenance & Repair (25,352 | 3.3%), and Farming, Fishing & Forestry (2,141 | 0.3%).
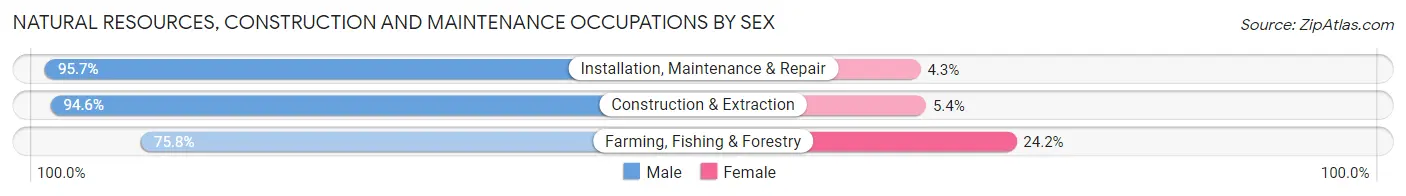
Natural Resources, Construction and Maintenance Occupations by Sex
| Occupation | Male | Female |
| Farming, Fishing & Forestry | 1,622 (75.8%) | 519 (24.2%) |
| Construction & Extraction | 36,622 (94.6%) | 2,099 (5.4%) |
| Installation, Maintenance & Repair | 24,266 (95.7%) | 1,086 (4.3%) |
| Total (Category) | 62,510 (94.4%) | 3,704 (5.6%) |
| Total (Overall) | 401,973 (53.0%) | 357,111 (47.0%) |
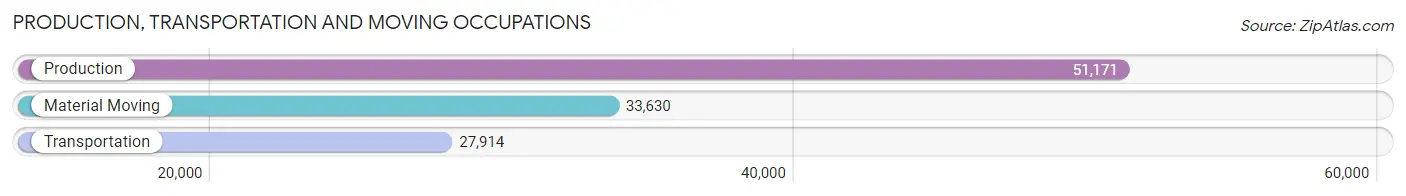
Production, Transportation and Moving Occupations
The most common Production, Transportation and Moving occupations in Area Code 980 are Production (51,171 | 6.7%), Material Moving (33,630 | 4.4%), and Transportation (27,914 | 3.7%).
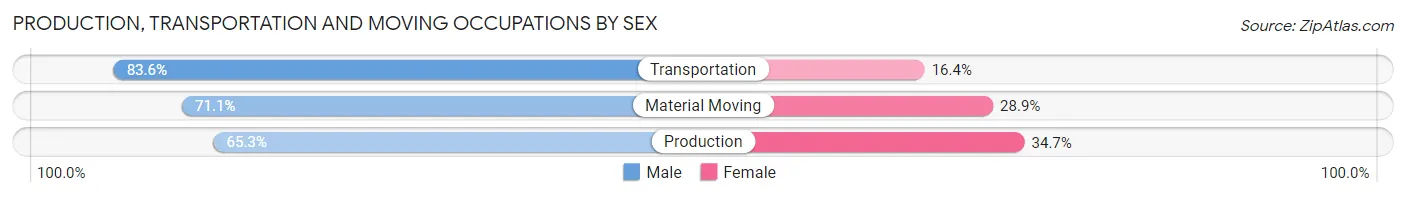
Production, Transportation and Moving Occupations by Sex
| Occupation | Male | Female |
| Production | 33,420 (65.3%) | 17,751 (34.7%) |
| Transportation | 23,348 (83.6%) | 4,566 (16.4%) |
| Material Moving | 23,904 (71.1%) | 9,726 (28.9%) |
| Total (Category) | 80,672 (71.6%) | 32,043 (28.4%) |
| Total (Overall) | 401,973 (53.0%) | 357,111 (47.0%) |
Employment Industries by Sex in Area Code 980
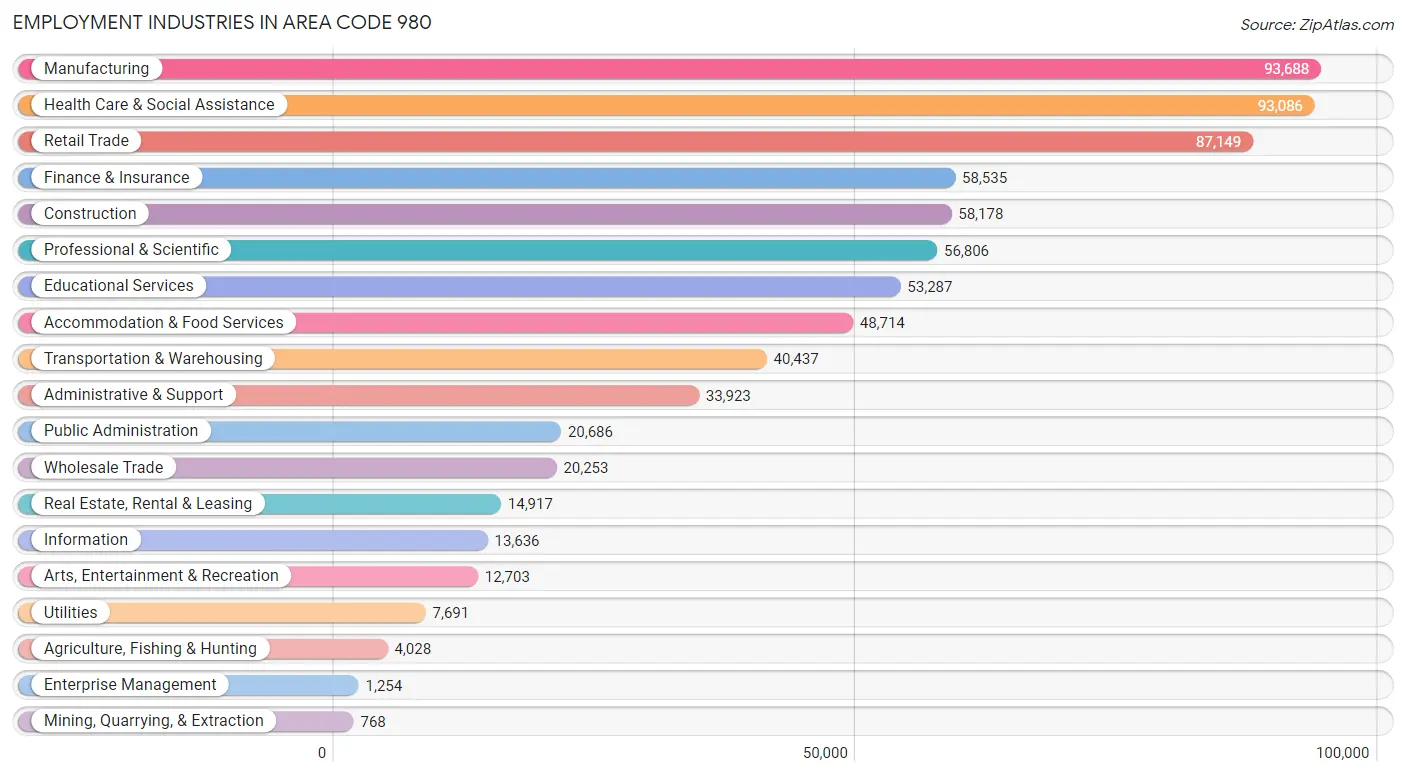
Employment Industries in Area Code 980
The major employment industries in Area Code 980 include Manufacturing (93,688 | 12.3%), Health Care & Social Assistance (93,086 | 12.3%), Retail Trade (87,149 | 11.5%), Finance & Insurance (58,535 | 7.7%), and Construction (58,178 | 7.7%).
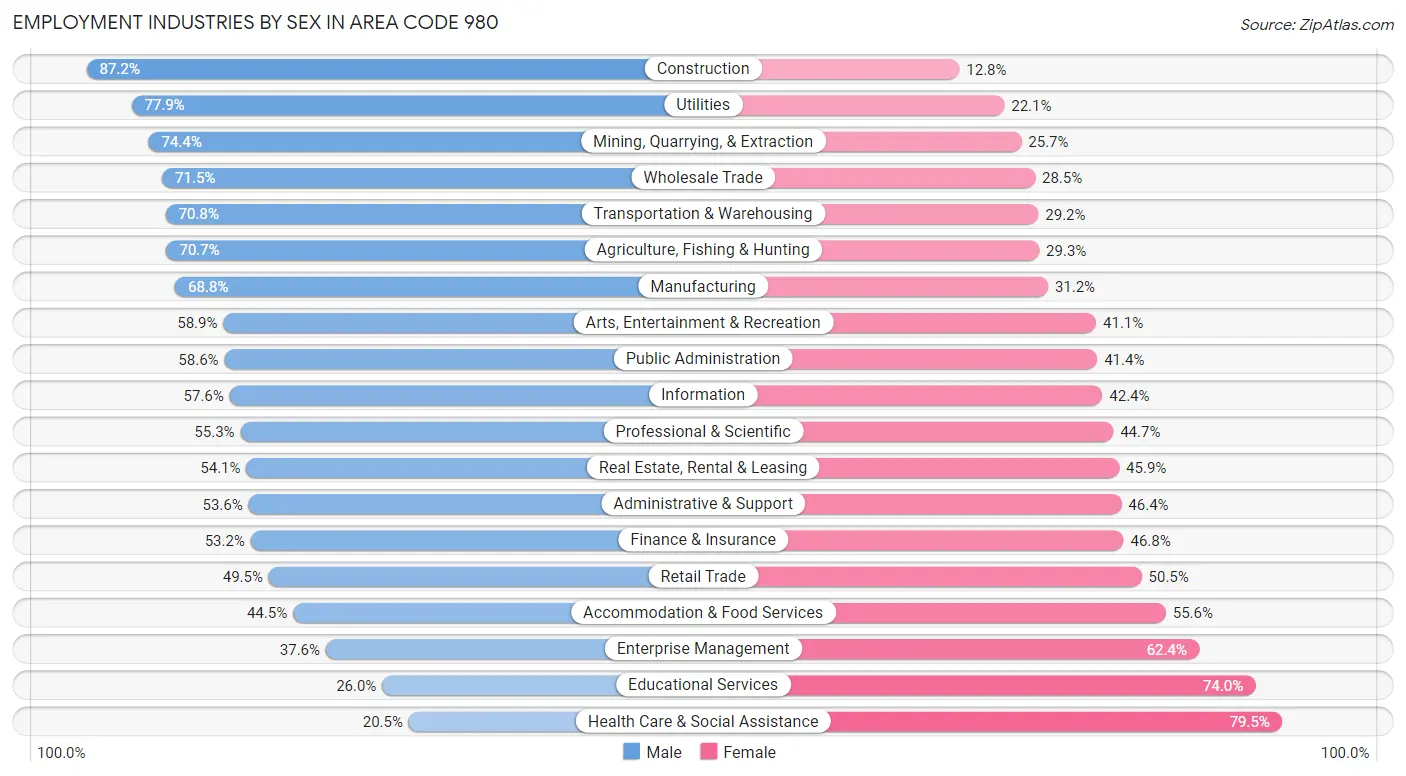
Employment Industries by Sex in Area Code 980
The Area Code 980 industries that see more men than women are Construction (87.2%), Utilities (77.9%), and Mining, Quarrying, & Extraction (74.4%), whereas the industries that tend to have a higher number of women are Health Care & Social Assistance (79.5%), Educational Services (74.0%), and Enterprise Management (62.4%).
| Industry | Male | Female |
| Agriculture, Fishing & Hunting | 2,846 (70.7%) | 1,182 (29.3%) |
| Mining, Quarrying, & Extraction | 571 (74.4%) | 197 (25.7%) |
| Construction | 50,718 (87.2%) | 7,460 (12.8%) |
| Manufacturing | 64,491 (68.8%) | 29,197 (31.2%) |
| Wholesale Trade | 14,484 (71.5%) | 5,769 (28.5%) |
| Retail Trade | 43,108 (49.5%) | 44,041 (50.5%) |
| Transportation & Warehousing | 28,641 (70.8%) | 11,796 (29.2%) |
| Utilities | 5,990 (77.9%) | 1,701 (22.1%) |
| Information | 7,852 (57.6%) | 5,784 (42.4%) |
| Finance & Insurance | 31,140 (53.2%) | 27,395 (46.8%) |
| Real Estate, Rental & Leasing | 8,070 (54.1%) | 6,847 (45.9%) |
| Professional & Scientific | 31,432 (55.3%) | 25,374 (44.7%) |
| Enterprise Management | 472 (37.6%) | 782 (62.4%) |
| Administrative & Support | 18,197 (53.6%) | 15,726 (46.4%) |
| Educational Services | 13,844 (26.0%) | 39,443 (74.0%) |
| Health Care & Social Assistance | 19,051 (20.5%) | 74,035 (79.5%) |
| Arts, Entertainment & Recreation | 7,478 (58.9%) | 5,225 (41.1%) |
| Accommodation & Food Services | 21,653 (44.5%) | 27,061 (55.5%) |
| Public Administration | 12,130 (58.6%) | 8,556 (41.4%) |
| Total | 401,973 (53.0%) | 357,111 (47.0%) |
Education in Area Code 980
School Enrollment in Area Code 980
The most common levels of schooling among the 352,110 students in Area Code 980 are high school (80,033 | 22.7%), middle school (78,272 | 22.2%), and elementary school (71,629 | 20.3%).
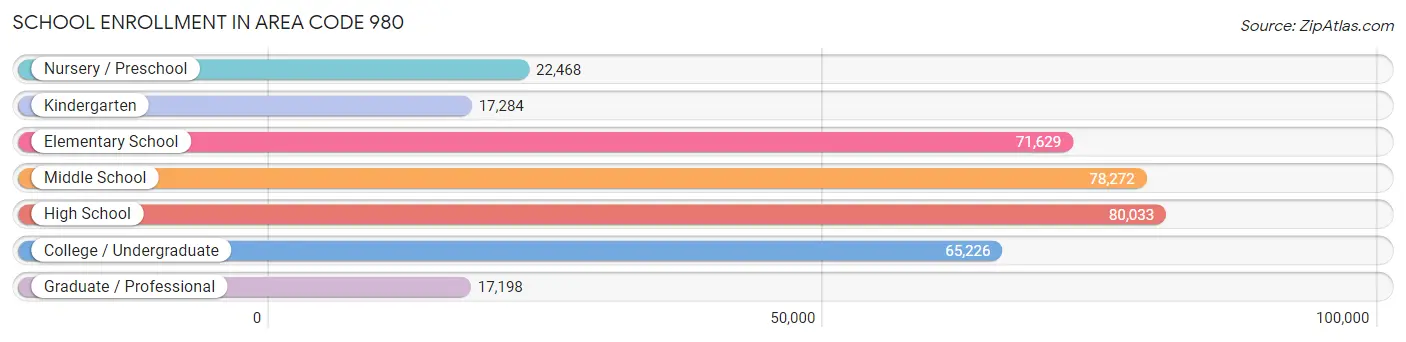
| School Level | # Students | % Students |
| Nursery / Preschool | 22,468 | 6.4% |
| Kindergarten | 17,284 | 4.9% |
| Elementary School | 71,629 | 20.3% |
| Middle School | 78,272 | 22.2% |
| High School | 80,033 | 22.7% |
| College / Undergraduate | 65,226 | 18.5% |
| Graduate / Professional | 17,198 | 4.9% |
| Total | 352,110 | 100.0% |
School Enrollment by Age by Funding Source in Area Code 980
Out of a total of 352,110 students who are enrolled in schools in Area Code 980, 60,269 (17.1%) attend a private institution, while the remaining 291,841 (82.9%) are enrolled in public schools. The age group of 3 to 4 year olds has the highest likelihood of being enrolled in private schools, with 9,107 (53.1% in the age bracket) enrolled. Conversely, the age group of 15 to 17 year olds has the lowest likelihood of being enrolled in a private school, with 52,024 (88.6% in the age bracket) attending a public institution.
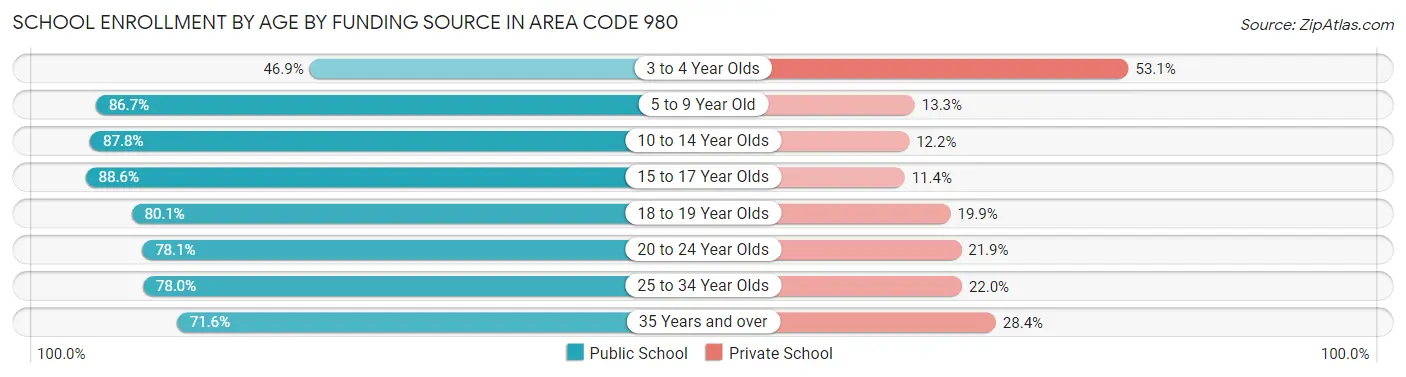
| Age Bracket | Public School | Private School |
| 3 to 4 Year Olds | 8,058 (46.9%) | 9,107 (53.1%) |
| 5 to 9 Year Old | 73,136 (86.7%) | 11,180 (13.3%) |
| 10 to 14 Year Olds | 85,329 (87.8%) | 11,867 (12.2%) |
| 15 to 17 Year Olds | 52,024 (88.6%) | 6,671 (11.4%) |
| 18 to 19 Year Olds | 19,884 (80.1%) | 4,942 (19.9%) |
| 20 to 24 Year Olds | 25,714 (78.1%) | 7,214 (21.9%) |
| 25 to 34 Year Olds | 14,532 (78.0%) | 4,107 (22.0%) |
| 35 Years and over | 13,143 (71.6%) | 5,202 (28.4%) |
| Total | 291,841 (82.9%) | 60,269 (17.1%) |
Educational Attainment by Field of Study in Area Code 980
Business (98,140 | 24.9%), education (40,081 | 10.2%), science & technology (35,184 | 8.9%), engineering (28,849 | 7.3%), and social sciences (28,360 | 7.2%) are the most common fields of study among 394,388 individuals in Area Code 980 who have obtained a bachelor's degree or higher.
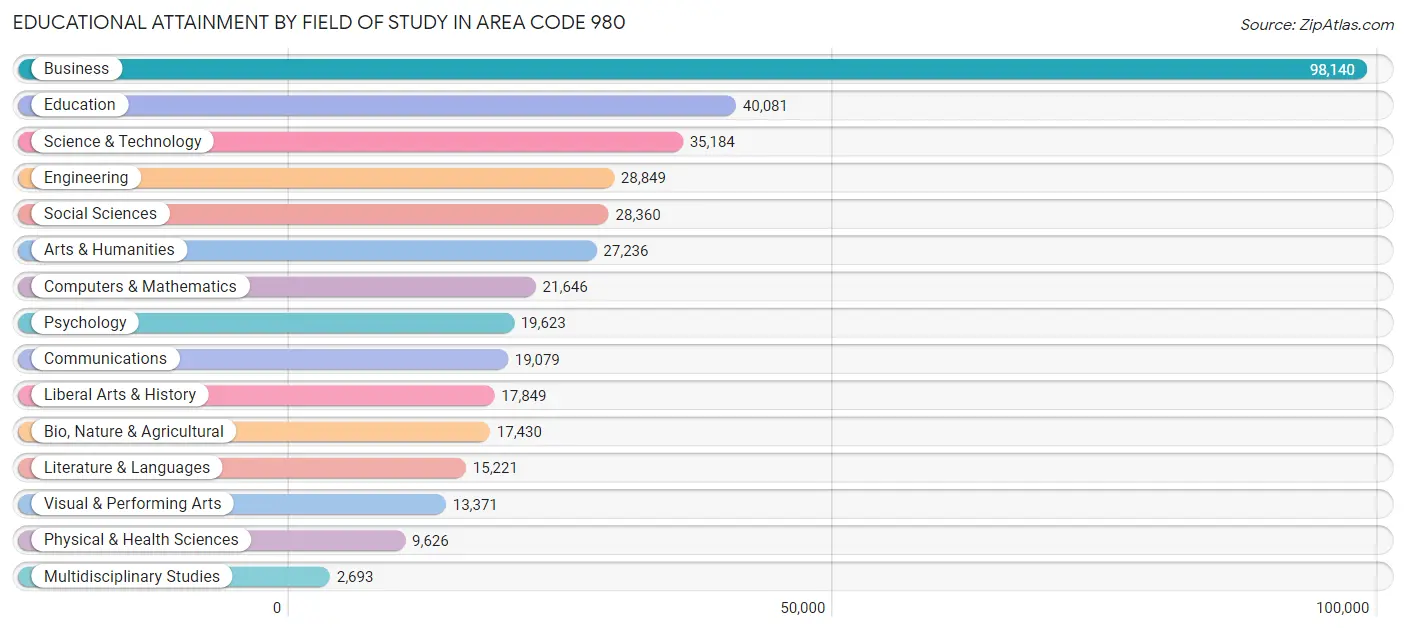
| Field of Study | # Graduates | % Graduates |
| Computers & Mathematics | 21,646 | 5.5% |
| Bio, Nature & Agricultural | 17,430 | 4.4% |
| Physical & Health Sciences | 9,626 | 2.4% |
| Psychology | 19,623 | 5.0% |
| Social Sciences | 28,360 | 7.2% |
| Engineering | 28,849 | 7.3% |
| Multidisciplinary Studies | 2,693 | 0.7% |
| Science & Technology | 35,184 | 8.9% |
| Business | 98,140 | 24.9% |
| Education | 40,081 | 10.2% |
| Literature & Languages | 15,221 | 3.9% |
| Liberal Arts & History | 17,849 | 4.5% |
| Visual & Performing Arts | 13,371 | 3.4% |
| Communications | 19,079 | 4.8% |
| Arts & Humanities | 27,236 | 6.9% |
| Total | 394,388 | 100.0% |
Transportation & Commute in Area Code 980
Vehicle Availability by Sex in Area Code 980
The most prevalent vehicle ownership categories in Area Code 980 are males with 2 vehicles (164,046, accounting for 41.5%) and females with 2 vehicles (136,641, making up 47.4%).
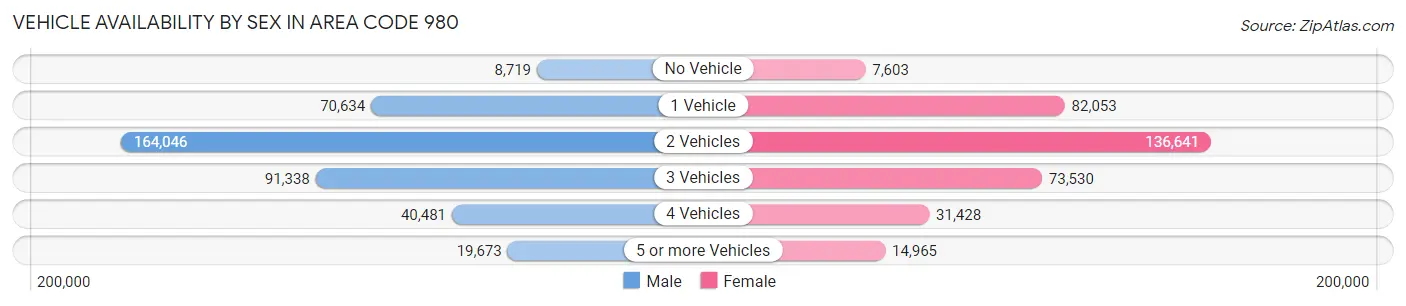
| Vehicles Available | Male | Female |
| No Vehicle | 8,719 (2.2%) | 7,603 (2.2%) |
| 1 Vehicle | 70,634 (17.9%) | 82,053 (23.7%) |
| 2 Vehicles | 164,046 (41.5%) | 136,641 (39.5%) |
| 3 Vehicles | 91,338 (23.1%) | 73,530 (21.2%) |
| 4 Vehicles | 40,481 (10.2%) | 31,428 (9.1%) |
| 5 or more Vehicles | 19,673 (5.0%) | 14,965 (4.3%) |
| Total | 394,891 (100.0%) | 346,220 (100.0%) |
Commute Time in Area Code 980
The most frequently occuring commute durations in Area Code 980 are 15 to 19 minutes (105,162 commuters, 16.6%), 20 to 24 minutes (93,757 commuters, 14.8%), and 30 to 34 minutes (89,298 commuters, 14.1%).
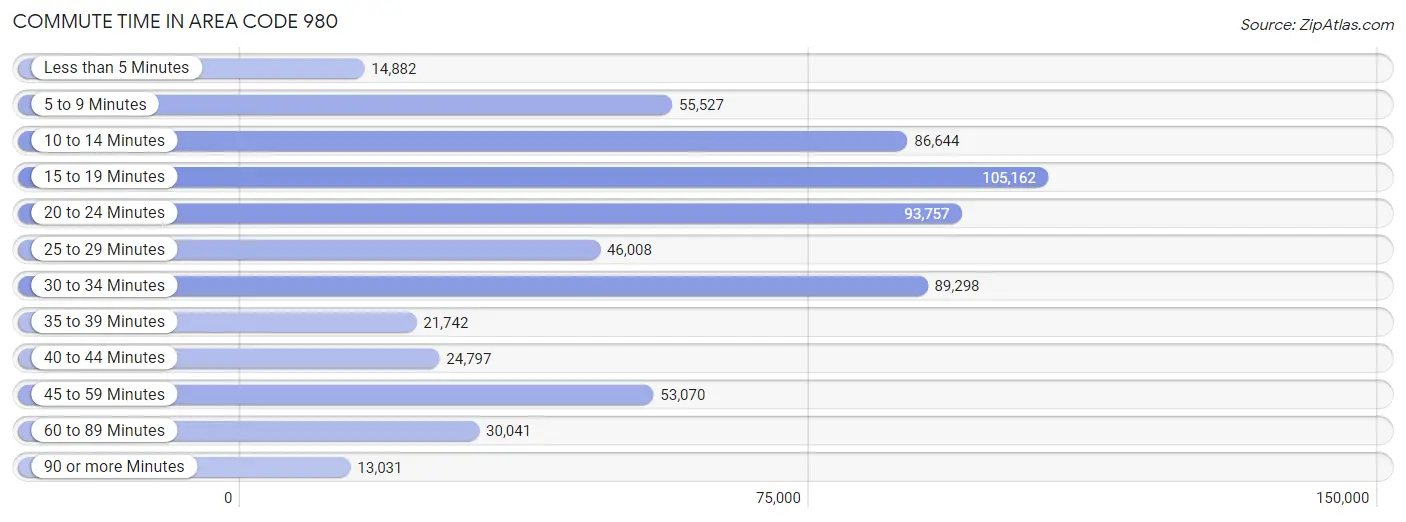
| Commute Time | # Commuters | % Commuters |
| Less than 5 Minutes | 14,882 | 2.4% |
| 5 to 9 Minutes | 55,527 | 8.8% |
| 10 to 14 Minutes | 86,644 | 13.7% |
| 15 to 19 Minutes | 105,162 | 16.6% |
| 20 to 24 Minutes | 93,757 | 14.8% |
| 25 to 29 Minutes | 46,008 | 7.3% |
| 30 to 34 Minutes | 89,298 | 14.1% |
| 35 to 39 Minutes | 21,742 | 3.4% |
| 40 to 44 Minutes | 24,797 | 3.9% |
| 45 to 59 Minutes | 53,070 | 8.4% |
| 60 to 89 Minutes | 30,041 | 4.7% |
| 90 or more Minutes | 13,031 | 2.1% |
Commute Time by Sex in Area Code 980
The most common commute times in Area Code 980 are 15 to 19 minutes (52,739 commuters, 15.5%) for males and 15 to 19 minutes (52,423 commuters, 17.8%) for females.
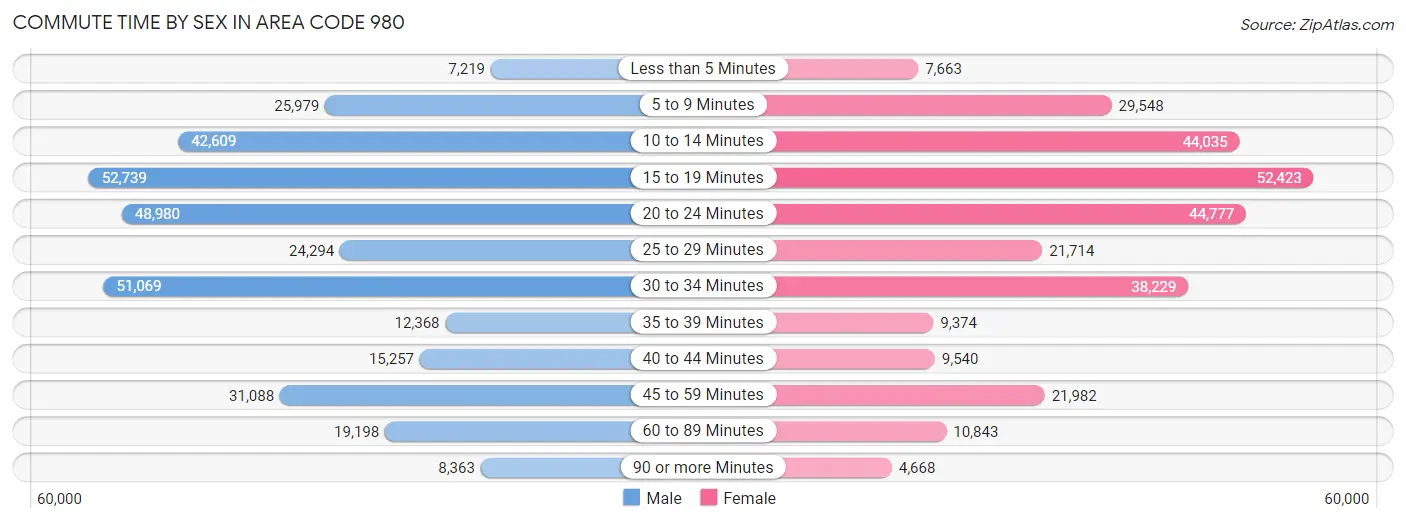
| Commute Time | Male | Female |
| Less than 5 Minutes | 7,219 (2.1%) | 7,663 (2.6%) |
| 5 to 9 Minutes | 25,979 (7.7%) | 29,548 (10.0%) |
| 10 to 14 Minutes | 42,609 (12.6%) | 44,035 (14.9%) |
| 15 to 19 Minutes | 52,739 (15.5%) | 52,423 (17.8%) |
| 20 to 24 Minutes | 48,980 (14.4%) | 44,777 (15.2%) |
| 25 to 29 Minutes | 24,294 (7.2%) | 21,714 (7.4%) |
| 30 to 34 Minutes | 51,069 (15.1%) | 38,229 (13.0%) |
| 35 to 39 Minutes | 12,368 (3.6%) | 9,374 (3.2%) |
| 40 to 44 Minutes | 15,257 (4.5%) | 9,540 (3.2%) |
| 45 to 59 Minutes | 31,088 (9.2%) | 21,982 (7.5%) |
| 60 to 89 Minutes | 19,198 (5.7%) | 10,843 (3.7%) |
| 90 or more Minutes | 8,363 (2.5%) | 4,668 (1.6%) |
Time of Departure to Work by Sex in Area Code 980
The most frequent times of departure to work in Area Code 980 are 7:00 AM to 7:29 AM (50,198, 14.8%) for males and 7:30 AM to 7:59 AM (44,511, 15.1%) for females.
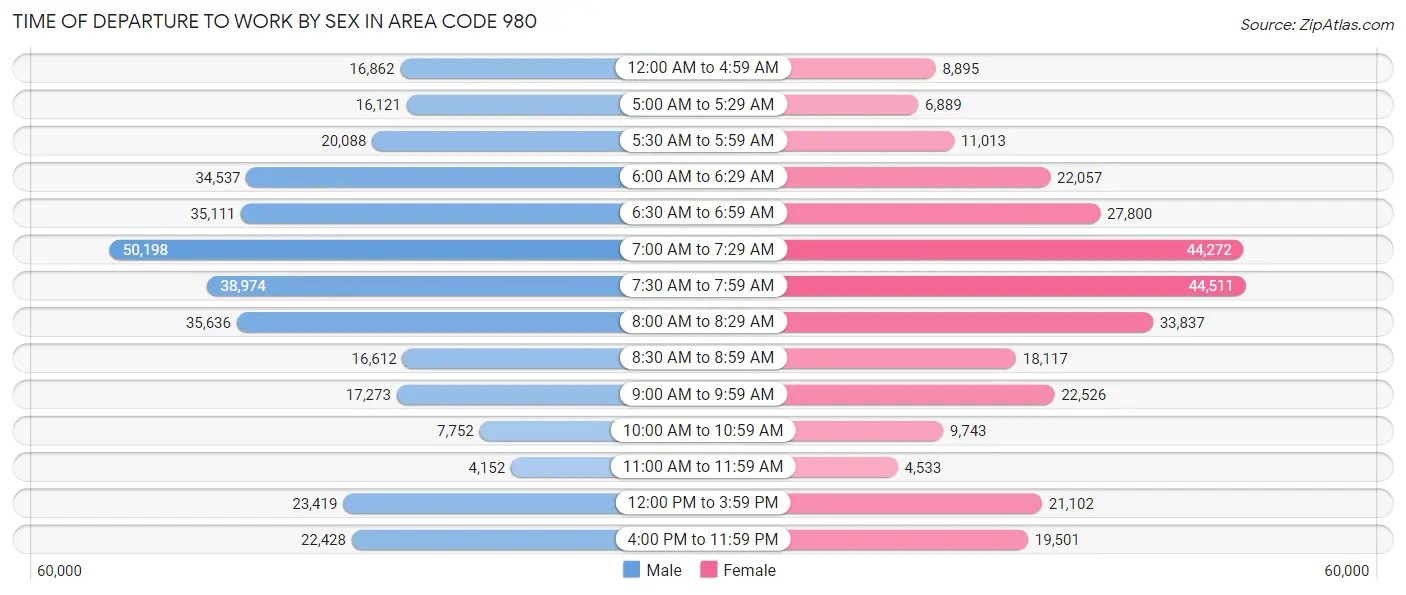
| Time of Departure | Male | Female |
| 12:00 AM to 4:59 AM | 16,862 (5.0%) | 8,895 (3.0%) |
| 5:00 AM to 5:29 AM | 16,121 (4.8%) | 6,889 (2.3%) |
| 5:30 AM to 5:59 AM | 20,088 (5.9%) | 11,013 (3.7%) |
| 6:00 AM to 6:29 AM | 34,537 (10.2%) | 22,057 (7.5%) |
| 6:30 AM to 6:59 AM | 35,111 (10.3%) | 27,800 (9.4%) |
| 7:00 AM to 7:29 AM | 50,198 (14.8%) | 44,272 (15.0%) |
| 7:30 AM to 7:59 AM | 38,974 (11.5%) | 44,511 (15.1%) |
| 8:00 AM to 8:29 AM | 35,636 (10.5%) | 33,837 (11.5%) |
| 8:30 AM to 8:59 AM | 16,612 (4.9%) | 18,117 (6.1%) |
| 9:00 AM to 9:59 AM | 17,273 (5.1%) | 22,526 (7.6%) |
| 10:00 AM to 10:59 AM | 7,752 (2.3%) | 9,743 (3.3%) |
| 11:00 AM to 11:59 AM | 4,152 (1.2%) | 4,533 (1.5%) |
| 12:00 PM to 3:59 PM | 23,419 (6.9%) | 21,102 (7.2%) |
| 4:00 PM to 11:59 PM | 22,428 (6.6%) | 19,501 (6.6%) |
| Total | 339,163 (100.0%) | 294,796 (100.0%) |
Housing Occupancy in Area Code 980
Occupancy by Ownership in Area Code 980
Of the total 578,916 dwellings in Area Code 980, owner-occupied units account for 370,254 (64.0%), while renter-occupied units make up 208,662 (36.0%).
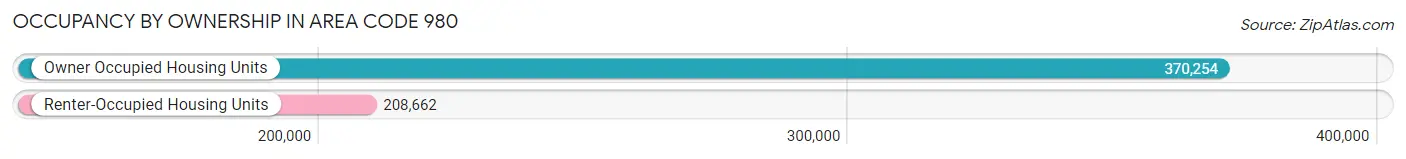
| Occupancy | # Housing Units | % Housing Units |
| Owner Occupied Housing Units | 370,254 | 64.0% |
| Renter-Occupied Housing Units | 208,662 | 36.0% |
| Total Occupied Housing Units | 578,916 | 100.0% |
Occupancy by Household Size in Area Code 980
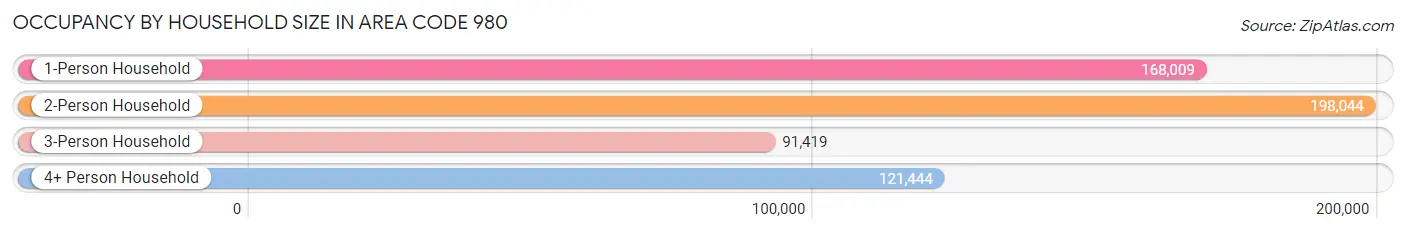
| Household Size | # Housing Units | % Housing Units |
| 1-Person Household | 168,009 | 29.0% |
| 2-Person Household | 198,044 | 34.2% |
| 3-Person Household | 91,419 | 15.8% |
| 4+ Person Household | 121,444 | 21.0% |
| Total Housing Units | 578,916 | 100.0% |
Occupancy by Ownership by Household Size in Area Code 980
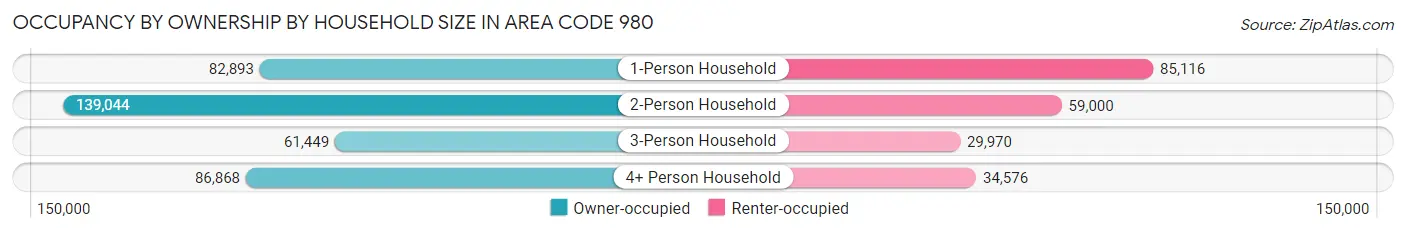
| Household Size | Owner-occupied | Renter-occupied |
| 1-Person Household | 82,893 (49.3%) | 85,116 (50.7%) |
| 2-Person Household | 139,044 (70.2%) | 59,000 (29.8%) |
| 3-Person Household | 61,449 (67.2%) | 29,970 (32.8%) |
| 4+ Person Household | 86,868 (71.5%) | 34,576 (28.5%) |
| Total Housing Units | 370,254 (64.0%) | 208,662 (36.0%) |
Occupancy by Educational Attainment in Area Code 980
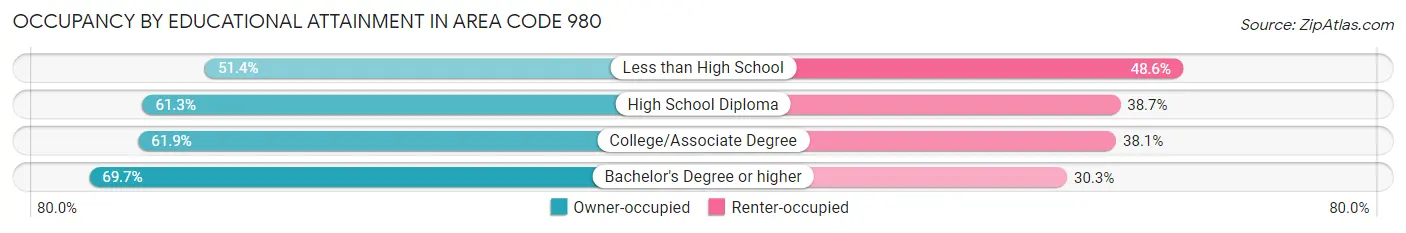
| Household Size | Owner-occupied | Renter-occupied |
| Less than High School | 24,847 (51.4%) | 23,521 (48.6%) |
| High School Diploma | 73,968 (61.3%) | 46,742 (38.7%) |
| College/Associate Degree | 114,062 (61.9%) | 70,087 (38.1%) |
| Bachelor's Degree or higher | 157,377 (69.7%) | 68,312 (30.3%) |
Occupancy by Age of Householder in Area Code 980
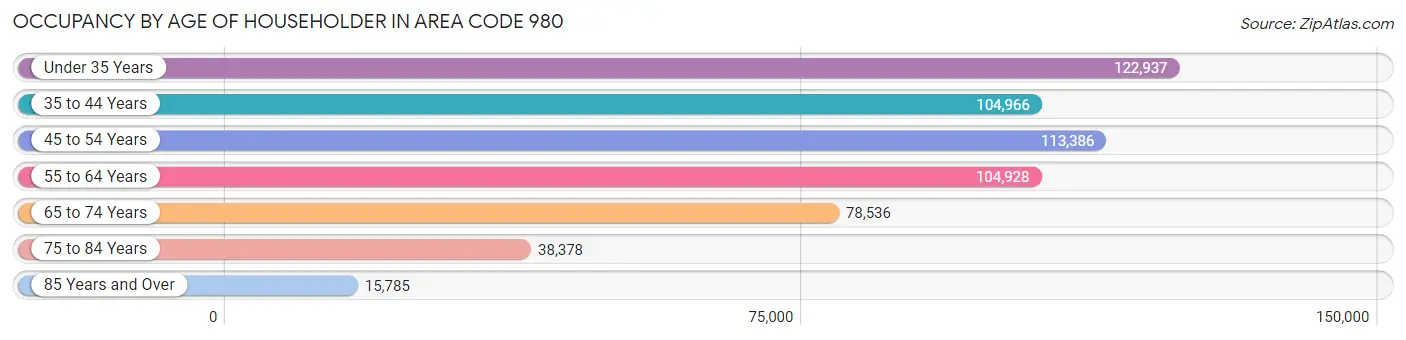
| Age Bracket | # Households | % Households |
| Under 35 Years | 122,937 | 21.2% |
| 35 to 44 Years | 104,966 | 18.1% |
| 45 to 54 Years | 113,386 | 19.6% |
| 55 to 64 Years | 104,928 | 18.1% |
| 65 to 74 Years | 78,536 | 13.6% |
| 75 to 84 Years | 38,378 | 6.6% |
| 85 Years and Over | 15,785 | 2.7% |
| Total | 578,916 | 100.0% |
Housing Finances in Area Code 980
Median Income by Occupancy in Area Code 980
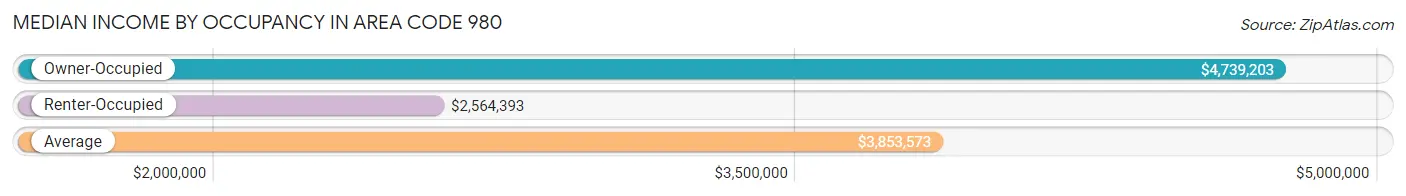
| Occupancy Type | # Households | Median Income |
| Owner-Occupied | 370,254 (64.0%) | $4,739,203 |
| Renter-Occupied | 208,662 (36.0%) | $2,564,393 |
| Average | 578,916 (100.0%) | $3,853,573 |
Occupancy by Householder Income Bracket in Area Code 980
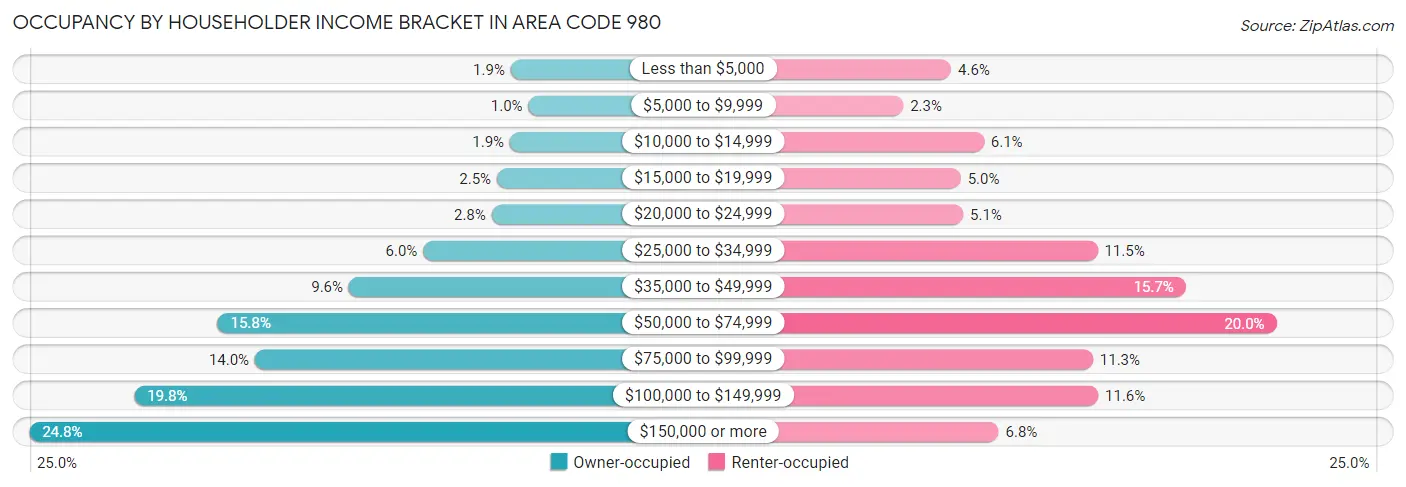
| Income Bracket | Owner-occupied | Renter-occupied |
| Less than $5,000 | 6,853 (1.8%) | 9,499 (4.5%) |
| $5,000 to $9,999 | 3,758 (1.0%) | 4,727 (2.3%) |
| $10,000 to $14,999 | 6,985 (1.9%) | 12,754 (6.1%) |
| $15,000 to $19,999 | 9,295 (2.5%) | 10,446 (5.0%) |
| $20,000 to $24,999 | 10,205 (2.8%) | 10,686 (5.1%) |
| $25,000 to $34,999 | 22,277 (6.0%) | 24,046 (11.5%) |
| $35,000 to $49,999 | 35,412 (9.6%) | 32,801 (15.7%) |
| $50,000 to $74,999 | 58,542 (15.8%) | 41,809 (20.0%) |
| $75,000 to $99,999 | 51,956 (14.0%) | 23,575 (11.3%) |
| $100,000 to $149,999 | 73,223 (19.8%) | 24,104 (11.6%) |
| $150,000 or more | 91,748 (24.8%) | 14,215 (6.8%) |
| Total | 370,254 (100.0%) | 208,662 (100.0%) |
Monthly Housing Cost Tiers in Area Code 980
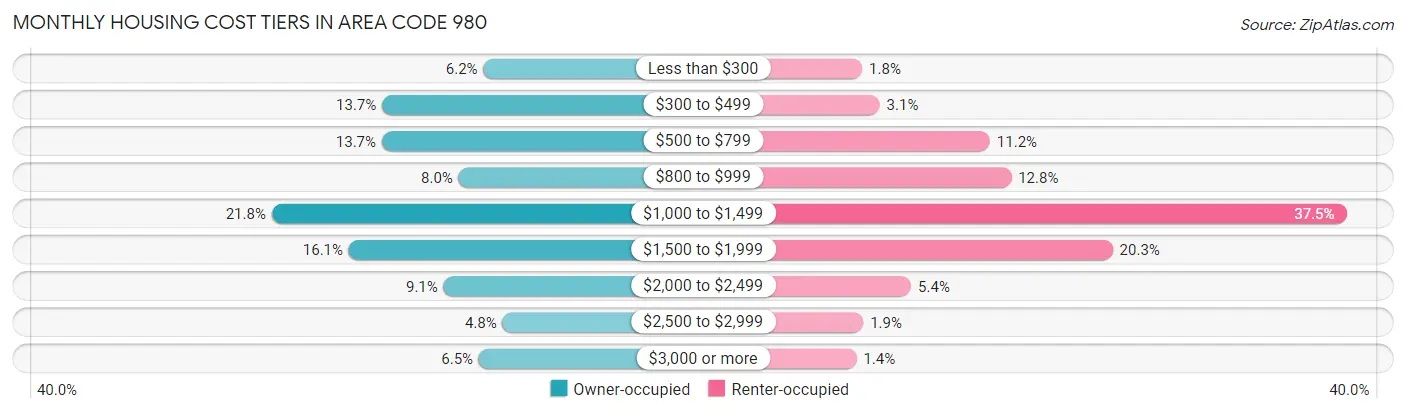
| Monthly Cost | Owner-occupied | Renter-occupied |
| Less than $300 | 22,993 (6.2%) | 3,801 (1.8%) |
| $300 to $499 | 50,613 (13.7%) | 6,483 (3.1%) |
| $500 to $799 | 50,696 (13.7%) | 23,442 (11.2%) |
| $800 to $999 | 29,741 (8.0%) | 26,713 (12.8%) |
| $1,000 to $1,499 | 80,709 (21.8%) | 78,201 (37.5%) |
| $1,500 to $1,999 | 59,686 (16.1%) | 42,295 (20.3%) |
| $2,000 to $2,499 | 33,840 (9.1%) | 11,335 (5.4%) |
| $2,500 to $2,999 | 17,762 (4.8%) | 3,964 (1.9%) |
| $3,000 or more | 24,214 (6.5%) | 2,918 (1.4%) |
| Total | 370,254 (100.0%) | 208,662 (100.0%) |
Physical Housing Characteristics in Area Code 980
Housing Structures in Area Code 980
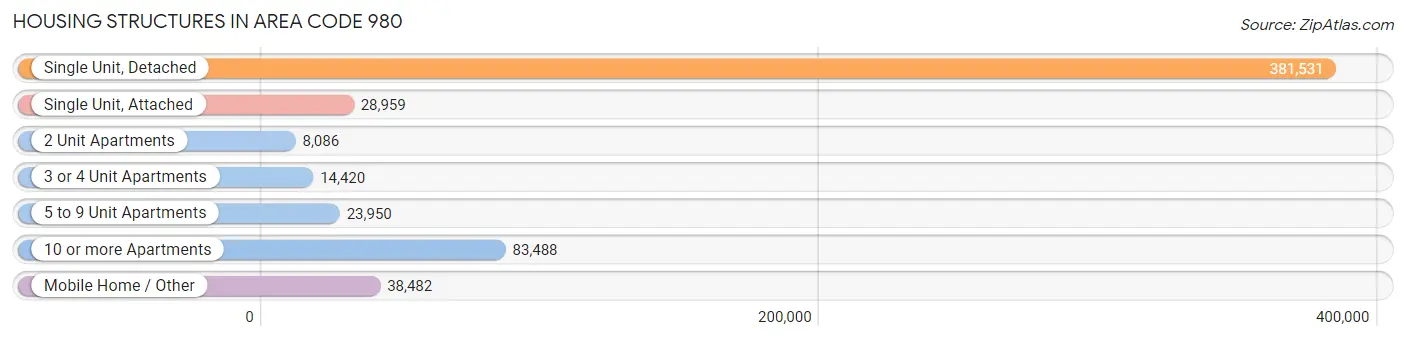
| Structure Type | # Housing Units | % Housing Units |
| Single Unit, Detached | 381,531 | 65.9% |
| Single Unit, Attached | 28,959 | 5.0% |
| 2 Unit Apartments | 8,086 | 1.4% |
| 3 or 4 Unit Apartments | 14,420 | 2.5% |
| 5 to 9 Unit Apartments | 23,950 | 4.1% |
| 10 or more Apartments | 83,488 | 14.4% |
| Mobile Home / Other | 38,482 | 6.7% |
| Total | 578,916 | 100.0% |
Housing Structures by Occupancy in Area Code 980
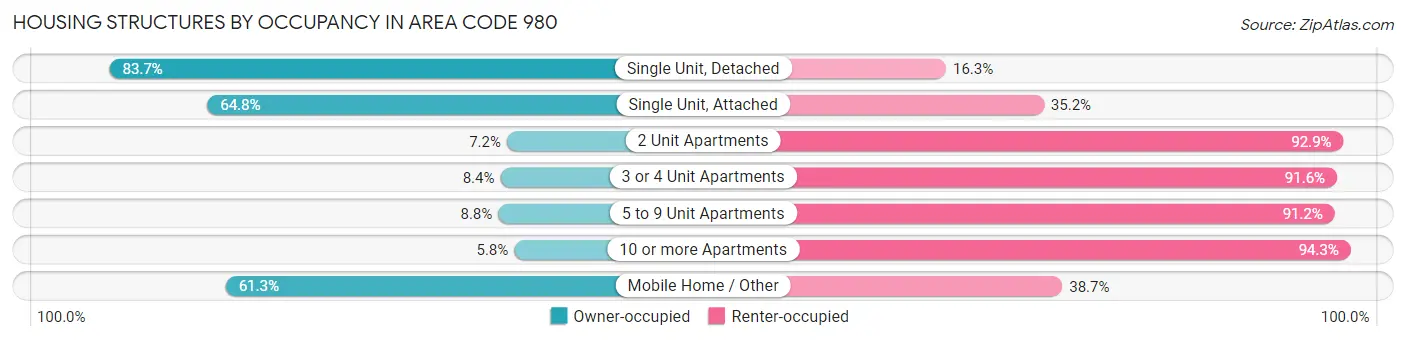
| Structure Type | Owner-occupied | Renter-occupied |
| Single Unit, Detached | 319,200 (83.7%) | 62,331 (16.3%) |
| Single Unit, Attached | 18,772 (64.8%) | 10,187 (35.2%) |
| 2 Unit Apartments | 578 (7.1%) | 7,508 (92.8%) |
| 3 or 4 Unit Apartments | 1,213 (8.4%) | 13,207 (91.6%) |
| 5 to 9 Unit Apartments | 2,115 (8.8%) | 21,835 (91.2%) |
| 10 or more Apartments | 4,798 (5.8%) | 78,690 (94.3%) |
| Mobile Home / Other | 23,578 (61.3%) | 14,904 (38.7%) |
| Total | 370,254 (64.0%) | 208,662 (36.0%) |
Housing Structures by Number of Rooms in Area Code 980
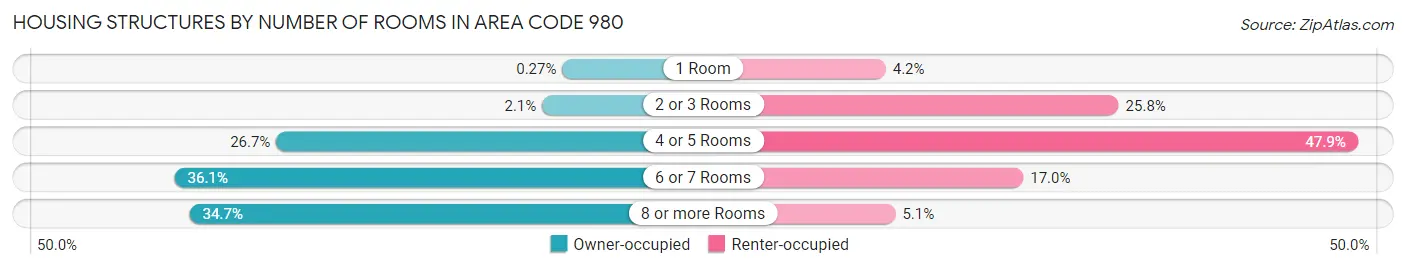
| Number of Rooms | Owner-occupied | Renter-occupied |
| 1 Room | 1,004 (0.3%) | 8,846 (4.2%) |
| 2 or 3 Rooms | 7,916 (2.1%) | 53,794 (25.8%) |
| 4 or 5 Rooms | 98,966 (26.7%) | 99,907 (47.9%) |
| 6 or 7 Rooms | 133,744 (36.1%) | 35,380 (17.0%) |
| 8 or more Rooms | 128,624 (34.7%) | 10,735 (5.1%) |
| Total | 370,254 (100.0%) | 208,662 (100.0%) |
Housing Structure by Heating Type in Area Code 980
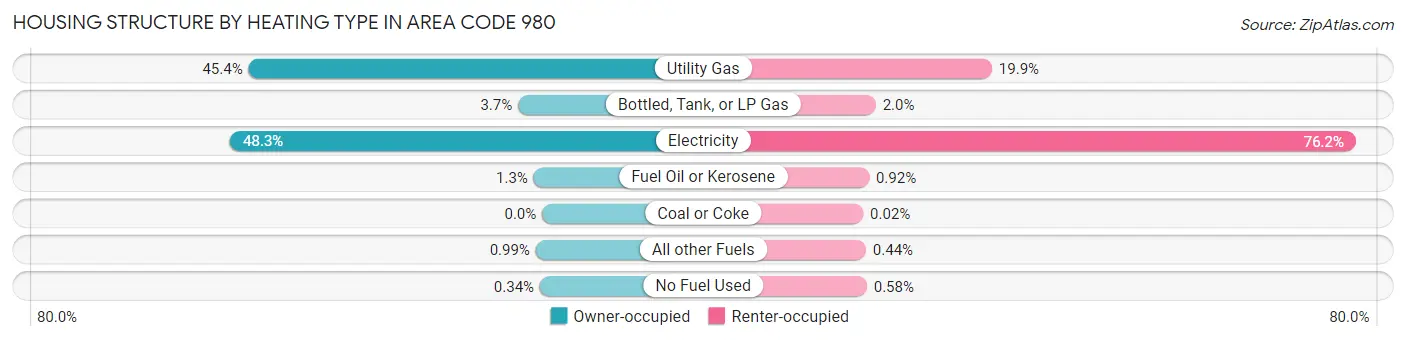
| Heating Type | Owner-occupied | Renter-occupied |
| Utility Gas | 168,060 (45.4%) | 41,557 (19.9%) |
| Bottled, Tank, or LP Gas | 13,781 (3.7%) | 4,084 (2.0%) |
| Electricity | 178,633 (48.2%) | 158,929 (76.2%) |
| Fuel Oil or Kerosene | 4,824 (1.3%) | 1,918 (0.9%) |
| Coal or Coke | 9 (0.0%) | 33 (0.0%) |
| All other Fuels | 3,672 (1.0%) | 923 (0.4%) |
| No Fuel Used | 1,275 (0.3%) | 1,218 (0.6%) |
| Total | 370,254 (100.0%) | 208,662 (100.0%) |
Household Vehicle Usage in Area Code 980
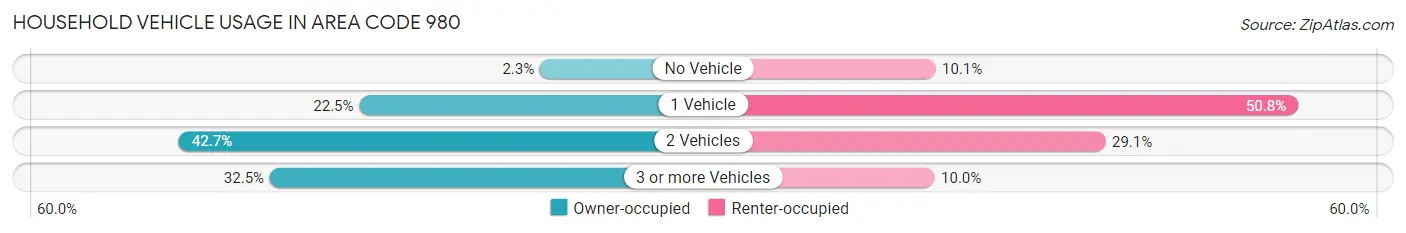
| Vehicles per Household | Owner-occupied | Renter-occupied |
| No Vehicle | 8,381 (2.3%) | 21,083 (10.1%) |
| 1 Vehicle | 83,318 (22.5%) | 105,927 (50.8%) |
| 2 Vehicles | 158,143 (42.7%) | 60,805 (29.1%) |
| 3 or more Vehicles | 120,412 (32.5%) | 20,847 (10.0%) |
| Total | 370,254 (100.0%) | 208,662 (100.0%) |
Real Estate & Mortgages in Area Code 980
Real Estate and Mortgage Overview in Area Code 980
| Characteristic | Without Mortgage | With Mortgage |
| Housing Units | 121,831 | 248,423 |
| Median Property Value | $12,627,100 | $14,791,200 |
| Median Household Income | $3,407,914 | $73,286 |
| Monthly Housing Costs | $25,168 | $23,700 |
| Real Estate Taxes | $99,182 | $3,943 |
Property Value by Mortgage Status in Area Code 980
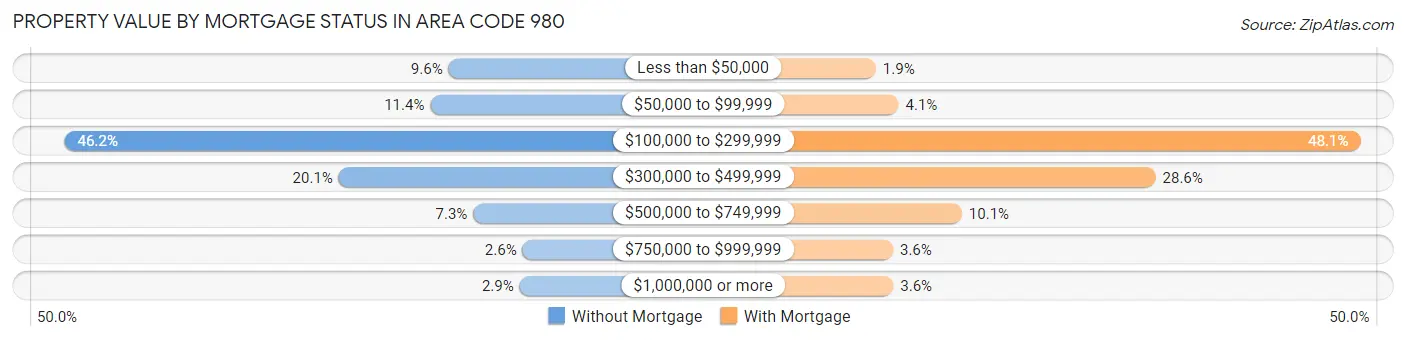
| Property Value | Without Mortgage | With Mortgage |
| Less than $50,000 | 11,728 (9.6%) | 4,820 (1.9%) |
| $50,000 to $99,999 | 13,850 (11.4%) | 10,197 (4.1%) |
| $100,000 to $299,999 | 56,277 (46.2%) | 119,428 (48.1%) |
| $300,000 to $499,999 | 24,478 (20.1%) | 71,009 (28.6%) |
| $500,000 to $749,999 | 8,866 (7.3%) | 25,164 (10.1%) |
| $750,000 to $999,999 | 3,147 (2.6%) | 8,871 (3.6%) |
| $1,000,000 or more | 3,485 (2.9%) | 8,934 (3.6%) |
| Total | 121,831 (100.0%) | 248,423 (100.0%) |
Household Income by Mortgage Status in Area Code 980
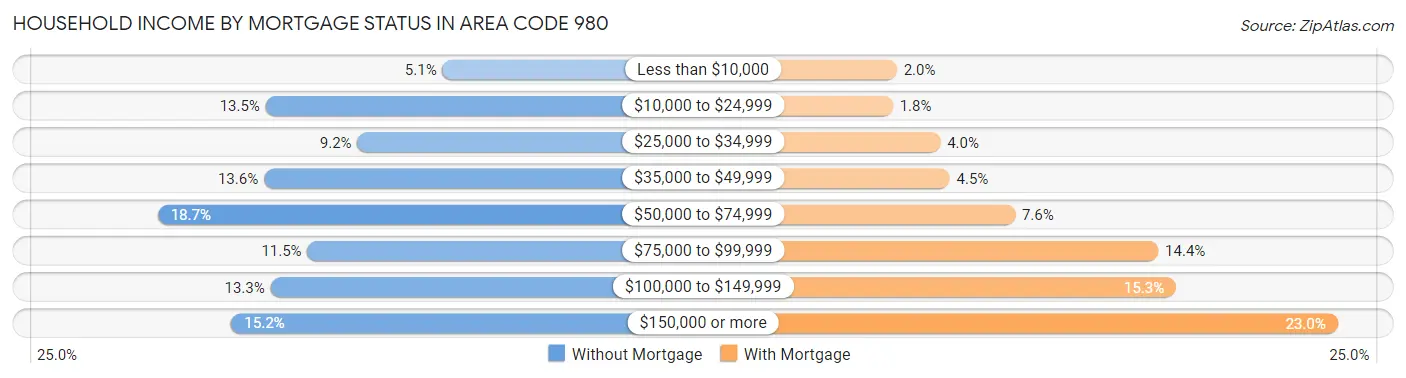
| Household Income | Without Mortgage | With Mortgage |
| Less than $10,000 | 6,214 (5.1%) | 4,857 (2.0%) |
| $10,000 to $24,999 | 16,469 (13.5%) | 4,397 (1.8%) |
| $25,000 to $34,999 | 11,148 (9.1%) | 10,016 (4.0%) |
| $35,000 to $49,999 | 16,566 (13.6%) | 11,129 (4.5%) |
| $50,000 to $74,999 | 22,735 (18.7%) | 18,846 (7.6%) |
| $75,000 to $99,999 | 14,049 (11.5%) | 35,807 (14.4%) |
| $100,000 to $149,999 | 16,188 (13.3%) | 37,907 (15.3%) |
| $150,000 or more | 18,462 (15.1%) | 57,035 (23.0%) |
| Total | 121,831 (100.0%) | 248,423 (100.0%) |
Property Value to Household Income Ratio in Area Code 980
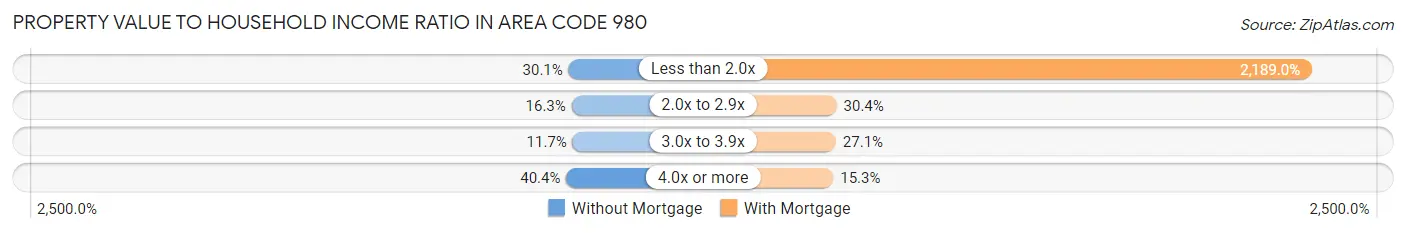
| Value-to-Income Ratio | Without Mortgage | With Mortgage |
| Less than 2.0x | 36,621 (30.1%) | 5,437,861 (2,189.0%) |
| 2.0x to 2.9x | 19,898 (16.3%) | 75,388 (30.3%) |
| 3.0x to 3.9x | 14,231 (11.7%) | 67,223 (27.1%) |
| 4.0x or more | 49,274 (40.4%) | 37,970 (15.3%) |
| Total | 121,831 (100.0%) | 248,423 (100.0%) |
Real Estate Taxes by Mortgage Status in Area Code 980
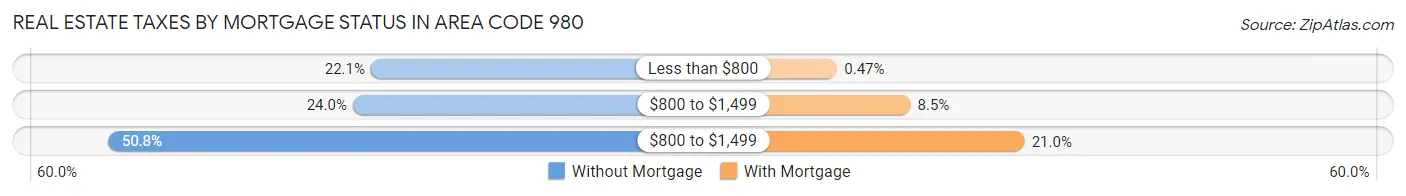
| Property Taxes | Without Mortgage | With Mortgage |
| Less than $800 | 26,872 (22.1%) | 1,161 (0.5%) |
| $800 to $1,499 | 29,293 (24.0%) | 21,115 (8.5%) |
| $800 to $1,499 | 61,851 (50.8%) | 52,201 (21.0%) |
| Total | 121,831 (100.0%) | 248,423 (100.0%) |
Health & Disability in Area Code 980
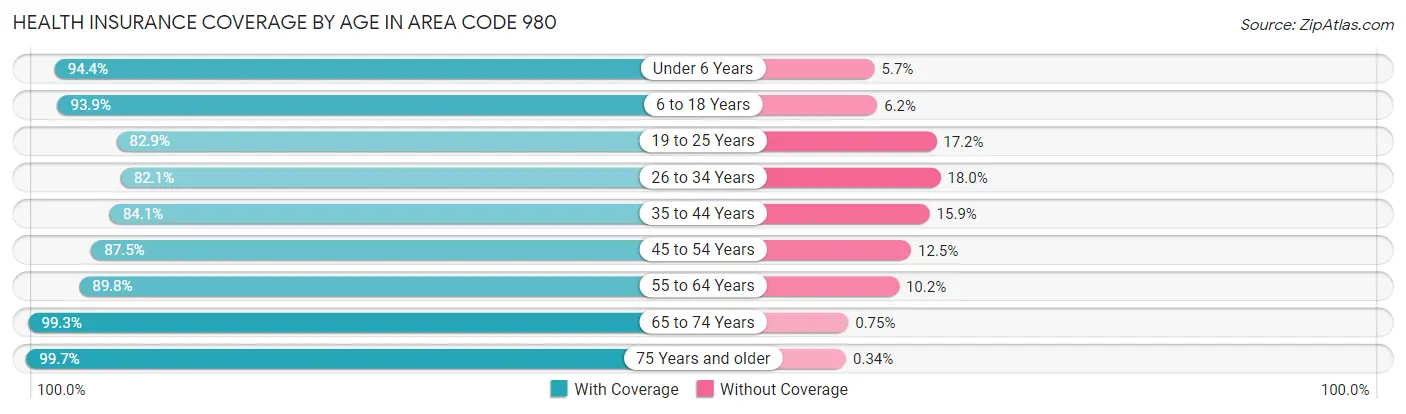
Health Insurance Coverage by Age in Area Code 980
| Age Bracket | With Coverage | Without Coverage |
| Under 6 Years | 101,305 (94.4%) | 6,063 (5.7%) |
| 6 to 18 Years | 236,008 (93.9%) | 15,460 (6.1%) |
| 19 to 25 Years | 116,064 (82.9%) | 24,032 (17.2%) |
| 26 to 34 Years | 157,920 (82.1%) | 34,541 (17.9%) |
| 35 to 44 Years | 163,861 (84.1%) | 31,021 (15.9%) |
| 45 to 54 Years | 177,948 (87.5%) | 25,325 (12.5%) |
| 55 to 64 Years | 163,358 (89.8%) | 18,552 (10.2%) |
| 65 to 74 Years | 126,335 (99.3%) | 950 (0.7%) |
| 75 Years and older | 82,216 (99.7%) | 280 (0.3%) |
| Total | 1,325,015 (89.4%) | 156,224 (10.5%) |
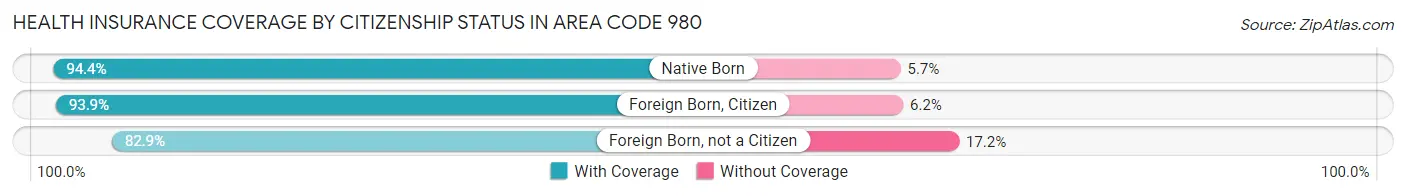
Health Insurance Coverage by Citizenship Status in Area Code 980
| Citizenship Status | With Coverage | Without Coverage |
| Native Born | 101,305 (94.4%) | 6,063 (5.7%) |
| Foreign Born, Citizen | 236,008 (93.9%) | 15,460 (6.1%) |
| Foreign Born, not a Citizen | 116,064 (82.9%) | 24,032 (17.2%) |
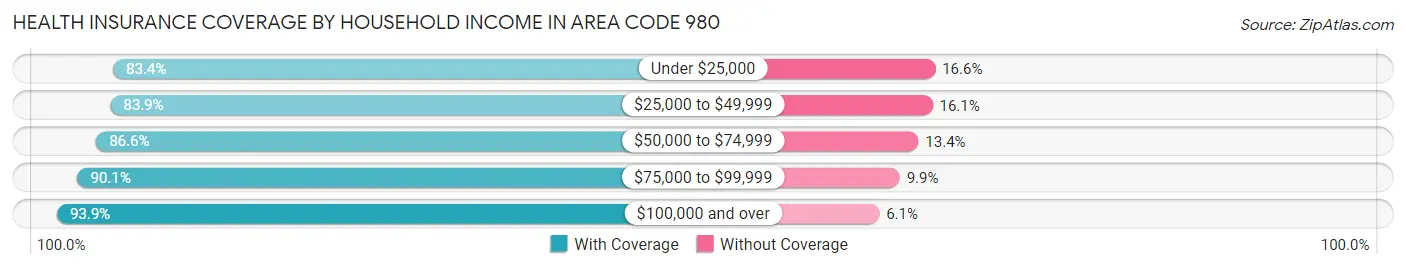
Health Insurance Coverage by Household Income in Area Code 980
| Household Income | With Coverage | Without Coverage |
| Under $25,000 | 126,343 (83.4%) | 25,096 (16.6%) |
| $25,000 to $49,999 | 206,074 (83.9%) | 39,463 (16.1%) |
| $50,000 to $74,999 | 207,425 (86.6%) | 32,142 (13.4%) |
| $75,000 to $99,999 | 186,237 (90.1%) | 20,500 (9.9%) |
| $100,000 and over | 591,172 (93.9%) | 38,223 (6.1%) |
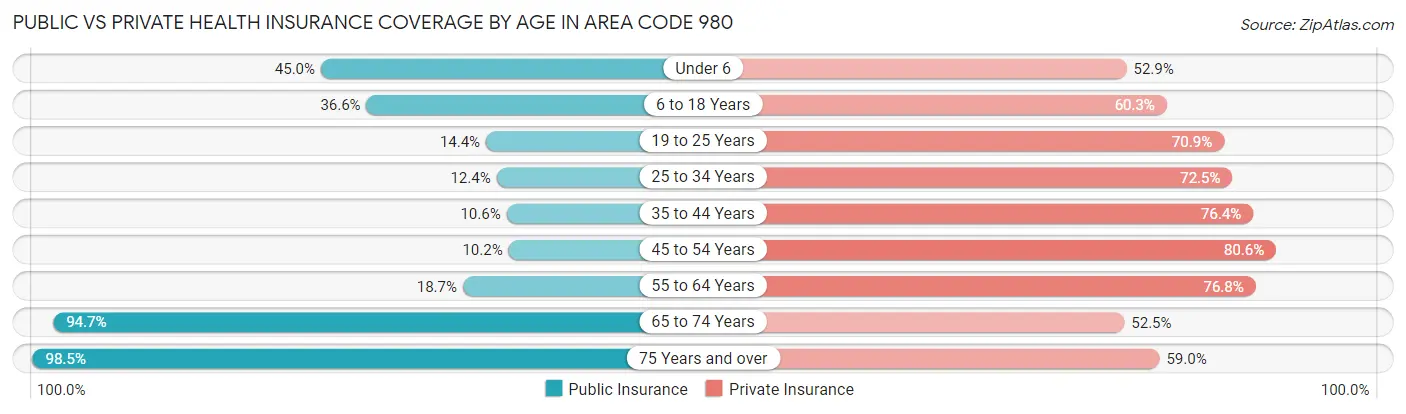
Public vs Private Health Insurance Coverage by Age in Area Code 980
| Age Bracket | Public Insurance | Private Insurance |
| Under 6 | 48,322 (45.0%) | 56,739 (52.8%) |
| 6 to 18 Years | 91,904 (36.5%) | 151,644 (60.3%) |
| 19 to 25 Years | 20,129 (14.4%) | 99,373 (70.9%) |
| 25 to 34 Years | 23,893 (12.4%) | 139,502 (72.5%) |
| 35 to 44 Years | 20,561 (10.5%) | 148,788 (76.3%) |
| 45 to 54 Years | 20,699 (10.2%) | 163,833 (80.6%) |
| 55 to 64 Years | 33,959 (18.7%) | 139,697 (76.8%) |
| 65 to 74 Years | 120,514 (94.7%) | 66,760 (52.4%) |
| 75 Years and over | 81,270 (98.5%) | 48,645 (59.0%) |
| Total | 461,251 (31.1%) | 1,014,981 (68.5%) |
Disability Status by Sex by Age in Area Code 980
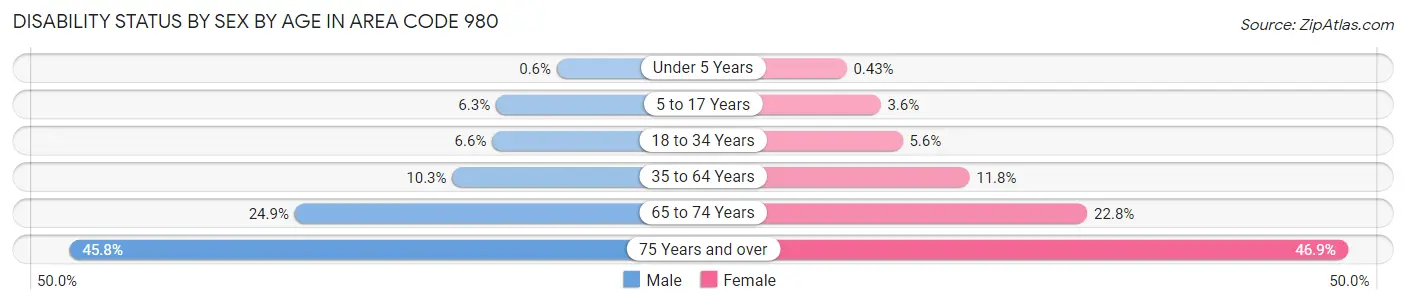
| Age Bracket | Male | Female |
| Under 5 Years | 282 (0.6%) | 183 (0.4%) |
| 5 to 17 Years | 7,927 (6.2%) | 4,435 (3.6%) |
| 18 to 34 Years | 11,583 (6.6%) | 9,918 (5.6%) |
| 35 to 64 Years | 29,147 (10.3%) | 35,166 (11.8%) |
| 65 to 74 Years | 14,617 (24.9%) | 15,638 (22.8%) |
| 75 Years and over | 14,894 (45.8%) | 23,464 (46.9%) |
Disability Class by Sex by Age in Area Code 980
Disability Class: Hearing Difficulty
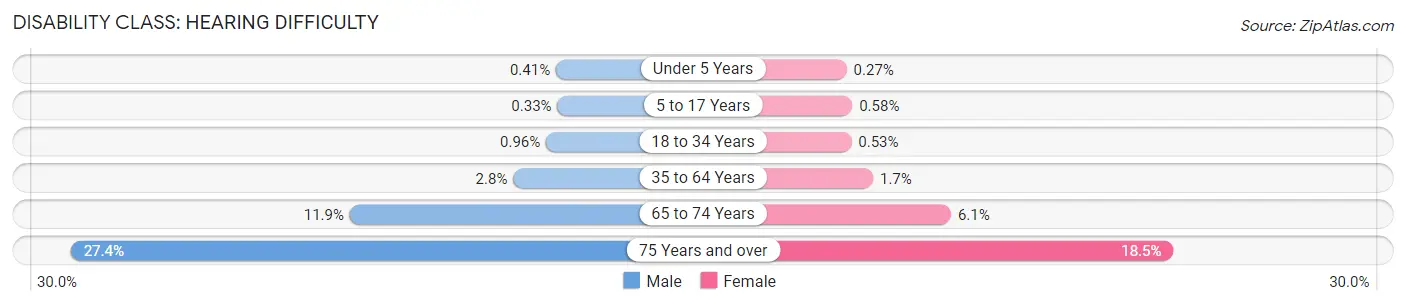
| Age Bracket | Male | Female |
| Under 5 Years | 193 (0.4%) | 114 (0.3%) |
| 5 to 17 Years | 412 (0.3%) | 712 (0.6%) |
| 18 to 34 Years | 1,676 (1.0%) | 934 (0.5%) |
| 35 to 64 Years | 7,889 (2.8%) | 5,173 (1.7%) |
| 65 to 74 Years | 6,972 (11.9%) | 4,176 (6.1%) |
| 75 Years and over | 8,913 (27.4%) | 9,230 (18.5%) |
Disability Class: Vision Difficulty
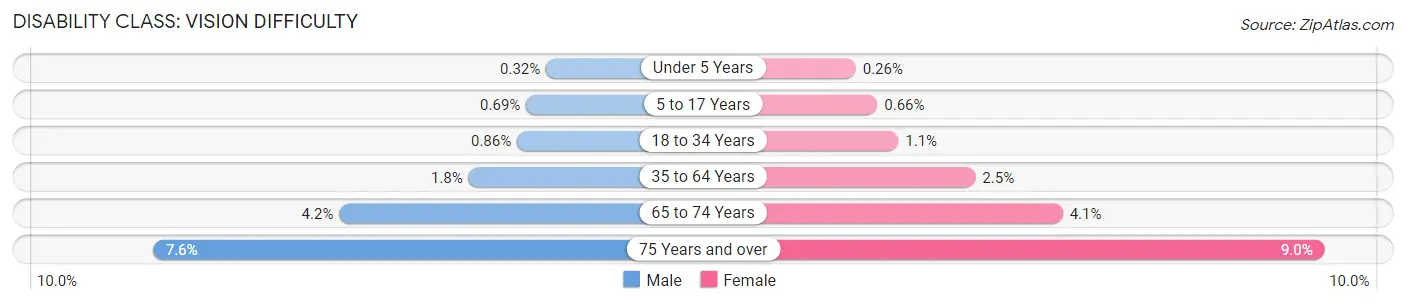
| Age Bracket | Male | Female |
| Under 5 Years | 152 (0.3%) | 110 (0.3%) |
| 5 to 17 Years | 877 (0.7%) | 813 (0.7%) |
| 18 to 34 Years | 1,501 (0.9%) | 1,846 (1.1%) |
| 35 to 64 Years | 4,965 (1.8%) | 7,370 (2.5%) |
| 65 to 74 Years | 2,437 (4.2%) | 2,816 (4.1%) |
| 75 Years and over | 2,476 (7.6%) | 4,478 (9.0%) |
Disability Class: Cognitive Difficulty
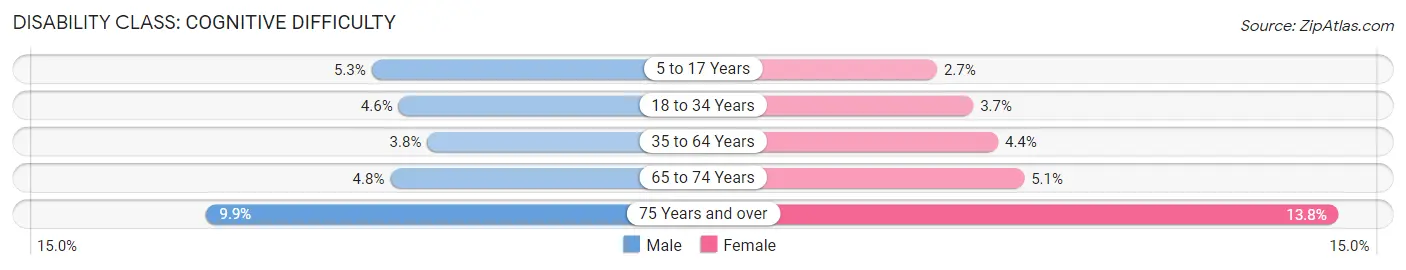
| Age Bracket | Male | Female |
| 5 to 17 Years | 6,774 (5.3%) | 3,277 (2.6%) |
| 18 to 34 Years | 8,052 (4.6%) | 6,440 (3.7%) |
| 35 to 64 Years | 10,729 (3.8%) | 12,919 (4.3%) |
| 65 to 74 Years | 2,824 (4.8%) | 3,489 (5.1%) |
| 75 Years and over | 3,231 (9.9%) | 6,916 (13.8%) |
Disability Class: Ambulatory Difficulty
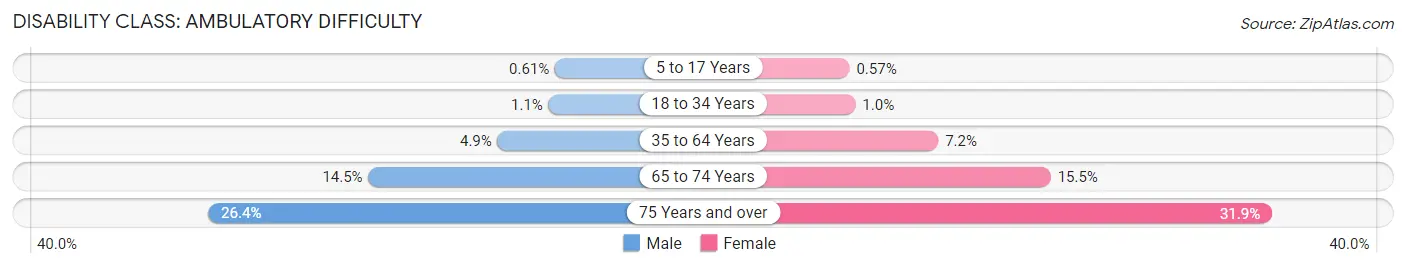
| Age Bracket | Male | Female |
| 5 to 17 Years | 768 (0.6%) | 710 (0.6%) |
| 18 to 34 Years | 1,906 (1.1%) | 1,782 (1.0%) |
| 35 to 64 Years | 13,793 (4.9%) | 21,275 (7.2%) |
| 65 to 74 Years | 8,483 (14.5%) | 10,647 (15.5%) |
| 75 Years and over | 8,570 (26.4%) | 15,968 (31.9%) |
Disability Class: Self-Care Difficulty
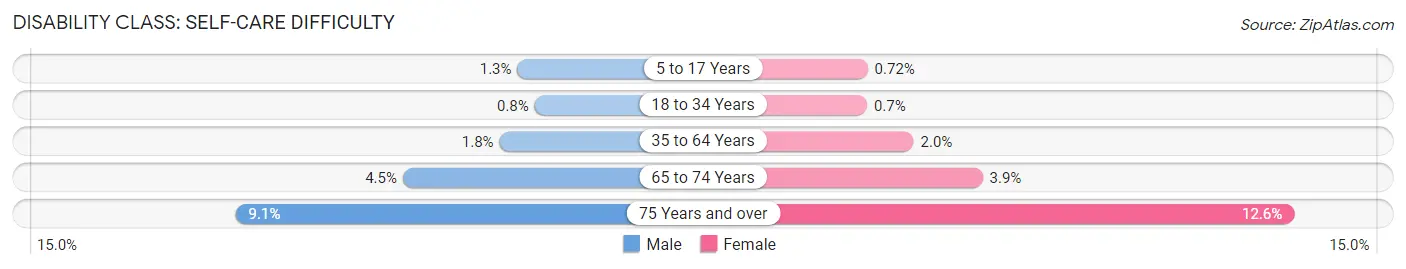
| Age Bracket | Male | Female |
| 5 to 17 Years | 1,625 (1.3%) | 892 (0.7%) |
| 18 to 34 Years | 1,402 (0.8%) | 1,229 (0.7%) |
| 35 to 64 Years | 5,026 (1.8%) | 5,952 (2.0%) |
| 65 to 74 Years | 2,621 (4.5%) | 2,694 (3.9%) |
| 75 Years and over | 2,967 (9.1%) | 6,293 (12.6%) |
Technology Access in Area Code 980
Computing Device Access in Area Code 980
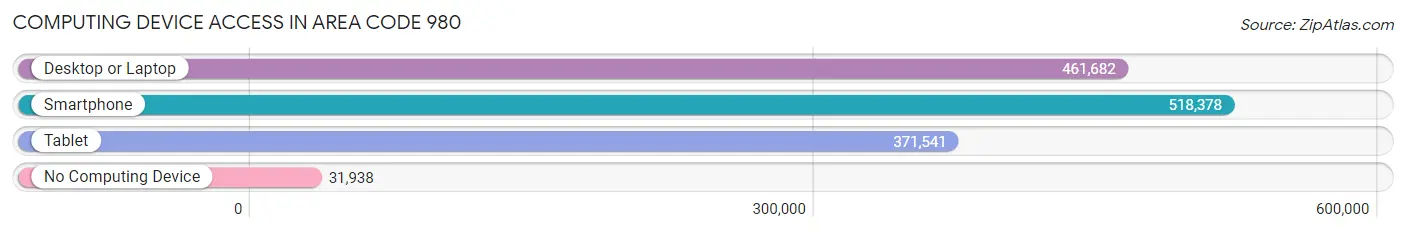
| Device Type | # Households | % Households |
| Desktop or Laptop | 461,682 | 79.7% |
| Smartphone | 518,378 | 89.5% |
| Tablet | 371,541 | 64.2% |
| No Computing Device | 31,938 | 5.5% |
| Total | 578,916 | 100.0% |
Internet Access in Area Code 980
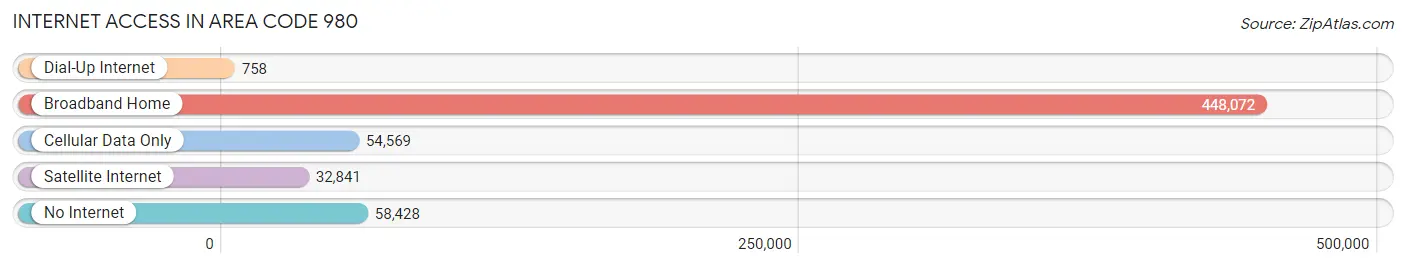
| Internet Type | # Households | % Households |
| Dial-Up Internet | 758 | 0.1% |
| Broadband Home | 448,072 | 77.4% |
| Cellular Data Only | 54,569 | 9.4% |
| Satellite Internet | 32,841 | 5.7% |
| No Internet | 58,428 | 10.1% |
| Total | 578,916 | 100.0% |
Area Code 980 Summary
Geography
Area code 980 is a telephone area code in the North American Numbering Plan (NANP) for the state of Washington. It serves the Seattle metropolitan area, including the cities of Bellevue, Everett, Kirkland, Redmond, and Tacoma.
Social
Area code 980 is a vibrant and diverse area, with a wide range of cultural and recreational activities. The area is home to many professional sports teams, including the Seattle Seahawks, Seattle Mariners, and Seattle Sounders. It is also home to a variety of museums, galleries, and performing arts venues.
Economics
Area code 980 is an economically prosperous area, with a strong job market and a high median household income. The area is home to many major corporations, including Amazon, Microsoft, and Boeing. It is also home to a number of universities and colleges, including the University of Washington and Seattle University.
Demographics
Area code 980 is home to a diverse population, with a variety of ethnic and racial backgrounds. According to the U.S. Census Bureau, the population of the area is approximately 1.7 million people. The median age is 37.5 years, and the median household income is $77,000.
Common Questions
What is Per Capita Income in Area Code 980?
Per Capita income in Area Code 980 is $39,991.
What is the Median Family Income in Area Code 980?
Median Family Income in Area Code 980 is $92,902.
What is the Median Household income in Area Code 980?
Median Household Income in Area Code 980 is $74,107.
What is Income or Wage Gap in Area Code 980?
Income or Wage Gap in Area Code 980 is 27.1%.
Women in Area Code 980 earn 72.9 cents for every dollar earned by a man.
What is Family Income Deficit in Area Code 980?
Family Income Deficit in Area Code 980 is $10,366.
Families that are below poverty line in Area Code 980 earn $10,366 less on average than the poverty threshold level.
What is Inequality or Gini Index in Area Code 980?
Inequality or Gini Index in Area Code 980 is 23.01.
What is the Total Population of Area Code 980?
Total Population of Area Code 980 is 1,497,267.
What is the Total Male Population of Area Code 980?
Total Male Population of Area Code 980 is 733,180.
What is the Total Female Population of Area Code 980?
Total Female Population of Area Code 980 is 764,087.
What is the Ratio of Males per 100 Females in Area Code 980?
There are 95.96 Males per 100 Females in Area Code 980.
What is the Ratio of Females per 100 Males in Area Code 980?
There are 104.22 Females per 100 Males in Area Code 980.
What is the Median Population Age in Area Code 980?
Median Population Age in Area Code 980 is 39.1 Years.
What is the Average Family Size in Area Code 980
Average Family Size in Area Code 980 is 3.1 People.
What is the Average Household Size in Area Code 980
Average Household Size in Area Code 980 is 2.6 People.
How Large is the Labor Force in Area Code 980?
There are 776,185 People in the Labor Forcein in Area Code 980.
What is the Percentage of People in the Labor Force in Area Code 980?
64.8% of People are in the Labor Force in Area Code 980.
What is the Unemployment Rate in Area Code 980?
Unemployment Rate in Area Code 980 is 4.7%.