Area Code 430 Map & Demographics
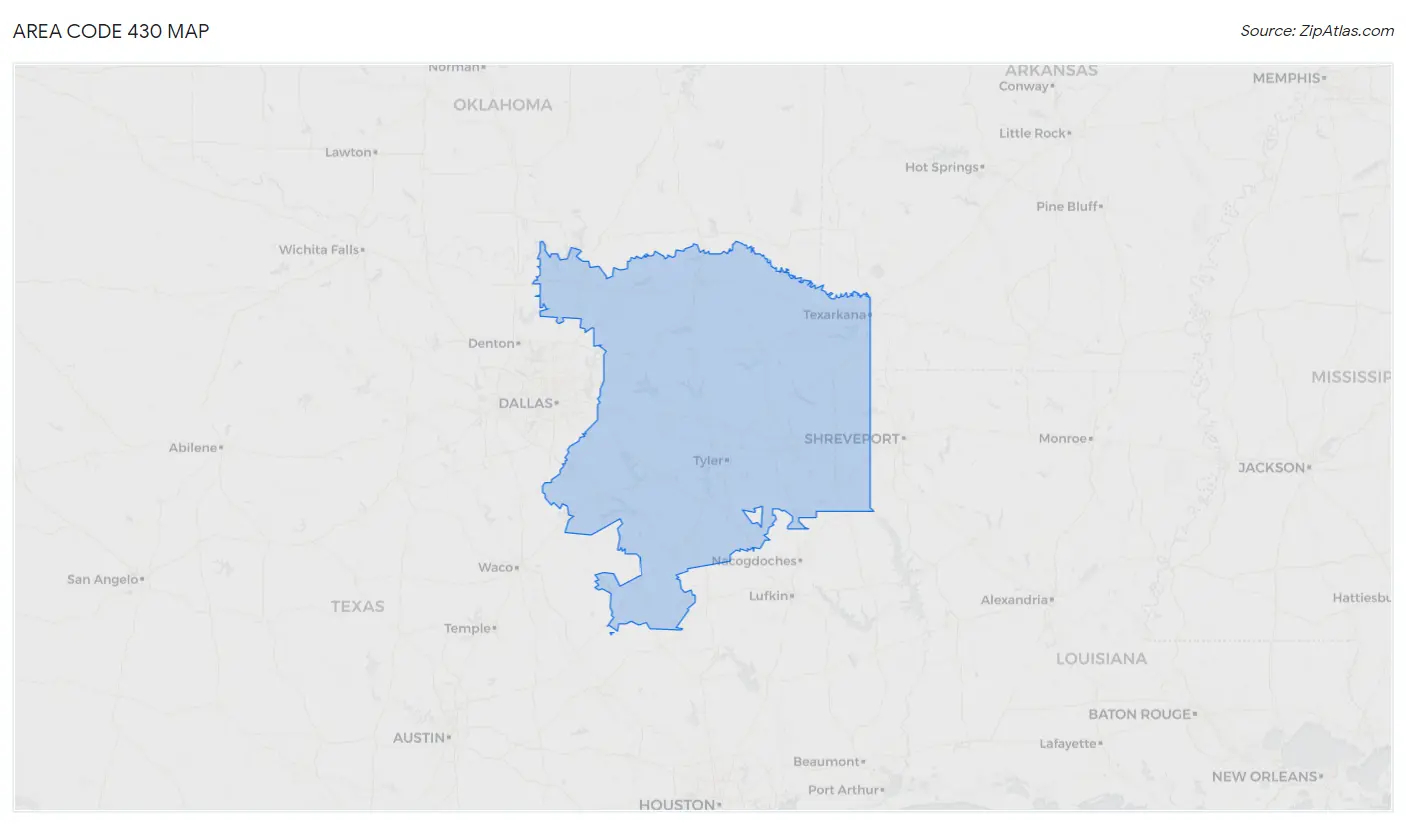
Area Code 430 Map
Area Code 430 Overview
$31,505
PER CAPITA INCOME
$76,219
AVG FAMILY INCOME
$63,825
AVG HOUSEHOLD INCOME
33.6%
WAGE / INCOME GAP [ % ]
66.4¢/ $1
WAGE / INCOME GAP [ $ ]
$11,169
FAMILY INCOME DEFICIT
24.01
INEQUALITY / GINI INDEX
576,904
TOTAL POPULATION
290,684
MALE POPULATION
286,220
FEMALE POPULATION
101.56
MALES / 100 FEMALES
98.46
FEMALES / 100 MALES
41.2
MEDIAN AGE
3.2
AVG FAMILY SIZE
2.7
AVG HOUSEHOLD SIZE
253,206
LABOR FORCE [ PEOPLE ]
55.2%
PERCENT IN LABOR FORCE
5.0%
UNEMPLOYMENT RATE
Income in Area Code 430
Income Overview in Area Code 430
Per Capita Income in Area Code 430 is $31,505, while median incomes of families and households are $76,219 and $63,825 respectively.
| Characteristic | Number | Measure |
| Per Capita Income | 576,904 | $31,505 |
| Median Family Income | 144,247 | $76,219 |
| Mean Family Income | 144,247 | $5,196,256 |
| Median Household Income | 210,156 | $63,825 |
| Mean Household Income | 210,156 | $4,485,172 |
| Income Deficit | 144,247 | $11,169 |
| Wage / Income Gap (%) | 576,904 | 33.56% |
| Wage / Income Gap ($) | 576,904 | 66.44¢ per $1 |
| Gini / Inequality Index | 576,904 | 24.01 |
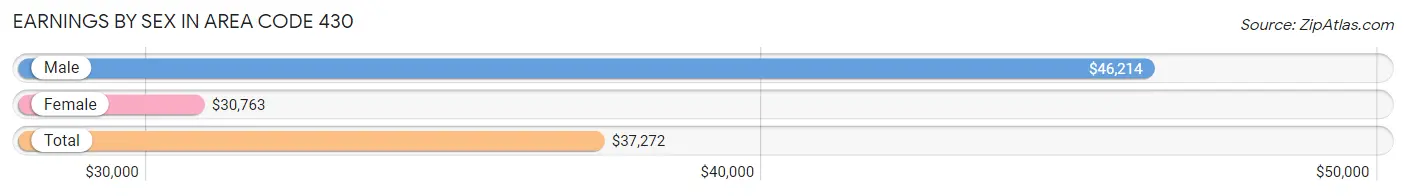
Earnings by Sex in Area Code 430
Average Earnings in Area Code 430 are $37,272, $46,214 for men and $30,763 for women, a difference of 33.4%.
| Sex | Number | Average Earnings |
| Male | 145,112 (53.8%) | $46,214 |
| Female | 124,803 (46.2%) | $30,763 |
| Total | 269,915 (100.0%) | $37,272 |
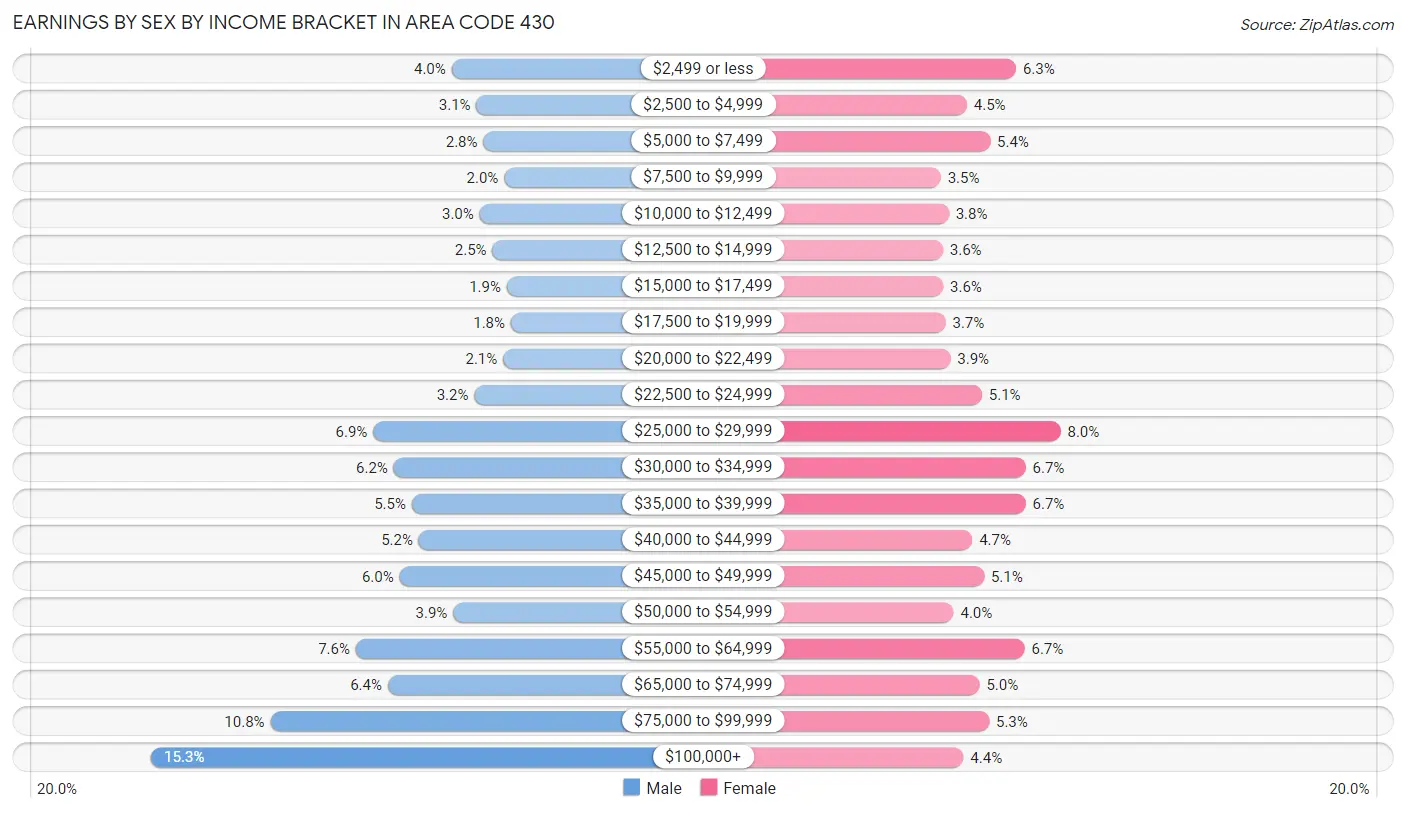
Earnings by Sex by Income Bracket in Area Code 430
The most common earnings brackets in Area Code 430 are $100,000+ for men (22,145 | 15.3%) and $25,000 to $29,999 for women (9,998 | 8.0%).
| Income | Male | Female |
| $2,499 or less | 5,806 (4.0%) | 7,916 (6.3%) |
| $2,500 to $4,999 | 4,455 (3.1%) | 5,619 (4.5%) |
| $5,000 to $7,499 | 4,074 (2.8%) | 6,704 (5.4%) |
| $7,500 to $9,999 | 2,939 (2.0%) | 4,393 (3.5%) |
| $10,000 to $12,499 | 4,275 (2.9%) | 4,768 (3.8%) |
| $12,500 to $14,999 | 3,586 (2.5%) | 4,488 (3.6%) |
| $15,000 to $17,499 | 2,796 (1.9%) | 4,502 (3.6%) |
| $17,500 to $19,999 | 2,576 (1.8%) | 4,621 (3.7%) |
| $20,000 to $22,499 | 2,998 (2.1%) | 4,842 (3.9%) |
| $22,500 to $24,999 | 4,578 (3.2%) | 6,321 (5.1%) |
| $25,000 to $29,999 | 10,078 (6.9%) | 9,998 (8.0%) |
| $30,000 to $34,999 | 8,948 (6.2%) | 8,359 (6.7%) |
| $35,000 to $39,999 | 7,962 (5.5%) | 8,366 (6.7%) |
| $40,000 to $44,999 | 7,584 (5.2%) | 5,865 (4.7%) |
| $45,000 to $49,999 | 8,641 (5.9%) | 6,410 (5.1%) |
| $50,000 to $54,999 | 5,716 (3.9%) | 4,996 (4.0%) |
| $55,000 to $64,999 | 11,018 (7.6%) | 8,318 (6.7%) |
| $65,000 to $74,999 | 9,276 (6.4%) | 6,207 (5.0%) |
| $75,000 to $99,999 | 15,661 (10.8%) | 6,654 (5.3%) |
| $100,000+ | 22,145 (15.3%) | 5,456 (4.4%) |
| Total | 145,112 (100.0%) | 124,803 (100.0%) |
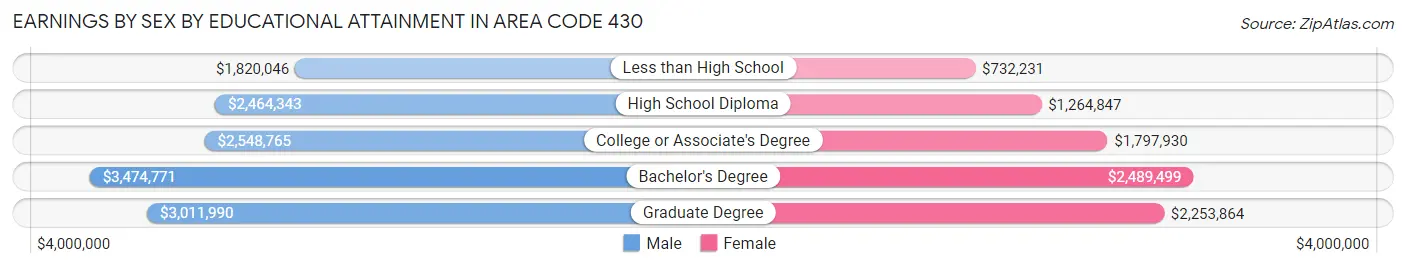
Earnings by Sex by Educational Attainment in Area Code 430
Average earnings in Area Code 430 are $2,872,349 for men and $1,804,508 for women, a difference of 37.2%. Men with an educational attainment of bachelor's degree enjoy the highest average annual earnings of $3,474,771, while those with less than high school education earn the least with $1,820,046. Women with an educational attainment of bachelor's degree earn the most with the average annual earnings of $2,489,499, while those with less than high school education have the smallest earnings of $732,231.
| Educational Attainment | Male Income | Female Income |
| Less than High School | $1,820,046 | $732,231 |
| High School Diploma | $2,464,343 | $1,264,847 |
| College or Associate's Degree | $2,548,765 | $1,797,930 |
| Bachelor's Degree | $3,474,771 | $2,489,499 |
| Graduate Degree | $3,011,990 | $2,253,864 |
| Total | $2,872,349 | $1,804,508 |
Family Income in Area Code 430
Family Income Brackets in Area Code 430
According to the Area Code 430 family income data, there are 1,518,777 families falling into the $100,000 to $149,999 income range, which is the most common income bracket and makes up 1,052.9% of all families. Conversely, the $10,000 to $14,999 income bracket is the least frequent group with only 161,989 families (112.3%) belonging to this category.
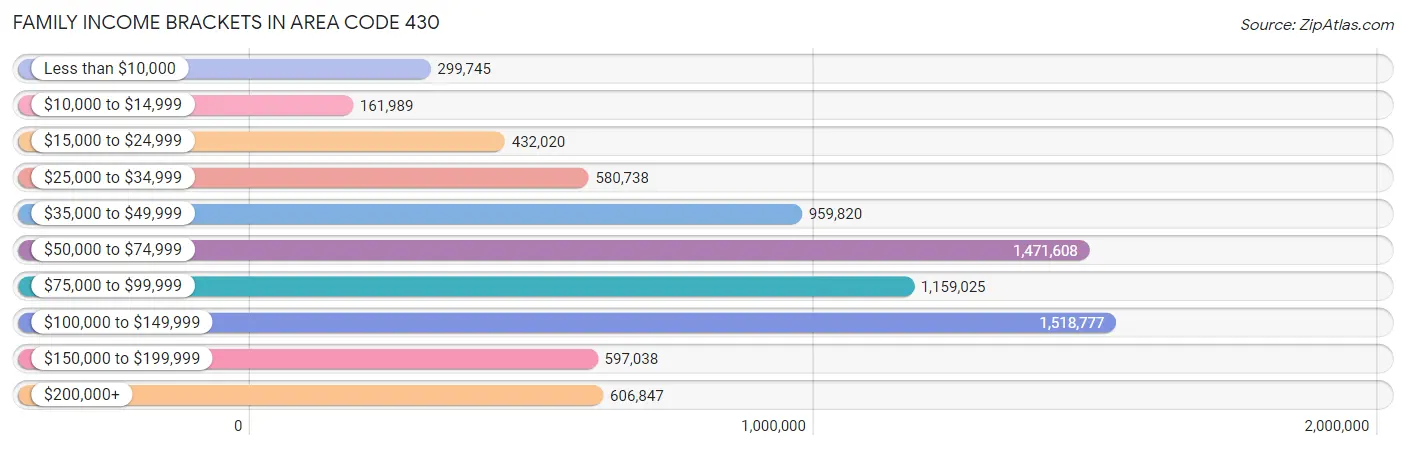
| Income Bracket | # Families | % Families |
| Less than $10,000 | 299,745 | 207.8% |
| $10,000 to $14,999 | 161,989 | 112.3% |
| $15,000 to $24,999 | 432,020 | 299.5% |
| $25,000 to $34,999 | 580,738 | 402.6% |
| $35,000 to $49,999 | 959,820 | 665.4% |
| $50,000 to $74,999 | 1,471,608 | 1,020.2% |
| $75,000 to $99,999 | 1,159,025 | 803.5% |
| $100,000 to $149,999 | 1,518,777 | 1,052.9% |
| $150,000 to $199,999 | 597,038 | 413.9% |
| $200,000+ | 606,847 | 420.7% |
Family Income by Famaliy Size in Area Code 430
7+ person families (2,724 | 1.9%) account for the highest median family income in Area Code 430 with $105,834 per family, while 2-person families (69,423 | 48.1%) have the highest median income of $34,535 per family member.
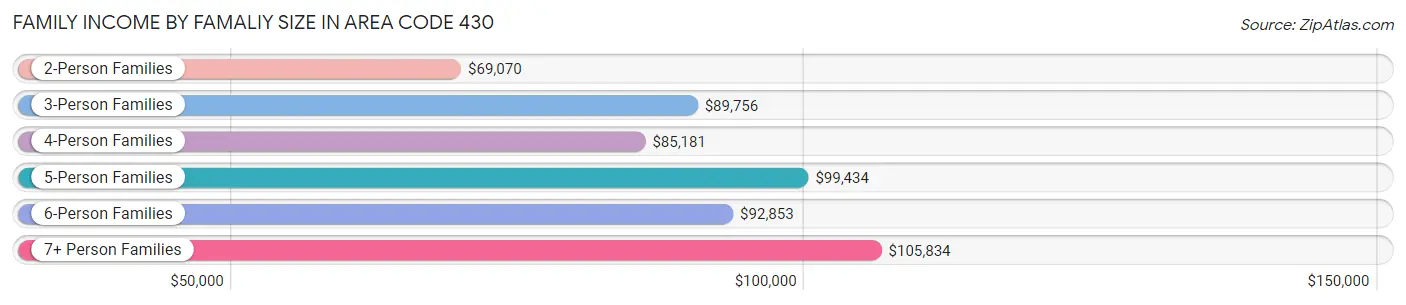
| Income Bracket | # Families | Median Income |
| 2-Person Families | 69,423 (48.1%) | $69,070 |
| 3-Person Families | 31,984 (22.2%) | $89,756 |
| 4-Person Families | 23,980 (16.6%) | $85,181 |
| 5-Person Families | 10,810 (7.5%) | $99,434 |
| 6-Person Families | 5,326 (3.7%) | $92,852 |
| 7+ Person Families | 2,724 (1.9%) | $105,834 |
| Total | 144,247 (100.0%) | $76,219 |
Family Income by Number of Earners in Area Code 430
The median family income in Area Code 430 is $76,219, with families comprising 3+ earners (14,308) having the highest median family income of $131,410, while families with no earners (25,487) have the lowest median family income of $43,442, accounting for 9.9% and 17.7% of families, respectively.
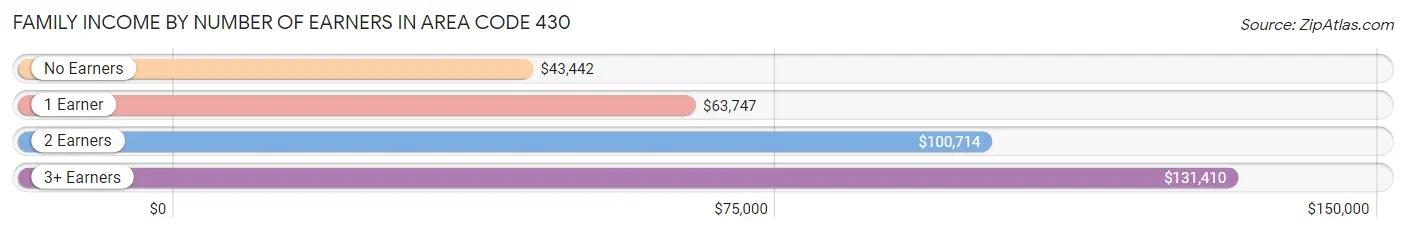
| Number of Earners | # Families | Median Income |
| No Earners | 25,487 (17.7%) | $43,442 |
| 1 Earner | 50,824 (35.2%) | $63,747 |
| 2 Earners | 53,628 (37.2%) | $100,714 |
| 3+ Earners | 14,308 (9.9%) | $131,410 |
| Total | 144,247 (100.0%) | $76,219 |
Household Income in Area Code 430
Household Income Brackets in Area Code 430
With 1,976,517 households falling in the category, the $50,000 to $74,999 income range is the most frequent in Area Code 430, accounting for 940.5% of all households. In contrast, only 505,425 households (240.5%) fall into the $10,000 to $14,999 income bracket, making it the least populous group.
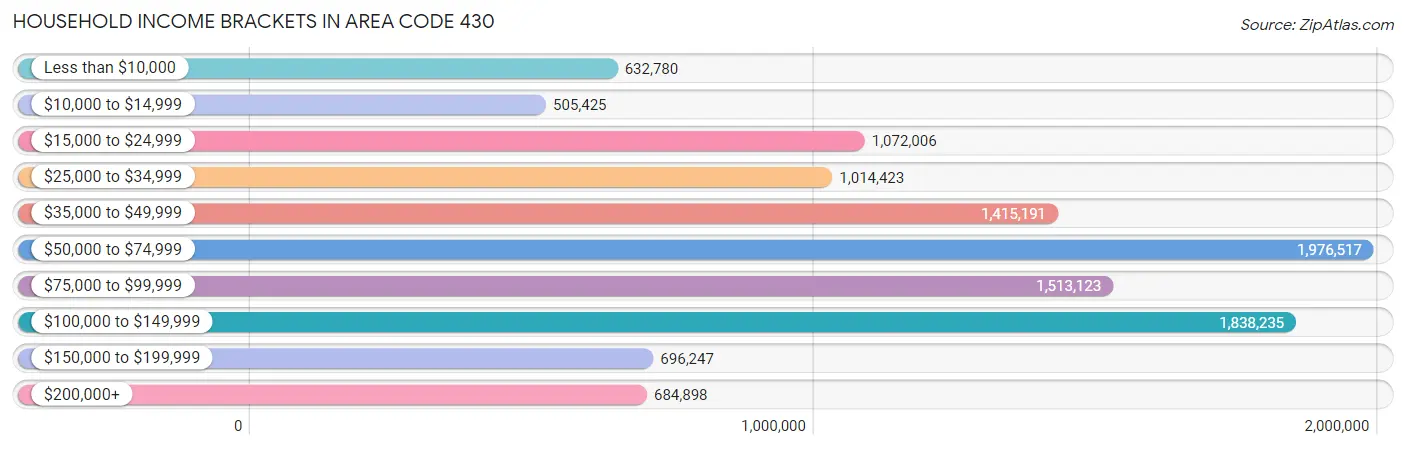
| Income Bracket | # Households | % Households |
| Less than $10,000 | 632,780 | 301.1% |
| $10,000 to $14,999 | 505,425 | 240.5% |
| $15,000 to $24,999 | 1,072,006 | 510.1% |
| $25,000 to $34,999 | 1,014,423 | 482.7% |
| $35,000 to $49,999 | 1,415,191 | 673.4% |
| $50,000 to $74,999 | 1,976,517 | 940.5% |
| $75,000 to $99,999 | 1,513,123 | 720.0% |
| $100,000 to $149,999 | 1,838,235 | 874.7% |
| $150,000 to $199,999 | 696,247 | 331.3% |
| $200,000+ | 684,898 | 325.9% |
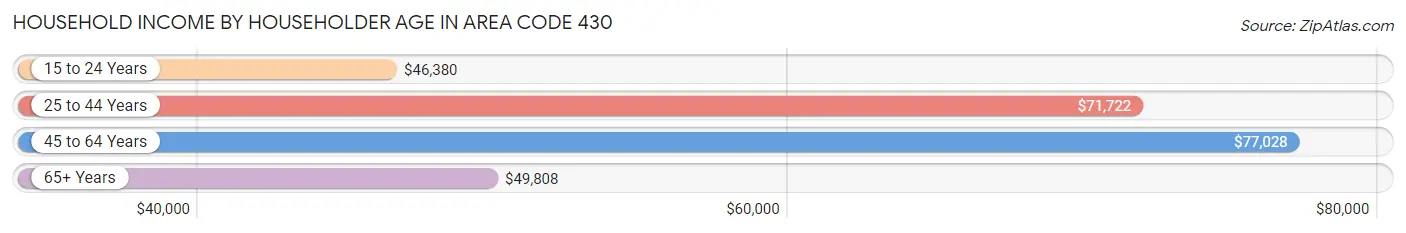
Household Income by Householder Age in Area Code 430
The median household income in Area Code 430 is $63,825, with the highest median household income of $77,028 found in the 45 to 64 years age bracket for the primary householder. A total of 77,311 households (36.8%) fall into this category. Meanwhile, the 15 to 24 years age bracket for the primary householder has the lowest median household income of $46,380, with 7,474 households (3.6%) in this group.
| Income Bracket | # Households | Median Income |
| 15 to 24 Years | 7,474 (3.6%) | $46,380 |
| 25 to 44 Years | 60,589 (28.8%) | $71,722 |
| 45 to 64 Years | 77,311 (36.8%) | $77,028 |
| 65+ Years | 64,782 (30.8%) | $49,808 |
| Total | 210,156 (100.0%) | $63,825 |
Poverty in Area Code 430
Income Below Poverty by Sex and Age in Area Code 430
With 13.6% poverty level for males and 15.8% for females among the residents of Area Code 430, under 5 year old males and under 5 year old females are the most vulnerable to poverty, with 4,060 males (23.4%) and 3,567 females (22.2%) in their respective age groups living below the poverty level.
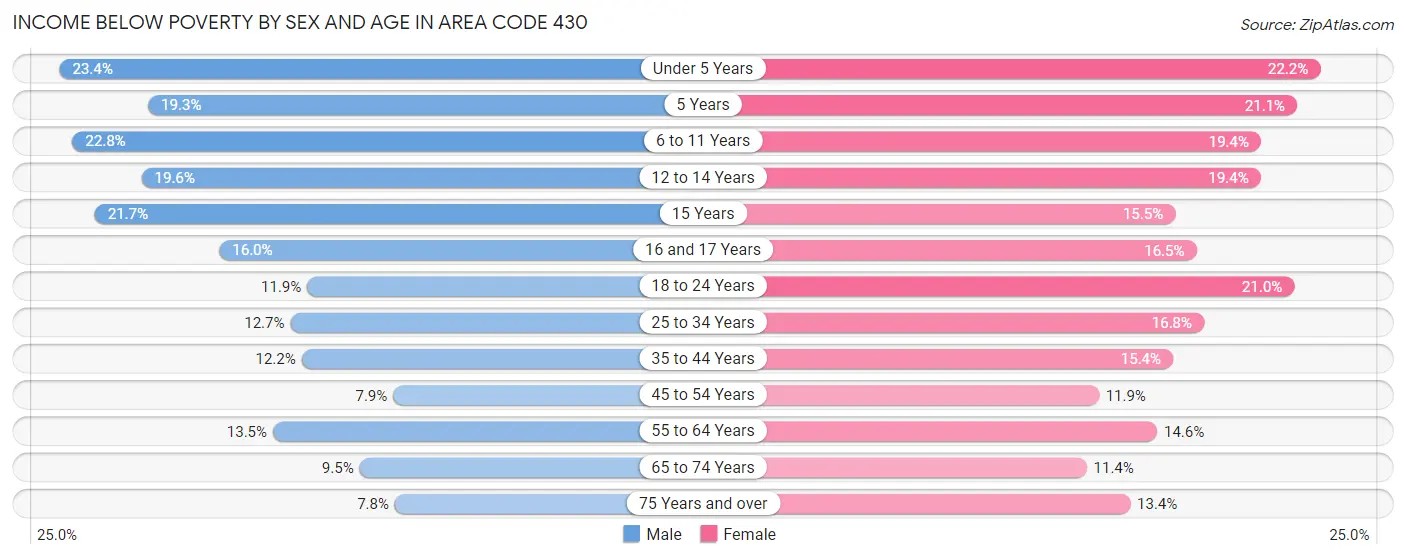
| Age Bracket | Male | Female |
| Under 5 Years | 4,060 (23.4%) | 3,567 (22.2%) |
| 5 Years | 683 (19.3%) | 765 (21.1%) |
| 6 to 11 Years | 4,920 (22.8%) | 4,306 (19.4%) |
| 12 to 14 Years | 2,563 (19.6%) | 2,214 (19.4%) |
| 15 Years | 927 (21.7%) | 580 (15.5%) |
| 16 and 17 Years | 1,244 (16.0%) | 1,266 (16.5%) |
| 18 to 24 Years | 2,810 (11.9%) | 4,654 (21.0%) |
| 25 to 34 Years | 4,261 (12.7%) | 5,723 (16.8%) |
| 35 to 44 Years | 3,928 (12.1%) | 5,053 (15.4%) |
| 45 to 54 Years | 2,491 (7.9%) | 4,016 (11.9%) |
| 55 to 64 Years | 4,905 (13.5%) | 5,518 (14.6%) |
| 65 to 74 Years | 2,686 (9.5%) | 3,569 (11.4%) |
| 75 Years and over | 1,330 (7.8%) | 3,212 (13.4%) |
| Total | 36,808 (13.6%) | 44,443 (15.8%) |
Income Above Poverty by Sex and Age in Area Code 430
According to the poverty statistics in Area Code 430, males aged 75 years and over and females aged 65 to 74 years are the age groups that are most secure financially, with 92.2% of males and 88.6% of females in these age groups living above the poverty line.
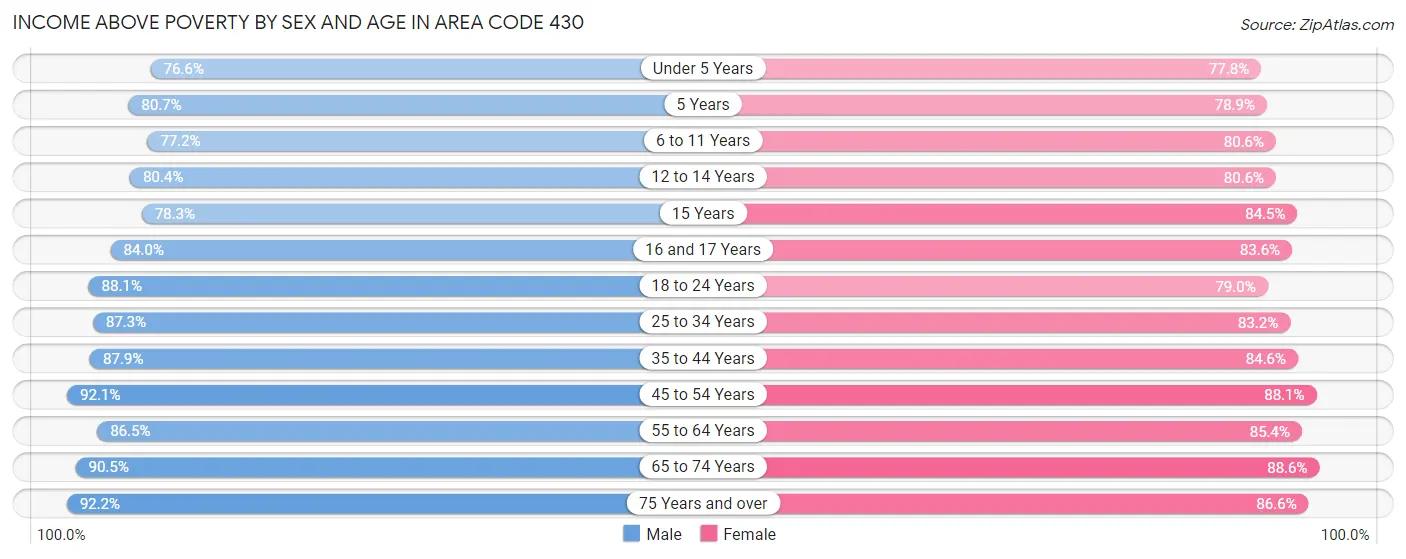
| Age Bracket | Male | Female |
| Under 5 Years | 13,302 (76.6%) | 12,508 (77.8%) |
| 5 Years | 2,862 (80.7%) | 2,858 (78.9%) |
| 6 to 11 Years | 16,674 (77.2%) | 17,849 (80.6%) |
| 12 to 14 Years | 10,531 (80.4%) | 9,182 (80.6%) |
| 15 Years | 3,337 (78.3%) | 3,171 (84.5%) |
| 16 and 17 Years | 6,552 (84.0%) | 6,432 (83.6%) |
| 18 to 24 Years | 20,826 (88.1%) | 17,520 (79.0%) |
| 25 to 34 Years | 29,363 (87.3%) | 28,351 (83.2%) |
| 35 to 44 Years | 28,401 (87.8%) | 27,850 (84.6%) |
| 45 to 54 Years | 29,042 (92.1%) | 29,670 (88.1%) |
| 55 to 64 Years | 31,470 (86.5%) | 32,192 (85.4%) |
| 65 to 74 Years | 25,696 (90.5%) | 27,861 (88.6%) |
| 75 Years and over | 15,669 (92.2%) | 20,800 (86.6%) |
| Total | 233,725 (86.4%) | 236,244 (84.2%) |
Income Below Poverty Among Married-Couple Families in Area Code 430
The poverty statistics for married-couple families in Area Code 430 show that 5.8% or 6,238 of the total 107,581 families live below the poverty line. Families with 5 or more children have the highest poverty rate of 18.7%, comprising of 151 families. On the other hand, families with no children have the lowest poverty rate of 4.1%, which includes 2,653 families.
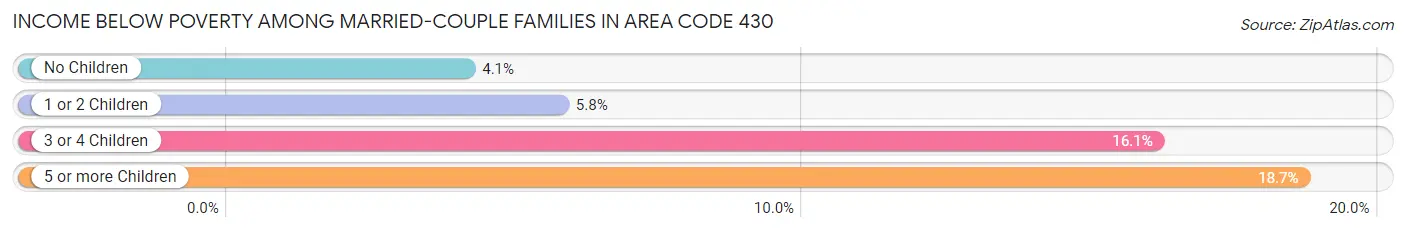
| Children | Above Poverty | Below Poverty |
| No Children | 61,615 (95.9%) | 2,653 (4.1%) |
| 1 or 2 Children | 31,105 (94.2%) | 1,902 (5.8%) |
| 3 or 4 Children | 7,965 (83.9%) | 1,532 (16.1%) |
| 5 or more Children | 658 (81.3%) | 151 (18.7%) |
| Total | 101,343 (94.2%) | 6,238 (5.8%) |
Income Below Poverty Among Single-Parent Households in Area Code 430
According to the poverty data in Area Code 430, 14.0% or 1,267 single-father households and 29.6% or 8,166 single-mother households are living below the poverty line. Among single-father households, those with 5 or more children have the highest poverty rate, with 116 households (74.8%) experiencing poverty. Likewise, among single-mother households, those with 5 or more children have the highest poverty rate, with 261 households (59.2%) falling below the poverty line.

| Children | Single Father | Single Mother |
| No Children | 313 (7.4%) | 1,299 (14.1%) |
| 1 or 2 Children | 713 (17.9%) | 5,159 (33.7%) |
| 3 or 4 Children | 125 (18.5%) | 1,447 (54.6%) |
| 5 or more Children | 116 (74.8%) | 261 (59.2%) |
| Total | 1,267 (14.0%) | 8,166 (29.6%) |
Income Below Poverty Among Married-Couple vs Single-Parent Households in Area Code 430
The poverty data for Area Code 430 shows that 6,238 of the married-couple family households (5.8%) and 9,433 of the single-parent households (25.7%) are living below the poverty level. Within the married-couple family households, those with 5 or more children have the highest poverty rate, with 151 households (18.7%) falling below the poverty line. Among the single-parent households, those with 5 or more children have the highest poverty rate, with 377 household (63.3%) living below poverty.
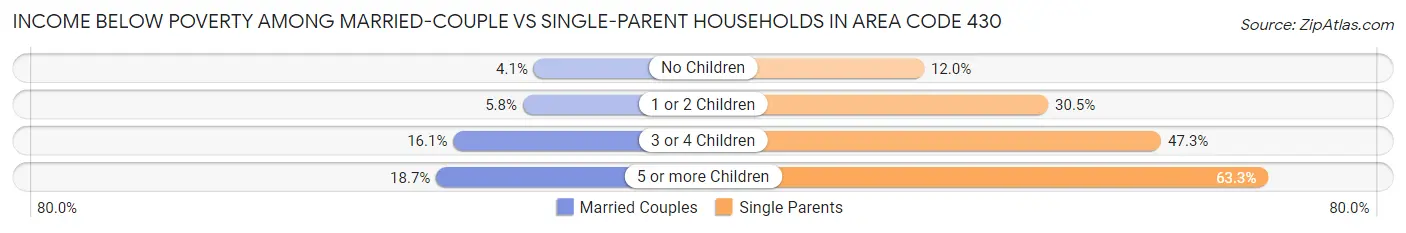
| Children | Married-Couple Families | Single-Parent Households |
| No Children | 2,653 (4.1%) | 1,612 (12.0%) |
| 1 or 2 Children | 1,902 (5.8%) | 5,872 (30.5%) |
| 3 or 4 Children | 1,532 (16.1%) | 1,572 (47.3%) |
| 5 or more Children | 151 (18.7%) | 377 (63.3%) |
| Total | 6,238 (5.8%) | 9,433 (25.7%) |
Race in Area Code 430
The most populous races in Area Code 430 are White / Caucasian (426,414 | 73.9%), Hispanic or Latino (89,847 | 15.6%), and Black / African American (78,554 | 13.6%).
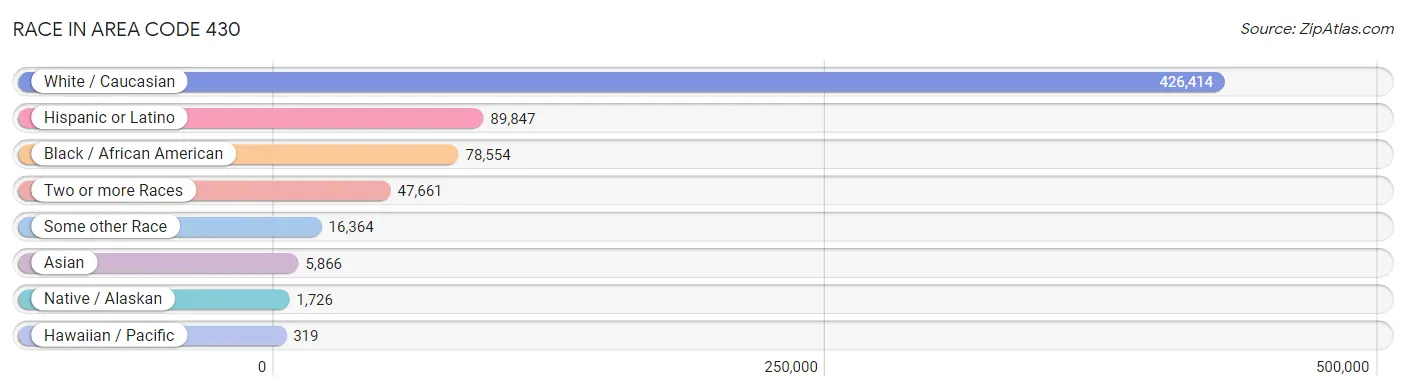
| Race | # Population | % Population |
| Asian | 5,866 | 1.0% |
| Black / African American | 78,554 | 13.6% |
| Hawaiian / Pacific | 319 | 0.1% |
| Hispanic or Latino | 89,847 | 15.6% |
| Native / Alaskan | 1,726 | 0.3% |
| White / Caucasian | 426,414 | 73.9% |
| Two or more Races | 47,661 | 8.3% |
| Some other Race | 16,364 | 2.8% |
| Total | 576,904 | 100.0% |
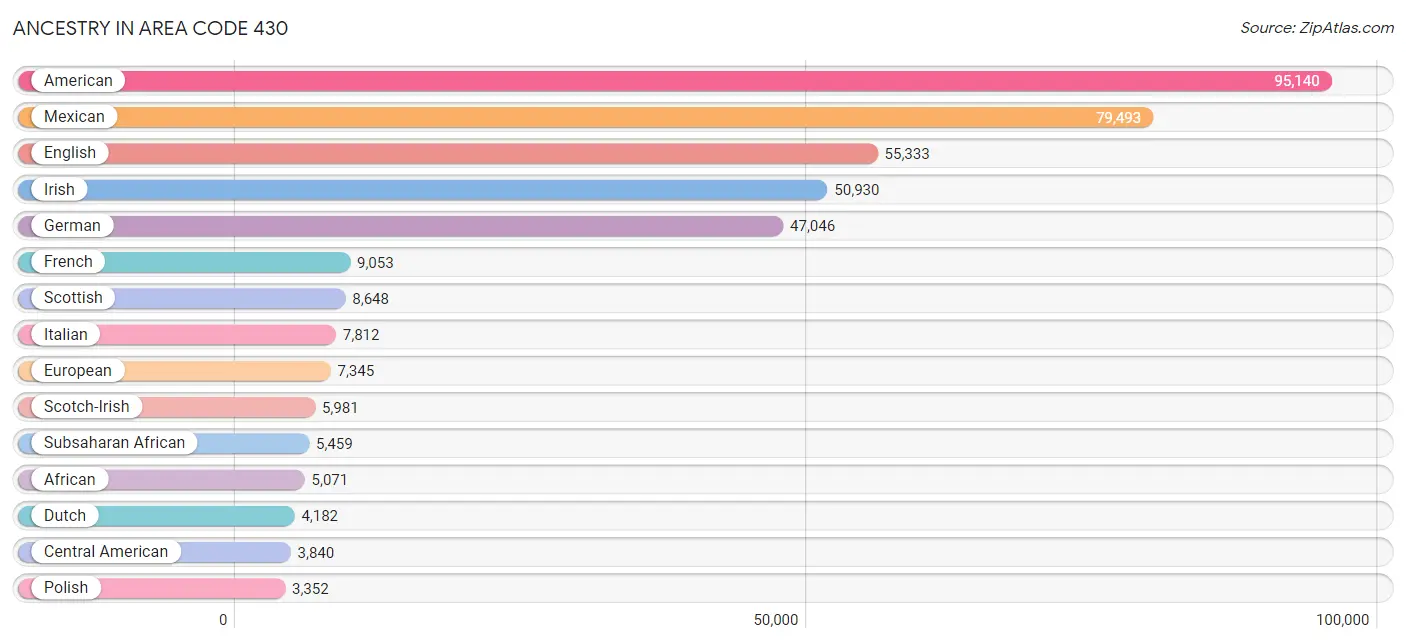
Ancestry in Area Code 430
The most populous ancestries reported in Area Code 430 are American (95,140 | 16.5%), Mexican (79,493 | 13.8%), English (55,333 | 9.6%), Irish (50,930 | 8.8%), and German (47,046 | 8.2%), together accounting for 56.8% of all Area Code 430 residents.
| Ancestry | # Population | % Population |
| African | 5,071 | 0.9% |
| Albanian | 102 | 0.0% |
| American | 95,140 | 16.5% |
| Apache | 449 | 0.1% |
| Arab | 667 | 0.1% |
| Argentinean | 32 | 0.0% |
| Armenian | 62 | 0.0% |
| Australian | 186 | 0.0% |
| Austrian | 292 | 0.1% |
| Bahamian | 25 | 0.0% |
| Basque | 30 | 0.0% |
| Belgian | 277 | 0.1% |
| Belizean | 37 | 0.0% |
| Bermudan | 18 | 0.0% |
| Bhutanese | 346 | 0.1% |
| Blackfeet | 148 | 0.0% |
| Bolivian | 65 | 0.0% |
| Brazilian | 86 | 0.0% |
| British | 2,282 | 0.4% |
| Burmese | 743 | 0.1% |
| Cajun | 314 | 0.1% |
| Cambodian | 75 | 0.0% |
| Canadian | 431 | 0.1% |
| Carpatho Rusyn | 13 | 0.0% |
| Celtic | 48 | 0.0% |
| Central American | 3,840 | 0.7% |
| Central American Indian | 166 | 0.0% |
| Cherokee | 2,504 | 0.4% |
| Chickasaw | 161 | 0.0% |
| Chilean | 76 | 0.0% |
| Chippewa | 46 | 0.0% |
| Choctaw | 678 | 0.1% |
| Colombian | 287 | 0.1% |
| Comanche | 251 | 0.0% |
| Costa Rican | 93 | 0.0% |
| Cree | 10 | 0.0% |
| Creek | 67 | 0.0% |
| Croatian | 120 | 0.0% |
| Crow | 45 | 0.0% |
| Cuban | 382 | 0.1% |
| Czech | 2,074 | 0.4% |
| Czechoslovakian | 305 | 0.1% |
| Danish | 494 | 0.1% |
| Delaware | 23 | 0.0% |
| Dominican | 238 | 0.0% |
| Dutch | 4,182 | 0.7% |
| Dutch West Indian | 603 | 0.1% |
| Eastern European | 333 | 0.1% |
| Ecuadorian | 100 | 0.0% |
| Egyptian | 65 | 0.0% |
| English | 55,333 | 9.6% |
| Estonian | 22 | 0.0% |
| European | 7,345 | 1.3% |
| Filipino | 100 | 0.0% |
| Finnish | 165 | 0.0% |
| French | 9,053 | 1.6% |
| French American Indian | 3 | 0.0% |
| French Canadian | 825 | 0.1% |
| German | 47,046 | 8.2% |
| Greek | 242 | 0.0% |
| Guamanian / Chamorro | 61 | 0.0% |
| Guatemalan | 600 | 0.1% |
| Haitian | 189 | 0.0% |
| Honduran | 726 | 0.1% |
| Hungarian | 200 | 0.0% |
| Icelander | 6 | 0.0% |
| Indian (Asian) | 1,130 | 0.2% |
| Indonesian | 25 | 0.0% |
| Iranian | 516 | 0.1% |
| Irish | 50,930 | 8.8% |
| Iroquois | 30 | 0.0% |
| Israeli | 122 | 0.0% |
| Italian | 7,812 | 1.3% |
| Jamaican | 85 | 0.0% |
| Japanese | 624 | 0.1% |
| Kenyan | 65 | 0.0% |
| Korean | 1,621 | 0.3% |
| Latvian | 16 | 0.0% |
| Lebanese | 145 | 0.0% |
| Lithuanian | 184 | 0.0% |
| Lumbee | 7 | 0.0% |
| Luxembourger | 16 | 0.0% |
| Malaysian | 250 | 0.0% |
| Maltese | 14 | 0.0% |
| Mexican | 79,493 | 13.8% |
| Mexican American Indian | 239 | 0.0% |
| Mongolian | 34 | 0.0% |
| Native Hawaiian | 420 | 0.1% |
| Navajo | 334 | 0.1% |
| New Zealander | 7 | 0.0% |
| Nicaraguan | 106 | 0.0% |
| Nigerian | 180 | 0.0% |
| Northern European | 452 | 0.1% |
| Norwegian | 2,760 | 0.5% |
| Osage | 5 | 0.0% |
| Ottawa | 29 | 0.0% |
| Paiute | 4 | 0.0% |
| Pakistani | 126 | 0.0% |
| Palestinian | 171 | 0.0% |
| Panamanian | 68 | 0.0% |
| Paraguayan | 30 | 0.0% |
| Pennsylvania German | 83 | 0.0% |
| Peruvian | 233 | 0.0% |
| Polish | 3,352 | 0.6% |
| Portuguese | 497 | 0.1% |
| Potawatomi | 28 | 0.0% |
| Pueblo | 32 | 0.0% |
| Puerto Rican | 1,610 | 0.3% |
| Romanian | 161 | 0.0% |
| Russian | 584 | 0.1% |
| Salvadoran | 2,247 | 0.4% |
| Samoan | 50 | 0.0% |
| Scandinavian | 1,316 | 0.2% |
| Scotch-Irish | 5,981 | 1.0% |
| Scottish | 8,648 | 1.5% |
| Seminole | 22 | 0.0% |
| Senegalese | 9 | 0.0% |
| Serbian | 61 | 0.0% |
| Sioux | 181 | 0.0% |
| Slavic | 65 | 0.0% |
| Slovak | 71 | 0.0% |
| Slovene | 18 | 0.0% |
| South African | 26 | 0.0% |
| South American | 970 | 0.2% |
| Spaniard | 492 | 0.1% |
| Spanish | 782 | 0.1% |
| Sri Lankan | 1,848 | 0.3% |
| Subsaharan African | 5,459 | 0.9% |
| Sudanese | 64 | 0.0% |
| Swedish | 2,250 | 0.4% |
| Swiss | 800 | 0.1% |
| Thai | 711 | 0.1% |
| Trinidadian and Tobagonian | 33 | 0.0% |
| Turkish | 178 | 0.0% |
| Ukrainian | 258 | 0.0% |
| Venezuelan | 147 | 0.0% |
| Welsh | 2,351 | 0.4% |
| West Indian | 66 | 0.0% |
| Yaqui | 23 | 0.0% |
| Yugoslavian | 62 | 0.0% | View All 140 Rows |
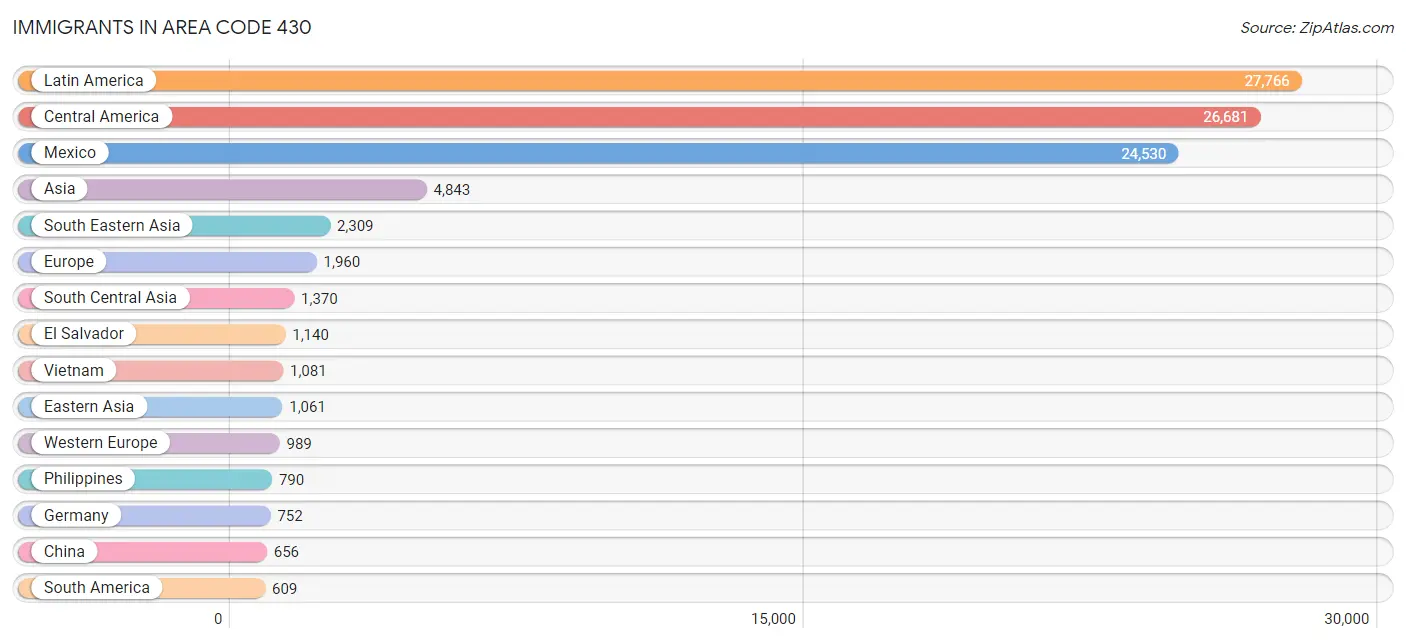
Immigrants in Area Code 430
The most numerous immigrant groups reported in Area Code 430 came from Latin America (27,766 | 4.8%), Central America (26,681 | 4.6%), Mexico (24,530 | 4.3%), Asia (4,843 | 0.8%), and South Eastern Asia (2,309 | 0.4%), together accounting for 14.9% of all Area Code 430 residents.
| Immigration Origin | # Population | % Population |
| Africa | 597 | 0.1% |
| Albania | 27 | 0.0% |
| Argentina | 14 | 0.0% |
| Asia | 4,843 | 0.8% |
| Australia | 288 | 0.1% |
| Austria | 8 | 0.0% |
| Bahamas | 25 | 0.0% |
| Bangladesh | 40 | 0.0% |
| Belgium | 4 | 0.0% |
| Belize | 49 | 0.0% |
| Bolivia | 11 | 0.0% |
| Bosnia and Herzegovina | 18 | 0.0% |
| Brazil | 98 | 0.0% |
| Cambodia | 290 | 0.1% |
| Cameroon | 16 | 0.0% |
| Canada | 573 | 0.1% |
| Caribbean | 476 | 0.1% |
| Central America | 26,681 | 4.6% |
| Chile | 19 | 0.0% |
| China | 656 | 0.1% |
| Colombia | 249 | 0.0% |
| Costa Rica | 24 | 0.0% |
| Cuba | 115 | 0.0% |
| Czechoslovakia | 11 | 0.0% |
| Denmark | 27 | 0.0% |
| Dominican Republic | 77 | 0.0% |
| Eastern Africa | 153 | 0.0% |
| Eastern Asia | 1,061 | 0.2% |
| Eastern Europe | 506 | 0.1% |
| Ecuador | 63 | 0.0% |
| Egypt | 21 | 0.0% |
| El Salvador | 1,140 | 0.2% |
| England | 167 | 0.0% |
| Ethiopia | 28 | 0.0% |
| Europe | 1,960 | 0.3% |
| France | 62 | 0.0% |
| Germany | 752 | 0.1% |
| Ghana | 22 | 0.0% |
| Greece | 48 | 0.0% |
| Guatemala | 340 | 0.1% |
| Haiti | 98 | 0.0% |
| Honduras | 529 | 0.1% |
| Hong Kong | 75 | 0.0% |
| Hungary | 19 | 0.0% |
| India | 501 | 0.1% |
| Indonesia | 3 | 0.0% |
| Iran | 363 | 0.1% |
| Israel | 35 | 0.0% |
| Italy | 4 | 0.0% |
| Jamaica | 48 | 0.0% |
| Japan | 31 | 0.0% |
| Kazakhstan | 9 | 0.0% |
| Kenya | 65 | 0.0% |
| Korea | 299 | 0.1% |
| Laos | 36 | 0.0% |
| Latin America | 27,766 | 4.8% |
| Liberia | 9 | 0.0% |
| Lithuania | 56 | 0.0% |
| Malaysia | 25 | 0.0% |
| Mexico | 24,530 | 4.3% |
| Middle Africa | 16 | 0.0% |
| Morocco | 11 | 0.0% |
| Nepal | 304 | 0.1% |
| Netherlands | 118 | 0.0% |
| Nigeria | 121 | 0.0% |
| Northern Africa | 80 | 0.0% |
| Northern Europe | 364 | 0.1% |
| Oceania | 319 | 0.1% |
| Pakistan | 133 | 0.0% |
| Panama | 69 | 0.0% |
| Peru | 61 | 0.0% |
| Philippines | 790 | 0.1% |
| Poland | 54 | 0.0% |
| Romania | 24 | 0.0% |
| Russia | 86 | 0.0% |
| Scotland | 4 | 0.0% |
| Serbia | 100 | 0.0% |
| South Africa | 60 | 0.0% |
| South America | 609 | 0.1% |
| South Central Asia | 1,370 | 0.2% |
| South Eastern Asia | 2,309 | 0.4% |
| Southern Europe | 101 | 0.0% |
| Spain | 49 | 0.0% |
| Switzerland | 45 | 0.0% |
| Taiwan | 63 | 0.0% |
| Thailand | 57 | 0.0% |
| Trinidad and Tobago | 58 | 0.0% |
| Turkey | 18 | 0.0% |
| Ukraine | 93 | 0.0% |
| Venezuela | 94 | 0.0% |
| Vietnam | 1,081 | 0.2% |
| Western Africa | 161 | 0.0% |
| Western Asia | 55 | 0.0% |
| Western Europe | 989 | 0.2% | View All 94 Rows |
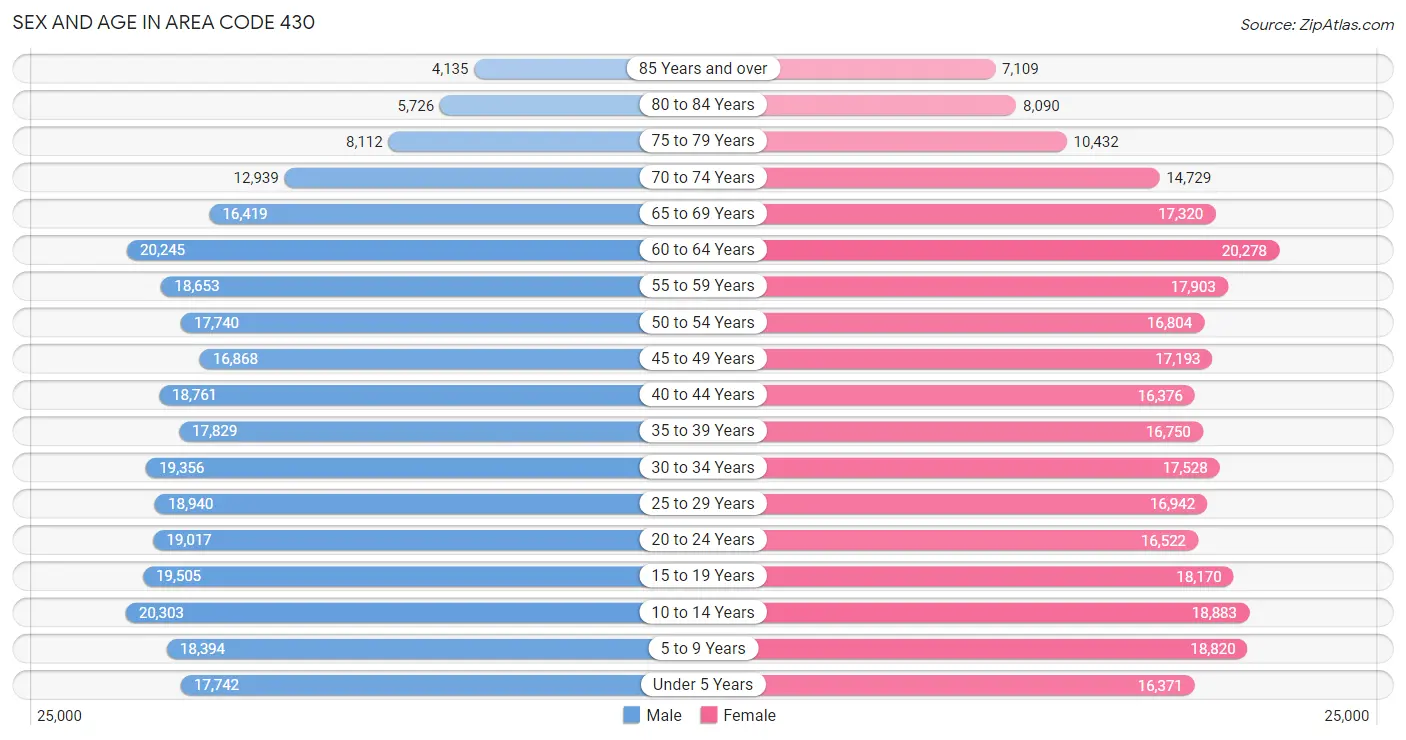
Sex and Age in Area Code 430
Sex and Age in Area Code 430
The most populous age groups in Area Code 430 are 10 to 14 Years (20,303 | 7.0%) for men and 60 to 64 Years (20,278 | 7.1%) for women.
| Age Bracket | Male | Female |
| Under 5 Years | 17,742 (6.1%) | 16,371 (5.7%) |
| 5 to 9 Years | 18,394 (6.3%) | 18,820 (6.6%) |
| 10 to 14 Years | 20,303 (7.0%) | 18,883 (6.6%) |
| 15 to 19 Years | 19,505 (6.7%) | 18,170 (6.4%) |
| 20 to 24 Years | 19,017 (6.5%) | 16,522 (5.8%) |
| 25 to 29 Years | 18,940 (6.5%) | 16,942 (5.9%) |
| 30 to 34 Years | 19,356 (6.7%) | 17,528 (6.1%) |
| 35 to 39 Years | 17,829 (6.1%) | 16,750 (5.9%) |
| 40 to 44 Years | 18,761 (6.5%) | 16,376 (5.7%) |
| 45 to 49 Years | 16,868 (5.8%) | 17,193 (6.0%) |
| 50 to 54 Years | 17,740 (6.1%) | 16,804 (5.9%) |
| 55 to 59 Years | 18,653 (6.4%) | 17,903 (6.2%) |
| 60 to 64 Years | 20,245 (7.0%) | 20,278 (7.1%) |
| 65 to 69 Years | 16,419 (5.7%) | 17,320 (6.0%) |
| 70 to 74 Years | 12,939 (4.4%) | 14,729 (5.1%) |
| 75 to 79 Years | 8,112 (2.8%) | 10,432 (3.6%) |
| 80 to 84 Years | 5,726 (2.0%) | 8,090 (2.8%) |
| 85 Years and over | 4,135 (1.4%) | 7,109 (2.5%) |
| Total | 290,684 (100.0%) | 286,220 (100.0%) |
Families and Households in Area Code 430
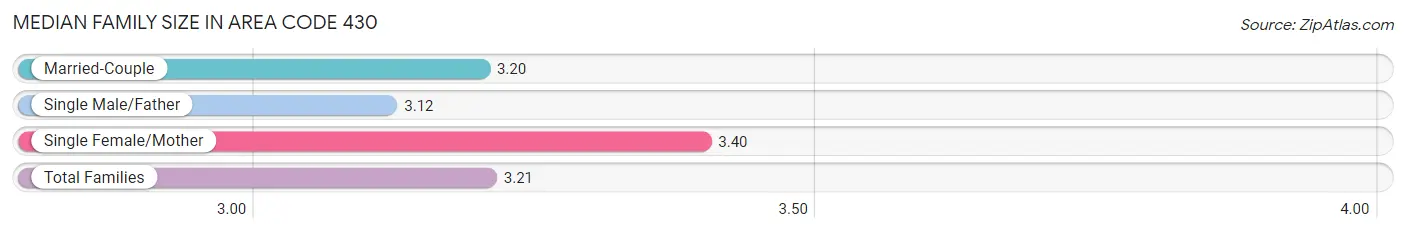
Median Family Size in Area Code 430
The median family size in Area Code 430 is 3.21 persons per family, with single female/mother families (27,621 | 19.2%) accounting for the largest median family size of 3.39759 persons per family. On the other hand, single male/father families (9,045 | 6.3%) represent the smallest median family size with 3.12 persons per family.
| Family Type | # Families | Family Size |
| Married-Couple | 107,581 (74.6%) | 3.20 |
| Single Male/Father | 9,045 (6.3%) | 3.12 |
| Single Female/Mother | 27,621 (19.2%) | 3.40 |
| Total Families | 144,247 (100.0%) | 3.21 |
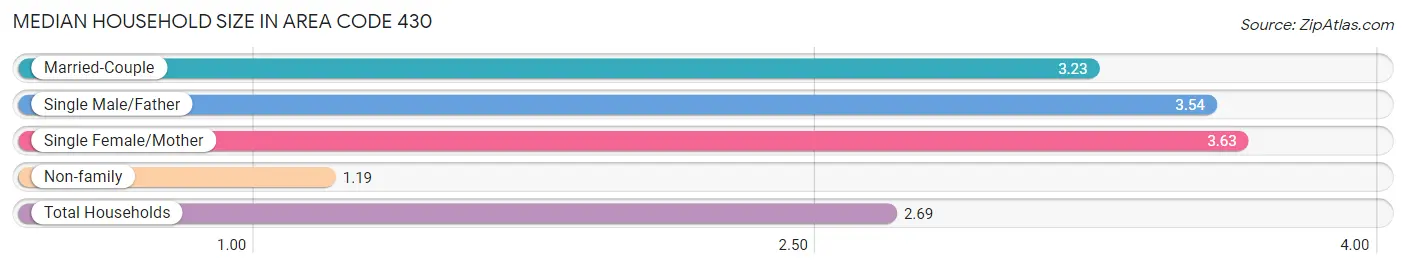
Median Household Size in Area Code 430
The median household size in Area Code 430 is 2.69 persons per household, with single female/mother households (27,621 | 13.1%) accounting for the largest median household size of 3.62981 persons per household. non-family households (65,909 | 31.4%) represent the smallest median household size with 1.19 persons per household.
| Household Type | # Households | Household Size |
| Married-Couple | 107,581 (51.2%) | 3.23 |
| Single Male/Father | 9,045 (4.3%) | 3.54 |
| Single Female/Mother | 27,621 (13.1%) | 3.63 |
| Non-family | 65,909 (31.4%) | 1.19 |
| Total Households | 210,156 (100.0%) | 2.69 |
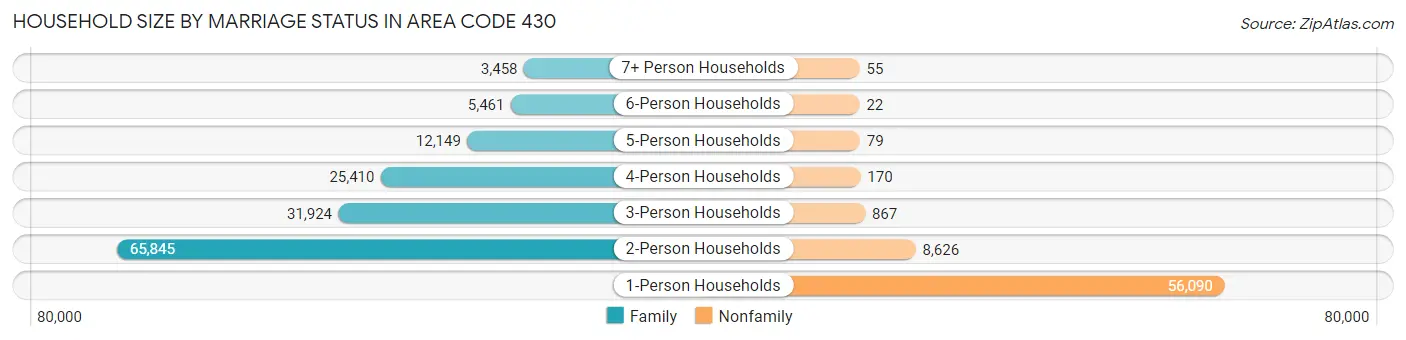
Household Size by Marriage Status in Area Code 430
Out of a total of 210,156 households in Area Code 430, 144,247 (68.6%) are family households, while 65,909 (31.4%) are nonfamily households. The most numerous type of family households are 2-person households, comprising 65,845, and the most common type of nonfamily households are 1-person households, comprising 56,090.
| Household Size | Family Households | Nonfamily Households |
| 1-Person Households | - | 56,090 (26.7%) |
| 2-Person Households | 65,845 (31.3%) | 8,626 (4.1%) |
| 3-Person Households | 31,924 (15.2%) | 867 (0.4%) |
| 4-Person Households | 25,410 (12.1%) | 170 (0.1%) |
| 5-Person Households | 12,149 (5.8%) | 79 (0.0%) |
| 6-Person Households | 5,461 (2.6%) | 22 (0.0%) |
| 7+ Person Households | 3,458 (1.7%) | 55 (0.0%) |
| Total | 144,247 (68.6%) | 65,909 (31.4%) |
Female Fertility in Area Code 430
Fertility by Age in Area Code 430
Average fertility rate in Area Code 430 is 65.8 births per 1,000 women. Women in the age bracket of 20 to 34 years have the highest fertility rate with 126.9 births per 1,000 women. Women in the age bracket of 20 to 34 years acount for 76.4% of all women with births.
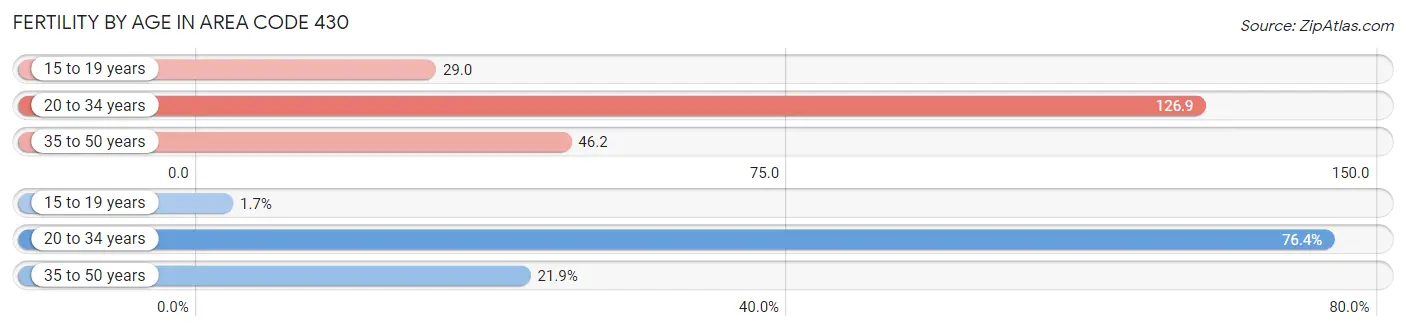
| Age Bracket | Women with Births | Births / 1,000 Women |
| 15 to 19 years | 126 (1.7%) | 29.0 |
| 20 to 34 years | 5,668 (76.4%) | 126.9 |
| 35 to 50 years | 1,624 (21.9%) | 46.2 |
| Total | 7,418 (100.0%) | 65.8 |
Fertility by Age by Marriage Status in Area Code 430
57.0% of women with births (7,418) in Area Code 430 are married. The highest percentage of unmarried women with births falls into 15 to 19 years age bracket with 100.0% of them unmarried at the time of birth, while the lowest percentage of unmarried women with births belong to 20 to 34 years age bracket with 48.9% of them unmarried.
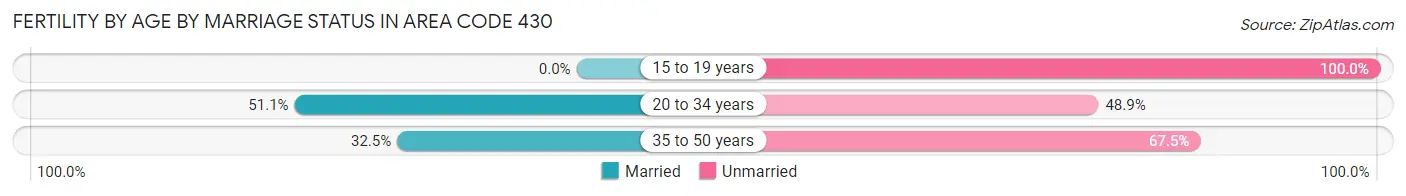
| Age Bracket | Married | Unmarried |
| 15 to 19 years | 0 (0.0%) | 126 (100.0%) |
| 20 to 34 years | 2,897 (51.1%) | 2,771 (48.9%) |
| 35 to 50 years | 528 (32.5%) | 1,096 (67.5%) |
| Total | 4,228 (57.0%) | 3,190 (43.0%) |
Fertility by Education in Area Code 430
Average fertility rate in Area Code 430 is 65.8 births per 1,000 women. Women with the education attainment of graduate degree have the highest fertility rate of 219.9 births per 1,000 women, while women with the education attainment of college or associate's degree have the lowest fertility at 67.0 births per 1,000 women. Women with the education attainment of college or associate's degree represent 36.5% of all women with births.
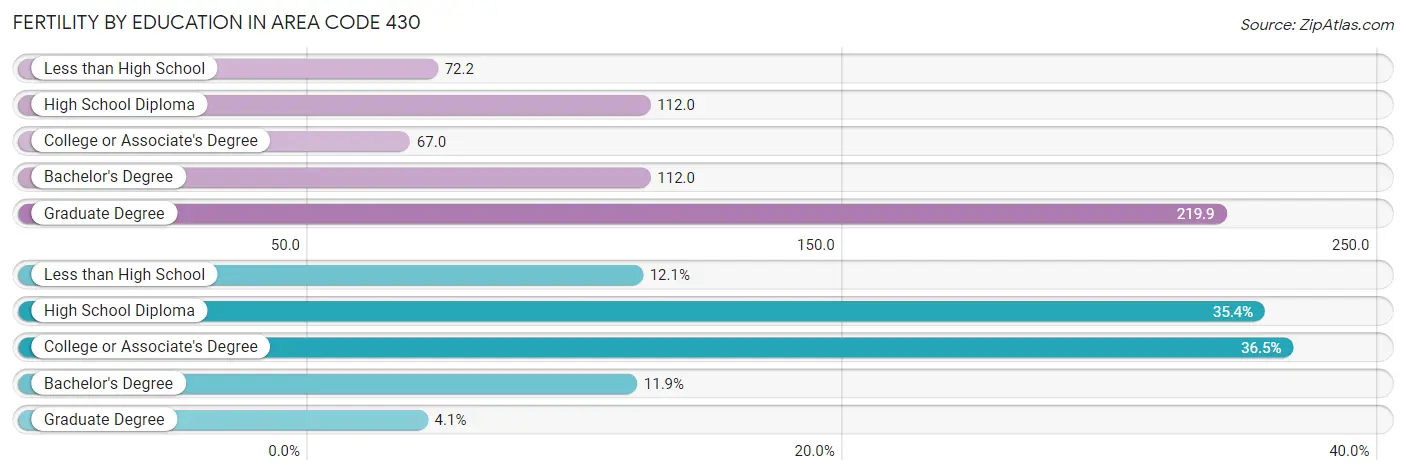
| Educational Attainment | Women with Births | Births / 1,000 Women |
| Less than High School | 899 (12.1%) | 72.2 |
| High School Diploma | 2,628 (35.4%) | 112.0 |
| College or Associate's Degree | 2,707 (36.5%) | 67.0 |
| Bachelor's Degree | 883 (11.9%) | 112.0 |
| Graduate Degree | 301 (4.1%) | 219.9 |
| Total | 7,418 (100.0%) | 65.8 |
Fertility by Education by Marriage Status in Area Code 430
43.0% of women with births in Area Code 430 are unmarried. Women with the educational attainment of graduate degree are most likely to be married with 100.0% of them married at childbirth, while women with the educational attainment of less than high school are least likely to be married with 89.3% of them unmarried at childbirth.
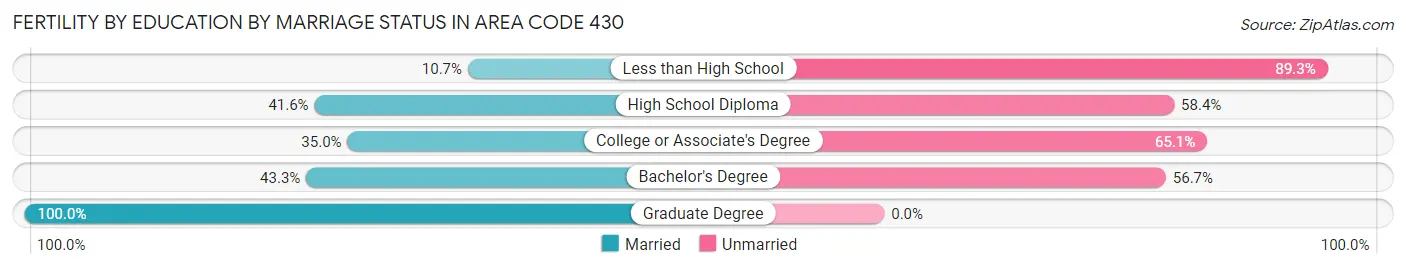
| Educational Attainment | Married | Unmarried |
| Less than High School | 96 (10.7%) | 803 (89.3%) |
| High School Diploma | 1,093 (41.6%) | 1,535 (58.4%) |
| College or Associate's Degree | 946 (34.9%) | 1,761 (65.0%) |
| Bachelor's Degree | 382 (43.3%) | 501 (56.7%) |
| Graduate Degree | 301 (100.0%) | 0 (0.0%) |
| Total | 4,228 (57.0%) | 3,190 (43.0%) |
Employment Characteristics in Area Code 430
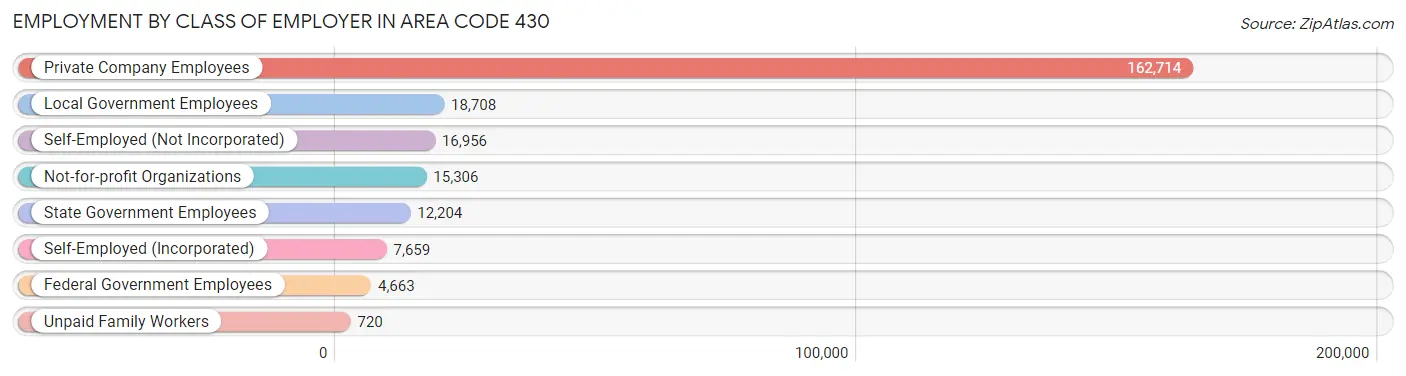
Employment by Class of Employer in Area Code 430
Among the 238,930 employed individuals in Area Code 430, private company employees (162,714 | 68.1%), local government employees (18,708 | 7.8%), and self-employed (not incorporated) (16,956 | 7.1%) make up the most common classes of employment.
| Employer Class | # Employees | % Employees |
| Private Company Employees | 162,714 | 68.1% |
| Self-Employed (Incorporated) | 7,659 | 3.2% |
| Self-Employed (Not Incorporated) | 16,956 | 7.1% |
| Not-for-profit Organizations | 15,306 | 6.4% |
| Local Government Employees | 18,708 | 7.8% |
| State Government Employees | 12,204 | 5.1% |
| Federal Government Employees | 4,663 | 1.9% |
| Unpaid Family Workers | 720 | 0.3% |
| Total | 238,930 | 100.0% |
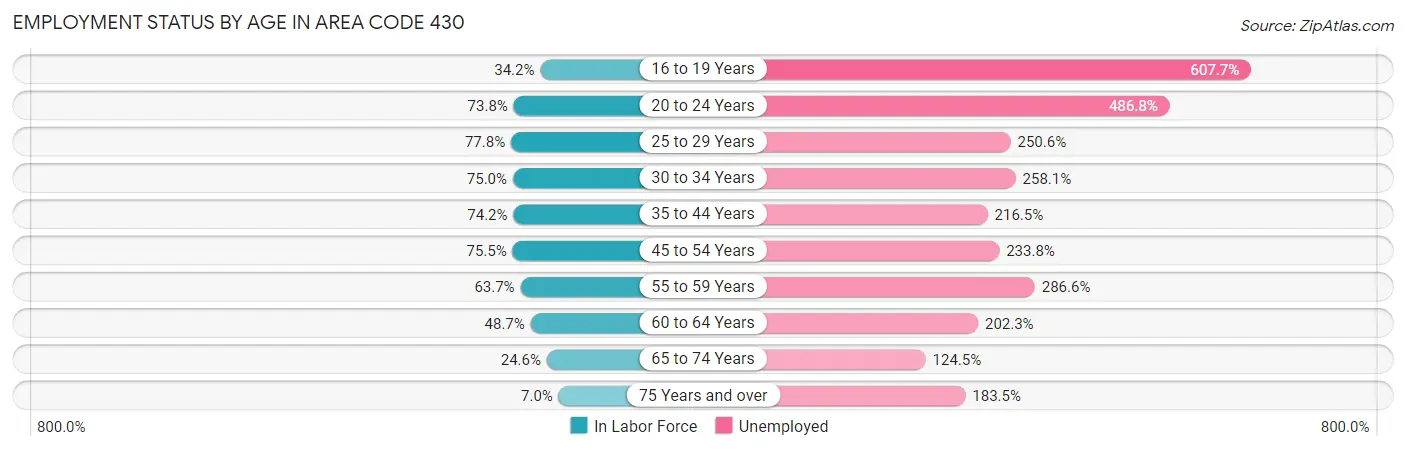
Employment Status by Age in Area Code 430
According to the labor force statistics for Area Code 430, out of the total population over 16 years of age (458,352), 55.2% or 253,194 individuals are in the labor force, with 5.0% or 12,736 of them unemployed. The age group with the highest labor force participation rate is 25 to 29 years, with 77.8% or 27,902 individuals in the labor force. Within the labor force, the 16 to 19 years age range has the highest percentage of unemployed individuals, with 607.7% or 61,609 of them being unemployed.
| Age Bracket | In Labor Force | Unemployed |
| 16 to 19 Years | 10,137 (34.2%) | 61,609 (607.7%) |
| 20 to 24 Years | 26,224 (73.8%) | 127,658 (486.8%) |
| 25 to 29 Years | 27,903 (77.8%) | 69,922 (250.6%) |
| 30 to 34 Years | 27,650 (75.0%) | 71,370 (258.1%) |
| 35 to 44 Years | 51,747 (74.2%) | 112,039 (216.5%) |
| 45 to 54 Years | 51,770 (75.5%) | 121,036 (233.8%) |
| 55 to 59 Years | 23,302 (63.7%) | 66,781 (286.6%) |
| 60 to 64 Years | 19,720 (48.7%) | 39,890 (202.3%) |
| 65 to 74 Years | 15,082 (24.6%) | 18,777 (124.5%) |
| 75 Years and over | 3,038 (7.0%) | 5,577 (183.5%) |
| Total | 253,206 (55.2%) | 12,741 (5.0%) |
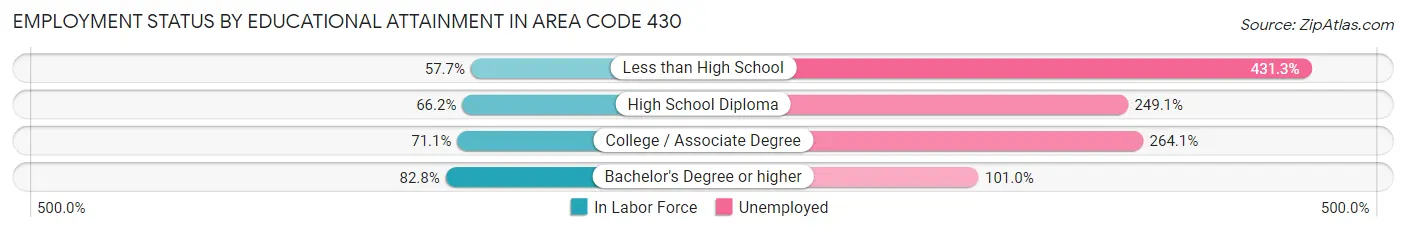
Employment Status by Educational Attainment in Area Code 430
According to labor force statistics for Area Code 430, 69.7% of individuals (200,852) out of the total population between 25 and 64 years of age (288,166) are in the labor force, with 231.9% or 465,776 of them being unemployed. The group with the highest labor force participation rate are those with the educational attainment of bachelor's degree or higher, with 82.8% or 45,277 individuals in the labor force. Within the labor force, individuals with less than high school education have the highest percentage of unemployment, with 431.3% or 100,946 of them being unemployed.
| Educational Attainment | In Labor Force | Unemployed |
| Less than High School | 23,405 (57.7%) | 174,953 (431.3%) |
| High School Diploma | 62,078 (66.2%) | 233,740 (249.1%) |
| College / Associate Degree | 70,375 (71.1%) | 261,596 (264.1%) |
| Bachelor's Degree or higher | 45,275 (82.8%) | 55,263 (101.0%) |
| Total | 200,841 (69.7%) | 668,257 (231.9%) |
Employment Occupations by Sex in Area Code 430
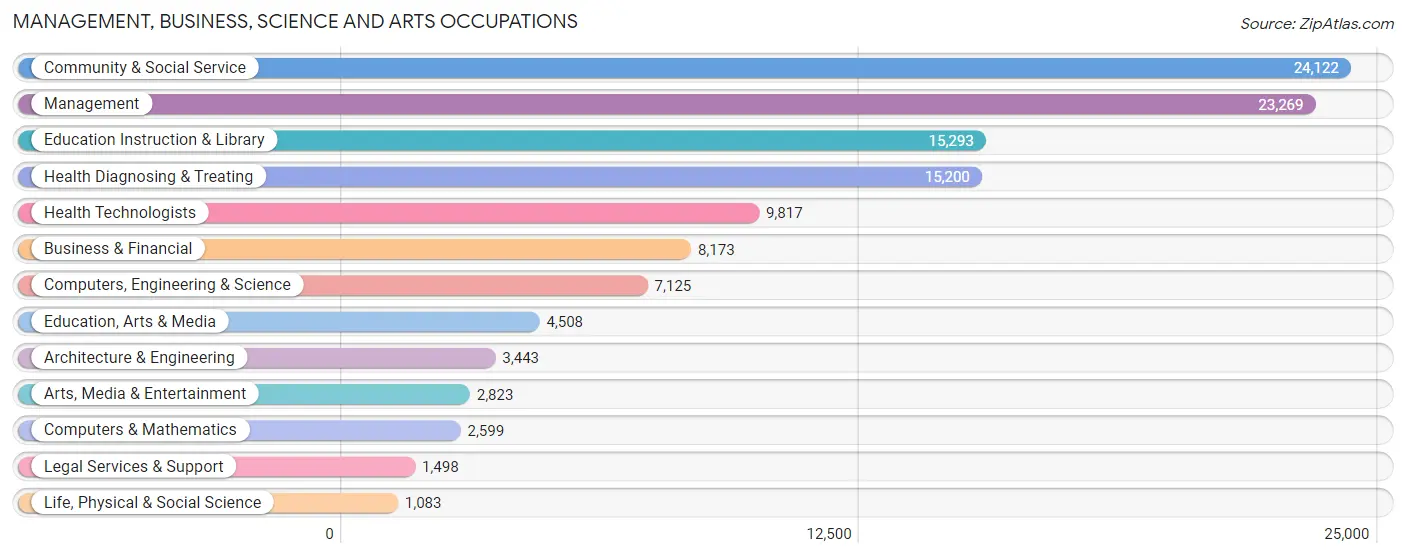
Management, Business, Science and Arts Occupations
The most common Management, Business, Science and Arts occupations in Area Code 430 are Community & Social Service (24,122 | 9.9%), Management (23,269 | 9.6%), Education Instruction & Library (15,293 | 6.3%), Health Diagnosing & Treating (15,200 | 6.3%), and Health Technologists (9,817 | 4.0%).
Management, Business, Science and Arts Occupations by Sex
Within the Management, Business, Science and Arts occupations in Area Code 430, the most male-oriented occupations are Architecture & Engineering (90.8%), Computers, Engineering & Science (83.3%), and Computers & Mathematics (76.6%), while the most female-oriented occupations are Health Diagnosing & Treating (76.3%), Health Technologists (74.3%), and Education Instruction & Library (73.7%).
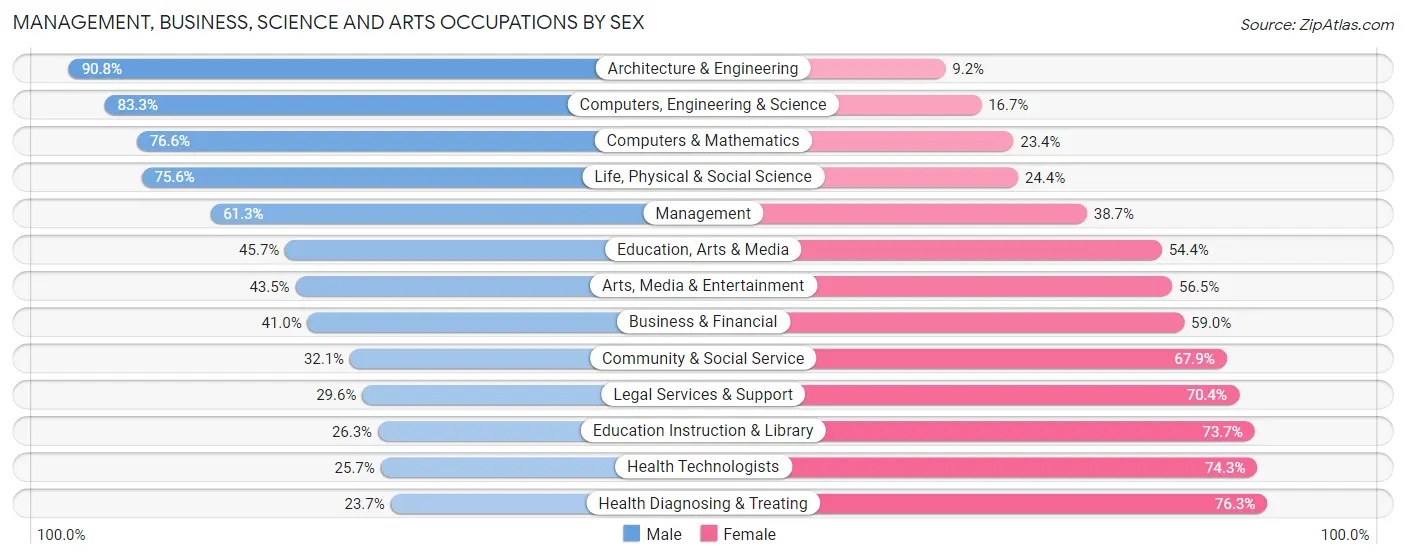
| Occupation | Male | Female |
| Management | 14,260 (61.3%) | 9,009 (38.7%) |
| Business & Financial | 3,349 (41.0%) | 4,824 (59.0%) |
| Computers, Engineering & Science | 5,936 (83.3%) | 1,189 (16.7%) |
| Computers & Mathematics | 1,991 (76.6%) | 608 (23.4%) |
| Architecture & Engineering | 3,126 (90.8%) | 317 (9.2%) |
| Life, Physical & Social Science | 819 (75.6%) | 264 (24.4%) |
| Community & Social Service | 7,750 (32.1%) | 16,372 (67.9%) |
| Education, Arts & Media | 2,058 (45.7%) | 2,450 (54.3%) |
| Legal Services & Support | 443 (29.6%) | 1,055 (70.4%) |
| Education Instruction & Library | 4,021 (26.3%) | 11,272 (73.7%) |
| Arts, Media & Entertainment | 1,228 (43.5%) | 1,595 (56.5%) |
| Health Diagnosing & Treating | 3,597 (23.7%) | 11,603 (76.3%) |
| Health Technologists | 2,526 (25.7%) | 7,291 (74.3%) |
| Total (Category) | 34,892 (44.8%) | 42,997 (55.2%) |
| Total (Overall) | 130,571 (53.8%) | 112,150 (46.2%) |
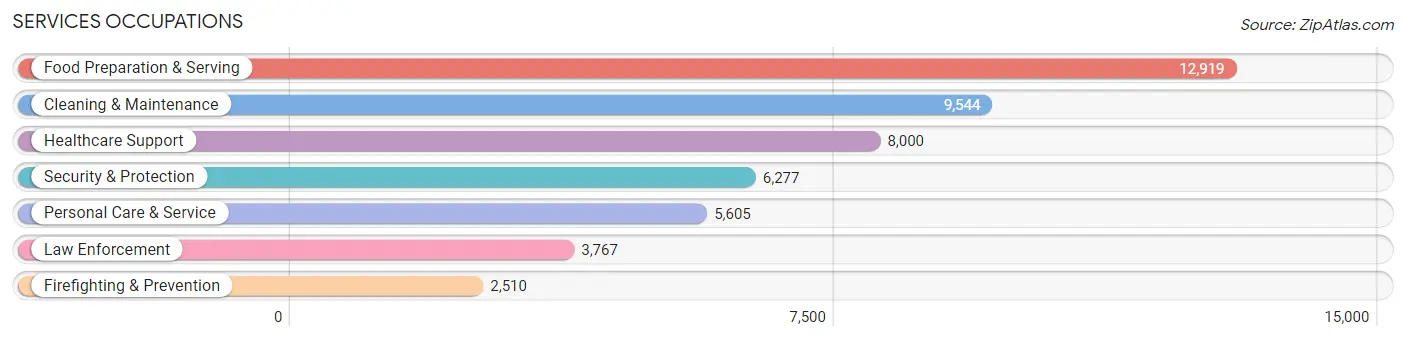
Services Occupations
The most common Services occupations in Area Code 430 are Food Preparation & Serving (12,919 | 5.3%), Cleaning & Maintenance (9,544 | 3.9%), Healthcare Support (8,000 | 3.3%), Security & Protection (6,277 | 2.6%), and Personal Care & Service (5,605 | 2.3%).
Services Occupations by Sex
Within the Services occupations in Area Code 430, the most male-oriented occupations are Firefighting & Prevention (72.2%), Security & Protection (68.0%), and Law Enforcement (65.1%), while the most female-oriented occupations are Healthcare Support (90.6%), Personal Care & Service (73.7%), and Food Preparation & Serving (60.5%).
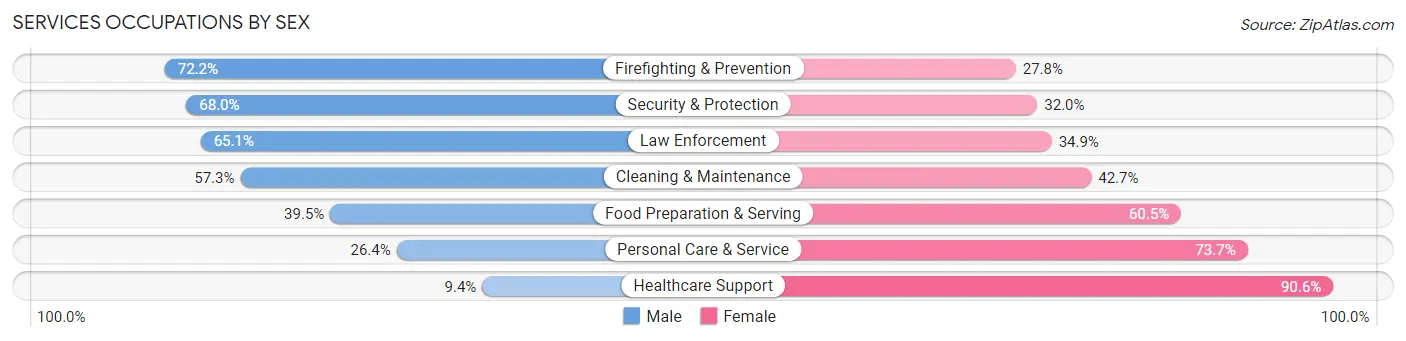
| Occupation | Male | Female |
| Healthcare Support | 751 (9.4%) | 7,249 (90.6%) |
| Security & Protection | 4,266 (68.0%) | 2,011 (32.0%) |
| Firefighting & Prevention | 1,813 (72.2%) | 697 (27.8%) |
| Law Enforcement | 2,453 (65.1%) | 1,314 (34.9%) |
| Food Preparation & Serving | 5,102 (39.5%) | 7,817 (60.5%) |
| Cleaning & Maintenance | 5,467 (57.3%) | 4,077 (42.7%) |
| Personal Care & Service | 1,477 (26.4%) | 4,128 (73.7%) |
| Total (Category) | 17,063 (40.3%) | 25,282 (59.7%) |
| Total (Overall) | 130,571 (53.8%) | 112,150 (46.2%) |
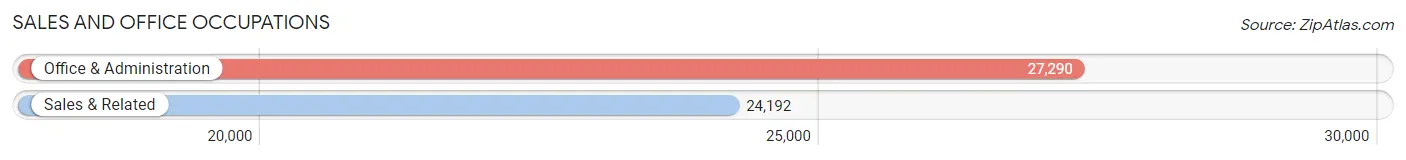
Sales and Office Occupations
The most common Sales and Office occupations in Area Code 430 are Office & Administration (27,290 | 11.2%), and Sales & Related (24,192 | 10.0%).
Sales and Office Occupations by Sex
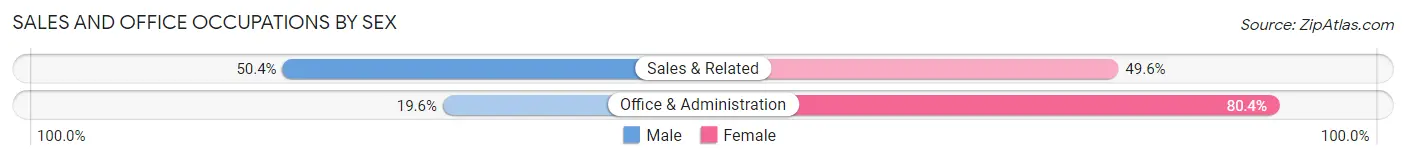
| Occupation | Male | Female |
| Sales & Related | 12,195 (50.4%) | 11,997 (49.6%) |
| Office & Administration | 5,342 (19.6%) | 21,948 (80.4%) |
| Total (Category) | 17,537 (34.1%) | 33,945 (65.9%) |
| Total (Overall) | 130,571 (53.8%) | 112,150 (46.2%) |
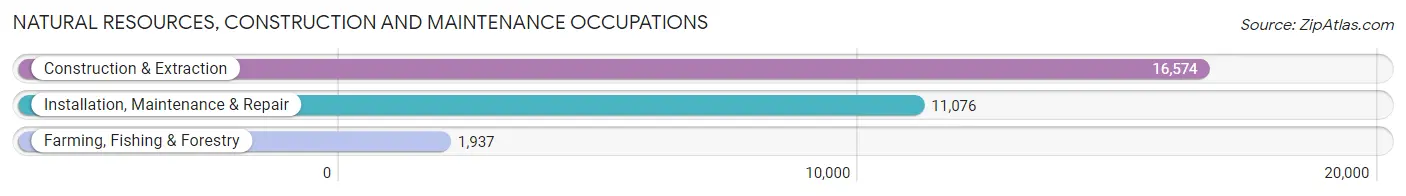
Natural Resources, Construction and Maintenance Occupations
The most common Natural Resources, Construction and Maintenance occupations in Area Code 430 are Construction & Extraction (16,574 | 6.8%), Installation, Maintenance & Repair (11,076 | 4.6%), and Farming, Fishing & Forestry (1,937 | 0.8%).
Natural Resources, Construction and Maintenance Occupations by Sex
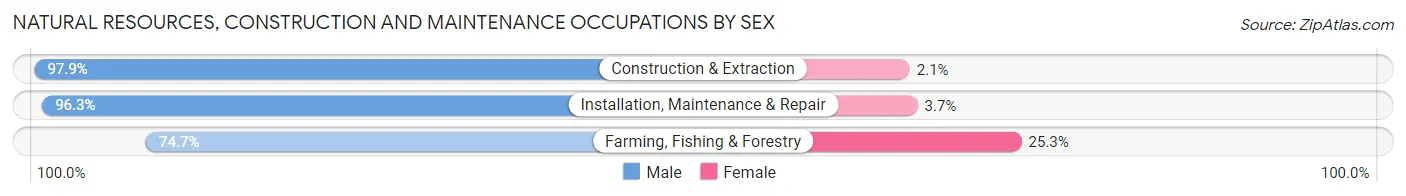
| Occupation | Male | Female |
| Farming, Fishing & Forestry | 1,447 (74.7%) | 490 (25.3%) |
| Construction & Extraction | 16,233 (97.9%) | 341 (2.1%) |
| Installation, Maintenance & Repair | 10,669 (96.3%) | 407 (3.7%) |
| Total (Category) | 28,349 (95.8%) | 1,238 (4.2%) |
| Total (Overall) | 130,571 (53.8%) | 112,150 (46.2%) |
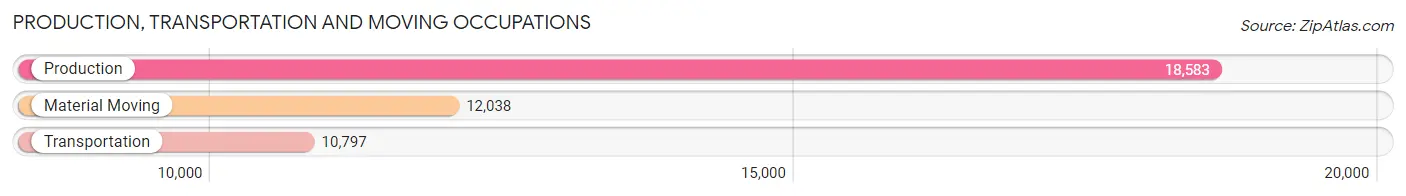
Production, Transportation and Moving Occupations
The most common Production, Transportation and Moving occupations in Area Code 430 are Production (18,583 | 7.7%), Material Moving (12,038 | 5.0%), and Transportation (10,797 | 4.4%).
Production, Transportation and Moving Occupations by Sex
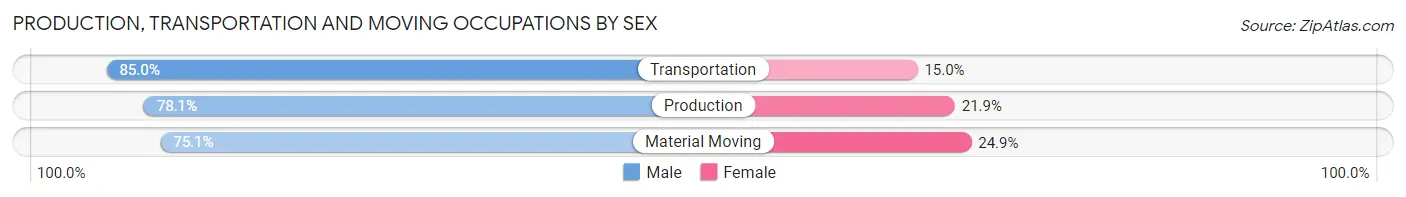
| Occupation | Male | Female |
| Production | 14,517 (78.1%) | 4,066 (21.9%) |
| Transportation | 9,174 (85.0%) | 1,623 (15.0%) |
| Material Moving | 9,039 (75.1%) | 2,999 (24.9%) |
| Total (Category) | 32,730 (79.0%) | 8,688 (21.0%) |
| Total (Overall) | 130,571 (53.8%) | 112,150 (46.2%) |
Employment Industries by Sex in Area Code 430
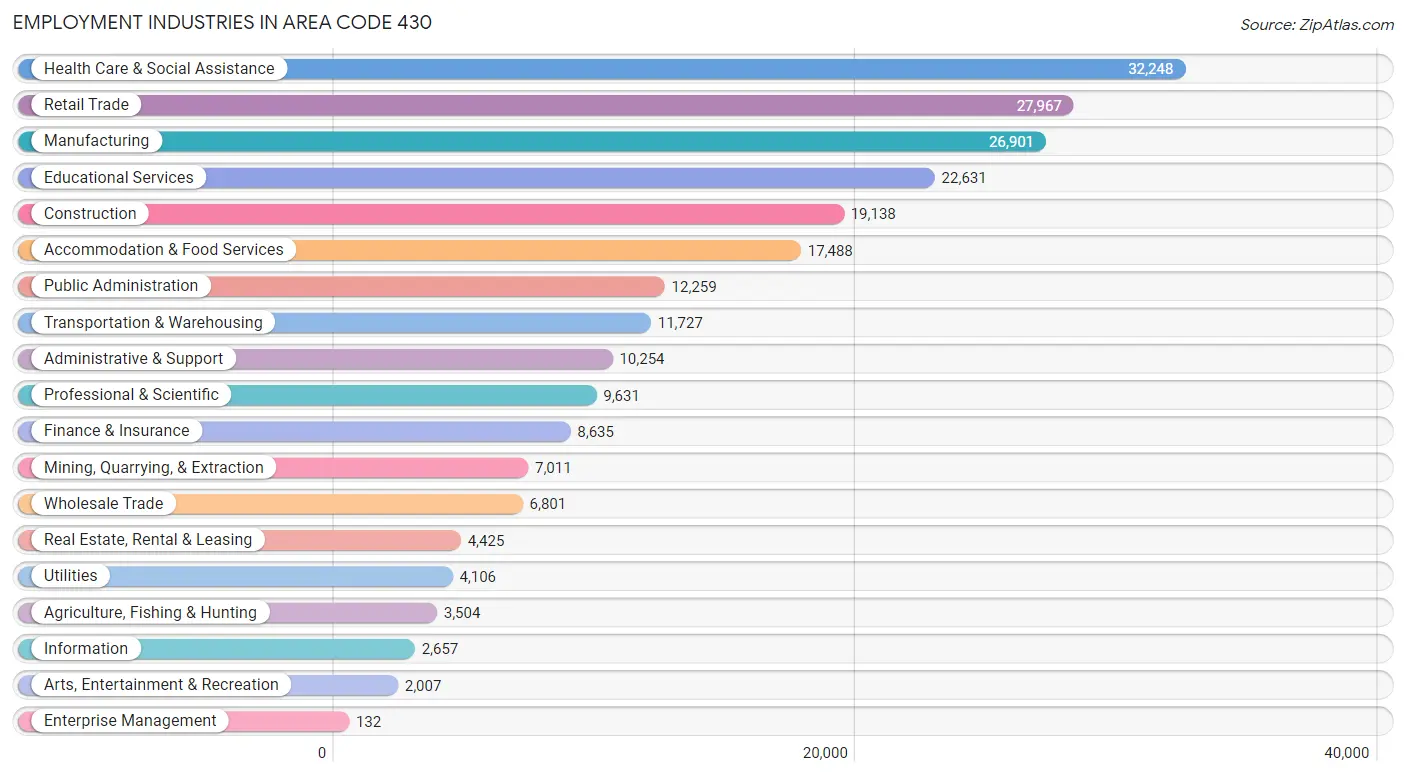
Employment Industries in Area Code 430
The major employment industries in Area Code 430 include Health Care & Social Assistance (32,248 | 13.3%), Retail Trade (27,967 | 11.5%), Manufacturing (26,901 | 11.1%), Educational Services (22,631 | 9.3%), and Construction (19,138 | 7.9%).
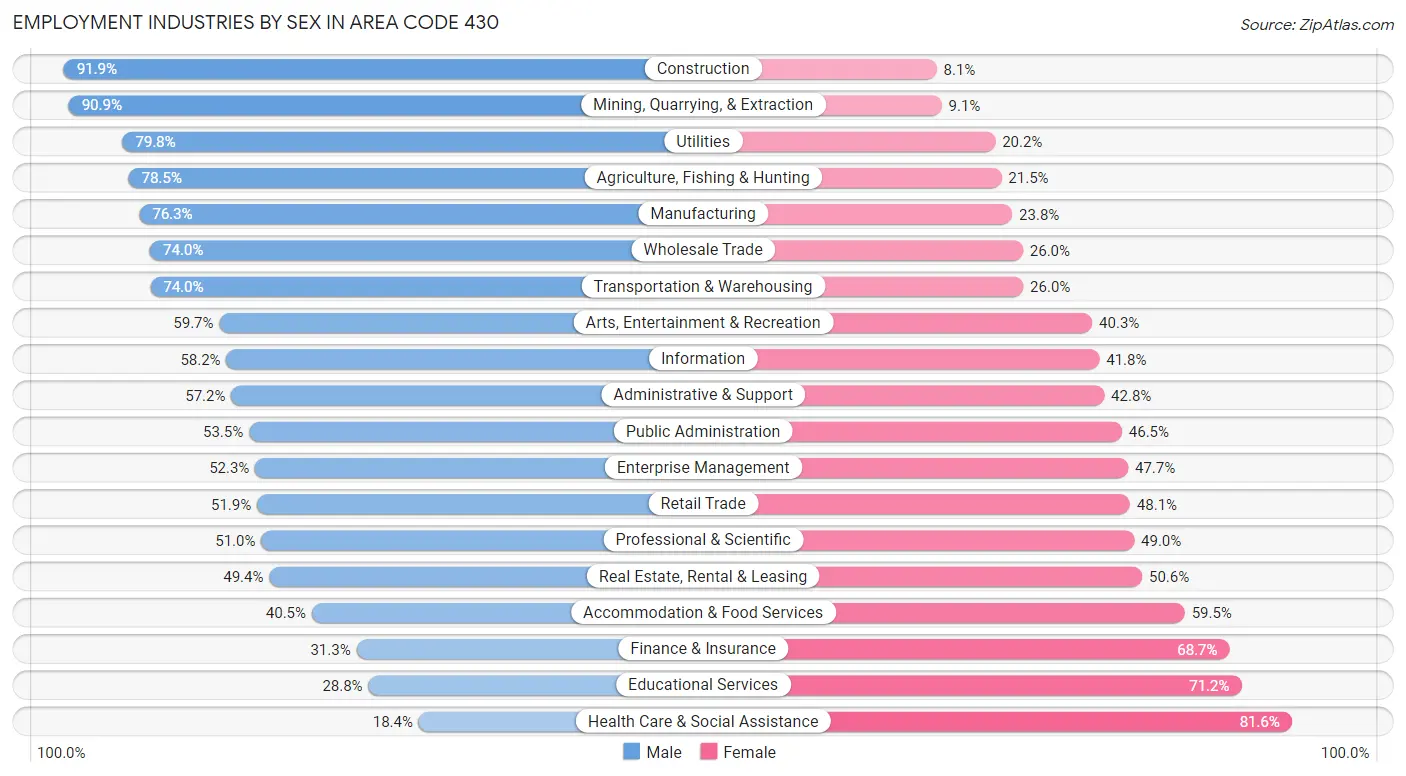
Employment Industries by Sex in Area Code 430
The Area Code 430 industries that see more men than women are Construction (91.9%), Mining, Quarrying, & Extraction (90.9%), and Utilities (79.8%), whereas the industries that tend to have a higher number of women are Health Care & Social Assistance (81.6%), Educational Services (71.2%), and Finance & Insurance (68.7%).
| Industry | Male | Female |
| Agriculture, Fishing & Hunting | 2,750 (78.5%) | 754 (21.5%) |
| Mining, Quarrying, & Extraction | 6,370 (90.9%) | 641 (9.1%) |
| Construction | 17,585 (91.9%) | 1,553 (8.1%) |
| Manufacturing | 20,513 (76.2%) | 6,388 (23.7%) |
| Wholesale Trade | 5,035 (74.0%) | 1,766 (26.0%) |
| Retail Trade | 14,509 (51.9%) | 13,458 (48.1%) |
| Transportation & Warehousing | 8,675 (74.0%) | 3,052 (26.0%) |
| Utilities | 3,275 (79.8%) | 831 (20.2%) |
| Information | 1,547 (58.2%) | 1,110 (41.8%) |
| Finance & Insurance | 2,703 (31.3%) | 5,932 (68.7%) |
| Real Estate, Rental & Leasing | 2,184 (49.4%) | 2,241 (50.6%) |
| Professional & Scientific | 4,913 (51.0%) | 4,718 (49.0%) |
| Enterprise Management | 69 (52.3%) | 63 (47.7%) |
| Administrative & Support | 5,866 (57.2%) | 4,388 (42.8%) |
| Educational Services | 6,525 (28.8%) | 16,106 (71.2%) |
| Health Care & Social Assistance | 5,933 (18.4%) | 26,315 (81.6%) |
| Arts, Entertainment & Recreation | 1,198 (59.7%) | 809 (40.3%) |
| Accommodation & Food Services | 7,089 (40.5%) | 10,399 (59.5%) |
| Public Administration | 6,563 (53.5%) | 5,696 (46.5%) |
| Total | 130,571 (53.8%) | 112,150 (46.2%) |
Education in Area Code 430
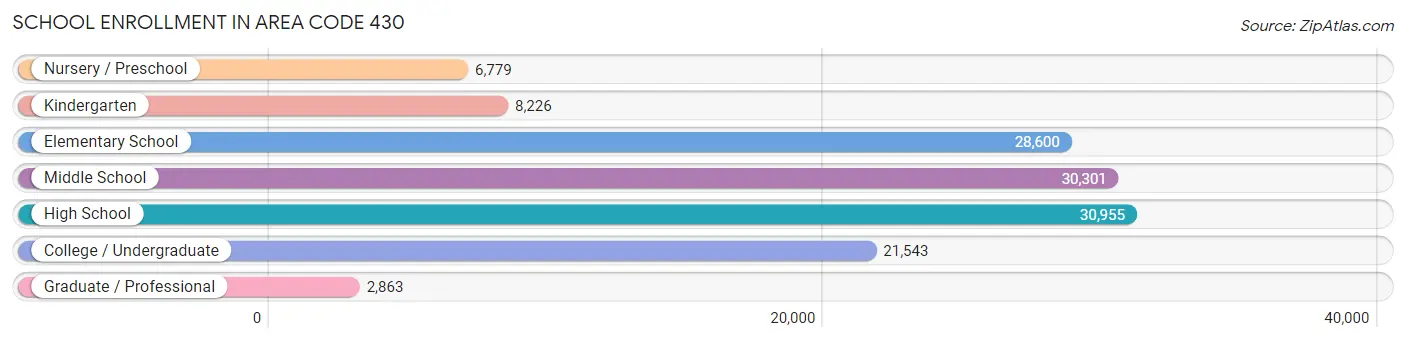
School Enrollment in Area Code 430
The most common levels of schooling among the 129,267 students in Area Code 430 are high school (30,955 | 23.9%), middle school (30,301 | 23.4%), and elementary school (28,600 | 22.1%).
| School Level | # Students | % Students |
| Nursery / Preschool | 6,779 | 5.2% |
| Kindergarten | 8,226 | 6.4% |
| Elementary School | 28,600 | 22.1% |
| Middle School | 30,301 | 23.4% |
| High School | 30,955 | 23.9% |
| College / Undergraduate | 21,543 | 16.7% |
| Graduate / Professional | 2,863 | 2.2% |
| Total | 129,267 | 100.0% |
School Enrollment by Age by Funding Source in Area Code 430
Out of a total of 129,267 students who are enrolled in schools in Area Code 430, 14,325 (11.1%) attend a private institution, while the remaining 114,942 (88.9%) are enrolled in public schools. The age group of 3 to 4 year olds has the highest likelihood of being enrolled in private schools, with 1,595 (31.2% in the age bracket) enrolled. Conversely, the age group of 10 to 14 year olds has the lowest likelihood of being enrolled in a private school, with 34,981 (92.8% in the age bracket) attending a public institution.
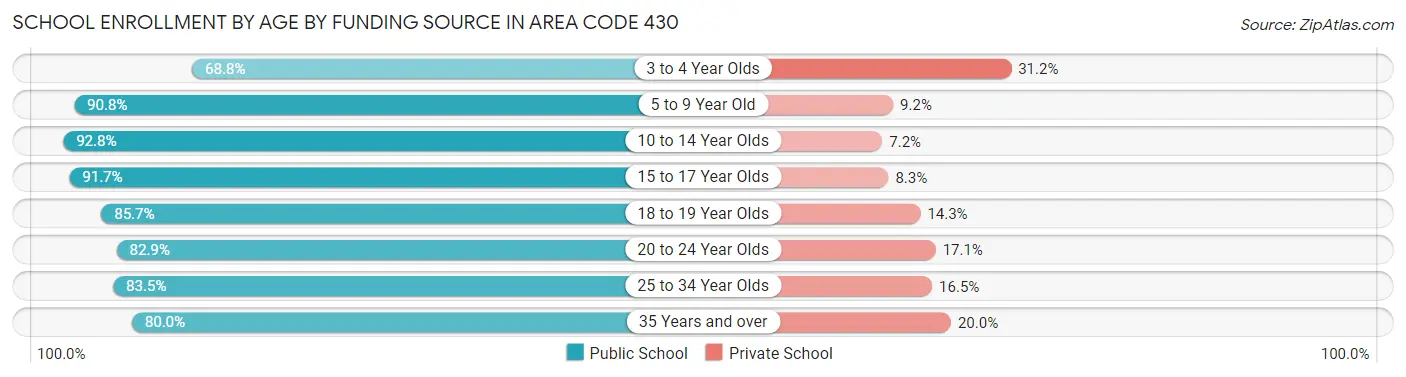
| Age Bracket | Public School | Private School |
| 3 to 4 Year Olds | 3,516 (68.8%) | 1,595 (31.2%) |
| 5 to 9 Year Old | 31,210 (90.8%) | 3,171 (9.2%) |
| 10 to 14 Year Olds | 34,981 (92.8%) | 2,714 (7.2%) |
| 15 to 17 Year Olds | 20,820 (91.7%) | 1,894 (8.3%) |
| 18 to 19 Year Olds | 7,022 (85.7%) | 1,172 (14.3%) |
| 20 to 24 Year Olds | 8,262 (82.9%) | 1,709 (17.1%) |
| 25 to 34 Year Olds | 4,308 (83.5%) | 850 (16.5%) |
| 35 Years and over | 4,835 (80.0%) | 1,208 (20.0%) |
| Total | 114,942 (88.9%) | 14,325 (11.1%) |
Educational Attainment by Field of Study in Area Code 430
Business (16,076 | 19.4%), education (15,999 | 19.3%), science & technology (9,744 | 11.7%), arts & humanities (6,444 | 7.8%), and bio, nature & agricultural (5,859 | 7.1%) are the most common fields of study among 83,019 individuals in Area Code 430 who have obtained a bachelor's degree or higher.
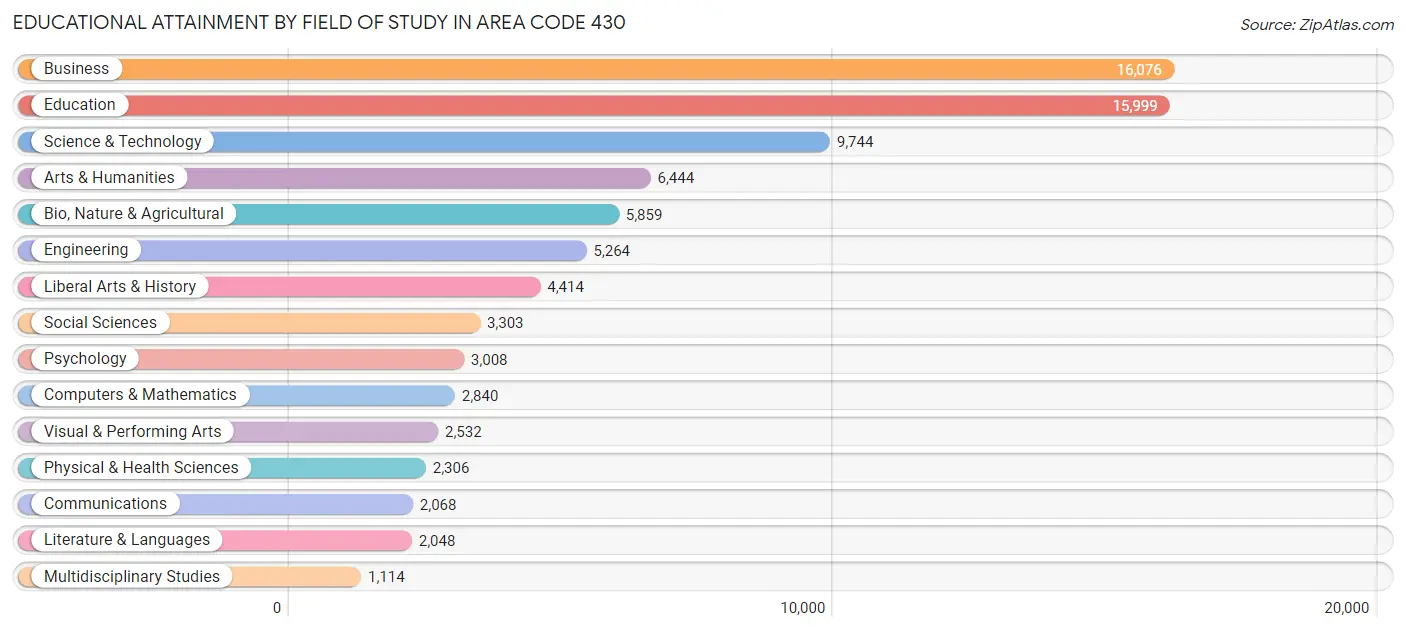
| Field of Study | # Graduates | % Graduates |
| Computers & Mathematics | 2,840 | 3.4% |
| Bio, Nature & Agricultural | 5,859 | 7.1% |
| Physical & Health Sciences | 2,306 | 2.8% |
| Psychology | 3,008 | 3.6% |
| Social Sciences | 3,303 | 4.0% |
| Engineering | 5,264 | 6.3% |
| Multidisciplinary Studies | 1,114 | 1.3% |
| Science & Technology | 9,744 | 11.7% |
| Business | 16,076 | 19.4% |
| Education | 15,999 | 19.3% |
| Literature & Languages | 2,048 | 2.5% |
| Liberal Arts & History | 4,414 | 5.3% |
| Visual & Performing Arts | 2,532 | 3.0% |
| Communications | 2,068 | 2.5% |
| Arts & Humanities | 6,444 | 7.8% |
| Total | 83,019 | 100.0% |
Transportation & Commute in Area Code 430
Vehicle Availability by Sex in Area Code 430
The most prevalent vehicle ownership categories in Area Code 430 are males with 2 vehicles (54,967, accounting for 43.0%) and females with 2 vehicles (44,408, making up 49.9%).
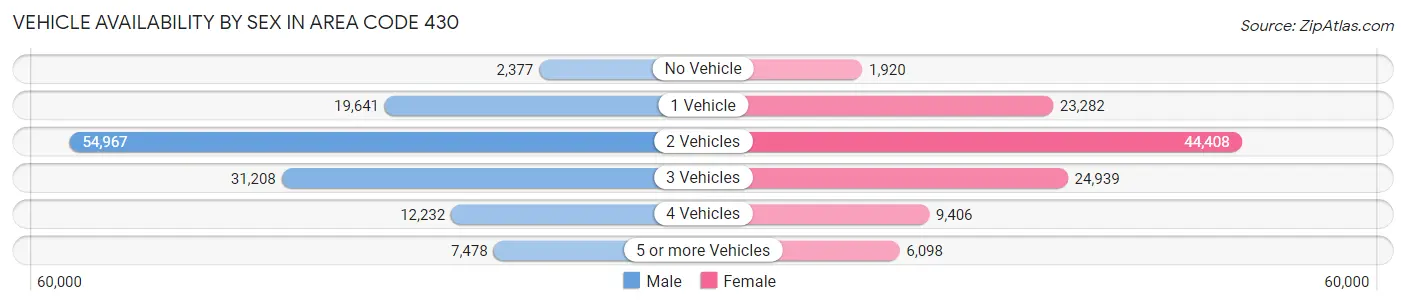
| Vehicles Available | Male | Female |
| No Vehicle | 2,377 (1.9%) | 1,920 (1.7%) |
| 1 Vehicle | 19,641 (15.4%) | 23,282 (21.2%) |
| 2 Vehicles | 54,967 (43.0%) | 44,408 (40.4%) |
| 3 Vehicles | 31,208 (24.4%) | 24,939 (22.7%) |
| 4 Vehicles | 12,232 (9.6%) | 9,406 (8.6%) |
| 5 or more Vehicles | 7,478 (5.9%) | 6,098 (5.5%) |
| Total | 127,903 (100.0%) | 110,053 (100.0%) |
Commute Time in Area Code 430
The most frequently occuring commute durations in Area Code 430 are 10 to 14 minutes (37,831 commuters, 16.8%), 15 to 19 minutes (33,619 commuters, 14.9%), and 5 to 9 minutes (30,932 commuters, 13.7%).
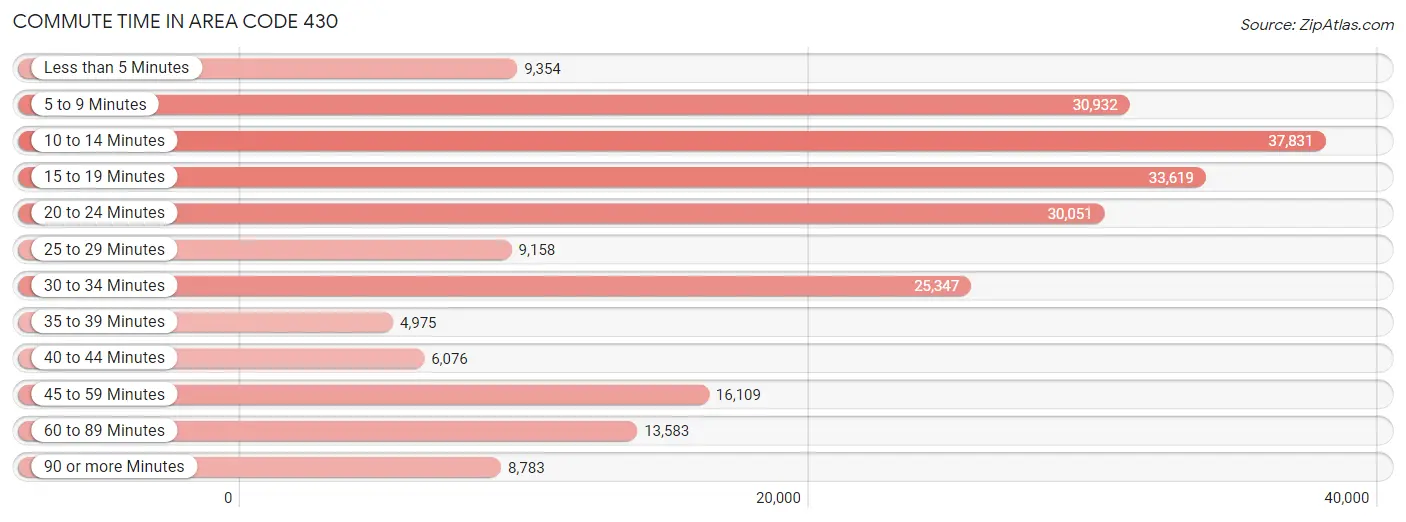
| Commute Time | # Commuters | % Commuters |
| Less than 5 Minutes | 9,354 | 4.1% |
| 5 to 9 Minutes | 30,932 | 13.7% |
| 10 to 14 Minutes | 37,831 | 16.8% |
| 15 to 19 Minutes | 33,619 | 14.9% |
| 20 to 24 Minutes | 30,051 | 13.3% |
| 25 to 29 Minutes | 9,158 | 4.1% |
| 30 to 34 Minutes | 25,347 | 11.2% |
| 35 to 39 Minutes | 4,975 | 2.2% |
| 40 to 44 Minutes | 6,076 | 2.7% |
| 45 to 59 Minutes | 16,109 | 7.1% |
| 60 to 89 Minutes | 13,583 | 6.0% |
| 90 or more Minutes | 8,783 | 3.9% |
Commute Time by Sex in Area Code 430
The most common commute times in Area Code 430 are 10 to 14 minutes (18,418 commuters, 15.0%) for males and 10 to 14 minutes (19,413 commuters, 18.8%) for females.
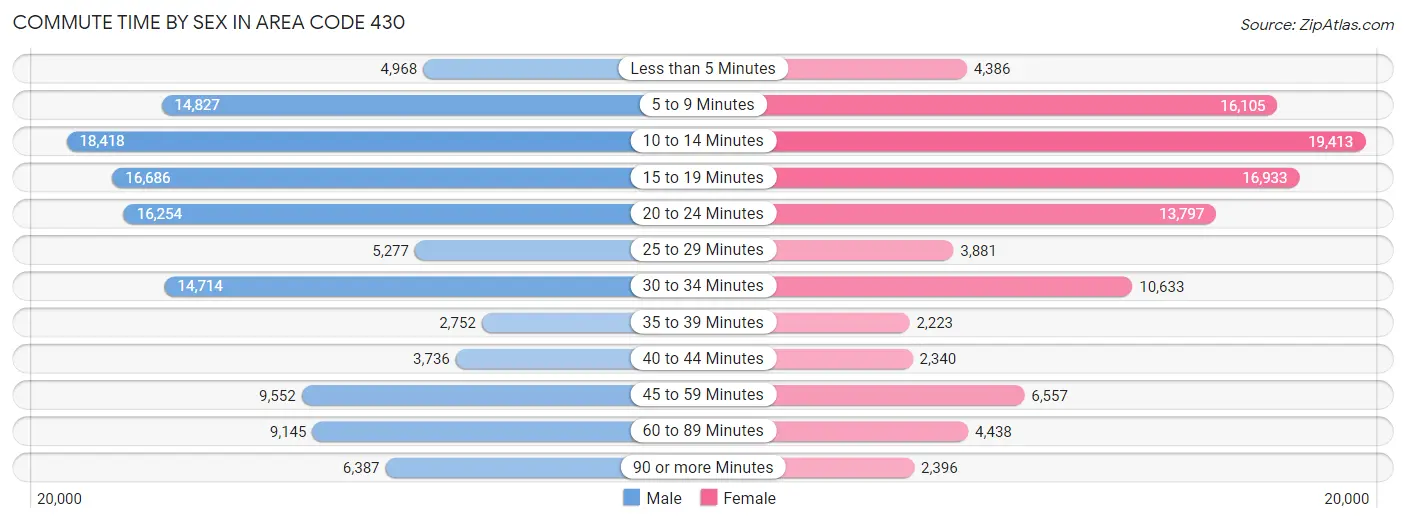
| Commute Time | Male | Female |
| Less than 5 Minutes | 4,968 (4.1%) | 4,386 (4.3%) |
| 5 to 9 Minutes | 14,827 (12.1%) | 16,105 (15.6%) |
| 10 to 14 Minutes | 18,418 (15.0%) | 19,413 (18.8%) |
| 15 to 19 Minutes | 16,686 (13.6%) | 16,933 (16.4%) |
| 20 to 24 Minutes | 16,254 (13.3%) | 13,797 (13.4%) |
| 25 to 29 Minutes | 5,277 (4.3%) | 3,881 (3.8%) |
| 30 to 34 Minutes | 14,714 (12.0%) | 10,633 (10.3%) |
| 35 to 39 Minutes | 2,752 (2.2%) | 2,223 (2.2%) |
| 40 to 44 Minutes | 3,736 (3.0%) | 2,340 (2.3%) |
| 45 to 59 Minutes | 9,552 (7.8%) | 6,557 (6.4%) |
| 60 to 89 Minutes | 9,145 (7.4%) | 4,438 (4.3%) |
| 90 or more Minutes | 6,387 (5.2%) | 2,396 (2.3%) |
Time of Departure to Work by Sex in Area Code 430
The most frequent times of departure to work in Area Code 430 are 7:00 AM to 7:29 AM (18,337, 14.9%) for males and 7:00 AM to 7:29 AM (18,560, 18.0%) for females.
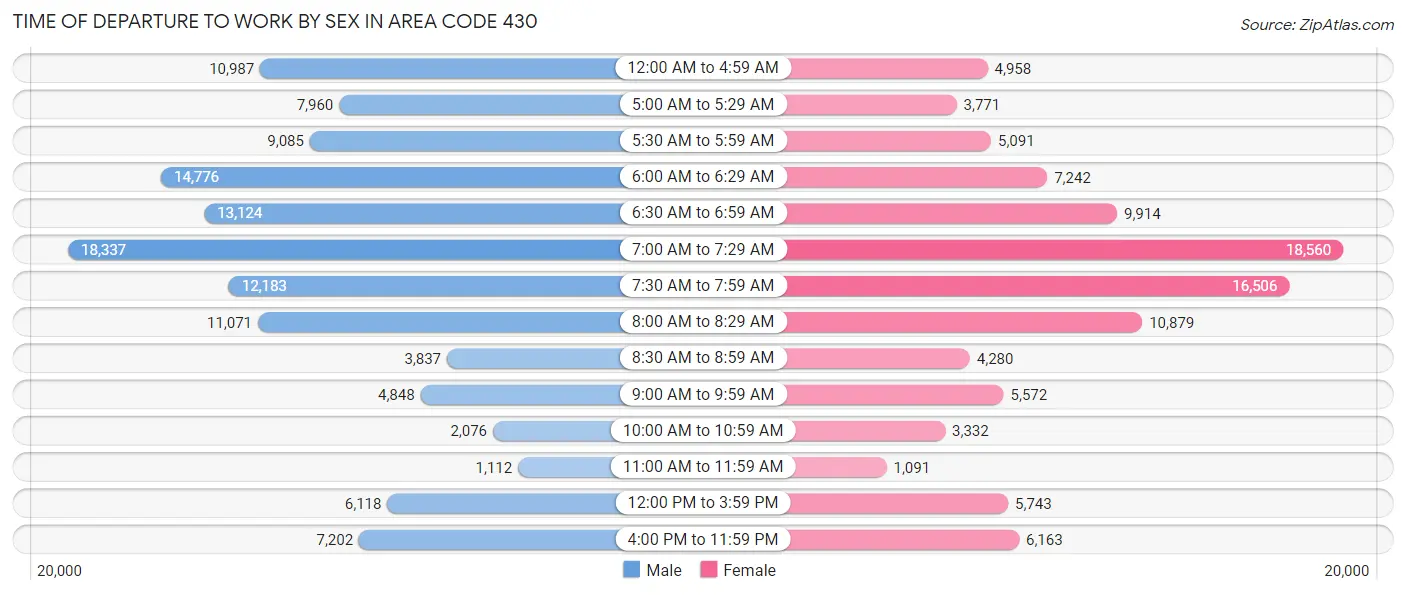
| Time of Departure | Male | Female |
| 12:00 AM to 4:59 AM | 10,987 (8.9%) | 4,958 (4.8%) |
| 5:00 AM to 5:29 AM | 7,960 (6.5%) | 3,771 (3.7%) |
| 5:30 AM to 5:59 AM | 9,085 (7.4%) | 5,091 (4.9%) |
| 6:00 AM to 6:29 AM | 14,776 (12.0%) | 7,242 (7.0%) |
| 6:30 AM to 6:59 AM | 13,124 (10.7%) | 9,914 (9.6%) |
| 7:00 AM to 7:29 AM | 18,337 (14.9%) | 18,560 (18.0%) |
| 7:30 AM to 7:59 AM | 12,183 (9.9%) | 16,506 (16.0%) |
| 8:00 AM to 8:29 AM | 11,071 (9.0%) | 10,879 (10.5%) |
| 8:30 AM to 8:59 AM | 3,837 (3.1%) | 4,280 (4.2%) |
| 9:00 AM to 9:59 AM | 4,848 (4.0%) | 5,572 (5.4%) |
| 10:00 AM to 10:59 AM | 2,076 (1.7%) | 3,332 (3.2%) |
| 11:00 AM to 11:59 AM | 1,112 (0.9%) | 1,091 (1.1%) |
| 12:00 PM to 3:59 PM | 6,118 (5.0%) | 5,743 (5.6%) |
| 4:00 PM to 11:59 PM | 7,202 (5.9%) | 6,163 (6.0%) |
| Total | 122,716 (100.0%) | 103,102 (100.0%) |
Housing Occupancy in Area Code 430
Occupancy by Ownership in Area Code 430
Of the total 210,156 dwellings in Area Code 430, owner-occupied units account for 149,305 (71.0%), while renter-occupied units make up 60,851 (29.0%).
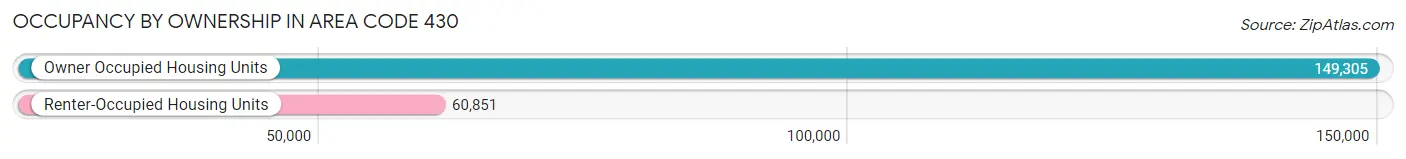
| Occupancy | # Housing Units | % Housing Units |
| Owner Occupied Housing Units | 149,305 | 71.0% |
| Renter-Occupied Housing Units | 60,851 | 29.0% |
| Total Occupied Housing Units | 210,156 | 100.0% |
Occupancy by Household Size in Area Code 430
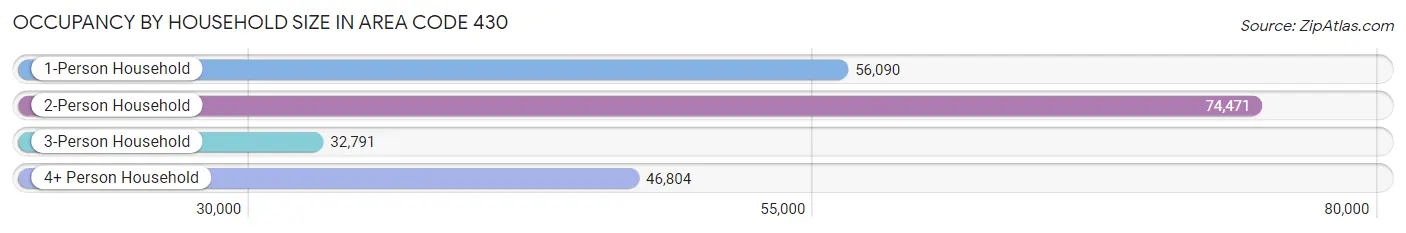
| Household Size | # Housing Units | % Housing Units |
| 1-Person Household | 56,090 | 26.7% |
| 2-Person Household | 74,471 | 35.4% |
| 3-Person Household | 32,791 | 15.6% |
| 4+ Person Household | 46,804 | 22.3% |
| Total Housing Units | 210,156 | 100.0% |
Occupancy by Ownership by Household Size in Area Code 430
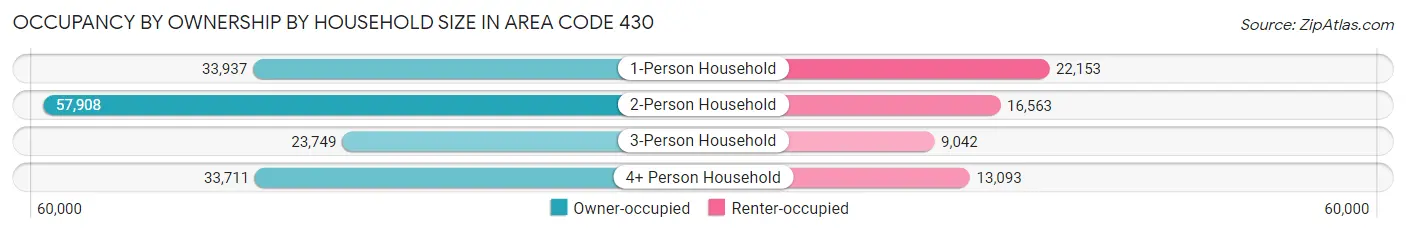
| Household Size | Owner-occupied | Renter-occupied |
| 1-Person Household | 33,937 (60.5%) | 22,153 (39.5%) |
| 2-Person Household | 57,908 (77.8%) | 16,563 (22.2%) |
| 3-Person Household | 23,749 (72.4%) | 9,042 (27.6%) |
| 4+ Person Household | 33,711 (72.0%) | 13,093 (28.0%) |
| Total Housing Units | 149,305 (71.0%) | 60,851 (29.0%) |
Occupancy by Educational Attainment in Area Code 430
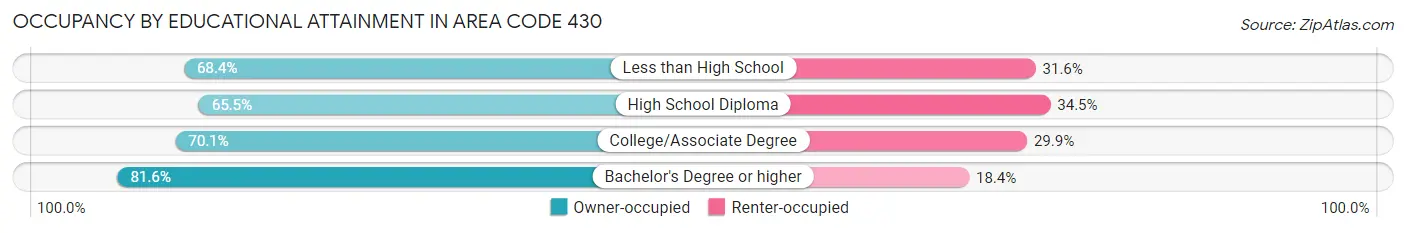
| Household Size | Owner-occupied | Renter-occupied |
| Less than High School | 17,000 (68.4%) | 7,859 (31.6%) |
| High School Diploma | 40,639 (65.5%) | 21,440 (34.5%) |
| College/Associate Degree | 54,055 (70.1%) | 23,057 (29.9%) |
| Bachelor's Degree or higher | 37,611 (81.6%) | 8,495 (18.4%) |
Occupancy by Age of Householder in Area Code 430
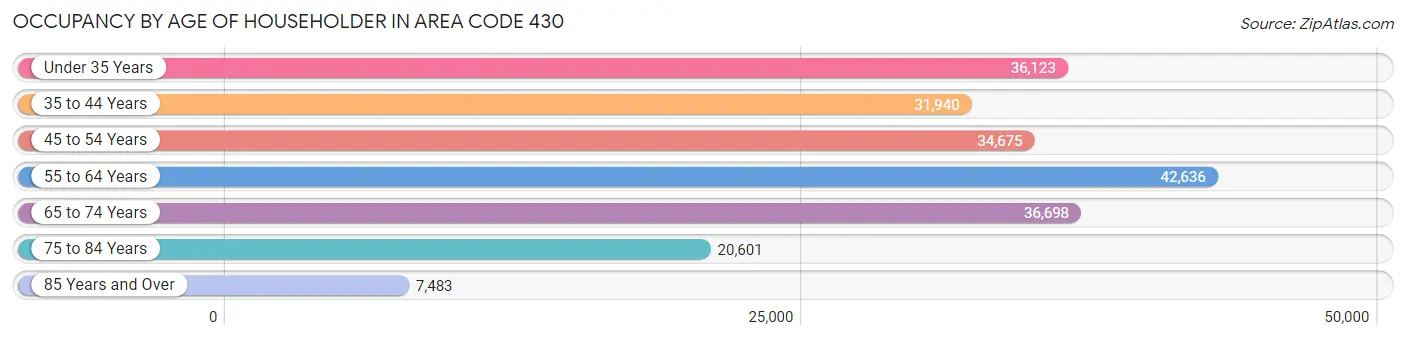
| Age Bracket | # Households | % Households |
| Under 35 Years | 36,123 | 17.2% |
| 35 to 44 Years | 31,940 | 15.2% |
| 45 to 54 Years | 34,675 | 16.5% |
| 55 to 64 Years | 42,636 | 20.3% |
| 65 to 74 Years | 36,698 | 17.5% |
| 75 to 84 Years | 20,601 | 9.8% |
| 85 Years and Over | 7,483 | 3.6% |
| Total | 210,156 | 100.0% |
Housing Finances in Area Code 430
Median Income by Occupancy in Area Code 430
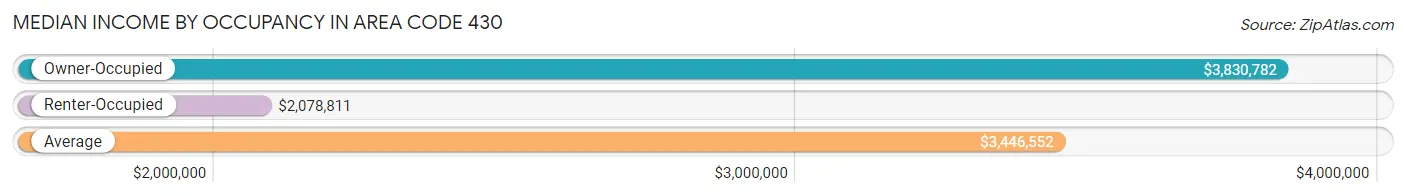
| Occupancy Type | # Households | Median Income |
| Owner-Occupied | 149,305 (71.0%) | $3,830,782 |
| Renter-Occupied | 60,851 (29.0%) | $2,078,811 |
| Average | 210,156 (100.0%) | $3,446,552 |
Occupancy by Householder Income Bracket in Area Code 430
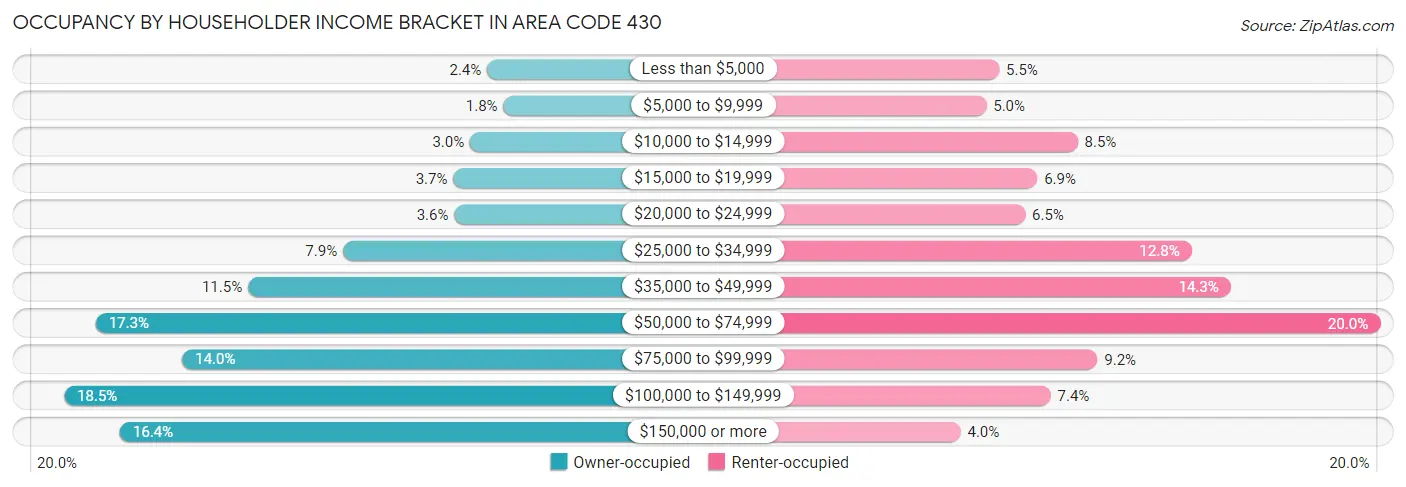
| Income Bracket | Owner-occupied | Renter-occupied |
| Less than $5,000 | 3,551 (2.4%) | 3,328 (5.5%) |
| $5,000 to $9,999 | 2,629 (1.8%) | 3,033 (5.0%) |
| $10,000 to $14,999 | 4,528 (3.0%) | 5,146 (8.5%) |
| $15,000 to $19,999 | 5,480 (3.7%) | 4,209 (6.9%) |
| $20,000 to $24,999 | 5,427 (3.6%) | 3,933 (6.5%) |
| $25,000 to $34,999 | 11,744 (7.9%) | 7,790 (12.8%) |
| $35,000 to $49,999 | 17,152 (11.5%) | 8,698 (14.3%) |
| $50,000 to $74,999 | 25,817 (17.3%) | 12,156 (20.0%) |
| $75,000 to $99,999 | 20,909 (14.0%) | 5,602 (9.2%) |
| $100,000 to $149,999 | 27,621 (18.5%) | 4,519 (7.4%) |
| $150,000 or more | 24,447 (16.4%) | 2,437 (4.0%) |
| Total | 149,305 (100.0%) | 60,851 (100.0%) |
Monthly Housing Cost Tiers in Area Code 430
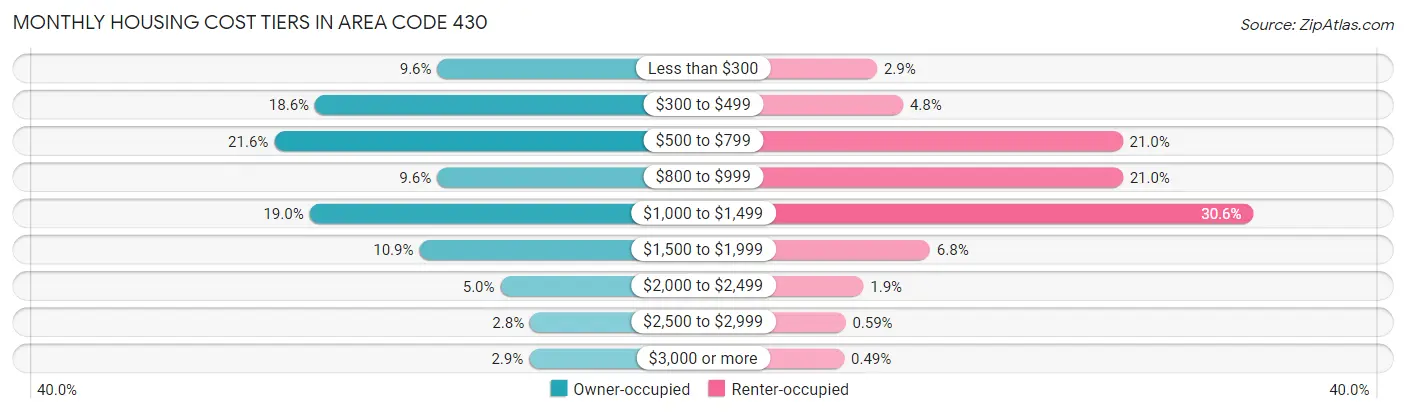
| Monthly Cost | Owner-occupied | Renter-occupied |
| Less than $300 | 14,328 (9.6%) | 1,771 (2.9%) |
| $300 to $499 | 27,798 (18.6%) | 2,942 (4.8%) |
| $500 to $799 | 32,275 (21.6%) | 12,778 (21.0%) |
| $800 to $999 | 14,377 (9.6%) | 12,787 (21.0%) |
| $1,000 to $1,499 | 28,392 (19.0%) | 18,636 (30.6%) |
| $1,500 to $1,999 | 16,325 (10.9%) | 4,142 (6.8%) |
| $2,000 to $2,499 | 7,401 (5.0%) | 1,160 (1.9%) |
| $2,500 to $2,999 | 4,151 (2.8%) | 362 (0.6%) |
| $3,000 or more | 4,258 (2.9%) | 300 (0.5%) |
| Total | 149,305 (100.0%) | 60,851 (100.0%) |
Physical Housing Characteristics in Area Code 430
Housing Structures in Area Code 430
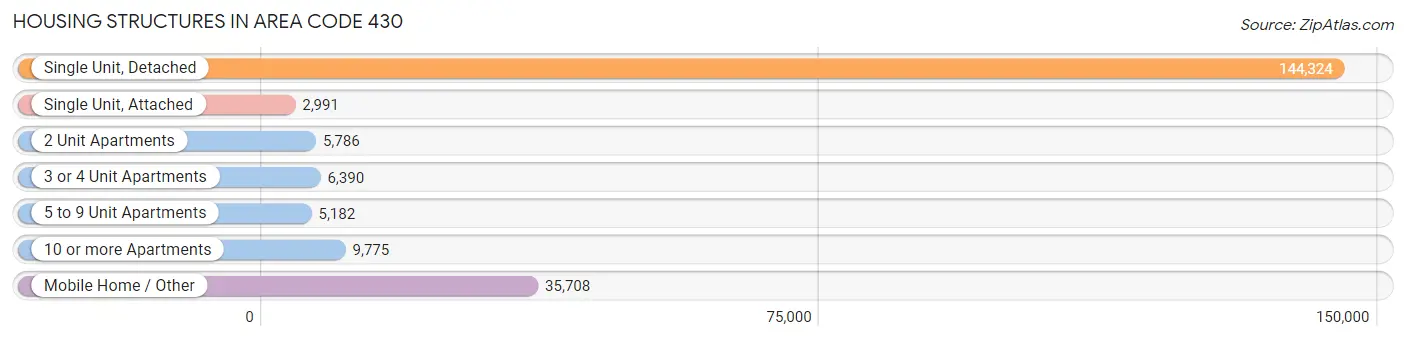
| Structure Type | # Housing Units | % Housing Units |
| Single Unit, Detached | 144,324 | 68.7% |
| Single Unit, Attached | 2,991 | 1.4% |
| 2 Unit Apartments | 5,786 | 2.8% |
| 3 or 4 Unit Apartments | 6,390 | 3.0% |
| 5 to 9 Unit Apartments | 5,182 | 2.5% |
| 10 or more Apartments | 9,775 | 4.6% |
| Mobile Home / Other | 35,708 | 17.0% |
| Total | 210,156 | 100.0% |
Housing Structures by Occupancy in Area Code 430
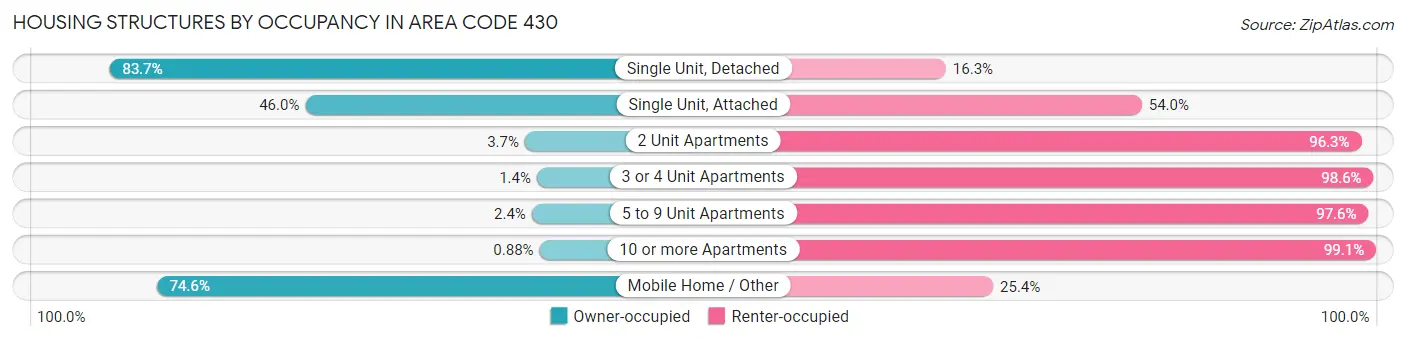
| Structure Type | Owner-occupied | Renter-occupied |
| Single Unit, Detached | 120,781 (83.7%) | 23,543 (16.3%) |
| Single Unit, Attached | 1,375 (46.0%) | 1,616 (54.0%) |
| 2 Unit Apartments | 214 (3.7%) | 5,572 (96.3%) |
| 3 or 4 Unit Apartments | 88 (1.4%) | 6,302 (98.6%) |
| 5 to 9 Unit Apartments | 123 (2.4%) | 5,059 (97.6%) |
| 10 or more Apartments | 86 (0.9%) | 9,689 (99.1%) |
| Mobile Home / Other | 26,638 (74.6%) | 9,070 (25.4%) |
| Total | 149,305 (71.0%) | 60,851 (29.0%) |
Housing Structures by Number of Rooms in Area Code 430
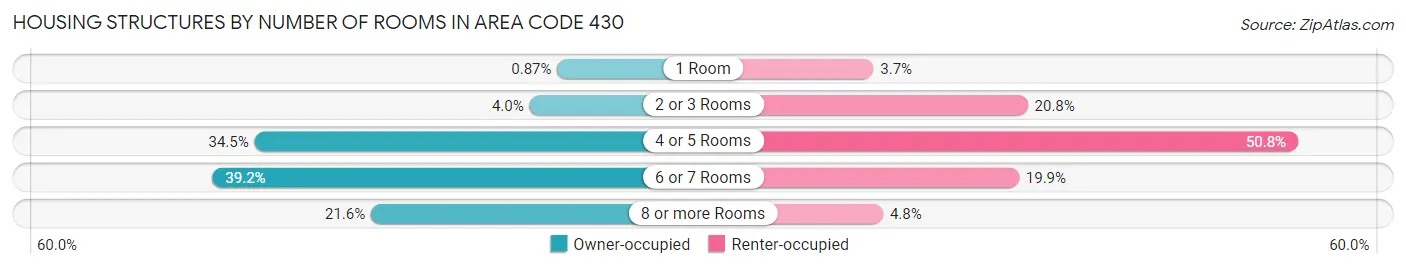
| Number of Rooms | Owner-occupied | Renter-occupied |
| 1 Room | 1,298 (0.9%) | 2,255 (3.7%) |
| 2 or 3 Rooms | 5,912 (4.0%) | 12,673 (20.8%) |
| 4 or 5 Rooms | 51,479 (34.5%) | 30,932 (50.8%) |
| 6 or 7 Rooms | 58,448 (39.2%) | 12,083 (19.9%) |
| 8 or more Rooms | 32,168 (21.5%) | 2,908 (4.8%) |
| Total | 149,305 (100.0%) | 60,851 (100.0%) |
Housing Structure by Heating Type in Area Code 430
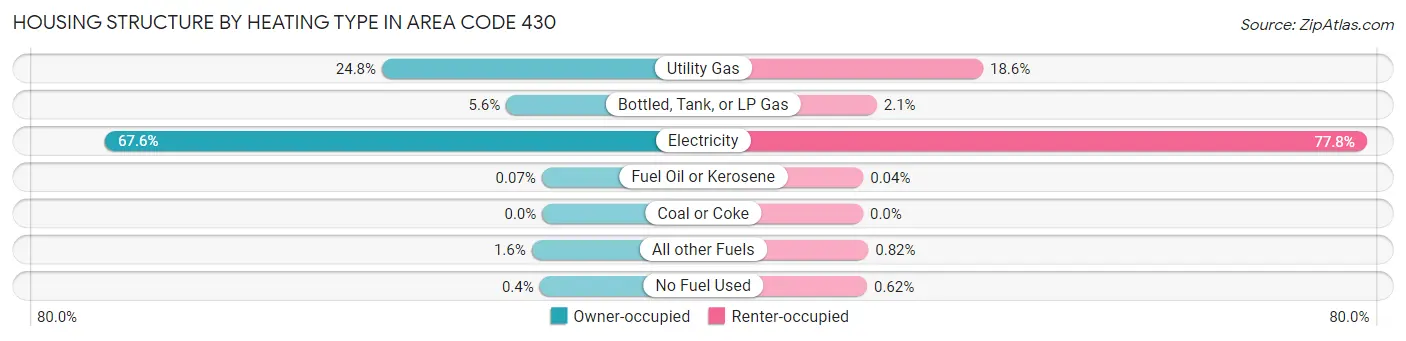
| Heating Type | Owner-occupied | Renter-occupied |
| Utility Gas | 36,978 (24.8%) | 11,287 (18.5%) |
| Bottled, Tank, or LP Gas | 8,308 (5.6%) | 1,296 (2.1%) |
| Electricity | 100,881 (67.6%) | 47,368 (77.8%) |
| Fuel Oil or Kerosene | 111 (0.1%) | 26 (0.0%) |
| Coal or Coke | 0 (0.0%) | 0 (0.0%) |
| All other Fuels | 2,430 (1.6%) | 498 (0.8%) |
| No Fuel Used | 597 (0.4%) | 376 (0.6%) |
| Total | 149,305 (100.0%) | 60,851 (100.0%) |
Household Vehicle Usage in Area Code 430
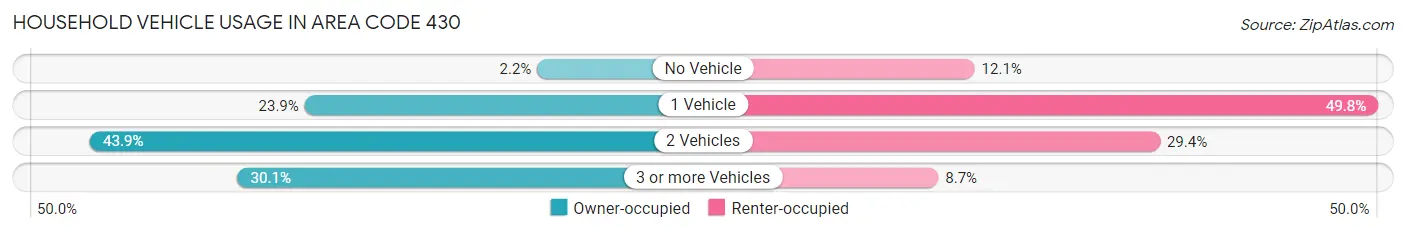
| Vehicles per Household | Owner-occupied | Renter-occupied |
| No Vehicle | 3,212 (2.1%) | 7,368 (12.1%) |
| 1 Vehicle | 35,619 (23.9%) | 30,278 (49.8%) |
| 2 Vehicles | 65,517 (43.9%) | 17,898 (29.4%) |
| 3 or more Vehicles | 44,957 (30.1%) | 5,307 (8.7%) |
| Total | 149,305 (100.0%) | 60,851 (100.0%) |
Real Estate & Mortgages in Area Code 430
Real Estate and Mortgage Overview in Area Code 430
| Characteristic | Without Mortgage | With Mortgage |
| Housing Units | 81,900 | 67,405 |
| Median Property Value | $7,379,100 | $10,070,800 |
| Median Household Income | $2,851,692 | $15,462 |
| Monthly Housing Costs | $26,416 | $4,085 |
| Real Estate Taxes | $76,629 | $2,548 |
Property Value by Mortgage Status in Area Code 430
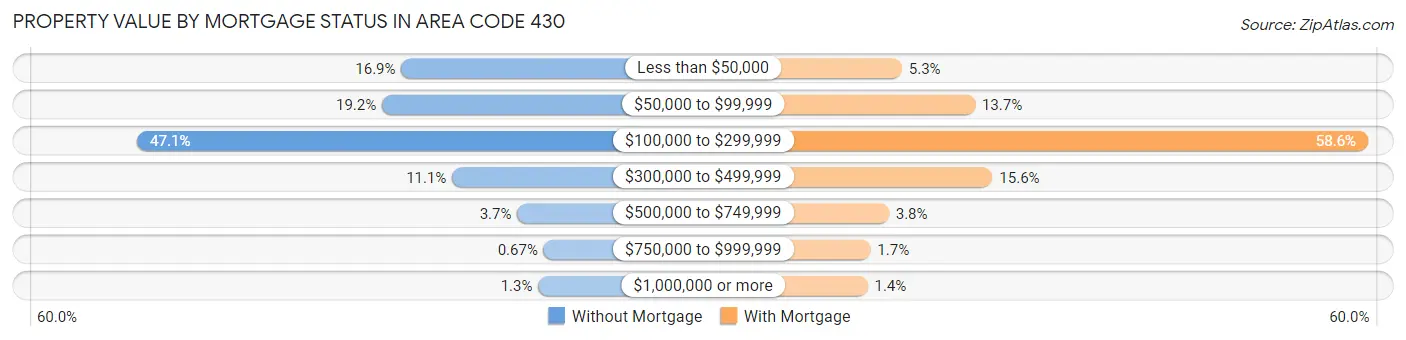
| Property Value | Without Mortgage | With Mortgage |
| Less than $50,000 | 13,872 (16.9%) | 3,568 (5.3%) |
| $50,000 to $99,999 | 15,680 (19.2%) | 9,201 (13.7%) |
| $100,000 to $299,999 | 38,597 (47.1%) | 39,465 (58.6%) |
| $300,000 to $499,999 | 9,119 (11.1%) | 10,540 (15.6%) |
| $500,000 to $749,999 | 3,025 (3.7%) | 2,560 (3.8%) |
| $750,000 to $999,999 | 550 (0.7%) | 1,149 (1.7%) |
| $1,000,000 or more | 1,057 (1.3%) | 922 (1.4%) |
| Total | 81,900 (100.0%) | 67,405 (100.0%) |
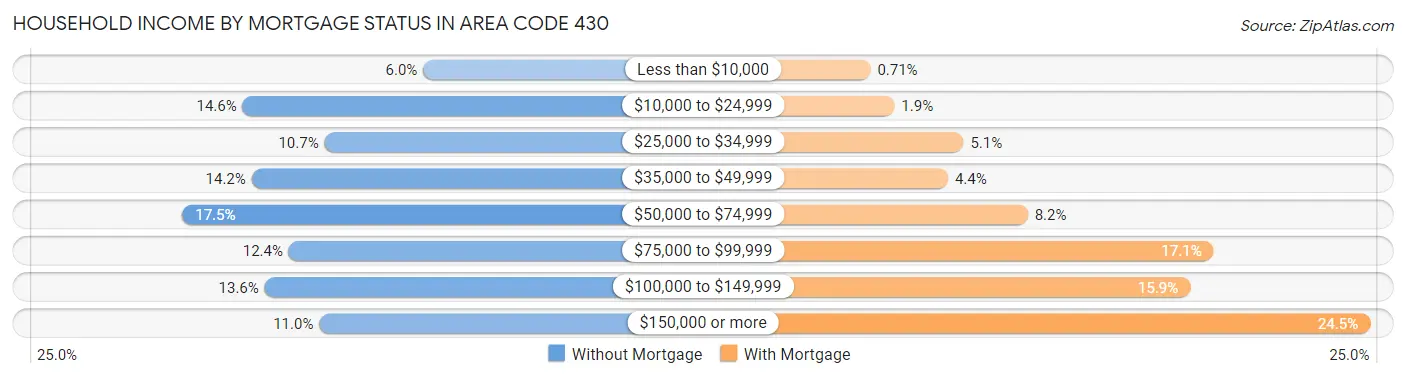
Household Income by Mortgage Status in Area Code 430
| Household Income | Without Mortgage | With Mortgage |
| Less than $10,000 | 4,934 (6.0%) | 478 (0.7%) |
| $10,000 to $24,999 | 11,971 (14.6%) | 1,246 (1.8%) |
| $25,000 to $34,999 | 8,776 (10.7%) | 3,464 (5.1%) |
| $35,000 to $49,999 | 11,625 (14.2%) | 2,968 (4.4%) |
| $50,000 to $74,999 | 14,326 (17.5%) | 5,527 (8.2%) |
| $75,000 to $99,999 | 10,173 (12.4%) | 11,491 (17.1%) |
| $100,000 to $149,999 | 11,110 (13.6%) | 10,736 (15.9%) |
| $150,000 or more | 8,985 (11.0%) | 16,511 (24.5%) |
| Total | 81,900 (100.0%) | 67,405 (100.0%) |
Property Value to Household Income Ratio in Area Code 430
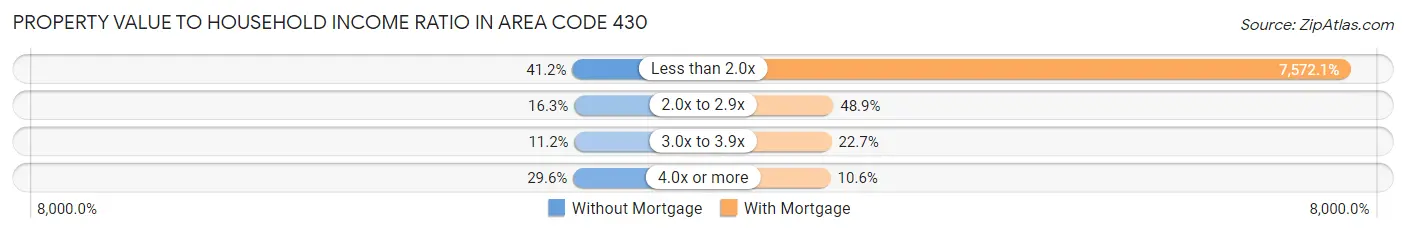
| Value-to-Income Ratio | Without Mortgage | With Mortgage |
| Less than 2.0x | 33,779 (41.2%) | 5,103,940 (7,572.1%) |
| 2.0x to 2.9x | 13,360 (16.3%) | 32,981 (48.9%) |
| 3.0x to 3.9x | 9,145 (11.2%) | 15,324 (22.7%) |
| 4.0x or more | 24,221 (29.6%) | 7,142 (10.6%) |
| Total | 81,900 (100.0%) | 67,405 (100.0%) |
Real Estate Taxes by Mortgage Status in Area Code 430
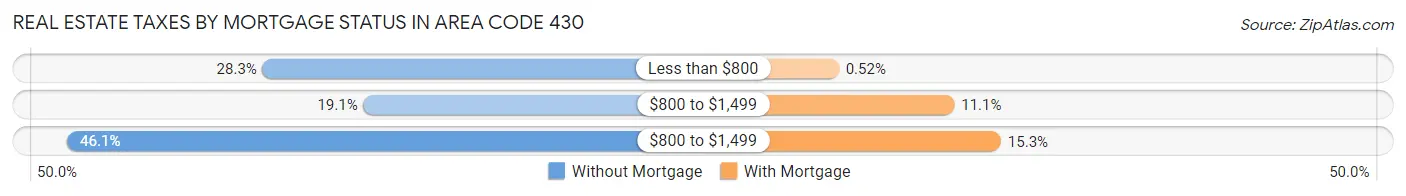
| Property Taxes | Without Mortgage | With Mortgage |
| Less than $800 | 23,149 (28.3%) | 349 (0.5%) |
| $800 to $1,499 | 15,606 (19.1%) | 7,464 (11.1%) |
| $800 to $1,499 | 37,764 (46.1%) | 10,334 (15.3%) |
| Total | 81,900 (100.0%) | 67,405 (100.0%) |
Health & Disability in Area Code 430
Health Insurance Coverage by Age in Area Code 430
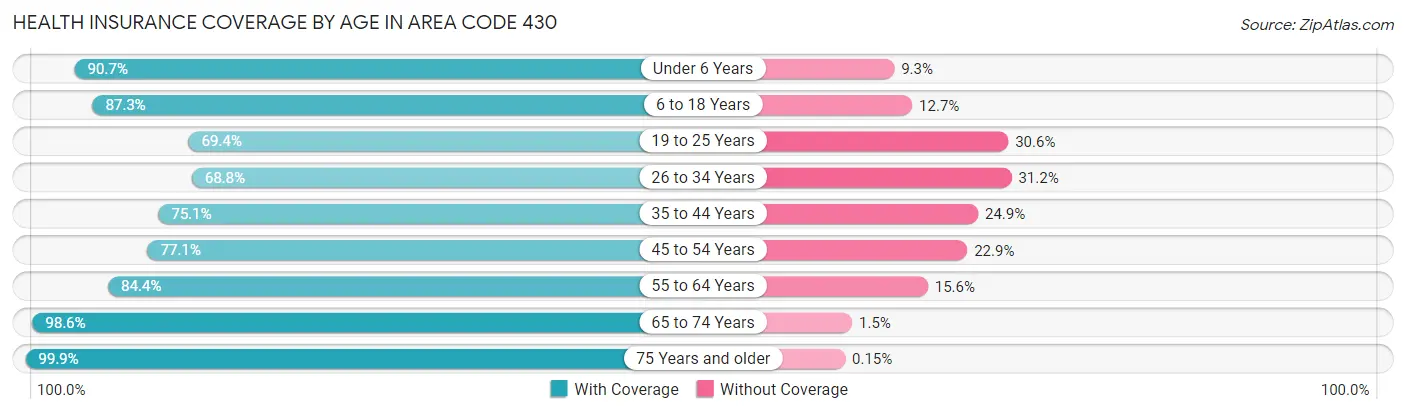
| Age Bracket | With Coverage | Without Coverage |
| Under 6 Years | 37,478 (90.7%) | 3,846 (9.3%) |
| 6 to 18 Years | 87,024 (87.3%) | 12,618 (12.7%) |
| 19 to 25 Years | 32,717 (69.4%) | 14,407 (30.6%) |
| 26 to 34 Years | 42,367 (68.8%) | 19,194 (31.2%) |
| 35 to 44 Years | 48,965 (75.1%) | 16,268 (24.9%) |
| 45 to 54 Years | 50,261 (77.1%) | 14,951 (22.9%) |
| 55 to 64 Years | 62,554 (84.4%) | 11,532 (15.6%) |
| 65 to 74 Years | 58,946 (98.6%) | 866 (1.5%) |
| 75 Years and older | 40,948 (99.9%) | 63 (0.2%) |
| Total | 461,260 (83.1%) | 93,745 (16.9%) |
Health Insurance Coverage by Citizenship Status in Area Code 430
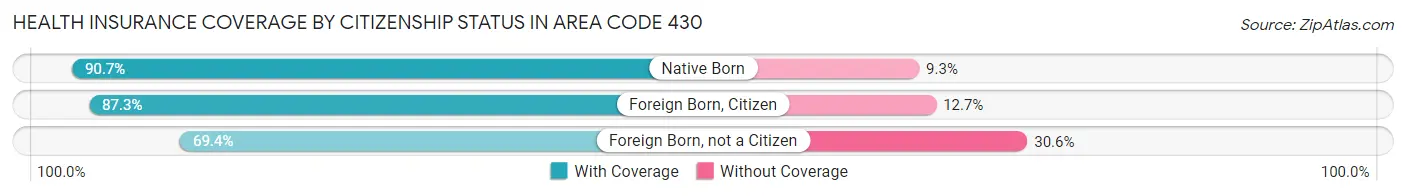
| Citizenship Status | With Coverage | Without Coverage |
| Native Born | 37,478 (90.7%) | 3,846 (9.3%) |
| Foreign Born, Citizen | 87,024 (87.3%) | 12,618 (12.7%) |
| Foreign Born, not a Citizen | 32,717 (69.4%) | 14,407 (30.6%) |
Health Insurance Coverage by Household Income in Area Code 430
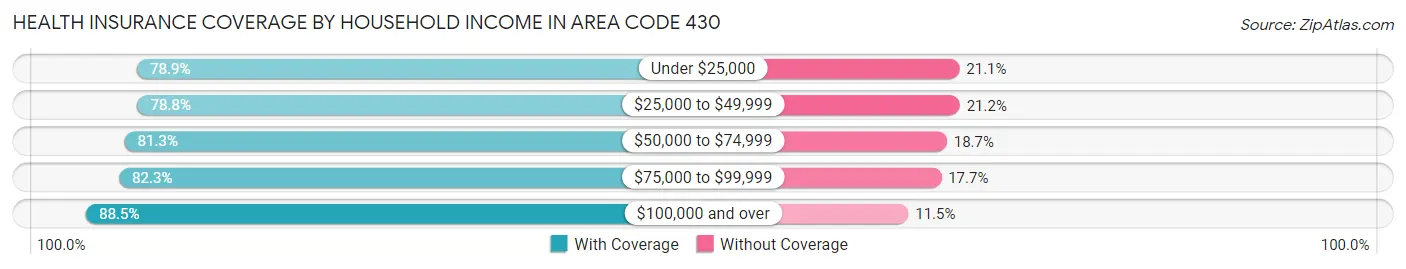
| Household Income | With Coverage | Without Coverage |
| Under $25,000 | 59,412 (78.9%) | 15,878 (21.1%) |
| $25,000 to $49,999 | 82,236 (78.8%) | 22,073 (21.2%) |
| $50,000 to $74,999 | 83,606 (81.3%) | 19,268 (18.7%) |
| $75,000 to $99,999 | 64,127 (82.3%) | 13,778 (17.7%) |
| $100,000 and over | 168,440 (88.5%) | 21,930 (11.5%) |
Public vs Private Health Insurance Coverage by Age in Area Code 430
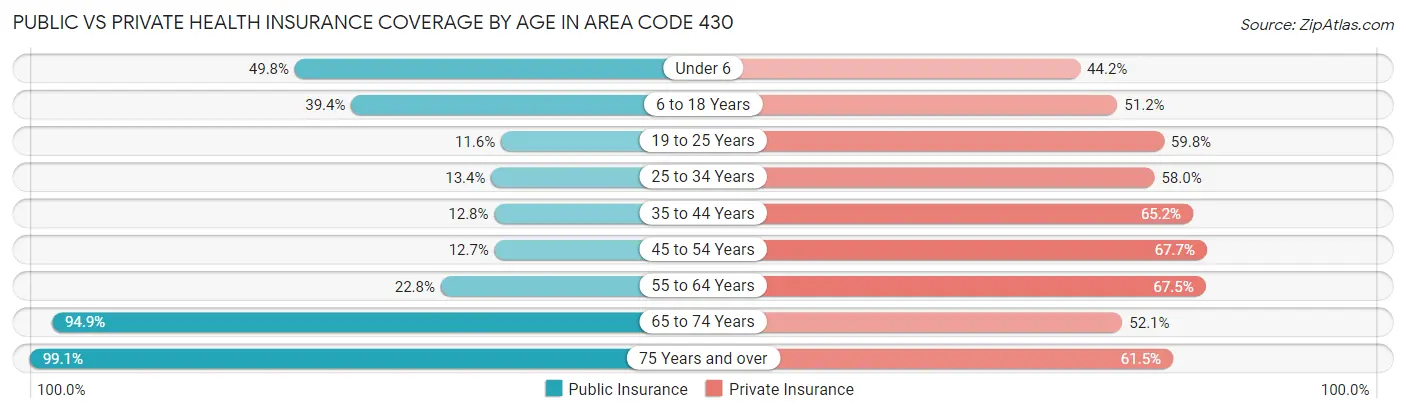
| Age Bracket | Public Insurance | Private Insurance |
| Under 6 | 20,592 (49.8%) | 18,280 (44.2%) |
| 6 to 18 Years | 39,222 (39.4%) | 50,979 (51.2%) |
| 19 to 25 Years | 5,451 (11.6%) | 28,174 (59.8%) |
| 25 to 34 Years | 8,236 (13.4%) | 35,732 (58.0%) |
| 35 to 44 Years | 8,359 (12.8%) | 42,511 (65.2%) |
| 45 to 54 Years | 8,309 (12.7%) | 44,173 (67.7%) |
| 55 to 64 Years | 16,854 (22.8%) | 50,014 (67.5%) |
| 65 to 74 Years | 56,772 (94.9%) | 31,153 (52.1%) |
| 75 Years and over | 40,622 (99.1%) | 25,201 (61.5%) |
| Total | 204,417 (36.8%) | 326,217 (58.8%) |
Disability Status by Sex by Age in Area Code 430
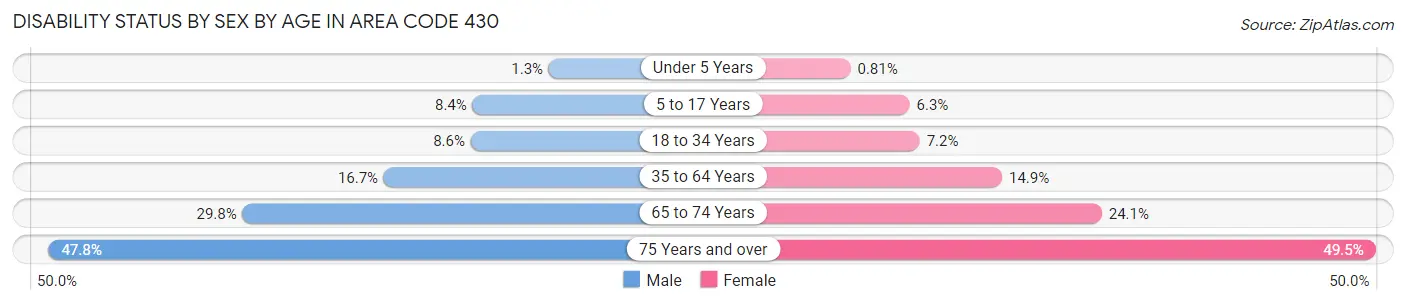
| Age Bracket | Male | Female |
| Under 5 Years | 237 (1.3%) | 132 (0.8%) |
| 5 to 17 Years | 4,269 (8.4%) | 3,091 (6.3%) |
| 18 to 34 Years | 5,022 (8.6%) | 4,138 (7.2%) |
| 35 to 64 Years | 16,691 (16.7%) | 15,511 (14.9%) |
| 65 to 74 Years | 8,449 (29.8%) | 7,584 (24.1%) |
| 75 Years and over | 8,122 (47.8%) | 11,892 (49.5%) |
Disability Class by Sex by Age in Area Code 430
Disability Class: Hearing Difficulty
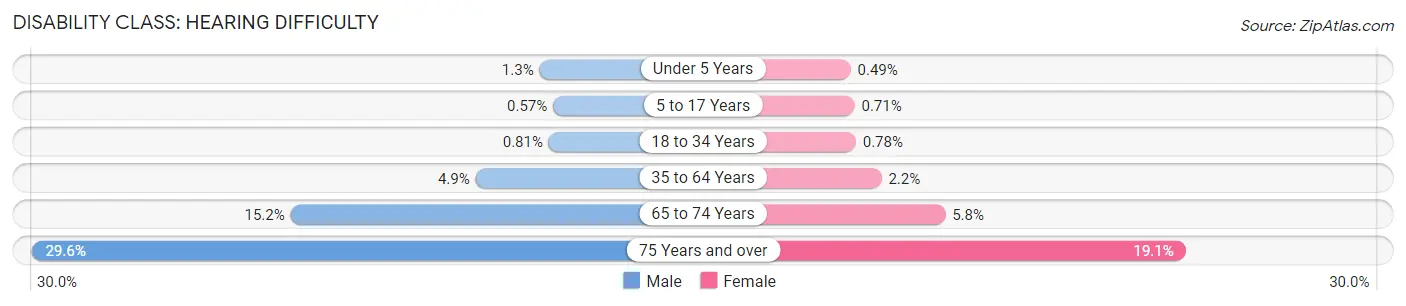
| Age Bracket | Male | Female |
| Under 5 Years | 236 (1.3%) | 80 (0.5%) |
| 5 to 17 Years | 287 (0.6%) | 350 (0.7%) |
| 18 to 34 Years | 475 (0.8%) | 444 (0.8%) |
| 35 to 64 Years | 4,900 (4.9%) | 2,310 (2.2%) |
| 65 to 74 Years | 4,312 (15.2%) | 1,809 (5.8%) |
| 75 Years and over | 5,025 (29.6%) | 4,597 (19.1%) |
Disability Class: Vision Difficulty
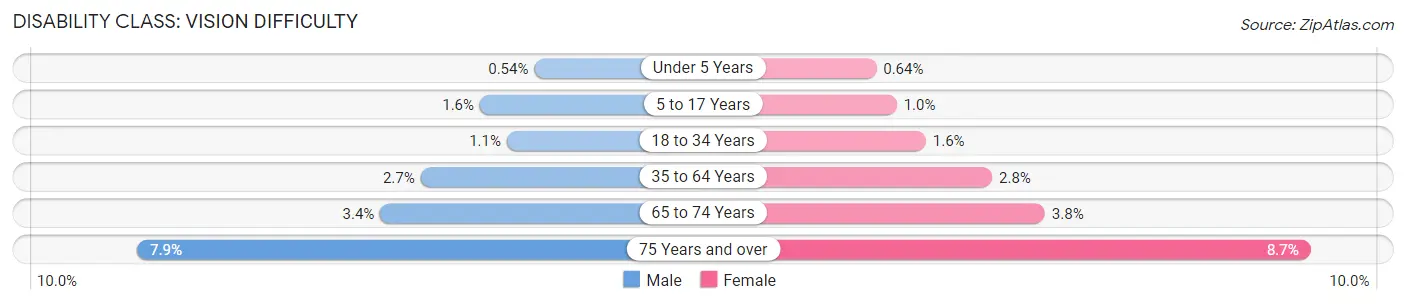
| Age Bracket | Male | Female |
| Under 5 Years | 95 (0.5%) | 104 (0.6%) |
| 5 to 17 Years | 786 (1.5%) | 502 (1.0%) |
| 18 to 34 Years | 612 (1.1%) | 894 (1.6%) |
| 35 to 64 Years | 2,655 (2.6%) | 2,909 (2.8%) |
| 65 to 74 Years | 964 (3.4%) | 1,185 (3.8%) |
| 75 Years and over | 1,345 (7.9%) | 2,088 (8.7%) |
Disability Class: Cognitive Difficulty
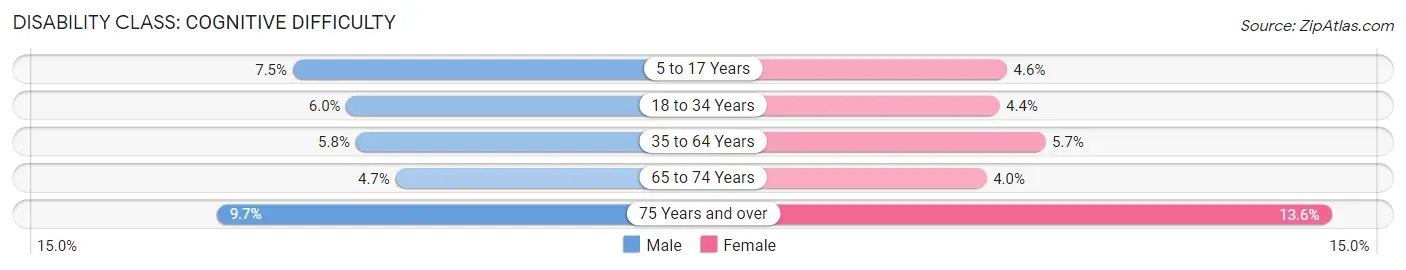
| Age Bracket | Male | Female |
| 5 to 17 Years | 3,821 (7.5%) | 2,255 (4.6%) |
| 18 to 34 Years | 3,532 (6.0%) | 2,505 (4.4%) |
| 35 to 64 Years | 5,794 (5.8%) | 5,901 (5.7%) |
| 65 to 74 Years | 1,325 (4.7%) | 1,265 (4.0%) |
| 75 Years and over | 1,640 (9.7%) | 3,272 (13.6%) |
Disability Class: Ambulatory Difficulty
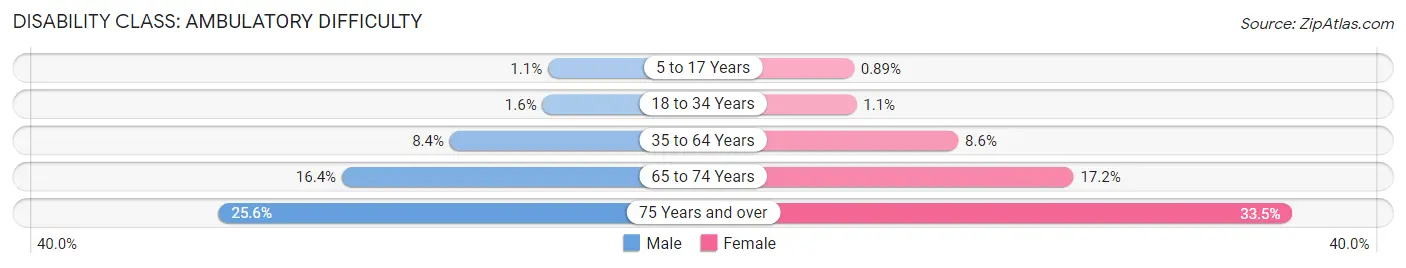
| Age Bracket | Male | Female |
| 5 to 17 Years | 577 (1.1%) | 436 (0.9%) |
| 18 to 34 Years | 906 (1.5%) | 618 (1.1%) |
| 35 to 64 Years | 8,451 (8.4%) | 9,009 (8.6%) |
| 65 to 74 Years | 4,667 (16.4%) | 5,407 (17.2%) |
| 75 Years and over | 4,351 (25.6%) | 8,032 (33.5%) |
Disability Class: Self-Care Difficulty
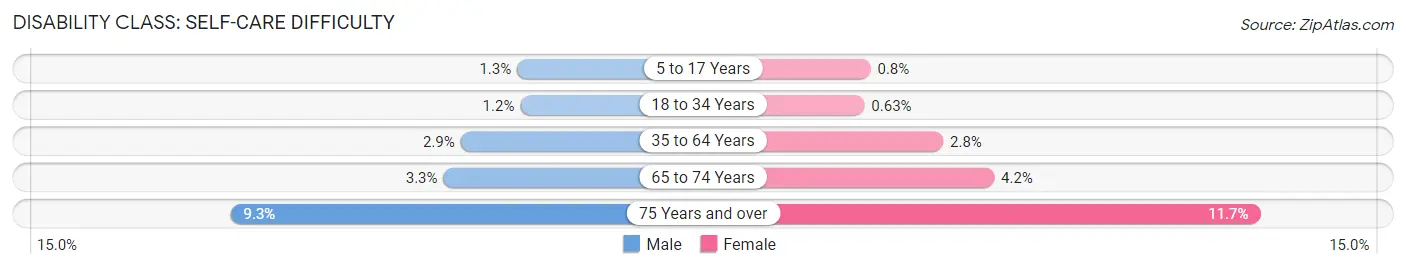
| Age Bracket | Male | Female |
| 5 to 17 Years | 656 (1.3%) | 391 (0.8%) |
| 18 to 34 Years | 700 (1.2%) | 360 (0.6%) |
| 35 to 64 Years | 2,870 (2.9%) | 2,946 (2.8%) |
| 65 to 74 Years | 947 (3.3%) | 1,332 (4.2%) |
| 75 Years and over | 1,576 (9.3%) | 2,797 (11.7%) |
Technology Access in Area Code 430
Computing Device Access in Area Code 430
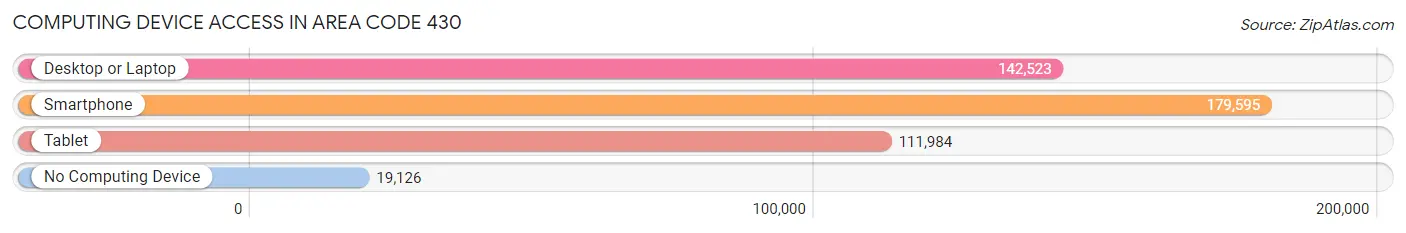
| Device Type | # Households | % Households |
| Desktop or Laptop | 142,523 | 67.8% |
| Smartphone | 179,595 | 85.5% |
| Tablet | 111,984 | 53.3% |
| No Computing Device | 19,126 | 9.1% |
| Total | 210,156 | 100.0% |
Internet Access in Area Code 430
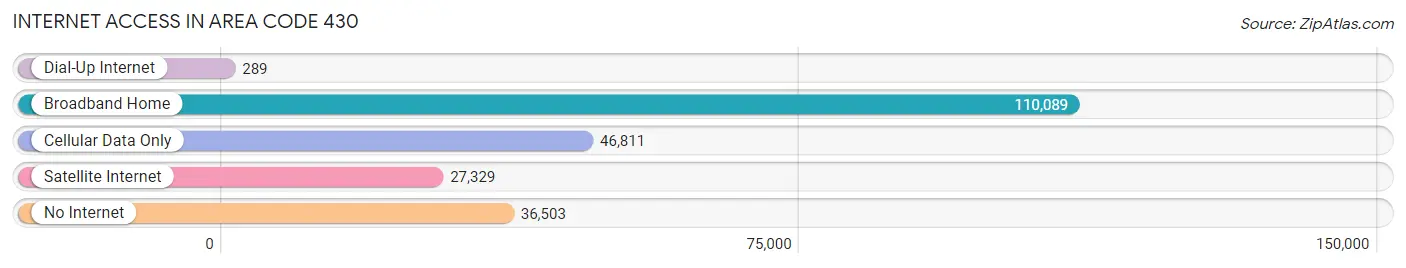
| Internet Type | # Households | % Households |
| Dial-Up Internet | 289 | 0.1% |
| Broadband Home | 110,089 | 52.4% |
| Cellular Data Only | 46,811 | 22.3% |
| Satellite Internet | 27,329 | 13.0% |
| No Internet | 36,503 | 17.4% |
| Total | 210,156 | 100.0% |
Area Code 430 Summary
Geography
Area code 430 is located in the state of Texas. It covers the eastern portion of the state, including the cities of Tyler, Longview, and Marshall.
Social
Area code 430 is home to a diverse population of people from all walks of life. The area is known for its friendly and welcoming atmosphere, and its residents are proud of their heritage and culture.
Economics
Area code 430 is a major economic hub in the state of Texas. It is home to a number of large businesses, including oil and gas companies, manufacturing plants, and financial institutions. The area also has a thriving tourism industry, with many attractions and activities for visitors to enjoy.
Demographics
Area code 430 is home to a population of over 1.2 million people. The majority of the population is white, followed by African American, Hispanic, and Asian. The median household income is around $50,000, and the unemployment rate is below the national average.
Common Questions
What is Per Capita Income in Area Code 430?
Per Capita income in Area Code 430 is $31,505.
What is the Median Family Income in Area Code 430?
Median Family Income in Area Code 430 is $76,219.
What is the Median Household income in Area Code 430?
Median Household Income in Area Code 430 is $63,825.
What is Income or Wage Gap in Area Code 430?
Income or Wage Gap in Area Code 430 is 33.6%.
Women in Area Code 430 earn 66.4 cents for every dollar earned by a man.
What is Family Income Deficit in Area Code 430?
Family Income Deficit in Area Code 430 is $11,169.
Families that are below poverty line in Area Code 430 earn $11,169 less on average than the poverty threshold level.
What is Inequality or Gini Index in Area Code 430?
Inequality or Gini Index in Area Code 430 is 24.01.
What is the Total Population of Area Code 430?
Total Population of Area Code 430 is 576,904.
What is the Total Male Population of Area Code 430?
Total Male Population of Area Code 430 is 290,684.
What is the Total Female Population of Area Code 430?
Total Female Population of Area Code 430 is 286,220.
What is the Ratio of Males per 100 Females in Area Code 430?
There are 101.56 Males per 100 Females in Area Code 430.
What is the Ratio of Females per 100 Males in Area Code 430?
There are 98.46 Females per 100 Males in Area Code 430.
What is the Median Population Age in Area Code 430?
Median Population Age in Area Code 430 is 41.2 Years.
What is the Average Family Size in Area Code 430
Average Family Size in Area Code 430 is 3.2 People.
What is the Average Household Size in Area Code 430
Average Household Size in Area Code 430 is 2.7 People.
How Large is the Labor Force in Area Code 430?
There are 253,206 People in the Labor Forcein in Area Code 430.
What is the Percentage of People in the Labor Force in Area Code 430?
55.2% of People are in the Labor Force in Area Code 430.
What is the Unemployment Rate in Area Code 430?
Unemployment Rate in Area Code 430 is 5.0%.