Area Code 561 Map & Demographics
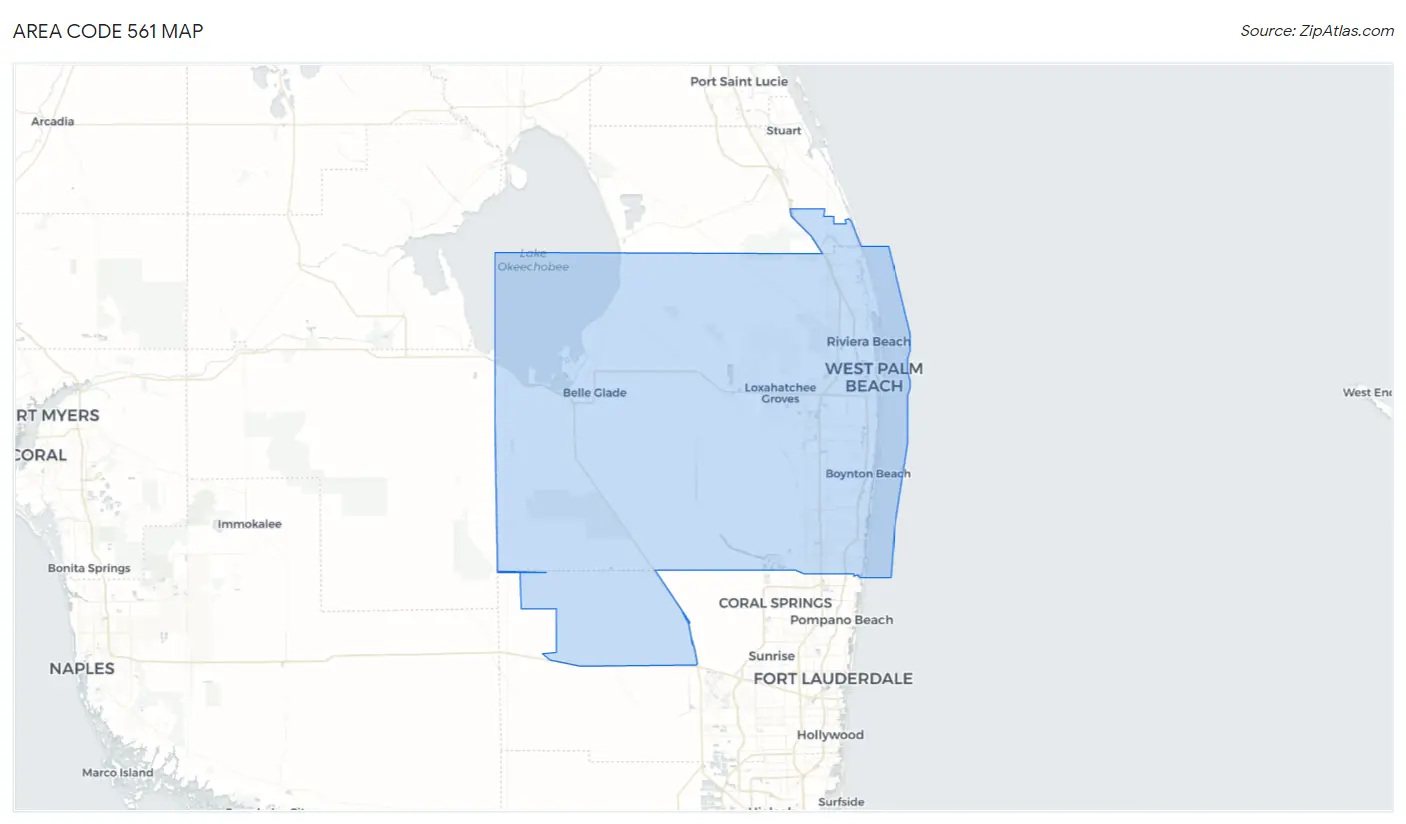
Area Code 561 Map
Area Code 561 Overview
$51,612
PER CAPITA INCOME
$99,595
AVG FAMILY INCOME
$81,508
AVG HOUSEHOLD INCOME
27.4%
WAGE / INCOME GAP [ % ]
72.6¢/ $1
WAGE / INCOME GAP [ $ ]
$10,849
FAMILY INCOME DEFICIT
27.24
INEQUALITY / GINI INDEX
1,684,204
TOTAL POPULATION
822,989
MALE POPULATION
861,215
FEMALE POPULATION
95.56
MALES / 100 FEMALES
104.64
FEMALES / 100 MALES
47.0
MEDIAN AGE
3.1
AVG FAMILY SIZE
2.5
AVG HOUSEHOLD SIZE
810,888
LABOR FORCE [ PEOPLE ]
57.6%
PERCENT IN LABOR FORCE
6.2%
UNEMPLOYMENT RATE
Income in Area Code 561
Income Overview in Area Code 561
Per Capita Income in Area Code 561 is $51,612, while median incomes of families and households are $99,595 and $81,508 respectively.
| Characteristic | Number | Measure |
| Per Capita Income | 1,684,204 | $51,612 |
| Median Family Income | 413,622 | $99,595 |
| Mean Family Income | 413,622 | $7,970,185 |
| Median Household Income | 670,318 | $81,508 |
| Mean Household Income | 670,318 | $6,694,000 |
| Income Deficit | 413,622 | $10,849 |
| Wage / Income Gap (%) | 1,684,204 | 27.38% |
| Wage / Income Gap ($) | 1,684,204 | 72.62¢ per $1 |
| Gini / Inequality Index | 1,684,204 | 27.24 |
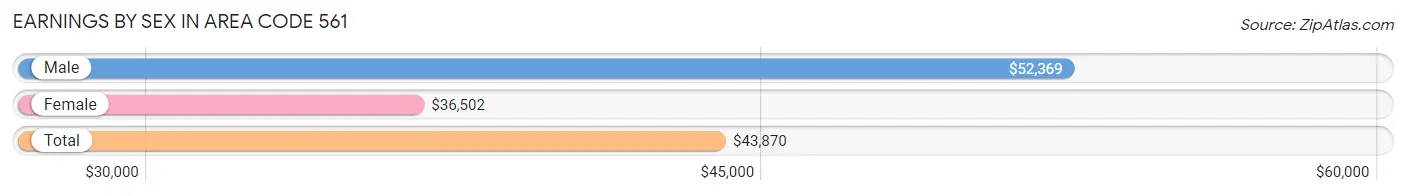
Earnings by Sex in Area Code 561
Average Earnings in Area Code 561 are $43,870, $52,369 for men and $36,502 for women, a difference of 30.3%.
| Sex | Number | Average Earnings |
| Male | 458,132 (53.0%) | $52,369 |
| Female | 406,656 (47.0%) | $36,502 |
| Total | 864,788 (100.0%) | $43,870 |
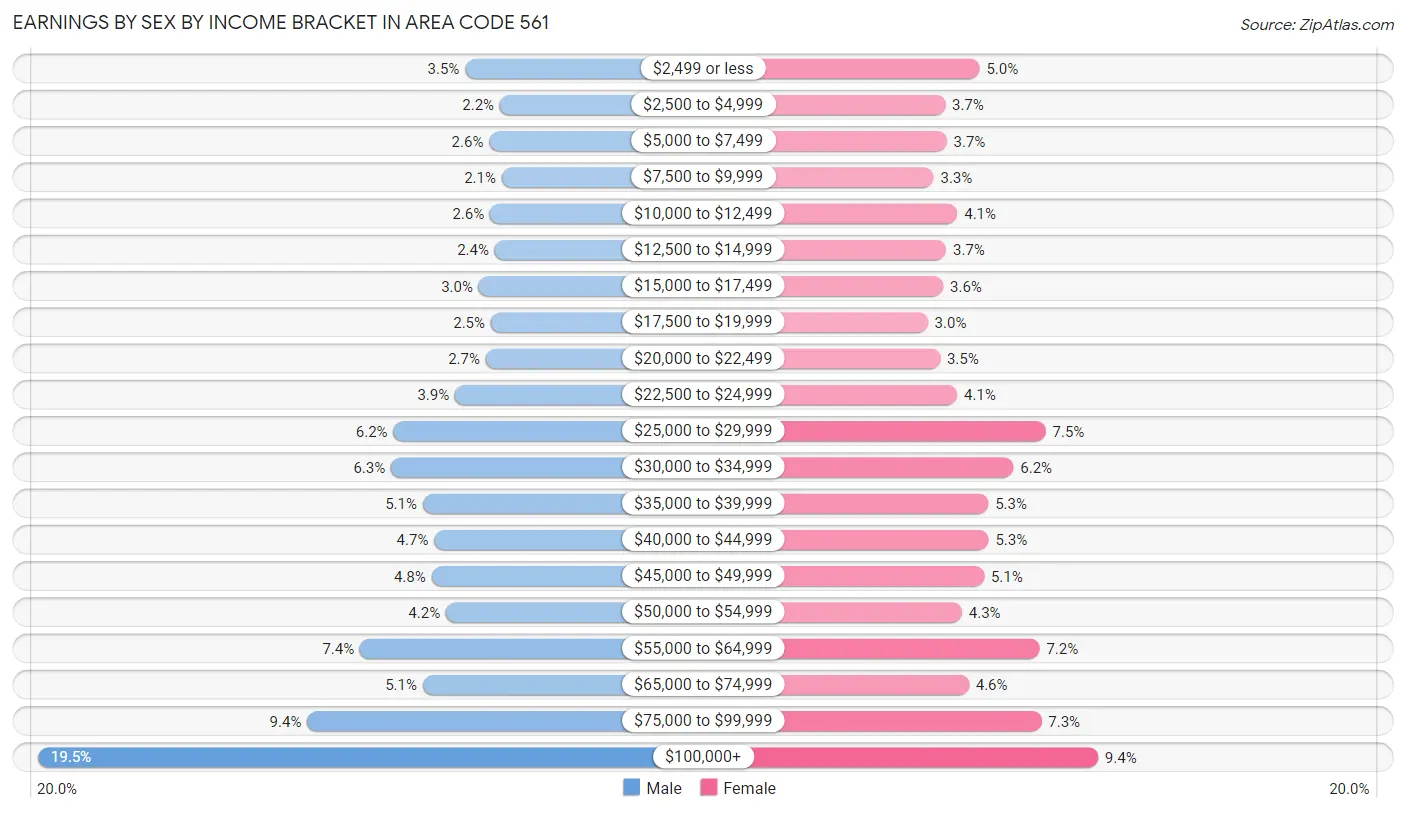
Earnings by Sex by Income Bracket in Area Code 561
The most common earnings brackets in Area Code 561 are $100,000+ for men (89,352 | 19.5%) and $100,000+ for women (38,257 | 9.4%).
| Income | Male | Female |
| $2,499 or less | 15,990 (3.5%) | 20,214 (5.0%) |
| $2,500 to $4,999 | 10,041 (2.2%) | 14,964 (3.7%) |
| $5,000 to $7,499 | 11,845 (2.6%) | 15,219 (3.7%) |
| $7,500 to $9,999 | 9,698 (2.1%) | 13,205 (3.3%) |
| $10,000 to $12,499 | 11,726 (2.6%) | 16,847 (4.1%) |
| $12,500 to $14,999 | 10,922 (2.4%) | 15,141 (3.7%) |
| $15,000 to $17,499 | 13,670 (3.0%) | 14,681 (3.6%) |
| $17,500 to $19,999 | 11,600 (2.5%) | 12,337 (3.0%) |
| $20,000 to $22,499 | 12,471 (2.7%) | 14,183 (3.5%) |
| $22,500 to $24,999 | 17,728 (3.9%) | 16,811 (4.1%) |
| $25,000 to $29,999 | 28,295 (6.2%) | 30,313 (7.4%) |
| $30,000 to $34,999 | 28,741 (6.3%) | 25,379 (6.2%) |
| $35,000 to $39,999 | 23,262 (5.1%) | 21,535 (5.3%) |
| $40,000 to $44,999 | 21,287 (4.6%) | 21,593 (5.3%) |
| $45,000 to $49,999 | 21,771 (4.8%) | 20,891 (5.1%) |
| $50,000 to $54,999 | 19,295 (4.2%) | 17,535 (4.3%) |
| $55,000 to $64,999 | 34,046 (7.4%) | 29,358 (7.2%) |
| $65,000 to $74,999 | 23,262 (5.1%) | 18,568 (4.6%) |
| $75,000 to $99,999 | 43,130 (9.4%) | 29,625 (7.3%) |
| $100,000+ | 89,352 (19.5%) | 38,257 (9.4%) |
| Total | 458,132 (100.0%) | 406,656 (100.0%) |
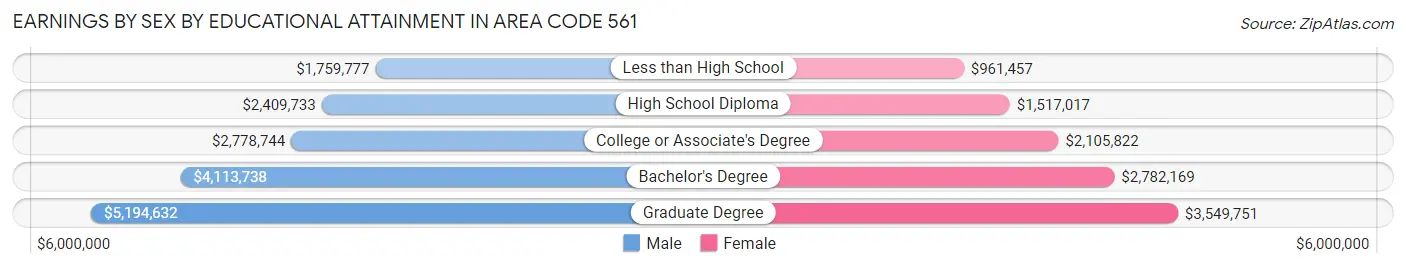
Earnings by Sex by Educational Attainment in Area Code 561
Average earnings in Area Code 561 are $3,265,430 for men and $2,288,547 for women, a difference of 29.9%. Men with an educational attainment of graduate degree enjoy the highest average annual earnings of $5,194,632, while those with less than high school education earn the least with $1,759,777. Women with an educational attainment of graduate degree earn the most with the average annual earnings of $3,549,751, while those with less than high school education have the smallest earnings of $961,457.
| Educational Attainment | Male Income | Female Income |
| Less than High School | $1,759,777 | $961,457 |
| High School Diploma | $2,409,733 | $1,517,017 |
| College or Associate's Degree | $2,778,744 | $2,105,822 |
| Bachelor's Degree | $4,113,738 | $2,782,169 |
| Graduate Degree | $5,194,632 | $3,549,751 |
| Total | $3,265,430 | $2,288,547 |
Family Income in Area Code 561
Family Income Brackets in Area Code 561
According to the Area Code 561 family income data, there are 4,376,534 families falling into the $100,000 to $149,999 income range, which is the most common income bracket and makes up 1,058.1% of all families. Conversely, the $10,000 to $14,999 income bracket is the least frequent group with only 424,376 families (102.6%) belonging to this category.
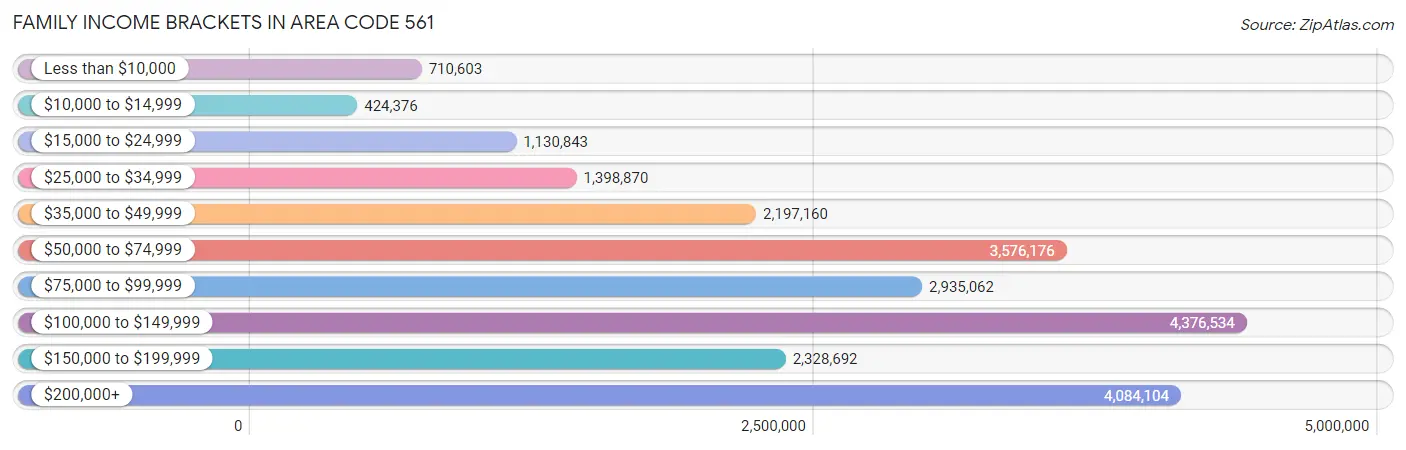
| Income Bracket | # Families | % Families |
| Less than $10,000 | 710,603 | 171.8% |
| $10,000 to $14,999 | 424,376 | 102.6% |
| $15,000 to $24,999 | 1,130,843 | 273.4% |
| $25,000 to $34,999 | 1,398,870 | 338.2% |
| $35,000 to $49,999 | 2,197,160 | 531.2% |
| $50,000 to $74,999 | 3,576,176 | 864.6% |
| $75,000 to $99,999 | 2,935,062 | 709.6% |
| $100,000 to $149,999 | 4,376,534 | 1,058.1% |
| $150,000 to $199,999 | 2,328,692 | 563.0% |
| $200,000+ | 4,084,104 | 987.4% |
Family Income by Famaliy Size in Area Code 561
6-person families (9,499 | 2.3%) account for the highest median family income in Area Code 561 with $130,275 per family, while 2-person families (215,534 | 52.1%) have the highest median income of $45,881 per family member.
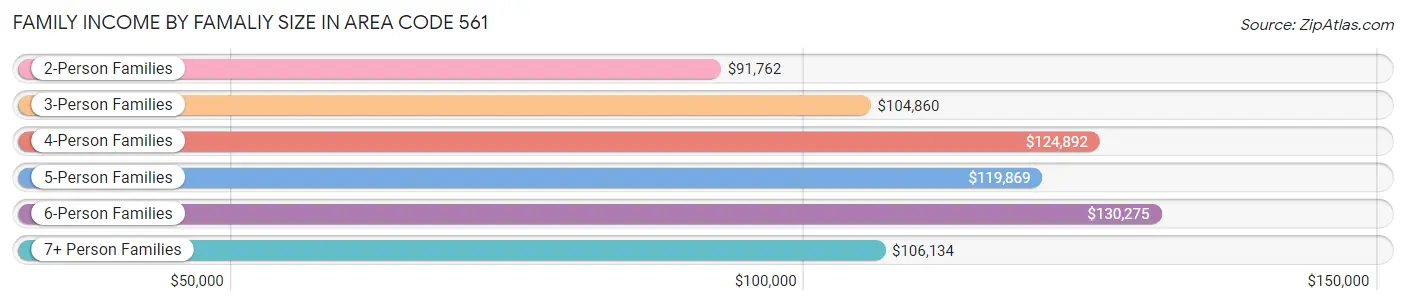
| Income Bracket | # Families | Median Income |
| 2-Person Families | 215,534 (52.1%) | $91,762 |
| 3-Person Families | 88,220 (21.3%) | $104,860 |
| 4-Person Families | 64,765 (15.7%) | $124,892 |
| 5-Person Families | 30,145 (7.3%) | $119,869 |
| 6-Person Families | 9,499 (2.3%) | $130,275 |
| 7+ Person Families | 5,459 (1.3%) | $106,134 |
| Total | 413,622 (100.0%) | $99,595 |
Family Income by Number of Earners in Area Code 561
The median family income in Area Code 561 is $99,595, with families comprising 3+ earners (45,476) having the highest median family income of $141,868, while families with no earners (79,944) have the lowest median family income of $65,292, accounting for 11.0% and 19.3% of families, respectively.
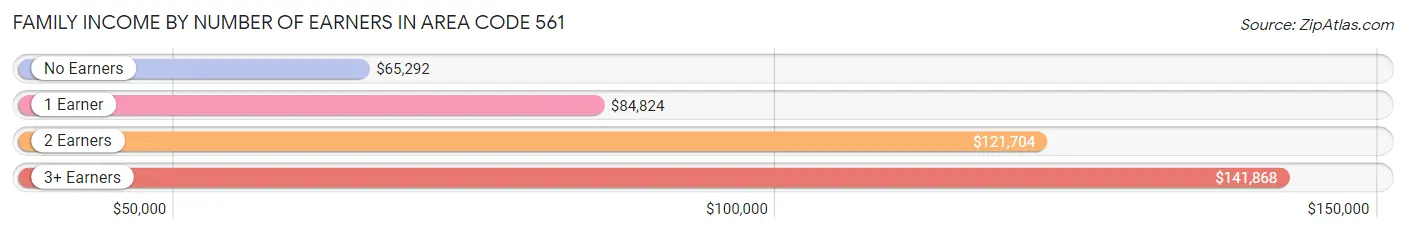
| Number of Earners | # Families | Median Income |
| No Earners | 79,944 (19.3%) | $65,292 |
| 1 Earner | 129,144 (31.2%) | $84,824 |
| 2 Earners | 159,058 (38.5%) | $121,704 |
| 3+ Earners | 45,476 (11.0%) | $141,868 |
| Total | 413,622 (100.0%) | $99,595 |
Household Income in Area Code 561
Household Income Brackets in Area Code 561
With 6,158,211 households falling in the category, the $100,000 to $149,999 income range is the most frequent in Area Code 561, accounting for 918.7% of all households. In contrast, only 1,232,715 households (183.9%) fall into the $10,000 to $14,999 income bracket, making it the least populous group.
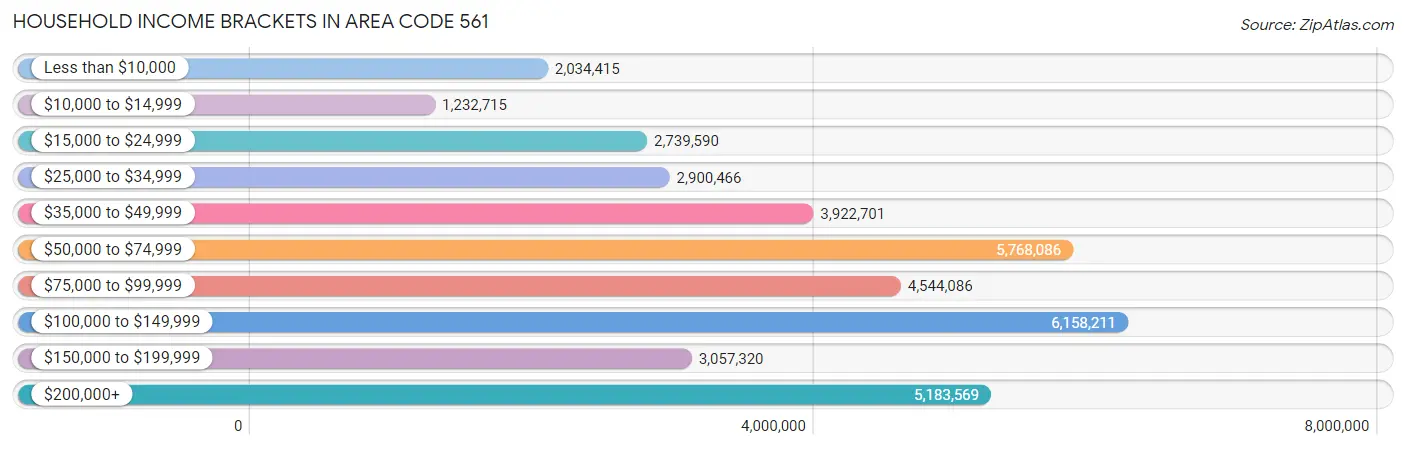
| Income Bracket | # Households | % Households |
| Less than $10,000 | 2,034,415 | 303.5% |
| $10,000 to $14,999 | 1,232,715 | 183.9% |
| $15,000 to $24,999 | 2,739,590 | 408.7% |
| $25,000 to $34,999 | 2,900,466 | 432.7% |
| $35,000 to $49,999 | 3,922,701 | 585.2% |
| $50,000 to $74,999 | 5,768,086 | 860.5% |
| $75,000 to $99,999 | 4,544,086 | 677.9% |
| $100,000 to $149,999 | 6,158,211 | 918.7% |
| $150,000 to $199,999 | 3,057,320 | 456.1% |
| $200,000+ | 5,183,569 | 773.3% |
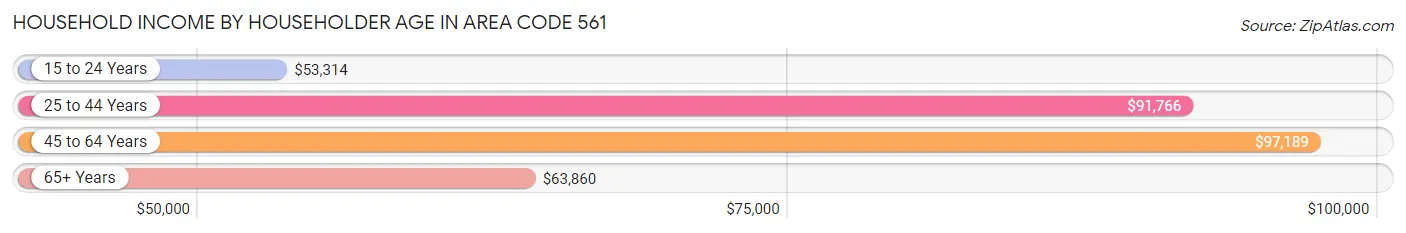
Household Income by Householder Age in Area Code 561
The median household income in Area Code 561 is $81,508, with the highest median household income of $97,189 found in the 45 to 64 years age bracket for the primary householder. A total of 240,310 households (35.8%) fall into this category. Meanwhile, the 15 to 24 years age bracket for the primary householder has the lowest median household income of $53,314, with 12,600 households (1.9%) in this group.
| Income Bracket | # Households | Median Income |
| 15 to 24 Years | 12,600 (1.9%) | $53,314 |
| 25 to 44 Years | 165,540 (24.7%) | $91,766 |
| 45 to 64 Years | 240,310 (35.8%) | $97,189 |
| 65+ Years | 251,868 (37.6%) | $63,860 |
| Total | 670,318 (100.0%) | $81,508 |
Poverty in Area Code 561
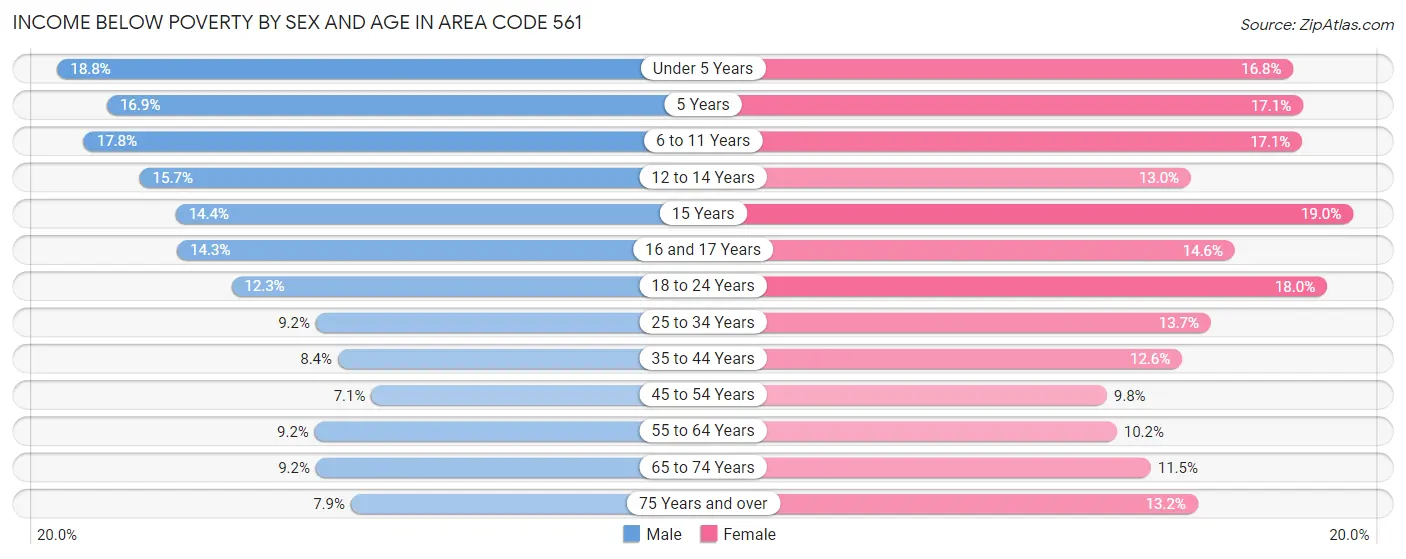
Income Below Poverty by Sex and Age in Area Code 561
With 10.5% poverty level for males and 13.0% for females among the residents of Area Code 561, under 5 year old males and 15 year old females are the most vulnerable to poverty, with 7,792 males (18.8%) and 1,748 females (19.0%) in their respective age groups living below the poverty level.
| Age Bracket | Male | Female |
| Under 5 Years | 7,792 (18.8%) | 6,710 (16.8%) |
| 5 Years | 1,396 (16.9%) | 1,267 (17.1%) |
| 6 to 11 Years | 9,332 (17.8%) | 8,439 (17.1%) |
| 12 to 14 Years | 4,348 (15.7%) | 3,450 (13.0%) |
| 15 Years | 1,338 (14.4%) | 1,748 (19.0%) |
| 16 and 17 Years | 2,700 (14.3%) | 2,560 (14.6%) |
| 18 to 24 Years | 7,568 (12.3%) | 10,552 (18.0%) |
| 25 to 34 Years | 9,050 (9.2%) | 13,357 (13.7%) |
| 35 to 44 Years | 8,268 (8.4%) | 12,342 (12.6%) |
| 45 to 54 Years | 7,381 (7.1%) | 10,454 (9.8%) |
| 55 to 64 Years | 10,208 (9.2%) | 11,905 (10.2%) |
| 65 to 74 Years | 8,251 (9.2%) | 12,178 (11.5%) |
| 75 Years and over | 6,938 (7.9%) | 15,285 (13.2%) |
| Total | 84,570 (10.5%) | 110,247 (13.0%) |
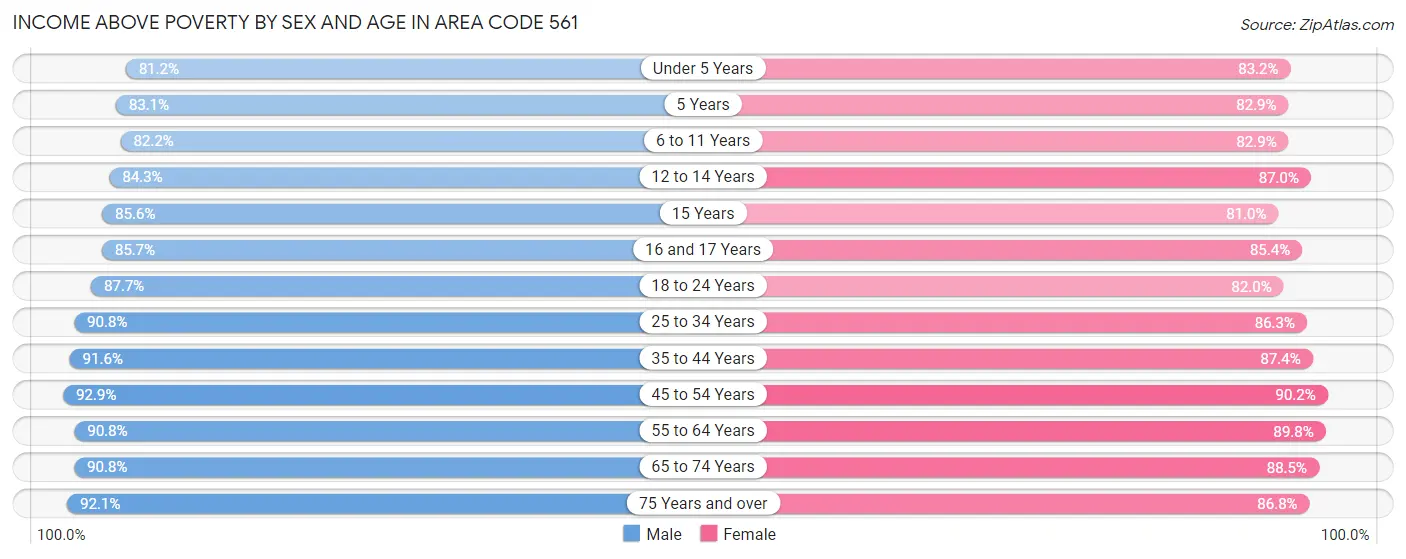
Income Above Poverty by Sex and Age in Area Code 561
According to the poverty statistics in Area Code 561, males aged 45 to 54 years and females aged 45 to 54 years are the age groups that are most secure financially, with 92.9% of males and 90.2% of females in these age groups living above the poverty line.
| Age Bracket | Male | Female |
| Under 5 Years | 33,695 (81.2%) | 33,325 (83.2%) |
| 5 Years | 6,843 (83.1%) | 6,135 (82.9%) |
| 6 to 11 Years | 43,088 (82.2%) | 40,953 (82.9%) |
| 12 to 14 Years | 23,298 (84.3%) | 23,169 (87.0%) |
| 15 Years | 7,960 (85.6%) | 7,464 (81.0%) |
| 16 and 17 Years | 16,124 (85.7%) | 14,982 (85.4%) |
| 18 to 24 Years | 53,855 (87.7%) | 48,041 (82.0%) |
| 25 to 34 Years | 89,445 (90.8%) | 84,159 (86.3%) |
| 35 to 44 Years | 90,544 (91.6%) | 85,403 (87.4%) |
| 45 to 54 Years | 96,072 (92.9%) | 95,782 (90.2%) |
| 55 to 64 Years | 100,359 (90.8%) | 104,693 (89.8%) |
| 65 to 74 Years | 81,520 (90.8%) | 93,954 (88.5%) |
| 75 Years and over | 80,950 (92.1%) | 100,389 (86.8%) |
| Total | 723,753 (89.5%) | 738,449 (87.0%) |
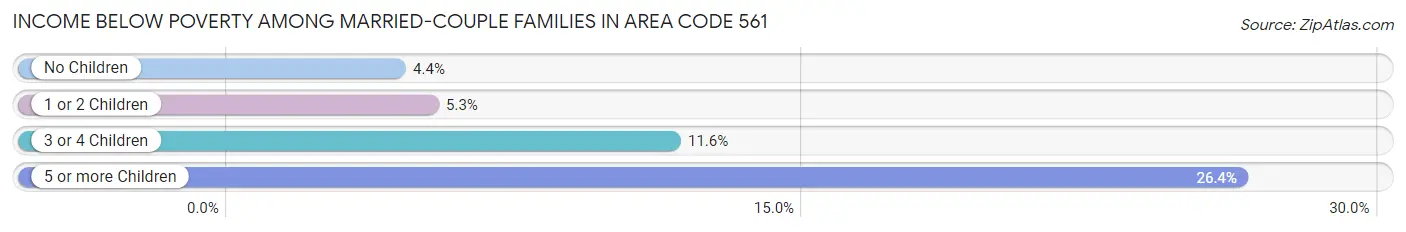
Income Below Poverty Among Married-Couple Families in Area Code 561
The poverty statistics for married-couple families in Area Code 561 show that 5.1% or 15,389 of the total 299,946 families live below the poverty line. Families with 5 or more children have the highest poverty rate of 26.4%, comprising of 332 families. On the other hand, families with no children have the lowest poverty rate of 4.4%, which includes 8,606 families.
| Children | Above Poverty | Below Poverty |
| No Children | 187,368 (95.6%) | 8,606 (4.4%) |
| 1 or 2 Children | 81,501 (94.8%) | 4,520 (5.2%) |
| 3 or 4 Children | 14,762 (88.4%) | 1,931 (11.6%) |
| 5 or more Children | 926 (73.6%) | 332 (26.4%) |
| Total | 284,557 (94.9%) | 15,389 (5.1%) |
Income Below Poverty Among Single-Parent Households in Area Code 561
According to the poverty data in Area Code 561, 10.3% or 3,619 single-father households and 18.8% or 14,778 single-mother households are living below the poverty line. Among single-father households, those with 3 or 4 children have the highest poverty rate, with 690 households (26.2%) experiencing poverty. Likewise, among single-mother households, those with 5 or more children have the highest poverty rate, with 435 households (66.7%) falling below the poverty line.
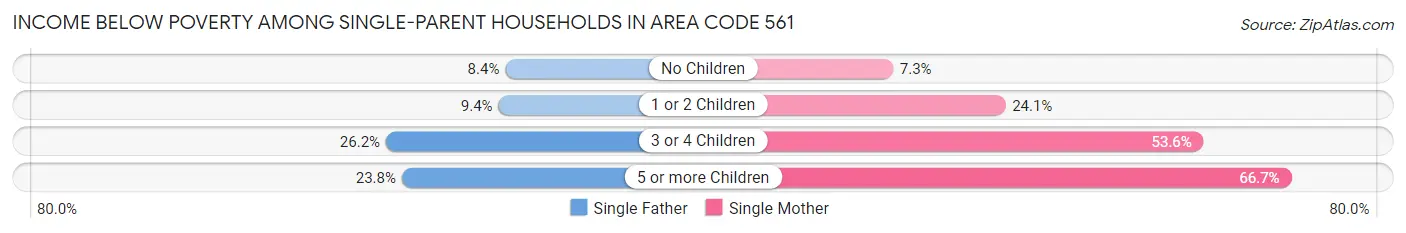
| Children | Single Father | Single Mother |
| No Children | 1,395 (8.4%) | 2,758 (7.3%) |
| 1 or 2 Children | 1,455 (9.4%) | 8,159 (24.1%) |
| 3 or 4 Children | 690 (26.2%) | 3,426 (53.6%) |
| 5 or more Children | 79 (23.8%) | 435 (66.7%) |
| Total | 3,619 (10.3%) | 14,778 (18.8%) |
Income Below Poverty Among Married-Couple vs Single-Parent Households in Area Code 561
The poverty data for Area Code 561 shows that 15,389 of the married-couple family households (5.1%) and 18,397 of the single-parent households (16.2%) are living below the poverty level. Within the married-couple family households, those with 5 or more children have the highest poverty rate, with 332 households (26.4%) falling below the poverty line. Among the single-parent households, those with 5 or more children have the highest poverty rate, with 514 household (52.2%) living below poverty.
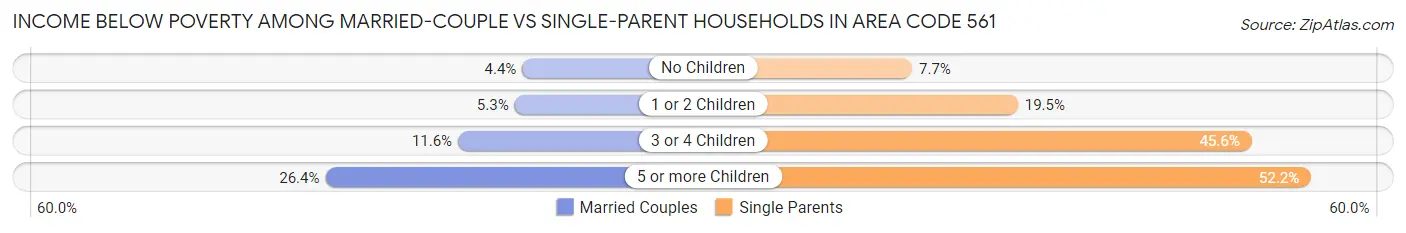
| Children | Married-Couple Families | Single-Parent Households |
| No Children | 8,606 (4.4%) | 4,153 (7.6%) |
| 1 or 2 Children | 4,520 (5.2%) | 9,614 (19.5%) |
| 3 or 4 Children | 1,931 (11.6%) | 4,116 (45.6%) |
| 5 or more Children | 332 (26.4%) | 514 (52.2%) |
| Total | 15,389 (5.1%) | 18,397 (16.2%) |
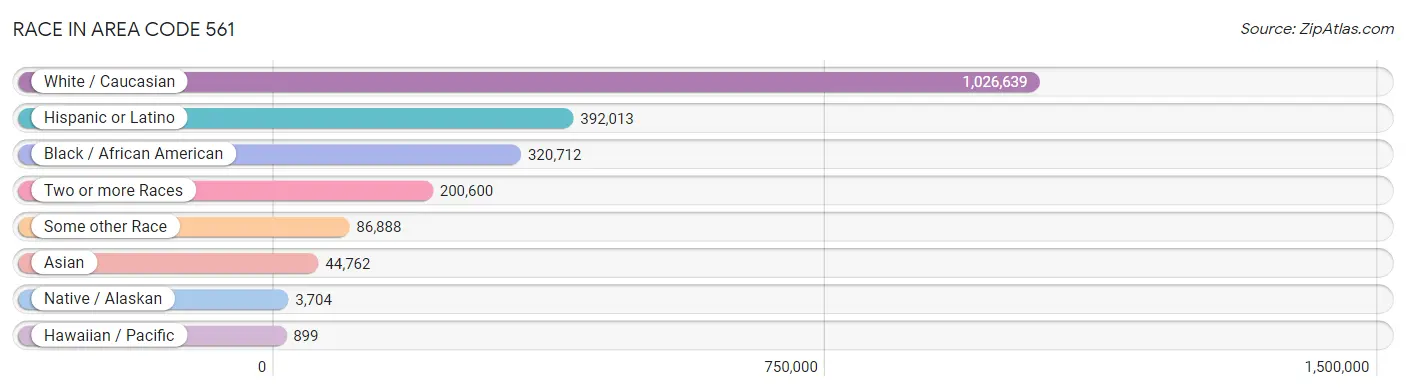
Race in Area Code 561
The most populous races in Area Code 561 are White / Caucasian (1,026,639 | 61.0%), Hispanic or Latino (392,013 | 23.3%), and Black / African American (320,712 | 19.0%).
| Race | # Population | % Population |
| Asian | 44,762 | 2.7% |
| Black / African American | 320,712 | 19.0% |
| Hawaiian / Pacific | 899 | 0.1% |
| Hispanic or Latino | 392,013 | 23.3% |
| Native / Alaskan | 3,704 | 0.2% |
| White / Caucasian | 1,026,639 | 61.0% |
| Two or more Races | 200,600 | 11.9% |
| Some other Race | 86,888 | 5.2% |
| Total | 1,684,204 | 100.0% |
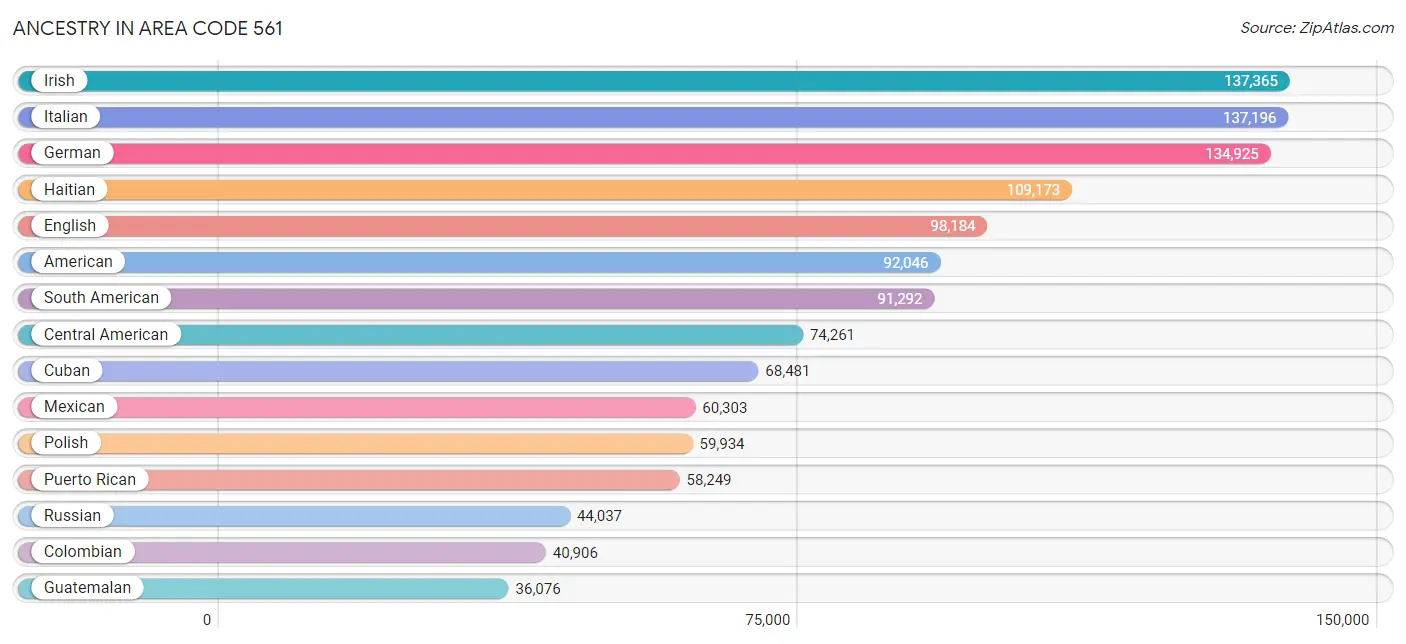
Ancestry in Area Code 561
The most populous ancestries reported in Area Code 561 are Irish (137,365 | 8.2%), Italian (137,196 | 8.2%), German (134,925 | 8.0%), Haitian (109,173 | 6.5%), and English (98,184 | 5.8%), together accounting for 36.6% of all Area Code 561 residents.
| Ancestry | # Population | % Population |
| Afghan | 45 | 0.0% |
| African | 18,978 | 1.1% |
| Albanian | 958 | 0.1% |
| Aleut | 7 | 0.0% |
| Alsatian | 61 | 0.0% |
| American | 92,046 | 5.5% |
| Apache | 209 | 0.0% |
| Arab | 12,368 | 0.7% |
| Argentinean | 6,094 | 0.4% |
| Armenian | 2,186 | 0.1% |
| Assyrian / Chaldean / Syriac | 50 | 0.0% |
| Australian | 686 | 0.0% |
| Austrian | 8,352 | 0.5% |
| Bahamian | 3,902 | 0.2% |
| Barbadian | 1,090 | 0.1% |
| Basque | 123 | 0.0% |
| Belgian | 1,347 | 0.1% |
| Belizean | 495 | 0.0% |
| Bermudan | 23 | 0.0% |
| Bhutanese | 2,485 | 0.2% |
| Blackfeet | 411 | 0.0% |
| Bolivian | 1,437 | 0.1% |
| Brazilian | 25,296 | 1.5% |
| British | 7,833 | 0.5% |
| British West Indian | 1,003 | 0.1% |
| Bulgarian | 1,124 | 0.1% |
| Burmese | 3,176 | 0.2% |
| Cajun | 84 | 0.0% |
| Canadian | 7,022 | 0.4% |
| Cape Verdean | 81 | 0.0% |
| Carpatho Rusyn | 12 | 0.0% |
| Celtic | 219 | 0.0% |
| Central American | 74,261 | 4.4% |
| Central American Indian | 3,028 | 0.2% |
| Cherokee | 2,406 | 0.1% |
| Cheyenne | 28 | 0.0% |
| Chickasaw | 23 | 0.0% |
| Chilean | 2,561 | 0.2% |
| Chinese | 22 | 0.0% |
| Chippewa | 75 | 0.0% |
| Choctaw | 162 | 0.0% |
| Colombian | 40,906 | 2.4% |
| Comanche | 37 | 0.0% |
| Costa Rican | 2,359 | 0.1% |
| Cree | 28 | 0.0% |
| Creek | 260 | 0.0% |
| Croatian | 1,513 | 0.1% |
| Crow | 31 | 0.0% |
| Cuban | 68,481 | 4.1% |
| Cypriot | 177 | 0.0% |
| Czech | 4,434 | 0.3% |
| Czechoslovakian | 1,146 | 0.1% |
| Danish | 2,588 | 0.2% |
| Delaware | 96 | 0.0% |
| Dominican | 19,162 | 1.1% |
| Dutch | 9,967 | 0.6% |
| Dutch West Indian | 49 | 0.0% |
| Eastern European | 17,235 | 1.0% |
| Ecuadorian | 8,234 | 0.5% |
| Egyptian | 2,162 | 0.1% |
| English | 98,184 | 5.8% |
| Estonian | 179 | 0.0% |
| Ethiopian | 106 | 0.0% |
| European | 23,666 | 1.4% |
| Fijian | 12 | 0.0% |
| Filipino | 315 | 0.0% |
| Finnish | 3,579 | 0.2% |
| French | 27,870 | 1.7% |
| French American Indian | 21 | 0.0% |
| French Canadian | 8,390 | 0.5% |
| German | 134,925 | 8.0% |
| German Russian | 39 | 0.0% |
| Ghanaian | 300 | 0.0% |
| Greek | 7,979 | 0.5% |
| Guamanian / Chamorro | 450 | 0.0% |
| Guatemalan | 36,076 | 2.1% |
| Guyanese | 1,464 | 0.1% |
| Haitian | 109,173 | 6.5% |
| Hmong | 21 | 0.0% |
| Honduran | 17,911 | 1.1% |
| Hopi | 21 | 0.0% |
| Hungarian | 11,139 | 0.7% |
| Icelander | 174 | 0.0% |
| Indian (Asian) | 10,777 | 0.6% |
| Indonesian | 255 | 0.0% |
| Inupiat | 55 | 0.0% |
| Iranian | 1,622 | 0.1% |
| Iraqi | 416 | 0.0% |
| Irish | 137,365 | 8.2% |
| Iroquois | 313 | 0.0% |
| Israeli | 2,866 | 0.2% |
| Italian | 137,196 | 8.2% |
| Jamaican | 35,199 | 2.1% |
| Japanese | 298 | 0.0% |
| Jordanian | 278 | 0.0% |
| Kenyan | 562 | 0.0% |
| Korean | 8,126 | 0.5% |
| Laotian | 247 | 0.0% |
| Latvian | 777 | 0.1% |
| Lebanese | 4,445 | 0.3% |
| Liberian | 117 | 0.0% |
| Lithuanian | 4,969 | 0.3% |
| Lumbee | 44 | 0.0% |
| Luxembourger | 104 | 0.0% |
| Macedonian | 382 | 0.0% |
| Malaysian | 66 | 0.0% |
| Maltese | 285 | 0.0% |
| Mexican | 60,303 | 3.6% |
| Mexican American Indian | 1,056 | 0.1% |
| Mongolian | 40 | 0.0% |
| Moroccan | 928 | 0.1% |
| Native Hawaiian | 748 | 0.0% |
| Navajo | 118 | 0.0% |
| New Zealander | 39 | 0.0% |
| Nicaraguan | 6,428 | 0.4% |
| Nigerian | 1,091 | 0.1% |
| Northern European | 971 | 0.1% |
| Norwegian | 8,690 | 0.5% |
| Pakistani | 1,519 | 0.1% |
| Palestinian | 441 | 0.0% |
| Panamanian | 1,886 | 0.1% |
| Paraguayan | 183 | 0.0% |
| Pennsylvania German | 267 | 0.0% |
| Peruvian | 12,649 | 0.7% |
| Pima | 86 | 0.0% |
| Polish | 59,934 | 3.6% |
| Portuguese | 9,052 | 0.5% |
| Potawatomi | 34 | 0.0% |
| Pueblo | 2 | 0.0% |
| Puerto Rican | 58,249 | 3.5% |
| Romanian | 6,712 | 0.4% |
| Russian | 44,037 | 2.6% |
| Salvadoran | 9,054 | 0.5% |
| Samoan | 382 | 0.0% |
| Scandinavian | 2,603 | 0.2% |
| Scotch-Irish | 7,850 | 0.5% |
| Scottish | 17,804 | 1.1% |
| Seminole | 237 | 0.0% |
| Serbian | 940 | 0.1% |
| Sierra Leonean | 5 | 0.0% |
| Sioux | 368 | 0.0% |
| Slavic | 668 | 0.0% |
| Slovak | 2,378 | 0.1% |
| Slovene | 565 | 0.0% |
| Somali | 66 | 0.0% |
| South African | 2,020 | 0.1% |
| South American | 91,292 | 5.4% |
| South American Indian | 666 | 0.0% |
| Soviet Union | 20 | 0.0% |
| Spaniard | 5,763 | 0.3% |
| Spanish | 3,244 | 0.2% |
| Spanish American | 24 | 0.0% |
| Spanish American Indian | 129 | 0.0% |
| Sri Lankan | 7,860 | 0.5% |
| Subsaharan African | 24,222 | 1.4% |
| Sudanese | 278 | 0.0% |
| Swedish | 9,805 | 0.6% |
| Swiss | 2,929 | 0.2% |
| Syrian | 1,316 | 0.1% |
| Taiwanese | 27 | 0.0% |
| Thai | 17,486 | 1.0% |
| Tlingit-Haida | 32 | 0.0% |
| Tohono O'Odham | 1 | 0.0% |
| Trinidadian and Tobagonian | 3,057 | 0.2% |
| Turkish | 3,091 | 0.2% |
| U.S. Virgin Islander | 208 | 0.0% |
| Ukrainian | 7,728 | 0.5% |
| Uruguayan | 2,957 | 0.2% |
| Venezuelan | 15,711 | 0.9% |
| Vietnamese | 2,327 | 0.1% |
| Welsh | 5,398 | 0.3% |
| West Indian | 3,251 | 0.2% |
| Yugoslavian | 645 | 0.0% |
| Yup'ik | 9 | 0.0% |
| Zimbabwean | 137 | 0.0% | View All 175 Rows |
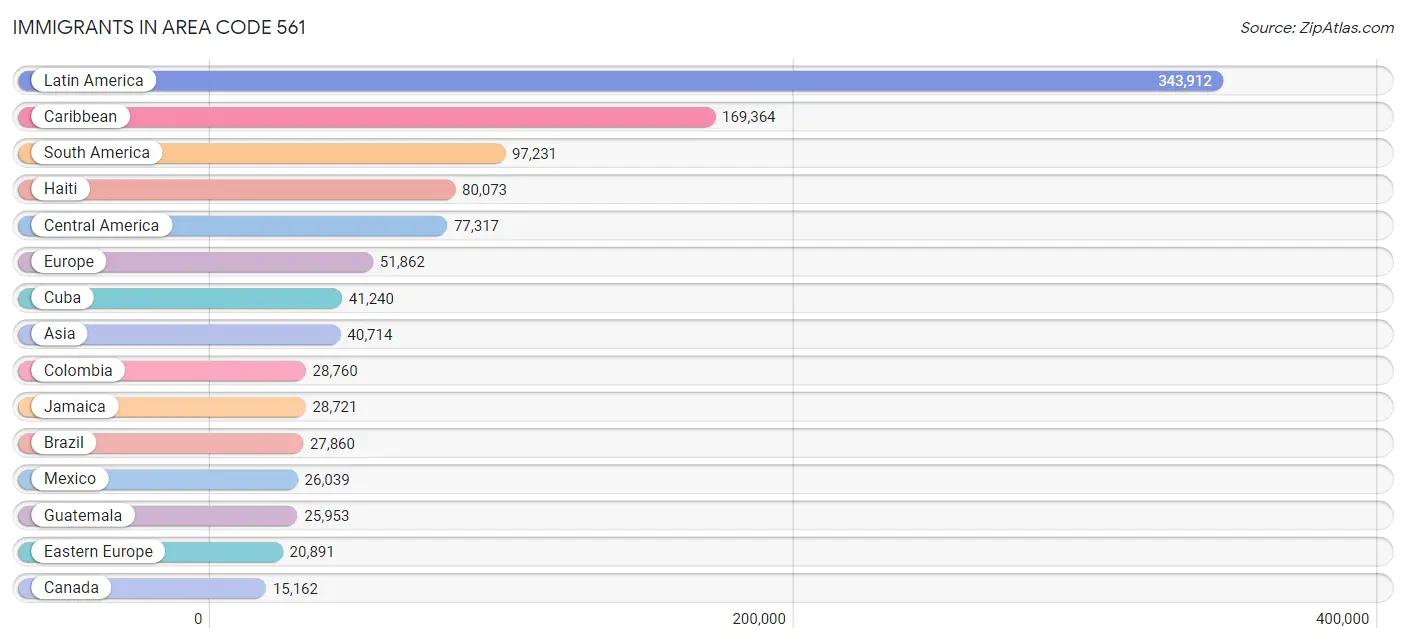
Immigrants in Area Code 561
The most numerous immigrant groups reported in Area Code 561 came from Latin America (343,912 | 20.4%), Caribbean (169,364 | 10.1%), South America (97,231 | 5.8%), Haiti (80,073 | 4.8%), and Central America (77,317 | 4.6%), together accounting for 45.6% of all Area Code 561 residents.
| Immigration Origin | # Population | % Population |
| Afghanistan | 307 | 0.0% |
| Africa | 8,648 | 0.5% |
| Albania | 492 | 0.0% |
| Argentina | 4,956 | 0.3% |
| Armenia | 74 | 0.0% |
| Asia | 40,714 | 2.4% |
| Australia | 403 | 0.0% |
| Austria | 750 | 0.0% |
| Azores | 25 | 0.0% |
| Bahamas | 1,670 | 0.1% |
| Bangladesh | 3,486 | 0.2% |
| Barbados | 870 | 0.1% |
| Belarus | 376 | 0.0% |
| Belgium | 794 | 0.1% |
| Belize | 450 | 0.0% |
| Bolivia | 920 | 0.1% |
| Bosnia and Herzegovina | 202 | 0.0% |
| Brazil | 27,860 | 1.7% |
| Bulgaria | 858 | 0.1% |
| Cabo Verde | 78 | 0.0% |
| Cambodia | 178 | 0.0% |
| Cameroon | 167 | 0.0% |
| Canada | 15,162 | 0.9% |
| Caribbean | 169,364 | 10.1% |
| Central America | 77,317 | 4.6% |
| Chile | 2,232 | 0.1% |
| China | 5,908 | 0.4% |
| Colombia | 28,760 | 1.7% |
| Congo | 7 | 0.0% |
| Costa Rica | 1,639 | 0.1% |
| Croatia | 408 | 0.0% |
| Cuba | 41,240 | 2.5% |
| Czechoslovakia | 1,159 | 0.1% |
| Denmark | 240 | 0.0% |
| Dominica | 417 | 0.0% |
| Dominican Republic | 9,803 | 0.6% |
| Eastern Africa | 1,191 | 0.1% |
| Eastern Asia | 8,071 | 0.5% |
| Eastern Europe | 20,891 | 1.2% |
| Ecuador | 5,070 | 0.3% |
| Egypt | 1,770 | 0.1% |
| El Salvador | 5,612 | 0.3% |
| England | 4,017 | 0.2% |
| Ethiopia | 94 | 0.0% |
| Europe | 51,862 | 3.1% |
| Fiji | 23 | 0.0% |
| France | 2,470 | 0.2% |
| Germany | 5,304 | 0.3% |
| Ghana | 258 | 0.0% |
| Greece | 898 | 0.1% |
| Grenada | 96 | 0.0% |
| Guatemala | 25,953 | 1.5% |
| Guyana | 2,443 | 0.2% |
| Haiti | 80,073 | 4.8% |
| Honduras | 12,202 | 0.7% |
| Hong Kong | 611 | 0.0% |
| Hungary | 1,158 | 0.1% |
| India | 5,706 | 0.3% |
| Indonesia | 301 | 0.0% |
| Iran | 1,013 | 0.1% |
| Iraq | 569 | 0.0% |
| Ireland | 1,247 | 0.1% |
| Israel | 2,893 | 0.2% |
| Italy | 4,206 | 0.3% |
| Jamaica | 28,721 | 1.7% |
| Japan | 724 | 0.0% |
| Jordan | 282 | 0.0% |
| Kazakhstan | 503 | 0.0% |
| Kenya | 491 | 0.0% |
| Korea | 1,439 | 0.1% |
| Kuwait | 61 | 0.0% |
| Laos | 90 | 0.0% |
| Latin America | 343,912 | 20.4% |
| Latvia | 298 | 0.0% |
| Lebanon | 1,262 | 0.1% |
| Liberia | 151 | 0.0% |
| Lithuania | 352 | 0.0% |
| Malaysia | 87 | 0.0% |
| Mexico | 26,039 | 1.5% |
| Micronesia | 12 | 0.0% |
| Middle Africa | 389 | 0.0% |
| Moldova | 360 | 0.0% |
| Morocco | 816 | 0.1% |
| Nepal | 106 | 0.0% |
| Netherlands | 892 | 0.1% |
| Nicaragua | 4,436 | 0.3% |
| Nigeria | 472 | 0.0% |
| North Macedonia | 195 | 0.0% |
| Northern Africa | 3,235 | 0.2% |
| Northern Europe | 11,557 | 0.7% |
| Norway | 518 | 0.0% |
| Oceania | 830 | 0.1% |
| Pakistan | 1,101 | 0.1% |
| Panama | 974 | 0.1% |
| Peru | 9,156 | 0.5% |
| Philippines | 4,068 | 0.2% |
| Poland | 3,978 | 0.2% |
| Portugal | 1,489 | 0.1% |
| Romania | 2,489 | 0.2% |
| Russia | 4,057 | 0.2% |
| Saudi Arabia | 153 | 0.0% |
| Scotland | 518 | 0.0% |
| Senegal | 32 | 0.0% |
| Serbia | 667 | 0.0% |
| South Africa | 2,554 | 0.2% |
| South America | 97,231 | 5.8% |
| South Central Asia | 12,751 | 0.8% |
| South Eastern Asia | 10,632 | 0.6% |
| Southern Europe | 8,523 | 0.5% |
| Spain | 1,871 | 0.1% |
| Sri Lanka | 231 | 0.0% |
| St. Vincent and the Grenadines | 201 | 0.0% |
| Sudan | 241 | 0.0% |
| Sweden | 668 | 0.0% |
| Switzerland | 594 | 0.0% |
| Syria | 991 | 0.1% |
| Taiwan | 529 | 0.0% |
| Thailand | 1,086 | 0.1% |
| Trinidad and Tobago | 4,275 | 0.3% |
| Turkey | 1,832 | 0.1% |
| Uganda | 35 | 0.0% |
| Ukraine | 2,746 | 0.2% |
| Uruguay | 2,373 | 0.1% |
| Uzbekistan | 260 | 0.0% |
| Venezuela | 13,013 | 0.8% |
| Vietnam | 4,685 | 0.3% |
| West Indies | 267 | 0.0% |
| Western Africa | 1,047 | 0.1% |
| Western Asia | 8,968 | 0.5% |
| Western Europe | 10,825 | 0.6% |
| Yemen | 361 | 0.0% |
| Zimbabwe | 360 | 0.0% | View All 132 Rows |
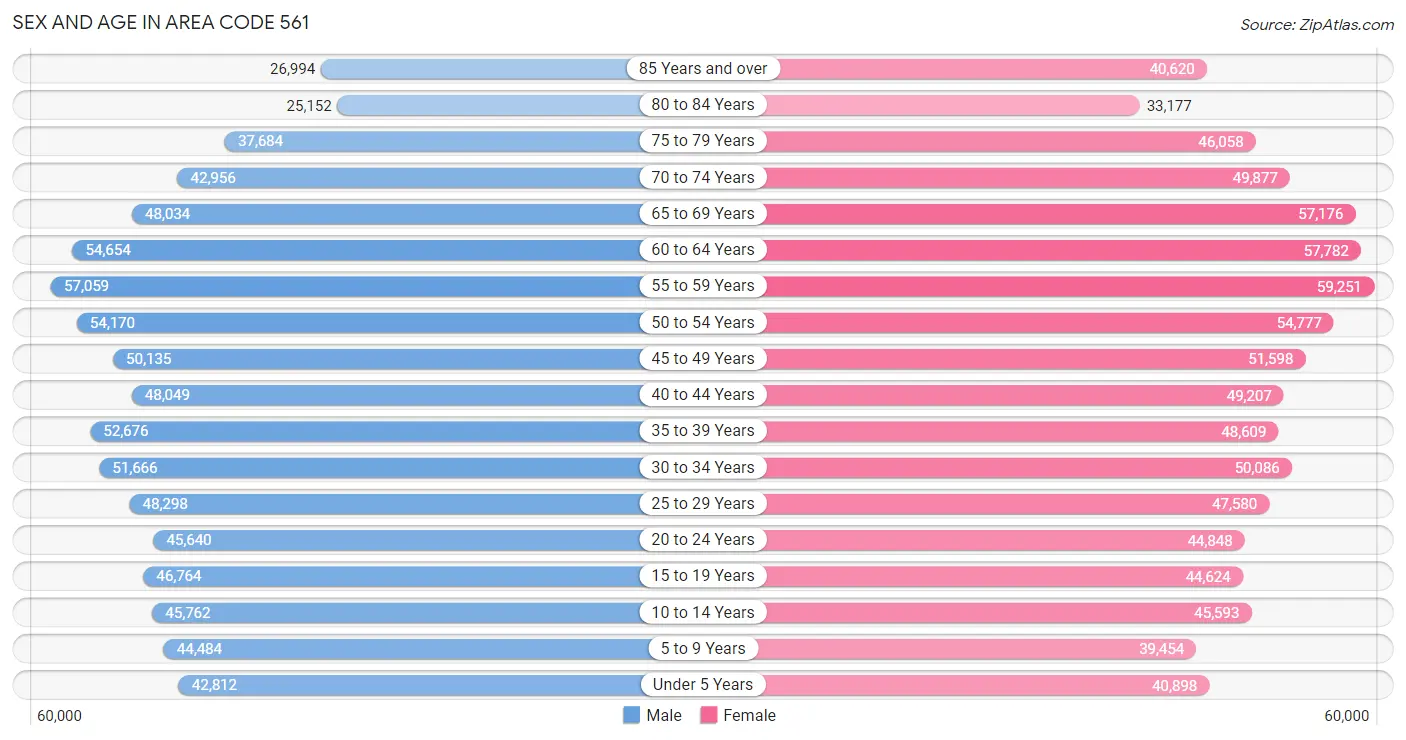
Sex and Age in Area Code 561
Sex and Age in Area Code 561
The most populous age groups in Area Code 561 are 55 to 59 Years (57,059 | 6.9%) for men and 55 to 59 Years (59,251 | 6.9%) for women.
| Age Bracket | Male | Female |
| Under 5 Years | 42,812 (5.2%) | 40,898 (4.8%) |
| 5 to 9 Years | 44,484 (5.4%) | 39,454 (4.6%) |
| 10 to 14 Years | 45,762 (5.6%) | 45,593 (5.3%) |
| 15 to 19 Years | 46,764 (5.7%) | 44,624 (5.2%) |
| 20 to 24 Years | 45,640 (5.6%) | 44,848 (5.2%) |
| 25 to 29 Years | 48,298 (5.9%) | 47,580 (5.5%) |
| 30 to 34 Years | 51,666 (6.3%) | 50,086 (5.8%) |
| 35 to 39 Years | 52,676 (6.4%) | 48,609 (5.6%) |
| 40 to 44 Years | 48,049 (5.8%) | 49,207 (5.7%) |
| 45 to 49 Years | 50,135 (6.1%) | 51,598 (6.0%) |
| 50 to 54 Years | 54,170 (6.6%) | 54,777 (6.4%) |
| 55 to 59 Years | 57,059 (6.9%) | 59,251 (6.9%) |
| 60 to 64 Years | 54,654 (6.6%) | 57,782 (6.7%) |
| 65 to 69 Years | 48,034 (5.8%) | 57,176 (6.6%) |
| 70 to 74 Years | 42,956 (5.2%) | 49,877 (5.8%) |
| 75 to 79 Years | 37,684 (4.6%) | 46,058 (5.3%) |
| 80 to 84 Years | 25,152 (3.1%) | 33,177 (3.8%) |
| 85 Years and over | 26,994 (3.3%) | 40,620 (4.7%) |
| Total | 822,989 (100.0%) | 861,215 (100.0%) |
Families and Households in Area Code 561
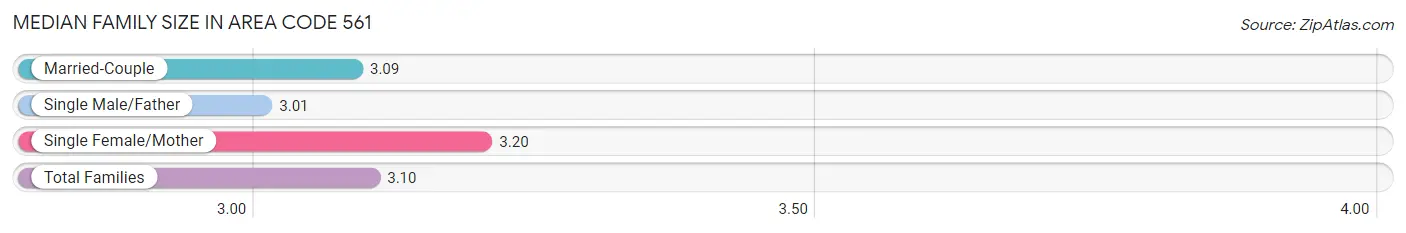
Median Family Size in Area Code 561
The median family size in Area Code 561 is 3.10 persons per family, with single female/mother families (78,565 | 19.0%) accounting for the largest median family size of 3.20232 persons per family. On the other hand, single male/father families (35,111 | 8.5%) represent the smallest median family size with 3.01 persons per family.
| Family Type | # Families | Family Size |
| Married-Couple | 299,946 (72.5%) | 3.09 |
| Single Male/Father | 35,111 (8.5%) | 3.01 |
| Single Female/Mother | 78,565 (19.0%) | 3.20 |
| Total Families | 413,622 (100.0%) | 3.10 |
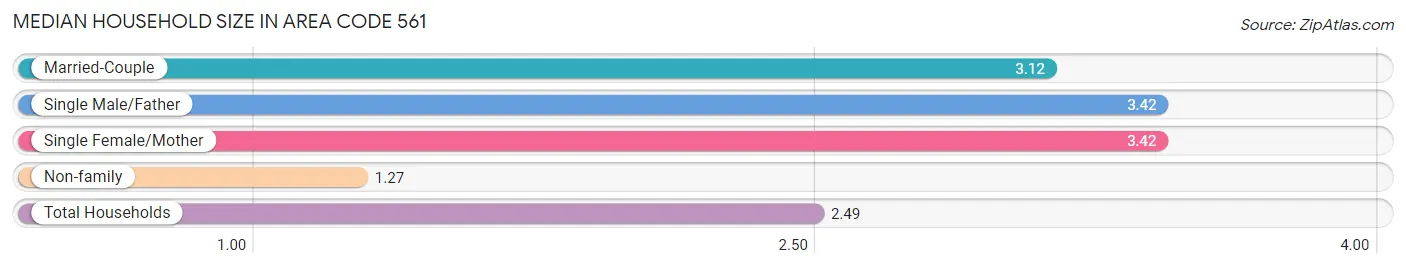
Median Household Size in Area Code 561
The median household size in Area Code 561 is 2.49 persons per household, with single female/mother households (78,565 | 11.7%) accounting for the largest median household size of 3.41517 persons per household. non-family households (256,696 | 38.3%) represent the smallest median household size with 1.27 persons per household.
| Household Type | # Households | Household Size |
| Married-Couple | 299,946 (44.8%) | 3.12 |
| Single Male/Father | 35,111 (5.2%) | 3.42 |
| Single Female/Mother | 78,565 (11.7%) | 3.42 |
| Non-family | 256,696 (38.3%) | 1.27 |
| Total Households | 670,318 (100.0%) | 2.49 |
Household Size by Marriage Status in Area Code 561
Out of a total of 670,318 households in Area Code 561, 413,622 (61.7%) are family households, while 256,696 (38.3%) are nonfamily households. The most numerous type of family households are 2-person households, comprising 201,703, and the most common type of nonfamily households are 1-person households, comprising 209,646.
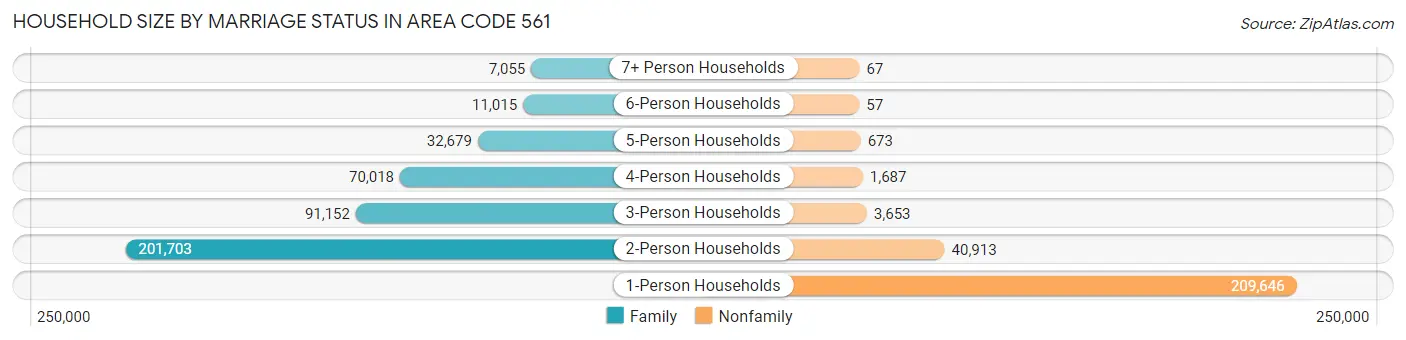
| Household Size | Family Households | Nonfamily Households |
| 1-Person Households | - | 209,646 (31.3%) |
| 2-Person Households | 201,703 (30.1%) | 40,913 (6.1%) |
| 3-Person Households | 91,152 (13.6%) | 3,653 (0.5%) |
| 4-Person Households | 70,018 (10.4%) | 1,687 (0.3%) |
| 5-Person Households | 32,679 (4.9%) | 673 (0.1%) |
| 6-Person Households | 11,015 (1.6%) | 57 (0.0%) |
| 7+ Person Households | 7,055 (1.1%) | 67 (0.0%) |
| Total | 413,622 (61.7%) | 256,696 (38.3%) |
Female Fertility in Area Code 561
Fertility by Age in Area Code 561
Average fertility rate in Area Code 561 is 51.1 births per 1,000 women. Women in the age bracket of 20 to 34 years have the highest fertility rate with 82.5 births per 1,000 women. Women in the age bracket of 20 to 34 years acount for 64.3% of all women with births.
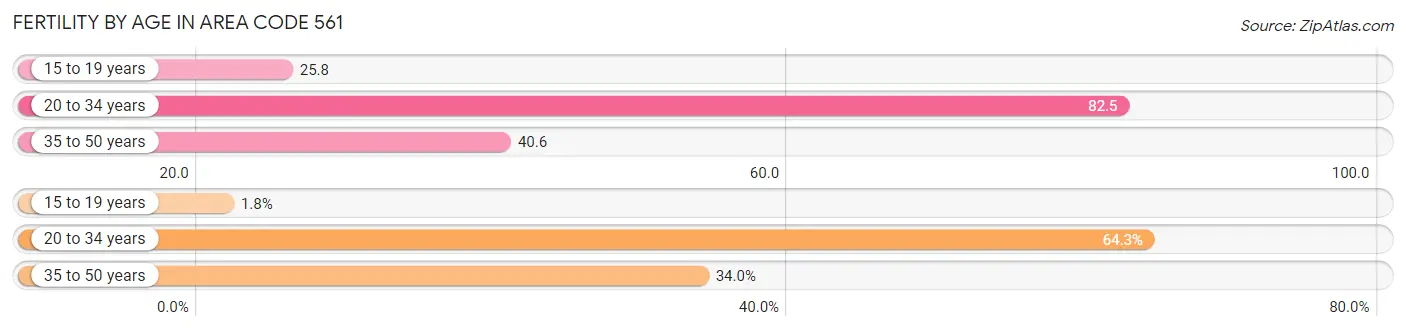
| Age Bracket | Women with Births | Births / 1,000 Women |
| 15 to 19 years | 311 (1.8%) | 25.8 |
| 20 to 34 years | 11,367 (64.3%) | 82.5 |
| 35 to 50 years | 6,011 (34.0%) | 40.6 |
| Total | 17,689 (100.0%) | 51.1 |
Fertility by Age by Marriage Status in Area Code 561
61.8% of women with births (17,689) in Area Code 561 are married. The highest percentage of unmarried women with births falls into 15 to 19 years age bracket with 96.5% of them unmarried at the time of birth, while the lowest percentage of unmarried women with births belong to 35 to 50 years age bracket with 36.1% of them unmarried.
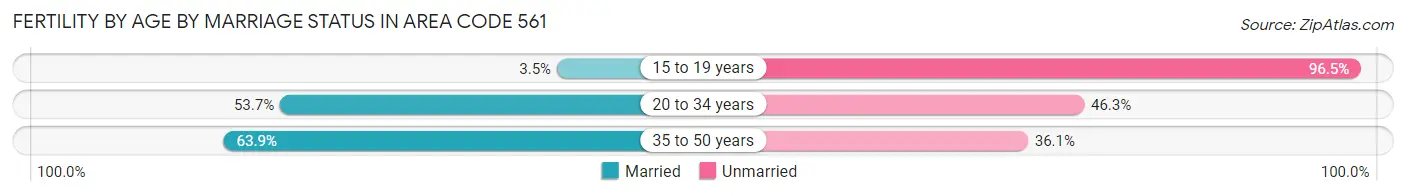
| Age Bracket | Married | Unmarried |
| 15 to 19 years | 11 (3.5%) | 300 (96.5%) |
| 20 to 34 years | 6,106 (53.7%) | 5,261 (46.3%) |
| 35 to 50 years | 3,842 (63.9%) | 2,169 (36.1%) |
| Total | 10,923 (61.8%) | 6,766 (38.3%) |
Fertility by Education in Area Code 561
Average fertility rate in Area Code 561 is 51.1 births per 1,000 women. Women with the education attainment of graduate degree have the highest fertility rate of 65.3 births per 1,000 women, while women with the education attainment of less than high school have the lowest fertility at 56.6 births per 1,000 women. Women with the education attainment of college or associate's degree represent 29.4% of all women with births.
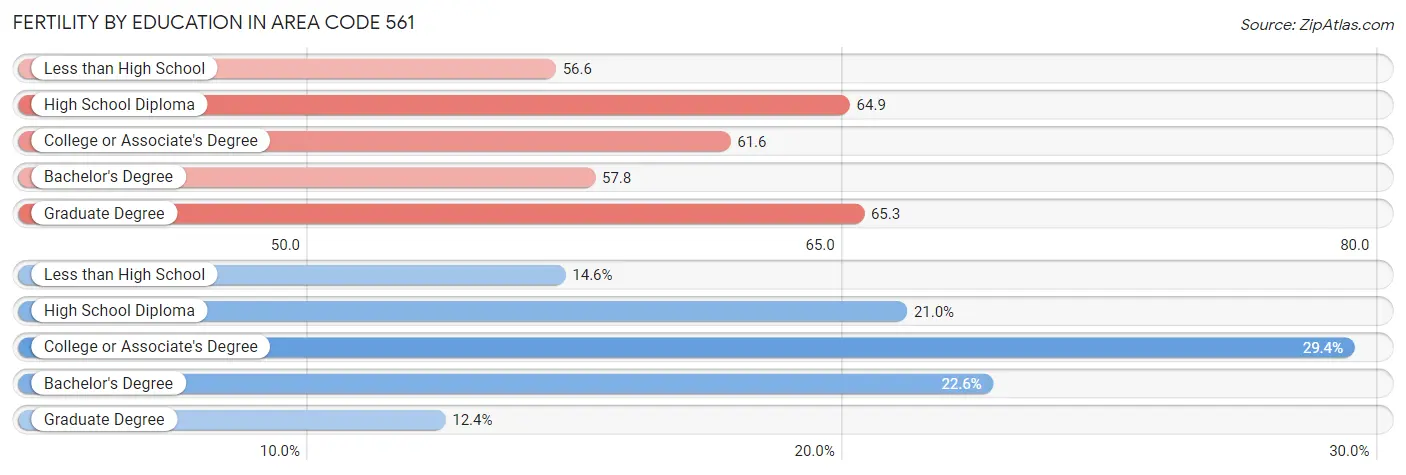
| Educational Attainment | Women with Births | Births / 1,000 Women |
| Less than High School | 2,584 (14.6%) | 56.6 |
| High School Diploma | 3,716 (21.0%) | 64.9 |
| College or Associate's Degree | 5,200 (29.4%) | 61.6 |
| Bachelor's Degree | 4,003 (22.6%) | 57.8 |
| Graduate Degree | 2,186 (12.4%) | 65.3 |
| Total | 17,689 (100.0%) | 51.1 |
Fertility by Education by Marriage Status in Area Code 561
38.3% of women with births in Area Code 561 are unmarried. Women with the educational attainment of bachelor's degree are most likely to be married with 56.8% of them married at childbirth, while women with the educational attainment of less than high school are least likely to be married with 71.1% of them unmarried at childbirth.
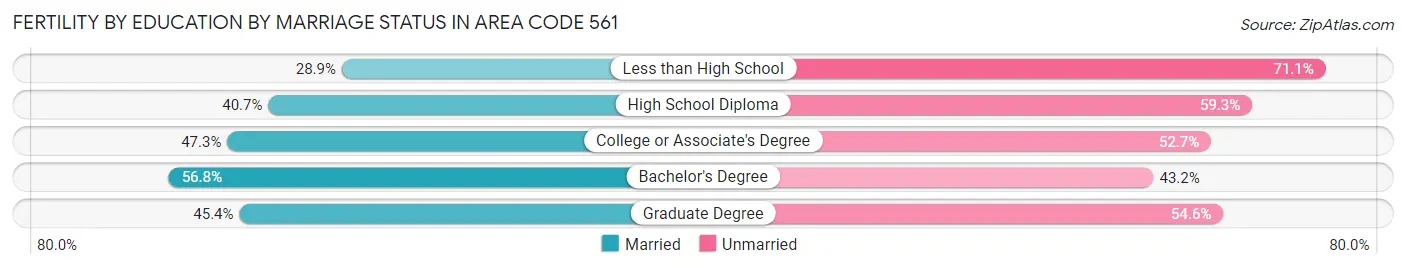
| Educational Attainment | Married | Unmarried |
| Less than High School | 746 (28.9%) | 1,838 (71.1%) |
| High School Diploma | 1,513 (40.7%) | 2,203 (59.3%) |
| College or Associate's Degree | 2,461 (47.3%) | 2,739 (52.7%) |
| Bachelor's Degree | 2,272 (56.8%) | 1,731 (43.2%) |
| Graduate Degree | 992 (45.4%) | 1,194 (54.6%) |
| Total | 10,923 (61.8%) | 6,766 (38.3%) |
Employment Characteristics in Area Code 561
Employment by Class of Employer in Area Code 561
Among the 773,407 employed individuals in Area Code 561, private company employees (533,807 | 69.0%), self-employed (incorporated) (64,034 | 8.3%), and self-employed (not incorporated) (52,560 | 6.8%) make up the most common classes of employment.
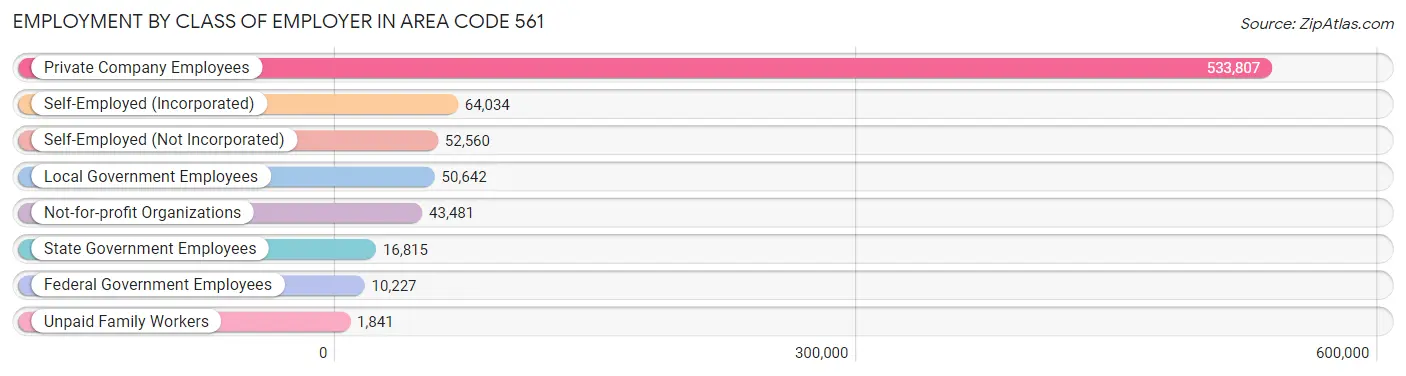
| Employer Class | # Employees | % Employees |
| Private Company Employees | 533,807 | 69.0% |
| Self-Employed (Incorporated) | 64,034 | 8.3% |
| Self-Employed (Not Incorporated) | 52,560 | 6.8% |
| Not-for-profit Organizations | 43,481 | 5.6% |
| Local Government Employees | 50,642 | 6.6% |
| State Government Employees | 16,815 | 2.2% |
| Federal Government Employees | 10,227 | 1.3% |
| Unpaid Family Workers | 1,841 | 0.2% |
| Total | 773,407 | 100.0% |
Employment Status by Age in Area Code 561
According to the labor force statistics for Area Code 561, out of the total population over 16 years of age (1,406,658), 57.7% or 810,938 individuals are in the labor force, with 6.2% or 50,278 of them unemployed. The age group with the highest labor force participation rate is 25 to 29 years, with 83.2% or 79,790 individuals in the labor force. Within the labor force, the 16 to 19 years age range has the highest percentage of unemployed individuals, with 1,056.1% or 283,880 of them being unemployed.
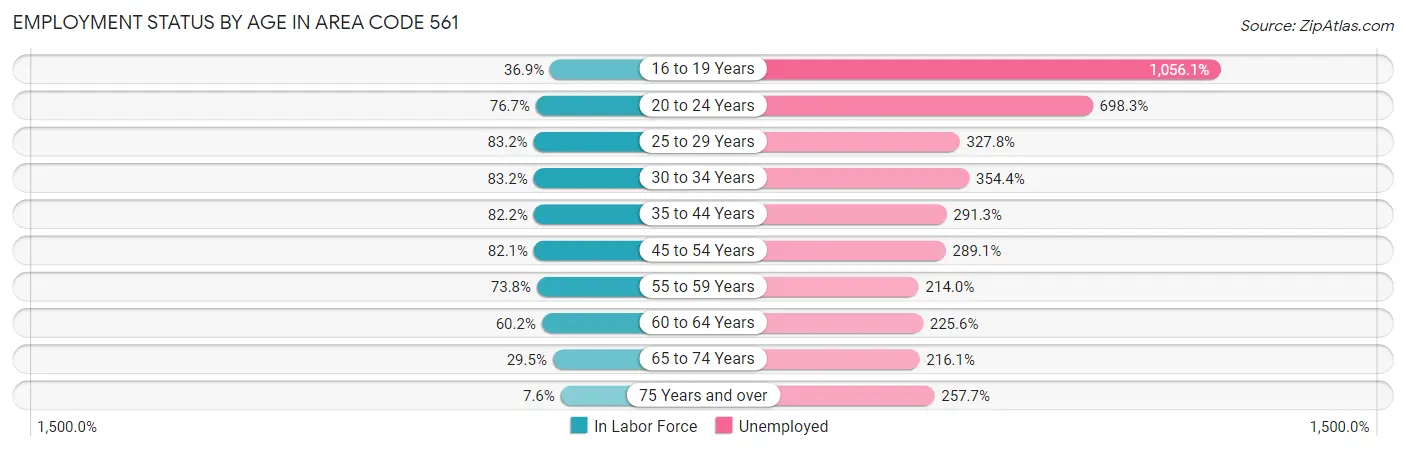
| Age Bracket | In Labor Force | Unemployed |
| 16 to 19 Years | 26,882 (36.9%) | 283,880 (1,056.1%) |
| 20 to 24 Years | 69,427 (76.7%) | 484,774 (698.3%) |
| 25 to 29 Years | 79,791 (83.2%) | 261,552 (327.8%) |
| 30 to 34 Years | 84,650 (83.2%) | 299,989 (354.4%) |
| 35 to 44 Years | 163,279 (82.2%) | 475,635 (291.3%) |
| 45 to 54 Years | 172,901 (82.1%) | 499,868 (289.1%) |
| 55 to 59 Years | 85,858 (73.8%) | 183,740 (214.0%) |
| 60 to 64 Years | 67,699 (60.2%) | 152,727 (225.6%) |
| 65 to 74 Years | 58,423 (29.5%) | 126,252 (216.1%) |
| 75 Years and over | 15,928 (7.6%) | 41,067 (257.7%) |
| Total | 810,888 (57.7%) | 50,293 (6.2%) |
Employment Status by Educational Attainment in Area Code 561
According to labor force statistics for Area Code 561, 77.8% of individuals (650,178) out of the total population between 25 and 64 years of age (835,597) are in the labor force, with 285.7% or 1,857,559 of them being unemployed. The group with the highest labor force participation rate are those with the educational attainment of bachelor's degree or higher, with 83.5% or 257,975 individuals in the labor force. Within the labor force, individuals with high school diploma education have the highest percentage of unemployment, with 351.7% or 505,871 of them being unemployed.
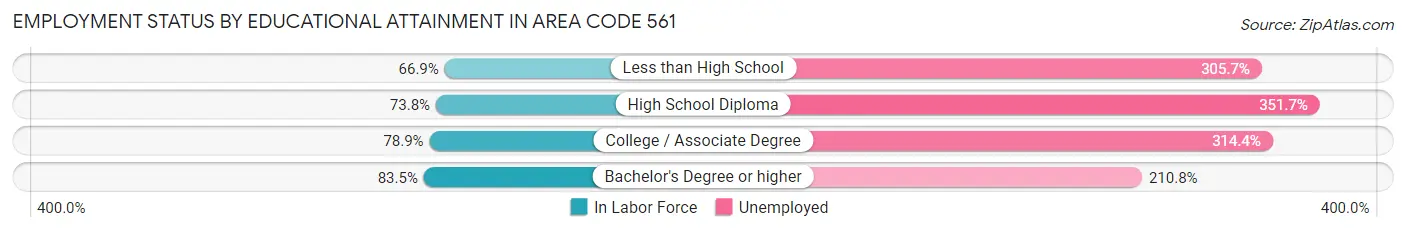
| Educational Attainment | In Labor Force | Unemployed |
| Less than High School | 65,727 (66.9%) | 300,381 (305.7%) |
| High School Diploma | 143,844 (73.8%) | 685,368 (351.7%) |
| College / Associate Degree | 184,233 (78.9%) | 733,813 (314.4%) |
| Bachelor's Degree or higher | 257,968 (83.5%) | 651,505 (210.8%) |
| Total | 650,214 (77.8%) | 2,387,301 (285.7%) |
Employment Occupations by Sex in Area Code 561
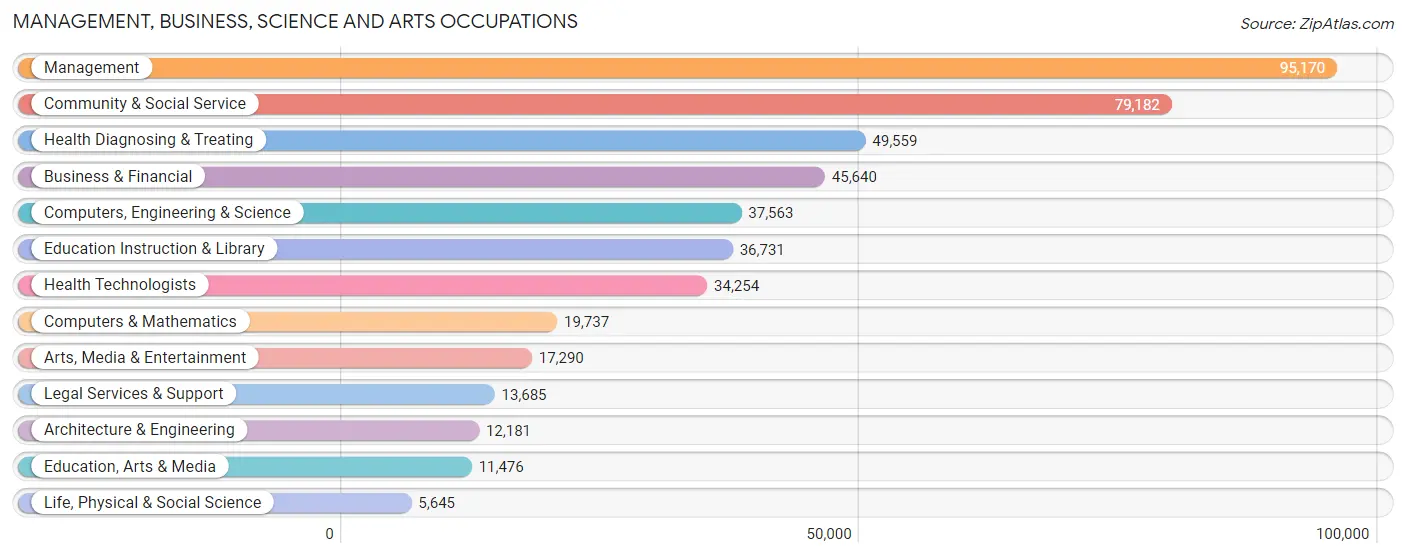
Management, Business, Science and Arts Occupations
The most common Management, Business, Science and Arts occupations in Area Code 561 are Management (95,170 | 12.0%), Community & Social Service (79,182 | 10.0%), Health Diagnosing & Treating (49,559 | 6.3%), Business & Financial (45,640 | 5.8%), and Computers, Engineering & Science (37,563 | 4.7%).
Management, Business, Science and Arts Occupations by Sex
Within the Management, Business, Science and Arts occupations in Area Code 561, the most male-oriented occupations are Architecture & Engineering (86.5%), Computers, Engineering & Science (74.2%), and Computers & Mathematics (73.7%), while the most female-oriented occupations are Education Instruction & Library (76.4%), Health Diagnosing & Treating (69.0%), and Health Technologists (67.4%).
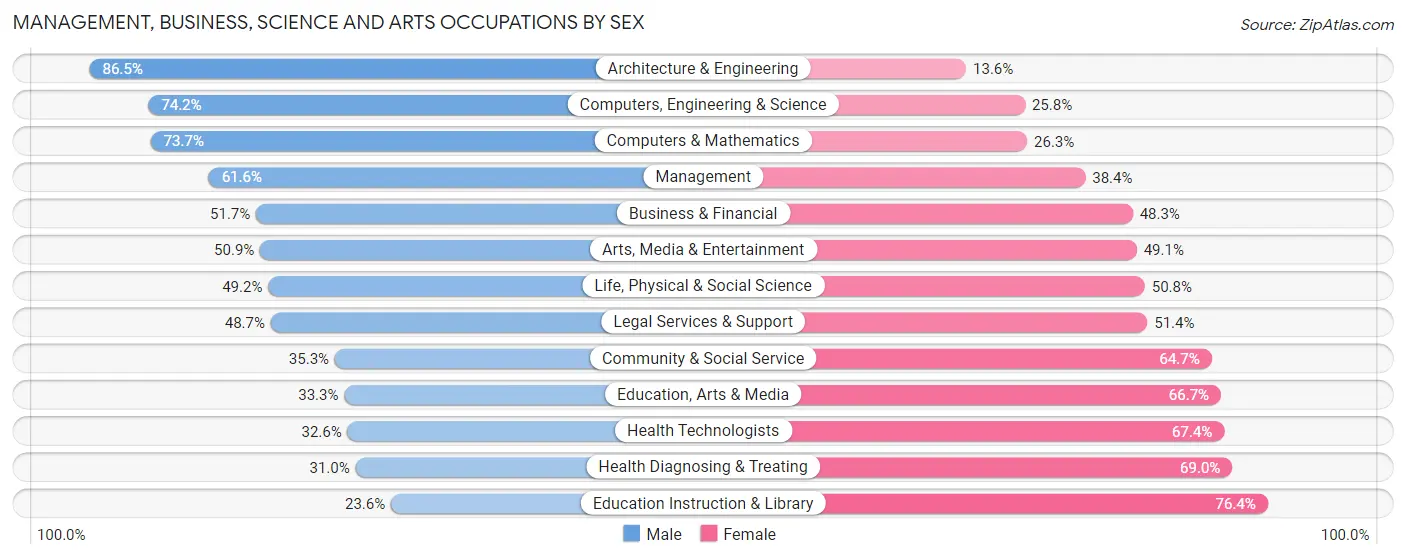
| Occupation | Male | Female |
| Management | 58,619 (61.6%) | 36,551 (38.4%) |
| Business & Financial | 23,596 (51.7%) | 22,044 (48.3%) |
| Computers, Engineering & Science | 27,859 (74.2%) | 9,704 (25.8%) |
| Computers & Mathematics | 14,552 (73.7%) | 5,185 (26.3%) |
| Architecture & Engineering | 10,531 (86.5%) | 1,650 (13.6%) |
| Life, Physical & Social Science | 2,776 (49.2%) | 2,869 (50.8%) |
| Community & Social Service | 27,929 (35.3%) | 51,253 (64.7%) |
| Education, Arts & Media | 3,823 (33.3%) | 7,653 (66.7%) |
| Legal Services & Support | 6,658 (48.6%) | 7,027 (51.3%) |
| Education Instruction & Library | 8,654 (23.6%) | 28,077 (76.4%) |
| Arts, Media & Entertainment | 8,794 (50.9%) | 8,496 (49.1%) |
| Health Diagnosing & Treating | 15,344 (31.0%) | 34,215 (69.0%) |
| Health Technologists | 11,176 (32.6%) | 23,078 (67.4%) |
| Total (Category) | 153,347 (49.9%) | 153,767 (50.1%) |
| Total (Overall) | 421,815 (53.3%) | 369,830 (46.7%) |
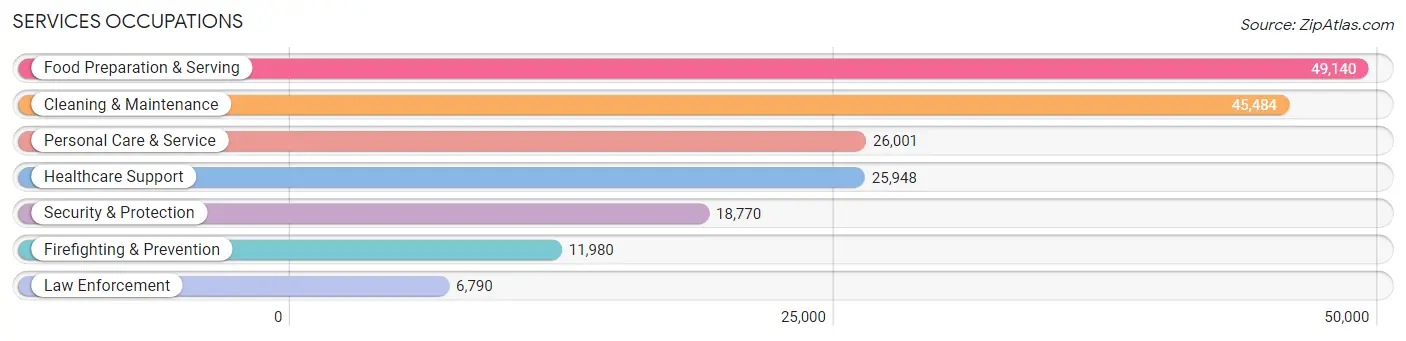
Services Occupations
The most common Services occupations in Area Code 561 are Food Preparation & Serving (49,140 | 6.2%), Cleaning & Maintenance (45,484 | 5.8%), Personal Care & Service (26,001 | 3.3%), Healthcare Support (25,948 | 3.3%), and Security & Protection (18,770 | 2.4%).
Services Occupations by Sex
Within the Services occupations in Area Code 561, the most male-oriented occupations are Firefighting & Prevention (77.0%), Security & Protection (76.0%), and Law Enforcement (74.3%), while the most female-oriented occupations are Healthcare Support (86.9%), Personal Care & Service (64.6%), and Food Preparation & Serving (50.4%).
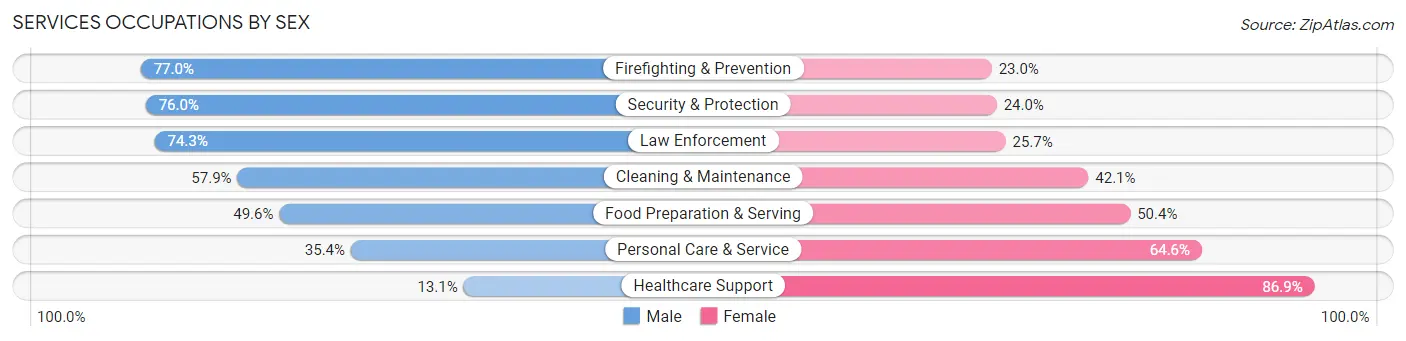
| Occupation | Male | Female |
| Healthcare Support | 3,396 (13.1%) | 22,552 (86.9%) |
| Security & Protection | 14,267 (76.0%) | 4,503 (24.0%) |
| Firefighting & Prevention | 9,225 (77.0%) | 2,755 (23.0%) |
| Law Enforcement | 5,042 (74.3%) | 1,748 (25.7%) |
| Food Preparation & Serving | 24,358 (49.6%) | 24,782 (50.4%) |
| Cleaning & Maintenance | 26,317 (57.9%) | 19,167 (42.1%) |
| Personal Care & Service | 9,201 (35.4%) | 16,800 (64.6%) |
| Total (Category) | 77,539 (46.9%) | 87,804 (53.1%) |
| Total (Overall) | 421,815 (53.3%) | 369,830 (46.7%) |
Sales and Office Occupations
The most common Sales and Office occupations in Area Code 561 are Sales & Related (94,866 | 12.0%), and Office & Administration (80,258 | 10.1%).
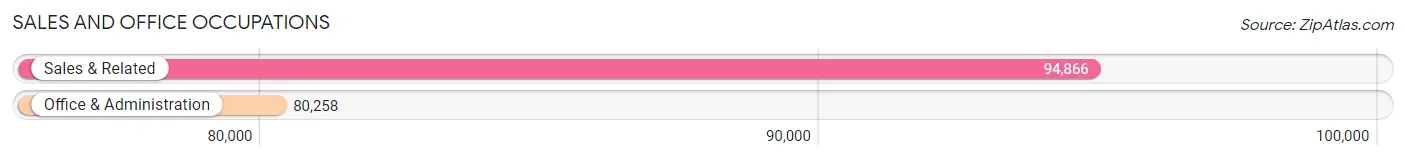
Sales and Office Occupations by Sex
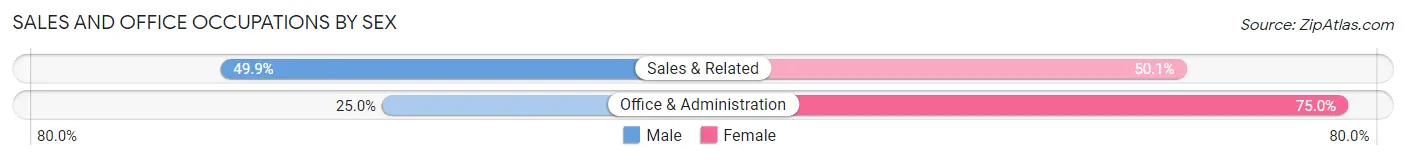
| Occupation | Male | Female |
| Sales & Related | 47,308 (49.9%) | 47,558 (50.1%) |
| Office & Administration | 20,086 (25.0%) | 60,172 (75.0%) |
| Total (Category) | 67,394 (38.5%) | 107,730 (61.5%) |
| Total (Overall) | 421,815 (53.3%) | 369,830 (46.7%) |
Natural Resources, Construction and Maintenance Occupations
The most common Natural Resources, Construction and Maintenance occupations in Area Code 561 are Construction & Extraction (47,286 | 6.0%), Installation, Maintenance & Repair (23,096 | 2.9%), and Farming, Fishing & Forestry (3,839 | 0.5%).
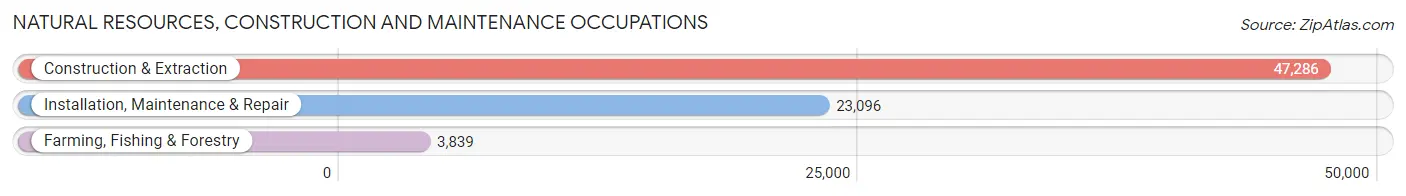
Natural Resources, Construction and Maintenance Occupations by Sex
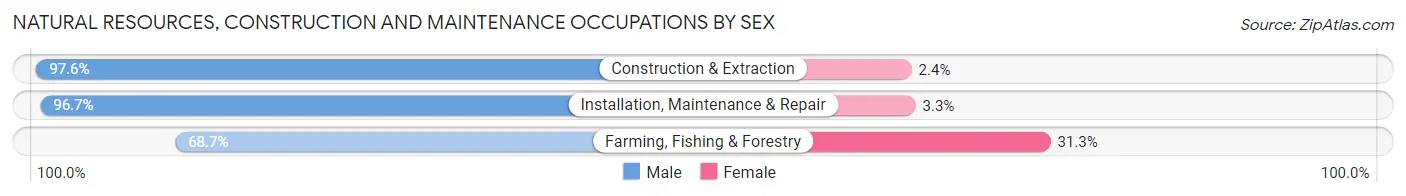
| Occupation | Male | Female |
| Farming, Fishing & Forestry | 2,636 (68.7%) | 1,203 (31.3%) |
| Construction & Extraction | 46,132 (97.6%) | 1,154 (2.4%) |
| Installation, Maintenance & Repair | 22,341 (96.7%) | 755 (3.3%) |
| Total (Category) | 71,109 (95.8%) | 3,112 (4.2%) |
| Total (Overall) | 421,815 (53.3%) | 369,830 (46.7%) |
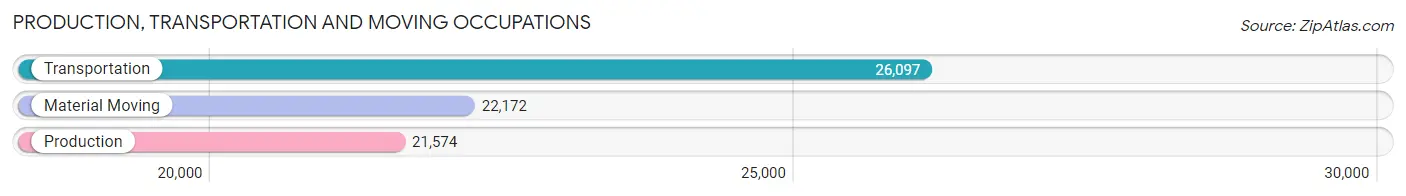
Production, Transportation and Moving Occupations
The most common Production, Transportation and Moving occupations in Area Code 561 are Transportation (26,097 | 3.3%), Material Moving (22,172 | 2.8%), and Production (21,574 | 2.7%).
Production, Transportation and Moving Occupations by Sex
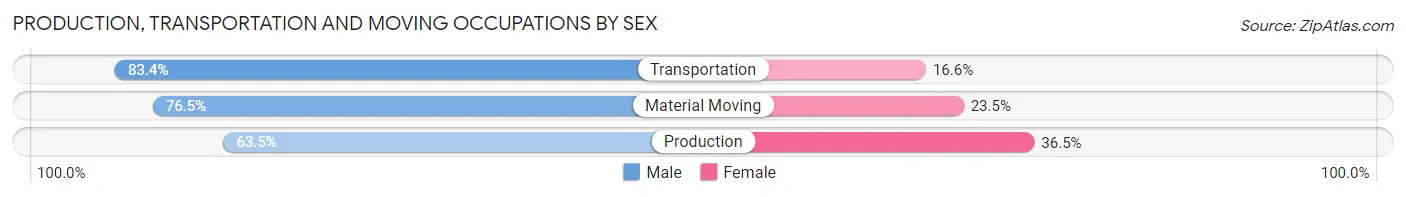
| Occupation | Male | Female |
| Production | 13,701 (63.5%) | 7,873 (36.5%) |
| Transportation | 21,767 (83.4%) | 4,330 (16.6%) |
| Material Moving | 16,958 (76.5%) | 5,214 (23.5%) |
| Total (Category) | 52,426 (75.1%) | 17,417 (24.9%) |
| Total (Overall) | 421,815 (53.3%) | 369,830 (46.7%) |
Employment Industries by Sex in Area Code 561
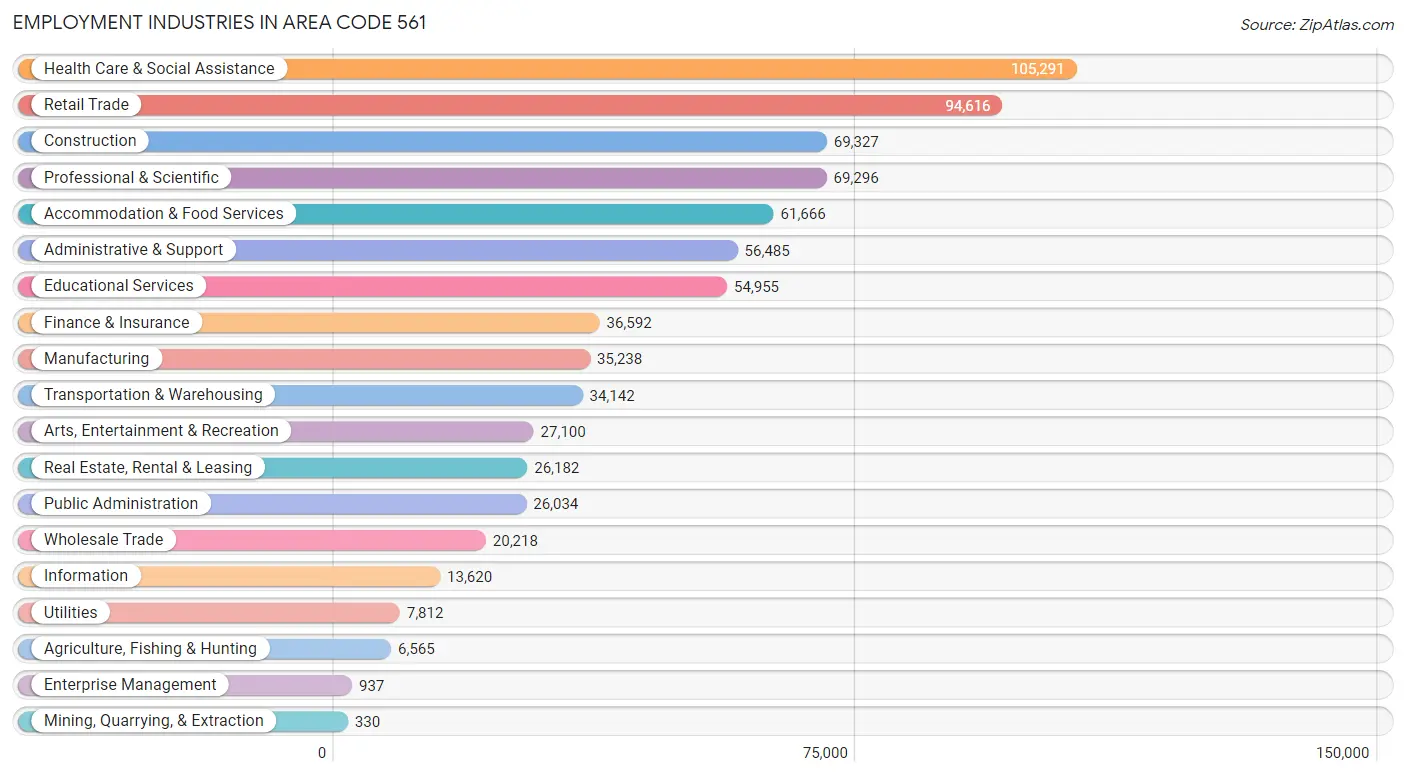
Employment Industries in Area Code 561
The major employment industries in Area Code 561 include Health Care & Social Assistance (105,291 | 13.3%), Retail Trade (94,616 | 11.9%), Construction (69,327 | 8.8%), Professional & Scientific (69,296 | 8.7%), and Accommodation & Food Services (61,666 | 7.8%).
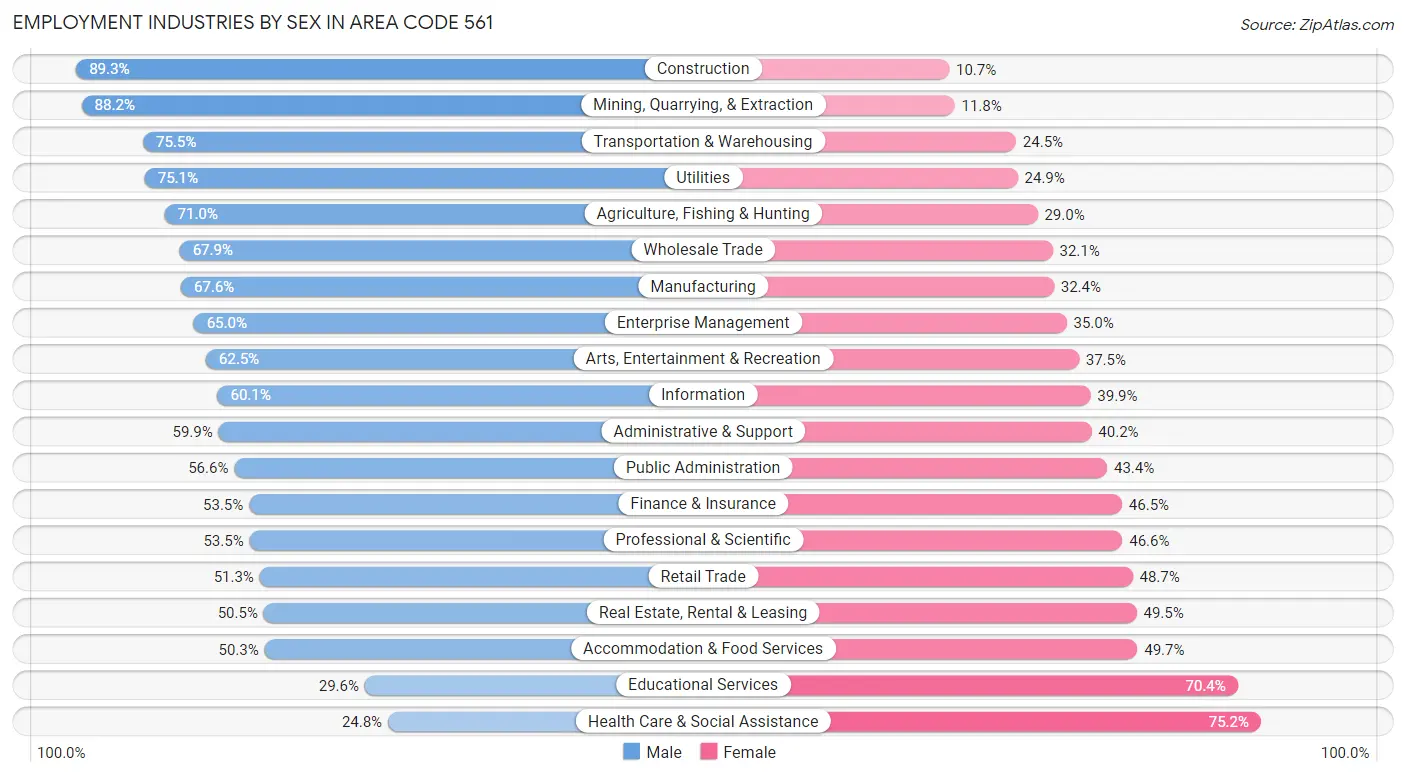
Employment Industries by Sex in Area Code 561
The Area Code 561 industries that see more men than women are Construction (89.3%), Mining, Quarrying, & Extraction (88.2%), and Transportation & Warehousing (75.5%), whereas the industries that tend to have a higher number of women are Health Care & Social Assistance (75.2%), Educational Services (70.4%), and Accommodation & Food Services (49.7%).
| Industry | Male | Female |
| Agriculture, Fishing & Hunting | 4,662 (71.0%) | 1,903 (29.0%) |
| Mining, Quarrying, & Extraction | 291 (88.2%) | 39 (11.8%) |
| Construction | 61,917 (89.3%) | 7,410 (10.7%) |
| Manufacturing | 23,831 (67.6%) | 11,407 (32.4%) |
| Wholesale Trade | 13,726 (67.9%) | 6,492 (32.1%) |
| Retail Trade | 48,575 (51.3%) | 46,041 (48.7%) |
| Transportation & Warehousing | 25,768 (75.5%) | 8,374 (24.5%) |
| Utilities | 5,868 (75.1%) | 1,944 (24.9%) |
| Information | 8,180 (60.1%) | 5,440 (39.9%) |
| Finance & Insurance | 19,587 (53.5%) | 17,005 (46.5%) |
| Real Estate, Rental & Leasing | 13,222 (50.5%) | 12,960 (49.5%) |
| Professional & Scientific | 37,042 (53.4%) | 32,254 (46.6%) |
| Enterprise Management | 609 (65.0%) | 328 (35.0%) |
| Administrative & Support | 33,808 (59.9%) | 22,677 (40.2%) |
| Educational Services | 16,261 (29.6%) | 38,694 (70.4%) |
| Health Care & Social Assistance | 26,103 (24.8%) | 79,188 (75.2%) |
| Arts, Entertainment & Recreation | 16,926 (62.5%) | 10,174 (37.5%) |
| Accommodation & Food Services | 31,041 (50.3%) | 30,625 (49.7%) |
| Public Administration | 14,737 (56.6%) | 11,297 (43.4%) |
| Total | 421,815 (53.3%) | 369,830 (46.7%) |
Education in Area Code 561
School Enrollment in Area Code 561
The most common levels of schooling among the 352,117 students in Area Code 561 are college / undergraduate (78,225 | 22.2%), high school (76,549 | 21.7%), and middle school (72,553 | 20.6%).
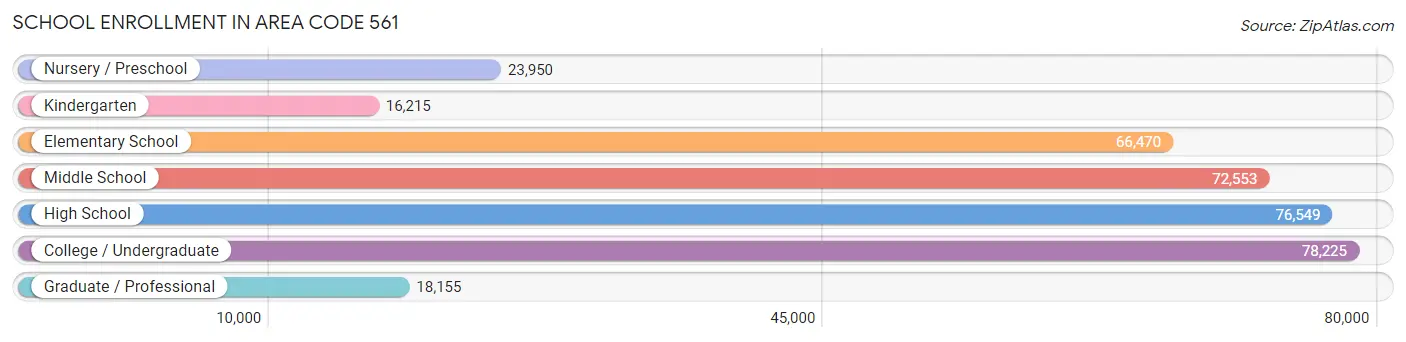
| School Level | # Students | % Students |
| Nursery / Preschool | 23,950 | 6.8% |
| Kindergarten | 16,215 | 4.6% |
| Elementary School | 66,470 | 18.9% |
| Middle School | 72,553 | 20.6% |
| High School | 76,549 | 21.7% |
| College / Undergraduate | 78,225 | 22.2% |
| Graduate / Professional | 18,155 | 5.2% |
| Total | 352,117 | 100.0% |
School Enrollment by Age by Funding Source in Area Code 561
Out of a total of 352,117 students who are enrolled in schools in Area Code 561, 73,276 (20.8%) attend a private institution, while the remaining 278,841 (79.2%) are enrolled in public schools. The age group of 3 to 4 year olds has the highest likelihood of being enrolled in private schools, with 9,747 (50.6% in the age bracket) enrolled. Conversely, the age group of 15 to 17 year olds has the lowest likelihood of being enrolled in a private school, with 45,747 (85.8% in the age bracket) attending a public institution.
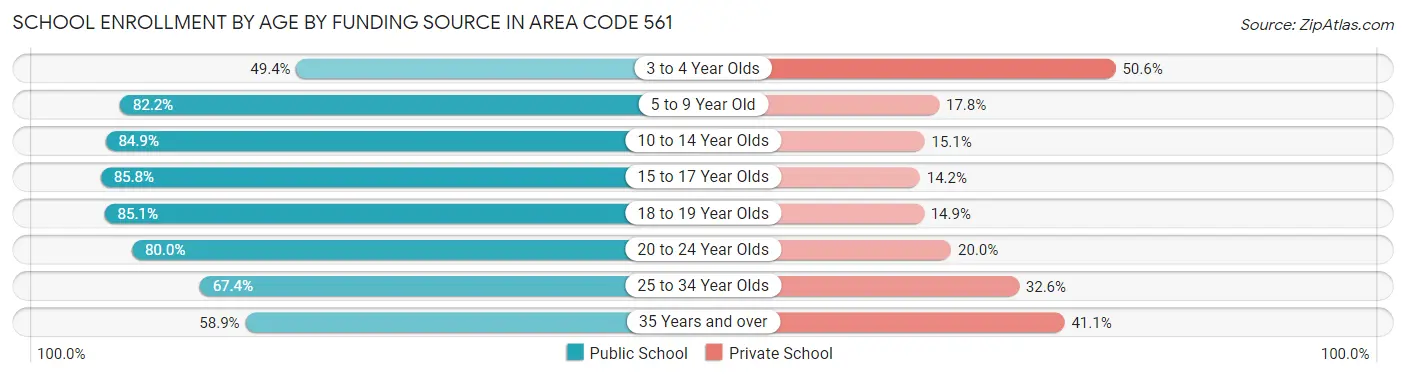
| Age Bracket | Public School | Private School |
| 3 to 4 Year Olds | 9,505 (49.4%) | 9,747 (50.6%) |
| 5 to 9 Year Old | 65,401 (82.2%) | 14,119 (17.8%) |
| 10 to 14 Year Olds | 75,298 (84.9%) | 13,364 (15.1%) |
| 15 to 17 Year Olds | 45,747 (85.8%) | 7,557 (14.2%) |
| 18 to 19 Year Olds | 23,862 (85.1%) | 4,182 (14.9%) |
| 20 to 24 Year Olds | 30,576 (80.0%) | 7,650 (20.0%) |
| 25 to 34 Year Olds | 14,956 (67.4%) | 7,243 (32.6%) |
| 35 Years and over | 13,488 (58.9%) | 9,422 (41.1%) |
| Total | 278,841 (79.2%) | 73,276 (20.8%) |
Educational Attainment by Field of Study in Area Code 561
Business (122,882 | 24.5%), education (63,111 | 12.6%), science & technology (48,638 | 9.7%), social sciences (42,456 | 8.5%), and engineering (36,629 | 7.3%) are the most common fields of study among 501,271 individuals in Area Code 561 who have obtained a bachelor's degree or higher.
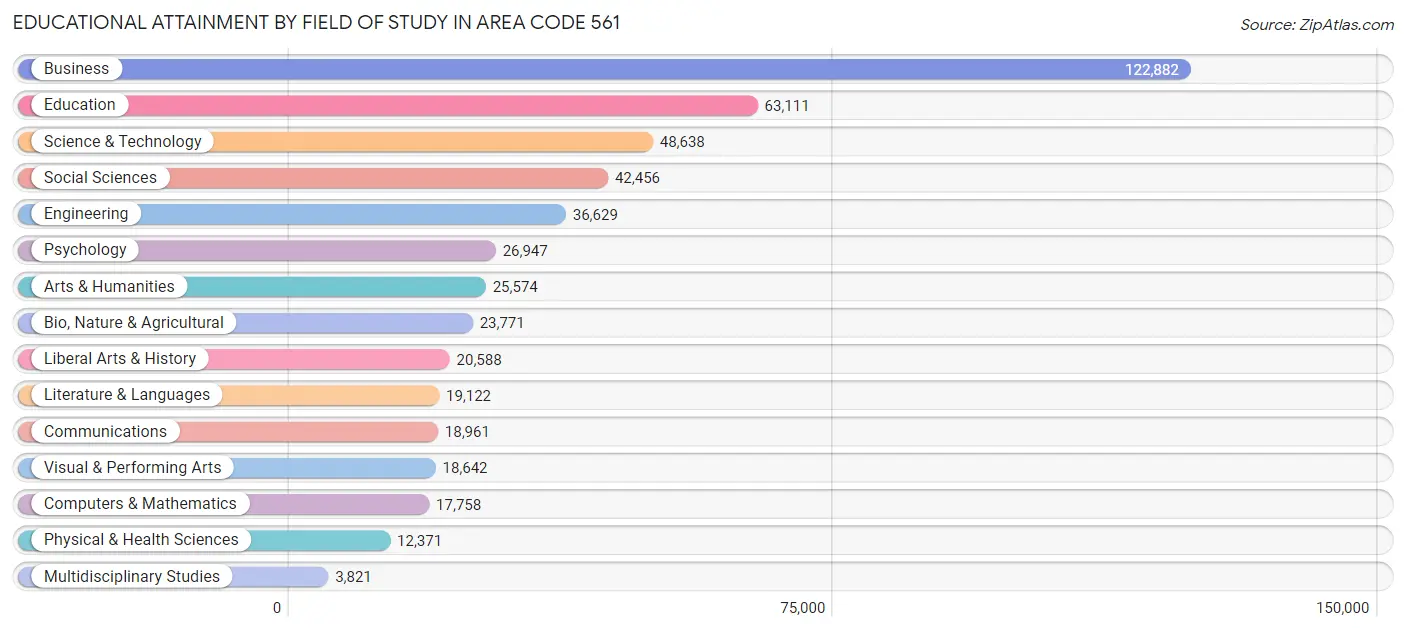
| Field of Study | # Graduates | % Graduates |
| Computers & Mathematics | 17,758 | 3.5% |
| Bio, Nature & Agricultural | 23,771 | 4.7% |
| Physical & Health Sciences | 12,371 | 2.5% |
| Psychology | 26,947 | 5.4% |
| Social Sciences | 42,456 | 8.5% |
| Engineering | 36,629 | 7.3% |
| Multidisciplinary Studies | 3,821 | 0.8% |
| Science & Technology | 48,638 | 9.7% |
| Business | 122,882 | 24.5% |
| Education | 63,111 | 12.6% |
| Literature & Languages | 19,122 | 3.8% |
| Liberal Arts & History | 20,588 | 4.1% |
| Visual & Performing Arts | 18,642 | 3.7% |
| Communications | 18,961 | 3.8% |
| Arts & Humanities | 25,574 | 5.1% |
| Total | 501,271 | 100.0% |
Transportation & Commute in Area Code 561
Vehicle Availability by Sex in Area Code 561
The most prevalent vehicle ownership categories in Area Code 561 are males with 2 vehicles (187,052, accounting for 45.3%) and females with 2 vehicles (150,604, making up 52.4%).
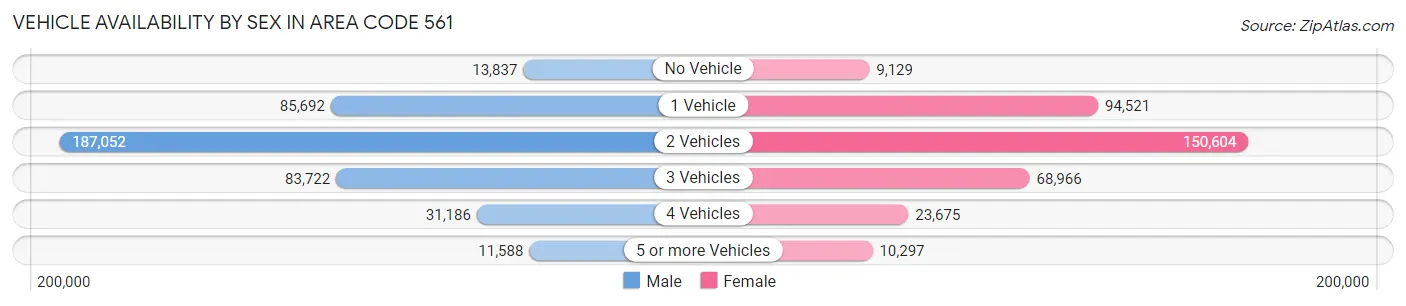
| Vehicles Available | Male | Female |
| No Vehicle | 13,837 (3.4%) | 9,129 (2.6%) |
| 1 Vehicle | 85,692 (20.7%) | 94,521 (26.5%) |
| 2 Vehicles | 187,052 (45.3%) | 150,604 (42.2%) |
| 3 Vehicles | 83,722 (20.3%) | 68,966 (19.3%) |
| 4 Vehicles | 31,186 (7.5%) | 23,675 (6.6%) |
| 5 or more Vehicles | 11,588 (2.8%) | 10,297 (2.9%) |
| Total | 413,077 (100.0%) | 357,192 (100.0%) |
Commute Time in Area Code 561
The most frequently occuring commute durations in Area Code 561 are 30 to 34 minutes (115,663 commuters, 17.0%), 15 to 19 minutes (109,058 commuters, 16.0%), and 20 to 24 minutes (106,516 commuters, 15.7%).
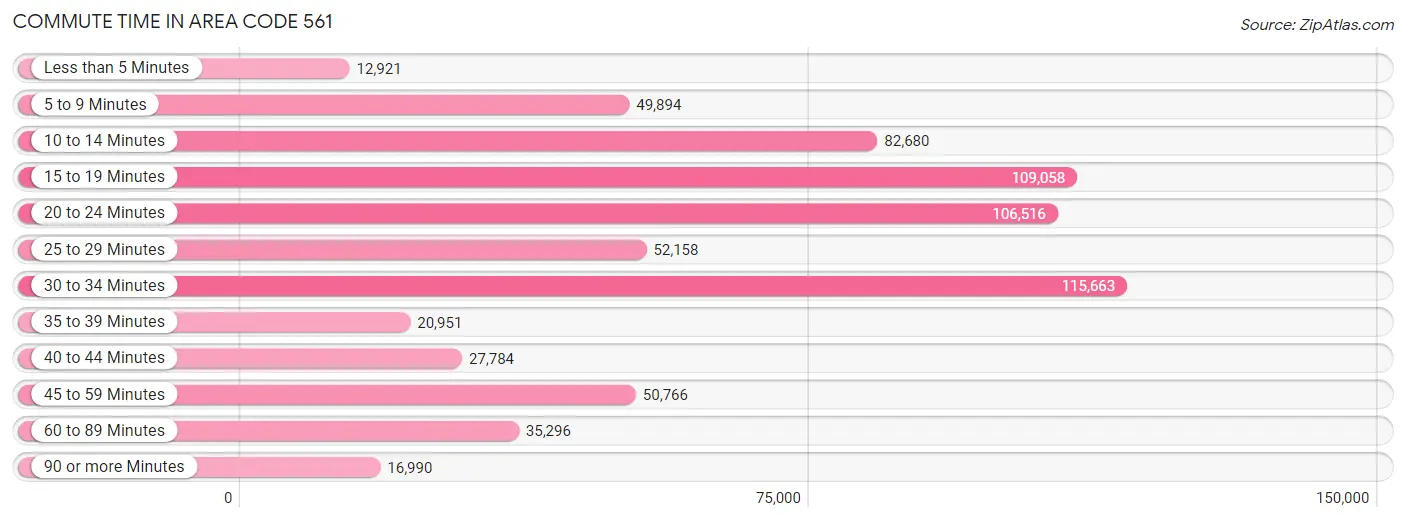
| Commute Time | # Commuters | % Commuters |
| Less than 5 Minutes | 12,921 | 1.9% |
| 5 to 9 Minutes | 49,894 | 7.3% |
| 10 to 14 Minutes | 82,680 | 12.1% |
| 15 to 19 Minutes | 109,058 | 16.0% |
| 20 to 24 Minutes | 106,516 | 15.7% |
| 25 to 29 Minutes | 52,158 | 7.7% |
| 30 to 34 Minutes | 115,663 | 17.0% |
| 35 to 39 Minutes | 20,951 | 3.1% |
| 40 to 44 Minutes | 27,784 | 4.1% |
| 45 to 59 Minutes | 50,766 | 7.5% |
| 60 to 89 Minutes | 35,296 | 5.2% |
| 90 or more Minutes | 16,990 | 2.5% |
Commute Time by Sex in Area Code 561
The most common commute times in Area Code 561 are 30 to 34 minutes (65,319 commuters, 17.7%) for males and 15 to 19 minutes (52,718 commuters, 16.9%) for females.
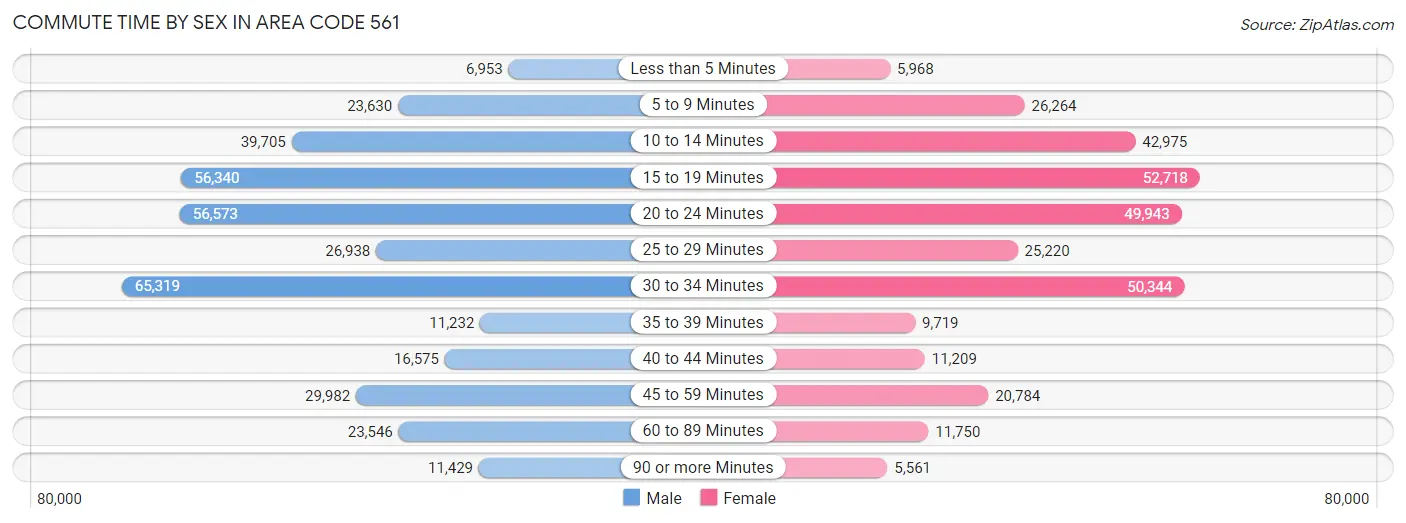
| Commute Time | Male | Female |
| Less than 5 Minutes | 6,953 (1.9%) | 5,968 (1.9%) |
| 5 to 9 Minutes | 23,630 (6.4%) | 26,264 (8.4%) |
| 10 to 14 Minutes | 39,705 (10.8%) | 42,975 (13.8%) |
| 15 to 19 Minutes | 56,340 (15.3%) | 52,718 (16.9%) |
| 20 to 24 Minutes | 56,573 (15.4%) | 49,943 (16.0%) |
| 25 to 29 Minutes | 26,938 (7.3%) | 25,220 (8.1%) |
| 30 to 34 Minutes | 65,319 (17.7%) | 50,344 (16.1%) |
| 35 to 39 Minutes | 11,232 (3.0%) | 9,719 (3.1%) |
| 40 to 44 Minutes | 16,575 (4.5%) | 11,209 (3.6%) |
| 45 to 59 Minutes | 29,982 (8.1%) | 20,784 (6.7%) |
| 60 to 89 Minutes | 23,546 (6.4%) | 11,750 (3.8%) |
| 90 or more Minutes | 11,429 (3.1%) | 5,561 (1.8%) |
Time of Departure to Work by Sex in Area Code 561
The most frequent times of departure to work in Area Code 561 are 7:00 AM to 7:29 AM (56,567, 15.4%) for males and 7:00 AM to 7:29 AM (47,320, 15.1%) for females.
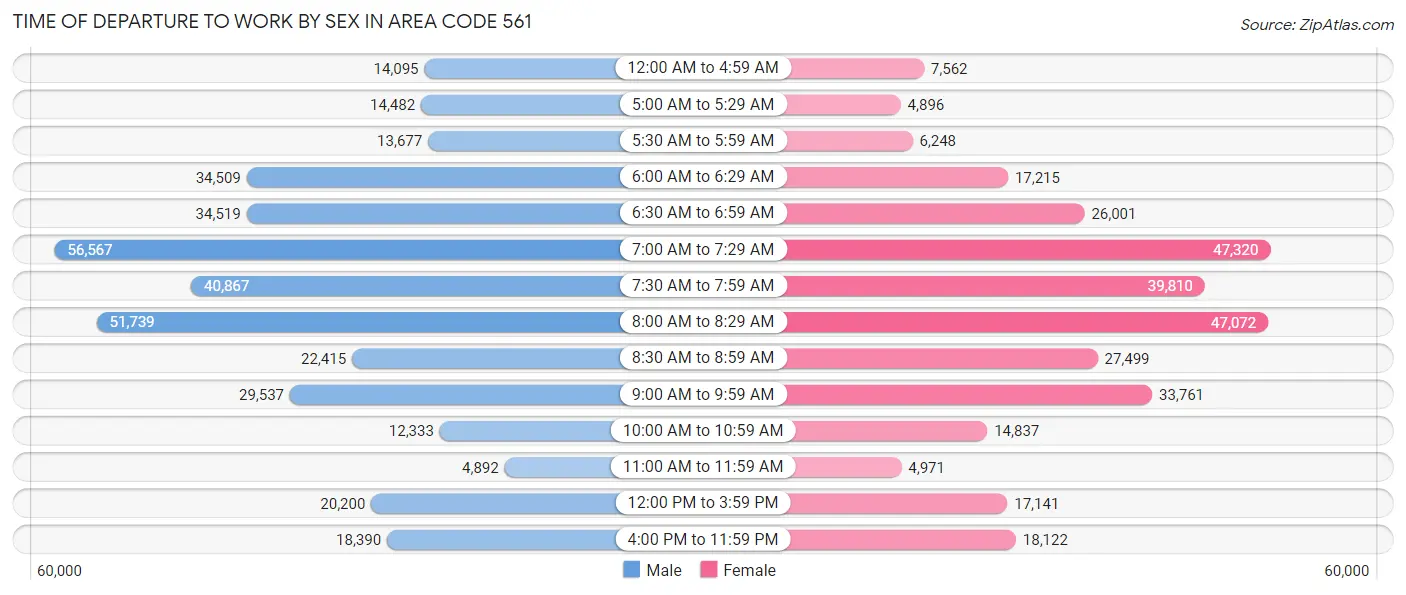
| Time of Departure | Male | Female |
| 12:00 AM to 4:59 AM | 14,095 (3.8%) | 7,562 (2.4%) |
| 5:00 AM to 5:29 AM | 14,482 (3.9%) | 4,896 (1.6%) |
| 5:30 AM to 5:59 AM | 13,677 (3.7%) | 6,248 (2.0%) |
| 6:00 AM to 6:29 AM | 34,509 (9.4%) | 17,215 (5.5%) |
| 6:30 AM to 6:59 AM | 34,519 (9.4%) | 26,001 (8.3%) |
| 7:00 AM to 7:29 AM | 56,567 (15.4%) | 47,320 (15.1%) |
| 7:30 AM to 7:59 AM | 40,867 (11.1%) | 39,810 (12.7%) |
| 8:00 AM to 8:29 AM | 51,739 (14.1%) | 47,072 (15.1%) |
| 8:30 AM to 8:59 AM | 22,415 (6.1%) | 27,499 (8.8%) |
| 9:00 AM to 9:59 AM | 29,537 (8.0%) | 33,761 (10.8%) |
| 10:00 AM to 10:59 AM | 12,333 (3.4%) | 14,837 (4.8%) |
| 11:00 AM to 11:59 AM | 4,892 (1.3%) | 4,971 (1.6%) |
| 12:00 PM to 3:59 PM | 20,200 (5.5%) | 17,141 (5.5%) |
| 4:00 PM to 11:59 PM | 18,390 (5.0%) | 18,122 (5.8%) |
| Total | 368,222 (100.0%) | 312,455 (100.0%) |
Housing Occupancy in Area Code 561
Occupancy by Ownership in Area Code 561
Of the total 670,318 dwellings in Area Code 561, owner-occupied units account for 459,906 (68.6%), while renter-occupied units make up 210,412 (31.4%).
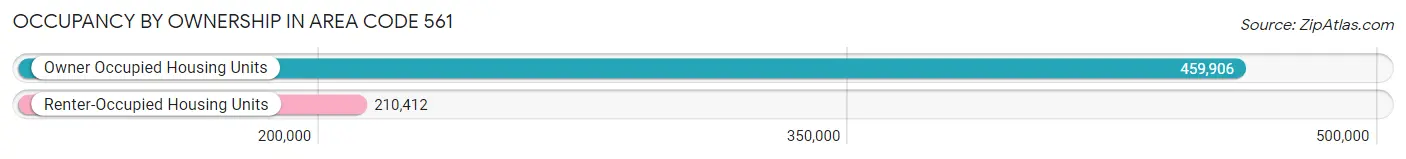
| Occupancy | # Housing Units | % Housing Units |
| Owner Occupied Housing Units | 459,906 | 68.6% |
| Renter-Occupied Housing Units | 210,412 | 31.4% |
| Total Occupied Housing Units | 670,318 | 100.0% |
Occupancy by Household Size in Area Code 561
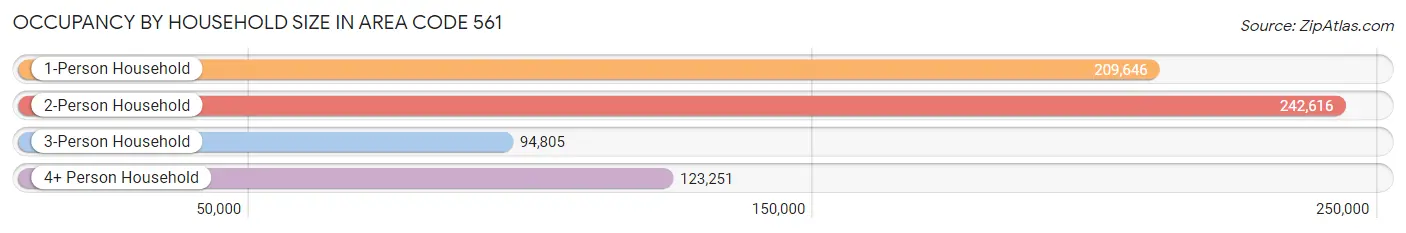
| Household Size | # Housing Units | % Housing Units |
| 1-Person Household | 209,646 | 31.3% |
| 2-Person Household | 242,616 | 36.2% |
| 3-Person Household | 94,805 | 14.1% |
| 4+ Person Household | 123,251 | 18.4% |
| Total Housing Units | 670,318 | 100.0% |
Occupancy by Ownership by Household Size in Area Code 561
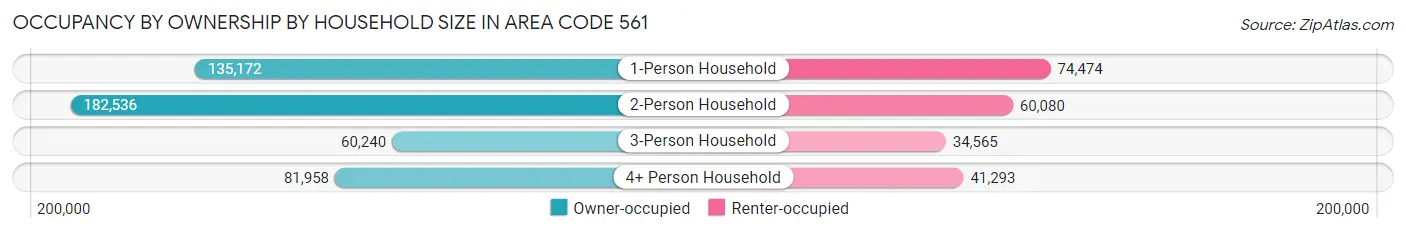
| Household Size | Owner-occupied | Renter-occupied |
| 1-Person Household | 135,172 (64.5%) | 74,474 (35.5%) |
| 2-Person Household | 182,536 (75.2%) | 60,080 (24.8%) |
| 3-Person Household | 60,240 (63.5%) | 34,565 (36.5%) |
| 4+ Person Household | 81,958 (66.5%) | 41,293 (33.5%) |
| Total Housing Units | 459,906 (68.6%) | 210,412 (31.4%) |
Occupancy by Educational Attainment in Area Code 561
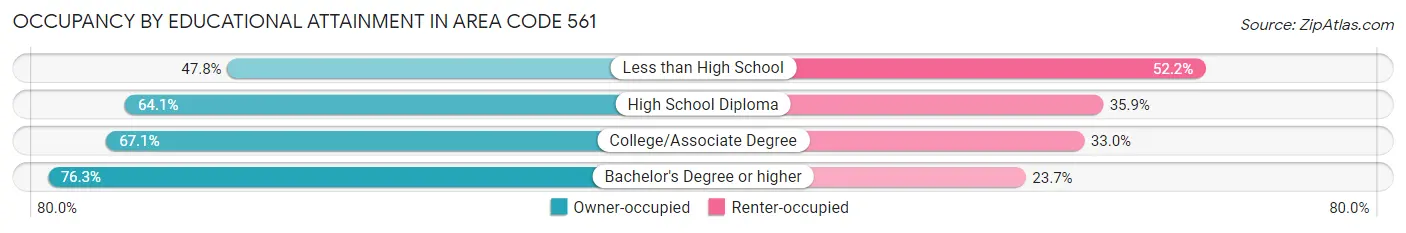
| Household Size | Owner-occupied | Renter-occupied |
| Less than High School | 28,641 (47.8%) | 31,242 (52.2%) |
| High School Diploma | 87,756 (64.1%) | 49,222 (35.9%) |
| College/Associate Degree | 129,100 (67.0%) | 63,454 (33.0%) |
| Bachelor's Degree or higher | 214,409 (76.3%) | 66,494 (23.7%) |
Occupancy by Age of Householder in Area Code 561
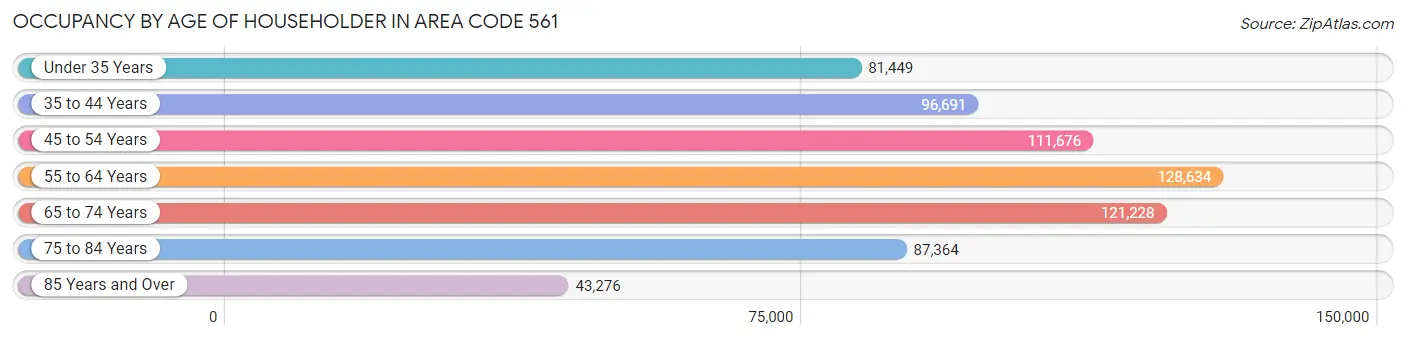
| Age Bracket | # Households | % Households |
| Under 35 Years | 81,449 | 12.1% |
| 35 to 44 Years | 96,691 | 14.4% |
| 45 to 54 Years | 111,676 | 16.7% |
| 55 to 64 Years | 128,634 | 19.2% |
| 65 to 74 Years | 121,228 | 18.1% |
| 75 to 84 Years | 87,364 | 13.0% |
| 85 Years and Over | 43,276 | 6.5% |
| Total | 670,318 | 100.0% |
Housing Finances in Area Code 561
Median Income by Occupancy in Area Code 561
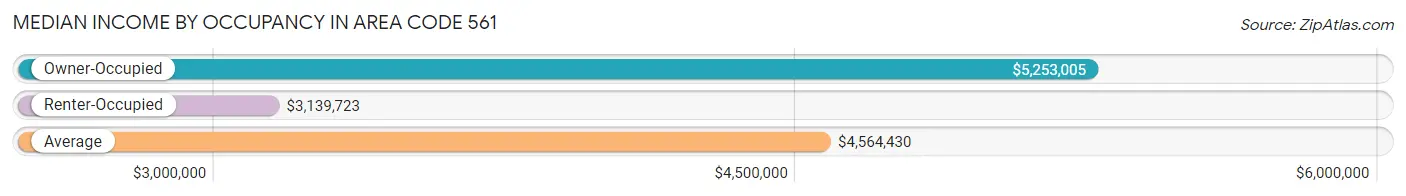
| Occupancy Type | # Households | Median Income |
| Owner-Occupied | 459,906 (68.6%) | $5,253,005 |
| Renter-Occupied | 210,412 (31.4%) | $3,139,723 |
| Average | 670,318 (100.0%) | $4,564,430 |
Occupancy by Householder Income Bracket in Area Code 561
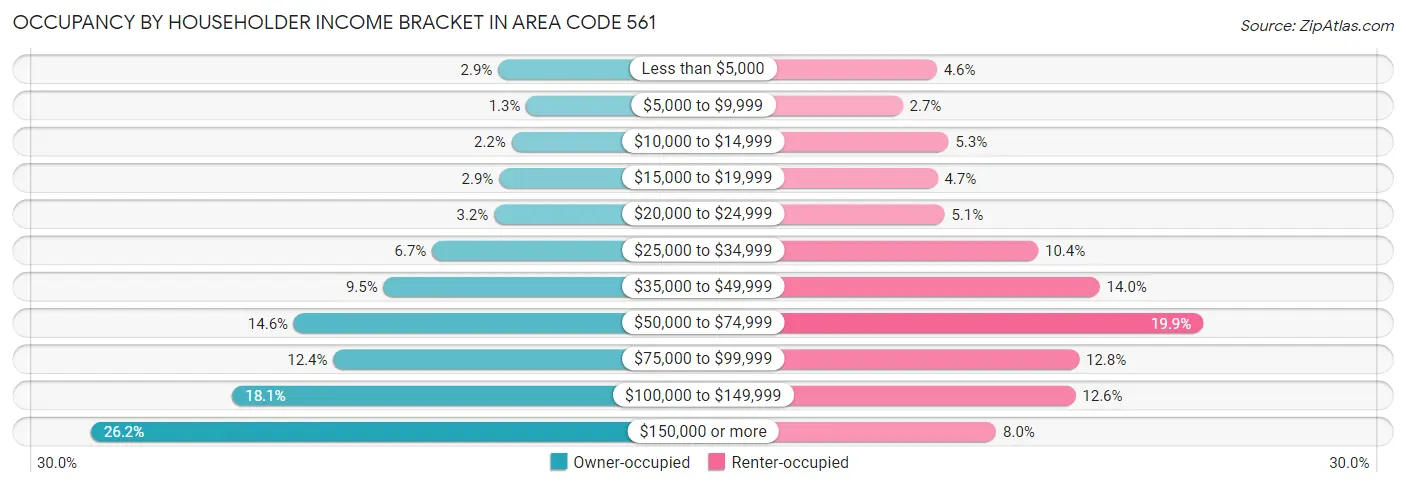
| Income Bracket | Owner-occupied | Renter-occupied |
| Less than $5,000 | 13,537 (2.9%) | 9,759 (4.6%) |
| $5,000 to $9,999 | 6,095 (1.3%) | 5,659 (2.7%) |
| $10,000 to $14,999 | 9,971 (2.2%) | 11,167 (5.3%) |
| $15,000 to $19,999 | 13,223 (2.9%) | 9,854 (4.7%) |
| $20,000 to $24,999 | 14,590 (3.2%) | 10,690 (5.1%) |
| $25,000 to $34,999 | 30,865 (6.7%) | 21,951 (10.4%) |
| $35,000 to $49,999 | 43,645 (9.5%) | 29,346 (14.0%) |
| $50,000 to $74,999 | 67,187 (14.6%) | 41,797 (19.9%) |
| $75,000 to $99,999 | 56,865 (12.4%) | 26,871 (12.8%) |
| $100,000 to $149,999 | 83,393 (18.1%) | 26,422 (12.6%) |
| $150,000 or more | 120,535 (26.2%) | 16,896 (8.0%) |
| Total | 459,906 (100.0%) | 210,412 (100.0%) |
Monthly Housing Cost Tiers in Area Code 561
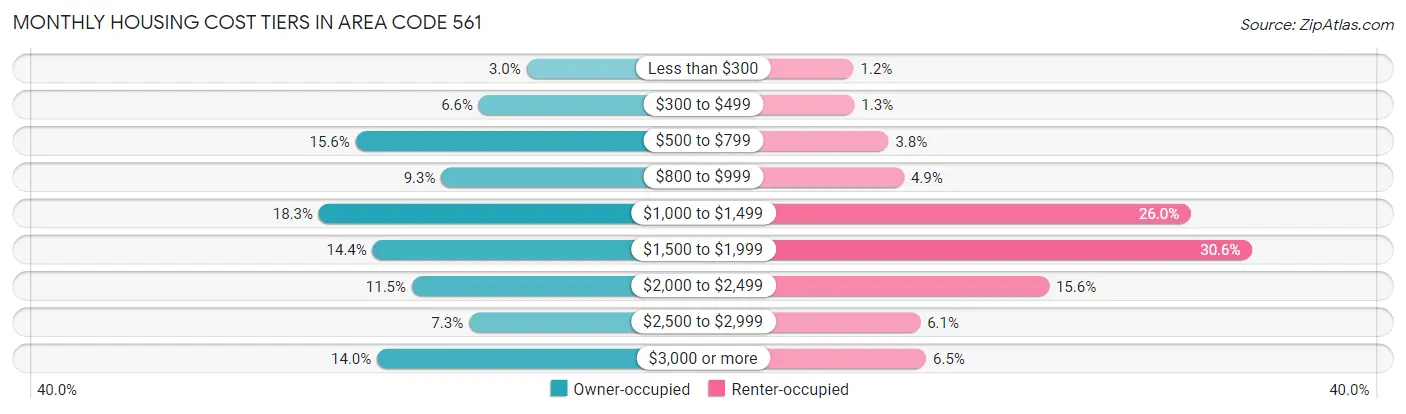
| Monthly Cost | Owner-occupied | Renter-occupied |
| Less than $300 | 13,946 (3.0%) | 2,511 (1.2%) |
| $300 to $499 | 30,105 (6.6%) | 2,633 (1.3%) |
| $500 to $799 | 71,841 (15.6%) | 7,920 (3.8%) |
| $800 to $999 | 42,805 (9.3%) | 10,316 (4.9%) |
| $1,000 to $1,499 | 84,314 (18.3%) | 54,790 (26.0%) |
| $1,500 to $1,999 | 66,096 (14.4%) | 64,289 (30.5%) |
| $2,000 to $2,499 | 52,815 (11.5%) | 32,788 (15.6%) |
| $2,500 to $2,999 | 33,435 (7.3%) | 12,835 (6.1%) |
| $3,000 or more | 64,549 (14.0%) | 13,750 (6.5%) |
| Total | 459,906 (100.0%) | 210,412 (100.0%) |
Physical Housing Characteristics in Area Code 561
Housing Structures in Area Code 561
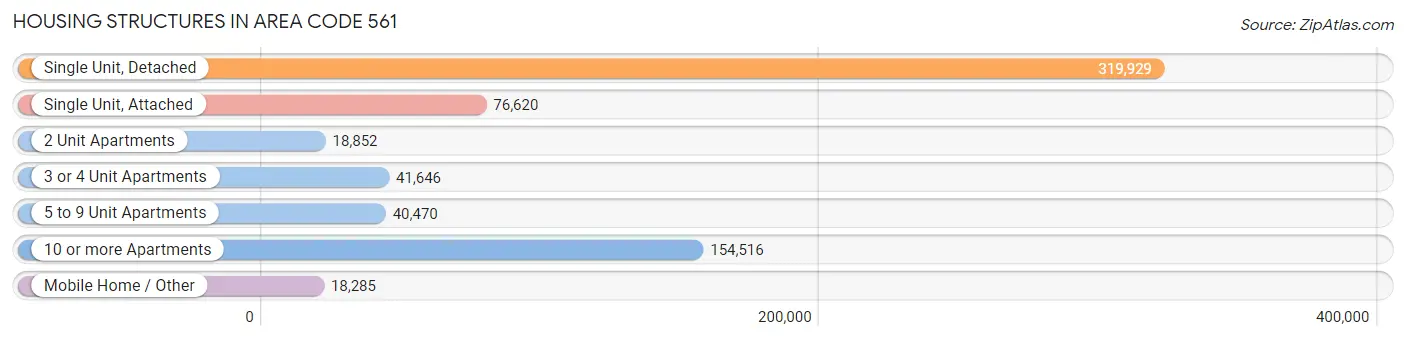
| Structure Type | # Housing Units | % Housing Units |
| Single Unit, Detached | 319,929 | 47.7% |
| Single Unit, Attached | 76,620 | 11.4% |
| 2 Unit Apartments | 18,852 | 2.8% |
| 3 or 4 Unit Apartments | 41,646 | 6.2% |
| 5 to 9 Unit Apartments | 40,470 | 6.0% |
| 10 or more Apartments | 154,516 | 23.1% |
| Mobile Home / Other | 18,285 | 2.7% |
| Total | 670,318 | 100.0% |
Housing Structures by Occupancy in Area Code 561
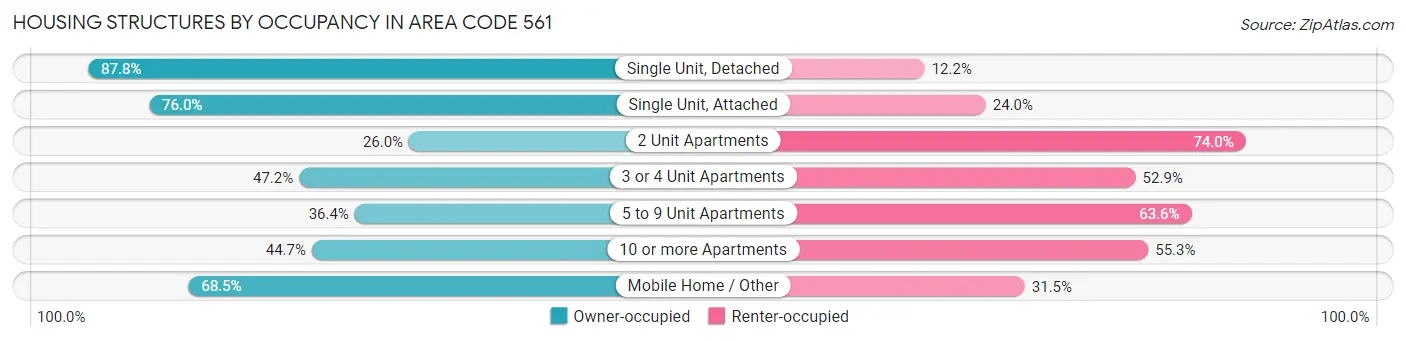
| Structure Type | Owner-occupied | Renter-occupied |
| Single Unit, Detached | 280,782 (87.8%) | 39,147 (12.2%) |
| Single Unit, Attached | 58,239 (76.0%) | 18,381 (24.0%) |
| 2 Unit Apartments | 4,902 (26.0%) | 13,950 (74.0%) |
| 3 or 4 Unit Apartments | 19,638 (47.1%) | 22,008 (52.8%) |
| 5 to 9 Unit Apartments | 14,746 (36.4%) | 25,724 (63.6%) |
| 10 or more Apartments | 69,078 (44.7%) | 85,438 (55.3%) |
| Mobile Home / Other | 12,521 (68.5%) | 5,764 (31.5%) |
| Total | 459,906 (68.6%) | 210,412 (31.4%) |
Housing Structures by Number of Rooms in Area Code 561
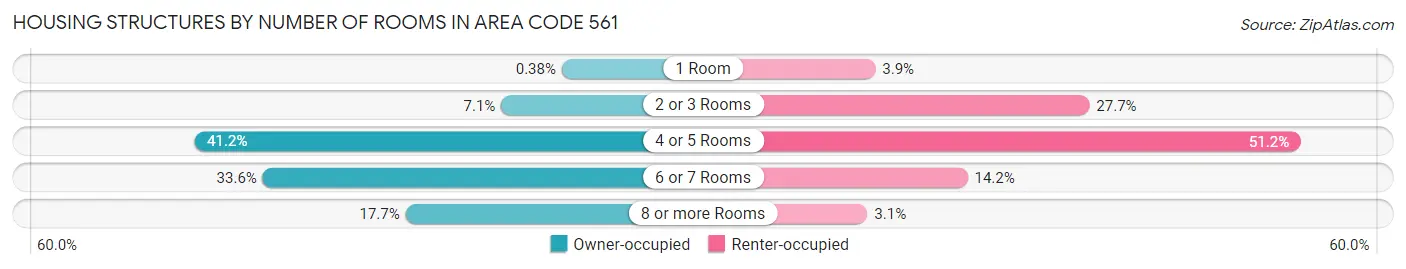
| Number of Rooms | Owner-occupied | Renter-occupied |
| 1 Room | 1,764 (0.4%) | 8,278 (3.9%) |
| 2 or 3 Rooms | 32,685 (7.1%) | 58,259 (27.7%) |
| 4 or 5 Rooms | 189,489 (41.2%) | 107,666 (51.2%) |
| 6 or 7 Rooms | 154,450 (33.6%) | 29,792 (14.2%) |
| 8 or more Rooms | 81,518 (17.7%) | 6,417 (3.0%) |
| Total | 459,906 (100.0%) | 210,412 (100.0%) |
Housing Structure by Heating Type in Area Code 561
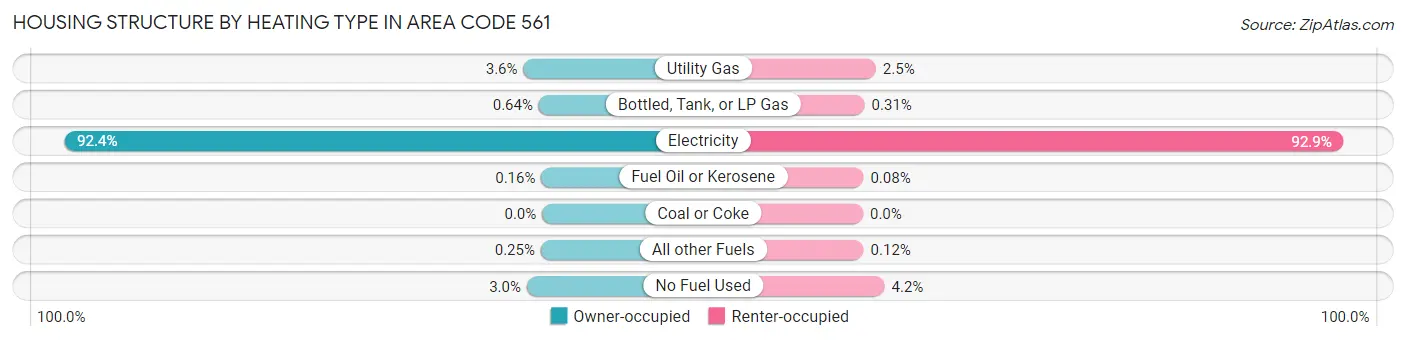
| Heating Type | Owner-occupied | Renter-occupied |
| Utility Gas | 16,666 (3.6%) | 5,235 (2.5%) |
| Bottled, Tank, or LP Gas | 2,953 (0.6%) | 645 (0.3%) |
| Electricity | 424,775 (92.4%) | 195,360 (92.8%) |
| Fuel Oil or Kerosene | 738 (0.2%) | 165 (0.1%) |
| Coal or Coke | 5 (0.0%) | 0 (0.0%) |
| All other Fuels | 1,150 (0.3%) | 258 (0.1%) |
| No Fuel Used | 13,619 (3.0%) | 8,749 (4.2%) |
| Total | 459,906 (100.0%) | 210,412 (100.0%) |
Household Vehicle Usage in Area Code 561
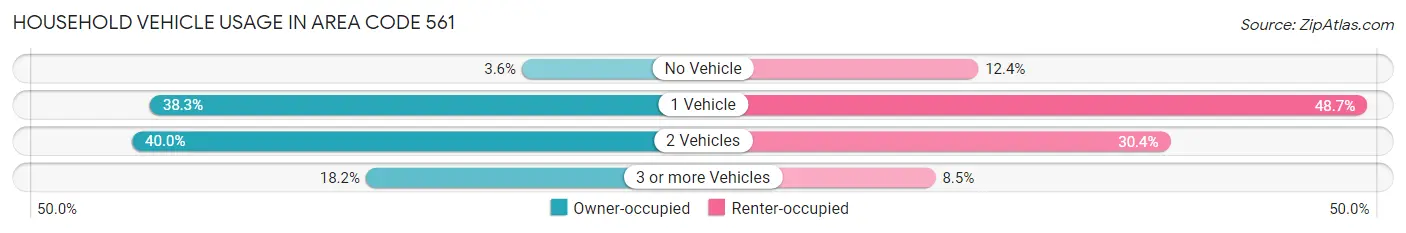
| Vehicles per Household | Owner-occupied | Renter-occupied |
| No Vehicle | 16,457 (3.6%) | 26,178 (12.4%) |
| 1 Vehicle | 176,188 (38.3%) | 102,542 (48.7%) |
| 2 Vehicles | 183,777 (40.0%) | 63,903 (30.4%) |
| 3 or more Vehicles | 83,484 (18.1%) | 17,789 (8.5%) |
| Total | 459,906 (100.0%) | 210,412 (100.0%) |
Real Estate & Mortgages in Area Code 561
Real Estate and Mortgage Overview in Area Code 561
| Characteristic | Without Mortgage | With Mortgage |
| Housing Units | 217,255 | 242,651 |
| Median Property Value | $20,551,600 | $23,216,100 |
| Median Household Income | $4,230,635 | $74,856 |
| Monthly Housing Costs | $46,410 | $56,044 |
| Real Estate Taxes | $183,695 | $4,849 |
Property Value by Mortgage Status in Area Code 561
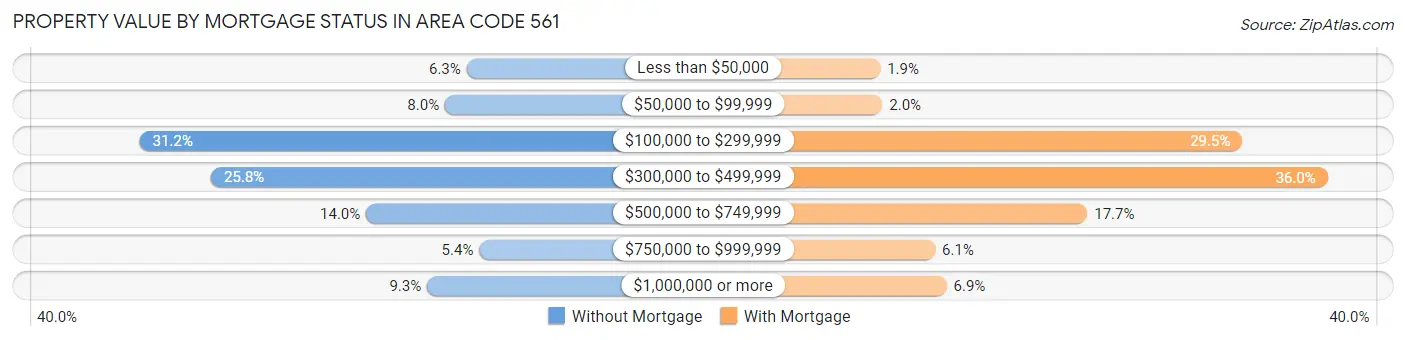
| Property Value | Without Mortgage | With Mortgage |
| Less than $50,000 | 13,725 (6.3%) | 4,555 (1.9%) |
| $50,000 to $99,999 | 17,315 (8.0%) | 4,946 (2.0%) |
| $100,000 to $299,999 | 67,861 (31.2%) | 71,481 (29.5%) |
| $300,000 to $499,999 | 56,053 (25.8%) | 87,278 (36.0%) |
| $500,000 to $749,999 | 30,373 (14.0%) | 42,843 (17.7%) |
| $750,000 to $999,999 | 11,636 (5.4%) | 14,714 (6.1%) |
| $1,000,000 or more | 20,292 (9.3%) | 16,834 (6.9%) |
| Total | 217,255 (100.0%) | 242,651 (100.0%) |
Household Income by Mortgage Status in Area Code 561
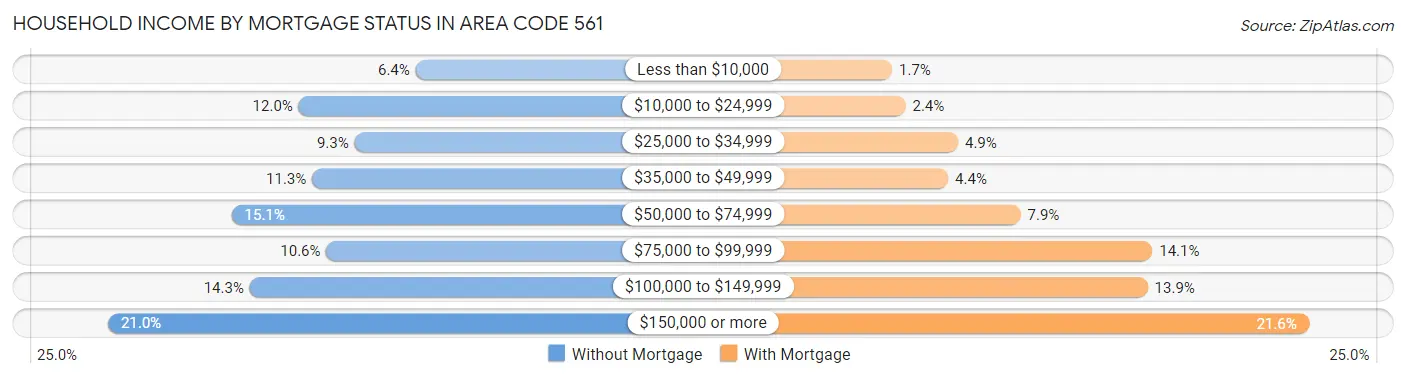
| Household Income | Without Mortgage | With Mortgage |
| Less than $10,000 | 13,860 (6.4%) | 4,230 (1.7%) |
| $10,000 to $24,999 | 25,953 (11.9%) | 5,772 (2.4%) |
| $25,000 to $34,999 | 20,175 (9.3%) | 11,831 (4.9%) |
| $35,000 to $49,999 | 24,567 (11.3%) | 10,690 (4.4%) |
| $50,000 to $74,999 | 32,895 (15.1%) | 19,078 (7.9%) |
| $75,000 to $99,999 | 23,102 (10.6%) | 34,292 (14.1%) |
| $100,000 to $149,999 | 31,024 (14.3%) | 33,763 (13.9%) |
| $150,000 or more | 45,679 (21.0%) | 52,369 (21.6%) |
| Total | 217,255 (100.0%) | 242,651 (100.0%) |
Property Value to Household Income Ratio in Area Code 561
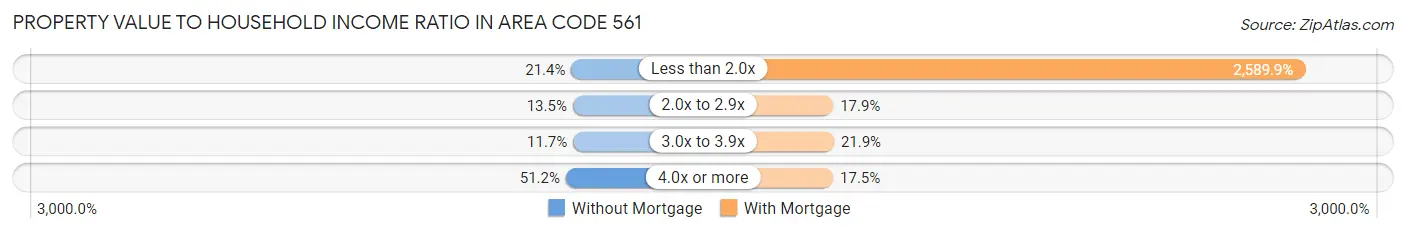
| Value-to-Income Ratio | Without Mortgage | With Mortgage |
| Less than 2.0x | 46,533 (21.4%) | 6,284,407 (2,589.9%) |
| 2.0x to 2.9x | 29,423 (13.5%) | 43,433 (17.9%) |
| 3.0x to 3.9x | 25,339 (11.7%) | 53,233 (21.9%) |
| 4.0x or more | 111,234 (51.2%) | 42,489 (17.5%) |
| Total | 217,255 (100.0%) | 242,651 (100.0%) |
Real Estate Taxes by Mortgage Status in Area Code 561
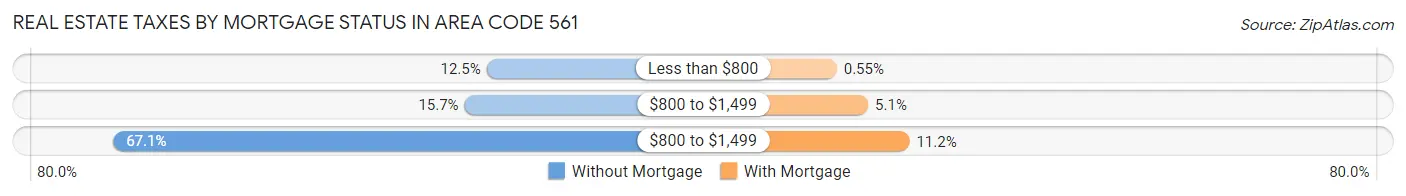
| Property Taxes | Without Mortgage | With Mortgage |
| Less than $800 | 27,155 (12.5%) | 1,344 (0.5%) |
| $800 to $1,499 | 34,169 (15.7%) | 12,443 (5.1%) |
| $800 to $1,499 | 145,673 (67.0%) | 27,108 (11.2%) |
| Total | 217,255 (100.0%) | 242,651 (100.0%) |
Health & Disability in Area Code 561
Health Insurance Coverage by Age in Area Code 561
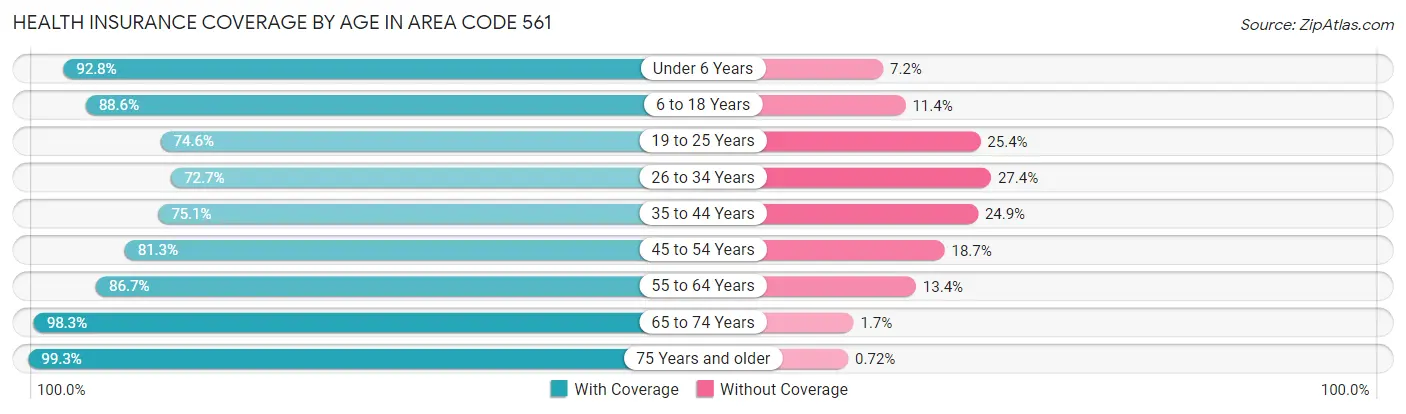
| Age Bracket | With Coverage | Without Coverage |
| Under 6 Years | 92,554 (92.8%) | 7,219 (7.2%) |
| 6 to 18 Years | 206,503 (88.6%) | 26,609 (11.4%) |
| 19 to 25 Years | 94,839 (74.6%) | 32,254 (25.4%) |
| 26 to 34 Years | 127,774 (72.7%) | 48,091 (27.4%) |
| 35 to 44 Years | 147,441 (75.1%) | 48,937 (24.9%) |
| 45 to 54 Years | 170,422 (81.3%) | 39,174 (18.7%) |
| 55 to 64 Years | 196,848 (86.7%) | 30,317 (13.4%) |
| 65 to 74 Years | 192,538 (98.3%) | 3,365 (1.7%) |
| 75 Years and older | 202,094 (99.3%) | 1,468 (0.7%) |
| Total | 1,431,013 (85.8%) | 237,434 (14.2%) |
Health Insurance Coverage by Citizenship Status in Area Code 561
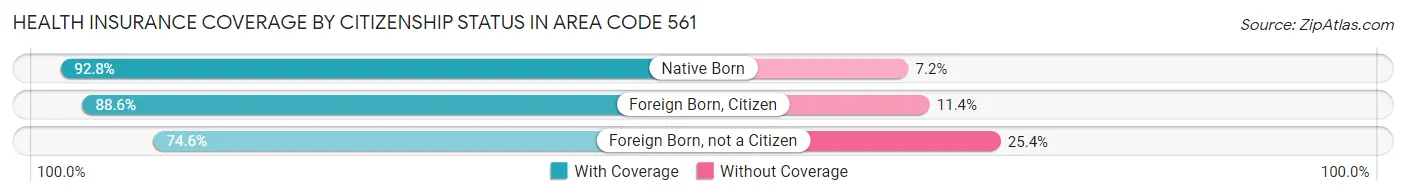
| Citizenship Status | With Coverage | Without Coverage |
| Native Born | 92,554 (92.8%) | 7,219 (7.2%) |
| Foreign Born, Citizen | 206,503 (88.6%) | 26,609 (11.4%) |
| Foreign Born, not a Citizen | 94,839 (74.6%) | 32,254 (25.4%) |
Health Insurance Coverage by Household Income in Area Code 561
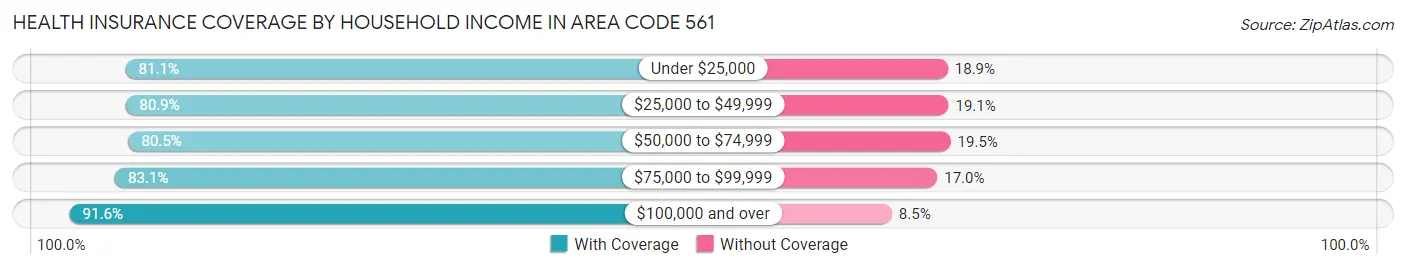
| Household Income | With Coverage | Without Coverage |
| Under $25,000 | 145,907 (81.1%) | 34,085 (18.9%) |
| $25,000 to $49,999 | 212,198 (80.9%) | 49,998 (19.1%) |
| $50,000 to $74,999 | 214,767 (80.5%) | 51,881 (19.5%) |
| $75,000 to $99,999 | 187,123 (83.1%) | 38,203 (17.0%) |
| $100,000 and over | 661,263 (91.5%) | 61,065 (8.5%) |
Public vs Private Health Insurance Coverage by Age in Area Code 561
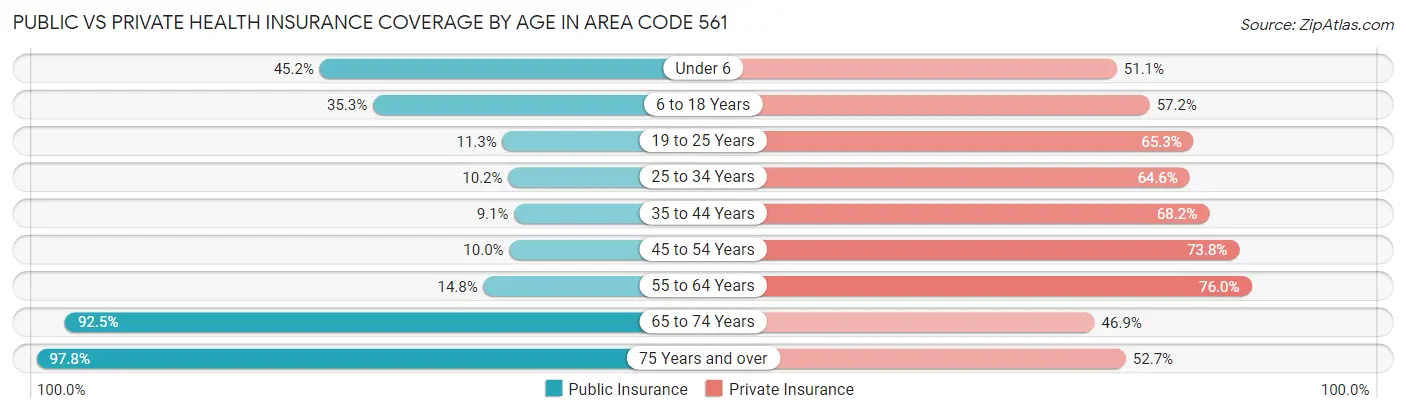
| Age Bracket | Public Insurance | Private Insurance |
| Under 6 | 45,114 (45.2%) | 50,946 (51.1%) |
| 6 to 18 Years | 82,370 (35.3%) | 133,218 (57.2%) |
| 19 to 25 Years | 14,339 (11.3%) | 82,970 (65.3%) |
| 25 to 34 Years | 17,948 (10.2%) | 113,561 (64.6%) |
| 35 to 44 Years | 17,873 (9.1%) | 133,834 (68.1%) |
| 45 to 54 Years | 20,985 (10.0%) | 154,600 (73.8%) |
| 55 to 64 Years | 33,660 (14.8%) | 172,676 (76.0%) |
| 65 to 74 Years | 181,207 (92.5%) | 91,960 (46.9%) |
| 75 Years and over | 199,071 (97.8%) | 107,339 (52.7%) |
| Total | 612,567 (36.7%) | 1,041,104 (62.4%) |
Disability Status by Sex by Age in Area Code 561
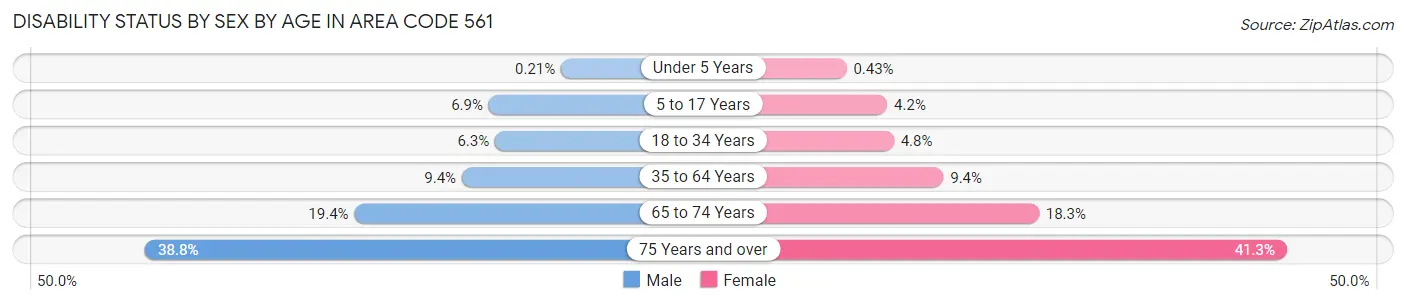
| Age Bracket | Male | Female |
| Under 5 Years | 88 (0.2%) | 174 (0.4%) |
| 5 to 17 Years | 8,192 (6.9%) | 4,711 (4.2%) |
| 18 to 34 Years | 10,270 (6.3%) | 7,714 (4.8%) |
| 35 to 64 Years | 29,399 (9.4%) | 30,189 (9.4%) |
| 65 to 74 Years | 17,403 (19.4%) | 19,401 (18.3%) |
| 75 Years and over | 34,107 (38.8%) | 47,763 (41.3%) |
Disability Class by Sex by Age in Area Code 561
Disability Class: Hearing Difficulty
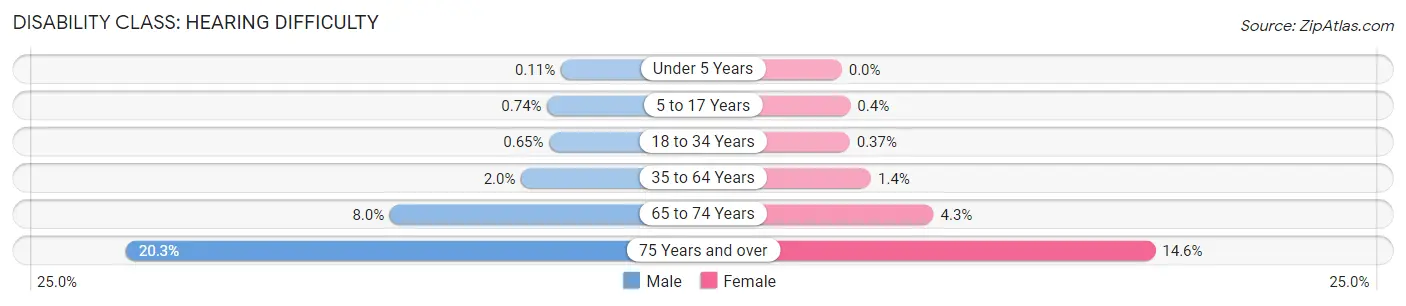
| Age Bracket | Male | Female |
| Under 5 Years | 46 (0.1%) | 1 (0.0%) |
| 5 to 17 Years | 873 (0.7%) | 444 (0.4%) |
| 18 to 34 Years | 1,049 (0.6%) | 590 (0.4%) |
| 35 to 64 Years | 6,107 (1.9%) | 4,363 (1.4%) |
| 65 to 74 Years | 7,219 (8.0%) | 4,520 (4.3%) |
| 75 Years and over | 17,845 (20.3%) | 16,831 (14.5%) |
Disability Class: Vision Difficulty
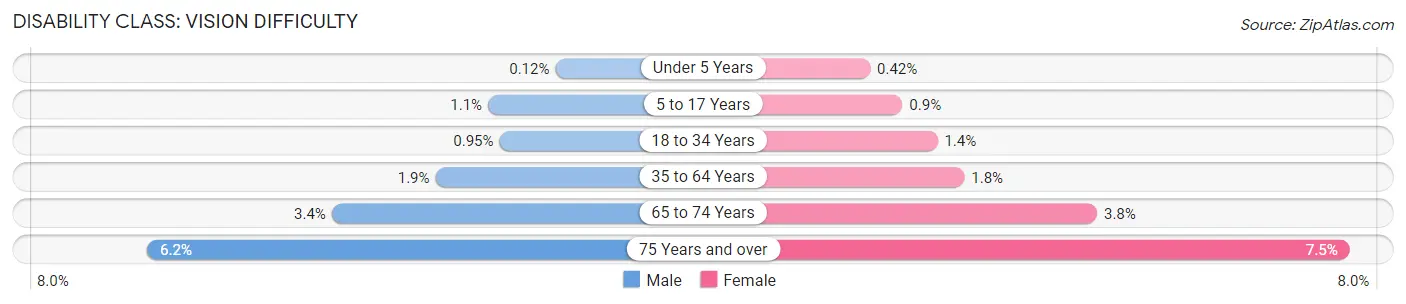
| Age Bracket | Male | Female |
| Under 5 Years | 51 (0.1%) | 173 (0.4%) |
| 5 to 17 Years | 1,323 (1.1%) | 1,004 (0.9%) |
| 18 to 34 Years | 1,538 (0.9%) | 2,268 (1.4%) |
| 35 to 64 Years | 5,938 (1.9%) | 5,829 (1.8%) |
| 65 to 74 Years | 3,086 (3.4%) | 4,026 (3.8%) |
| 75 Years and over | 5,434 (6.2%) | 8,727 (7.5%) |
Disability Class: Cognitive Difficulty
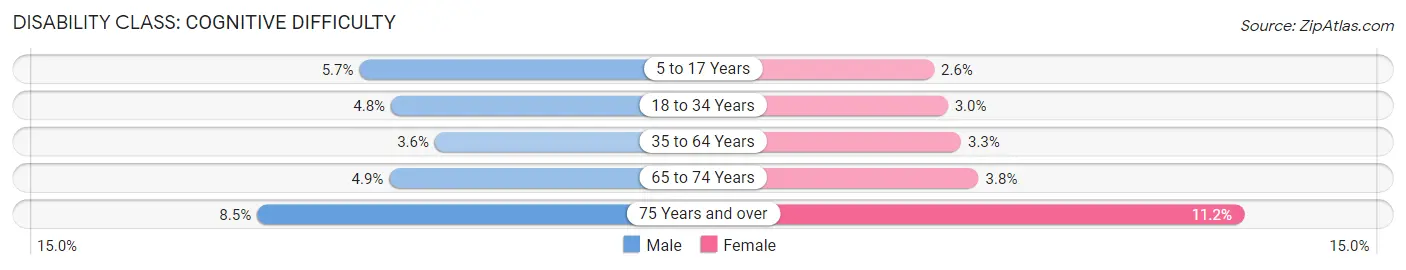
| Age Bracket | Male | Female |
| 5 to 17 Years | 6,724 (5.7%) | 2,873 (2.6%) |
| 18 to 34 Years | 7,784 (4.8%) | 4,719 (2.9%) |
| 35 to 64 Years | 11,185 (3.6%) | 10,657 (3.3%) |
| 65 to 74 Years | 4,352 (4.9%) | 4,039 (3.8%) |
| 75 Years and over | 7,494 (8.5%) | 12,947 (11.2%) |
Disability Class: Ambulatory Difficulty
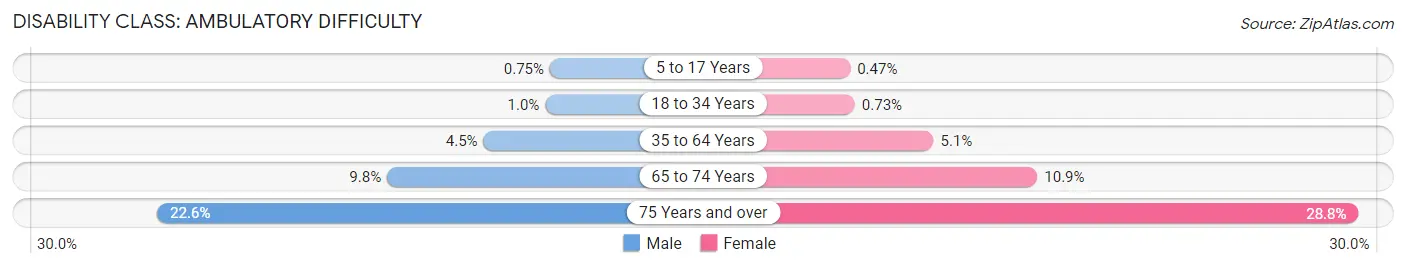
| Age Bracket | Male | Female |
| 5 to 17 Years | 885 (0.7%) | 525 (0.5%) |
| 18 to 34 Years | 1,632 (1.0%) | 1,168 (0.7%) |
| 35 to 64 Years | 13,914 (4.4%) | 16,379 (5.1%) |
| 65 to 74 Years | 8,818 (9.8%) | 11,562 (10.9%) |
| 75 Years and over | 19,882 (22.6%) | 33,264 (28.8%) |
Disability Class: Self-Care Difficulty
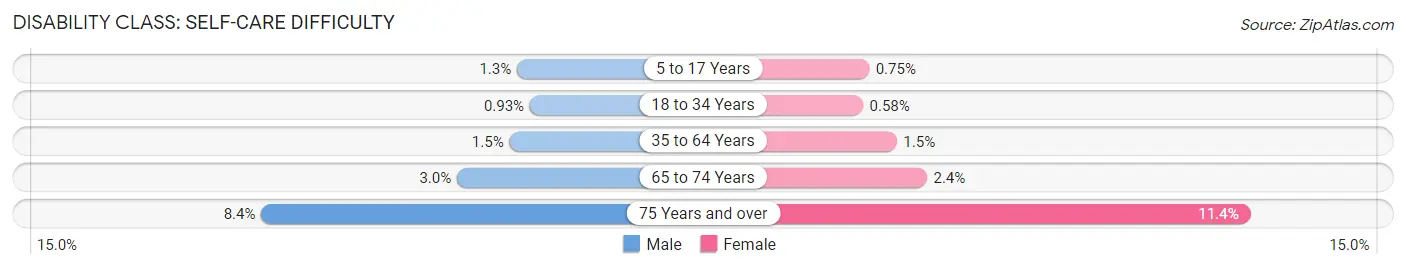
| Age Bracket | Male | Female |
| 5 to 17 Years | 1,526 (1.3%) | 834 (0.7%) |
| 18 to 34 Years | 1,503 (0.9%) | 930 (0.6%) |
| 35 to 64 Years | 4,678 (1.5%) | 4,871 (1.5%) |
| 65 to 74 Years | 2,657 (3.0%) | 2,509 (2.4%) |
| 75 Years and over | 7,387 (8.4%) | 13,166 (11.4%) |
Technology Access in Area Code 561
Computing Device Access in Area Code 561
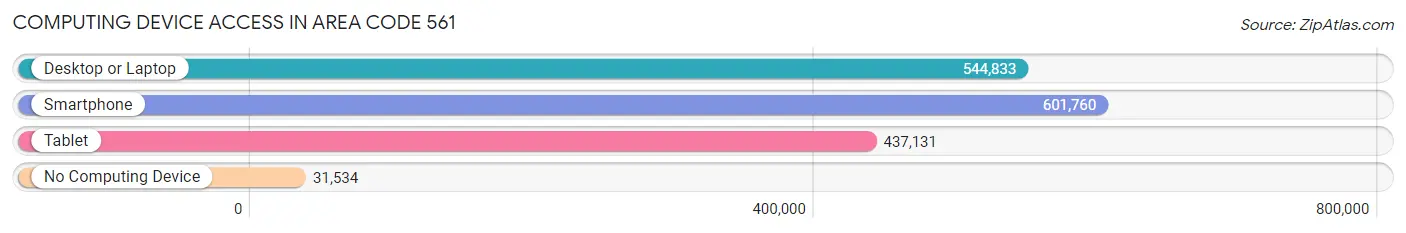
| Device Type | # Households | % Households |
| Desktop or Laptop | 544,833 | 81.3% |
| Smartphone | 601,760 | 89.8% |
| Tablet | 437,131 | 65.2% |
| No Computing Device | 31,534 | 4.7% |
| Total | 670,318 | 100.0% |
Internet Access in Area Code 561
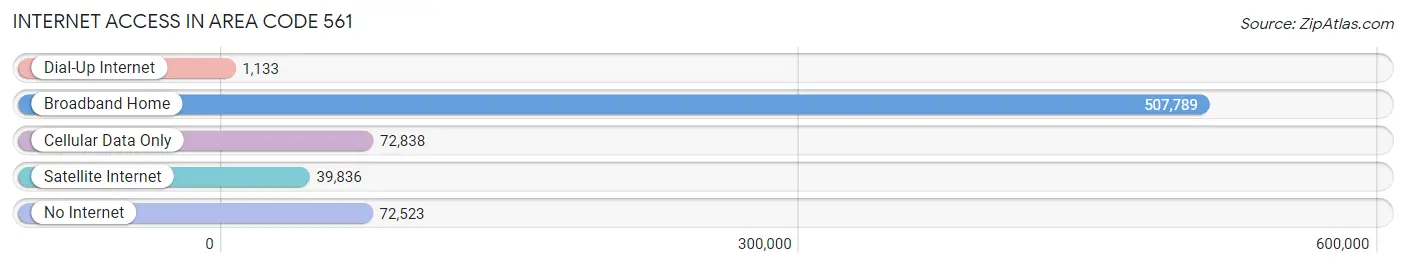
| Internet Type | # Households | % Households |
| Dial-Up Internet | 1,133 | 0.2% |
| Broadband Home | 507,789 | 75.7% |
| Cellular Data Only | 72,838 | 10.9% |
| Satellite Internet | 39,836 | 5.9% |
| No Internet | 72,523 | 10.8% |
| Total | 670,318 | 100.0% |
Area Code 561 Summary
Geography
Area code 561 is located in the southeastern part of Florida, covering the Palm Beach County area. It includes the cities of Boca Raton, Boynton Beach, Delray Beach, Jupiter, and West Palm Beach.
Social
Area code 561 is home to a diverse population of people from all walks of life. The area is known for its vibrant nightlife, cultural attractions, and outdoor activities. It is also home to many universities and colleges, making it a popular destination for students.
Economics
Area code 561 is a major economic hub in Florida. It is home to many large corporations, such as Office Depot, NextEra Energy, and Florida Power & Light. The area also has a thriving tourism industry, with many resorts, restaurants, and attractions.
Demographics
Area code 561 is home to a population of over 1.5 million people. The majority of the population is white, followed by African American, Hispanic, and Asian. The median household income is around $60,000, and the median home value is around $250,000.
Common Questions
What is Per Capita Income in Area Code 561?
Per Capita income in Area Code 561 is $51,612.
What is the Median Family Income in Area Code 561?
Median Family Income in Area Code 561 is $99,595.
What is the Median Household income in Area Code 561?
Median Household Income in Area Code 561 is $81,508.
What is Income or Wage Gap in Area Code 561?
Income or Wage Gap in Area Code 561 is 27.4%.
Women in Area Code 561 earn 72.6 cents for every dollar earned by a man.
What is Family Income Deficit in Area Code 561?
Family Income Deficit in Area Code 561 is $10,849.
Families that are below poverty line in Area Code 561 earn $10,849 less on average than the poverty threshold level.
What is Inequality or Gini Index in Area Code 561?
Inequality or Gini Index in Area Code 561 is 27.24.
What is the Total Population of Area Code 561?
Total Population of Area Code 561 is 1,684,204.
What is the Total Male Population of Area Code 561?
Total Male Population of Area Code 561 is 822,989.
What is the Total Female Population of Area Code 561?
Total Female Population of Area Code 561 is 861,215.
What is the Ratio of Males per 100 Females in Area Code 561?
There are 95.56 Males per 100 Females in Area Code 561.
What is the Ratio of Females per 100 Males in Area Code 561?
There are 104.64 Females per 100 Males in Area Code 561.
What is the Median Population Age in Area Code 561?
Median Population Age in Area Code 561 is 47.0 Years.
What is the Average Family Size in Area Code 561
Average Family Size in Area Code 561 is 3.1 People.
What is the Average Household Size in Area Code 561
Average Household Size in Area Code 561 is 2.5 People.
How Large is the Labor Force in Area Code 561?
There are 810,888 People in the Labor Forcein in Area Code 561.
What is the Percentage of People in the Labor Force in Area Code 561?
57.6% of People are in the Labor Force in Area Code 561.
What is the Unemployment Rate in Area Code 561?
Unemployment Rate in Area Code 561 is 6.2%.