Area Code 586 Map & Demographics
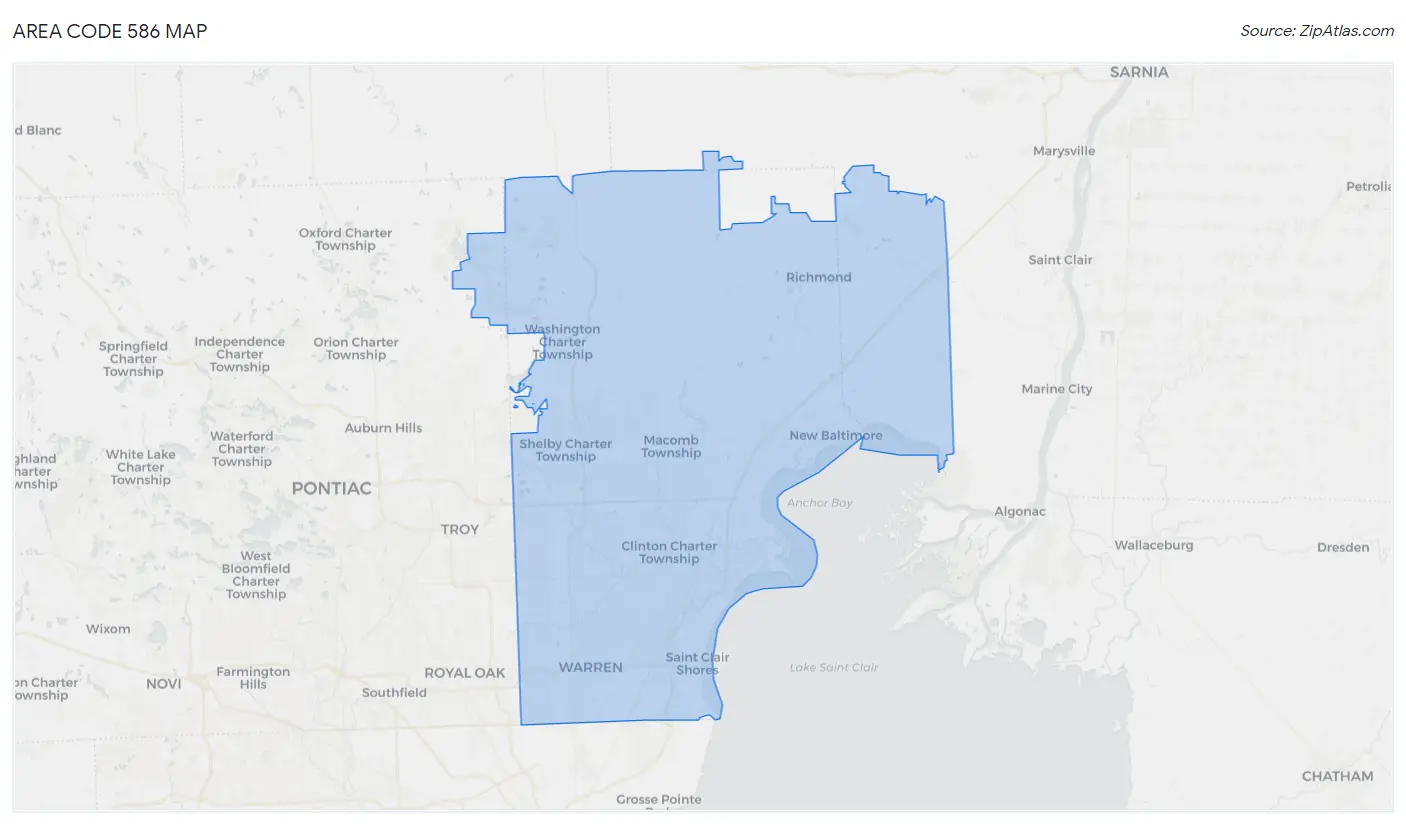
Area Code 586 Map
Area Code 586 Overview
$37,220
PER CAPITA INCOME
$86,852
AVG FAMILY INCOME
$70,771
AVG HOUSEHOLD INCOME
26.9%
WAGE / INCOME GAP [ % ]
73.1¢/ $1
WAGE / INCOME GAP [ $ ]
$9,737
FAMILY INCOME DEFICIT
20.63
INEQUALITY / GINI INDEX
1,163,943
TOTAL POPULATION
566,024
MALE POPULATION
597,919
FEMALE POPULATION
94.67
MALES / 100 FEMALES
105.63
FEMALES / 100 MALES
40.6
MEDIAN AGE
3.1
AVG FAMILY SIZE
2.4
AVG HOUSEHOLD SIZE
590,769
LABOR FORCE [ PEOPLE ]
62.2%
PERCENT IN LABOR FORCE
6.5%
UNEMPLOYMENT RATE
Income in Area Code 586
Income Overview in Area Code 586
Per Capita Income in Area Code 586 is $37,220, while median incomes of families and households are $86,852 and $70,771 respectively.
| Characteristic | Number | Measure |
| Per Capita Income | 1,163,943 | $37,220 |
| Median Family Income | 289,224 | $86,852 |
| Mean Family Income | 289,224 | $5,045,474 |
| Median Household Income | 476,387 | $70,771 |
| Mean Household Income | 476,387 | $4,242,078 |
| Income Deficit | 289,224 | $9,737 |
| Wage / Income Gap (%) | 1,163,943 | 26.91% |
| Wage / Income Gap ($) | 1,163,943 | 73.09¢ per $1 |
| Gini / Inequality Index | 1,163,943 | 20.63 |
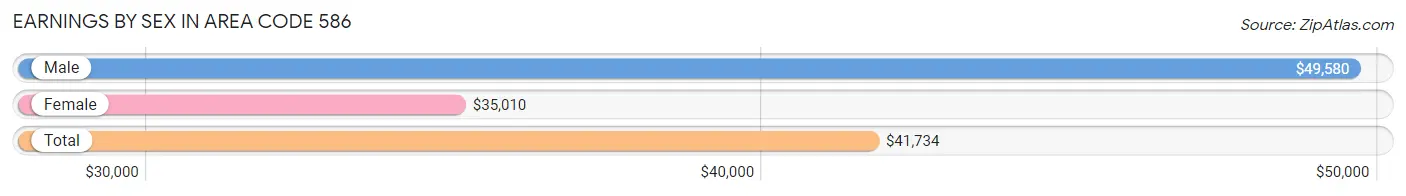
Earnings by Sex in Area Code 586
Average Earnings in Area Code 586 are $41,734, $49,580 for men and $35,010 for women, a difference of 29.4%.
| Sex | Number | Average Earnings |
| Male | 319,124 (51.5%) | $49,580 |
| Female | 300,941 (48.5%) | $35,010 |
| Total | 620,065 (100.0%) | $41,734 |
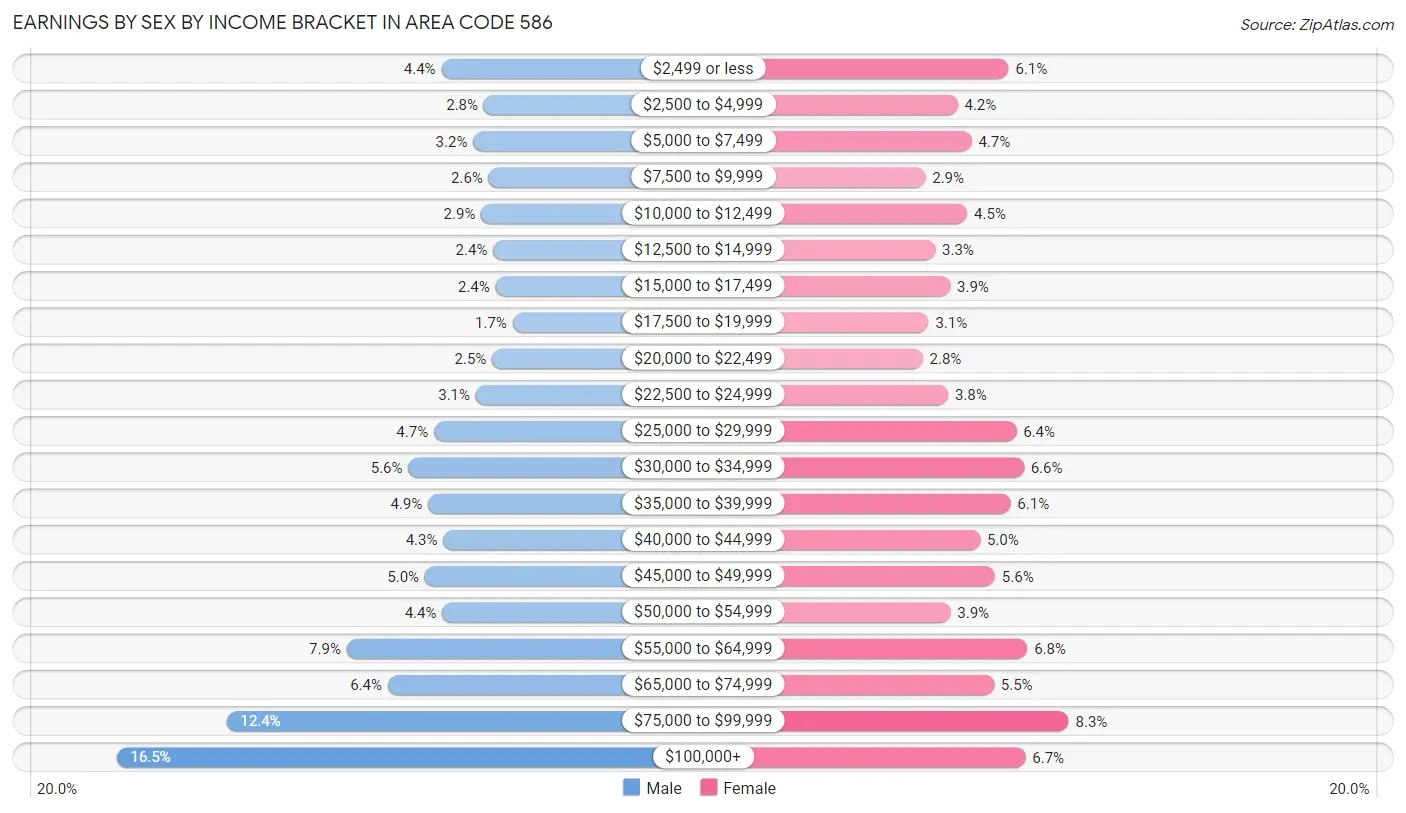
Earnings by Sex by Income Bracket in Area Code 586
The most common earnings brackets in Area Code 586 are $100,000+ for men (52,727 | 16.5%) and $75,000 to $99,999 for women (25,012 | 8.3%).
| Income | Male | Female |
| $2,499 or less | 13,968 (4.4%) | 18,222 (6.1%) |
| $2,500 to $4,999 | 8,901 (2.8%) | 12,498 (4.2%) |
| $5,000 to $7,499 | 10,175 (3.2%) | 14,061 (4.7%) |
| $7,500 to $9,999 | 8,333 (2.6%) | 8,846 (2.9%) |
| $10,000 to $12,499 | 9,218 (2.9%) | 13,587 (4.5%) |
| $12,500 to $14,999 | 7,800 (2.4%) | 9,949 (3.3%) |
| $15,000 to $17,499 | 7,504 (2.4%) | 11,657 (3.9%) |
| $17,500 to $19,999 | 5,465 (1.7%) | 9,195 (3.1%) |
| $20,000 to $22,499 | 7,909 (2.5%) | 8,532 (2.8%) |
| $22,500 to $24,999 | 9,849 (3.1%) | 11,398 (3.8%) |
| $25,000 to $29,999 | 14,884 (4.7%) | 19,120 (6.4%) |
| $30,000 to $34,999 | 17,928 (5.6%) | 19,958 (6.6%) |
| $35,000 to $39,999 | 15,572 (4.9%) | 18,461 (6.1%) |
| $40,000 to $44,999 | 13,743 (4.3%) | 15,012 (5.0%) |
| $45,000 to $49,999 | 15,963 (5.0%) | 16,715 (5.6%) |
| $50,000 to $54,999 | 13,897 (4.3%) | 11,662 (3.9%) |
| $55,000 to $64,999 | 25,312 (7.9%) | 20,329 (6.8%) |
| $65,000 to $74,999 | 20,400 (6.4%) | 16,594 (5.5%) |
| $75,000 to $99,999 | 39,576 (12.4%) | 25,012 (8.3%) |
| $100,000+ | 52,727 (16.5%) | 20,133 (6.7%) |
| Total | 319,124 (100.0%) | 300,941 (100.0%) |
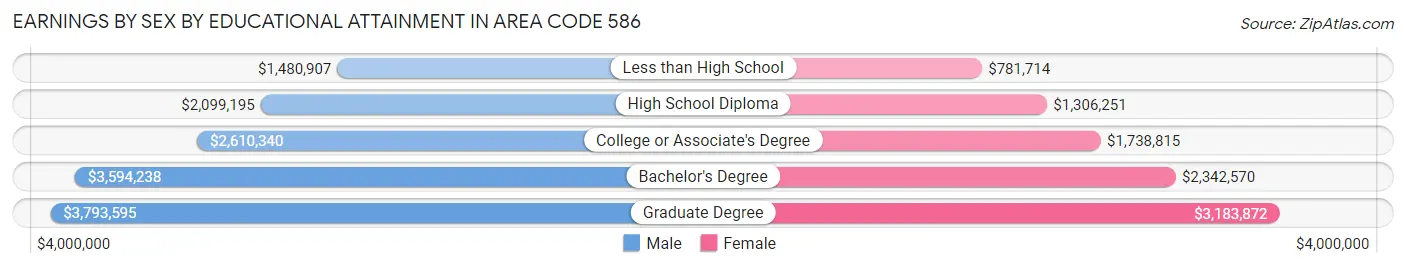
Earnings by Sex by Educational Attainment in Area Code 586
Average earnings in Area Code 586 are $2,690,945 for men and $1,924,839 for women, a difference of 28.5%. Men with an educational attainment of graduate degree enjoy the highest average annual earnings of $3,793,595, while those with less than high school education earn the least with $1,480,907. Women with an educational attainment of graduate degree earn the most with the average annual earnings of $3,183,872, while those with less than high school education have the smallest earnings of $781,714.
| Educational Attainment | Male Income | Female Income |
| Less than High School | $1,480,907 | $781,714 |
| High School Diploma | $2,099,195 | $1,306,251 |
| College or Associate's Degree | $2,610,340 | $1,738,815 |
| Bachelor's Degree | $3,594,238 | $2,342,570 |
| Graduate Degree | $3,793,595 | $3,183,872 |
| Total | $2,690,945 | $1,924,839 |
Family Income in Area Code 586
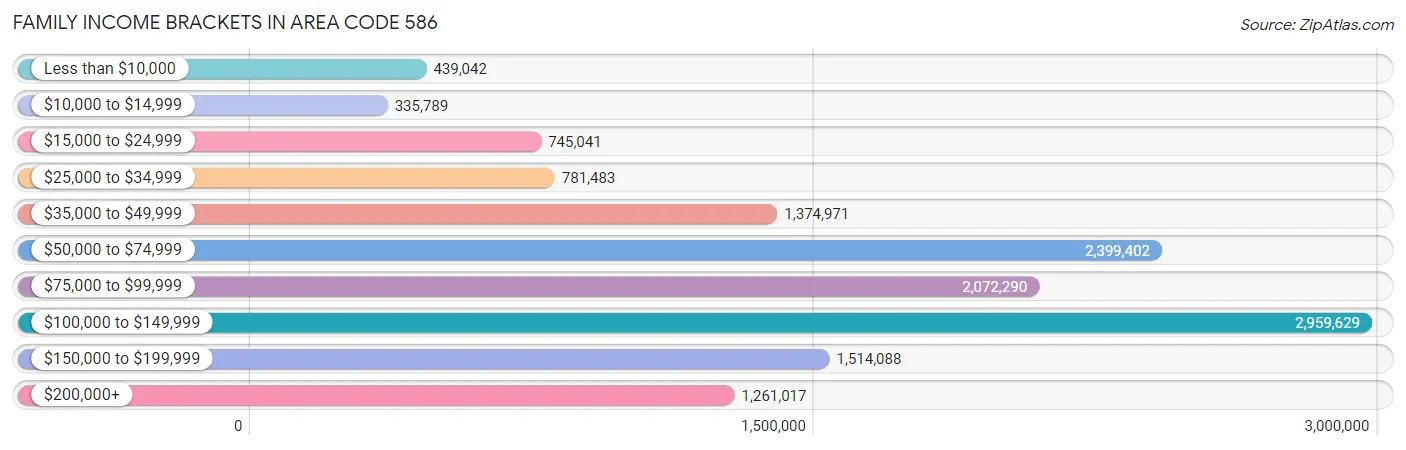
Family Income Brackets in Area Code 586
According to the Area Code 586 family income data, there are 2,959,629 families falling into the $100,000 to $149,999 income range, which is the most common income bracket and makes up 1,023.3% of all families. Conversely, the $10,000 to $14,999 income bracket is the least frequent group with only 335,789 families (116.1%) belonging to this category.
| Income Bracket | # Families | % Families |
| Less than $10,000 | 439,042 | 151.8% |
| $10,000 to $14,999 | 335,789 | 116.1% |
| $15,000 to $24,999 | 745,041 | 257.6% |
| $25,000 to $34,999 | 781,483 | 270.2% |
| $35,000 to $49,999 | 1,374,971 | 475.4% |
| $50,000 to $74,999 | 2,399,402 | 829.6% |
| $75,000 to $99,999 | 2,072,290 | 716.5% |
| $100,000 to $149,999 | 2,959,629 | 1,023.3% |
| $150,000 to $199,999 | 1,514,088 | 523.5% |
| $200,000+ | 1,261,017 | 436.0% |
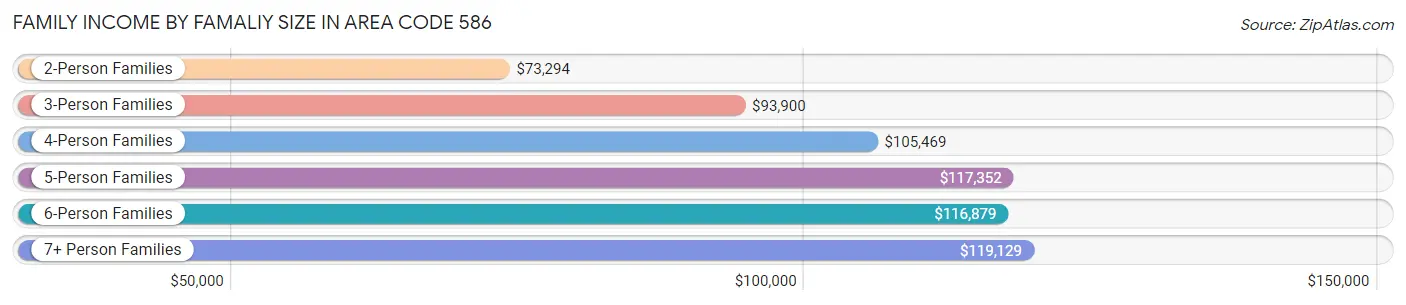
Family Income by Famaliy Size in Area Code 586
7+ person families (4,479 | 1.5%) account for the highest median family income in Area Code 586 with $119,129 per family, while 2-person families (136,134 | 47.1%) have the highest median income of $36,647 per family member.
| Income Bracket | # Families | Median Income |
| 2-Person Families | 136,134 (47.1%) | $73,294 |
| 3-Person Families | 67,548 (23.4%) | $93,900 |
| 4-Person Families | 50,461 (17.4%) | $105,469 |
| 5-Person Families | 23,000 (8.0%) | $117,352 |
| 6-Person Families | 7,602 (2.6%) | $116,879 |
| 7+ Person Families | 4,479 (1.5%) | $119,129 |
| Total | 289,224 (100.0%) | $86,852 |
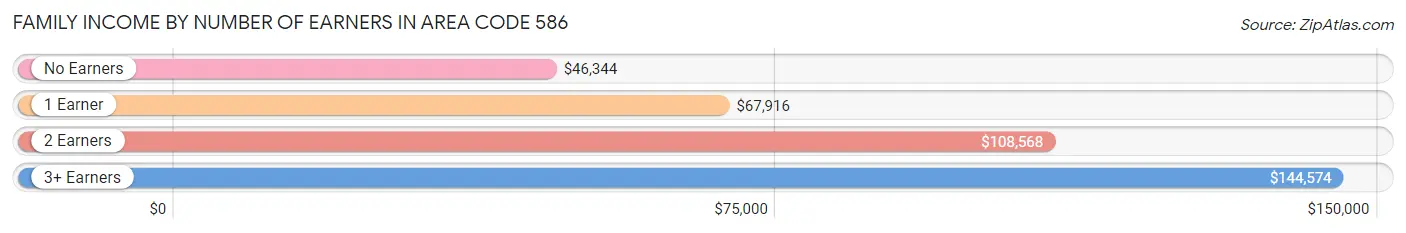
Family Income by Number of Earners in Area Code 586
The median family income in Area Code 586 is $86,852, with families comprising 3+ earners (41,964) having the highest median family income of $144,574, while families with no earners (44,148) have the lowest median family income of $46,344, accounting for 14.5% and 15.3% of families, respectively.
| Number of Earners | # Families | Median Income |
| No Earners | 44,148 (15.3%) | $46,344 |
| 1 Earner | 93,824 (32.4%) | $67,916 |
| 2 Earners | 109,288 (37.8%) | $108,568 |
| 3+ Earners | 41,964 (14.5%) | $144,574 |
| Total | 289,224 (100.0%) | $86,852 |
Household Income in Area Code 586
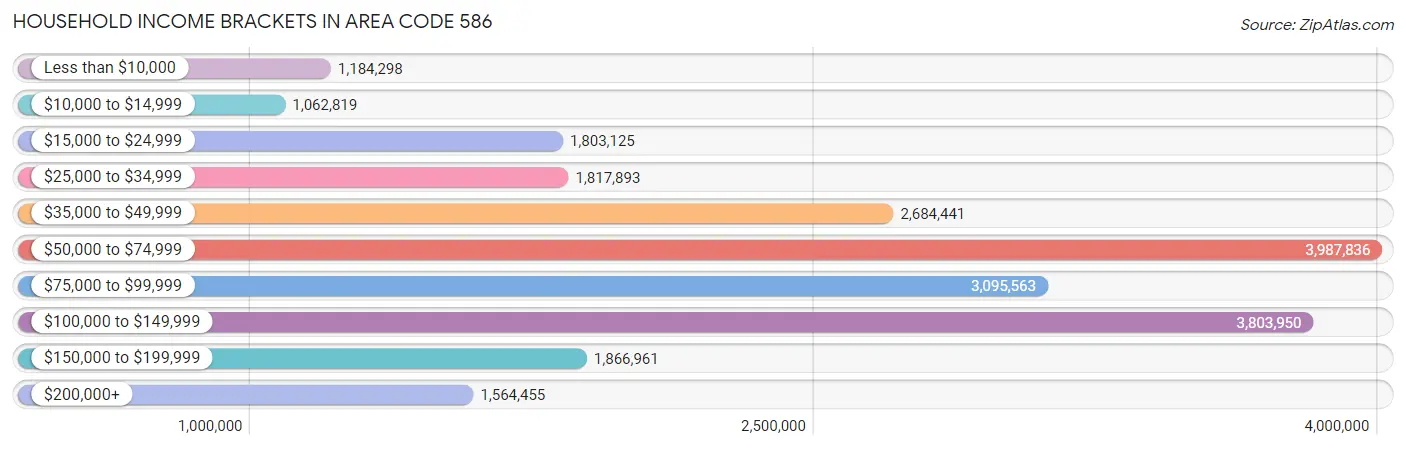
Household Income Brackets in Area Code 586
With 3,987,836 households falling in the category, the $50,000 to $74,999 income range is the most frequent in Area Code 586, accounting for 837.1% of all households. In contrast, only 1,062,819 households (223.1%) fall into the $10,000 to $14,999 income bracket, making it the least populous group.
| Income Bracket | # Households | % Households |
| Less than $10,000 | 1,184,298 | 248.6% |
| $10,000 to $14,999 | 1,062,819 | 223.1% |
| $15,000 to $24,999 | 1,803,125 | 378.5% |
| $25,000 to $34,999 | 1,817,893 | 381.6% |
| $35,000 to $49,999 | 2,684,441 | 563.5% |
| $50,000 to $74,999 | 3,987,836 | 837.1% |
| $75,000 to $99,999 | 3,095,563 | 649.8% |
| $100,000 to $149,999 | 3,803,950 | 798.5% |
| $150,000 to $199,999 | 1,866,961 | 391.9% |
| $200,000+ | 1,564,455 | 328.4% |
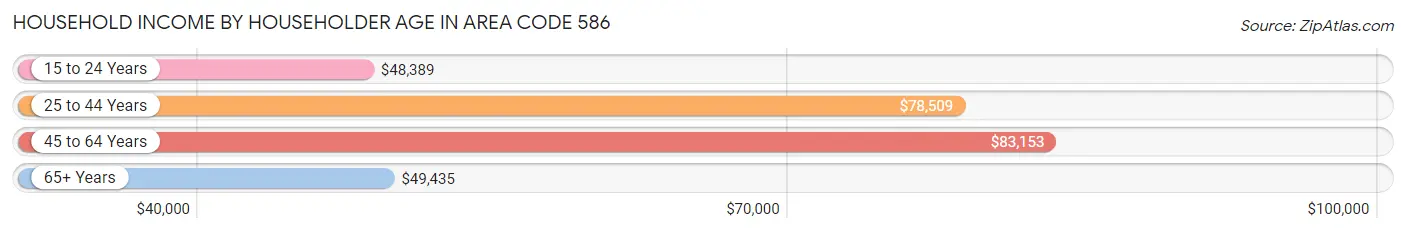
Household Income by Householder Age in Area Code 586
The median household income in Area Code 586 is $70,771, with the highest median household income of $83,153 found in the 45 to 64 years age bracket for the primary householder. A total of 184,978 households (38.8%) fall into this category. Meanwhile, the 15 to 24 years age bracket for the primary householder has the lowest median household income of $48,389, with 12,733 households (2.7%) in this group.
| Income Bracket | # Households | Median Income |
| 15 to 24 Years | 12,733 (2.7%) | $48,389 |
| 25 to 44 Years | 147,269 (30.9%) | $78,509 |
| 45 to 64 Years | 184,978 (38.8%) | $83,153 |
| 65+ Years | 131,407 (27.6%) | $49,434 |
| Total | 476,387 (100.0%) | $70,771 |
Poverty in Area Code 586
Income Below Poverty by Sex and Age in Area Code 586
With 11.5% poverty level for males and 14.0% for females among the residents of Area Code 586, under 5 year old males and under 5 year old females are the most vulnerable to poverty, with 6,977 males (21.3%) and 6,261 females (20.8%) in their respective age groups living below the poverty level.
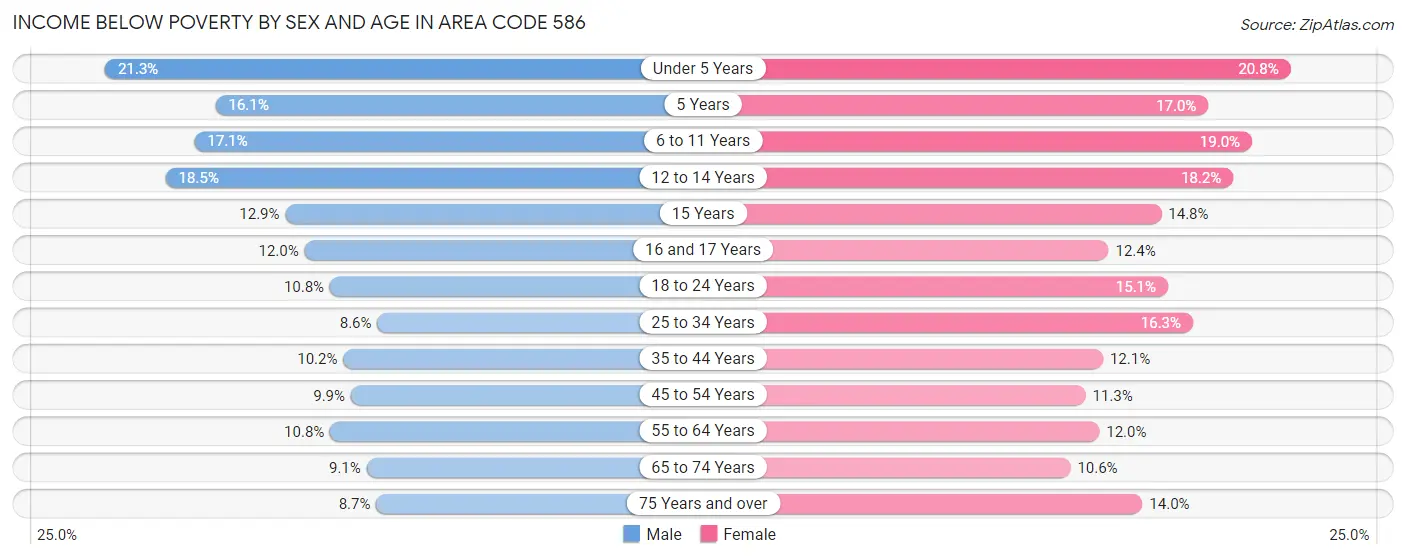
| Age Bracket | Male | Female |
| Under 5 Years | 6,977 (21.3%) | 6,261 (20.8%) |
| 5 Years | 1,045 (16.1%) | 1,124 (17.0%) |
| 6 to 11 Years | 6,734 (17.1%) | 7,541 (19.0%) |
| 12 to 14 Years | 4,233 (18.5%) | 3,530 (18.2%) |
| 15 Years | 951 (12.9%) | 974 (14.8%) |
| 16 and 17 Years | 1,819 (12.0%) | 1,828 (12.4%) |
| 18 to 24 Years | 5,298 (10.8%) | 7,284 (15.1%) |
| 25 to 34 Years | 7,030 (8.6%) | 13,405 (16.3%) |
| 35 to 44 Years | 6,889 (10.2%) | 8,534 (12.1%) |
| 45 to 54 Years | 7,221 (9.9%) | 8,903 (11.3%) |
| 55 to 64 Years | 8,428 (10.8%) | 9,930 (11.9%) |
| 65 to 74 Years | 4,906 (9.1%) | 6,742 (10.6%) |
| 75 Years and over | 2,655 (8.7%) | 6,795 (14.0%) |
| Total | 64,186 (11.5%) | 82,851 (14.0%) |
Income Above Poverty by Sex and Age in Area Code 586
According to the poverty statistics in Area Code 586, males aged 25 to 34 years and females aged 65 to 74 years are the age groups that are most secure financially, with 91.4% of males and 89.4% of females in these age groups living above the poverty line.
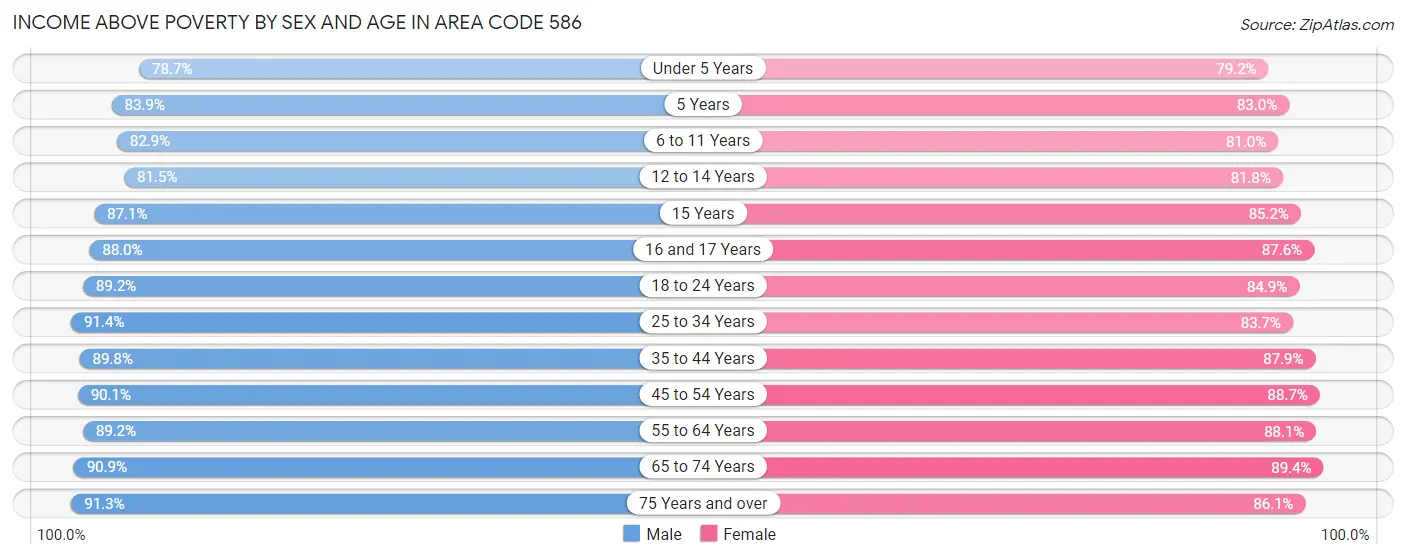
| Age Bracket | Male | Female |
| Under 5 Years | 25,819 (78.7%) | 23,804 (79.2%) |
| 5 Years | 5,431 (83.9%) | 5,487 (83.0%) |
| 6 to 11 Years | 32,591 (82.9%) | 32,087 (81.0%) |
| 12 to 14 Years | 18,700 (81.5%) | 15,905 (81.8%) |
| 15 Years | 6,423 (87.1%) | 5,592 (85.2%) |
| 16 and 17 Years | 13,333 (88.0%) | 12,942 (87.6%) |
| 18 to 24 Years | 43,631 (89.2%) | 40,872 (84.9%) |
| 25 to 34 Years | 74,415 (91.4%) | 68,880 (83.7%) |
| 35 to 44 Years | 60,563 (89.8%) | 61,885 (87.9%) |
| 45 to 54 Years | 66,005 (90.1%) | 69,844 (88.7%) |
| 55 to 64 Years | 69,500 (89.2%) | 73,174 (88.0%) |
| 65 to 74 Years | 48,828 (90.9%) | 56,774 (89.4%) |
| 75 Years and over | 27,923 (91.3%) | 41,916 (86.1%) |
| Total | 493,162 (88.5%) | 509,162 (86.0%) |
Income Below Poverty Among Married-Couple Families in Area Code 586
The poverty statistics for married-couple families in Area Code 586 show that 4.5% or 8,788 of the total 193,014 families live below the poverty line. Families with 5 or more children have the highest poverty rate of 20.7%, comprising of 237 families. On the other hand, families with no children have the lowest poverty rate of 3.4%, which includes 3,966 families.
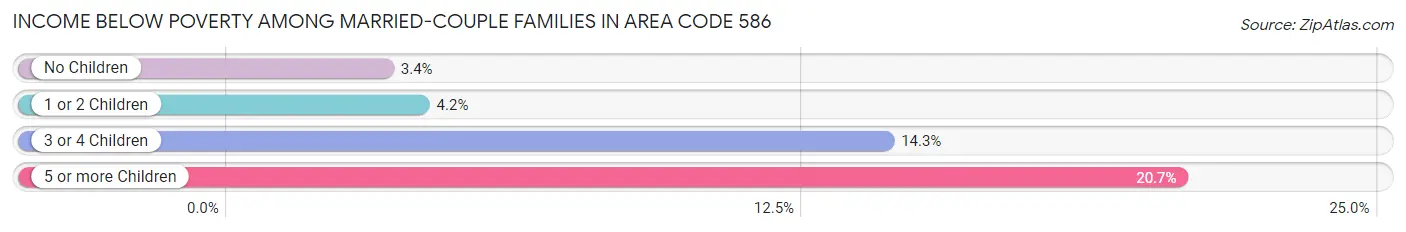
| Children | Above Poverty | Below Poverty |
| No Children | 113,183 (96.6%) | 3,966 (3.4%) |
| 1 or 2 Children | 57,680 (95.8%) | 2,511 (4.2%) |
| 3 or 4 Children | 12,454 (85.7%) | 2,074 (14.3%) |
| 5 or more Children | 909 (79.3%) | 237 (20.7%) |
| Total | 184,226 (95.5%) | 8,788 (4.5%) |
Income Below Poverty Among Single-Parent Households in Area Code 586
According to the poverty data in Area Code 586, 12.0% or 3,047 single-father households and 21.5% or 15,207 single-mother households are living below the poverty line. Among single-father households, those with 3 or 4 children have the highest poverty rate, with 354 households (33.1%) experiencing poverty. Likewise, among single-mother households, those with 5 or more children have the highest poverty rate, with 371 households (72.6%) falling below the poverty line.
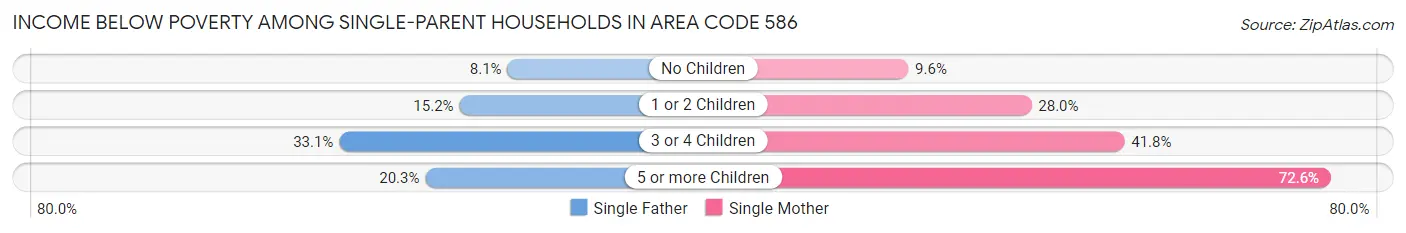
| Children | Single Father | Single Mother |
| No Children | 1,133 (8.1%) | 2,967 (9.6%) |
| 1 or 2 Children | 1,546 (15.2%) | 9,355 (28.0%) |
| 3 or 4 Children | 354 (33.1%) | 2,514 (41.8%) |
| 5 or more Children | 14 (20.3%) | 371 (72.6%) |
| Total | 3,047 (12.0%) | 15,207 (21.5%) |
Income Below Poverty Among Married-Couple vs Single-Parent Households in Area Code 586
The poverty data for Area Code 586 shows that 8,788 of the married-couple family households (4.5%) and 18,254 of the single-parent households (19.0%) are living below the poverty level. Within the married-couple family households, those with 5 or more children have the highest poverty rate, with 237 households (20.7%) falling below the poverty line. Among the single-parent households, those with 5 or more children have the highest poverty rate, with 385 household (66.4%) living below poverty.
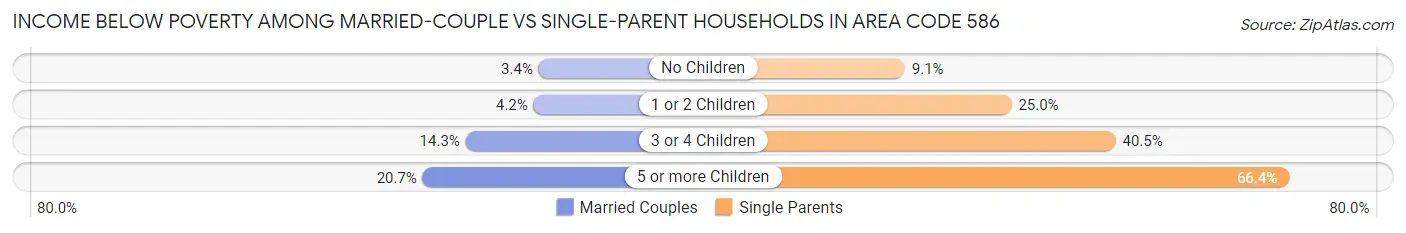
| Children | Married-Couple Families | Single-Parent Households |
| No Children | 3,966 (3.4%) | 4,100 (9.1%) |
| 1 or 2 Children | 2,511 (4.2%) | 10,901 (25.0%) |
| 3 or 4 Children | 2,074 (14.3%) | 2,868 (40.5%) |
| 5 or more Children | 237 (20.7%) | 385 (66.4%) |
| Total | 8,788 (4.5%) | 18,254 (19.0%) |
Race in Area Code 586
The most populous races in Area Code 586 are White / Caucasian (734,214 | 63.1%), Black / African American (309,317 | 26.6%), and Two or more Races (58,173 | 5.0%).
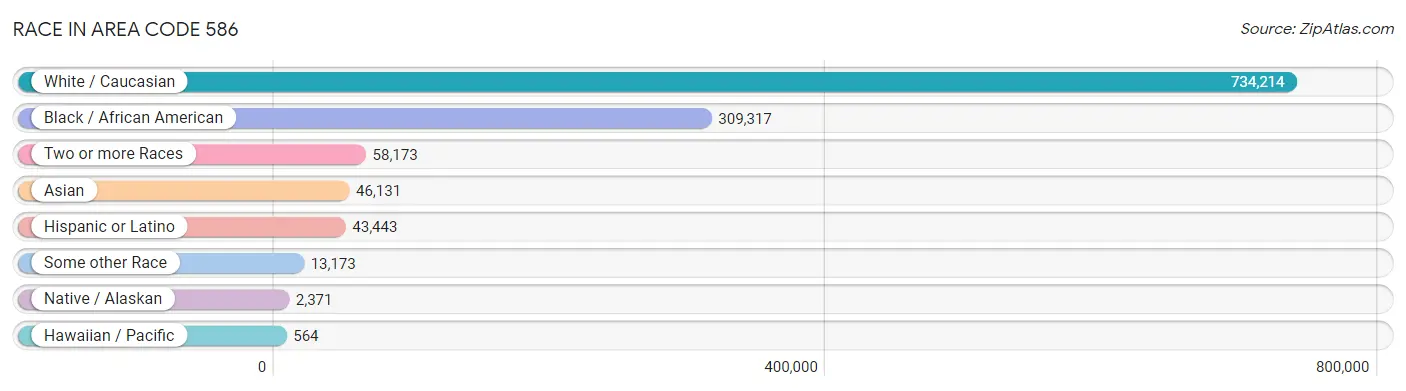
| Race | # Population | % Population |
| Asian | 46,131 | 4.0% |
| Black / African American | 309,317 | 26.6% |
| Hawaiian / Pacific | 564 | 0.1% |
| Hispanic or Latino | 43,443 | 3.7% |
| Native / Alaskan | 2,371 | 0.2% |
| White / Caucasian | 734,214 | 63.1% |
| Two or more Races | 58,173 | 5.0% |
| Some other Race | 13,173 | 1.1% |
| Total | 1,163,943 | 100.0% |
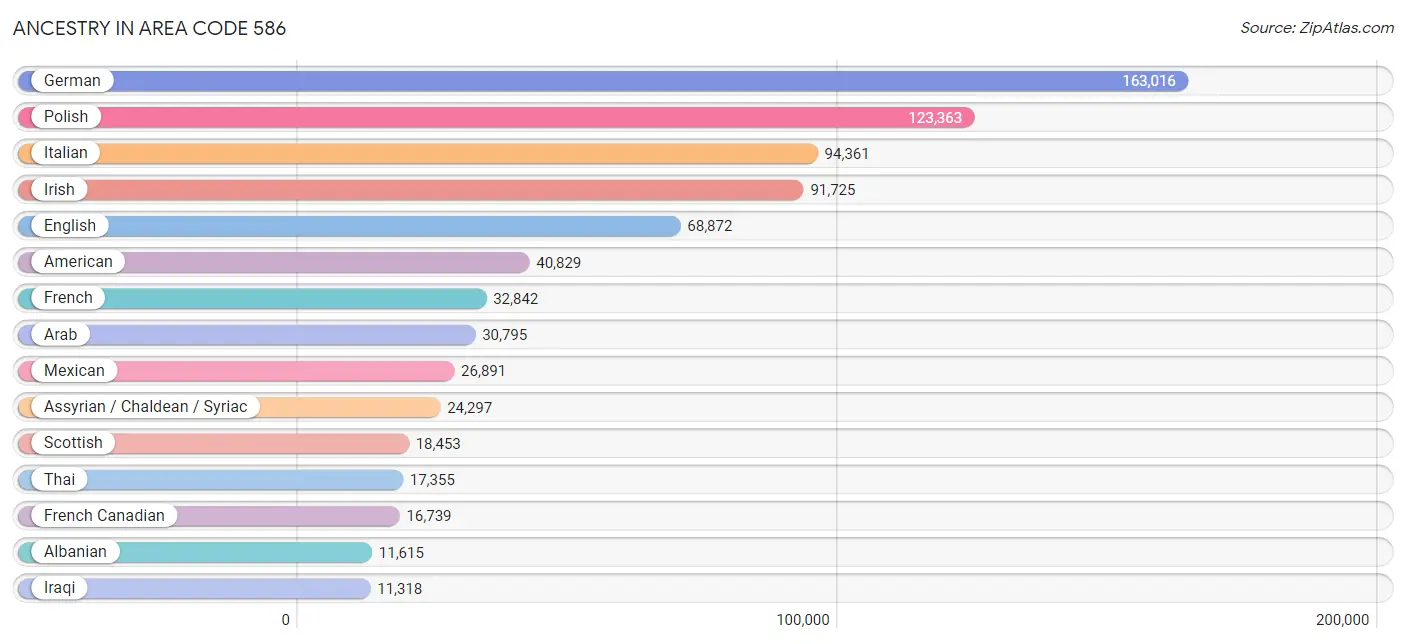
Ancestry in Area Code 586
The most populous ancestries reported in Area Code 586 are German (163,016 | 14.0%), Polish (123,363 | 10.6%), Italian (94,361 | 8.1%), Irish (91,725 | 7.9%), and English (68,872 | 5.9%), together accounting for 46.5% of all Area Code 586 residents.
| Ancestry | # Population | % Population |
| Afghan | 26 | 0.0% |
| African | 7,385 | 0.6% |
| Alaska Native | 29 | 0.0% |
| Alaskan Athabascan | 26 | 0.0% |
| Albanian | 11,615 | 1.0% |
| Alsatian | 57 | 0.0% |
| American | 40,829 | 3.5% |
| Apache | 331 | 0.0% |
| Arab | 30,795 | 2.6% |
| Arapaho | 27 | 0.0% |
| Argentinean | 293 | 0.0% |
| Armenian | 1,969 | 0.2% |
| Assyrian / Chaldean / Syriac | 24,297 | 2.1% |
| Australian | 165 | 0.0% |
| Austrian | 1,907 | 0.2% |
| Bahamian | 279 | 0.0% |
| Bangladeshi | 5,263 | 0.4% |
| Barbadian | 29 | 0.0% |
| Basque | 36 | 0.0% |
| Belgian | 10,422 | 0.9% |
| Belizean | 22 | 0.0% |
| Bermudan | 34 | 0.0% |
| Bhutanese | 1,781 | 0.2% |
| Blackfeet | 846 | 0.1% |
| Bolivian | 30 | 0.0% |
| Brazilian | 644 | 0.1% |
| British | 4,481 | 0.4% |
| British West Indian | 108 | 0.0% |
| Bulgarian | 413 | 0.0% |
| Burmese | 2,744 | 0.2% |
| Cajun | 8 | 0.0% |
| Cambodian | 19 | 0.0% |
| Canadian | 4,528 | 0.4% |
| Carpatho Rusyn | 10 | 0.0% |
| Celtic | 258 | 0.0% |
| Central American | 2,297 | 0.2% |
| Central American Indian | 224 | 0.0% |
| Cherokee | 2,914 | 0.3% |
| Cheyenne | 3 | 0.0% |
| Chickasaw | 24 | 0.0% |
| Chilean | 43 | 0.0% |
| Chippewa | 1,472 | 0.1% |
| Choctaw | 258 | 0.0% |
| Colombian | 855 | 0.1% |
| Comanche | 35 | 0.0% |
| Costa Rican | 205 | 0.0% |
| Cree | 16 | 0.0% |
| Creek | 319 | 0.0% |
| Croatian | 1,891 | 0.2% |
| Crow | 5 | 0.0% |
| Cuban | 1,050 | 0.1% |
| Czech | 3,382 | 0.3% |
| Czechoslovakian | 1,000 | 0.1% |
| Danish | 2,271 | 0.2% |
| Delaware | 11 | 0.0% |
| Dominican | 510 | 0.0% |
| Dutch | 9,740 | 0.8% |
| Dutch West Indian | 52 | 0.0% |
| Eastern European | 2,322 | 0.2% |
| Ecuadorian | 293 | 0.0% |
| Egyptian | 635 | 0.1% |
| English | 68,872 | 5.9% |
| Estonian | 120 | 0.0% |
| Ethiopian | 87 | 0.0% |
| European | 10,452 | 0.9% |
| Fijian | 16 | 0.0% |
| Filipino | 431 | 0.0% |
| Finnish | 4,248 | 0.4% |
| French | 32,842 | 2.8% |
| French American Indian | 322 | 0.0% |
| French Canadian | 16,739 | 1.4% |
| German | 163,016 | 14.0% |
| German Russian | 18 | 0.0% |
| Ghanaian | 336 | 0.0% |
| Greek | 6,918 | 0.6% |
| Guamanian / Chamorro | 261 | 0.0% |
| Guatemalan | 122 | 0.0% |
| Guyanese | 22 | 0.0% |
| Haitian | 459 | 0.0% |
| Honduran | 531 | 0.1% |
| Hopi | 23 | 0.0% |
| Hungarian | 6,695 | 0.6% |
| Icelander | 59 | 0.0% |
| Indian (Asian) | 5,728 | 0.5% |
| Indonesian | 87 | 0.0% |
| Iranian | 320 | 0.0% |
| Iraqi | 11,318 | 1.0% |
| Irish | 91,725 | 7.9% |
| Iroquois | 555 | 0.1% |
| Israeli | 882 | 0.1% |
| Italian | 94,361 | 8.1% |
| Jamaican | 2,101 | 0.2% |
| Japanese | 380 | 0.0% |
| Jordanian | 954 | 0.1% |
| Kenyan | 221 | 0.0% |
| Korean | 7,835 | 0.7% |
| Laotian | 13 | 0.0% |
| Latvian | 141 | 0.0% |
| Lebanese | 7,615 | 0.6% |
| Liberian | 389 | 0.0% |
| Lithuanian | 2,690 | 0.2% |
| Lumbee | 134 | 0.0% |
| Luxembourger | 101 | 0.0% |
| Macedonian | 5,716 | 0.5% |
| Malaysian | 945 | 0.1% |
| Maltese | 1,323 | 0.1% |
| Menominee | 6 | 0.0% |
| Mexican | 26,891 | 2.3% |
| Mexican American Indian | 385 | 0.0% |
| Mongolian | 14 | 0.0% |
| Moroccan | 329 | 0.0% |
| Native Hawaiian | 484 | 0.0% |
| Navajo | 71 | 0.0% |
| New Zealander | 19 | 0.0% |
| Nicaraguan | 114 | 0.0% |
| Nigerian | 1,878 | 0.2% |
| Northern European | 646 | 0.1% |
| Norwegian | 4,657 | 0.4% |
| Ottawa | 127 | 0.0% |
| Pakistani | 782 | 0.1% |
| Palestinian | 461 | 0.0% |
| Panamanian | 185 | 0.0% |
| Pennsylvania German | 123 | 0.0% |
| Peruvian | 253 | 0.0% |
| Polish | 123,363 | 10.6% |
| Portuguese | 697 | 0.1% |
| Potawatomi | 212 | 0.0% |
| Pueblo | 23 | 0.0% |
| Puerto Rican | 6,695 | 0.6% |
| Romanian | 4,640 | 0.4% |
| Russian | 7,663 | 0.7% |
| Salvadoran | 1,102 | 0.1% |
| Samoan | 128 | 0.0% |
| Scandinavian | 1,421 | 0.1% |
| Scotch-Irish | 5,529 | 0.5% |
| Scottish | 18,453 | 1.6% |
| Seminole | 126 | 0.0% |
| Senegalese | 129 | 0.0% |
| Serbian | 2,961 | 0.3% |
| Sioux | 317 | 0.0% |
| Slavic | 753 | 0.1% |
| Slovak | 3,224 | 0.3% |
| Slovene | 543 | 0.1% |
| South African | 118 | 0.0% |
| South American | 2,148 | 0.2% |
| South American Indian | 18 | 0.0% |
| Soviet Union | 16 | 0.0% |
| Spaniard | 1,036 | 0.1% |
| Spanish | 701 | 0.1% |
| Spanish American | 23 | 0.0% |
| Sri Lankan | 3,586 | 0.3% |
| Subsaharan African | 10,982 | 0.9% |
| Sudanese | 13 | 0.0% |
| Swedish | 6,613 | 0.6% |
| Swiss | 821 | 0.1% |
| Syrian | 2,272 | 0.2% |
| Thai | 17,355 | 1.5% |
| Trinidadian and Tobagonian | 88 | 0.0% |
| Turkish | 300 | 0.0% |
| Ukrainian | 6,923 | 0.6% |
| Uruguayan | 3 | 0.0% |
| Ute | 1 | 0.0% |
| Venezuelan | 341 | 0.0% |
| Vietnamese | 4,818 | 0.4% |
| Welsh | 3,955 | 0.3% |
| West Indian | 98 | 0.0% |
| Yaqui | 6 | 0.0% |
| Yugoslavian | 4,676 | 0.4% |
| Zimbabwean | 13 | 0.0% | View All 169 Rows |
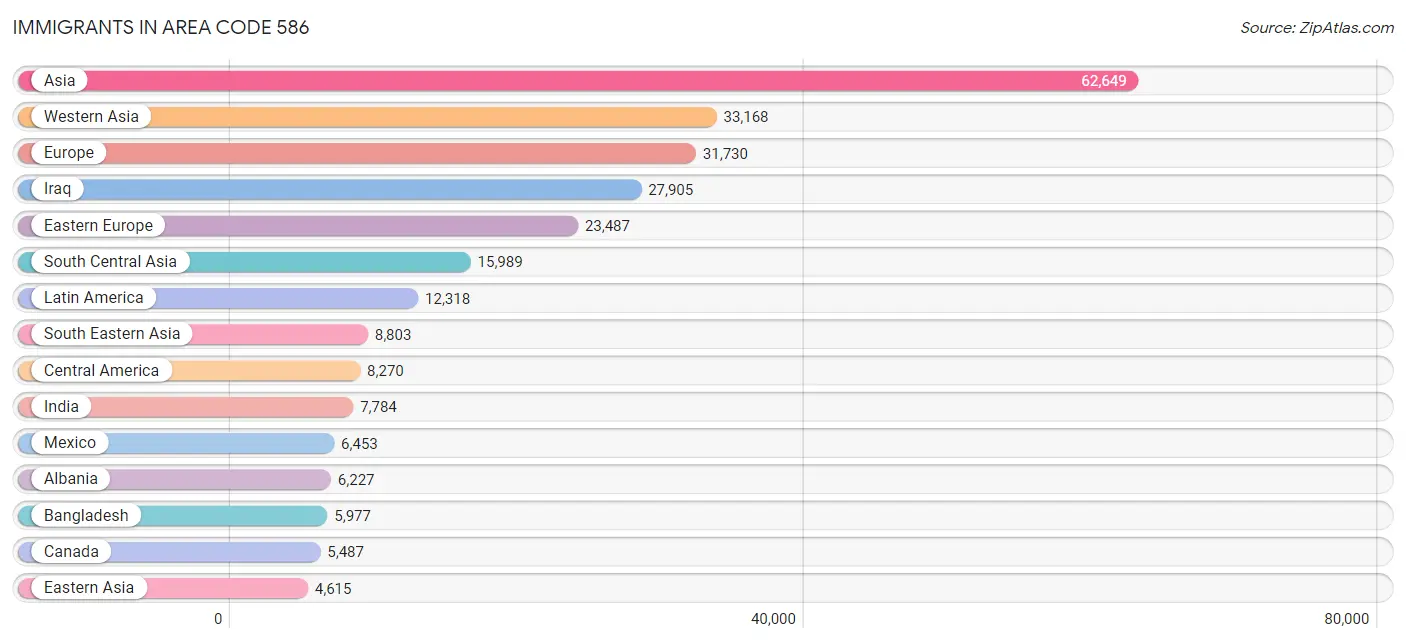
Immigrants in Area Code 586
The most numerous immigrant groups reported in Area Code 586 came from Asia (62,649 | 5.4%), Western Asia (33,168 | 2.9%), Europe (31,730 | 2.7%), Iraq (27,905 | 2.4%), and Eastern Europe (23,487 | 2.0%), together accounting for 15.4% of all Area Code 586 residents.
| Immigration Origin | # Population | % Population |
| Africa | 3,910 | 0.3% |
| Albania | 6,227 | 0.5% |
| Argentina | 66 | 0.0% |
| Armenia | 139 | 0.0% |
| Asia | 62,649 | 5.4% |
| Australia | 123 | 0.0% |
| Austria | 231 | 0.0% |
| Bahamas | 220 | 0.0% |
| Bangladesh | 5,977 | 0.5% |
| Belarus | 6 | 0.0% |
| Belgium | 80 | 0.0% |
| Belize | 22 | 0.0% |
| Bosnia and Herzegovina | 2,253 | 0.2% |
| Brazil | 700 | 0.1% |
| Bulgaria | 288 | 0.0% |
| Cambodia | 147 | 0.0% |
| Cameroon | 50 | 0.0% |
| Canada | 5,487 | 0.5% |
| Caribbean | 1,997 | 0.2% |
| Central America | 8,270 | 0.7% |
| Chile | 69 | 0.0% |
| China | 2,755 | 0.2% |
| Colombia | 520 | 0.0% |
| Congo | 8 | 0.0% |
| Costa Rica | 126 | 0.0% |
| Croatia | 208 | 0.0% |
| Cuba | 318 | 0.0% |
| Czechoslovakia | 238 | 0.0% |
| Denmark | 52 | 0.0% |
| Dominica | 23 | 0.0% |
| Dominican Republic | 199 | 0.0% |
| Eastern Africa | 535 | 0.1% |
| Eastern Asia | 4,615 | 0.4% |
| Eastern Europe | 23,487 | 2.0% |
| Ecuador | 263 | 0.0% |
| Egypt | 583 | 0.1% |
| El Salvador | 505 | 0.0% |
| England | 483 | 0.0% |
| Eritrea | 27 | 0.0% |
| Ethiopia | 112 | 0.0% |
| Europe | 31,730 | 2.7% |
| Fiji | 8 | 0.0% |
| France | 314 | 0.0% |
| Germany | 2,166 | 0.2% |
| Ghana | 305 | 0.0% |
| Greece | 731 | 0.1% |
| Guatemala | 140 | 0.0% |
| Guyana | 72 | 0.0% |
| Haiti | 116 | 0.0% |
| Honduras | 624 | 0.1% |
| Hong Kong | 195 | 0.0% |
| Hungary | 288 | 0.0% |
| India | 7,784 | 0.7% |
| Indonesia | 36 | 0.0% |
| Iran | 291 | 0.0% |
| Iraq | 27,905 | 2.4% |
| Ireland | 131 | 0.0% |
| Israel | 230 | 0.0% |
| Italy | 2,859 | 0.3% |
| Jamaica | 949 | 0.1% |
| Japan | 324 | 0.0% |
| Jordan | 829 | 0.1% |
| Kazakhstan | 145 | 0.0% |
| Kenya | 249 | 0.0% |
| Korea | 1,521 | 0.1% |
| Kuwait | 167 | 0.0% |
| Laos | 1,439 | 0.1% |
| Latin America | 12,318 | 1.1% |
| Latvia | 25 | 0.0% |
| Lebanon | 1,653 | 0.1% |
| Liberia | 204 | 0.0% |
| Lithuania | 199 | 0.0% |
| Malaysia | 143 | 0.0% |
| Mexico | 6,453 | 0.5% |
| Micronesia | 214 | 0.0% |
| Middle Africa | 80 | 0.0% |
| Moldova | 142 | 0.0% |
| Morocco | 81 | 0.0% |
| Nepal | 104 | 0.0% |
| Netherlands | 56 | 0.0% |
| Nicaragua | 260 | 0.0% |
| Nigeria | 1,213 | 0.1% |
| North Macedonia | 2,164 | 0.2% |
| Northern Africa | 851 | 0.1% |
| Northern Europe | 1,390 | 0.1% |
| Oceania | 398 | 0.0% |
| Pakistan | 1,505 | 0.1% |
| Panama | 140 | 0.0% |
| Peru | 69 | 0.0% |
| Philippines | 4,273 | 0.4% |
| Poland | 3,737 | 0.3% |
| Romania | 1,838 | 0.2% |
| Russia | 761 | 0.1% |
| Saudi Arabia | 110 | 0.0% |
| Scotland | 203 | 0.0% |
| Senegal | 214 | 0.0% |
| Serbia | 473 | 0.0% |
| Singapore | 14 | 0.0% |
| South Africa | 138 | 0.0% |
| South America | 2,051 | 0.2% |
| South Central Asia | 15,989 | 1.4% |
| South Eastern Asia | 8,803 | 0.8% |
| Southern Europe | 3,801 | 0.3% |
| Spain | 92 | 0.0% |
| Sri Lanka | 90 | 0.0% |
| St. Vincent and the Grenadines | 22 | 0.0% |
| Sudan | 21 | 0.0% |
| Sweden | 11 | 0.0% |
| Switzerland | 101 | 0.0% |
| Syria | 1,199 | 0.1% |
| Taiwan | 269 | 0.0% |
| Thailand | 621 | 0.1% |
| Trinidad and Tobago | 57 | 0.0% |
| Turkey | 270 | 0.0% |
| Uganda | 19 | 0.0% |
| Ukraine | 1,753 | 0.2% |
| Uruguay | 38 | 0.0% |
| Uzbekistan | 68 | 0.0% |
| Venezuela | 254 | 0.0% |
| Vietnam | 2,059 | 0.2% |
| Western Africa | 2,054 | 0.2% |
| Western Asia | 33,168 | 2.9% |
| Western Europe | 2,948 | 0.3% |
| Yemen | 189 | 0.0% |
| Zaire | 6 | 0.0% |
| Zimbabwe | 20 | 0.0% | View All 126 Rows |
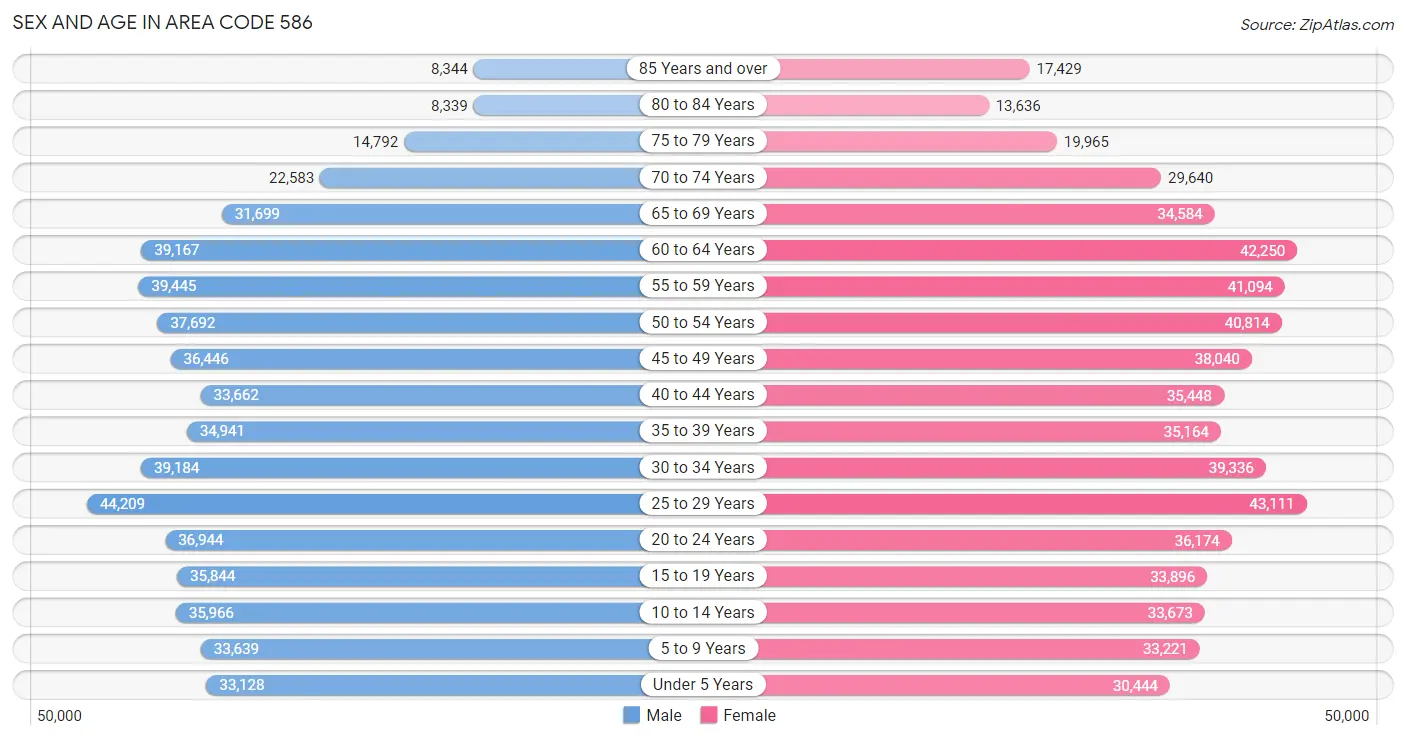
Sex and Age in Area Code 586
Sex and Age in Area Code 586
The most populous age groups in Area Code 586 are 25 to 29 Years (44,209 | 7.8%) for men and 25 to 29 Years (43,111 | 7.2%) for women.
| Age Bracket | Male | Female |
| Under 5 Years | 33,128 (5.9%) | 30,444 (5.1%) |
| 5 to 9 Years | 33,639 (5.9%) | 33,221 (5.6%) |
| 10 to 14 Years | 35,966 (6.4%) | 33,673 (5.6%) |
| 15 to 19 Years | 35,844 (6.3%) | 33,896 (5.7%) |
| 20 to 24 Years | 36,944 (6.5%) | 36,174 (6.0%) |
| 25 to 29 Years | 44,209 (7.8%) | 43,111 (7.2%) |
| 30 to 34 Years | 39,184 (6.9%) | 39,336 (6.6%) |
| 35 to 39 Years | 34,941 (6.2%) | 35,164 (5.9%) |
| 40 to 44 Years | 33,662 (5.9%) | 35,448 (5.9%) |
| 45 to 49 Years | 36,446 (6.4%) | 38,040 (6.4%) |
| 50 to 54 Years | 37,692 (6.7%) | 40,814 (6.8%) |
| 55 to 59 Years | 39,445 (7.0%) | 41,094 (6.9%) |
| 60 to 64 Years | 39,167 (6.9%) | 42,250 (7.1%) |
| 65 to 69 Years | 31,699 (5.6%) | 34,584 (5.8%) |
| 70 to 74 Years | 22,583 (4.0%) | 29,640 (5.0%) |
| 75 to 79 Years | 14,792 (2.6%) | 19,965 (3.3%) |
| 80 to 84 Years | 8,339 (1.5%) | 13,636 (2.3%) |
| 85 Years and over | 8,344 (1.5%) | 17,429 (2.9%) |
| Total | 566,024 (100.0%) | 597,919 (100.0%) |
Families and Households in Area Code 586
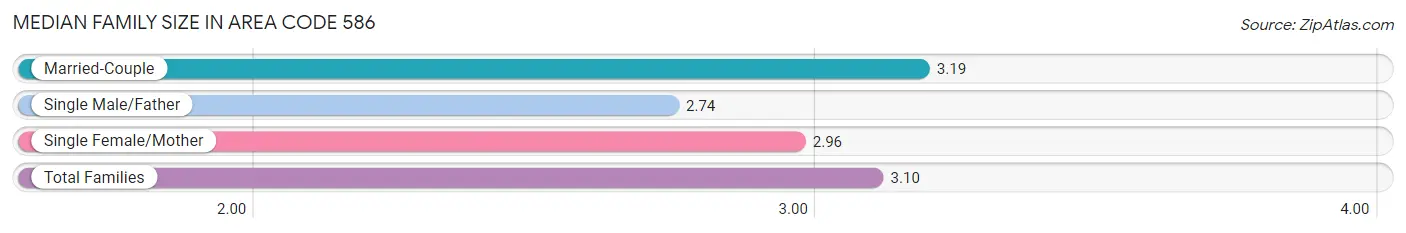
Median Family Size in Area Code 586
The median family size in Area Code 586 is 3.10 persons per family, with married-couple families (193,014 | 66.7%) accounting for the largest median family size of 3.185 persons per family. On the other hand, single male/father families (25,379 | 8.8%) represent the smallest median family size with 2.74 persons per family.
| Family Type | # Families | Family Size |
| Married-Couple | 193,014 (66.7%) | 3.19 |
| Single Male/Father | 25,379 (8.8%) | 2.74 |
| Single Female/Mother | 70,831 (24.5%) | 2.96 |
| Total Families | 289,224 (100.0%) | 3.10 |
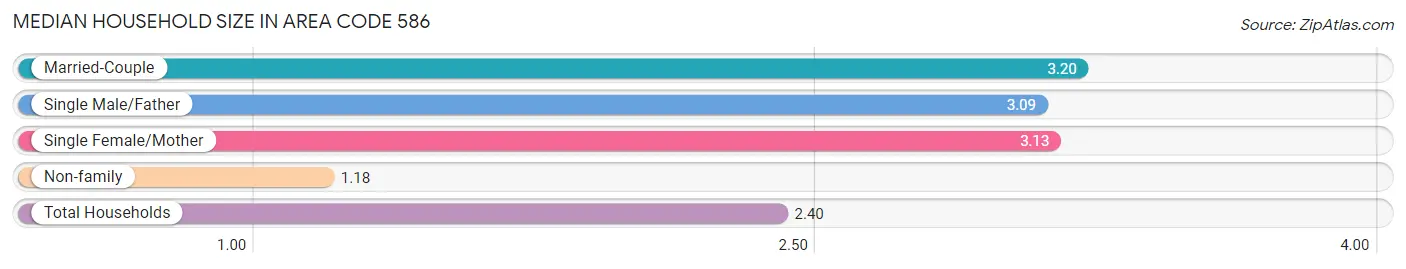
Median Household Size in Area Code 586
The median household size in Area Code 586 is 2.40 persons per household, with married-couple households (193,014 | 40.5%) accounting for the largest median household size of 3.20166 persons per household. non-family households (187,163 | 39.3%) represent the smallest median household size with 1.18 persons per household.
| Household Type | # Households | Household Size |
| Married-Couple | 193,014 (40.5%) | 3.20 |
| Single Male/Father | 25,379 (5.3%) | 3.09 |
| Single Female/Mother | 70,831 (14.9%) | 3.13 |
| Non-family | 187,163 (39.3%) | 1.18 |
| Total Households | 476,387 (100.0%) | 2.40 |
Household Size by Marriage Status in Area Code 586
Out of a total of 476,387 households in Area Code 586, 289,224 (60.7%) are family households, while 187,163 (39.3%) are nonfamily households. The most numerous type of family households are 2-person households, comprising 127,159, and the most common type of nonfamily households are 1-person households, comprising 159,358.
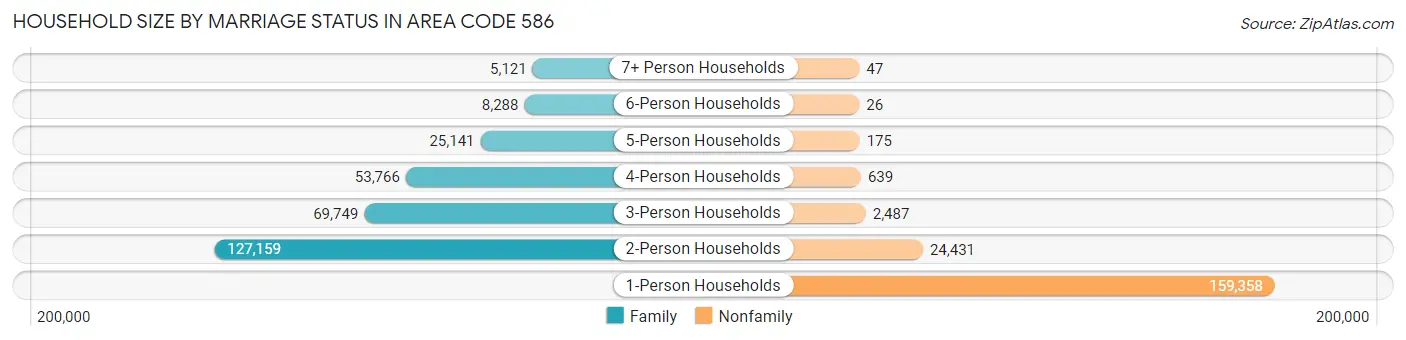
| Household Size | Family Households | Nonfamily Households |
| 1-Person Households | - | 159,358 (33.5%) |
| 2-Person Households | 127,159 (26.7%) | 24,431 (5.1%) |
| 3-Person Households | 69,749 (14.6%) | 2,487 (0.5%) |
| 4-Person Households | 53,766 (11.3%) | 639 (0.1%) |
| 5-Person Households | 25,141 (5.3%) | 175 (0.0%) |
| 6-Person Households | 8,288 (1.7%) | 26 (0.0%) |
| 7+ Person Households | 5,121 (1.1%) | 47 (0.0%) |
| Total | 289,224 (60.7%) | 187,163 (39.3%) |
Female Fertility in Area Code 586
Fertility by Age in Area Code 586
Average fertility rate in Area Code 586 is 51.8 births per 1,000 women. Women in the age bracket of 20 to 34 years have the highest fertility rate with 89.1 births per 1,000 women. Women in the age bracket of 20 to 34 years acount for 72.5% of all women with births.
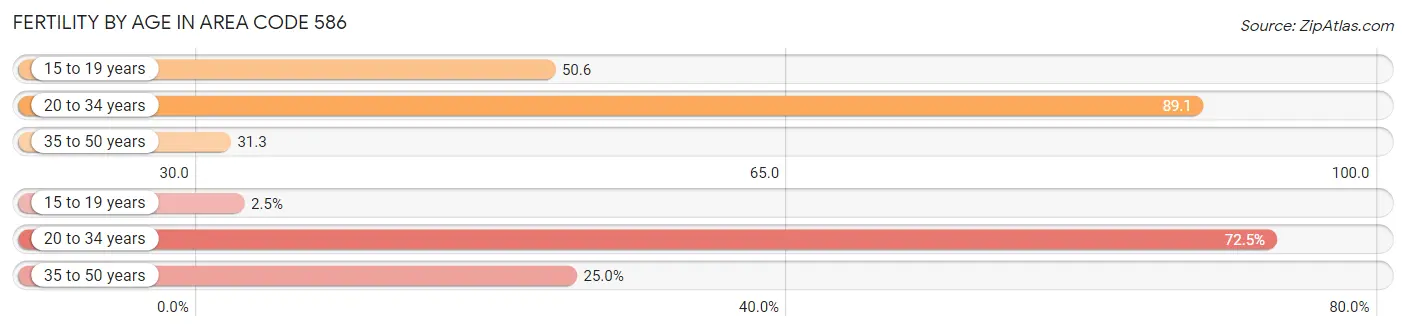
| Age Bracket | Women with Births | Births / 1,000 Women |
| 15 to 19 years | 334 (2.5%) | 50.6 |
| 20 to 34 years | 9,878 (72.5%) | 89.1 |
| 35 to 50 years | 3,406 (25.0%) | 31.3 |
| Total | 13,618 (100.0%) | 51.8 |
Fertility by Age by Marriage Status in Area Code 586
62.1% of women with births (13,618) in Area Code 586 are married. The highest percentage of unmarried women with births falls into 15 to 19 years age bracket with 97.3% of them unmarried at the time of birth, while the lowest percentage of unmarried women with births belong to 20 to 34 years age bracket with 40.8% of them unmarried.
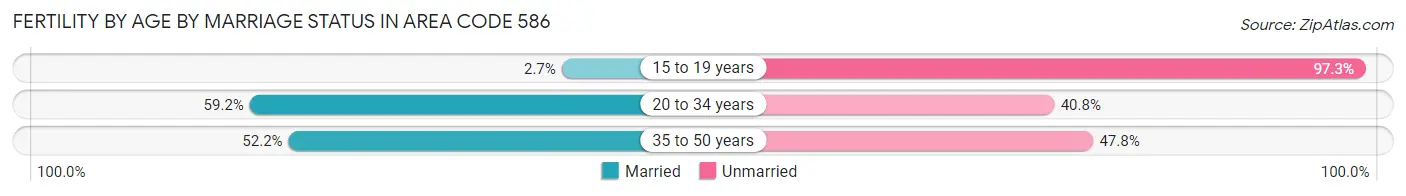
| Age Bracket | Married | Unmarried |
| 15 to 19 years | 9 (2.7%) | 325 (97.3%) |
| 20 to 34 years | 5,850 (59.2%) | 4,028 (40.8%) |
| 35 to 50 years | 1,778 (52.2%) | 1,628 (47.8%) |
| Total | 8,459 (62.1%) | 5,159 (37.9%) |
Fertility by Education in Area Code 586
Average fertility rate in Area Code 586 is 51.8 births per 1,000 women. Women with the education attainment of graduate degree have the highest fertility rate of 87.7 births per 1,000 women, while women with the education attainment of high school diploma have the lowest fertility at 50.9 births per 1,000 women. Women with the education attainment of college or associate's degree represent 35.1% of all women with births.
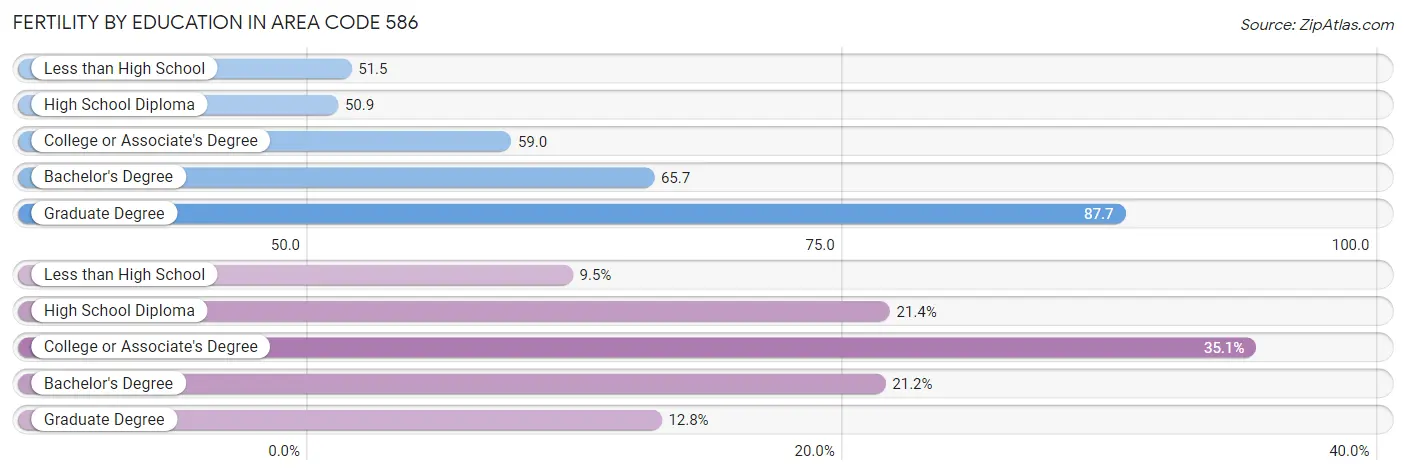
| Educational Attainment | Women with Births | Births / 1,000 Women |
| Less than High School | 1,293 (9.5%) | 51.5 |
| High School Diploma | 2,910 (21.4%) | 50.9 |
| College or Associate's Degree | 4,780 (35.1%) | 59.0 |
| Bachelor's Degree | 2,889 (21.2%) | 65.7 |
| Graduate Degree | 1,746 (12.8%) | 87.7 |
| Total | 13,618 (100.0%) | 51.8 |
Fertility by Education by Marriage Status in Area Code 586
37.9% of women with births in Area Code 586 are unmarried. Women with the educational attainment of bachelor's degree are most likely to be married with 54.6% of them married at childbirth, while women with the educational attainment of less than high school are least likely to be married with 85.7% of them unmarried at childbirth.
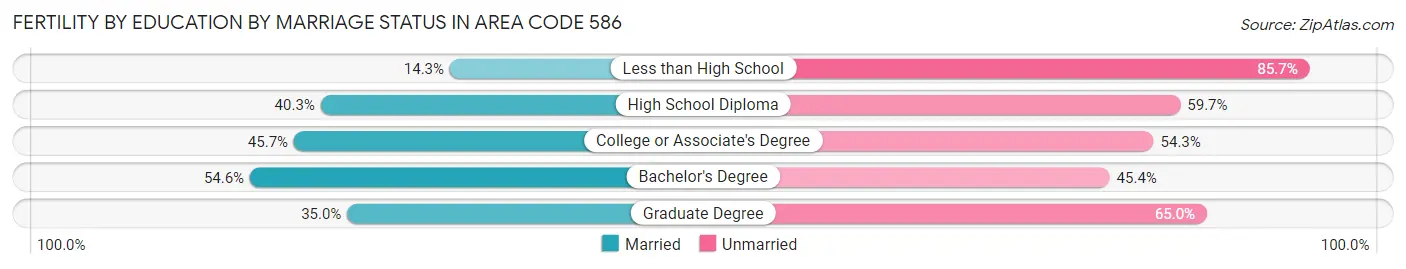
| Educational Attainment | Married | Unmarried |
| Less than High School | 185 (14.3%) | 1,108 (85.7%) |
| High School Diploma | 1,174 (40.3%) | 1,736 (59.7%) |
| College or Associate's Degree | 2,186 (45.7%) | 2,594 (54.3%) |
| Bachelor's Degree | 1,577 (54.6%) | 1,312 (45.4%) |
| Graduate Degree | 611 (35.0%) | 1,135 (65.0%) |
| Total | 8,459 (62.1%) | 5,159 (37.9%) |
Employment Characteristics in Area Code 586
Employment by Class of Employer in Area Code 586
Among the 539,927 employed individuals in Area Code 586, private company employees (400,085 | 74.1%), not-for-profit organizations (45,325 | 8.4%), and local government employees (29,589 | 5.5%) make up the most common classes of employment.
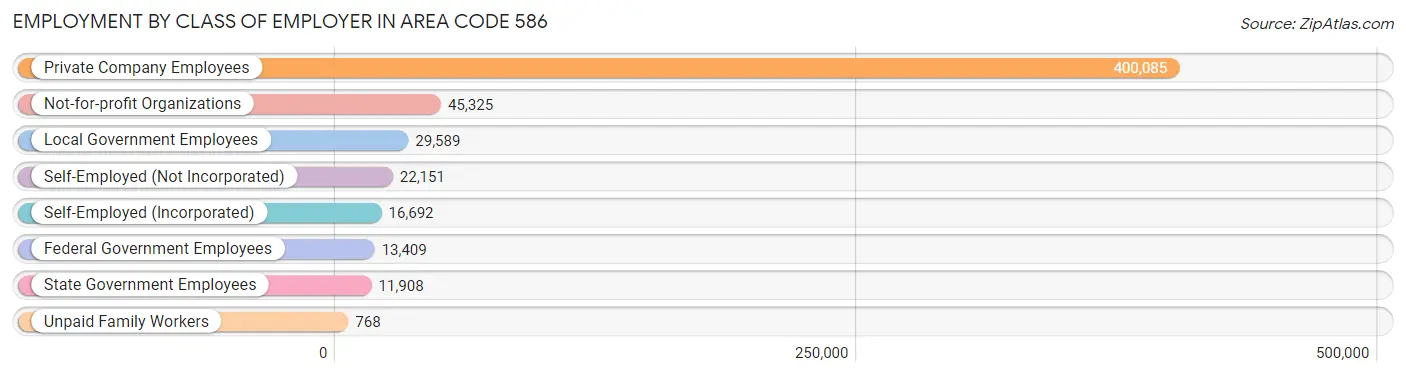
| Employer Class | # Employees | % Employees |
| Private Company Employees | 400,085 | 74.1% |
| Self-Employed (Incorporated) | 16,692 | 3.1% |
| Self-Employed (Not Incorporated) | 22,151 | 4.1% |
| Not-for-profit Organizations | 45,325 | 8.4% |
| Local Government Employees | 29,589 | 5.5% |
| State Government Employees | 11,908 | 2.2% |
| Federal Government Employees | 13,409 | 2.5% |
| Unpaid Family Workers | 768 | 0.1% |
| Total | 539,927 | 100.0% |
Employment Status by Age in Area Code 586
According to the labor force statistics for Area Code 586, out of the total population over 16 years of age (949,917), 62.2% or 590,753 individuals are in the labor force, with 6.5% or 38,635 of them unemployed. The age group with the highest labor force participation rate is 25 to 29 years, with 84.2% or 73,506 individuals in the labor force. Within the labor force, the 16 to 19 years age range has the highest percentage of unemployed individuals, with 972.6% or 242,421 of them being unemployed.
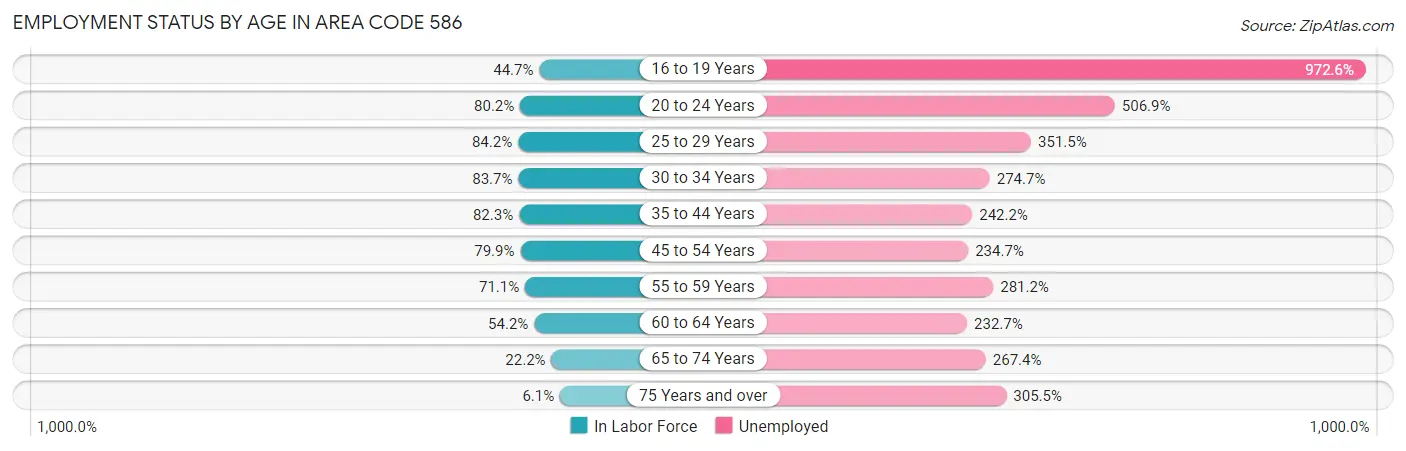
| Age Bracket | In Labor Force | Unemployed |
| 16 to 19 Years | 24,927 (44.7%) | 242,421 (972.6%) |
| 20 to 24 Years | 58,660 (80.2%) | 297,363 (506.9%) |
| 25 to 29 Years | 73,505 (84.2%) | 258,374 (351.5%) |
| 30 to 34 Years | 65,720 (83.7%) | 180,536 (274.7%) |
| 35 to 44 Years | 114,586 (82.3%) | 277,532 (242.2%) |
| 45 to 54 Years | 122,228 (79.9%) | 286,862 (234.7%) |
| 55 to 59 Years | 57,253 (71.1%) | 161,001 (281.2%) |
| 60 to 64 Years | 44,135 (54.2%) | 102,704 (232.7%) |
| 65 to 74 Years | 26,264 (22.2%) | 70,222 (267.4%) |
| 75 Years and over | 5,058 (6.1%) | 15,452 (305.5%) |
| Total | 590,769 (62.2%) | 38,608 (6.5%) |
Employment Status by Educational Attainment in Area Code 586
According to labor force statistics for Area Code 586, 77.0% of individuals (477,216) out of the total population between 25 and 64 years of age (620,003) are in the labor force, with 261.7% or 1,248,874 of them being unemployed. The group with the highest labor force participation rate are those with the educational attainment of bachelor's degree or higher, with 86.8% or 153,418 individuals in the labor force. Within the labor force, individuals with less than high school education have the highest percentage of unemployment, with 434.7% or 129,728 of them being unemployed.
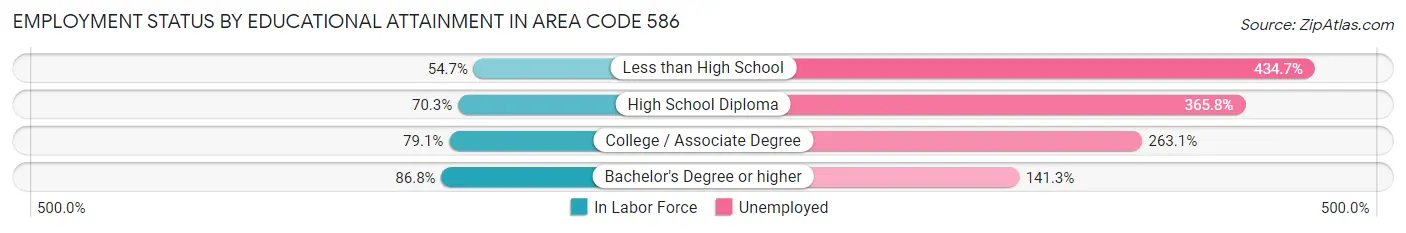
| Educational Attainment | In Labor Force | Unemployed |
| Less than High School | 29,845 (54.7%) | 237,251 (434.7%) |
| High School Diploma | 117,671 (70.3%) | 612,057 (365.8%) |
| College / Associate Degree | 175,118 (79.1%) | 582,335 (263.1%) |
| Bachelor's Degree or higher | 153,413 (86.8%) | 249,775 (141.3%) |
| Total | 477,221 (77.0%) | 1,622,548 (261.7%) |
Employment Occupations by Sex in Area Code 586
Management, Business, Science and Arts Occupations
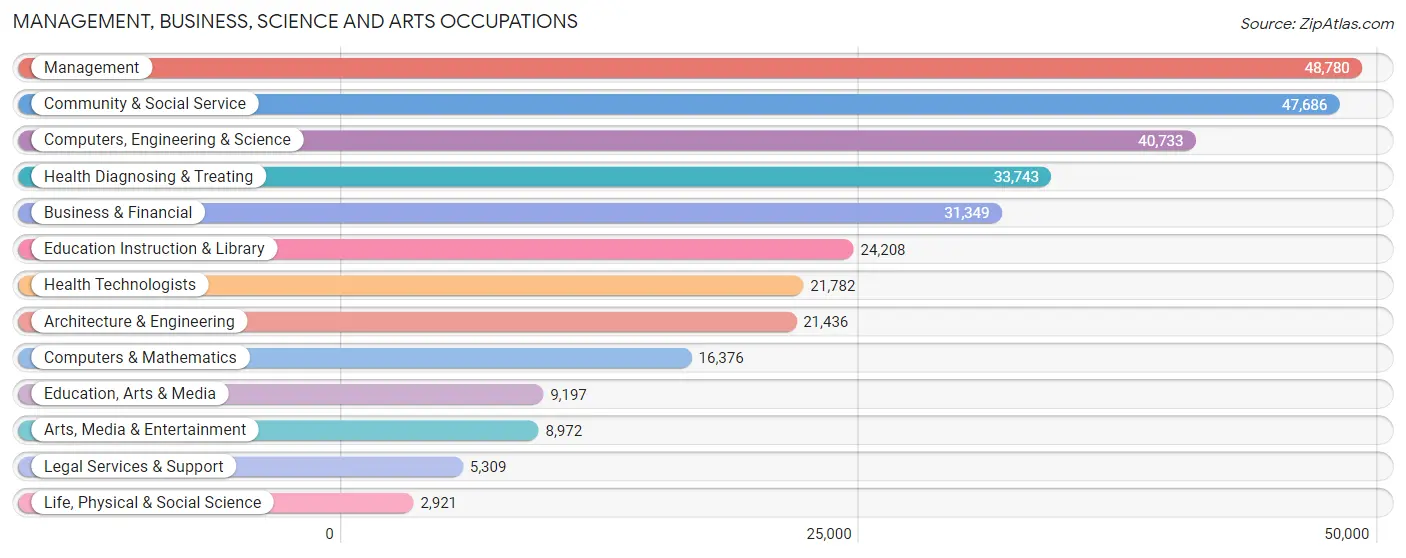
The most common Management, Business, Science and Arts occupations in Area Code 586 are Management (48,780 | 8.8%), Community & Social Service (47,686 | 8.6%), Computers, Engineering & Science (40,733 | 7.3%), Health Diagnosing & Treating (33,743 | 6.1%), and Business & Financial (31,349 | 5.6%).
Management, Business, Science and Arts Occupations by Sex
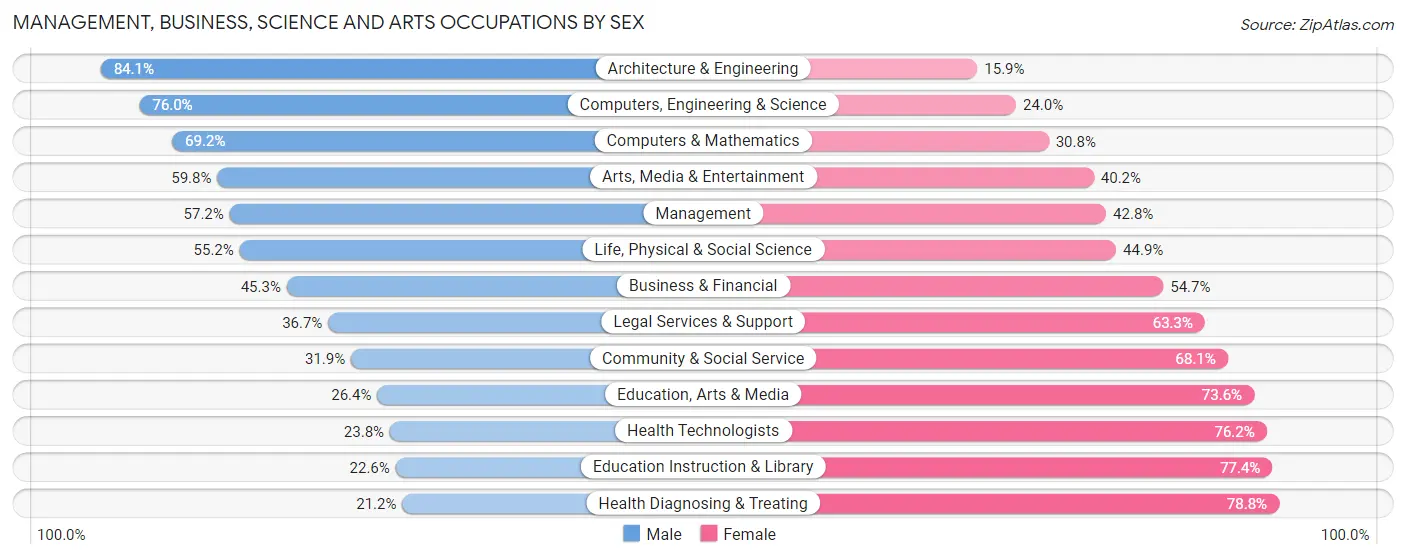
Within the Management, Business, Science and Arts occupations in Area Code 586, the most male-oriented occupations are Architecture & Engineering (84.1%), Computers, Engineering & Science (76.0%), and Computers & Mathematics (69.2%), while the most female-oriented occupations are Health Diagnosing & Treating (78.8%), Education Instruction & Library (77.4%), and Health Technologists (76.2%).
| Occupation | Male | Female |
| Management | 27,921 (57.2%) | 20,859 (42.8%) |
| Business & Financial | 14,207 (45.3%) | 17,142 (54.7%) |
| Computers, Engineering & Science | 30,975 (76.0%) | 9,758 (24.0%) |
| Computers & Mathematics | 11,335 (69.2%) | 5,041 (30.8%) |
| Architecture & Engineering | 18,029 (84.1%) | 3,407 (15.9%) |
| Life, Physical & Social Science | 1,611 (55.1%) | 1,310 (44.9%) |
| Community & Social Service | 15,218 (31.9%) | 32,468 (68.1%) |
| Education, Arts & Media | 2,431 (26.4%) | 6,766 (73.6%) |
| Legal Services & Support | 1,947 (36.7%) | 3,362 (63.3%) |
| Education Instruction & Library | 5,474 (22.6%) | 18,734 (77.4%) |
| Arts, Media & Entertainment | 5,366 (59.8%) | 3,606 (40.2%) |
| Health Diagnosing & Treating | 7,157 (21.2%) | 26,586 (78.8%) |
| Health Technologists | 5,183 (23.8%) | 16,599 (76.2%) |
| Total (Category) | 95,478 (47.2%) | 106,813 (52.8%) |
| Total (Overall) | 286,624 (51.6%) | 268,870 (48.4%) |
Services Occupations
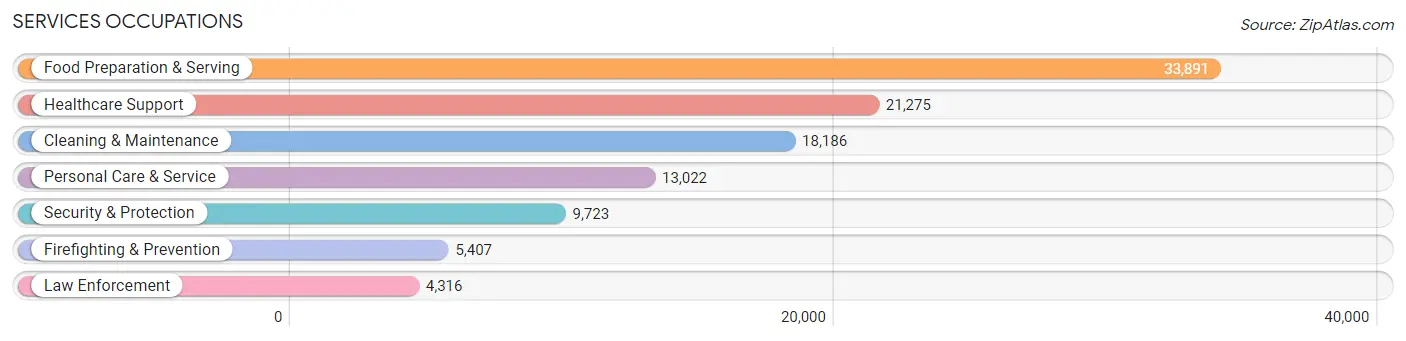
The most common Services occupations in Area Code 586 are Food Preparation & Serving (33,891 | 6.1%), Healthcare Support (21,275 | 3.8%), Cleaning & Maintenance (18,186 | 3.3%), Personal Care & Service (13,022 | 2.3%), and Security & Protection (9,723 | 1.8%).
Services Occupations by Sex
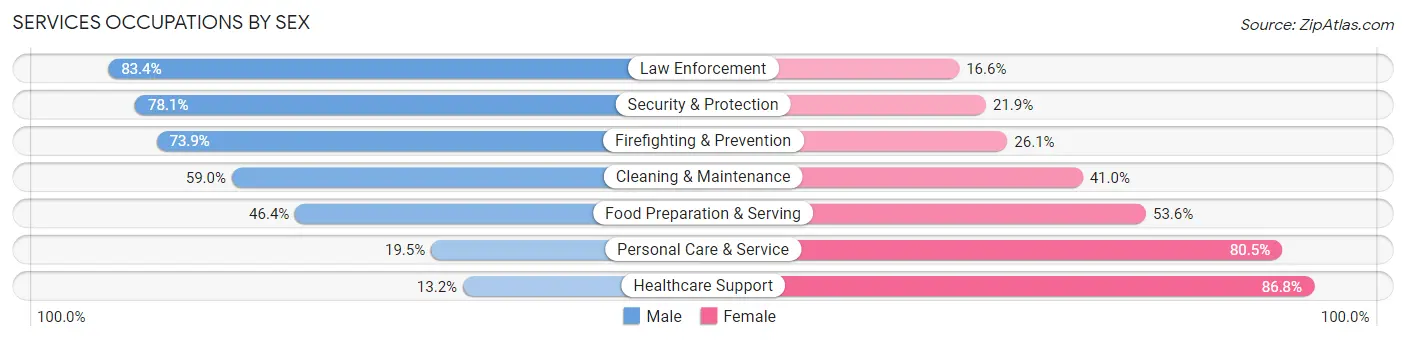
Within the Services occupations in Area Code 586, the most male-oriented occupations are Law Enforcement (83.4%), Security & Protection (78.1%), and Firefighting & Prevention (73.9%), while the most female-oriented occupations are Healthcare Support (86.8%), Personal Care & Service (80.5%), and Food Preparation & Serving (53.6%).
| Occupation | Male | Female |
| Healthcare Support | 2,811 (13.2%) | 18,464 (86.8%) |
| Security & Protection | 7,596 (78.1%) | 2,127 (21.9%) |
| Firefighting & Prevention | 3,995 (73.9%) | 1,412 (26.1%) |
| Law Enforcement | 3,601 (83.4%) | 715 (16.6%) |
| Food Preparation & Serving | 15,736 (46.4%) | 18,155 (53.6%) |
| Cleaning & Maintenance | 10,724 (59.0%) | 7,462 (41.0%) |
| Personal Care & Service | 2,542 (19.5%) | 10,480 (80.5%) |
| Total (Category) | 39,409 (41.0%) | 56,688 (59.0%) |
| Total (Overall) | 286,624 (51.6%) | 268,870 (48.4%) |
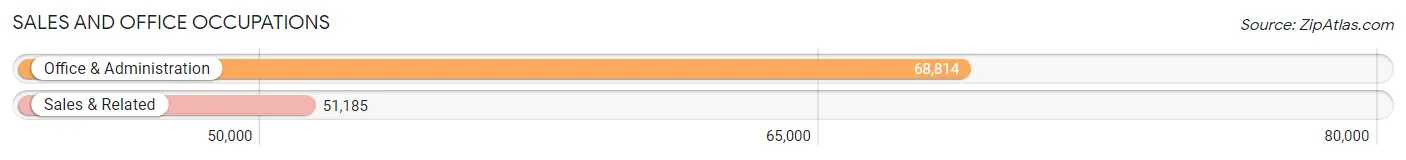
Sales and Office Occupations
The most common Sales and Office occupations in Area Code 586 are Office & Administration (68,814 | 12.4%), and Sales & Related (51,185 | 9.2%).
Sales and Office Occupations by Sex
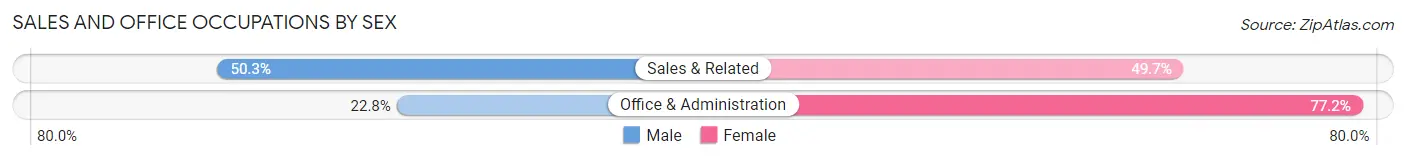
| Occupation | Male | Female |
| Sales & Related | 25,752 (50.3%) | 25,433 (49.7%) |
| Office & Administration | 15,667 (22.8%) | 53,147 (77.2%) |
| Total (Category) | 41,419 (34.5%) | 78,580 (65.5%) |
| Total (Overall) | 286,624 (51.6%) | 268,870 (48.4%) |
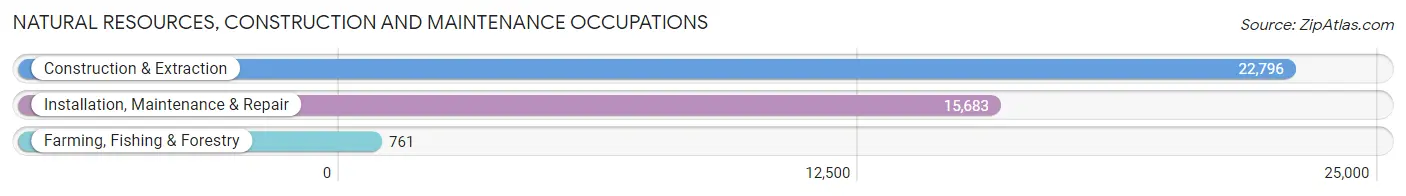
Natural Resources, Construction and Maintenance Occupations
The most common Natural Resources, Construction and Maintenance occupations in Area Code 586 are Construction & Extraction (22,796 | 4.1%), Installation, Maintenance & Repair (15,683 | 2.8%), and Farming, Fishing & Forestry (761 | 0.1%).
Natural Resources, Construction and Maintenance Occupations by Sex
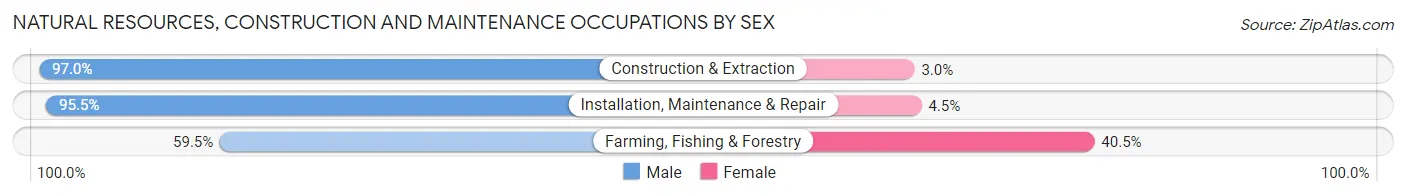
| Occupation | Male | Female |
| Farming, Fishing & Forestry | 453 (59.5%) | 308 (40.5%) |
| Construction & Extraction | 22,107 (97.0%) | 689 (3.0%) |
| Installation, Maintenance & Repair | 14,980 (95.5%) | 703 (4.5%) |
| Total (Category) | 37,540 (95.7%) | 1,700 (4.3%) |
| Total (Overall) | 286,624 (51.6%) | 268,870 (48.4%) |
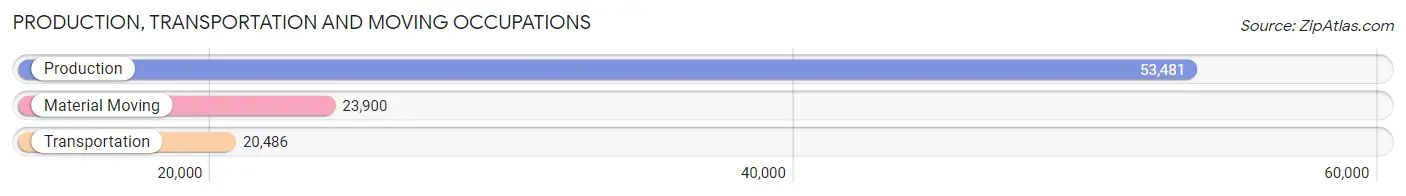
Production, Transportation and Moving Occupations
The most common Production, Transportation and Moving occupations in Area Code 586 are Production (53,481 | 9.6%), Material Moving (23,900 | 4.3%), and Transportation (20,486 | 3.7%).
Production, Transportation and Moving Occupations by Sex
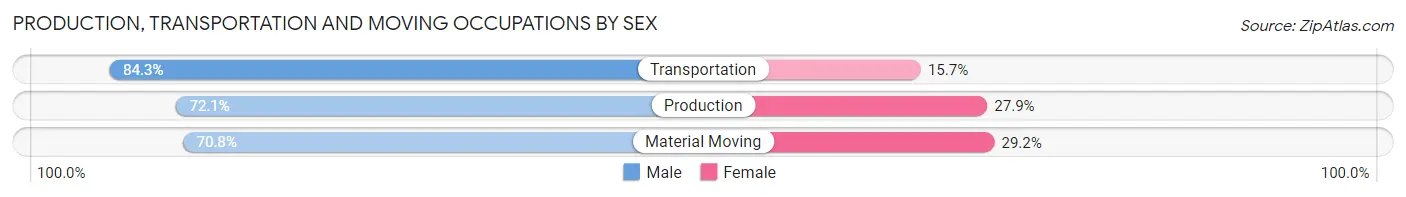
| Occupation | Male | Female |
| Production | 38,580 (72.1%) | 14,901 (27.9%) |
| Transportation | 17,273 (84.3%) | 3,213 (15.7%) |
| Material Moving | 16,925 (70.8%) | 6,975 (29.2%) |
| Total (Category) | 72,778 (74.4%) | 25,089 (25.6%) |
| Total (Overall) | 286,624 (51.6%) | 268,870 (48.4%) |
Employment Industries by Sex in Area Code 586
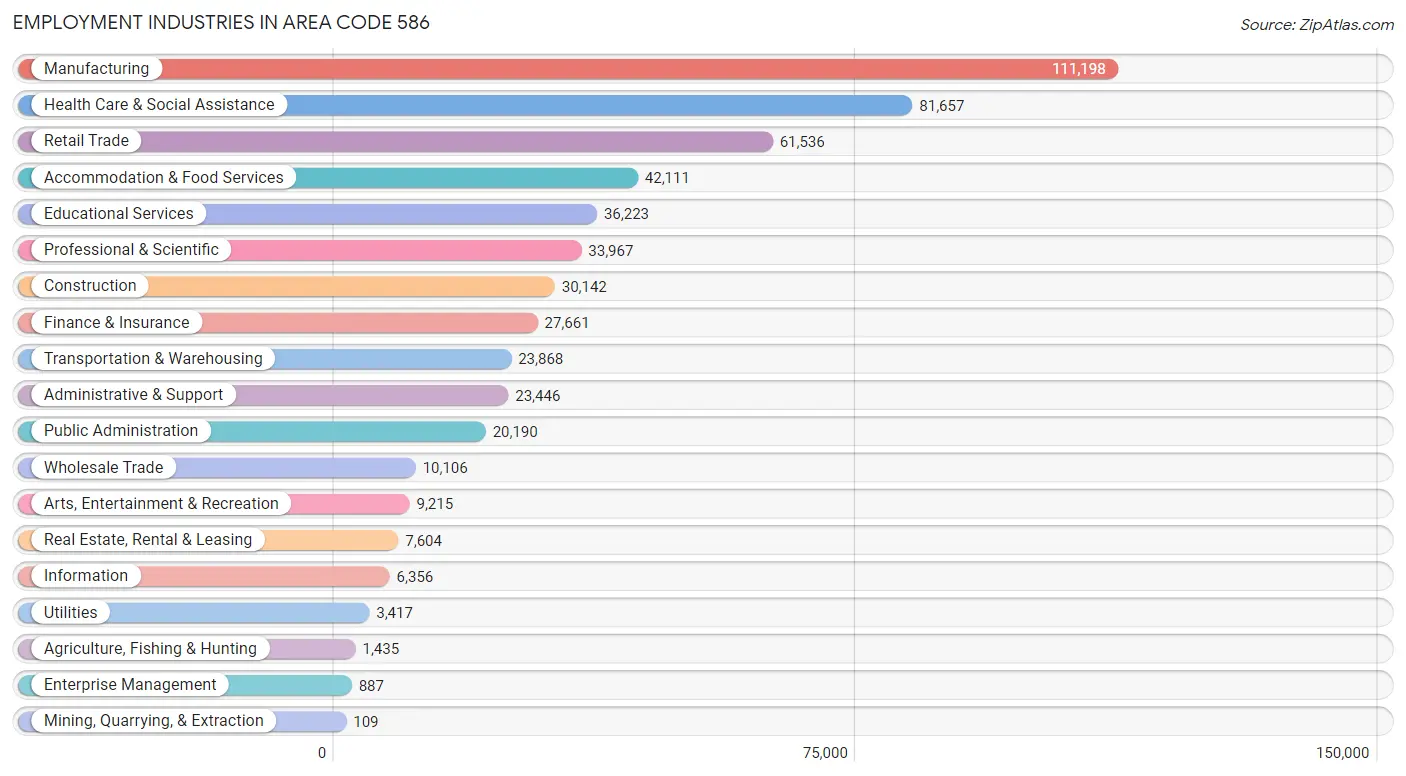
Employment Industries in Area Code 586
The major employment industries in Area Code 586 include Manufacturing (111,198 | 20.0%), Health Care & Social Assistance (81,657 | 14.7%), Retail Trade (61,536 | 11.1%), Accommodation & Food Services (42,111 | 7.6%), and Educational Services (36,223 | 6.5%).
Employment Industries by Sex in Area Code 586
The Area Code 586 industries that see more men than women are Construction (89.9%), Mining, Quarrying, & Extraction (78.0%), and Manufacturing (73.2%), whereas the industries that tend to have a higher number of women are Health Care & Social Assistance (81.6%), Educational Services (73.1%), and Finance & Insurance (63.0%).
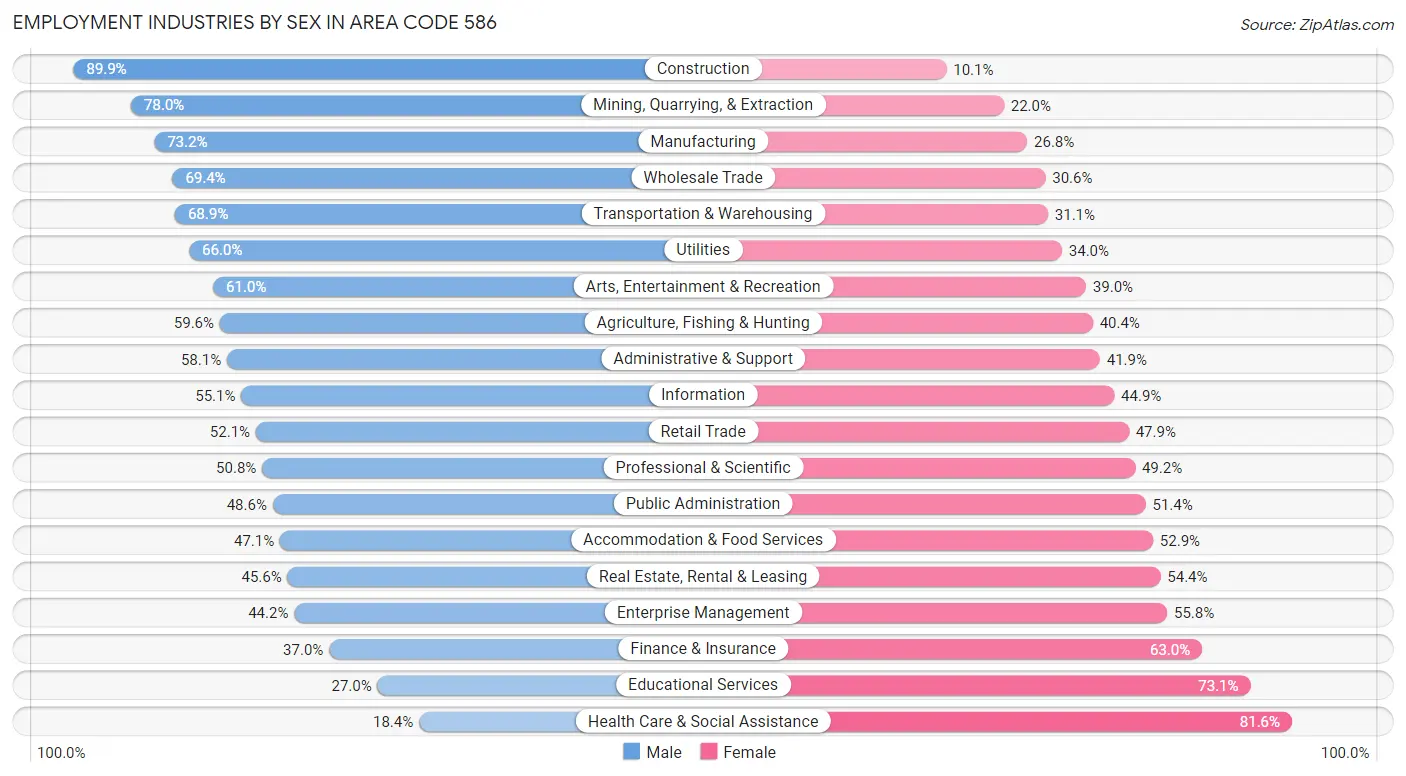
| Industry | Male | Female |
| Agriculture, Fishing & Hunting | 855 (59.6%) | 580 (40.4%) |
| Mining, Quarrying, & Extraction | 85 (78.0%) | 24 (22.0%) |
| Construction | 27,095 (89.9%) | 3,047 (10.1%) |
| Manufacturing | 81,356 (73.2%) | 29,842 (26.8%) |
| Wholesale Trade | 7,013 (69.4%) | 3,093 (30.6%) |
| Retail Trade | 32,071 (52.1%) | 29,465 (47.9%) |
| Transportation & Warehousing | 16,436 (68.9%) | 7,432 (31.1%) |
| Utilities | 2,254 (66.0%) | 1,163 (34.0%) |
| Information | 3,505 (55.1%) | 2,851 (44.9%) |
| Finance & Insurance | 10,223 (37.0%) | 17,438 (63.0%) |
| Real Estate, Rental & Leasing | 3,466 (45.6%) | 4,138 (54.4%) |
| Professional & Scientific | 17,267 (50.8%) | 16,700 (49.2%) |
| Enterprise Management | 392 (44.2%) | 495 (55.8%) |
| Administrative & Support | 13,625 (58.1%) | 9,821 (41.9%) |
| Educational Services | 9,762 (27.0%) | 26,461 (73.1%) |
| Health Care & Social Assistance | 14,993 (18.4%) | 66,664 (81.6%) |
| Arts, Entertainment & Recreation | 5,620 (61.0%) | 3,595 (39.0%) |
| Accommodation & Food Services | 19,843 (47.1%) | 22,268 (52.9%) |
| Public Administration | 9,820 (48.6%) | 10,370 (51.4%) |
| Total | 286,624 (51.6%) | 268,870 (48.4%) |
Education in Area Code 586
School Enrollment in Area Code 586
The most common levels of schooling among the 260,869 students in Area Code 586 are high school (60,127 | 23.1%), college / undergraduate (54,427 | 20.9%), and middle school (53,649 | 20.6%).
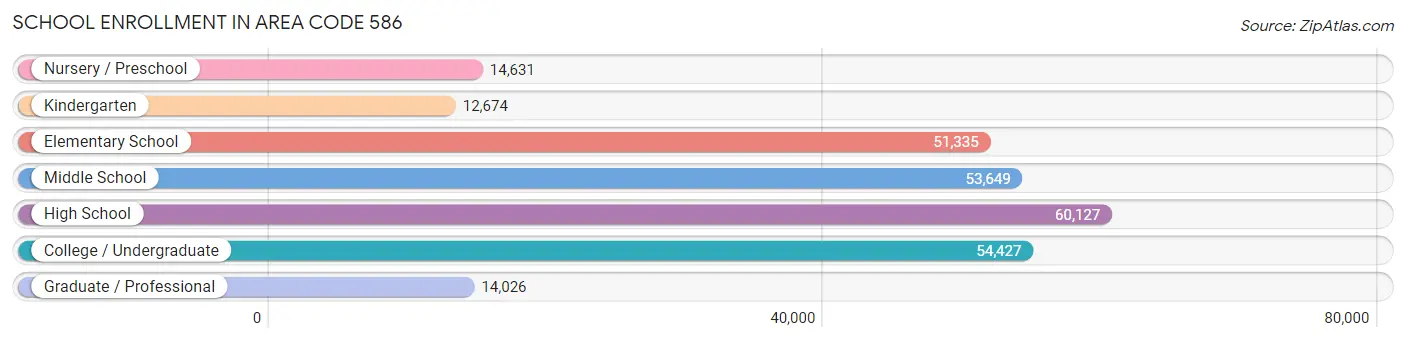
| School Level | # Students | % Students |
| Nursery / Preschool | 14,631 | 5.6% |
| Kindergarten | 12,674 | 4.9% |
| Elementary School | 51,335 | 19.7% |
| Middle School | 53,649 | 20.6% |
| High School | 60,127 | 23.1% |
| College / Undergraduate | 54,427 | 20.9% |
| Graduate / Professional | 14,026 | 5.4% |
| Total | 260,869 | 100.0% |
School Enrollment by Age by Funding Source in Area Code 586
Out of a total of 260,869 students who are enrolled in schools in Area Code 586, 33,635 (12.9%) attend a private institution, while the remaining 227,234 (87.1%) are enrolled in public schools. The age group of 3 to 4 year olds has the highest likelihood of being enrolled in private schools, with 3,323 (30.1% in the age bracket) enrolled. Conversely, the age group of 10 to 14 year olds has the lowest likelihood of being enrolled in a private school, with 61,457 (91.1% in the age bracket) attending a public institution.
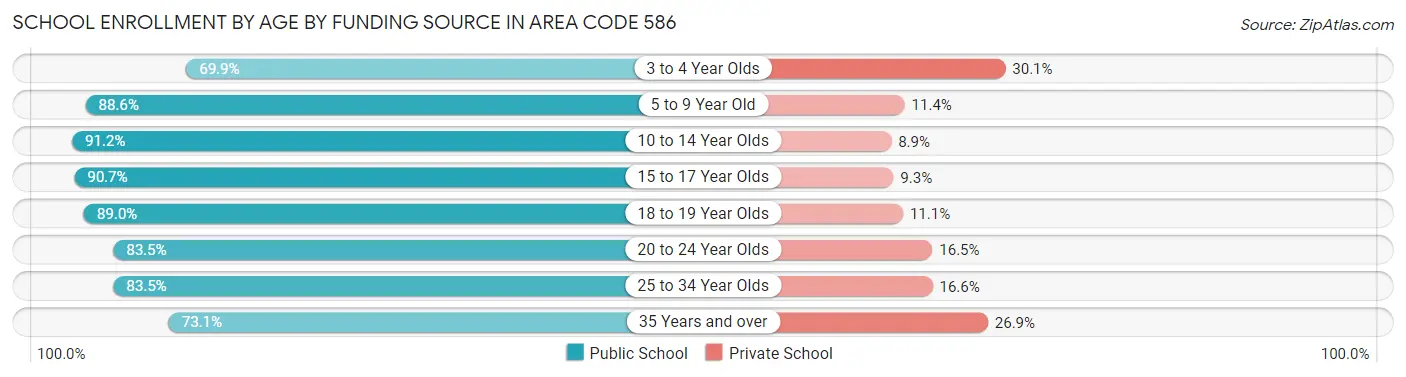
| Age Bracket | Public School | Private School |
| 3 to 4 Year Olds | 7,711 (69.9%) | 3,323 (30.1%) |
| 5 to 9 Year Old | 55,730 (88.6%) | 7,143 (11.4%) |
| 10 to 14 Year Olds | 61,457 (91.1%) | 5,966 (8.8%) |
| 15 to 17 Year Olds | 38,480 (90.7%) | 3,928 (9.3%) |
| 18 to 19 Year Olds | 15,627 (88.9%) | 1,942 (11.1%) |
| 20 to 24 Year Olds | 22,539 (83.5%) | 4,459 (16.5%) |
| 25 to 34 Year Olds | 15,231 (83.5%) | 3,021 (16.6%) |
| 35 Years and over | 10,468 (73.1%) | 3,844 (26.9%) |
| Total | 227,234 (87.1%) | 33,635 (12.9%) |
Educational Attainment by Field of Study in Area Code 586
Business (54,481 | 23.2%), science & technology (28,262 | 12.0%), education (26,807 | 11.4%), engineering (23,921 | 10.2%), and arts & humanities (17,347 | 7.4%) are the most common fields of study among 234,587 individuals in Area Code 586 who have obtained a bachelor's degree or higher.
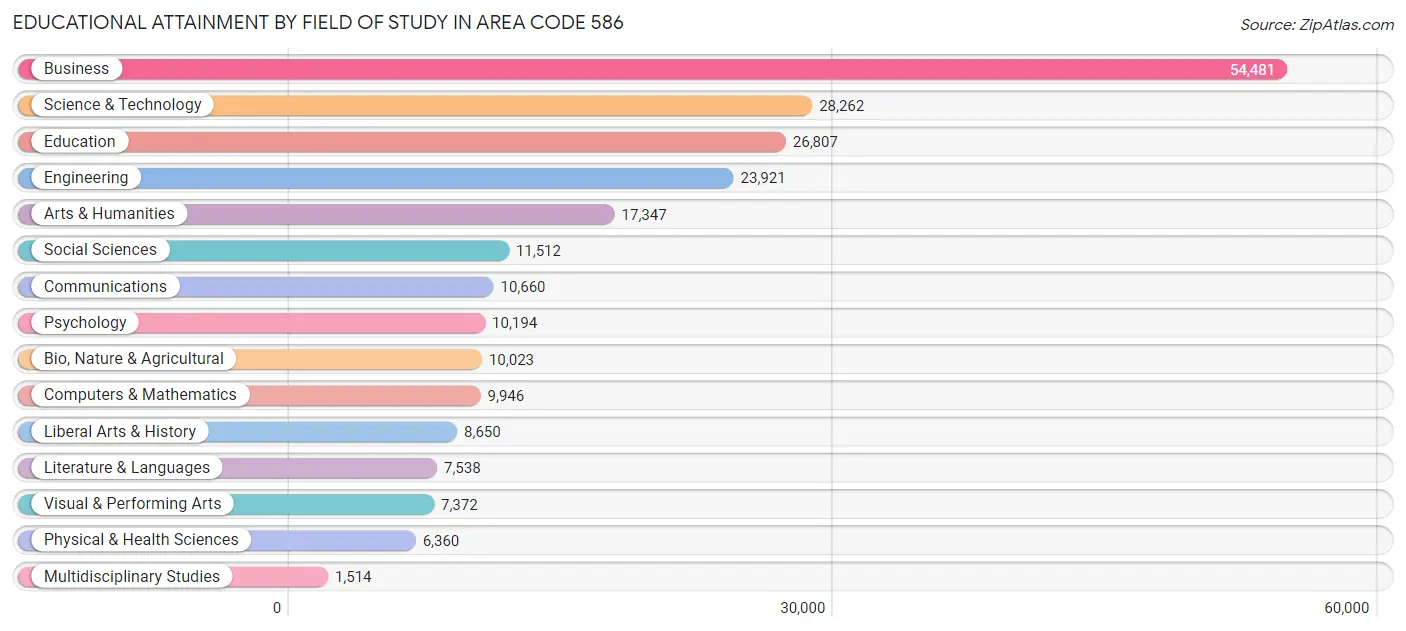
| Field of Study | # Graduates | % Graduates |
| Computers & Mathematics | 9,946 | 4.2% |
| Bio, Nature & Agricultural | 10,023 | 4.3% |
| Physical & Health Sciences | 6,360 | 2.7% |
| Psychology | 10,194 | 4.3% |
| Social Sciences | 11,512 | 4.9% |
| Engineering | 23,921 | 10.2% |
| Multidisciplinary Studies | 1,514 | 0.6% |
| Science & Technology | 28,262 | 12.0% |
| Business | 54,481 | 23.2% |
| Education | 26,807 | 11.4% |
| Literature & Languages | 7,538 | 3.2% |
| Liberal Arts & History | 8,650 | 3.7% |
| Visual & Performing Arts | 7,372 | 3.1% |
| Communications | 10,660 | 4.5% |
| Arts & Humanities | 17,347 | 7.4% |
| Total | 234,587 | 100.0% |
Transportation & Commute in Area Code 586
Vehicle Availability by Sex in Area Code 586
The most prevalent vehicle ownership categories in Area Code 586 are males with 2 vehicles (117,351, accounting for 41.9%) and females with 2 vehicles (104,076, making up 45.4%).
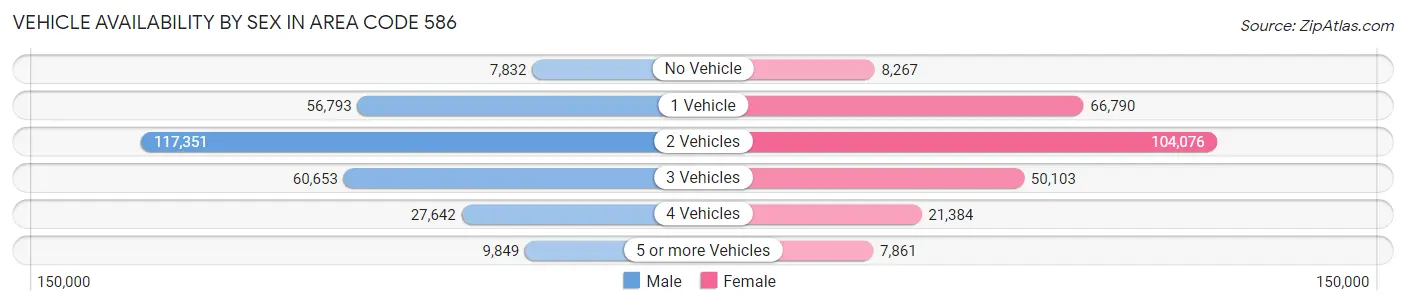
| Vehicles Available | Male | Female |
| No Vehicle | 7,832 (2.8%) | 8,267 (3.2%) |
| 1 Vehicle | 56,793 (20.3%) | 66,790 (25.8%) |
| 2 Vehicles | 117,351 (41.9%) | 104,076 (40.3%) |
| 3 Vehicles | 60,653 (21.6%) | 50,103 (19.4%) |
| 4 Vehicles | 27,642 (9.9%) | 21,384 (8.3%) |
| 5 or more Vehicles | 9,849 (3.5%) | 7,861 (3.0%) |
| Total | 280,120 (100.0%) | 258,481 (100.0%) |
Commute Time in Area Code 586
The most frequently occuring commute durations in Area Code 586 are 20 to 24 minutes (78,698 commuters, 16.2%), 30 to 34 minutes (78,087 commuters, 16.0%), and 15 to 19 minutes (73,665 commuters, 15.1%).
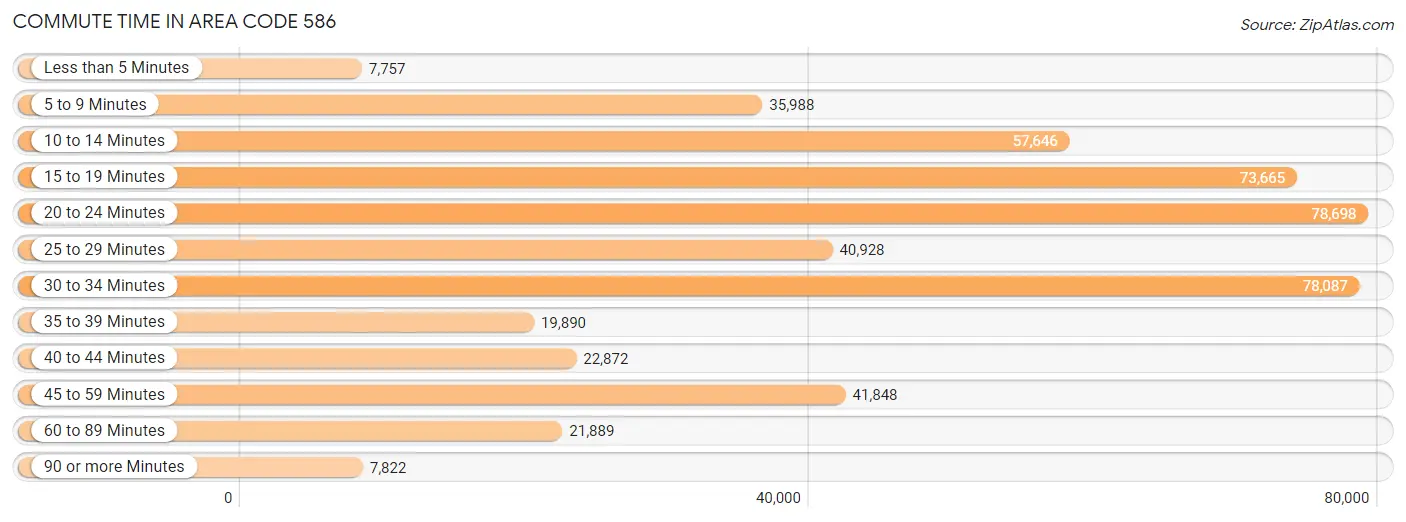
| Commute Time | # Commuters | % Commuters |
| Less than 5 Minutes | 7,757 | 1.6% |
| 5 to 9 Minutes | 35,988 | 7.4% |
| 10 to 14 Minutes | 57,646 | 11.8% |
| 15 to 19 Minutes | 73,665 | 15.1% |
| 20 to 24 Minutes | 78,698 | 16.2% |
| 25 to 29 Minutes | 40,928 | 8.4% |
| 30 to 34 Minutes | 78,087 | 16.0% |
| 35 to 39 Minutes | 19,890 | 4.1% |
| 40 to 44 Minutes | 22,872 | 4.7% |
| 45 to 59 Minutes | 41,848 | 8.6% |
| 60 to 89 Minutes | 21,889 | 4.5% |
| 90 or more Minutes | 7,822 | 1.6% |
Commute Time by Sex in Area Code 586
The most common commute times in Area Code 586 are 30 to 34 minutes (43,231 commuters, 16.9%) for males and 20 to 24 minutes (37,919 commuters, 16.4%) for females.
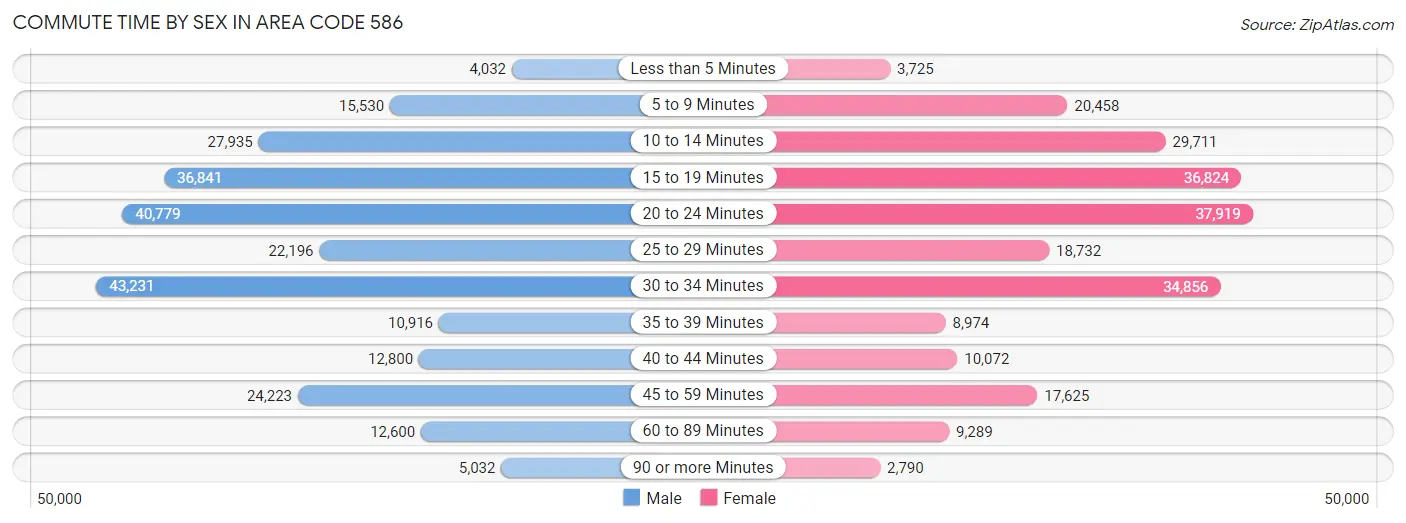
| Commute Time | Male | Female |
| Less than 5 Minutes | 4,032 (1.6%) | 3,725 (1.6%) |
| 5 to 9 Minutes | 15,530 (6.1%) | 20,458 (8.9%) |
| 10 to 14 Minutes | 27,935 (10.9%) | 29,711 (12.9%) |
| 15 to 19 Minutes | 36,841 (14.4%) | 36,824 (15.9%) |
| 20 to 24 Minutes | 40,779 (15.9%) | 37,919 (16.4%) |
| 25 to 29 Minutes | 22,196 (8.7%) | 18,732 (8.1%) |
| 30 to 34 Minutes | 43,231 (16.9%) | 34,856 (15.1%) |
| 35 to 39 Minutes | 10,916 (4.3%) | 8,974 (3.9%) |
| 40 to 44 Minutes | 12,800 (5.0%) | 10,072 (4.4%) |
| 45 to 59 Minutes | 24,223 (9.5%) | 17,625 (7.6%) |
| 60 to 89 Minutes | 12,600 (4.9%) | 9,289 (4.0%) |
| 90 or more Minutes | 5,032 (2.0%) | 2,790 (1.2%) |
Time of Departure to Work by Sex in Area Code 586
The most frequent times of departure to work in Area Code 586 are 7:00 AM to 7:29 AM (31,941, 12.5%) for males and 7:00 AM to 7:29 AM (30,312, 13.1%) for females.
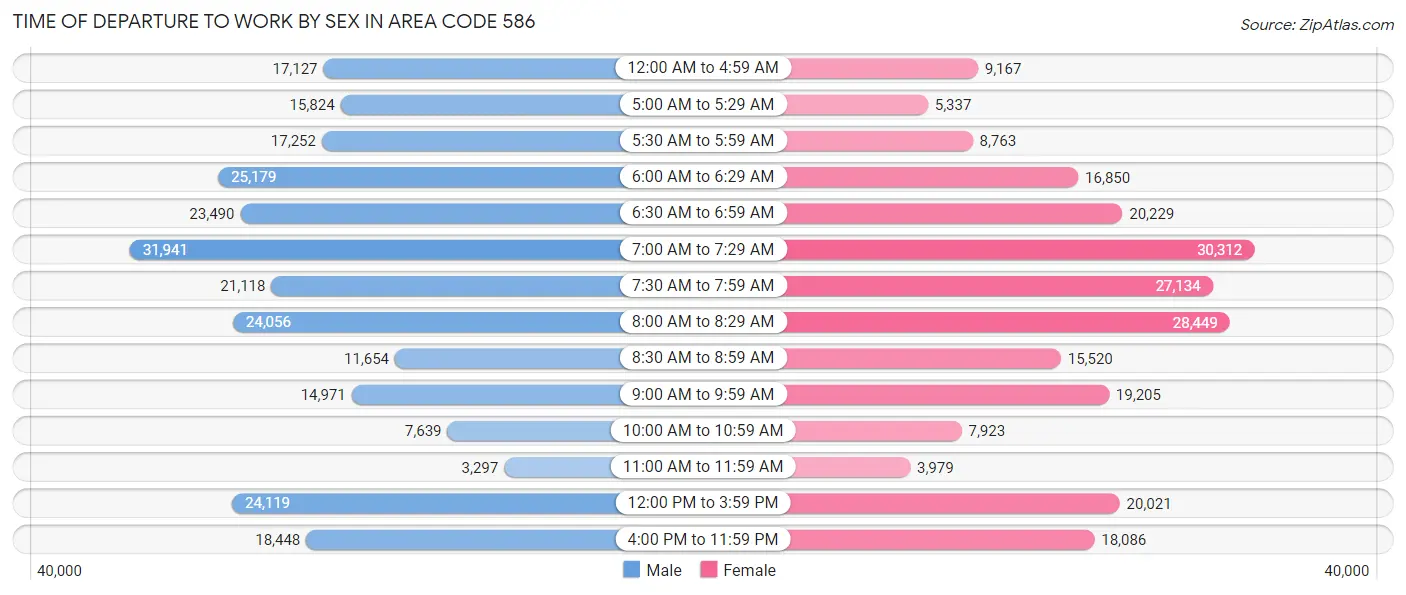
| Time of Departure | Male | Female |
| 12:00 AM to 4:59 AM | 17,127 (6.7%) | 9,167 (4.0%) |
| 5:00 AM to 5:29 AM | 15,824 (6.2%) | 5,337 (2.3%) |
| 5:30 AM to 5:59 AM | 17,252 (6.7%) | 8,763 (3.8%) |
| 6:00 AM to 6:29 AM | 25,179 (9.8%) | 16,850 (7.3%) |
| 6:30 AM to 6:59 AM | 23,490 (9.2%) | 20,229 (8.8%) |
| 7:00 AM to 7:29 AM | 31,941 (12.5%) | 30,312 (13.1%) |
| 7:30 AM to 7:59 AM | 21,118 (8.3%) | 27,134 (11.7%) |
| 8:00 AM to 8:29 AM | 24,056 (9.4%) | 28,449 (12.3%) |
| 8:30 AM to 8:59 AM | 11,654 (4.5%) | 15,520 (6.7%) |
| 9:00 AM to 9:59 AM | 14,971 (5.9%) | 19,205 (8.3%) |
| 10:00 AM to 10:59 AM | 7,639 (3.0%) | 7,923 (3.4%) |
| 11:00 AM to 11:59 AM | 3,297 (1.3%) | 3,979 (1.7%) |
| 12:00 PM to 3:59 PM | 24,119 (9.4%) | 20,021 (8.7%) |
| 4:00 PM to 11:59 PM | 18,448 (7.2%) | 18,086 (7.8%) |
| Total | 256,115 (100.0%) | 230,975 (100.0%) |
Housing Occupancy in Area Code 586
Occupancy by Ownership in Area Code 586
Of the total 476,387 dwellings in Area Code 586, owner-occupied units account for 321,914 (67.6%), while renter-occupied units make up 154,473 (32.4%).
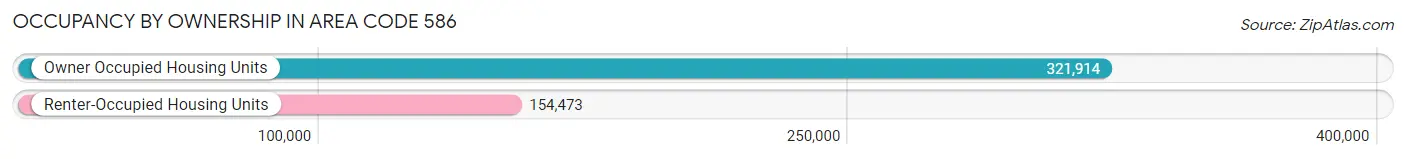
| Occupancy | # Housing Units | % Housing Units |
| Owner Occupied Housing Units | 321,914 | 67.6% |
| Renter-Occupied Housing Units | 154,473 | 32.4% |
| Total Occupied Housing Units | 476,387 | 100.0% |
Occupancy by Household Size in Area Code 586
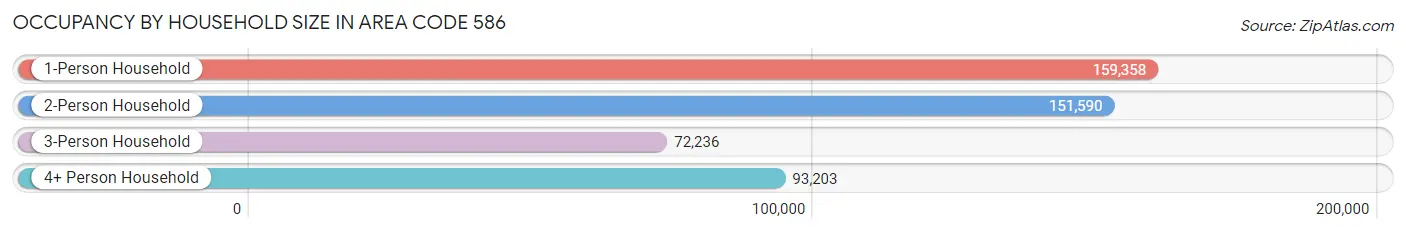
| Household Size | # Housing Units | % Housing Units |
| 1-Person Household | 159,358 | 33.5% |
| 2-Person Household | 151,590 | 31.8% |
| 3-Person Household | 72,236 | 15.2% |
| 4+ Person Household | 93,203 | 19.6% |
| Total Housing Units | 476,387 | 100.0% |
Occupancy by Ownership by Household Size in Area Code 586
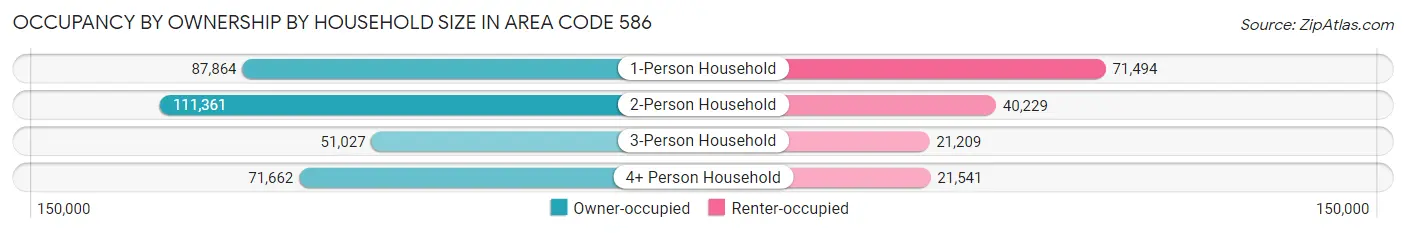
| Household Size | Owner-occupied | Renter-occupied |
| 1-Person Household | 87,864 (55.1%) | 71,494 (44.9%) |
| 2-Person Household | 111,361 (73.5%) | 40,229 (26.5%) |
| 3-Person Household | 51,027 (70.6%) | 21,209 (29.4%) |
| 4+ Person Household | 71,662 (76.9%) | 21,541 (23.1%) |
| Total Housing Units | 321,914 (67.6%) | 154,473 (32.4%) |
Occupancy by Educational Attainment in Area Code 586
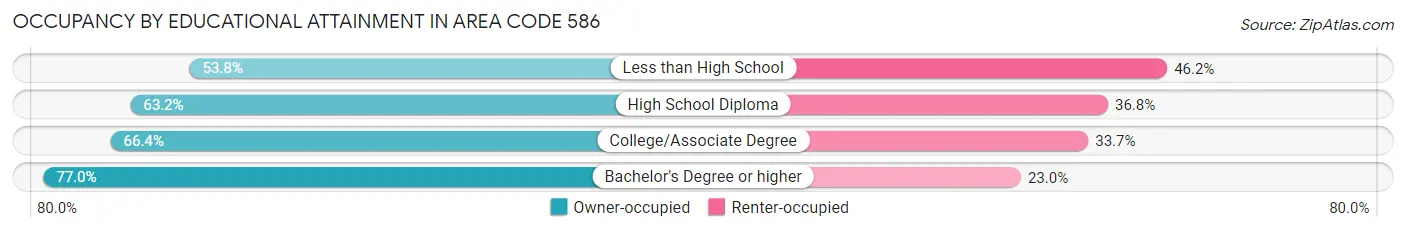
| Household Size | Owner-occupied | Renter-occupied |
| Less than High School | 21,152 (53.8%) | 18,137 (46.2%) |
| High School Diploma | 77,867 (63.2%) | 45,305 (36.8%) |
| College/Associate Degree | 117,470 (66.3%) | 59,587 (33.7%) |
| Bachelor's Degree or higher | 105,425 (77.0%) | 31,444 (23.0%) |
Occupancy by Age of Householder in Area Code 586
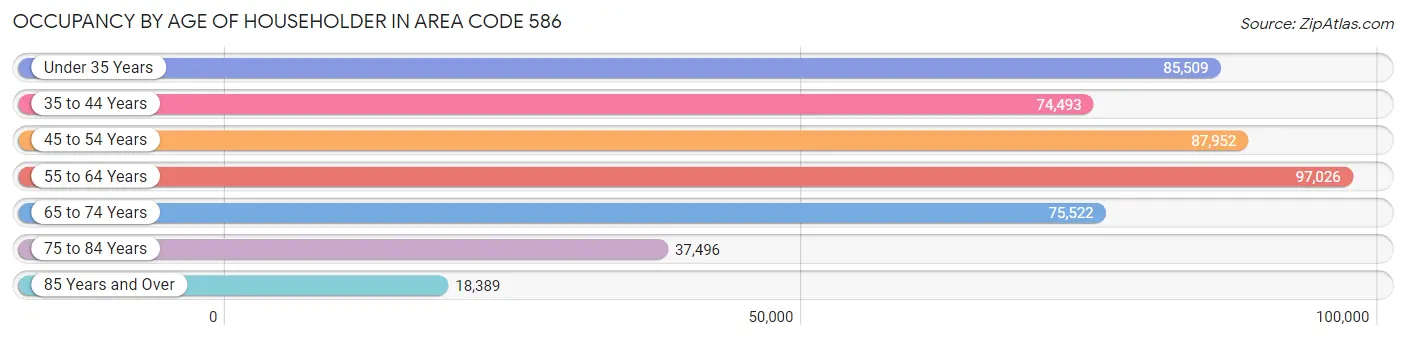
| Age Bracket | # Households | % Households |
| Under 35 Years | 85,509 | 17.9% |
| 35 to 44 Years | 74,493 | 15.6% |
| 45 to 54 Years | 87,952 | 18.5% |
| 55 to 64 Years | 97,026 | 20.4% |
| 65 to 74 Years | 75,522 | 15.9% |
| 75 to 84 Years | 37,496 | 7.9% |
| 85 Years and Over | 18,389 | 3.9% |
| Total | 476,387 | 100.0% |
Housing Finances in Area Code 586
Median Income by Occupancy in Area Code 586
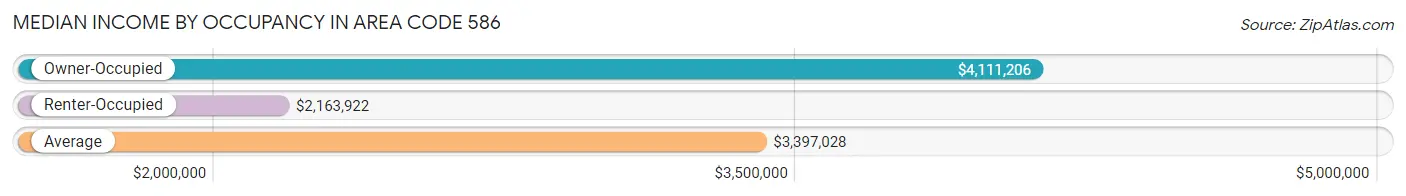
| Occupancy Type | # Households | Median Income |
| Owner-Occupied | 321,914 (67.6%) | $4,111,206 |
| Renter-Occupied | 154,473 (32.4%) | $2,163,922 |
| Average | 476,387 (100.0%) | $3,397,028 |
Occupancy by Householder Income Bracket in Area Code 586
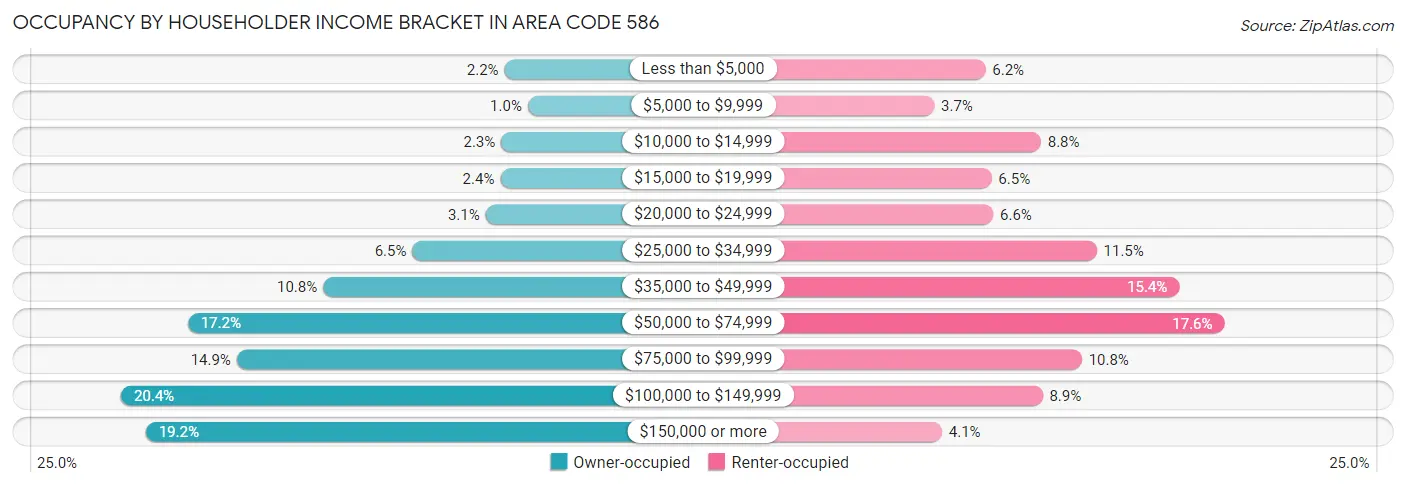
| Income Bracket | Owner-occupied | Renter-occupied |
| Less than $5,000 | 6,918 (2.1%) | 9,554 (6.2%) |
| $5,000 to $9,999 | 3,334 (1.0%) | 5,777 (3.7%) |
| $10,000 to $14,999 | 7,440 (2.3%) | 13,631 (8.8%) |
| $15,000 to $19,999 | 7,573 (2.4%) | 9,987 (6.5%) |
| $20,000 to $24,999 | 9,810 (3.0%) | 10,118 (6.6%) |
| $25,000 to $34,999 | 21,058 (6.5%) | 17,738 (11.5%) |
| $35,000 to $49,999 | 34,725 (10.8%) | 23,802 (15.4%) |
| $50,000 to $74,999 | 55,459 (17.2%) | 27,132 (17.6%) |
| $75,000 to $99,999 | 47,981 (14.9%) | 16,640 (10.8%) |
| $100,000 to $149,999 | 65,703 (20.4%) | 13,746 (8.9%) |
| $150,000 or more | 61,913 (19.2%) | 6,348 (4.1%) |
| Total | 321,914 (100.0%) | 154,473 (100.0%) |
Monthly Housing Cost Tiers in Area Code 586
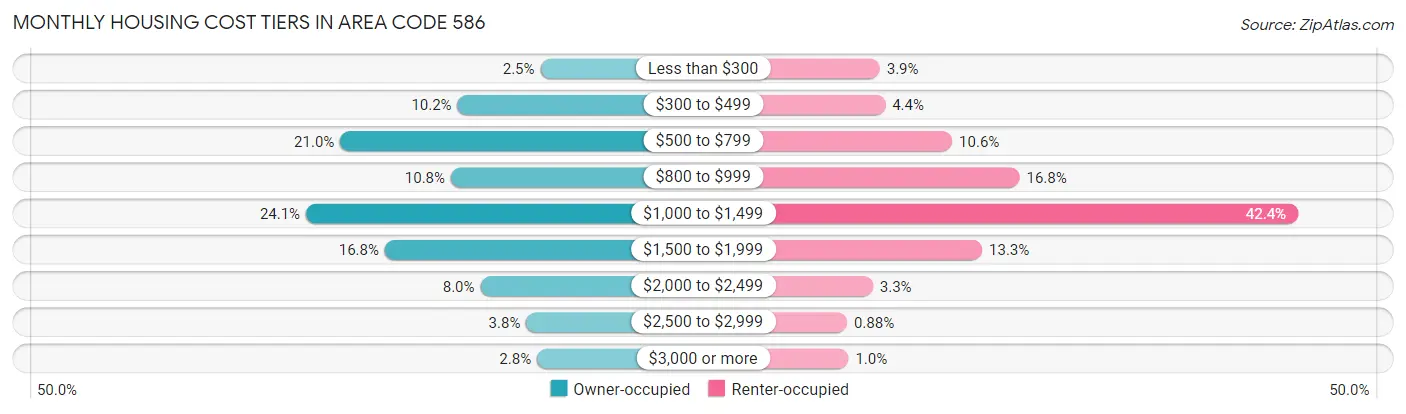
| Monthly Cost | Owner-occupied | Renter-occupied |
| Less than $300 | 8,111 (2.5%) | 6,029 (3.9%) |
| $300 to $499 | 32,660 (10.2%) | 6,790 (4.4%) |
| $500 to $799 | 67,441 (20.9%) | 16,306 (10.6%) |
| $800 to $999 | 34,625 (10.8%) | 25,906 (16.8%) |
| $1,000 to $1,499 | 77,580 (24.1%) | 65,474 (42.4%) |
| $1,500 to $1,999 | 54,198 (16.8%) | 20,579 (13.3%) |
| $2,000 to $2,499 | 25,884 (8.0%) | 5,037 (3.3%) |
| $2,500 to $2,999 | 12,294 (3.8%) | 1,352 (0.9%) |
| $3,000 or more | 9,121 (2.8%) | 1,581 (1.0%) |
| Total | 321,914 (100.0%) | 154,473 (100.0%) |
Physical Housing Characteristics in Area Code 586
Housing Structures in Area Code 586
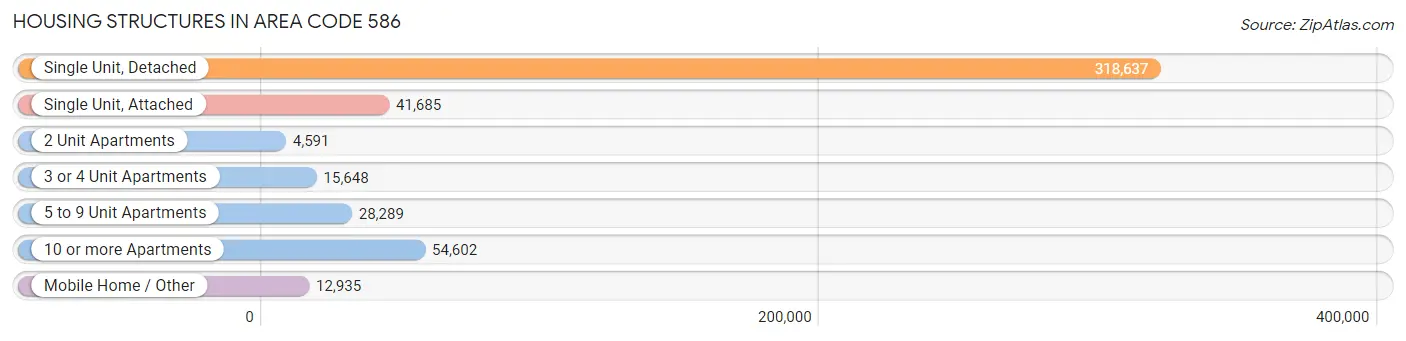
| Structure Type | # Housing Units | % Housing Units |
| Single Unit, Detached | 318,637 | 66.9% |
| Single Unit, Attached | 41,685 | 8.7% |
| 2 Unit Apartments | 4,591 | 1.0% |
| 3 or 4 Unit Apartments | 15,648 | 3.3% |
| 5 to 9 Unit Apartments | 28,289 | 5.9% |
| 10 or more Apartments | 54,602 | 11.5% |
| Mobile Home / Other | 12,935 | 2.7% |
| Total | 476,387 | 100.0% |
Housing Structures by Occupancy in Area Code 586
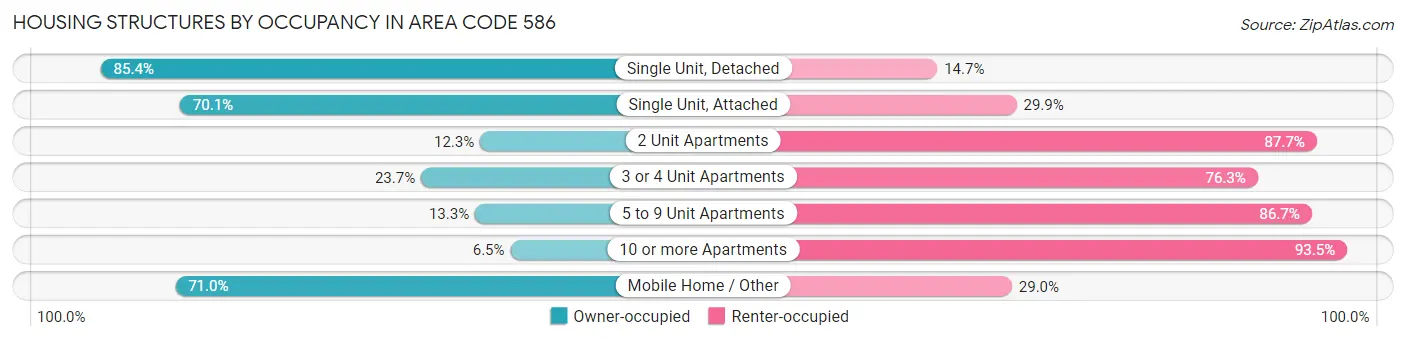
| Structure Type | Owner-occupied | Renter-occupied |
| Single Unit, Detached | 271,954 (85.4%) | 46,683 (14.6%) |
| Single Unit, Attached | 29,215 (70.1%) | 12,470 (29.9%) |
| 2 Unit Apartments | 565 (12.3%) | 4,026 (87.7%) |
| 3 or 4 Unit Apartments | 3,706 (23.7%) | 11,942 (76.3%) |
| 5 to 9 Unit Apartments | 3,757 (13.3%) | 24,532 (86.7%) |
| 10 or more Apartments | 3,534 (6.5%) | 51,068 (93.5%) |
| Mobile Home / Other | 9,183 (71.0%) | 3,752 (29.0%) |
| Total | 321,914 (67.6%) | 154,473 (32.4%) |
Housing Structures by Number of Rooms in Area Code 586
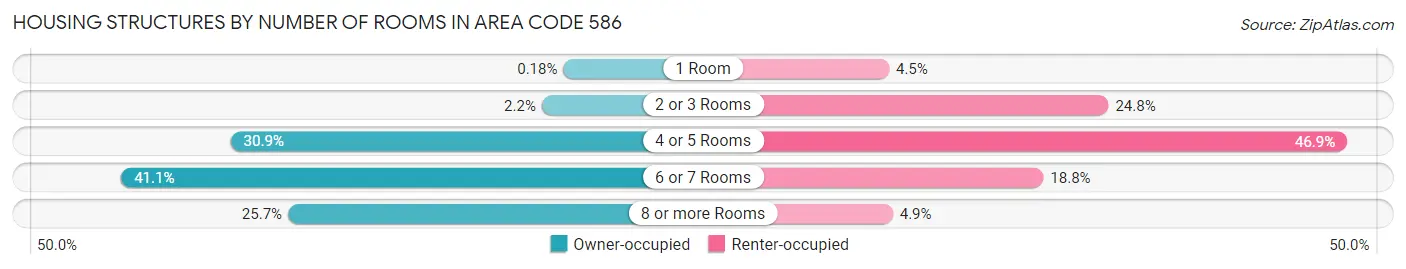
| Number of Rooms | Owner-occupied | Renter-occupied |
| 1 Room | 571 (0.2%) | 7,020 (4.5%) |
| 2 or 3 Rooms | 6,993 (2.2%) | 38,375 (24.8%) |
| 4 or 5 Rooms | 99,603 (30.9%) | 72,441 (46.9%) |
| 6 or 7 Rooms | 132,176 (41.1%) | 29,078 (18.8%) |
| 8 or more Rooms | 82,571 (25.7%) | 7,559 (4.9%) |
| Total | 321,914 (100.0%) | 154,473 (100.0%) |
Housing Structure by Heating Type in Area Code 586
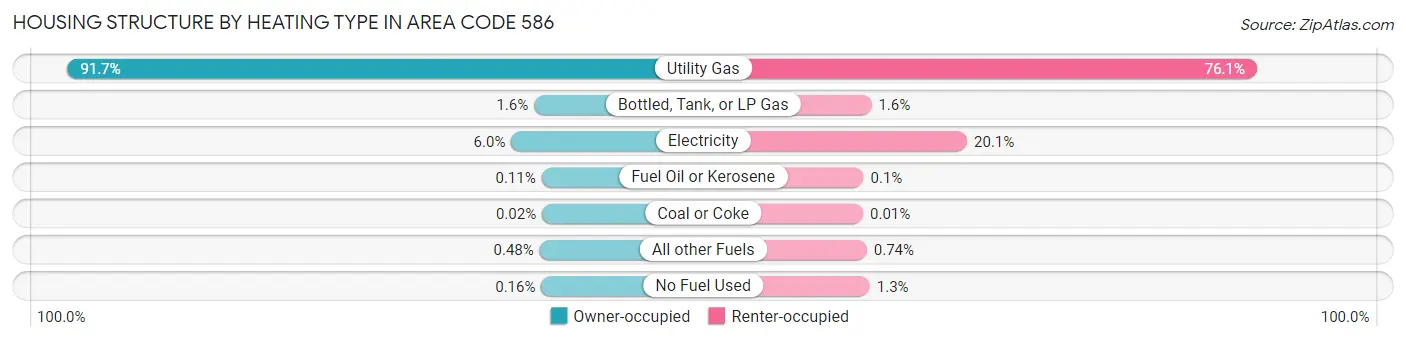
| Heating Type | Owner-occupied | Renter-occupied |
| Utility Gas | 295,297 (91.7%) | 117,530 (76.1%) |
| Bottled, Tank, or LP Gas | 4,984 (1.5%) | 2,524 (1.6%) |
| Electricity | 19,186 (6.0%) | 31,062 (20.1%) |
| Fuel Oil or Kerosene | 350 (0.1%) | 156 (0.1%) |
| Coal or Coke | 54 (0.0%) | 19 (0.0%) |
| All other Fuels | 1,540 (0.5%) | 1,146 (0.7%) |
| No Fuel Used | 503 (0.2%) | 2,036 (1.3%) |
| Total | 321,914 (100.0%) | 154,473 (100.0%) |
Household Vehicle Usage in Area Code 586
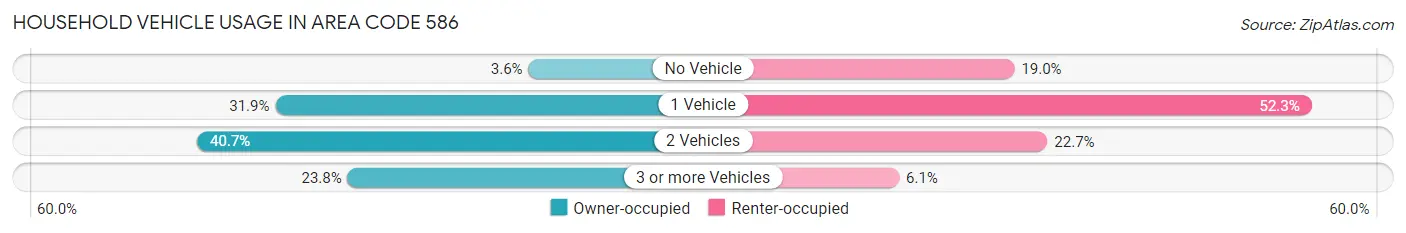
| Vehicles per Household | Owner-occupied | Renter-occupied |
| No Vehicle | 11,459 (3.6%) | 29,327 (19.0%) |
| 1 Vehicle | 102,759 (31.9%) | 80,743 (52.3%) |
| 2 Vehicles | 131,001 (40.7%) | 35,029 (22.7%) |
| 3 or more Vehicles | 76,695 (23.8%) | 9,374 (6.1%) |
| Total | 321,914 (100.0%) | 154,473 (100.0%) |
Real Estate & Mortgages in Area Code 586
Real Estate and Mortgage Overview in Area Code 586
| Characteristic | Without Mortgage | With Mortgage |
| Housing Units | 123,054 | 198,860 |
| Median Property Value | $9,403,800 | $11,030,000 |
| Median Household Income | $3,149,298 | $46,194 |
| Monthly Housing Costs | $29,455 | $8,954 |
| Real Estate Taxes | $132,443 | $6,730 |
Property Value by Mortgage Status in Area Code 586
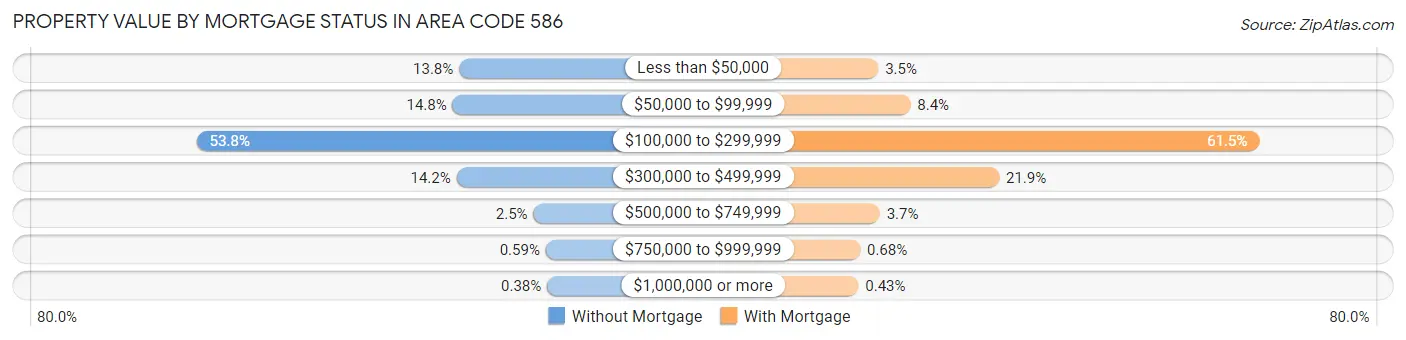
| Property Value | Without Mortgage | With Mortgage |
| Less than $50,000 | 16,975 (13.8%) | 6,886 (3.5%) |
| $50,000 to $99,999 | 18,202 (14.8%) | 16,599 (8.4%) |
| $100,000 to $299,999 | 66,204 (53.8%) | 122,347 (61.5%) |
| $300,000 to $499,999 | 17,445 (14.2%) | 43,489 (21.9%) |
| $500,000 to $749,999 | 3,039 (2.5%) | 7,332 (3.7%) |
| $750,000 to $999,999 | 725 (0.6%) | 1,359 (0.7%) |
| $1,000,000 or more | 464 (0.4%) | 848 (0.4%) |
| Total | 123,054 (100.0%) | 198,860 (100.0%) |
Household Income by Mortgage Status in Area Code 586
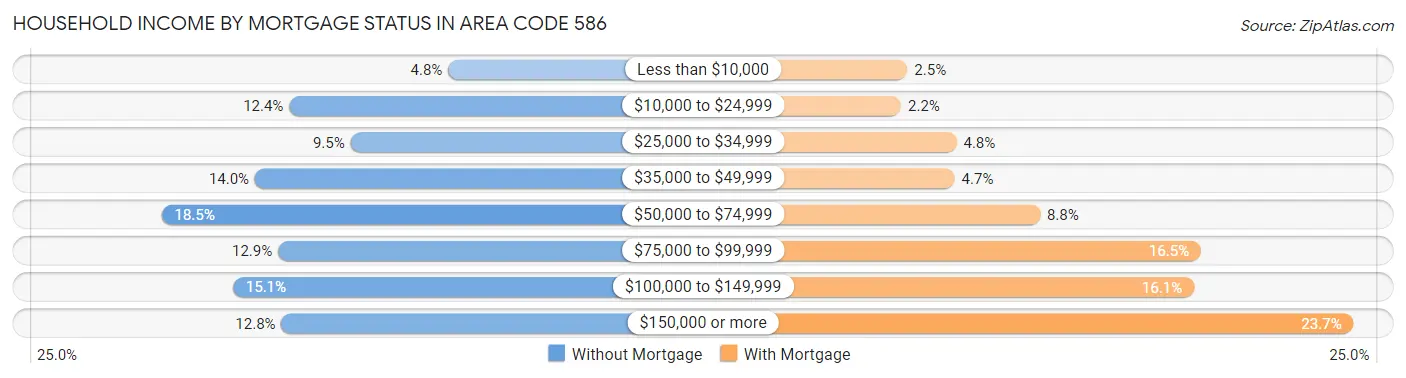
| Household Income | Without Mortgage | With Mortgage |
| Less than $10,000 | 5,939 (4.8%) | 4,919 (2.5%) |
| $10,000 to $24,999 | 15,254 (12.4%) | 4,313 (2.2%) |
| $25,000 to $34,999 | 11,671 (9.5%) | 9,569 (4.8%) |
| $35,000 to $49,999 | 17,262 (14.0%) | 9,387 (4.7%) |
| $50,000 to $74,999 | 22,741 (18.5%) | 17,463 (8.8%) |
| $75,000 to $99,999 | 15,917 (12.9%) | 32,718 (16.5%) |
| $100,000 to $149,999 | 18,551 (15.1%) | 32,064 (16.1%) |
| $150,000 or more | 15,719 (12.8%) | 47,152 (23.7%) |
| Total | 123,054 (100.0%) | 198,860 (100.0%) |
Property Value to Household Income Ratio in Area Code 586
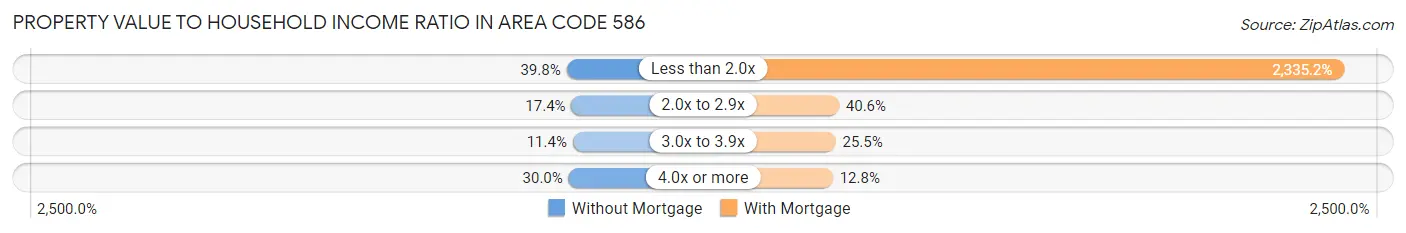
| Value-to-Income Ratio | Without Mortgage | With Mortgage |
| Less than 2.0x | 48,969 (39.8%) | 4,643,752 (2,335.2%) |
| 2.0x to 2.9x | 21,385 (17.4%) | 80,720 (40.6%) |
| 3.0x to 3.9x | 14,032 (11.4%) | 50,647 (25.5%) |
| 4.0x or more | 36,858 (29.9%) | 25,509 (12.8%) |
| Total | 123,054 (100.0%) | 198,860 (100.0%) |
Real Estate Taxes by Mortgage Status in Area Code 586
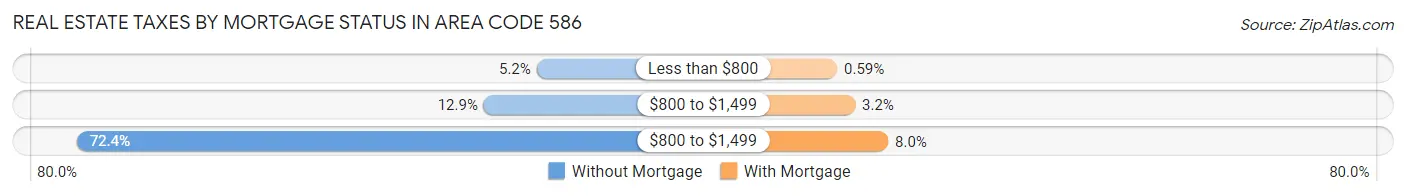
| Property Taxes | Without Mortgage | With Mortgage |
| Less than $800 | 6,370 (5.2%) | 1,174 (0.6%) |
| $800 to $1,499 | 15,884 (12.9%) | 6,395 (3.2%) |
| $800 to $1,499 | 89,065 (72.4%) | 15,983 (8.0%) |
| Total | 123,054 (100.0%) | 198,860 (100.0%) |
Health & Disability in Area Code 586
Health Insurance Coverage by Age in Area Code 586
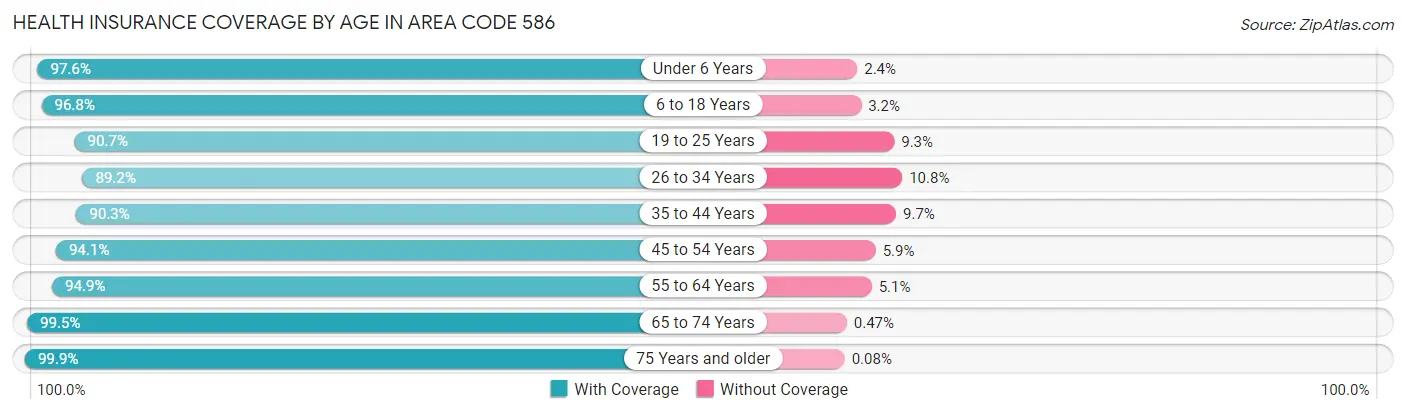
| Age Bracket | With Coverage | Without Coverage |
| Under 6 Years | 74,982 (97.6%) | 1,863 (2.4%) |
| 6 to 18 Years | 175,159 (96.8%) | 5,720 (3.2%) |
| 19 to 25 Years | 92,108 (90.7%) | 9,466 (9.3%) |
| 26 to 34 Years | 130,445 (89.2%) | 15,801 (10.8%) |
| 35 to 44 Years | 124,422 (90.3%) | 13,302 (9.7%) |
| 45 to 54 Years | 142,934 (94.1%) | 8,893 (5.9%) |
| 55 to 64 Years | 152,780 (94.9%) | 8,252 (5.1%) |
| 65 to 74 Years | 116,694 (99.5%) | 556 (0.5%) |
| 75 Years and older | 79,225 (99.9%) | 64 (0.1%) |
| Total | 1,088,749 (94.5%) | 63,917 (5.6%) |
Health Insurance Coverage by Citizenship Status in Area Code 586
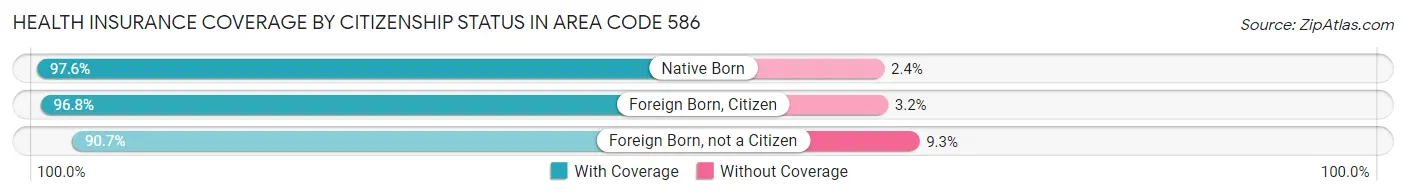
| Citizenship Status | With Coverage | Without Coverage |
| Native Born | 74,982 (97.6%) | 1,863 (2.4%) |
| Foreign Born, Citizen | 175,159 (96.8%) | 5,720 (3.2%) |
| Foreign Born, not a Citizen | 92,108 (90.7%) | 9,466 (9.3%) |
Health Insurance Coverage by Household Income in Area Code 586
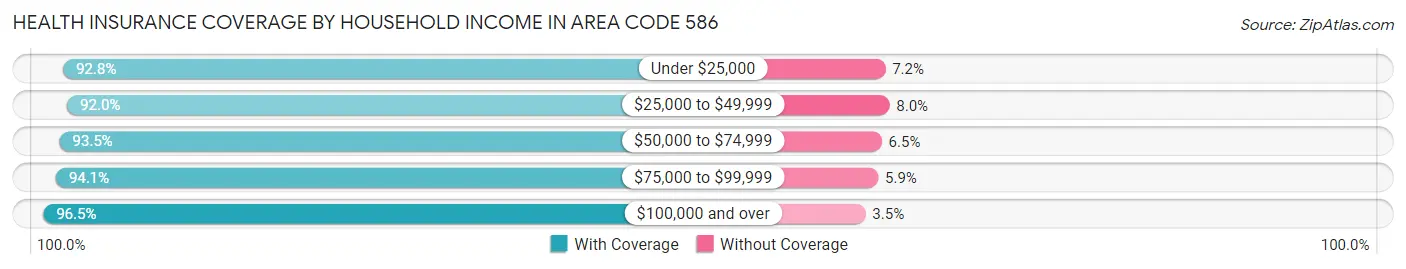
| Household Income | With Coverage | Without Coverage |
| Under $25,000 | 131,799 (92.8%) | 10,221 (7.2%) |
| $25,000 to $49,999 | 173,527 (92.0%) | 15,052 (8.0%) |
| $50,000 to $74,999 | 176,512 (93.5%) | 12,326 (6.5%) |
| $75,000 to $99,999 | 158,002 (94.1%) | 9,837 (5.9%) |
| $100,000 and over | 444,209 (96.5%) | 16,080 (3.5%) |
Public vs Private Health Insurance Coverage by Age in Area Code 586
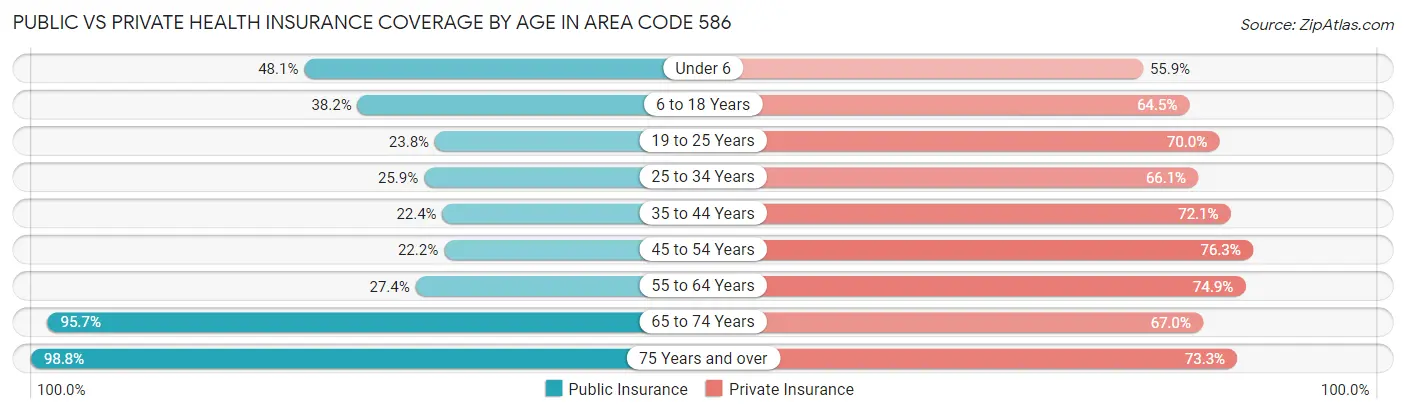
| Age Bracket | Public Insurance | Private Insurance |
| Under 6 | 36,959 (48.1%) | 42,953 (55.9%) |
| 6 to 18 Years | 69,109 (38.2%) | 116,624 (64.5%) |
| 19 to 25 Years | 24,218 (23.8%) | 71,118 (70.0%) |
| 25 to 34 Years | 37,825 (25.9%) | 96,667 (66.1%) |
| 35 to 44 Years | 30,906 (22.4%) | 99,316 (72.1%) |
| 45 to 54 Years | 33,647 (22.2%) | 115,775 (76.2%) |
| 55 to 64 Years | 44,179 (27.4%) | 120,544 (74.9%) |
| 65 to 74 Years | 112,256 (95.7%) | 78,552 (67.0%) |
| 75 Years and over | 78,363 (98.8%) | 58,151 (73.3%) |
| Total | 467,462 (40.6%) | 799,700 (69.4%) |
Disability Status by Sex by Age in Area Code 586
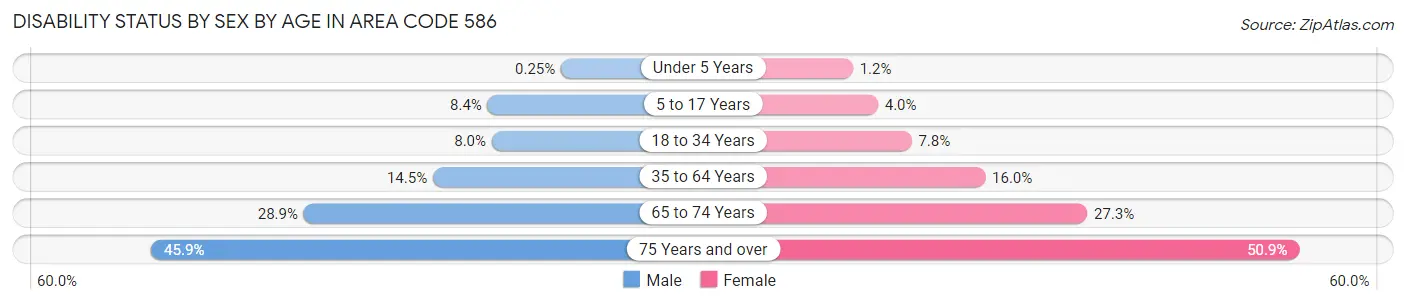
| Age Bracket | Male | Female |
| Under 5 Years | 83 (0.3%) | 370 (1.2%) |
| 5 to 17 Years | 7,766 (8.4%) | 3,533 (4.0%) |
| 18 to 34 Years | 10,412 (8.0%) | 10,156 (7.8%) |
| 35 to 64 Years | 31,710 (14.5%) | 37,068 (16.0%) |
| 65 to 74 Years | 15,534 (28.9%) | 17,348 (27.3%) |
| 75 Years and over | 14,036 (45.9%) | 24,813 (50.9%) |
Disability Class by Sex by Age in Area Code 586
Disability Class: Hearing Difficulty
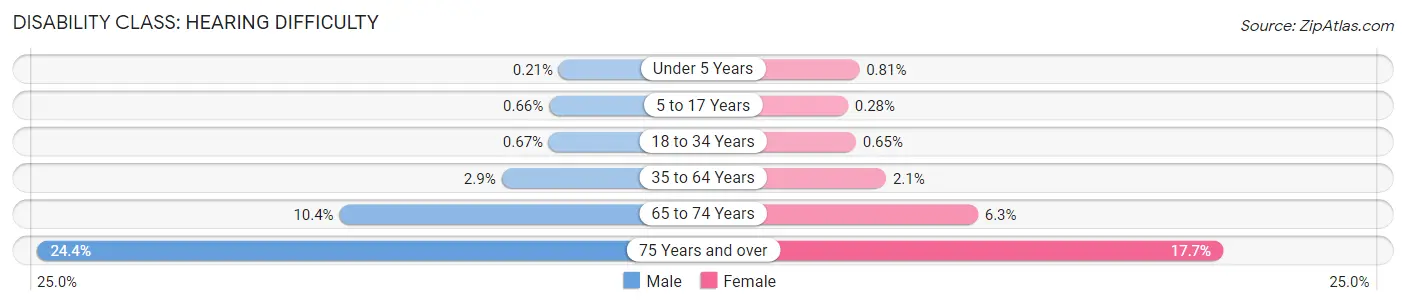
| Age Bracket | Male | Female |
| Under 5 Years | 71 (0.2%) | 247 (0.8%) |
| 5 to 17 Years | 612 (0.7%) | 250 (0.3%) |
| 18 to 34 Years | 882 (0.7%) | 855 (0.6%) |
| 35 to 64 Years | 6,272 (2.9%) | 4,770 (2.1%) |
| 65 to 74 Years | 5,582 (10.4%) | 4,010 (6.3%) |
| 75 Years and over | 7,461 (24.4%) | 8,613 (17.7%) |
Disability Class: Vision Difficulty
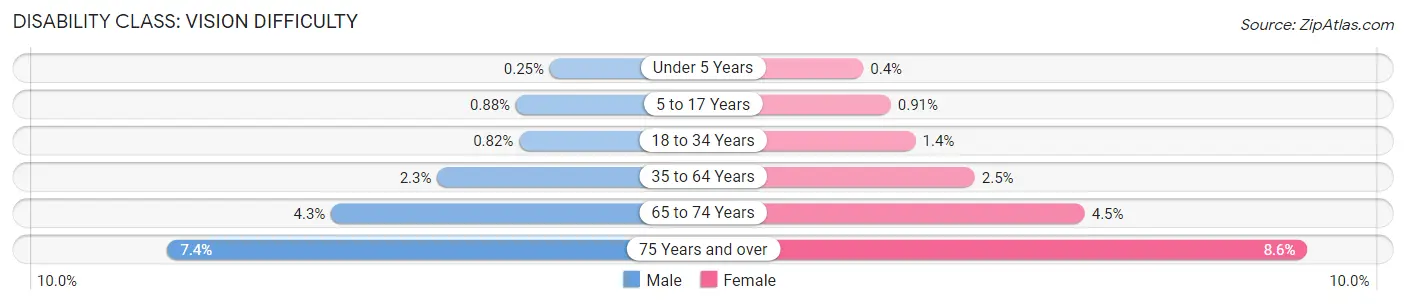
| Age Bracket | Male | Female |
| Under 5 Years | 83 (0.3%) | 123 (0.4%) |
| 5 to 17 Years | 807 (0.9%) | 805 (0.9%) |
| 18 to 34 Years | 1,078 (0.8%) | 1,800 (1.4%) |
| 35 to 64 Years | 5,099 (2.3%) | 5,746 (2.5%) |
| 65 to 74 Years | 2,316 (4.3%) | 2,864 (4.5%) |
| 75 Years and over | 2,247 (7.3%) | 4,211 (8.6%) |
Disability Class: Cognitive Difficulty
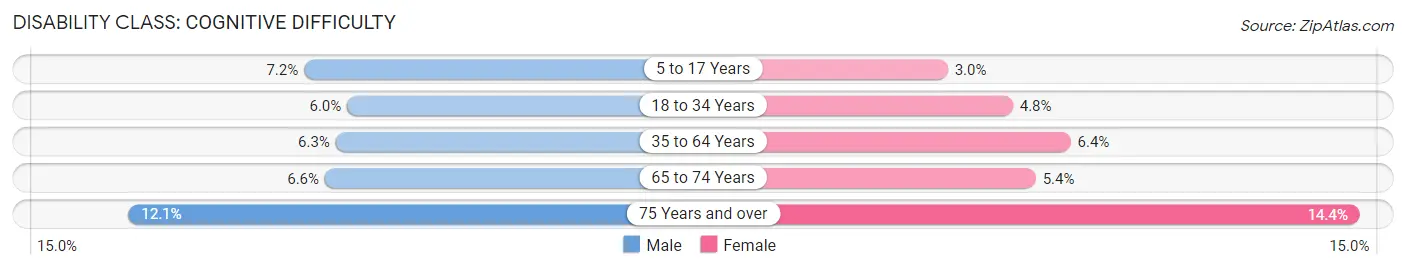
| Age Bracket | Male | Female |
| 5 to 17 Years | 6,645 (7.2%) | 2,601 (2.9%) |
| 18 to 34 Years | 7,871 (6.0%) | 6,230 (4.8%) |
| 35 to 64 Years | 13,837 (6.3%) | 14,790 (6.4%) |
| 65 to 74 Years | 3,568 (6.6%) | 3,428 (5.4%) |
| 75 Years and over | 3,703 (12.1%) | 7,023 (14.4%) |
Disability Class: Ambulatory Difficulty
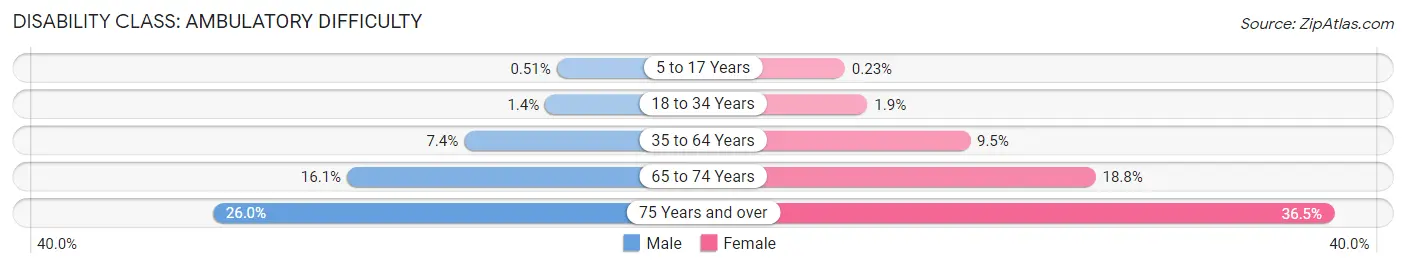
| Age Bracket | Male | Female |
| 5 to 17 Years | 468 (0.5%) | 205 (0.2%) |
| 18 to 34 Years | 1,773 (1.4%) | 2,488 (1.9%) |
| 35 to 64 Years | 16,094 (7.4%) | 22,110 (9.5%) |
| 65 to 74 Years | 8,634 (16.1%) | 11,967 (18.8%) |
| 75 Years and over | 7,956 (26.0%) | 17,794 (36.5%) |
Disability Class: Self-Care Difficulty
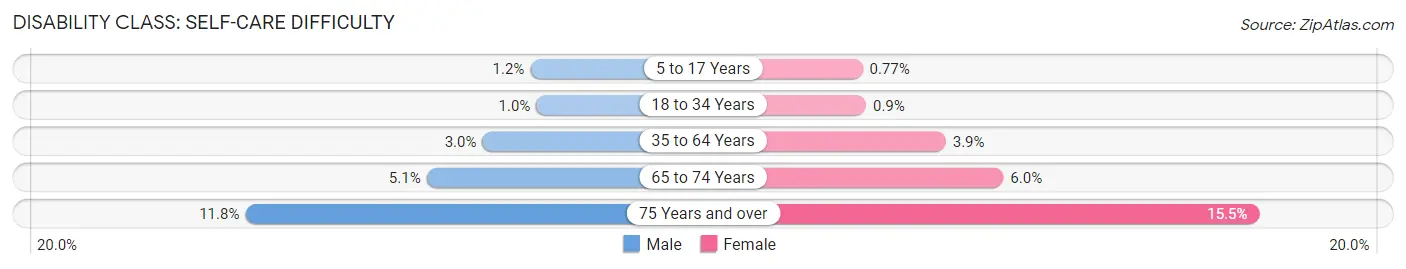
| Age Bracket | Male | Female |
| 5 to 17 Years | 1,130 (1.2%) | 681 (0.8%) |
| 18 to 34 Years | 1,324 (1.0%) | 1,172 (0.9%) |
| 35 to 64 Years | 6,561 (3.0%) | 8,969 (3.9%) |
| 65 to 74 Years | 2,729 (5.1%) | 3,810 (6.0%) |
| 75 Years and over | 3,610 (11.8%) | 7,549 (15.5%) |
Technology Access in Area Code 586
Computing Device Access in Area Code 586
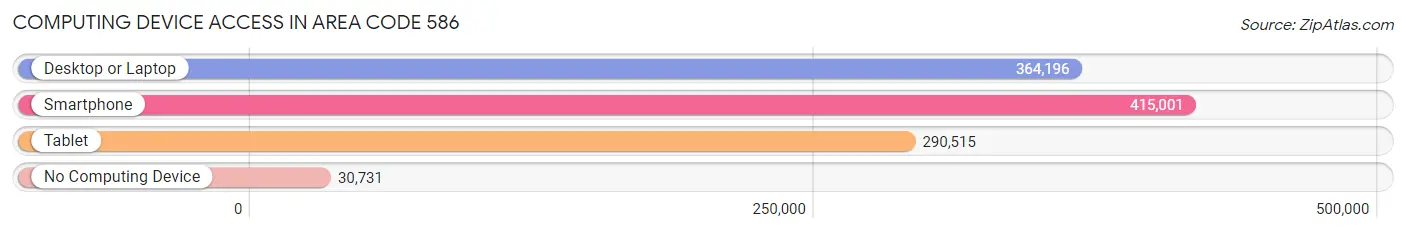
| Device Type | # Households | % Households |
| Desktop or Laptop | 364,196 | 76.4% |
| Smartphone | 415,001 | 87.1% |
| Tablet | 290,515 | 61.0% |
| No Computing Device | 30,731 | 6.5% |
| Total | 476,387 | 100.0% |
Internet Access in Area Code 586
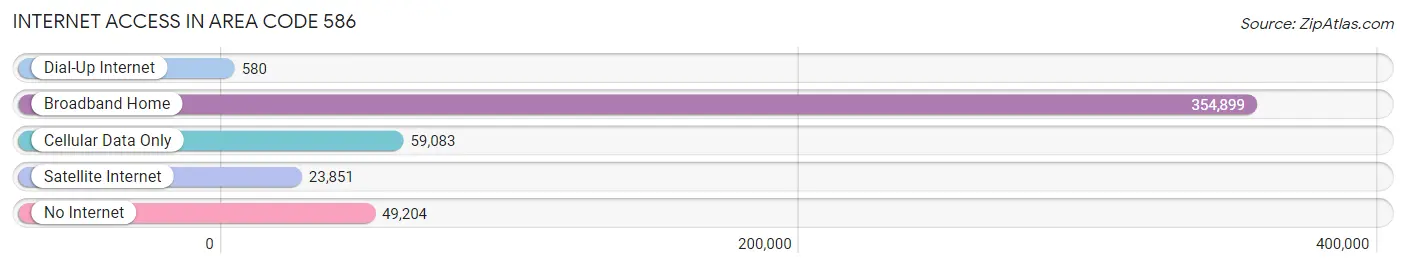
| Internet Type | # Households | % Households |
| Dial-Up Internet | 580 | 0.1% |
| Broadband Home | 354,899 | 74.5% |
| Cellular Data Only | 59,083 | 12.4% |
| Satellite Internet | 23,851 | 5.0% |
| No Internet | 49,204 | 10.3% |
| Total | 476,387 | 100.0% |
Area Code 586 Summary
Geography
Area code 586 is located in the state of Michigan. It covers the Macomb County area, which is located in the southeastern part of the state. The cities and towns that are served by this area code include Sterling Heights, Warren, Clinton Township, and St. Clair Shores.
Social
Area code 586 is home to a diverse population of people from different backgrounds and cultures. The area is known for its strong sense of community and is home to many different types of businesses, restaurants, and entertainment venues.
Economics
Area code 586 is a major economic hub in the state of Michigan. The area is home to many large corporations, such as General Motors, Chrysler, and Ford. The area also has a strong manufacturing base, with many factories and plants located in the area.
Demographics
Area code 586 is home to a population of over 500,000 people. The population is largely white, with a significant minority population of African Americans, Hispanics, and Asians. The median household income in the area is around $60,000, and the unemployment rate is around 5%.
Common Questions
What is Per Capita Income in Area Code 586?
Per Capita income in Area Code 586 is $37,220.
What is the Median Family Income in Area Code 586?
Median Family Income in Area Code 586 is $86,852.
What is the Median Household income in Area Code 586?
Median Household Income in Area Code 586 is $70,771.
What is Income or Wage Gap in Area Code 586?
Income or Wage Gap in Area Code 586 is 26.9%.
Women in Area Code 586 earn 73.1 cents for every dollar earned by a man.
What is Family Income Deficit in Area Code 586?
Family Income Deficit in Area Code 586 is $9,737.
Families that are below poverty line in Area Code 586 earn $9,737 less on average than the poverty threshold level.
What is Inequality or Gini Index in Area Code 586?
Inequality or Gini Index in Area Code 586 is 20.63.
What is the Total Population of Area Code 586?
Total Population of Area Code 586 is 1,163,943.
What is the Total Male Population of Area Code 586?
Total Male Population of Area Code 586 is 566,024.
What is the Total Female Population of Area Code 586?
Total Female Population of Area Code 586 is 597,919.
What is the Ratio of Males per 100 Females in Area Code 586?
There are 94.67 Males per 100 Females in Area Code 586.
What is the Ratio of Females per 100 Males in Area Code 586?
There are 105.63 Females per 100 Males in Area Code 586.
What is the Median Population Age in Area Code 586?
Median Population Age in Area Code 586 is 40.6 Years.
What is the Average Family Size in Area Code 586
Average Family Size in Area Code 586 is 3.1 People.
What is the Average Household Size in Area Code 586
Average Household Size in Area Code 586 is 2.4 People.
How Large is the Labor Force in Area Code 586?
There are 590,769 People in the Labor Forcein in Area Code 586.
What is the Percentage of People in the Labor Force in Area Code 586?
62.2% of People are in the Labor Force in Area Code 586.
What is the Unemployment Rate in Area Code 586?
Unemployment Rate in Area Code 586 is 6.5%.