Area Code 856 Map & Demographics
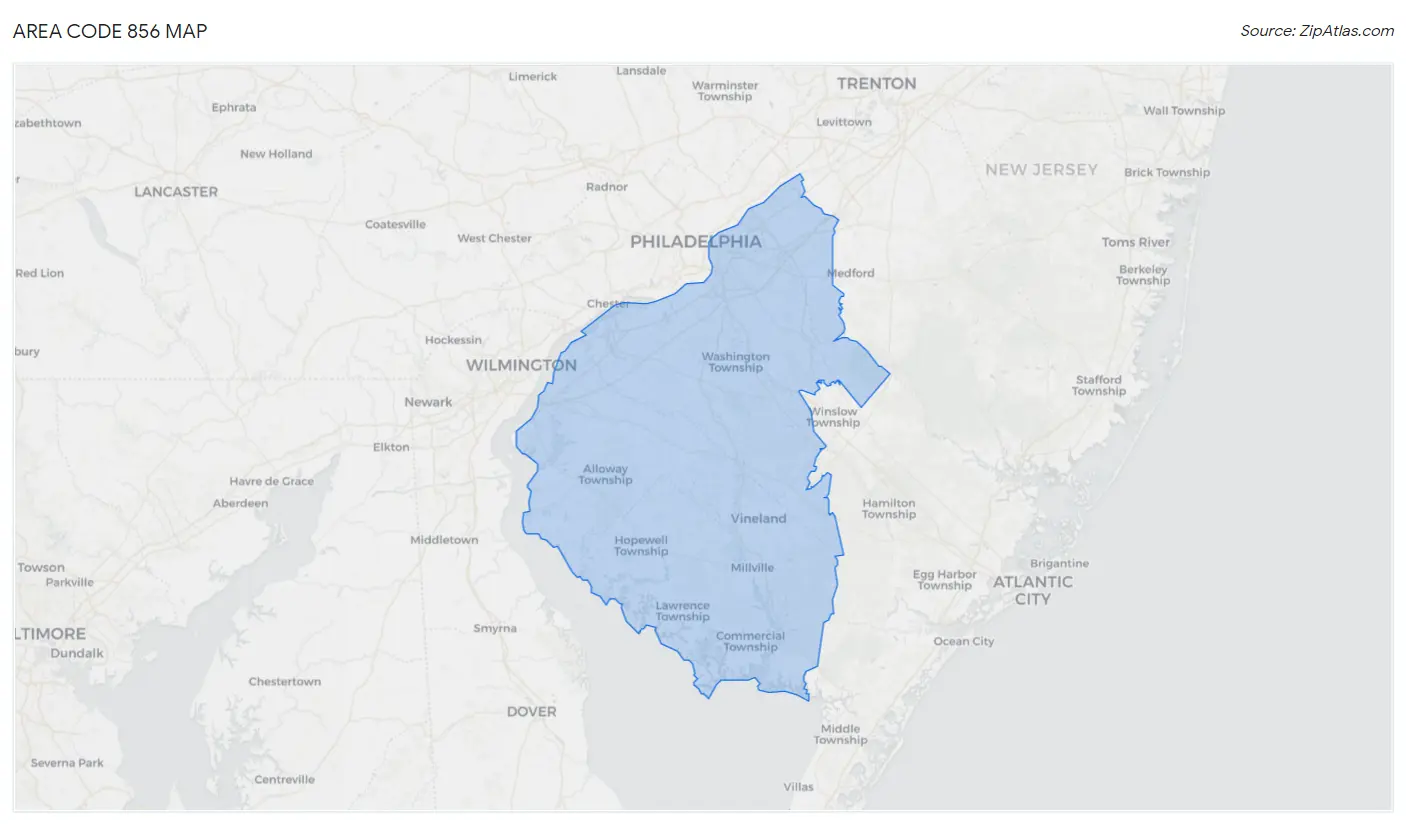
Area Code 856 Map
Area Code 856 Overview
$41,554
PER CAPITA INCOME
$108,489
AVG FAMILY INCOME
$90,238
AVG HOUSEHOLD INCOME
26.7%
WAGE / INCOME GAP [ % ]
73.3¢/ $1
WAGE / INCOME GAP [ $ ]
$10,281
FAMILY INCOME DEFICIT
31.76
INEQUALITY / GINI INDEX
1,028,483
TOTAL POPULATION
505,178
MALE POPULATION
523,305
FEMALE POPULATION
96.54
MALES / 100 FEMALES
103.59
FEMALES / 100 MALES
41.7
MEDIAN AGE
3.2
AVG FAMILY SIZE
2.7
AVG HOUSEHOLD SIZE
509,203
LABOR FORCE [ PEOPLE ]
61.8%
PERCENT IN LABOR FORCE
7.0%
UNEMPLOYMENT RATE
Income in Area Code 856
Income Overview in Area Code 856
Per Capita Income in Area Code 856 is $41,554, while median incomes of families and households are $108,489 and $90,238 respectively.
| Characteristic | Number | Measure |
| Per Capita Income | 1,028,483 | $41,554 |
| Median Family Income | 256,615 | $108,489 |
| Mean Family Income | 256,615 | $10,043,368 |
| Median Household Income | 382,110 | $90,238 |
| Mean Household Income | 382,110 | $8,735,530 |
| Income Deficit | 256,615 | $10,281 |
| Wage / Income Gap (%) | 1,028,483 | 26.69% |
| Wage / Income Gap ($) | 1,028,483 | 73.31¢ per $1 |
| Gini / Inequality Index | 1,028,483 | 31.76 |
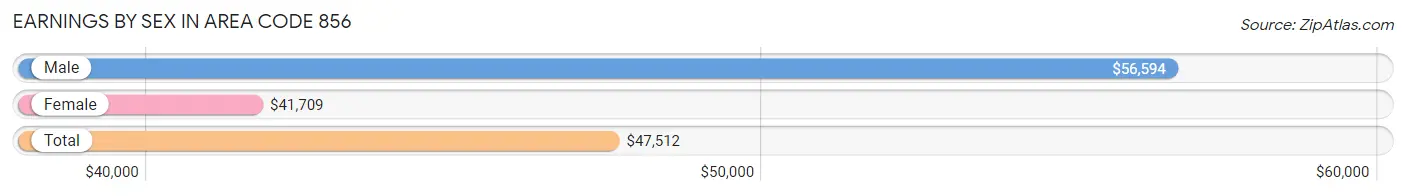
Earnings by Sex in Area Code 856
Average Earnings in Area Code 856 are $47,512, $56,594 for men and $41,709 for women, a difference of 26.3%.
| Sex | Number | Average Earnings |
| Male | 288,943 (52.0%) | $56,594 |
| Female | 266,801 (48.0%) | $41,709 |
| Total | 555,744 (100.0%) | $47,512 |
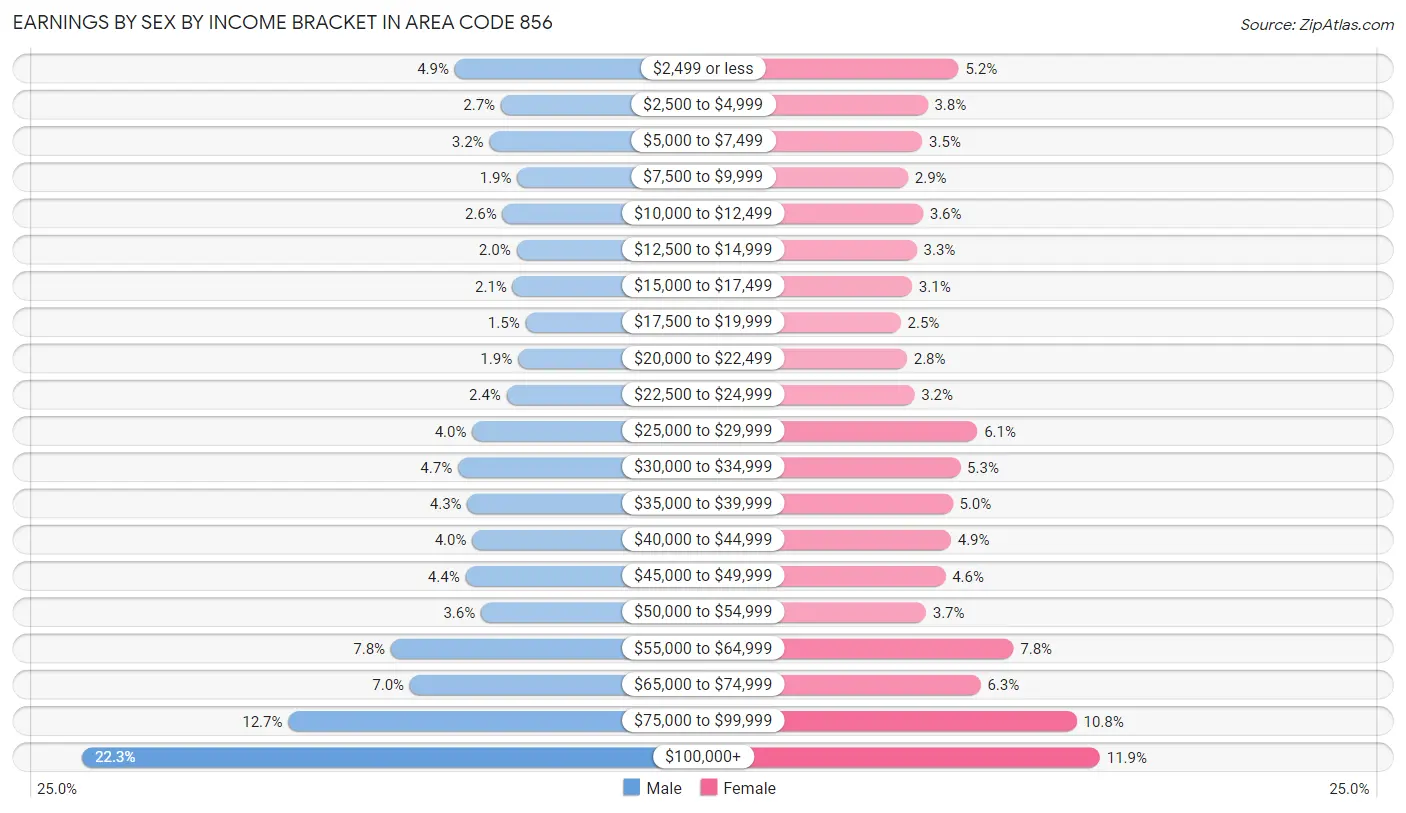
Earnings by Sex by Income Bracket in Area Code 856
The most common earnings brackets in Area Code 856 are $100,000+ for men (64,473 | 22.3%) and $100,000+ for women (31,612 | 11.8%).
| Income | Male | Female |
| $2,499 or less | 14,024 (4.9%) | 13,944 (5.2%) |
| $2,500 to $4,999 | 7,778 (2.7%) | 10,096 (3.8%) |
| $5,000 to $7,499 | 9,325 (3.2%) | 9,416 (3.5%) |
| $7,500 to $9,999 | 5,537 (1.9%) | 7,636 (2.9%) |
| $10,000 to $12,499 | 7,537 (2.6%) | 9,499 (3.6%) |
| $12,500 to $14,999 | 5,665 (2.0%) | 8,732 (3.3%) |
| $15,000 to $17,499 | 6,171 (2.1%) | 8,138 (3.0%) |
| $17,500 to $19,999 | 4,455 (1.5%) | 6,719 (2.5%) |
| $20,000 to $22,499 | 5,464 (1.9%) | 7,509 (2.8%) |
| $22,500 to $24,999 | 6,981 (2.4%) | 8,440 (3.2%) |
| $25,000 to $29,999 | 11,646 (4.0%) | 16,313 (6.1%) |
| $30,000 to $34,999 | 13,584 (4.7%) | 14,168 (5.3%) |
| $35,000 to $39,999 | 12,299 (4.3%) | 13,205 (5.0%) |
| $40,000 to $44,999 | 11,648 (4.0%) | 12,984 (4.9%) |
| $45,000 to $49,999 | 12,578 (4.3%) | 12,290 (4.6%) |
| $50,000 to $54,999 | 10,465 (3.6%) | 9,876 (3.7%) |
| $55,000 to $64,999 | 22,661 (7.8%) | 20,820 (7.8%) |
| $65,000 to $74,999 | 20,095 (7.0%) | 16,697 (6.3%) |
| $75,000 to $99,999 | 36,557 (12.7%) | 28,707 (10.8%) |
| $100,000+ | 64,473 (22.3%) | 31,612 (11.8%) |
| Total | 288,943 (100.0%) | 266,801 (100.0%) |
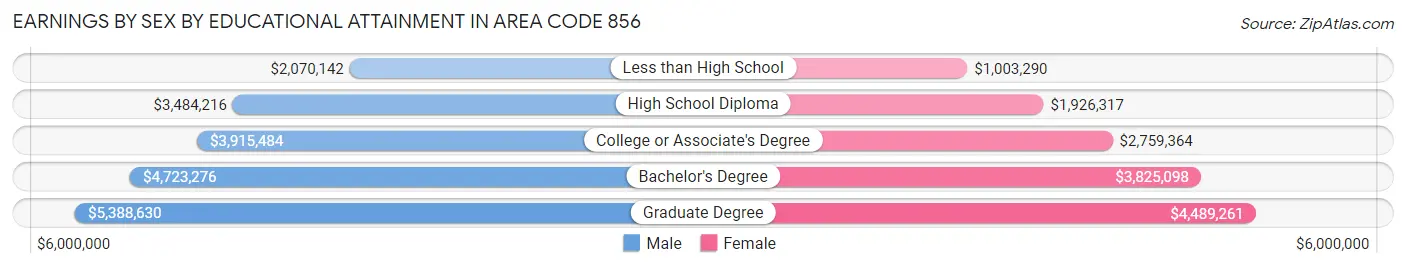
Earnings by Sex by Educational Attainment in Area Code 856
Average earnings in Area Code 856 are $4,520,023 for men and $3,242,261 for women, a difference of 28.3%. Men with an educational attainment of graduate degree enjoy the highest average annual earnings of $5,388,630, while those with less than high school education earn the least with $2,070,142. Women with an educational attainment of graduate degree earn the most with the average annual earnings of $4,489,261, while those with less than high school education have the smallest earnings of $1,003,290.
| Educational Attainment | Male Income | Female Income |
| Less than High School | $2,070,142 | $1,003,290 |
| High School Diploma | $3,484,216 | $1,926,317 |
| College or Associate's Degree | $3,915,484 | $2,759,364 |
| Bachelor's Degree | $4,723,276 | $3,825,098 |
| Graduate Degree | $5,388,630 | $4,489,261 |
| Total | $4,520,023 | $3,242,261 |
Family Income in Area Code 856
Family Income Brackets in Area Code 856
According to the Area Code 856 family income data, there are 4,383,497 families falling into the $100,000 to $149,999 income range, which is the most common income bracket and makes up 1,708.2% of all families. Conversely, the $10,000 to $14,999 income bracket is the least frequent group with only 261,234 families (101.8%) belonging to this category.
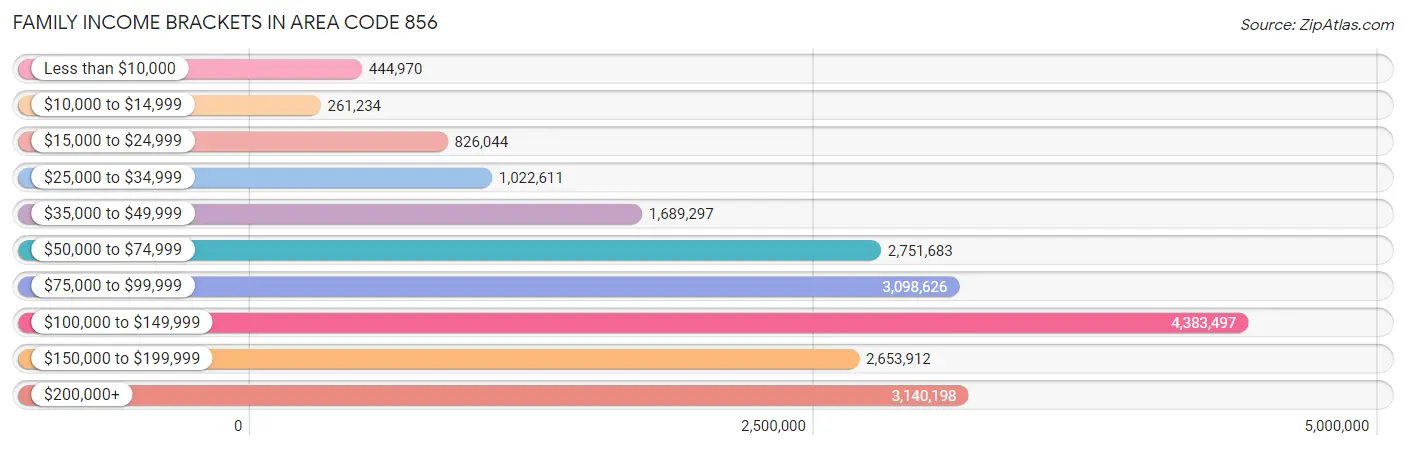
| Income Bracket | # Families | % Families |
| Less than $10,000 | 444,970 | 173.4% |
| $10,000 to $14,999 | 261,234 | 101.8% |
| $15,000 to $24,999 | 826,044 | 321.9% |
| $25,000 to $34,999 | 1,022,611 | 398.5% |
| $35,000 to $49,999 | 1,689,297 | 658.3% |
| $50,000 to $74,999 | 2,751,683 | 1,072.3% |
| $75,000 to $99,999 | 3,098,626 | 1,207.5% |
| $100,000 to $149,999 | 4,383,497 | 1,708.2% |
| $150,000 to $199,999 | 2,653,912 | 1,034.2% |
| $200,000+ | 3,140,198 | 1,223.7% |
Family Income by Famaliy Size in Area Code 856
6-person families (7,203 | 2.8%) account for the highest median family income in Area Code 856 with $156,749 per family, while 2-person families (109,890 | 42.8%) have the highest median income of $45,547 per family member.
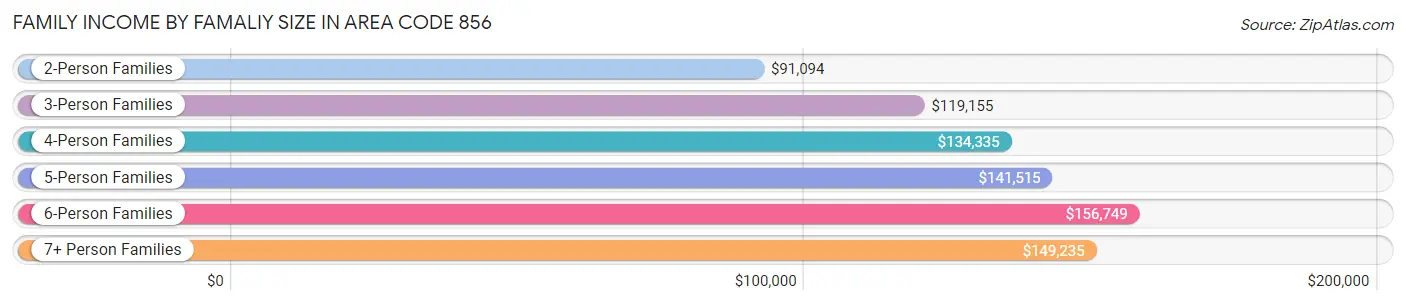
| Income Bracket | # Families | Median Income |
| 2-Person Families | 109,890 (42.8%) | $91,094 |
| 3-Person Families | 61,292 (23.9%) | $119,155 |
| 4-Person Families | 53,155 (20.7%) | $134,335 |
| 5-Person Families | 21,082 (8.2%) | $141,515 |
| 6-Person Families | 7,203 (2.8%) | $156,749 |
| 7+ Person Families | 3,993 (1.6%) | $149,234 |
| Total | 256,615 (100.0%) | $108,489 |
Family Income by Number of Earners in Area Code 856
The median family income in Area Code 856 is $108,489, with families comprising 3+ earners (36,880) having the highest median family income of $171,739, while families with no earners (32,165) have the lowest median family income of $56,628, accounting for 14.4% and 12.5% of families, respectively.
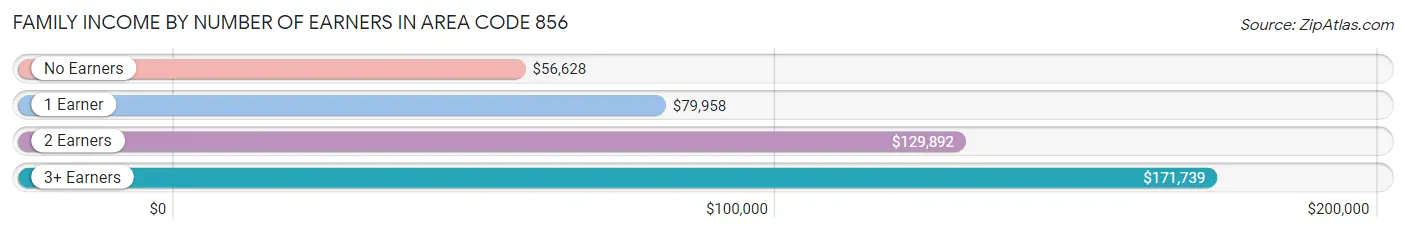
| Number of Earners | # Families | Median Income |
| No Earners | 32,165 (12.5%) | $56,628 |
| 1 Earner | 81,671 (31.8%) | $79,958 |
| 2 Earners | 105,899 (41.3%) | $129,892 |
| 3+ Earners | 36,880 (14.4%) | $171,739 |
| Total | 256,615 (100.0%) | $108,489 |
Household Income in Area Code 856
Household Income Brackets in Area Code 856
With 5,589,123 households falling in the category, the $100,000 to $149,999 income range is the most frequent in Area Code 856, accounting for 1,462.7% of all households. In contrast, only 845,227 households (221.2%) fall into the $10,000 to $14,999 income bracket, making it the least populous group.
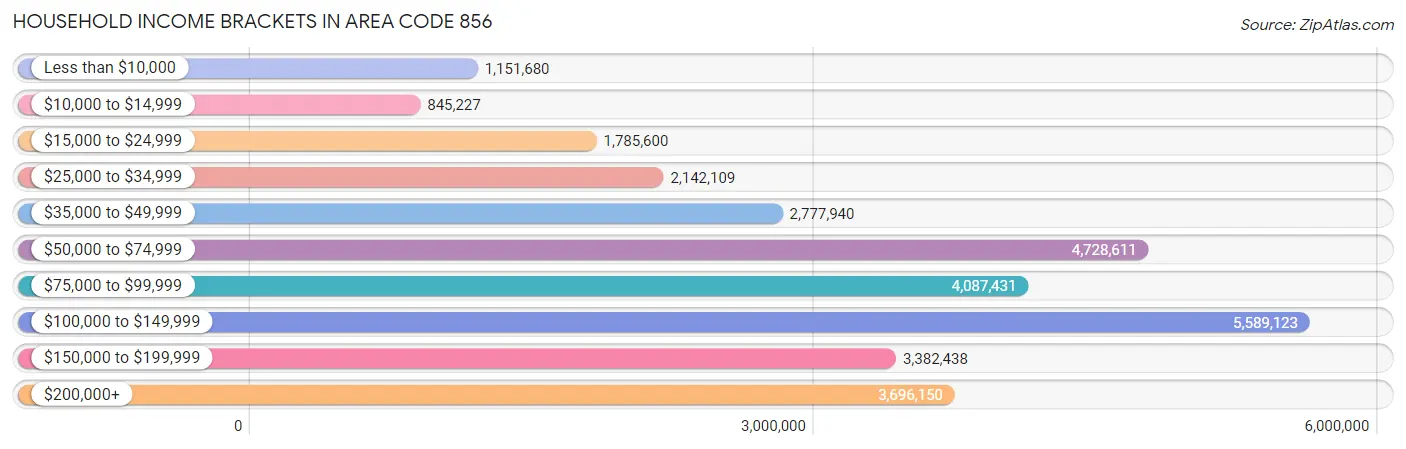
| Income Bracket | # Households | % Households |
| Less than $10,000 | 1,151,680 | 301.4% |
| $10,000 to $14,999 | 845,227 | 221.2% |
| $15,000 to $24,999 | 1,785,600 | 467.3% |
| $25,000 to $34,999 | 2,142,109 | 560.6% |
| $35,000 to $49,999 | 2,777,940 | 727.0% |
| $50,000 to $74,999 | 4,728,611 | 1,237.5% |
| $75,000 to $99,999 | 4,087,431 | 1,069.7% |
| $100,000 to $149,999 | 5,589,123 | 1,462.7% |
| $150,000 to $199,999 | 3,382,438 | 885.2% |
| $200,000+ | 3,696,150 | 967.3% |
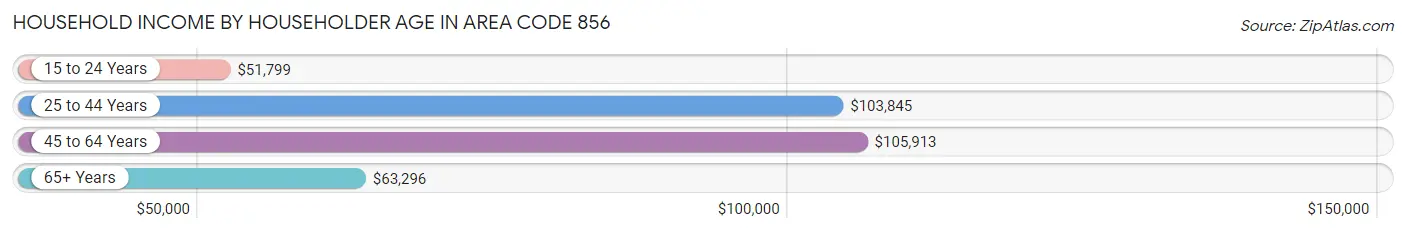
Household Income by Householder Age in Area Code 856
The median household income in Area Code 856 is $90,238, with the highest median household income of $105,913 found in the 45 to 64 years age bracket for the primary householder. A total of 150,652 households (39.4%) fall into this category. Meanwhile, the 15 to 24 years age bracket for the primary householder has the lowest median household income of $51,799, with 8,688 households (2.3%) in this group.
| Income Bracket | # Households | Median Income |
| 15 to 24 Years | 8,688 (2.3%) | $51,799 |
| 25 to 44 Years | 116,894 (30.6%) | $103,844 |
| 45 to 64 Years | 150,652 (39.4%) | $105,913 |
| 65+ Years | 105,876 (27.7%) | $63,296 |
| Total | 382,110 (100.0%) | $90,238 |
Poverty in Area Code 856
Income Below Poverty by Sex and Age in Area Code 856
With 10.0% poverty level for males and 12.3% for females among the residents of Area Code 856, under 5 year old males and 12 to 14 year old females are the most vulnerable to poverty, with 5,314 males (18.0%) and 3,461 females (17.5%) in their respective age groups living below the poverty level.
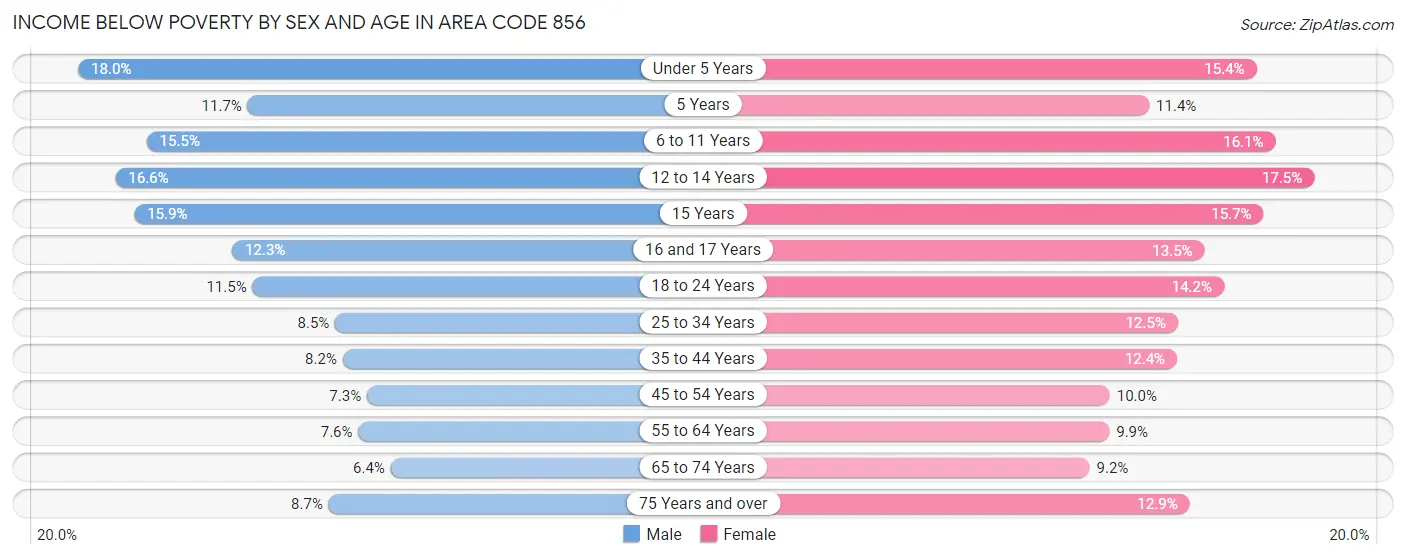
| Age Bracket | Male | Female |
| Under 5 Years | 5,314 (18.0%) | 4,211 (15.4%) |
| 5 Years | 785 (11.7%) | 653 (11.4%) |
| 6 to 11 Years | 6,202 (15.5%) | 6,353 (16.1%) |
| 12 to 14 Years | 3,234 (16.6%) | 3,461 (17.5%) |
| 15 Years | 1,117 (15.9%) | 1,042 (15.7%) |
| 16 and 17 Years | 1,718 (12.3%) | 1,707 (13.5%) |
| 18 to 24 Years | 5,022 (11.5%) | 6,019 (14.2%) |
| 25 to 34 Years | 5,429 (8.5%) | 8,049 (12.5%) |
| 35 to 44 Years | 5,287 (8.2%) | 8,243 (12.4%) |
| 45 to 54 Years | 4,672 (7.3%) | 6,733 (10.0%) |
| 55 to 64 Years | 5,041 (7.6%) | 7,118 (9.9%) |
| 65 to 74 Years | 2,849 (6.4%) | 4,770 (9.2%) |
| 75 Years and over | 2,298 (8.7%) | 5,225 (12.9%) |
| Total | 48,968 (10.0%) | 63,584 (12.3%) |
Income Above Poverty by Sex and Age in Area Code 856
According to the poverty statistics in Area Code 856, males aged 65 to 74 years and females aged 65 to 74 years are the age groups that are most secure financially, with 93.6% of males and 90.8% of females in these age groups living above the poverty line.
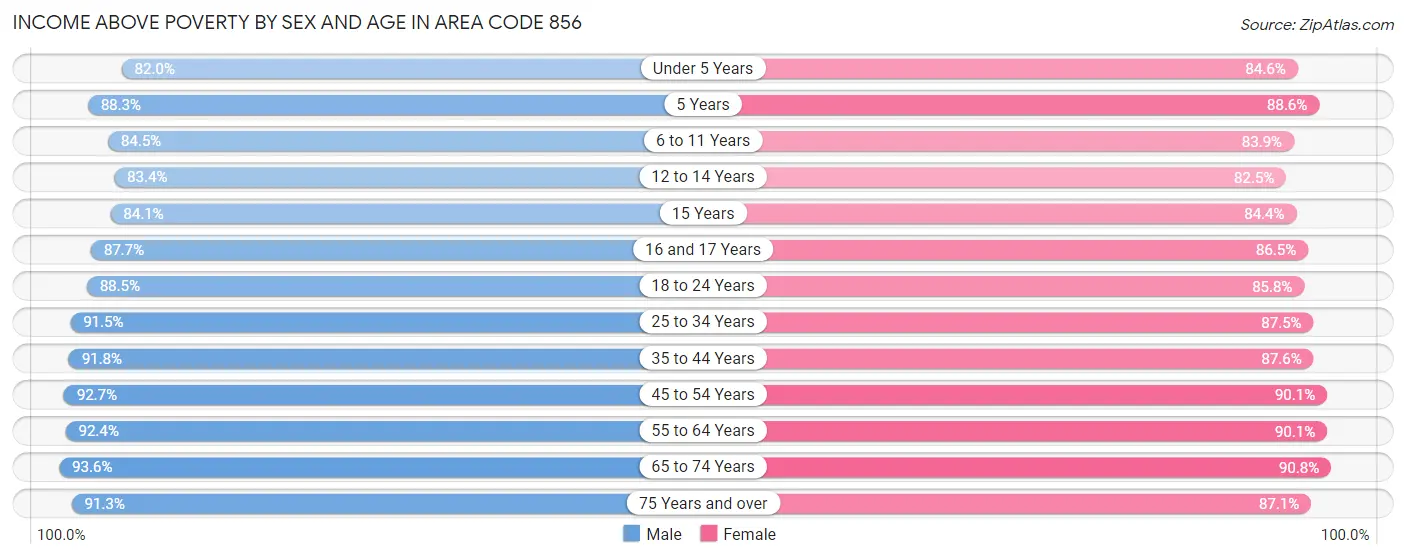
| Age Bracket | Male | Female |
| Under 5 Years | 24,184 (82.0%) | 23,158 (84.6%) |
| 5 Years | 5,911 (88.3%) | 5,068 (88.6%) |
| 6 to 11 Years | 33,881 (84.5%) | 33,131 (83.9%) |
| 12 to 14 Years | 16,217 (83.4%) | 16,283 (82.5%) |
| 15 Years | 5,896 (84.1%) | 5,616 (84.4%) |
| 16 and 17 Years | 12,253 (87.7%) | 10,974 (86.5%) |
| 18 to 24 Years | 38,503 (88.5%) | 36,421 (85.8%) |
| 25 to 34 Years | 58,656 (91.5%) | 56,523 (87.5%) |
| 35 to 44 Years | 59,242 (91.8%) | 57,997 (87.6%) |
| 45 to 54 Years | 59,377 (92.7%) | 60,952 (90.0%) |
| 55 to 64 Years | 61,215 (92.4%) | 64,579 (90.1%) |
| 65 to 74 Years | 41,602 (93.6%) | 47,071 (90.8%) |
| 75 Years and over | 24,085 (91.3%) | 35,259 (87.1%) |
| Total | 441,022 (90.0%) | 453,032 (87.7%) |
Income Below Poverty Among Married-Couple Families in Area Code 856
The poverty statistics for married-couple families in Area Code 856 show that 3.2% or 5,758 of the total 178,672 families live below the poverty line. Families with 3 or 4 children have the highest poverty rate of 9.3%, comprising of 1,272 families. On the other hand, families with no children have the lowest poverty rate of 2.7%, which includes 2,814 families.
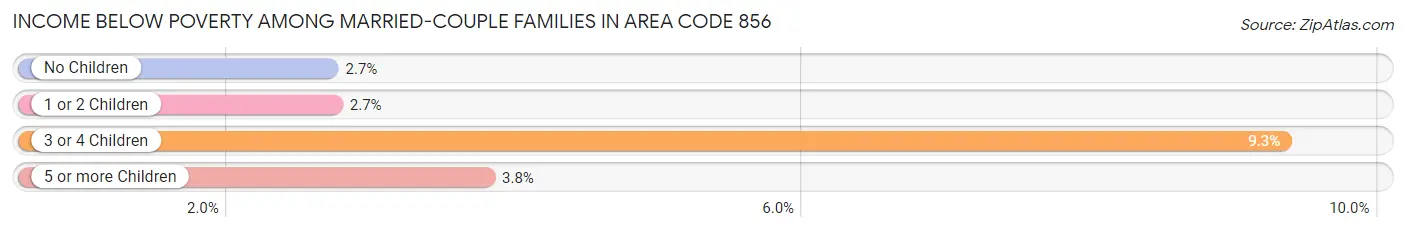
| Children | Above Poverty | Below Poverty |
| No Children | 101,256 (97.3%) | 2,814 (2.7%) |
| 1 or 2 Children | 58,501 (97.3%) | 1,640 (2.7%) |
| 3 or 4 Children | 12,344 (90.7%) | 1,272 (9.3%) |
| 5 or more Children | 813 (96.2%) | 32 (3.8%) |
| Total | 172,914 (96.8%) | 5,758 (3.2%) |
Income Below Poverty Among Single-Parent Households in Area Code 856
According to the poverty data in Area Code 856, 11.0% or 2,406 single-father households and 22.5% or 12,603 single-mother households are living below the poverty line. Among single-father households, those with 5 or more children have the highest poverty rate, with 45 households (40.5%) experiencing poverty. Likewise, among single-mother households, those with 5 or more children have the highest poverty rate, with 323 households (73.9%) falling below the poverty line.
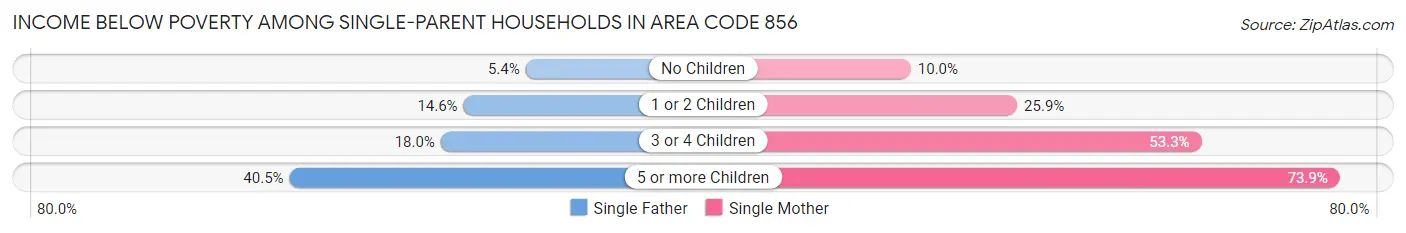
| Children | Single Father | Single Mother |
| No Children | 511 (5.3%) | 2,348 (10.0%) |
| 1 or 2 Children | 1,496 (14.6%) | 6,803 (25.9%) |
| 3 or 4 Children | 354 (18.0%) | 3,129 (53.3%) |
| 5 or more Children | 45 (40.5%) | 323 (73.9%) |
| Total | 2,406 (11.0%) | 12,603 (22.5%) |
Income Below Poverty Among Married-Couple vs Single-Parent Households in Area Code 856
The poverty data for Area Code 856 shows that 5,758 of the married-couple family households (3.2%) and 15,009 of the single-parent households (19.3%) are living below the poverty level. Within the married-couple family households, those with 3 or 4 children have the highest poverty rate, with 1,272 households (9.3%) falling below the poverty line. Among the single-parent households, those with 5 or more children have the highest poverty rate, with 368 household (67.1%) living below poverty.
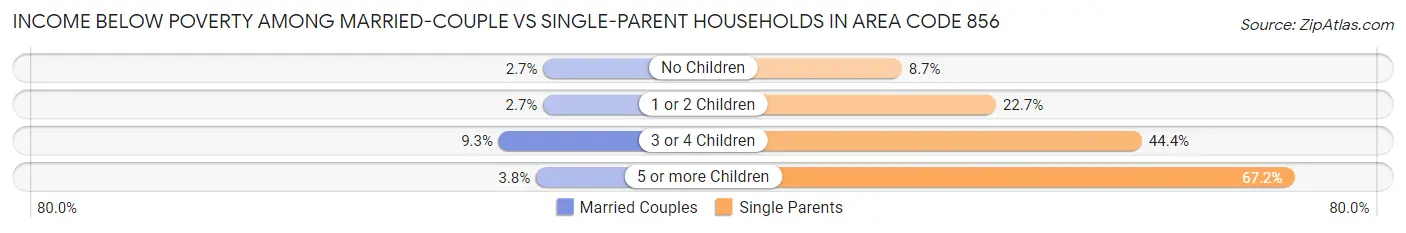
| Children | Married-Couple Families | Single-Parent Households |
| No Children | 2,814 (2.7%) | 2,859 (8.7%) |
| 1 or 2 Children | 1,640 (2.7%) | 8,299 (22.7%) |
| 3 or 4 Children | 1,272 (9.3%) | 3,483 (44.4%) |
| 5 or more Children | 32 (3.8%) | 368 (67.1%) |
| Total | 5,758 (3.2%) | 15,009 (19.3%) |
Race in Area Code 856
The most populous races in Area Code 856 are White / Caucasian (688,301 | 66.9%), Hispanic or Latino (169,130 | 16.4%), and Black / African American (150,142 | 14.6%).
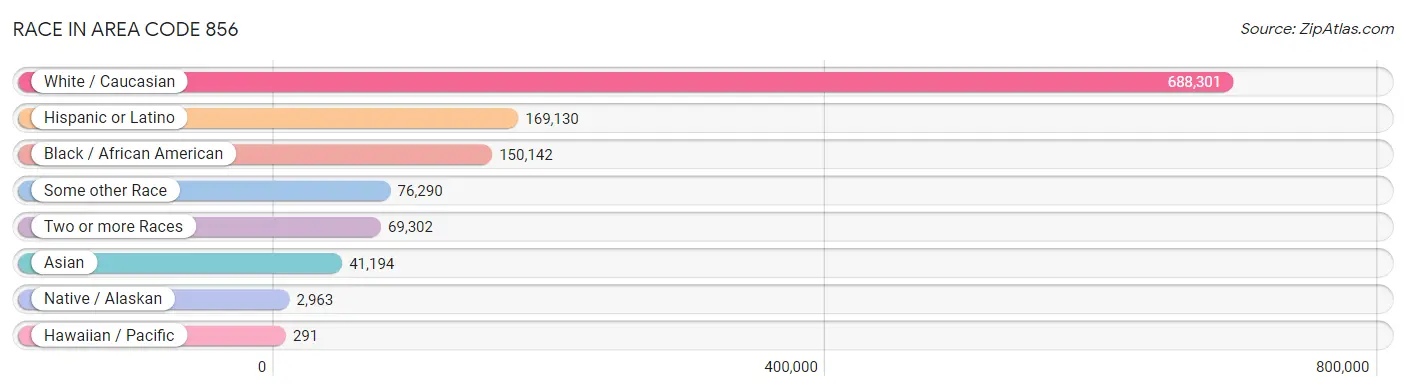
| Race | # Population | % Population |
| Asian | 41,194 | 4.0% |
| Black / African American | 150,142 | 14.6% |
| Hawaiian / Pacific | 291 | 0.0% |
| Hispanic or Latino | 169,130 | 16.4% |
| Native / Alaskan | 2,963 | 0.3% |
| White / Caucasian | 688,301 | 66.9% |
| Two or more Races | 69,302 | 6.7% |
| Some other Race | 76,290 | 7.4% |
| Total | 1,028,483 | 100.0% |
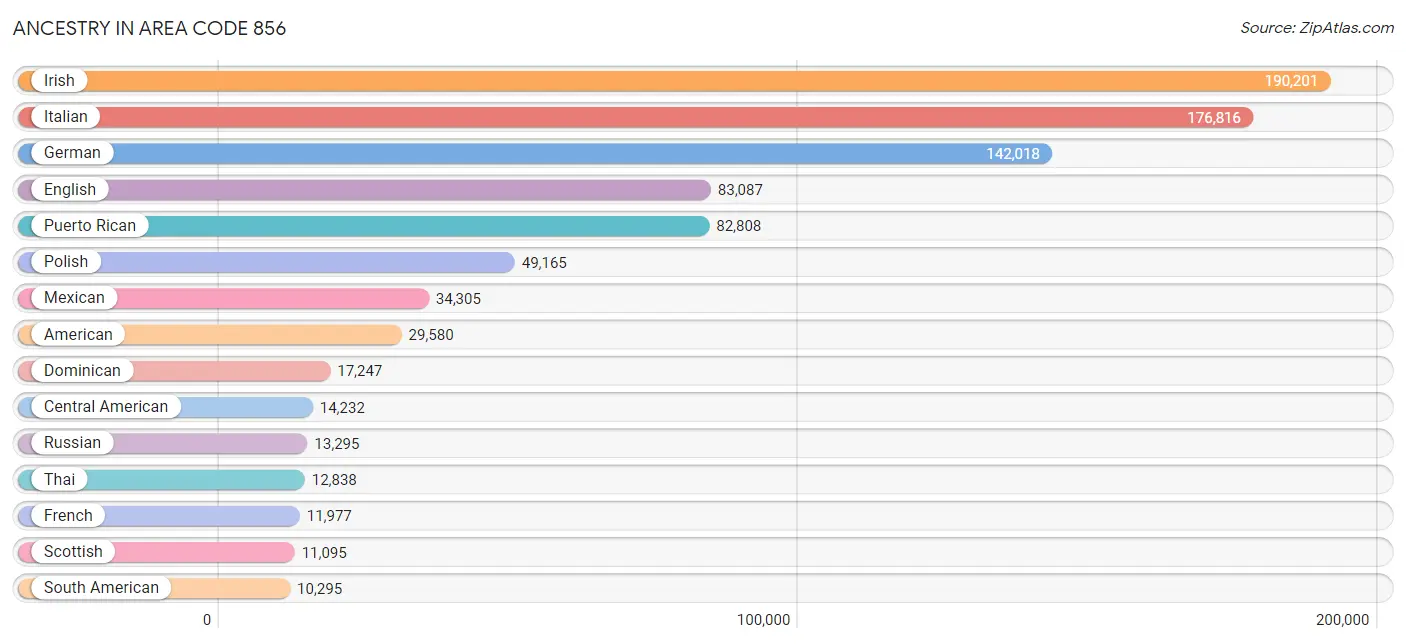
Ancestry in Area Code 856
The most populous ancestries reported in Area Code 856 are Irish (190,201 | 18.5%), Italian (176,816 | 17.2%), German (142,018 | 13.8%), English (83,087 | 8.1%), and Puerto Rican (82,808 | 8.1%), together accounting for 65.6% of all Area Code 856 residents.
| Ancestry | # Population | % Population |
| Afghan | 128 | 0.0% |
| African | 4,667 | 0.4% |
| Alaskan Athabascan | 9 | 0.0% |
| Albanian | 942 | 0.1% |
| Alsatian | 23 | 0.0% |
| American | 29,580 | 2.9% |
| Apache | 207 | 0.0% |
| Arab | 3,855 | 0.4% |
| Arapaho | 7 | 0.0% |
| Argentinean | 623 | 0.1% |
| Armenian | 1,051 | 0.1% |
| Australian | 230 | 0.0% |
| Austrian | 2,204 | 0.2% |
| Bahamian | 164 | 0.0% |
| Barbadian | 191 | 0.0% |
| Basque | 52 | 0.0% |
| Belgian | 536 | 0.1% |
| Bermudan | 52 | 0.0% |
| Bhutanese | 2,149 | 0.2% |
| Blackfeet | 671 | 0.1% |
| Bolivian | 736 | 0.1% |
| Brazilian | 2,031 | 0.2% |
| British | 3,159 | 0.3% |
| British West Indian | 277 | 0.0% |
| Bulgarian | 31 | 0.0% |
| Burmese | 4,314 | 0.4% |
| Cajun | 34 | 0.0% |
| Canadian | 777 | 0.1% |
| Cape Verdean | 11 | 0.0% |
| Carpatho Rusyn | 43 | 0.0% |
| Celtic | 81 | 0.0% |
| Central American | 14,232 | 1.4% |
| Central American Indian | 1,312 | 0.1% |
| Cherokee | 1,766 | 0.2% |
| Cheyenne | 1 | 0.0% |
| Chickasaw | 89 | 0.0% |
| Chilean | 261 | 0.0% |
| Chinese | 253 | 0.0% |
| Chippewa | 59 | 0.0% |
| Choctaw | 29 | 0.0% |
| Colombian | 4,015 | 0.4% |
| Costa Rican | 374 | 0.0% |
| Cree | 22 | 0.0% |
| Creek | 15 | 0.0% |
| Croatian | 875 | 0.1% |
| Cuban | 3,311 | 0.3% |
| Czech | 1,794 | 0.2% |
| Czechoslovakian | 665 | 0.1% |
| Danish | 1,188 | 0.1% |
| Delaware | 756 | 0.1% |
| Dominican | 17,247 | 1.7% |
| Dutch | 5,879 | 0.6% |
| Eastern European | 4,185 | 0.4% |
| Ecuadorian | 2,005 | 0.2% |
| Egyptian | 1,003 | 0.1% |
| English | 83,087 | 8.1% |
| Estonian | 244 | 0.0% |
| Ethiopian | 531 | 0.1% |
| European | 7,957 | 0.8% |
| Filipino | 358 | 0.0% |
| Finnish | 699 | 0.1% |
| French | 11,977 | 1.2% |
| French American Indian | 21 | 0.0% |
| French Canadian | 2,152 | 0.2% |
| German | 142,018 | 13.8% |
| German Russian | 39 | 0.0% |
| Ghanaian | 517 | 0.1% |
| Greek | 4,658 | 0.4% |
| Guamanian / Chamorro | 76 | 0.0% |
| Guatemalan | 4,367 | 0.4% |
| Guyanese | 547 | 0.1% |
| Haitian | 3,094 | 0.3% |
| Hmong | 36 | 0.0% |
| Honduran | 2,683 | 0.3% |
| Hungarian | 5,957 | 0.6% |
| Icelander | 34 | 0.0% |
| Indian (Asian) | 9,279 | 0.9% |
| Indonesian | 48 | 0.0% |
| Inupiat | 9 | 0.0% |
| Iranian | 294 | 0.0% |
| Iraqi | 139 | 0.0% |
| Irish | 190,201 | 18.5% |
| Iroquois | 146 | 0.0% |
| Israeli | 465 | 0.1% |
| Italian | 176,816 | 17.2% |
| Jamaican | 4,634 | 0.4% |
| Japanese | 1,879 | 0.2% |
| Jordanian | 225 | 0.0% |
| Korean | 9,613 | 0.9% |
| Laotian | 146 | 0.0% |
| Latvian | 398 | 0.0% |
| Lebanese | 745 | 0.1% |
| Liberian | 153 | 0.0% |
| Lithuanian | 4,425 | 0.4% |
| Lumbee | 11 | 0.0% |
| Malaysian | 112 | 0.0% |
| Maltese | 39 | 0.0% |
| Mexican | 34,305 | 3.3% |
| Mexican American Indian | 338 | 0.0% |
| Moroccan | 478 | 0.1% |
| Native Hawaiian | 389 | 0.0% |
| Navajo | 107 | 0.0% |
| New Zealander | 22 | 0.0% |
| Nicaraguan | 1,985 | 0.2% |
| Nigerian | 2,065 | 0.2% |
| Northern European | 522 | 0.1% |
| Norwegian | 3,743 | 0.4% |
| Okinawan | 23 | 0.0% |
| Paiute | 5 | 0.0% |
| Pakistani | 416 | 0.0% |
| Palestinian | 126 | 0.0% |
| Panamanian | 714 | 0.1% |
| Paraguayan | 26 | 0.0% |
| Pennsylvania German | 1,095 | 0.1% |
| Peruvian | 1,238 | 0.1% |
| Polish | 49,165 | 4.8% |
| Portuguese | 2,050 | 0.2% |
| Potawatomi | 6 | 0.0% |
| Puerto Rican | 82,808 | 8.1% |
| Romanian | 1,735 | 0.2% |
| Russian | 13,295 | 1.3% |
| Salvadoran | 4,069 | 0.4% |
| Samoan | 66 | 0.0% |
| Scandinavian | 1,428 | 0.1% |
| Scotch-Irish | 5,463 | 0.5% |
| Scottish | 11,095 | 1.1% |
| Seminole | 37 | 0.0% |
| Senegalese | 1 | 0.0% |
| Serbian | 652 | 0.1% |
| Sierra Leonean | 906 | 0.1% |
| Sioux | 81 | 0.0% |
| Slavic | 431 | 0.0% |
| Slovak | 2,213 | 0.2% |
| Slovene | 121 | 0.0% |
| Somali | 105 | 0.0% |
| South African | 153 | 0.0% |
| South American | 10,295 | 1.0% |
| South American Indian | 258 | 0.0% |
| Spaniard | 1,305 | 0.1% |
| Spanish | 1,256 | 0.1% |
| Spanish American | 151 | 0.0% |
| Spanish American Indian | 19 | 0.0% |
| Sri Lankan | 5,696 | 0.5% |
| Subsaharan African | 9,413 | 0.9% |
| Swedish | 5,550 | 0.5% |
| Swiss | 1,134 | 0.1% |
| Syrian | 454 | 0.0% |
| Thai | 12,838 | 1.3% |
| Trinidadian and Tobagonian | 674 | 0.1% |
| Turkish | 2,554 | 0.3% |
| U.S. Virgin Islander | 27 | 0.0% |
| Ukrainian | 7,134 | 0.7% |
| Uruguayan | 334 | 0.0% |
| Venezuelan | 1,057 | 0.1% |
| Vietnamese | 469 | 0.1% |
| Welsh | 7,149 | 0.7% |
| West Indian | 999 | 0.1% |
| Yugoslavian | 750 | 0.1% | View All 158 Rows |
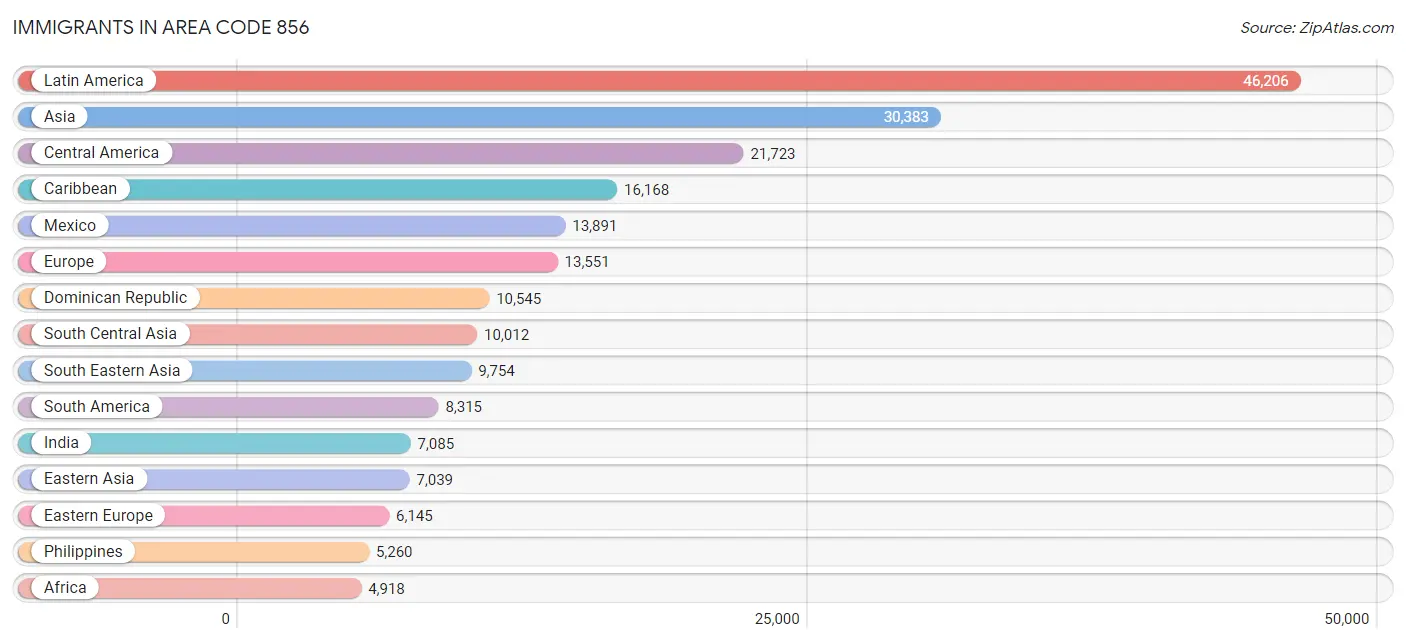
Immigrants in Area Code 856
The most numerous immigrant groups reported in Area Code 856 came from Latin America (46,206 | 4.5%), Asia (30,383 | 2.9%), Central America (21,723 | 2.1%), Caribbean (16,168 | 1.6%), and Mexico (13,891 | 1.3%), together accounting for 12.5% of all Area Code 856 residents.
| Immigration Origin | # Population | % Population |
| Afghanistan | 98 | 0.0% |
| Africa | 4,918 | 0.5% |
| Albania | 367 | 0.0% |
| Argentina | 298 | 0.0% |
| Armenia | 32 | 0.0% |
| Asia | 30,383 | 2.9% |
| Australia | 181 | 0.0% |
| Austria | 86 | 0.0% |
| Bahamas | 115 | 0.0% |
| Bangladesh | 766 | 0.1% |
| Barbados | 54 | 0.0% |
| Belarus | 84 | 0.0% |
| Belgium | 50 | 0.0% |
| Belize | 68 | 0.0% |
| Bolivia | 348 | 0.0% |
| Bosnia and Herzegovina | 269 | 0.0% |
| Brazil | 1,914 | 0.2% |
| Bulgaria | 24 | 0.0% |
| Cambodia | 428 | 0.0% |
| Cameroon | 150 | 0.0% |
| Canada | 1,493 | 0.2% |
| Caribbean | 16,168 | 1.6% |
| Central America | 21,723 | 2.1% |
| Chile | 184 | 0.0% |
| China | 4,051 | 0.4% |
| Colombia | 1,908 | 0.2% |
| Costa Rica | 127 | 0.0% |
| Croatia | 91 | 0.0% |
| Cuba | 830 | 0.1% |
| Czechoslovakia | 160 | 0.0% |
| Denmark | 8 | 0.0% |
| Dominica | 83 | 0.0% |
| Dominican Republic | 10,545 | 1.0% |
| Eastern Africa | 773 | 0.1% |
| Eastern Asia | 7,039 | 0.7% |
| Eastern Europe | 6,145 | 0.6% |
| Ecuador | 1,585 | 0.2% |
| Egypt | 544 | 0.1% |
| El Salvador | 2,297 | 0.2% |
| England | 814 | 0.1% |
| Eritrea | 15 | 0.0% |
| Ethiopia | 419 | 0.0% |
| Europe | 13,551 | 1.3% |
| France | 344 | 0.0% |
| Germany | 1,497 | 0.2% |
| Ghana | 517 | 0.1% |
| Greece | 642 | 0.1% |
| Grenada | 131 | 0.0% |
| Guatemala | 2,546 | 0.3% |
| Guyana | 517 | 0.1% |
| Haiti | 1,017 | 0.1% |
| Honduras | 1,758 | 0.2% |
| Hong Kong | 292 | 0.0% |
| Hungary | 119 | 0.0% |
| India | 7,085 | 0.7% |
| Indonesia | 57 | 0.0% |
| Iran | 136 | 0.0% |
| Iraq | 185 | 0.0% |
| Ireland | 338 | 0.0% |
| Israel | 493 | 0.1% |
| Italy | 1,759 | 0.2% |
| Jamaica | 2,717 | 0.3% |
| Japan | 504 | 0.1% |
| Jordan | 256 | 0.0% |
| Kazakhstan | 158 | 0.0% |
| Kenya | 181 | 0.0% |
| Korea | 2,484 | 0.2% |
| Kuwait | 47 | 0.0% |
| Laos | 56 | 0.0% |
| Latin America | 46,206 | 4.5% |
| Latvia | 61 | 0.0% |
| Lebanon | 130 | 0.0% |
| Liberia | 248 | 0.0% |
| Lithuania | 37 | 0.0% |
| Malaysia | 67 | 0.0% |
| Mexico | 13,891 | 1.3% |
| Middle Africa | 180 | 0.0% |
| Moldova | 65 | 0.0% |
| Morocco | 130 | 0.0% |
| Nepal | 147 | 0.0% |
| Netherlands | 152 | 0.0% |
| Nicaragua | 868 | 0.1% |
| Nigeria | 1,081 | 0.1% |
| North Macedonia | 72 | 0.0% |
| Northern Africa | 692 | 0.1% |
| Northern Europe | 2,142 | 0.2% |
| Norway | 32 | 0.0% |
| Oceania | 224 | 0.0% |
| Pakistan | 1,406 | 0.1% |
| Panama | 168 | 0.0% |
| Peru | 720 | 0.1% |
| Philippines | 5,260 | 0.5% |
| Poland | 1,419 | 0.1% |
| Portugal | 357 | 0.0% |
| Romania | 248 | 0.0% |
| Russia | 1,056 | 0.1% |
| Saudi Arabia | 22 | 0.0% |
| Scotland | 78 | 0.0% |
| Senegal | 1 | 0.0% |
| Serbia | 400 | 0.0% |
| Sierra Leone | 640 | 0.1% |
| Singapore | 78 | 0.0% |
| Somalia | 49 | 0.0% |
| South Africa | 97 | 0.0% |
| South America | 8,315 | 0.8% |
| South Central Asia | 10,012 | 1.0% |
| South Eastern Asia | 9,754 | 0.9% |
| Southern Europe | 2,987 | 0.3% |
| Spain | 228 | 0.0% |
| Sri Lanka | 63 | 0.0% |
| Sweden | 109 | 0.0% |
| Switzerland | 144 | 0.0% |
| Syria | 191 | 0.0% |
| Taiwan | 455 | 0.0% |
| Thailand | 183 | 0.0% |
| Trinidad and Tobago | 548 | 0.1% |
| Turkey | 1,978 | 0.2% |
| Uganda | 35 | 0.0% |
| Ukraine | 1,227 | 0.1% |
| Uruguay | 193 | 0.0% |
| Uzbekistan | 131 | 0.0% |
| Venezuela | 608 | 0.1% |
| Vietnam | 3,585 | 0.4% |
| West Indies | 41 | 0.0% |
| Western Africa | 2,888 | 0.3% |
| Western Asia | 3,570 | 0.4% |
| Western Europe | 2,273 | 0.2% |
| Zaire | 30 | 0.0% | View All 128 Rows |
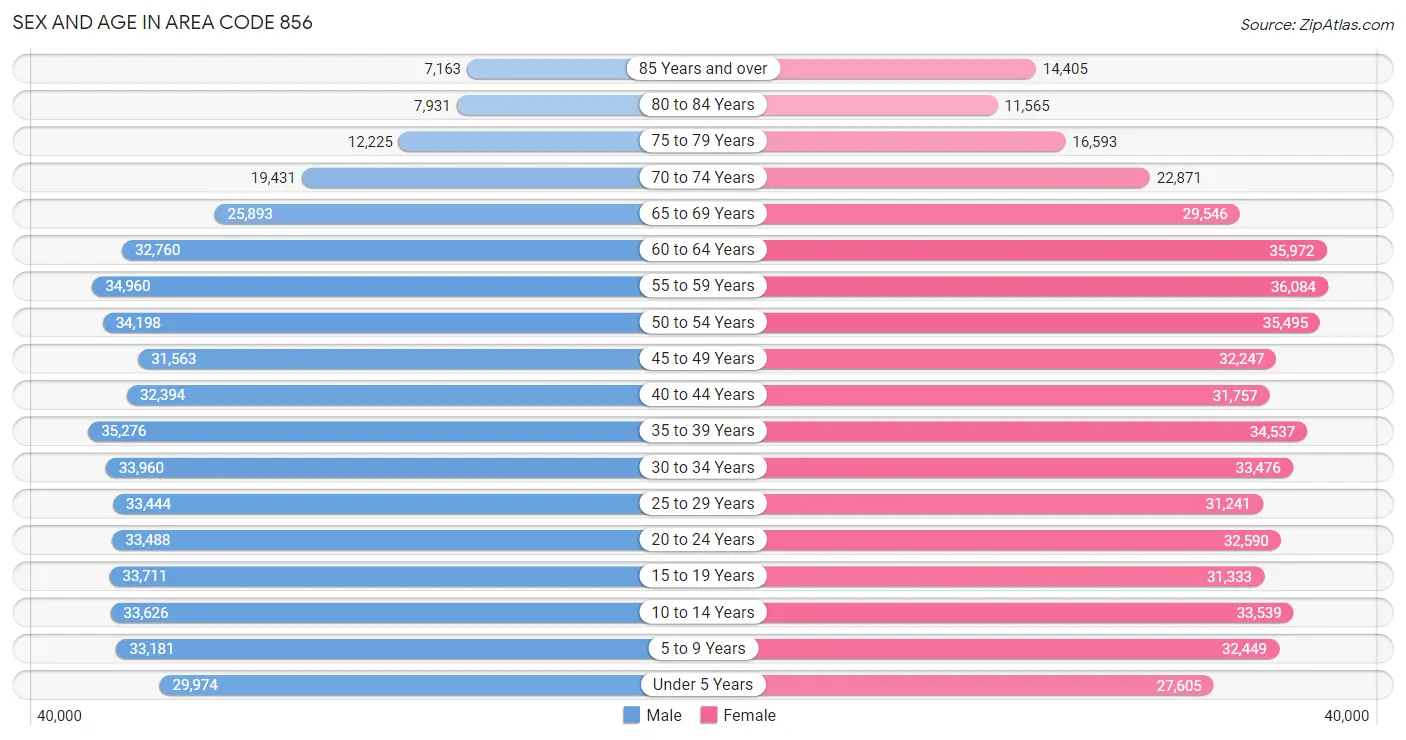
Sex and Age in Area Code 856
Sex and Age in Area Code 856
The most populous age groups in Area Code 856 are 35 to 39 Years (35,276 | 7.0%) for men and 55 to 59 Years (36,084 | 6.9%) for women.
| Age Bracket | Male | Female |
| Under 5 Years | 29,974 (5.9%) | 27,605 (5.3%) |
| 5 to 9 Years | 33,181 (6.6%) | 32,449 (6.2%) |
| 10 to 14 Years | 33,626 (6.7%) | 33,539 (6.4%) |
| 15 to 19 Years | 33,711 (6.7%) | 31,333 (6.0%) |
| 20 to 24 Years | 33,488 (6.6%) | 32,590 (6.2%) |
| 25 to 29 Years | 33,444 (6.6%) | 31,241 (6.0%) |
| 30 to 34 Years | 33,960 (6.7%) | 33,476 (6.4%) |
| 35 to 39 Years | 35,276 (7.0%) | 34,537 (6.6%) |
| 40 to 44 Years | 32,394 (6.4%) | 31,757 (6.1%) |
| 45 to 49 Years | 31,563 (6.2%) | 32,247 (6.2%) |
| 50 to 54 Years | 34,198 (6.8%) | 35,495 (6.8%) |
| 55 to 59 Years | 34,960 (6.9%) | 36,084 (6.9%) |
| 60 to 64 Years | 32,760 (6.5%) | 35,972 (6.9%) |
| 65 to 69 Years | 25,893 (5.1%) | 29,546 (5.7%) |
| 70 to 74 Years | 19,431 (3.8%) | 22,871 (4.4%) |
| 75 to 79 Years | 12,225 (2.4%) | 16,593 (3.2%) |
| 80 to 84 Years | 7,931 (1.6%) | 11,565 (2.2%) |
| 85 Years and over | 7,163 (1.4%) | 14,405 (2.8%) |
| Total | 505,178 (100.0%) | 523,305 (100.0%) |
Families and Households in Area Code 856
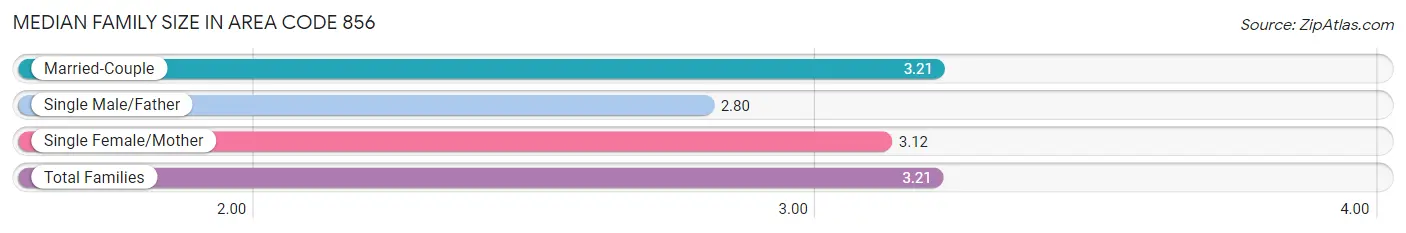
Median Family Size in Area Code 856
The median family size in Area Code 856 is 3.21 persons per family, with married-couple families (178,672 | 69.6%) accounting for the largest median family size of 3.21139 persons per family. On the other hand, single male/father families (21,867 | 8.5%) represent the smallest median family size with 2.80 persons per family.
| Family Type | # Families | Family Size |
| Married-Couple | 178,672 (69.6%) | 3.21 |
| Single Male/Father | 21,867 (8.5%) | 2.80 |
| Single Female/Mother | 56,076 (21.8%) | 3.12 |
| Total Families | 256,615 (100.0%) | 3.21 |
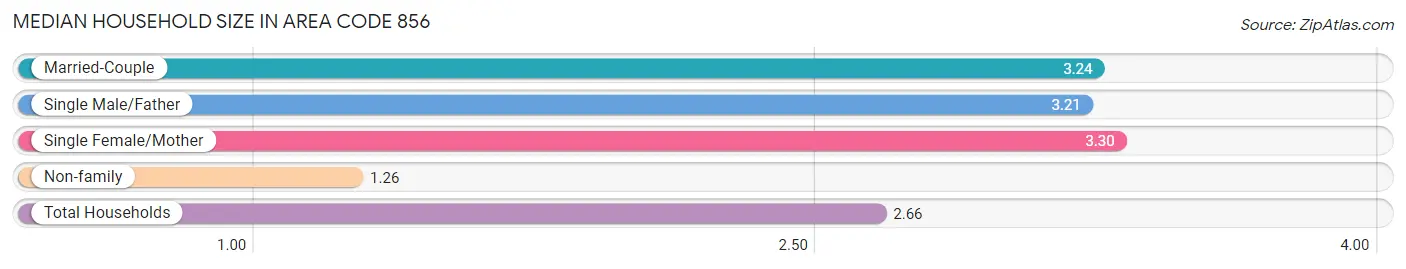
Median Household Size in Area Code 856
The median household size in Area Code 856 is 2.66 persons per household, with single female/mother households (56,076 | 14.7%) accounting for the largest median household size of 3.30347 persons per household. non-family households (125,495 | 32.8%) represent the smallest median household size with 1.26 persons per household.
| Household Type | # Households | Household Size |
| Married-Couple | 178,672 (46.8%) | 3.24 |
| Single Male/Father | 21,867 (5.7%) | 3.21 |
| Single Female/Mother | 56,076 (14.7%) | 3.30 |
| Non-family | 125,495 (32.8%) | 1.26 |
| Total Households | 382,110 (100.0%) | 2.66 |
Household Size by Marriage Status in Area Code 856
Out of a total of 382,110 households in Area Code 856, 256,615 (67.2%) are family households, while 125,495 (32.8%) are nonfamily households. The most numerous type of family households are 2-person households, comprising 101,711, and the most common type of nonfamily households are 1-person households, comprising 102,833.
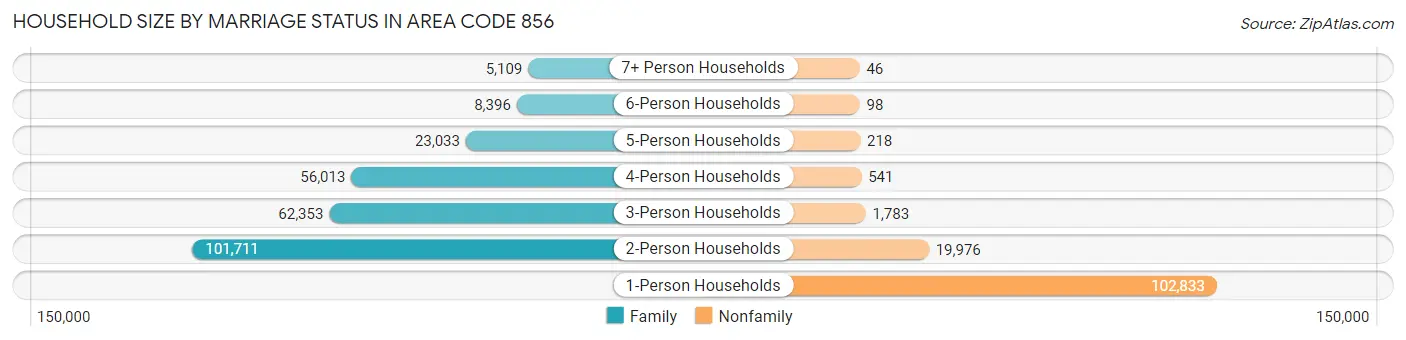
| Household Size | Family Households | Nonfamily Households |
| 1-Person Households | - | 102,833 (26.9%) |
| 2-Person Households | 101,711 (26.6%) | 19,976 (5.2%) |
| 3-Person Households | 62,353 (16.3%) | 1,783 (0.5%) |
| 4-Person Households | 56,013 (14.7%) | 541 (0.1%) |
| 5-Person Households | 23,033 (6.0%) | 218 (0.1%) |
| 6-Person Households | 8,396 (2.2%) | 98 (0.0%) |
| 7+ Person Households | 5,109 (1.3%) | 46 (0.0%) |
| Total | 256,615 (67.2%) | 125,495 (32.8%) |
Female Fertility in Area Code 856
Fertility by Age in Area Code 856
Average fertility rate in Area Code 856 is 54.7 births per 1,000 women. Women in the age bracket of 20 to 34 years have the highest fertility rate with 95.2 births per 1,000 women. Women in the age bracket of 20 to 34 years acount for 66.3% of all women with births.
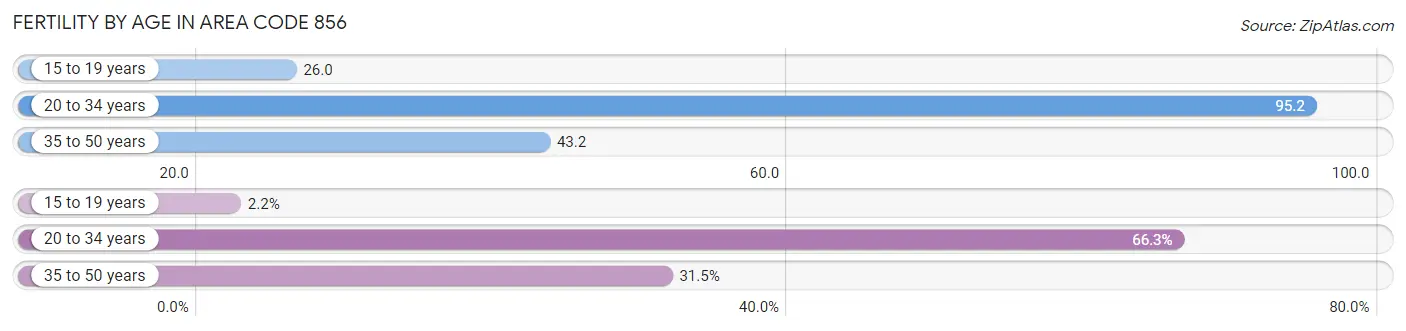
| Age Bracket | Women with Births | Births / 1,000 Women |
| 15 to 19 years | 257 (2.2%) | 26.0 |
| 20 to 34 years | 7,644 (66.3%) | 95.2 |
| 35 to 50 years | 3,636 (31.5%) | 43.2 |
| Total | 11,537 (100.0%) | 54.7 |
Fertility by Age by Marriage Status in Area Code 856
60.6% of women with births (11,537) in Area Code 856 are married. The highest percentage of unmarried women with births falls into 15 to 19 years age bracket with 92.2% of them unmarried at the time of birth, while the lowest percentage of unmarried women with births belong to 20 to 34 years age bracket with 43.7% of them unmarried.
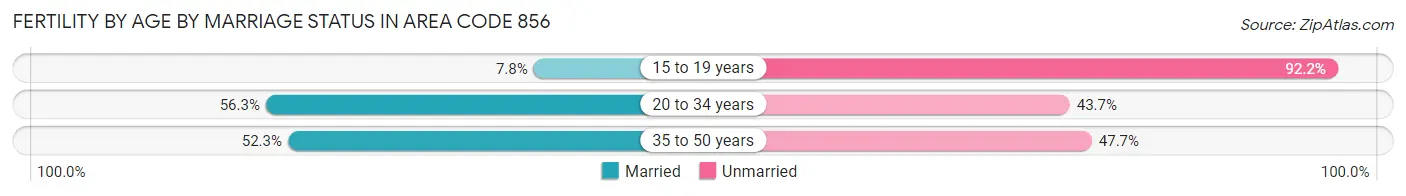
| Age Bracket | Married | Unmarried |
| 15 to 19 years | 20 (7.8%) | 237 (92.2%) |
| 20 to 34 years | 4,304 (56.3%) | 3,340 (43.7%) |
| 35 to 50 years | 1,902 (52.3%) | 1,734 (47.7%) |
| Total | 6,993 (60.6%) | 4,544 (39.4%) |
Fertility by Education in Area Code 856
Average fertility rate in Area Code 856 is 54.7 births per 1,000 women. Women with the education attainment of graduate degree have the highest fertility rate of 94.2 births per 1,000 women, while women with the education attainment of less than high school have the lowest fertility at 46.6 births per 1,000 women. Women with the education attainment of college or associate's degree represent 29.8% of all women with births.
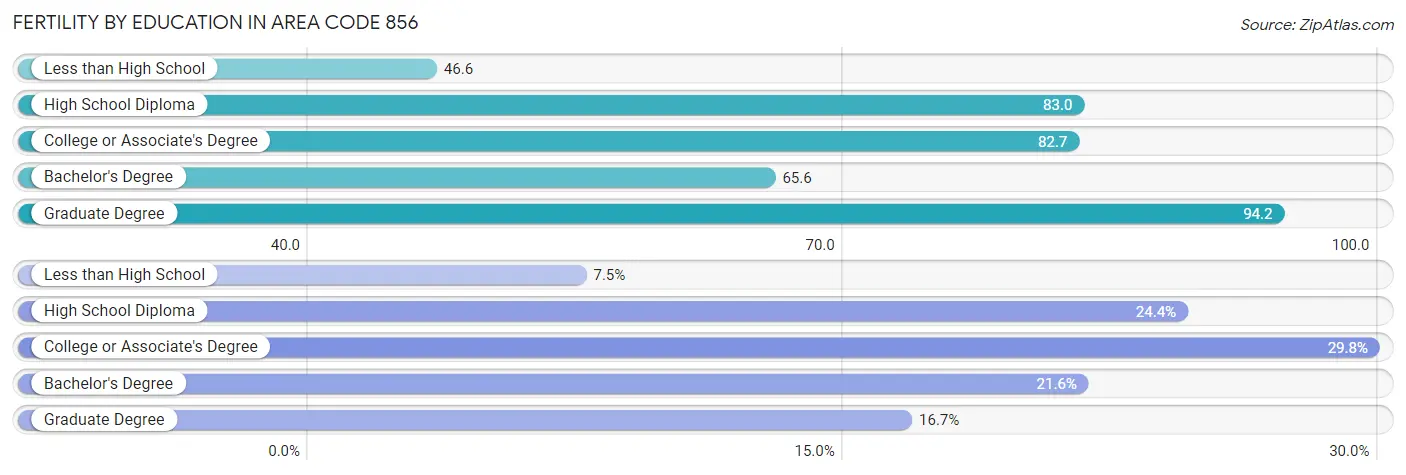
| Educational Attainment | Women with Births | Births / 1,000 Women |
| Less than High School | 867 (7.5%) | 46.6 |
| High School Diploma | 2,816 (24.4%) | 83.0 |
| College or Associate's Degree | 3,438 (29.8%) | 82.7 |
| Bachelor's Degree | 2,494 (21.6%) | 65.6 |
| Graduate Degree | 1,922 (16.7%) | 94.2 |
| Total | 11,537 (100.0%) | 54.7 |
Fertility by Education by Marriage Status in Area Code 856
39.4% of women with births in Area Code 856 are unmarried. Women with the educational attainment of bachelor's degree are most likely to be married with 57.6% of them married at childbirth, while women with the educational attainment of less than high school are least likely to be married with 84.1% of them unmarried at childbirth.
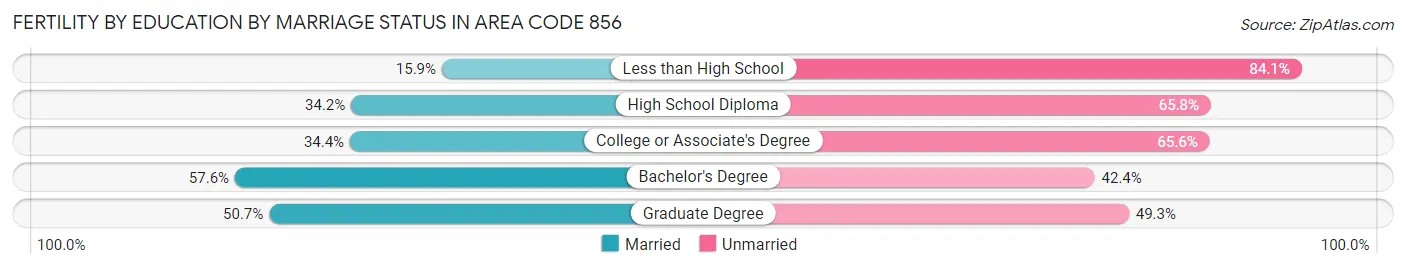
| Educational Attainment | Married | Unmarried |
| Less than High School | 138 (15.9%) | 729 (84.1%) |
| High School Diploma | 963 (34.2%) | 1,853 (65.8%) |
| College or Associate's Degree | 1,184 (34.4%) | 2,254 (65.6%) |
| Bachelor's Degree | 1,437 (57.6%) | 1,057 (42.4%) |
| Graduate Degree | 975 (50.7%) | 947 (49.3%) |
| Total | 6,993 (60.6%) | 4,544 (39.4%) |
Employment Characteristics in Area Code 856
Employment by Class of Employer in Area Code 856
Among the 486,372 employed individuals in Area Code 856, private company employees (333,681 | 68.6%), local government employees (43,414 | 8.9%), and not-for-profit organizations (40,856 | 8.4%) make up the most common classes of employment.
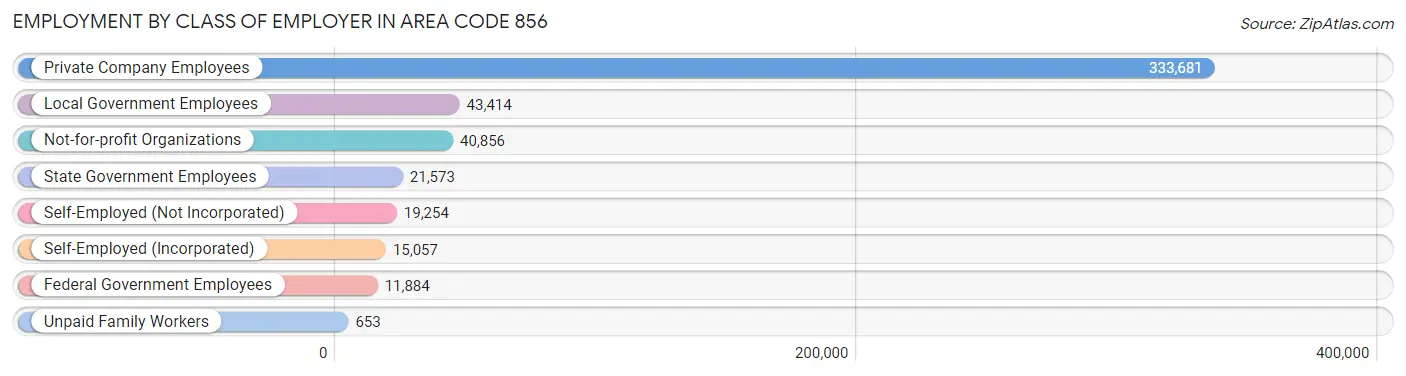
| Employer Class | # Employees | % Employees |
| Private Company Employees | 333,681 | 68.6% |
| Self-Employed (Incorporated) | 15,057 | 3.1% |
| Self-Employed (Not Incorporated) | 19,254 | 4.0% |
| Not-for-profit Organizations | 40,856 | 8.4% |
| Local Government Employees | 43,414 | 8.9% |
| State Government Employees | 21,573 | 4.4% |
| Federal Government Employees | 11,884 | 2.4% |
| Unpaid Family Workers | 653 | 0.1% |
| Total | 486,372 | 100.0% |
Employment Status by Age in Area Code 856
According to the labor force statistics for Area Code 856, out of the total population over 16 years of age (824,426), 61.8% or 509,165 individuals are in the labor force, with 7.0% or 35,743 of them unemployed. The age group with the highest labor force participation rate is 30 to 34 years, with 84.9% or 57,233 individuals in the labor force. Within the labor force, the 16 to 19 years age range has the highest percentage of unemployed individuals, with 1,108.1% or 263,739 of them being unemployed.
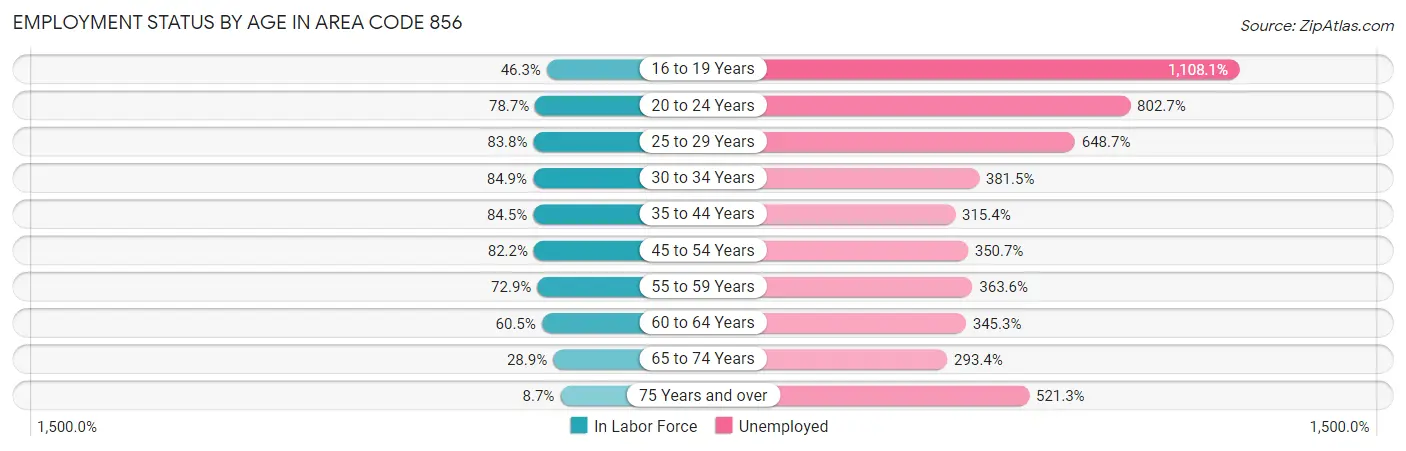
| Age Bracket | In Labor Force | Unemployed |
| 16 to 19 Years | 23,802 (46.3%) | 263,739 (1,108.1%) |
| 20 to 24 Years | 51,997 (78.7%) | 417,380 (802.7%) |
| 25 to 29 Years | 54,184 (83.8%) | 351,511 (648.7%) |
| 30 to 34 Years | 57,234 (84.9%) | 218,344 (381.5%) |
| 35 to 44 Years | 113,244 (84.5%) | 357,159 (315.4%) |
| 45 to 54 Years | 109,780 (82.2%) | 384,998 (350.7%) |
| 55 to 59 Years | 51,781 (72.9%) | 188,287 (363.6%) |
| 60 to 64 Years | 41,613 (60.5%) | 143,679 (345.3%) |
| 65 to 74 Years | 28,255 (28.9%) | 82,906 (293.4%) |
| 75 Years and over | 6,105 (8.7%) | 31,841 (521.3%) |
| Total | 509,203 (61.8%) | 35,723 (7.0%) |
Employment Status by Educational Attainment in Area Code 856
According to labor force statistics for Area Code 856, 77.1% of individuals (415,958) out of the total population between 25 and 64 years of age (539,364) are in the labor force, with 396.7% or 1,650,105 of them being unemployed. The group with the highest labor force participation rate are those with the educational attainment of bachelor's degree or higher, with 88.6% or 165,987 individuals in the labor force. Within the labor force, individuals with high school diploma education have the highest percentage of unemployment, with 603.2% or 689,385 of them being unemployed.
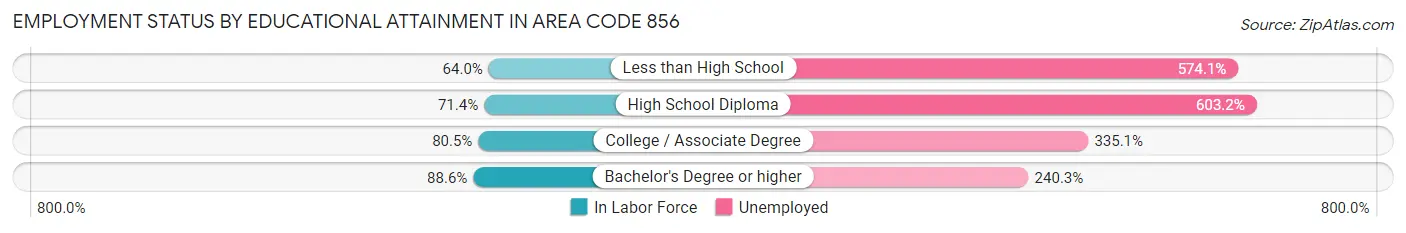
| Educational Attainment | In Labor Force | Unemployed |
| Less than High School | 31,129 (64.0%) | 279,351 (574.1%) |
| High School Diploma | 114,283 (71.4%) | 965,663 (603.2%) |
| College / Associate Degree | 115,287 (80.5%) | 479,816 (335.1%) |
| Bachelor's Degree or higher | 165,993 (88.6%) | 450,392 (240.3%) |
| Total | 415,946 (77.1%) | 2,139,657 (396.7%) |
Employment Occupations by Sex in Area Code 856
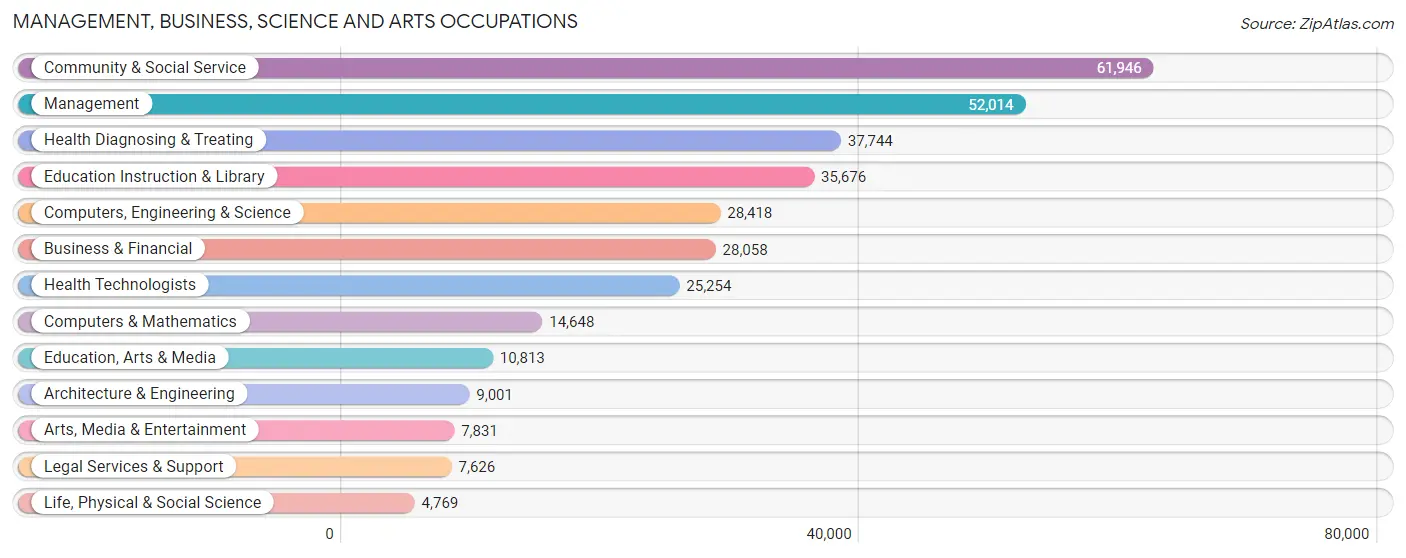
Management, Business, Science and Arts Occupations
The most common Management, Business, Science and Arts occupations in Area Code 856 are Community & Social Service (61,946 | 12.4%), Management (52,014 | 10.4%), Health Diagnosing & Treating (37,744 | 7.6%), Education Instruction & Library (35,676 | 7.1%), and Computers, Engineering & Science (28,418 | 5.7%).
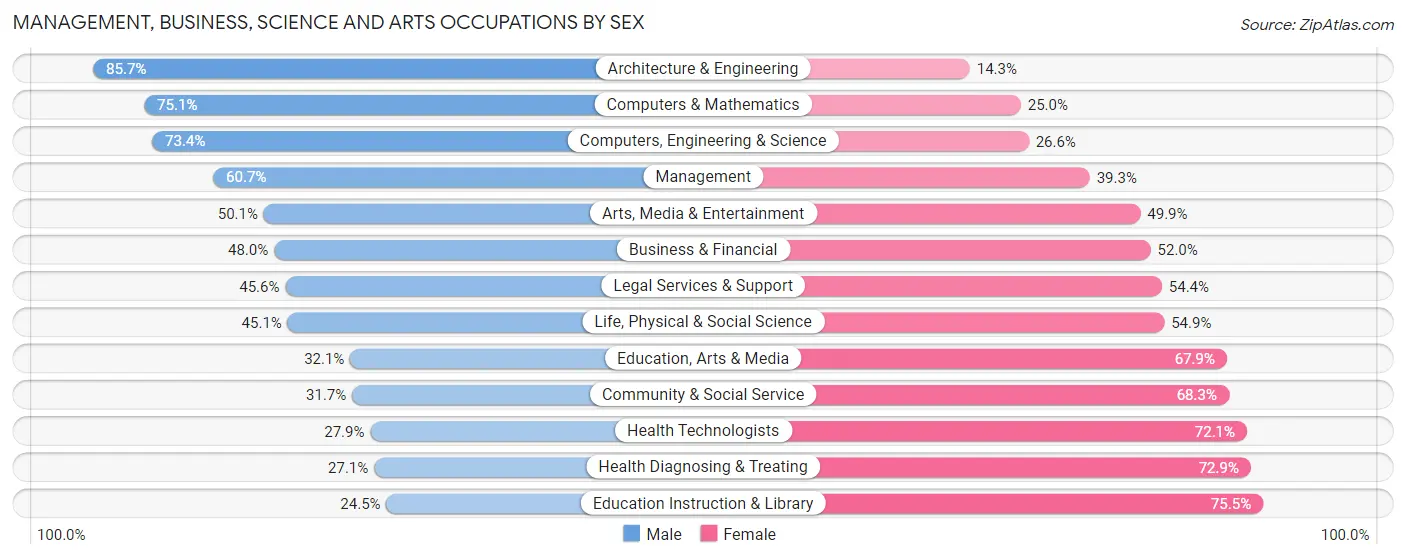
Management, Business, Science and Arts Occupations by Sex
Within the Management, Business, Science and Arts occupations in Area Code 856, the most male-oriented occupations are Architecture & Engineering (85.7%), Computers & Mathematics (75.0%), and Computers, Engineering & Science (73.4%), while the most female-oriented occupations are Education Instruction & Library (75.5%), Health Diagnosing & Treating (72.9%), and Health Technologists (72.1%).
| Occupation | Male | Female |
| Management | 31,552 (60.7%) | 20,462 (39.3%) |
| Business & Financial | 13,457 (48.0%) | 14,601 (52.0%) |
| Computers, Engineering & Science | 20,858 (73.4%) | 7,560 (26.6%) |
| Computers & Mathematics | 10,993 (75.0%) | 3,655 (24.9%) |
| Architecture & Engineering | 7,713 (85.7%) | 1,288 (14.3%) |
| Life, Physical & Social Science | 2,152 (45.1%) | 2,617 (54.9%) |
| Community & Social Service | 19,622 (31.7%) | 42,324 (68.3%) |
| Education, Arts & Media | 3,469 (32.1%) | 7,344 (67.9%) |
| Legal Services & Support | 3,479 (45.6%) | 4,147 (54.4%) |
| Education Instruction & Library | 8,750 (24.5%) | 26,926 (75.5%) |
| Arts, Media & Entertainment | 3,924 (50.1%) | 3,907 (49.9%) |
| Health Diagnosing & Treating | 10,224 (27.1%) | 27,520 (72.9%) |
| Health Technologists | 7,044 (27.9%) | 18,210 (72.1%) |
| Total (Category) | 95,713 (46.0%) | 112,467 (54.0%) |
| Total (Overall) | 256,792 (51.5%) | 242,041 (48.5%) |
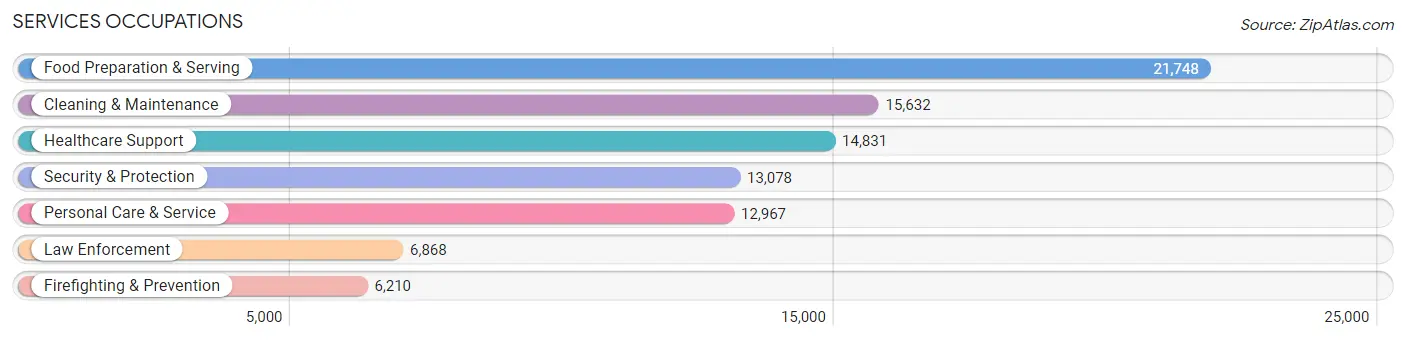
Services Occupations
The most common Services occupations in Area Code 856 are Food Preparation & Serving (21,748 | 4.4%), Cleaning & Maintenance (15,632 | 3.1%), Healthcare Support (14,831 | 3.0%), Security & Protection (13,078 | 2.6%), and Personal Care & Service (12,967 | 2.6%).
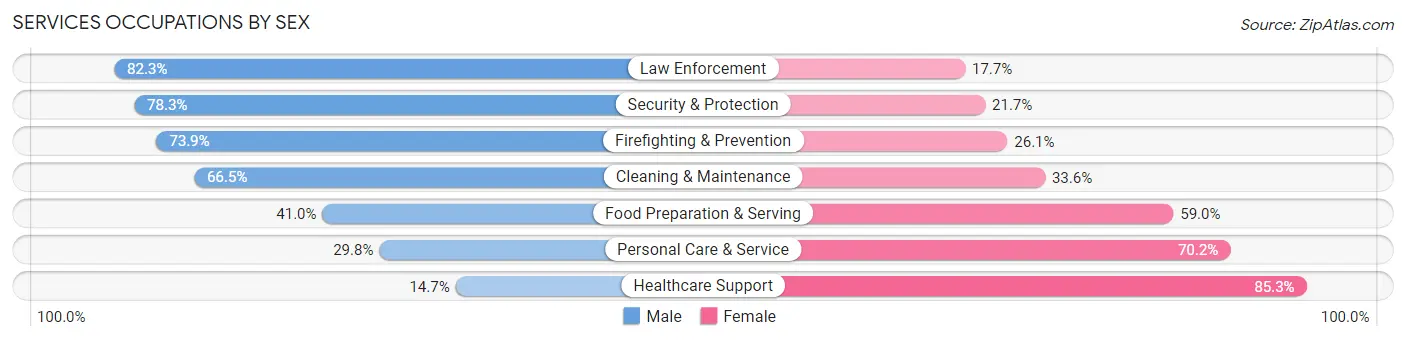
Services Occupations by Sex
Within the Services occupations in Area Code 856, the most male-oriented occupations are Law Enforcement (82.3%), Security & Protection (78.3%), and Firefighting & Prevention (73.9%), while the most female-oriented occupations are Healthcare Support (85.3%), Personal Care & Service (70.2%), and Food Preparation & Serving (59.0%).
| Occupation | Male | Female |
| Healthcare Support | 2,177 (14.7%) | 12,654 (85.3%) |
| Security & Protection | 10,240 (78.3%) | 2,838 (21.7%) |
| Firefighting & Prevention | 4,589 (73.9%) | 1,621 (26.1%) |
| Law Enforcement | 5,651 (82.3%) | 1,217 (17.7%) |
| Food Preparation & Serving | 8,926 (41.0%) | 12,822 (59.0%) |
| Cleaning & Maintenance | 10,388 (66.4%) | 5,244 (33.6%) |
| Personal Care & Service | 3,861 (29.8%) | 9,106 (70.2%) |
| Total (Category) | 35,592 (45.5%) | 42,664 (54.5%) |
| Total (Overall) | 256,792 (51.5%) | 242,041 (48.5%) |
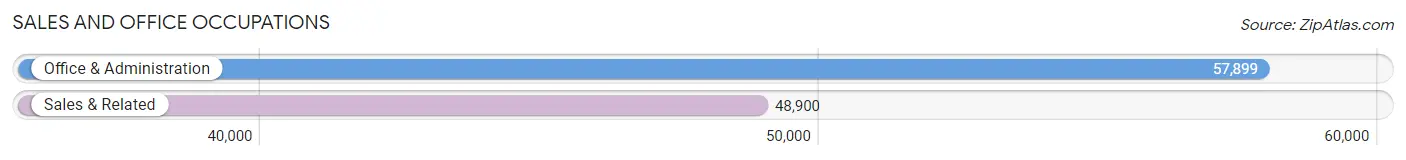
Sales and Office Occupations
The most common Sales and Office occupations in Area Code 856 are Office & Administration (57,899 | 11.6%), and Sales & Related (48,900 | 9.8%).
Sales and Office Occupations by Sex
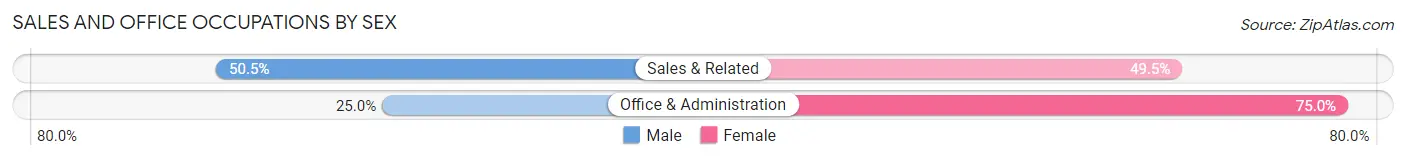
| Occupation | Male | Female |
| Sales & Related | 24,705 (50.5%) | 24,195 (49.5%) |
| Office & Administration | 14,485 (25.0%) | 43,414 (75.0%) |
| Total (Category) | 39,190 (36.7%) | 67,609 (63.3%) |
| Total (Overall) | 256,792 (51.5%) | 242,041 (48.5%) |
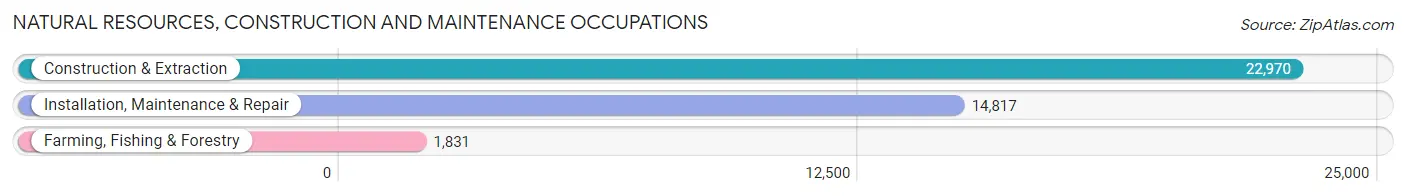
Natural Resources, Construction and Maintenance Occupations
The most common Natural Resources, Construction and Maintenance occupations in Area Code 856 are Construction & Extraction (22,970 | 4.6%), Installation, Maintenance & Repair (14,817 | 3.0%), and Farming, Fishing & Forestry (1,831 | 0.4%).
Natural Resources, Construction and Maintenance Occupations by Sex
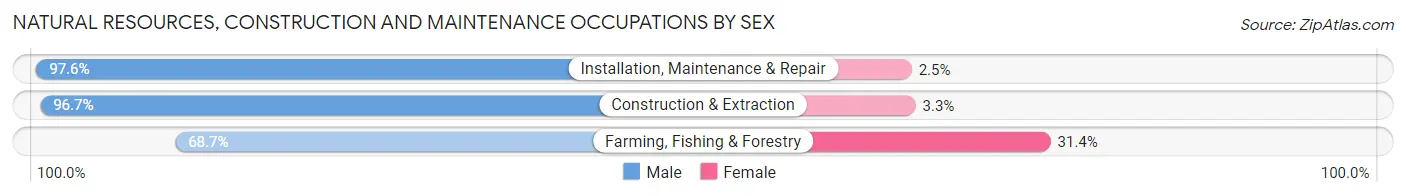
| Occupation | Male | Female |
| Farming, Fishing & Forestry | 1,257 (68.6%) | 574 (31.4%) |
| Construction & Extraction | 22,221 (96.7%) | 749 (3.3%) |
| Installation, Maintenance & Repair | 14,454 (97.6%) | 363 (2.5%) |
| Total (Category) | 37,932 (95.7%) | 1,686 (4.3%) |
| Total (Overall) | 256,792 (51.5%) | 242,041 (48.5%) |
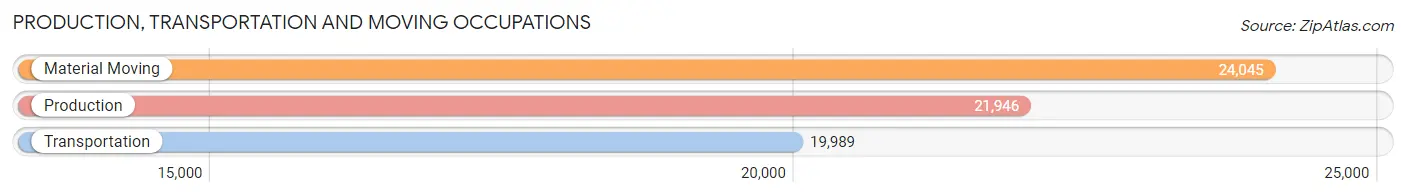
Production, Transportation and Moving Occupations
The most common Production, Transportation and Moving occupations in Area Code 856 are Material Moving (24,045 | 4.8%), Production (21,946 | 4.4%), and Transportation (19,989 | 4.0%).
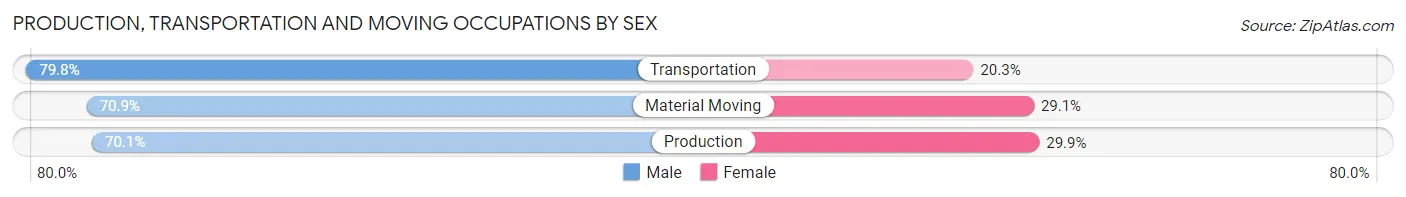
Production, Transportation and Moving Occupations by Sex
| Occupation | Male | Female |
| Production | 15,381 (70.1%) | 6,565 (29.9%) |
| Transportation | 15,941 (79.7%) | 4,048 (20.3%) |
| Material Moving | 17,043 (70.9%) | 7,002 (29.1%) |
| Total (Category) | 48,365 (73.3%) | 17,615 (26.7%) |
| Total (Overall) | 256,792 (51.5%) | 242,041 (48.5%) |
Employment Industries by Sex in Area Code 856
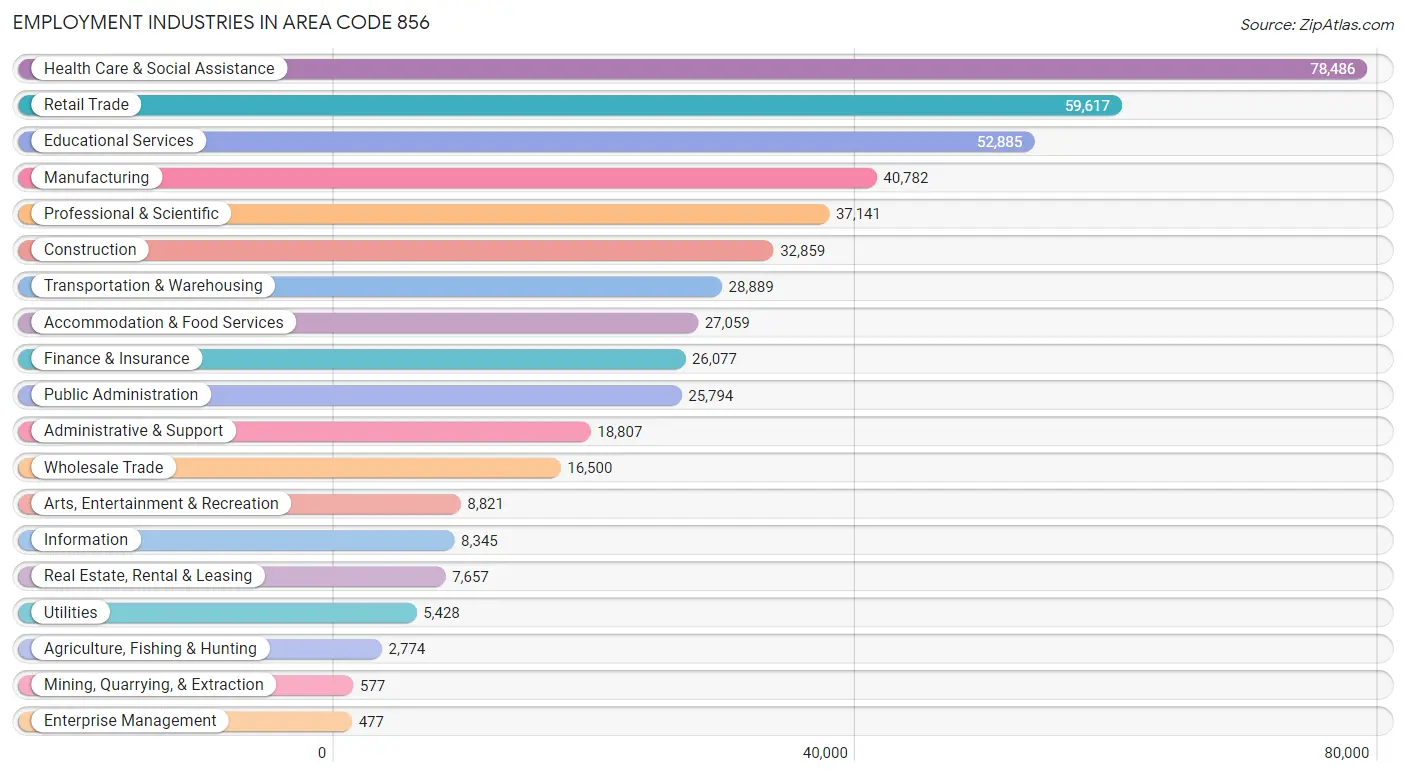
Employment Industries in Area Code 856
The major employment industries in Area Code 856 include Health Care & Social Assistance (78,486 | 15.7%), Retail Trade (59,617 | 11.9%), Educational Services (52,885 | 10.6%), Manufacturing (40,782 | 8.2%), and Professional & Scientific (37,141 | 7.4%).
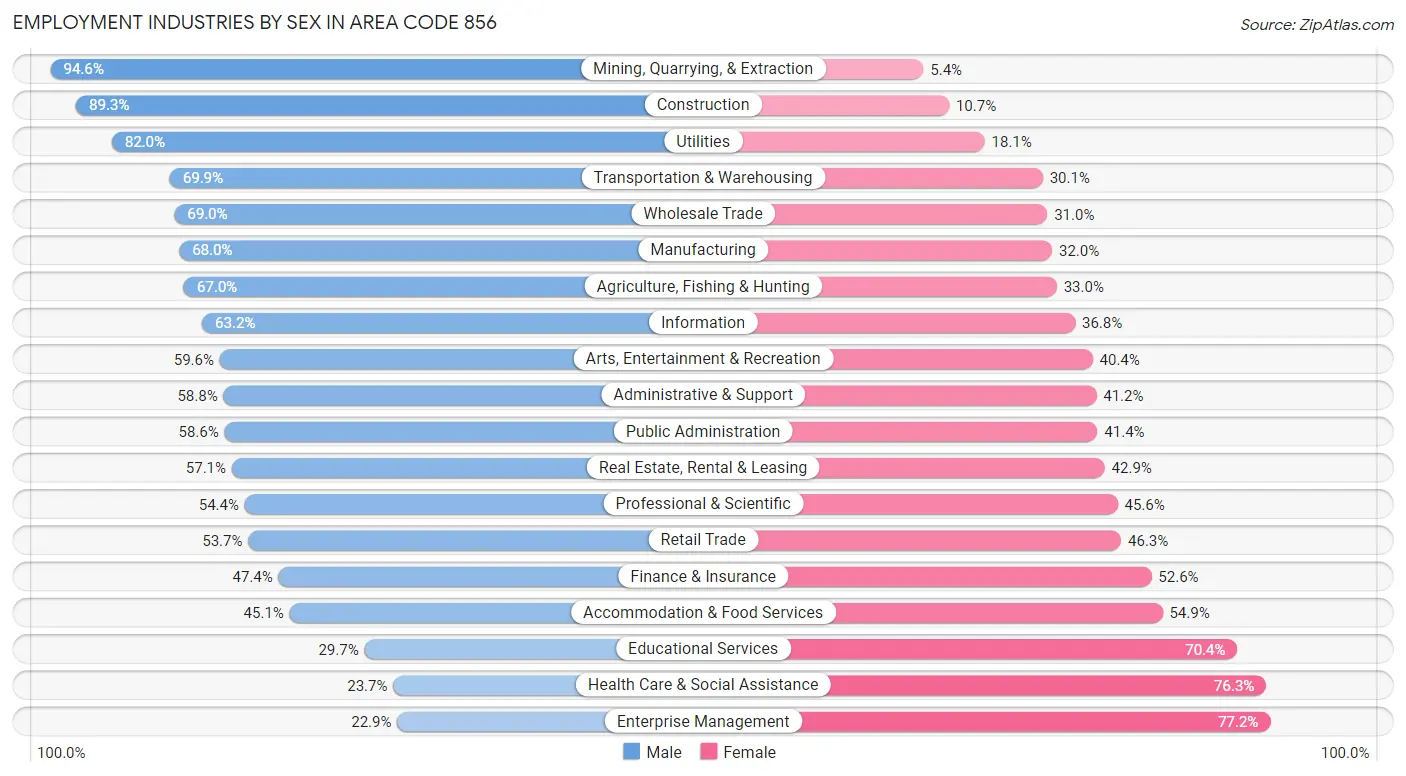
Employment Industries by Sex in Area Code 856
The Area Code 856 industries that see more men than women are Mining, Quarrying, & Extraction (94.6%), Construction (89.3%), and Utilities (82.0%), whereas the industries that tend to have a higher number of women are Enterprise Management (77.1%), Health Care & Social Assistance (76.3%), and Educational Services (70.4%).
| Industry | Male | Female |
| Agriculture, Fishing & Hunting | 1,859 (67.0%) | 915 (33.0%) |
| Mining, Quarrying, & Extraction | 546 (94.6%) | 31 (5.4%) |
| Construction | 29,353 (89.3%) | 3,506 (10.7%) |
| Manufacturing | 27,727 (68.0%) | 13,055 (32.0%) |
| Wholesale Trade | 11,384 (69.0%) | 5,116 (31.0%) |
| Retail Trade | 32,014 (53.7%) | 27,603 (46.3%) |
| Transportation & Warehousing | 20,203 (69.9%) | 8,686 (30.1%) |
| Utilities | 4,448 (82.0%) | 980 (18.0%) |
| Information | 5,277 (63.2%) | 3,068 (36.8%) |
| Finance & Insurance | 12,368 (47.4%) | 13,709 (52.6%) |
| Real Estate, Rental & Leasing | 4,372 (57.1%) | 3,285 (42.9%) |
| Professional & Scientific | 20,216 (54.4%) | 16,925 (45.6%) |
| Enterprise Management | 109 (22.9%) | 368 (77.1%) |
| Administrative & Support | 11,065 (58.8%) | 7,742 (41.2%) |
| Educational Services | 15,679 (29.6%) | 37,206 (70.4%) |
| Health Care & Social Assistance | 18,585 (23.7%) | 59,901 (76.3%) |
| Arts, Entertainment & Recreation | 5,257 (59.6%) | 3,564 (40.4%) |
| Accommodation & Food Services | 12,214 (45.1%) | 14,845 (54.9%) |
| Public Administration | 15,117 (58.6%) | 10,677 (41.4%) |
| Total | 256,792 (51.5%) | 242,041 (48.5%) |
Education in Area Code 856
School Enrollment in Area Code 856
The most common levels of schooling among the 251,452 students in Area Code 856 are middle school (54,409 | 21.6%), high school (53,145 | 21.1%), and elementary school (50,544 | 20.1%).
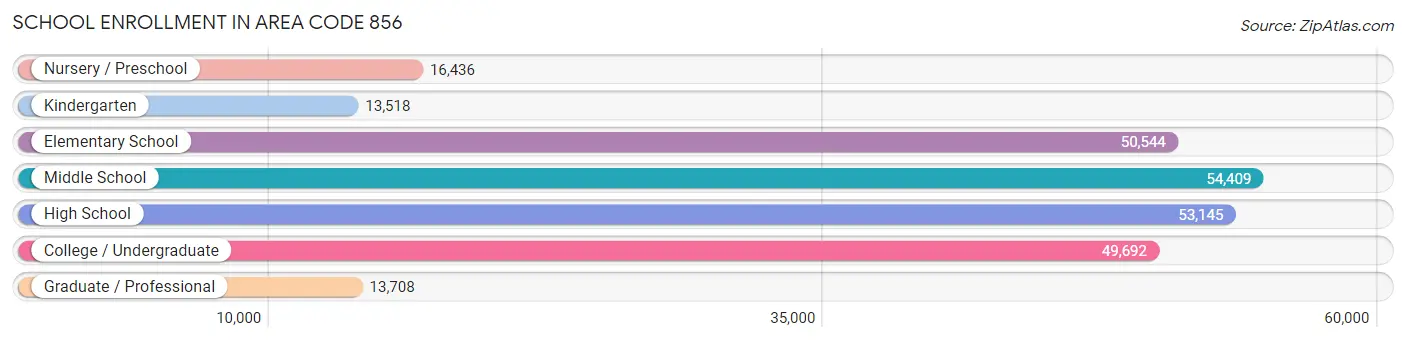
| School Level | # Students | % Students |
| Nursery / Preschool | 16,436 | 6.5% |
| Kindergarten | 13,518 | 5.4% |
| Elementary School | 50,544 | 20.1% |
| Middle School | 54,409 | 21.6% |
| High School | 53,145 | 21.1% |
| College / Undergraduate | 49,692 | 19.8% |
| Graduate / Professional | 13,708 | 5.4% |
| Total | 251,452 | 100.0% |
School Enrollment by Age by Funding Source in Area Code 856
Out of a total of 251,452 students who are enrolled in schools in Area Code 856, 38,893 (15.5%) attend a private institution, while the remaining 212,559 (84.5%) are enrolled in public schools. The age group of 3 to 4 year olds has the highest likelihood of being enrolled in private schools, with 5,176 (40.7% in the age bracket) enrolled. Conversely, the age group of 10 to 14 year olds has the lowest likelihood of being enrolled in a private school, with 59,786 (91.1% in the age bracket) attending a public institution.
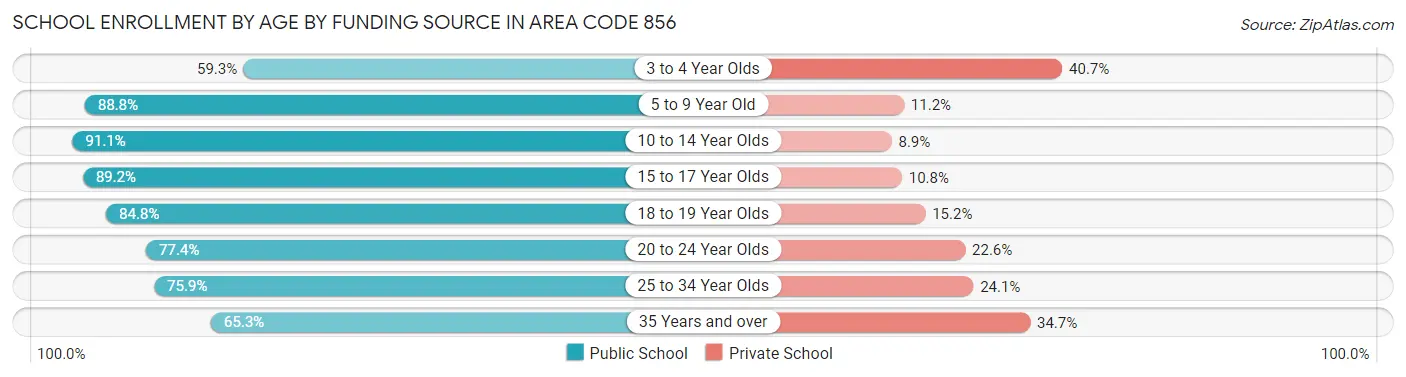
| Age Bracket | Public School | Private School |
| 3 to 4 Year Olds | 7,544 (59.3%) | 5,176 (40.7%) |
| 5 to 9 Year Old | 54,924 (88.8%) | 6,940 (11.2%) |
| 10 to 14 Year Olds | 59,786 (91.1%) | 5,851 (8.9%) |
| 15 to 17 Year Olds | 34,825 (89.2%) | 4,231 (10.8%) |
| 18 to 19 Year Olds | 15,343 (84.8%) | 2,749 (15.2%) |
| 20 to 24 Year Olds | 21,978 (77.4%) | 6,426 (22.6%) |
| 25 to 34 Year Olds | 10,037 (75.9%) | 3,192 (24.1%) |
| 35 Years and over | 8,129 (65.3%) | 4,321 (34.7%) |
| Total | 212,559 (84.5%) | 38,893 (15.5%) |
Educational Attainment by Field of Study in Area Code 856
Business (48,729 | 19.5%), education (32,915 | 13.2%), science & technology (27,330 | 11.0%), social sciences (18,483 | 7.4%), and psychology (16,123 | 6.5%) are the most common fields of study among 249,566 individuals in Area Code 856 who have obtained a bachelor's degree or higher.
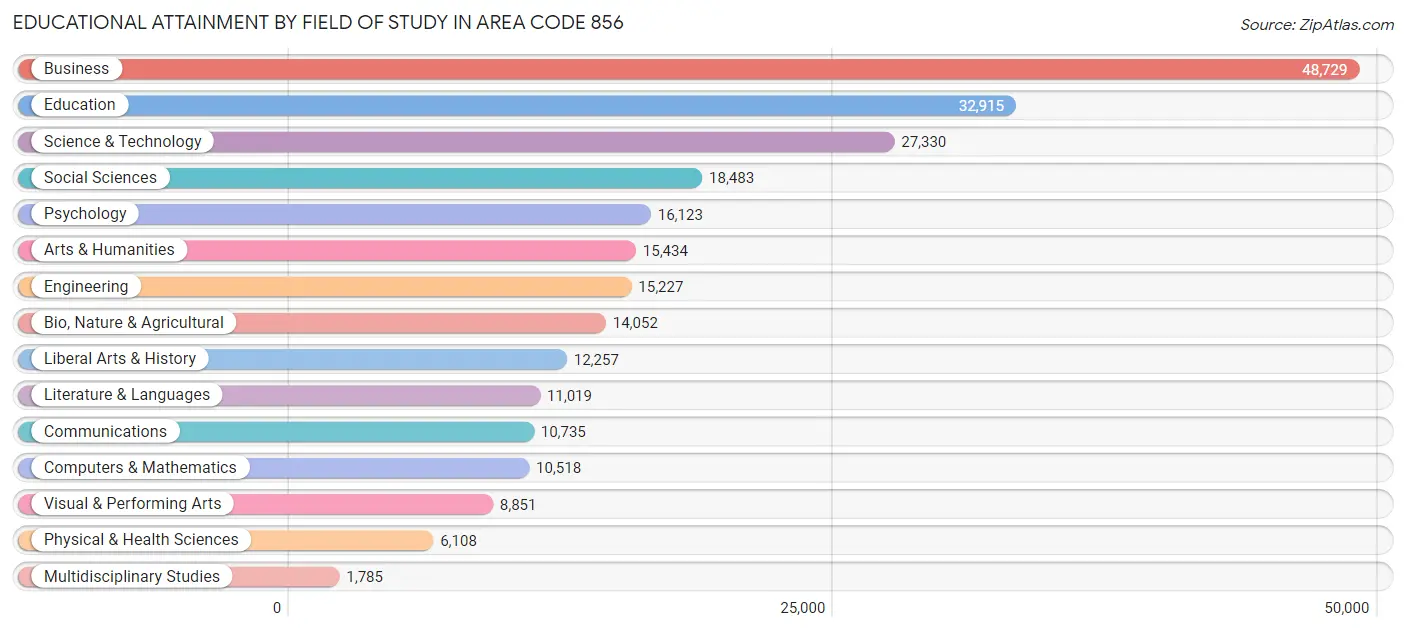
| Field of Study | # Graduates | % Graduates |
| Computers & Mathematics | 10,518 | 4.2% |
| Bio, Nature & Agricultural | 14,052 | 5.6% |
| Physical & Health Sciences | 6,108 | 2.5% |
| Psychology | 16,123 | 6.5% |
| Social Sciences | 18,483 | 7.4% |
| Engineering | 15,227 | 6.1% |
| Multidisciplinary Studies | 1,785 | 0.7% |
| Science & Technology | 27,330 | 11.0% |
| Business | 48,729 | 19.5% |
| Education | 32,915 | 13.2% |
| Literature & Languages | 11,019 | 4.4% |
| Liberal Arts & History | 12,257 | 4.9% |
| Visual & Performing Arts | 8,851 | 3.5% |
| Communications | 10,735 | 4.3% |
| Arts & Humanities | 15,434 | 6.2% |
| Total | 249,566 | 100.0% |
Transportation & Commute in Area Code 856
Vehicle Availability by Sex in Area Code 856
The most prevalent vehicle ownership categories in Area Code 856 are males with 2 vehicles (108,687, accounting for 43.3%) and females with 2 vehicles (96,719, making up 46.6%).
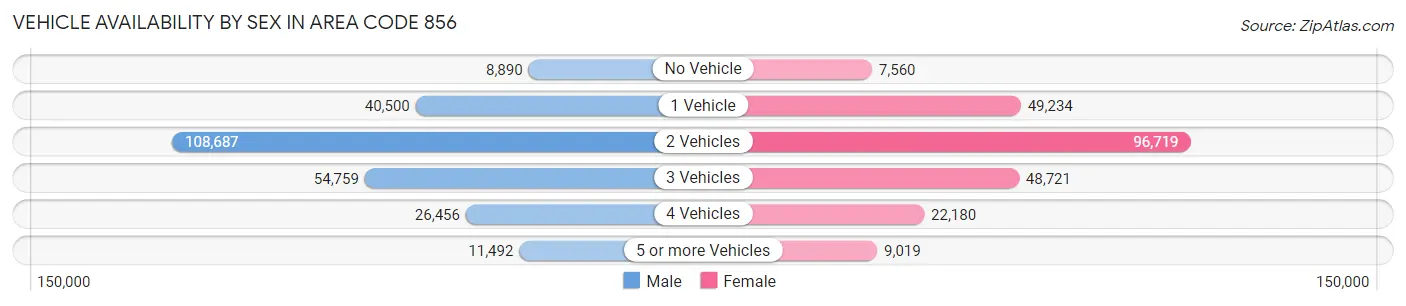
| Vehicles Available | Male | Female |
| No Vehicle | 8,890 (3.5%) | 7,560 (3.2%) |
| 1 Vehicle | 40,500 (16.2%) | 49,234 (21.1%) |
| 2 Vehicles | 108,687 (43.3%) | 96,719 (41.4%) |
| 3 Vehicles | 54,759 (21.8%) | 48,721 (20.9%) |
| 4 Vehicles | 26,456 (10.5%) | 22,180 (9.5%) |
| 5 or more Vehicles | 11,492 (4.6%) | 9,019 (3.9%) |
| Total | 250,784 (100.0%) | 233,433 (100.0%) |
Commute Time in Area Code 856
The most frequently occuring commute durations in Area Code 856 are 15 to 19 minutes (61,326 commuters, 14.1%), 20 to 24 minutes (59,999 commuters, 13.9%), and 30 to 34 minutes (58,416 commuters, 13.5%).
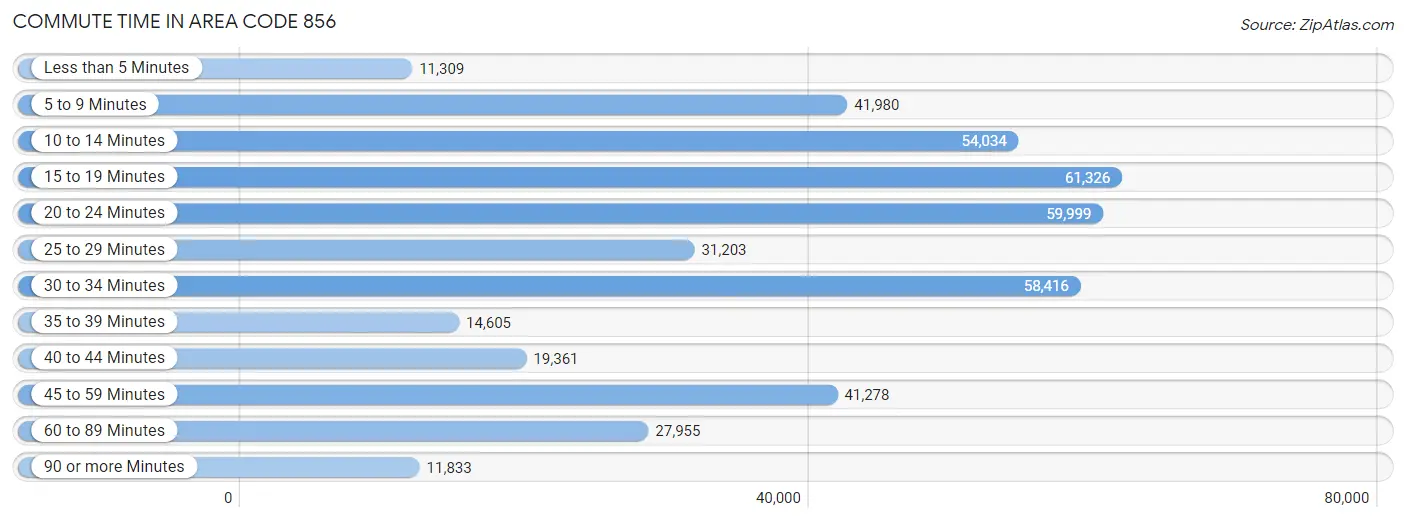
| Commute Time | # Commuters | % Commuters |
| Less than 5 Minutes | 11,309 | 2.6% |
| 5 to 9 Minutes | 41,980 | 9.7% |
| 10 to 14 Minutes | 54,034 | 12.5% |
| 15 to 19 Minutes | 61,326 | 14.1% |
| 20 to 24 Minutes | 59,999 | 13.9% |
| 25 to 29 Minutes | 31,203 | 7.2% |
| 30 to 34 Minutes | 58,416 | 13.5% |
| 35 to 39 Minutes | 14,605 | 3.4% |
| 40 to 44 Minutes | 19,361 | 4.5% |
| 45 to 59 Minutes | 41,278 | 9.5% |
| 60 to 89 Minutes | 27,955 | 6.5% |
| 90 or more Minutes | 11,833 | 2.7% |
Commute Time by Sex in Area Code 856
The most common commute times in Area Code 856 are 30 to 34 minutes (31,251 commuters, 13.8%) for males and 15 to 19 minutes (31,583 commuters, 15.2%) for females.
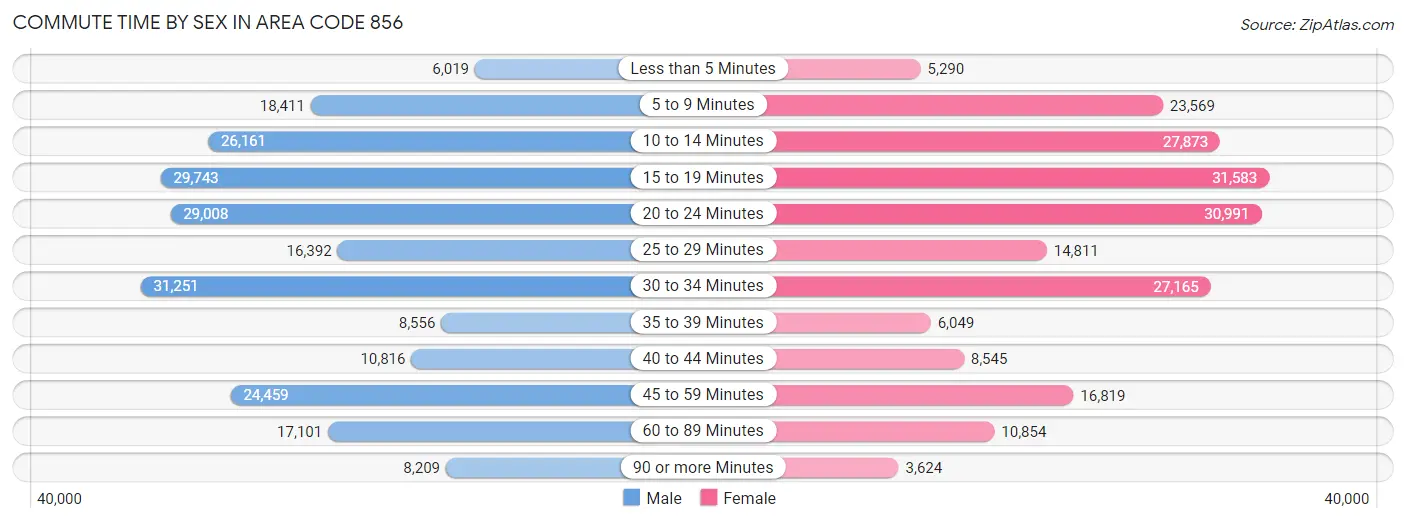
| Commute Time | Male | Female |
| Less than 5 Minutes | 6,019 (2.7%) | 5,290 (2.5%) |
| 5 to 9 Minutes | 18,411 (8.1%) | 23,569 (11.4%) |
| 10 to 14 Minutes | 26,161 (11.6%) | 27,873 (13.5%) |
| 15 to 19 Minutes | 29,743 (13.2%) | 31,583 (15.2%) |
| 20 to 24 Minutes | 29,008 (12.8%) | 30,991 (15.0%) |
| 25 to 29 Minutes | 16,392 (7.2%) | 14,811 (7.1%) |
| 30 to 34 Minutes | 31,251 (13.8%) | 27,165 (13.1%) |
| 35 to 39 Minutes | 8,556 (3.8%) | 6,049 (2.9%) |
| 40 to 44 Minutes | 10,816 (4.8%) | 8,545 (4.1%) |
| 45 to 59 Minutes | 24,459 (10.8%) | 16,819 (8.1%) |
| 60 to 89 Minutes | 17,101 (7.6%) | 10,854 (5.2%) |
| 90 or more Minutes | 8,209 (3.6%) | 3,624 (1.8%) |
Time of Departure to Work by Sex in Area Code 856
The most frequent times of departure to work in Area Code 856 are 7:00 AM to 7:29 AM (30,181, 13.4%) for males and 7:30 AM to 7:59 AM (31,145, 15.0%) for females.
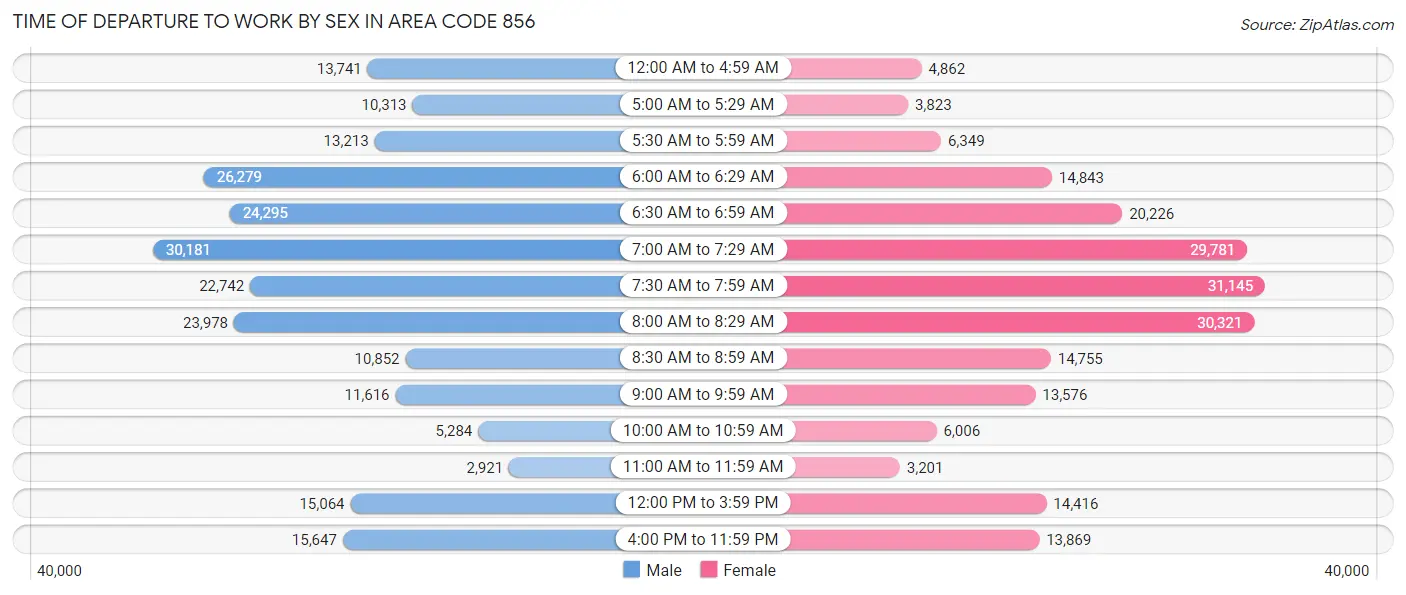
| Time of Departure | Male | Female |
| 12:00 AM to 4:59 AM | 13,741 (6.1%) | 4,862 (2.4%) |
| 5:00 AM to 5:29 AM | 10,313 (4.6%) | 3,823 (1.8%) |
| 5:30 AM to 5:59 AM | 13,213 (5.8%) | 6,349 (3.1%) |
| 6:00 AM to 6:29 AM | 26,279 (11.6%) | 14,843 (7.2%) |
| 6:30 AM to 6:59 AM | 24,295 (10.7%) | 20,226 (9.8%) |
| 7:00 AM to 7:29 AM | 30,181 (13.4%) | 29,781 (14.4%) |
| 7:30 AM to 7:59 AM | 22,742 (10.1%) | 31,145 (15.0%) |
| 8:00 AM to 8:29 AM | 23,978 (10.6%) | 30,321 (14.6%) |
| 8:30 AM to 8:59 AM | 10,852 (4.8%) | 14,755 (7.1%) |
| 9:00 AM to 9:59 AM | 11,616 (5.1%) | 13,576 (6.6%) |
| 10:00 AM to 10:59 AM | 5,284 (2.3%) | 6,006 (2.9%) |
| 11:00 AM to 11:59 AM | 2,921 (1.3%) | 3,201 (1.5%) |
| 12:00 PM to 3:59 PM | 15,064 (6.7%) | 14,416 (7.0%) |
| 4:00 PM to 11:59 PM | 15,647 (6.9%) | 13,869 (6.7%) |
| Total | 226,126 (100.0%) | 207,173 (100.0%) |
Housing Occupancy in Area Code 856
Occupancy by Ownership in Area Code 856
Of the total 382,110 dwellings in Area Code 856, owner-occupied units account for 266,669 (69.8%), while renter-occupied units make up 115,441 (30.2%).
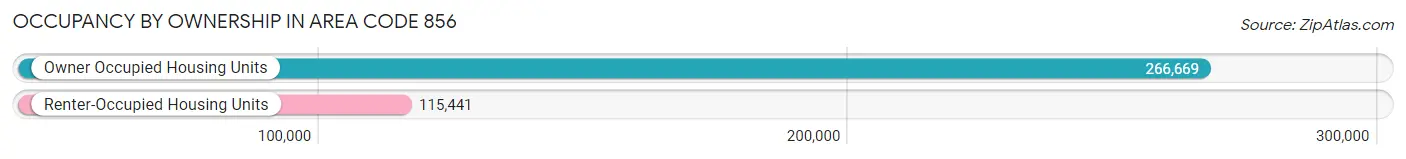
| Occupancy | # Housing Units | % Housing Units |
| Owner Occupied Housing Units | 266,669 | 69.8% |
| Renter-Occupied Housing Units | 115,441 | 30.2% |
| Total Occupied Housing Units | 382,110 | 100.0% |
Occupancy by Household Size in Area Code 856
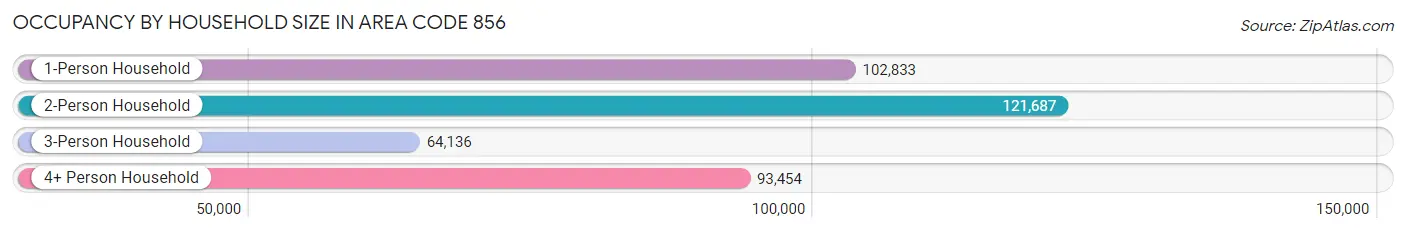
| Household Size | # Housing Units | % Housing Units |
| 1-Person Household | 102,833 | 26.9% |
| 2-Person Household | 121,687 | 31.9% |
| 3-Person Household | 64,136 | 16.8% |
| 4+ Person Household | 93,454 | 24.5% |
| Total Housing Units | 382,110 | 100.0% |
Occupancy by Ownership by Household Size in Area Code 856
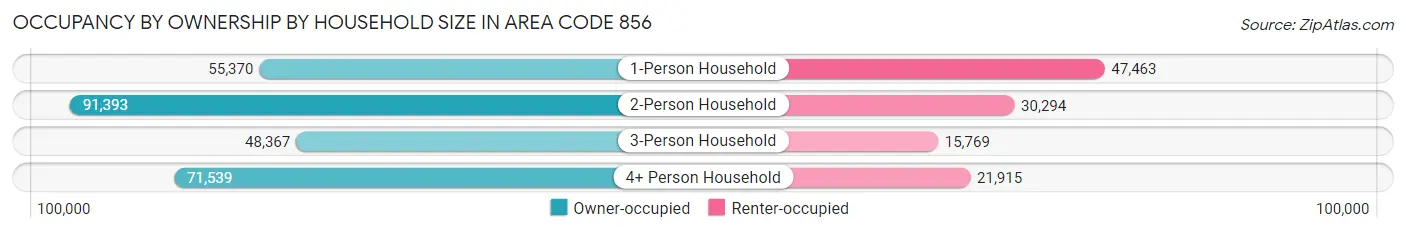
| Household Size | Owner-occupied | Renter-occupied |
| 1-Person Household | 55,370 (53.8%) | 47,463 (46.2%) |
| 2-Person Household | 91,393 (75.1%) | 30,294 (24.9%) |
| 3-Person Household | 48,367 (75.4%) | 15,769 (24.6%) |
| 4+ Person Household | 71,539 (76.5%) | 21,915 (23.4%) |
| Total Housing Units | 266,669 (69.8%) | 115,441 (30.2%) |
Occupancy by Educational Attainment in Area Code 856
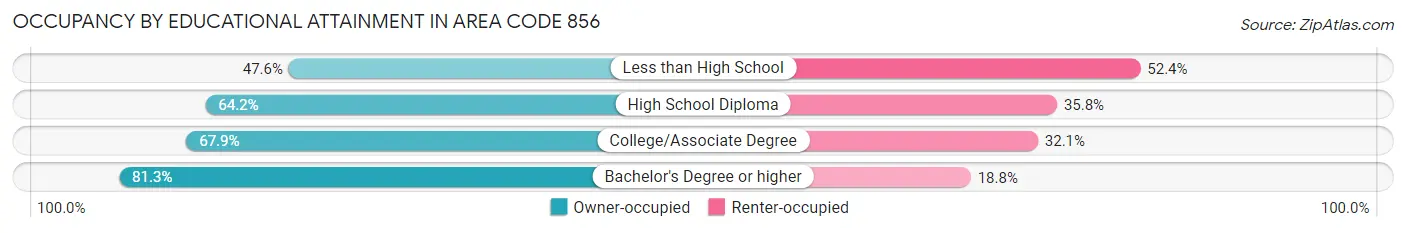
| Household Size | Owner-occupied | Renter-occupied |
| Less than High School | 16,278 (47.6%) | 17,902 (52.4%) |
| High School Diploma | 68,833 (64.2%) | 38,442 (35.8%) |
| College/Associate Degree | 71,347 (67.9%) | 33,666 (32.1%) |
| Bachelor's Degree or higher | 110,211 (81.2%) | 25,431 (18.8%) |
Occupancy by Age of Householder in Area Code 856
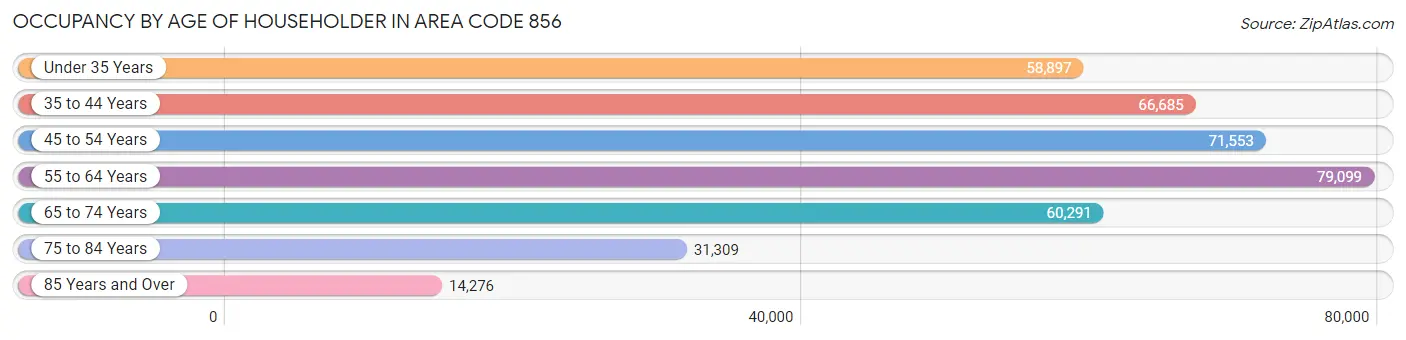
| Age Bracket | # Households | % Households |
| Under 35 Years | 58,897 | 15.4% |
| 35 to 44 Years | 66,685 | 17.4% |
| 45 to 54 Years | 71,553 | 18.7% |
| 55 to 64 Years | 79,099 | 20.7% |
| 65 to 74 Years | 60,291 | 15.8% |
| 75 to 84 Years | 31,309 | 8.2% |
| 85 Years and Over | 14,276 | 3.7% |
| Total | 382,110 | 100.0% |
Housing Finances in Area Code 856
Median Income by Occupancy in Area Code 856
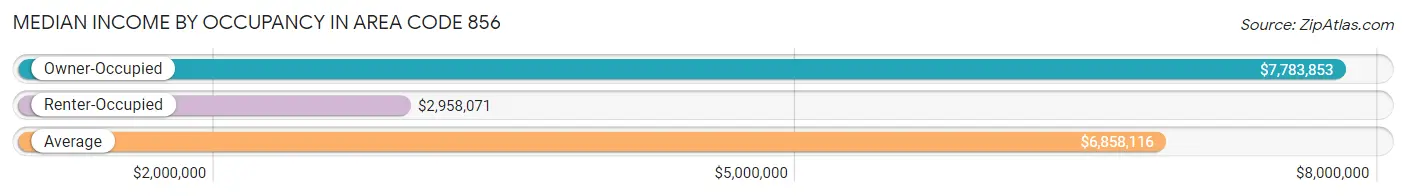
| Occupancy Type | # Households | Median Income |
| Owner-Occupied | 266,669 (69.8%) | $7,783,853 |
| Renter-Occupied | 115,441 (30.2%) | $2,958,071 |
| Average | 382,110 (100.0%) | $6,858,116 |
Occupancy by Householder Income Bracket in Area Code 856
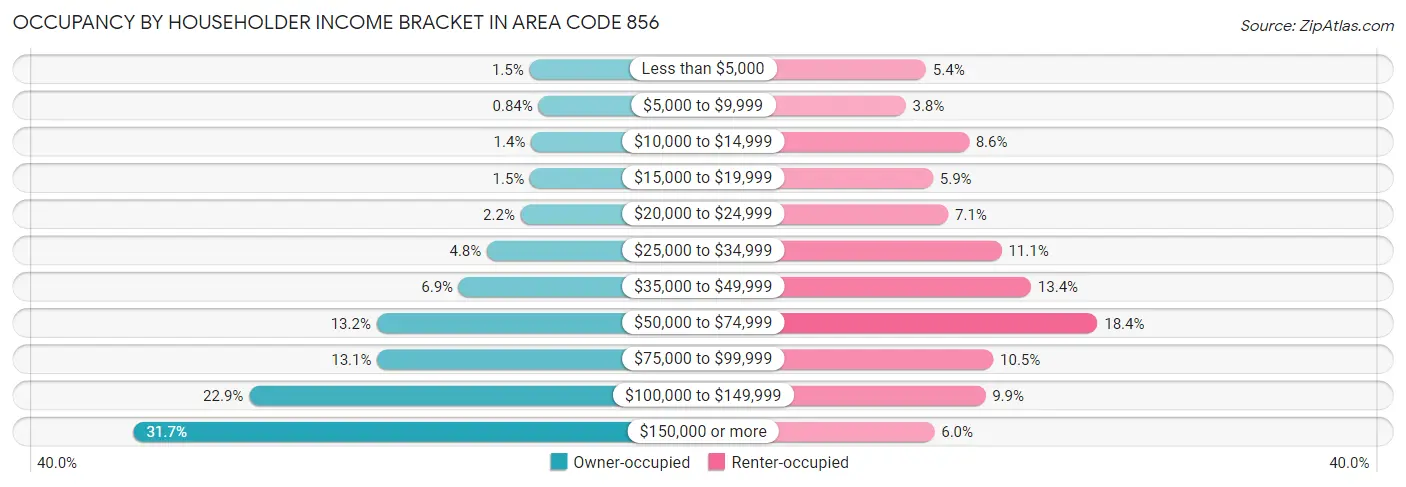
| Income Bracket | Owner-occupied | Renter-occupied |
| Less than $5,000 | 4,089 (1.5%) | 6,192 (5.4%) |
| $5,000 to $9,999 | 2,231 (0.8%) | 4,403 (3.8%) |
| $10,000 to $14,999 | 3,731 (1.4%) | 9,953 (8.6%) |
| $15,000 to $19,999 | 3,947 (1.5%) | 6,802 (5.9%) |
| $20,000 to $24,999 | 5,863 (2.2%) | 8,136 (7.0%) |
| $25,000 to $34,999 | 12,690 (4.8%) | 12,840 (11.1%) |
| $35,000 to $49,999 | 18,418 (6.9%) | 15,424 (13.4%) |
| $50,000 to $74,999 | 35,108 (13.2%) | 21,267 (18.4%) |
| $75,000 to $99,999 | 35,004 (13.1%) | 12,094 (10.5%) |
| $100,000 to $149,999 | 61,046 (22.9%) | 11,401 (9.9%) |
| $150,000 or more | 84,542 (31.7%) | 6,929 (6.0%) |
| Total | 266,669 (100.0%) | 115,441 (100.0%) |
Monthly Housing Cost Tiers in Area Code 856
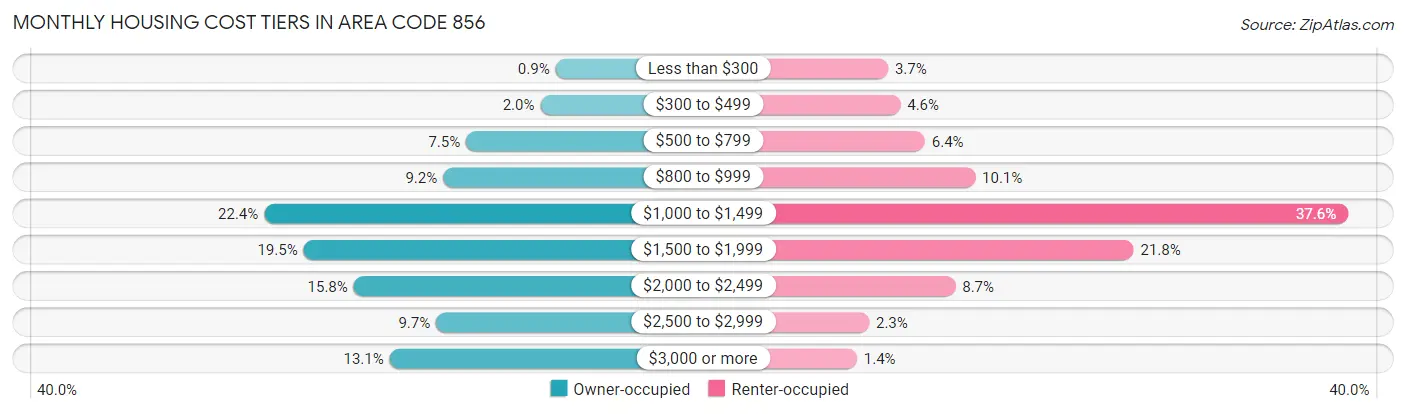
| Monthly Cost | Owner-occupied | Renter-occupied |
| Less than $300 | 2,392 (0.9%) | 4,290 (3.7%) |
| $300 to $499 | 5,389 (2.0%) | 5,346 (4.6%) |
| $500 to $799 | 19,986 (7.5%) | 7,432 (6.4%) |
| $800 to $999 | 24,487 (9.2%) | 11,707 (10.1%) |
| $1,000 to $1,499 | 59,627 (22.4%) | 43,409 (37.6%) |
| $1,500 to $1,999 | 51,901 (19.5%) | 25,180 (21.8%) |
| $2,000 to $2,499 | 42,057 (15.8%) | 10,026 (8.7%) |
| $2,500 to $2,999 | 25,854 (9.7%) | 2,688 (2.3%) |
| $3,000 or more | 34,976 (13.1%) | 1,646 (1.4%) |
| Total | 266,669 (100.0%) | 115,441 (100.0%) |
Physical Housing Characteristics in Area Code 856
Housing Structures in Area Code 856
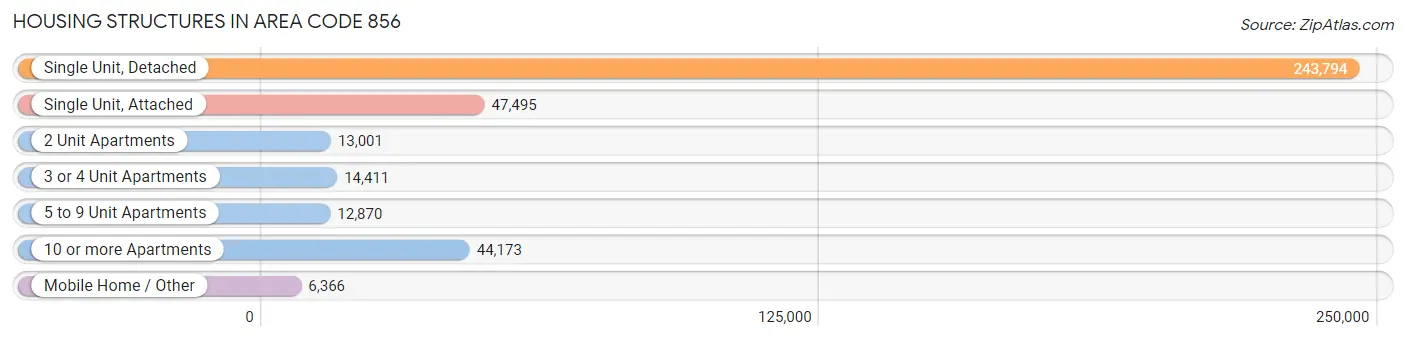
| Structure Type | # Housing Units | % Housing Units |
| Single Unit, Detached | 243,794 | 63.8% |
| Single Unit, Attached | 47,495 | 12.4% |
| 2 Unit Apartments | 13,001 | 3.4% |
| 3 or 4 Unit Apartments | 14,411 | 3.8% |
| 5 to 9 Unit Apartments | 12,870 | 3.4% |
| 10 or more Apartments | 44,173 | 11.6% |
| Mobile Home / Other | 6,366 | 1.7% |
| Total | 382,110 | 100.0% |
Housing Structures by Occupancy in Area Code 856
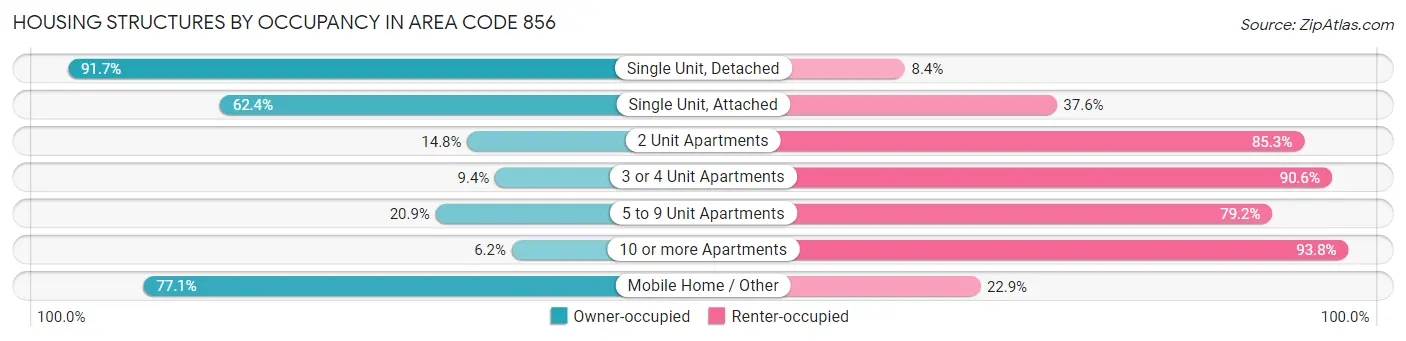
| Structure Type | Owner-occupied | Renter-occupied |
| Single Unit, Detached | 223,428 (91.6%) | 20,366 (8.4%) |
| Single Unit, Attached | 29,642 (62.4%) | 17,853 (37.6%) |
| 2 Unit Apartments | 1,918 (14.7%) | 11,083 (85.3%) |
| 3 or 4 Unit Apartments | 1,354 (9.4%) | 13,057 (90.6%) |
| 5 to 9 Unit Apartments | 2,683 (20.8%) | 10,187 (79.1%) |
| 10 or more Apartments | 2,734 (6.2%) | 41,439 (93.8%) |
| Mobile Home / Other | 4,910 (77.1%) | 1,456 (22.9%) |
| Total | 266,669 (69.8%) | 115,441 (30.2%) |
Housing Structures by Number of Rooms in Area Code 856
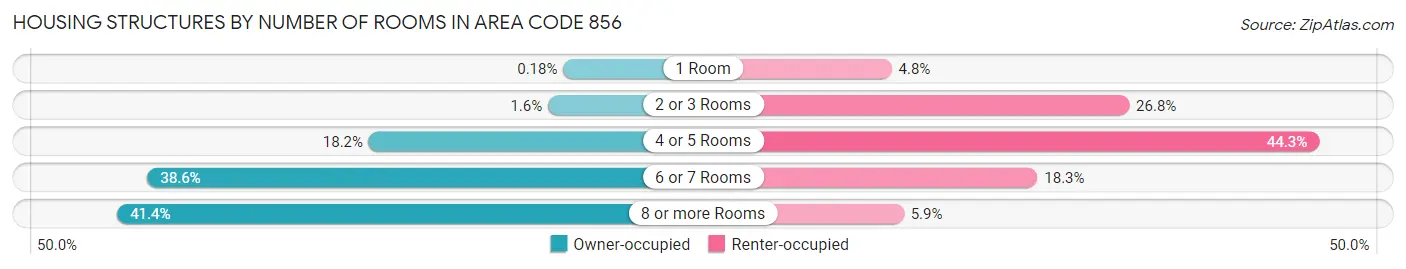
| Number of Rooms | Owner-occupied | Renter-occupied |
| 1 Room | 492 (0.2%) | 5,513 (4.8%) |
| 2 or 3 Rooms | 4,243 (1.6%) | 30,877 (26.8%) |
| 4 or 5 Rooms | 48,424 (18.2%) | 51,155 (44.3%) |
| 6 or 7 Rooms | 103,038 (38.6%) | 21,085 (18.3%) |
| 8 or more Rooms | 110,472 (41.4%) | 6,811 (5.9%) |
| Total | 266,669 (100.0%) | 115,441 (100.0%) |
Housing Structure by Heating Type in Area Code 856
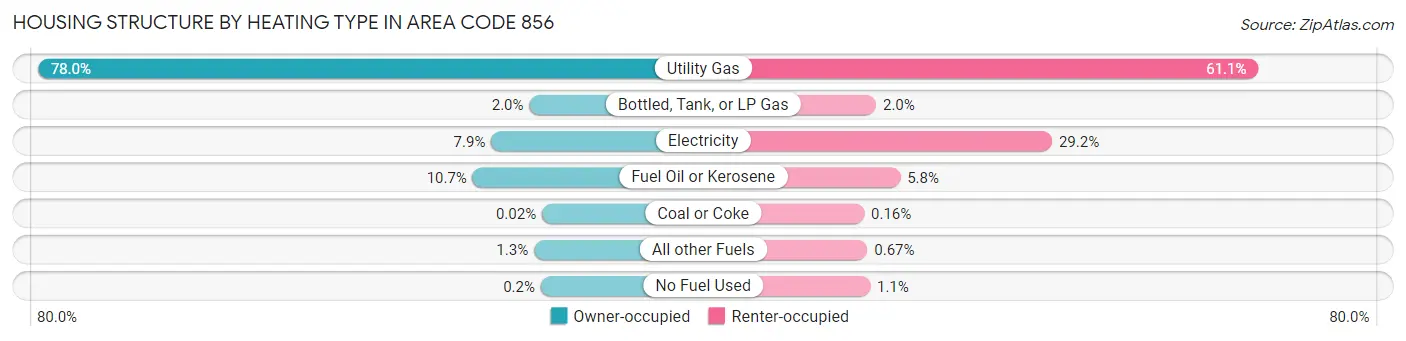
| Heating Type | Owner-occupied | Renter-occupied |
| Utility Gas | 207,921 (78.0%) | 70,540 (61.1%) |
| Bottled, Tank, or LP Gas | 5,263 (2.0%) | 2,318 (2.0%) |
| Electricity | 20,966 (7.9%) | 33,726 (29.2%) |
| Fuel Oil or Kerosene | 28,605 (10.7%) | 6,643 (5.8%) |
| Coal or Coke | 46 (0.0%) | 185 (0.2%) |
| All other Fuels | 3,343 (1.3%) | 779 (0.7%) |
| No Fuel Used | 525 (0.2%) | 1,250 (1.1%) |
| Total | 266,669 (100.0%) | 115,441 (100.0%) |
Household Vehicle Usage in Area Code 856
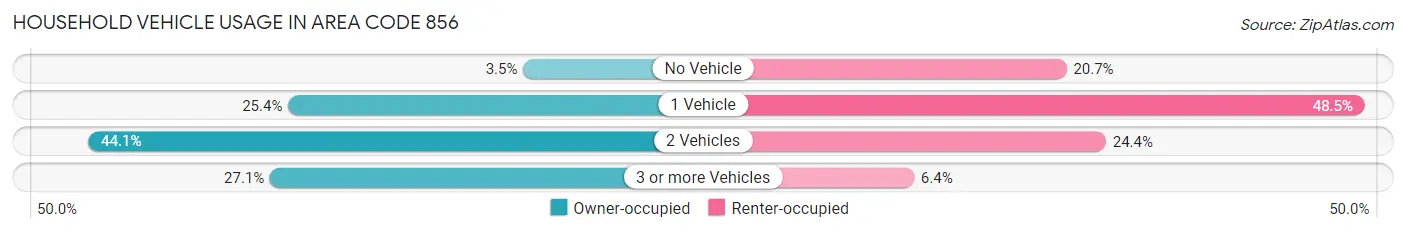
| Vehicles per Household | Owner-occupied | Renter-occupied |
| No Vehicle | 9,207 (3.5%) | 23,870 (20.7%) |
| 1 Vehicle | 67,712 (25.4%) | 56,022 (48.5%) |
| 2 Vehicles | 117,528 (44.1%) | 28,109 (24.3%) |
| 3 or more Vehicles | 72,222 (27.1%) | 7,440 (6.4%) |
| Total | 266,669 (100.0%) | 115,441 (100.0%) |
Real Estate & Mortgages in Area Code 856
Real Estate and Mortgage Overview in Area Code 856
| Characteristic | Without Mortgage | With Mortgage |
| Housing Units | 92,717 | 173,952 |
| Median Property Value | $15,827,599 | $17,936,300 |
| Median Household Income | $5,544,956 | $64,935 |
| Monthly Housing Costs | $69,537 | $34,480 |
| Real Estate Taxes | $470,473 | $4,020 |
Property Value by Mortgage Status in Area Code 856
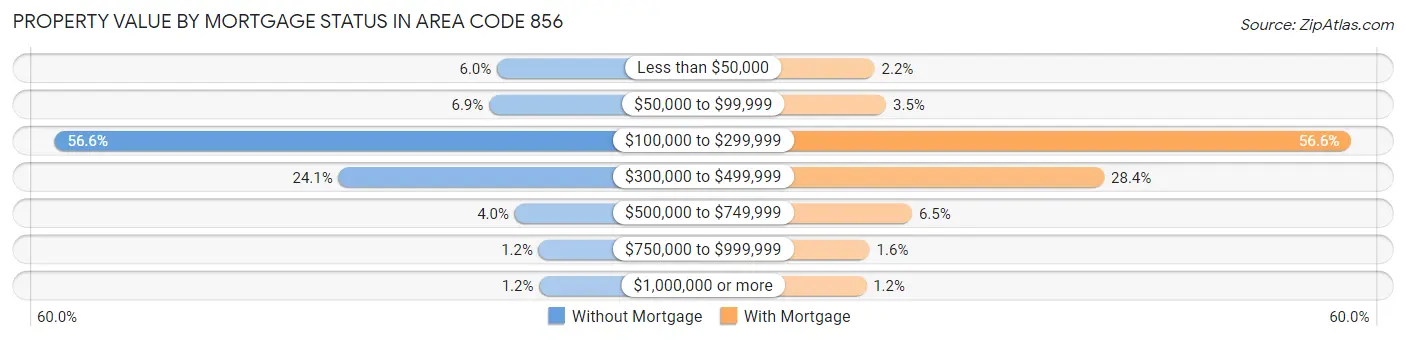
| Property Value | Without Mortgage | With Mortgage |
| Less than $50,000 | 5,564 (6.0%) | 3,790 (2.2%) |
| $50,000 to $99,999 | 6,408 (6.9%) | 6,066 (3.5%) |
| $100,000 to $299,999 | 52,452 (56.6%) | 98,531 (56.6%) |
| $300,000 to $499,999 | 22,363 (24.1%) | 49,426 (28.4%) |
| $500,000 to $749,999 | 3,692 (4.0%) | 11,218 (6.5%) |
| $750,000 to $999,999 | 1,142 (1.2%) | 2,805 (1.6%) |
| $1,000,000 or more | 1,096 (1.2%) | 2,116 (1.2%) |
| Total | 92,717 (100.0%) | 173,952 (100.0%) |
Household Income by Mortgage Status in Area Code 856
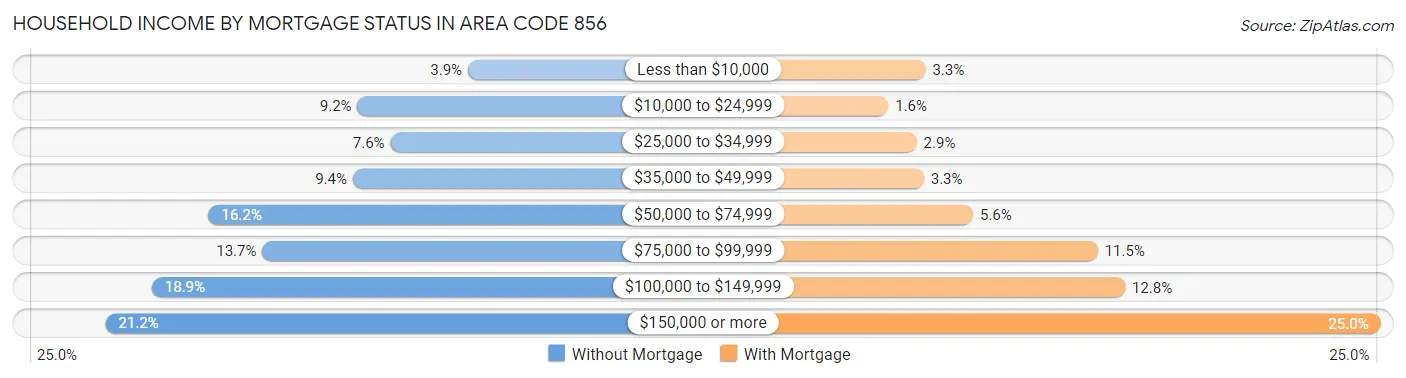
| Household Income | Without Mortgage | With Mortgage |
| Less than $10,000 | 3,611 (3.9%) | 5,789 (3.3%) |
| $10,000 to $24,999 | 8,479 (9.1%) | 2,709 (1.6%) |
| $25,000 to $34,999 | 7,030 (7.6%) | 5,062 (2.9%) |
| $35,000 to $49,999 | 8,687 (9.4%) | 5,660 (3.3%) |
| $50,000 to $74,999 | 15,057 (16.2%) | 9,731 (5.6%) |
| $75,000 to $99,999 | 12,681 (13.7%) | 20,051 (11.5%) |
| $100,000 to $149,999 | 17,565 (18.9%) | 22,323 (12.8%) |
| $150,000 or more | 19,607 (21.1%) | 43,481 (25.0%) |
| Total | 92,717 (100.0%) | 173,952 (100.0%) |
Property Value to Household Income Ratio in Area Code 856
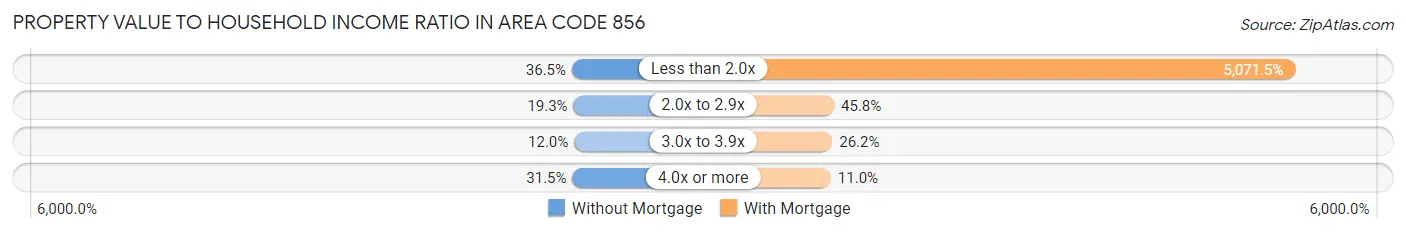
| Value-to-Income Ratio | Without Mortgage | With Mortgage |
| Less than 2.0x | 33,795 (36.4%) | 8,822,013 (5,071.5%) |
| 2.0x to 2.9x | 17,894 (19.3%) | 79,589 (45.8%) |
| 3.0x to 3.9x | 11,091 (12.0%) | 45,582 (26.2%) |
| 4.0x or more | 29,164 (31.5%) | 19,052 (11.0%) |
| Total | 92,717 (100.0%) | 173,952 (100.0%) |
Real Estate Taxes by Mortgage Status in Area Code 856
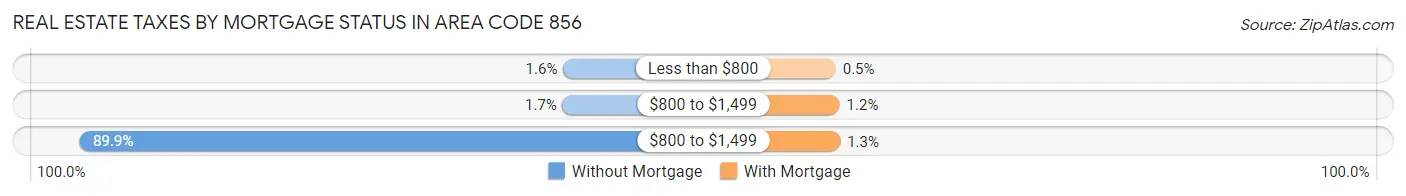
| Property Taxes | Without Mortgage | With Mortgage |
| Less than $800 | 1,500 (1.6%) | 871 (0.5%) |
| $800 to $1,499 | 1,594 (1.7%) | 2,099 (1.2%) |
| $800 to $1,499 | 83,330 (89.9%) | 2,274 (1.3%) |
| Total | 92,717 (100.0%) | 173,952 (100.0%) |
Health & Disability in Area Code 856
Health Insurance Coverage by Age in Area Code 856
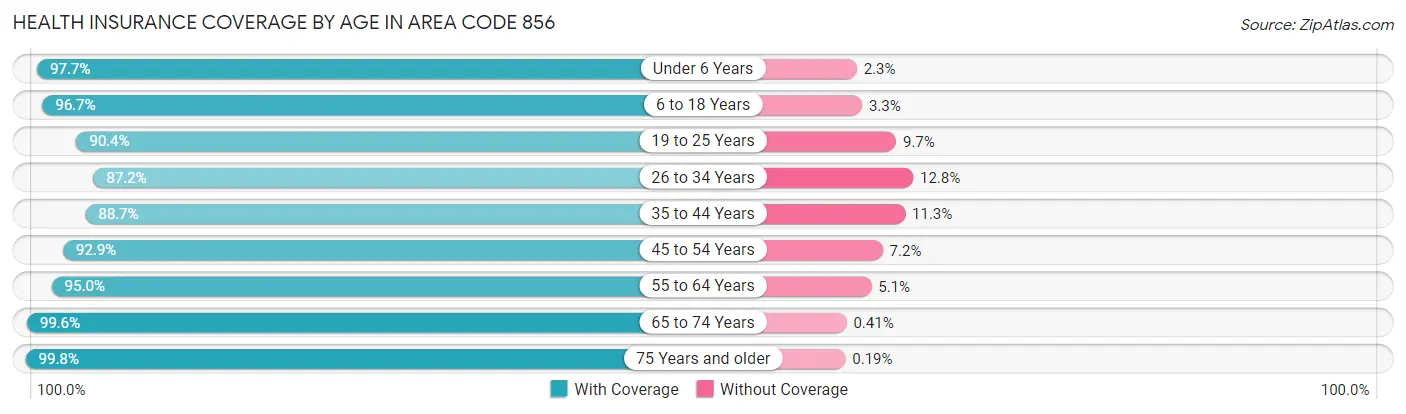
| Age Bracket | With Coverage | Without Coverage |
| Under 6 Years | 68,510 (97.7%) | 1,626 (2.3%) |
| 6 to 18 Years | 168,142 (96.7%) | 5,741 (3.3%) |
| 19 to 25 Years | 80,375 (90.3%) | 8,580 (9.7%) |
| 26 to 34 Years | 101,023 (87.2%) | 14,865 (12.8%) |
| 35 to 44 Years | 115,737 (88.7%) | 14,798 (11.3%) |
| 45 to 54 Years | 122,067 (92.8%) | 9,405 (7.1%) |
| 55 to 64 Years | 130,982 (95.0%) | 6,971 (5.1%) |
| 65 to 74 Years | 95,902 (99.6%) | 390 (0.4%) |
| 75 Years and older | 66,743 (99.8%) | 124 (0.2%) |
| Total | 949,481 (93.8%) | 62,500 (6.2%) |
Health Insurance Coverage by Citizenship Status in Area Code 856
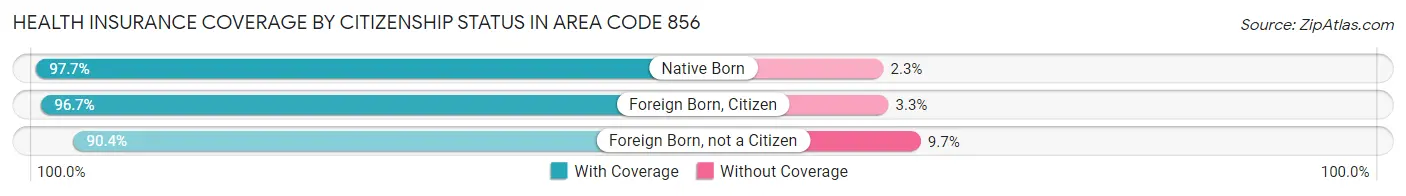
| Citizenship Status | With Coverage | Without Coverage |
| Native Born | 68,510 (97.7%) | 1,626 (2.3%) |
| Foreign Born, Citizen | 168,142 (96.7%) | 5,741 (3.3%) |
| Foreign Born, not a Citizen | 80,375 (90.3%) | 8,580 (9.7%) |
Health Insurance Coverage by Household Income in Area Code 856
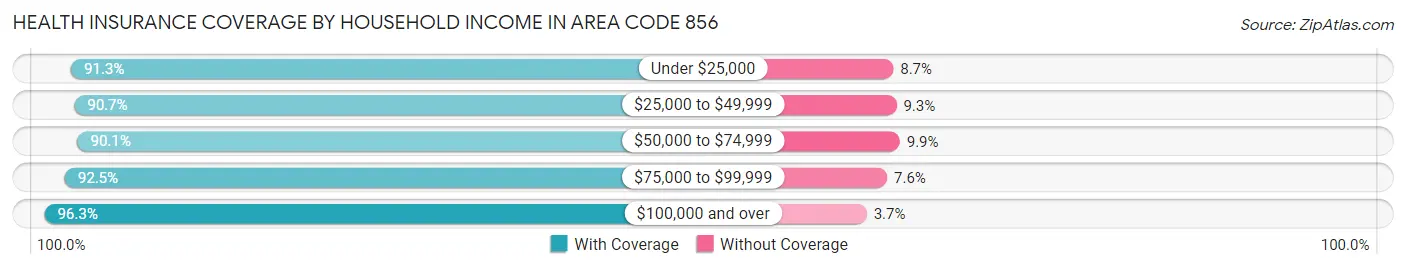
| Household Income | With Coverage | Without Coverage |
| Under $25,000 | 88,995 (91.3%) | 8,495 (8.7%) |
| $25,000 to $49,999 | 114,741 (90.7%) | 11,783 (9.3%) |
| $50,000 to $74,999 | 118,350 (90.1%) | 13,048 (9.9%) |
| $75,000 to $99,999 | 111,097 (92.4%) | 9,074 (7.5%) |
| $100,000 and over | 508,932 (96.3%) | 19,694 (3.7%) |
Public vs Private Health Insurance Coverage by Age in Area Code 856
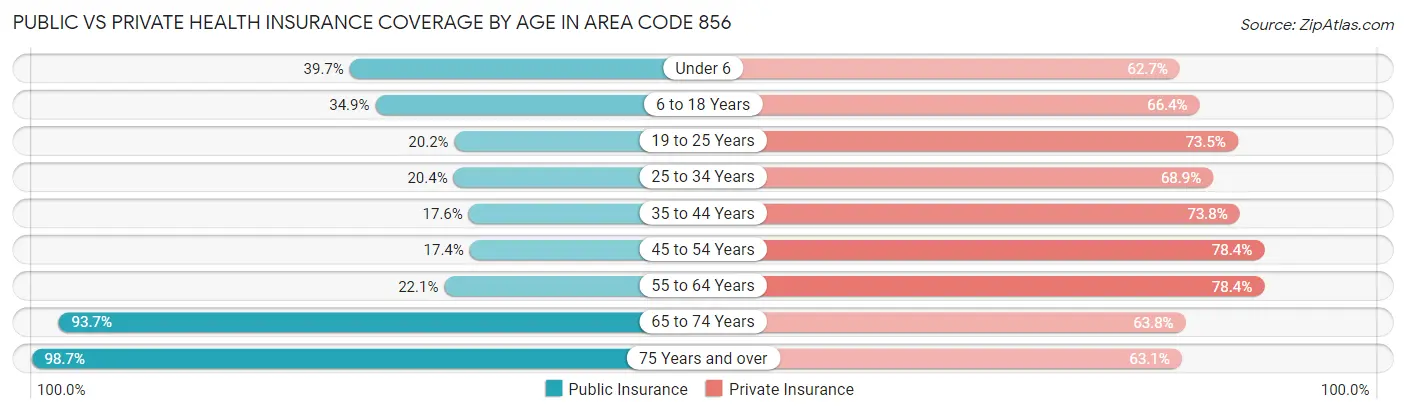
| Age Bracket | Public Insurance | Private Insurance |
| Under 6 | 27,824 (39.7%) | 43,985 (62.7%) |
| 6 to 18 Years | 60,679 (34.9%) | 115,406 (66.4%) |
| 19 to 25 Years | 17,987 (20.2%) | 65,362 (73.5%) |
| 25 to 34 Years | 23,631 (20.4%) | 79,841 (68.9%) |
| 35 to 44 Years | 22,945 (17.6%) | 96,366 (73.8%) |
| 45 to 54 Years | 22,876 (17.4%) | 103,022 (78.4%) |
| 55 to 64 Years | 30,507 (22.1%) | 108,094 (78.4%) |
| 65 to 74 Years | 90,206 (93.7%) | 61,417 (63.8%) |
| 75 Years and over | 66,011 (98.7%) | 42,171 (63.1%) |
| Total | 362,666 (35.8%) | 715,664 (70.7%) |
Disability Status by Sex by Age in Area Code 856
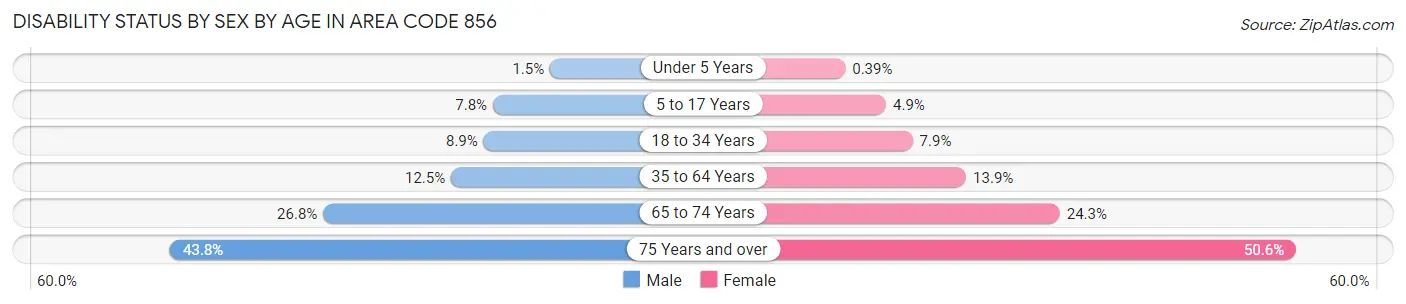
| Age Bracket | Male | Female |
| Under 5 Years | 443 (1.5%) | 107 (0.4%) |
| 5 to 17 Years | 6,887 (7.8%) | 4,207 (4.9%) |
| 18 to 34 Years | 9,712 (8.9%) | 8,590 (7.9%) |
| 35 to 64 Years | 24,318 (12.5%) | 28,465 (13.9%) |
| 65 to 74 Years | 11,891 (26.8%) | 12,588 (24.3%) |
| 75 Years and over | 11,559 (43.8%) | 20,481 (50.6%) |
Disability Class by Sex by Age in Area Code 856
Disability Class: Hearing Difficulty
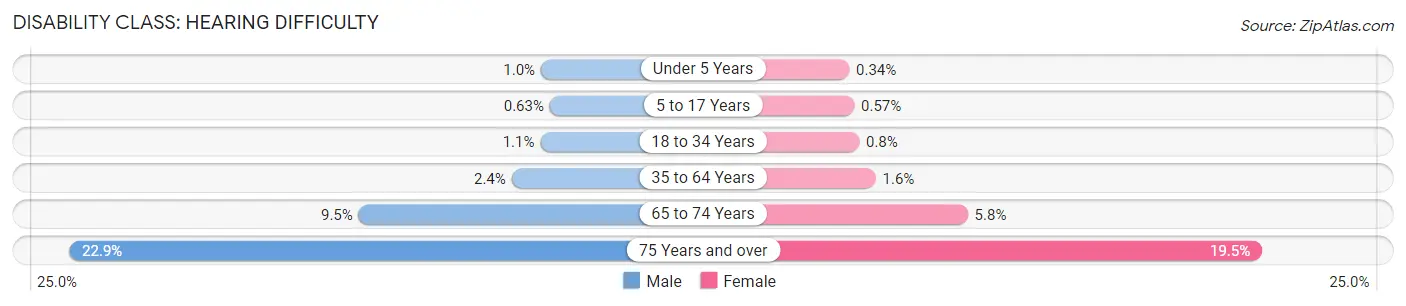
| Age Bracket | Male | Female |
| Under 5 Years | 312 (1.0%) | 95 (0.3%) |
| 5 to 17 Years | 555 (0.6%) | 490 (0.6%) |
| 18 to 34 Years | 1,165 (1.1%) | 872 (0.8%) |
| 35 to 64 Years | 4,671 (2.4%) | 3,230 (1.6%) |
| 65 to 74 Years | 4,221 (9.5%) | 3,025 (5.8%) |
| 75 Years and over | 6,052 (22.9%) | 7,896 (19.5%) |
Disability Class: Vision Difficulty
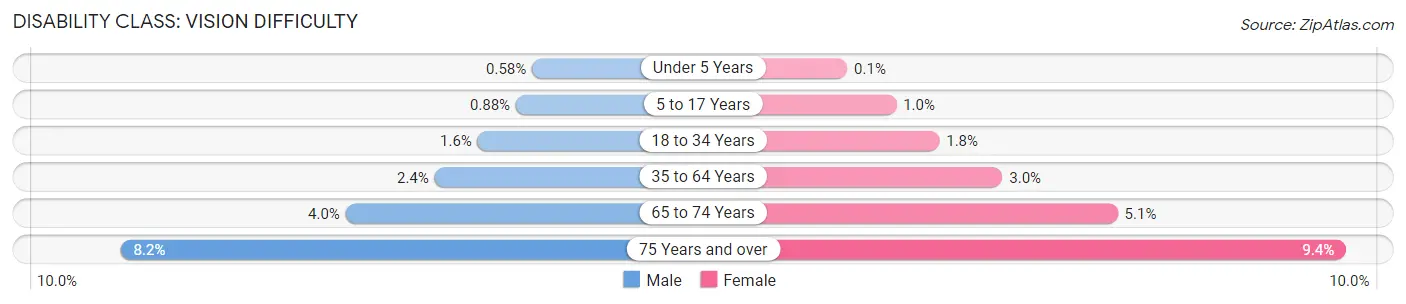
| Age Bracket | Male | Female |
| Under 5 Years | 173 (0.6%) | 27 (0.1%) |
| 5 to 17 Years | 775 (0.9%) | 862 (1.0%) |
| 18 to 34 Years | 1,733 (1.6%) | 1,971 (1.8%) |
| 35 to 64 Years | 4,637 (2.4%) | 6,125 (3.0%) |
| 65 to 74 Years | 1,796 (4.0%) | 2,656 (5.1%) |
| 75 Years and over | 2,168 (8.2%) | 3,791 (9.4%) |
Disability Class: Cognitive Difficulty
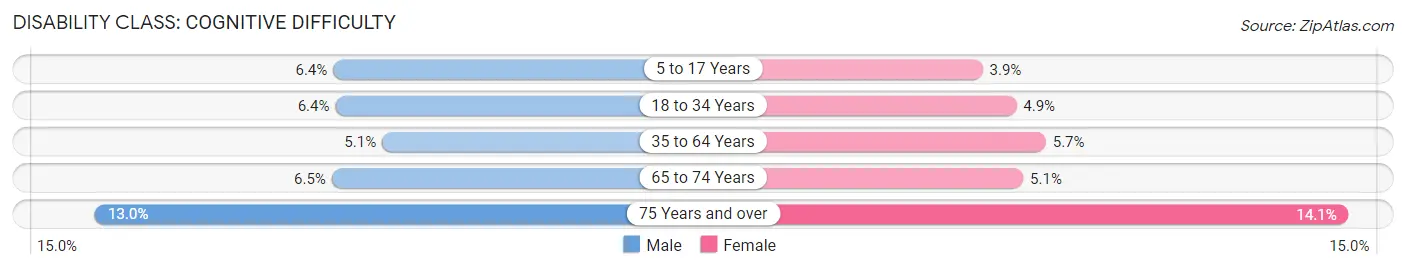
| Age Bracket | Male | Female |
| 5 to 17 Years | 5,629 (6.4%) | 3,347 (3.9%) |
| 18 to 34 Years | 6,937 (6.4%) | 5,292 (4.9%) |
| 35 to 64 Years | 9,826 (5.1%) | 11,681 (5.7%) |
| 65 to 74 Years | 2,865 (6.5%) | 2,620 (5.1%) |
| 75 Years and over | 3,440 (13.0%) | 5,713 (14.1%) |
Disability Class: Ambulatory Difficulty
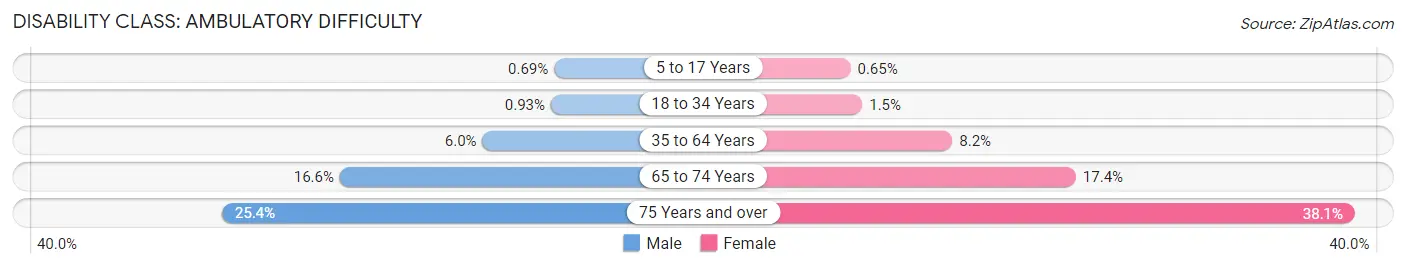
| Age Bracket | Male | Female |
| 5 to 17 Years | 608 (0.7%) | 553 (0.6%) |
| 18 to 34 Years | 1,018 (0.9%) | 1,652 (1.5%) |
| 35 to 64 Years | 11,680 (6.0%) | 16,877 (8.2%) |
| 65 to 74 Years | 7,380 (16.6%) | 9,010 (17.4%) |
| 75 Years and over | 6,689 (25.4%) | 15,422 (38.1%) |
Disability Class: Self-Care Difficulty
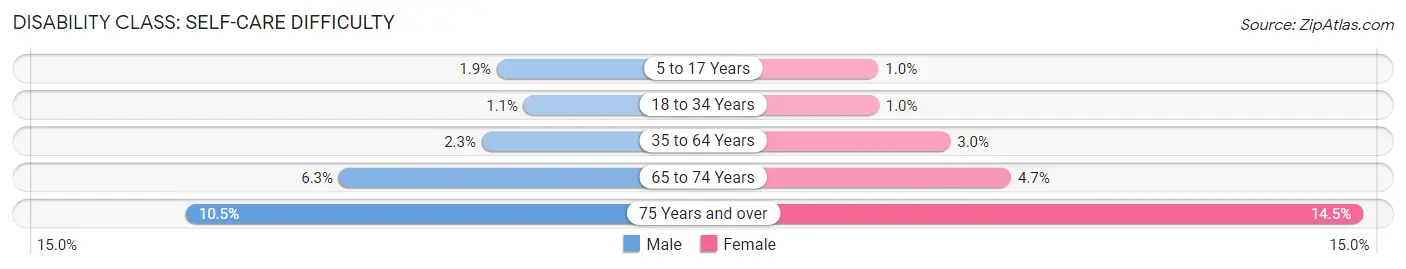
| Age Bracket | Male | Female |
| 5 to 17 Years | 1,625 (1.8%) | 871 (1.0%) |
| 18 to 34 Years | 1,205 (1.1%) | 1,118 (1.0%) |
| 35 to 64 Years | 4,416 (2.3%) | 6,208 (3.0%) |
| 65 to 74 Years | 2,779 (6.2%) | 2,444 (4.7%) |
| 75 Years and over | 2,772 (10.5%) | 5,876 (14.5%) |
Technology Access in Area Code 856
Computing Device Access in Area Code 856
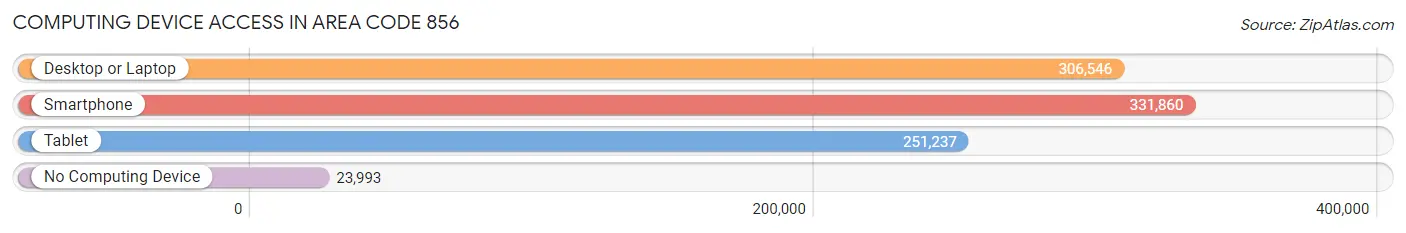
| Device Type | # Households | % Households |
| Desktop or Laptop | 306,546 | 80.2% |
| Smartphone | 331,860 | 86.9% |
| Tablet | 251,237 | 65.7% |
| No Computing Device | 23,993 | 6.3% |
| Total | 382,110 | 100.0% |
Internet Access in Area Code 856
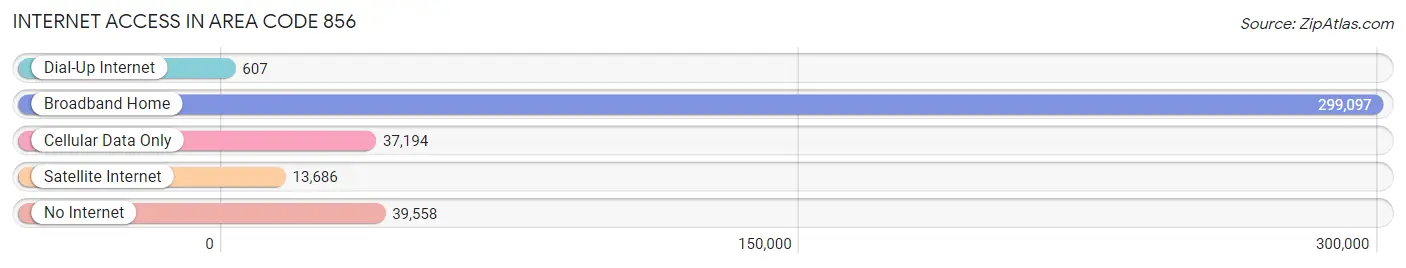
| Internet Type | # Households | % Households |
| Dial-Up Internet | 607 | 0.2% |
| Broadband Home | 299,097 | 78.3% |
| Cellular Data Only | 37,194 | 9.7% |
| Satellite Internet | 13,686 | 3.6% |
| No Internet | 39,558 | 10.3% |
| Total | 382,110 | 100.0% |
Area Code 856 Summary
Geography
Area code 856 is located in the state of New Jersey and covers the southern portion of the state. It includes the cities of Camden, Vineland, Millville, Bridgeton, and Atlantic City.
Social
Area code 856 is home to a diverse population of people from all walks of life. The area is known for its vibrant nightlife, with a variety of bars, clubs, and restaurants. It is also home to a number of cultural attractions, including the Camden Waterfront, the Battleship New Jersey, and the Atlantic City Boardwalk.
Economics
Area code 856 is an economically diverse area, with a mix of industries ranging from manufacturing to tourism. The area is home to a number of large corporations, including Campbell Soup Company, Lockheed Martin, and Subaru of America.
Demographics
Area code 856 is home to a population of over 1.2 million people. The population is predominantly white, with a large Hispanic population. The median household income is $50,000, and the median age is 37.
Common Questions
What is Per Capita Income in Area Code 856?
Per Capita income in Area Code 856 is $41,554.
What is the Median Family Income in Area Code 856?
Median Family Income in Area Code 856 is $108,489.
What is the Median Household income in Area Code 856?
Median Household Income in Area Code 856 is $90,238.
What is Income or Wage Gap in Area Code 856?
Income or Wage Gap in Area Code 856 is 26.7%.
Women in Area Code 856 earn 73.3 cents for every dollar earned by a man.
What is Family Income Deficit in Area Code 856?
Family Income Deficit in Area Code 856 is $10,281.
Families that are below poverty line in Area Code 856 earn $10,281 less on average than the poverty threshold level.
What is Inequality or Gini Index in Area Code 856?
Inequality or Gini Index in Area Code 856 is 31.76.
What is the Total Population of Area Code 856?
Total Population of Area Code 856 is 1,028,483.
What is the Total Male Population of Area Code 856?
Total Male Population of Area Code 856 is 505,178.
What is the Total Female Population of Area Code 856?
Total Female Population of Area Code 856 is 523,305.
What is the Ratio of Males per 100 Females in Area Code 856?
There are 96.54 Males per 100 Females in Area Code 856.
What is the Ratio of Females per 100 Males in Area Code 856?
There are 103.59 Females per 100 Males in Area Code 856.
What is the Median Population Age in Area Code 856?
Median Population Age in Area Code 856 is 41.7 Years.
What is the Average Family Size in Area Code 856
Average Family Size in Area Code 856 is 3.2 People.
What is the Average Household Size in Area Code 856
Average Household Size in Area Code 856 is 2.7 People.
How Large is the Labor Force in Area Code 856?
There are 509,203 People in the Labor Forcein in Area Code 856.
What is the Percentage of People in the Labor Force in Area Code 856?
61.8% of People are in the Labor Force in Area Code 856.
What is the Unemployment Rate in Area Code 856?
Unemployment Rate in Area Code 856 is 7.0%.