Area Code 956 Map & Demographics
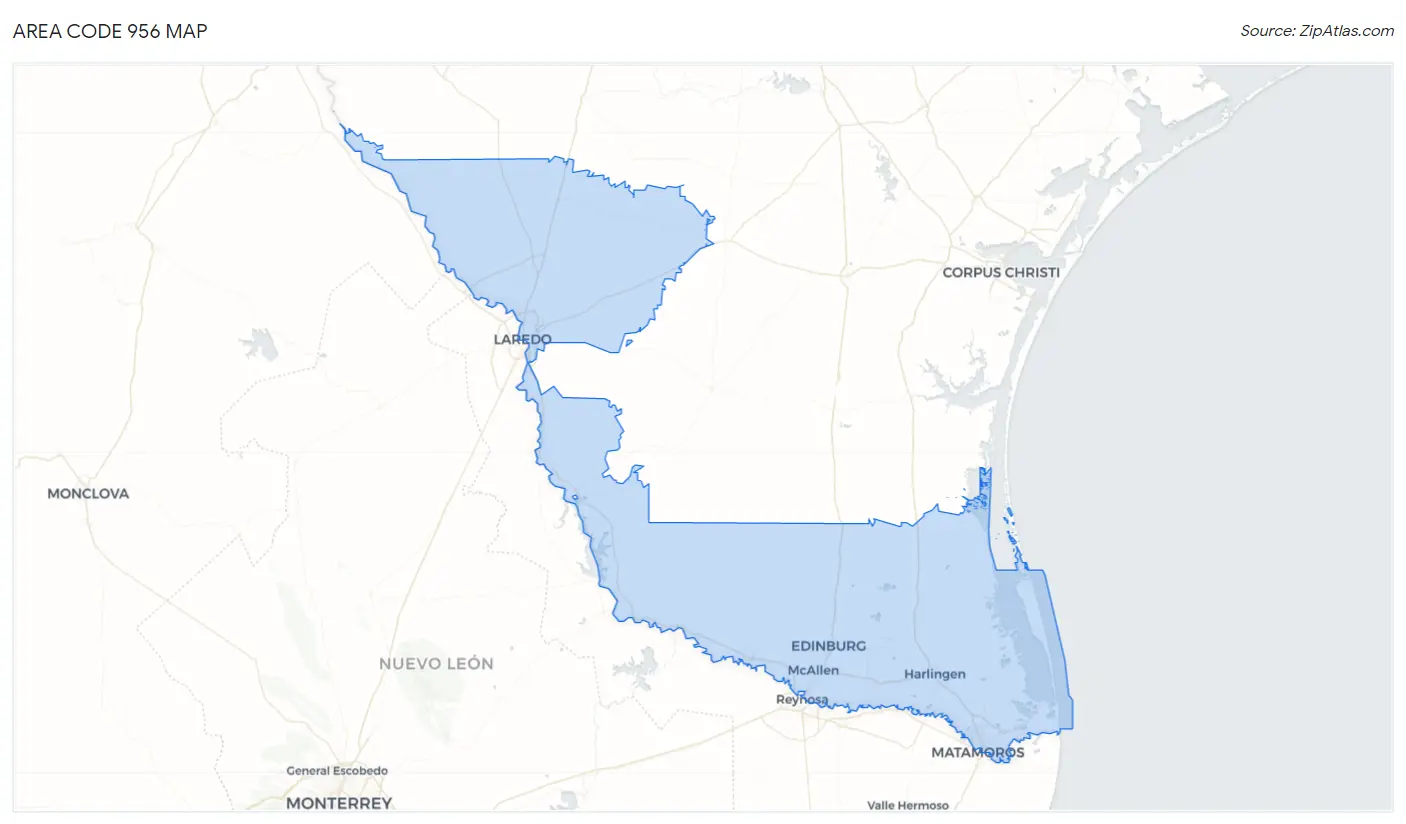
Area Code 956 Map
Area Code 956 Overview
$20,907
PER CAPITA INCOME
$56,664
AVG FAMILY INCOME
$46,596
AVG HOUSEHOLD INCOME
33.9%
WAGE / INCOME GAP [ % ]
66.1¢/ $1
WAGE / INCOME GAP [ $ ]
$11,482
FAMILY INCOME DEFICIT
29.98
INEQUALITY / GINI INDEX
1,666,455
TOTAL POPULATION
825,243
MALE POPULATION
841,212
FEMALE POPULATION
98.10
MALES / 100 FEMALES
101.94
FEMALES / 100 MALES
35.0
MEDIAN AGE
3.8
AVG FAMILY SIZE
3.2
AVG HOUSEHOLD SIZE
644,965
LABOR FORCE [ PEOPLE ]
53.4%
PERCENT IN LABOR FORCE
8.0%
UNEMPLOYMENT RATE
Income in Area Code 956
Income Overview in Area Code 956
Per Capita Income in Area Code 956 is $20,907, while median incomes of families and households are $56,664 and $46,596 respectively.
| Characteristic | Number | Measure |
| Per Capita Income | 1,666,455 | $20,907 |
| Median Family Income | 388,890 | $56,664 |
| Mean Family Income | 388,890 | $4,555,594 |
| Median Household Income | 497,375 | $46,596 |
| Mean Household Income | 497,375 | $4,134,186 |
| Income Deficit | 388,890 | $11,482 |
| Wage / Income Gap (%) | 1,666,455 | 33.90% |
| Wage / Income Gap ($) | 1,666,455 | 66.10¢ per $1 |
| Gini / Inequality Index | 1,666,455 | 29.98 |
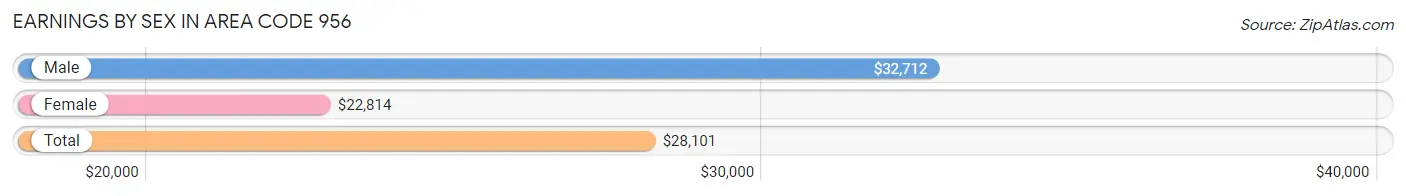
Earnings by Sex in Area Code 956
Average Earnings in Area Code 956 are $28,101, $32,712 for men and $22,814 for women, a difference of 30.3%.
| Sex | Number | Average Earnings |
| Male | 402,843 (55.2%) | $32,712 |
| Female | 326,626 (44.8%) | $22,814 |
| Total | 729,469 (100.0%) | $28,101 |
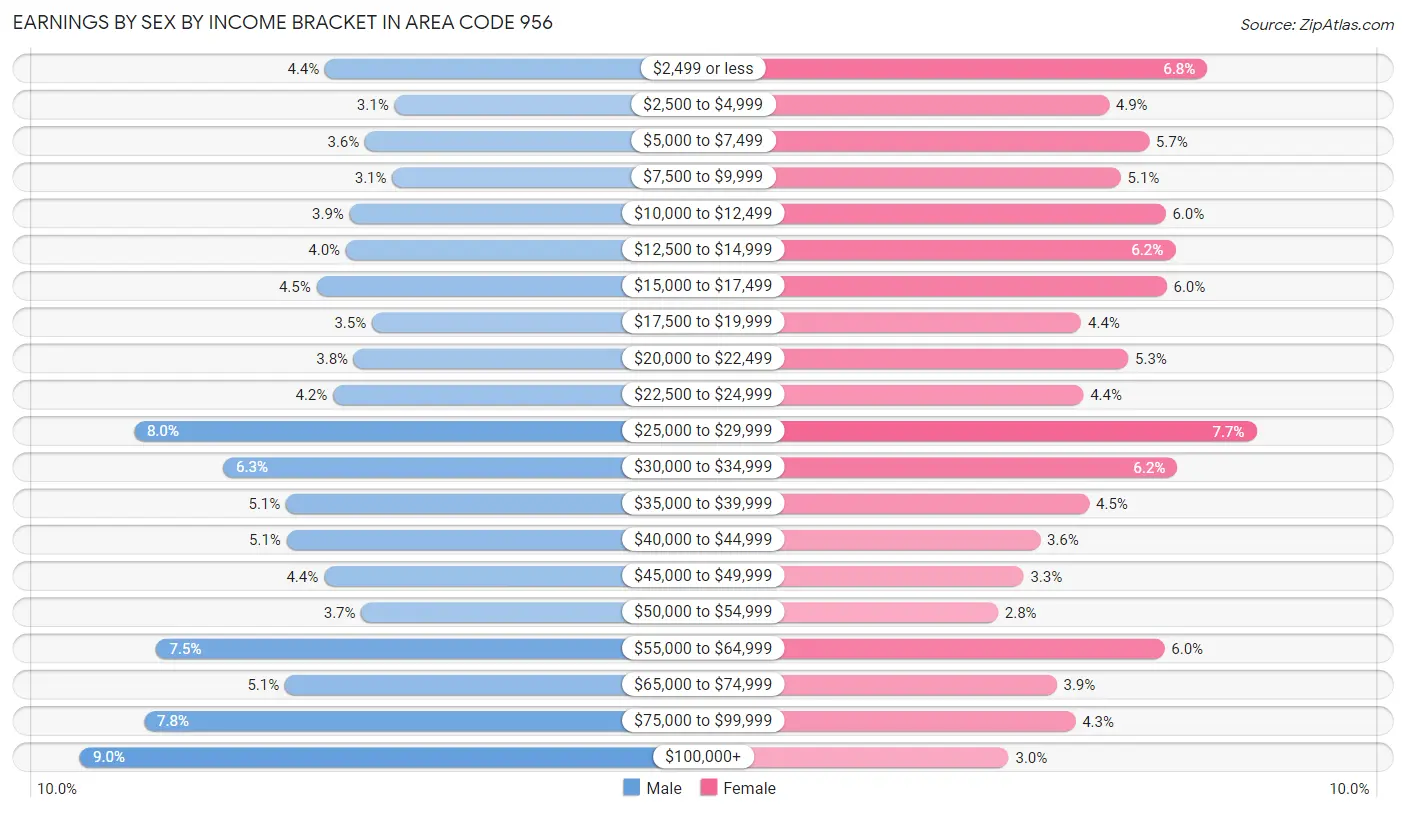
Earnings by Sex by Income Bracket in Area Code 956
The most common earnings brackets in Area Code 956 are $100,000+ for men (36,083 | 9.0%) and $25,000 to $29,999 for women (25,066 | 7.7%).
| Income | Male | Female |
| $2,499 or less | 17,589 (4.4%) | 22,039 (6.8%) |
| $2,500 to $4,999 | 12,357 (3.1%) | 16,041 (4.9%) |
| $5,000 to $7,499 | 14,586 (3.6%) | 18,492 (5.7%) |
| $7,500 to $9,999 | 12,543 (3.1%) | 16,771 (5.1%) |
| $10,000 to $12,499 | 15,734 (3.9%) | 19,499 (6.0%) |
| $12,500 to $14,999 | 16,052 (4.0%) | 20,080 (6.1%) |
| $15,000 to $17,499 | 18,250 (4.5%) | 19,578 (6.0%) |
| $17,500 to $19,999 | 14,072 (3.5%) | 14,338 (4.4%) |
| $20,000 to $22,499 | 15,410 (3.8%) | 17,217 (5.3%) |
| $22,500 to $24,999 | 17,010 (4.2%) | 14,484 (4.4%) |
| $25,000 to $29,999 | 32,025 (8.0%) | 25,066 (7.7%) |
| $30,000 to $34,999 | 25,287 (6.3%) | 20,221 (6.2%) |
| $35,000 to $39,999 | 20,544 (5.1%) | 14,818 (4.5%) |
| $40,000 to $44,999 | 20,509 (5.1%) | 11,829 (3.6%) |
| $45,000 to $49,999 | 17,695 (4.4%) | 10,805 (3.3%) |
| $50,000 to $54,999 | 14,862 (3.7%) | 9,231 (2.8%) |
| $55,000 to $64,999 | 30,349 (7.5%) | 19,418 (5.9%) |
| $65,000 to $74,999 | 20,613 (5.1%) | 12,824 (3.9%) |
| $75,000 to $99,999 | 31,273 (7.8%) | 13,981 (4.3%) |
| $100,000+ | 36,083 (9.0%) | 9,894 (3.0%) |
| Total | 402,843 (100.0%) | 326,626 (100.0%) |
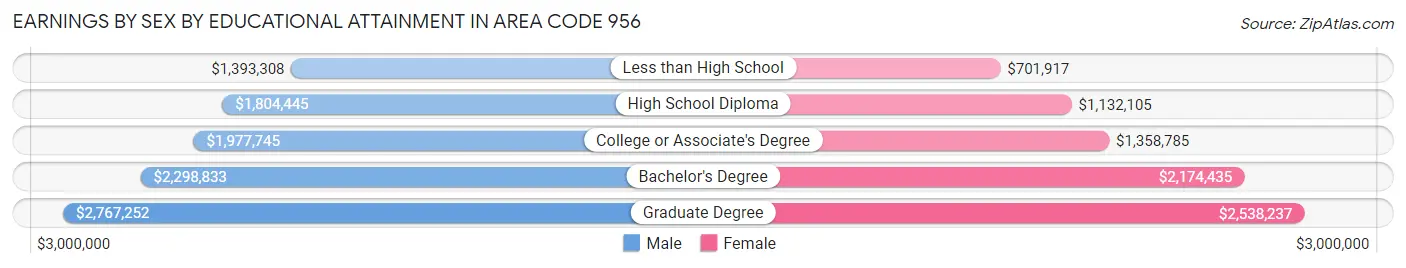
Earnings by Sex by Educational Attainment in Area Code 956
Average earnings in Area Code 956 are $2,215,623 for men and $1,586,007 for women, a difference of 28.4%. Men with an educational attainment of graduate degree enjoy the highest average annual earnings of $2,767,252, while those with less than high school education earn the least with $1,393,308. Women with an educational attainment of graduate degree earn the most with the average annual earnings of $2,538,237, while those with less than high school education have the smallest earnings of $701,917.
| Educational Attainment | Male Income | Female Income |
| Less than High School | $1,393,308 | $701,917 |
| High School Diploma | $1,804,445 | $1,132,105 |
| College or Associate's Degree | $1,977,745 | $1,358,785 |
| Bachelor's Degree | $2,298,833 | $2,174,435 |
| Graduate Degree | $2,767,252 | $2,538,237 |
| Total | $2,215,623 | $1,586,007 |
Family Income in Area Code 956
Family Income Brackets in Area Code 956
According to the Area Code 956 family income data, there are 4,158,401 families falling into the $50,000 to $74,999 income range, which is the most common income bracket and makes up 1,069.3% of all families. Conversely, the $200,000+ income bracket is the least frequent group with only 1,146,837 families (294.9%) belonging to this category.
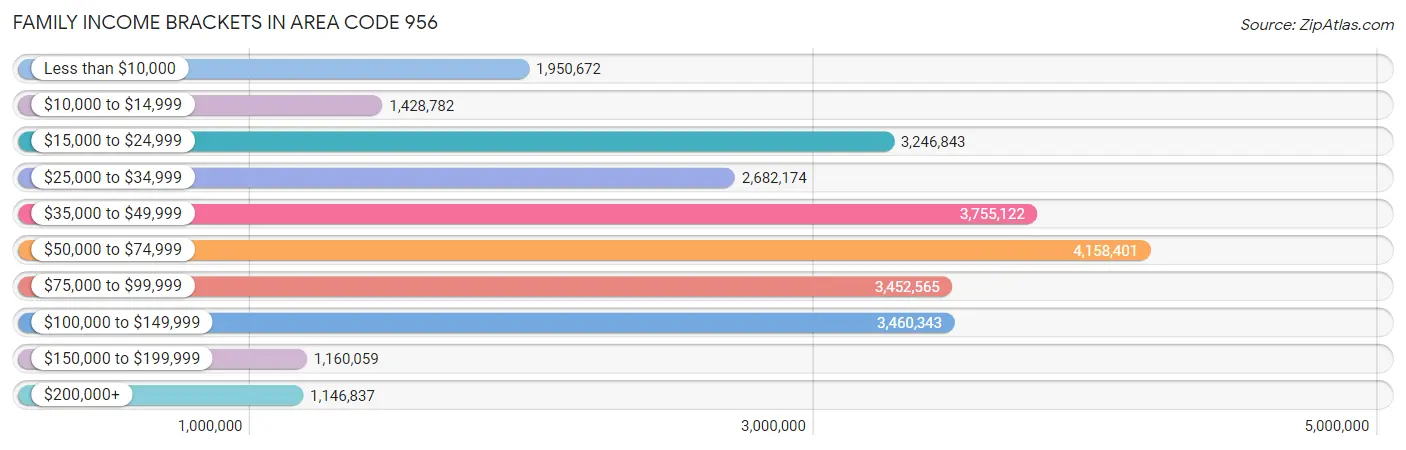
| Income Bracket | # Families | % Families |
| Less than $10,000 | 1,950,672 | 501.6% |
| $10,000 to $14,999 | 1,428,782 | 367.4% |
| $15,000 to $24,999 | 3,246,843 | 834.9% |
| $25,000 to $34,999 | 2,682,174 | 689.7% |
| $35,000 to $49,999 | 3,755,122 | 965.6% |
| $50,000 to $74,999 | 4,158,401 | 1,069.3% |
| $75,000 to $99,999 | 3,452,565 | 887.8% |
| $100,000 to $149,999 | 3,460,343 | 889.8% |
| $150,000 to $199,999 | 1,160,059 | 298.3% |
| $200,000+ | 1,146,837 | 294.9% |
Family Income by Famaliy Size in Area Code 956
7+ person families (18,386 | 4.7%) account for the highest median family income in Area Code 956 with $74,554 per family, while 2-person families (119,161 | 30.6%) have the highest median income of $22,815 per family member.
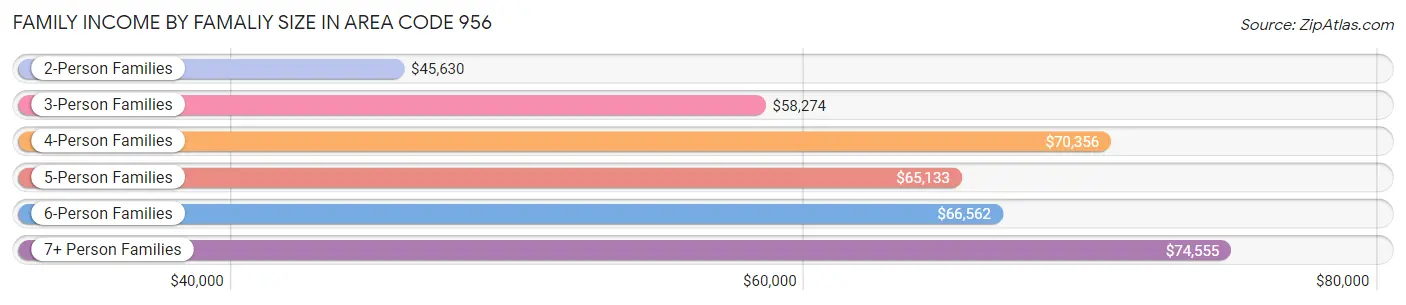
| Income Bracket | # Families | Median Income |
| 2-Person Families | 119,161 (30.6%) | $45,630 |
| 3-Person Families | 85,623 (22.0%) | $58,274 |
| 4-Person Families | 85,329 (21.9%) | $70,356 |
| 5-Person Families | 54,805 (14.1%) | $65,133 |
| 6-Person Families | 25,586 (6.6%) | $66,562 |
| 7+ Person Families | 18,386 (4.7%) | $74,554 |
| Total | 388,890 (100.0%) | $56,664 |
Family Income by Number of Earners in Area Code 956
The median family income in Area Code 956 is $56,664, with families comprising 3+ earners (53,835) having the highest median family income of $97,459, while families with no earners (54,335) have the lowest median family income of $23,699, accounting for 13.8% and 14.0% of families, respectively.
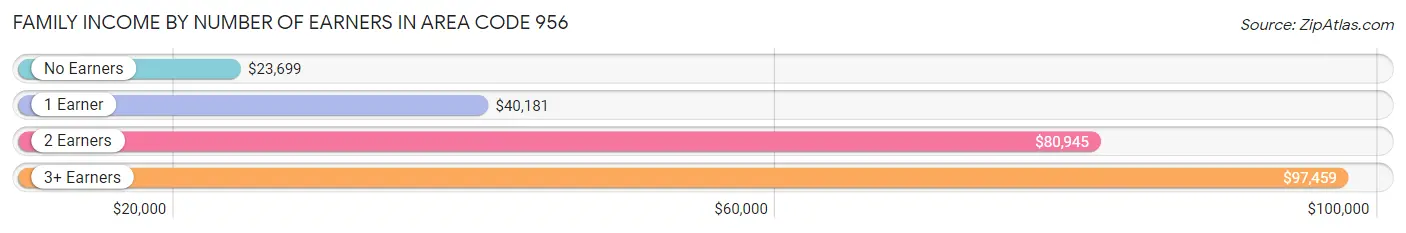
| Number of Earners | # Families | Median Income |
| No Earners | 54,335 (14.0%) | $23,699 |
| 1 Earner | 141,925 (36.5%) | $40,181 |
| 2 Earners | 138,795 (35.7%) | $80,945 |
| 3+ Earners | 53,835 (13.8%) | $97,459 |
| Total | 388,890 (100.0%) | $56,664 |
Household Income in Area Code 956
Household Income Brackets in Area Code 956
With 5,077,204 households falling in the category, the $15,000 to $24,999 income range is the most frequent in Area Code 956, accounting for 1,020.8% of all households. In contrast, only 1,123,073 households (225.8%) fall into the $200,000+ income bracket, making it the least populous group.
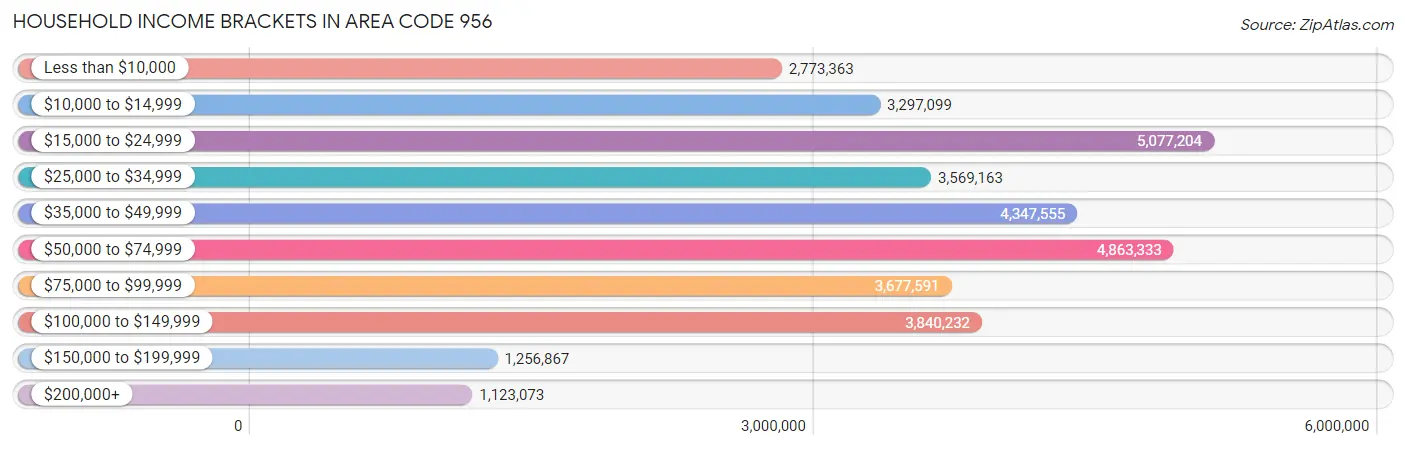
| Income Bracket | # Households | % Households |
| Less than $10,000 | 2,773,363 | 557.6% |
| $10,000 to $14,999 | 3,297,099 | 662.9% |
| $15,000 to $24,999 | 5,077,204 | 1,020.8% |
| $25,000 to $34,999 | 3,569,163 | 717.6% |
| $35,000 to $49,999 | 4,347,555 | 874.1% |
| $50,000 to $74,999 | 4,863,333 | 977.8% |
| $75,000 to $99,999 | 3,677,591 | 739.4% |
| $100,000 to $149,999 | 3,840,232 | 772.1% |
| $150,000 to $199,999 | 1,256,867 | 252.7% |
| $200,000+ | 1,123,073 | 225.8% |
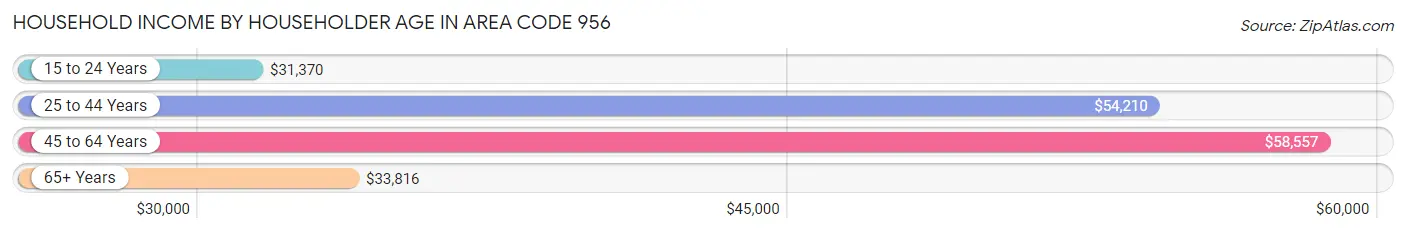
Household Income by Householder Age in Area Code 956
The median household income in Area Code 956 is $46,596, with the highest median household income of $58,557 found in the 45 to 64 years age bracket for the primary householder. A total of 182,873 households (36.8%) fall into this category. Meanwhile, the 15 to 24 years age bracket for the primary householder has the lowest median household income of $31,370, with 19,549 households (3.9%) in this group.
| Income Bracket | # Households | Median Income |
| 15 to 24 Years | 19,549 (3.9%) | $31,370 |
| 25 to 44 Years | 179,450 (36.1%) | $54,210 |
| 45 to 64 Years | 182,873 (36.8%) | $58,557 |
| 65+ Years | 115,503 (23.2%) | $33,816 |
| Total | 497,375 (100.0%) | $46,596 |
Poverty in Area Code 956
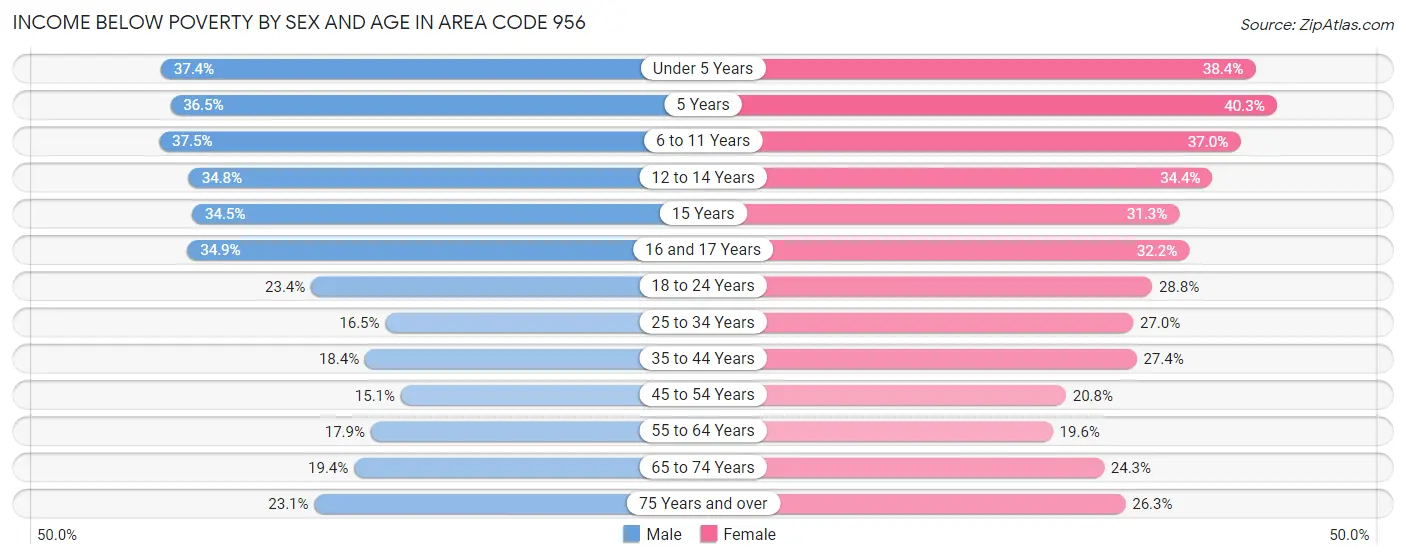
Income Below Poverty by Sex and Age in Area Code 956
With 24.4% poverty level for males and 28.4% for females among the residents of Area Code 956, 6 to 11 year old males and 5 year old females are the most vulnerable to poverty, with 33,456 males (37.5%) and 5,132 females (40.3%) in their respective age groups living below the poverty level.
| Age Bracket | Male | Female |
| Under 5 Years | 25,274 (37.3%) | 24,908 (38.4%) |
| 5 Years | 5,182 (36.5%) | 5,132 (40.3%) |
| 6 to 11 Years | 33,456 (37.5%) | 30,893 (36.9%) |
| 12 to 14 Years | 15,779 (34.8%) | 16,194 (34.4%) |
| 15 Years | 5,018 (34.4%) | 4,612 (31.3%) |
| 16 and 17 Years | 10,648 (34.9%) | 9,480 (32.2%) |
| 18 to 24 Years | 22,444 (23.4%) | 26,534 (28.8%) |
| 25 to 34 Years | 18,425 (16.5%) | 29,039 (27.0%) |
| 35 to 44 Years | 18,470 (18.4%) | 27,821 (27.4%) |
| 45 to 54 Years | 13,617 (15.1%) | 20,255 (20.8%) |
| 55 to 64 Years | 12,221 (17.9%) | 15,182 (19.6%) |
| 65 to 74 Years | 9,752 (19.4%) | 14,427 (24.3%) |
| 75 Years and over | 7,895 (23.1%) | 12,522 (26.3%) |
| Total | 198,181 (24.4%) | 236,999 (28.4%) |
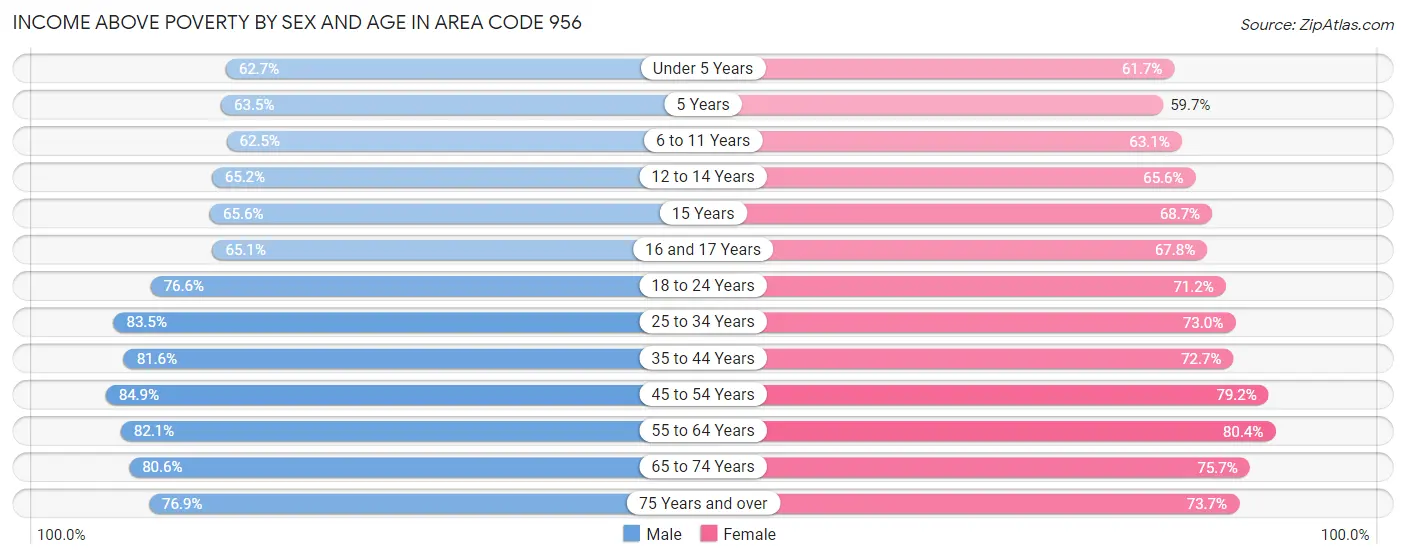
Income Above Poverty by Sex and Age in Area Code 956
According to the poverty statistics in Area Code 956, males aged 45 to 54 years and females aged 55 to 64 years are the age groups that are most secure financially, with 84.9% of males and 80.4% of females in these age groups living above the poverty line.
| Age Bracket | Male | Female |
| Under 5 Years | 42,401 (62.6%) | 40,043 (61.7%) |
| 5 Years | 9,023 (63.5%) | 7,589 (59.7%) |
| 6 to 11 Years | 55,731 (62.5%) | 52,710 (63.0%) |
| 12 to 14 Years | 29,618 (65.2%) | 30,900 (65.6%) |
| 15 Years | 9,547 (65.5%) | 10,121 (68.7%) |
| 16 and 17 Years | 19,869 (65.1%) | 19,939 (67.8%) |
| 18 to 24 Years | 73,449 (76.6%) | 65,631 (71.2%) |
| 25 to 34 Years | 93,131 (83.5%) | 78,386 (73.0%) |
| 35 to 44 Years | 81,867 (81.6%) | 73,886 (72.7%) |
| 45 to 54 Years | 76,669 (84.9%) | 77,168 (79.2%) |
| 55 to 64 Years | 56,164 (82.1%) | 62,405 (80.4%) |
| 65 to 74 Years | 40,462 (80.6%) | 44,891 (75.7%) |
| 75 Years and over | 26,272 (76.9%) | 35,070 (73.7%) |
| Total | 614,203 (75.6%) | 598,739 (71.6%) |
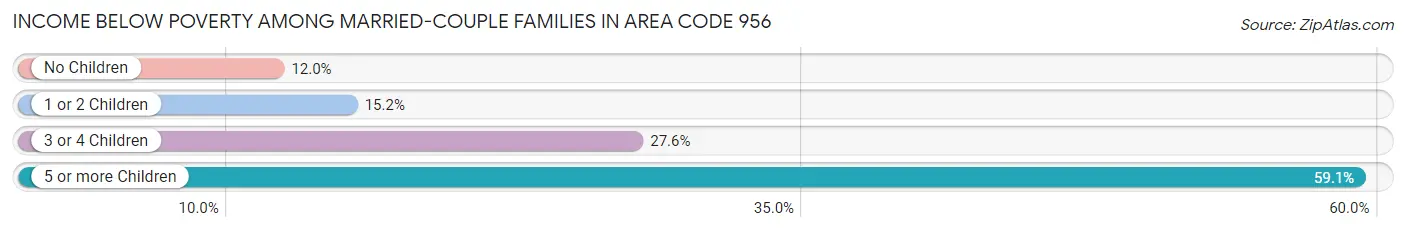
Income Below Poverty Among Married-Couple Families in Area Code 956
The poverty statistics for married-couple families in Area Code 956 show that 16.5% or 41,382 of the total 251,412 families live below the poverty line. Families with 5 or more children have the highest poverty rate of 59.1%, comprising of 2,805 families. On the other hand, families with no children have the lowest poverty rate of 12.0%, which includes 13,527 families.
| Children | Above Poverty | Below Poverty |
| No Children | 99,024 (88.0%) | 13,527 (12.0%) |
| 1 or 2 Children | 82,011 (84.8%) | 14,716 (15.2%) |
| 3 or 4 Children | 27,053 (72.4%) | 10,334 (27.6%) |
| 5 or more Children | 1,942 (40.9%) | 2,805 (59.1%) |
| Total | 210,030 (83.5%) | 41,382 (16.5%) |
Income Below Poverty Among Single-Parent Households in Area Code 956
According to the poverty data in Area Code 956, 24.0% or 7,710 single-father households and 40.0% or 42,149 single-mother households are living below the poverty line. Among single-father households, those with 5 or more children have the highest poverty rate, with 303 households (53.9%) experiencing poverty. Likewise, among single-mother households, those with 5 or more children have the highest poverty rate, with 2,433 households (82.0%) falling below the poverty line.
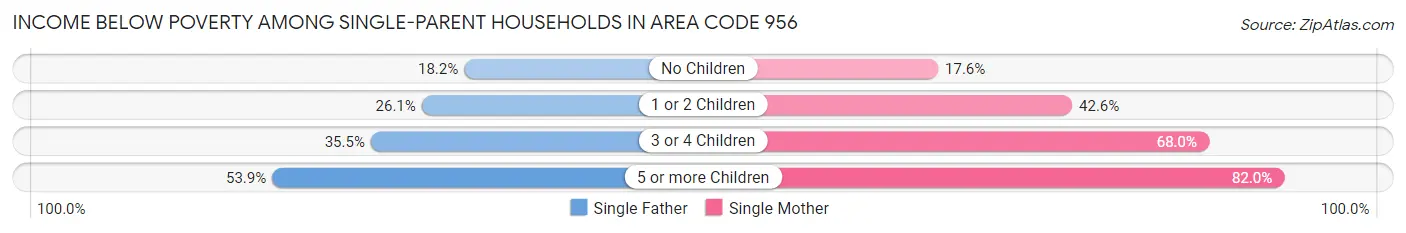
| Children | Single Father | Single Mother |
| No Children | 2,651 (18.1%) | 5,977 (17.6%) |
| 1 or 2 Children | 3,515 (26.1%) | 21,326 (42.5%) |
| 3 or 4 Children | 1,241 (35.5%) | 12,413 (68.0%) |
| 5 or more Children | 303 (53.9%) | 2,433 (82.0%) |
| Total | 7,710 (24.0%) | 42,149 (40.0%) |
Income Below Poverty Among Married-Couple vs Single-Parent Households in Area Code 956
The poverty data for Area Code 956 shows that 41,382 of the married-couple family households (16.5%) and 49,859 of the single-parent households (36.3%) are living below the poverty level. Within the married-couple family households, those with 5 or more children have the highest poverty rate, with 2,805 households (59.1%) falling below the poverty line. Among the single-parent households, those with 5 or more children have the highest poverty rate, with 2,736 household (77.5%) living below poverty.
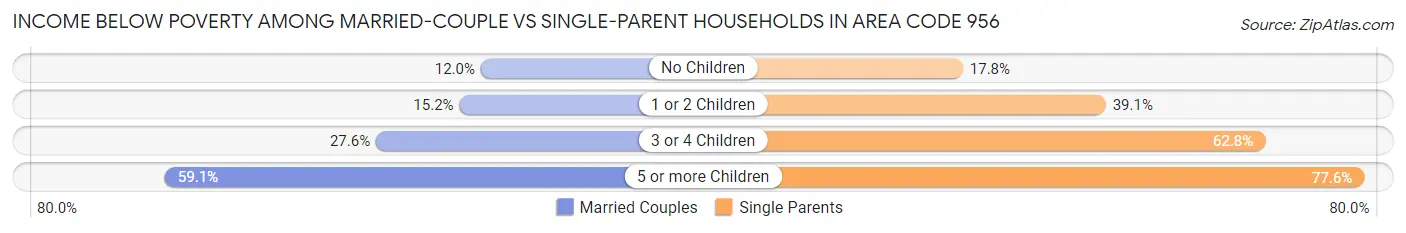
| Children | Married-Couple Families | Single-Parent Households |
| No Children | 13,527 (12.0%) | 8,628 (17.8%) |
| 1 or 2 Children | 14,716 (15.2%) | 24,841 (39.1%) |
| 3 or 4 Children | 10,334 (27.6%) | 13,654 (62.8%) |
| 5 or more Children | 2,805 (59.1%) | 2,736 (77.5%) |
| Total | 41,382 (16.5%) | 49,859 (36.3%) |
Race in Area Code 956
The most populous races in Area Code 956 are Hispanic or Latino (1,540,581 | 92.4%), White / Caucasian (914,847 | 54.9%), and Two or more Races (579,077 | 34.7%).
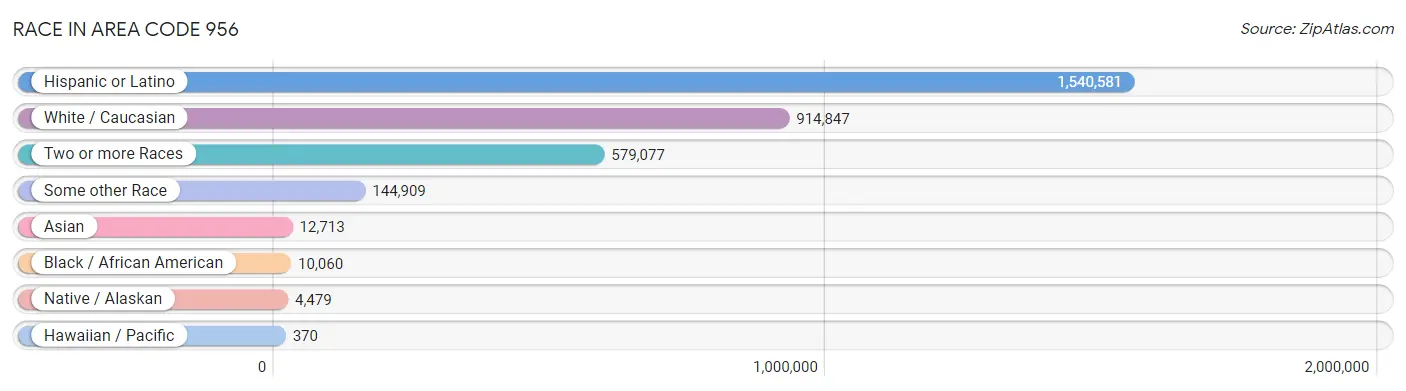
| Race | # Population | % Population |
| Asian | 12,713 | 0.8% |
| Black / African American | 10,060 | 0.6% |
| Hawaiian / Pacific | 370 | 0.0% |
| Hispanic or Latino | 1,540,581 | 92.4% |
| Native / Alaskan | 4,479 | 0.3% |
| White / Caucasian | 914,847 | 54.9% |
| Two or more Races | 579,077 | 34.7% |
| Some other Race | 144,909 | 8.7% |
| Total | 1,666,455 | 100.0% |
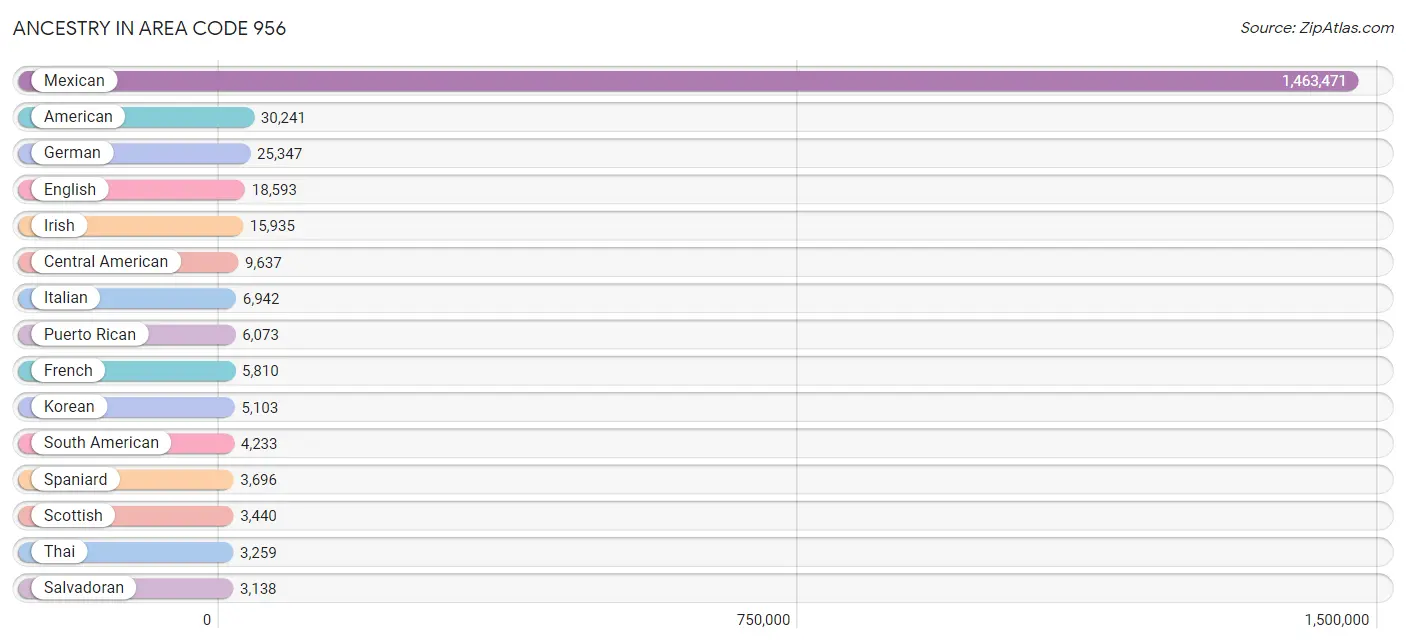
Ancestry in Area Code 956
The most populous ancestries reported in Area Code 956 are Mexican (1,463,471 | 87.8%), American (30,241 | 1.8%), German (25,347 | 1.5%), English (18,593 | 1.1%), and Irish (15,935 | 1.0%), together accounting for 93.2% of all Area Code 956 residents.
| Ancestry | # Population | % Population |
| Afghan | 27 | 0.0% |
| African | 1,410 | 0.1% |
| Albanian | 62 | 0.0% |
| Alsatian | 18 | 0.0% |
| American | 30,241 | 1.8% |
| Apache | 346 | 0.0% |
| Arab | 800 | 0.1% |
| Argentinean | 257 | 0.0% |
| Armenian | 50 | 0.0% |
| Assyrian / Chaldean / Syriac | 2 | 0.0% |
| Australian | 67 | 0.0% |
| Austrian | 179 | 0.0% |
| Bahamian | 32 | 0.0% |
| Bangladeshi | 10 | 0.0% |
| Basque | 26 | 0.0% |
| Belgian | 191 | 0.0% |
| Belizean | 211 | 0.0% |
| Bhutanese | 979 | 0.1% |
| Blackfeet | 75 | 0.0% |
| Bolivian | 68 | 0.0% |
| Brazilian | 426 | 0.0% |
| British | 1,110 | 0.1% |
| Bulgarian | 251 | 0.0% |
| Burmese | 1,011 | 0.1% |
| Cajun | 95 | 0.0% |
| Cambodian | 15 | 0.0% |
| Canadian | 722 | 0.0% |
| Carpatho Rusyn | 27 | 0.0% |
| Celtic | 20 | 0.0% |
| Central American | 9,637 | 0.6% |
| Central American Indian | 1,131 | 0.1% |
| Cherokee | 902 | 0.1% |
| Chickasaw | 217 | 0.0% |
| Chilean | 73 | 0.0% |
| Chippewa | 18 | 0.0% |
| Choctaw | 227 | 0.0% |
| Colombian | 1,453 | 0.1% |
| Comanche | 66 | 0.0% |
| Costa Rican | 37 | 0.0% |
| Creek | 37 | 0.0% |
| Croatian | 53 | 0.0% |
| Cuban | 1,747 | 0.1% |
| Czech | 1,013 | 0.1% |
| Czechoslovakian | 141 | 0.0% |
| Danish | 512 | 0.0% |
| Delaware | 90 | 0.0% |
| Dominican | 1,172 | 0.1% |
| Dutch | 1,962 | 0.1% |
| Dutch West Indian | 60 | 0.0% |
| Eastern European | 309 | 0.0% |
| Ecuadorian | 250 | 0.0% |
| Egyptian | 164 | 0.0% |
| English | 18,593 | 1.1% |
| Estonian | 12 | 0.0% |
| Ethiopian | 39 | 0.0% |
| European | 2,918 | 0.2% |
| Fijian | 54 | 0.0% |
| Filipino | 124 | 0.0% |
| Finnish | 251 | 0.0% |
| French | 5,810 | 0.4% |
| French American Indian | 3 | 0.0% |
| French Canadian | 801 | 0.1% |
| German | 25,347 | 1.5% |
| Ghanaian | 14 | 0.0% |
| Greek | 256 | 0.0% |
| Guamanian / Chamorro | 270 | 0.0% |
| Guatemalan | 2,096 | 0.1% |
| Haitian | 99 | 0.0% |
| Honduran | 3,118 | 0.2% |
| Hungarian | 358 | 0.0% |
| Icelander | 32 | 0.0% |
| Indian (Asian) | 1,862 | 0.1% |
| Indonesian | 51 | 0.0% |
| Iranian | 157 | 0.0% |
| Iraqi | 44 | 0.0% |
| Irish | 15,935 | 1.0% |
| Iroquois | 69 | 0.0% |
| Israeli | 96 | 0.0% |
| Italian | 6,942 | 0.4% |
| Jamaican | 199 | 0.0% |
| Kenyan | 3 | 0.0% |
| Kiowa | 34 | 0.0% |
| Korean | 5,103 | 0.3% |
| Laotian | 126 | 0.0% |
| Latvian | 13 | 0.0% |
| Lebanese | 298 | 0.0% |
| Lithuanian | 127 | 0.0% |
| Lumbee | 4 | 0.0% |
| Malaysian | 10 | 0.0% |
| Maltese | 25 | 0.0% |
| Mexican | 1,463,471 | 87.8% |
| Mexican American Indian | 2,992 | 0.2% |
| Native Hawaiian | 304 | 0.0% |
| Navajo | 203 | 0.0% |
| Nicaraguan | 970 | 0.1% |
| Nigerian | 350 | 0.0% |
| Northern European | 501 | 0.0% |
| Norwegian | 2,103 | 0.1% |
| Okinawan | 11 | 0.0% |
| Osage | 48 | 0.0% |
| Pakistani | 86 | 0.0% |
| Panamanian | 217 | 0.0% |
| Paraguayan | 8 | 0.0% |
| Pennsylvania German | 40 | 0.0% |
| Peruvian | 1,097 | 0.1% |
| Polish | 2,654 | 0.2% |
| Portuguese | 624 | 0.0% |
| Potawatomi | 46 | 0.0% |
| Pueblo | 40 | 0.0% |
| Puerto Rican | 6,073 | 0.4% |
| Puget Sound Salish | 8 | 0.0% |
| Romanian | 140 | 0.0% |
| Russian | 614 | 0.0% |
| Salvadoran | 3,138 | 0.2% |
| Samoan | 140 | 0.0% |
| Scandinavian | 510 | 0.0% |
| Scotch-Irish | 2,262 | 0.1% |
| Scottish | 3,440 | 0.2% |
| Seminole | 7 | 0.0% |
| Serbian | 24 | 0.0% |
| Sioux | 16 | 0.0% |
| Slavic | 87 | 0.0% |
| Slovak | 160 | 0.0% |
| Slovene | 189 | 0.0% |
| South African | 5 | 0.0% |
| South American | 4,233 | 0.3% |
| Spaniard | 3,696 | 0.2% |
| Spanish | 1,978 | 0.1% |
| Spanish American | 84 | 0.0% |
| Spanish American Indian | 33 | 0.0% |
| Sri Lankan | 1,784 | 0.1% |
| Subsaharan African | 2,033 | 0.1% |
| Sudanese | 91 | 0.0% |
| Swedish | 2,047 | 0.1% |
| Swiss | 486 | 0.0% |
| Syrian | 86 | 0.0% |
| Thai | 3,259 | 0.2% |
| Turkish | 29 | 0.0% |
| Ukrainian | 247 | 0.0% |
| Uruguayan | 19 | 0.0% |
| Venezuelan | 910 | 0.1% |
| Vietnamese | 135 | 0.0% |
| Welsh | 789 | 0.1% |
| West Indian | 34 | 0.0% |
| Yakama | 11 | 0.0% |
| Yaqui | 7 | 0.0% |
| Yugoslavian | 96 | 0.0% | View All 147 Rows |
Immigrants in Area Code 956
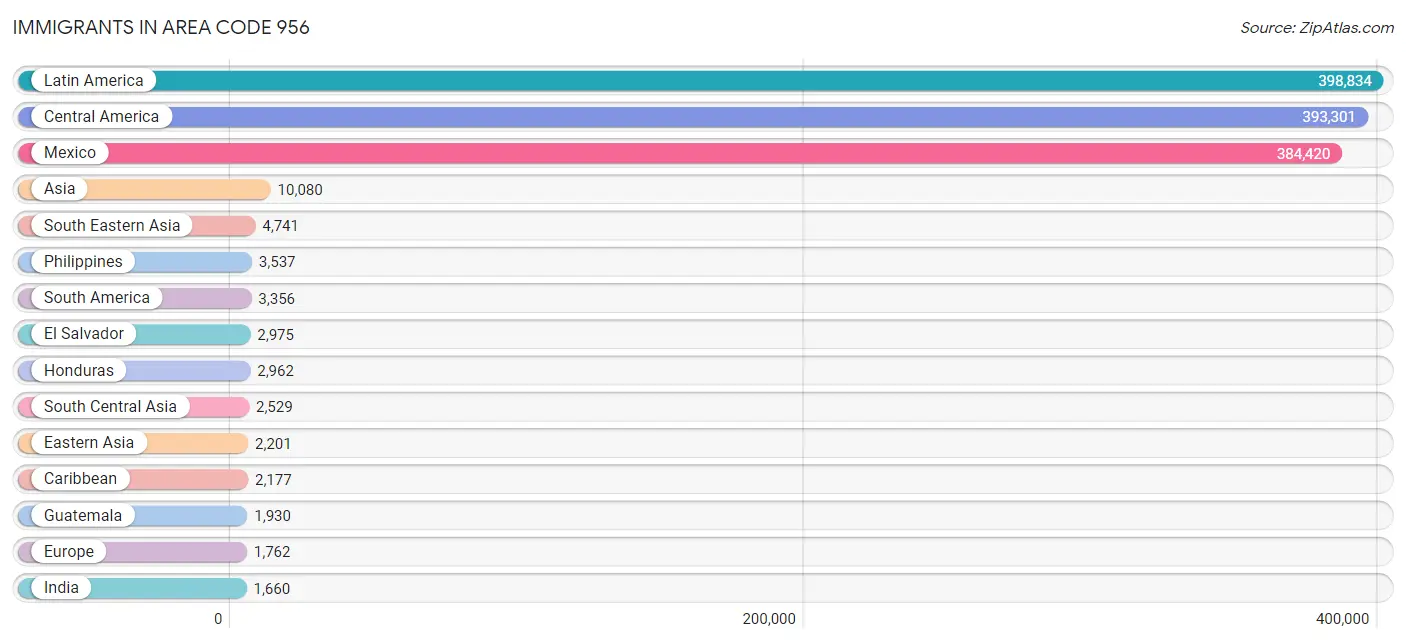
The most numerous immigrant groups reported in Area Code 956 came from Latin America (398,834 | 23.9%), Central America (393,301 | 23.6%), Mexico (384,420 | 23.1%), Asia (10,080 | 0.6%), and South Eastern Asia (4,741 | 0.3%), together accounting for 71.5% of all Area Code 956 residents.
| Immigration Origin | # Population | % Population |
| Afghanistan | 27 | 0.0% |
| Africa | 1,020 | 0.1% |
| Albania | 52 | 0.0% |
| Argentina | 270 | 0.0% |
| Armenia | 30 | 0.0% |
| Asia | 10,080 | 0.6% |
| Australia | 90 | 0.0% |
| Bangladesh | 270 | 0.0% |
| Belgium | 54 | 0.0% |
| Belize | 112 | 0.0% |
| Bolivia | 100 | 0.0% |
| Brazil | 204 | 0.0% |
| Bulgaria | 171 | 0.0% |
| Cameroon | 132 | 0.0% |
| Canada | 1,505 | 0.1% |
| Caribbean | 2,177 | 0.1% |
| Central America | 393,301 | 23.6% |
| Chile | 36 | 0.0% |
| China | 861 | 0.1% |
| Colombia | 1,194 | 0.1% |
| Costa Rica | 58 | 0.0% |
| Croatia | 2 | 0.0% |
| Cuba | 1,165 | 0.1% |
| Czechoslovakia | 14 | 0.0% |
| Denmark | 73 | 0.0% |
| Dominica | 20 | 0.0% |
| Dominican Republic | 679 | 0.0% |
| Eastern Africa | 157 | 0.0% |
| Eastern Asia | 2,201 | 0.1% |
| Eastern Europe | 587 | 0.0% |
| Ecuador | 240 | 0.0% |
| Egypt | 35 | 0.0% |
| El Salvador | 2,975 | 0.2% |
| England | 171 | 0.0% |
| Eritrea | 6 | 0.0% |
| Ethiopia | 148 | 0.0% |
| Europe | 1,762 | 0.1% |
| France | 59 | 0.0% |
| Germany | 330 | 0.0% |
| Ghana | 60 | 0.0% |
| Guatemala | 1,930 | 0.1% |
| Haiti | 68 | 0.0% |
| Honduras | 2,962 | 0.2% |
| Hong Kong | 78 | 0.0% |
| Hungary | 13 | 0.0% |
| India | 1,660 | 0.1% |
| Indonesia | 118 | 0.0% |
| Iran | 113 | 0.0% |
| Iraq | 100 | 0.0% |
| Ireland | 28 | 0.0% |
| Israel | 71 | 0.0% |
| Italy | 71 | 0.0% |
| Jamaica | 17 | 0.0% |
| Japan | 597 | 0.0% |
| Jordan | 12 | 0.0% |
| Kenya | 3 | 0.0% |
| Korea | 743 | 0.0% |
| Latin America | 398,834 | 23.9% |
| Malaysia | 28 | 0.0% |
| Mexico | 384,420 | 23.1% |
| Middle Africa | 132 | 0.0% |
| Nepal | 139 | 0.0% |
| Netherlands | 6 | 0.0% |
| Nicaragua | 777 | 0.1% |
| Nigeria | 452 | 0.0% |
| Northern Africa | 126 | 0.0% |
| Northern Europe | 465 | 0.0% |
| Oceania | 101 | 0.0% |
| Pakistan | 115 | 0.0% |
| Panama | 67 | 0.0% |
| Peru | 433 | 0.0% |
| Philippines | 3,537 | 0.2% |
| Poland | 50 | 0.0% |
| Portugal | 9 | 0.0% |
| Romania | 36 | 0.0% |
| Russia | 167 | 0.0% |
| Saudi Arabia | 120 | 0.0% |
| Scotland | 14 | 0.0% |
| Serbia | 36 | 0.0% |
| Singapore | 31 | 0.0% |
| South Africa | 5 | 0.0% |
| South America | 3,356 | 0.2% |
| South Central Asia | 2,529 | 0.2% |
| South Eastern Asia | 4,741 | 0.3% |
| Southern Europe | 242 | 0.0% |
| Spain | 151 | 0.0% |
| Sri Lanka | 93 | 0.0% |
| Sudan | 91 | 0.0% |
| Sweden | 14 | 0.0% |
| Switzerland | 19 | 0.0% |
| Syria | 34 | 0.0% |
| Taiwan | 298 | 0.0% |
| Thailand | 77 | 0.0% |
| Trinidad and Tobago | 96 | 0.0% |
| Turkey | 12 | 0.0% |
| Ukraine | 33 | 0.0% |
| Uruguay | 26 | 0.0% |
| Venezuela | 821 | 0.1% |
| Vietnam | 919 | 0.1% |
| Western Africa | 543 | 0.0% |
| Western Asia | 521 | 0.0% |
| Western Europe | 468 | 0.0% | View All 102 Rows |
Sex and Age in Area Code 956
Sex and Age in Area Code 956
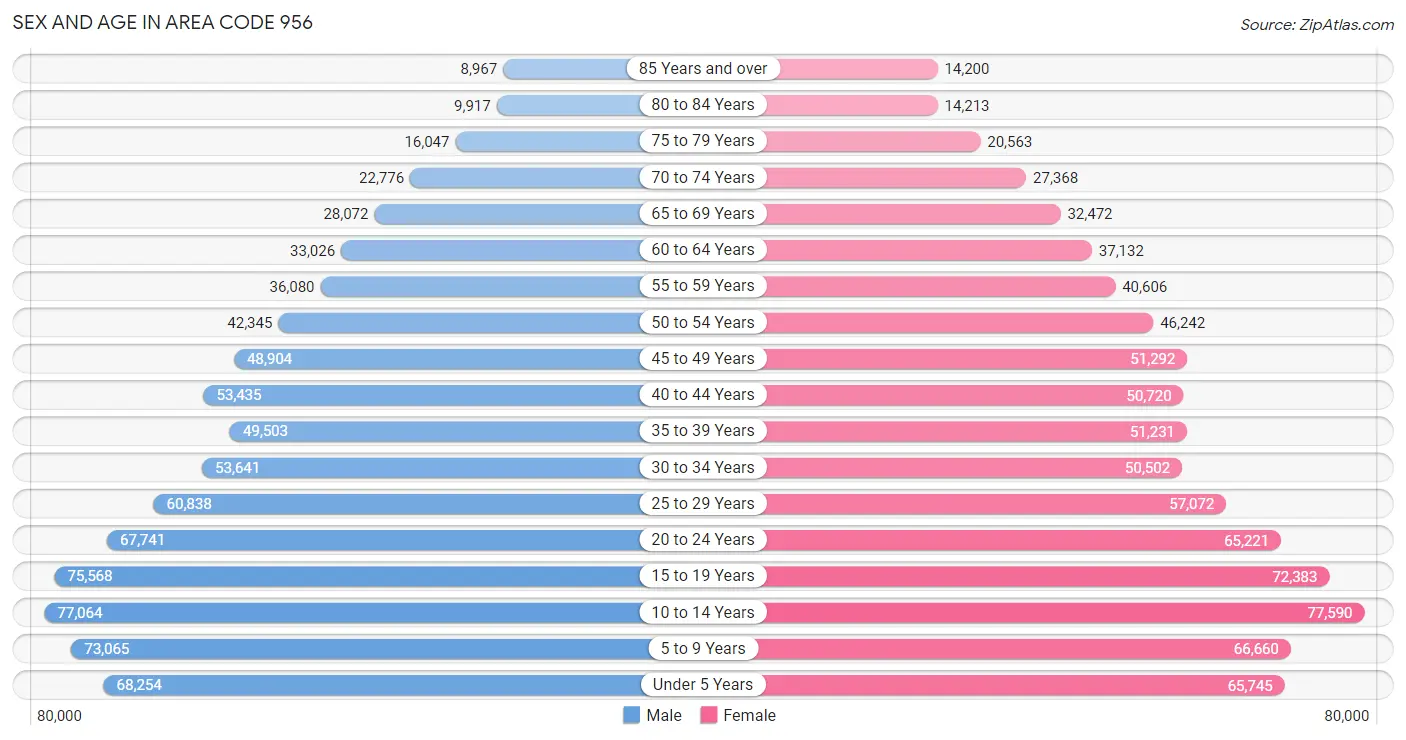
The most populous age groups in Area Code 956 are 10 to 14 Years (77,064 | 9.3%) for men and 10 to 14 Years (77,590 | 9.2%) for women.
| Age Bracket | Male | Female |
| Under 5 Years | 68,254 (8.3%) | 65,745 (7.8%) |
| 5 to 9 Years | 73,065 (8.8%) | 66,660 (7.9%) |
| 10 to 14 Years | 77,064 (9.3%) | 77,590 (9.2%) |
| 15 to 19 Years | 75,568 (9.2%) | 72,383 (8.6%) |
| 20 to 24 Years | 67,741 (8.2%) | 65,221 (7.7%) |
| 25 to 29 Years | 60,838 (7.4%) | 57,072 (6.8%) |
| 30 to 34 Years | 53,641 (6.5%) | 50,502 (6.0%) |
| 35 to 39 Years | 49,503 (6.0%) | 51,231 (6.1%) |
| 40 to 44 Years | 53,435 (6.5%) | 50,720 (6.0%) |
| 45 to 49 Years | 48,904 (5.9%) | 51,292 (6.1%) |
| 50 to 54 Years | 42,345 (5.1%) | 46,242 (5.5%) |
| 55 to 59 Years | 36,080 (4.4%) | 40,606 (4.8%) |
| 60 to 64 Years | 33,026 (4.0%) | 37,132 (4.4%) |
| 65 to 69 Years | 28,072 (3.4%) | 32,472 (3.9%) |
| 70 to 74 Years | 22,776 (2.8%) | 27,368 (3.3%) |
| 75 to 79 Years | 16,047 (1.9%) | 20,563 (2.4%) |
| 80 to 84 Years | 9,917 (1.2%) | 14,213 (1.7%) |
| 85 Years and over | 8,967 (1.1%) | 14,200 (1.7%) |
| Total | 825,243 (100.0%) | 841,212 (100.0%) |
Families and Households in Area Code 956
Median Family Size in Area Code 956
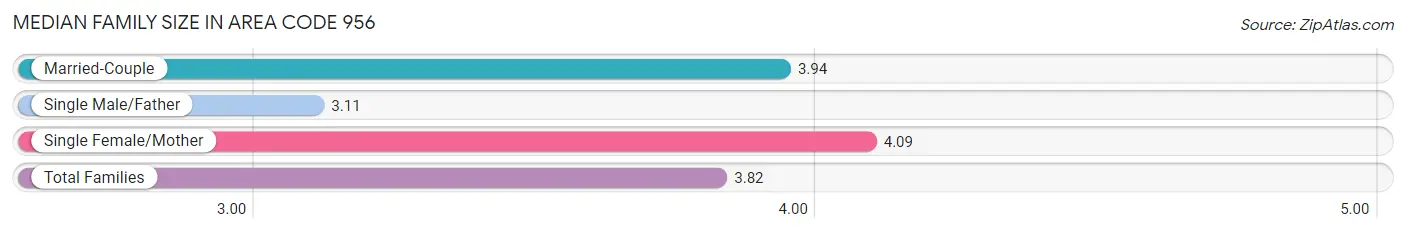
The median family size in Area Code 956 is 3.82 persons per family, with single female/mother families (105,323 | 27.1%) accounting for the largest median family size of 4.0903 persons per family. On the other hand, single male/father families (32,155 | 8.3%) represent the smallest median family size with 3.10 persons per family.
| Family Type | # Families | Family Size |
| Married-Couple | 251,412 (64.6%) | 3.94 |
| Single Male/Father | 32,155 (8.3%) | 3.10 |
| Single Female/Mother | 105,323 (27.1%) | 4.09 |
| Total Families | 388,890 (100.0%) | 3.82 |
Median Household Size in Area Code 956
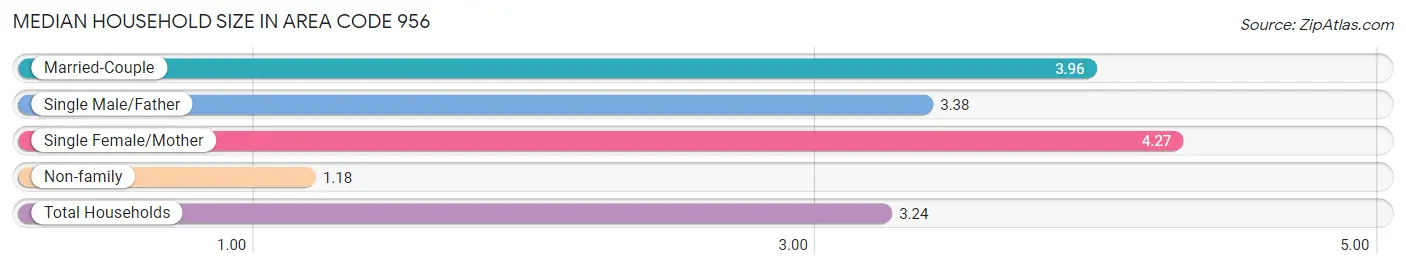
The median household size in Area Code 956 is 3.24 persons per household, with single female/mother households (105,323 | 21.2%) accounting for the largest median household size of 4.27338 persons per household. non-family households (108,485 | 21.8%) represent the smallest median household size with 1.18 persons per household.
| Household Type | # Households | Household Size |
| Married-Couple | 251,412 (50.5%) | 3.96 |
| Single Male/Father | 32,155 (6.5%) | 3.38 |
| Single Female/Mother | 105,323 (21.2%) | 4.27 |
| Non-family | 108,485 (21.8%) | 1.18 |
| Total Households | 497,375 (100.0%) | 3.24 |
Household Size by Marriage Status in Area Code 956
Out of a total of 497,375 households in Area Code 956, 388,890 (78.2%) are family households, while 108,485 (21.8%) are nonfamily households. The most numerous type of family households are 2-person households, comprising 111,991, and the most common type of nonfamily households are 1-person households, comprising 93,886.
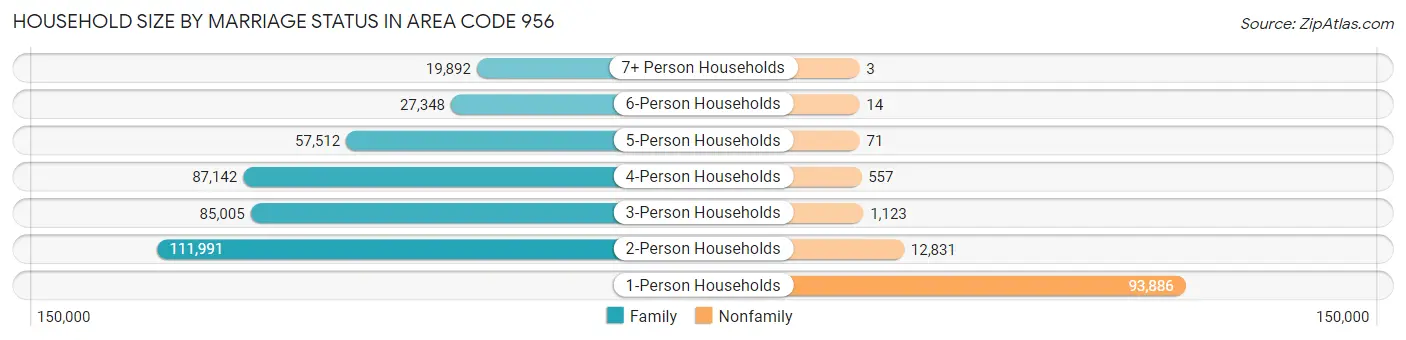
| Household Size | Family Households | Nonfamily Households |
| 1-Person Households | - | 93,886 (18.9%) |
| 2-Person Households | 111,991 (22.5%) | 12,831 (2.6%) |
| 3-Person Households | 85,005 (17.1%) | 1,123 (0.2%) |
| 4-Person Households | 87,142 (17.5%) | 557 (0.1%) |
| 5-Person Households | 57,512 (11.6%) | 71 (0.0%) |
| 6-Person Households | 27,348 (5.5%) | 14 (0.0%) |
| 7+ Person Households | 19,892 (4.0%) | 3 (0.0%) |
| Total | 388,890 (78.2%) | 108,485 (21.8%) |
Female Fertility in Area Code 956
Fertility by Age in Area Code 956
Average fertility rate in Area Code 956 is 76.4 births per 1,000 women. Women in the age bracket of 20 to 34 years have the highest fertility rate with 137.4 births per 1,000 women. Women in the age bracket of 20 to 34 years acount for 78.4% of all women with births.
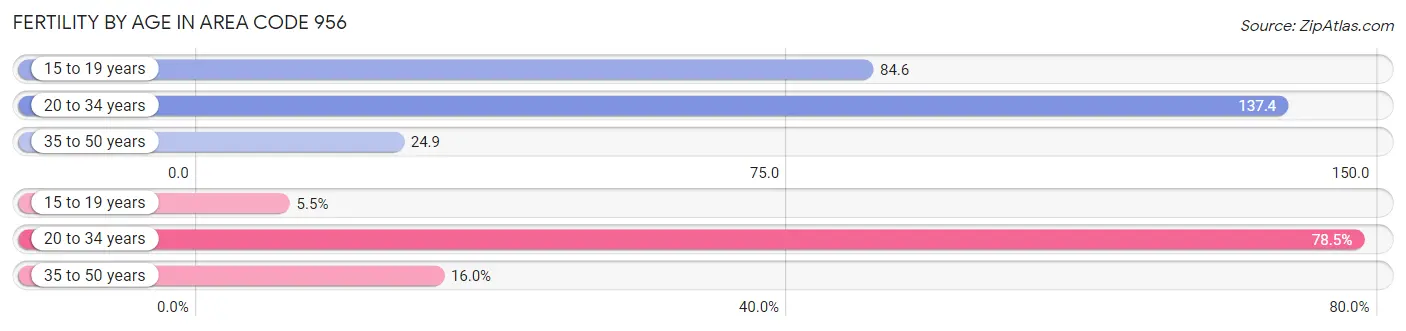
| Age Bracket | Women with Births | Births / 1,000 Women |
| 15 to 19 years | 1,357 (5.5%) | 84.6 |
| 20 to 34 years | 19,203 (78.4%) | 137.4 |
| 35 to 50 years | 3,919 (16.0%) | 24.9 |
| Total | 24,479 (100.0%) | 76.4 |
Fertility by Age by Marriage Status in Area Code 956
52.4% of women with births (24,479) in Area Code 956 are married. The highest percentage of unmarried women with births falls into 15 to 19 years age bracket with 89.5% of them unmarried at the time of birth, while the lowest percentage of unmarried women with births belong to 35 to 50 years age bracket with 43.5% of them unmarried.
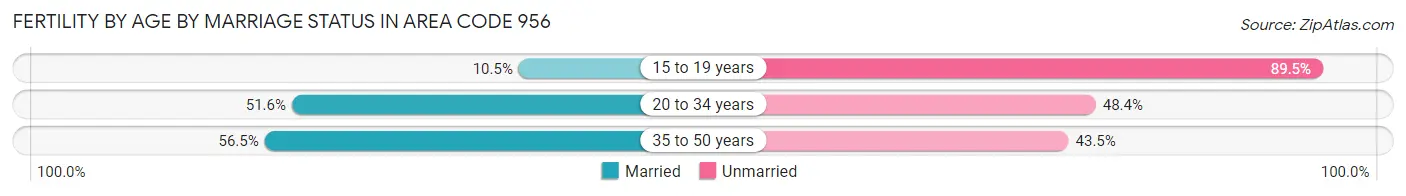
| Age Bracket | Married | Unmarried |
| 15 to 19 years | 142 (10.5%) | 1,215 (89.5%) |
| 20 to 34 years | 9,907 (51.6%) | 9,296 (48.4%) |
| 35 to 50 years | 2,215 (56.5%) | 1,704 (43.5%) |
| Total | 12,820 (52.4%) | 11,659 (47.6%) |
Fertility by Education in Area Code 956
Average fertility rate in Area Code 956 is 76.4 births per 1,000 women. Women with the education attainment of college or associate's degree have the highest fertility rate of 136.2 births per 1,000 women, while women with the education attainment of less than high school have the lowest fertility at 52.3 births per 1,000 women. Women with the education attainment of college or associate's degree represent 33.8% of all women with births.
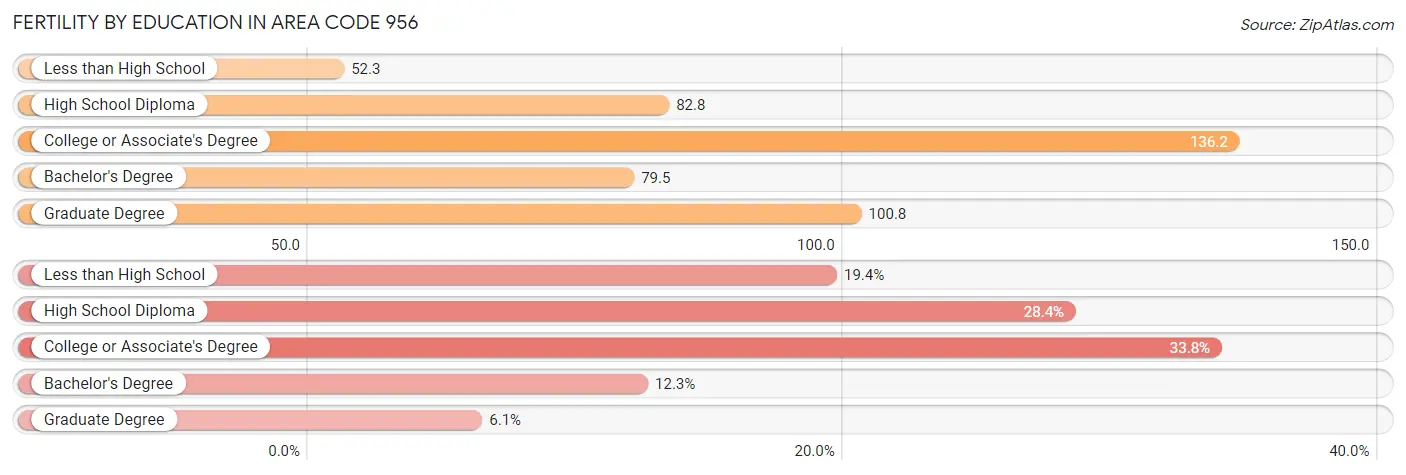
| Educational Attainment | Women with Births | Births / 1,000 Women |
| Less than High School | 4,748 (19.4%) | 52.3 |
| High School Diploma | 6,939 (28.3%) | 82.8 |
| College or Associate's Degree | 8,280 (33.8%) | 136.2 |
| Bachelor's Degree | 3,017 (12.3%) | 79.5 |
| Graduate Degree | 1,495 (6.1%) | 100.8 |
| Total | 24,479 (100.0%) | 76.4 |
Fertility by Education by Marriage Status in Area Code 956
47.6% of women with births in Area Code 956 are unmarried. Women with the educational attainment of bachelor's degree are most likely to be married with 59.4% of them married at childbirth, while women with the educational attainment of less than high school are least likely to be married with 58.9% of them unmarried at childbirth.
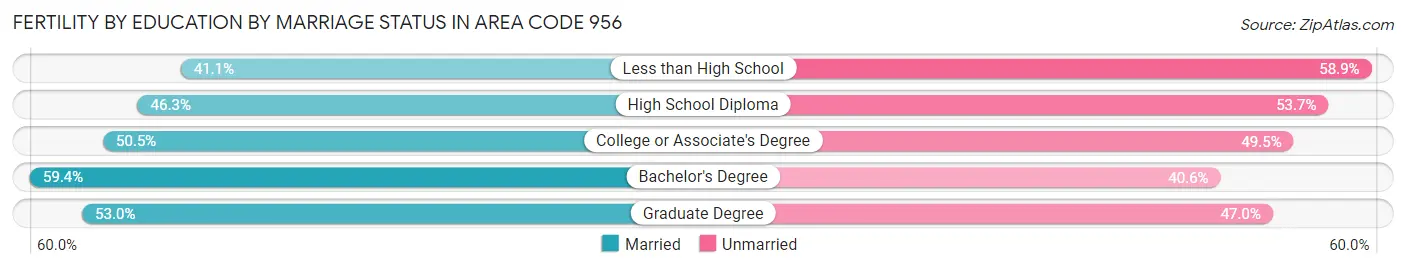
| Educational Attainment | Married | Unmarried |
| Less than High School | 1,952 (41.1%) | 2,796 (58.9%) |
| High School Diploma | 3,215 (46.3%) | 3,724 (53.7%) |
| College or Associate's Degree | 4,184 (50.5%) | 4,096 (49.5%) |
| Bachelor's Degree | 1,791 (59.4%) | 1,226 (40.6%) |
| Graduate Degree | 793 (53.0%) | 702 (47.0%) |
| Total | 12,820 (52.4%) | 11,659 (47.6%) |
Employment Characteristics in Area Code 956
Employment by Class of Employer in Area Code 956
Among the 647,221 employed individuals in Area Code 956, private company employees (424,885 | 65.6%), self-employed (not incorporated) (63,493 | 9.8%), and local government employees (61,045 | 9.4%) make up the most common classes of employment.
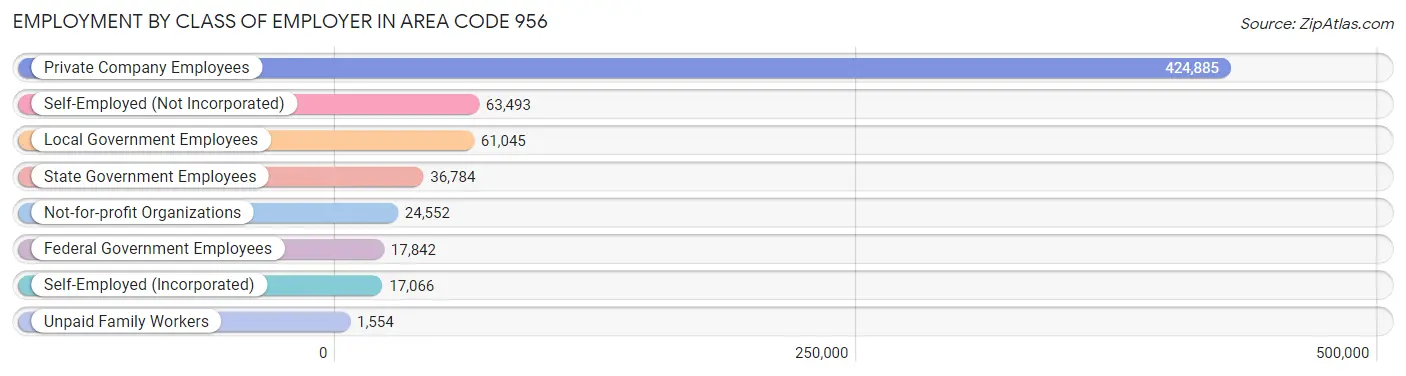
| Employer Class | # Employees | % Employees |
| Private Company Employees | 424,885 | 65.6% |
| Self-Employed (Incorporated) | 17,066 | 2.6% |
| Self-Employed (Not Incorporated) | 63,493 | 9.8% |
| Not-for-profit Organizations | 24,552 | 3.8% |
| Local Government Employees | 61,045 | 9.4% |
| State Government Employees | 36,784 | 5.7% |
| Federal Government Employees | 17,842 | 2.8% |
| Unpaid Family Workers | 1,554 | 0.2% |
| Total | 647,221 | 100.0% |
Employment Status by Age in Area Code 956
According to the labor force statistics for Area Code 956, out of the total population over 16 years of age (1,208,731), 53.4% or 644,979 individuals are in the labor force, with 8.0% or 51,340 of them unemployed. The age group with the highest labor force participation rate is 35 to 44 years, with 78.8% or 161,473 individuals in the labor force. Within the labor force, the 16 to 19 years age range has the highest percentage of unemployed individuals, with 1,059.3% or 351,666 of them being unemployed.
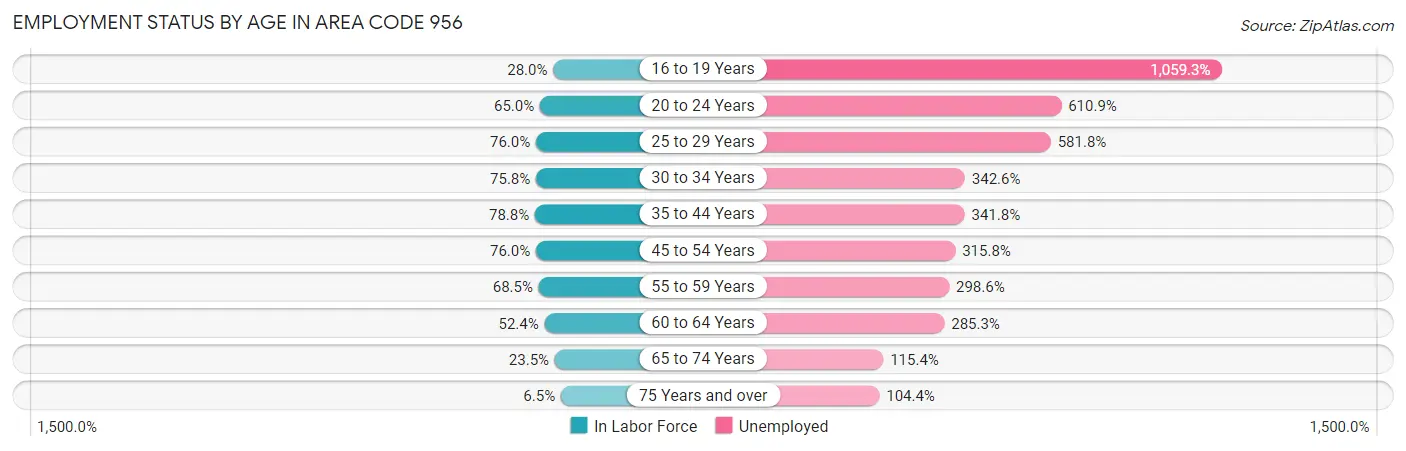
| Age Bracket | In Labor Force | Unemployed |
| 16 to 19 Years | 33,201 (28.0%) | 351,666 (1,059.3%) |
| 20 to 24 Years | 86,374 (65.0%) | 527,647 (610.9%) |
| 25 to 29 Years | 89,624 (76.0%) | 521,427 (581.8%) |
| 30 to 34 Years | 78,953 (75.8%) | 270,486 (342.6%) |
| 35 to 44 Years | 161,481 (78.8%) | 551,915 (341.8%) |
| 45 to 54 Years | 143,424 (76.0%) | 452,914 (315.8%) |
| 55 to 59 Years | 52,494 (68.4%) | 156,741 (298.6%) |
| 60 to 64 Years | 36,766 (52.4%) | 104,885 (285.3%) |
| 65 to 74 Years | 25,970 (23.5%) | 29,966 (115.4%) |
| 75 Years and over | 5,483 (6.5%) | 5,720 (104.4%) |
| Total | 644,965 (53.4%) | 51,319 (8.0%) |
Employment Status by Educational Attainment in Area Code 956
According to labor force statistics for Area Code 956, 70.2% of individuals (535,552) out of the total population between 25 and 64 years of age (762,569) are in the labor force, with 409.7% or 2,194,157 of them being unemployed. The group with the highest labor force participation rate are those with the educational attainment of bachelor's degree or higher, with 88.2% or 139,653 individuals in the labor force. Within the labor force, individuals with high school diploma education have the highest percentage of unemployment, with 532.9% or 761,312 of them being unemployed.
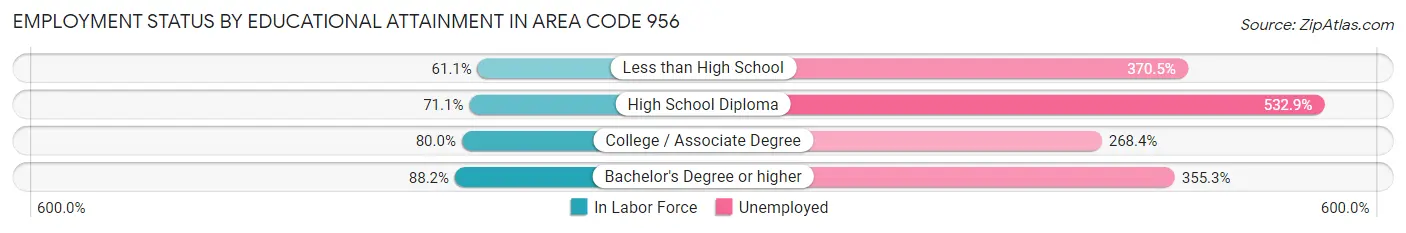
| Educational Attainment | In Labor Force | Unemployed |
| Less than High School | 124,693 (61.1%) | 756,042 (370.5%) |
| High School Diploma | 142,857 (71.1%) | 1,070,911 (532.9%) |
| College / Associate Degree | 159,289 (80.0%) | 534,543 (268.4%) |
| Bachelor's Degree or higher | 139,646 (88.2%) | 562,763 (355.3%) |
| Total | 535,562 (70.2%) | 3,124,245 (409.7%) |
Employment Occupations by Sex in Area Code 956
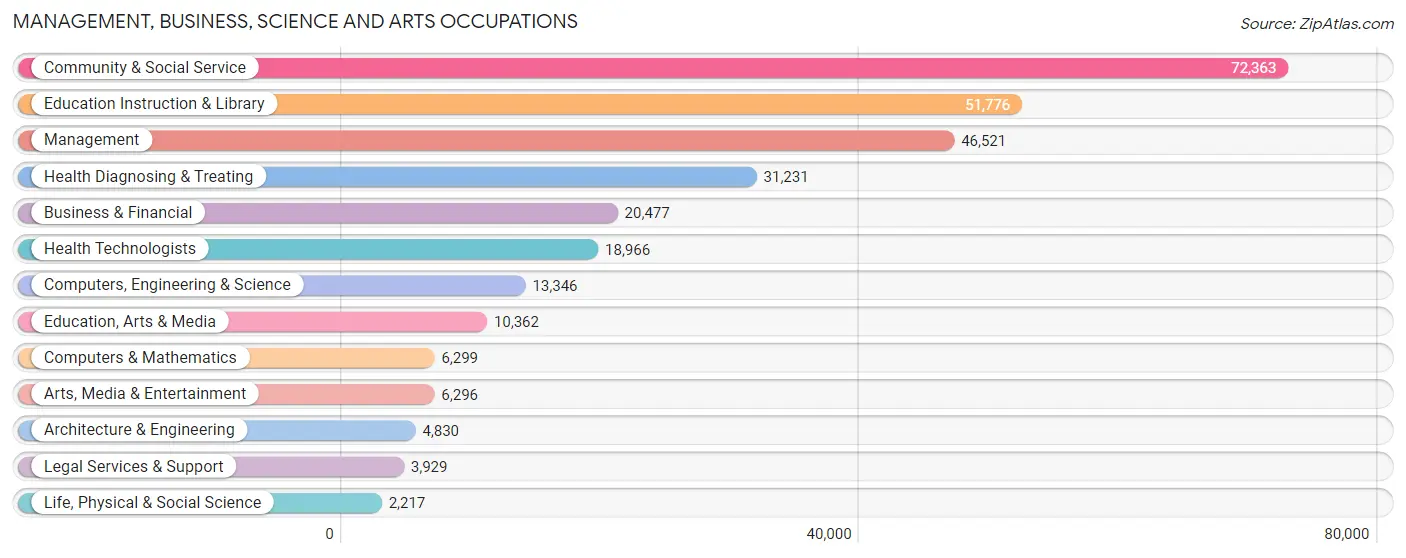
Management, Business, Science and Arts Occupations
The most common Management, Business, Science and Arts occupations in Area Code 956 are Community & Social Service (72,363 | 11.0%), Education Instruction & Library (51,776 | 7.9%), Management (46,521 | 7.1%), Health Diagnosing & Treating (31,231 | 4.7%), and Business & Financial (20,477 | 3.1%).
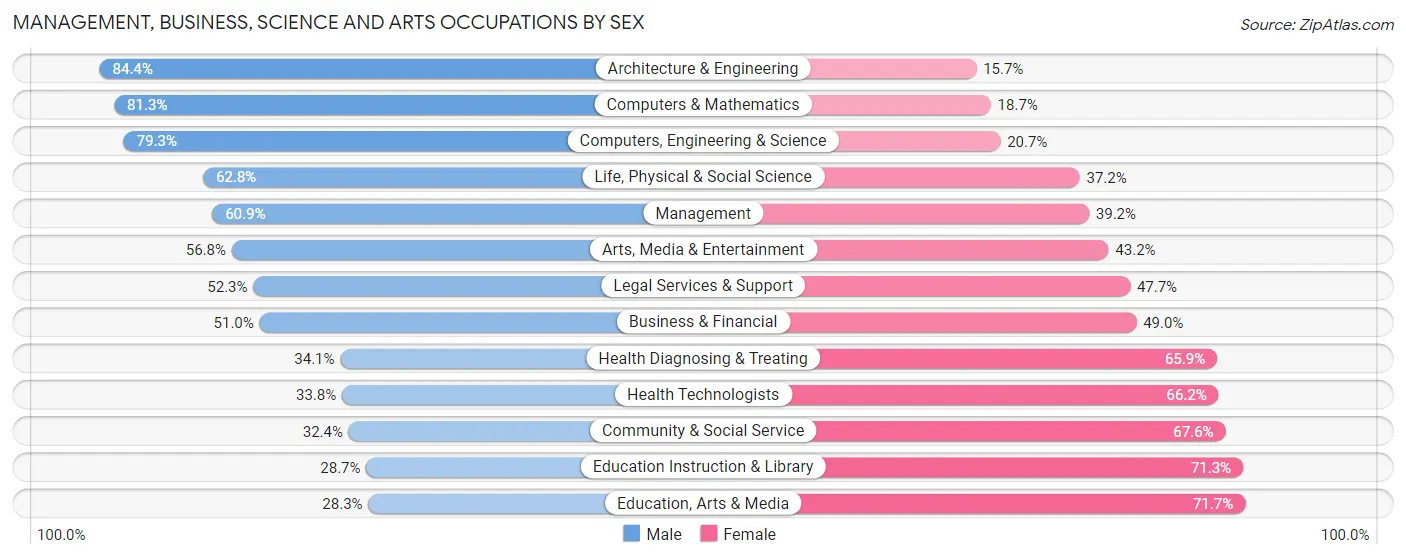
Management, Business, Science and Arts Occupations by Sex
Within the Management, Business, Science and Arts occupations in Area Code 956, the most male-oriented occupations are Architecture & Engineering (84.4%), Computers & Mathematics (81.3%), and Computers, Engineering & Science (79.3%), while the most female-oriented occupations are Education, Arts & Media (71.7%), Education Instruction & Library (71.3%), and Community & Social Service (67.6%).
| Occupation | Male | Female |
| Management | 28,310 (60.9%) | 18,211 (39.2%) |
| Business & Financial | 10,438 (51.0%) | 10,039 (49.0%) |
| Computers, Engineering & Science | 10,589 (79.3%) | 2,757 (20.7%) |
| Computers & Mathematics | 5,123 (81.3%) | 1,176 (18.7%) |
| Architecture & Engineering | 4,074 (84.4%) | 756 (15.7%) |
| Life, Physical & Social Science | 1,392 (62.8%) | 825 (37.2%) |
| Community & Social Service | 23,422 (32.4%) | 48,941 (67.6%) |
| Education, Arts & Media | 2,930 (28.3%) | 7,432 (71.7%) |
| Legal Services & Support | 2,054 (52.3%) | 1,875 (47.7%) |
| Education Instruction & Library | 14,864 (28.7%) | 36,912 (71.3%) |
| Arts, Media & Entertainment | 3,574 (56.8%) | 2,722 (43.2%) |
| Health Diagnosing & Treating | 10,659 (34.1%) | 20,572 (65.9%) |
| Health Technologists | 6,406 (33.8%) | 12,560 (66.2%) |
| Total (Category) | 83,418 (45.4%) | 100,520 (54.6%) |
| Total (Overall) | 366,411 (55.6%) | 292,821 (44.4%) |
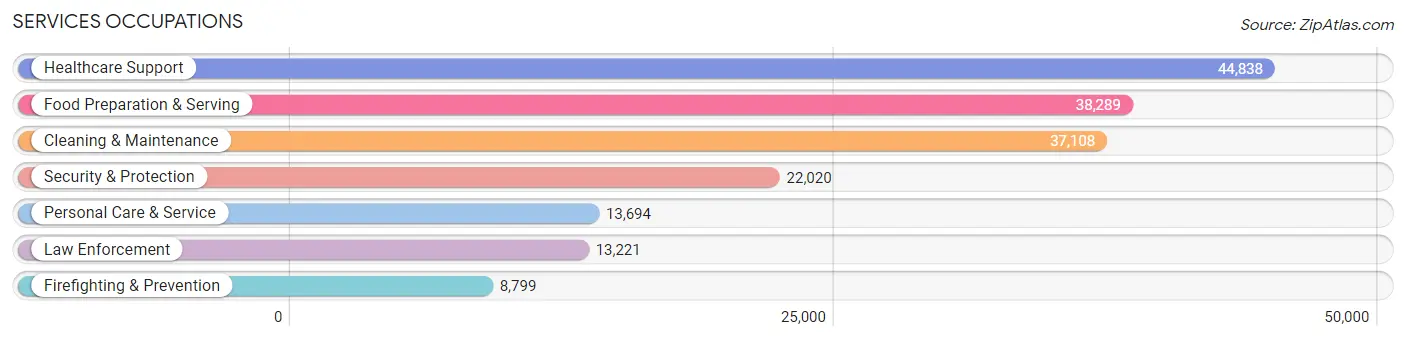
Services Occupations
The most common Services occupations in Area Code 956 are Healthcare Support (44,838 | 6.8%), Food Preparation & Serving (38,289 | 5.8%), Cleaning & Maintenance (37,108 | 5.6%), Security & Protection (22,020 | 3.3%), and Personal Care & Service (13,694 | 2.1%).
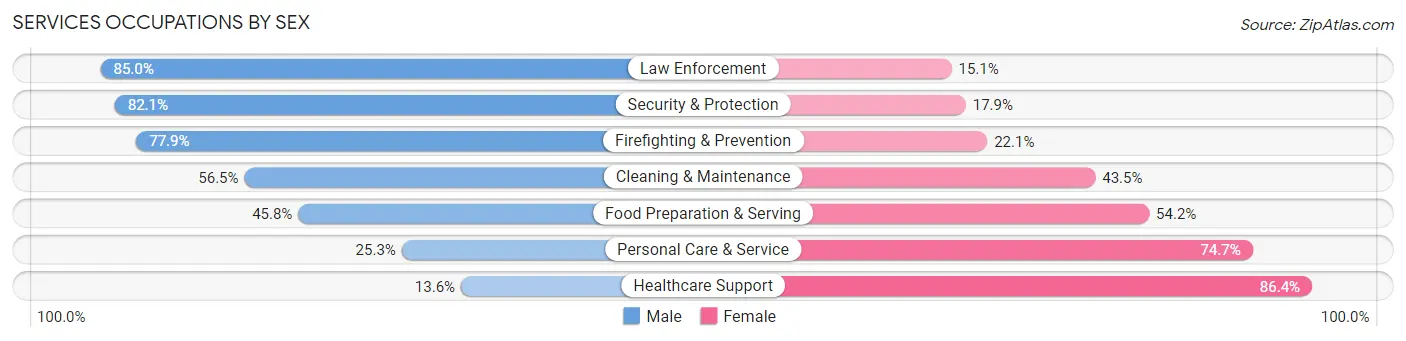
Services Occupations by Sex
Within the Services occupations in Area Code 956, the most male-oriented occupations are Law Enforcement (85.0%), Security & Protection (82.1%), and Firefighting & Prevention (77.9%), while the most female-oriented occupations are Healthcare Support (86.4%), Personal Care & Service (74.7%), and Food Preparation & Serving (54.2%).
| Occupation | Male | Female |
| Healthcare Support | 6,099 (13.6%) | 38,739 (86.4%) |
| Security & Protection | 18,084 (82.1%) | 3,936 (17.9%) |
| Firefighting & Prevention | 6,853 (77.9%) | 1,946 (22.1%) |
| Law Enforcement | 11,231 (85.0%) | 1,990 (15.0%) |
| Food Preparation & Serving | 17,544 (45.8%) | 20,745 (54.2%) |
| Cleaning & Maintenance | 20,959 (56.5%) | 16,149 (43.5%) |
| Personal Care & Service | 3,470 (25.3%) | 10,224 (74.7%) |
| Total (Category) | 66,156 (42.4%) | 89,793 (57.6%) |
| Total (Overall) | 366,411 (55.6%) | 292,821 (44.4%) |
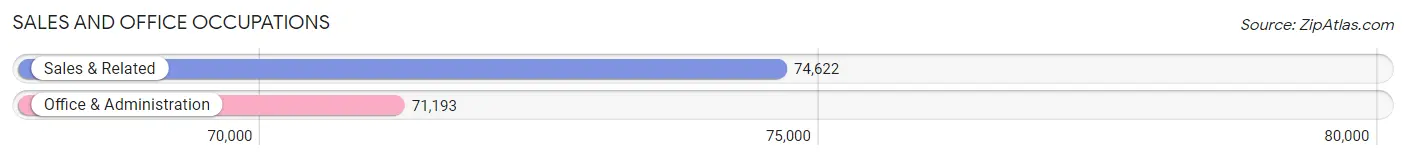
Sales and Office Occupations
The most common Sales and Office occupations in Area Code 956 are Sales & Related (74,622 | 11.3%), and Office & Administration (71,193 | 10.8%).
Sales and Office Occupations by Sex
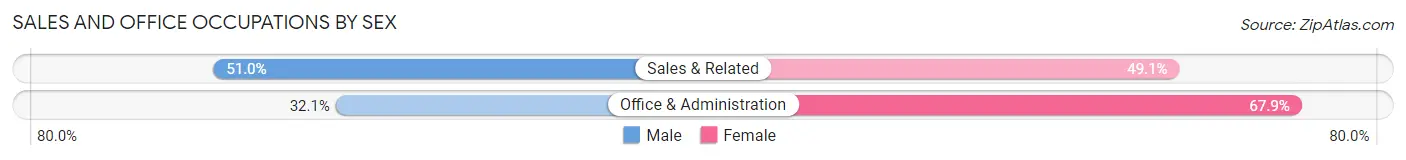
| Occupation | Male | Female |
| Sales & Related | 38,023 (50.9%) | 36,599 (49.0%) |
| Office & Administration | 22,882 (32.1%) | 48,311 (67.9%) |
| Total (Category) | 60,905 (41.8%) | 84,910 (58.2%) |
| Total (Overall) | 366,411 (55.6%) | 292,821 (44.4%) |
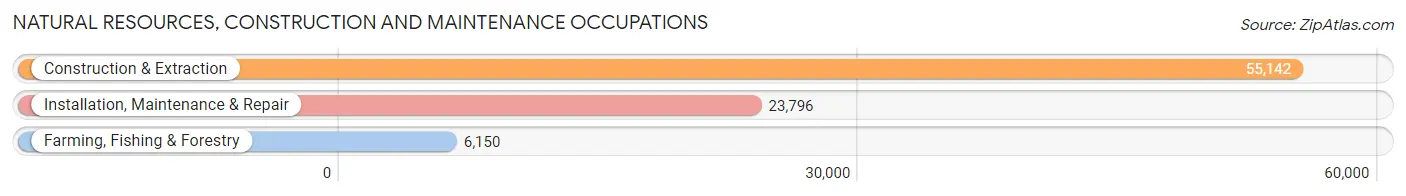
Natural Resources, Construction and Maintenance Occupations
The most common Natural Resources, Construction and Maintenance occupations in Area Code 956 are Construction & Extraction (55,142 | 8.4%), Installation, Maintenance & Repair (23,796 | 3.6%), and Farming, Fishing & Forestry (6,150 | 0.9%).
Natural Resources, Construction and Maintenance Occupations by Sex
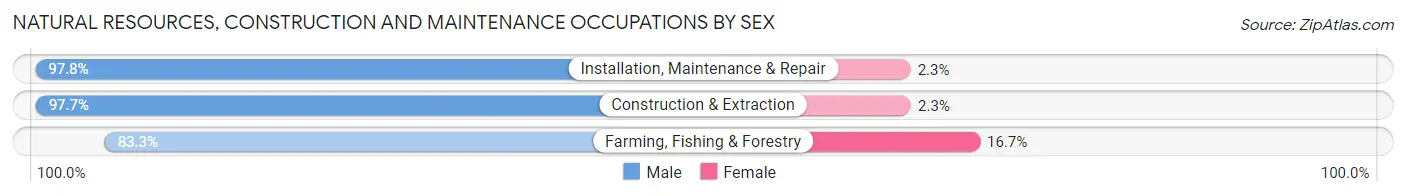
| Occupation | Male | Female |
| Farming, Fishing & Forestry | 5,124 (83.3%) | 1,026 (16.7%) |
| Construction & Extraction | 53,861 (97.7%) | 1,281 (2.3%) |
| Installation, Maintenance & Repair | 23,260 (97.8%) | 536 (2.2%) |
| Total (Category) | 82,245 (96.7%) | 2,843 (3.3%) |
| Total (Overall) | 366,411 (55.6%) | 292,821 (44.4%) |
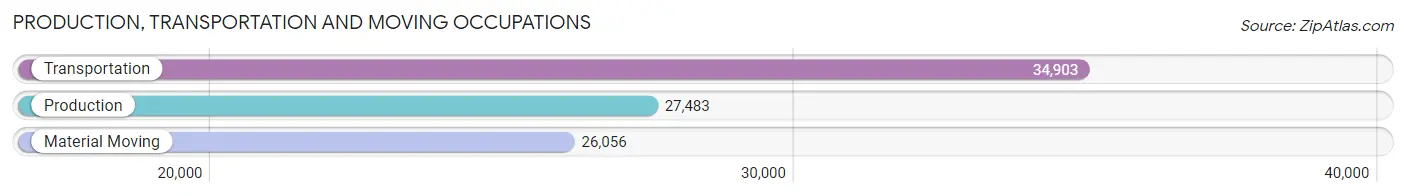
Production, Transportation and Moving Occupations
The most common Production, Transportation and Moving occupations in Area Code 956 are Transportation (34,903 | 5.3%), Production (27,483 | 4.2%), and Material Moving (26,056 | 4.0%).
Production, Transportation and Moving Occupations by Sex
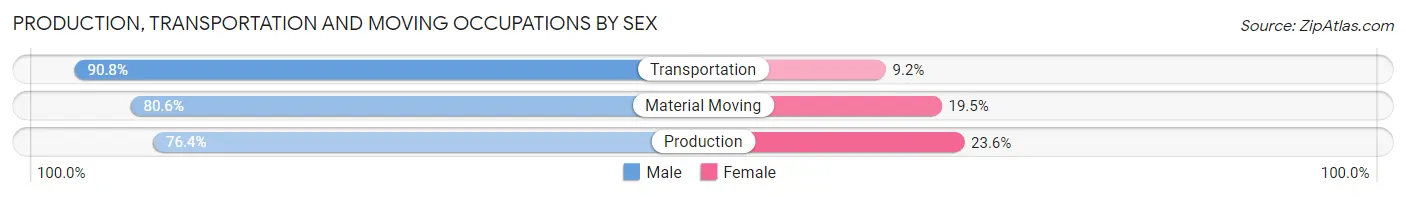
| Occupation | Male | Female |
| Production | 21,000 (76.4%) | 6,483 (23.6%) |
| Transportation | 31,700 (90.8%) | 3,203 (9.2%) |
| Material Moving | 20,987 (80.5%) | 5,069 (19.5%) |
| Total (Category) | 73,687 (83.3%) | 14,755 (16.7%) |
| Total (Overall) | 366,411 (55.6%) | 292,821 (44.4%) |
Employment Industries by Sex in Area Code 956
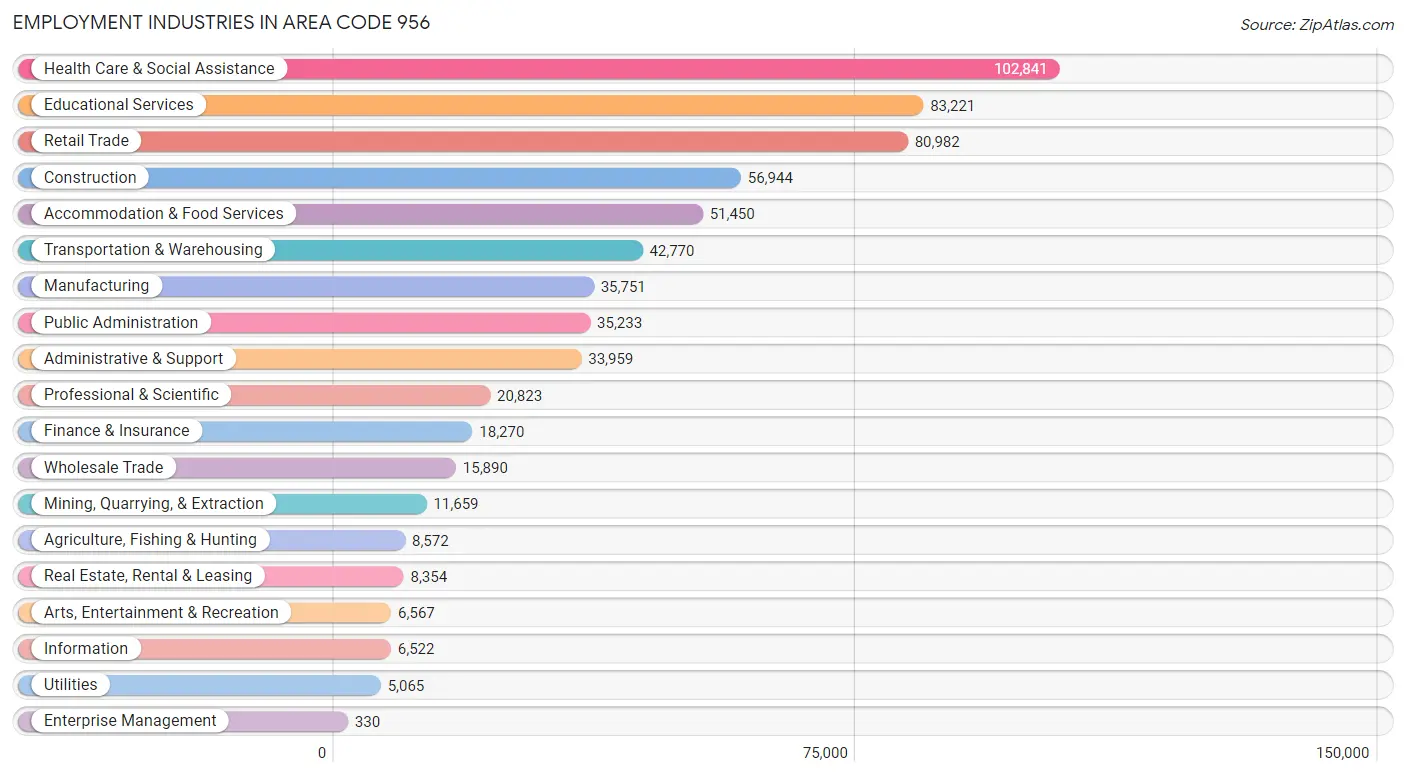
Employment Industries in Area Code 956
The major employment industries in Area Code 956 include Health Care & Social Assistance (102,841 | 15.6%), Educational Services (83,221 | 12.6%), Retail Trade (80,982 | 12.3%), Construction (56,944 | 8.6%), and Accommodation & Food Services (51,450 | 7.8%).
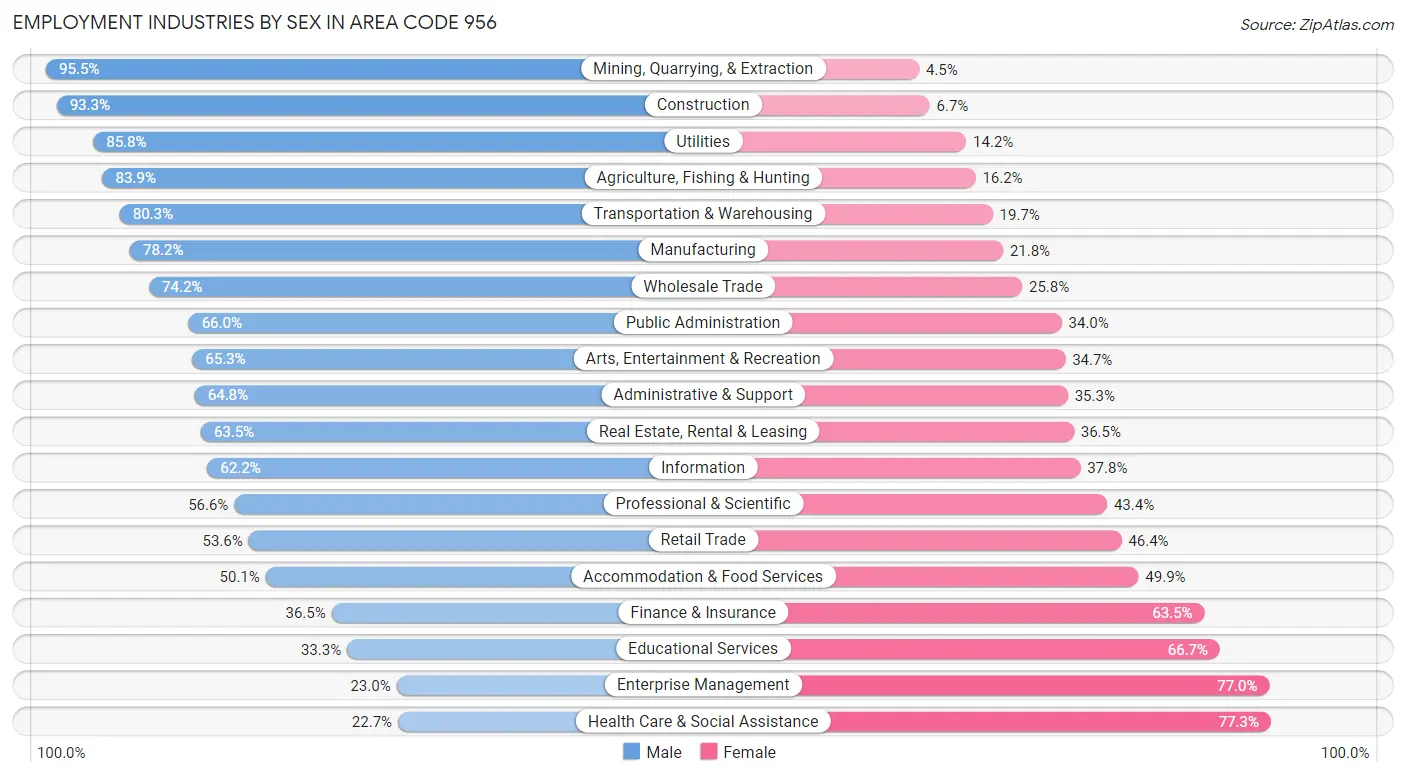
Employment Industries by Sex in Area Code 956
The Area Code 956 industries that see more men than women are Mining, Quarrying, & Extraction (95.5%), Construction (93.3%), and Utilities (85.8%), whereas the industries that tend to have a higher number of women are Health Care & Social Assistance (77.3%), Enterprise Management (77.0%), and Educational Services (66.7%).
| Industry | Male | Female |
| Agriculture, Fishing & Hunting | 7,188 (83.9%) | 1,384 (16.2%) |
| Mining, Quarrying, & Extraction | 11,138 (95.5%) | 521 (4.5%) |
| Construction | 53,154 (93.3%) | 3,790 (6.7%) |
| Manufacturing | 27,943 (78.2%) | 7,808 (21.8%) |
| Wholesale Trade | 11,792 (74.2%) | 4,098 (25.8%) |
| Retail Trade | 43,432 (53.6%) | 37,550 (46.4%) |
| Transportation & Warehousing | 34,341 (80.3%) | 8,429 (19.7%) |
| Utilities | 4,344 (85.8%) | 721 (14.2%) |
| Information | 4,054 (62.2%) | 2,468 (37.8%) |
| Finance & Insurance | 6,662 (36.5%) | 11,608 (63.5%) |
| Real Estate, Rental & Leasing | 5,304 (63.5%) | 3,050 (36.5%) |
| Professional & Scientific | 11,791 (56.6%) | 9,032 (43.4%) |
| Enterprise Management | 76 (23.0%) | 254 (77.0%) |
| Administrative & Support | 21,990 (64.7%) | 11,969 (35.2%) |
| Educational Services | 27,688 (33.3%) | 55,533 (66.7%) |
| Health Care & Social Assistance | 23,374 (22.7%) | 79,467 (77.3%) |
| Arts, Entertainment & Recreation | 4,286 (65.3%) | 2,281 (34.7%) |
| Accommodation & Food Services | 25,785 (50.1%) | 25,665 (49.9%) |
| Public Administration | 23,260 (66.0%) | 11,973 (34.0%) |
| Total | 366,411 (55.6%) | 292,821 (44.4%) |
Education in Area Code 956
School Enrollment in Area Code 956
The most common levels of schooling among the 516,214 students in Area Code 956 are high school (120,693 | 23.4%), middle school (120,267 | 23.3%), and elementary school (115,142 | 22.3%).
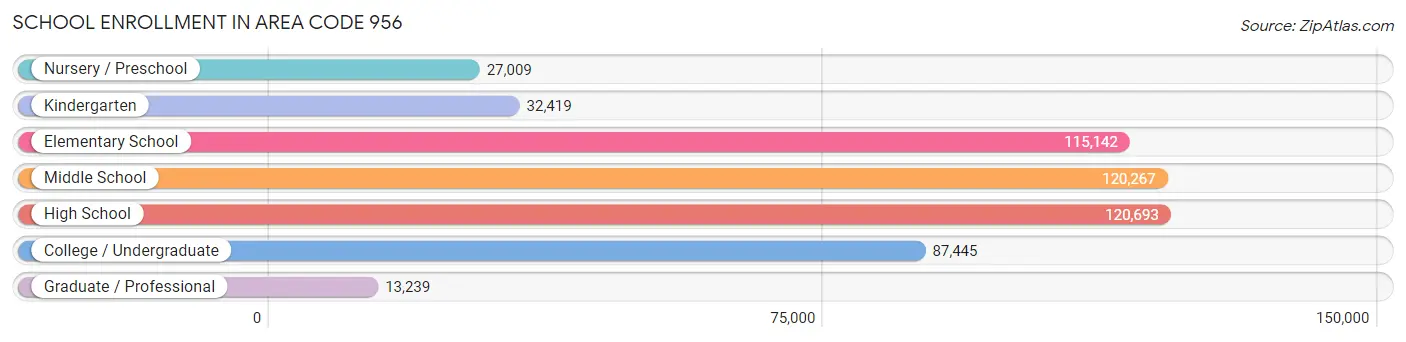
| School Level | # Students | % Students |
| Nursery / Preschool | 27,009 | 5.2% |
| Kindergarten | 32,419 | 6.3% |
| Elementary School | 115,142 | 22.3% |
| Middle School | 120,267 | 23.3% |
| High School | 120,693 | 23.4% |
| College / Undergraduate | 87,445 | 16.9% |
| Graduate / Professional | 13,239 | 2.6% |
| Total | 516,214 | 100.0% |
School Enrollment by Age by Funding Source in Area Code 956
Out of a total of 516,214 students who are enrolled in schools in Area Code 956, 27,604 (5.3%) attend a private institution, while the remaining 488,610 (94.7%) are enrolled in public schools. The age group of 35 years and over has the highest likelihood of being enrolled in private schools, with 2,948 (20.6% in the age bracket) enrolled. Conversely, the age group of 15 to 17 year olds has the lowest likelihood of being enrolled in a private school, with 83,570 (98.2% in the age bracket) attending a public institution.
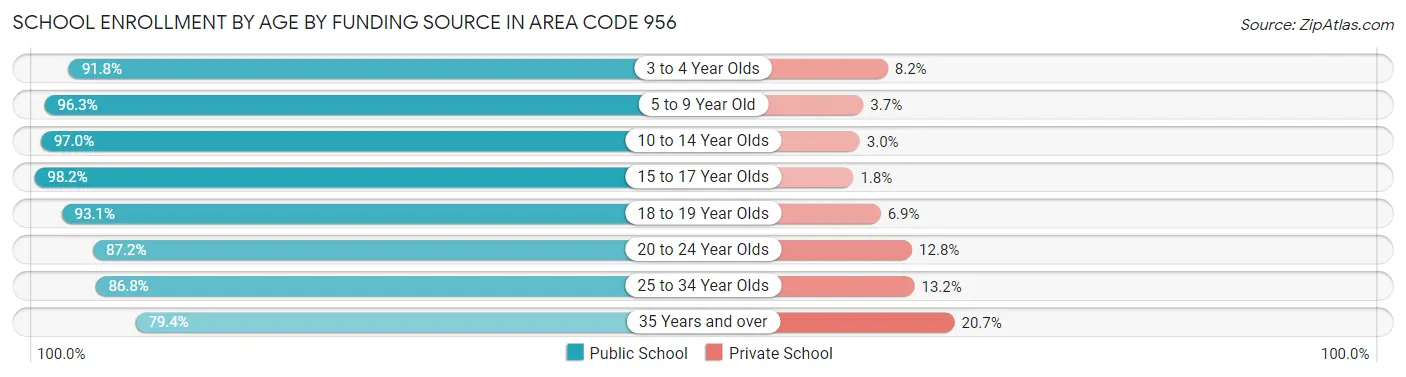
| Age Bracket | Public School | Private School |
| 3 to 4 Year Olds | 22,619 (91.8%) | 2,029 (8.2%) |
| 5 to 9 Year Old | 128,737 (96.3%) | 4,924 (3.7%) |
| 10 to 14 Year Olds | 145,173 (97.0%) | 4,513 (3.0%) |
| 15 to 17 Year Olds | 83,570 (98.2%) | 1,552 (1.8%) |
| 18 to 19 Year Olds | 37,812 (93.1%) | 2,803 (6.9%) |
| 20 to 24 Year Olds | 41,928 (87.2%) | 6,134 (12.8%) |
| 25 to 34 Year Olds | 17,483 (86.8%) | 2,658 (13.2%) |
| 35 Years and over | 11,331 (79.3%) | 2,948 (20.6%) |
| Total | 488,610 (94.7%) | 27,604 (5.3%) |
Educational Attainment by Field of Study in Area Code 956
Business (40,431 | 20.6%), education (37,582 | 19.2%), science & technology (20,656 | 10.5%), arts & humanities (16,877 | 8.6%), and engineering (12,425 | 6.3%) are the most common fields of study among 195,830 individuals in Area Code 956 who have obtained a bachelor's degree or higher.
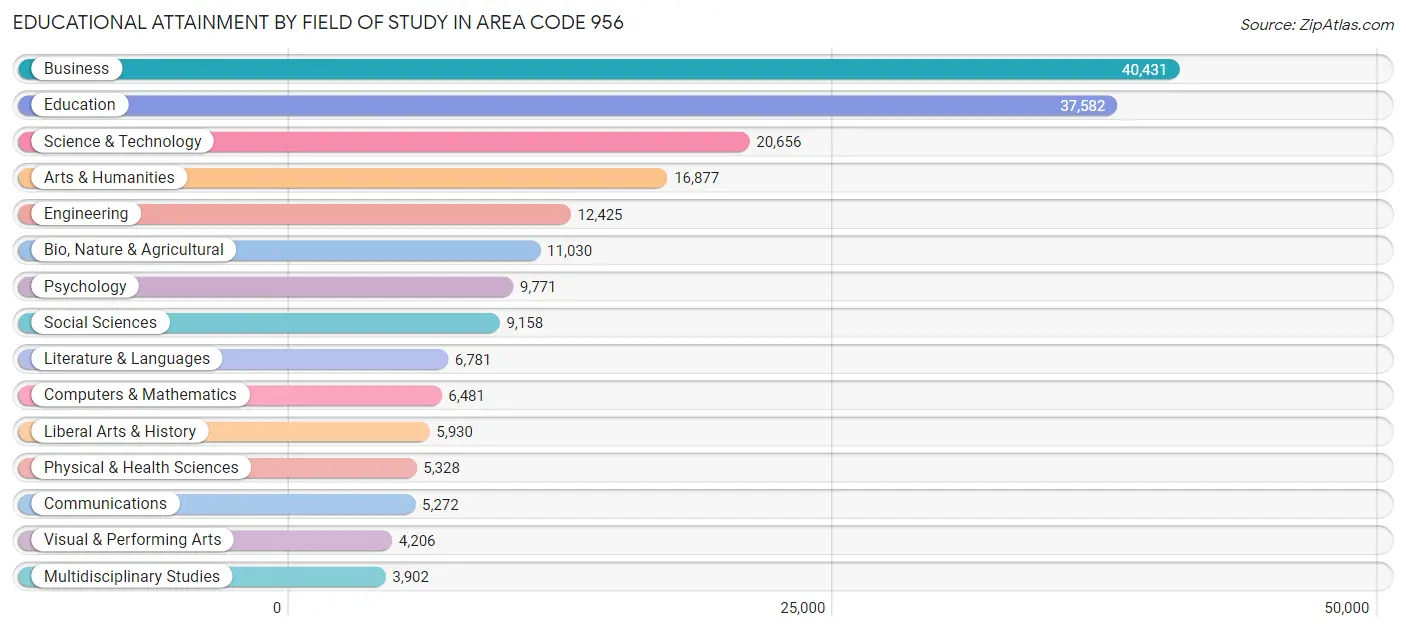
| Field of Study | # Graduates | % Graduates |
| Computers & Mathematics | 6,481 | 3.3% |
| Bio, Nature & Agricultural | 11,030 | 5.6% |
| Physical & Health Sciences | 5,328 | 2.7% |
| Psychology | 9,771 | 5.0% |
| Social Sciences | 9,158 | 4.7% |
| Engineering | 12,425 | 6.3% |
| Multidisciplinary Studies | 3,902 | 2.0% |
| Science & Technology | 20,656 | 10.5% |
| Business | 40,431 | 20.6% |
| Education | 37,582 | 19.2% |
| Literature & Languages | 6,781 | 3.5% |
| Liberal Arts & History | 5,930 | 3.0% |
| Visual & Performing Arts | 4,206 | 2.1% |
| Communications | 5,272 | 2.7% |
| Arts & Humanities | 16,877 | 8.6% |
| Total | 195,830 | 100.0% |
Transportation & Commute in Area Code 956
Vehicle Availability by Sex in Area Code 956
The most prevalent vehicle ownership categories in Area Code 956 are males with 2 vehicles (144,837, accounting for 40.3%) and females with 2 vehicles (107,622, making up 50.6%).
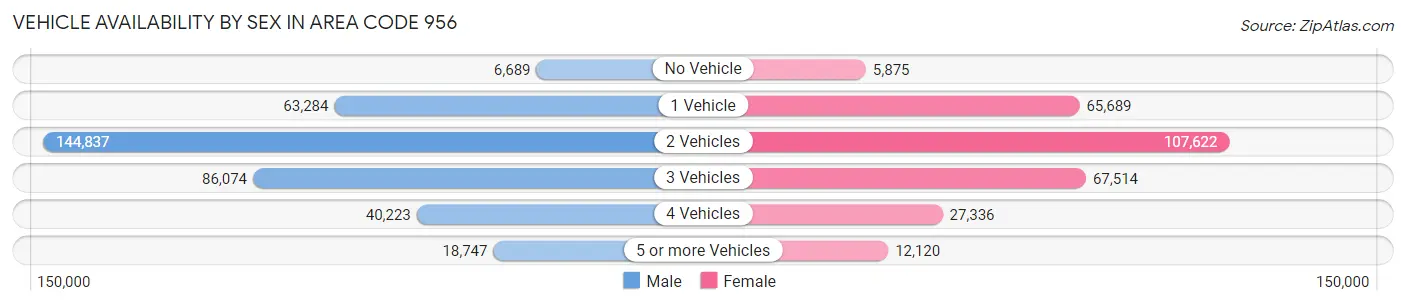
| Vehicles Available | Male | Female |
| No Vehicle | 6,689 (1.9%) | 5,875 (2.1%) |
| 1 Vehicle | 63,284 (17.6%) | 65,689 (23.0%) |
| 2 Vehicles | 144,837 (40.3%) | 107,622 (37.6%) |
| 3 Vehicles | 86,074 (23.9%) | 67,514 (23.6%) |
| 4 Vehicles | 40,223 (11.2%) | 27,336 (9.6%) |
| 5 or more Vehicles | 18,747 (5.2%) | 12,120 (4.2%) |
| Total | 359,854 (100.0%) | 286,156 (100.0%) |
Commute Time in Area Code 956
The most frequently occuring commute durations in Area Code 956 are 15 to 19 minutes (114,873 commuters, 19.1%), 10 to 14 minutes (108,366 commuters, 18.0%), and 20 to 24 minutes (106,497 commuters, 17.7%).
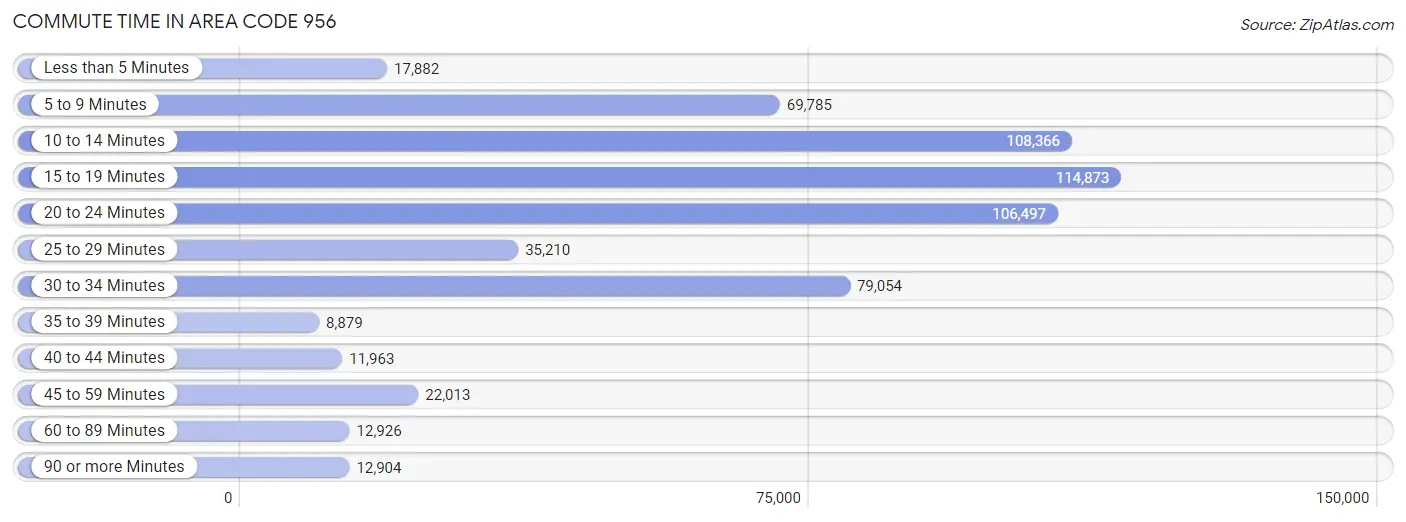
| Commute Time | # Commuters | % Commuters |
| Less than 5 Minutes | 17,882 | 3.0% |
| 5 to 9 Minutes | 69,785 | 11.6% |
| 10 to 14 Minutes | 108,366 | 18.0% |
| 15 to 19 Minutes | 114,873 | 19.1% |
| 20 to 24 Minutes | 106,497 | 17.7% |
| 25 to 29 Minutes | 35,210 | 5.9% |
| 30 to 34 Minutes | 79,054 | 13.2% |
| 35 to 39 Minutes | 8,879 | 1.5% |
| 40 to 44 Minutes | 11,963 | 2.0% |
| 45 to 59 Minutes | 22,013 | 3.7% |
| 60 to 89 Minutes | 12,926 | 2.1% |
| 90 or more Minutes | 12,904 | 2.1% |
Commute Time by Sex in Area Code 956
The most common commute times in Area Code 956 are 20 to 24 minutes (60,539 commuters, 18.0%) for males and 15 to 19 minutes (55,049 commuters, 20.9%) for females.
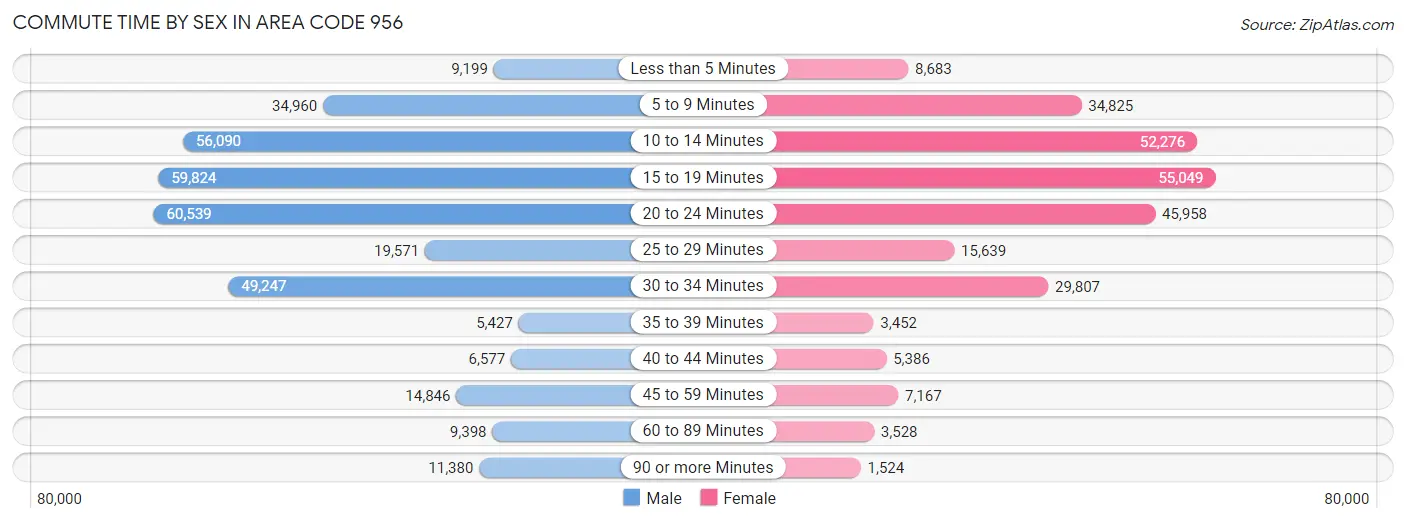
| Commute Time | Male | Female |
| Less than 5 Minutes | 9,199 (2.7%) | 8,683 (3.3%) |
| 5 to 9 Minutes | 34,960 (10.4%) | 34,825 (13.2%) |
| 10 to 14 Minutes | 56,090 (16.6%) | 52,276 (19.9%) |
| 15 to 19 Minutes | 59,824 (17.7%) | 55,049 (20.9%) |
| 20 to 24 Minutes | 60,539 (18.0%) | 45,958 (17.5%) |
| 25 to 29 Minutes | 19,571 (5.8%) | 15,639 (5.9%) |
| 30 to 34 Minutes | 49,247 (14.6%) | 29,807 (11.3%) |
| 35 to 39 Minutes | 5,427 (1.6%) | 3,452 (1.3%) |
| 40 to 44 Minutes | 6,577 (1.9%) | 5,386 (2.1%) |
| 45 to 59 Minutes | 14,846 (4.4%) | 7,167 (2.7%) |
| 60 to 89 Minutes | 9,398 (2.8%) | 3,528 (1.3%) |
| 90 or more Minutes | 11,380 (3.4%) | 1,524 (0.6%) |
Time of Departure to Work by Sex in Area Code 956
The most frequent times of departure to work in Area Code 956 are 7:00 AM to 7:29 AM (48,898, 14.5%) for males and 7:00 AM to 7:29 AM (48,029, 18.2%) for females.
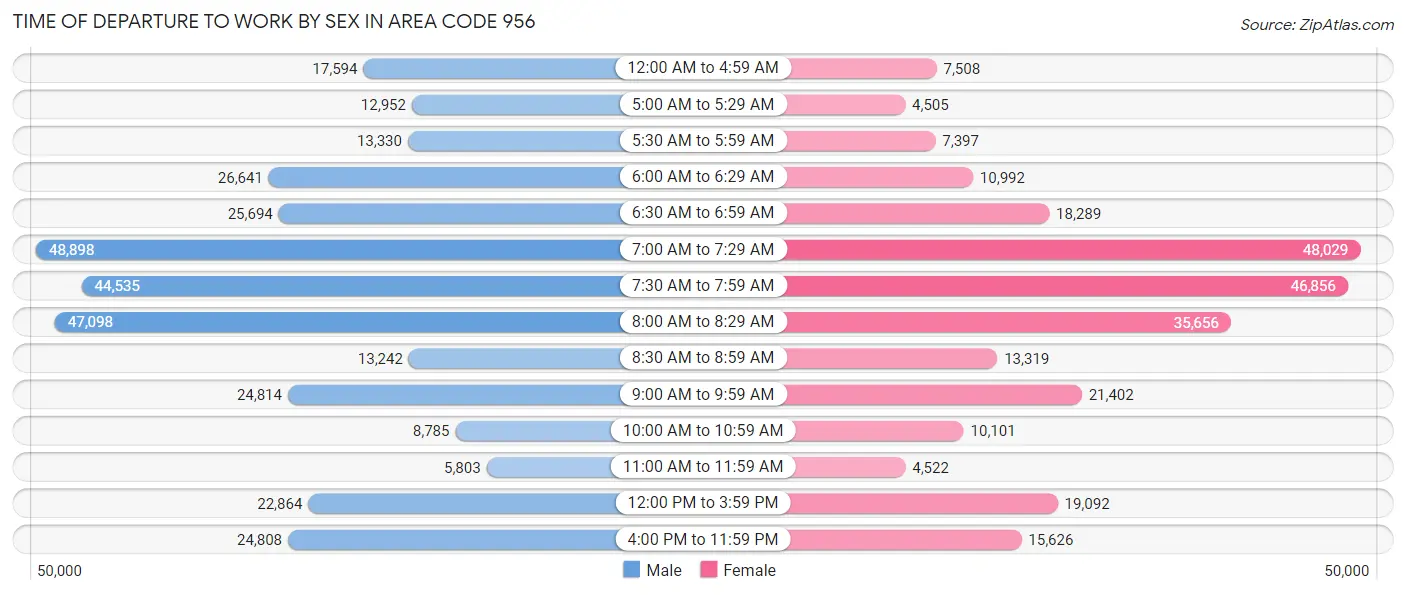
| Time of Departure | Male | Female |
| 12:00 AM to 4:59 AM | 17,594 (5.2%) | 7,508 (2.9%) |
| 5:00 AM to 5:29 AM | 12,952 (3.8%) | 4,505 (1.7%) |
| 5:30 AM to 5:59 AM | 13,330 (4.0%) | 7,397 (2.8%) |
| 6:00 AM to 6:29 AM | 26,641 (7.9%) | 10,992 (4.2%) |
| 6:30 AM to 6:59 AM | 25,694 (7.6%) | 18,289 (7.0%) |
| 7:00 AM to 7:29 AM | 48,898 (14.5%) | 48,029 (18.2%) |
| 7:30 AM to 7:59 AM | 44,535 (13.2%) | 46,856 (17.8%) |
| 8:00 AM to 8:29 AM | 47,098 (14.0%) | 35,656 (13.5%) |
| 8:30 AM to 8:59 AM | 13,242 (3.9%) | 13,319 (5.1%) |
| 9:00 AM to 9:59 AM | 24,814 (7.4%) | 21,402 (8.1%) |
| 10:00 AM to 10:59 AM | 8,785 (2.6%) | 10,101 (3.8%) |
| 11:00 AM to 11:59 AM | 5,803 (1.7%) | 4,522 (1.7%) |
| 12:00 PM to 3:59 PM | 22,864 (6.8%) | 19,092 (7.2%) |
| 4:00 PM to 11:59 PM | 24,808 (7.4%) | 15,626 (5.9%) |
| Total | 337,058 (100.0%) | 263,294 (100.0%) |
Housing Occupancy in Area Code 956
Occupancy by Ownership in Area Code 956
Of the total 497,375 dwellings in Area Code 956, owner-occupied units account for 331,784 (66.7%), while renter-occupied units make up 165,591 (33.3%).
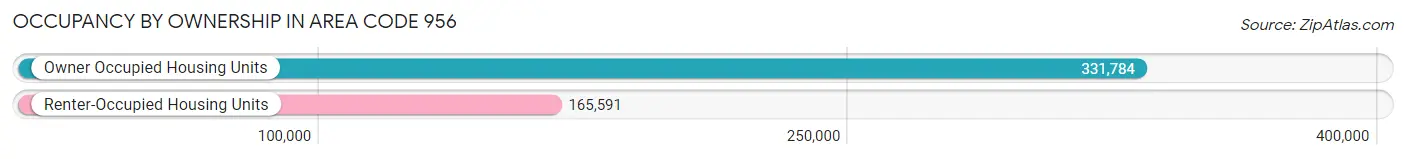
| Occupancy | # Housing Units | % Housing Units |
| Owner Occupied Housing Units | 331,784 | 66.7% |
| Renter-Occupied Housing Units | 165,591 | 33.3% |
| Total Occupied Housing Units | 497,375 | 100.0% |
Occupancy by Household Size in Area Code 956
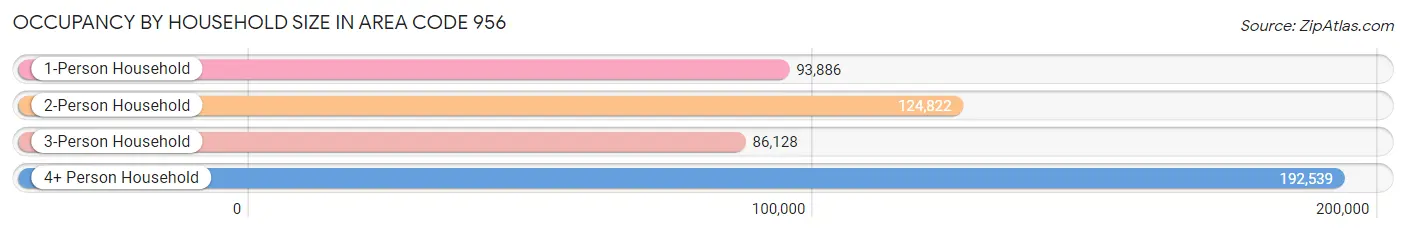
| Household Size | # Housing Units | % Housing Units |
| 1-Person Household | 93,886 | 18.9% |
| 2-Person Household | 124,822 | 25.1% |
| 3-Person Household | 86,128 | 17.3% |
| 4+ Person Household | 192,539 | 38.7% |
| Total Housing Units | 497,375 | 100.0% |
Occupancy by Ownership by Household Size in Area Code 956
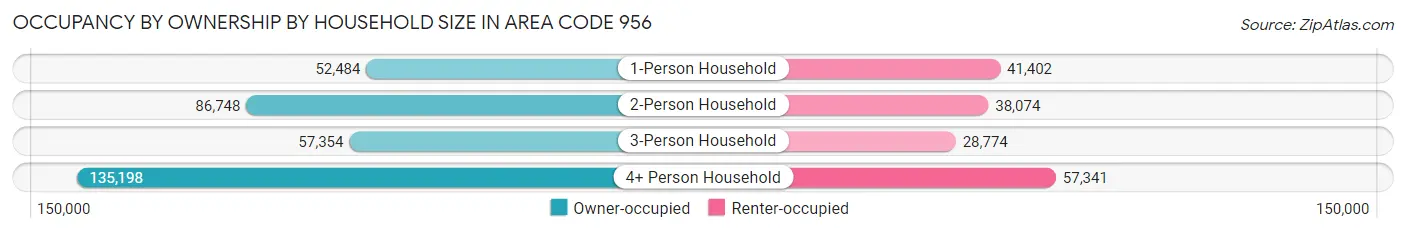
| Household Size | Owner-occupied | Renter-occupied |
| 1-Person Household | 52,484 (55.9%) | 41,402 (44.1%) |
| 2-Person Household | 86,748 (69.5%) | 38,074 (30.5%) |
| 3-Person Household | 57,354 (66.6%) | 28,774 (33.4%) |
| 4+ Person Household | 135,198 (70.2%) | 57,341 (29.8%) |
| Total Housing Units | 331,784 (66.7%) | 165,591 (33.3%) |
Occupancy by Educational Attainment in Area Code 956
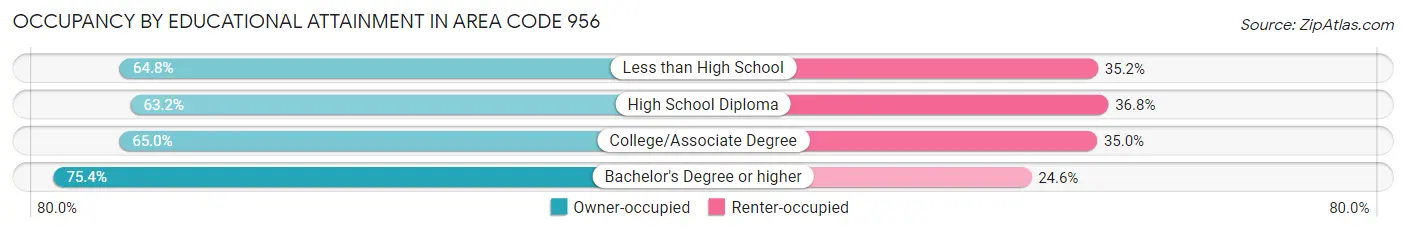
| Household Size | Owner-occupied | Renter-occupied |
| Less than High School | 97,683 (64.8%) | 52,977 (35.2%) |
| High School Diploma | 74,336 (63.2%) | 43,305 (36.8%) |
| College/Associate Degree | 80,912 (65.0%) | 43,603 (35.0%) |
| Bachelor's Degree or higher | 78,853 (75.4%) | 25,706 (24.6%) |
Occupancy by Age of Householder in Area Code 956
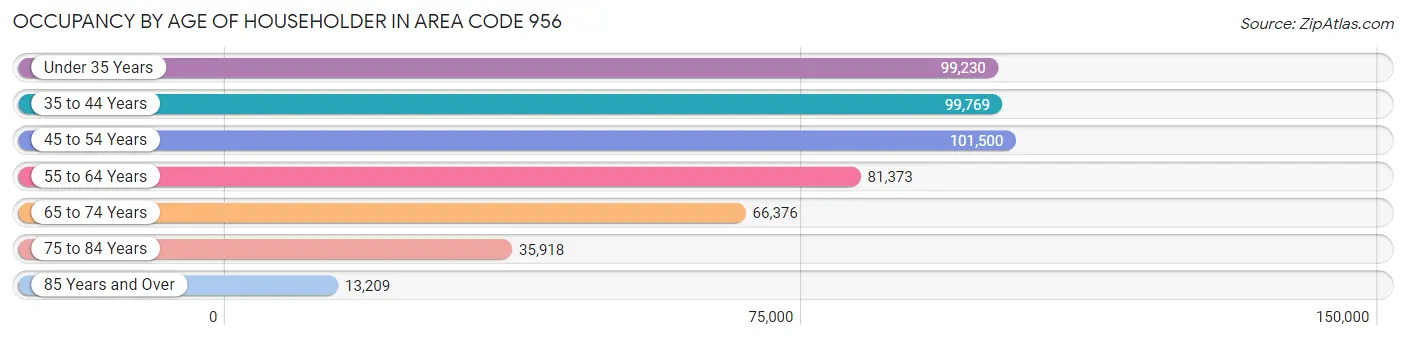
| Age Bracket | # Households | % Households |
| Under 35 Years | 99,230 | 20.0% |
| 35 to 44 Years | 99,769 | 20.1% |
| 45 to 54 Years | 101,500 | 20.4% |
| 55 to 64 Years | 81,373 | 16.4% |
| 65 to 74 Years | 66,376 | 13.4% |
| 75 to 84 Years | 35,918 | 7.2% |
| 85 Years and Over | 13,209 | 2.7% |
| Total | 497,375 | 100.0% |
Housing Finances in Area Code 956
Median Income by Occupancy in Area Code 956
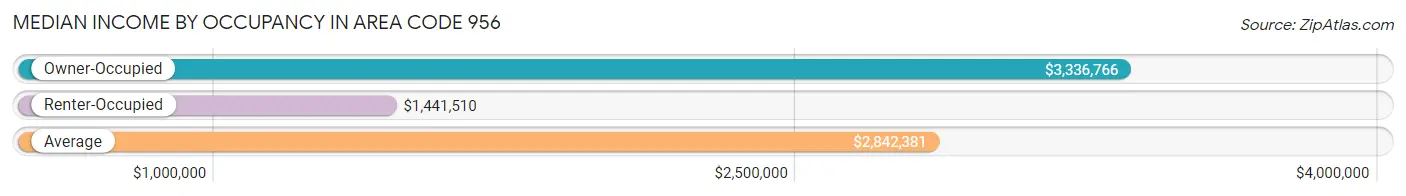
| Occupancy Type | # Households | Median Income |
| Owner-Occupied | 331,784 (66.7%) | $3,336,766 |
| Renter-Occupied | 165,591 (33.3%) | $1,441,510 |
| Average | 497,375 (100.0%) | $2,842,381 |
Occupancy by Householder Income Bracket in Area Code 956
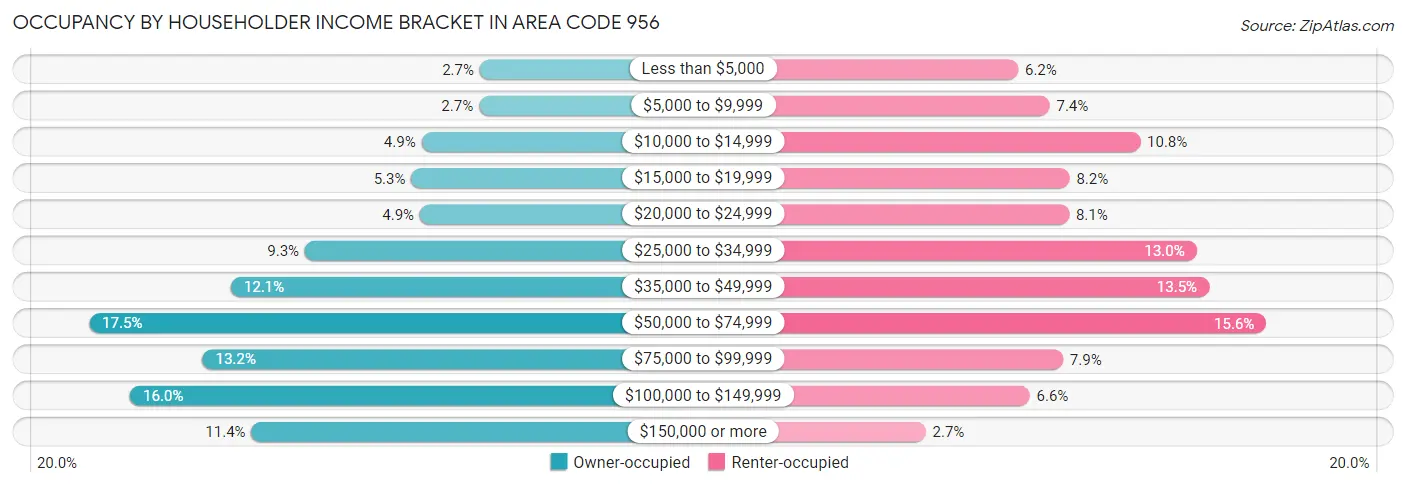
| Income Bracket | Owner-occupied | Renter-occupied |
| Less than $5,000 | 8,834 (2.7%) | 10,253 (6.2%) |
| $5,000 to $9,999 | 8,921 (2.7%) | 12,240 (7.4%) |
| $10,000 to $14,999 | 16,192 (4.9%) | 17,945 (10.8%) |
| $15,000 to $19,999 | 17,474 (5.3%) | 13,498 (8.2%) |
| $20,000 to $24,999 | 16,383 (4.9%) | 13,469 (8.1%) |
| $25,000 to $34,999 | 30,933 (9.3%) | 21,503 (13.0%) |
| $35,000 to $49,999 | 40,283 (12.1%) | 22,293 (13.5%) |
| $50,000 to $74,999 | 58,193 (17.5%) | 25,906 (15.6%) |
| $75,000 to $99,999 | 43,861 (13.2%) | 13,087 (7.9%) |
| $100,000 to $149,999 | 53,032 (16.0%) | 10,977 (6.6%) |
| $150,000 or more | 37,678 (11.4%) | 4,420 (2.7%) |
| Total | 331,784 (100.0%) | 165,591 (100.0%) |
Monthly Housing Cost Tiers in Area Code 956
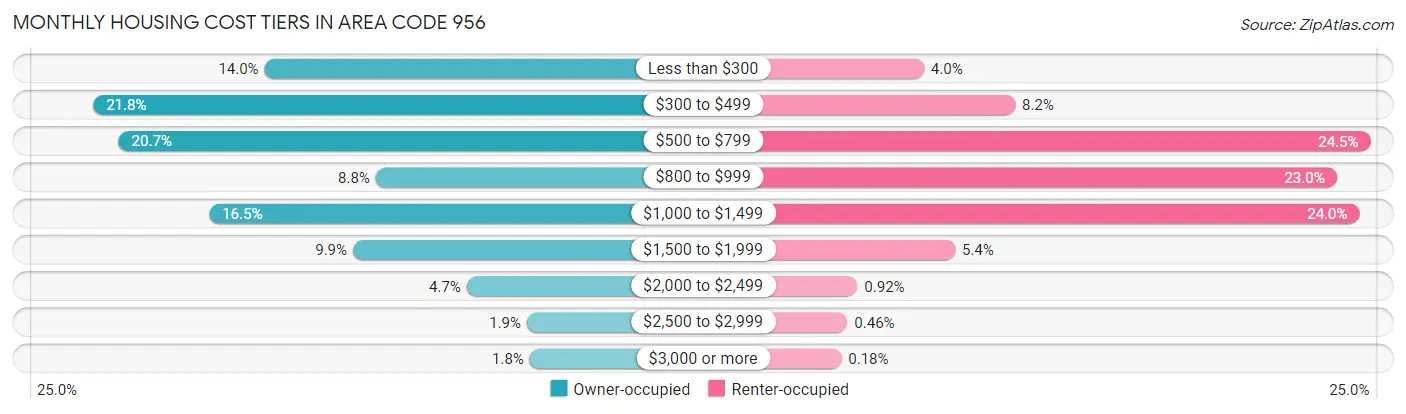
| Monthly Cost | Owner-occupied | Renter-occupied |
| Less than $300 | 46,332 (14.0%) | 6,584 (4.0%) |
| $300 to $499 | 72,461 (21.8%) | 13,541 (8.2%) |
| $500 to $799 | 68,596 (20.7%) | 40,624 (24.5%) |
| $800 to $999 | 29,336 (8.8%) | 38,033 (23.0%) |
| $1,000 to $1,499 | 54,760 (16.5%) | 39,779 (24.0%) |
| $1,500 to $1,999 | 32,807 (9.9%) | 8,957 (5.4%) |
| $2,000 to $2,499 | 15,421 (4.6%) | 1,520 (0.9%) |
| $2,500 to $2,999 | 6,251 (1.9%) | 765 (0.5%) |
| $3,000 or more | 5,820 (1.8%) | 295 (0.2%) |
| Total | 331,784 (100.0%) | 165,591 (100.0%) |
Physical Housing Characteristics in Area Code 956
Housing Structures in Area Code 956
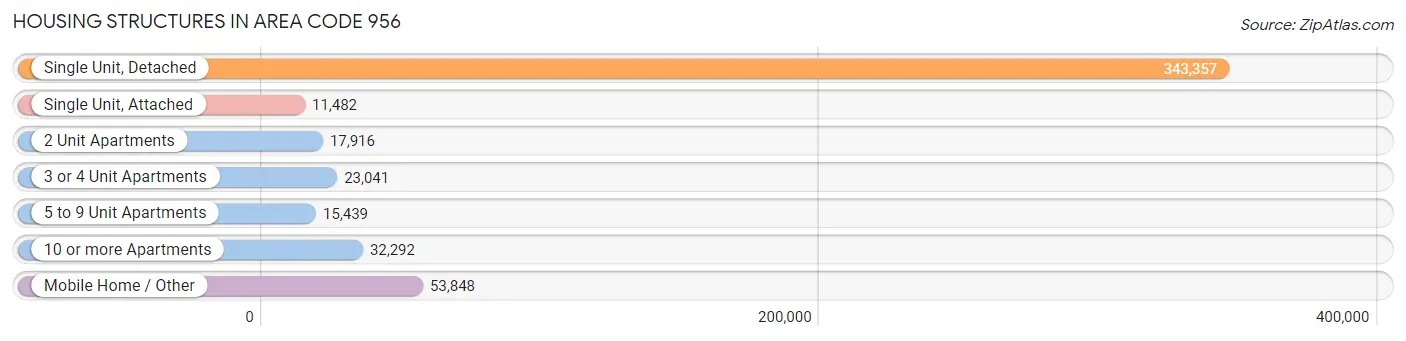
| Structure Type | # Housing Units | % Housing Units |
| Single Unit, Detached | 343,357 | 69.0% |
| Single Unit, Attached | 11,482 | 2.3% |
| 2 Unit Apartments | 17,916 | 3.6% |
| 3 or 4 Unit Apartments | 23,041 | 4.6% |
| 5 to 9 Unit Apartments | 15,439 | 3.1% |
| 10 or more Apartments | 32,292 | 6.5% |
| Mobile Home / Other | 53,848 | 10.8% |
| Total | 497,375 | 100.0% |
Housing Structures by Occupancy in Area Code 956
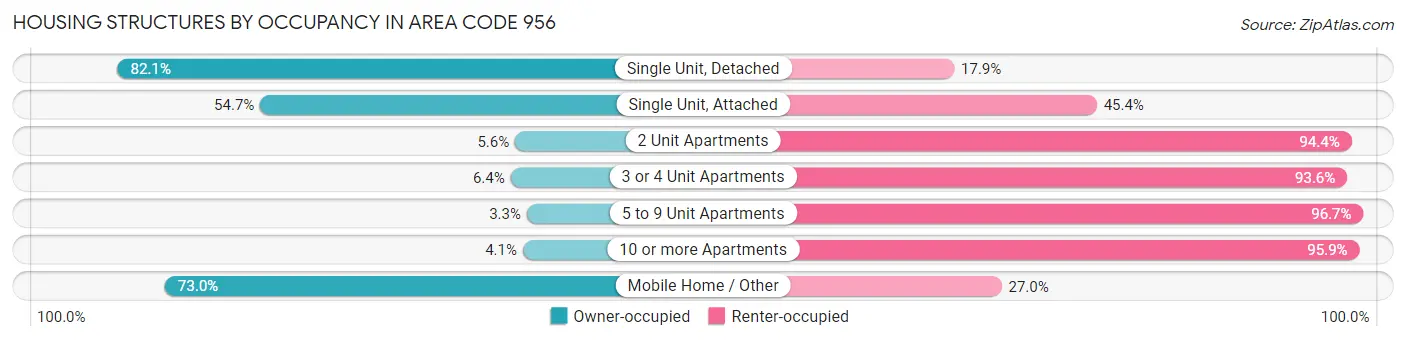
| Structure Type | Owner-occupied | Renter-occupied |
| Single Unit, Detached | 281,899 (82.1%) | 61,458 (17.9%) |
| Single Unit, Attached | 6,275 (54.6%) | 5,207 (45.4%) |
| 2 Unit Apartments | 998 (5.6%) | 16,918 (94.4%) |
| 3 or 4 Unit Apartments | 1,484 (6.4%) | 21,557 (93.6%) |
| 5 to 9 Unit Apartments | 511 (3.3%) | 14,928 (96.7%) |
| 10 or more Apartments | 1,318 (4.1%) | 30,974 (95.9%) |
| Mobile Home / Other | 39,299 (73.0%) | 14,549 (27.0%) |
| Total | 331,784 (66.7%) | 165,591 (33.3%) |
Housing Structures by Number of Rooms in Area Code 956
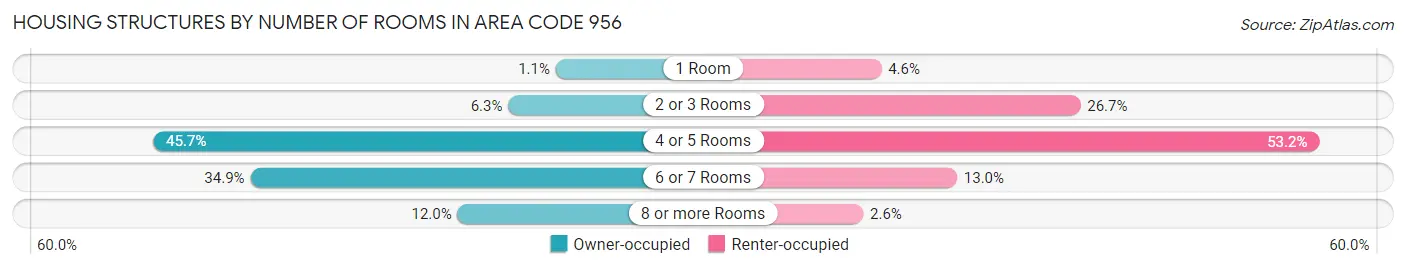
| Number of Rooms | Owner-occupied | Renter-occupied |
| 1 Room | 3,481 (1.1%) | 7,577 (4.6%) |
| 2 or 3 Rooms | 20,972 (6.3%) | 44,183 (26.7%) |
| 4 or 5 Rooms | 151,761 (45.7%) | 88,083 (53.2%) |
| 6 or 7 Rooms | 115,928 (34.9%) | 21,500 (13.0%) |
| 8 or more Rooms | 39,642 (11.9%) | 4,248 (2.6%) |
| Total | 331,784 (100.0%) | 165,591 (100.0%) |
Housing Structure by Heating Type in Area Code 956
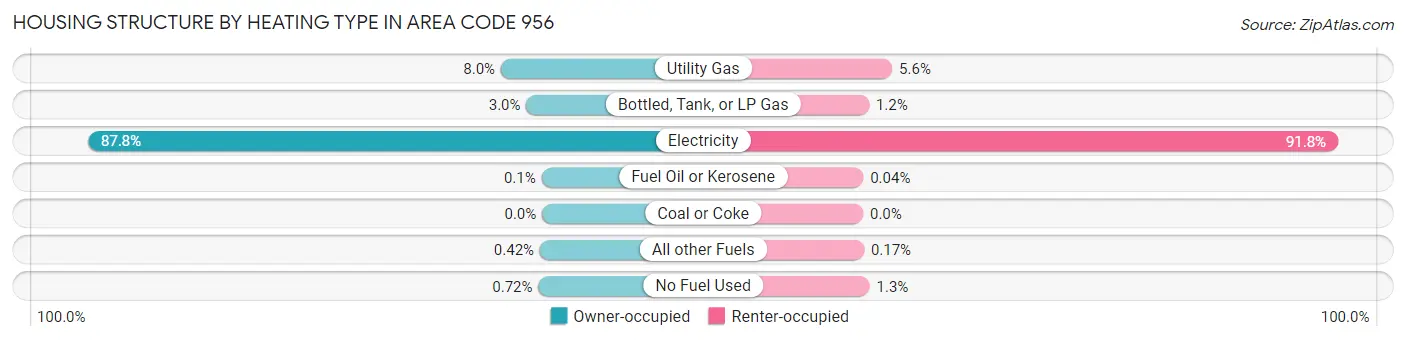
| Heating Type | Owner-occupied | Renter-occupied |
| Utility Gas | 26,362 (8.0%) | 9,302 (5.6%) |
| Bottled, Tank, or LP Gas | 10,088 (3.0%) | 1,900 (1.1%) |
| Electricity | 291,208 (87.8%) | 151,940 (91.8%) |
| Fuel Oil or Kerosene | 320 (0.1%) | 61 (0.0%) |
| Coal or Coke | 16 (0.0%) | 0 (0.0%) |
| All other Fuels | 1,390 (0.4%) | 284 (0.2%) |
| No Fuel Used | 2,400 (0.7%) | 2,104 (1.3%) |
| Total | 331,784 (100.0%) | 165,591 (100.0%) |
Household Vehicle Usage in Area Code 956
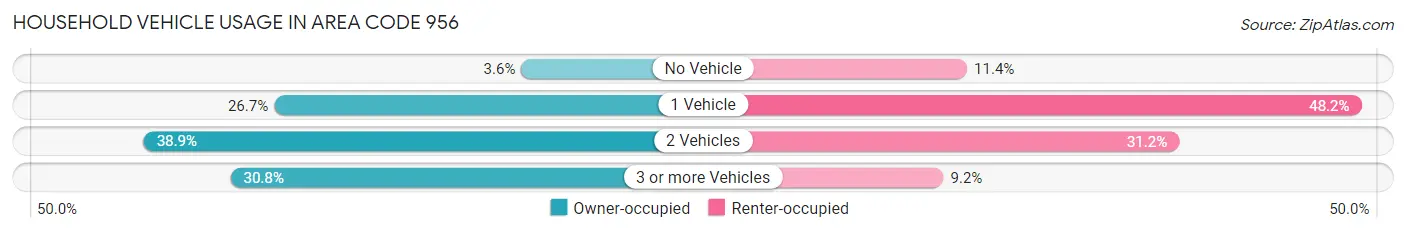
| Vehicles per Household | Owner-occupied | Renter-occupied |
| No Vehicle | 12,071 (3.6%) | 18,902 (11.4%) |
| 1 Vehicle | 88,646 (26.7%) | 79,807 (48.2%) |
| 2 Vehicles | 128,988 (38.9%) | 51,626 (31.2%) |
| 3 or more Vehicles | 102,079 (30.8%) | 15,256 (9.2%) |
| Total | 331,784 (100.0%) | 165,591 (100.0%) |
Real Estate & Mortgages in Area Code 956
Real Estate and Mortgage Overview in Area Code 956
| Characteristic | Without Mortgage | With Mortgage |
| Housing Units | 195,240 | 136,544 |
| Median Property Value | $5,545,800 | $7,802,500 |
| Median Household Income | $2,617,005 | $22,708 |
| Monthly Housing Costs | $26,906 | $5,664 |
| Real Estate Taxes | $90,149 | $4,345 |
Property Value by Mortgage Status in Area Code 956
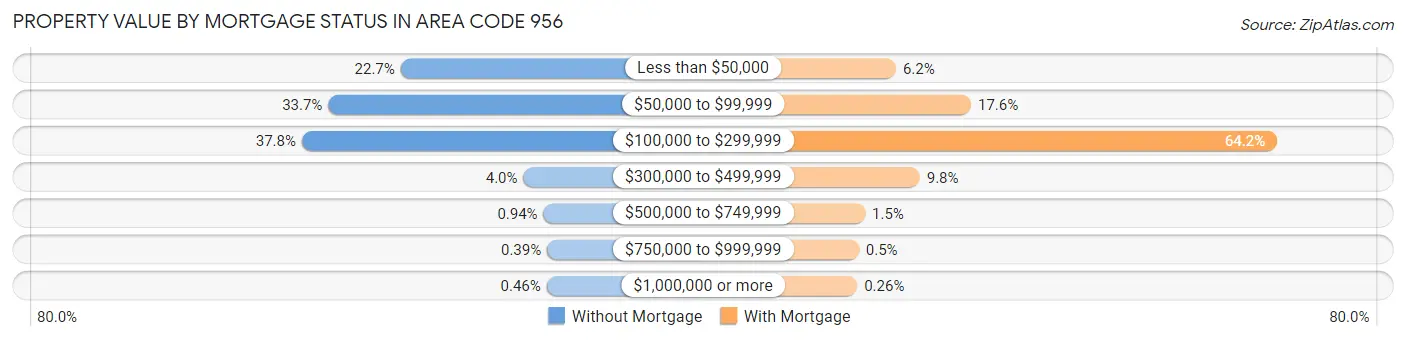
| Property Value | Without Mortgage | With Mortgage |
| Less than $50,000 | 44,317 (22.7%) | 8,411 (6.2%) |
| $50,000 to $99,999 | 65,878 (33.7%) | 24,036 (17.6%) |
| $100,000 to $299,999 | 73,728 (37.8%) | 87,698 (64.2%) |
| $300,000 to $499,999 | 7,817 (4.0%) | 13,372 (9.8%) |
| $500,000 to $749,999 | 1,837 (0.9%) | 1,987 (1.5%) |
| $750,000 to $999,999 | 771 (0.4%) | 686 (0.5%) |
| $1,000,000 or more | 892 (0.5%) | 354 (0.3%) |
| Total | 195,240 (100.0%) | 136,544 (100.0%) |
Household Income by Mortgage Status in Area Code 956
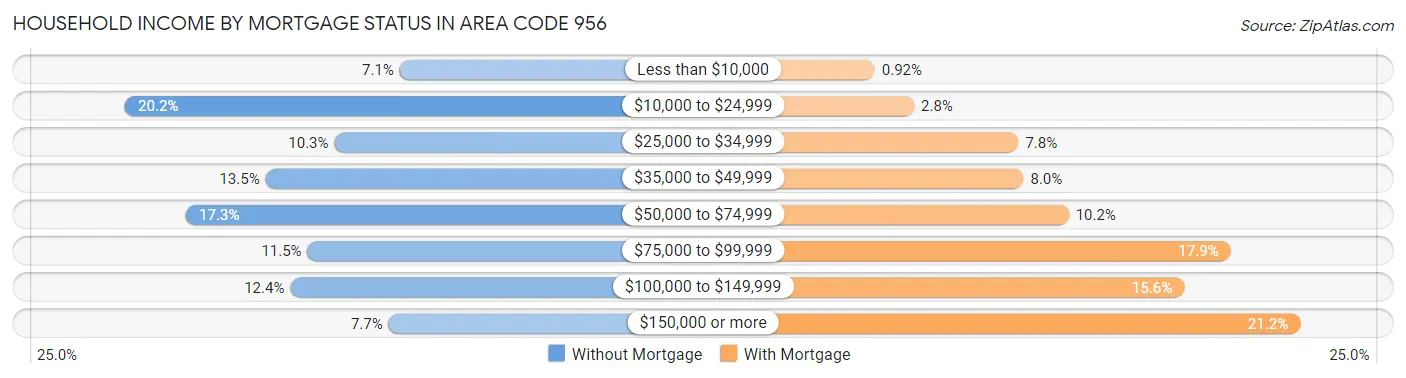
| Household Income | Without Mortgage | With Mortgage |
| Less than $10,000 | 13,949 (7.1%) | 1,256 (0.9%) |
| $10,000 to $24,999 | 39,453 (20.2%) | 3,806 (2.8%) |
| $25,000 to $34,999 | 20,010 (10.2%) | 10,596 (7.8%) |
| $35,000 to $49,999 | 26,421 (13.5%) | 10,923 (8.0%) |
| $50,000 to $74,999 | 33,805 (17.3%) | 13,862 (10.2%) |
| $75,000 to $99,999 | 22,512 (11.5%) | 24,388 (17.9%) |
| $100,000 to $149,999 | 24,120 (12.3%) | 21,349 (15.6%) |
| $150,000 or more | 14,970 (7.7%) | 28,912 (21.2%) |
| Total | 195,240 (100.0%) | 136,544 (100.0%) |
Property Value to Household Income Ratio in Area Code 956
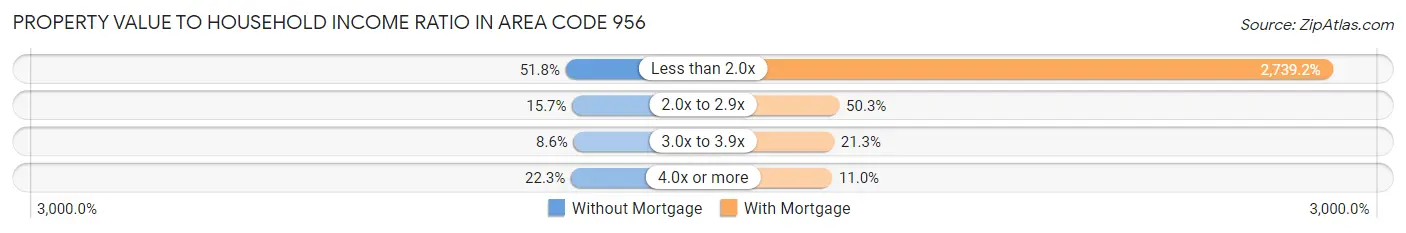
| Value-to-Income Ratio | Without Mortgage | With Mortgage |
| Less than 2.0x | 101,048 (51.8%) | 3,740,180 (2,739.2%) |
| 2.0x to 2.9x | 30,699 (15.7%) | 68,742 (50.3%) |
| 3.0x to 3.9x | 16,734 (8.6%) | 29,060 (21.3%) |
| 4.0x or more | 43,519 (22.3%) | 15,029 (11.0%) |
| Total | 195,240 (100.0%) | 136,544 (100.0%) |
Real Estate Taxes by Mortgage Status in Area Code 956
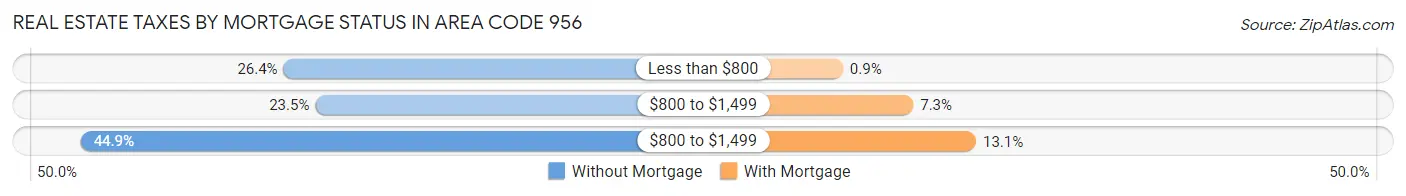
| Property Taxes | Without Mortgage | With Mortgage |
| Less than $800 | 51,468 (26.4%) | 1,225 (0.9%) |
| $800 to $1,499 | 45,813 (23.5%) | 10,015 (7.3%) |
| $800 to $1,499 | 87,608 (44.9%) | 17,839 (13.1%) |
| Total | 195,240 (100.0%) | 136,544 (100.0%) |
Health & Disability in Area Code 956
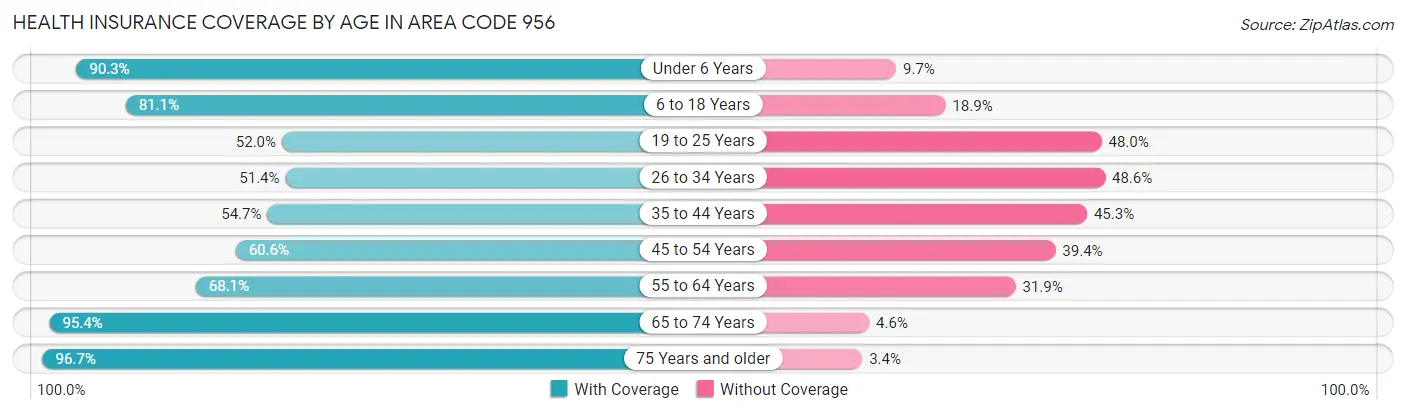
Health Insurance Coverage by Age in Area Code 956
| Age Bracket | With Coverage | Without Coverage |
| Under 6 Years | 145,626 (90.3%) | 15,564 (9.7%) |
| 6 to 18 Years | 315,311 (81.1%) | 73,330 (18.9%) |
| 19 to 25 Years | 94,494 (52.0%) | 87,111 (48.0%) |
| 26 to 34 Years | 99,850 (51.4%) | 94,536 (48.6%) |
| 35 to 44 Years | 110,525 (54.7%) | 91,375 (45.3%) |
| 45 to 54 Years | 113,692 (60.6%) | 73,825 (39.4%) |
| 55 to 64 Years | 99,349 (68.1%) | 46,623 (31.9%) |
| 65 to 74 Years | 104,453 (95.4%) | 5,079 (4.6%) |
| 75 Years and older | 79,022 (96.7%) | 2,737 (3.4%) |
| Total | 1,162,322 (70.3%) | 490,180 (29.7%) |
Health Insurance Coverage by Citizenship Status in Area Code 956
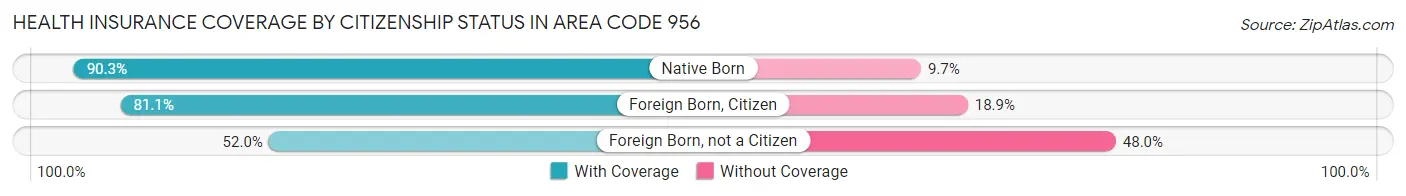
| Citizenship Status | With Coverage | Without Coverage |
| Native Born | 145,626 (90.3%) | 15,564 (9.7%) |
| Foreign Born, Citizen | 315,311 (81.1%) | 73,330 (18.9%) |
| Foreign Born, not a Citizen | 94,494 (52.0%) | 87,111 (48.0%) |
Health Insurance Coverage by Household Income in Area Code 956
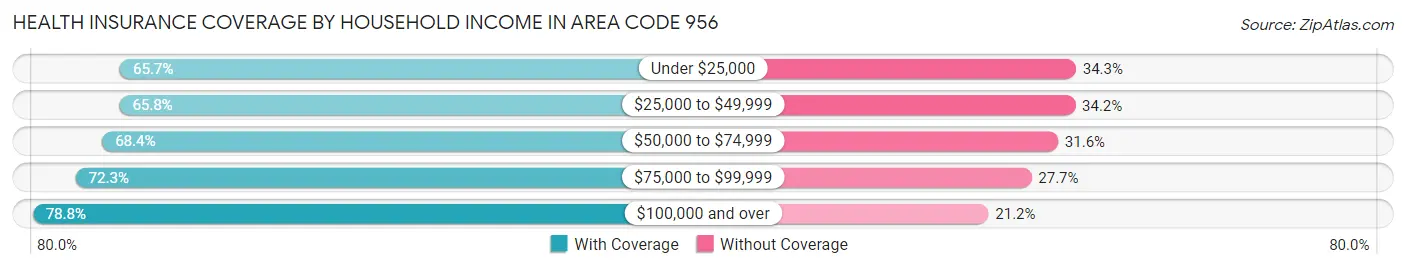
| Household Income | With Coverage | Without Coverage |
| Under $25,000 | 228,385 (65.7%) | 119,353 (34.3%) |
| $25,000 to $49,999 | 244,200 (65.8%) | 127,044 (34.2%) |
| $50,000 to $74,999 | 201,541 (68.4%) | 93,290 (31.6%) |
| $75,000 to $99,999 | 154,664 (72.3%) | 59,148 (27.7%) |
| $100,000 and over | 331,133 (78.8%) | 89,176 (21.2%) |
Public vs Private Health Insurance Coverage by Age in Area Code 956
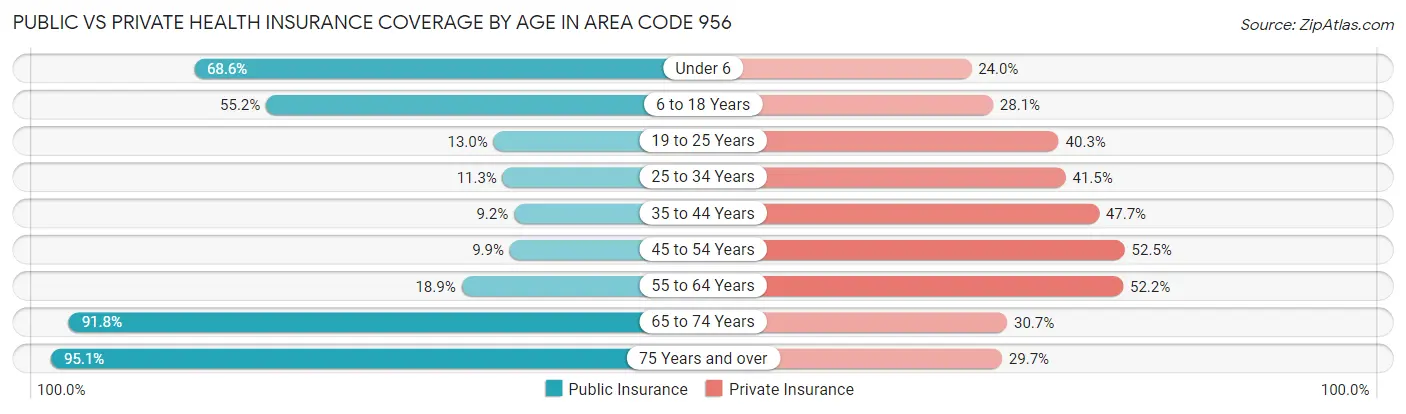
| Age Bracket | Public Insurance | Private Insurance |
| Under 6 | 110,511 (68.6%) | 38,715 (24.0%) |
| 6 to 18 Years | 214,400 (55.2%) | 109,029 (28.1%) |
| 19 to 25 Years | 23,542 (13.0%) | 73,087 (40.3%) |
| 25 to 34 Years | 21,895 (11.3%) | 80,737 (41.5%) |
| 35 to 44 Years | 18,481 (9.1%) | 96,345 (47.7%) |
| 45 to 54 Years | 18,642 (9.9%) | 98,446 (52.5%) |
| 55 to 64 Years | 27,606 (18.9%) | 76,200 (52.2%) |
| 65 to 74 Years | 100,547 (91.8%) | 33,592 (30.7%) |
| 75 Years and over | 77,752 (95.1%) | 24,300 (29.7%) |
| Total | 613,376 (37.1%) | 630,451 (38.2%) |
Disability Status by Sex by Age in Area Code 956
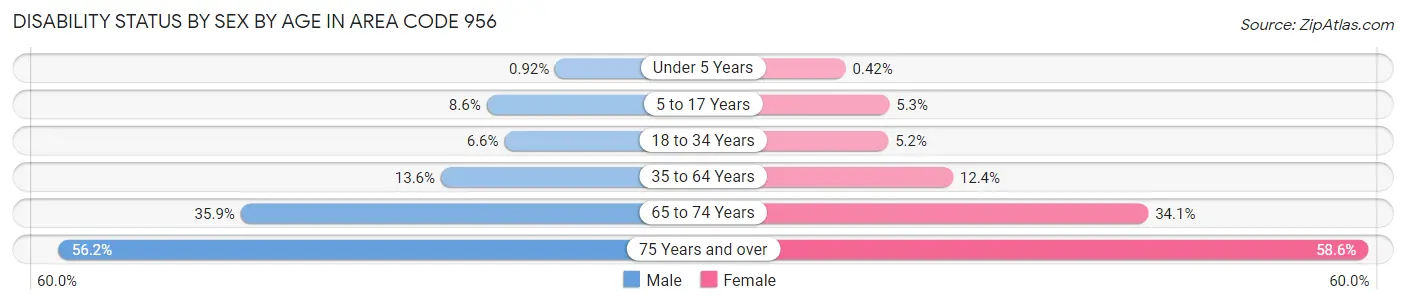
| Age Bracket | Male | Female |
| Under 5 Years | 631 (0.9%) | 277 (0.4%) |
| 5 to 17 Years | 16,710 (8.6%) | 9,960 (5.3%) |
| 18 to 34 Years | 13,651 (6.6%) | 10,359 (5.2%) |
| 35 to 64 Years | 35,276 (13.6%) | 34,235 (12.4%) |
| 65 to 74 Years | 18,049 (35.9%) | 20,247 (34.1%) |
| 75 Years and over | 19,194 (56.2%) | 27,899 (58.6%) |
Disability Class by Sex by Age in Area Code 956
Disability Class: Hearing Difficulty
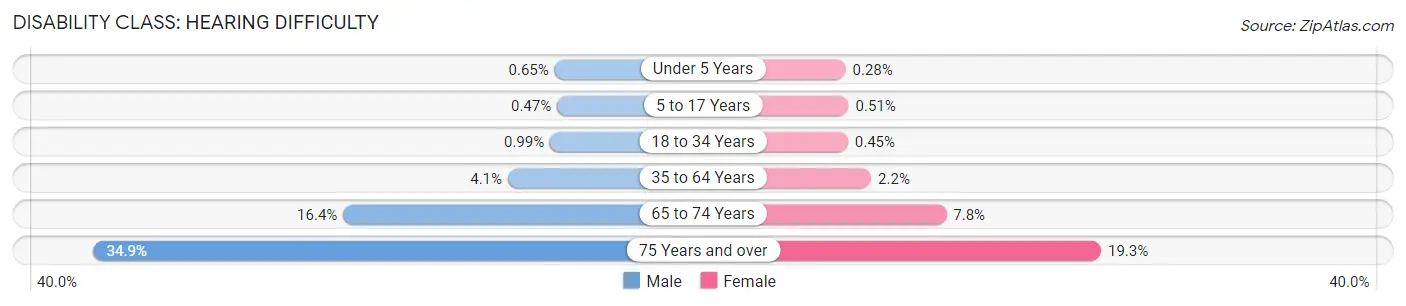
| Age Bracket | Male | Female |
| Under 5 Years | 446 (0.6%) | 183 (0.3%) |
| 5 to 17 Years | 913 (0.5%) | 959 (0.5%) |
| 18 to 34 Years | 2,066 (1.0%) | 894 (0.4%) |
| 35 to 64 Years | 10,651 (4.1%) | 6,045 (2.2%) |
| 65 to 74 Years | 8,210 (16.4%) | 4,603 (7.8%) |
| 75 Years and over | 11,915 (34.9%) | 9,160 (19.3%) |
Disability Class: Vision Difficulty
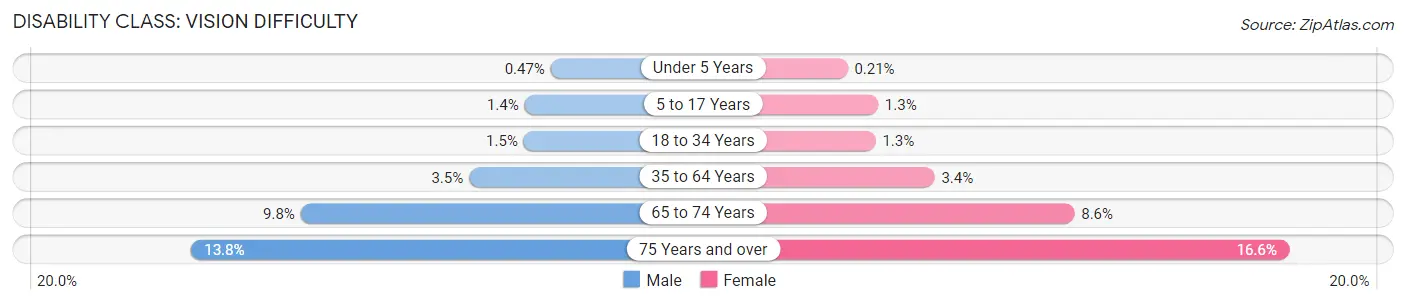
| Age Bracket | Male | Female |
| Under 5 Years | 318 (0.5%) | 137 (0.2%) |
| 5 to 17 Years | 2,815 (1.4%) | 2,519 (1.3%) |
| 18 to 34 Years | 3,055 (1.5%) | 2,500 (1.3%) |
| 35 to 64 Years | 9,047 (3.5%) | 9,527 (3.4%) |
| 65 to 74 Years | 4,894 (9.8%) | 5,121 (8.6%) |
| 75 Years and over | 4,718 (13.8%) | 7,895 (16.6%) |
Disability Class: Cognitive Difficulty
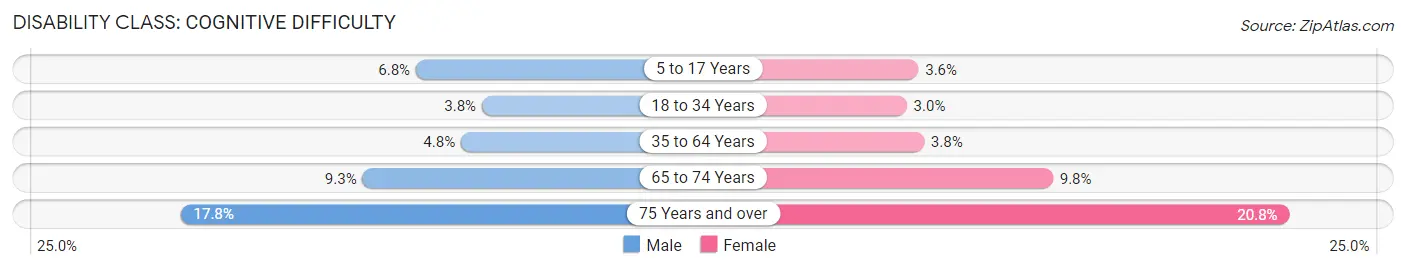
| Age Bracket | Male | Female |
| 5 to 17 Years | 13,351 (6.8%) | 6,687 (3.5%) |
| 18 to 34 Years | 7,849 (3.8%) | 6,039 (3.0%) |
| 35 to 64 Years | 12,284 (4.8%) | 10,551 (3.8%) |
| 65 to 74 Years | 4,681 (9.3%) | 5,807 (9.8%) |
| 75 Years and over | 6,069 (17.8%) | 9,887 (20.8%) |
Disability Class: Ambulatory Difficulty
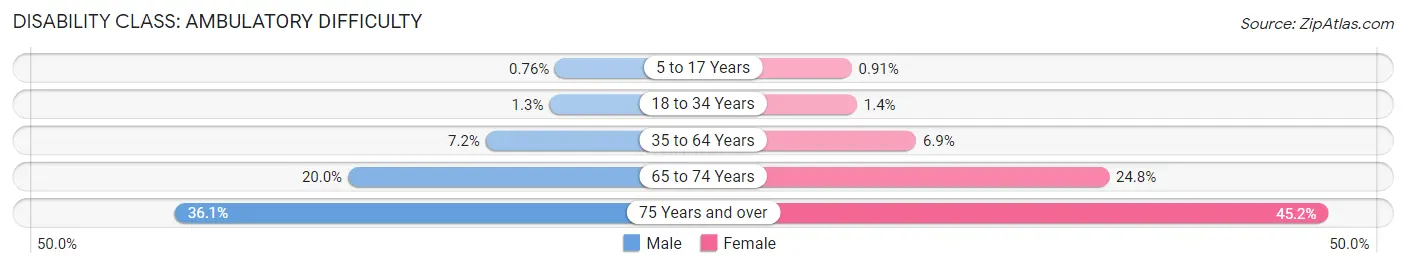
| Age Bracket | Male | Female |
| 5 to 17 Years | 1,474 (0.8%) | 1,712 (0.9%) |
| 18 to 34 Years | 2,728 (1.3%) | 2,808 (1.4%) |
| 35 to 64 Years | 18,646 (7.2%) | 19,054 (6.9%) |
| 65 to 74 Years | 10,040 (20.0%) | 14,709 (24.8%) |
| 75 Years and over | 12,317 (36.0%) | 21,486 (45.2%) |
Disability Class: Self-Care Difficulty
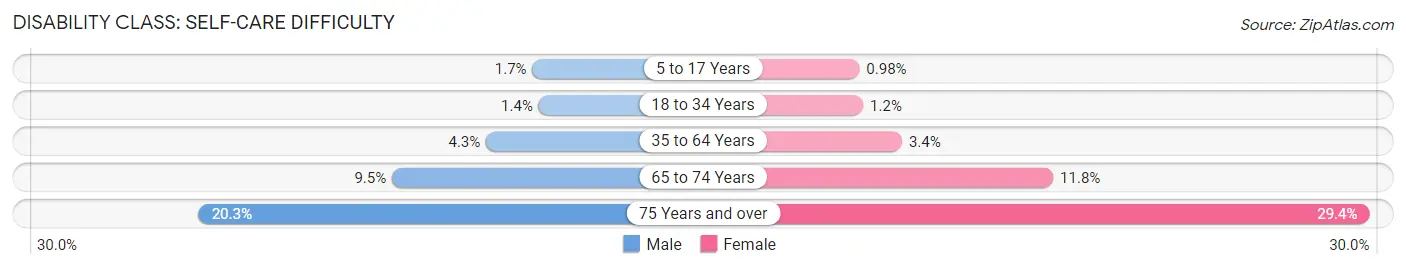
| Age Bracket | Male | Female |
| 5 to 17 Years | 3,365 (1.7%) | 1,837 (1.0%) |
| 18 to 34 Years | 2,848 (1.4%) | 2,394 (1.2%) |
| 35 to 64 Years | 11,124 (4.3%) | 9,269 (3.4%) |
| 65 to 74 Years | 4,789 (9.5%) | 6,982 (11.8%) |
| 75 Years and over | 6,935 (20.3%) | 13,978 (29.4%) |
Technology Access in Area Code 956
Computing Device Access in Area Code 956
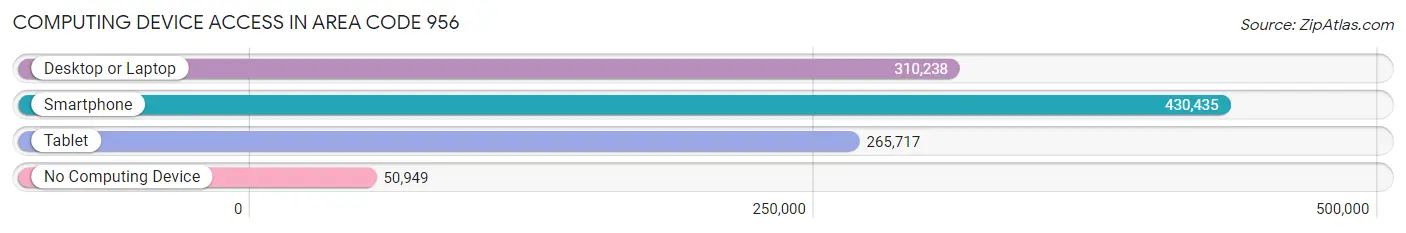
| Device Type | # Households | % Households |
| Desktop or Laptop | 310,238 | 62.4% |
| Smartphone | 430,435 | 86.5% |
| Tablet | 265,717 | 53.4% |
| No Computing Device | 50,949 | 10.2% |
| Total | 497,375 | 100.0% |
Internet Access in Area Code 956
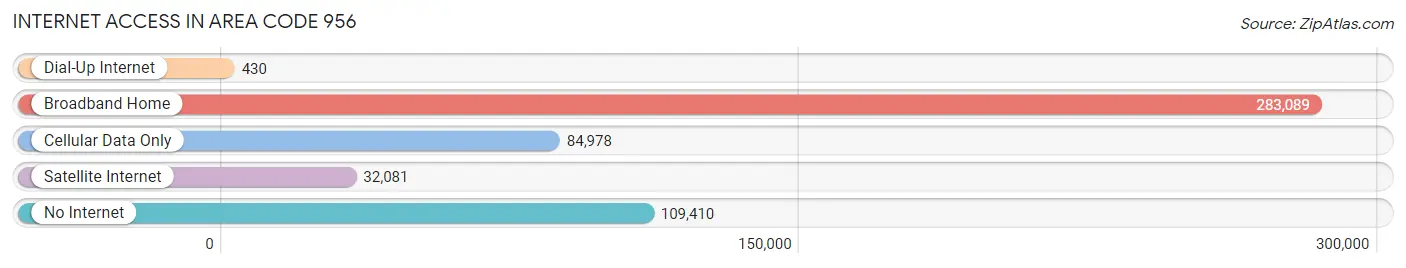
| Internet Type | # Households | % Households |
| Dial-Up Internet | 430 | 0.1% |
| Broadband Home | 283,089 | 56.9% |
| Cellular Data Only | 84,978 | 17.1% |
| Satellite Internet | 32,081 | 6.5% |
| No Internet | 109,410 | 22.0% |
| Total | 497,375 | 100.0% |
Area Code 956 Summary
Geography
Area code 956 is located in the southernmost part of Texas, covering the Rio Grande Valley and the cities of McAllen, Brownsville, Harlingen, and Laredo. It is bordered by the Mexican states of Tamaulipas and Nuevo Leon to the south, and by area codes 210, 830, and 361 to the north.
Social
Area code 956 is home to a diverse population of people from all walks of life. The area is known for its vibrant culture, with a mix of Mexican, American, and other Latin American influences. The area is also home to a large number of immigrants, both legal and illegal, from Mexico and other Latin American countries.
Economics
Area code 956 is an economically diverse region, with a mix of industries ranging from agriculture to manufacturing to tourism. The area is home to a number of large companies, including the University of Texas at Brownsville, the Port of Brownsville, and the McAllen-Hidalgo-Reynosa International Bridge.
Demographics
Area code 956 is home to a population of over 2.5 million people, with a majority of the population being of Hispanic or Latino origin. The area is also home to a large number of immigrants, both legal and illegal, from Mexico and other Latin American countries. The median household income in the area is $37,000, and the unemployment rate is 8.2%.
Common Questions
What is Per Capita Income in Area Code 956?
Per Capita income in Area Code 956 is $20,907.
What is the Median Family Income in Area Code 956?
Median Family Income in Area Code 956 is $56,664.
What is the Median Household income in Area Code 956?
Median Household Income in Area Code 956 is $46,596.
What is Income or Wage Gap in Area Code 956?
Income or Wage Gap in Area Code 956 is 33.9%.
Women in Area Code 956 earn 66.1 cents for every dollar earned by a man.
What is Family Income Deficit in Area Code 956?
Family Income Deficit in Area Code 956 is $11,482.
Families that are below poverty line in Area Code 956 earn $11,482 less on average than the poverty threshold level.
What is Inequality or Gini Index in Area Code 956?
Inequality or Gini Index in Area Code 956 is 29.98.
What is the Total Population of Area Code 956?
Total Population of Area Code 956 is 1,666,455.
What is the Total Male Population of Area Code 956?
Total Male Population of Area Code 956 is 825,243.
What is the Total Female Population of Area Code 956?
Total Female Population of Area Code 956 is 841,212.
What is the Ratio of Males per 100 Females in Area Code 956?
There are 98.10 Males per 100 Females in Area Code 956.
What is the Ratio of Females per 100 Males in Area Code 956?
There are 101.94 Females per 100 Males in Area Code 956.
What is the Median Population Age in Area Code 956?
Median Population Age in Area Code 956 is 35.0 Years.
What is the Average Family Size in Area Code 956
Average Family Size in Area Code 956 is 3.8 People.
What is the Average Household Size in Area Code 956
Average Household Size in Area Code 956 is 3.2 People.
How Large is the Labor Force in Area Code 956?
There are 644,965 People in the Labor Forcein in Area Code 956.
What is the Percentage of People in the Labor Force in Area Code 956?
53.4% of People are in the Labor Force in Area Code 956.
What is the Unemployment Rate in Area Code 956?
Unemployment Rate in Area Code 956 is 8.0%.