Area Code 512 Map & Demographics
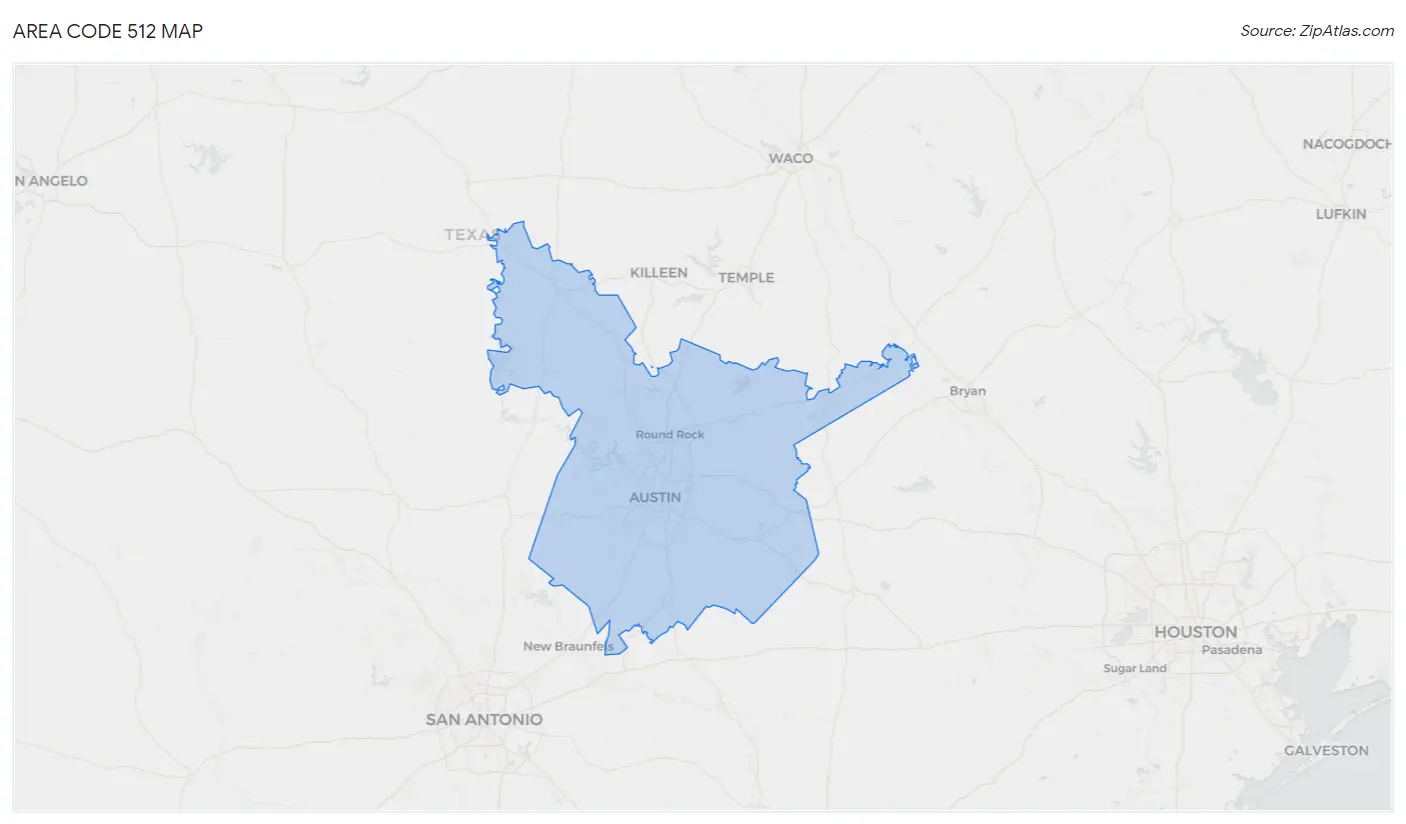
Area Code 512 Map
Area Code 512 Overview
$48,443
PER CAPITA INCOME
$116,099
AVG FAMILY INCOME
$94,281
AVG HOUSEHOLD INCOME
30.5%
WAGE / INCOME GAP [ % ]
69.5¢/ $1
WAGE / INCOME GAP [ $ ]
$10,710
FAMILY INCOME DEFICIT
39.69
INEQUALITY / GINI INDEX
2,356,612
TOTAL POPULATION
1,190,810
MALE POPULATION
1,165,802
FEMALE POPULATION
102.15
MALES / 100 FEMALES
97.90
FEMALES / 100 MALES
38.2
MEDIAN AGE
3.1
AVG FAMILY SIZE
2.6
AVG HOUSEHOLD SIZE
1,272,222
LABOR FORCE [ PEOPLE ]
67.3%
PERCENT IN LABOR FORCE
4.3%
UNEMPLOYMENT RATE
Income in Area Code 512
Income Overview in Area Code 512
Per Capita Income in Area Code 512 is $48,443, while median incomes of families and households are $116,099 and $94,281 respectively.
| Characteristic | Number | Measure |
| Per Capita Income | 2,356,612 | $48,443 |
| Median Family Income | 574,483 | $116,099 |
| Mean Family Income | 574,483 | $13,312,305 |
| Median Household Income | 927,232 | $94,281 |
| Mean Household Income | 927,232 | $11,314,994 |
| Income Deficit | 574,483 | $10,710 |
| Wage / Income Gap (%) | 2,356,612 | 30.55% |
| Wage / Income Gap ($) | 2,356,612 | 69.45¢ per $1 |
| Gini / Inequality Index | 2,356,612 | 39.69 |
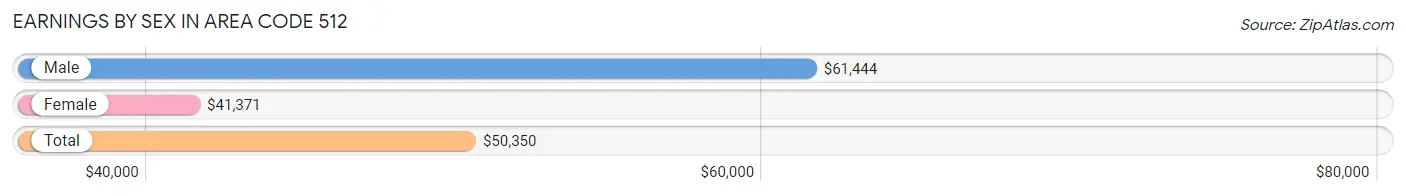
Earnings by Sex in Area Code 512
Average Earnings in Area Code 512 are $50,350, $61,444 for men and $41,371 for women, a difference of 32.7%.
| Sex | Number | Average Earnings |
| Male | 757,894 (54.3%) | $61,444 |
| Female | 638,866 (45.7%) | $41,371 |
| Total | 1,396,760 (100.0%) | $50,350 |
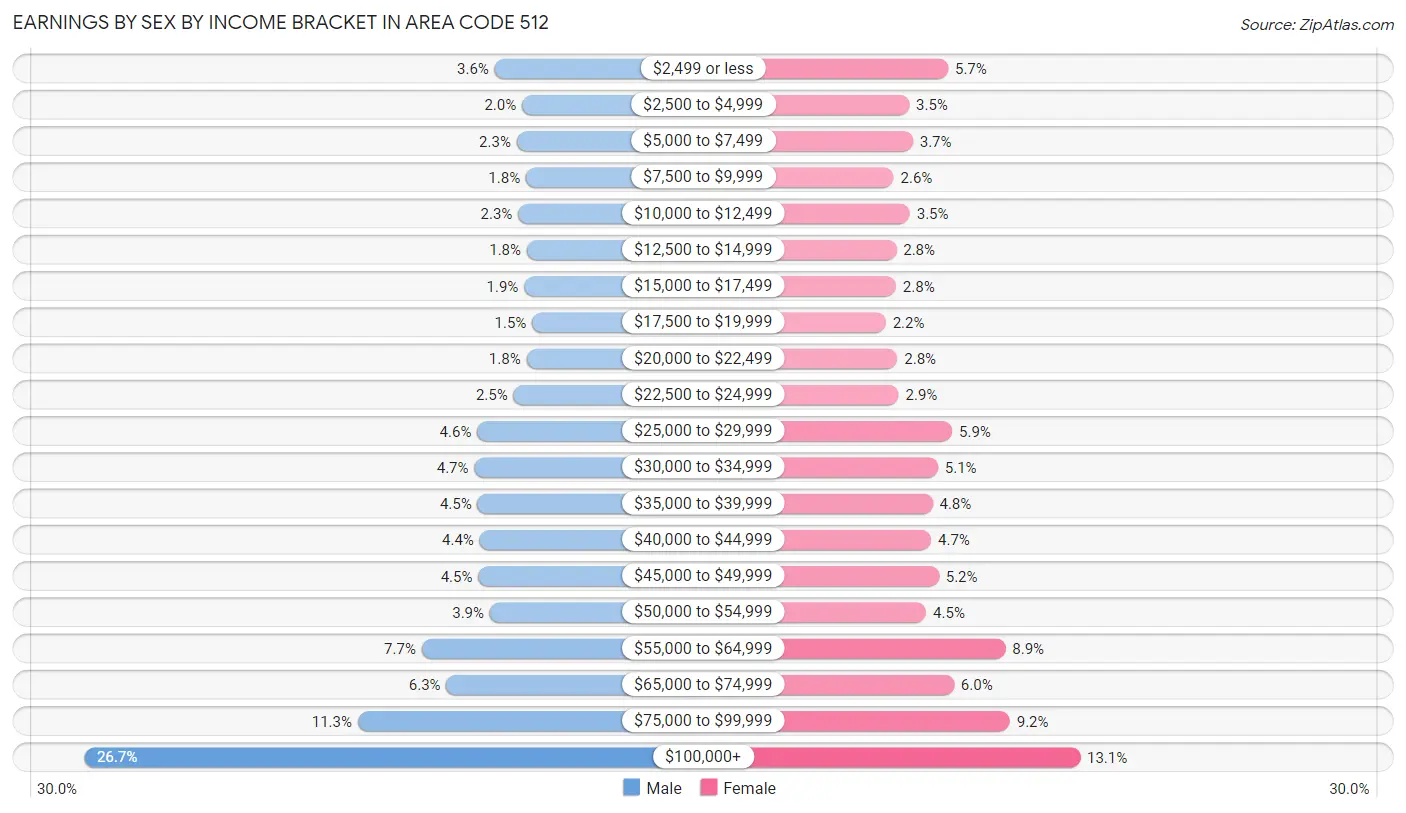
Earnings by Sex by Income Bracket in Area Code 512
The most common earnings brackets in Area Code 512 are $100,000+ for men (202,052 | 26.7%) and $100,000+ for women (83,776 | 13.1%).
| Income | Male | Female |
| $2,499 or less | 27,116 (3.6%) | 36,370 (5.7%) |
| $2,500 to $4,999 | 15,491 (2.0%) | 22,376 (3.5%) |
| $5,000 to $7,499 | 17,745 (2.3%) | 23,719 (3.7%) |
| $7,500 to $9,999 | 13,791 (1.8%) | 16,784 (2.6%) |
| $10,000 to $12,499 | 17,113 (2.3%) | 22,646 (3.5%) |
| $12,500 to $14,999 | 13,418 (1.8%) | 17,738 (2.8%) |
| $15,000 to $17,499 | 14,580 (1.9%) | 17,632 (2.8%) |
| $17,500 to $19,999 | 11,134 (1.5%) | 13,992 (2.2%) |
| $20,000 to $22,499 | 13,547 (1.8%) | 18,159 (2.8%) |
| $22,500 to $24,999 | 19,063 (2.5%) | 18,599 (2.9%) |
| $25,000 to $29,999 | 34,552 (4.6%) | 37,792 (5.9%) |
| $30,000 to $34,999 | 35,802 (4.7%) | 32,738 (5.1%) |
| $35,000 to $39,999 | 34,374 (4.5%) | 30,810 (4.8%) |
| $40,000 to $44,999 | 33,512 (4.4%) | 30,284 (4.7%) |
| $45,000 to $49,999 | 34,089 (4.5%) | 33,045 (5.2%) |
| $50,000 to $54,999 | 29,183 (3.8%) | 28,470 (4.5%) |
| $55,000 to $64,999 | 58,244 (7.7%) | 56,930 (8.9%) |
| $65,000 to $74,999 | 47,675 (6.3%) | 38,475 (6.0%) |
| $75,000 to $99,999 | 85,413 (11.3%) | 58,531 (9.2%) |
| $100,000+ | 202,052 (26.7%) | 83,776 (13.1%) |
| Total | 757,894 (100.0%) | 638,866 (100.0%) |
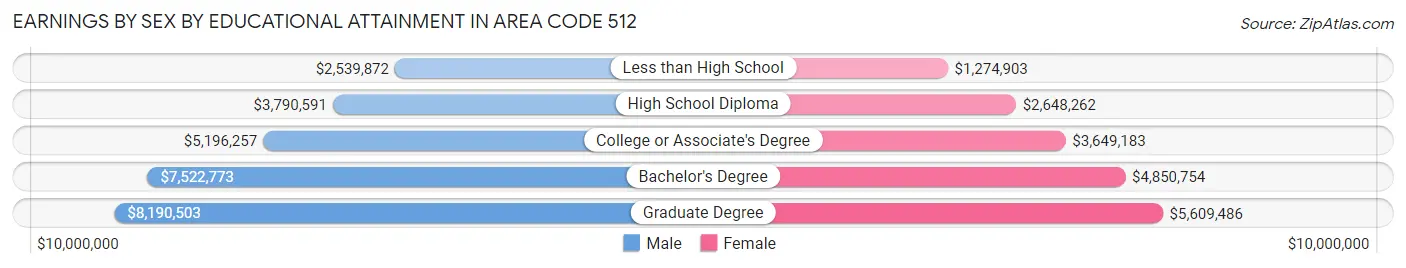
Earnings by Sex by Educational Attainment in Area Code 512
Average earnings in Area Code 512 are $6,354,108 for men and $4,321,773 for women, a difference of 32.0%. Men with an educational attainment of graduate degree enjoy the highest average annual earnings of $8,190,503, while those with less than high school education earn the least with $2,539,872. Women with an educational attainment of graduate degree earn the most with the average annual earnings of $5,609,486, while those with less than high school education have the smallest earnings of $1,274,903.
| Educational Attainment | Male Income | Female Income |
| Less than High School | $2,539,872 | $1,274,903 |
| High School Diploma | $3,790,591 | $2,648,262 |
| College or Associate's Degree | $5,196,257 | $3,649,183 |
| Bachelor's Degree | $7,522,773 | $4,850,754 |
| Graduate Degree | $8,190,503 | $5,609,486 |
| Total | $6,354,108 | $4,321,773 |
Family Income in Area Code 512
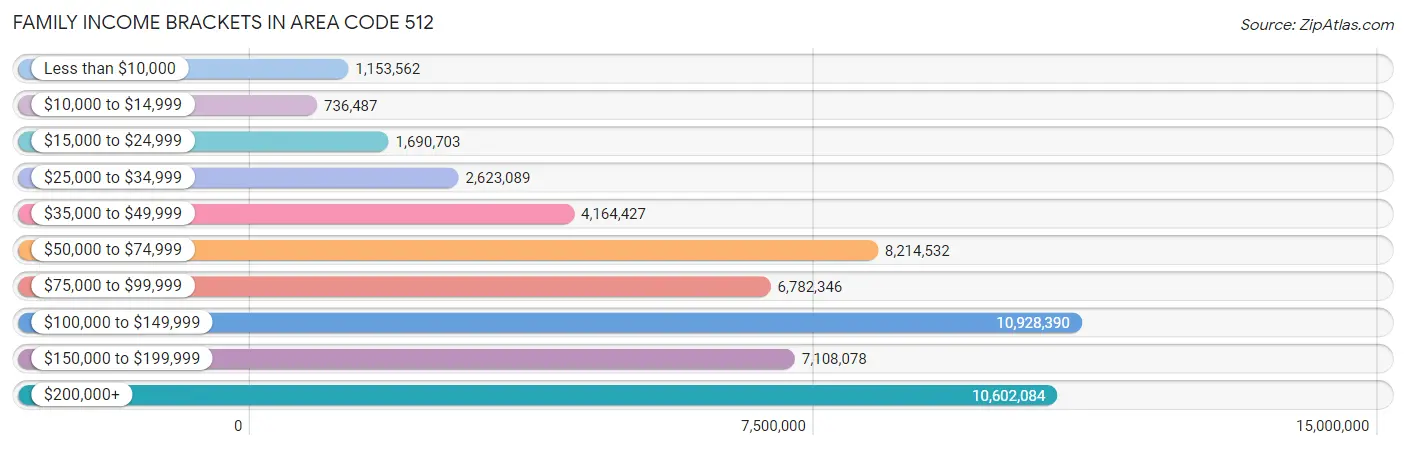
Family Income Brackets in Area Code 512
According to the Area Code 512 family income data, there are 10,928,390 families falling into the $100,000 to $149,999 income range, which is the most common income bracket and makes up 1,902.3% of all families. Conversely, the $10,000 to $14,999 income bracket is the least frequent group with only 736,487 families (128.2%) belonging to this category.
| Income Bracket | # Families | % Families |
| Less than $10,000 | 1,153,562 | 200.8% |
| $10,000 to $14,999 | 736,487 | 128.2% |
| $15,000 to $24,999 | 1,690,703 | 294.3% |
| $25,000 to $34,999 | 2,623,089 | 456.6% |
| $35,000 to $49,999 | 4,164,427 | 724.9% |
| $50,000 to $74,999 | 8,214,532 | 1,429.9% |
| $75,000 to $99,999 | 6,782,346 | 1,180.6% |
| $100,000 to $149,999 | 10,928,390 | 1,902.3% |
| $150,000 to $199,999 | 7,108,078 | 1,237.3% |
| $200,000+ | 10,602,084 | 1,845.5% |
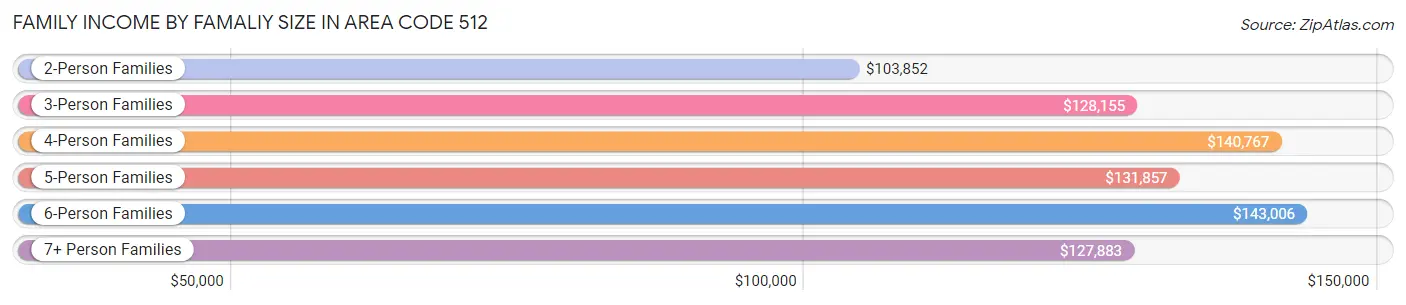
Family Income by Famaliy Size in Area Code 512
6-person families (18,910 | 3.3%) account for the highest median family income in Area Code 512 with $143,006 per family, while 2-person families (252,016 | 43.9%) have the highest median income of $51,926 per family member.
| Income Bracket | # Families | Median Income |
| 2-Person Families | 252,016 (43.9%) | $103,852 |
| 3-Person Families | 131,125 (22.8%) | $128,155 |
| 4-Person Families | 113,356 (19.7%) | $140,767 |
| 5-Person Families | 49,870 (8.7%) | $131,857 |
| 6-Person Families | 18,910 (3.3%) | $143,006 |
| 7+ Person Families | 9,206 (1.6%) | $127,883 |
| Total | 574,483 (100.0%) | $116,099 |
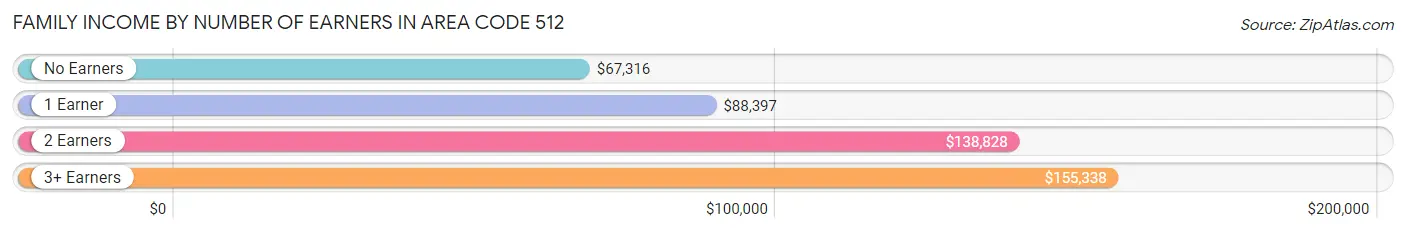
Family Income by Number of Earners in Area Code 512
The median family income in Area Code 512 is $116,099, with families comprising 3+ earners (65,837) having the highest median family income of $155,338, while families with no earners (56,528) have the lowest median family income of $67,316, accounting for 11.5% and 9.8% of families, respectively.
| Number of Earners | # Families | Median Income |
| No Earners | 56,528 (9.8%) | $67,316 |
| 1 Earner | 174,439 (30.4%) | $88,397 |
| 2 Earners | 277,679 (48.3%) | $138,828 |
| 3+ Earners | 65,837 (11.5%) | $155,338 |
| Total | 574,483 (100.0%) | $116,099 |
Household Income in Area Code 512
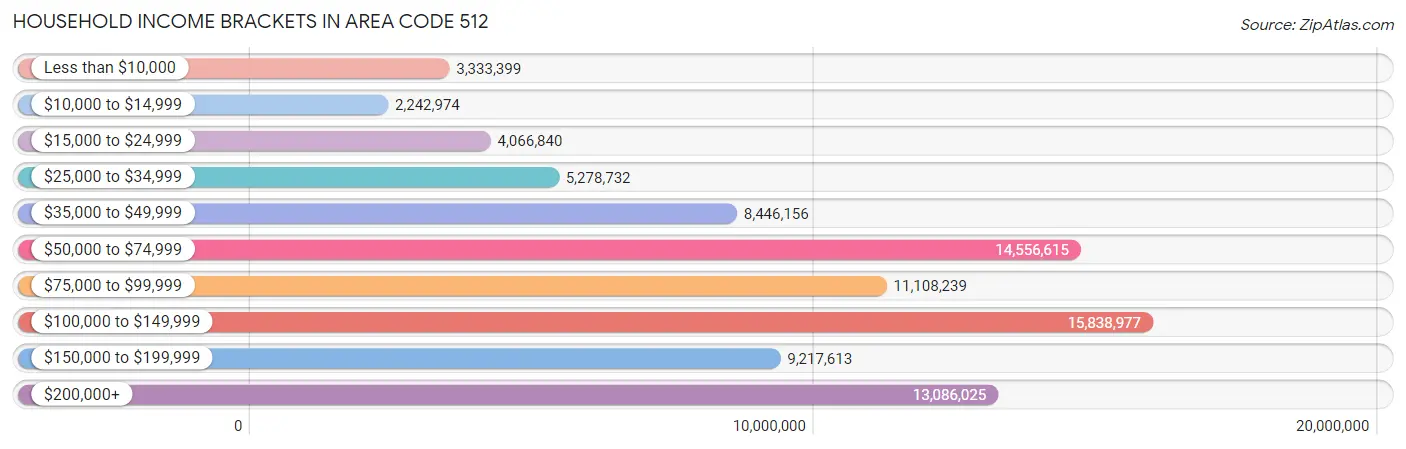
Household Income Brackets in Area Code 512
With 15,838,977 households falling in the category, the $100,000 to $149,999 income range is the most frequent in Area Code 512, accounting for 1,708.2% of all households. In contrast, only 2,242,974 households (241.9%) fall into the $10,000 to $14,999 income bracket, making it the least populous group.
| Income Bracket | # Households | % Households |
| Less than $10,000 | 3,333,399 | 359.5% |
| $10,000 to $14,999 | 2,242,974 | 241.9% |
| $15,000 to $24,999 | 4,066,840 | 438.6% |
| $25,000 to $34,999 | 5,278,732 | 569.3% |
| $35,000 to $49,999 | 8,446,156 | 910.9% |
| $50,000 to $74,999 | 14,556,615 | 1,569.9% |
| $75,000 to $99,999 | 11,108,239 | 1,198.0% |
| $100,000 to $149,999 | 15,838,977 | 1,708.2% |
| $150,000 to $199,999 | 9,217,613 | 994.1% |
| $200,000+ | 13,086,025 | 1,411.3% |
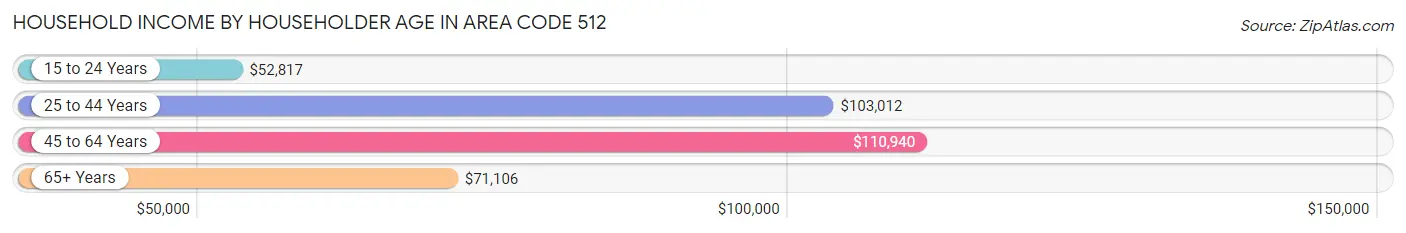
Household Income by Householder Age in Area Code 512
The median household income in Area Code 512 is $94,281, with the highest median household income of $110,940 found in the 45 to 64 years age bracket for the primary householder. A total of 314,044 households (33.9%) fall into this category. Meanwhile, the 15 to 24 years age bracket for the primary householder has the lowest median household income of $52,817, with 51,698 households (5.6%) in this group.
| Income Bracket | # Households | Median Income |
| 15 to 24 Years | 51,698 (5.6%) | $52,817 |
| 25 to 44 Years | 398,108 (42.9%) | $103,012 |
| 45 to 64 Years | 314,044 (33.9%) | $110,940 |
| 65+ Years | 163,382 (17.6%) | $71,106 |
| Total | 927,232 (100.0%) | $94,281 |
Poverty in Area Code 512
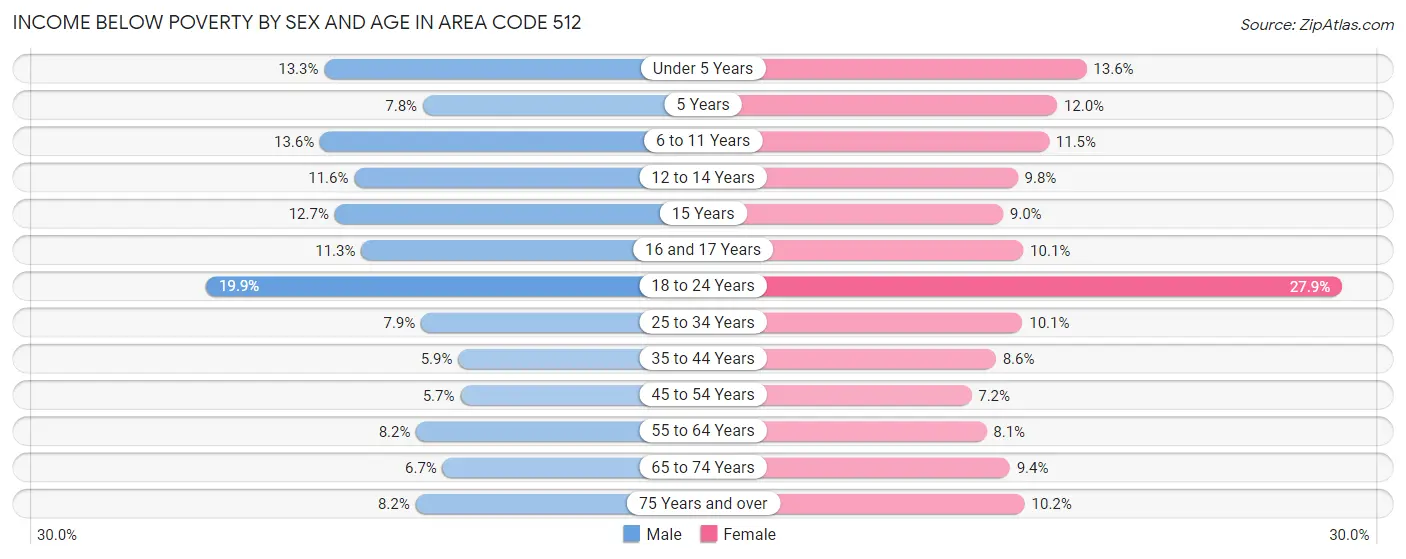
Income Below Poverty by Sex and Age in Area Code 512
With 9.4% poverty level for males and 11.1% for females among the residents of Area Code 512, 18 to 24 year old males and 18 to 24 year old females are the most vulnerable to poverty, with 20,934 males (19.9%) and 28,037 females (27.9%) in their respective age groups living below the poverty level.
| Age Bracket | Male | Female |
| Under 5 Years | 9,265 (13.3%) | 9,162 (13.6%) |
| 5 Years | 1,123 (7.8%) | 1,454 (12.0%) |
| 6 to 11 Years | 12,085 (13.6%) | 9,981 (11.5%) |
| 12 to 14 Years | 5,330 (11.6%) | 4,314 (9.8%) |
| 15 Years | 1,941 (12.7%) | 1,339 (9.0%) |
| 16 and 17 Years | 3,357 (11.3%) | 2,871 (10.1%) |
| 18 to 24 Years | 20,934 (19.9%) | 28,037 (27.9%) |
| 25 to 34 Years | 16,096 (7.9%) | 19,218 (10.1%) |
| 35 to 44 Years | 11,312 (5.9%) | 15,421 (8.6%) |
| 45 to 54 Years | 8,993 (5.7%) | 10,546 (7.2%) |
| 55 to 64 Years | 10,162 (8.2%) | 10,097 (8.1%) |
| 65 to 74 Years | 5,443 (6.7%) | 8,571 (9.3%) |
| 75 Years and over | 3,377 (8.2%) | 5,551 (10.2%) |
| Total | 109,418 (9.4%) | 126,562 (11.1%) |
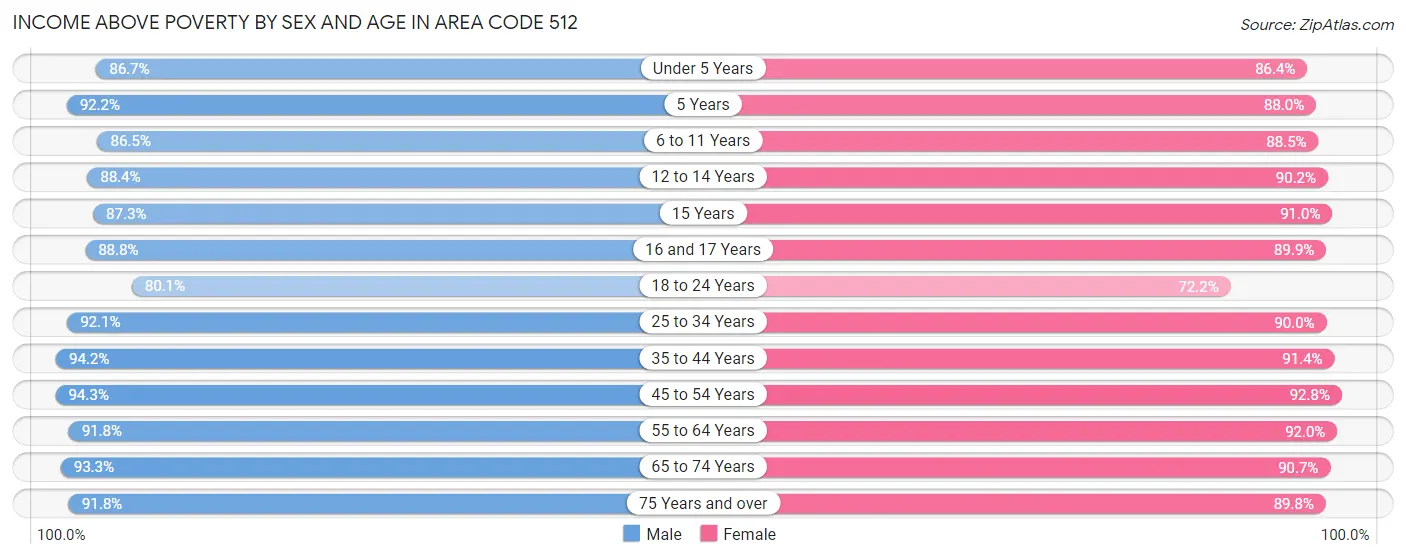
Income Above Poverty by Sex and Age in Area Code 512
According to the poverty statistics in Area Code 512, males aged 45 to 54 years and females aged 45 to 54 years are the age groups that are most secure financially, with 94.3% of males and 92.8% of females in these age groups living above the poverty line.
| Age Bracket | Male | Female |
| Under 5 Years | 60,354 (86.7%) | 58,100 (86.4%) |
| 5 Years | 13,233 (92.2%) | 10,685 (88.0%) |
| 6 to 11 Years | 77,075 (86.5%) | 76,575 (88.5%) |
| 12 to 14 Years | 40,447 (88.4%) | 39,754 (90.2%) |
| 15 Years | 13,304 (87.3%) | 13,595 (91.0%) |
| 16 and 17 Years | 26,481 (88.7%) | 25,565 (89.9%) |
| 18 to 24 Years | 84,257 (80.1%) | 72,617 (72.2%) |
| 25 to 34 Years | 187,123 (92.1%) | 171,988 (89.9%) |
| 35 to 44 Years | 182,208 (94.2%) | 164,504 (91.4%) |
| 45 to 54 Years | 147,606 (94.3%) | 135,800 (92.8%) |
| 55 to 64 Years | 113,894 (91.8%) | 115,274 (91.9%) |
| 65 to 74 Years | 75,556 (93.3%) | 83,069 (90.6%) |
| 75 Years and over | 37,651 (91.8%) | 48,963 (89.8%) |
| Total | 1,059,189 (90.6%) | 1,016,489 (88.9%) |
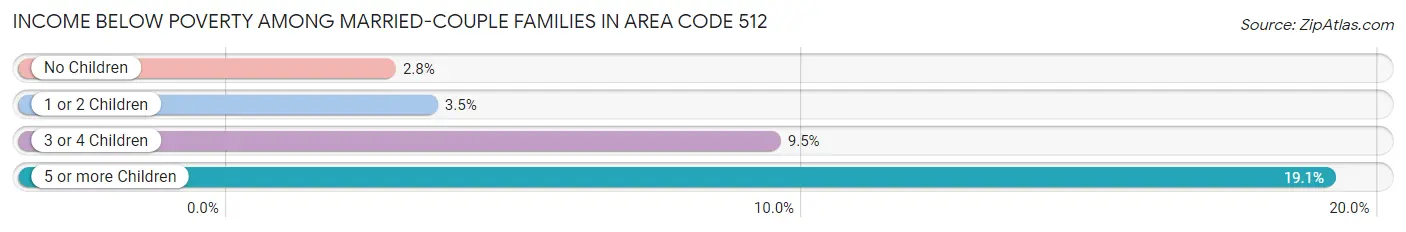
Income Below Poverty Among Married-Couple Families in Area Code 512
The poverty statistics for married-couple families in Area Code 512 show that 3.7% or 16,598 of the total 446,323 families live below the poverty line. Families with 5 or more children have the highest poverty rate of 19.1%, comprising of 497 families. On the other hand, families with no children have the lowest poverty rate of 2.8%, which includes 6,419 families.
| Children | Above Poverty | Below Poverty |
| No Children | 226,943 (97.3%) | 6,419 (2.8%) |
| 1 or 2 Children | 164,781 (96.5%) | 5,934 (3.5%) |
| 3 or 4 Children | 35,897 (90.5%) | 3,748 (9.5%) |
| 5 or more Children | 2,104 (80.9%) | 497 (19.1%) |
| Total | 429,725 (96.3%) | 16,598 (3.7%) |
Income Below Poverty Among Single-Parent Households in Area Code 512
According to the poverty data in Area Code 512, 9.7% or 3,773 single-father households and 20.4% or 18,239 single-mother households are living below the poverty line. Among single-father households, those with 3 or 4 children have the highest poverty rate, with 455 households (14.4%) experiencing poverty. Likewise, among single-mother households, those with 5 or more children have the highest poverty rate, with 418 households (48.7%) falling below the poverty line.
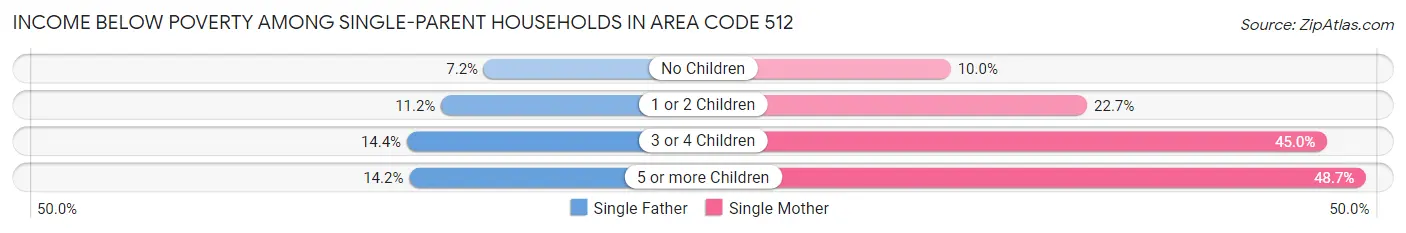
| Children | Single Father | Single Mother |
| No Children | 1,224 (7.2%) | 3,424 (10.0%) |
| 1 or 2 Children | 2,056 (11.2%) | 10,154 (22.7%) |
| 3 or 4 Children | 455 (14.4%) | 4,243 (45.0%) |
| 5 or more Children | 38 (14.2%) | 418 (48.7%) |
| Total | 3,773 (9.7%) | 18,239 (20.4%) |
Income Below Poverty Among Married-Couple vs Single-Parent Households in Area Code 512
The poverty data for Area Code 512 shows that 16,598 of the married-couple family households (3.7%) and 22,012 of the single-parent households (17.2%) are living below the poverty level. Within the married-couple family households, those with 5 or more children have the highest poverty rate, with 497 households (19.1%) falling below the poverty line. Among the single-parent households, those with 5 or more children have the highest poverty rate, with 456 household (40.5%) living below poverty.
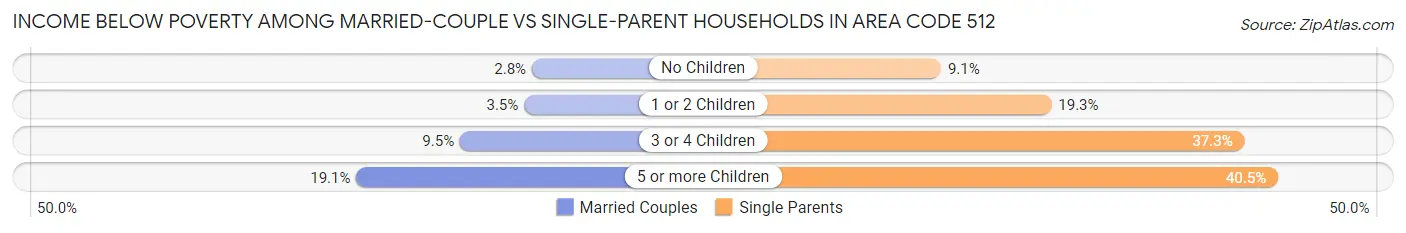
| Children | Married-Couple Families | Single-Parent Households |
| No Children | 6,419 (2.8%) | 4,648 (9.1%) |
| 1 or 2 Children | 5,934 (3.5%) | 12,210 (19.3%) |
| 3 or 4 Children | 3,748 (9.5%) | 4,698 (37.3%) |
| 5 or more Children | 497 (19.1%) | 456 (40.5%) |
| Total | 16,598 (3.7%) | 22,012 (17.2%) |
Race in Area Code 512
The most populous races in Area Code 512 are White / Caucasian (1,542,570 | 65.5%), Hispanic or Latino (764,951 | 32.5%), and Two or more Races (305,808 | 13.0%).
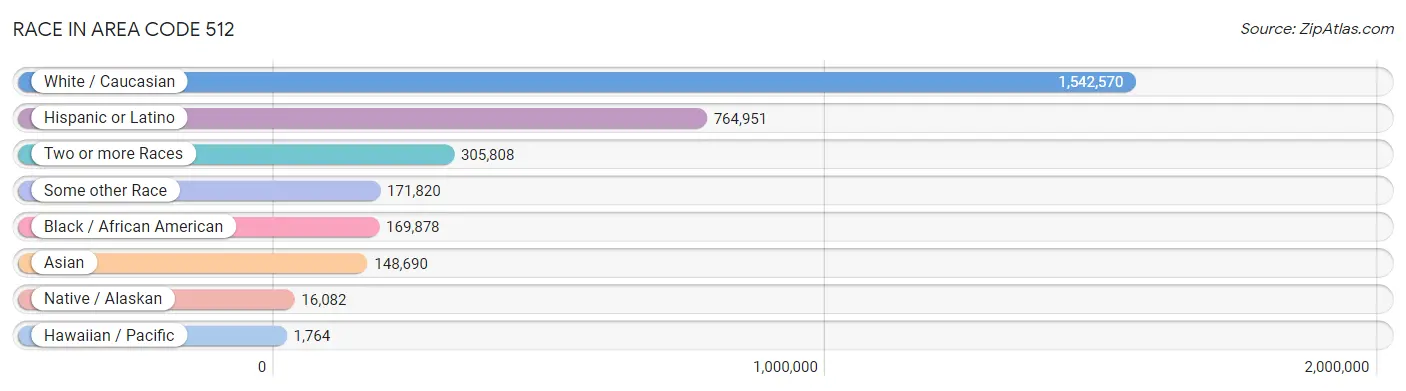
| Race | # Population | % Population |
| Asian | 148,690 | 6.3% |
| Black / African American | 169,878 | 7.2% |
| Hawaiian / Pacific | 1,764 | 0.1% |
| Hispanic or Latino | 764,951 | 32.5% |
| Native / Alaskan | 16,082 | 0.7% |
| White / Caucasian | 1,542,570 | 65.5% |
| Two or more Races | 305,808 | 13.0% |
| Some other Race | 171,820 | 7.3% |
| Total | 2,356,612 | 100.0% |
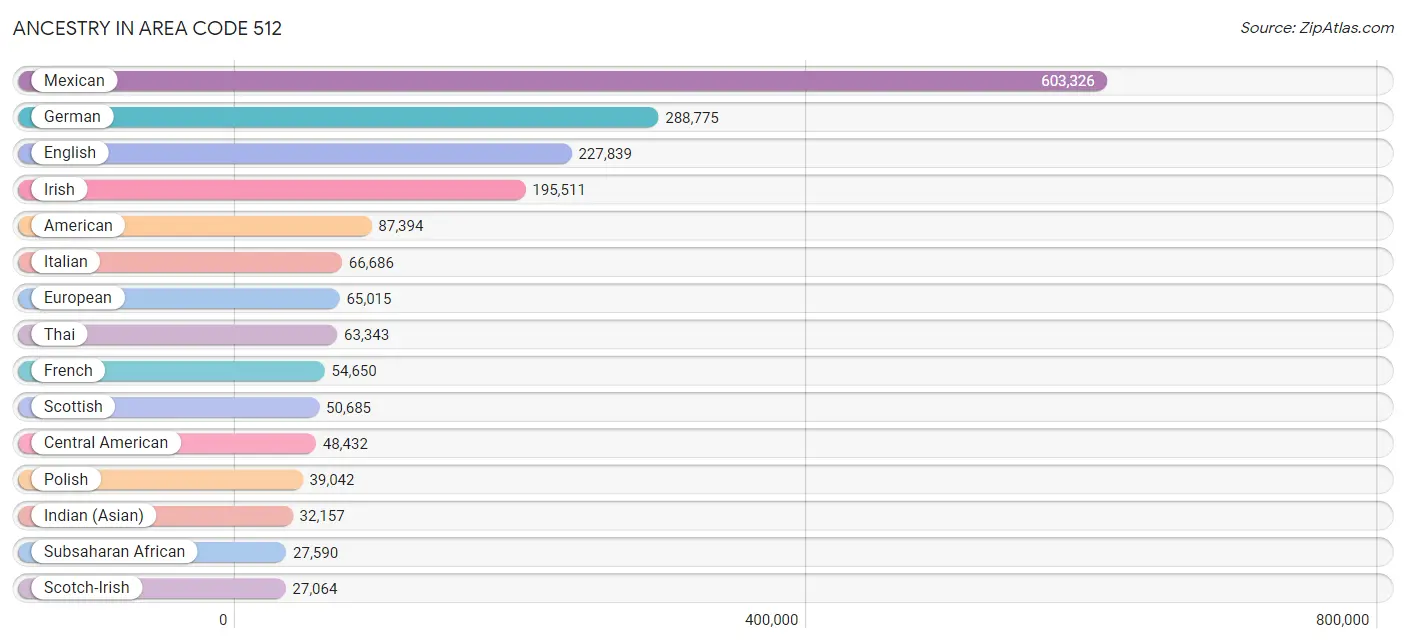
Ancestry in Area Code 512
The most populous ancestries reported in Area Code 512 are Mexican (603,326 | 25.6%), German (288,775 | 12.2%), English (227,839 | 9.7%), Irish (195,511 | 8.3%), and American (87,394 | 3.7%), together accounting for 59.5% of all Area Code 512 residents.
| Ancestry | # Population | % Population |
| Afghan | 2,255 | 0.1% |
| African | 13,378 | 0.6% |
| Alaska Native | 303 | 0.0% |
| Alaskan Athabascan | 5 | 0.0% |
| Albanian | 451 | 0.0% |
| Aleut | 16 | 0.0% |
| Alsatian | 381 | 0.0% |
| American | 87,394 | 3.7% |
| Apache | 2,393 | 0.1% |
| Arab | 19,852 | 0.8% |
| Argentinean | 1,388 | 0.1% |
| Armenian | 1,071 | 0.1% |
| Assyrian / Chaldean / Syriac | 133 | 0.0% |
| Australian | 1,071 | 0.1% |
| Austrian | 4,176 | 0.2% |
| Bahamian | 275 | 0.0% |
| Bangladeshi | 315 | 0.0% |
| Barbadian | 365 | 0.0% |
| Basque | 327 | 0.0% |
| Belgian | 2,699 | 0.1% |
| Belizean | 511 | 0.0% |
| Bhutanese | 11,033 | 0.5% |
| Blackfeet | 1,043 | 0.0% |
| Bolivian | 1,261 | 0.1% |
| Brazilian | 2,589 | 0.1% |
| British | 19,566 | 0.8% |
| British West Indian | 98 | 0.0% |
| Bulgarian | 249 | 0.0% |
| Burmese | 15,076 | 0.6% |
| Cajun | 1,413 | 0.1% |
| Cambodian | 285 | 0.0% |
| Canadian | 3,886 | 0.2% |
| Cape Verdean | 64 | 0.0% |
| Carpatho Rusyn | 26 | 0.0% |
| Celtic | 532 | 0.0% |
| Central American | 48,432 | 2.1% |
| Central American Indian | 3,405 | 0.1% |
| Cherokee | 7,856 | 0.3% |
| Cheyenne | 113 | 0.0% |
| Chickasaw | 462 | 0.0% |
| Chilean | 1,372 | 0.1% |
| Chinese | 150 | 0.0% |
| Chippewa | 132 | 0.0% |
| Choctaw | 2,260 | 0.1% |
| Colombian | 7,283 | 0.3% |
| Comanche | 700 | 0.0% |
| Costa Rican | 1,394 | 0.1% |
| Cree | 61 | 0.0% |
| Creek | 490 | 0.0% |
| Croatian | 1,329 | 0.1% |
| Crow | 77 | 0.0% |
| Cuban | 12,613 | 0.5% |
| Cypriot | 61 | 0.0% |
| Czech | 24,162 | 1.0% |
| Czechoslovakian | 2,484 | 0.1% |
| Danish | 7,572 | 0.3% |
| Delaware | 111 | 0.0% |
| Dominican | 2,772 | 0.1% |
| Dutch | 17,039 | 0.7% |
| Dutch West Indian | 189 | 0.0% |
| Eastern European | 6,684 | 0.3% |
| Ecuadorian | 2,249 | 0.1% |
| Egyptian | 1,002 | 0.0% |
| English | 227,839 | 9.7% |
| Estonian | 274 | 0.0% |
| Ethiopian | 2,402 | 0.1% |
| European | 65,015 | 2.8% |
| Filipino | 3,243 | 0.1% |
| Finnish | 2,120 | 0.1% |
| French | 54,650 | 2.3% |
| French American Indian | 193 | 0.0% |
| French Canadian | 7,074 | 0.3% |
| German | 288,775 | 12.2% |
| German Russian | 230 | 0.0% |
| Ghanaian | 855 | 0.0% |
| Greek | 6,268 | 0.3% |
| Guamanian / Chamorro | 1,825 | 0.1% |
| Guatemalan | 9,863 | 0.4% |
| Guyanese | 335 | 0.0% |
| Haitian | 565 | 0.0% |
| Hmong | 11 | 0.0% |
| Honduran | 15,647 | 0.7% |
| Hopi | 31 | 0.0% |
| Hungarian | 5,606 | 0.2% |
| Icelander | 347 | 0.0% |
| Indian (Asian) | 32,157 | 1.4% |
| Indonesian | 952 | 0.0% |
| Inupiat | 107 | 0.0% |
| Iranian | 3,788 | 0.2% |
| Iraqi | 2,043 | 0.1% |
| Irish | 195,511 | 8.3% |
| Iroquois | 206 | 0.0% |
| Israeli | 811 | 0.0% |
| Italian | 66,686 | 2.8% |
| Jamaican | 2,303 | 0.1% |
| Japanese | 1,287 | 0.1% |
| Jordanian | 1,596 | 0.1% |
| Kenyan | 299 | 0.0% |
| Kiowa | 111 | 0.0% |
| Korean | 19,992 | 0.9% |
| Laotian | 1,023 | 0.0% |
| Latvian | 414 | 0.0% |
| Lebanese | 5,452 | 0.2% |
| Liberian | 157 | 0.0% |
| Lithuanian | 2,370 | 0.1% |
| Lumbee | 51 | 0.0% |
| Luxembourger | 201 | 0.0% |
| Macedonian | 128 | 0.0% |
| Malaysian | 602 | 0.0% |
| Maltese | 269 | 0.0% |
| Menominee | 17 | 0.0% |
| Mexican | 603,326 | 25.6% |
| Mexican American Indian | 7,562 | 0.3% |
| Mongolian | 684 | 0.0% |
| Moroccan | 732 | 0.0% |
| Native Hawaiian | 2,286 | 0.1% |
| Navajo | 603 | 0.0% |
| New Zealander | 209 | 0.0% |
| Nicaraguan | 3,617 | 0.2% |
| Nigerian | 5,917 | 0.3% |
| Northern European | 4,987 | 0.2% |
| Norwegian | 19,786 | 0.8% |
| Okinawan | 118 | 0.0% |
| Osage | 184 | 0.0% |
| Ottawa | 60 | 0.0% |
| Paiute | 123 | 0.0% |
| Pakistani | 2,937 | 0.1% |
| Palestinian | 973 | 0.0% |
| Panamanian | 3,091 | 0.1% |
| Paraguayan | 192 | 0.0% |
| Pennsylvania German | 337 | 0.0% |
| Peruvian | 3,425 | 0.2% |
| Pima | 15 | 0.0% |
| Polish | 39,042 | 1.7% |
| Portuguese | 5,471 | 0.2% |
| Potawatomi | 258 | 0.0% |
| Pueblo | 290 | 0.0% |
| Puerto Rican | 25,184 | 1.1% |
| Romanian | 2,269 | 0.1% |
| Russian | 13,806 | 0.6% |
| Salvadoran | 14,674 | 0.6% |
| Samoan | 836 | 0.0% |
| Scandinavian | 6,856 | 0.3% |
| Scotch-Irish | 27,064 | 1.1% |
| Scottish | 50,685 | 2.1% |
| Seminole | 397 | 0.0% |
| Senegalese | 117 | 0.0% |
| Serbian | 955 | 0.0% |
| Shoshone | 35 | 0.0% |
| Sierra Leonean | 13 | 0.0% |
| Sioux | 824 | 0.0% |
| Slavic | 487 | 0.0% |
| Slovak | 1,418 | 0.1% |
| Slovene | 1,469 | 0.1% |
| Somali | 122 | 0.0% |
| South African | 902 | 0.0% |
| South American | 22,726 | 1.0% |
| South American Indian | 493 | 0.0% |
| Soviet Union | 11 | 0.0% |
| Spaniard | 11,818 | 0.5% |
| Spanish | 9,337 | 0.4% |
| Spanish American | 84 | 0.0% |
| Spanish American Indian | 61 | 0.0% |
| Sri Lankan | 21,705 | 0.9% |
| Subsaharan African | 27,590 | 1.2% |
| Sudanese | 114 | 0.0% |
| Swedish | 23,619 | 1.0% |
| Swiss | 5,707 | 0.2% |
| Syrian | 2,194 | 0.1% |
| Taiwanese | 7 | 0.0% |
| Thai | 63,343 | 2.7% |
| Tlingit-Haida | 47 | 0.0% |
| Tohono O'Odham | 4 | 0.0% |
| Tongan | 104 | 0.0% |
| Trinidadian and Tobagonian | 533 | 0.0% |
| Turkish | 2,700 | 0.1% |
| U.S. Virgin Islander | 54 | 0.0% |
| Ugandan | 49 | 0.0% |
| Ukrainian | 4,314 | 0.2% |
| Uruguayan | 175 | 0.0% |
| Ute | 15 | 0.0% |
| Venezuelan | 5,243 | 0.2% |
| Vietnamese | 1,021 | 0.0% |
| Welsh | 14,300 | 0.6% |
| West Indian | 858 | 0.0% |
| Yakama | 15 | 0.0% |
| Yaqui | 558 | 0.0% |
| Yugoslavian | 859 | 0.0% |
| Yuman | 19 | 0.0% |
| Zimbabwean | 27 | 0.0% | View All 190 Rows |
Immigrants in Area Code 512
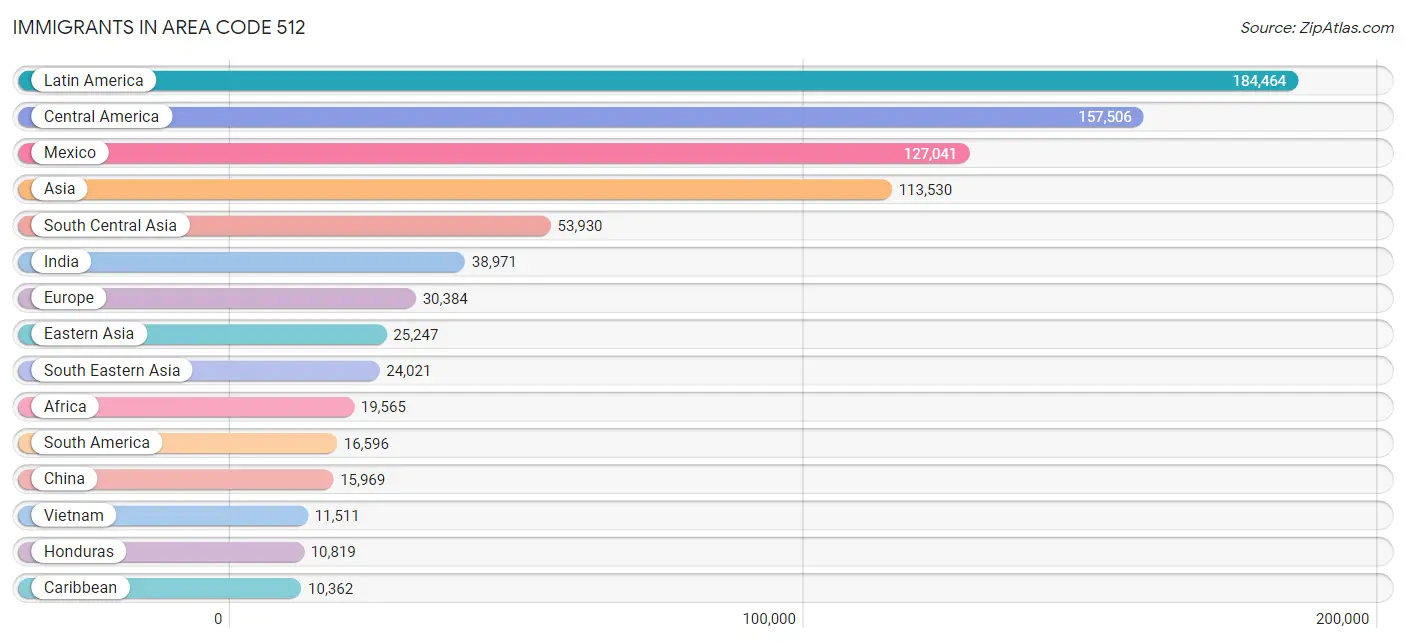
The most numerous immigrant groups reported in Area Code 512 came from Latin America (184,464 | 7.8%), Central America (157,506 | 6.7%), Mexico (127,041 | 5.4%), Asia (113,530 | 4.8%), and South Central Asia (53,930 | 2.3%), together accounting for 27.0% of all Area Code 512 residents.
| Immigration Origin | # Population | % Population |
| Afghanistan | 2,415 | 0.1% |
| Africa | 19,565 | 0.8% |
| Albania | 210 | 0.0% |
| Argentina | 669 | 0.0% |
| Armenia | 170 | 0.0% |
| Asia | 113,530 | 4.8% |
| Australia | 1,078 | 0.1% |
| Austria | 150 | 0.0% |
| Bahamas | 145 | 0.0% |
| Bangladesh | 1,406 | 0.1% |
| Barbados | 132 | 0.0% |
| Belarus | 164 | 0.0% |
| Belgium | 248 | 0.0% |
| Belize | 480 | 0.0% |
| Bolivia | 510 | 0.0% |
| Bosnia and Herzegovina | 381 | 0.0% |
| Brazil | 3,084 | 0.1% |
| Bulgaria | 90 | 0.0% |
| Cambodia | 856 | 0.0% |
| Cameroon | 509 | 0.0% |
| Canada | 7,018 | 0.3% |
| Caribbean | 10,362 | 0.4% |
| Central America | 157,506 | 6.7% |
| Chile | 1,041 | 0.0% |
| China | 15,969 | 0.7% |
| Colombia | 3,726 | 0.2% |
| Congo | 391 | 0.0% |
| Costa Rica | 709 | 0.0% |
| Croatia | 112 | 0.0% |
| Cuba | 6,957 | 0.3% |
| Czechoslovakia | 360 | 0.0% |
| Denmark | 46 | 0.0% |
| Dominica | 98 | 0.0% |
| Dominican Republic | 1,230 | 0.1% |
| Eastern Africa | 5,755 | 0.2% |
| Eastern Asia | 25,247 | 1.1% |
| Eastern Europe | 9,467 | 0.4% |
| Ecuador | 934 | 0.0% |
| Egypt | 458 | 0.0% |
| El Salvador | 8,772 | 0.4% |
| England | 2,847 | 0.1% |
| Eritrea | 498 | 0.0% |
| Ethiopia | 2,299 | 0.1% |
| Europe | 30,384 | 1.3% |
| France | 1,931 | 0.1% |
| Germany | 5,433 | 0.2% |
| Ghana | 1,019 | 0.0% |
| Greece | 377 | 0.0% |
| Grenada | 19 | 0.0% |
| Guatemala | 6,708 | 0.3% |
| Guyana | 191 | 0.0% |
| Haiti | 347 | 0.0% |
| Honduras | 10,819 | 0.5% |
| Hong Kong | 1,075 | 0.1% |
| Hungary | 566 | 0.0% |
| India | 38,971 | 1.7% |
| Indonesia | 837 | 0.0% |
| Iran | 3,215 | 0.1% |
| Iraq | 3,236 | 0.1% |
| Ireland | 1,097 | 0.1% |
| Israel | 637 | 0.0% |
| Italy | 645 | 0.0% |
| Jamaica | 548 | 0.0% |
| Japan | 1,815 | 0.1% |
| Jordan | 619 | 0.0% |
| Kazakhstan | 594 | 0.0% |
| Kenya | 963 | 0.0% |
| Korea | 7,365 | 0.3% |
| Kuwait | 226 | 0.0% |
| Laos | 274 | 0.0% |
| Latin America | 184,464 | 7.8% |
| Latvia | 23 | 0.0% |
| Lebanon | 1,041 | 0.0% |
| Liberia | 190 | 0.0% |
| Lithuania | 209 | 0.0% |
| Malaysia | 1,124 | 0.1% |
| Mexico | 127,041 | 5.4% |
| Micronesia | 8 | 0.0% |
| Middle Africa | 1,188 | 0.1% |
| Moldova | 284 | 0.0% |
| Morocco | 820 | 0.0% |
| Nepal | 3,281 | 0.1% |
| Netherlands | 875 | 0.0% |
| Nicaragua | 1,965 | 0.1% |
| Nigeria | 4,584 | 0.2% |
| North Macedonia | 39 | 0.0% |
| Northern Africa | 3,275 | 0.1% |
| Northern Europe | 8,962 | 0.4% |
| Norway | 183 | 0.0% |
| Oceania | 1,713 | 0.1% |
| Pakistan | 3,093 | 0.1% |
| Panama | 766 | 0.0% |
| Peru | 1,810 | 0.1% |
| Philippines | 6,629 | 0.3% |
| Poland | 1,530 | 0.1% |
| Portugal | 253 | 0.0% |
| Romania | 774 | 0.0% |
| Russia | 2,430 | 0.1% |
| Saudi Arabia | 508 | 0.0% |
| Scotland | 856 | 0.0% |
| Senegal | 270 | 0.0% |
| Serbia | 312 | 0.0% |
| Sierra Leone | 115 | 0.0% |
| Singapore | 368 | 0.0% |
| Somalia | 38 | 0.0% |
| South Africa | 1,026 | 0.0% |
| South America | 16,596 | 0.7% |
| South Central Asia | 53,930 | 2.3% |
| South Eastern Asia | 24,021 | 1.0% |
| Southern Europe | 2,793 | 0.1% |
| Spain | 1,372 | 0.1% |
| Sri Lanka | 490 | 0.0% |
| Sudan | 339 | 0.0% |
| Sweden | 416 | 0.0% |
| Switzerland | 463 | 0.0% |
| Syria | 934 | 0.0% |
| Taiwan | 3,413 | 0.1% |
| Thailand | 1,716 | 0.1% |
| Trinidad and Tobago | 694 | 0.0% |
| Turkey | 1,950 | 0.1% |
| Uganda | 502 | 0.0% |
| Ukraine | 1,605 | 0.1% |
| Uruguay | 525 | 0.0% |
| Uzbekistan | 240 | 0.0% |
| Venezuela | 4,035 | 0.2% |
| Vietnam | 11,511 | 0.5% |
| West Indies | 90 | 0.0% |
| Western Africa | 7,379 | 0.3% |
| Western Asia | 10,184 | 0.4% |
| Western Europe | 9,132 | 0.4% |
| Yemen | 123 | 0.0% |
| Zaire | 240 | 0.0% |
| Zimbabwe | 167 | 0.0% | View All 133 Rows |
Sex and Age in Area Code 512
Sex and Age in Area Code 512
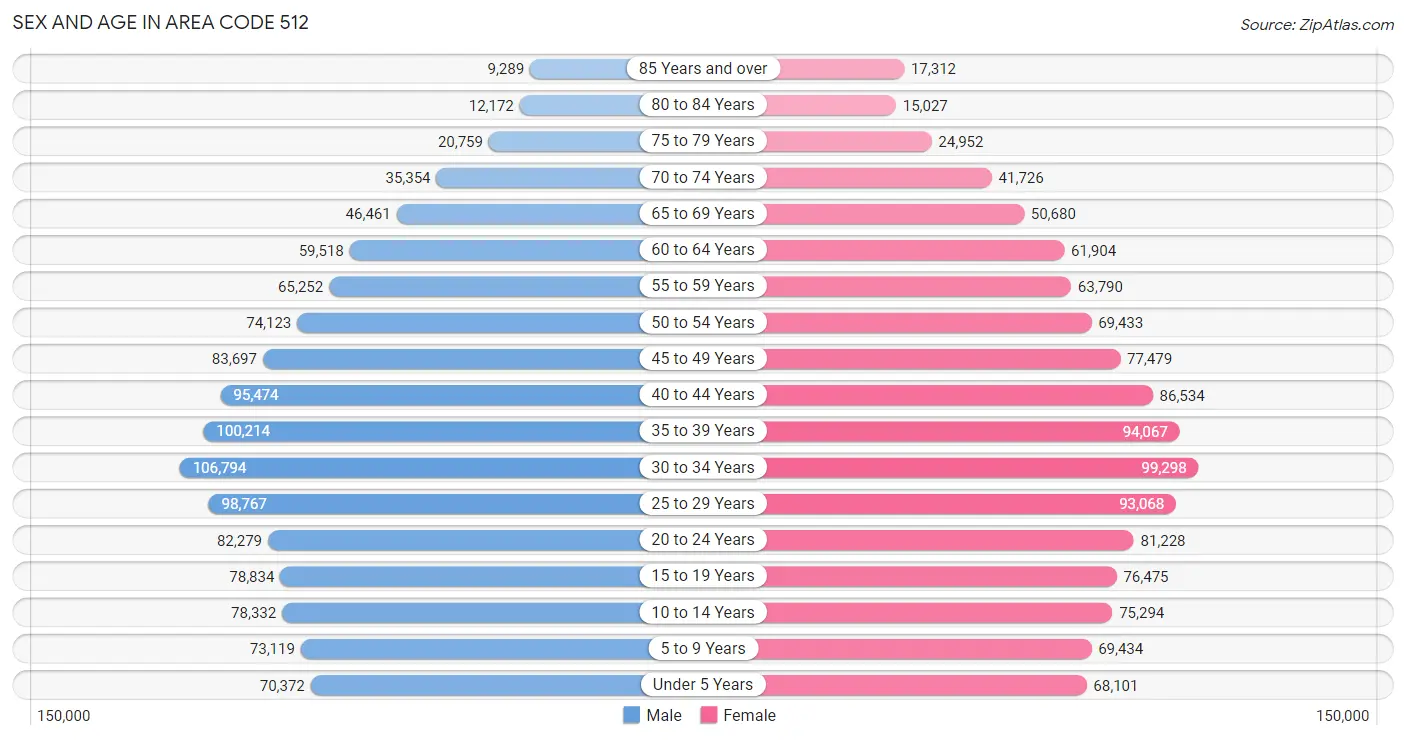
The most populous age groups in Area Code 512 are 30 to 34 Years (106,794 | 9.0%) for men and 30 to 34 Years (99,298 | 8.5%) for women.
| Age Bracket | Male | Female |
| Under 5 Years | 70,372 (5.9%) | 68,101 (5.8%) |
| 5 to 9 Years | 73,119 (6.1%) | 69,434 (6.0%) |
| 10 to 14 Years | 78,332 (6.6%) | 75,294 (6.5%) |
| 15 to 19 Years | 78,834 (6.6%) | 76,475 (6.6%) |
| 20 to 24 Years | 82,279 (6.9%) | 81,228 (7.0%) |
| 25 to 29 Years | 98,767 (8.3%) | 93,068 (8.0%) |
| 30 to 34 Years | 106,794 (9.0%) | 99,298 (8.5%) |
| 35 to 39 Years | 100,214 (8.4%) | 94,067 (8.1%) |
| 40 to 44 Years | 95,474 (8.0%) | 86,534 (7.4%) |
| 45 to 49 Years | 83,697 (7.0%) | 77,479 (6.7%) |
| 50 to 54 Years | 74,123 (6.2%) | 69,433 (6.0%) |
| 55 to 59 Years | 65,252 (5.5%) | 63,790 (5.5%) |
| 60 to 64 Years | 59,518 (5.0%) | 61,904 (5.3%) |
| 65 to 69 Years | 46,461 (3.9%) | 50,680 (4.3%) |
| 70 to 74 Years | 35,354 (3.0%) | 41,726 (3.6%) |
| 75 to 79 Years | 20,759 (1.7%) | 24,952 (2.1%) |
| 80 to 84 Years | 12,172 (1.0%) | 15,027 (1.3%) |
| 85 Years and over | 9,289 (0.8%) | 17,312 (1.5%) |
| Total | 1,190,810 (100.0%) | 1,165,802 (100.0%) |
Families and Households in Area Code 512
Median Family Size in Area Code 512
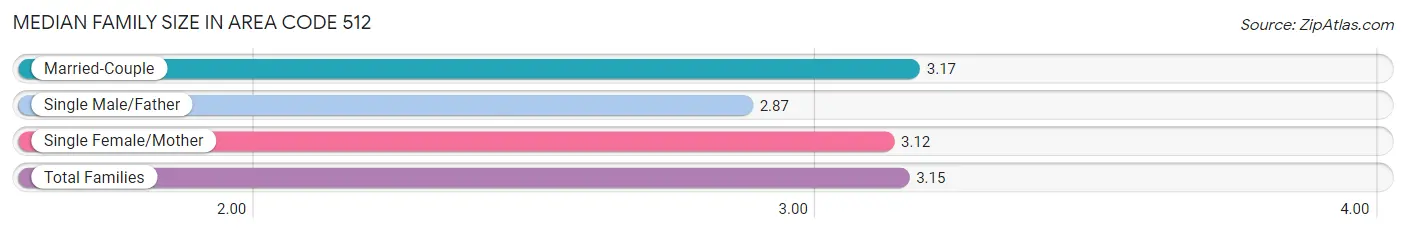
The median family size in Area Code 512 is 3.15 persons per family, with married-couple families (446,323 | 77.7%) accounting for the largest median family size of 3.16702 persons per family. On the other hand, single male/father families (38,746 | 6.7%) represent the smallest median family size with 2.87 persons per family.
| Family Type | # Families | Family Size |
| Married-Couple | 446,323 (77.7%) | 3.17 |
| Single Male/Father | 38,746 (6.7%) | 2.87 |
| Single Female/Mother | 89,414 (15.6%) | 3.12 |
| Total Families | 574,483 (100.0%) | 3.15 |
Median Household Size in Area Code 512
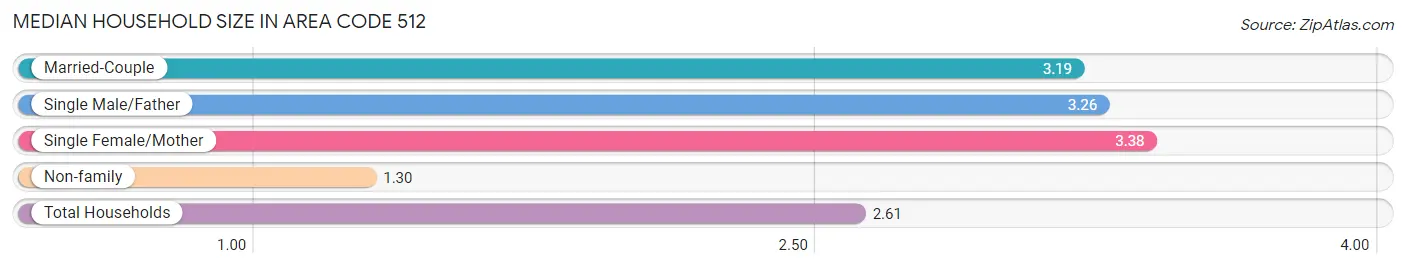
The median household size in Area Code 512 is 2.61 persons per household, with single female/mother households (89,414 | 9.6%) accounting for the largest median household size of 3.38333 persons per household. non-family households (352,749 | 38.0%) represent the smallest median household size with 1.30 persons per household.
| Household Type | # Households | Household Size |
| Married-Couple | 446,323 (48.1%) | 3.19 |
| Single Male/Father | 38,746 (4.2%) | 3.26 |
| Single Female/Mother | 89,414 (9.6%) | 3.38 |
| Non-family | 352,749 (38.0%) | 1.30 |
| Total Households | 927,232 (100.0%) | 2.61 |
Household Size by Marriage Status in Area Code 512
Out of a total of 927,232 households in Area Code 512, 574,483 (62.0%) are family households, while 352,749 (38.0%) are nonfamily households. The most numerous type of family households are 2-person households, comprising 234,874, and the most common type of nonfamily households are 1-person households, comprising 255,820.
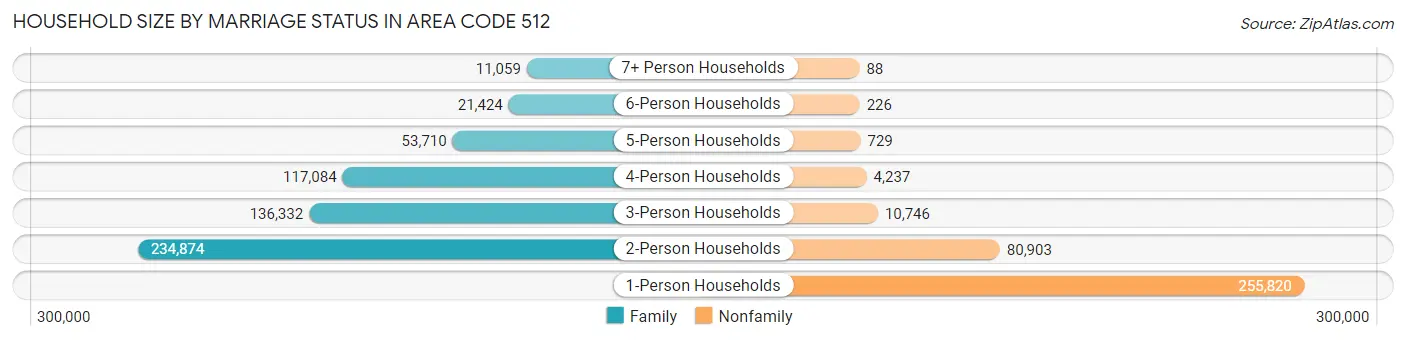
| Household Size | Family Households | Nonfamily Households |
| 1-Person Households | - | 255,820 (27.6%) |
| 2-Person Households | 234,874 (25.3%) | 80,903 (8.7%) |
| 3-Person Households | 136,332 (14.7%) | 10,746 (1.2%) |
| 4-Person Households | 117,084 (12.6%) | 4,237 (0.5%) |
| 5-Person Households | 53,710 (5.8%) | 729 (0.1%) |
| 6-Person Households | 21,424 (2.3%) | 226 (0.0%) |
| 7+ Person Households | 11,059 (1.2%) | 88 (0.0%) |
| Total | 574,483 (62.0%) | 352,749 (38.0%) |
Female Fertility in Area Code 512
Fertility by Age in Area Code 512
Average fertility rate in Area Code 512 is 52.8 births per 1,000 women. Women in the age bracket of 20 to 34 years have the highest fertility rate with 92.2 births per 1,000 women. Women in the age bracket of 20 to 34 years acount for 65.3% of all women with births.
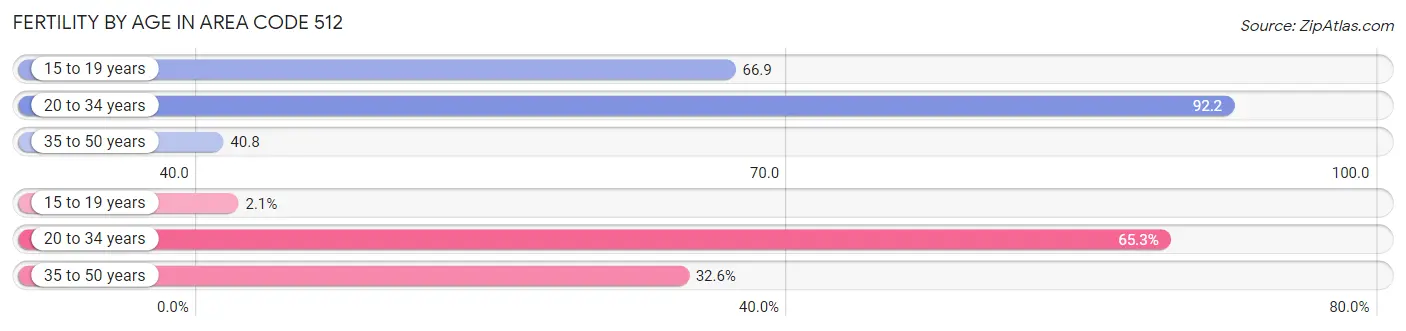
| Age Bracket | Women with Births | Births / 1,000 Women |
| 15 to 19 years | 613 (2.1%) | 66.8 |
| 20 to 34 years | 19,347 (65.3%) | 92.2 |
| 35 to 50 years | 9,661 (32.6%) | 40.8 |
| Total | 29,621 (100.0%) | 52.8 |
Fertility by Age by Marriage Status in Area Code 512
69.0% of women with births (29,621) in Area Code 512 are married. The highest percentage of unmarried women with births falls into 15 to 19 years age bracket with 93.1% of them unmarried at the time of birth, while the lowest percentage of unmarried women with births belong to 35 to 50 years age bracket with 24.9% of them unmarried.
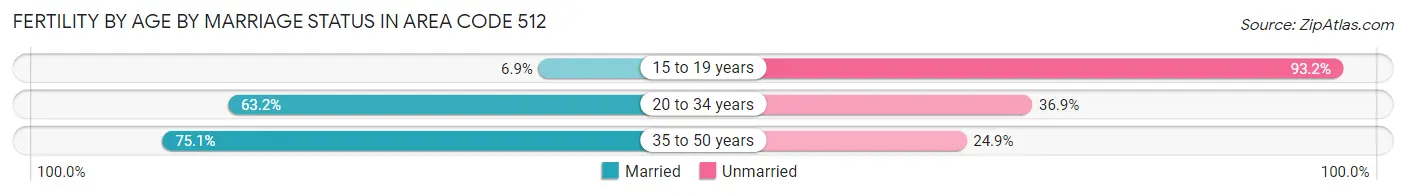
| Age Bracket | Married | Unmarried |
| 15 to 19 years | 42 (6.9%) | 571 (93.1%) |
| 20 to 34 years | 12,218 (63.1%) | 7,129 (36.8%) |
| 35 to 50 years | 7,252 (75.1%) | 2,409 (24.9%) |
| Total | 20,439 (69.0%) | 9,182 (31.0%) |
Fertility by Education in Area Code 512
Average fertility rate in Area Code 512 is 52.8 births per 1,000 women. Women with the education attainment of graduate degree have the highest fertility rate of 92.0 births per 1,000 women, while women with the education attainment of college or associate's degree have the lowest fertility at 57.0 births per 1,000 women. Women with the education attainment of bachelor's degree represent 28.7% of all women with births.
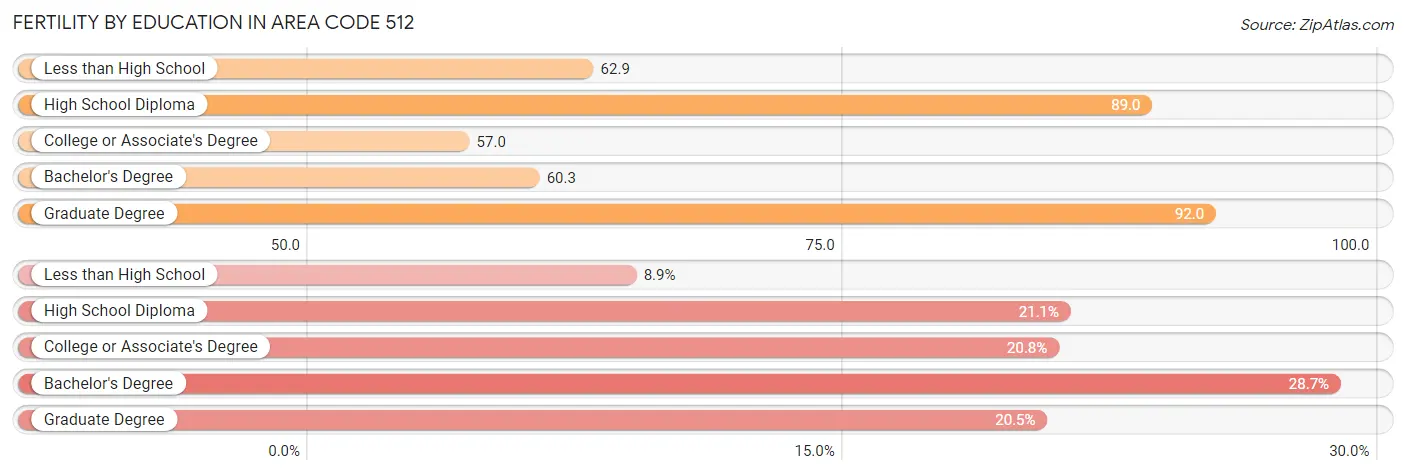
| Educational Attainment | Women with Births | Births / 1,000 Women |
| Less than High School | 2,643 (8.9%) | 62.9 |
| High School Diploma | 6,257 (21.1%) | 89.0 |
| College or Associate's Degree | 6,158 (20.8%) | 57.0 |
| Bachelor's Degree | 8,503 (28.7%) | 60.3 |
| Graduate Degree | 6,060 (20.5%) | 92.0 |
| Total | 29,621 (100.0%) | 52.8 |
Fertility by Education by Marriage Status in Area Code 512
31.0% of women with births in Area Code 512 are unmarried. Women with the educational attainment of bachelor's degree are most likely to be married with 69.2% of them married at childbirth, while women with the educational attainment of less than high school are least likely to be married with 64.0% of them unmarried at childbirth.
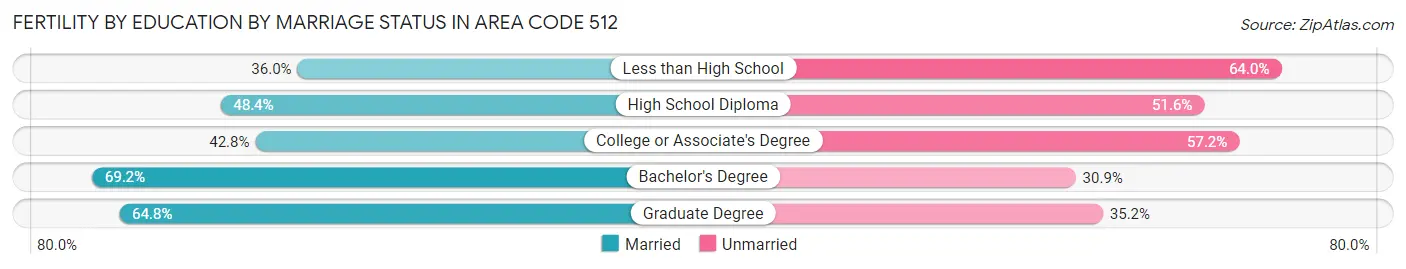
| Educational Attainment | Married | Unmarried |
| Less than High School | 952 (36.0%) | 1,691 (64.0%) |
| High School Diploma | 3,031 (48.4%) | 3,226 (51.6%) |
| College or Associate's Degree | 2,636 (42.8%) | 3,522 (57.2%) |
| Bachelor's Degree | 5,880 (69.2%) | 2,623 (30.8%) |
| Graduate Degree | 3,925 (64.8%) | 2,135 (35.2%) |
| Total | 20,439 (69.0%) | 9,182 (31.0%) |
Employment Characteristics in Area Code 512
Employment by Class of Employer in Area Code 512
Among the 1,261,332 employed individuals in Area Code 512, private company employees (850,670 | 67.4%), self-employed (not incorporated) (86,044 | 6.8%), and state government employees (85,857 | 6.8%) make up the most common classes of employment.
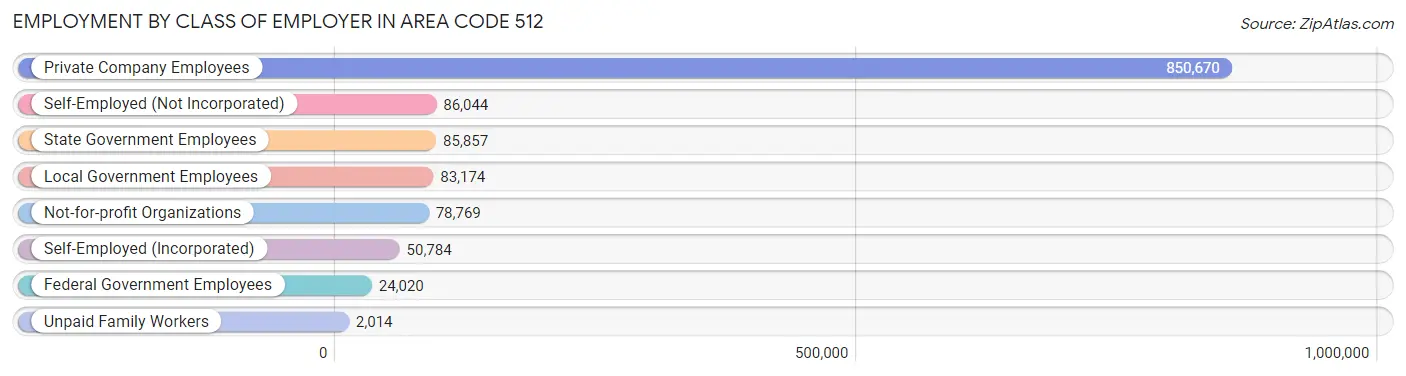
| Employer Class | # Employees | % Employees |
| Private Company Employees | 850,670 | 67.4% |
| Self-Employed (Incorporated) | 50,784 | 4.0% |
| Self-Employed (Not Incorporated) | 86,044 | 6.8% |
| Not-for-profit Organizations | 78,769 | 6.2% |
| Local Government Employees | 83,174 | 6.6% |
| State Government Employees | 85,857 | 6.8% |
| Federal Government Employees | 24,020 | 1.9% |
| Unpaid Family Workers | 2,014 | 0.2% |
| Total | 1,261,332 | 100.0% |
Employment Status by Age in Area Code 512
According to the labor force statistics for Area Code 512, out of the total population over 16 years of age (1,891,587), 67.3% or 1,272,281 individuals are in the labor force, with 4.3% or 54,454 of them unemployed. The age group with the highest labor force participation rate is 25 to 29 years, with 86.7% or 166,302 individuals in the labor force. Within the labor force, the 16 to 19 years age range has the highest percentage of unemployed individuals, with 1,338.2% or 675,617 of them being unemployed.
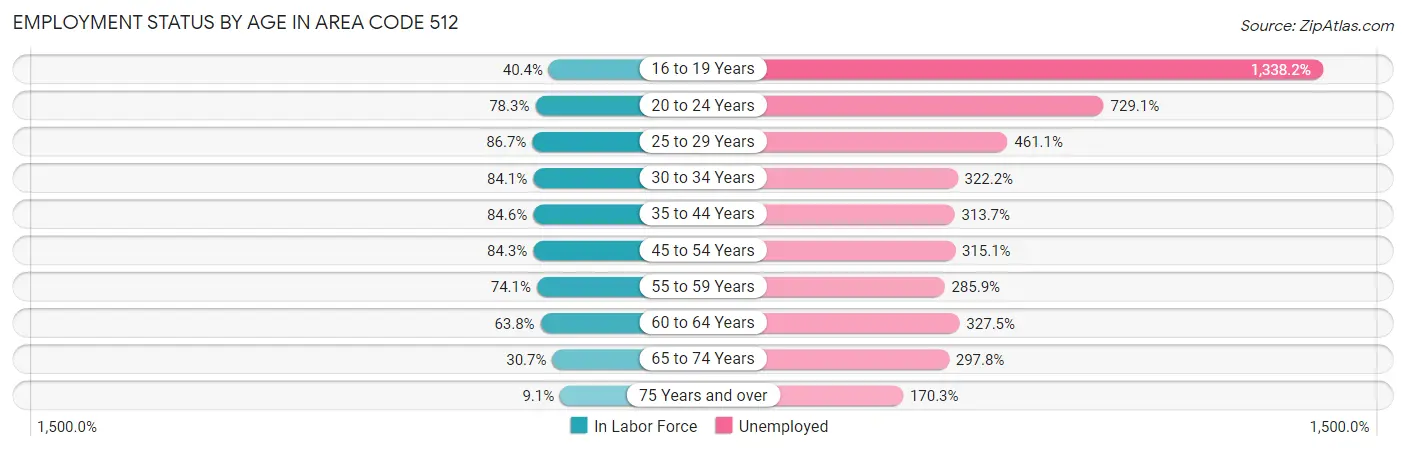
| Age Bracket | In Labor Force | Unemployed |
| 16 to 19 Years | 50,489 (40.4%) | 675,617 (1,338.2%) |
| 20 to 24 Years | 128,051 (78.3%) | 933,678 (729.1%) |
| 25 to 29 Years | 166,292 (86.7%) | 766,819 (461.1%) |
| 30 to 34 Years | 173,384 (84.1%) | 558,646 (322.2%) |
| 35 to 44 Years | 318,146 (84.6%) | 998,043 (313.7%) |
| 45 to 54 Years | 256,737 (84.3%) | 808,978 (315.1%) |
| 55 to 59 Years | 95,565 (74.1%) | 273,232 (285.9%) |
| 60 to 64 Years | 77,479 (63.8%) | 253,744 (327.5%) |
| 65 to 74 Years | 53,435 (30.7%) | 159,126 (297.8%) |
| 75 Years and over | 9,071 (9.1%) | 15,455 (170.3%) |
| Total | 1,272,222 (67.3%) | 54,404 (4.3%) |
Employment Status by Educational Attainment in Area Code 512
According to labor force statistics for Area Code 512, 81.6% of individuals (1,085,199) out of the total population between 25 and 64 years of age (1,329,412) are in the labor force, with 329.6% or 3,576,816 of them being unemployed. The group with the highest labor force participation rate are those with the educational attainment of bachelor's degree or higher, with 86.5% or 561,561 individuals in the labor force. Within the labor force, individuals with less than high school education have the highest percentage of unemployment, with 543.2% or 417,134 of them being unemployed.
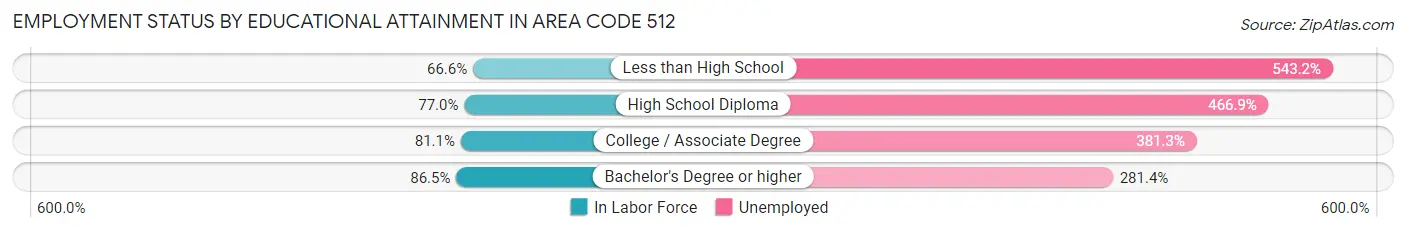
| Educational Attainment | In Labor Force | Unemployed |
| Less than High School | 76,794 (66.6%) | 626,614 (543.2%) |
| High School Diploma | 178,802 (77.0%) | 1,084,492 (466.9%) |
| College / Associate Degree | 269,502 (81.1%) | 1,267,544 (381.3%) |
| Bachelor's Degree or higher | 561,531 (86.5%) | 1,827,282 (281.4%) |
| Total | 1,085,154 (81.6%) | 4,381,742 (329.6%) |
Employment Occupations by Sex in Area Code 512
Management, Business, Science and Arts Occupations
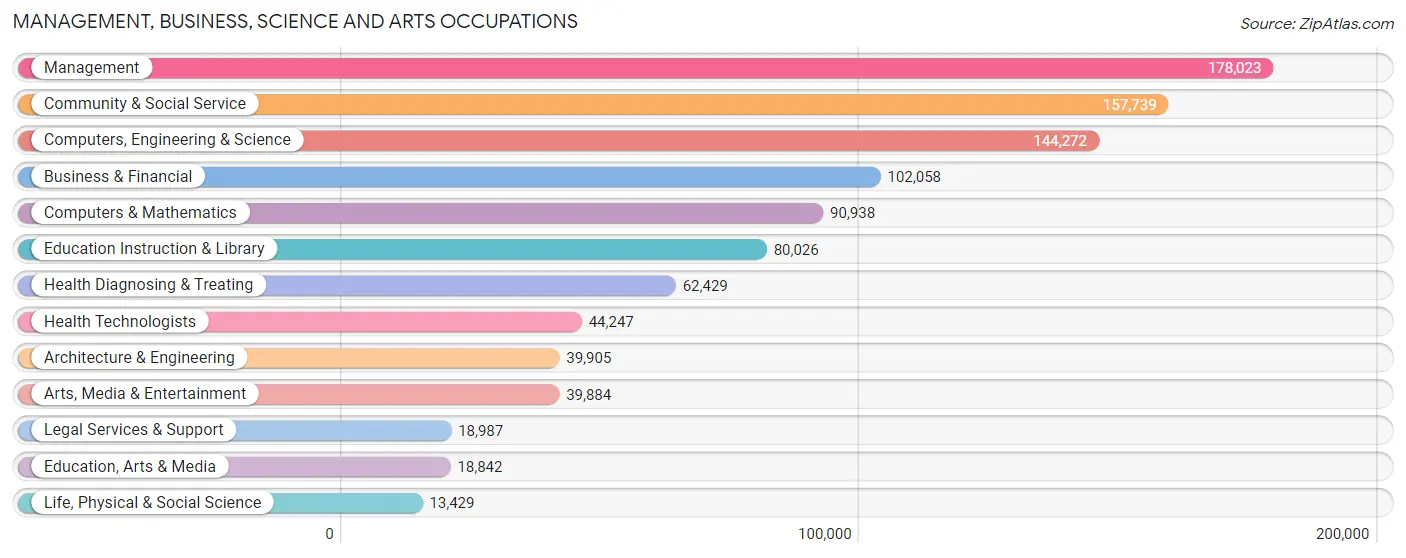
The most common Management, Business, Science and Arts occupations in Area Code 512 are Management (178,023 | 13.9%), Community & Social Service (157,739 | 12.3%), Computers, Engineering & Science (144,272 | 11.3%), Business & Financial (102,058 | 8.0%), and Computers & Mathematics (90,938 | 7.1%).
Management, Business, Science and Arts Occupations by Sex
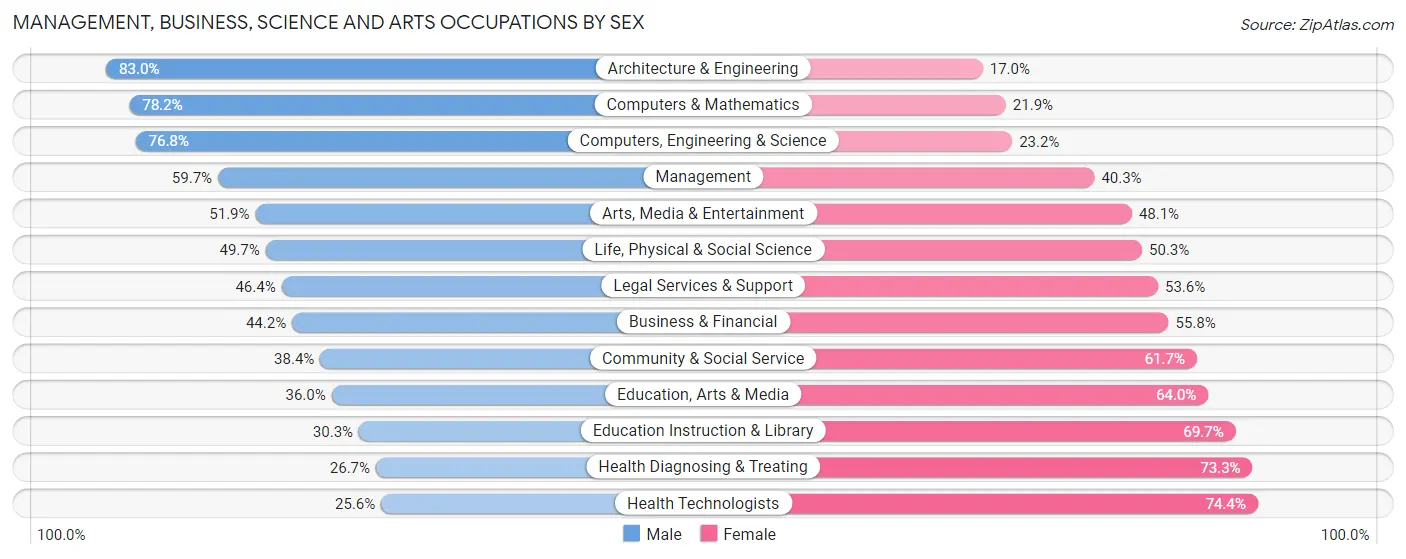
Within the Management, Business, Science and Arts occupations in Area Code 512, the most male-oriented occupations are Architecture & Engineering (83.0%), Computers & Mathematics (78.1%), and Computers, Engineering & Science (76.8%), while the most female-oriented occupations are Health Technologists (74.4%), Health Diagnosing & Treating (73.3%), and Education Instruction & Library (69.7%).
| Occupation | Male | Female |
| Management | 106,250 (59.7%) | 71,773 (40.3%) |
| Business & Financial | 45,133 (44.2%) | 56,925 (55.8%) |
| Computers, Engineering & Science | 110,863 (76.8%) | 33,409 (23.2%) |
| Computers & Mathematics | 71,072 (78.1%) | 19,866 (21.8%) |
| Architecture & Engineering | 33,112 (83.0%) | 6,793 (17.0%) |
| Life, Physical & Social Science | 6,679 (49.7%) | 6,750 (50.3%) |
| Community & Social Service | 60,489 (38.4%) | 97,250 (61.7%) |
| Education, Arts & Media | 6,776 (36.0%) | 12,066 (64.0%) |
| Legal Services & Support | 8,811 (46.4%) | 10,176 (53.6%) |
| Education Instruction & Library | 24,219 (30.3%) | 55,807 (69.7%) |
| Arts, Media & Entertainment | 20,683 (51.9%) | 19,201 (48.1%) |
| Health Diagnosing & Treating | 16,687 (26.7%) | 45,742 (73.3%) |
| Health Technologists | 11,341 (25.6%) | 32,906 (74.4%) |
| Total (Category) | 339,422 (52.7%) | 305,099 (47.3%) |
| Total (Overall) | 701,397 (54.8%) | 578,219 (45.2%) |
Services Occupations
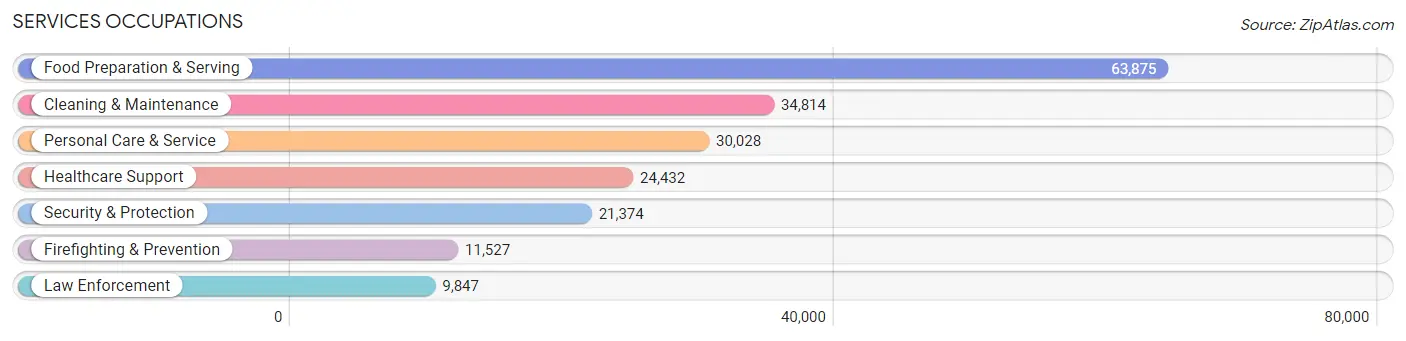
The most common Services occupations in Area Code 512 are Food Preparation & Serving (63,875 | 5.0%), Cleaning & Maintenance (34,814 | 2.7%), Personal Care & Service (30,028 | 2.4%), Healthcare Support (24,432 | 1.9%), and Security & Protection (21,374 | 1.7%).
Services Occupations by Sex
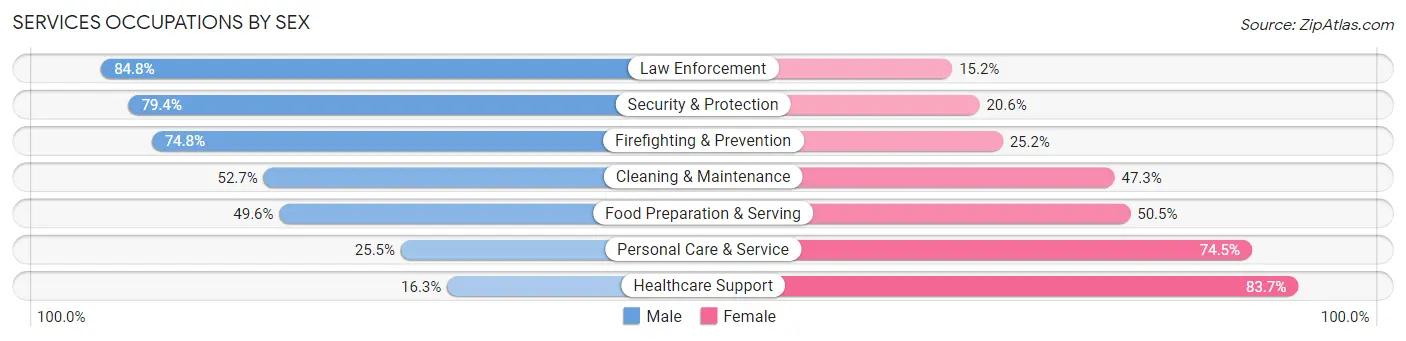
Within the Services occupations in Area Code 512, the most male-oriented occupations are Law Enforcement (84.8%), Security & Protection (79.4%), and Firefighting & Prevention (74.8%), while the most female-oriented occupations are Healthcare Support (83.7%), Personal Care & Service (74.5%), and Food Preparation & Serving (50.4%).
| Occupation | Male | Female |
| Healthcare Support | 3,993 (16.3%) | 20,439 (83.7%) |
| Security & Protection | 16,976 (79.4%) | 4,398 (20.6%) |
| Firefighting & Prevention | 8,624 (74.8%) | 2,903 (25.2%) |
| Law Enforcement | 8,352 (84.8%) | 1,495 (15.2%) |
| Food Preparation & Serving | 31,650 (49.5%) | 32,225 (50.4%) |
| Cleaning & Maintenance | 18,339 (52.7%) | 16,475 (47.3%) |
| Personal Care & Service | 7,653 (25.5%) | 22,375 (74.5%) |
| Total (Category) | 78,611 (45.0%) | 95,912 (55.0%) |
| Total (Overall) | 701,397 (54.8%) | 578,219 (45.2%) |
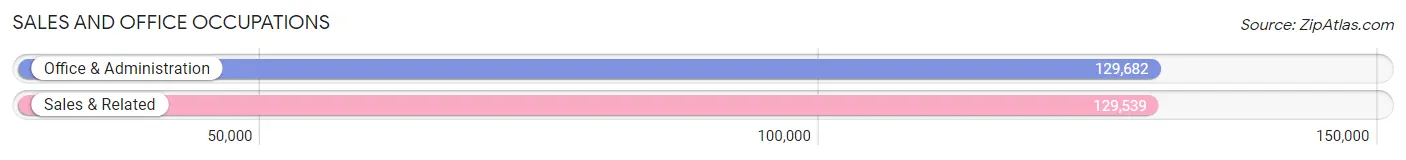
Sales and Office Occupations
The most common Sales and Office occupations in Area Code 512 are Office & Administration (129,682 | 10.1%), and Sales & Related (129,539 | 10.1%).
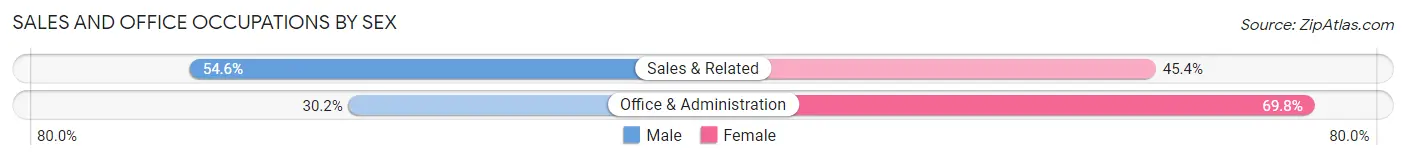
Sales and Office Occupations by Sex
| Occupation | Male | Female |
| Sales & Related | 70,708 (54.6%) | 58,831 (45.4%) |
| Office & Administration | 39,118 (30.2%) | 90,564 (69.8%) |
| Total (Category) | 109,826 (42.4%) | 149,395 (57.6%) |
| Total (Overall) | 701,397 (54.8%) | 578,219 (45.2%) |
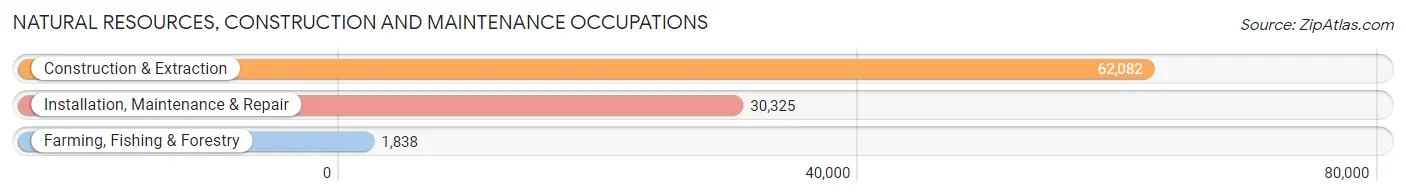
Natural Resources, Construction and Maintenance Occupations
The most common Natural Resources, Construction and Maintenance occupations in Area Code 512 are Construction & Extraction (62,082 | 4.9%), Installation, Maintenance & Repair (30,325 | 2.4%), and Farming, Fishing & Forestry (1,838 | 0.1%).
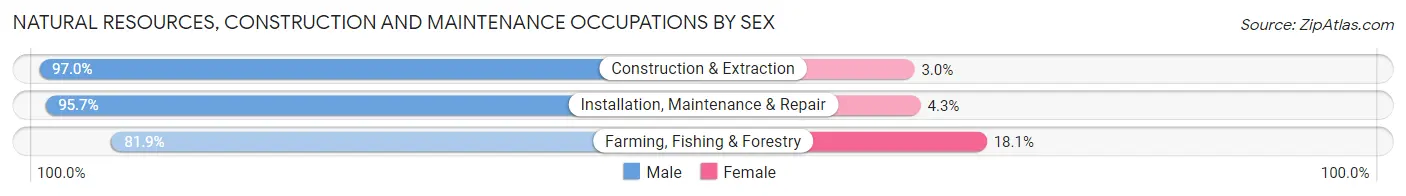
Natural Resources, Construction and Maintenance Occupations by Sex
| Occupation | Male | Female |
| Farming, Fishing & Forestry | 1,506 (81.9%) | 332 (18.1%) |
| Construction & Extraction | 60,207 (97.0%) | 1,875 (3.0%) |
| Installation, Maintenance & Repair | 29,021 (95.7%) | 1,304 (4.3%) |
| Total (Category) | 90,734 (96.3%) | 3,511 (3.7%) |
| Total (Overall) | 701,397 (54.8%) | 578,219 (45.2%) |
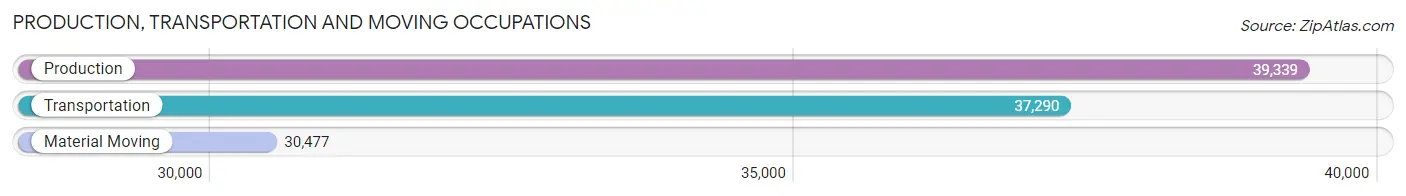
Production, Transportation and Moving Occupations
The most common Production, Transportation and Moving occupations in Area Code 512 are Production (39,339 | 3.1%), Transportation (37,290 | 2.9%), and Material Moving (30,477 | 2.4%).
Production, Transportation and Moving Occupations by Sex
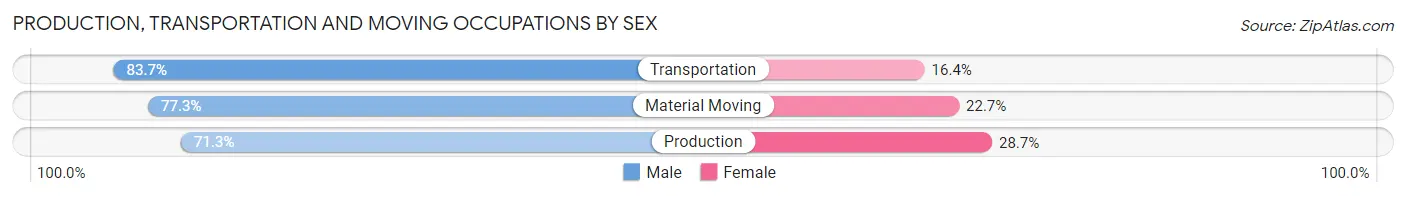
| Occupation | Male | Female |
| Production | 28,043 (71.3%) | 11,296 (28.7%) |
| Transportation | 31,193 (83.7%) | 6,097 (16.4%) |
| Material Moving | 23,568 (77.3%) | 6,909 (22.7%) |
| Total (Category) | 82,804 (77.3%) | 24,302 (22.7%) |
| Total (Overall) | 701,397 (54.8%) | 578,219 (45.2%) |
Employment Industries by Sex in Area Code 512
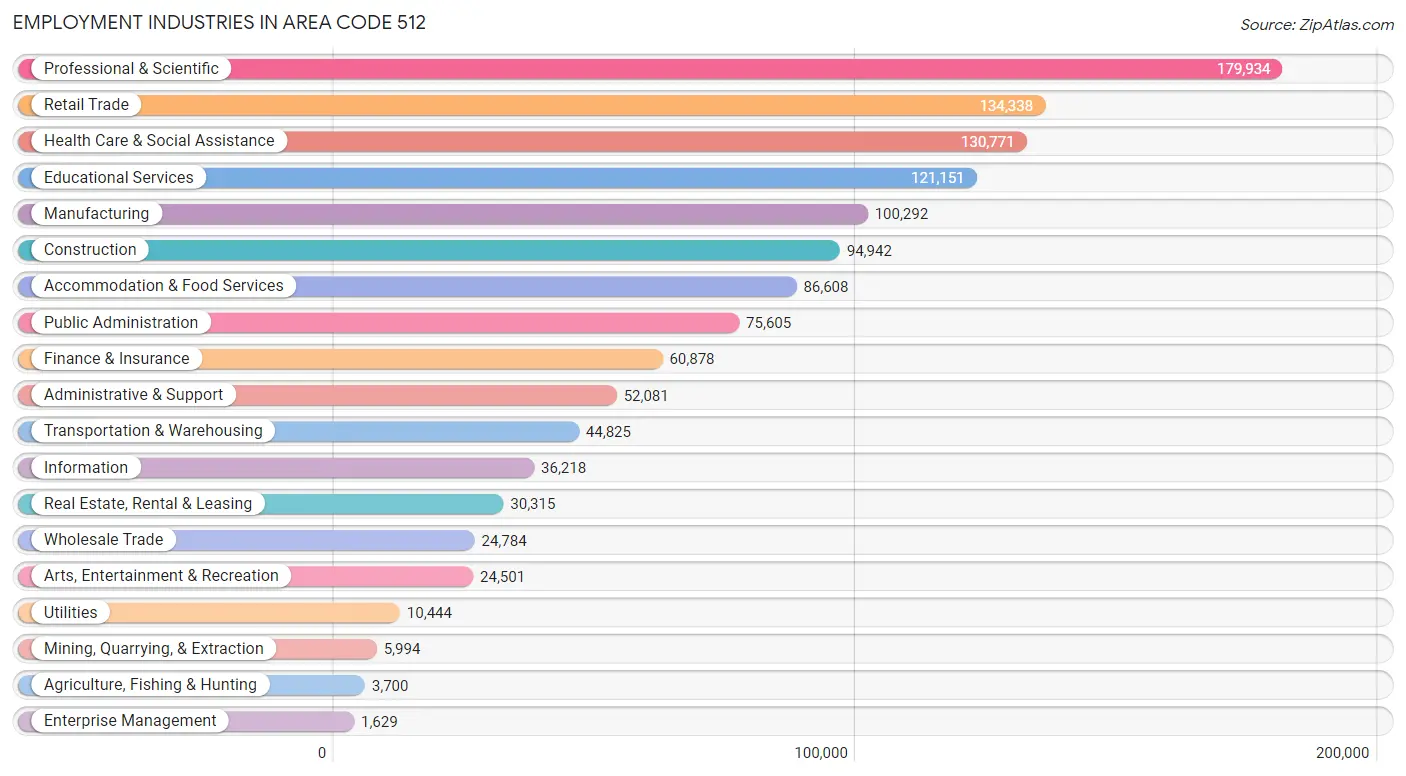
Employment Industries in Area Code 512
The major employment industries in Area Code 512 include Professional & Scientific (179,934 | 14.1%), Retail Trade (134,338 | 10.5%), Health Care & Social Assistance (130,771 | 10.2%), Educational Services (121,151 | 9.5%), and Manufacturing (100,292 | 7.8%).
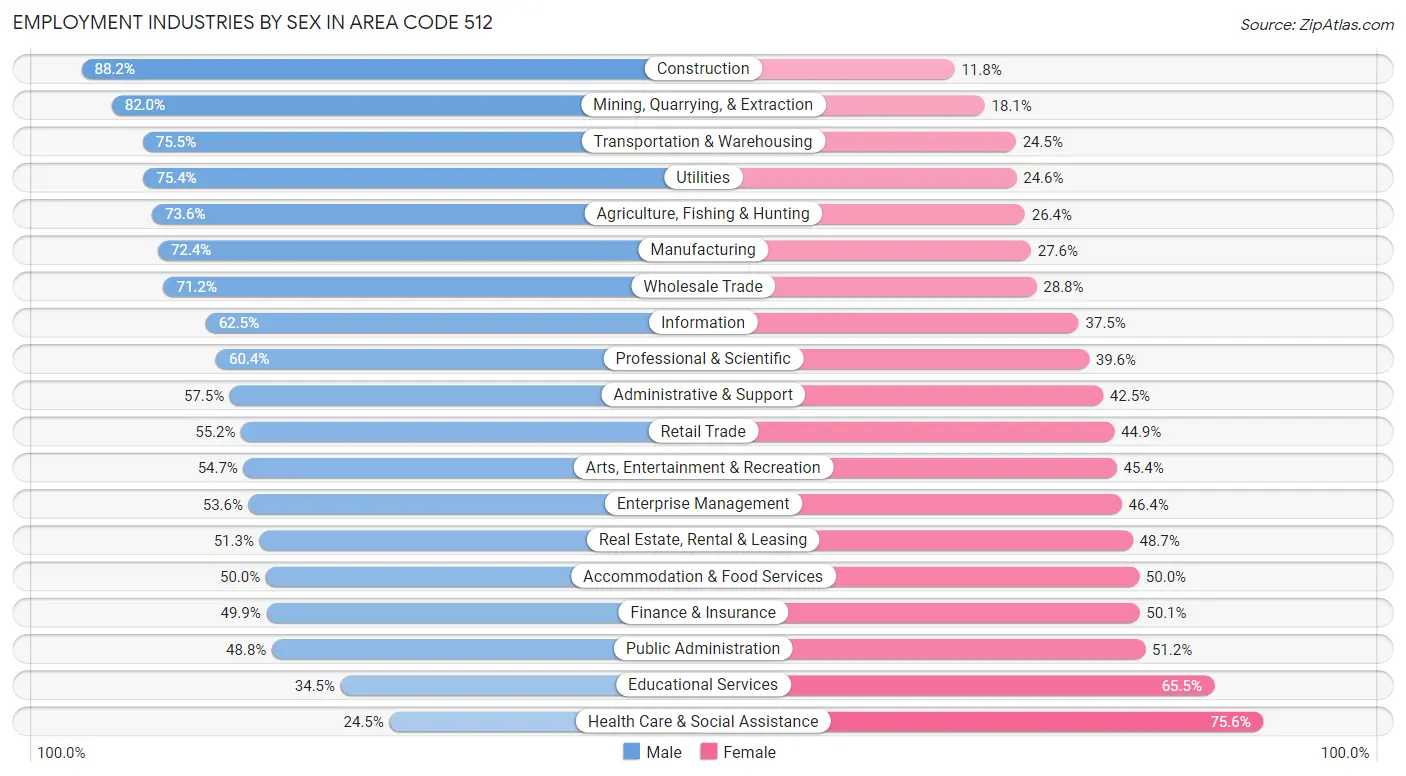
Employment Industries by Sex in Area Code 512
The Area Code 512 industries that see more men than women are Construction (88.2%), Mining, Quarrying, & Extraction (82.0%), and Transportation & Warehousing (75.5%), whereas the industries that tend to have a higher number of women are Health Care & Social Assistance (75.5%), Educational Services (65.5%), and Public Administration (51.2%).
| Industry | Male | Female |
| Agriculture, Fishing & Hunting | 2,724 (73.6%) | 976 (26.4%) |
| Mining, Quarrying, & Extraction | 4,912 (82.0%) | 1,082 (18.0%) |
| Construction | 83,730 (88.2%) | 11,212 (11.8%) |
| Manufacturing | 72,602 (72.4%) | 27,690 (27.6%) |
| Wholesale Trade | 17,656 (71.2%) | 7,128 (28.8%) |
| Retail Trade | 74,093 (55.1%) | 60,245 (44.9%) |
| Transportation & Warehousing | 33,849 (75.5%) | 10,976 (24.5%) |
| Utilities | 7,875 (75.4%) | 2,569 (24.6%) |
| Information | 22,635 (62.5%) | 13,583 (37.5%) |
| Finance & Insurance | 30,388 (49.9%) | 30,490 (50.1%) |
| Real Estate, Rental & Leasing | 15,560 (51.3%) | 14,755 (48.7%) |
| Professional & Scientific | 108,620 (60.4%) | 71,314 (39.6%) |
| Enterprise Management | 873 (53.6%) | 756 (46.4%) |
| Administrative & Support | 29,931 (57.5%) | 22,150 (42.5%) |
| Educational Services | 41,840 (34.5%) | 79,311 (65.5%) |
| Health Care & Social Assistance | 31,979 (24.4%) | 98,792 (75.5%) |
| Arts, Entertainment & Recreation | 13,391 (54.6%) | 11,110 (45.4%) |
| Accommodation & Food Services | 43,320 (50.0%) | 43,288 (50.0%) |
| Public Administration | 36,867 (48.8%) | 38,738 (51.2%) |
| Total | 701,397 (54.8%) | 578,219 (45.2%) |
Education in Area Code 512
School Enrollment in Area Code 512
The most common levels of schooling among the 592,923 students in Area Code 512 are college / undergraduate (134,314 | 22.7%), middle school (120,846 | 20.4%), and high school (120,788 | 20.4%).
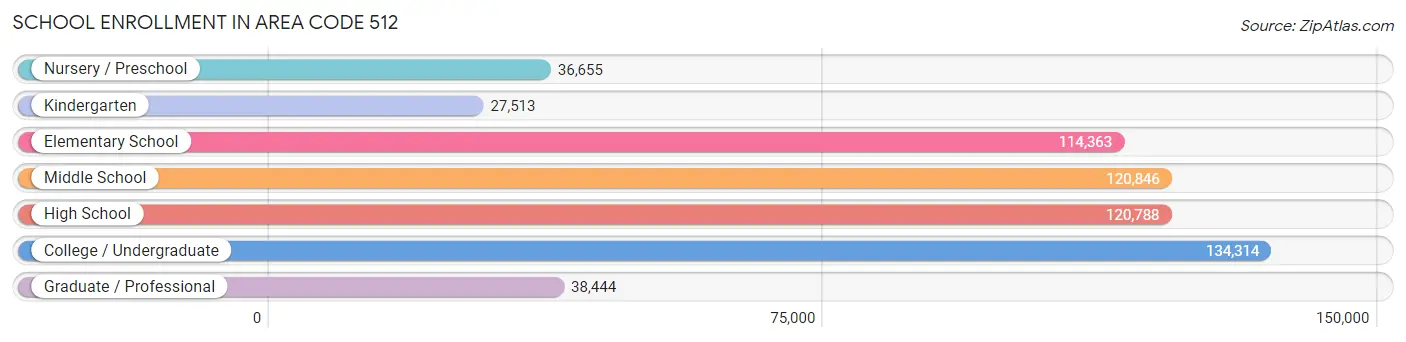
| School Level | # Students | % Students |
| Nursery / Preschool | 36,655 | 6.2% |
| Kindergarten | 27,513 | 4.6% |
| Elementary School | 114,363 | 19.3% |
| Middle School | 120,846 | 20.4% |
| High School | 120,788 | 20.4% |
| College / Undergraduate | 134,314 | 22.7% |
| Graduate / Professional | 38,444 | 6.5% |
| Total | 592,923 | 100.0% |
School Enrollment by Age by Funding Source in Area Code 512
Out of a total of 592,923 students who are enrolled in schools in Area Code 512, 87,826 (14.8%) attend a private institution, while the remaining 505,097 (85.2%) are enrolled in public schools. The age group of 3 to 4 year olds has the highest likelihood of being enrolled in private schools, with 14,385 (50.3% in the age bracket) enrolled. Conversely, the age group of 15 to 17 year olds has the lowest likelihood of being enrolled in a private school, with 78,614 (90.9% in the age bracket) attending a public institution.
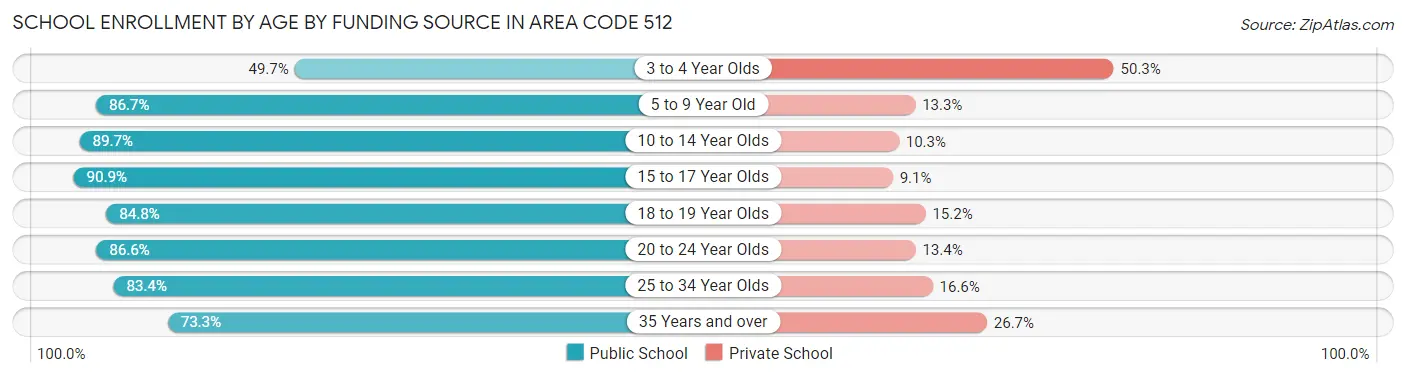
| Age Bracket | Public School | Private School |
| 3 to 4 Year Olds | 14,222 (49.7%) | 14,385 (50.3%) |
| 5 to 9 Year Old | 116,414 (86.7%) | 17,883 (13.3%) |
| 10 to 14 Year Olds | 134,551 (89.7%) | 15,382 (10.3%) |
| 15 to 17 Year Olds | 78,614 (90.9%) | 7,908 (9.1%) |
| 18 to 19 Year Olds | 42,663 (84.8%) | 7,672 (15.2%) |
| 20 to 24 Year Olds | 62,445 (86.6%) | 9,643 (13.4%) |
| 25 to 34 Year Olds | 33,080 (83.4%) | 6,563 (16.6%) |
| 35 Years and over | 23,098 (73.3%) | 8,400 (26.7%) |
| Total | 505,097 (85.2%) | 87,826 (14.8%) |
Educational Attainment by Field of Study in Area Code 512
Business (158,922 | 19.2%), engineering (86,103 | 10.4%), social sciences (68,122 | 8.2%), education (63,808 | 7.7%), and science & technology (62,222 | 7.5%) are the most common fields of study among 829,852 individuals in Area Code 512 who have obtained a bachelor's degree or higher.
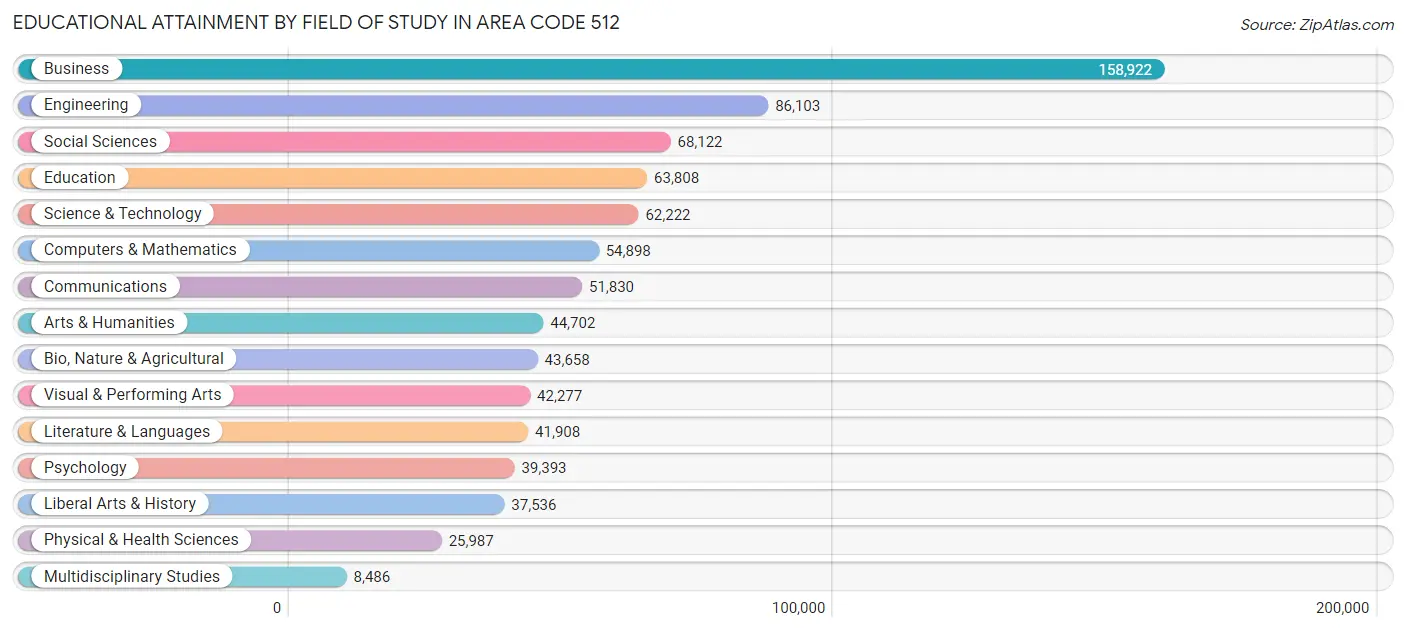
| Field of Study | # Graduates | % Graduates |
| Computers & Mathematics | 54,898 | 6.6% |
| Bio, Nature & Agricultural | 43,658 | 5.3% |
| Physical & Health Sciences | 25,987 | 3.1% |
| Psychology | 39,393 | 4.8% |
| Social Sciences | 68,122 | 8.2% |
| Engineering | 86,103 | 10.4% |
| Multidisciplinary Studies | 8,486 | 1.0% |
| Science & Technology | 62,222 | 7.5% |
| Business | 158,922 | 19.2% |
| Education | 63,808 | 7.7% |
| Literature & Languages | 41,908 | 5.1% |
| Liberal Arts & History | 37,536 | 4.5% |
| Visual & Performing Arts | 42,277 | 5.1% |
| Communications | 51,830 | 6.2% |
| Arts & Humanities | 44,702 | 5.4% |
| Total | 829,852 | 100.0% |
Transportation & Commute in Area Code 512
Vehicle Availability by Sex in Area Code 512
The most prevalent vehicle ownership categories in Area Code 512 are males with 2 vehicles (319,845, accounting for 46.3%) and females with 2 vehicles (256,687, making up 56.9%).
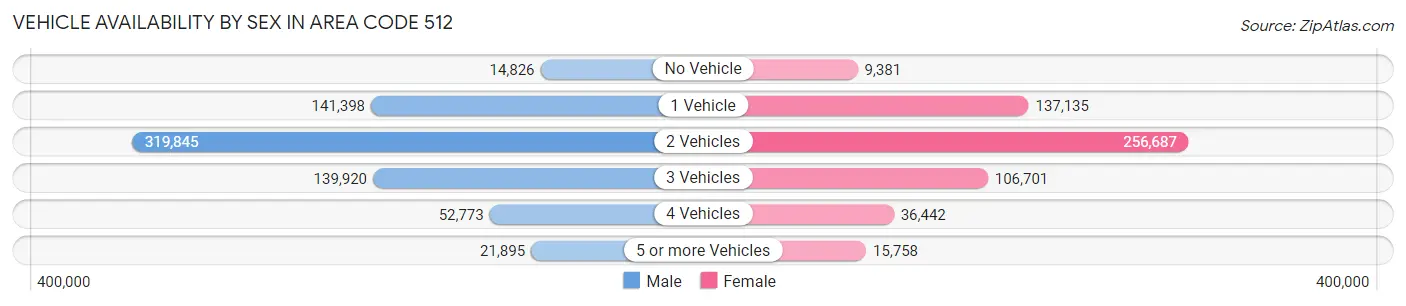
| Vehicles Available | Male | Female |
| No Vehicle | 14,826 (2.1%) | 9,381 (1.7%) |
| 1 Vehicle | 141,398 (20.5%) | 137,135 (24.4%) |
| 2 Vehicles | 319,845 (46.3%) | 256,687 (45.7%) |
| 3 Vehicles | 139,920 (20.3%) | 106,701 (19.0%) |
| 4 Vehicles | 52,773 (7.6%) | 36,442 (6.5%) |
| 5 or more Vehicles | 21,895 (3.2%) | 15,758 (2.8%) |
| Total | 690,657 (100.0%) | 562,104 (100.0%) |
Commute Time in Area Code 512
The most frequently occuring commute durations in Area Code 512 are 30 to 34 minutes (158,172 commuters, 15.7%), 15 to 19 minutes (154,994 commuters, 15.4%), and 20 to 24 minutes (145,924 commuters, 14.5%).
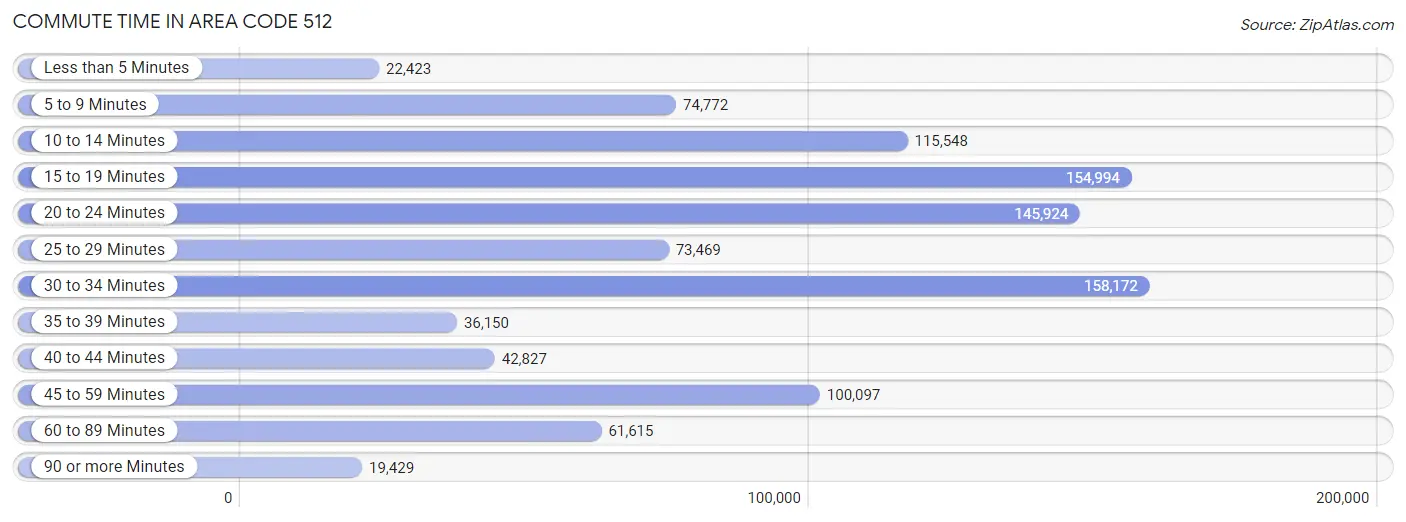
| Commute Time | # Commuters | % Commuters |
| Less than 5 Minutes | 22,423 | 2.2% |
| 5 to 9 Minutes | 74,772 | 7.4% |
| 10 to 14 Minutes | 115,548 | 11.5% |
| 15 to 19 Minutes | 154,994 | 15.4% |
| 20 to 24 Minutes | 145,924 | 14.5% |
| 25 to 29 Minutes | 73,469 | 7.3% |
| 30 to 34 Minutes | 158,172 | 15.7% |
| 35 to 39 Minutes | 36,150 | 3.6% |
| 40 to 44 Minutes | 42,827 | 4.3% |
| 45 to 59 Minutes | 100,097 | 10.0% |
| 60 to 89 Minutes | 61,615 | 6.1% |
| 90 or more Minutes | 19,429 | 1.9% |
Commute Time by Sex in Area Code 512
The most common commute times in Area Code 512 are 30 to 34 minutes (91,507 commuters, 16.4%) for males and 15 to 19 minutes (72,964 commuters, 16.3%) for females.
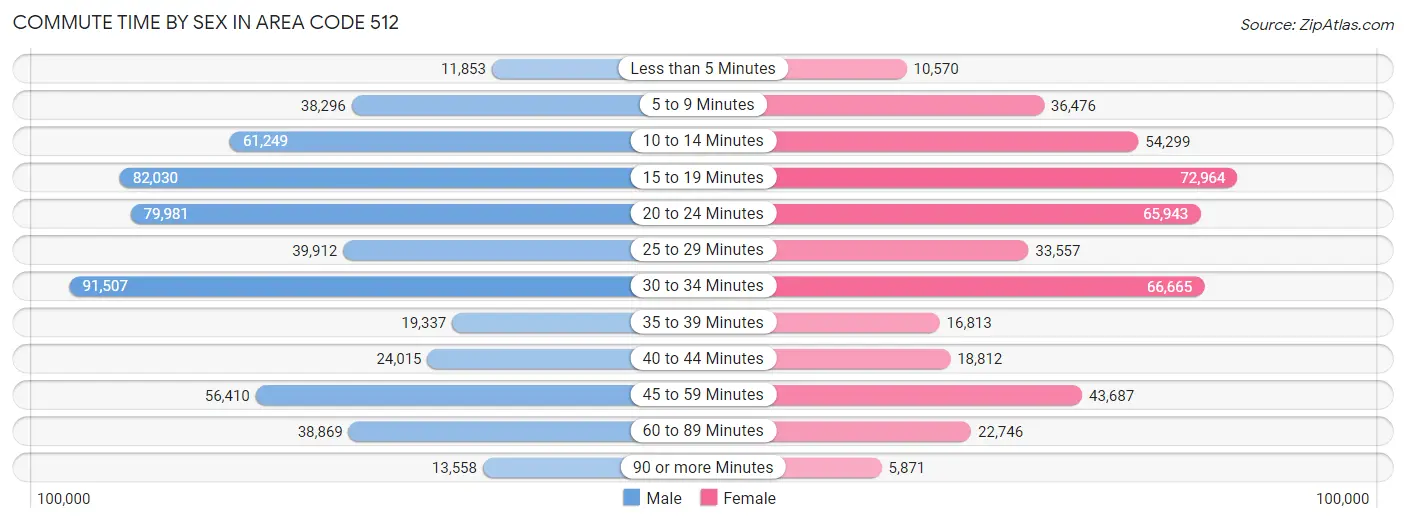
| Commute Time | Male | Female |
| Less than 5 Minutes | 11,853 (2.1%) | 10,570 (2.4%) |
| 5 to 9 Minutes | 38,296 (6.9%) | 36,476 (8.1%) |
| 10 to 14 Minutes | 61,249 (11.0%) | 54,299 (12.1%) |
| 15 to 19 Minutes | 82,030 (14.7%) | 72,964 (16.3%) |
| 20 to 24 Minutes | 79,981 (14.4%) | 65,943 (14.7%) |
| 25 to 29 Minutes | 39,912 (7.2%) | 33,557 (7.5%) |
| 30 to 34 Minutes | 91,507 (16.4%) | 66,665 (14.9%) |
| 35 to 39 Minutes | 19,337 (3.5%) | 16,813 (3.7%) |
| 40 to 44 Minutes | 24,015 (4.3%) | 18,812 (4.2%) |
| 45 to 59 Minutes | 56,410 (10.1%) | 43,687 (9.7%) |
| 60 to 89 Minutes | 38,869 (7.0%) | 22,746 (5.1%) |
| 90 or more Minutes | 13,558 (2.4%) | 5,871 (1.3%) |
Time of Departure to Work by Sex in Area Code 512
The most frequent times of departure to work in Area Code 512 are 7:00 AM to 7:29 AM (82,367, 14.8%) for males and 7:00 AM to 7:29 AM (73,843, 16.5%) for females.
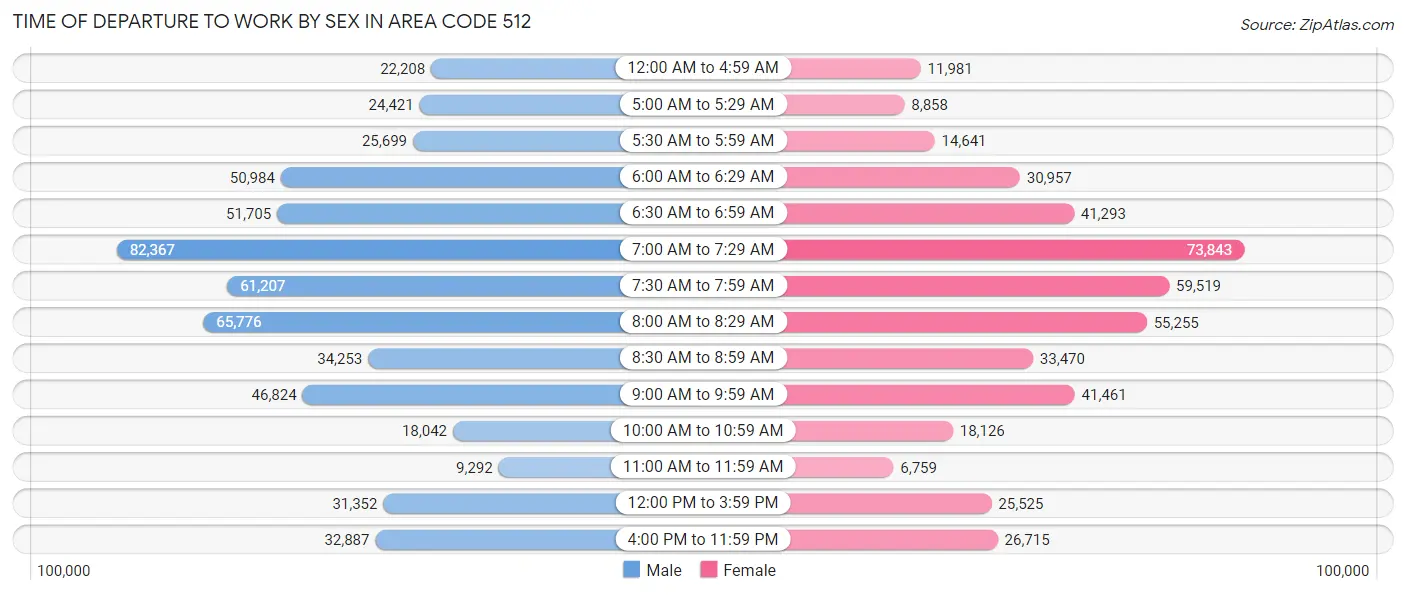
| Time of Departure | Male | Female |
| 12:00 AM to 4:59 AM | 22,208 (4.0%) | 11,981 (2.7%) |
| 5:00 AM to 5:29 AM | 24,421 (4.4%) | 8,858 (2.0%) |
| 5:30 AM to 5:59 AM | 25,699 (4.6%) | 14,641 (3.3%) |
| 6:00 AM to 6:29 AM | 50,984 (9.1%) | 30,957 (6.9%) |
| 6:30 AM to 6:59 AM | 51,705 (9.3%) | 41,293 (9.2%) |
| 7:00 AM to 7:29 AM | 82,367 (14.8%) | 73,843 (16.5%) |
| 7:30 AM to 7:59 AM | 61,207 (11.0%) | 59,519 (13.3%) |
| 8:00 AM to 8:29 AM | 65,776 (11.8%) | 55,255 (12.3%) |
| 8:30 AM to 8:59 AM | 34,253 (6.1%) | 33,470 (7.5%) |
| 9:00 AM to 9:59 AM | 46,824 (8.4%) | 41,461 (9.2%) |
| 10:00 AM to 10:59 AM | 18,042 (3.2%) | 18,126 (4.0%) |
| 11:00 AM to 11:59 AM | 9,292 (1.7%) | 6,759 (1.5%) |
| 12:00 PM to 3:59 PM | 31,352 (5.6%) | 25,525 (5.7%) |
| 4:00 PM to 11:59 PM | 32,887 (5.9%) | 26,715 (6.0%) |
| Total | 557,017 (100.0%) | 448,403 (100.0%) |
Housing Occupancy in Area Code 512
Occupancy by Ownership in Area Code 512
Of the total 927,232 dwellings in Area Code 512, owner-occupied units account for 550,177 (59.3%), while renter-occupied units make up 377,055 (40.7%).
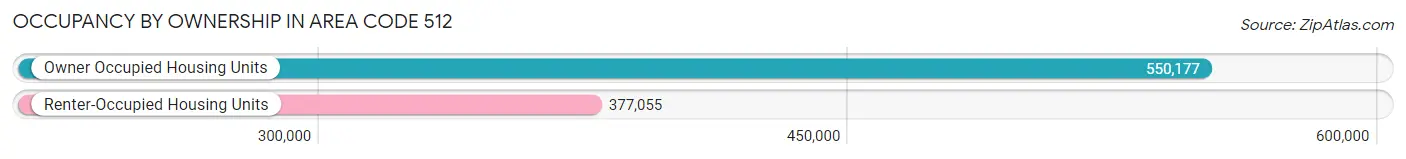
| Occupancy | # Housing Units | % Housing Units |
| Owner Occupied Housing Units | 550,177 | 59.3% |
| Renter-Occupied Housing Units | 377,055 | 40.7% |
| Total Occupied Housing Units | 927,232 | 100.0% |
Occupancy by Household Size in Area Code 512
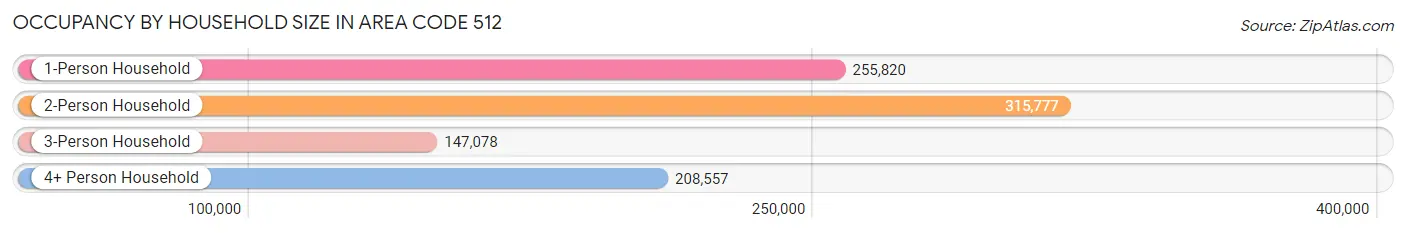
| Household Size | # Housing Units | % Housing Units |
| 1-Person Household | 255,820 | 27.6% |
| 2-Person Household | 315,777 | 34.1% |
| 3-Person Household | 147,078 | 15.9% |
| 4+ Person Household | 208,557 | 22.5% |
| Total Housing Units | 927,232 | 100.0% |
Occupancy by Ownership by Household Size in Area Code 512
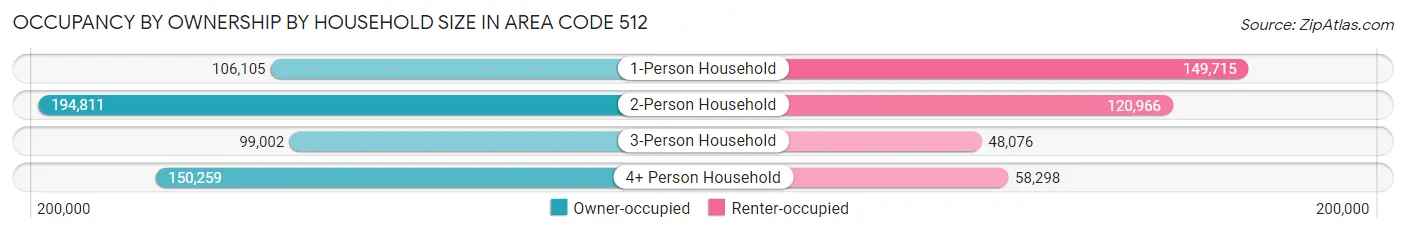
| Household Size | Owner-occupied | Renter-occupied |
| 1-Person Household | 106,105 (41.5%) | 149,715 (58.5%) |
| 2-Person Household | 194,811 (61.7%) | 120,966 (38.3%) |
| 3-Person Household | 99,002 (67.3%) | 48,076 (32.7%) |
| 4+ Person Household | 150,259 (72.1%) | 58,298 (28.0%) |
| Total Housing Units | 550,177 (59.3%) | 377,055 (40.7%) |
Occupancy by Educational Attainment in Area Code 512
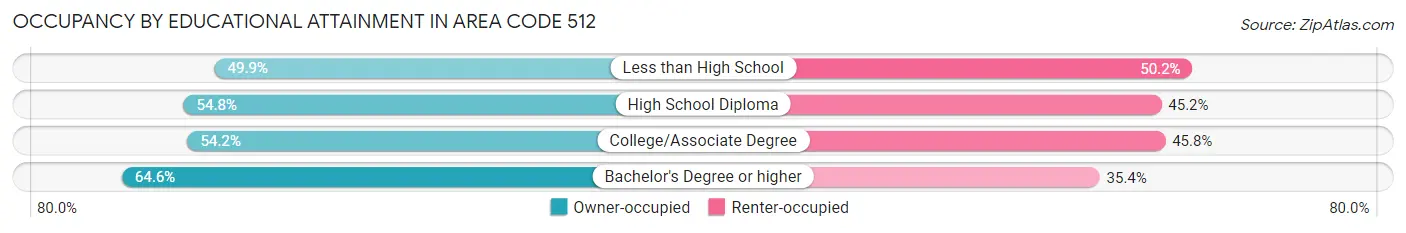
| Household Size | Owner-occupied | Renter-occupied |
| Less than High School | 31,388 (49.8%) | 31,573 (50.1%) |
| High School Diploma | 75,579 (54.8%) | 62,412 (45.2%) |
| College/Associate Degree | 133,651 (54.2%) | 113,136 (45.8%) |
| Bachelor's Degree or higher | 309,559 (64.6%) | 169,934 (35.4%) |
Occupancy by Age of Householder in Area Code 512
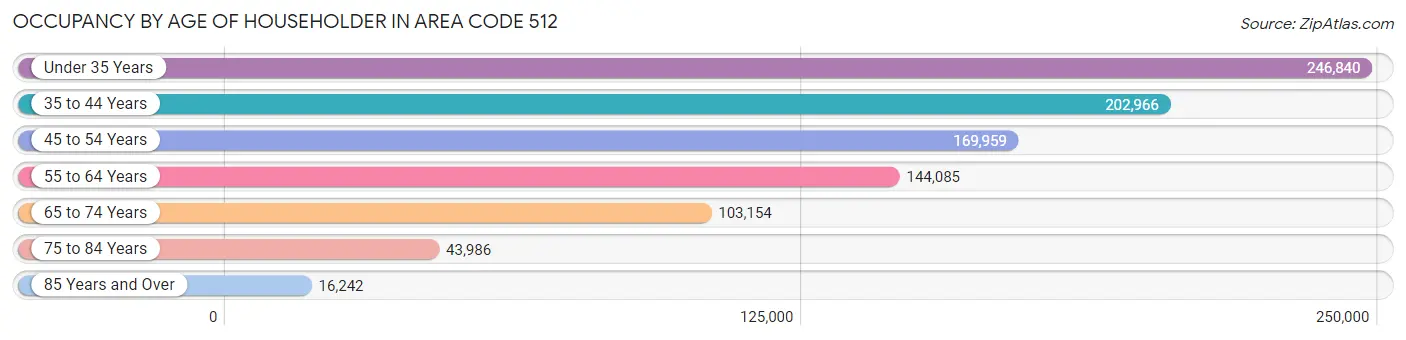
| Age Bracket | # Households | % Households |
| Under 35 Years | 246,840 | 26.6% |
| 35 to 44 Years | 202,966 | 21.9% |
| 45 to 54 Years | 169,959 | 18.3% |
| 55 to 64 Years | 144,085 | 15.5% |
| 65 to 74 Years | 103,154 | 11.1% |
| 75 to 84 Years | 43,986 | 4.7% |
| 85 Years and Over | 16,242 | 1.8% |
| Total | 927,232 | 100.0% |
Housing Finances in Area Code 512
Median Income by Occupancy in Area Code 512
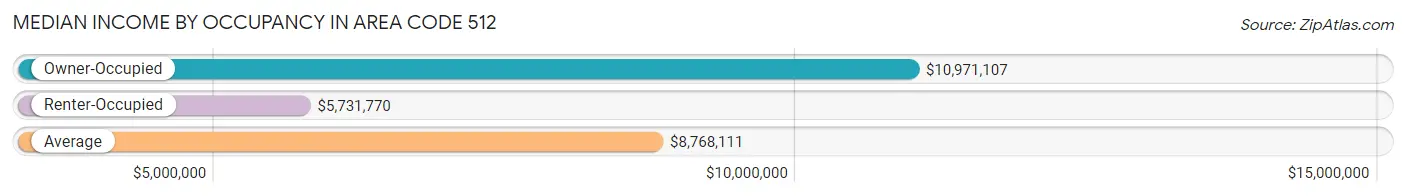
| Occupancy Type | # Households | Median Income |
| Owner-Occupied | 550,177 (59.3%) | $10,971,107 |
| Renter-Occupied | 377,055 (40.7%) | $5,731,770 |
| Average | 927,232 (100.0%) | $8,768,111 |
Occupancy by Householder Income Bracket in Area Code 512
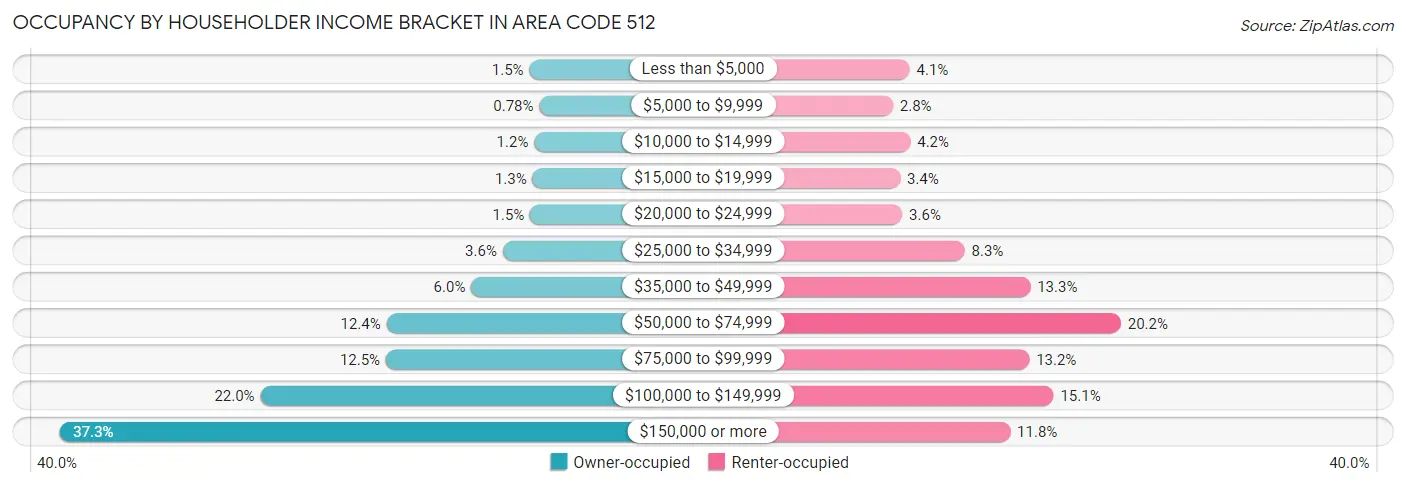
| Income Bracket | Owner-occupied | Renter-occupied |
| Less than $5,000 | 8,466 (1.5%) | 15,553 (4.1%) |
| $5,000 to $9,999 | 4,280 (0.8%) | 10,723 (2.8%) |
| $10,000 to $14,999 | 6,424 (1.2%) | 15,720 (4.2%) |
| $15,000 to $19,999 | 7,144 (1.3%) | 12,796 (3.4%) |
| $20,000 to $24,999 | 8,118 (1.5%) | 13,389 (3.5%) |
| $25,000 to $34,999 | 19,641 (3.6%) | 31,319 (8.3%) |
| $35,000 to $49,999 | 32,841 (6.0%) | 50,197 (13.3%) |
| $50,000 to $74,999 | 68,328 (12.4%) | 76,201 (20.2%) |
| $75,000 to $99,999 | 68,613 (12.5%) | 49,901 (13.2%) |
| $100,000 to $149,999 | 121,184 (22.0%) | 56,854 (15.1%) |
| $150,000 or more | 205,138 (37.3%) | 44,402 (11.8%) |
| Total | 550,177 (100.0%) | 377,055 (100.0%) |
Monthly Housing Cost Tiers in Area Code 512
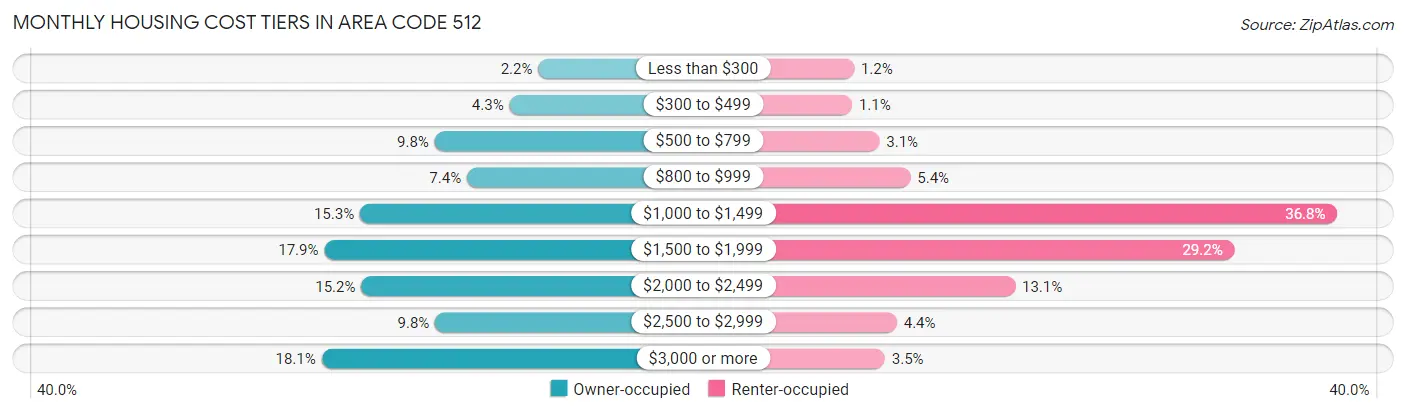
| Monthly Cost | Owner-occupied | Renter-occupied |
| Less than $300 | 11,916 (2.2%) | 4,612 (1.2%) |
| $300 to $499 | 23,579 (4.3%) | 4,029 (1.1%) |
| $500 to $799 | 53,908 (9.8%) | 11,663 (3.1%) |
| $800 to $999 | 40,806 (7.4%) | 20,239 (5.4%) |
| $1,000 to $1,499 | 84,200 (15.3%) | 138,777 (36.8%) |
| $1,500 to $1,999 | 98,665 (17.9%) | 110,248 (29.2%) |
| $2,000 to $2,499 | 83,620 (15.2%) | 49,319 (13.1%) |
| $2,500 to $2,999 | 53,709 (9.8%) | 16,465 (4.4%) |
| $3,000 or more | 99,774 (18.1%) | 13,159 (3.5%) |
| Total | 550,177 (100.0%) | 377,055 (100.0%) |
Physical Housing Characteristics in Area Code 512
Housing Structures in Area Code 512
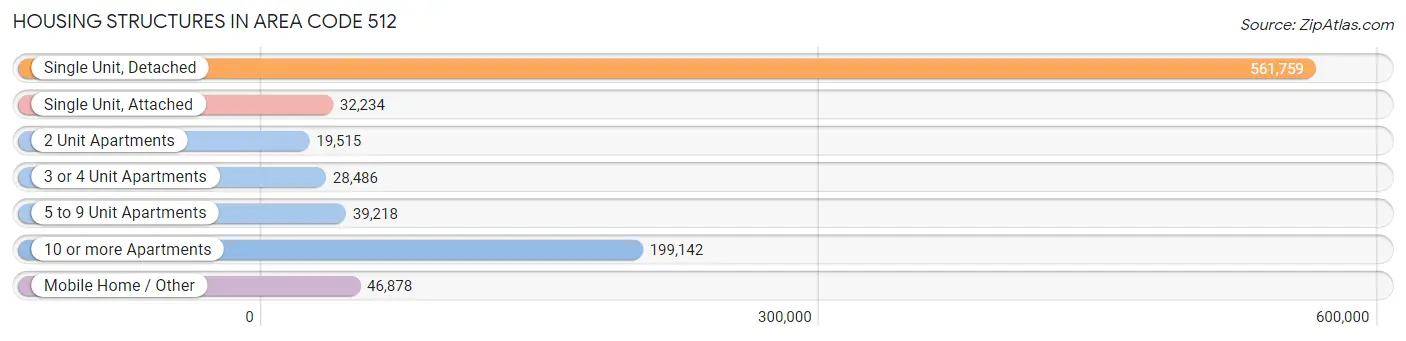
| Structure Type | # Housing Units | % Housing Units |
| Single Unit, Detached | 561,759 | 60.6% |
| Single Unit, Attached | 32,234 | 3.5% |
| 2 Unit Apartments | 19,515 | 2.1% |
| 3 or 4 Unit Apartments | 28,486 | 3.1% |
| 5 to 9 Unit Apartments | 39,218 | 4.2% |
| 10 or more Apartments | 199,142 | 21.5% |
| Mobile Home / Other | 46,878 | 5.1% |
| Total | 927,232 | 100.0% |
Housing Structures by Occupancy in Area Code 512
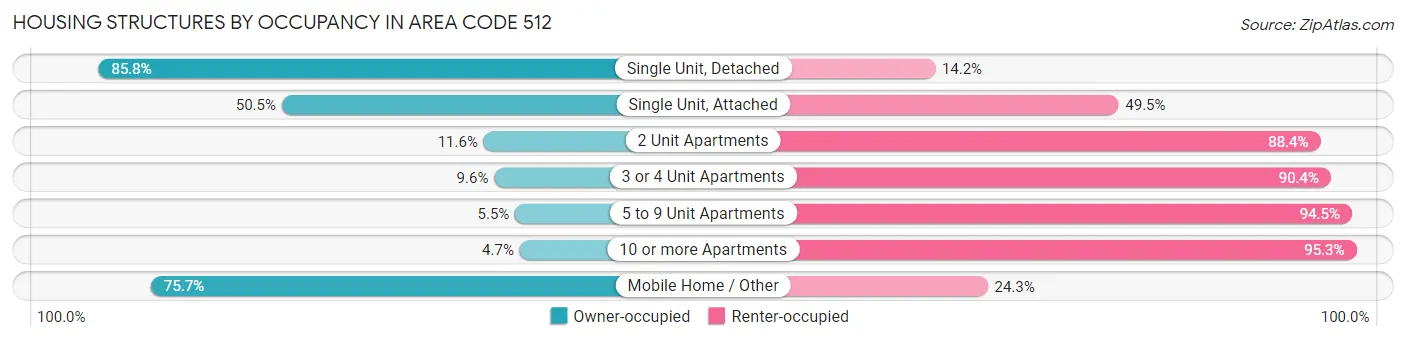
| Structure Type | Owner-occupied | Renter-occupied |
| Single Unit, Detached | 481,968 (85.8%) | 79,791 (14.2%) |
| Single Unit, Attached | 16,272 (50.5%) | 15,962 (49.5%) |
| 2 Unit Apartments | 2,264 (11.6%) | 17,251 (88.4%) |
| 3 or 4 Unit Apartments | 2,728 (9.6%) | 25,758 (90.4%) |
| 5 to 9 Unit Apartments | 2,171 (5.5%) | 37,047 (94.5%) |
| 10 or more Apartments | 9,301 (4.7%) | 189,841 (95.3%) |
| Mobile Home / Other | 35,473 (75.7%) | 11,405 (24.3%) |
| Total | 550,177 (59.3%) | 377,055 (40.7%) |
Housing Structures by Number of Rooms in Area Code 512
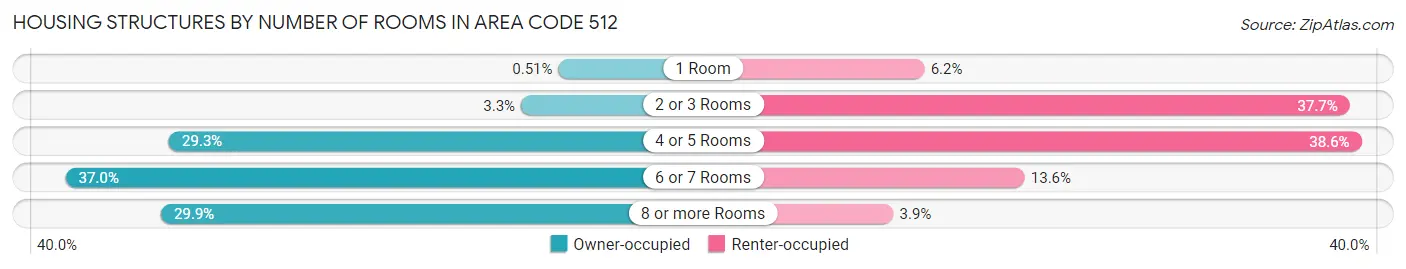
| Number of Rooms | Owner-occupied | Renter-occupied |
| 1 Room | 2,812 (0.5%) | 23,372 (6.2%) |
| 2 or 3 Rooms | 18,061 (3.3%) | 142,202 (37.7%) |
| 4 or 5 Rooms | 161,334 (29.3%) | 145,461 (38.6%) |
| 6 or 7 Rooms | 203,414 (37.0%) | 51,324 (13.6%) |
| 8 or more Rooms | 164,556 (29.9%) | 14,696 (3.9%) |
| Total | 550,177 (100.0%) | 377,055 (100.0%) |
Housing Structure by Heating Type in Area Code 512
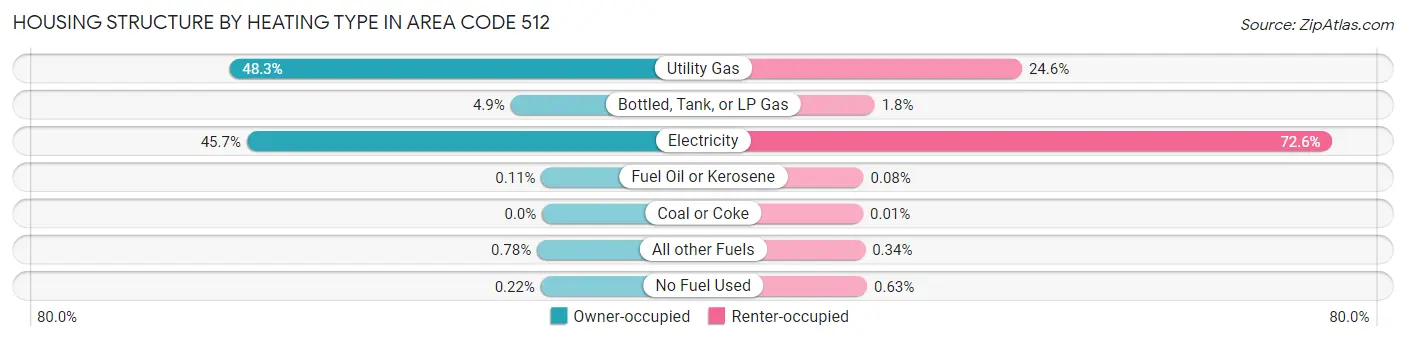
| Heating Type | Owner-occupied | Renter-occupied |
| Utility Gas | 265,959 (48.3%) | 92,661 (24.6%) |
| Bottled, Tank, or LP Gas | 26,849 (4.9%) | 6,789 (1.8%) |
| Electricity | 251,202 (45.7%) | 273,594 (72.6%) |
| Fuel Oil or Kerosene | 620 (0.1%) | 289 (0.1%) |
| Coal or Coke | 25 (0.0%) | 56 (0.0%) |
| All other Fuels | 4,292 (0.8%) | 1,297 (0.3%) |
| No Fuel Used | 1,230 (0.2%) | 2,369 (0.6%) |
| Total | 550,177 (100.0%) | 377,055 (100.0%) |
Household Vehicle Usage in Area Code 512
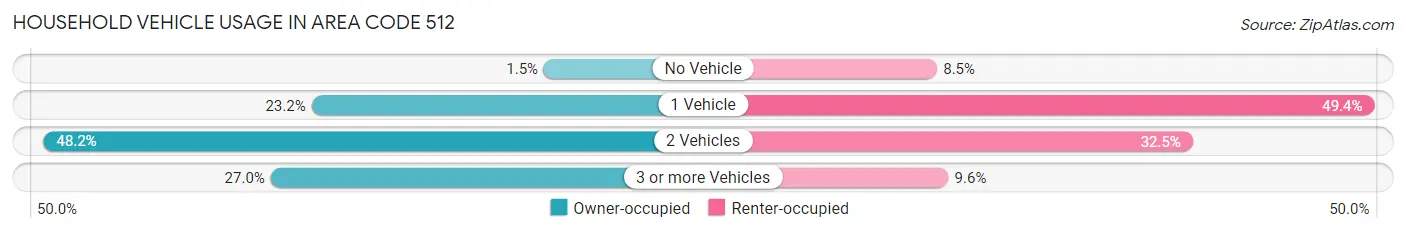
| Vehicles per Household | Owner-occupied | Renter-occupied |
| No Vehicle | 8,343 (1.5%) | 32,176 (8.5%) |
| 1 Vehicle | 127,727 (23.2%) | 186,317 (49.4%) |
| 2 Vehicles | 265,400 (48.2%) | 122,401 (32.5%) |
| 3 or more Vehicles | 148,707 (27.0%) | 36,161 (9.6%) |
| Total | 550,177 (100.0%) | 377,055 (100.0%) |
Real Estate & Mortgages in Area Code 512
Real Estate and Mortgage Overview in Area Code 512
| Characteristic | Without Mortgage | With Mortgage |
| Housing Units | 182,760 | 367,417 |
| Median Property Value | $34,530,099 | $38,374,200 |
| Median Household Income | $8,275,647 | $158,664 |
| Monthly Housing Costs | $78,114 | $96,288 |
| Real Estate Taxes | $467,550 | $8,953 |
Property Value by Mortgage Status in Area Code 512
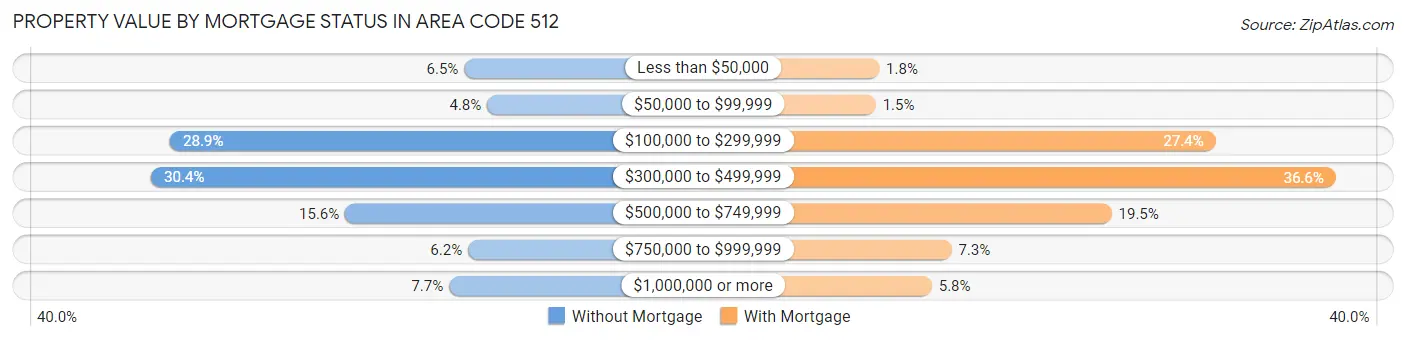
| Property Value | Without Mortgage | With Mortgage |
| Less than $50,000 | 11,892 (6.5%) | 6,629 (1.8%) |
| $50,000 to $99,999 | 8,701 (4.8%) | 5,649 (1.5%) |
| $100,000 to $299,999 | 52,845 (28.9%) | 100,769 (27.4%) |
| $300,000 to $499,999 | 55,480 (30.4%) | 134,445 (36.6%) |
| $500,000 to $749,999 | 28,468 (15.6%) | 71,699 (19.5%) |
| $750,000 to $999,999 | 11,366 (6.2%) | 26,872 (7.3%) |
| $1,000,000 or more | 14,008 (7.7%) | 21,354 (5.8%) |
| Total | 182,760 (100.0%) | 367,417 (100.0%) |
Household Income by Mortgage Status in Area Code 512
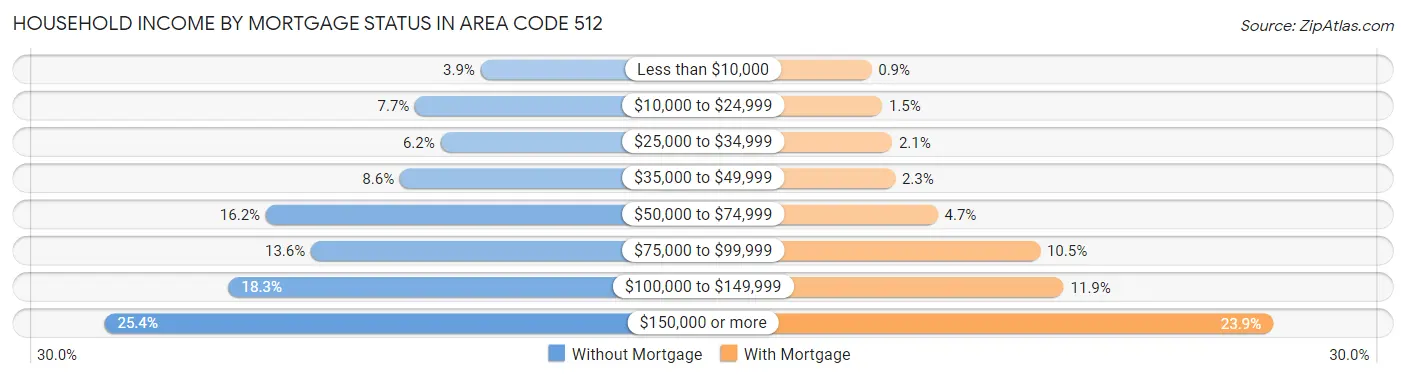
| Household Income | Without Mortgage | With Mortgage |
| Less than $10,000 | 7,197 (3.9%) | 3,316 (0.9%) |
| $10,000 to $24,999 | 14,038 (7.7%) | 5,549 (1.5%) |
| $25,000 to $34,999 | 11,392 (6.2%) | 7,648 (2.1%) |
| $35,000 to $49,999 | 15,617 (8.6%) | 8,249 (2.2%) |
| $50,000 to $74,999 | 29,620 (16.2%) | 17,224 (4.7%) |
| $75,000 to $99,999 | 24,909 (13.6%) | 38,708 (10.5%) |
| $100,000 to $149,999 | 33,513 (18.3%) | 43,704 (11.9%) |
| $150,000 or more | 46,474 (25.4%) | 87,671 (23.9%) |
| Total | 182,760 (100.0%) | 367,417 (100.0%) |
Property Value to Household Income Ratio in Area Code 512
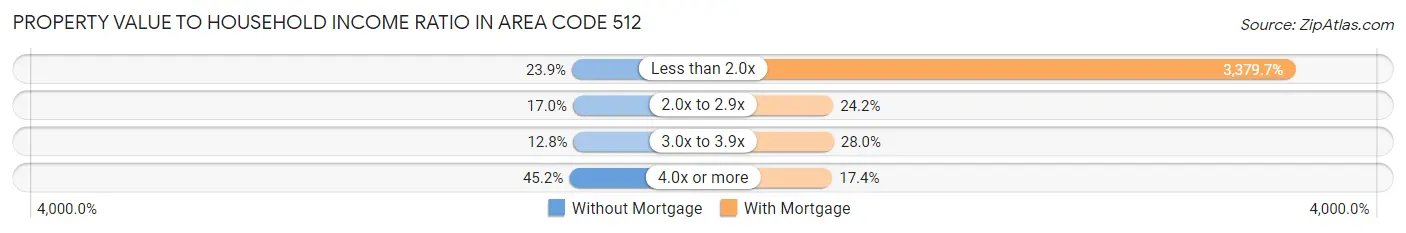
| Value-to-Income Ratio | Without Mortgage | With Mortgage |
| Less than 2.0x | 43,644 (23.9%) | 12,417,589 (3,379.7%) |
| 2.0x to 2.9x | 31,145 (17.0%) | 88,780 (24.2%) |
| 3.0x to 3.9x | 23,336 (12.8%) | 102,856 (28.0%) |
| 4.0x or more | 82,510 (45.2%) | 63,820 (17.4%) |
| Total | 182,760 (100.0%) | 367,417 (100.0%) |
Real Estate Taxes by Mortgage Status in Area Code 512
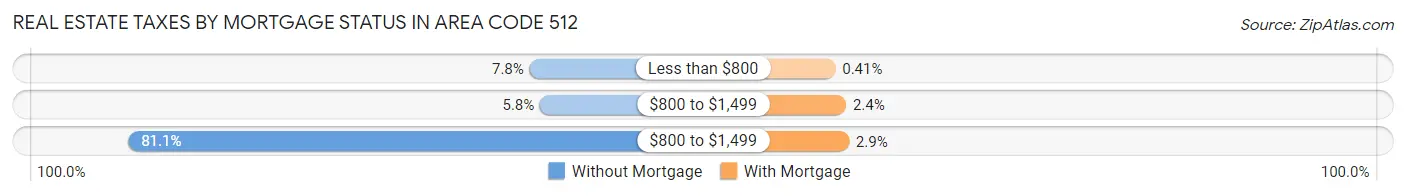
| Property Taxes | Without Mortgage | With Mortgage |
| Less than $800 | 14,189 (7.8%) | 1,502 (0.4%) |
| $800 to $1,499 | 10,665 (5.8%) | 8,661 (2.4%) |
| $800 to $1,499 | 148,156 (81.1%) | 10,646 (2.9%) |
| Total | 182,760 (100.0%) | 367,417 (100.0%) |
Health & Disability in Area Code 512
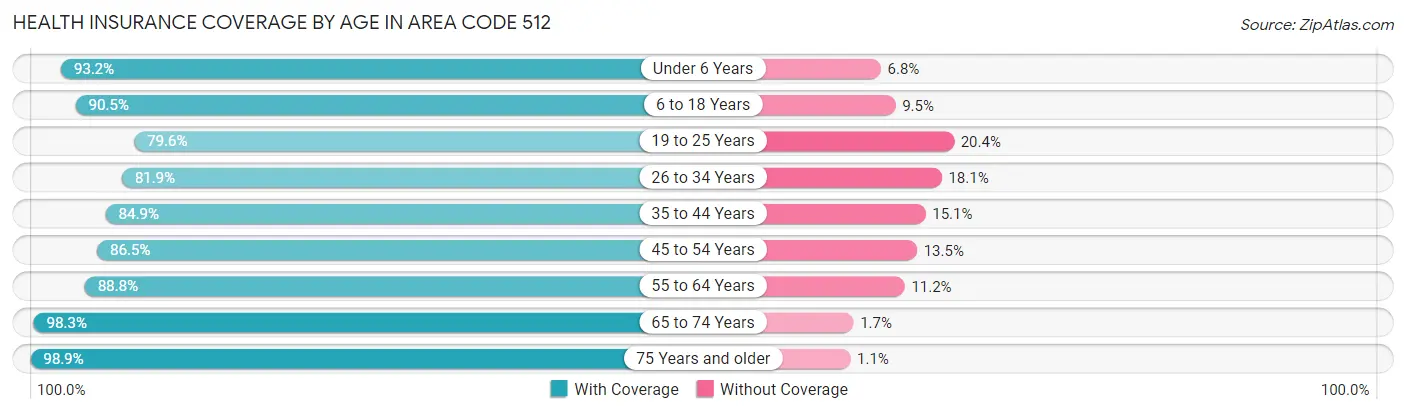
Health Insurance Coverage by Age in Area Code 512
| Age Bracket | With Coverage | Without Coverage |
| Under 6 Years | 154,046 (93.2%) | 11,191 (6.8%) |
| 6 to 18 Years | 351,480 (90.5%) | 36,887 (9.5%) |
| 19 to 25 Years | 185,049 (79.6%) | 47,458 (20.4%) |
| 26 to 34 Years | 293,414 (81.9%) | 64,923 (18.1%) |
| 35 to 44 Years | 316,105 (84.9%) | 56,254 (15.1%) |
| 45 to 54 Years | 261,652 (86.5%) | 40,871 (13.5%) |
| 55 to 64 Years | 221,424 (88.8%) | 27,989 (11.2%) |
| 65 to 74 Years | 169,749 (98.3%) | 2,890 (1.7%) |
| 75 Years and older | 94,509 (98.9%) | 1,033 (1.1%) |
| Total | 2,047,428 (87.6%) | 289,496 (12.4%) |
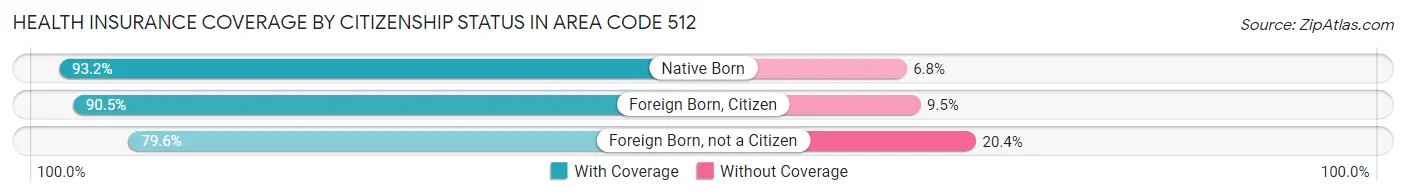
Health Insurance Coverage by Citizenship Status in Area Code 512
| Citizenship Status | With Coverage | Without Coverage |
| Native Born | 154,046 (93.2%) | 11,191 (6.8%) |
| Foreign Born, Citizen | 351,480 (90.5%) | 36,887 (9.5%) |
| Foreign Born, not a Citizen | 185,049 (79.6%) | 47,458 (20.4%) |
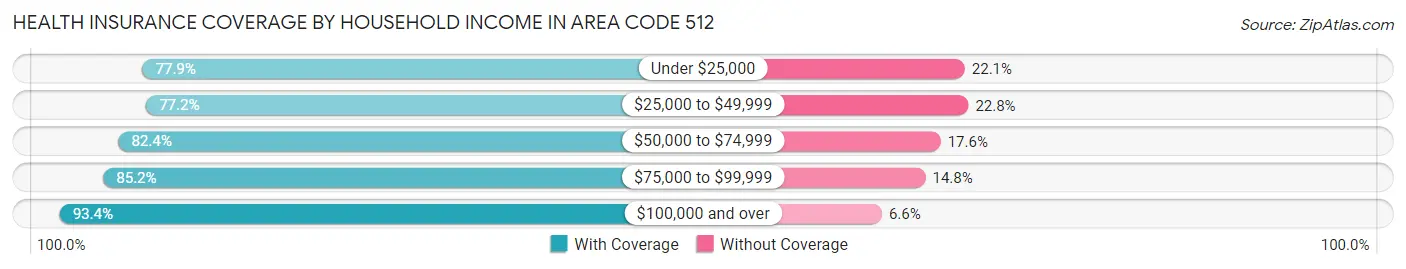
Health Insurance Coverage by Household Income in Area Code 512
| Household Income | With Coverage | Without Coverage |
| Under $25,000 | 142,904 (77.9%) | 40,590 (22.1%) |
| $25,000 to $49,999 | 211,285 (77.2%) | 62,352 (22.8%) |
| $50,000 to $74,999 | 264,157 (82.4%) | 56,405 (17.6%) |
| $75,000 to $99,999 | 251,842 (85.2%) | 43,617 (14.8%) |
| $100,000 and over | 1,152,811 (93.4%) | 81,375 (6.6%) |
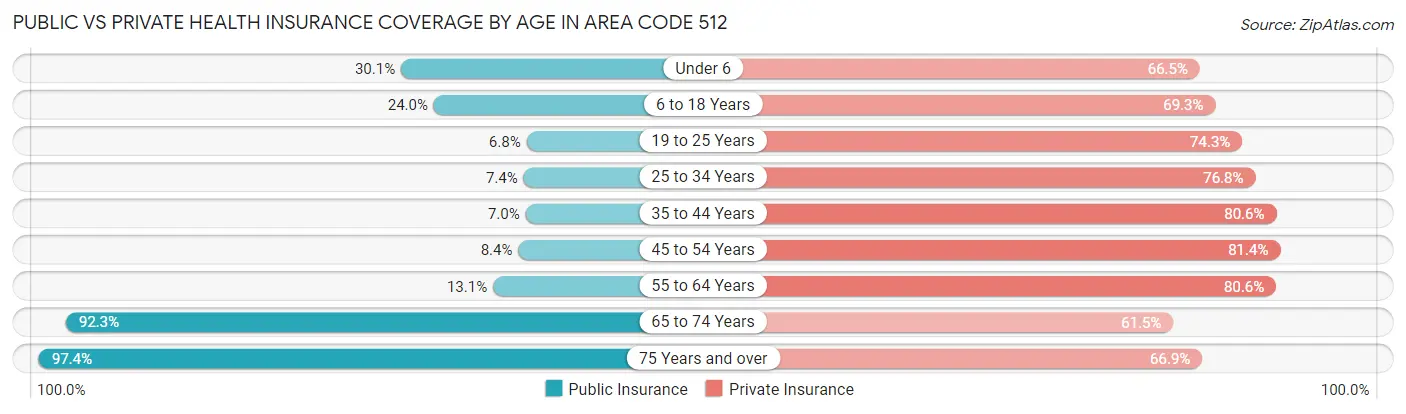
Public vs Private Health Insurance Coverage by Age in Area Code 512
| Age Bracket | Public Insurance | Private Insurance |
| Under 6 | 49,800 (30.1%) | 109,792 (66.4%) |
| 6 to 18 Years | 93,379 (24.0%) | 269,259 (69.3%) |
| 19 to 25 Years | 15,894 (6.8%) | 172,766 (74.3%) |
| 25 to 34 Years | 26,477 (7.4%) | 275,063 (76.8%) |
| 35 to 44 Years | 26,148 (7.0%) | 300,252 (80.6%) |
| 45 to 54 Years | 25,297 (8.4%) | 246,173 (81.4%) |
| 55 to 64 Years | 32,570 (13.1%) | 201,046 (80.6%) |
| 65 to 74 Years | 159,413 (92.3%) | 106,237 (61.5%) |
| 75 Years and over | 93,019 (97.4%) | 63,902 (66.9%) |
| Total | 521,997 (22.3%) | 1,744,490 (74.7%) |
Disability Status by Sex by Age in Area Code 512
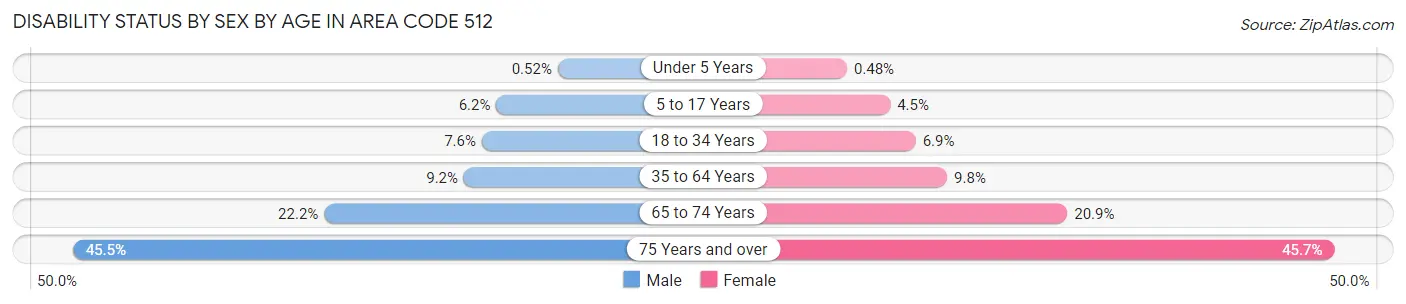
| Age Bracket | Male | Female |
| Under 5 Years | 363 (0.5%) | 330 (0.5%) |
| 5 to 17 Years | 12,211 (6.2%) | 8,444 (4.5%) |
| 18 to 34 Years | 23,956 (7.6%) | 20,930 (6.9%) |
| 35 to 64 Years | 43,642 (9.2%) | 44,150 (9.8%) |
| 65 to 74 Years | 17,983 (22.2%) | 19,184 (20.9%) |
| 75 Years and over | 18,680 (45.5%) | 24,914 (45.7%) |
Disability Class by Sex by Age in Area Code 512
Disability Class: Hearing Difficulty
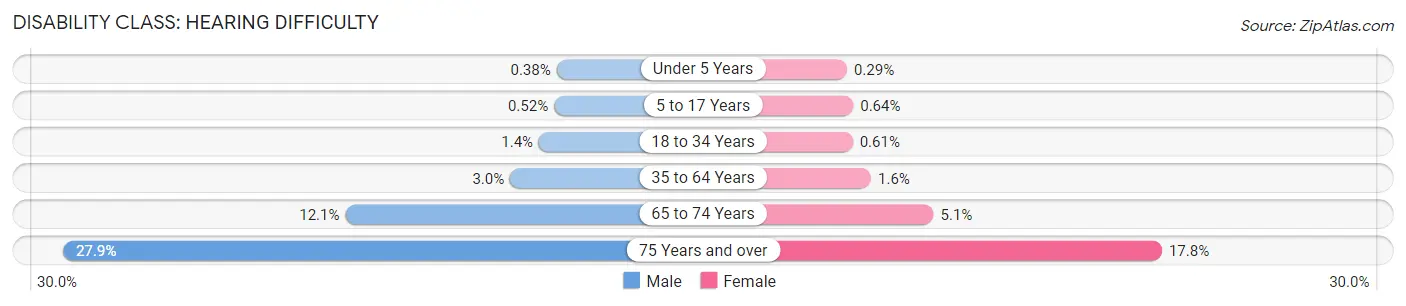
| Age Bracket | Male | Female |
| Under 5 Years | 270 (0.4%) | 197 (0.3%) |
| 5 to 17 Years | 1,022 (0.5%) | 1,210 (0.6%) |
| 18 to 34 Years | 4,292 (1.4%) | 1,867 (0.6%) |
| 35 to 64 Years | 14,062 (3.0%) | 7,353 (1.6%) |
| 65 to 74 Years | 9,830 (12.1%) | 4,682 (5.1%) |
| 75 Years and over | 11,432 (27.9%) | 9,722 (17.8%) |
Disability Class: Vision Difficulty
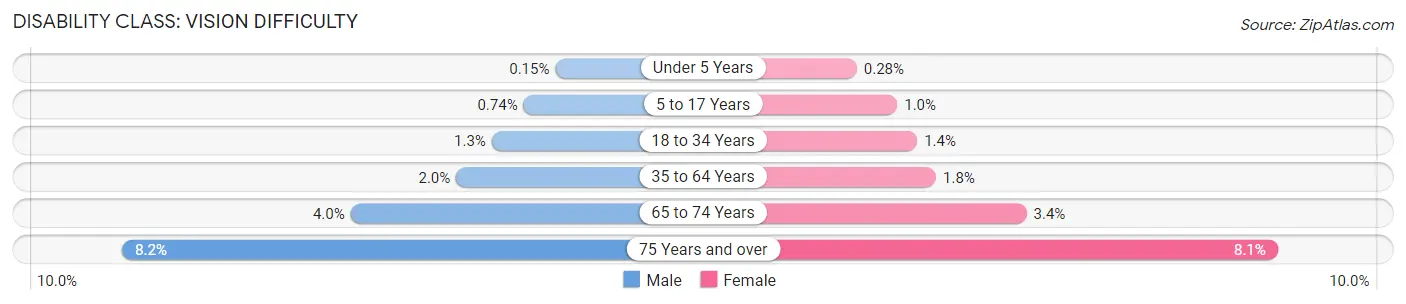
| Age Bracket | Male | Female |
| Under 5 Years | 109 (0.2%) | 192 (0.3%) |
| 5 to 17 Years | 1,452 (0.7%) | 1,940 (1.0%) |
| 18 to 34 Years | 4,216 (1.3%) | 4,266 (1.4%) |
| 35 to 64 Years | 9,423 (2.0%) | 7,891 (1.8%) |
| 65 to 74 Years | 3,200 (4.0%) | 3,146 (3.4%) |
| 75 Years and over | 3,360 (8.2%) | 4,412 (8.1%) |
Disability Class: Cognitive Difficulty
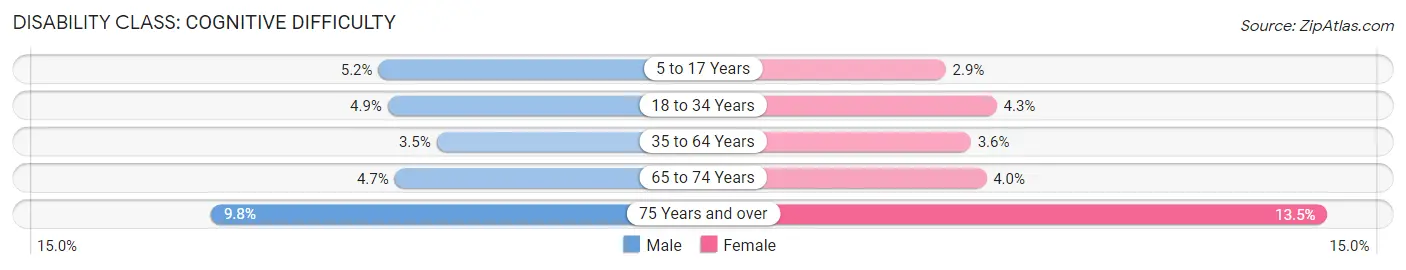
| Age Bracket | Male | Female |
| 5 to 17 Years | 10,105 (5.1%) | 5,435 (2.9%) |
| 18 to 34 Years | 15,470 (4.9%) | 13,136 (4.3%) |
| 35 to 64 Years | 16,695 (3.5%) | 16,194 (3.6%) |
| 65 to 74 Years | 3,805 (4.7%) | 3,686 (4.0%) |
| 75 Years and over | 4,024 (9.8%) | 7,373 (13.5%) |
Disability Class: Ambulatory Difficulty
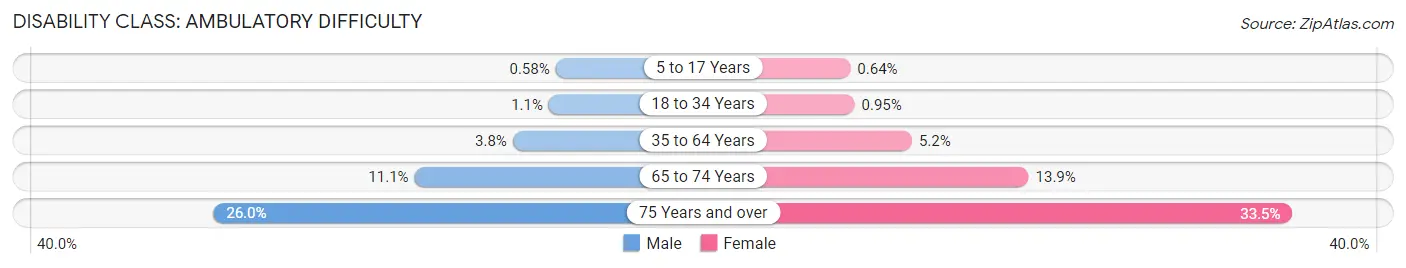
| Age Bracket | Male | Female |
| 5 to 17 Years | 1,137 (0.6%) | 1,214 (0.6%) |
| 18 to 34 Years | 3,412 (1.1%) | 2,884 (0.9%) |
| 35 to 64 Years | 17,771 (3.8%) | 23,531 (5.2%) |
| 65 to 74 Years | 8,960 (11.1%) | 12,709 (13.9%) |
| 75 Years and over | 10,662 (26.0%) | 18,237 (33.5%) |
Disability Class: Self-Care Difficulty
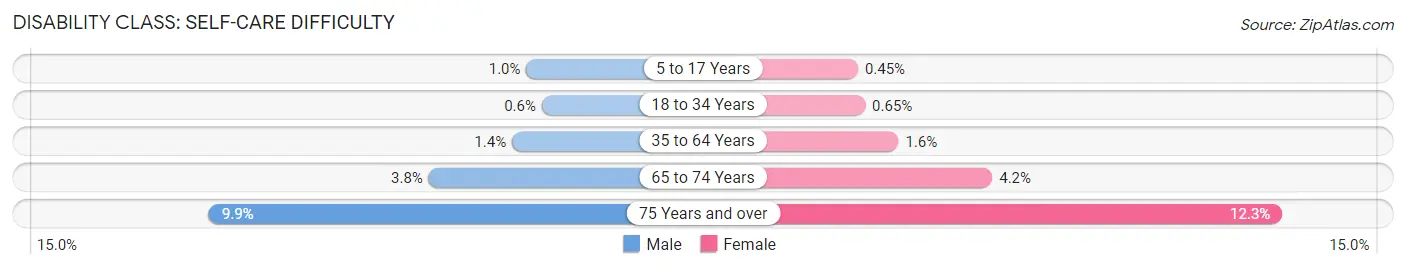
| Age Bracket | Male | Female |
| 5 to 17 Years | 2,018 (1.0%) | 845 (0.4%) |
| 18 to 34 Years | 1,914 (0.6%) | 1,967 (0.6%) |
| 35 to 64 Years | 6,750 (1.4%) | 7,126 (1.6%) |
| 65 to 74 Years | 3,040 (3.7%) | 3,840 (4.2%) |
| 75 Years and over | 4,049 (9.9%) | 6,685 (12.3%) |
Technology Access in Area Code 512
Computing Device Access in Area Code 512
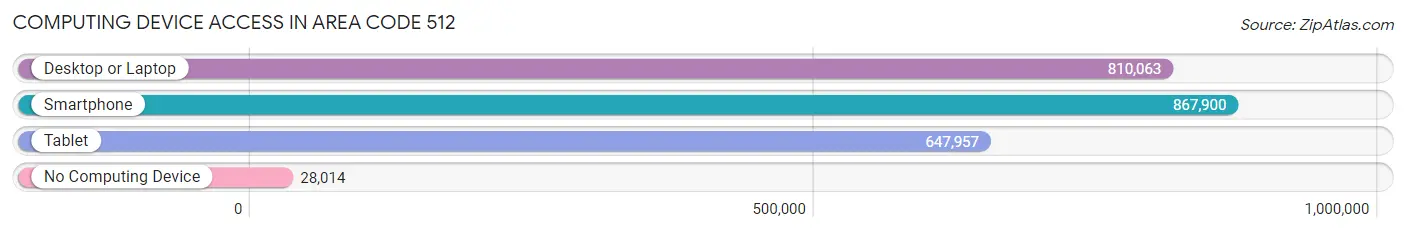
| Device Type | # Households | % Households |
| Desktop or Laptop | 810,063 | 87.4% |
| Smartphone | 867,900 | 93.6% |
| Tablet | 647,957 | 69.9% |
| No Computing Device | 28,014 | 3.0% |
| Total | 927,232 | 100.0% |
Internet Access in Area Code 512
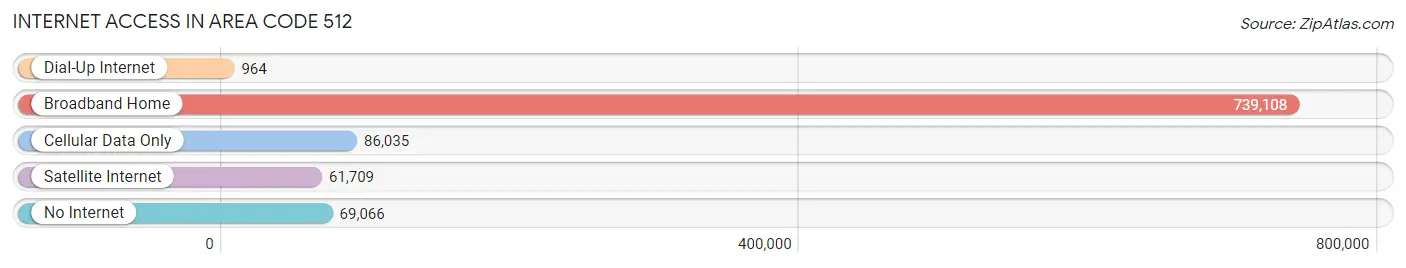
| Internet Type | # Households | % Households |
| Dial-Up Internet | 964 | 0.1% |
| Broadband Home | 739,108 | 79.7% |
| Cellular Data Only | 86,035 | 9.3% |
| Satellite Internet | 61,709 | 6.7% |
| No Internet | 69,066 | 7.4% |
| Total | 927,232 | 100.0% |
Area Code 512 Summary
Geography
Area code 512 is located in the state of Texas. It covers the Austin metropolitan area, which includes the cities of Austin, Round Rock, Georgetown, and San Marcos. It also covers parts of Travis, Williamson, Hays, Burnet, and Bastrop counties.
Social
Area code 512 is home to a diverse population of people from all walks of life. The city of Austin is known for its vibrant music and art scene, and the area is home to many festivals and events throughout the year. The area is also home to a number of universities and colleges, including the University of Texas at Austin.
Economics
Area code 512 is home to a thriving economy. The city of Austin is a major tech hub, and many tech companies have their headquarters in the area. The area is also home to a number of large corporations, including Dell, IBM, and Apple.
Demographics
Area code 512 is home to a diverse population. According to the U.S. Census Bureau, the population of the area is approximately 1.9 million people. The population is made up of a variety of ethnicities, including White, African American, Hispanic, and Asian. The median household income in the area is approximately $63,000.
Common Questions
What is Per Capita Income in Area Code 512?
Per Capita income in Area Code 512 is $48,443.
What is the Median Family Income in Area Code 512?
Median Family Income in Area Code 512 is $116,099.
What is the Median Household income in Area Code 512?
Median Household Income in Area Code 512 is $94,281.
What is Income or Wage Gap in Area Code 512?
Income or Wage Gap in Area Code 512 is 30.5%.
Women in Area Code 512 earn 69.5 cents for every dollar earned by a man.
What is Family Income Deficit in Area Code 512?
Family Income Deficit in Area Code 512 is $10,710.
Families that are below poverty line in Area Code 512 earn $10,710 less on average than the poverty threshold level.
What is Inequality or Gini Index in Area Code 512?
Inequality or Gini Index in Area Code 512 is 39.69.
What is the Total Population of Area Code 512?
Total Population of Area Code 512 is 2,356,612.
What is the Total Male Population of Area Code 512?
Total Male Population of Area Code 512 is 1,190,810.
What is the Total Female Population of Area Code 512?
Total Female Population of Area Code 512 is 1,165,802.
What is the Ratio of Males per 100 Females in Area Code 512?
There are 102.15 Males per 100 Females in Area Code 512.
What is the Ratio of Females per 100 Males in Area Code 512?
There are 97.90 Females per 100 Males in Area Code 512.
What is the Median Population Age in Area Code 512?
Median Population Age in Area Code 512 is 38.2 Years.
What is the Average Family Size in Area Code 512
Average Family Size in Area Code 512 is 3.1 People.
What is the Average Household Size in Area Code 512
Average Household Size in Area Code 512 is 2.6 People.
How Large is the Labor Force in Area Code 512?
There are 1,272,222 People in the Labor Forcein in Area Code 512.
What is the Percentage of People in the Labor Force in Area Code 512?
67.3% of People are in the Labor Force in Area Code 512.
What is the Unemployment Rate in Area Code 512?
Unemployment Rate in Area Code 512 is 4.3%.