Area Code 940 Map & Demographics
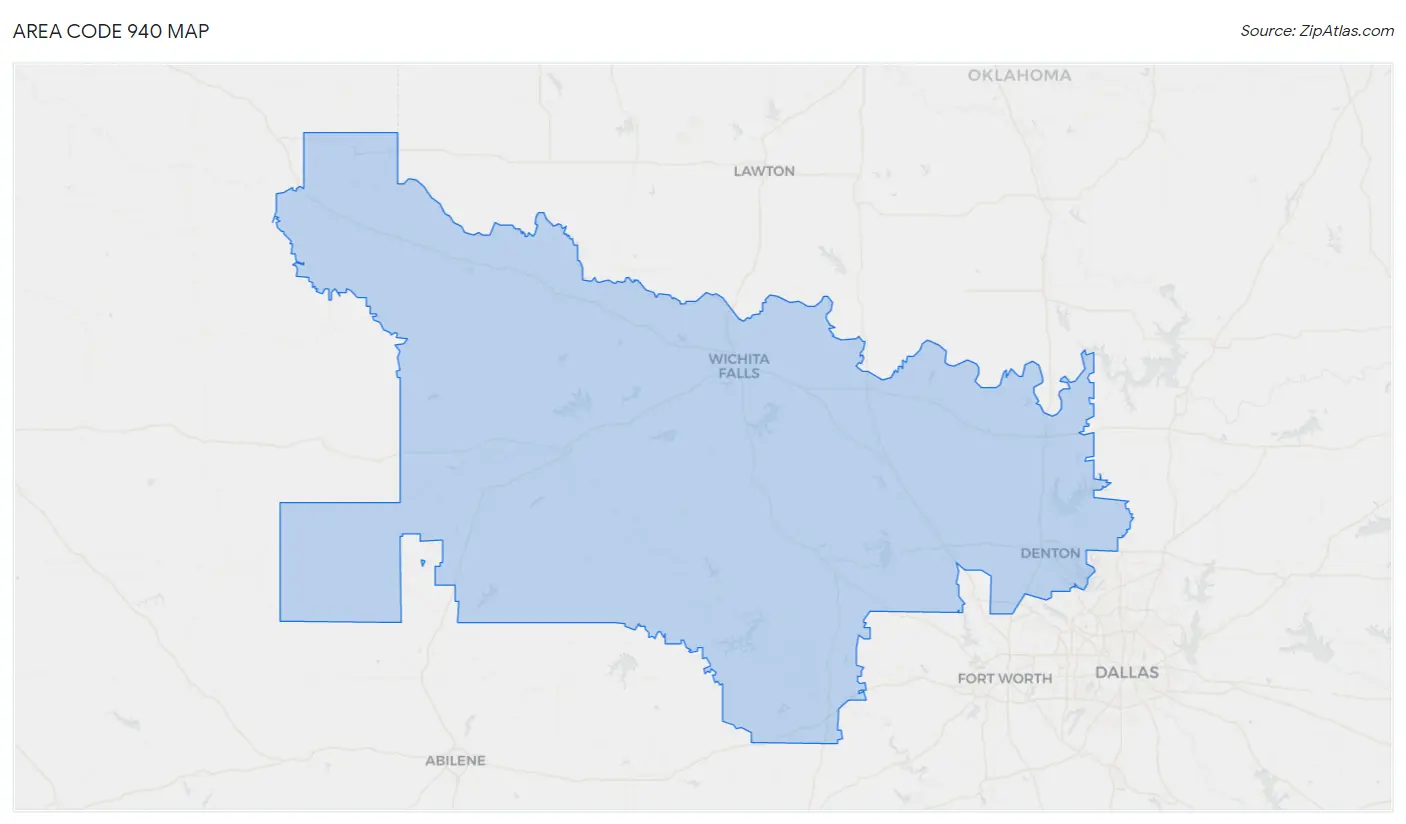
Area Code 940 Map
Area Code 940 Overview
$35,558
PER CAPITA INCOME
$86,388
AVG FAMILY INCOME
$71,296
AVG HOUSEHOLD INCOME
35.1%
WAGE / INCOME GAP [ % ]
64.9¢/ $1
WAGE / INCOME GAP [ $ ]
$10,989
FAMILY INCOME DEFICIT
38.89
INEQUALITY / GINI INDEX
795,419
TOTAL POPULATION
399,646
MALE POPULATION
395,773
FEMALE POPULATION
100.98
MALES / 100 FEMALES
99.03
FEMALES / 100 MALES
41.9
MEDIAN AGE
3.1
AVG FAMILY SIZE
2.6
AVG HOUSEHOLD SIZE
391,362
LABOR FORCE [ PEOPLE ]
61.9%
PERCENT IN LABOR FORCE
4.5%
UNEMPLOYMENT RATE
Income in Area Code 940
Income Overview in Area Code 940
Per Capita Income in Area Code 940 is $35,558, while median incomes of families and households are $86,388 and $71,296 respectively.
| Characteristic | Number | Measure |
| Per Capita Income | 795,419 | $35,558 |
| Median Family Income | 200,828 | $86,388 |
| Mean Family Income | 200,828 | $9,532,595 |
| Median Household Income | 292,132 | $71,296 |
| Mean Household Income | 292,132 | $8,393,394 |
| Income Deficit | 200,828 | $10,989 |
| Wage / Income Gap (%) | 795,419 | 35.14% |
| Wage / Income Gap ($) | 795,419 | 64.86¢ per $1 |
| Gini / Inequality Index | 795,419 | 38.89 |
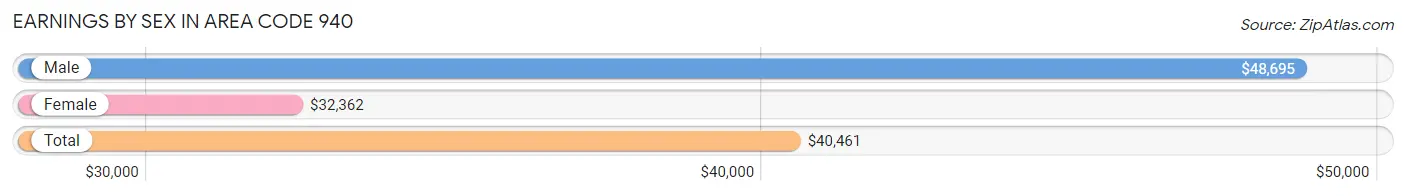
Earnings by Sex in Area Code 940
Average Earnings in Area Code 940 are $40,461, $48,695 for men and $32,362 for women, a difference of 33.5%.
| Sex | Number | Average Earnings |
| Male | 236,109 (53.8%) | $48,695 |
| Female | 202,453 (46.2%) | $32,362 |
| Total | 438,562 (100.0%) | $40,461 |
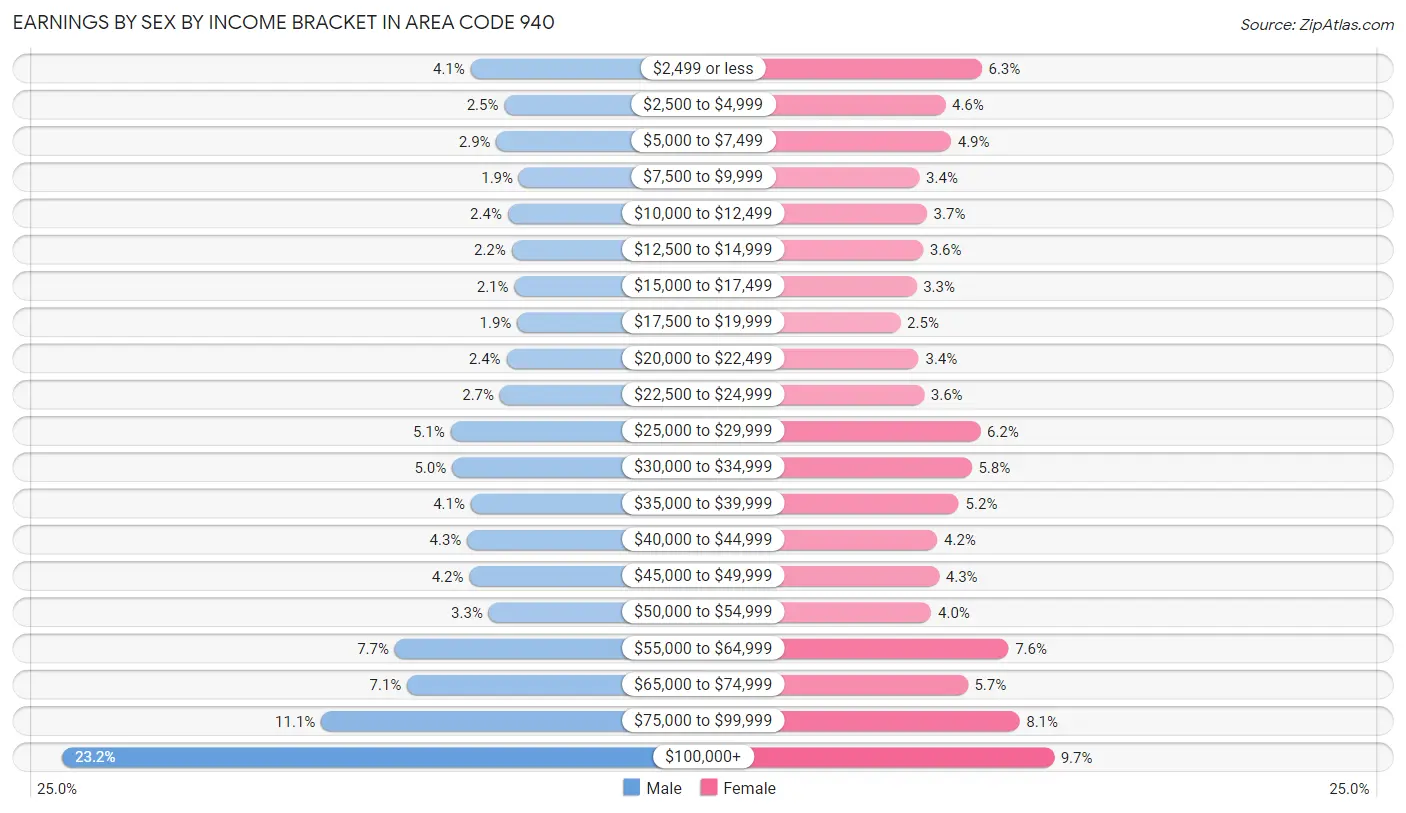
Earnings by Sex by Income Bracket in Area Code 940
The most common earnings brackets in Area Code 940 are $100,000+ for men (54,867 | 23.2%) and $100,000+ for women (19,610 | 9.7%).
| Income | Male | Female |
| $2,499 or less | 9,703 (4.1%) | 12,778 (6.3%) |
| $2,500 to $4,999 | 5,969 (2.5%) | 9,311 (4.6%) |
| $5,000 to $7,499 | 6,853 (2.9%) | 9,867 (4.9%) |
| $7,500 to $9,999 | 4,360 (1.8%) | 6,871 (3.4%) |
| $10,000 to $12,499 | 5,592 (2.4%) | 7,572 (3.7%) |
| $12,500 to $14,999 | 5,160 (2.2%) | 7,201 (3.6%) |
| $15,000 to $17,499 | 4,872 (2.1%) | 6,588 (3.3%) |
| $17,500 to $19,999 | 4,551 (1.9%) | 5,052 (2.5%) |
| $20,000 to $22,499 | 5,740 (2.4%) | 6,797 (3.4%) |
| $22,500 to $24,999 | 6,458 (2.7%) | 7,314 (3.6%) |
| $25,000 to $29,999 | 11,912 (5.1%) | 12,643 (6.2%) |
| $30,000 to $34,999 | 11,750 (5.0%) | 11,820 (5.8%) |
| $35,000 to $39,999 | 9,678 (4.1%) | 10,612 (5.2%) |
| $40,000 to $44,999 | 10,079 (4.3%) | 8,571 (4.2%) |
| $45,000 to $49,999 | 9,844 (4.2%) | 8,731 (4.3%) |
| $50,000 to $54,999 | 7,705 (3.3%) | 7,997 (4.0%) |
| $55,000 to $64,999 | 18,075 (7.7%) | 15,305 (7.6%) |
| $65,000 to $74,999 | 16,715 (7.1%) | 11,446 (5.7%) |
| $75,000 to $99,999 | 26,226 (11.1%) | 16,367 (8.1%) |
| $100,000+ | 54,867 (23.2%) | 19,610 (9.7%) |
| Total | 236,109 (100.0%) | 202,453 (100.0%) |
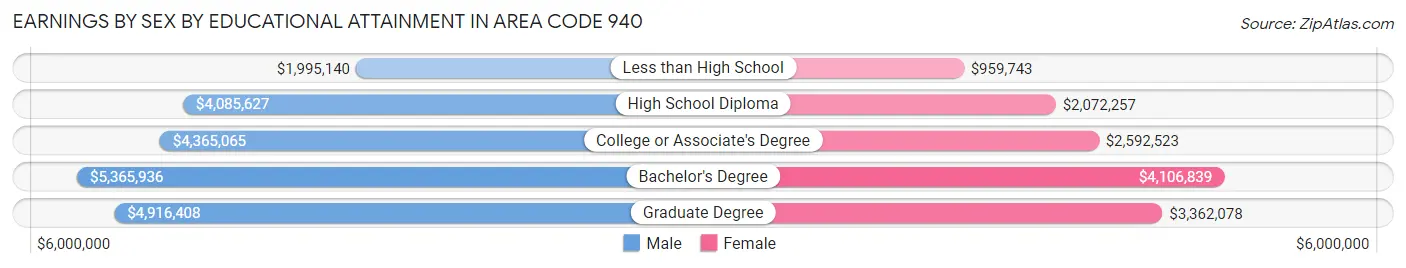
Earnings by Sex by Educational Attainment in Area Code 940
Average earnings in Area Code 940 are $4,941,216 for men and $3,172,555 for women, a difference of 35.8%. Men with an educational attainment of bachelor's degree enjoy the highest average annual earnings of $5,365,936, while those with less than high school education earn the least with $1,995,140. Women with an educational attainment of bachelor's degree earn the most with the average annual earnings of $4,106,839, while those with less than high school education have the smallest earnings of $959,743.
| Educational Attainment | Male Income | Female Income |
| Less than High School | $1,995,140 | $959,743 |
| High School Diploma | $4,085,627 | $2,072,257 |
| College or Associate's Degree | $4,365,065 | $2,592,523 |
| Bachelor's Degree | $5,365,936 | $4,106,839 |
| Graduate Degree | $4,916,408 | $3,362,078 |
| Total | $4,941,216 | $3,172,555 |
Family Income in Area Code 940
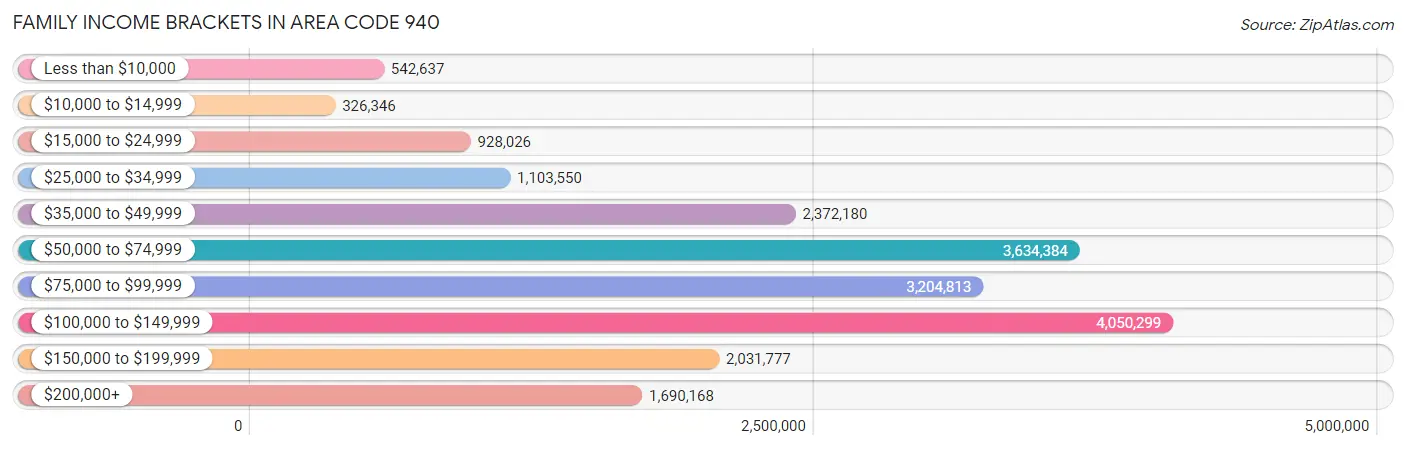
Family Income Brackets in Area Code 940
According to the Area Code 940 family income data, there are 4,050,299 families falling into the $100,000 to $149,999 income range, which is the most common income bracket and makes up 2,016.8% of all families. Conversely, the $10,000 to $14,999 income bracket is the least frequent group with only 326,346 families (162.5%) belonging to this category.
| Income Bracket | # Families | % Families |
| Less than $10,000 | 542,637 | 270.2% |
| $10,000 to $14,999 | 326,346 | 162.5% |
| $15,000 to $24,999 | 928,026 | 462.1% |
| $25,000 to $34,999 | 1,103,550 | 549.5% |
| $35,000 to $49,999 | 2,372,180 | 1,181.2% |
| $50,000 to $74,999 | 3,634,384 | 1,809.7% |
| $75,000 to $99,999 | 3,204,813 | 1,595.8% |
| $100,000 to $149,999 | 4,050,299 | 2,016.8% |
| $150,000 to $199,999 | 2,031,777 | 1,011.7% |
| $200,000+ | 1,690,168 | 841.6% |
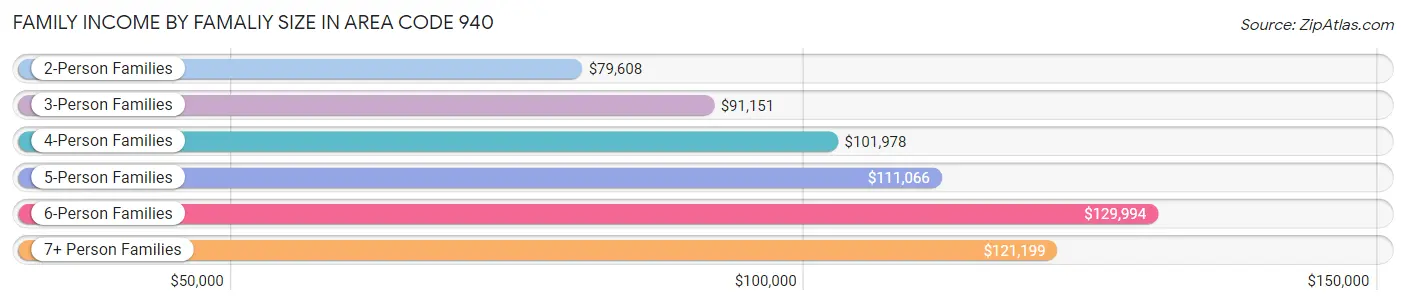
Family Income by Famaliy Size in Area Code 940
6-person families (5,338 | 2.7%) account for the highest median family income in Area Code 940 with $129,994 per family, while 2-person families (91,215 | 45.4%) have the highest median income of $39,804 per family member.
| Income Bracket | # Families | Median Income |
| 2-Person Families | 91,215 (45.4%) | $79,608 |
| 3-Person Families | 43,542 (21.7%) | $91,151 |
| 4-Person Families | 40,040 (19.9%) | $101,978 |
| 5-Person Families | 17,644 (8.8%) | $111,066 |
| 6-Person Families | 5,338 (2.7%) | $129,994 |
| 7+ Person Families | 3,049 (1.5%) | $121,199 |
| Total | 200,828 (100.0%) | $86,388 |
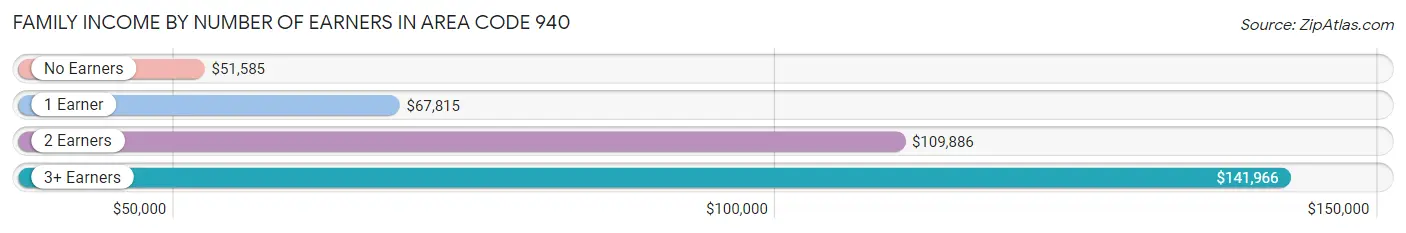
Family Income by Number of Earners in Area Code 940
The median family income in Area Code 940 is $86,388, with families comprising 3+ earners (22,100) having the highest median family income of $141,966, while families with no earners (23,007) have the lowest median family income of $51,585, accounting for 11.0% and 11.5% of families, respectively.
| Number of Earners | # Families | Median Income |
| No Earners | 23,007 (11.5%) | $51,585 |
| 1 Earner | 63,485 (31.6%) | $67,815 |
| 2 Earners | 92,236 (45.9%) | $109,886 |
| 3+ Earners | 22,100 (11.0%) | $141,966 |
| Total | 200,828 (100.0%) | $86,388 |
Household Income in Area Code 940
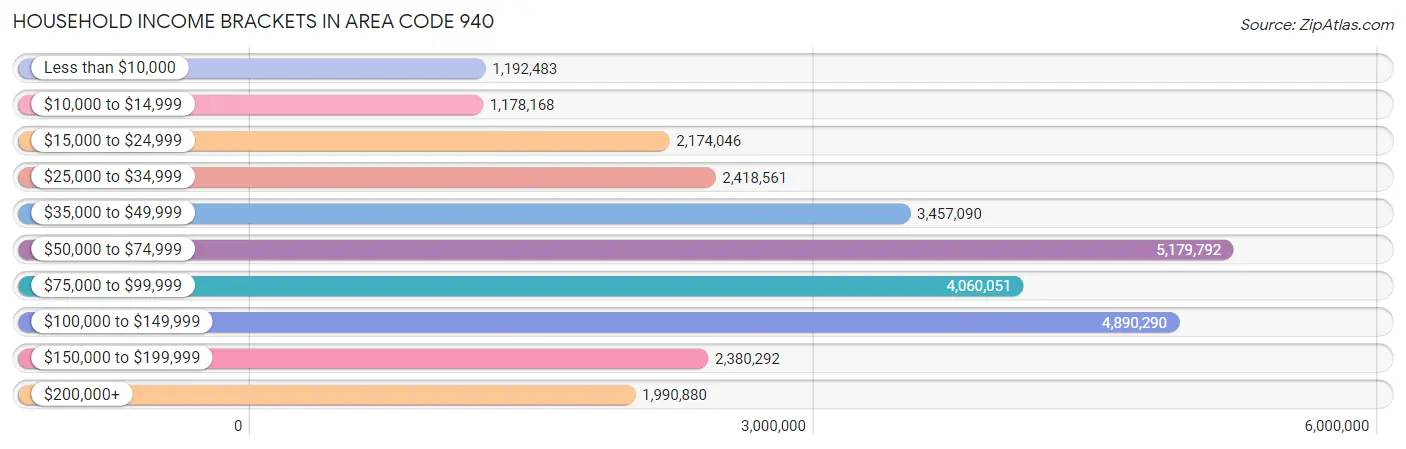
Household Income Brackets in Area Code 940
With 5,179,792 households falling in the category, the $50,000 to $74,999 income range is the most frequent in Area Code 940, accounting for 1,773.1% of all households. In contrast, only 1,178,168 households (403.3%) fall into the $10,000 to $14,999 income bracket, making it the least populous group.
| Income Bracket | # Households | % Households |
| Less than $10,000 | 1,192,483 | 408.2% |
| $10,000 to $14,999 | 1,178,168 | 403.3% |
| $15,000 to $24,999 | 2,174,046 | 744.2% |
| $25,000 to $34,999 | 2,418,561 | 827.9% |
| $35,000 to $49,999 | 3,457,090 | 1,183.4% |
| $50,000 to $74,999 | 5,179,792 | 1,773.1% |
| $75,000 to $99,999 | 4,060,051 | 1,389.8% |
| $100,000 to $149,999 | 4,890,290 | 1,674.0% |
| $150,000 to $199,999 | 2,380,292 | 814.8% |
| $200,000+ | 1,990,880 | 681.5% |
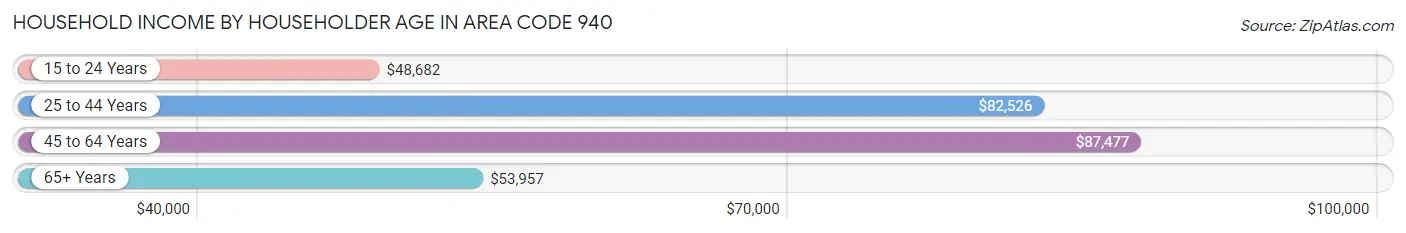
Household Income by Householder Age in Area Code 940
The median household income in Area Code 940 is $71,296, with the highest median household income of $87,477 found in the 45 to 64 years age bracket for the primary householder. A total of 108,586 households (37.2%) fall into this category. Meanwhile, the 15 to 24 years age bracket for the primary householder has the lowest median household income of $48,682, with 16,195 households (5.5%) in this group.
| Income Bracket | # Households | Median Income |
| 15 to 24 Years | 16,195 (5.5%) | $48,682 |
| 25 to 44 Years | 102,719 (35.2%) | $82,526 |
| 45 to 64 Years | 108,586 (37.2%) | $87,477 |
| 65+ Years | 64,632 (22.1%) | $53,957 |
| Total | 292,132 (100.0%) | $71,296 |
Poverty in Area Code 940
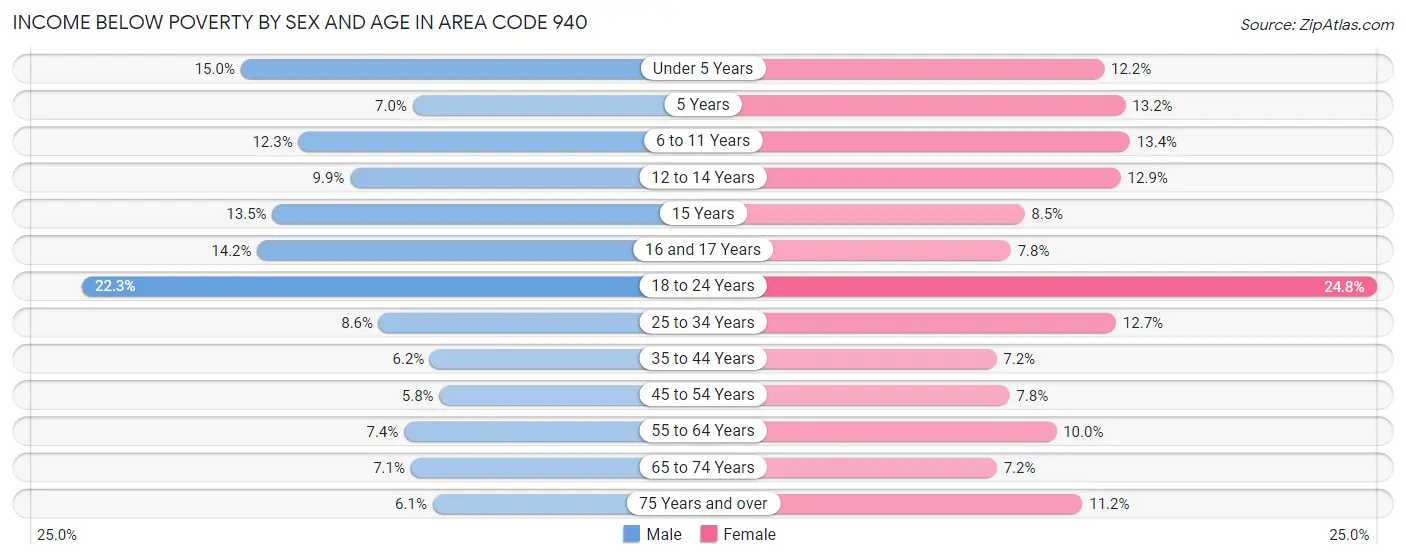
Income Below Poverty by Sex and Age in Area Code 940
With 9.8% poverty level for males and 11.4% for females among the residents of Area Code 940, 18 to 24 year old males and 18 to 24 year old females are the most vulnerable to poverty, with 8,339 males (22.3%) and 9,036 females (24.8%) in their respective age groups living below the poverty level.
| Age Bracket | Male | Female |
| Under 5 Years | 3,446 (15.0%) | 2,553 (12.2%) |
| 5 Years | 378 (7.0%) | 619 (13.2%) |
| 6 to 11 Years | 3,927 (12.3%) | 4,083 (13.4%) |
| 12 to 14 Years | 1,682 (9.9%) | 2,062 (12.9%) |
| 15 Years | 776 (13.5%) | 464 (8.5%) |
| 16 and 17 Years | 1,556 (14.2%) | 840 (7.8%) |
| 18 to 24 Years | 8,339 (22.3%) | 9,036 (24.8%) |
| 25 to 34 Years | 4,435 (8.6%) | 6,512 (12.7%) |
| 35 to 44 Years | 3,298 (6.2%) | 3,858 (7.2%) |
| 45 to 54 Years | 2,978 (5.8%) | 3,855 (7.8%) |
| 55 to 64 Years | 3,274 (7.4%) | 4,676 (10.0%) |
| 65 to 74 Years | 2,185 (7.1%) | 2,492 (7.2%) |
| 75 Years and over | 1,070 (6.1%) | 2,643 (11.2%) |
| Total | 37,344 (9.8%) | 43,693 (11.4%) |
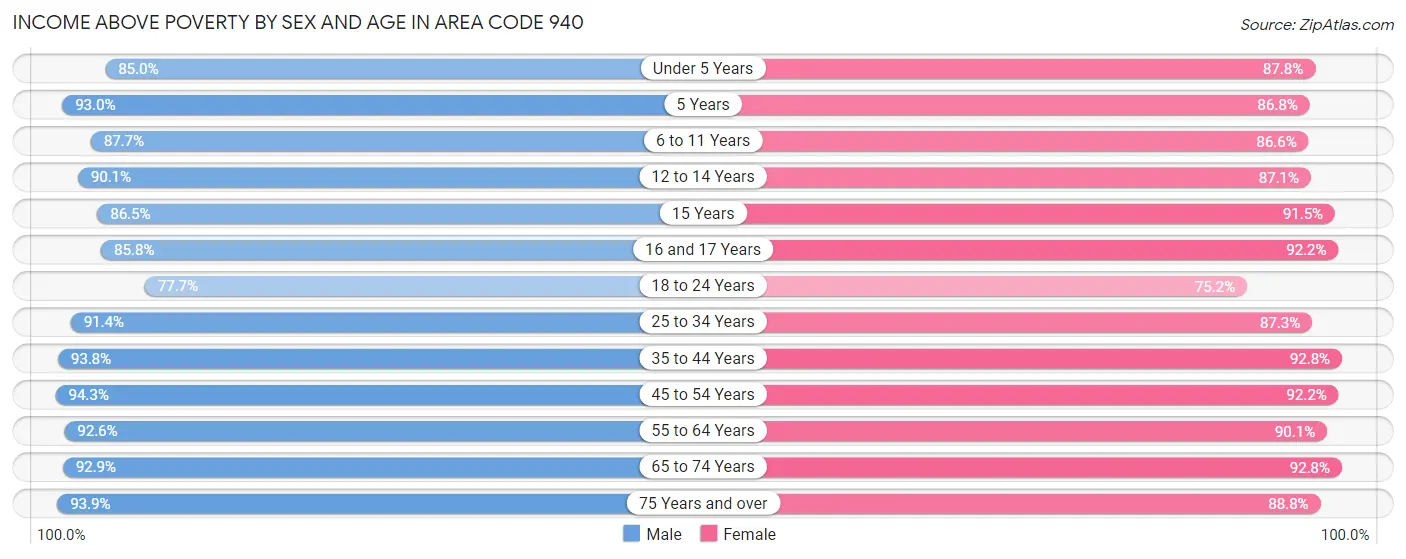
Income Above Poverty by Sex and Age in Area Code 940
According to the poverty statistics in Area Code 940, males aged 45 to 54 years and females aged 35 to 44 years are the age groups that are most secure financially, with 94.3% of males and 92.8% of females in these age groups living above the poverty line.
| Age Bracket | Male | Female |
| Under 5 Years | 19,572 (85.0%) | 18,428 (87.8%) |
| 5 Years | 5,032 (93.0%) | 4,083 (86.8%) |
| 6 to 11 Years | 28,024 (87.7%) | 26,447 (86.6%) |
| 12 to 14 Years | 15,329 (90.1%) | 13,879 (87.1%) |
| 15 Years | 4,973 (86.5%) | 5,017 (91.5%) |
| 16 and 17 Years | 9,403 (85.8%) | 9,871 (92.2%) |
| 18 to 24 Years | 29,013 (77.7%) | 27,398 (75.2%) |
| 25 to 34 Years | 47,359 (91.4%) | 44,673 (87.3%) |
| 35 to 44 Years | 50,052 (93.8%) | 49,975 (92.8%) |
| 45 to 54 Years | 48,806 (94.3%) | 45,679 (92.2%) |
| 55 to 64 Years | 41,031 (92.6%) | 42,313 (90.0%) |
| 65 to 74 Years | 28,674 (92.9%) | 32,191 (92.8%) |
| 75 Years and over | 16,599 (93.9%) | 21,030 (88.8%) |
| Total | 343,867 (90.2%) | 340,984 (88.6%) |
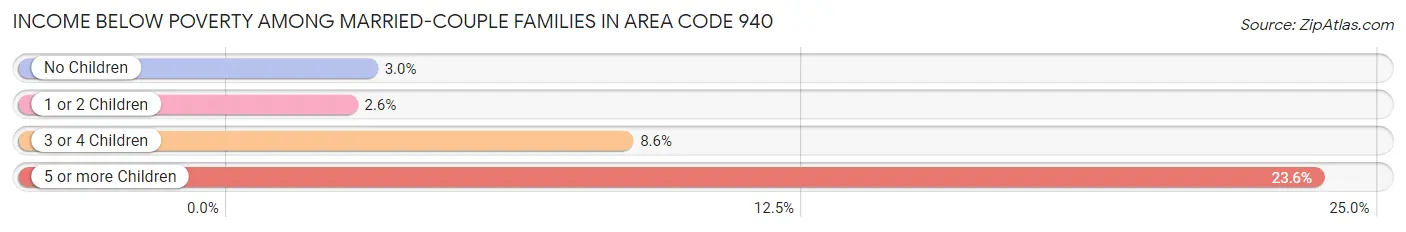
Income Below Poverty Among Married-Couple Families in Area Code 940
The poverty statistics for married-couple families in Area Code 940 show that 3.5% or 5,511 of the total 158,251 families live below the poverty line. Families with 5 or more children have the highest poverty rate of 23.6%, comprising of 267 families. On the other hand, families with 1 or 2 children have the lowest poverty rate of 2.6%, which includes 1,551 families.
| Children | Above Poverty | Below Poverty |
| No Children | 81,882 (97.0%) | 2,565 (3.0%) |
| 1 or 2 Children | 58,000 (97.4%) | 1,551 (2.6%) |
| 3 or 4 Children | 11,995 (91.4%) | 1,128 (8.6%) |
| 5 or more Children | 863 (76.4%) | 267 (23.6%) |
| Total | 152,740 (96.5%) | 5,511 (3.5%) |
Income Below Poverty Among Single-Parent Households in Area Code 940
According to the poverty data in Area Code 940, 12.7% or 1,722 single-father households and 21.3% or 6,199 single-mother households are living below the poverty line. Among single-father households, those with 5 or more children have the highest poverty rate, with 80 households (72.7%) experiencing poverty. Likewise, among single-mother households, those with 5 or more children have the highest poverty rate, with 211 households (85.8%) falling below the poverty line.
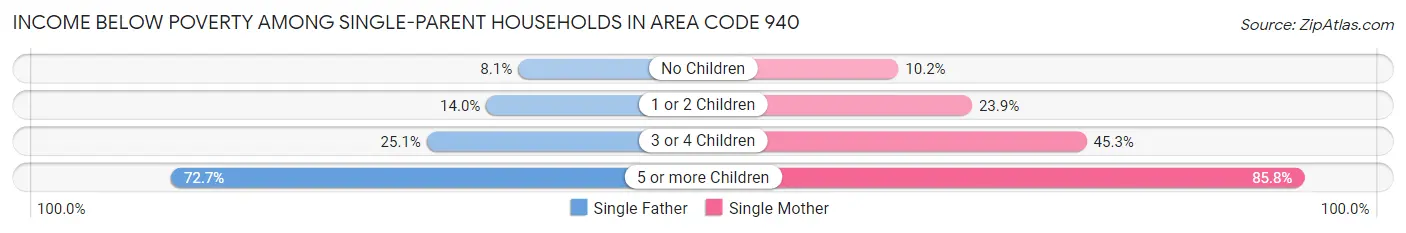
| Children | Single Father | Single Mother |
| No Children | 463 (8.1%) | 1,114 (10.2%) |
| 1 or 2 Children | 954 (14.0%) | 3,605 (23.9%) |
| 3 or 4 Children | 225 (25.1%) | 1,269 (45.3%) |
| 5 or more Children | 80 (72.7%) | 211 (85.8%) |
| Total | 1,722 (12.7%) | 6,199 (21.3%) |
Income Below Poverty Among Married-Couple vs Single-Parent Households in Area Code 940
The poverty data for Area Code 940 shows that 5,511 of the married-couple family households (3.5%) and 7,921 of the single-parent households (18.6%) are living below the poverty level. Within the married-couple family households, those with 5 or more children have the highest poverty rate, with 267 households (23.6%) falling below the poverty line. Among the single-parent households, those with 5 or more children have the highest poverty rate, with 291 household (81.7%) living below poverty.
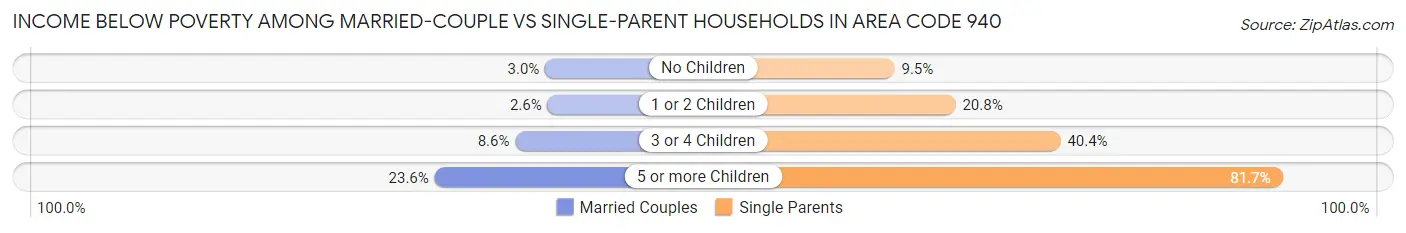
| Children | Married-Couple Families | Single-Parent Households |
| No Children | 2,565 (3.0%) | 1,577 (9.5%) |
| 1 or 2 Children | 1,551 (2.6%) | 4,559 (20.8%) |
| 3 or 4 Children | 1,128 (8.6%) | 1,494 (40.4%) |
| 5 or more Children | 267 (23.6%) | 291 (81.7%) |
| Total | 5,511 (3.5%) | 7,921 (18.6%) |
Race in Area Code 940
The most populous races in Area Code 940 are White / Caucasian (583,735 | 73.4%), Hispanic or Latino (146,912 | 18.5%), and Two or more Races (71,041 | 8.9%).
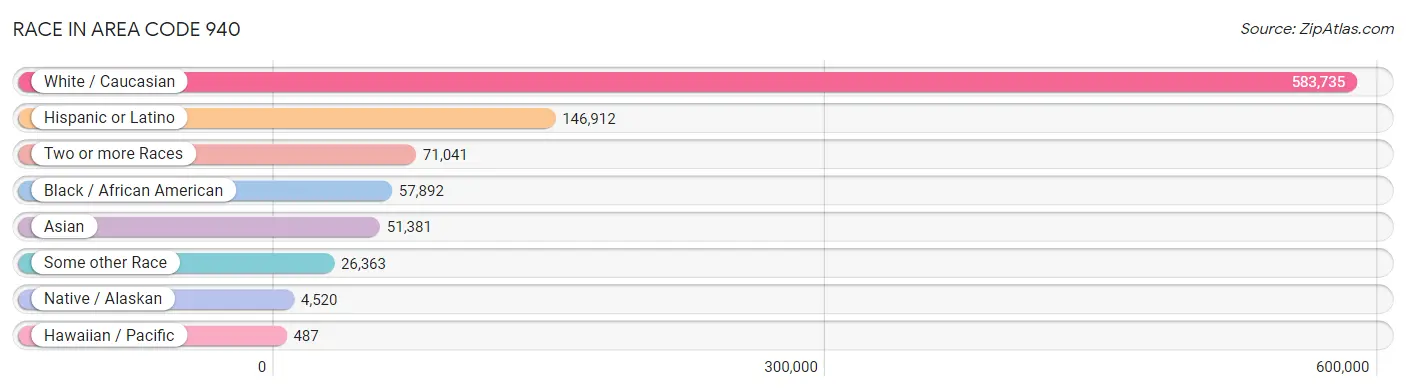
| Race | # Population | % Population |
| Asian | 51,381 | 6.5% |
| Black / African American | 57,892 | 7.3% |
| Hawaiian / Pacific | 487 | 0.1% |
| Hispanic or Latino | 146,912 | 18.5% |
| Native / Alaskan | 4,520 | 0.6% |
| White / Caucasian | 583,735 | 73.4% |
| Two or more Races | 71,041 | 8.9% |
| Some other Race | 26,363 | 3.3% |
| Total | 795,419 | 100.0% |
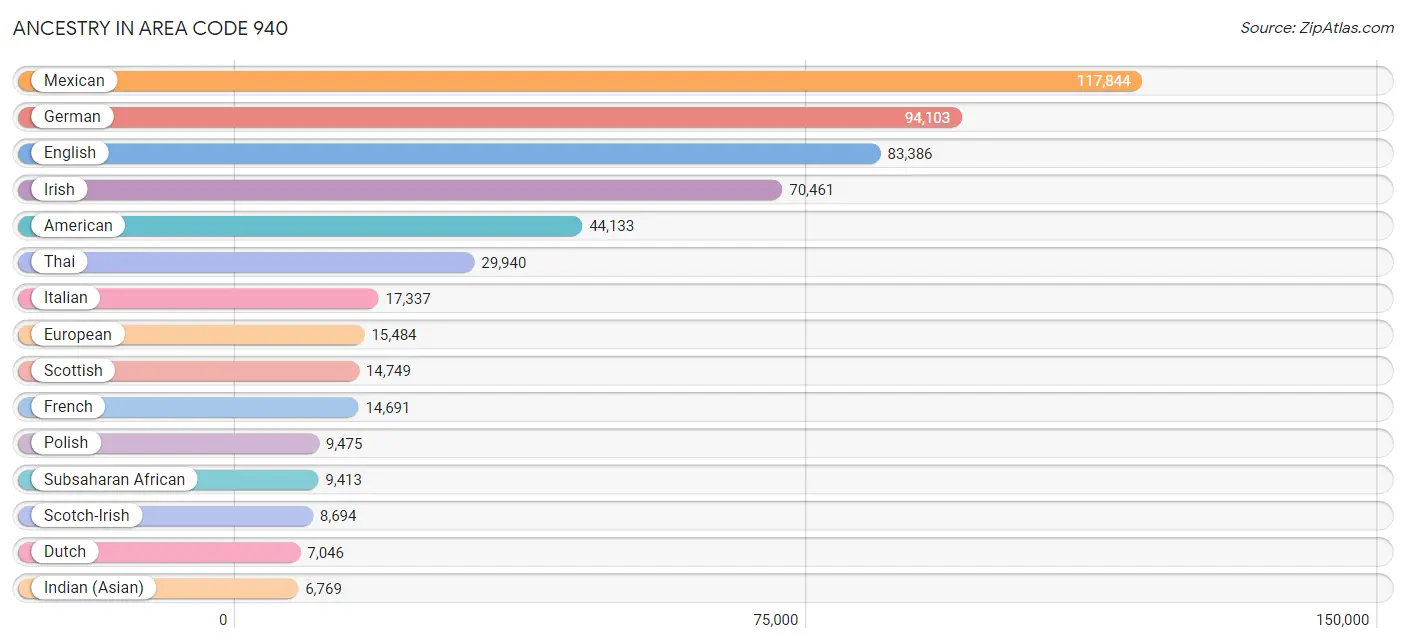
Ancestry in Area Code 940
The most populous ancestries reported in Area Code 940 are Mexican (117,844 | 14.8%), German (94,103 | 11.8%), English (83,386 | 10.5%), Irish (70,461 | 8.9%), and American (44,133 | 5.6%), together accounting for 51.5% of all Area Code 940 residents.
| Ancestry | # Population | % Population |
| Afghan | 39 | 0.0% |
| African | 4,425 | 0.6% |
| Alaska Native | 12 | 0.0% |
| Alaskan Athabascan | 10 | 0.0% |
| Albanian | 218 | 0.0% |
| Alsatian | 11 | 0.0% |
| American | 44,133 | 5.6% |
| Apache | 545 | 0.1% |
| Arab | 3,814 | 0.5% |
| Arapaho | 10 | 0.0% |
| Argentinean | 345 | 0.0% |
| Armenian | 136 | 0.0% |
| Assyrian / Chaldean / Syriac | 197 | 0.0% |
| Australian | 231 | 0.0% |
| Austrian | 657 | 0.1% |
| Bahamian | 207 | 0.0% |
| Bangladeshi | 59 | 0.0% |
| Barbadian | 75 | 0.0% |
| Basque | 24 | 0.0% |
| Belgian | 373 | 0.1% |
| Belizean | 15 | 0.0% |
| Bermudan | 32 | 0.0% |
| Bhutanese | 2,582 | 0.3% |
| Blackfeet | 404 | 0.1% |
| Bolivian | 295 | 0.0% |
| Brazilian | 743 | 0.1% |
| British | 5,686 | 0.7% |
| British West Indian | 107 | 0.0% |
| Bulgarian | 472 | 0.1% |
| Burmese | 4,789 | 0.6% |
| Cajun | 686 | 0.1% |
| Canadian | 1,179 | 0.2% |
| Celtic | 42 | 0.0% |
| Central American | 6,758 | 0.9% |
| Central American Indian | 679 | 0.1% |
| Cherokee | 3,487 | 0.4% |
| Chickasaw | 551 | 0.1% |
| Chilean | 416 | 0.1% |
| Chinese | 147 | 0.0% |
| Chippewa | 106 | 0.0% |
| Choctaw | 1,549 | 0.2% |
| Colombian | 1,642 | 0.2% |
| Colville | 14 | 0.0% |
| Comanche | 535 | 0.1% |
| Costa Rican | 110 | 0.0% |
| Creek | 227 | 0.0% |
| Croatian | 282 | 0.0% |
| Crow | 1 | 0.0% |
| Cuban | 1,628 | 0.2% |
| Cypriot | 106 | 0.0% |
| Czech | 4,029 | 0.5% |
| Czechoslovakian | 745 | 0.1% |
| Danish | 1,730 | 0.2% |
| Dominican | 468 | 0.1% |
| Dutch | 7,046 | 0.9% |
| Dutch West Indian | 339 | 0.0% |
| Eastern European | 1,229 | 0.2% |
| Ecuadorian | 427 | 0.1% |
| Egyptian | 212 | 0.0% |
| English | 83,386 | 10.5% |
| Estonian | 5 | 0.0% |
| Ethiopian | 207 | 0.0% |
| European | 15,484 | 1.9% |
| Fijian | 16 | 0.0% |
| Filipino | 754 | 0.1% |
| Finnish | 931 | 0.1% |
| French | 14,691 | 1.8% |
| French American Indian | 37 | 0.0% |
| French Canadian | 2,141 | 0.3% |
| German | 94,103 | 11.8% |
| German Russian | 8 | 0.0% |
| Ghanaian | 171 | 0.0% |
| Greek | 1,310 | 0.2% |
| Guamanian / Chamorro | 189 | 0.0% |
| Guatemalan | 2,127 | 0.3% |
| Guyanese | 42 | 0.0% |
| Haitian | 99 | 0.0% |
| Hmong | 33 | 0.0% |
| Honduran | 754 | 0.1% |
| Hopi | 25 | 0.0% |
| Houma | 1 | 0.0% |
| Hungarian | 1,085 | 0.1% |
| Icelander | 39 | 0.0% |
| Indian (Asian) | 6,769 | 0.9% |
| Indonesian | 442 | 0.1% |
| Inupiat | 24 | 0.0% |
| Iranian | 1,201 | 0.2% |
| Iraqi | 61 | 0.0% |
| Irish | 70,461 | 8.9% |
| Iroquois | 160 | 0.0% |
| Israeli | 47 | 0.0% |
| Italian | 17,337 | 2.2% |
| Jamaican | 420 | 0.1% |
| Japanese | 361 | 0.1% |
| Jordanian | 240 | 0.0% |
| Kenyan | 306 | 0.0% |
| Kiowa | 18 | 0.0% |
| Korean | 4,988 | 0.6% |
| Laotian | 329 | 0.0% |
| Latvian | 132 | 0.0% |
| Lebanese | 1,301 | 0.2% |
| Liberian | 102 | 0.0% |
| Lithuanian | 504 | 0.1% |
| Lumbee | 28 | 0.0% |
| Luxembourger | 26 | 0.0% |
| Macedonian | 42 | 0.0% |
| Malaysian | 51 | 0.0% |
| Maltese | 38 | 0.0% |
| Mexican | 117,844 | 14.8% |
| Mexican American Indian | 872 | 0.1% |
| Mongolian | 78 | 0.0% |
| Moroccan | 48 | 0.0% |
| Native Hawaiian | 690 | 0.1% |
| Navajo | 150 | 0.0% |
| Nepalese | 47 | 0.0% |
| New Zealander | 4 | 0.0% |
| Nicaraguan | 322 | 0.0% |
| Nigerian | 2,922 | 0.4% |
| Northern European | 646 | 0.1% |
| Norwegian | 5,402 | 0.7% |
| Osage | 71 | 0.0% |
| Paiute | 5 | 0.0% |
| Pakistani | 726 | 0.1% |
| Palestinian | 464 | 0.1% |
| Panamanian | 873 | 0.1% |
| Pennsylvania German | 271 | 0.0% |
| Peruvian | 400 | 0.1% |
| Pima | 21 | 0.0% |
| Polish | 9,475 | 1.2% |
| Portuguese | 1,667 | 0.2% |
| Potawatomi | 139 | 0.0% |
| Pueblo | 149 | 0.0% |
| Puerto Rican | 5,632 | 0.7% |
| Romanian | 737 | 0.1% |
| Russian | 1,892 | 0.2% |
| Salvadoran | 2,569 | 0.3% |
| Samoan | 227 | 0.0% |
| Scandinavian | 2,329 | 0.3% |
| Scotch-Irish | 8,694 | 1.1% |
| Scottish | 14,749 | 1.8% |
| Seminole | 175 | 0.0% |
| Serbian | 514 | 0.1% |
| Sioux | 129 | 0.0% |
| Slavic | 41 | 0.0% |
| Slovak | 558 | 0.1% |
| Slovene | 208 | 0.0% |
| Somali | 59 | 0.0% |
| South African | 207 | 0.0% |
| South American | 5,368 | 0.7% |
| South American Indian | 108 | 0.0% |
| Spaniard | 2,553 | 0.3% |
| Spanish | 2,534 | 0.3% |
| Spanish American | 5 | 0.0% |
| Spanish American Indian | 7 | 0.0% |
| Sri Lankan | 3,203 | 0.4% |
| Subsaharan African | 9,413 | 1.2% |
| Sudanese | 129 | 0.0% |
| Swedish | 4,793 | 0.6% |
| Swiss | 1,330 | 0.2% |
| Syrian | 104 | 0.0% |
| Thai | 29,940 | 3.8% |
| Tlingit-Haida | 27 | 0.0% |
| Tohono O'Odham | 3 | 0.0% |
| Tongan | 111 | 0.0% |
| Trinidadian and Tobagonian | 69 | 0.0% |
| Turkish | 643 | 0.1% |
| Ugandan | 10 | 0.0% |
| Ukrainian | 961 | 0.1% |
| Venezuelan | 1,793 | 0.2% |
| Vietnamese | 418 | 0.1% |
| Welsh | 4,355 | 0.5% |
| West Indian | 182 | 0.0% |
| Yugoslavian | 153 | 0.0% |
| Zimbabwean | 133 | 0.0% | View All 174 Rows |
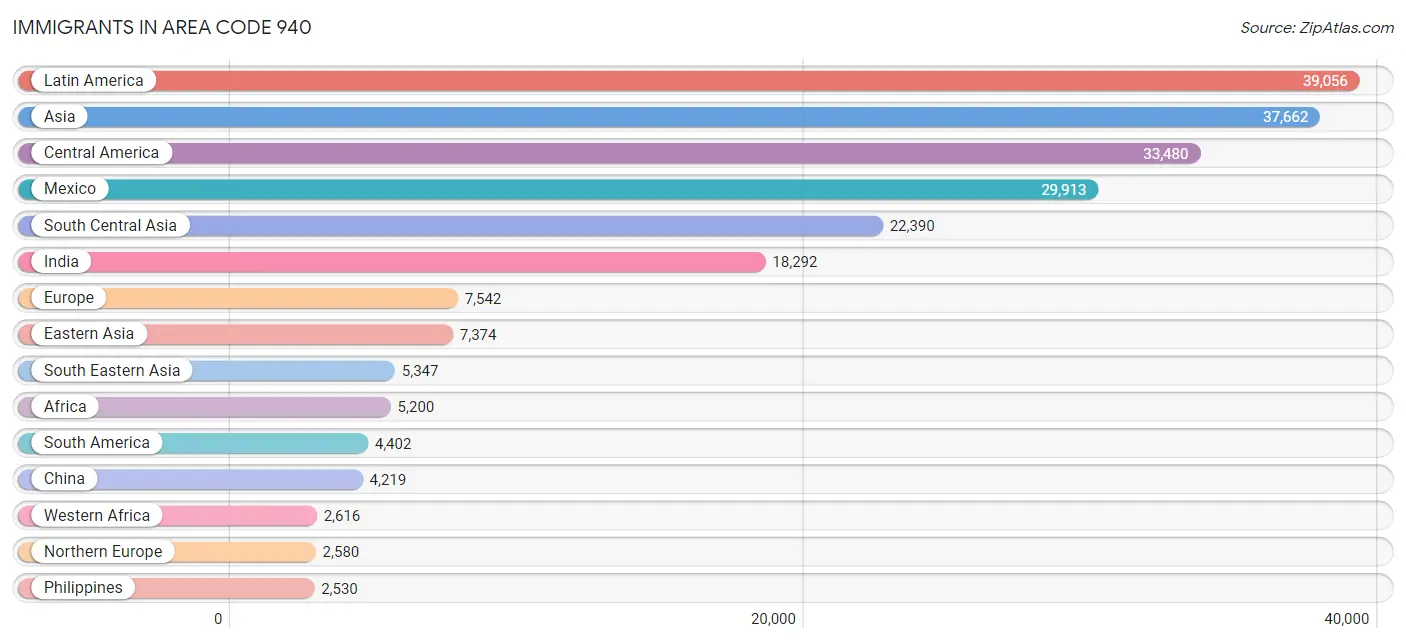
Immigrants in Area Code 940
The most numerous immigrant groups reported in Area Code 940 came from Latin America (39,056 | 4.9%), Asia (37,662 | 4.7%), Central America (33,480 | 4.2%), Mexico (29,913 | 3.8%), and South Central Asia (22,390 | 2.8%), together accounting for 20.4% of all Area Code 940 residents.
| Immigration Origin | # Population | % Population |
| Afghanistan | 50 | 0.0% |
| Africa | 5,200 | 0.6% |
| Albania | 13 | 0.0% |
| Argentina | 176 | 0.0% |
| Armenia | 29 | 0.0% |
| Asia | 37,662 | 4.7% |
| Australia | 236 | 0.0% |
| Austria | 32 | 0.0% |
| Azores | 11 | 0.0% |
| Bahamas | 144 | 0.0% |
| Bangladesh | 664 | 0.1% |
| Barbados | 44 | 0.0% |
| Belarus | 39 | 0.0% |
| Belgium | 124 | 0.0% |
| Belize | 11 | 0.0% |
| Bolivia | 249 | 0.0% |
| Bosnia and Herzegovina | 40 | 0.0% |
| Brazil | 1,083 | 0.1% |
| Bulgaria | 208 | 0.0% |
| Cambodia | 257 | 0.0% |
| Cameroon | 453 | 0.1% |
| Canada | 2,112 | 0.3% |
| Caribbean | 1,174 | 0.2% |
| Central America | 33,480 | 4.2% |
| Chile | 103 | 0.0% |
| China | 4,219 | 0.5% |
| Colombia | 877 | 0.1% |
| Congo | 9 | 0.0% |
| Costa Rica | 78 | 0.0% |
| Croatia | 19 | 0.0% |
| Cuba | 536 | 0.1% |
| Czechoslovakia | 66 | 0.0% |
| Denmark | 55 | 0.0% |
| Dominica | 60 | 0.0% |
| Dominican Republic | 55 | 0.0% |
| Eastern Africa | 1,217 | 0.2% |
| Eastern Asia | 7,374 | 0.9% |
| Eastern Europe | 2,157 | 0.3% |
| Ecuador | 198 | 0.0% |
| Egypt | 54 | 0.0% |
| El Salvador | 1,251 | 0.2% |
| England | 1,114 | 0.1% |
| Ethiopia | 136 | 0.0% |
| Europe | 7,542 | 0.9% |
| Fiji | 65 | 0.0% |
| France | 155 | 0.0% |
| Germany | 1,605 | 0.2% |
| Ghana | 232 | 0.0% |
| Greece | 152 | 0.0% |
| Grenada | 83 | 0.0% |
| Guatemala | 1,151 | 0.1% |
| Guyana | 17 | 0.0% |
| Honduras | 449 | 0.1% |
| Hong Kong | 395 | 0.1% |
| Hungary | 64 | 0.0% |
| India | 18,292 | 2.3% |
| Indonesia | 118 | 0.0% |
| Iran | 950 | 0.1% |
| Iraq | 181 | 0.0% |
| Ireland | 130 | 0.0% |
| Israel | 59 | 0.0% |
| Italy | 107 | 0.0% |
| Jamaica | 117 | 0.0% |
| Japan | 787 | 0.1% |
| Jordan | 213 | 0.0% |
| Kazakhstan | 17 | 0.0% |
| Kenya | 491 | 0.1% |
| Korea | 2,368 | 0.3% |
| Kuwait | 132 | 0.0% |
| Laos | 32 | 0.0% |
| Latin America | 39,056 | 4.9% |
| Latvia | 4 | 0.0% |
| Lebanon | 268 | 0.0% |
| Liberia | 125 | 0.0% |
| Lithuania | 12 | 0.0% |
| Malaysia | 209 | 0.0% |
| Mexico | 29,913 | 3.8% |
| Micronesia | 3 | 0.0% |
| Middle Africa | 518 | 0.1% |
| Moldova | 82 | 0.0% |
| Morocco | 39 | 0.0% |
| Nepal | 730 | 0.1% |
| Netherlands | 83 | 0.0% |
| Nicaragua | 168 | 0.0% |
| Nigeria | 2,028 | 0.3% |
| North Macedonia | 71 | 0.0% |
| Northern Africa | 197 | 0.0% |
| Northern Europe | 2,580 | 0.3% |
| Norway | 10 | 0.0% |
| Oceania | 403 | 0.1% |
| Pakistan | 1,530 | 0.2% |
| Panama | 459 | 0.1% |
| Peru | 176 | 0.0% |
| Philippines | 2,530 | 0.3% |
| Poland | 133 | 0.0% |
| Portugal | 104 | 0.0% |
| Romania | 255 | 0.0% |
| Russia | 540 | 0.1% |
| Saudi Arabia | 892 | 0.1% |
| Scotland | 194 | 0.0% |
| Senegal | 17 | 0.0% |
| Serbia | 147 | 0.0% |
| Sierra Leone | 49 | 0.0% |
| Singapore | 74 | 0.0% |
| Somalia | 7 | 0.0% |
| South Africa | 387 | 0.1% |
| South America | 4,402 | 0.5% |
| South Central Asia | 22,390 | 2.8% |
| South Eastern Asia | 5,347 | 0.7% |
| Southern Europe | 570 | 0.1% |
| Spain | 207 | 0.0% |
| Sri Lanka | 121 | 0.0% |
| Sweden | 298 | 0.0% |
| Switzerland | 16 | 0.0% |
| Syria | 31 | 0.0% |
| Taiwan | 717 | 0.1% |
| Thailand | 406 | 0.1% |
| Trinidad and Tobago | 80 | 0.0% |
| Turkey | 360 | 0.1% |
| Uganda | 7 | 0.0% |
| Ukraine | 321 | 0.0% |
| Venezuela | 1,501 | 0.2% |
| Vietnam | 1,597 | 0.2% |
| West Indies | 4 | 0.0% |
| Western Africa | 2,616 | 0.3% |
| Western Asia | 2,495 | 0.3% |
| Western Europe | 2,015 | 0.3% |
| Yemen | 45 | 0.0% |
| Zaire | 25 | 0.0% |
| Zimbabwe | 260 | 0.0% | View All 130 Rows |
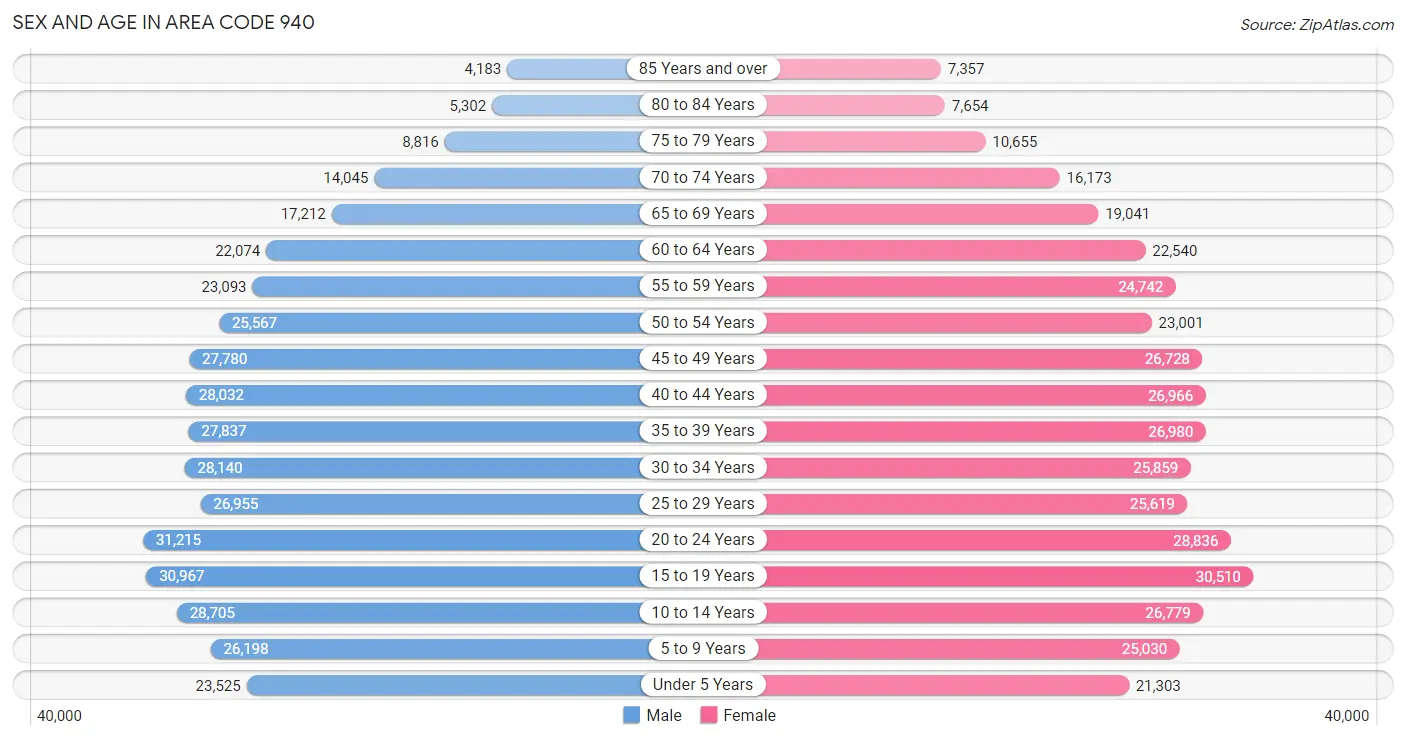
Sex and Age in Area Code 940
Sex and Age in Area Code 940
The most populous age groups in Area Code 940 are 20 to 24 Years (31,215 | 7.8%) for men and 15 to 19 Years (30,510 | 7.7%) for women.
| Age Bracket | Male | Female |
| Under 5 Years | 23,525 (5.9%) | 21,303 (5.4%) |
| 5 to 9 Years | 26,198 (6.6%) | 25,030 (6.3%) |
| 10 to 14 Years | 28,705 (7.2%) | 26,779 (6.8%) |
| 15 to 19 Years | 30,967 (7.7%) | 30,510 (7.7%) |
| 20 to 24 Years | 31,215 (7.8%) | 28,836 (7.3%) |
| 25 to 29 Years | 26,955 (6.7%) | 25,619 (6.5%) |
| 30 to 34 Years | 28,140 (7.0%) | 25,859 (6.5%) |
| 35 to 39 Years | 27,837 (7.0%) | 26,980 (6.8%) |
| 40 to 44 Years | 28,032 (7.0%) | 26,966 (6.8%) |
| 45 to 49 Years | 27,780 (7.0%) | 26,728 (6.8%) |
| 50 to 54 Years | 25,567 (6.4%) | 23,001 (5.8%) |
| 55 to 59 Years | 23,093 (5.8%) | 24,742 (6.2%) |
| 60 to 64 Years | 22,074 (5.5%) | 22,540 (5.7%) |
| 65 to 69 Years | 17,212 (4.3%) | 19,041 (4.8%) |
| 70 to 74 Years | 14,045 (3.5%) | 16,173 (4.1%) |
| 75 to 79 Years | 8,816 (2.2%) | 10,655 (2.7%) |
| 80 to 84 Years | 5,302 (1.3%) | 7,654 (1.9%) |
| 85 Years and over | 4,183 (1.1%) | 7,357 (1.9%) |
| Total | 399,646 (100.0%) | 395,773 (100.0%) |
Families and Households in Area Code 940
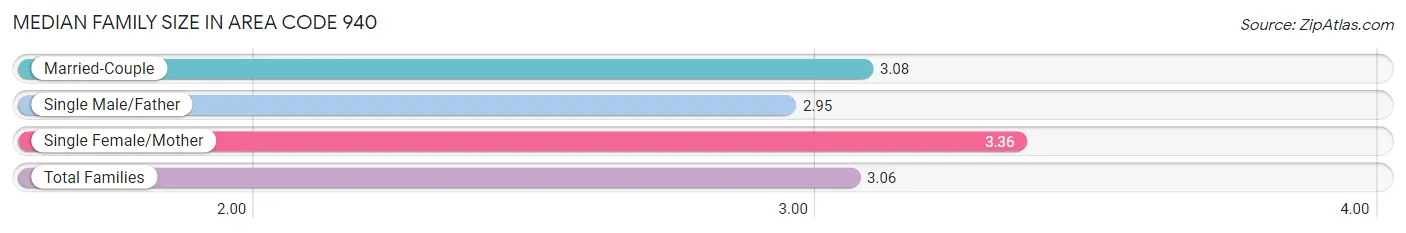
Median Family Size in Area Code 940
The median family size in Area Code 940 is 3.06 persons per family, with single female/mother families (29,052 | 14.5%) accounting for the largest median family size of 3.35685 persons per family. On the other hand, single male/father families (13,525 | 6.7%) represent the smallest median family size with 2.95 persons per family.
| Family Type | # Families | Family Size |
| Married-Couple | 158,251 (78.8%) | 3.08 |
| Single Male/Father | 13,525 (6.7%) | 2.95 |
| Single Female/Mother | 29,052 (14.5%) | 3.36 |
| Total Families | 200,828 (100.0%) | 3.06 |
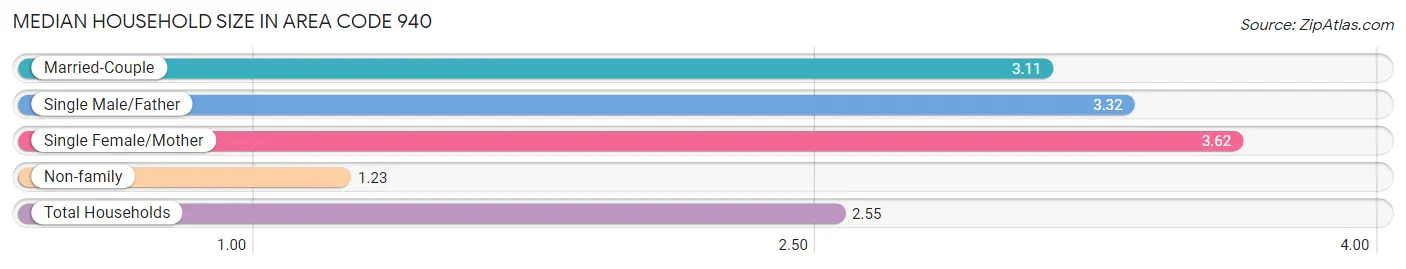
Median Household Size in Area Code 940
The median household size in Area Code 940 is 2.55 persons per household, with single female/mother households (29,052 | 9.9%) accounting for the largest median household size of 3.61505 persons per household. non-family households (91,304 | 31.2%) represent the smallest median household size with 1.23 persons per household.
| Household Type | # Households | Household Size |
| Married-Couple | 158,251 (54.2%) | 3.11 |
| Single Male/Father | 13,525 (4.6%) | 3.32 |
| Single Female/Mother | 29,052 (9.9%) | 3.62 |
| Non-family | 91,304 (31.2%) | 1.23 |
| Total Households | 292,132 (100.0%) | 2.55 |
Household Size by Marriage Status in Area Code 940
Out of a total of 292,132 households in Area Code 940, 200,828 (68.8%) are family households, while 91,304 (31.2%) are nonfamily households. The most numerous type of family households are 2-person households, comprising 85,525, and the most common type of nonfamily households are 1-person households, comprising 73,250.
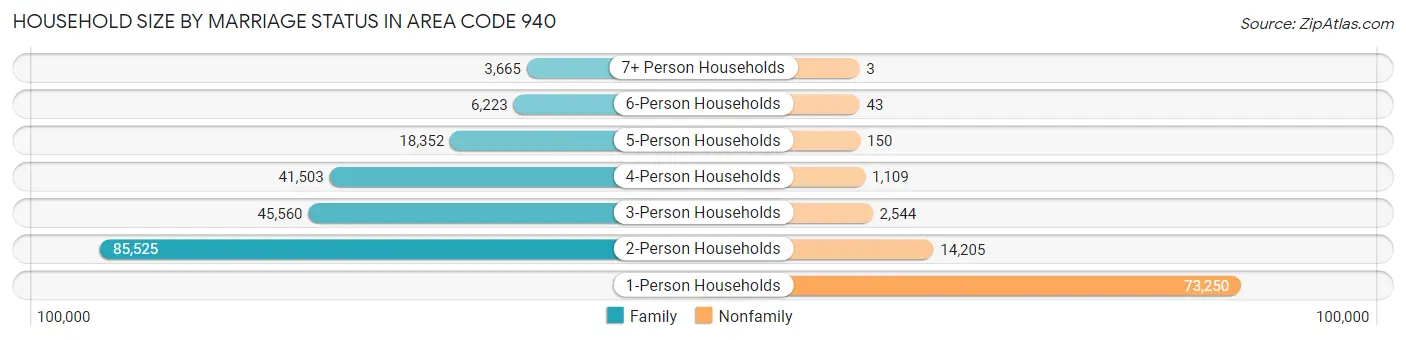
| Household Size | Family Households | Nonfamily Households |
| 1-Person Households | - | 73,250 (25.1%) |
| 2-Person Households | 85,525 (29.3%) | 14,205 (4.9%) |
| 3-Person Households | 45,560 (15.6%) | 2,544 (0.9%) |
| 4-Person Households | 41,503 (14.2%) | 1,109 (0.4%) |
| 5-Person Households | 18,352 (6.3%) | 150 (0.1%) |
| 6-Person Households | 6,223 (2.1%) | 43 (0.0%) |
| 7+ Person Households | 3,665 (1.3%) | 3 (0.0%) |
| Total | 200,828 (68.8%) | 91,304 (31.2%) |
Female Fertility in Area Code 940
Fertility by Age in Area Code 940
Average fertility rate in Area Code 940 is 65.8 births per 1,000 women. Women in the age bracket of 15 to 19 years have the highest fertility rate with 163.5 births per 1,000 women. Women in the age bracket of 20 to 34 years acount for 73.6% of all women with births.
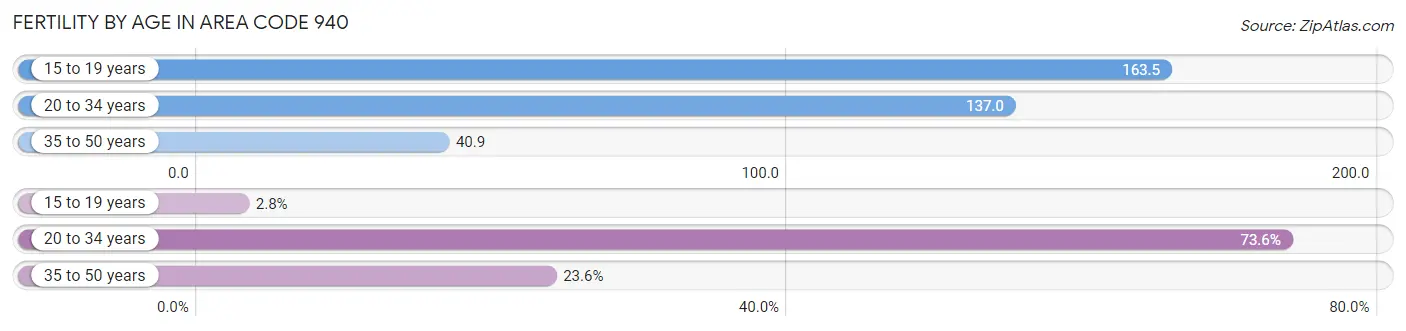
| Age Bracket | Women with Births | Births / 1,000 Women |
| 15 to 19 years | 257 (2.8%) | 163.5 |
| 20 to 34 years | 6,830 (73.6%) | 137.0 |
| 35 to 50 years | 2,193 (23.6%) | 40.9 |
| Total | 9,280 (100.0%) | 65.8 |
Fertility by Age by Marriage Status in Area Code 940
58.1% of women with births (9,280) in Area Code 940 are married. The highest percentage of unmarried women with births falls into 15 to 19 years age bracket with 99.6% of them unmarried at the time of birth, while the lowest percentage of unmarried women with births belong to 20 to 34 years age bracket with 42.8% of them unmarried.
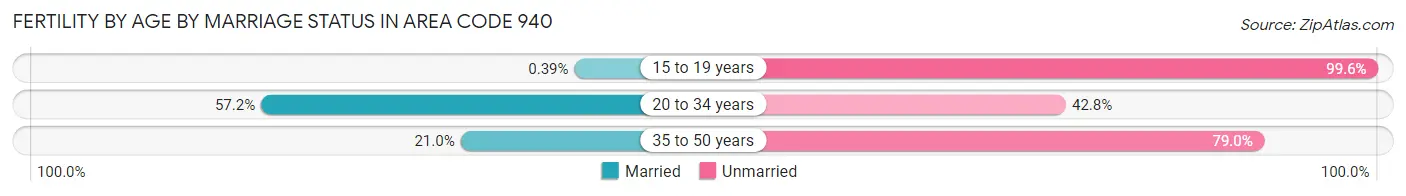
| Age Bracket | Married | Unmarried |
| 15 to 19 years | 1 (0.4%) | 256 (99.6%) |
| 20 to 34 years | 3,905 (57.2%) | 2,925 (42.8%) |
| 35 to 50 years | 461 (21.0%) | 1,732 (79.0%) |
| Total | 5,388 (58.1%) | 3,892 (41.9%) |
Fertility by Education in Area Code 940
Average fertility rate in Area Code 940 is 65.8 births per 1,000 women. Women with the education attainment of graduate degree have the highest fertility rate of 174.5 births per 1,000 women, while women with the education attainment of less than high school have the lowest fertility at 63.7 births per 1,000 women. Women with the education attainment of college or associate's degree represent 35.0% of all women with births.
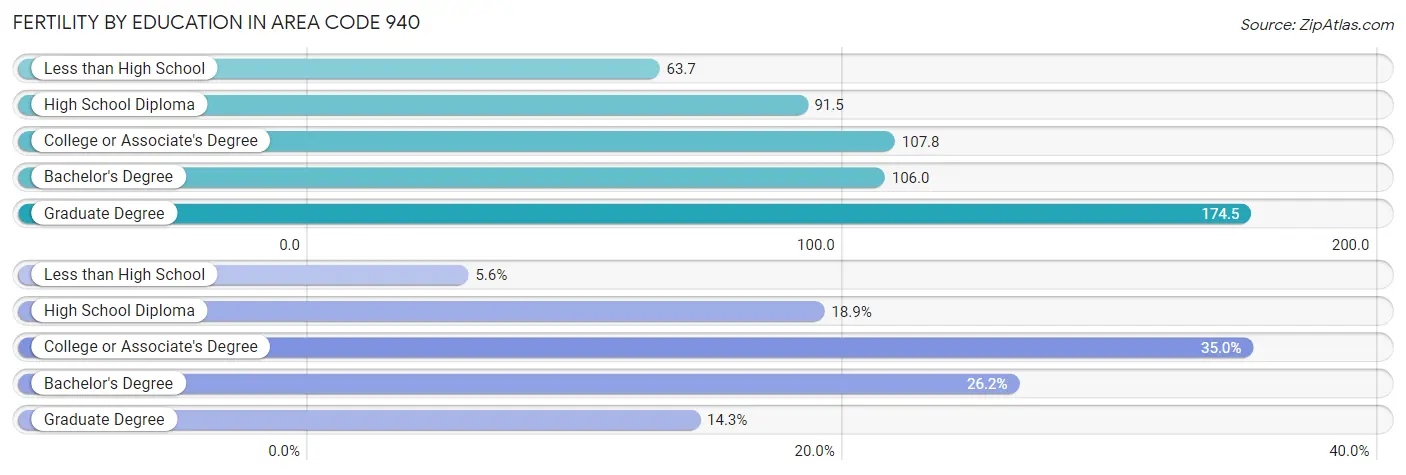
| Educational Attainment | Women with Births | Births / 1,000 Women |
| Less than High School | 519 (5.6%) | 63.7 |
| High School Diploma | 1,757 (18.9%) | 91.5 |
| College or Associate's Degree | 3,247 (35.0%) | 107.8 |
| Bachelor's Degree | 2,433 (26.2%) | 106.0 |
| Graduate Degree | 1,324 (14.3%) | 174.5 |
| Total | 9,280 (100.0%) | 65.8 |
Fertility by Education by Marriage Status in Area Code 940
41.9% of women with births in Area Code 940 are unmarried. Women with the educational attainment of bachelor's degree are most likely to be married with 69.1% of them married at childbirth, while women with the educational attainment of less than high school are least likely to be married with 92.1% of them unmarried at childbirth.
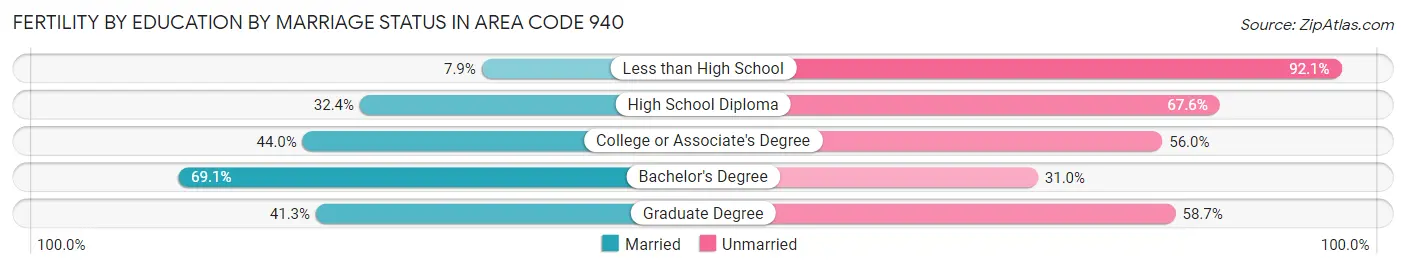
| Educational Attainment | Married | Unmarried |
| Less than High School | 41 (7.9%) | 478 (92.1%) |
| High School Diploma | 570 (32.4%) | 1,187 (67.6%) |
| College or Associate's Degree | 1,428 (44.0%) | 1,819 (56.0%) |
| Bachelor's Degree | 1,680 (69.1%) | 753 (30.9%) |
| Graduate Degree | 547 (41.3%) | 777 (58.7%) |
| Total | 5,388 (58.1%) | 3,892 (41.9%) |
Employment Characteristics in Area Code 940
Employment by Class of Employer in Area Code 940
Among the 396,473 employed individuals in Area Code 940, private company employees (271,421 | 68.5%), local government employees (28,753 | 7.2%), and self-employed (not incorporated) (26,529 | 6.7%) make up the most common classes of employment.
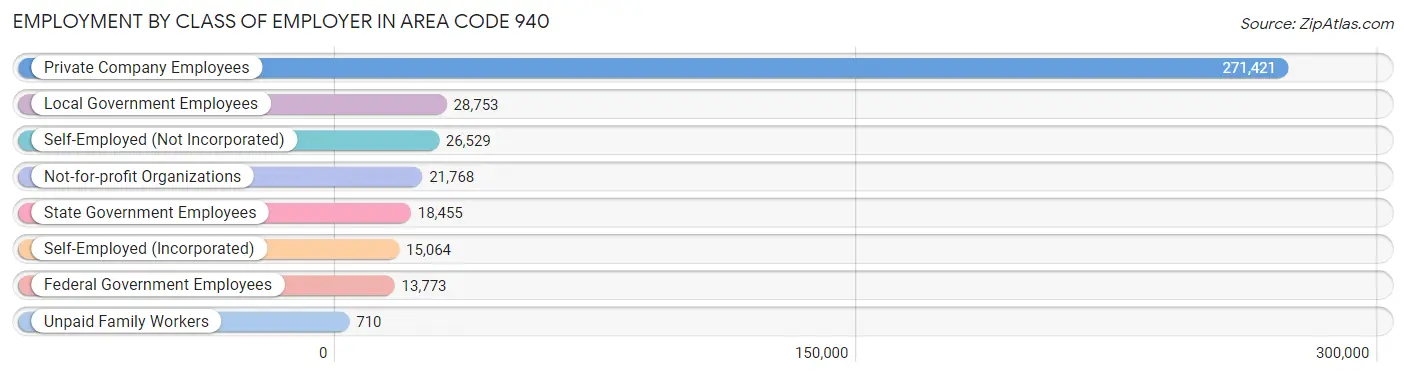
| Employer Class | # Employees | % Employees |
| Private Company Employees | 271,421 | 68.5% |
| Self-Employed (Incorporated) | 15,064 | 3.8% |
| Self-Employed (Not Incorporated) | 26,529 | 6.7% |
| Not-for-profit Organizations | 21,768 | 5.5% |
| Local Government Employees | 28,753 | 7.2% |
| State Government Employees | 18,455 | 4.6% |
| Federal Government Employees | 13,773 | 3.5% |
| Unpaid Family Workers | 710 | 0.2% |
| Total | 396,473 | 100.0% |
Employment Status by Age in Area Code 940
According to the labor force statistics for Area Code 940, out of the total population over 16 years of age (632,617), 61.9% or 391,337 individuals are in the labor force, with 4.5% or 17,688 of them unemployed. The age group with the highest labor force participation rate is 30 to 34 years, with 82.2% or 44,403 individuals in the labor force. Within the labor force, the 16 to 19 years age range has the highest percentage of unemployed individuals, with 880.9% or 200,784 of them being unemployed.
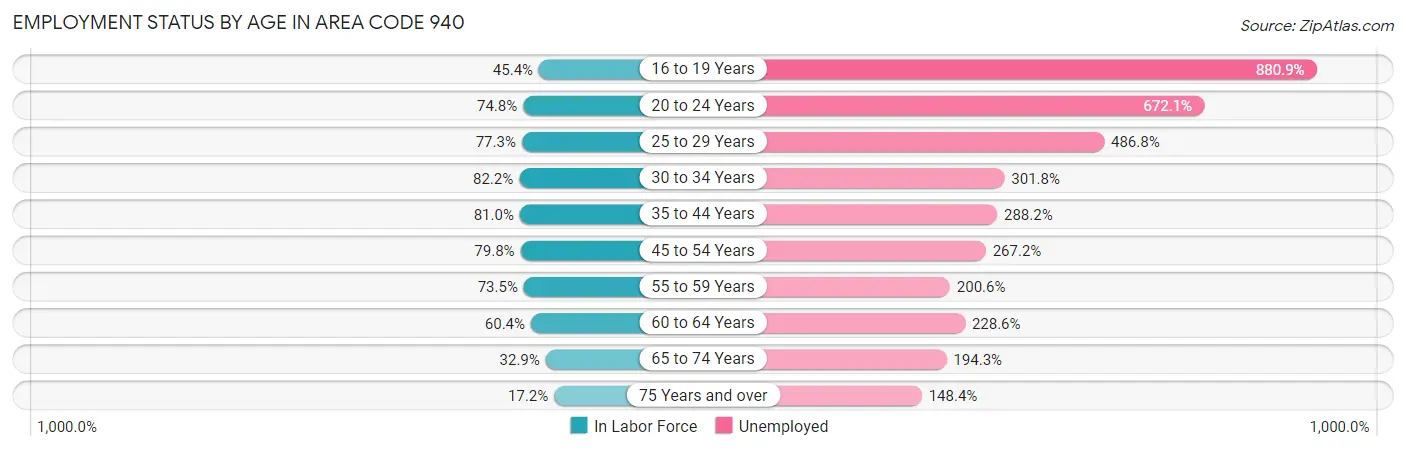
| Age Bracket | In Labor Force | Unemployed |
| 16 to 19 Years | 22,791 (45.4%) | 200,784 (880.9%) |
| 20 to 24 Years | 44,936 (74.8%) | 302,015 (672.1%) |
| 25 to 29 Years | 40,613 (77.2%) | 197,704 (486.8%) |
| 30 to 34 Years | 44,401 (82.2%) | 134,008 (301.8%) |
| 35 to 44 Years | 88,920 (81.0%) | 256,259 (288.2%) |
| 45 to 54 Years | 82,206 (79.7%) | 219,646 (267.2%) |
| 55 to 59 Years | 35,168 (73.5%) | 70,547 (200.6%) |
| 60 to 64 Years | 26,929 (60.4%) | 61,560 (228.6%) |
| 65 to 74 Years | 21,880 (32.9%) | 42,517 (194.3%) |
| 75 Years and over | 7,548 (17.2%) | 11,203 (148.4%) |
| Total | 391,362 (61.9%) | 17,693 (4.5%) |
Employment Status by Educational Attainment in Area Code 940
According to labor force statistics for Area Code 940, 75.7% of individuals (311,653) out of the total population between 25 and 64 years of age (411,913) are in the labor force, with 298.8% or 931,219 of them being unemployed. The group with the highest labor force participation rate are those with the educational attainment of bachelor's degree or higher, with 87.2% or 137,211 individuals in the labor force. Within the labor force, individuals with less than high school education have the highest percentage of unemployment, with 597.2% or 136,675 of them being unemployed.
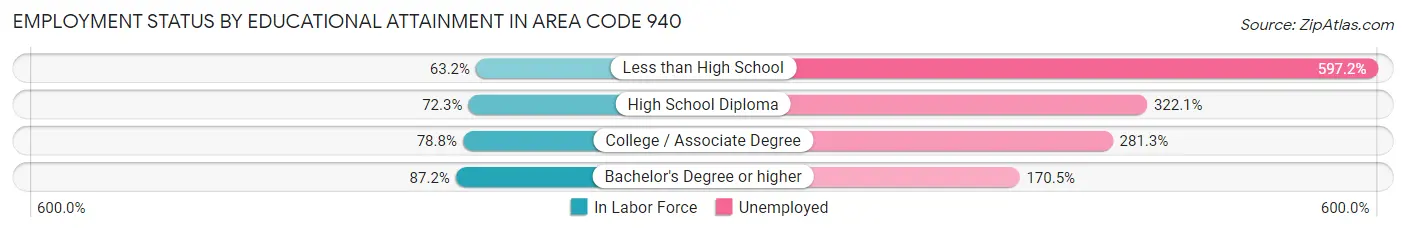
| Educational Attainment | In Labor Force | Unemployed |
| Less than High School | 22,885 (63.2%) | 216,330 (597.2%) |
| High School Diploma | 69,328 (72.3%) | 309,061 (322.1%) |
| College / Associate Degree | 96,506 (78.8%) | 344,421 (281.3%) |
| Bachelor's Degree or higher | 137,206 (87.2%) | 268,193 (170.5%) |
| Total | 311,664 (75.7%) | 1,230,796 (298.8%) |
Employment Occupations by Sex in Area Code 940
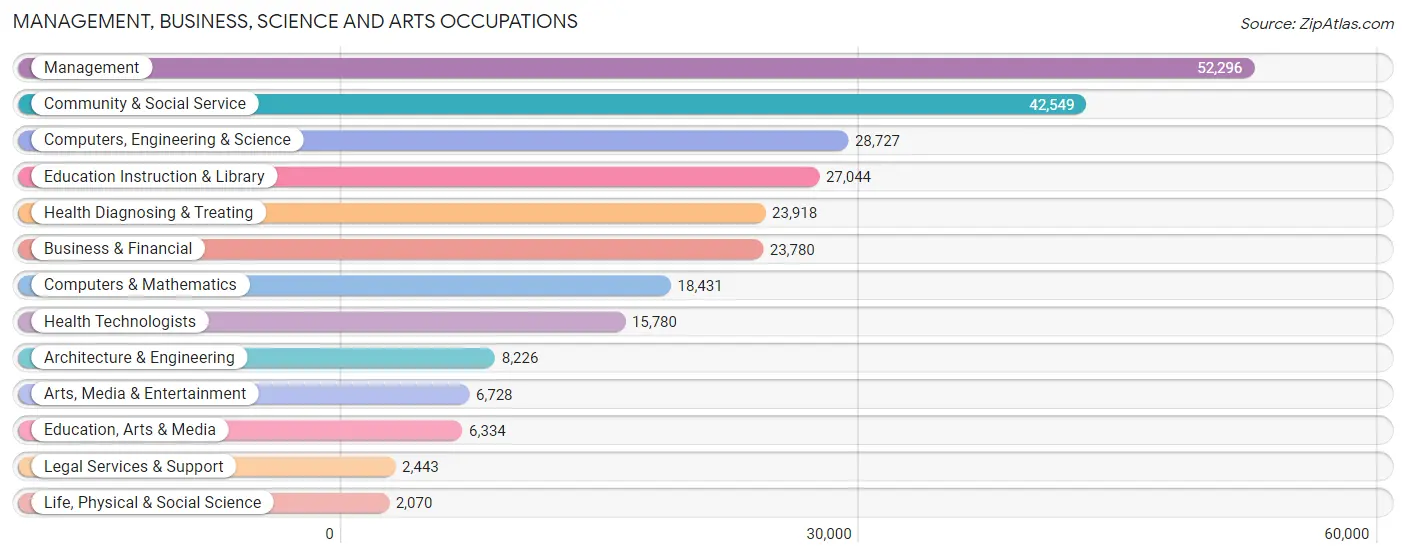
Management, Business, Science and Arts Occupations
The most common Management, Business, Science and Arts occupations in Area Code 940 are Management (52,296 | 13.2%), Community & Social Service (42,549 | 10.7%), Computers, Engineering & Science (28,727 | 7.2%), Education Instruction & Library (27,044 | 6.8%), and Health Diagnosing & Treating (23,918 | 6.0%).
Management, Business, Science and Arts Occupations by Sex
Within the Management, Business, Science and Arts occupations in Area Code 940, the most male-oriented occupations are Architecture & Engineering (88.8%), Computers, Engineering & Science (78.1%), and Computers & Mathematics (74.5%), while the most female-oriented occupations are Health Diagnosing & Treating (75.7%), Health Technologists (75.1%), and Education Instruction & Library (72.7%).
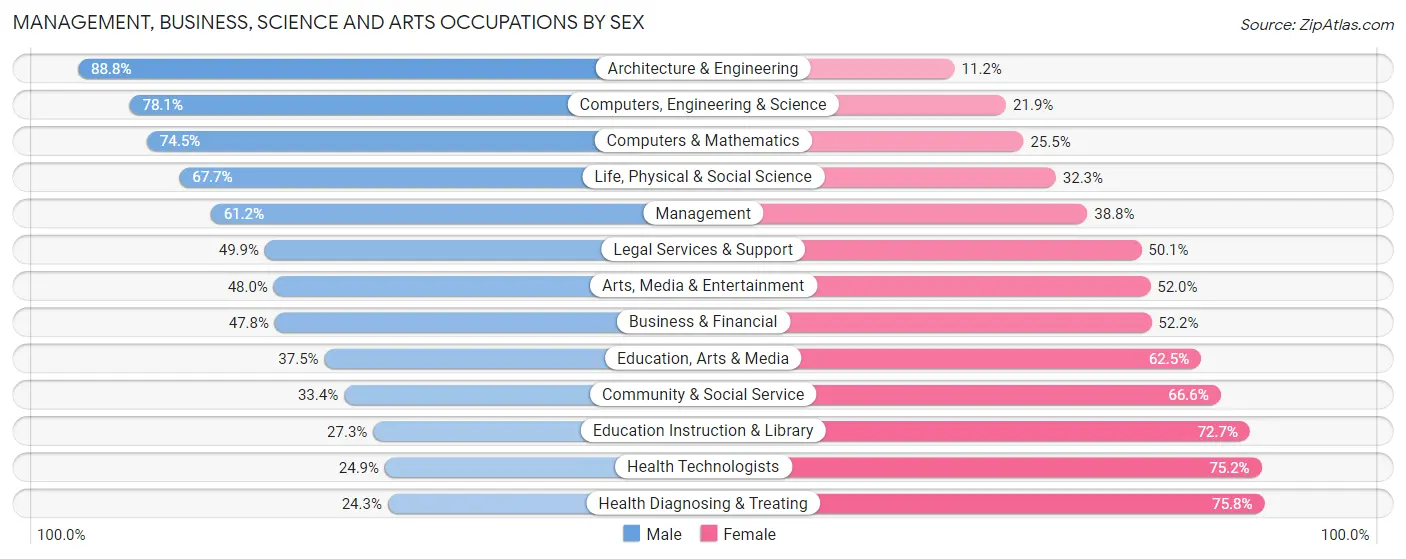
| Occupation | Male | Female |
| Management | 31,982 (61.2%) | 20,314 (38.8%) |
| Business & Financial | 11,370 (47.8%) | 12,410 (52.2%) |
| Computers, Engineering & Science | 22,437 (78.1%) | 6,290 (21.9%) |
| Computers & Mathematics | 13,727 (74.5%) | 4,704 (25.5%) |
| Architecture & Engineering | 7,308 (88.8%) | 918 (11.2%) |
| Life, Physical & Social Science | 1,402 (67.7%) | 668 (32.3%) |
| Community & Social Service | 14,204 (33.4%) | 28,345 (66.6%) |
| Education, Arts & Media | 2,373 (37.5%) | 3,961 (62.5%) |
| Legal Services & Support | 1,219 (49.9%) | 1,224 (50.1%) |
| Education Instruction & Library | 7,380 (27.3%) | 19,664 (72.7%) |
| Arts, Media & Entertainment | 3,232 (48.0%) | 3,496 (52.0%) |
| Health Diagnosing & Treating | 5,799 (24.2%) | 18,119 (75.7%) |
| Health Technologists | 3,921 (24.8%) | 11,859 (75.1%) |
| Total (Category) | 85,792 (50.1%) | 85,478 (49.9%) |
| Total (Overall) | 213,695 (53.8%) | 183,320 (46.2%) |
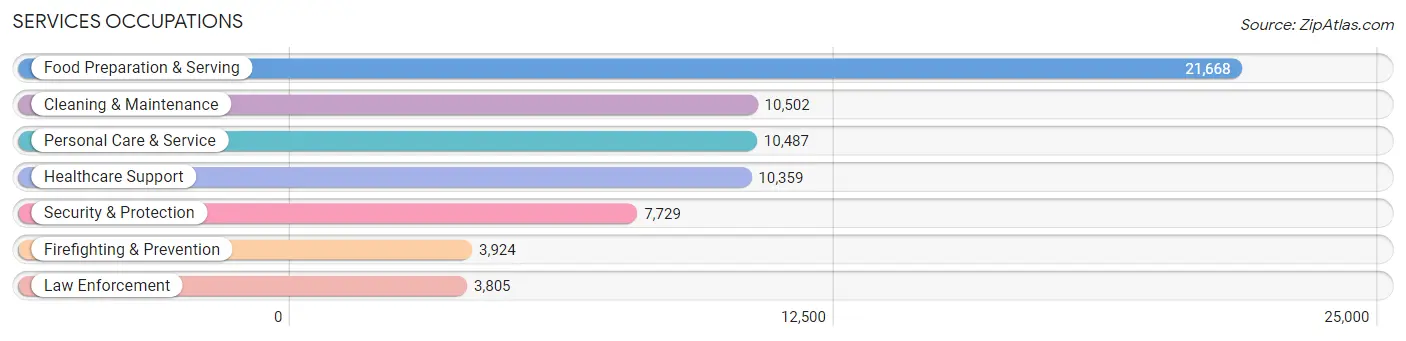
Services Occupations
The most common Services occupations in Area Code 940 are Food Preparation & Serving (21,668 | 5.5%), Cleaning & Maintenance (10,502 | 2.6%), Personal Care & Service (10,487 | 2.6%), Healthcare Support (10,359 | 2.6%), and Security & Protection (7,729 | 1.9%).
Services Occupations by Sex
Within the Services occupations in Area Code 940, the most male-oriented occupations are Firefighting & Prevention (78.7%), Security & Protection (77.3%), and Law Enforcement (75.8%), while the most female-oriented occupations are Healthcare Support (84.1%), Personal Care & Service (76.5%), and Food Preparation & Serving (58.7%).
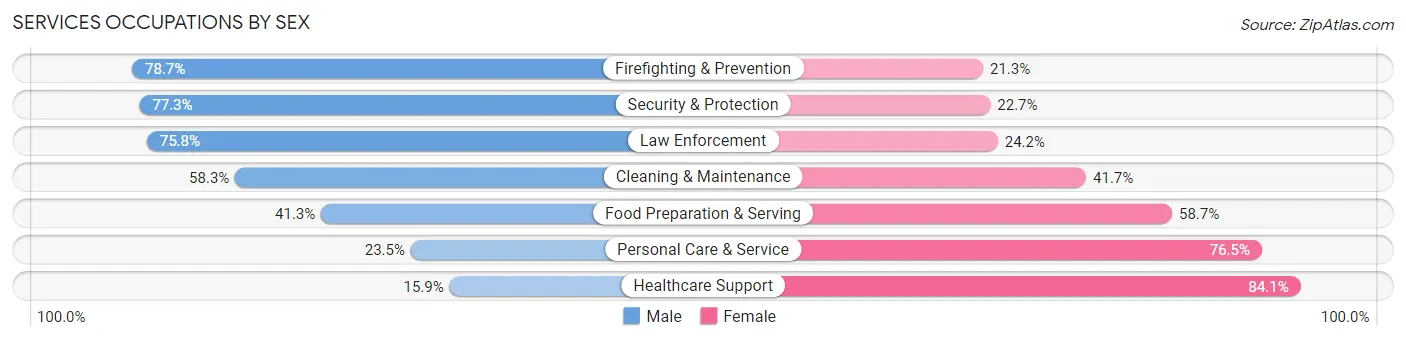
| Occupation | Male | Female |
| Healthcare Support | 1,643 (15.9%) | 8,716 (84.1%) |
| Security & Protection | 5,972 (77.3%) | 1,757 (22.7%) |
| Firefighting & Prevention | 3,088 (78.7%) | 836 (21.3%) |
| Law Enforcement | 2,884 (75.8%) | 921 (24.2%) |
| Food Preparation & Serving | 8,944 (41.3%) | 12,724 (58.7%) |
| Cleaning & Maintenance | 6,123 (58.3%) | 4,379 (41.7%) |
| Personal Care & Service | 2,468 (23.5%) | 8,019 (76.5%) |
| Total (Category) | 25,150 (41.4%) | 35,595 (58.6%) |
| Total (Overall) | 213,695 (53.8%) | 183,320 (46.2%) |
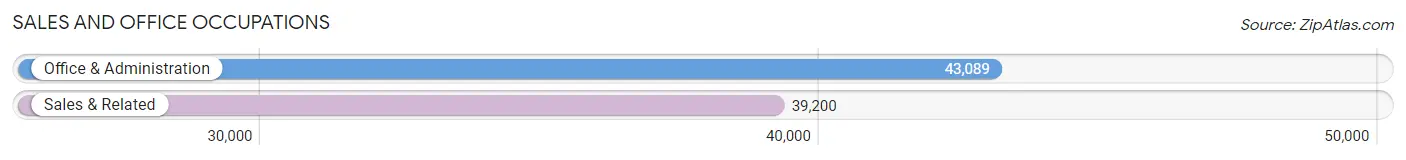
Sales and Office Occupations
The most common Sales and Office occupations in Area Code 940 are Office & Administration (43,089 | 10.8%), and Sales & Related (39,200 | 9.9%).
Sales and Office Occupations by Sex
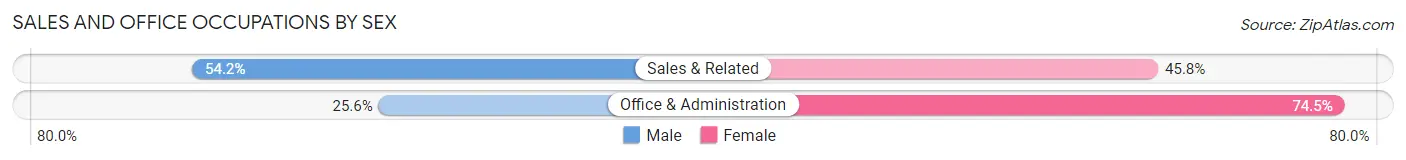
| Occupation | Male | Female |
| Sales & Related | 21,255 (54.2%) | 17,945 (45.8%) |
| Office & Administration | 11,011 (25.6%) | 32,078 (74.5%) |
| Total (Category) | 32,266 (39.2%) | 50,023 (60.8%) |
| Total (Overall) | 213,695 (53.8%) | 183,320 (46.2%) |
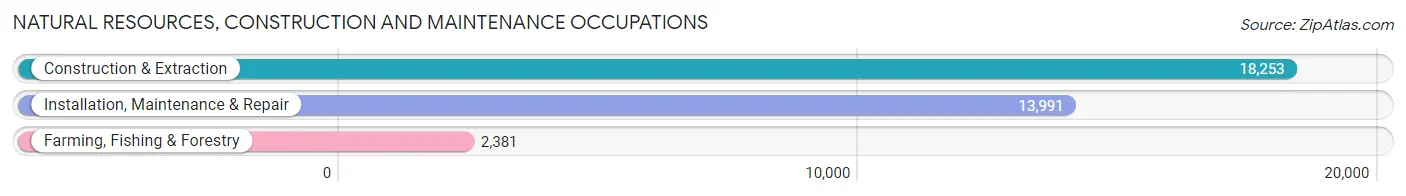
Natural Resources, Construction and Maintenance Occupations
The most common Natural Resources, Construction and Maintenance occupations in Area Code 940 are Construction & Extraction (18,253 | 4.6%), Installation, Maintenance & Repair (13,991 | 3.5%), and Farming, Fishing & Forestry (2,381 | 0.6%).
Natural Resources, Construction and Maintenance Occupations by Sex
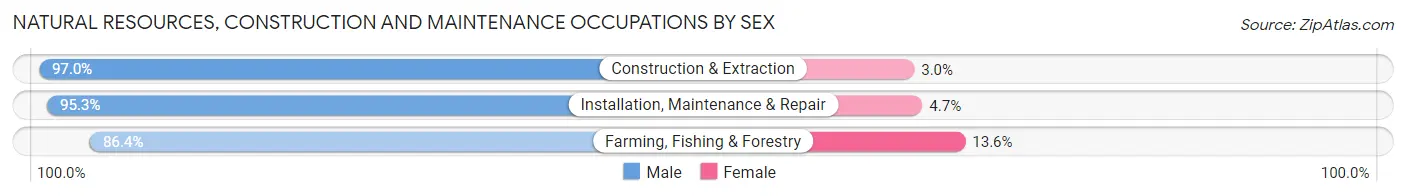
| Occupation | Male | Female |
| Farming, Fishing & Forestry | 2,057 (86.4%) | 324 (13.6%) |
| Construction & Extraction | 17,708 (97.0%) | 545 (3.0%) |
| Installation, Maintenance & Repair | 13,336 (95.3%) | 655 (4.7%) |
| Total (Category) | 33,101 (95.6%) | 1,524 (4.4%) |
| Total (Overall) | 213,695 (53.8%) | 183,320 (46.2%) |
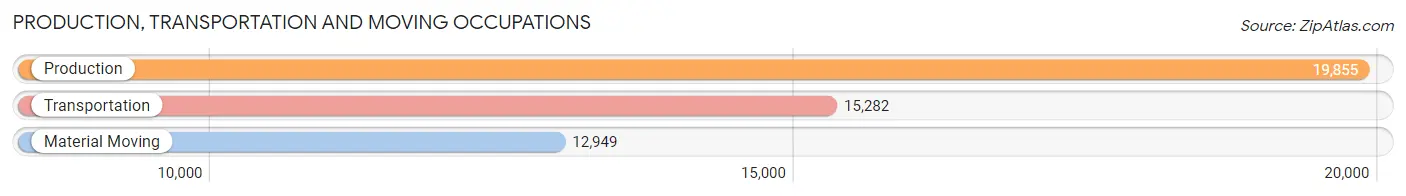
Production, Transportation and Moving Occupations
The most common Production, Transportation and Moving occupations in Area Code 940 are Production (19,855 | 5.0%), Transportation (15,282 | 3.8%), and Material Moving (12,949 | 3.3%).
Production, Transportation and Moving Occupations by Sex
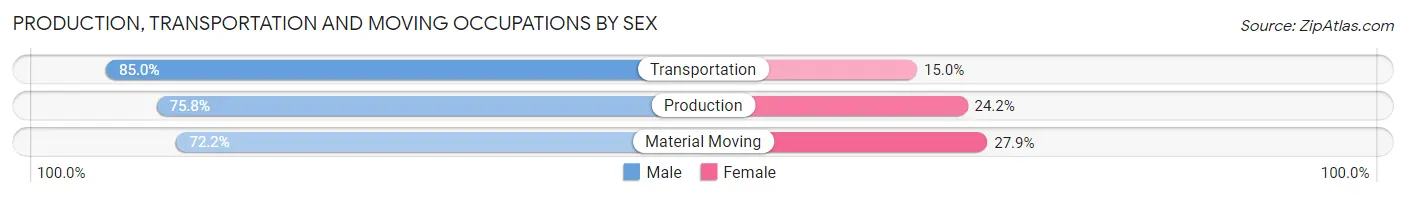
| Occupation | Male | Female |
| Production | 15,047 (75.8%) | 4,808 (24.2%) |
| Transportation | 12,996 (85.0%) | 2,286 (15.0%) |
| Material Moving | 9,343 (72.2%) | 3,606 (27.9%) |
| Total (Category) | 37,386 (77.7%) | 10,700 (22.3%) |
| Total (Overall) | 213,695 (53.8%) | 183,320 (46.2%) |
Employment Industries by Sex in Area Code 940
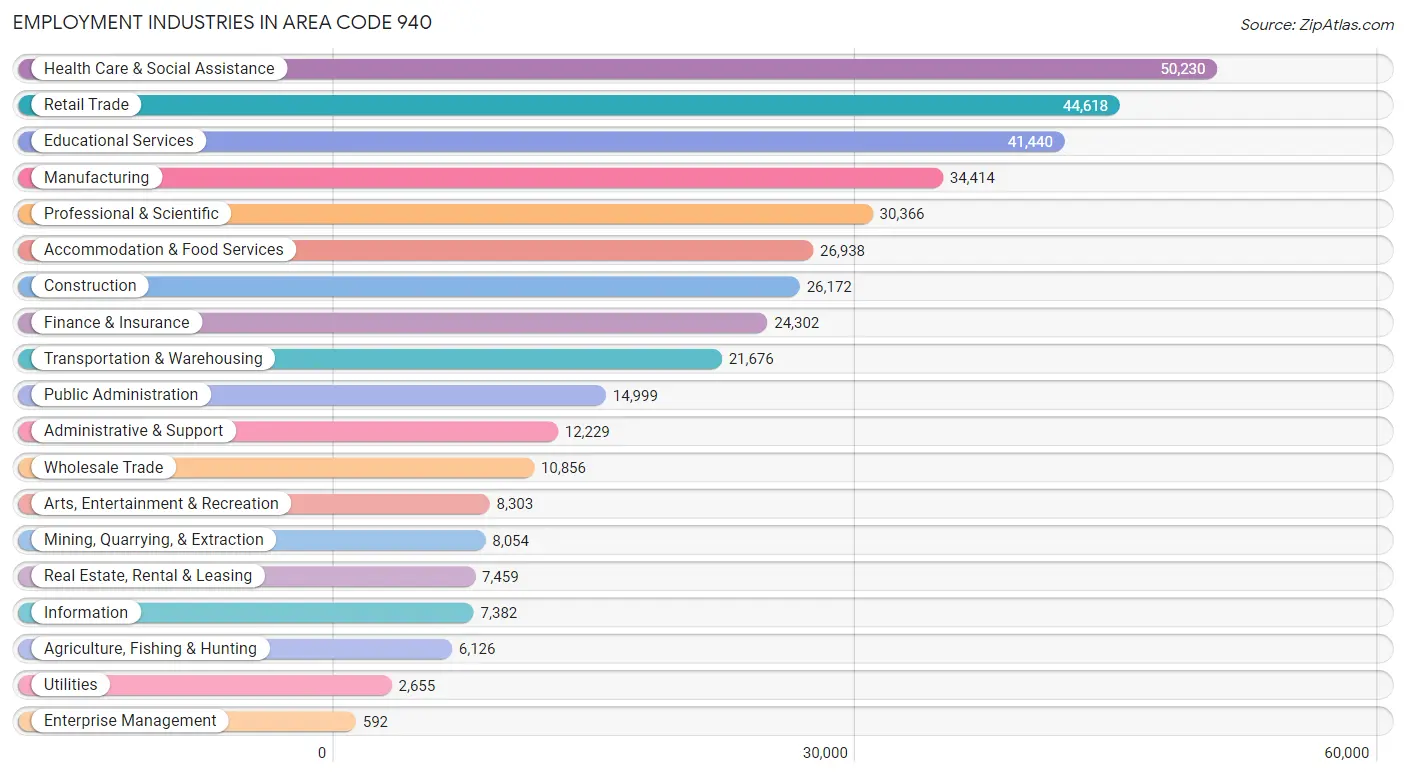
Employment Industries in Area Code 940
The major employment industries in Area Code 940 include Health Care & Social Assistance (50,230 | 12.7%), Retail Trade (44,618 | 11.2%), Educational Services (41,440 | 10.4%), Manufacturing (34,414 | 8.7%), and Professional & Scientific (30,366 | 7.6%).
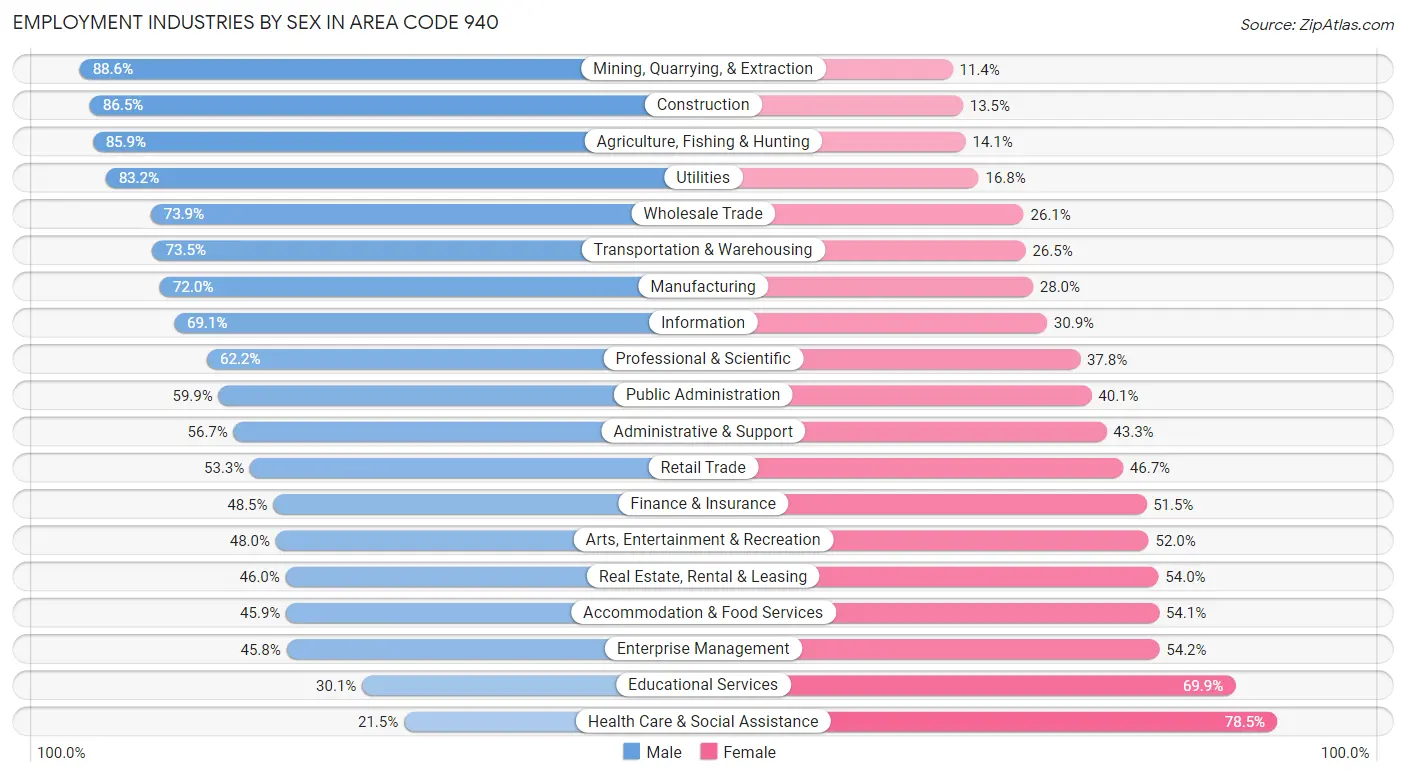
Employment Industries by Sex in Area Code 940
The Area Code 940 industries that see more men than women are Mining, Quarrying, & Extraction (88.6%), Construction (86.5%), and Agriculture, Fishing & Hunting (85.9%), whereas the industries that tend to have a higher number of women are Health Care & Social Assistance (78.5%), Educational Services (69.9%), and Enterprise Management (54.2%).
| Industry | Male | Female |
| Agriculture, Fishing & Hunting | 5,262 (85.9%) | 864 (14.1%) |
| Mining, Quarrying, & Extraction | 7,134 (88.6%) | 920 (11.4%) |
| Construction | 22,631 (86.5%) | 3,541 (13.5%) |
| Manufacturing | 24,768 (72.0%) | 9,646 (28.0%) |
| Wholesale Trade | 8,020 (73.9%) | 2,836 (26.1%) |
| Retail Trade | 23,797 (53.3%) | 20,821 (46.7%) |
| Transportation & Warehousing | 15,929 (73.5%) | 5,747 (26.5%) |
| Utilities | 2,209 (83.2%) | 446 (16.8%) |
| Information | 5,098 (69.1%) | 2,284 (30.9%) |
| Finance & Insurance | 11,790 (48.5%) | 12,512 (51.5%) |
| Real Estate, Rental & Leasing | 3,430 (46.0%) | 4,029 (54.0%) |
| Professional & Scientific | 18,890 (62.2%) | 11,476 (37.8%) |
| Enterprise Management | 271 (45.8%) | 321 (54.2%) |
| Administrative & Support | 6,939 (56.7%) | 5,290 (43.3%) |
| Educational Services | 12,487 (30.1%) | 28,953 (69.9%) |
| Health Care & Social Assistance | 10,779 (21.5%) | 39,451 (78.5%) |
| Arts, Entertainment & Recreation | 3,986 (48.0%) | 4,317 (52.0%) |
| Accommodation & Food Services | 12,355 (45.9%) | 14,583 (54.1%) |
| Public Administration | 8,979 (59.9%) | 6,020 (40.1%) |
| Total | 213,695 (53.8%) | 183,320 (46.2%) |
Education in Area Code 940
School Enrollment in Area Code 940
The most common levels of schooling among the 211,008 students in Area Code 940 are college / undergraduate (50,579 | 24.0%), high school (43,947 | 20.8%), and middle school (43,499 | 20.6%).
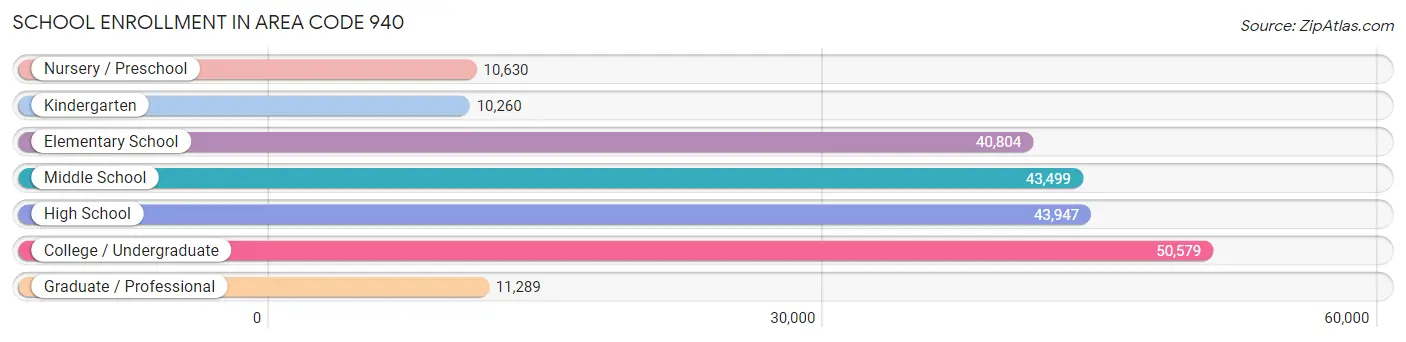
| School Level | # Students | % Students |
| Nursery / Preschool | 10,630 | 5.0% |
| Kindergarten | 10,260 | 4.9% |
| Elementary School | 40,804 | 19.3% |
| Middle School | 43,499 | 20.6% |
| High School | 43,947 | 20.8% |
| College / Undergraduate | 50,579 | 24.0% |
| Graduate / Professional | 11,289 | 5.3% |
| Total | 211,008 | 100.0% |
School Enrollment by Age by Funding Source in Area Code 940
Out of a total of 211,008 students who are enrolled in schools in Area Code 940, 24,742 (11.7%) attend a private institution, while the remaining 186,266 (88.3%) are enrolled in public schools. The age group of 3 to 4 year olds has the highest likelihood of being enrolled in private schools, with 3,459 (43.9% in the age bracket) enrolled. Conversely, the age group of 15 to 17 year olds has the lowest likelihood of being enrolled in a private school, with 29,973 (92.6% in the age bracket) attending a public institution.
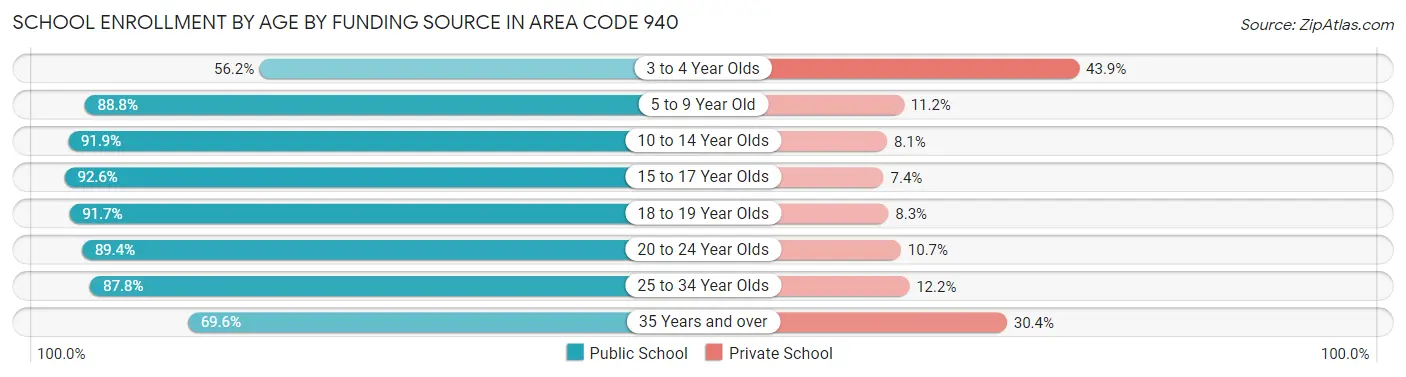
| Age Bracket | Public School | Private School |
| 3 to 4 Year Olds | 4,430 (56.1%) | 3,459 (43.9%) |
| 5 to 9 Year Old | 42,700 (88.8%) | 5,374 (11.2%) |
| 10 to 14 Year Olds | 50,282 (91.9%) | 4,410 (8.1%) |
| 15 to 17 Year Olds | 29,973 (92.6%) | 2,405 (7.4%) |
| 18 to 19 Year Olds | 17,158 (91.7%) | 1,557 (8.3%) |
| 20 to 24 Year Olds | 23,919 (89.3%) | 2,850 (10.6%) |
| 25 to 34 Year Olds | 10,374 (87.8%) | 1,443 (12.2%) |
| 35 Years and over | 7,430 (69.6%) | 3,244 (30.4%) |
| Total | 186,267 (88.3%) | 24,742 (11.7%) |
Educational Attainment by Field of Study in Area Code 940
Business (46,443 | 22.9%), education (23,618 | 11.7%), science & technology (19,267 | 9.5%), engineering (18,726 | 9.2%), and computers & mathematics (13,094 | 6.5%) are the most common fields of study among 202,470 individuals in Area Code 940 who have obtained a bachelor's degree or higher.
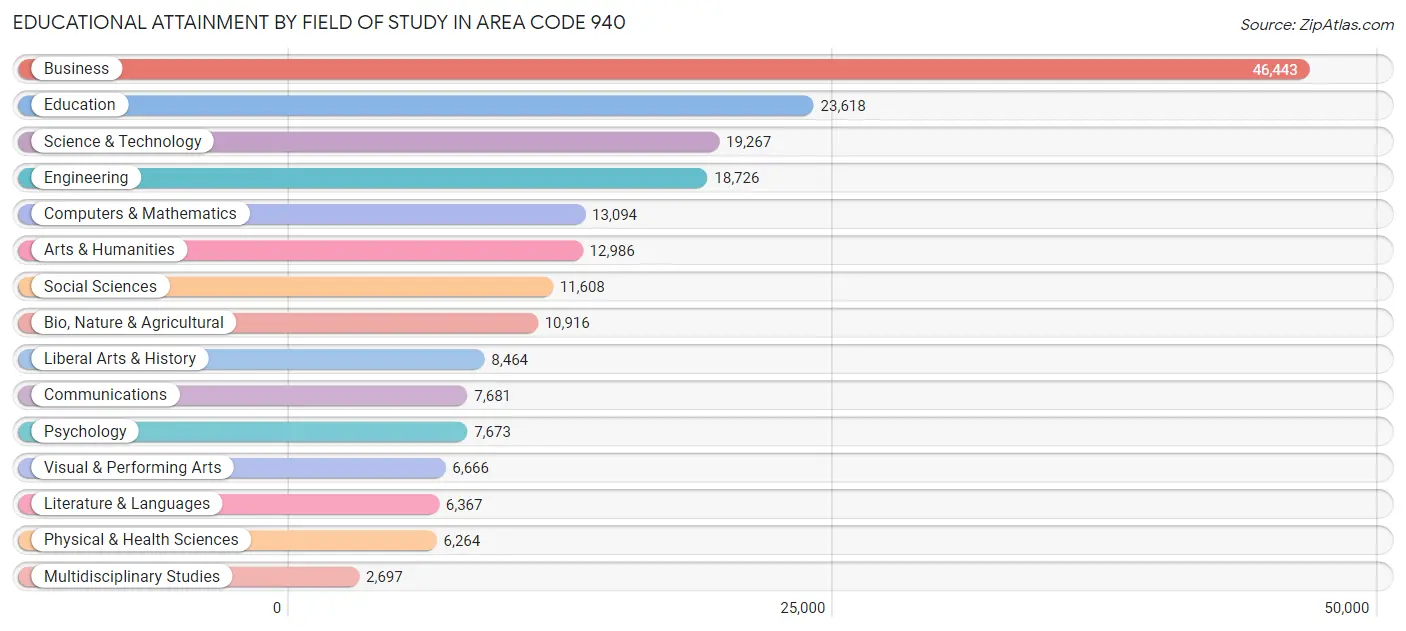
| Field of Study | # Graduates | % Graduates |
| Computers & Mathematics | 13,094 | 6.5% |
| Bio, Nature & Agricultural | 10,916 | 5.4% |
| Physical & Health Sciences | 6,264 | 3.1% |
| Psychology | 7,673 | 3.8% |
| Social Sciences | 11,608 | 5.7% |
| Engineering | 18,726 | 9.2% |
| Multidisciplinary Studies | 2,697 | 1.3% |
| Science & Technology | 19,267 | 9.5% |
| Business | 46,443 | 22.9% |
| Education | 23,618 | 11.7% |
| Literature & Languages | 6,367 | 3.1% |
| Liberal Arts & History | 8,464 | 4.2% |
| Visual & Performing Arts | 6,666 | 3.3% |
| Communications | 7,681 | 3.8% |
| Arts & Humanities | 12,986 | 6.4% |
| Total | 202,470 | 100.0% |
Transportation & Commute in Area Code 940
Vehicle Availability by Sex in Area Code 940
The most prevalent vehicle ownership categories in Area Code 940 are males with 2 vehicles (95,480, accounting for 45.2%) and females with 2 vehicles (75,683, making up 54.0%).
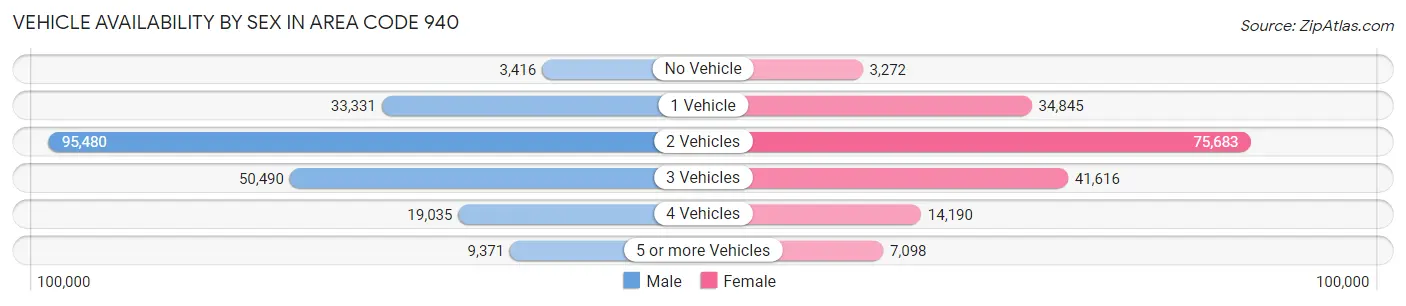
| Vehicles Available | Male | Female |
| No Vehicle | 3,416 (1.6%) | 3,272 (1.8%) |
| 1 Vehicle | 33,331 (15.8%) | 34,845 (19.7%) |
| 2 Vehicles | 95,480 (45.2%) | 75,683 (42.8%) |
| 3 Vehicles | 50,490 (23.9%) | 41,616 (23.5%) |
| 4 Vehicles | 19,035 (9.0%) | 14,190 (8.0%) |
| 5 or more Vehicles | 9,371 (4.4%) | 7,098 (4.0%) |
| Total | 211,123 (100.0%) | 176,704 (100.0%) |
Commute Time in Area Code 940
The most frequently occuring commute durations in Area Code 940 are 10 to 14 minutes (51,233 commuters, 14.8%), 15 to 19 minutes (49,597 commuters, 14.4%), and 5 to 9 minutes (46,346 commuters, 13.4%).
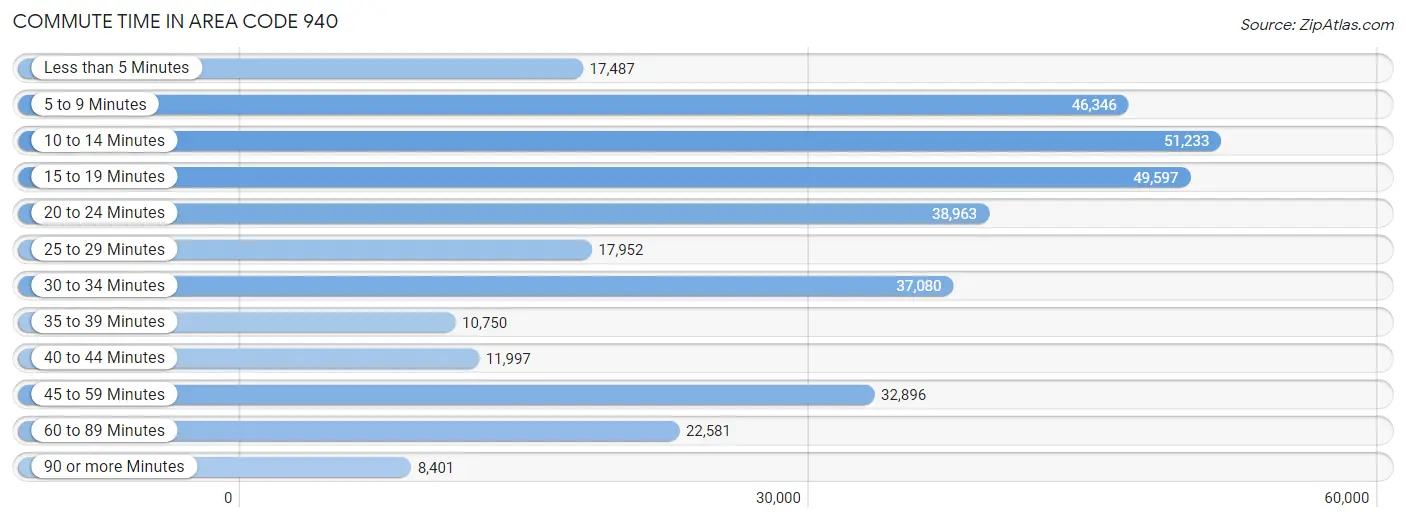
| Commute Time | # Commuters | % Commuters |
| Less than 5 Minutes | 17,487 | 5.1% |
| 5 to 9 Minutes | 46,346 | 13.4% |
| 10 to 14 Minutes | 51,233 | 14.8% |
| 15 to 19 Minutes | 49,597 | 14.4% |
| 20 to 24 Minutes | 38,963 | 11.3% |
| 25 to 29 Minutes | 17,952 | 5.2% |
| 30 to 34 Minutes | 37,080 | 10.7% |
| 35 to 39 Minutes | 10,750 | 3.1% |
| 40 to 44 Minutes | 11,997 | 3.5% |
| 45 to 59 Minutes | 32,896 | 9.5% |
| 60 to 89 Minutes | 22,581 | 6.5% |
| 90 or more Minutes | 8,401 | 2.4% |
Commute Time by Sex in Area Code 940
The most common commute times in Area Code 940 are 10 to 14 minutes (26,889 commuters, 14.1%) for males and 10 to 14 minutes (24,344 commuters, 15.7%) for females.
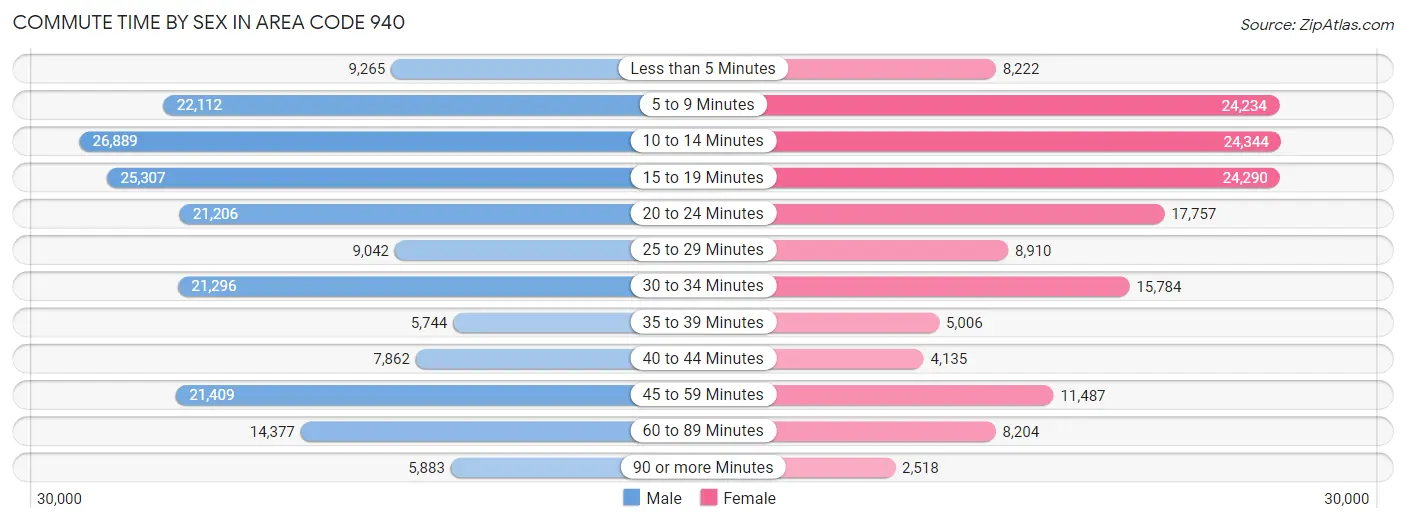
| Commute Time | Male | Female |
| Less than 5 Minutes | 9,265 (4.9%) | 8,222 (5.3%) |
| 5 to 9 Minutes | 22,112 (11.6%) | 24,234 (15.7%) |
| 10 to 14 Minutes | 26,889 (14.1%) | 24,344 (15.7%) |
| 15 to 19 Minutes | 25,307 (13.3%) | 24,290 (15.7%) |
| 20 to 24 Minutes | 21,206 (11.1%) | 17,757 (11.5%) |
| 25 to 29 Minutes | 9,042 (4.8%) | 8,910 (5.8%) |
| 30 to 34 Minutes | 21,296 (11.2%) | 15,784 (10.2%) |
| 35 to 39 Minutes | 5,744 (3.0%) | 5,006 (3.2%) |
| 40 to 44 Minutes | 7,862 (4.1%) | 4,135 (2.7%) |
| 45 to 59 Minutes | 21,409 (11.2%) | 11,487 (7.4%) |
| 60 to 89 Minutes | 14,377 (7.5%) | 8,204 (5.3%) |
| 90 or more Minutes | 5,883 (3.1%) | 2,518 (1.6%) |
Time of Departure to Work by Sex in Area Code 940
The most frequent times of departure to work in Area Code 940 are 7:00 AM to 7:29 AM (27,014, 14.2%) for males and 7:00 AM to 7:29 AM (23,349, 15.1%) for females.
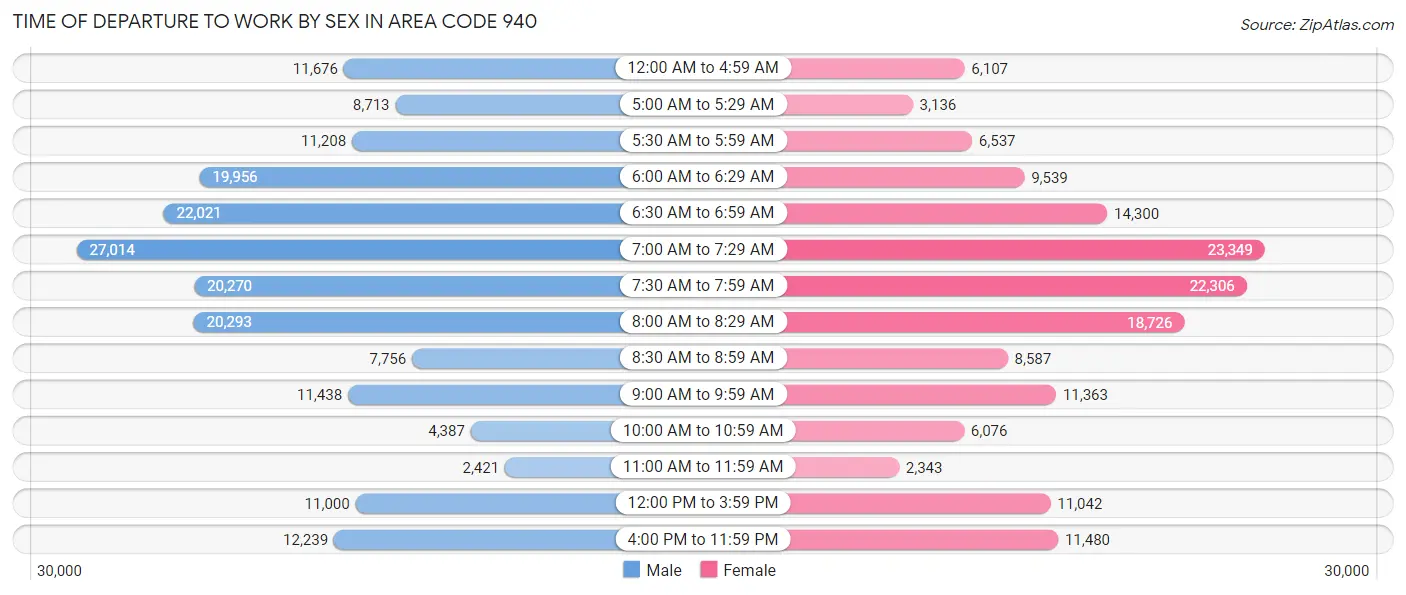
| Time of Departure | Male | Female |
| 12:00 AM to 4:59 AM | 11,676 (6.1%) | 6,107 (3.9%) |
| 5:00 AM to 5:29 AM | 8,713 (4.6%) | 3,136 (2.0%) |
| 5:30 AM to 5:59 AM | 11,208 (5.9%) | 6,537 (4.2%) |
| 6:00 AM to 6:29 AM | 19,956 (10.5%) | 9,539 (6.2%) |
| 6:30 AM to 6:59 AM | 22,021 (11.6%) | 14,300 (9.2%) |
| 7:00 AM to 7:29 AM | 27,014 (14.2%) | 23,349 (15.1%) |
| 7:30 AM to 7:59 AM | 20,270 (10.6%) | 22,306 (14.4%) |
| 8:00 AM to 8:29 AM | 20,293 (10.7%) | 18,726 (12.1%) |
| 8:30 AM to 8:59 AM | 7,756 (4.1%) | 8,587 (5.5%) |
| 9:00 AM to 9:59 AM | 11,438 (6.0%) | 11,363 (7.3%) |
| 10:00 AM to 10:59 AM | 4,387 (2.3%) | 6,076 (3.9%) |
| 11:00 AM to 11:59 AM | 2,421 (1.3%) | 2,343 (1.5%) |
| 12:00 PM to 3:59 PM | 11,000 (5.8%) | 11,042 (7.1%) |
| 4:00 PM to 11:59 PM | 12,239 (6.4%) | 11,480 (7.4%) |
| Total | 190,392 (100.0%) | 154,891 (100.0%) |
Housing Occupancy in Area Code 940
Occupancy by Ownership in Area Code 940
Of the total 292,132 dwellings in Area Code 940, owner-occupied units account for 195,316 (66.9%), while renter-occupied units make up 96,816 (33.1%).
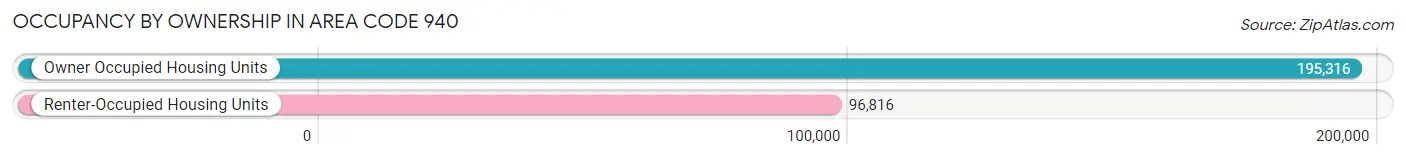
| Occupancy | # Housing Units | % Housing Units |
| Owner Occupied Housing Units | 195,316 | 66.9% |
| Renter-Occupied Housing Units | 96,816 | 33.1% |
| Total Occupied Housing Units | 292,132 | 100.0% |
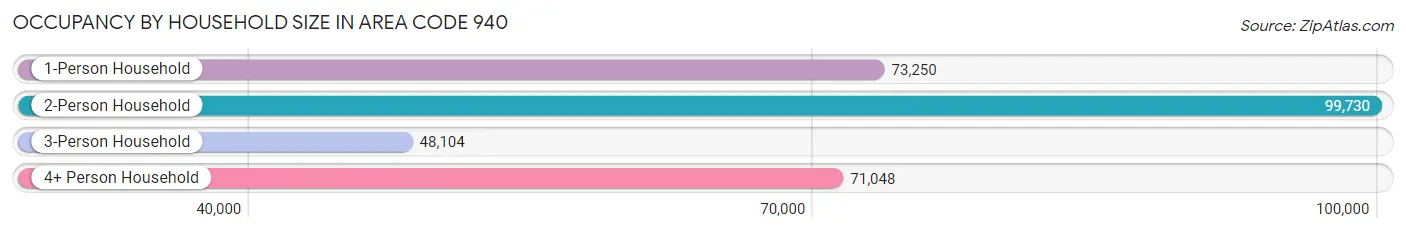
Occupancy by Household Size in Area Code 940
| Household Size | # Housing Units | % Housing Units |
| 1-Person Household | 73,250 | 25.1% |
| 2-Person Household | 99,730 | 34.1% |
| 3-Person Household | 48,104 | 16.5% |
| 4+ Person Household | 71,048 | 24.3% |
| Total Housing Units | 292,132 | 100.0% |
Occupancy by Ownership by Household Size in Area Code 940
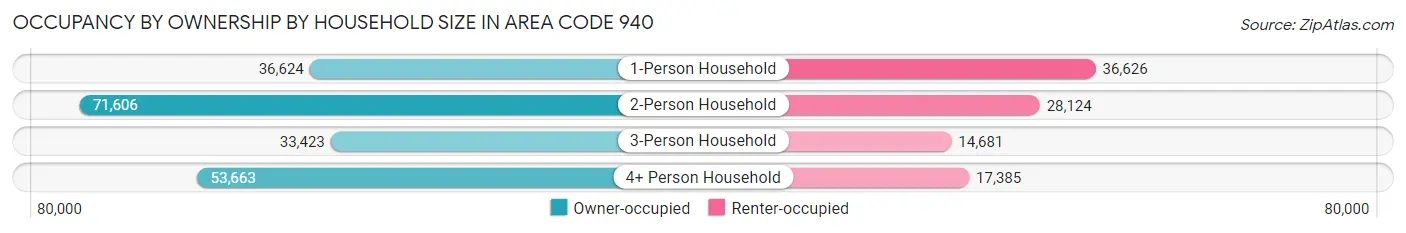
| Household Size | Owner-occupied | Renter-occupied |
| 1-Person Household | 36,624 (50.0%) | 36,626 (50.0%) |
| 2-Person Household | 71,606 (71.8%) | 28,124 (28.2%) |
| 3-Person Household | 33,423 (69.5%) | 14,681 (30.5%) |
| 4+ Person Household | 53,663 (75.5%) | 17,385 (24.5%) |
| Total Housing Units | 195,316 (66.9%) | 96,816 (33.1%) |
Occupancy by Educational Attainment in Area Code 940
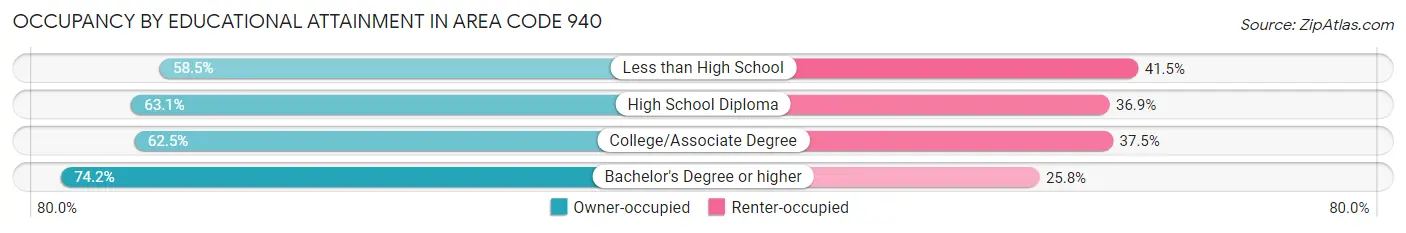
| Household Size | Owner-occupied | Renter-occupied |
| Less than High School | 12,876 (58.5%) | 9,136 (41.5%) |
| High School Diploma | 39,792 (63.1%) | 23,311 (36.9%) |
| College/Associate Degree | 58,407 (62.5%) | 35,045 (37.5%) |
| Bachelor's Degree or higher | 84,241 (74.2%) | 29,324 (25.8%) |
Occupancy by Age of Householder in Area Code 940
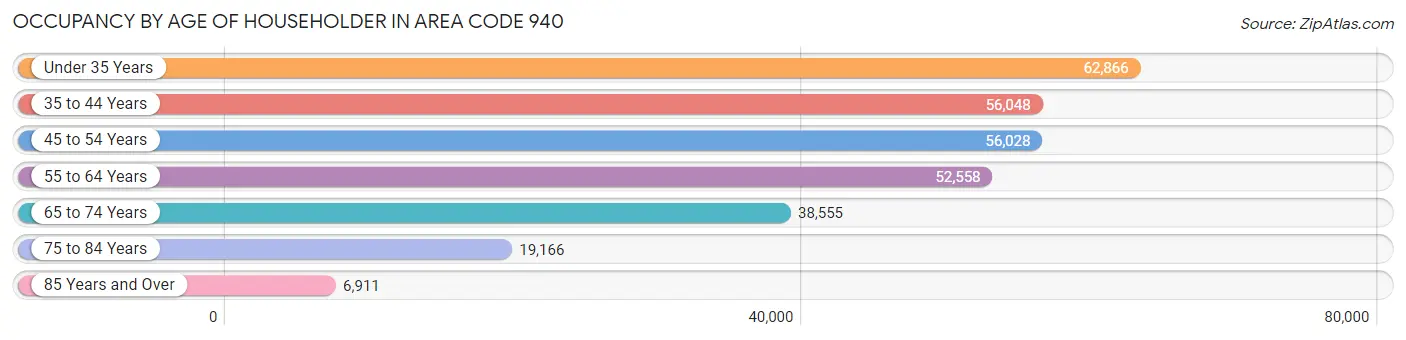
| Age Bracket | # Households | % Households |
| Under 35 Years | 62,866 | 21.5% |
| 35 to 44 Years | 56,048 | 19.2% |
| 45 to 54 Years | 56,028 | 19.2% |
| 55 to 64 Years | 52,558 | 18.0% |
| 65 to 74 Years | 38,555 | 13.2% |
| 75 to 84 Years | 19,166 | 6.6% |
| 85 Years and Over | 6,911 | 2.4% |
| Total | 292,132 | 100.0% |
Housing Finances in Area Code 940
Median Income by Occupancy in Area Code 940
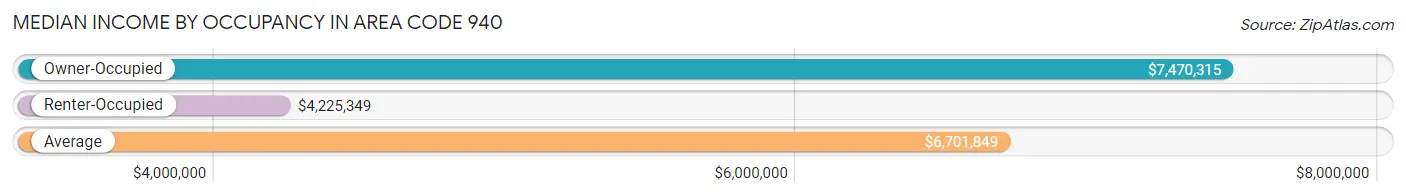
| Occupancy Type | # Households | Median Income |
| Owner-Occupied | 195,316 (66.9%) | $7,470,315 |
| Renter-Occupied | 96,816 (33.1%) | $4,225,349 |
| Average | 292,132 (100.0%) | $6,701,849 |
Occupancy by Householder Income Bracket in Area Code 940
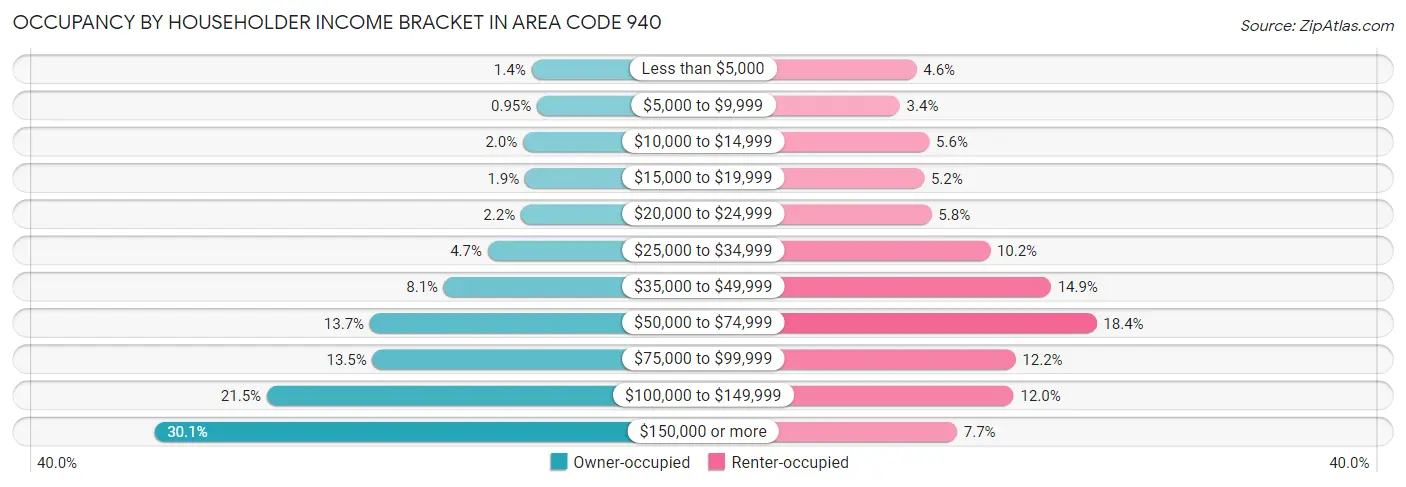
| Income Bracket | Owner-occupied | Renter-occupied |
| Less than $5,000 | 2,689 (1.4%) | 4,486 (4.6%) |
| $5,000 to $9,999 | 1,859 (0.9%) | 3,257 (3.4%) |
| $10,000 to $14,999 | 3,950 (2.0%) | 5,430 (5.6%) |
| $15,000 to $19,999 | 3,646 (1.9%) | 5,045 (5.2%) |
| $20,000 to $24,999 | 4,263 (2.2%) | 5,593 (5.8%) |
| $25,000 to $34,999 | 9,195 (4.7%) | 9,917 (10.2%) |
| $35,000 to $49,999 | 15,715 (8.1%) | 14,398 (14.9%) |
| $50,000 to $74,999 | 26,745 (13.7%) | 17,762 (18.3%) |
| $75,000 to $99,999 | 26,347 (13.5%) | 11,791 (12.2%) |
| $100,000 to $149,999 | 42,069 (21.5%) | 11,660 (12.0%) |
| $150,000 or more | 58,838 (30.1%) | 7,477 (7.7%) |
| Total | 195,316 (100.0%) | 96,816 (100.0%) |
Monthly Housing Cost Tiers in Area Code 940
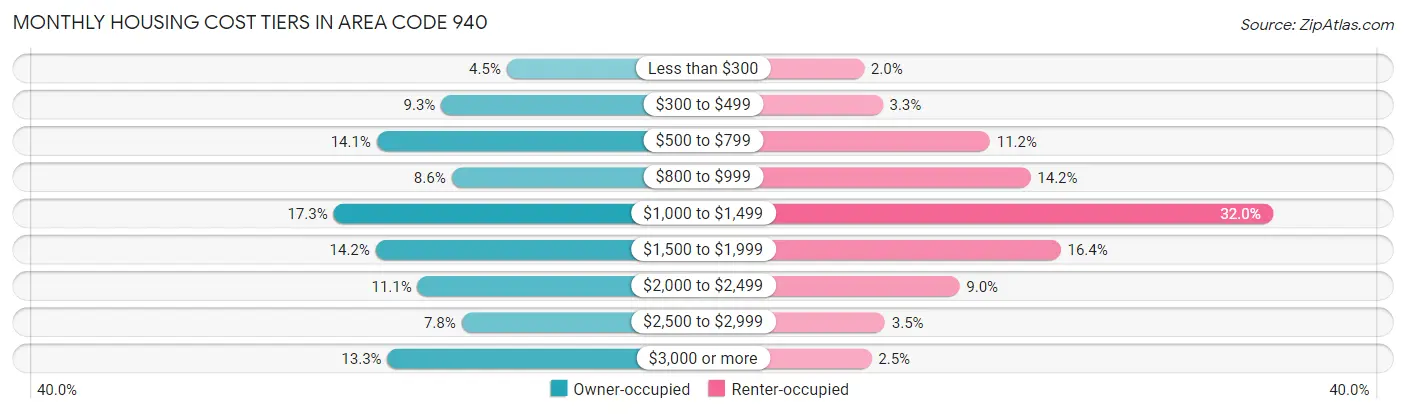
| Monthly Cost | Owner-occupied | Renter-occupied |
| Less than $300 | 8,764 (4.5%) | 1,889 (1.9%) |
| $300 to $499 | 18,200 (9.3%) | 3,212 (3.3%) |
| $500 to $799 | 27,474 (14.1%) | 10,866 (11.2%) |
| $800 to $999 | 16,716 (8.6%) | 13,758 (14.2%) |
| $1,000 to $1,499 | 33,693 (17.2%) | 31,023 (32.0%) |
| $1,500 to $1,999 | 27,643 (14.1%) | 15,903 (16.4%) |
| $2,000 to $2,499 | 21,602 (11.1%) | 8,691 (9.0%) |
| $2,500 to $2,999 | 15,281 (7.8%) | 3,378 (3.5%) |
| $3,000 or more | 25,943 (13.3%) | 2,424 (2.5%) |
| Total | 195,316 (100.0%) | 96,816 (100.0%) |
Physical Housing Characteristics in Area Code 940
Housing Structures in Area Code 940
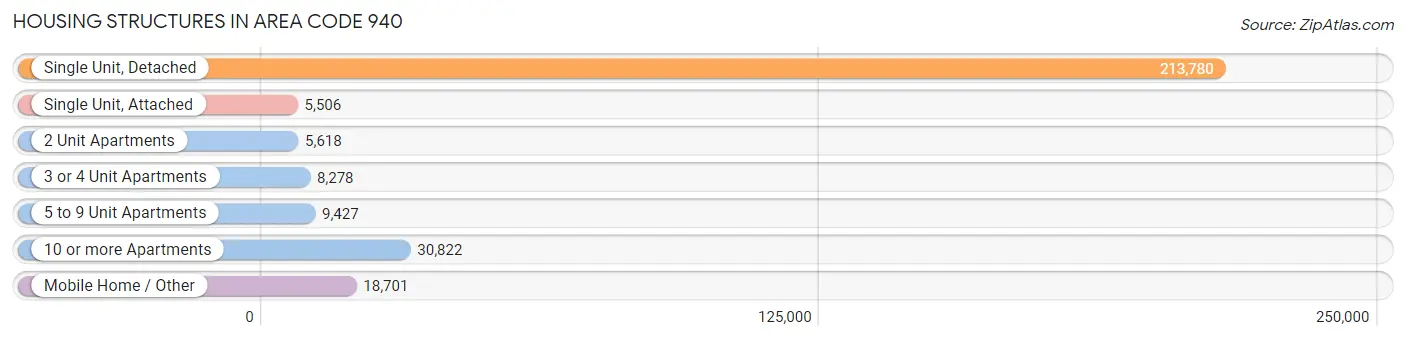
| Structure Type | # Housing Units | % Housing Units |
| Single Unit, Detached | 213,780 | 73.2% |
| Single Unit, Attached | 5,506 | 1.9% |
| 2 Unit Apartments | 5,618 | 1.9% |
| 3 or 4 Unit Apartments | 8,278 | 2.8% |
| 5 to 9 Unit Apartments | 9,427 | 3.2% |
| 10 or more Apartments | 30,822 | 10.5% |
| Mobile Home / Other | 18,701 | 6.4% |
| Total | 292,132 | 100.0% |
Housing Structures by Occupancy in Area Code 940
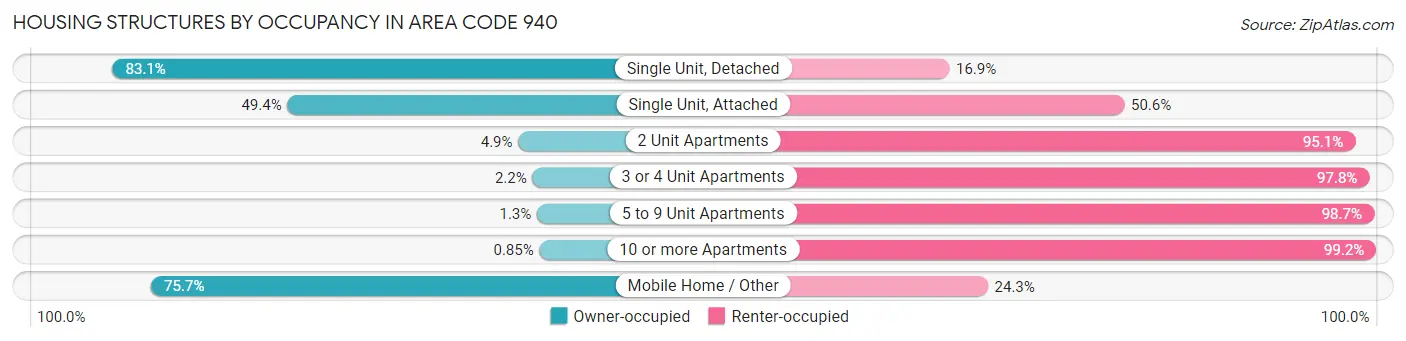
| Structure Type | Owner-occupied | Renter-occupied |
| Single Unit, Detached | 177,602 (83.1%) | 36,178 (16.9%) |
| Single Unit, Attached | 2,719 (49.4%) | 2,787 (50.6%) |
| 2 Unit Apartments | 277 (4.9%) | 5,341 (95.1%) |
| 3 or 4 Unit Apartments | 182 (2.2%) | 8,096 (97.8%) |
| 5 to 9 Unit Apartments | 124 (1.3%) | 9,303 (98.7%) |
| 10 or more Apartments | 262 (0.9%) | 30,560 (99.2%) |
| Mobile Home / Other | 14,150 (75.7%) | 4,551 (24.3%) |
| Total | 195,316 (66.9%) | 96,816 (33.1%) |
Housing Structures by Number of Rooms in Area Code 940
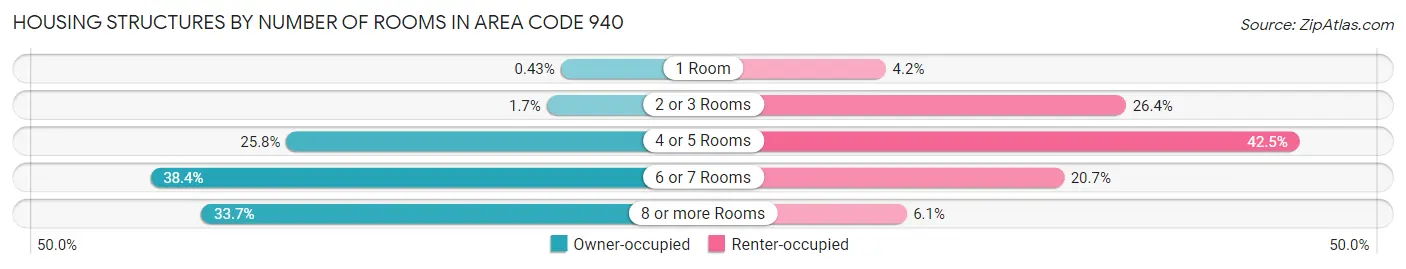
| Number of Rooms | Owner-occupied | Renter-occupied |
| 1 Room | 843 (0.4%) | 4,091 (4.2%) |
| 2 or 3 Rooms | 3,367 (1.7%) | 25,587 (26.4%) |
| 4 or 5 Rooms | 50,368 (25.8%) | 41,160 (42.5%) |
| 6 or 7 Rooms | 74,972 (38.4%) | 20,039 (20.7%) |
| 8 or more Rooms | 65,766 (33.7%) | 5,939 (6.1%) |
| Total | 195,316 (100.0%) | 96,816 (100.0%) |
Housing Structure by Heating Type in Area Code 940
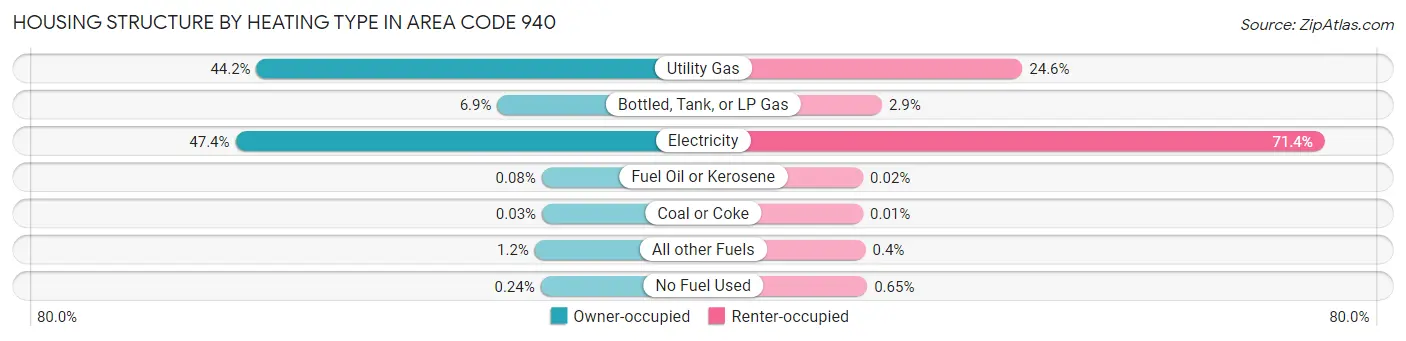
| Heating Type | Owner-occupied | Renter-occupied |
| Utility Gas | 86,247 (44.2%) | 23,841 (24.6%) |
| Bottled, Tank, or LP Gas | 13,534 (6.9%) | 2,849 (2.9%) |
| Electricity | 92,624 (47.4%) | 69,075 (71.4%) |
| Fuel Oil or Kerosene | 153 (0.1%) | 23 (0.0%) |
| Coal or Coke | 60 (0.0%) | 10 (0.0%) |
| All other Fuels | 2,238 (1.1%) | 390 (0.4%) |
| No Fuel Used | 460 (0.2%) | 628 (0.6%) |
| Total | 195,316 (100.0%) | 96,816 (100.0%) |
Household Vehicle Usage in Area Code 940
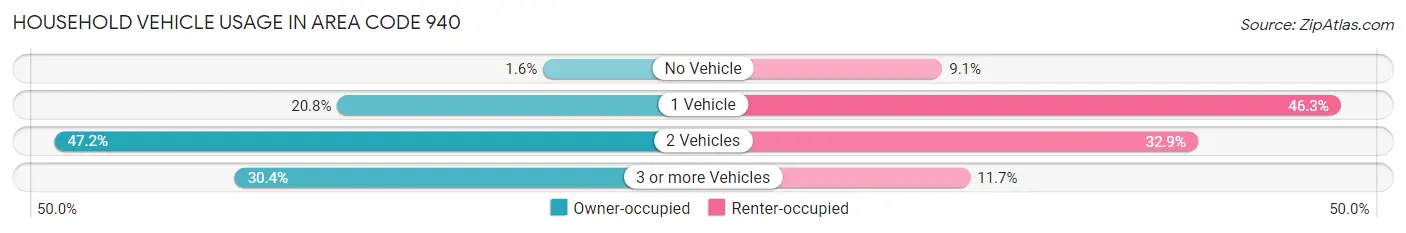
| Vehicles per Household | Owner-occupied | Renter-occupied |
| No Vehicle | 3,152 (1.6%) | 8,801 (9.1%) |
| 1 Vehicle | 40,650 (20.8%) | 44,797 (46.3%) |
| 2 Vehicles | 92,177 (47.2%) | 31,892 (32.9%) |
| 3 or more Vehicles | 59,337 (30.4%) | 11,326 (11.7%) |
| Total | 195,316 (100.0%) | 96,816 (100.0%) |
Real Estate & Mortgages in Area Code 940
Real Estate and Mortgage Overview in Area Code 940
| Characteristic | Without Mortgage | With Mortgage |
| Housing Units | 79,911 | 115,405 |
| Median Property Value | $13,586,200 | $16,771,200 |
| Median Household Income | $5,952,876 | $43,382 |
| Monthly Housing Costs | $53,842 | $25,498 |
| Real Estate Taxes | $181,150 | $3,919 |
Property Value by Mortgage Status in Area Code 940
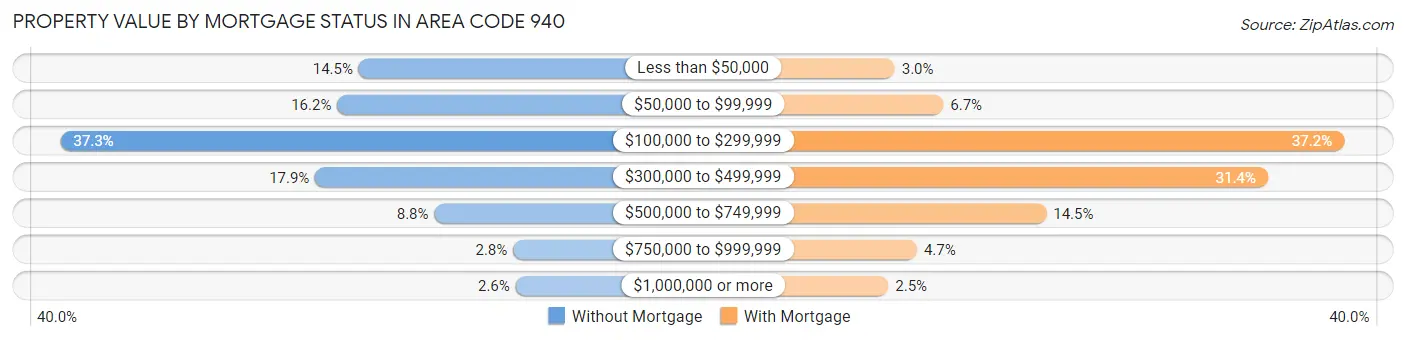
| Property Value | Without Mortgage | With Mortgage |
| Less than $50,000 | 11,622 (14.5%) | 3,454 (3.0%) |
| $50,000 to $99,999 | 12,932 (16.2%) | 7,715 (6.7%) |
| $100,000 to $299,999 | 29,783 (37.3%) | 42,943 (37.2%) |
| $300,000 to $499,999 | 14,270 (17.9%) | 36,243 (31.4%) |
| $500,000 to $749,999 | 7,013 (8.8%) | 16,763 (14.5%) |
| $750,000 to $999,999 | 2,222 (2.8%) | 5,401 (4.7%) |
| $1,000,000 or more | 2,069 (2.6%) | 2,886 (2.5%) |
| Total | 79,911 (100.0%) | 115,405 (100.0%) |
Household Income by Mortgage Status in Area Code 940
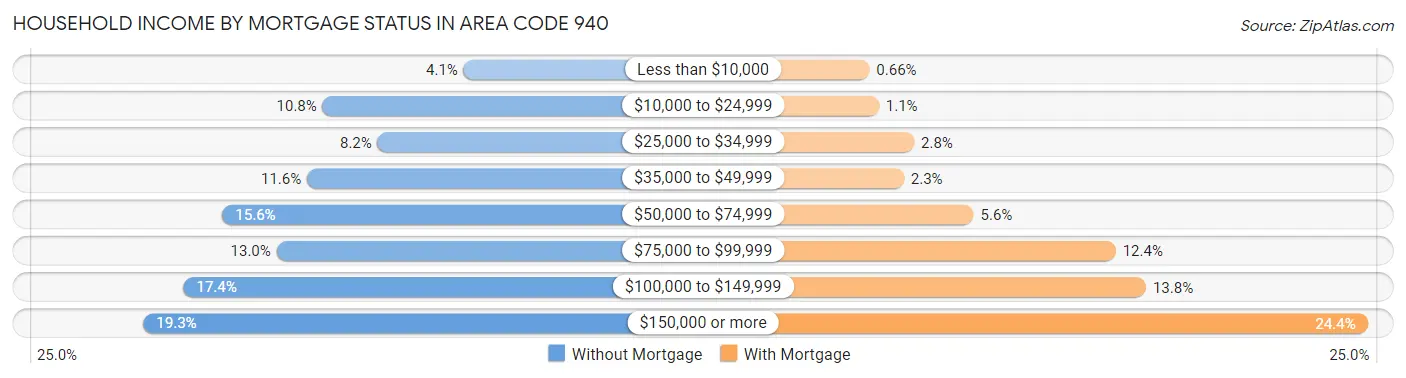
| Household Income | Without Mortgage | With Mortgage |
| Less than $10,000 | 3,270 (4.1%) | 764 (0.7%) |
| $10,000 to $24,999 | 8,642 (10.8%) | 1,278 (1.1%) |
| $25,000 to $34,999 | 6,543 (8.2%) | 3,217 (2.8%) |
| $35,000 to $49,999 | 9,230 (11.6%) | 2,652 (2.3%) |
| $50,000 to $74,999 | 12,451 (15.6%) | 6,485 (5.6%) |
| $75,000 to $99,999 | 10,391 (13.0%) | 14,294 (12.4%) |
| $100,000 to $149,999 | 13,928 (17.4%) | 15,956 (13.8%) |
| $150,000 or more | 15,456 (19.3%) | 28,141 (24.4%) |
| Total | 79,911 (100.0%) | 115,405 (100.0%) |
Property Value to Household Income Ratio in Area Code 940
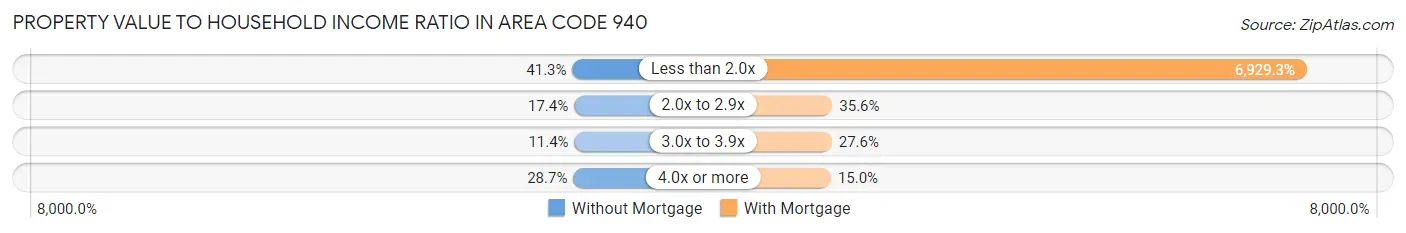
| Value-to-Income Ratio | Without Mortgage | With Mortgage |
| Less than 2.0x | 33,024 (41.3%) | 7,996,696 (6,929.3%) |
| 2.0x to 2.9x | 13,900 (17.4%) | 41,085 (35.6%) |
| 3.0x to 3.9x | 9,117 (11.4%) | 31,866 (27.6%) |
| 4.0x or more | 22,945 (28.7%) | 17,278 (15.0%) |
| Total | 79,911 (100.0%) | 115,405 (100.0%) |
Real Estate Taxes by Mortgage Status in Area Code 940
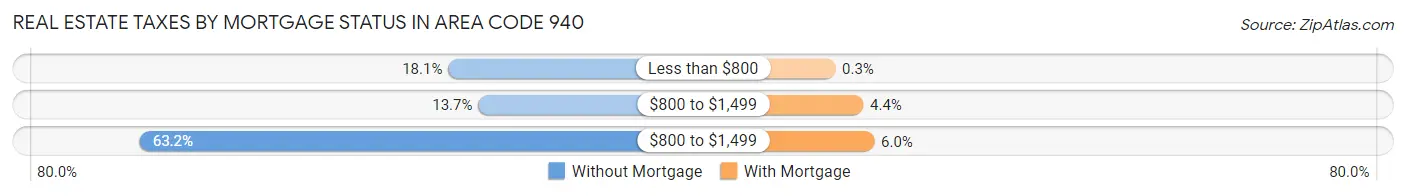
| Property Taxes | Without Mortgage | With Mortgage |
| Less than $800 | 14,462 (18.1%) | 347 (0.3%) |
| $800 to $1,499 | 10,956 (13.7%) | 5,066 (4.4%) |
| $800 to $1,499 | 50,474 (63.2%) | 6,919 (6.0%) |
| Total | 79,911 (100.0%) | 115,405 (100.0%) |
Health & Disability in Area Code 940
Health Insurance Coverage by Age in Area Code 940
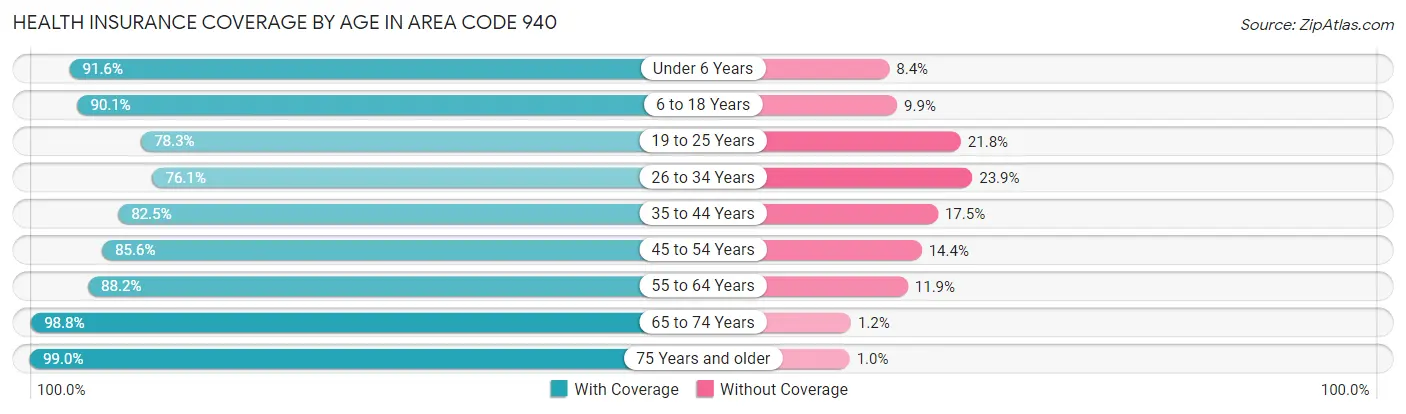
| Age Bracket | With Coverage | Without Coverage |
| Under 6 Years | 50,475 (91.6%) | 4,626 (8.4%) |
| 6 to 18 Years | 128,285 (90.1%) | 14,027 (9.9%) |
| 19 to 25 Years | 62,786 (78.2%) | 17,447 (21.7%) |
| 26 to 34 Years | 69,191 (76.1%) | 21,699 (23.9%) |
| 35 to 44 Years | 88,135 (82.5%) | 18,654 (17.5%) |
| 45 to 54 Years | 86,687 (85.6%) | 14,629 (14.4%) |
| 55 to 64 Years | 80,464 (88.1%) | 10,817 (11.8%) |
| 65 to 74 Years | 64,727 (98.8%) | 815 (1.2%) |
| 75 Years and older | 40,924 (99.0%) | 418 (1.0%) |
| Total | 671,674 (86.7%) | 103,132 (13.3%) |
Health Insurance Coverage by Citizenship Status in Area Code 940
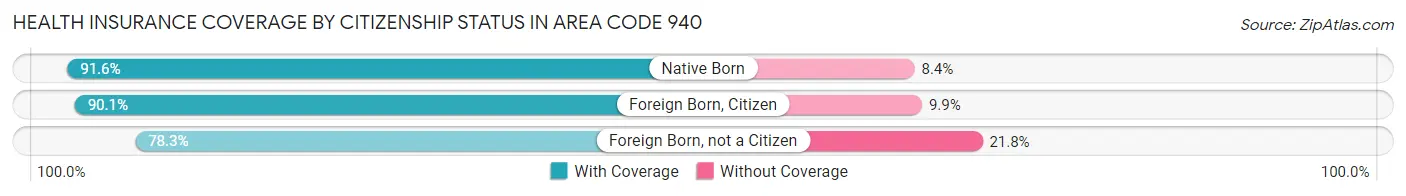
| Citizenship Status | With Coverage | Without Coverage |
| Native Born | 50,475 (91.6%) | 4,626 (8.4%) |
| Foreign Born, Citizen | 128,285 (90.1%) | 14,027 (9.9%) |
| Foreign Born, not a Citizen | 62,786 (78.2%) | 17,447 (21.7%) |
Health Insurance Coverage by Household Income in Area Code 940
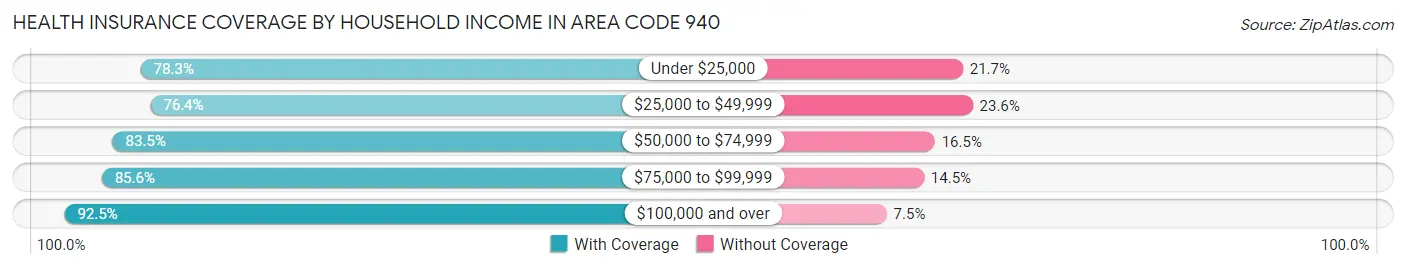
| Household Income | With Coverage | Without Coverage |
| Under $25,000 | 55,324 (78.3%) | 15,363 (21.7%) |
| $25,000 to $49,999 | 79,834 (76.4%) | 24,614 (23.6%) |
| $50,000 to $74,999 | 91,665 (83.5%) | 18,089 (16.5%) |
| $75,000 to $99,999 | 90,121 (85.6%) | 15,220 (14.4%) |
| $100,000 and over | 346,378 (92.5%) | 27,955 (7.5%) |
Public vs Private Health Insurance Coverage by Age in Area Code 940
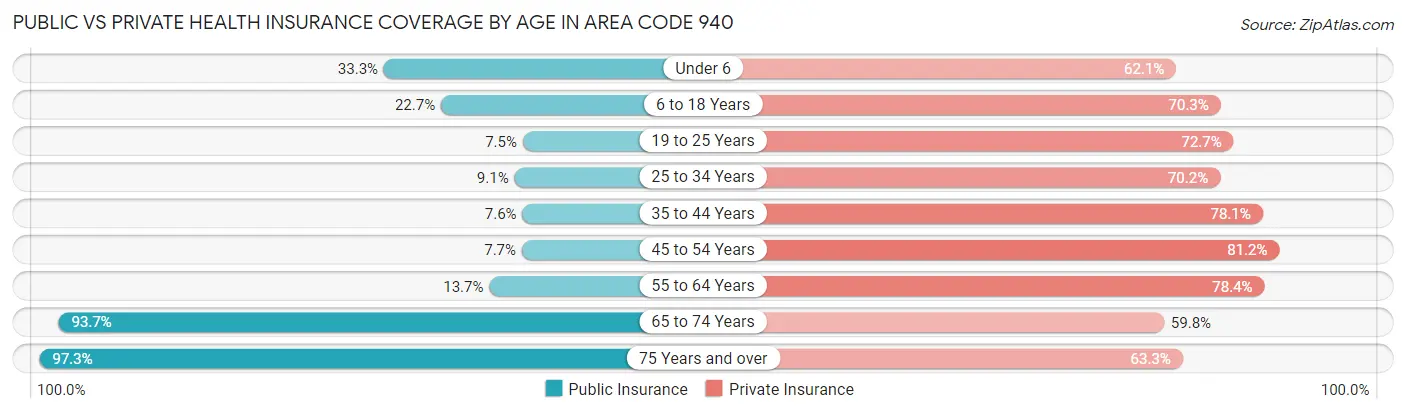
| Age Bracket | Public Insurance | Private Insurance |
| Under 6 | 18,356 (33.3%) | 34,195 (62.1%) |
| 6 to 18 Years | 32,321 (22.7%) | 100,060 (70.3%) |
| 19 to 25 Years | 6,040 (7.5%) | 58,339 (72.7%) |
| 25 to 34 Years | 8,243 (9.1%) | 63,792 (70.2%) |
| 35 to 44 Years | 8,120 (7.6%) | 83,406 (78.1%) |
| 45 to 54 Years | 7,800 (7.7%) | 82,271 (81.2%) |
| 55 to 64 Years | 12,546 (13.7%) | 71,600 (78.4%) |
| 65 to 74 Years | 61,417 (93.7%) | 39,188 (59.8%) |
| 75 Years and over | 40,215 (97.3%) | 26,152 (63.3%) |
| Total | 195,058 (25.2%) | 559,003 (72.2%) |
Disability Status by Sex by Age in Area Code 940
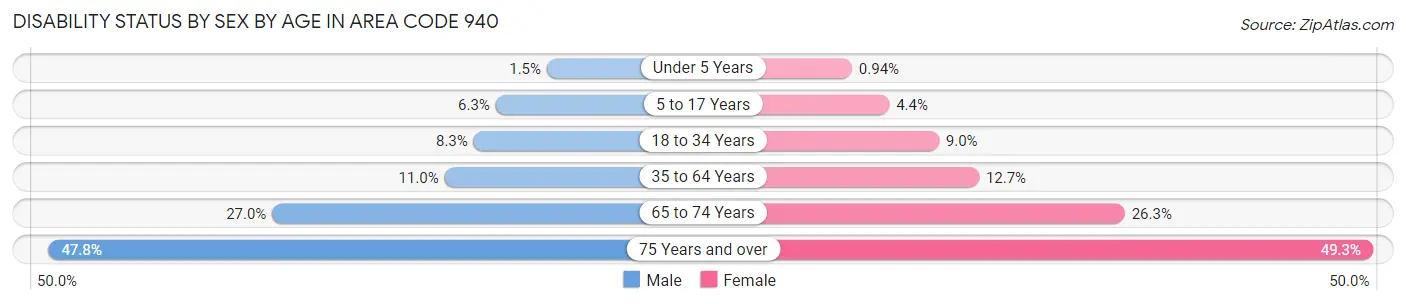
| Age Bracket | Male | Female |
| Under 5 Years | 359 (1.5%) | 200 (0.9%) |
| 5 to 17 Years | 4,502 (6.3%) | 3,004 (4.4%) |
| 18 to 34 Years | 7,551 (8.3%) | 8,375 (9.0%) |
| 35 to 64 Years | 16,422 (11.0%) | 19,141 (12.7%) |
| 65 to 74 Years | 8,337 (27.0%) | 9,107 (26.3%) |
| 75 Years and over | 8,443 (47.8%) | 11,667 (49.3%) |
Disability Class by Sex by Age in Area Code 940
Disability Class: Hearing Difficulty
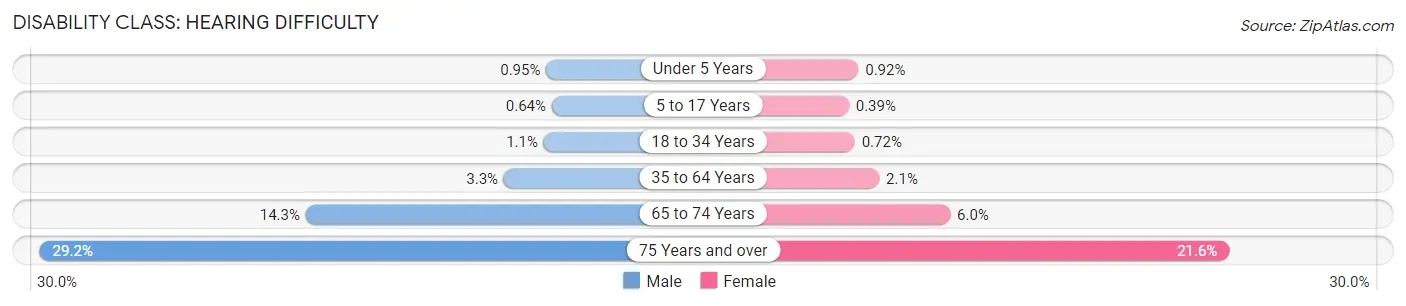
| Age Bracket | Male | Female |
| Under 5 Years | 223 (0.9%) | 195 (0.9%) |
| 5 to 17 Years | 459 (0.6%) | 268 (0.4%) |
| 18 to 34 Years | 988 (1.1%) | 667 (0.7%) |
| 35 to 64 Years | 4,939 (3.3%) | 3,122 (2.1%) |
| 65 to 74 Years | 4,426 (14.3%) | 2,093 (6.0%) |
| 75 Years and over | 5,152 (29.2%) | 5,107 (21.6%) |
Disability Class: Vision Difficulty
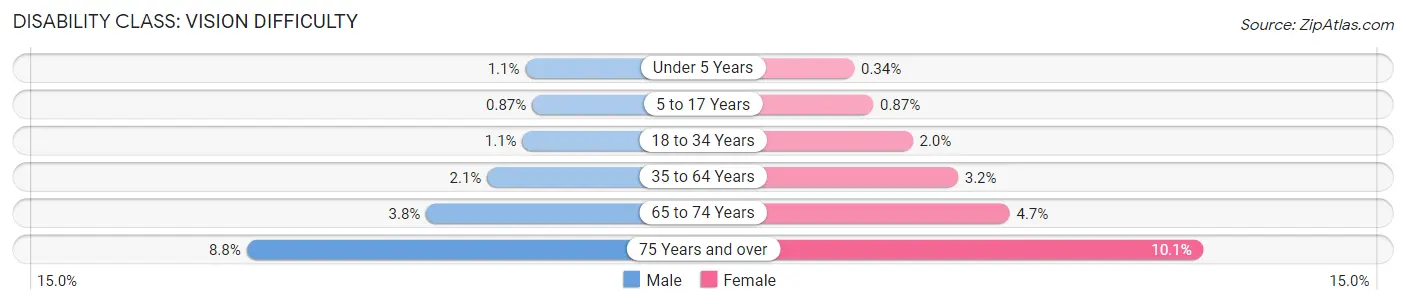
| Age Bracket | Male | Female |
| Under 5 Years | 250 (1.1%) | 73 (0.3%) |
| 5 to 17 Years | 625 (0.9%) | 594 (0.9%) |
| 18 to 34 Years | 1,033 (1.1%) | 1,832 (2.0%) |
| 35 to 64 Years | 3,158 (2.1%) | 4,855 (3.2%) |
| 65 to 74 Years | 1,178 (3.8%) | 1,618 (4.7%) |
| 75 Years and over | 1,558 (8.8%) | 2,385 (10.1%) |
Disability Class: Cognitive Difficulty
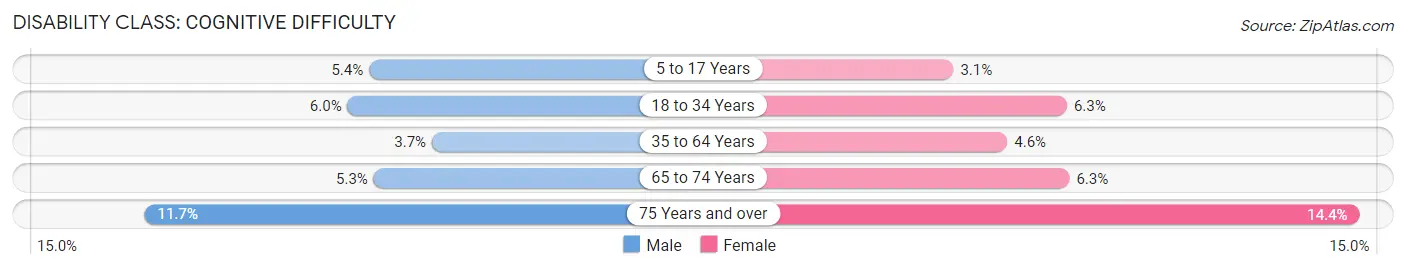
| Age Bracket | Male | Female |
| 5 to 17 Years | 3,878 (5.4%) | 2,127 (3.1%) |
| 18 to 34 Years | 5,447 (6.0%) | 5,825 (6.3%) |
| 35 to 64 Years | 5,459 (3.7%) | 6,931 (4.6%) |
| 65 to 74 Years | 1,628 (5.3%) | 2,198 (6.3%) |
| 75 Years and over | 2,060 (11.7%) | 3,412 (14.4%) |
Disability Class: Ambulatory Difficulty
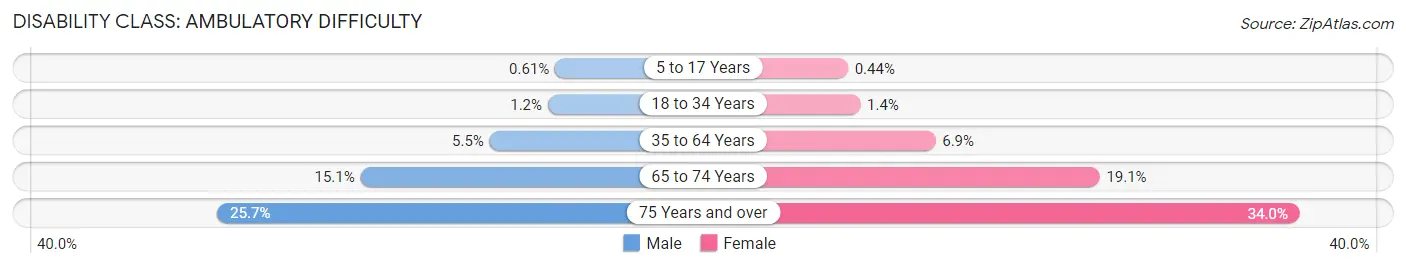
| Age Bracket | Male | Female |
| 5 to 17 Years | 438 (0.6%) | 302 (0.4%) |
| 18 to 34 Years | 1,044 (1.1%) | 1,260 (1.4%) |
| 35 to 64 Years | 8,150 (5.5%) | 10,436 (6.9%) |
| 65 to 74 Years | 4,646 (15.1%) | 6,636 (19.1%) |
| 75 Years and over | 4,541 (25.7%) | 8,049 (34.0%) |
Disability Class: Self-Care Difficulty
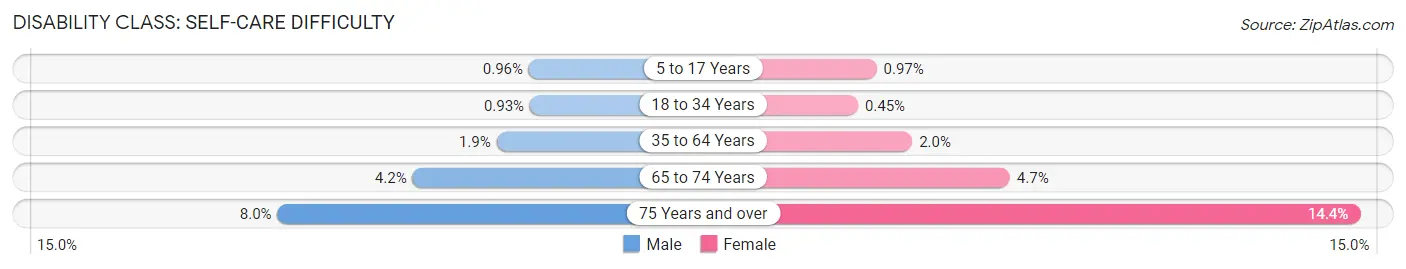
| Age Bracket | Male | Female |
| 5 to 17 Years | 686 (1.0%) | 663 (1.0%) |
| 18 to 34 Years | 840 (0.9%) | 415 (0.4%) |
| 35 to 64 Years | 2,777 (1.9%) | 2,948 (2.0%) |
| 65 to 74 Years | 1,297 (4.2%) | 1,624 (4.7%) |
| 75 Years and over | 1,406 (8.0%) | 3,417 (14.4%) |
Technology Access in Area Code 940
Computing Device Access in Area Code 940
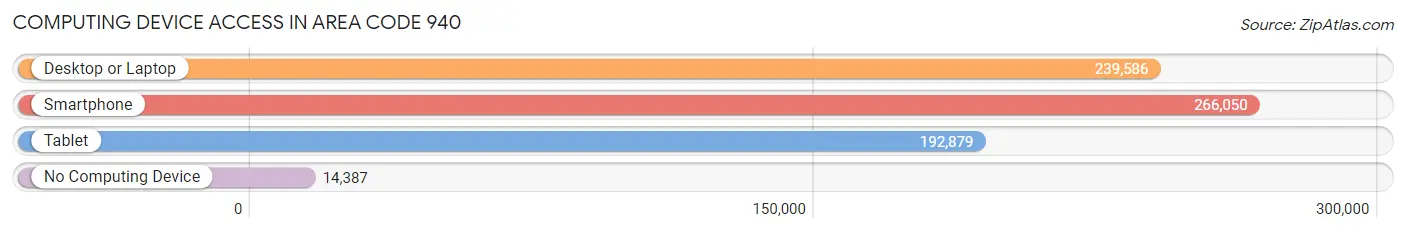
| Device Type | # Households | % Households |
| Desktop or Laptop | 239,586 | 82.0% |
| Smartphone | 266,050 | 91.1% |
| Tablet | 192,879 | 66.0% |
| No Computing Device | 14,387 | 4.9% |
| Total | 292,132 | 100.0% |
Internet Access in Area Code 940
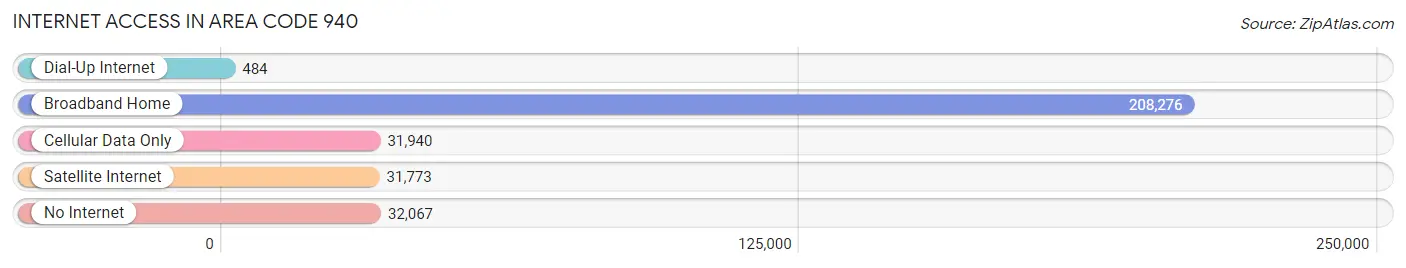
| Internet Type | # Households | % Households |
| Dial-Up Internet | 484 | 0.2% |
| Broadband Home | 208,276 | 71.3% |
| Cellular Data Only | 31,940 | 10.9% |
| Satellite Internet | 31,773 | 10.9% |
| No Internet | 32,067 | 11.0% |
| Total | 292,132 | 100.0% |
Area Code 940 Summary
Geography
Area code 940 is located in the state of Texas. It covers the northern and western parts of the state, including the cities of Wichita Falls, Denton, and Gainesville. It also covers parts of Collin, Cooke, Denton, and Wise counties.
Social
Area code 940 is home to a diverse population of people from all walks of life. The area is known for its friendly and welcoming atmosphere, and its residents are proud of their heritage and culture. The area is also home to a variety of recreational activities, including fishing, camping, and hiking.
Economics
Area code 940 is home to a thriving economy. The area is home to a variety of businesses, including manufacturing, retail, and healthcare. The area also has a strong agricultural sector, with a variety of crops grown in the area.
Demographics
Area code 940 is home to a population of over 1.2 million people. The population is diverse, with a mix of races and ethnicities. The median household income in the area is around $50,000, and the unemployment rate is around 4%. The area is also home to a variety of educational institutions, including universities, community colleges, and technical schools.
Common Questions
What is Per Capita Income in Area Code 940?
Per Capita income in Area Code 940 is $35,558.
What is the Median Family Income in Area Code 940?
Median Family Income in Area Code 940 is $86,388.
What is the Median Household income in Area Code 940?
Median Household Income in Area Code 940 is $71,296.
What is Income or Wage Gap in Area Code 940?
Income or Wage Gap in Area Code 940 is 35.1%.
Women in Area Code 940 earn 64.9 cents for every dollar earned by a man.
What is Family Income Deficit in Area Code 940?
Family Income Deficit in Area Code 940 is $10,989.
Families that are below poverty line in Area Code 940 earn $10,989 less on average than the poverty threshold level.
What is Inequality or Gini Index in Area Code 940?
Inequality or Gini Index in Area Code 940 is 38.89.
What is the Total Population of Area Code 940?
Total Population of Area Code 940 is 795,419.
What is the Total Male Population of Area Code 940?
Total Male Population of Area Code 940 is 399,646.
What is the Total Female Population of Area Code 940?
Total Female Population of Area Code 940 is 395,773.
What is the Ratio of Males per 100 Females in Area Code 940?
There are 100.98 Males per 100 Females in Area Code 940.
What is the Ratio of Females per 100 Males in Area Code 940?
There are 99.03 Females per 100 Males in Area Code 940.
What is the Median Population Age in Area Code 940?
Median Population Age in Area Code 940 is 41.9 Years.
What is the Average Family Size in Area Code 940
Average Family Size in Area Code 940 is 3.1 People.
What is the Average Household Size in Area Code 940
Average Household Size in Area Code 940 is 2.6 People.
How Large is the Labor Force in Area Code 940?
There are 391,362 People in the Labor Forcein in Area Code 940.
What is the Percentage of People in the Labor Force in Area Code 940?
61.9% of People are in the Labor Force in Area Code 940.
What is the Unemployment Rate in Area Code 940?
Unemployment Rate in Area Code 940 is 4.5%.