Area Code 845 Map & Demographics
Area Code 845 Map
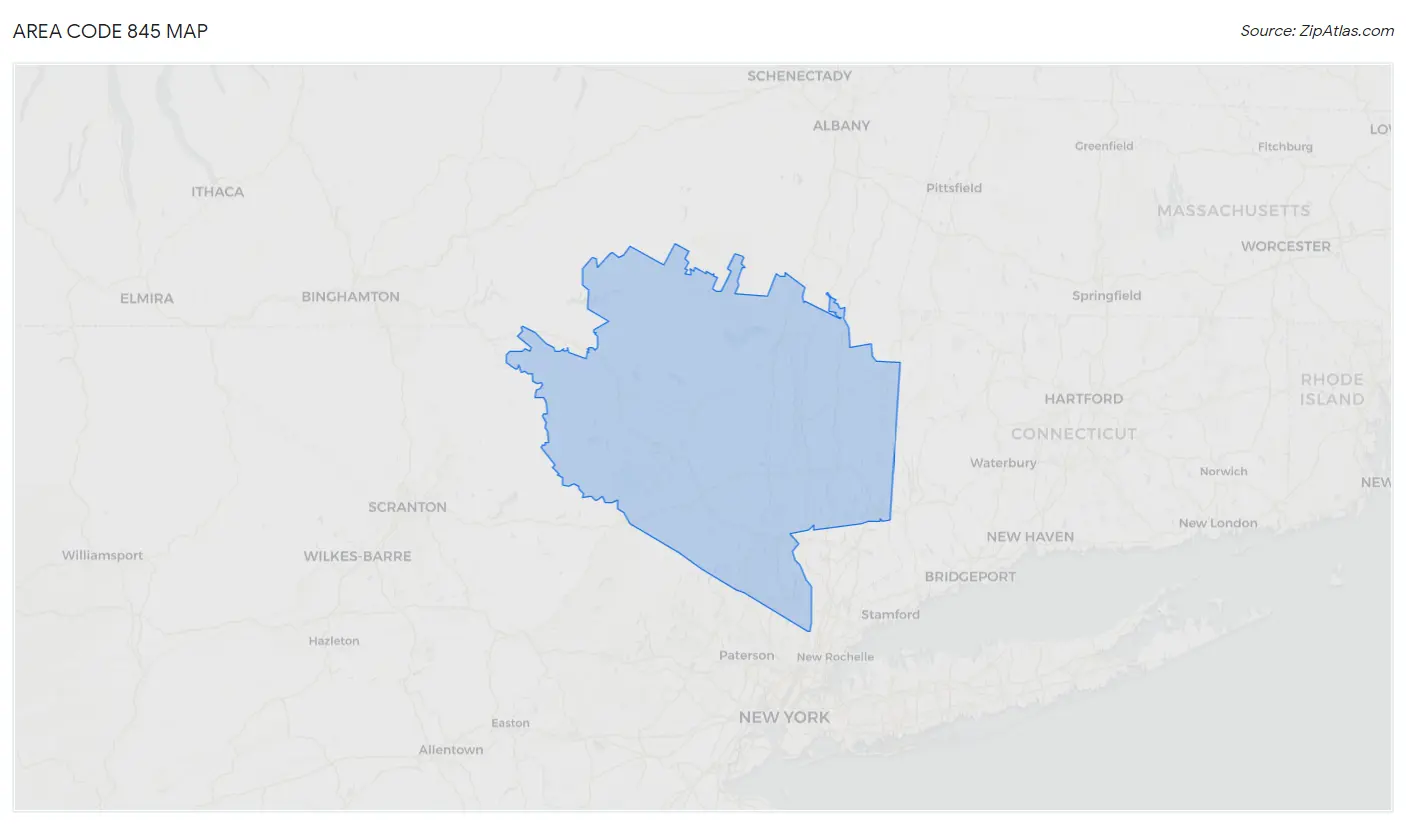
Area Code 845 Overview
$48,163
PER CAPITA INCOME
$121,768
AVG FAMILY INCOME
$97,588
AVG HOUSEHOLD INCOME
29.4%
WAGE / INCOME GAP [ % ]
70.6¢/ $1
WAGE / INCOME GAP [ $ ]
$10,859
FAMILY INCOME DEFICIT
86.90
INEQUALITY / GINI INDEX
1,486,280
TOTAL POPULATION
740,914
MALE POPULATION
745,366
FEMALE POPULATION
99.40
MALES / 100 FEMALES
100.60
FEMALES / 100 MALES
45.4
MEDIAN AGE
3.1
AVG FAMILY SIZE
2.6
AVG HOUSEHOLD SIZE
730,047
LABOR FORCE [ PEOPLE ]
61.5%
PERCENT IN LABOR FORCE
6.2%
UNEMPLOYMENT RATE
Income in Area Code 845
Income Overview in Area Code 845
Per Capita Income in Area Code 845 is $48,163, while median incomes of families and households are $121,768 and $97,588 respectively.
| Characteristic | Number | Measure |
| Per Capita Income | 1,486,280 | $48,163 |
| Median Family Income | 357,299 | $121,768 |
| Mean Family Income | 357,299 | $28,182,399 |
| Median Household Income | 525,688 | $97,588 |
| Mean Household Income | 525,688 | $24,821,781 |
| Income Deficit | 357,299 | $10,859 |
| Wage / Income Gap (%) | 1,486,280 | 29.38% |
| Wage / Income Gap ($) | 1,486,280 | 70.62¢ per $1 |
| Gini / Inequality Index | 1,486,280 | 86.90 |
Earnings by Sex in Area Code 845
Average Earnings in Area Code 845 are $50,995, $61,004 for men and $42,903 for women, a difference of 29.7%.
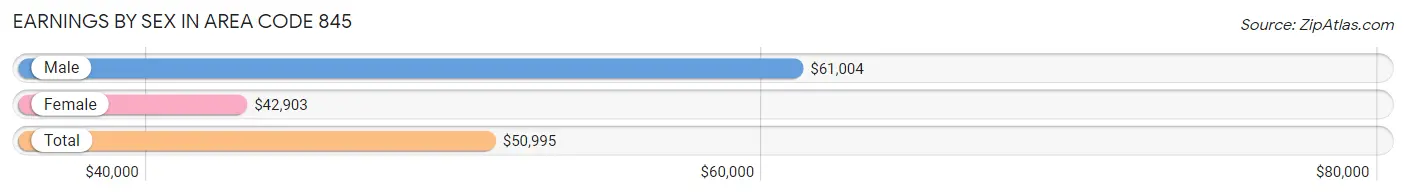
| Sex | Number | Average Earnings |
| Male | 406,766 (52.3%) | $61,004 |
| Female | 371,373 (47.7%) | $42,903 |
| Total | 778,139 (100.0%) | $50,995 |
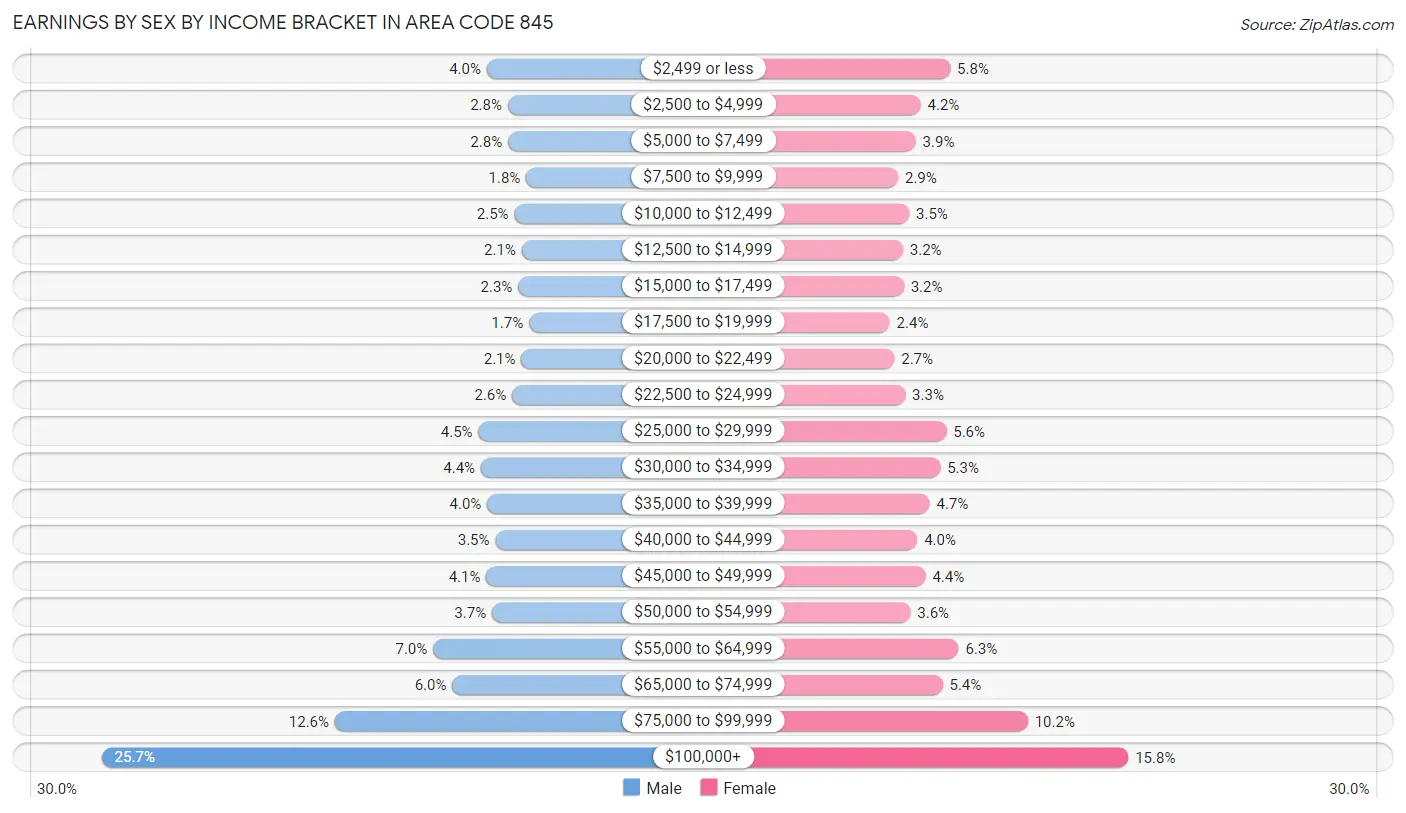
Earnings by Sex by Income Bracket in Area Code 845
The most common earnings brackets in Area Code 845 are $100,000+ for men (104,407 | 25.7%) and $100,000+ for women (58,734 | 15.8%).
| Income | Male | Female |
| $2,499 or less | 16,366 (4.0%) | 21,578 (5.8%) |
| $2,500 to $4,999 | 11,566 (2.8%) | 15,415 (4.2%) |
| $5,000 to $7,499 | 11,494 (2.8%) | 14,382 (3.9%) |
| $7,500 to $9,999 | 7,348 (1.8%) | 10,701 (2.9%) |
| $10,000 to $12,499 | 10,043 (2.5%) | 12,993 (3.5%) |
| $12,500 to $14,999 | 8,371 (2.1%) | 11,709 (3.2%) |
| $15,000 to $17,499 | 9,181 (2.3%) | 11,889 (3.2%) |
| $17,500 to $19,999 | 6,728 (1.7%) | 8,941 (2.4%) |
| $20,000 to $22,499 | 8,474 (2.1%) | 9,898 (2.7%) |
| $22,500 to $24,999 | 10,557 (2.6%) | 12,171 (3.3%) |
| $25,000 to $29,999 | 18,257 (4.5%) | 20,766 (5.6%) |
| $30,000 to $34,999 | 17,687 (4.3%) | 19,511 (5.2%) |
| $35,000 to $39,999 | 16,255 (4.0%) | 17,254 (4.6%) |
| $40,000 to $44,999 | 14,395 (3.5%) | 14,690 (4.0%) |
| $45,000 to $49,999 | 16,474 (4.1%) | 16,399 (4.4%) |
| $50,000 to $54,999 | 15,191 (3.7%) | 13,274 (3.6%) |
| $55,000 to $64,999 | 28,642 (7.0%) | 23,310 (6.3%) |
| $65,000 to $74,999 | 24,226 (6.0%) | 19,974 (5.4%) |
| $75,000 to $99,999 | 51,104 (12.6%) | 37,784 (10.2%) |
| $100,000+ | 104,407 (25.7%) | 58,734 (15.8%) |
| Total | 406,766 (100.0%) | 371,373 (100.0%) |
Earnings by Sex by Educational Attainment in Area Code 845
Average earnings in Area Code 845 are $12,235,338 for men and $8,875,393 for women, a difference of 27.5%. Men with an educational attainment of graduate degree enjoy the highest average annual earnings of $14,947,537, while those with less than high school education earn the least with $3,152,198. Women with an educational attainment of graduate degree earn the most with the average annual earnings of $11,718,954, while those with less than high school education have the smallest earnings of $1,455,876.
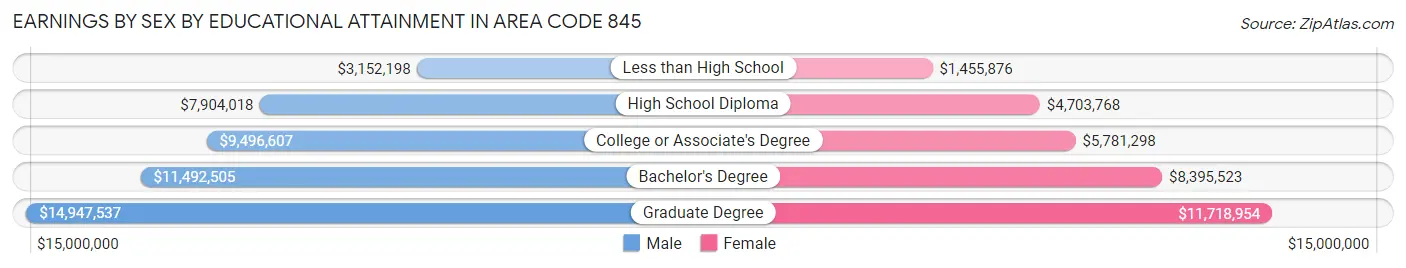
| Educational Attainment | Male Income | Female Income |
| Less than High School | $3,152,198 | $1,455,876 |
| High School Diploma | $7,904,018 | $4,703,768 |
| College or Associate's Degree | $9,496,607 | $5,781,298 |
| Bachelor's Degree | $11,492,505 | $8,395,523 |
| Graduate Degree | $14,947,537 | $11,718,954 |
| Total | $12,235,338 | $8,875,393 |
Family Income in Area Code 845
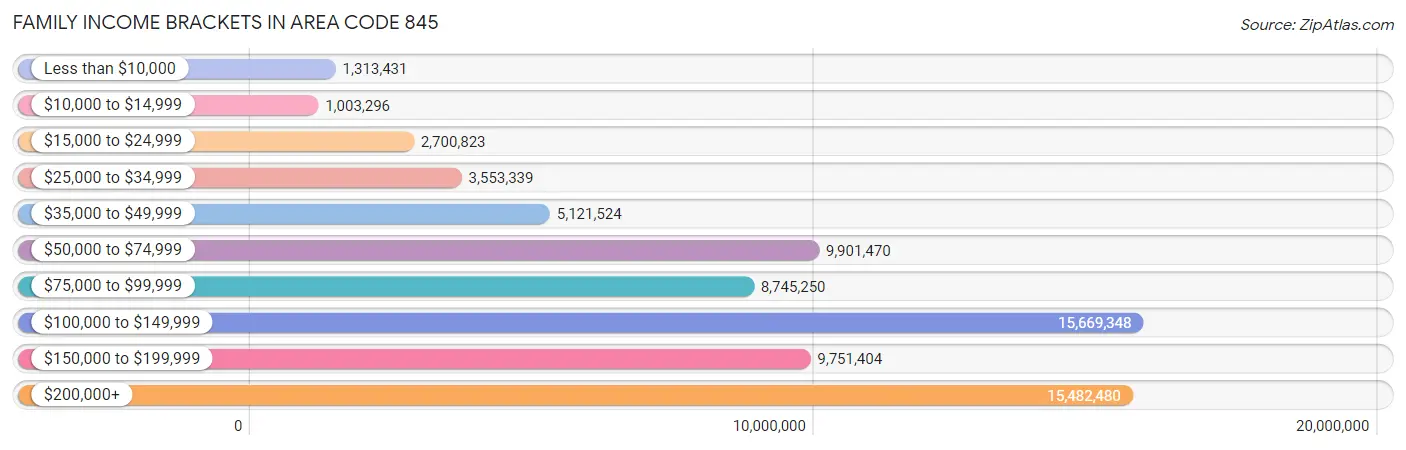
Family Income Brackets in Area Code 845
According to the Area Code 845 family income data, there are 15,669,348 families falling into the $100,000 to $149,999 income range, which is the most common income bracket and makes up 4,385.5% of all families. Conversely, the $10,000 to $14,999 income bracket is the least frequent group with only 1,003,296 families (280.8%) belonging to this category.
| Income Bracket | # Families | % Families |
| Less than $10,000 | 1,313,431 | 367.6% |
| $10,000 to $14,999 | 1,003,296 | 280.8% |
| $15,000 to $24,999 | 2,700,823 | 755.9% |
| $25,000 to $34,999 | 3,553,339 | 994.5% |
| $35,000 to $49,999 | 5,121,524 | 1,433.4% |
| $50,000 to $74,999 | 9,901,470 | 2,771.2% |
| $75,000 to $99,999 | 8,745,250 | 2,447.6% |
| $100,000 to $149,999 | 15,669,348 | 4,385.5% |
| $150,000 to $199,999 | 9,751,404 | 2,729.2% |
| $200,000+ | 15,482,480 | 4,333.2% |
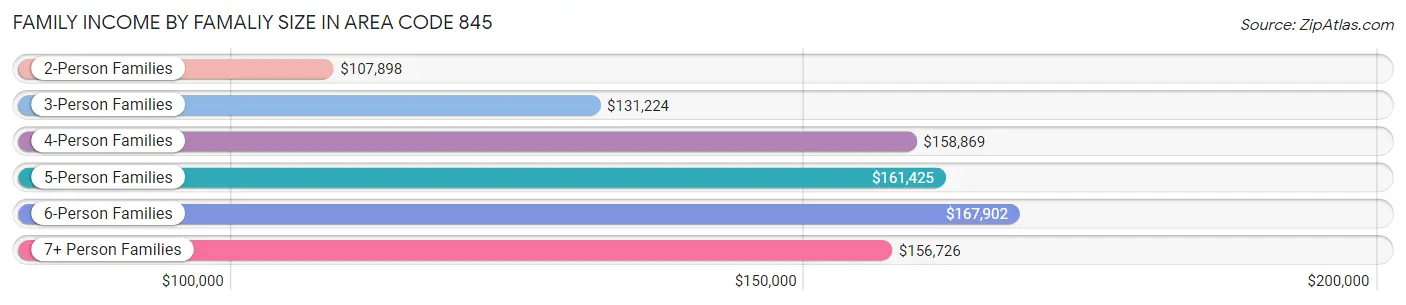
Family Income by Famaliy Size in Area Code 845
6-person families (12,672 | 3.5%) account for the highest median family income in Area Code 845 with $167,902 per family, while 2-person families (147,732 | 41.3%) have the highest median income of $53,949 per family member.
| Income Bracket | # Families | Median Income |
| 2-Person Families | 147,732 (41.3%) | $107,898 |
| 3-Person Families | 82,413 (23.1%) | $131,224 |
| 4-Person Families | 70,586 (19.8%) | $158,869 |
| 5-Person Families | 31,172 (8.7%) | $161,425 |
| 6-Person Families | 12,672 (3.5%) | $167,902 |
| 7+ Person Families | 12,724 (3.6%) | $156,726 |
| Total | 357,299 (100.0%) | $121,768 |
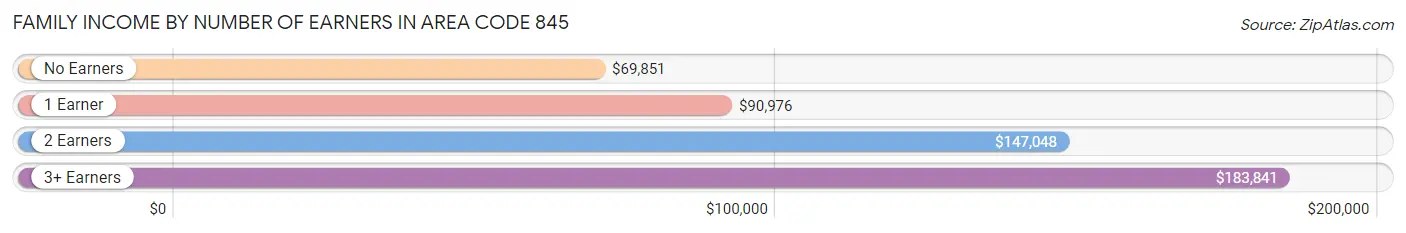
Family Income by Number of Earners in Area Code 845
The median family income in Area Code 845 is $121,768, with families comprising 3+ earners (53,553) having the highest median family income of $183,841, while families with no earners (43,360) have the lowest median family income of $69,851, accounting for 15.0% and 12.1% of families, respectively.
| Number of Earners | # Families | Median Income |
| No Earners | 43,360 (12.1%) | $69,851 |
| 1 Earner | 107,075 (30.0%) | $90,976 |
| 2 Earners | 153,311 (42.9%) | $147,048 |
| 3+ Earners | 53,553 (15.0%) | $183,841 |
| Total | 357,299 (100.0%) | $121,768 |
Household Income in Area Code 845
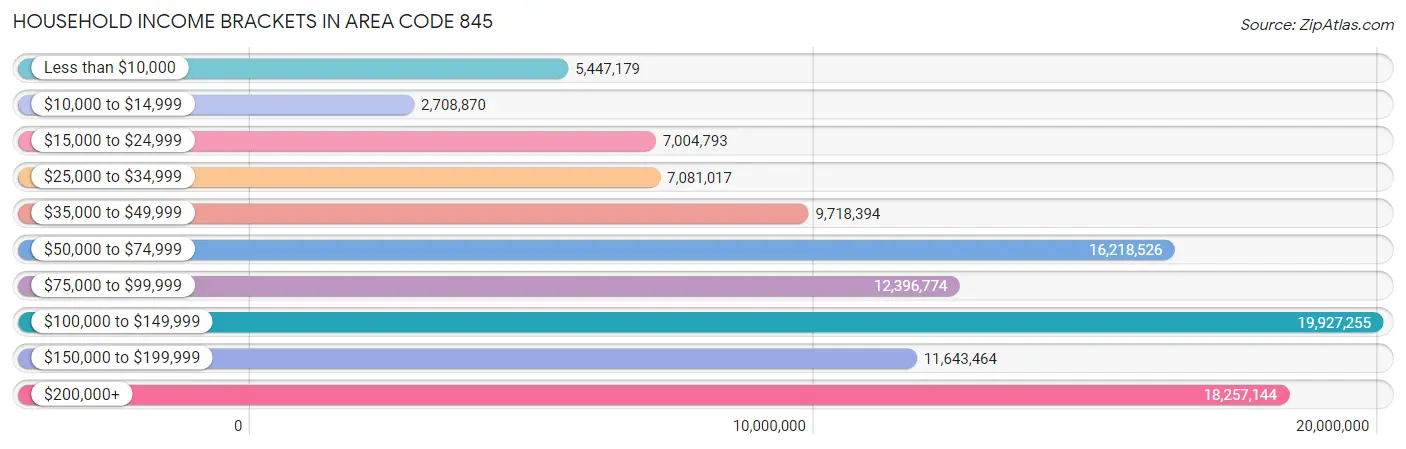
Household Income Brackets in Area Code 845
With 19,927,255 households falling in the category, the $100,000 to $149,999 income range is the most frequent in Area Code 845, accounting for 3,790.7% of all households. In contrast, only 2,708,870 households (515.3%) fall into the $10,000 to $14,999 income bracket, making it the least populous group.
| Income Bracket | # Households | % Households |
| Less than $10,000 | 5,447,179 | 1,036.2% |
| $10,000 to $14,999 | 2,708,870 | 515.3% |
| $15,000 to $24,999 | 7,004,793 | 1,332.5% |
| $25,000 to $34,999 | 7,081,017 | 1,347.0% |
| $35,000 to $49,999 | 9,718,394 | 1,848.7% |
| $50,000 to $74,999 | 16,218,526 | 3,085.2% |
| $75,000 to $99,999 | 12,396,774 | 2,358.2% |
| $100,000 to $149,999 | 19,927,255 | 3,790.7% |
| $150,000 to $199,999 | 11,643,464 | 2,214.9% |
| $200,000+ | 18,257,144 | 3,473.0% |
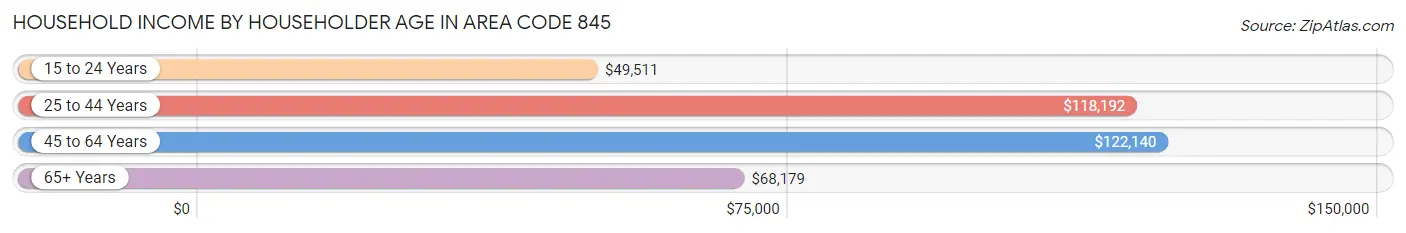
Household Income by Householder Age in Area Code 845
The median household income in Area Code 845 is $97,588, with the highest median household income of $122,140 found in the 45 to 64 years age bracket for the primary householder. A total of 216,268 households (41.1%) fall into this category. Meanwhile, the 15 to 24 years age bracket for the primary householder has the lowest median household income of $49,511, with 10,992 households (2.1%) in this group.
| Income Bracket | # Households | Median Income |
| 15 to 24 Years | 10,992 (2.1%) | $49,511 |
| 25 to 44 Years | 144,326 (27.5%) | $118,192 |
| 45 to 64 Years | 216,268 (41.1%) | $122,140 |
| 65+ Years | 154,102 (29.3%) | $68,179 |
| Total | 525,688 (100.0%) | $97,588 |
Poverty in Area Code 845
Income Below Poverty by Sex and Age in Area Code 845
With 11.5% poverty level for males and 12.7% for females among the residents of Area Code 845, under 5 year old males and under 5 year old females are the most vulnerable to poverty, with 9,117 males (20.6%) and 8,467 females (19.7%) in their respective age groups living below the poverty level.
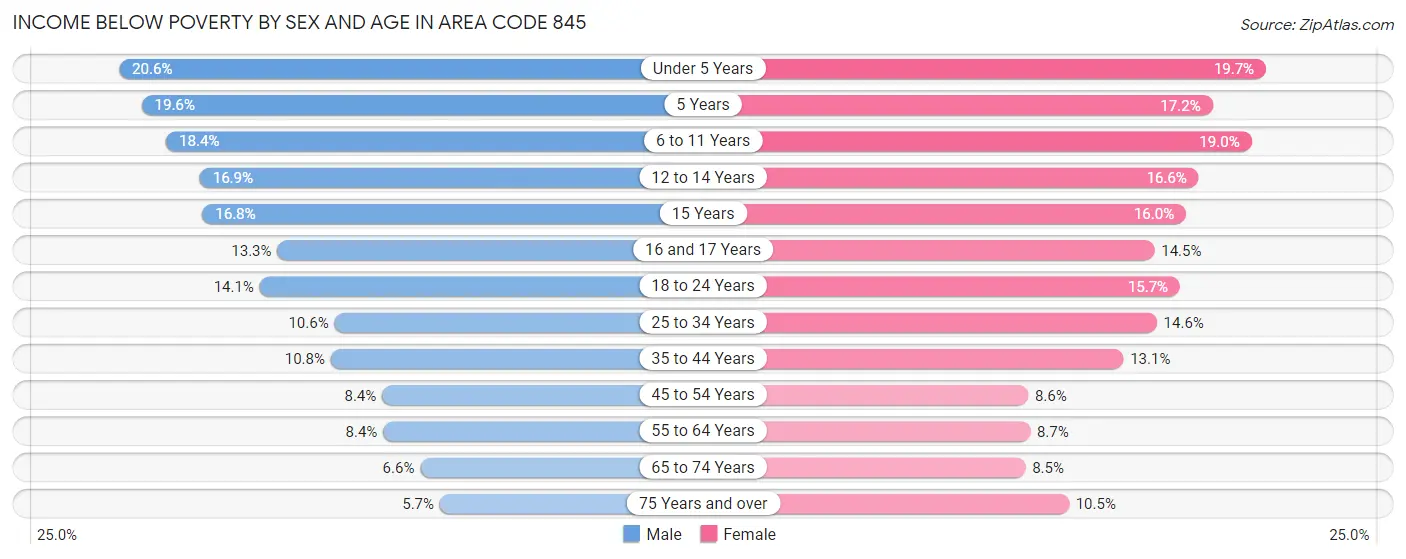
| Age Bracket | Male | Female |
| Under 5 Years | 9,117 (20.6%) | 8,467 (19.7%) |
| 5 Years | 1,672 (19.6%) | 1,581 (17.2%) |
| 6 to 11 Years | 10,342 (18.4%) | 10,204 (19.0%) |
| 12 to 14 Years | 5,293 (16.9%) | 4,525 (16.6%) |
| 15 Years | 1,787 (16.8%) | 1,670 (16.0%) |
| 16 and 17 Years | 2,713 (13.3%) | 2,829 (14.5%) |
| 18 to 24 Years | 9,303 (14.1%) | 9,600 (15.7%) |
| 25 to 34 Years | 9,457 (10.6%) | 12,333 (14.6%) |
| 35 to 44 Years | 9,491 (10.8%) | 11,390 (13.1%) |
| 45 to 54 Years | 7,953 (8.4%) | 8,228 (8.6%) |
| 55 to 64 Years | 8,362 (8.4%) | 8,990 (8.7%) |
| 65 to 74 Years | 4,502 (6.6%) | 6,404 (8.5%) |
| 75 Years and over | 2,397 (5.7%) | 6,331 (10.5%) |
| Total | 82,389 (11.5%) | 92,552 (12.7%) |
Income Above Poverty by Sex and Age in Area Code 845
According to the poverty statistics in Area Code 845, males aged 75 years and over and females aged 65 to 74 years are the age groups that are most secure financially, with 94.3% of males and 91.5% of females in these age groups living above the poverty line.
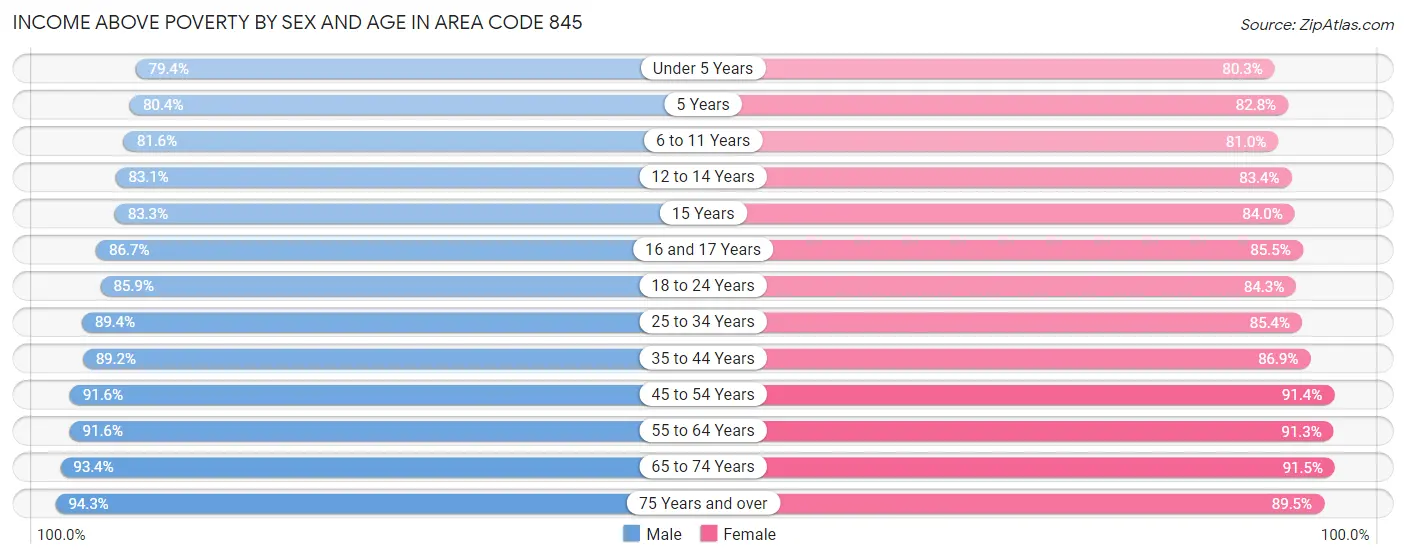
| Age Bracket | Male | Female |
| Under 5 Years | 35,126 (79.4%) | 34,553 (80.3%) |
| 5 Years | 6,872 (80.4%) | 7,611 (82.8%) |
| 6 to 11 Years | 45,788 (81.6%) | 43,485 (81.0%) |
| 12 to 14 Years | 26,083 (83.1%) | 22,803 (83.4%) |
| 15 Years | 8,883 (83.3%) | 8,788 (84.0%) |
| 16 and 17 Years | 17,739 (86.7%) | 16,678 (85.5%) |
| 18 to 24 Years | 56,710 (85.9%) | 51,577 (84.3%) |
| 25 to 34 Years | 79,632 (89.4%) | 72,061 (85.4%) |
| 35 to 44 Years | 78,506 (89.2%) | 75,801 (86.9%) |
| 45 to 54 Years | 86,638 (91.6%) | 87,000 (91.4%) |
| 55 to 64 Years | 91,667 (91.6%) | 93,994 (91.3%) |
| 65 to 74 Years | 63,271 (93.4%) | 68,807 (91.5%) |
| 75 Years and over | 39,434 (94.3%) | 53,772 (89.5%) |
| Total | 636,349 (88.5%) | 636,930 (87.3%) |
Income Below Poverty Among Married-Couple Families in Area Code 845
The poverty statistics for married-couple families in Area Code 845 show that 5.7% or 15,734 of the total 274,549 families live below the poverty line. Families with 5 or more children have the highest poverty rate of 43.9%, comprising of 3,548 families. On the other hand, families with no children have the lowest poverty rate of 2.8%, which includes 4,243 families.
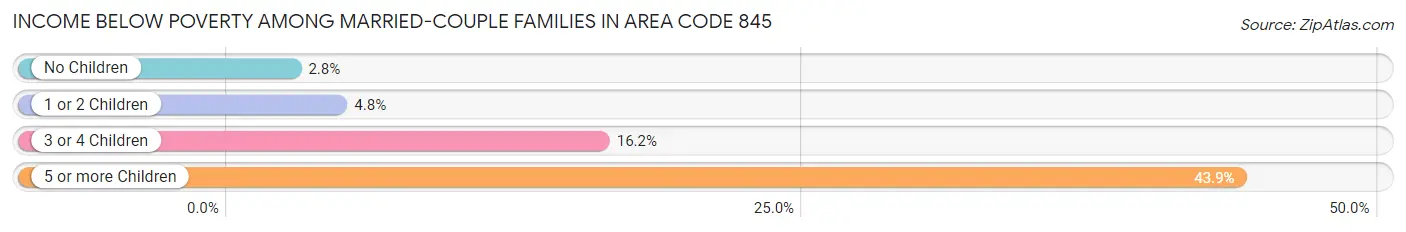
| Children | Above Poverty | Below Poverty |
| No Children | 149,212 (97.2%) | 4,243 (2.8%) |
| 1 or 2 Children | 86,271 (95.2%) | 4,314 (4.8%) |
| 3 or 4 Children | 18,796 (83.8%) | 3,629 (16.2%) |
| 5 or more Children | 4,536 (56.1%) | 3,548 (43.9%) |
| Total | 258,815 (94.3%) | 15,734 (5.7%) |
Income Below Poverty Among Single-Parent Households in Area Code 845
According to the poverty data in Area Code 845, 9.3% or 2,239 single-father households and 16.4% or 9,653 single-mother households are living below the poverty line. Among single-father households, those with 3 or 4 children have the highest poverty rate, with 532 households (35.8%) experiencing poverty. Likewise, among single-mother households, those with 5 or more children have the highest poverty rate, with 139 households (72.4%) falling below the poverty line.
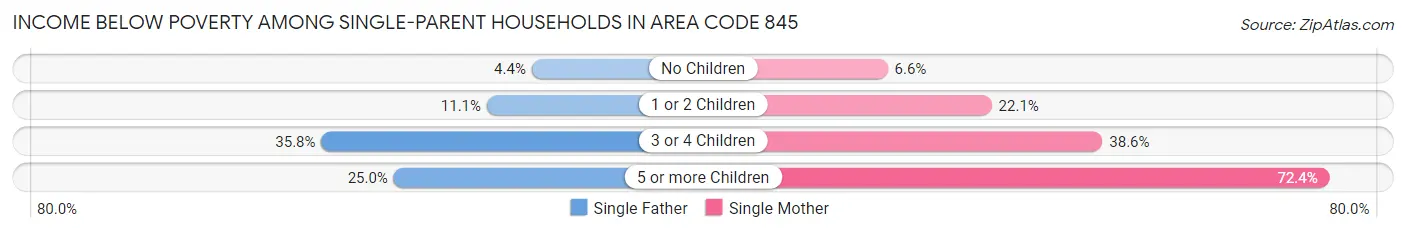
| Children | Single Father | Single Mother |
| No Children | 534 (4.4%) | 1,734 (6.6%) |
| 1 or 2 Children | 1,157 (11.1%) | 6,125 (22.1%) |
| 3 or 4 Children | 532 (35.8%) | 1,655 (38.6%) |
| 5 or more Children | 16 (25.0%) | 139 (72.4%) |
| Total | 2,239 (9.3%) | 9,653 (16.4%) |
Income Below Poverty Among Married-Couple vs Single-Parent Households in Area Code 845
The poverty data for Area Code 845 shows that 15,734 of the married-couple family households (5.7%) and 11,892 of the single-parent households (14.4%) are living below the poverty level. Within the married-couple family households, those with 5 or more children have the highest poverty rate, with 3,548 households (43.9%) falling below the poverty line. Among the single-parent households, those with 5 or more children have the highest poverty rate, with 155 household (60.6%) living below poverty.
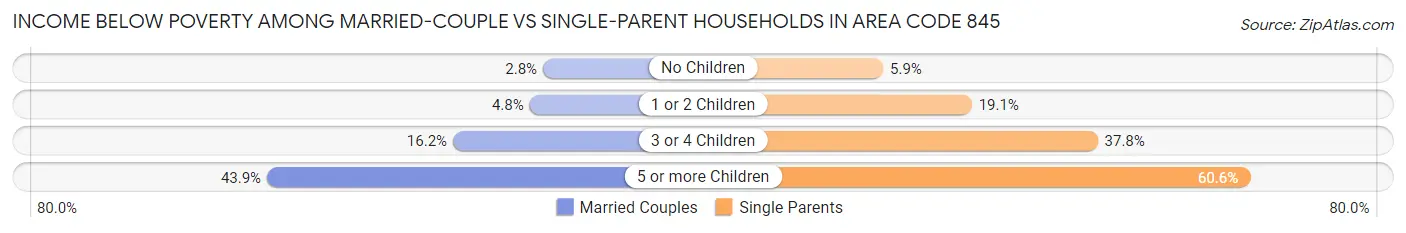
| Children | Married-Couple Families | Single-Parent Households |
| No Children | 4,243 (2.8%) | 2,268 (5.9%) |
| 1 or 2 Children | 4,314 (4.8%) | 7,282 (19.1%) |
| 3 or 4 Children | 3,629 (16.2%) | 2,187 (37.8%) |
| 5 or more Children | 3,548 (43.9%) | 155 (60.6%) |
| Total | 15,734 (5.7%) | 11,892 (14.4%) |
Race in Area Code 845
The most populous races in Area Code 845 are White / Caucasian (1,044,081 | 70.3%), Hispanic or Latino (271,290 | 18.2%), and Black / African American (148,528 | 10.0%).
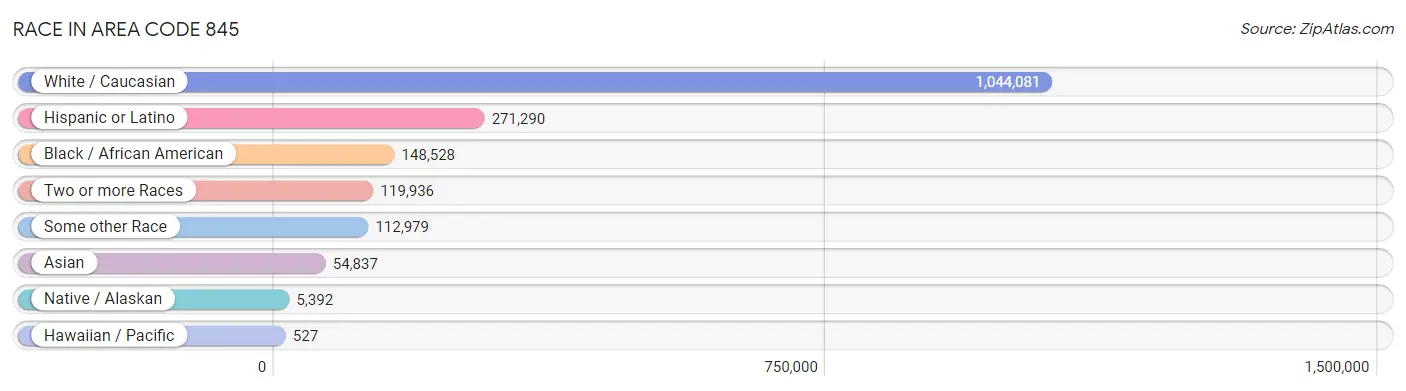
| Race | # Population | % Population |
| Asian | 54,837 | 3.7% |
| Black / African American | 148,528 | 10.0% |
| Hawaiian / Pacific | 527 | 0.0% |
| Hispanic or Latino | 271,290 | 18.2% |
| Native / Alaskan | 5,392 | 0.4% |
| White / Caucasian | 1,044,081 | 70.3% |
| Two or more Races | 119,936 | 8.1% |
| Some other Race | 112,979 | 7.6% |
| Total | 1,486,280 | 100.0% |
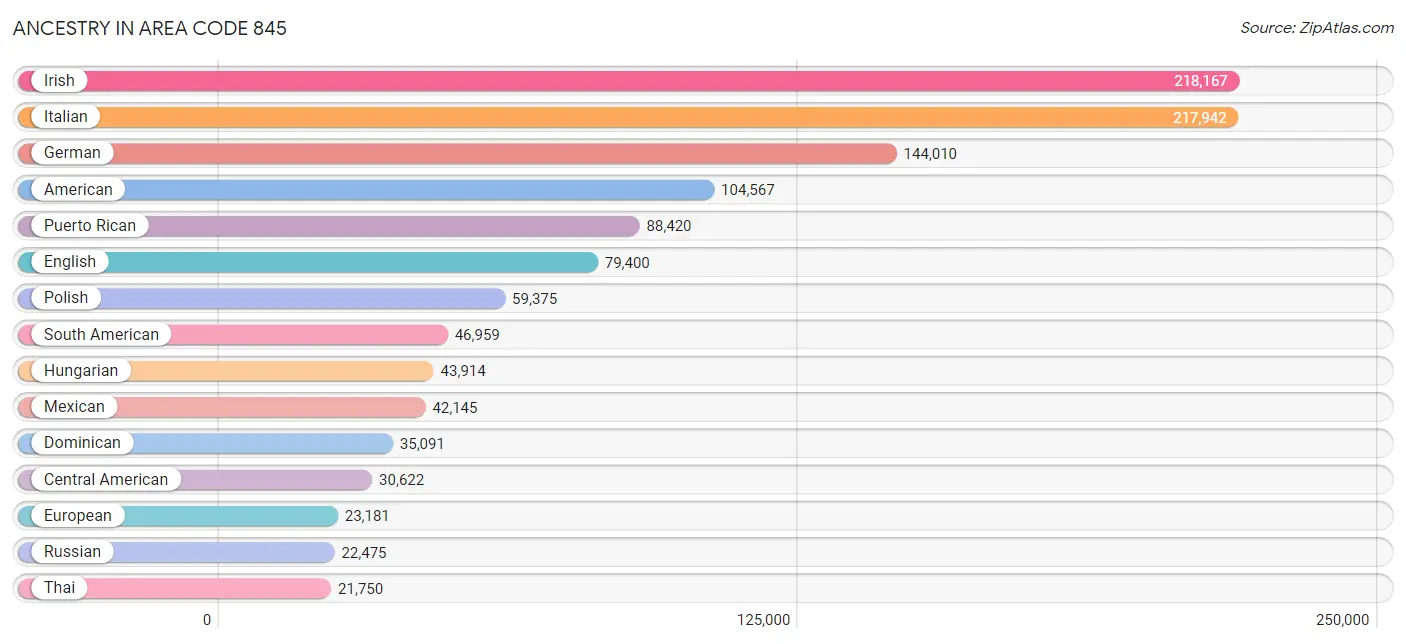
Ancestry in Area Code 845
The most populous ancestries reported in Area Code 845 are Irish (218,167 | 14.7%), Italian (217,942 | 14.7%), German (144,010 | 9.7%), American (104,567 | 7.0%), and Puerto Rican (88,420 | 5.9%), together accounting for 52.0% of all Area Code 845 residents.
| Ancestry | # Population | % Population |
| Afghan | 256 | 0.0% |
| African | 4,685 | 0.3% |
| Albanian | 4,184 | 0.3% |
| Alsatian | 64 | 0.0% |
| American | 104,567 | 7.0% |
| Apache | 256 | 0.0% |
| Arab | 8,212 | 0.5% |
| Argentinean | 3,173 | 0.2% |
| Armenian | 2,170 | 0.2% |
| Assyrian / Chaldean / Syriac | 137 | 0.0% |
| Australian | 491 | 0.0% |
| Austrian | 6,193 | 0.4% |
| Bahamian | 107 | 0.0% |
| Barbadian | 1,075 | 0.1% |
| Basque | 328 | 0.0% |
| Belgian | 1,358 | 0.1% |
| Belizean | 190 | 0.0% |
| Bhutanese | 3,380 | 0.2% |
| Blackfeet | 894 | 0.1% |
| Bolivian | 753 | 0.1% |
| Brazilian | 2,900 | 0.2% |
| British | 5,259 | 0.4% |
| British West Indian | 2,166 | 0.2% |
| Bulgarian | 338 | 0.0% |
| Burmese | 6,126 | 0.4% |
| Cajun | 183 | 0.0% |
| Cambodian | 36 | 0.0% |
| Canadian | 3,296 | 0.2% |
| Cape Verdean | 89 | 0.0% |
| Carpatho Rusyn | 42 | 0.0% |
| Celtic | 159 | 0.0% |
| Central American | 30,622 | 2.1% |
| Central American Indian | 3,774 | 0.3% |
| Cherokee | 2,169 | 0.2% |
| Cheyenne | 203 | 0.0% |
| Chilean | 1,599 | 0.1% |
| Chippewa | 29 | 0.0% |
| Choctaw | 161 | 0.0% |
| Colombian | 9,572 | 0.6% |
| Comanche | 9 | 0.0% |
| Costa Rican | 574 | 0.0% |
| Cree | 10 | 0.0% |
| Creek | 59 | 0.0% |
| Croatian | 1,379 | 0.1% |
| Cuban | 7,917 | 0.5% |
| Cypriot | 234 | 0.0% |
| Czech | 5,318 | 0.4% |
| Czechoslovakian | 1,644 | 0.1% |
| Danish | 2,883 | 0.2% |
| Delaware | 794 | 0.1% |
| Dominican | 35,091 | 2.4% |
| Dutch | 20,105 | 1.3% |
| Dutch West Indian | 183 | 0.0% |
| Eastern European | 11,543 | 0.8% |
| Ecuadorian | 21,301 | 1.4% |
| Egyptian | 1,296 | 0.1% |
| English | 79,400 | 5.3% |
| Estonian | 560 | 0.0% |
| Ethiopian | 324 | 0.0% |
| European | 23,181 | 1.6% |
| Filipino | 566 | 0.0% |
| Finnish | 1,364 | 0.1% |
| French | 20,480 | 1.4% |
| French American Indian | 129 | 0.0% |
| French Canadian | 6,350 | 0.4% |
| German | 144,010 | 9.7% |
| German Russian | 9 | 0.0% |
| Ghanaian | 1,606 | 0.1% |
| Greek | 10,541 | 0.7% |
| Guamanian / Chamorro | 145 | 0.0% |
| Guatemalan | 13,137 | 0.9% |
| Guyanese | 2,577 | 0.2% |
| Haitian | 17,494 | 1.2% |
| Honduran | 5,842 | 0.4% |
| Hungarian | 43,914 | 2.9% |
| Icelander | 109 | 0.0% |
| Indian (Asian) | 14,971 | 1.0% |
| Indonesian | 129 | 0.0% |
| Inupiat | 120 | 0.0% |
| Iranian | 1,067 | 0.1% |
| Iraqi | 223 | 0.0% |
| Irish | 218,167 | 14.7% |
| Iroquois | 1,069 | 0.1% |
| Israeli | 4,274 | 0.3% |
| Italian | 217,942 | 14.7% |
| Jamaican | 17,046 | 1.1% |
| Japanese | 490 | 0.0% |
| Jordanian | 950 | 0.1% |
| Kenyan | 221 | 0.0% |
| Kiowa | 2 | 0.0% |
| Korean | 10,664 | 0.7% |
| Laotian | 151 | 0.0% |
| Latvian | 738 | 0.1% |
| Lebanese | 1,503 | 0.1% |
| Liberian | 145 | 0.0% |
| Lithuanian | 3,109 | 0.2% |
| Luxembourger | 128 | 0.0% |
| Macedonian | 270 | 0.0% |
| Malaysian | 198 | 0.0% |
| Maltese | 311 | 0.0% |
| Mexican | 42,145 | 2.8% |
| Mexican American Indian | 1,860 | 0.1% |
| Mongolian | 90 | 0.0% |
| Moroccan | 1,235 | 0.1% |
| Native Hawaiian | 347 | 0.0% |
| Navajo | 218 | 0.0% |
| New Zealander | 19 | 0.0% |
| Nicaraguan | 764 | 0.1% |
| Nigerian | 1,991 | 0.1% |
| Northern European | 2,312 | 0.2% |
| Norwegian | 8,130 | 0.5% |
| Okinawan | 43 | 0.0% |
| Osage | 78 | 0.0% |
| Pakistani | 404 | 0.0% |
| Palestinian | 492 | 0.0% |
| Panamanian | 2,045 | 0.1% |
| Paraguayan | 325 | 0.0% |
| Pennsylvania German | 194 | 0.0% |
| Peruvian | 7,750 | 0.5% |
| Polish | 59,375 | 4.0% |
| Portuguese | 6,134 | 0.4% |
| Puerto Rican | 88,420 | 5.9% |
| Romanian | 7,852 | 0.5% |
| Russian | 22,475 | 1.5% |
| Salvadoran | 8,260 | 0.6% |
| Samoan | 125 | 0.0% |
| Scandinavian | 2,370 | 0.2% |
| Scotch-Irish | 6,266 | 0.4% |
| Scottish | 15,909 | 1.1% |
| Seminole | 57 | 0.0% |
| Senegalese | 32 | 0.0% |
| Serbian | 193 | 0.0% |
| Shoshone | 18 | 0.0% |
| Sierra Leonean | 195 | 0.0% |
| Sioux | 198 | 0.0% |
| Slavic | 559 | 0.0% |
| Slovak | 3,470 | 0.2% |
| Slovene | 283 | 0.0% |
| Somali | 17 | 0.0% |
| South African | 291 | 0.0% |
| South American | 46,959 | 3.2% |
| South American Indian | 1,103 | 0.1% |
| Soviet Union | 6 | 0.0% |
| Spaniard | 5,327 | 0.4% |
| Spanish | 3,374 | 0.2% |
| Spanish American | 28 | 0.0% |
| Sri Lankan | 2,714 | 0.2% |
| Subsaharan African | 10,200 | 0.7% |
| Swedish | 8,386 | 0.6% |
| Swiss | 3,198 | 0.2% |
| Syrian | 992 | 0.1% |
| Thai | 21,750 | 1.5% |
| Tohono O'Odham | 2 | 0.0% |
| Tongan | 28 | 0.0% |
| Trinidadian and Tobagonian | 1,940 | 0.1% |
| Turkish | 1,208 | 0.1% |
| U.S. Virgin Islander | 342 | 0.0% |
| Ugandan | 50 | 0.0% |
| Ukrainian | 8,622 | 0.6% |
| Uruguayan | 894 | 0.1% |
| Venezuelan | 1,443 | 0.1% |
| Vietnamese | 1,364 | 0.1% |
| Welsh | 4,405 | 0.3% |
| West Indian | 3,054 | 0.2% |
| Yaqui | 11 | 0.0% |
| Yugoslavian | 993 | 0.1% |
| Yuman | 11 | 0.0% | View All 167 Rows |
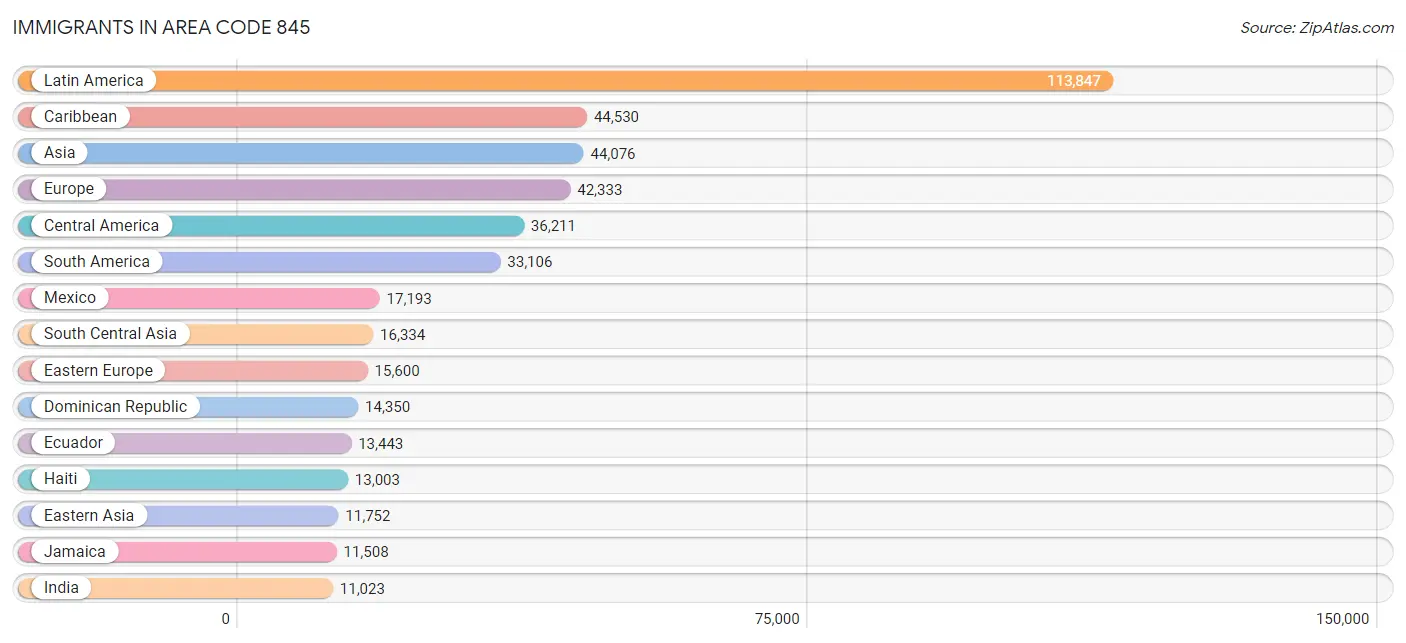
Immigrants in Area Code 845
The most numerous immigrant groups reported in Area Code 845 came from Latin America (113,847 | 7.7%), Caribbean (44,530 | 3.0%), Asia (44,076 | 3.0%), Europe (42,333 | 2.9%), and Central America (36,211 | 2.4%), together accounting for 18.9% of all Area Code 845 residents.
| Immigration Origin | # Population | % Population |
| Afghanistan | 234 | 0.0% |
| Africa | 6,494 | 0.4% |
| Albania | 808 | 0.1% |
| Argentina | 2,228 | 0.2% |
| Armenia | 34 | 0.0% |
| Asia | 44,076 | 3.0% |
| Australia | 698 | 0.1% |
| Austria | 410 | 0.0% |
| Bahamas | 173 | 0.0% |
| Bangladesh | 1,062 | 0.1% |
| Barbados | 491 | 0.0% |
| Belarus | 345 | 0.0% |
| Belgium | 615 | 0.0% |
| Belize | 213 | 0.0% |
| Bolivia | 513 | 0.0% |
| Bosnia and Herzegovina | 151 | 0.0% |
| Brazil | 2,464 | 0.2% |
| Bulgaria | 215 | 0.0% |
| Cambodia | 162 | 0.0% |
| Cameroon | 64 | 0.0% |
| Canada | 4,083 | 0.3% |
| Caribbean | 44,530 | 3.0% |
| Central America | 36,211 | 2.4% |
| Chile | 783 | 0.1% |
| China | 7,419 | 0.5% |
| Colombia | 4,828 | 0.3% |
| Congo | 13 | 0.0% |
| Costa Rica | 407 | 0.0% |
| Croatia | 346 | 0.0% |
| Cuba | 1,005 | 0.1% |
| Czechoslovakia | 844 | 0.1% |
| Denmark | 126 | 0.0% |
| Dominica | 383 | 0.0% |
| Dominican Republic | 14,350 | 1.0% |
| Eastern Africa | 954 | 0.1% |
| Eastern Asia | 11,752 | 0.8% |
| Eastern Europe | 15,600 | 1.1% |
| Ecuador | 13,443 | 0.9% |
| Egypt | 672 | 0.1% |
| El Salvador | 4,517 | 0.3% |
| England | 2,868 | 0.2% |
| Eritrea | 9 | 0.0% |
| Ethiopia | 321 | 0.0% |
| Europe | 42,333 | 2.9% |
| France | 1,015 | 0.1% |
| Germany | 3,836 | 0.3% |
| Ghana | 1,457 | 0.1% |
| Greece | 1,229 | 0.1% |
| Grenada | 363 | 0.0% |
| Guatemala | 8,942 | 0.6% |
| Guyana | 2,202 | 0.2% |
| Haiti | 13,003 | 0.9% |
| Honduras | 3,130 | 0.2% |
| Hong Kong | 767 | 0.1% |
| Hungary | 956 | 0.1% |
| India | 11,023 | 0.7% |
| Indonesia | 272 | 0.0% |
| Iran | 695 | 0.1% |
| Iraq | 149 | 0.0% |
| Ireland | 3,736 | 0.3% |
| Israel | 3,417 | 0.2% |
| Italy | 6,208 | 0.4% |
| Jamaica | 11,508 | 0.8% |
| Japan | 1,241 | 0.1% |
| Jordan | 1,003 | 0.1% |
| Kazakhstan | 44 | 0.0% |
| Kenya | 230 | 0.0% |
| Korea | 3,085 | 0.2% |
| Kuwait | 110 | 0.0% |
| Laos | 55 | 0.0% |
| Latin America | 113,847 | 7.7% |
| Latvia | 174 | 0.0% |
| Lebanon | 260 | 0.0% |
| Liberia | 229 | 0.0% |
| Lithuania | 93 | 0.0% |
| Malaysia | 210 | 0.0% |
| Mexico | 17,193 | 1.2% |
| Middle Africa | 121 | 0.0% |
| Moldova | 230 | 0.0% |
| Morocco | 488 | 0.0% |
| Nepal | 755 | 0.1% |
| Netherlands | 428 | 0.0% |
| Nicaragua | 752 | 0.1% |
| Nigeria | 1,449 | 0.1% |
| North Macedonia | 98 | 0.0% |
| Northern Africa | 1,294 | 0.1% |
| Northern Europe | 10,617 | 0.7% |
| Norway | 170 | 0.0% |
| Oceania | 853 | 0.1% |
| Pakistan | 1,996 | 0.1% |
| Panama | 1,000 | 0.1% |
| Peru | 4,806 | 0.3% |
| Philippines | 6,069 | 0.4% |
| Poland | 3,684 | 0.3% |
| Portugal | 938 | 0.1% |
| Romania | 1,262 | 0.1% |
| Russia | 2,244 | 0.2% |
| Saudi Arabia | 174 | 0.0% |
| Scotland | 504 | 0.0% |
| Senegal | 3 | 0.0% |
| Serbia | 89 | 0.0% |
| Sierra Leone | 125 | 0.0% |
| Singapore | 90 | 0.0% |
| Somalia | 52 | 0.0% |
| South Africa | 357 | 0.0% |
| South America | 33,106 | 2.2% |
| South Central Asia | 16,334 | 1.1% |
| South Eastern Asia | 8,994 | 0.6% |
| Southern Europe | 9,158 | 0.6% |
| Spain | 733 | 0.1% |
| Sri Lanka | 120 | 0.0% |
| St. Vincent and the Grenadines | 140 | 0.0% |
| Sudan | 29 | 0.0% |
| Sweden | 259 | 0.0% |
| Switzerland | 359 | 0.0% |
| Syria | 285 | 0.0% |
| Taiwan | 955 | 0.1% |
| Thailand | 270 | 0.0% |
| Trinidad and Tobago | 1,622 | 0.1% |
| Turkey | 560 | 0.0% |
| Uganda | 106 | 0.0% |
| Ukraine | 1,737 | 0.1% |
| Uruguay | 561 | 0.0% |
| Uzbekistan | 200 | 0.0% |
| Venezuela | 789 | 0.1% |
| Vietnam | 1,761 | 0.1% |
| West Indies | 585 | 0.0% |
| Western Africa | 3,669 | 0.3% |
| Western Asia | 6,922 | 0.5% |
| Western Europe | 6,663 | 0.4% |
| Yemen | 86 | 0.0% |
| Zaire | 14 | 0.0% |
| Zimbabwe | 11 | 0.0% | View All 133 Rows |
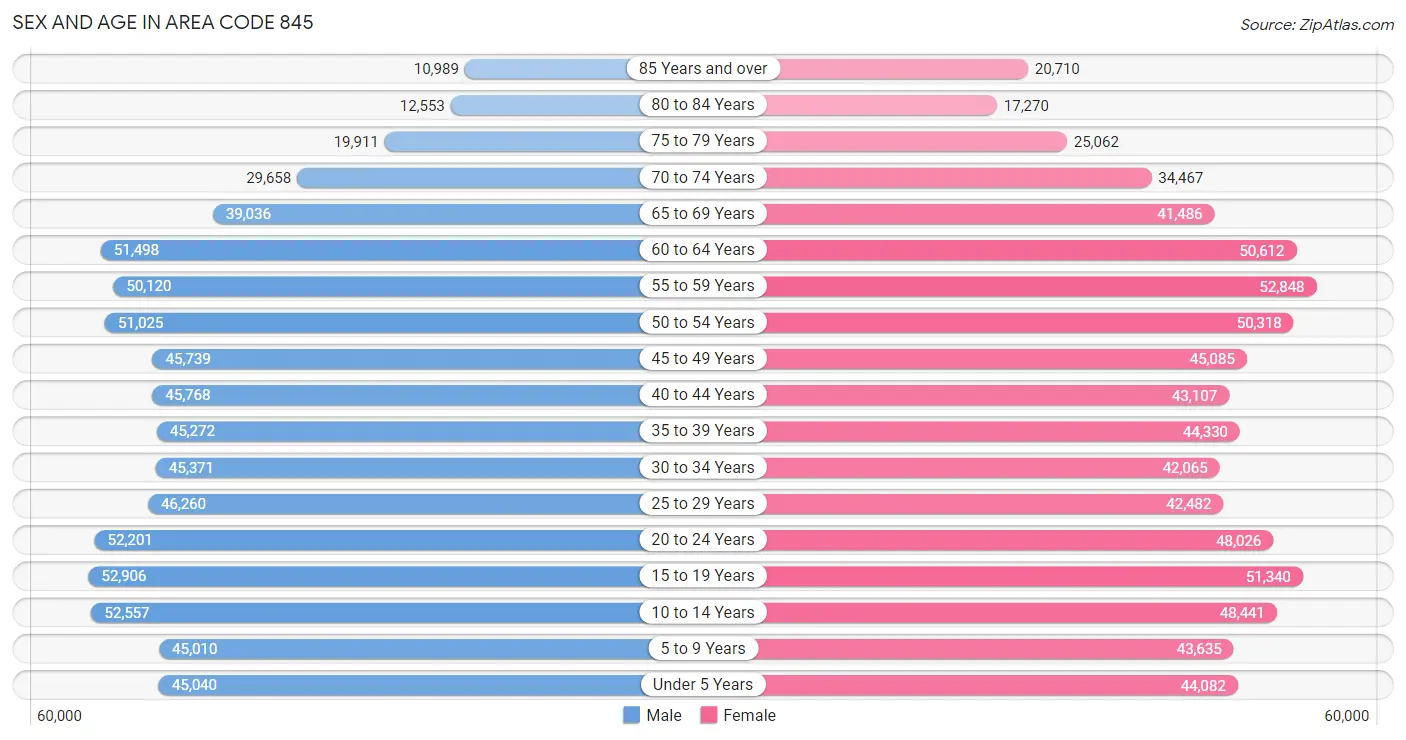
Sex and Age in Area Code 845
Sex and Age in Area Code 845
The most populous age groups in Area Code 845 are 15 to 19 Years (52,906 | 7.1%) for men and 55 to 59 Years (52,848 | 7.1%) for women.
| Age Bracket | Male | Female |
| Under 5 Years | 45,040 (6.1%) | 44,082 (5.9%) |
| 5 to 9 Years | 45,010 (6.1%) | 43,635 (5.9%) |
| 10 to 14 Years | 52,557 (7.1%) | 48,441 (6.5%) |
| 15 to 19 Years | 52,906 (7.1%) | 51,340 (6.9%) |
| 20 to 24 Years | 52,201 (7.0%) | 48,026 (6.4%) |
| 25 to 29 Years | 46,260 (6.2%) | 42,482 (5.7%) |
| 30 to 34 Years | 45,371 (6.1%) | 42,065 (5.6%) |
| 35 to 39 Years | 45,272 (6.1%) | 44,330 (5.9%) |
| 40 to 44 Years | 45,768 (6.2%) | 43,107 (5.8%) |
| 45 to 49 Years | 45,739 (6.2%) | 45,085 (6.0%) |
| 50 to 54 Years | 51,025 (6.9%) | 50,318 (6.8%) |
| 55 to 59 Years | 50,120 (6.8%) | 52,848 (7.1%) |
| 60 to 64 Years | 51,498 (7.0%) | 50,612 (6.8%) |
| 65 to 69 Years | 39,036 (5.3%) | 41,486 (5.6%) |
| 70 to 74 Years | 29,658 (4.0%) | 34,467 (4.6%) |
| 75 to 79 Years | 19,911 (2.7%) | 25,062 (3.4%) |
| 80 to 84 Years | 12,553 (1.7%) | 17,270 (2.3%) |
| 85 Years and over | 10,989 (1.5%) | 20,710 (2.8%) |
| Total | 740,914 (100.0%) | 745,366 (100.0%) |
Families and Households in Area Code 845
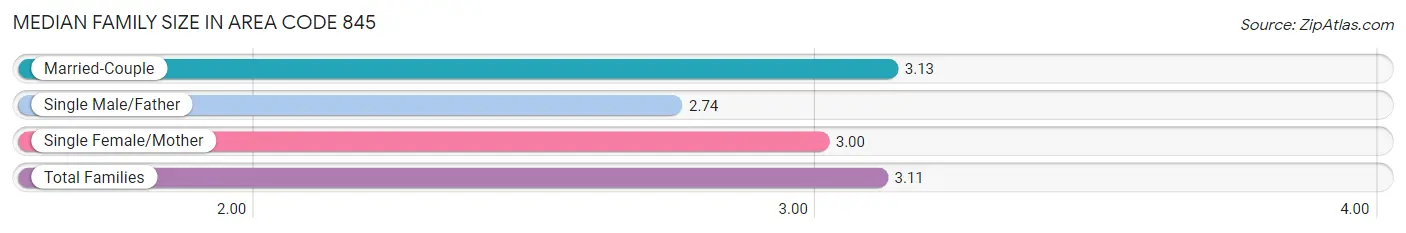
Median Family Size in Area Code 845
The median family size in Area Code 845 is 3.11 persons per family, with married-couple families (274,549 | 76.8%) accounting for the largest median family size of 3.12789 persons per family. On the other hand, single male/father families (24,003 | 6.7%) represent the smallest median family size with 2.74 persons per family.
| Family Type | # Families | Family Size |
| Married-Couple | 274,549 (76.8%) | 3.13 |
| Single Male/Father | 24,003 (6.7%) | 2.74 |
| Single Female/Mother | 58,747 (16.4%) | 3.00 |
| Total Families | 357,299 (100.0%) | 3.11 |
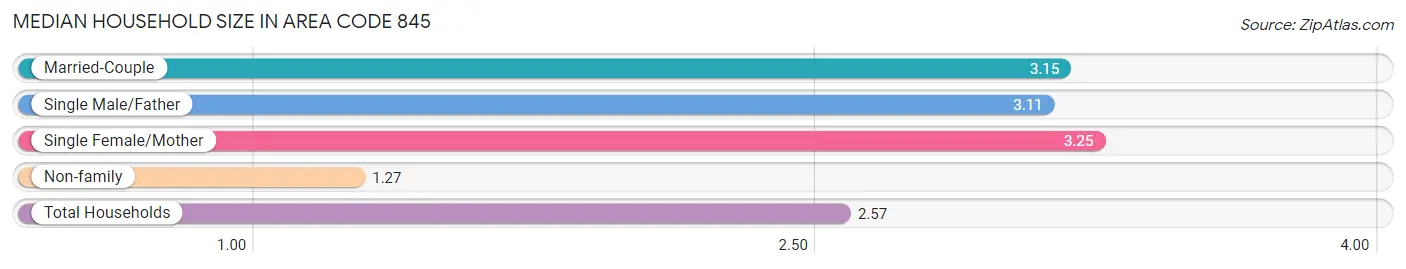
Median Household Size in Area Code 845
The median household size in Area Code 845 is 2.57 persons per household, with single female/mother households (58,747 | 11.2%) accounting for the largest median household size of 3.24644 persons per household. non-family households (168,389 | 32.0%) represent the smallest median household size with 1.27 persons per household.
| Household Type | # Households | Household Size |
| Married-Couple | 274,549 (52.2%) | 3.15 |
| Single Male/Father | 24,003 (4.6%) | 3.11 |
| Single Female/Mother | 58,747 (11.2%) | 3.25 |
| Non-family | 168,389 (32.0%) | 1.27 |
| Total Households | 525,688 (100.0%) | 2.57 |
Household Size by Marriage Status in Area Code 845
Out of a total of 525,688 households in Area Code 845, 357,299 (68.0%) are family households, while 168,389 (32.0%) are nonfamily households. The most numerous type of family households are 2-person households, comprising 137,300, and the most common type of nonfamily households are 1-person households, comprising 139,102.
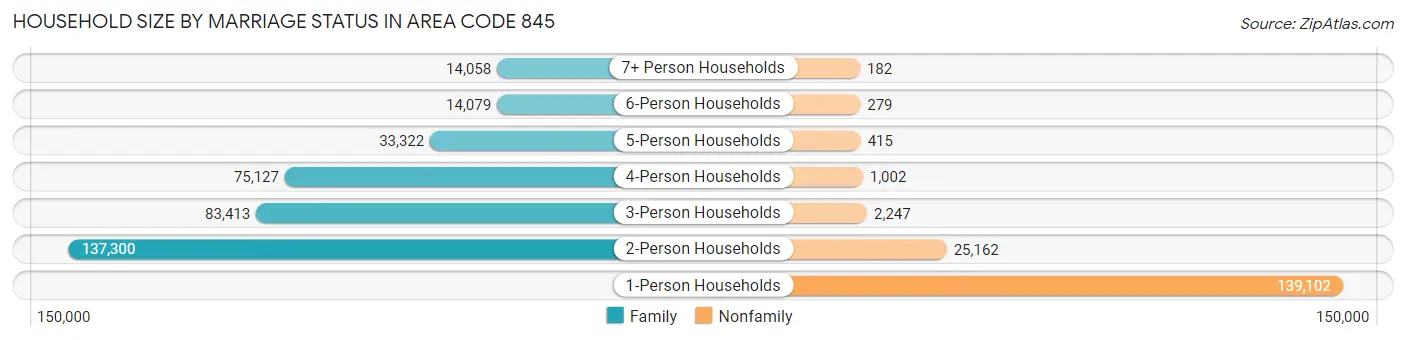
| Household Size | Family Households | Nonfamily Households |
| 1-Person Households | - | 139,102 (26.5%) |
| 2-Person Households | 137,300 (26.1%) | 25,162 (4.8%) |
| 3-Person Households | 83,413 (15.9%) | 2,247 (0.4%) |
| 4-Person Households | 75,127 (14.3%) | 1,002 (0.2%) |
| 5-Person Households | 33,322 (6.3%) | 415 (0.1%) |
| 6-Person Households | 14,079 (2.7%) | 279 (0.1%) |
| 7+ Person Households | 14,058 (2.7%) | 182 (0.0%) |
| Total | 357,299 (68.0%) | 168,389 (32.0%) |
Female Fertility in Area Code 845
Fertility by Age in Area Code 845
Average fertility rate in Area Code 845 is 91.9 births per 1,000 women. Women in the age bracket of 20 to 34 years have the highest fertility rate with 154.0 births per 1,000 women. Women in the age bracket of 20 to 34 years acount for 62.3% of all women with births.
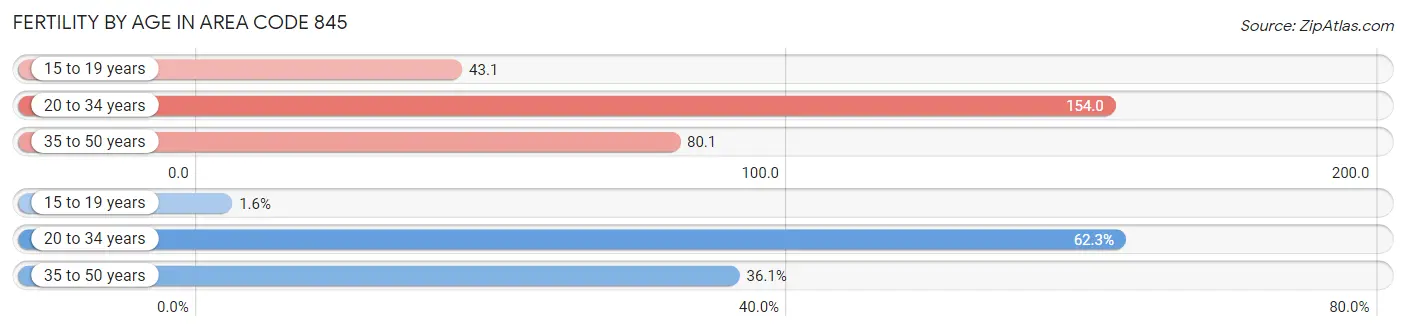
| Age Bracket | Women with Births | Births / 1,000 Women |
| 15 to 19 years | 320 (1.6%) | 43.1 |
| 20 to 34 years | 12,132 (62.3%) | 154.0 |
| 35 to 50 years | 7,029 (36.1%) | 80.1 |
| Total | 19,481 (100.0%) | 91.9 |
Fertility by Age by Marriage Status in Area Code 845
58.9% of women with births (19,481) in Area Code 845 are married. The highest percentage of unmarried women with births falls into 15 to 19 years age bracket with 100.0% of them unmarried at the time of birth, while the lowest percentage of unmarried women with births belong to 35 to 50 years age bracket with 38.9% of them unmarried.
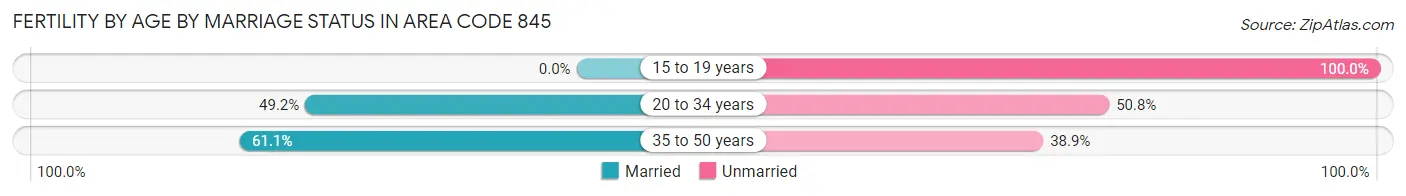
| Age Bracket | Married | Unmarried |
| 15 to 19 years | 0 (0.0%) | 320 (100.0%) |
| 20 to 34 years | 5,965 (49.2%) | 6,167 (50.8%) |
| 35 to 50 years | 4,297 (61.1%) | 2,732 (38.9%) |
| Total | 11,469 (58.9%) | 8,012 (41.1%) |
Fertility by Education in Area Code 845
Average fertility rate in Area Code 845 is 91.9 births per 1,000 women. Women with the education attainment of high school diploma have the highest fertility rate of 148.6 births per 1,000 women, while women with the education attainment of less than high school have the lowest fertility at 96.0 births per 1,000 women. Women with the education attainment of high school diploma represent 29.8% of all women with births.
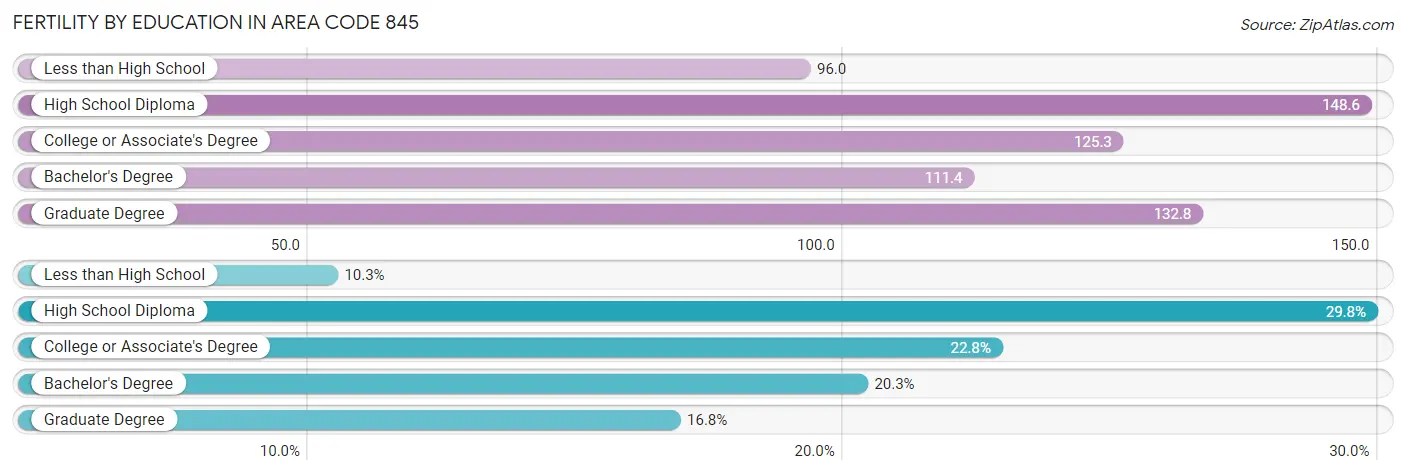
| Educational Attainment | Women with Births | Births / 1,000 Women |
| Less than High School | 2,014 (10.3%) | 96.0 |
| High School Diploma | 5,812 (29.8%) | 148.6 |
| College or Associate's Degree | 4,441 (22.8%) | 125.3 |
| Bachelor's Degree | 3,949 (20.3%) | 111.4 |
| Graduate Degree | 3,265 (16.8%) | 132.8 |
| Total | 19,481 (100.0%) | 91.9 |
Fertility by Education by Marriage Status in Area Code 845
41.1% of women with births in Area Code 845 are unmarried. Women with the educational attainment of graduate degree are most likely to be married with 61.1% of them married at childbirth, while women with the educational attainment of less than high school are least likely to be married with 74.6% of them unmarried at childbirth.
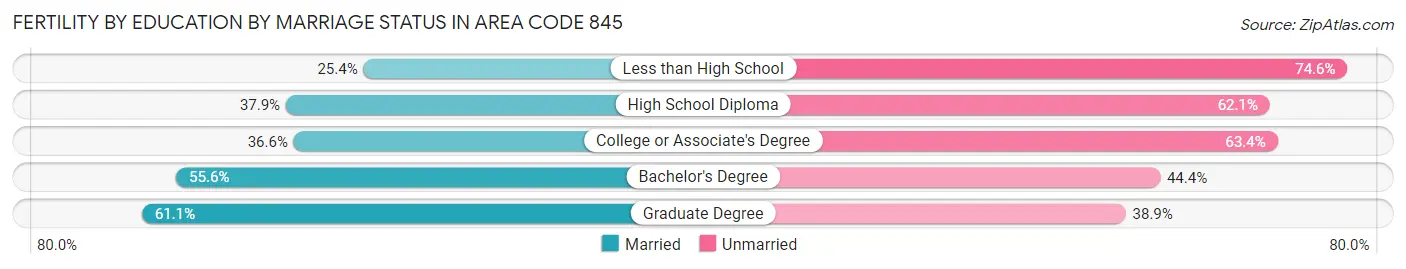
| Educational Attainment | Married | Unmarried |
| Less than High School | 511 (25.4%) | 1,503 (74.6%) |
| High School Diploma | 2,201 (37.9%) | 3,611 (62.1%) |
| College or Associate's Degree | 1,626 (36.6%) | 2,815 (63.4%) |
| Bachelor's Degree | 2,194 (55.6%) | 1,755 (44.4%) |
| Graduate Degree | 1,995 (61.1%) | 1,270 (38.9%) |
| Total | 11,469 (58.9%) | 8,012 (41.1%) |
Employment Characteristics in Area Code 845
Employment by Class of Employer in Area Code 845
Among the 687,747 employed individuals in Area Code 845, private company employees (410,414 | 59.7%), not-for-profit organizations (82,574 | 12.0%), and local government employees (74,157 | 10.8%) make up the most common classes of employment.
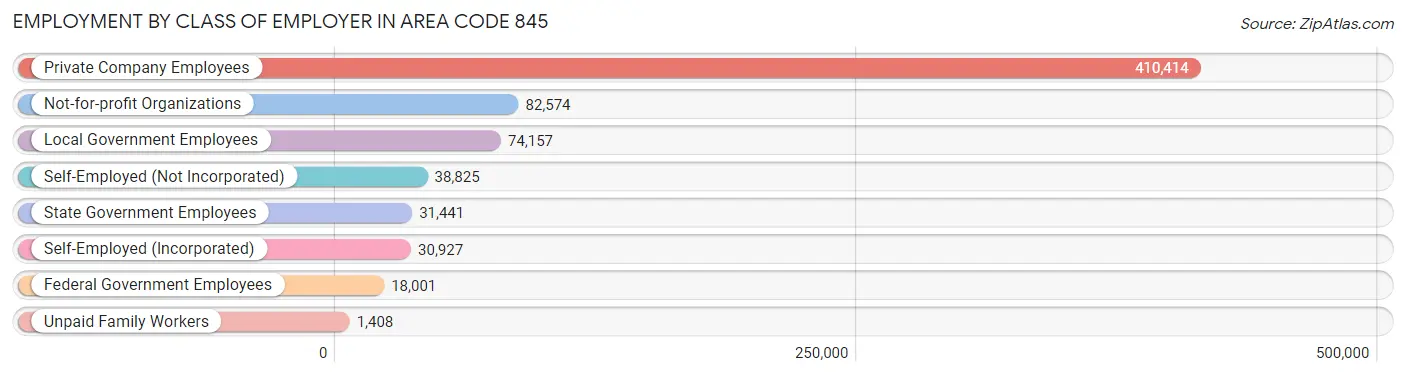
| Employer Class | # Employees | % Employees |
| Private Company Employees | 410,414 | 59.7% |
| Self-Employed (Incorporated) | 30,927 | 4.5% |
| Self-Employed (Not Incorporated) | 38,825 | 5.7% |
| Not-for-profit Organizations | 82,574 | 12.0% |
| Local Government Employees | 74,157 | 10.8% |
| State Government Employees | 31,441 | 4.6% |
| Federal Government Employees | 18,001 | 2.6% |
| Unpaid Family Workers | 1,408 | 0.2% |
| Total | 687,747 | 100.0% |
Employment Status by Age in Area Code 845
According to the labor force statistics for Area Code 845, out of the total population over 16 years of age (1,186,266), 61.5% or 730,028 individuals are in the labor force, with 6.2% or 45,627 of them unemployed. The age group with the highest labor force participation rate is 25 to 29 years, with 86.5% or 76,717 individuals in the labor force. Within the labor force, the 16 to 19 years age range has the highest percentage of unemployed individuals, with 2,277.9% or 726,923 of them being unemployed.
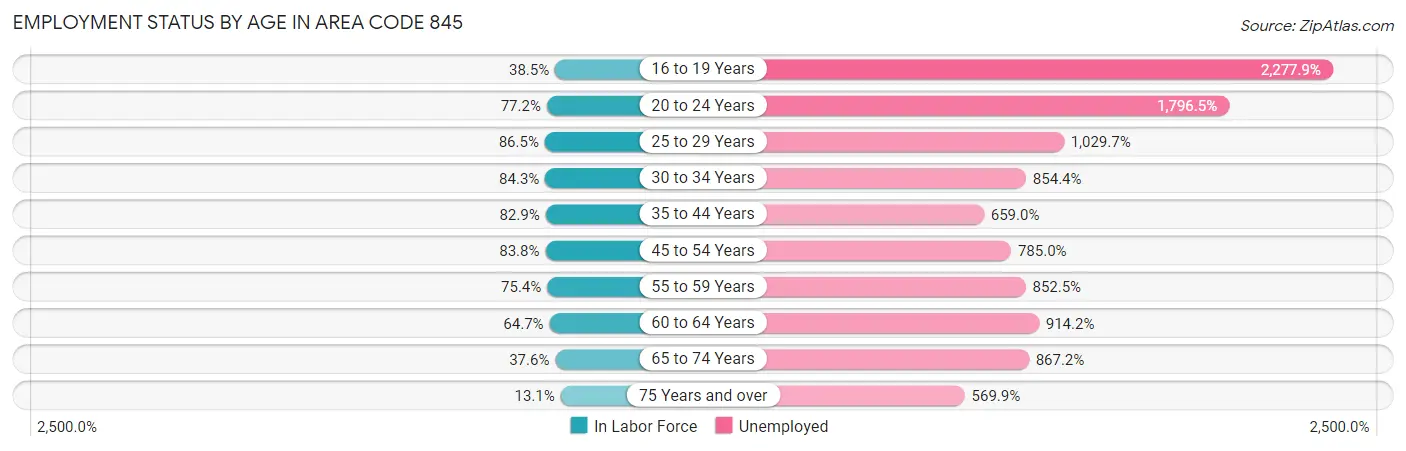
| Age Bracket | In Labor Force | Unemployed |
| 16 to 19 Years | 31,914 (38.5%) | 726,923 (2,277.9%) |
| 20 to 24 Years | 77,355 (77.2%) | 1,389,683 (1,796.5%) |
| 25 to 29 Years | 76,714 (86.5%) | 789,955 (1,029.7%) |
| 30 to 34 Years | 73,696 (84.3%) | 629,693 (854.4%) |
| 35 to 44 Years | 148,034 (82.9%) | 975,511 (659.0%) |
| 45 to 54 Years | 161,044 (83.8%) | 1,264,133 (785.0%) |
| 55 to 59 Years | 77,640 (75.4%) | 661,864 (852.5%) |
| 60 to 64 Years | 66,020 (64.7%) | 603,591 (914.2%) |
| 65 to 74 Years | 54,315 (37.6%) | 471,020 (867.2%) |
| 75 Years and over | 13,961 (13.1%) | 79,564 (569.9%) |
| Total | 730,047 (61.5%) | 45,622 (6.2%) |
Employment Status by Educational Attainment in Area Code 845
According to labor force statistics for Area Code 845, 77.9% of individuals (585,505) out of the total population between 25 and 64 years of age (751,900) are in the labor force, with 956.3% or 5,599,184 of them being unemployed. The group with the highest labor force participation rate are those with the educational attainment of bachelor's degree or higher, with 86.2% or 251,623 individuals in the labor force. Within the labor force, individuals with high school diploma education have the highest percentage of unemployment, with 1,255.4% or 1,734,423 of them being unemployed.
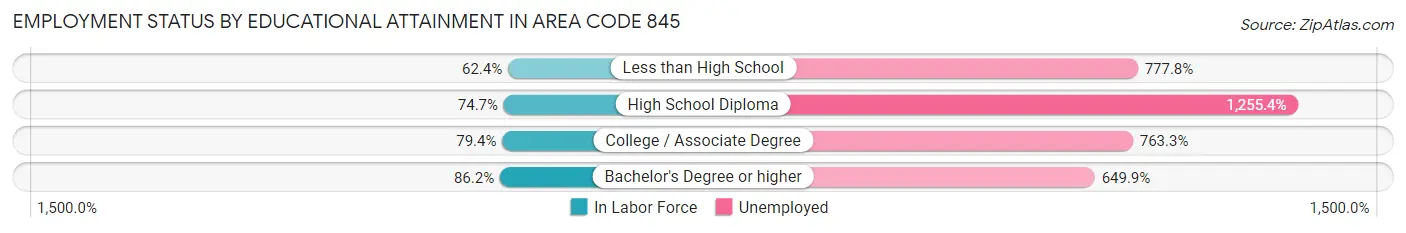
| Educational Attainment | In Labor Force | Unemployed |
| Less than High School | 42,524 (62.4%) | 530,320 (777.8%) |
| High School Diploma | 138,164 (74.7%) | 2,320,607 (1,255.4%) |
| College / Associate Degree | 164,412 (79.4%) | 1,580,000 (763.3%) |
| Bachelor's Degree or higher | 251,620 (86.2%) | 1,896,876 (649.9%) |
| Total | 585,500 (77.9%) | 7,190,420 (956.3%) |
Employment Occupations by Sex in Area Code 845
Management, Business, Science and Arts Occupations
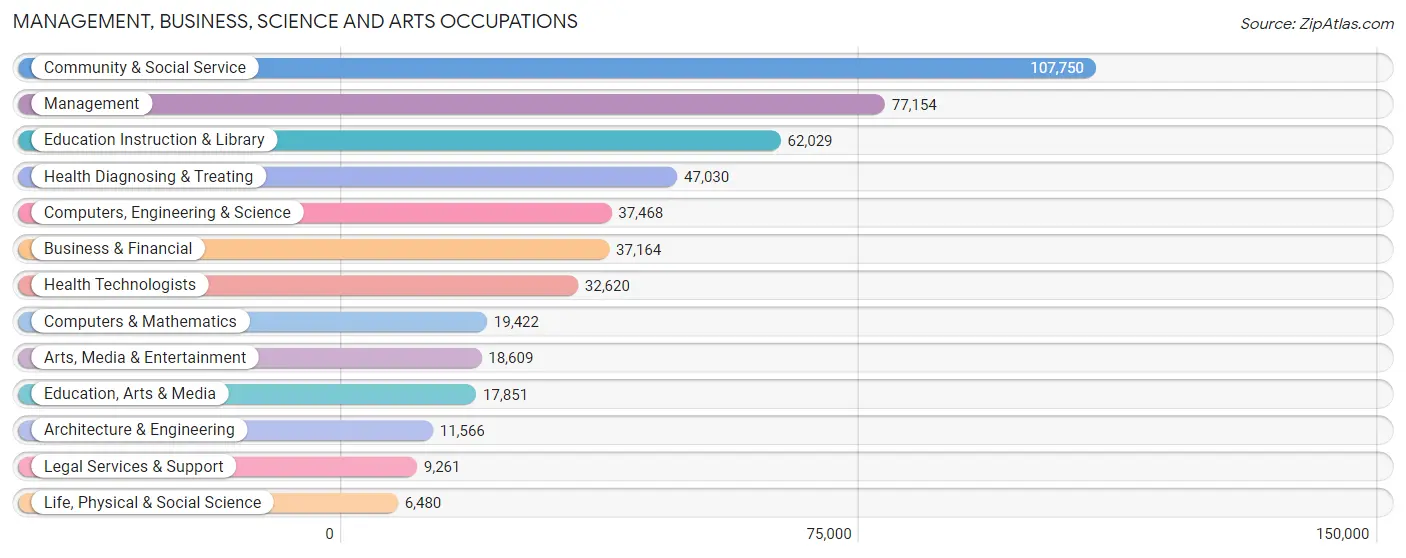
The most common Management, Business, Science and Arts occupations in Area Code 845 are Community & Social Service (107,750 | 15.4%), Management (77,154 | 11.0%), Education Instruction & Library (62,029 | 8.8%), Health Diagnosing & Treating (47,030 | 6.7%), and Computers, Engineering & Science (37,468 | 5.3%).
Management, Business, Science and Arts Occupations by Sex
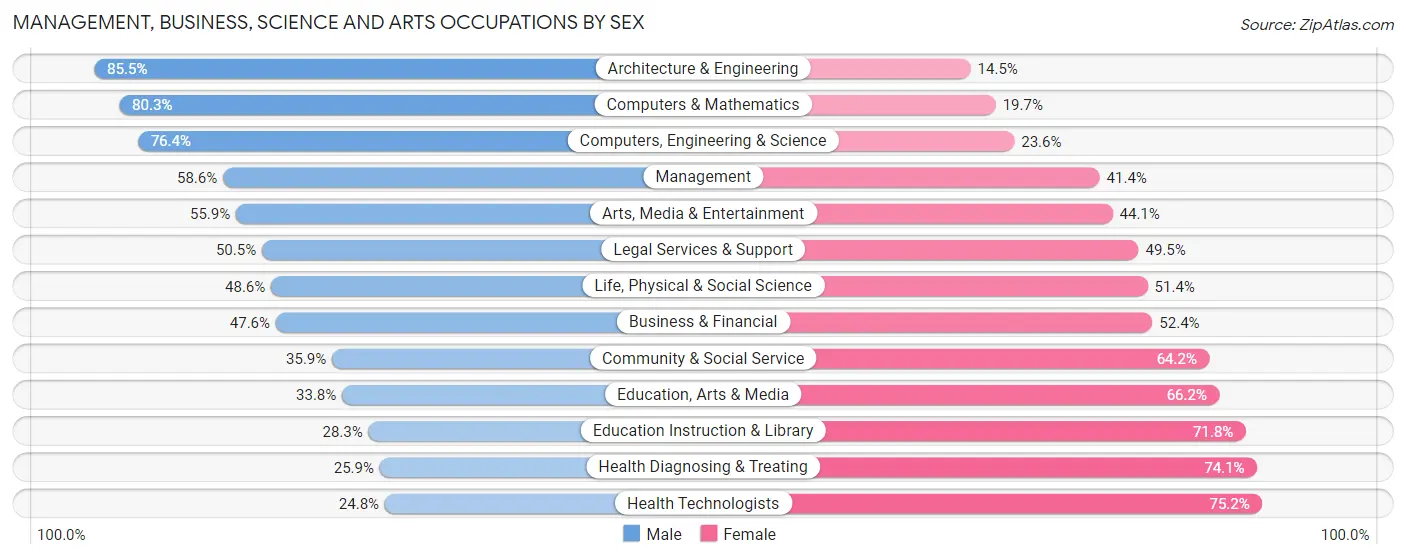
Within the Management, Business, Science and Arts occupations in Area Code 845, the most male-oriented occupations are Architecture & Engineering (85.5%), Computers & Mathematics (80.3%), and Computers, Engineering & Science (76.4%), while the most female-oriented occupations are Health Technologists (75.2%), Health Diagnosing & Treating (74.1%), and Education Instruction & Library (71.8%).
| Occupation | Male | Female |
| Management | 45,213 (58.6%) | 31,941 (41.4%) |
| Business & Financial | 17,685 (47.6%) | 19,479 (52.4%) |
| Computers, Engineering & Science | 28,627 (76.4%) | 8,841 (23.6%) |
| Computers & Mathematics | 15,590 (80.3%) | 3,832 (19.7%) |
| Architecture & Engineering | 9,889 (85.5%) | 1,677 (14.5%) |
| Life, Physical & Social Science | 3,148 (48.6%) | 3,332 (51.4%) |
| Community & Social Service | 38,627 (35.8%) | 69,123 (64.1%) |
| Education, Arts & Media | 6,027 (33.8%) | 11,824 (66.2%) |
| Legal Services & Support | 4,675 (50.5%) | 4,586 (49.5%) |
| Education Instruction & Library | 17,524 (28.2%) | 44,505 (71.8%) |
| Arts, Media & Entertainment | 10,401 (55.9%) | 8,208 (44.1%) |
| Health Diagnosing & Treating | 12,182 (25.9%) | 34,848 (74.1%) |
| Health Technologists | 8,104 (24.8%) | 24,516 (75.2%) |
| Total (Category) | 142,334 (46.4%) | 164,232 (53.6%) |
| Total (Overall) | 366,475 (52.3%) | 334,110 (47.7%) |
Services Occupations
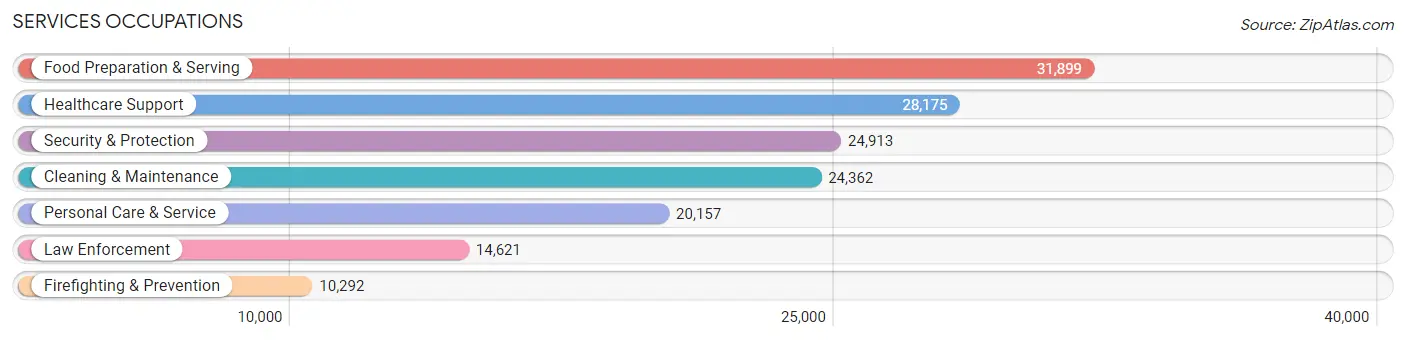
The most common Services occupations in Area Code 845 are Food Preparation & Serving (31,899 | 4.5%), Healthcare Support (28,175 | 4.0%), Security & Protection (24,913 | 3.6%), Cleaning & Maintenance (24,362 | 3.5%), and Personal Care & Service (20,157 | 2.9%).
Services Occupations by Sex
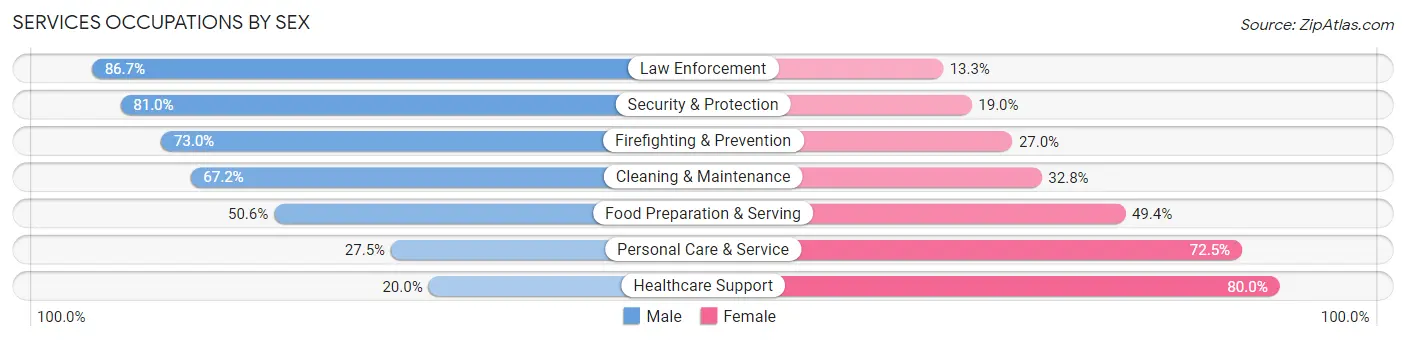
Within the Services occupations in Area Code 845, the most male-oriented occupations are Law Enforcement (86.7%), Security & Protection (81.0%), and Firefighting & Prevention (73.0%), while the most female-oriented occupations are Healthcare Support (80.0%), Personal Care & Service (72.5%), and Food Preparation & Serving (49.4%).
| Occupation | Male | Female |
| Healthcare Support | 5,642 (20.0%) | 22,533 (80.0%) |
| Security & Protection | 20,188 (81.0%) | 4,725 (19.0%) |
| Firefighting & Prevention | 7,512 (73.0%) | 2,780 (27.0%) |
| Law Enforcement | 12,676 (86.7%) | 1,945 (13.3%) |
| Food Preparation & Serving | 16,143 (50.6%) | 15,756 (49.4%) |
| Cleaning & Maintenance | 16,362 (67.2%) | 8,000 (32.8%) |
| Personal Care & Service | 5,536 (27.5%) | 14,621 (72.5%) |
| Total (Category) | 63,871 (49.3%) | 65,635 (50.7%) |
| Total (Overall) | 366,475 (52.3%) | 334,110 (47.7%) |
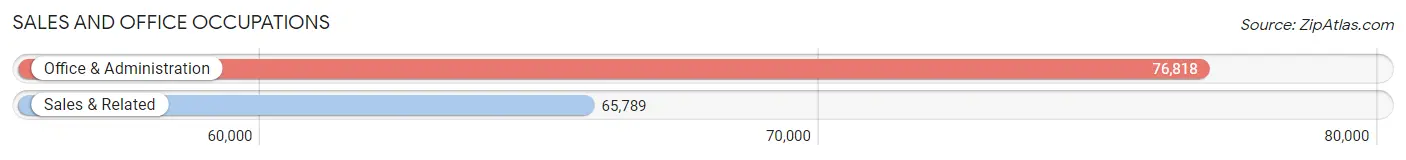
Sales and Office Occupations
The most common Sales and Office occupations in Area Code 845 are Office & Administration (76,818 | 11.0%), and Sales & Related (65,789 | 9.4%).
Sales and Office Occupations by Sex
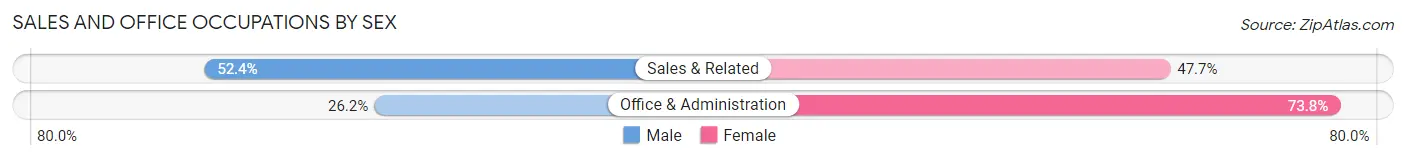
| Occupation | Male | Female |
| Sales & Related | 34,441 (52.3%) | 31,348 (47.6%) |
| Office & Administration | 20,156 (26.2%) | 56,662 (73.8%) |
| Total (Category) | 54,597 (38.3%) | 88,010 (61.7%) |
| Total (Overall) | 366,475 (52.3%) | 334,110 (47.7%) |
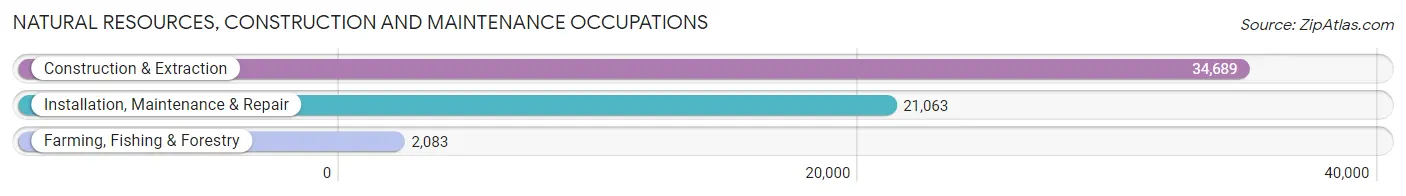
Natural Resources, Construction and Maintenance Occupations
The most common Natural Resources, Construction and Maintenance occupations in Area Code 845 are Construction & Extraction (34,689 | 5.0%), Installation, Maintenance & Repair (21,063 | 3.0%), and Farming, Fishing & Forestry (2,083 | 0.3%).
Natural Resources, Construction and Maintenance Occupations by Sex
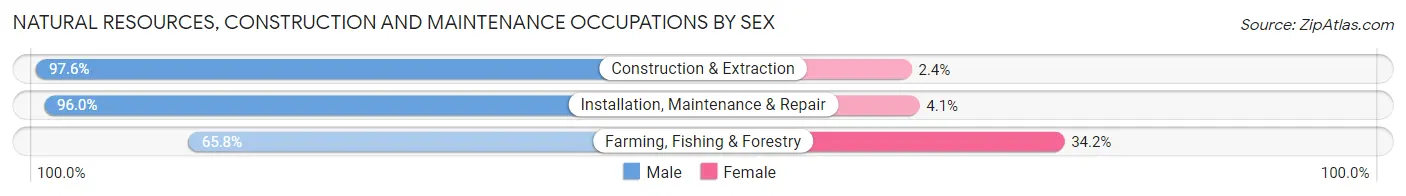
| Occupation | Male | Female |
| Farming, Fishing & Forestry | 1,371 (65.8%) | 712 (34.2%) |
| Construction & Extraction | 33,852 (97.6%) | 837 (2.4%) |
| Installation, Maintenance & Repair | 20,210 (96.0%) | 853 (4.1%) |
| Total (Category) | 55,433 (95.9%) | 2,402 (4.2%) |
| Total (Overall) | 366,475 (52.3%) | 334,110 (47.7%) |
Production, Transportation and Moving Occupations
The most common Production, Transportation and Moving occupations in Area Code 845 are Transportation (24,094 | 3.4%), Production (21,706 | 3.1%), and Material Moving (18,271 | 2.6%).
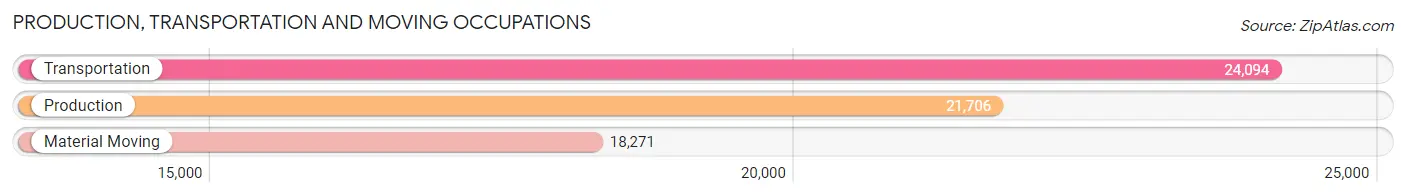
Production, Transportation and Moving Occupations by Sex
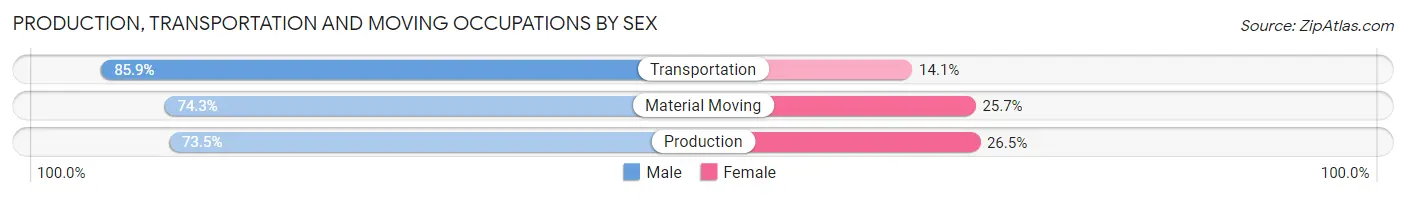
| Occupation | Male | Female |
| Production | 15,954 (73.5%) | 5,752 (26.5%) |
| Transportation | 20,706 (85.9%) | 3,388 (14.1%) |
| Material Moving | 13,580 (74.3%) | 4,691 (25.7%) |
| Total (Category) | 50,240 (78.4%) | 13,831 (21.6%) |
| Total (Overall) | 366,475 (52.3%) | 334,110 (47.7%) |
Employment Industries by Sex in Area Code 845
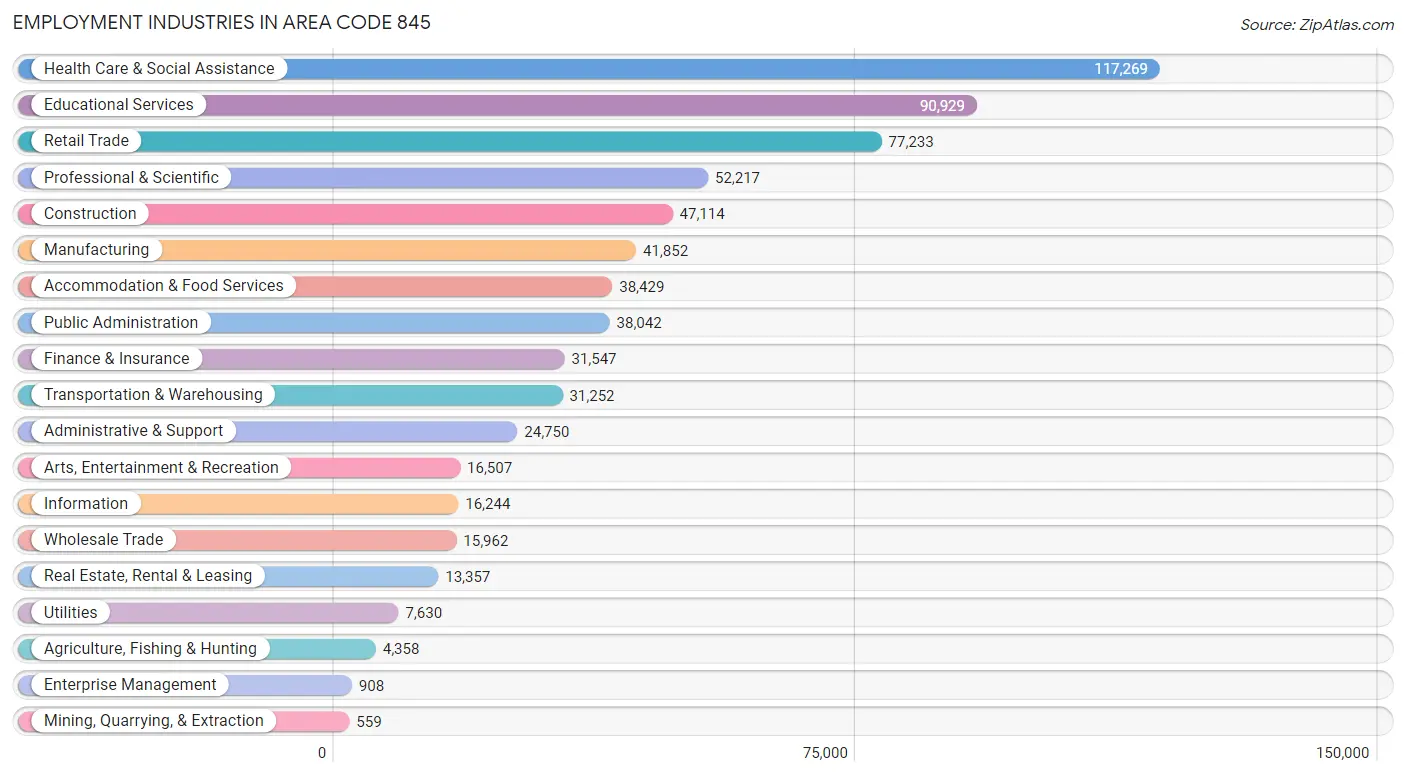
Employment Industries in Area Code 845
The major employment industries in Area Code 845 include Health Care & Social Assistance (117,269 | 16.7%), Educational Services (90,929 | 13.0%), Retail Trade (77,233 | 11.0%), Professional & Scientific (52,217 | 7.4%), and Construction (47,114 | 6.7%).
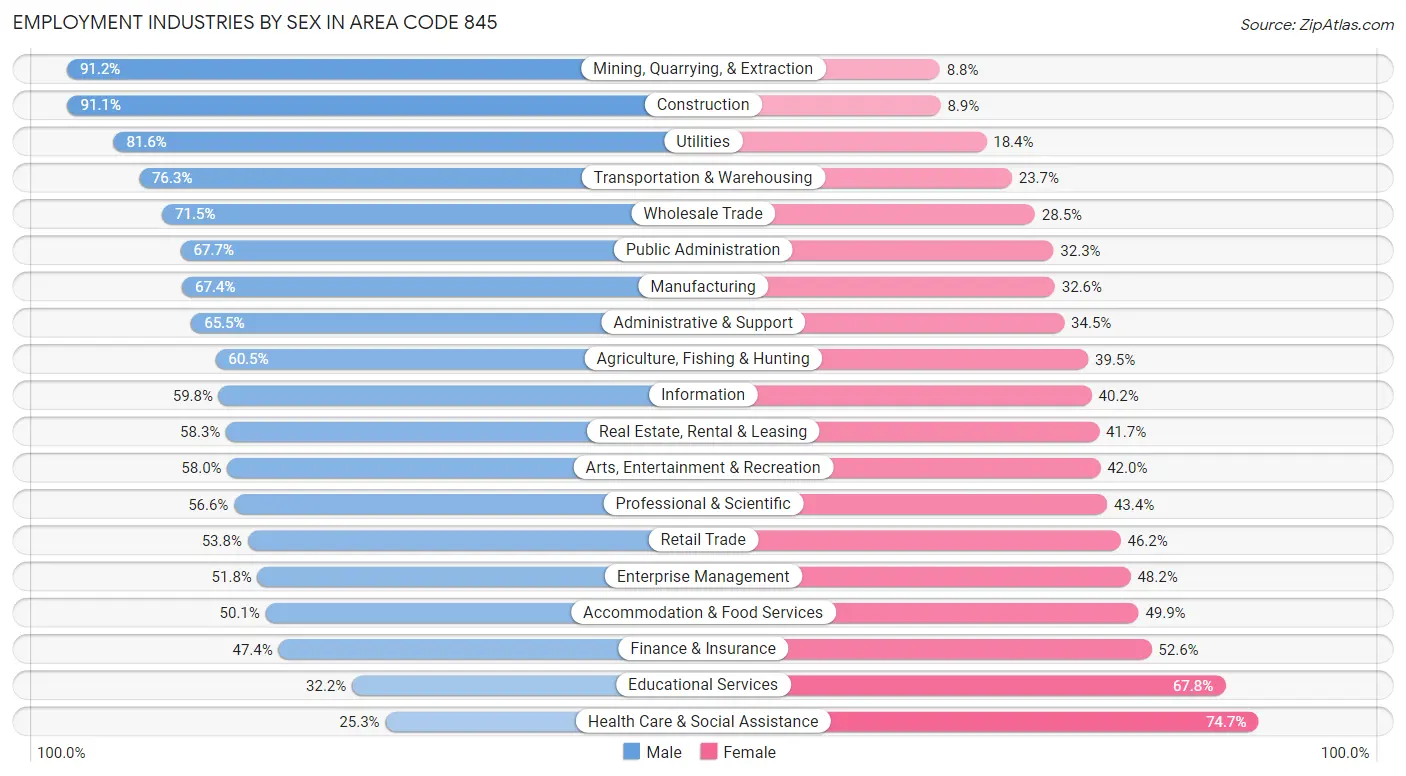
Employment Industries by Sex in Area Code 845
The Area Code 845 industries that see more men than women are Mining, Quarrying, & Extraction (91.2%), Construction (91.1%), and Utilities (81.6%), whereas the industries that tend to have a higher number of women are Health Care & Social Assistance (74.7%), Educational Services (67.8%), and Finance & Insurance (52.6%).
| Industry | Male | Female |
| Agriculture, Fishing & Hunting | 2,638 (60.5%) | 1,720 (39.5%) |
| Mining, Quarrying, & Extraction | 510 (91.2%) | 49 (8.8%) |
| Construction | 42,915 (91.1%) | 4,199 (8.9%) |
| Manufacturing | 28,214 (67.4%) | 13,638 (32.6%) |
| Wholesale Trade | 11,420 (71.5%) | 4,542 (28.5%) |
| Retail Trade | 41,563 (53.8%) | 35,670 (46.2%) |
| Transportation & Warehousing | 23,852 (76.3%) | 7,400 (23.7%) |
| Utilities | 6,226 (81.6%) | 1,404 (18.4%) |
| Information | 9,714 (59.8%) | 6,530 (40.2%) |
| Finance & Insurance | 14,963 (47.4%) | 16,584 (52.6%) |
| Real Estate, Rental & Leasing | 7,784 (58.3%) | 5,573 (41.7%) |
| Professional & Scientific | 29,567 (56.6%) | 22,650 (43.4%) |
| Enterprise Management | 470 (51.8%) | 438 (48.2%) |
| Administrative & Support | 16,209 (65.5%) | 8,541 (34.5%) |
| Educational Services | 29,284 (32.2%) | 61,645 (67.8%) |
| Health Care & Social Assistance | 29,688 (25.3%) | 87,581 (74.7%) |
| Arts, Entertainment & Recreation | 9,578 (58.0%) | 6,929 (42.0%) |
| Accommodation & Food Services | 19,256 (50.1%) | 19,173 (49.9%) |
| Public Administration | 25,758 (67.7%) | 12,284 (32.3%) |
| Total | 366,475 (52.3%) | 334,110 (47.7%) |
Education in Area Code 845
School Enrollment in Area Code 845
The most common levels of schooling among the 374,850 students in Area Code 845 are high school (84,087 | 22.4%), middle school (80,614 | 21.5%), and college / undergraduate (80,080 | 21.4%).
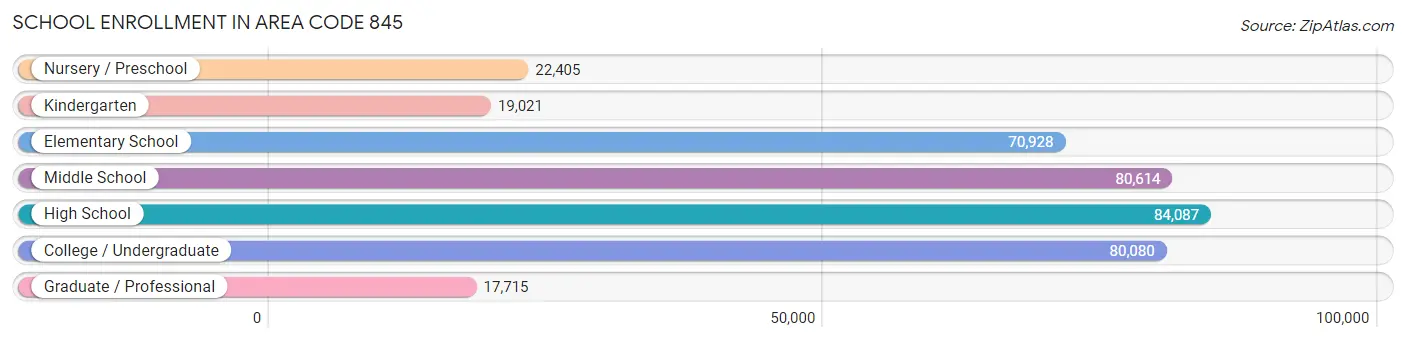
| School Level | # Students | % Students |
| Nursery / Preschool | 22,405 | 6.0% |
| Kindergarten | 19,021 | 5.1% |
| Elementary School | 70,928 | 18.9% |
| Middle School | 80,614 | 21.5% |
| High School | 84,087 | 22.4% |
| College / Undergraduate | 80,080 | 21.4% |
| Graduate / Professional | 17,715 | 4.7% |
| Total | 374,850 | 100.0% |
School Enrollment by Age by Funding Source in Area Code 845
Out of a total of 374,850 students who are enrolled in schools in Area Code 845, 121,644 (32.5%) attend a private institution, while the remaining 253,206 (67.5%) are enrolled in public schools. The age group of 3 to 4 year olds has the highest likelihood of being enrolled in private schools, with 14,046 (62.7% in the age bracket) enrolled. Conversely, the age group of 15 to 17 year olds has the lowest likelihood of being enrolled in a private school, with 46,661 (78.0% in the age bracket) attending a public institution.
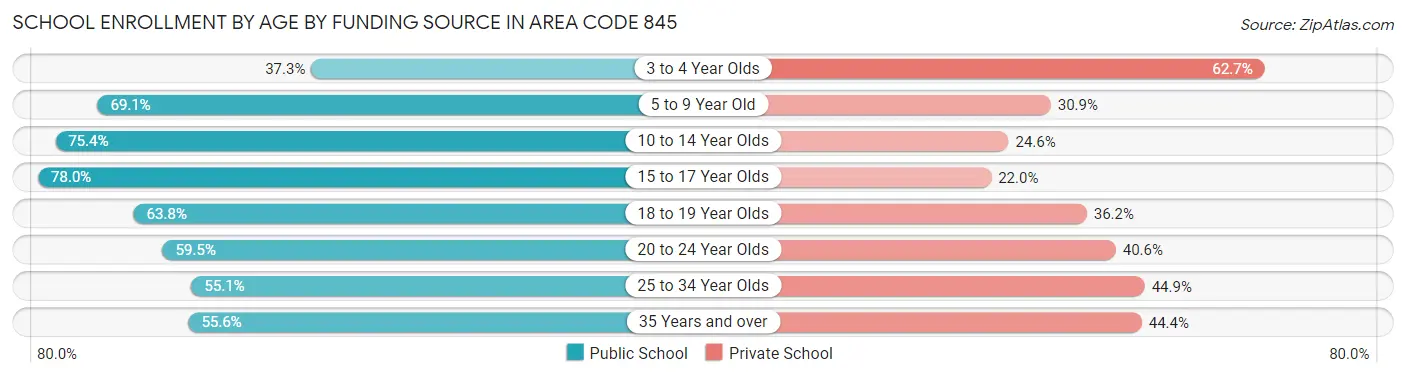
| Age Bracket | Public School | Private School |
| 3 to 4 Year Olds | 8,353 (37.3%) | 14,046 (62.7%) |
| 5 to 9 Year Old | 58,852 (69.1%) | 26,274 (30.9%) |
| 10 to 14 Year Olds | 74,901 (75.4%) | 24,401 (24.6%) |
| 15 to 17 Year Olds | 46,661 (78.0%) | 13,155 (22.0%) |
| 18 to 19 Year Olds | 20,959 (63.8%) | 11,908 (36.2%) |
| 20 to 24 Year Olds | 25,735 (59.5%) | 17,552 (40.6%) |
| 25 to 34 Year Olds | 9,275 (55.1%) | 7,547 (44.9%) |
| 35 Years and over | 8,466 (55.6%) | 6,765 (44.4%) |
| Total | 253,206 (67.5%) | 121,644 (32.5%) |
Educational Attainment by Field of Study in Area Code 845
Business (68,809 | 16.8%), education (52,245 | 12.8%), science & technology (38,747 | 9.5%), social sciences (33,798 | 8.3%), and visual & performing arts (27,387 | 6.7%) are the most common fields of study among 409,509 individuals in Area Code 845 who have obtained a bachelor's degree or higher.
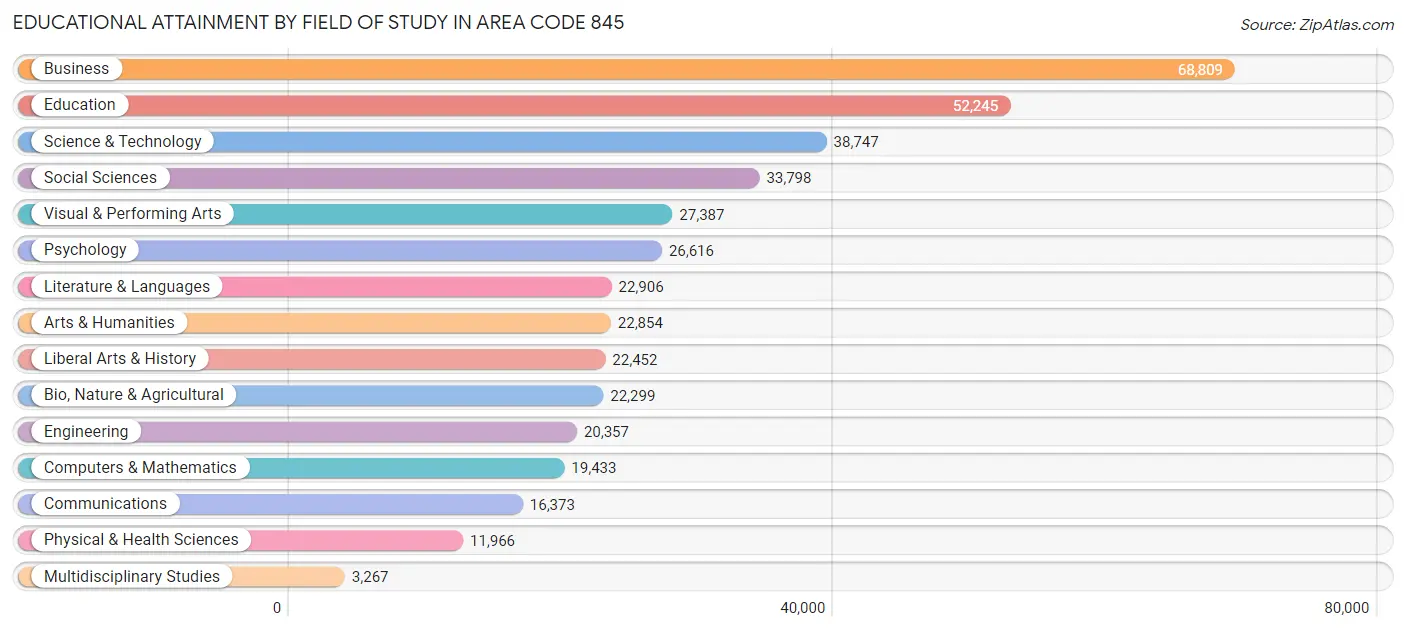
| Field of Study | # Graduates | % Graduates |
| Computers & Mathematics | 19,433 | 4.8% |
| Bio, Nature & Agricultural | 22,299 | 5.4% |
| Physical & Health Sciences | 11,966 | 2.9% |
| Psychology | 26,616 | 6.5% |
| Social Sciences | 33,798 | 8.3% |
| Engineering | 20,357 | 5.0% |
| Multidisciplinary Studies | 3,267 | 0.8% |
| Science & Technology | 38,747 | 9.5% |
| Business | 68,809 | 16.8% |
| Education | 52,245 | 12.8% |
| Literature & Languages | 22,906 | 5.6% |
| Liberal Arts & History | 22,452 | 5.5% |
| Visual & Performing Arts | 27,387 | 6.7% |
| Communications | 16,373 | 4.0% |
| Arts & Humanities | 22,854 | 5.6% |
| Total | 409,509 | 100.0% |
Transportation & Commute in Area Code 845
Vehicle Availability by Sex in Area Code 845
The most prevalent vehicle ownership categories in Area Code 845 are males with 2 vehicles (145,928, accounting for 40.7%) and females with 2 vehicles (125,840, making up 45.6%).
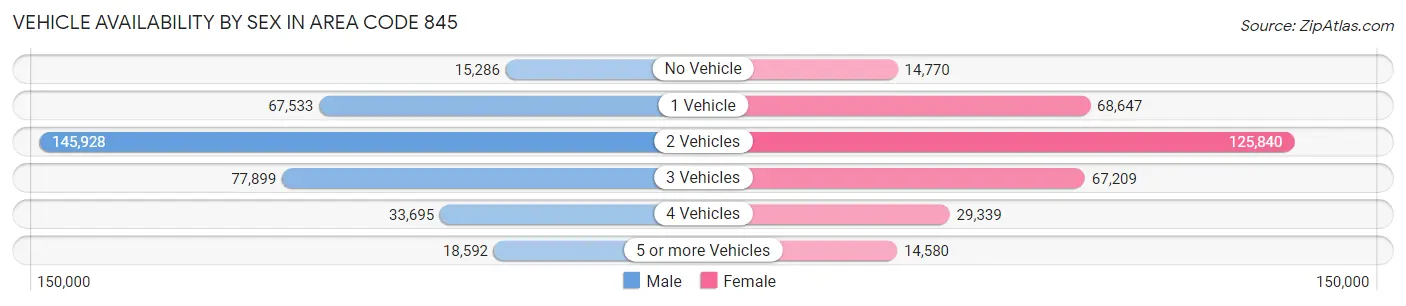
| Vehicles Available | Male | Female |
| No Vehicle | 15,286 (4.3%) | 14,770 (4.6%) |
| 1 Vehicle | 67,533 (18.8%) | 68,647 (21.4%) |
| 2 Vehicles | 145,928 (40.7%) | 125,840 (39.3%) |
| 3 Vehicles | 77,899 (21.7%) | 67,209 (21.0%) |
| 4 Vehicles | 33,695 (9.4%) | 29,339 (9.2%) |
| 5 or more Vehicles | 18,592 (5.2%) | 14,580 (4.5%) |
| Total | 358,933 (100.0%) | 320,385 (100.0%) |
Commute Time in Area Code 845
The most frequently occuring commute durations in Area Code 845 are 15 to 19 minutes (82,649 commuters, 13.6%), 10 to 14 minutes (76,518 commuters, 12.6%), and 20 to 24 minutes (70,649 commuters, 11.6%).
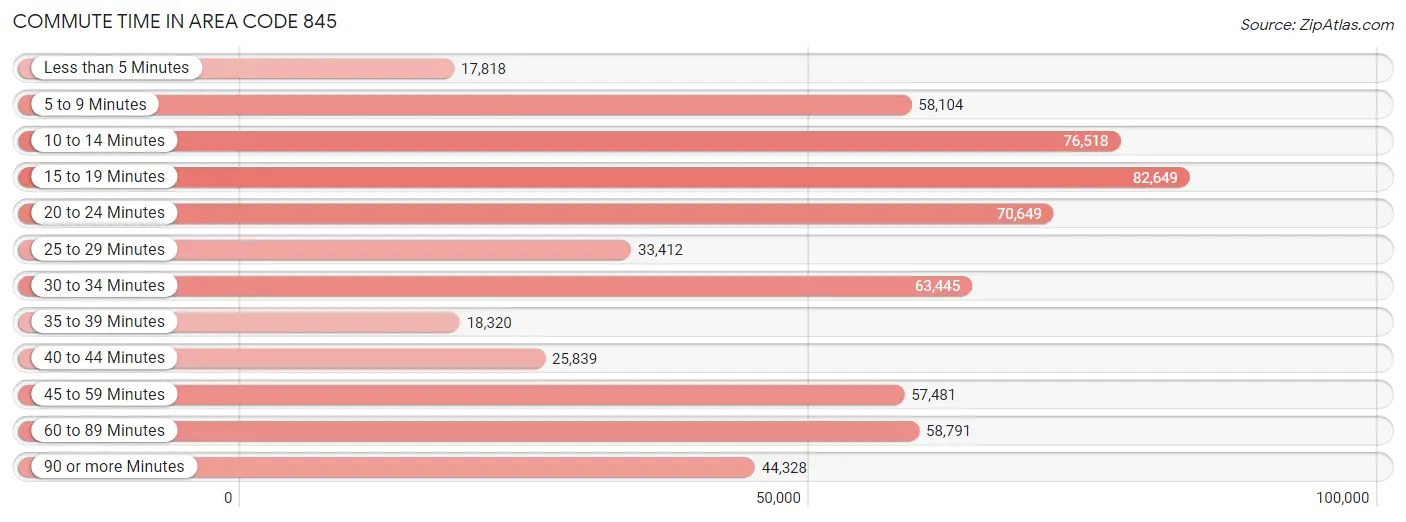
| Commute Time | # Commuters | % Commuters |
| Less than 5 Minutes | 17,818 | 2.9% |
| 5 to 9 Minutes | 58,104 | 9.6% |
| 10 to 14 Minutes | 76,518 | 12.6% |
| 15 to 19 Minutes | 82,649 | 13.6% |
| 20 to 24 Minutes | 70,649 | 11.6% |
| 25 to 29 Minutes | 33,412 | 5.5% |
| 30 to 34 Minutes | 63,445 | 10.4% |
| 35 to 39 Minutes | 18,320 | 3.0% |
| 40 to 44 Minutes | 25,839 | 4.3% |
| 45 to 59 Minutes | 57,481 | 9.5% |
| 60 to 89 Minutes | 58,791 | 9.7% |
| 90 or more Minutes | 44,328 | 7.3% |
Commute Time by Sex in Area Code 845
The most common commute times in Area Code 845 are 15 to 19 minutes (39,833 commuters, 12.3%) for males and 15 to 19 minutes (42,816 commuters, 15.0%) for females.
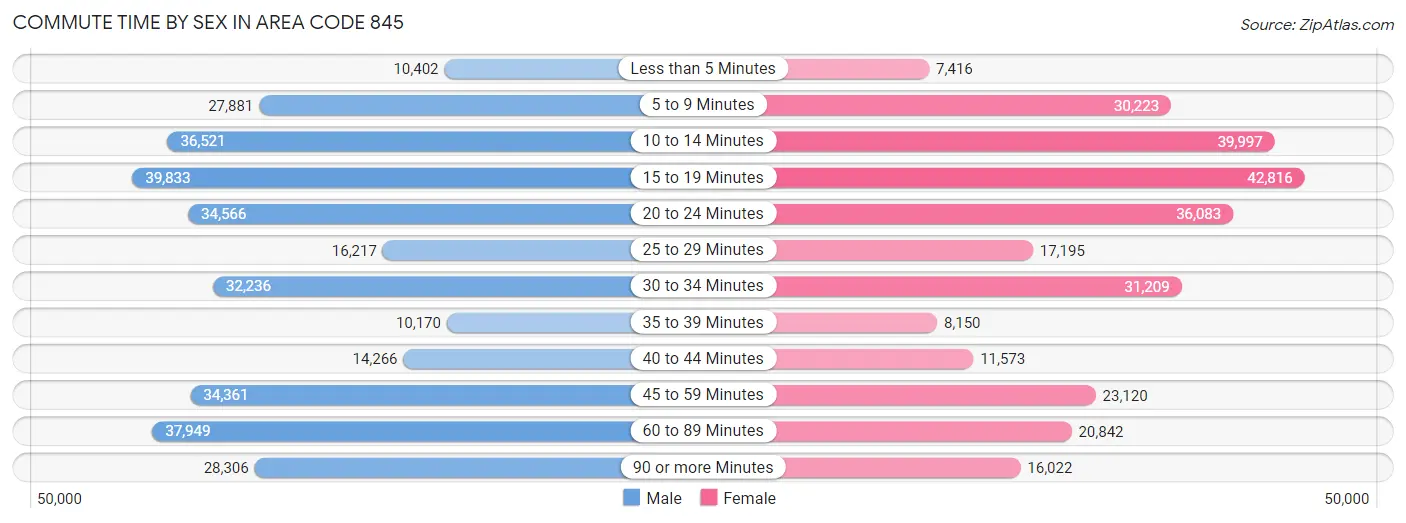
| Commute Time | Male | Female |
| Less than 5 Minutes | 10,402 (3.2%) | 7,416 (2.6%) |
| 5 to 9 Minutes | 27,881 (8.6%) | 30,223 (10.6%) |
| 10 to 14 Minutes | 36,521 (11.3%) | 39,997 (14.1%) |
| 15 to 19 Minutes | 39,833 (12.3%) | 42,816 (15.0%) |
| 20 to 24 Minutes | 34,566 (10.7%) | 36,083 (12.7%) |
| 25 to 29 Minutes | 16,217 (5.0%) | 17,195 (6.0%) |
| 30 to 34 Minutes | 32,236 (10.0%) | 31,209 (11.0%) |
| 35 to 39 Minutes | 10,170 (3.2%) | 8,150 (2.9%) |
| 40 to 44 Minutes | 14,266 (4.4%) | 11,573 (4.1%) |
| 45 to 59 Minutes | 34,361 (10.6%) | 23,120 (8.1%) |
| 60 to 89 Minutes | 37,949 (11.8%) | 20,842 (7.3%) |
| 90 or more Minutes | 28,306 (8.8%) | 16,022 (5.6%) |
Time of Departure to Work by Sex in Area Code 845
The most frequent times of departure to work in Area Code 845 are 7:00 AM to 7:29 AM (41,573, 12.9%) for males and 8:00 AM to 8:29 AM (40,366, 14.2%) for females.
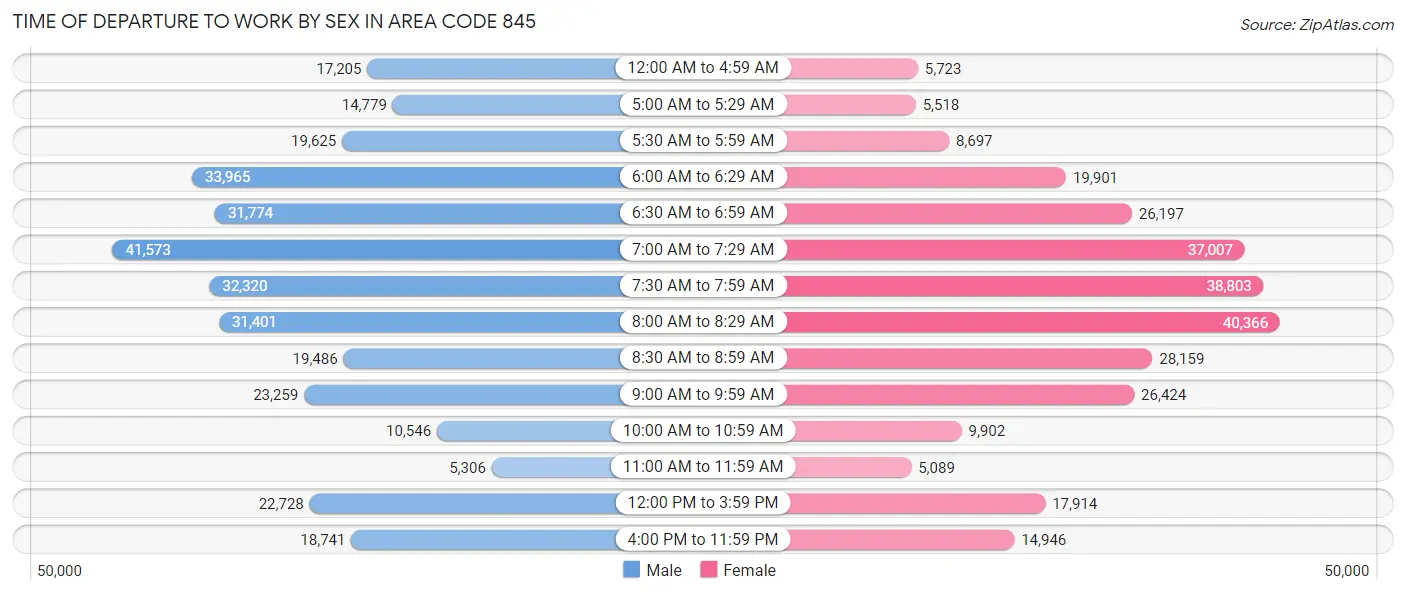
| Time of Departure | Male | Female |
| 12:00 AM to 4:59 AM | 17,205 (5.3%) | 5,723 (2.0%) |
| 5:00 AM to 5:29 AM | 14,779 (4.6%) | 5,518 (1.9%) |
| 5:30 AM to 5:59 AM | 19,625 (6.1%) | 8,697 (3.1%) |
| 6:00 AM to 6:29 AM | 33,965 (10.5%) | 19,901 (7.0%) |
| 6:30 AM to 6:59 AM | 31,774 (9.9%) | 26,197 (9.2%) |
| 7:00 AM to 7:29 AM | 41,573 (12.9%) | 37,007 (13.0%) |
| 7:30 AM to 7:59 AM | 32,320 (10.0%) | 38,803 (13.6%) |
| 8:00 AM to 8:29 AM | 31,401 (9.7%) | 40,366 (14.2%) |
| 8:30 AM to 8:59 AM | 19,486 (6.0%) | 28,159 (9.9%) |
| 9:00 AM to 9:59 AM | 23,259 (7.2%) | 26,424 (9.3%) |
| 10:00 AM to 10:59 AM | 10,546 (3.3%) | 9,902 (3.5%) |
| 11:00 AM to 11:59 AM | 5,306 (1.6%) | 5,089 (1.8%) |
| 12:00 PM to 3:59 PM | 22,728 (7.0%) | 17,914 (6.3%) |
| 4:00 PM to 11:59 PM | 18,741 (5.8%) | 14,946 (5.2%) |
| Total | 322,708 (100.0%) | 284,646 (100.0%) |
Housing Occupancy in Area Code 845
Occupancy by Ownership in Area Code 845
Of the total 525,688 dwellings in Area Code 845, owner-occupied units account for 362,795 (69.0%), while renter-occupied units make up 162,893 (31.0%).
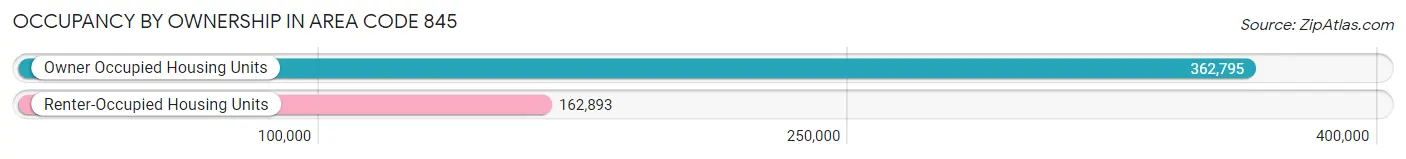
| Occupancy | # Housing Units | % Housing Units |
| Owner Occupied Housing Units | 362,795 | 69.0% |
| Renter-Occupied Housing Units | 162,893 | 31.0% |
| Total Occupied Housing Units | 525,688 | 100.0% |
Occupancy by Household Size in Area Code 845
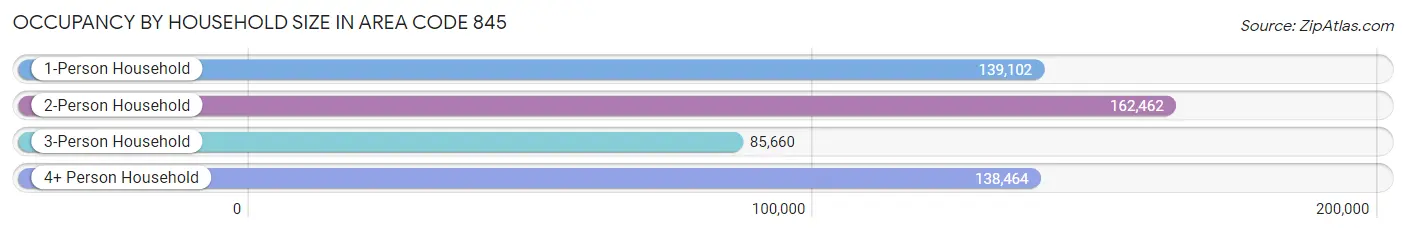
| Household Size | # Housing Units | % Housing Units |
| 1-Person Household | 139,102 | 26.5% |
| 2-Person Household | 162,462 | 30.9% |
| 3-Person Household | 85,660 | 16.3% |
| 4+ Person Household | 138,464 | 26.3% |
| Total Housing Units | 525,688 | 100.0% |
Occupancy by Ownership by Household Size in Area Code 845
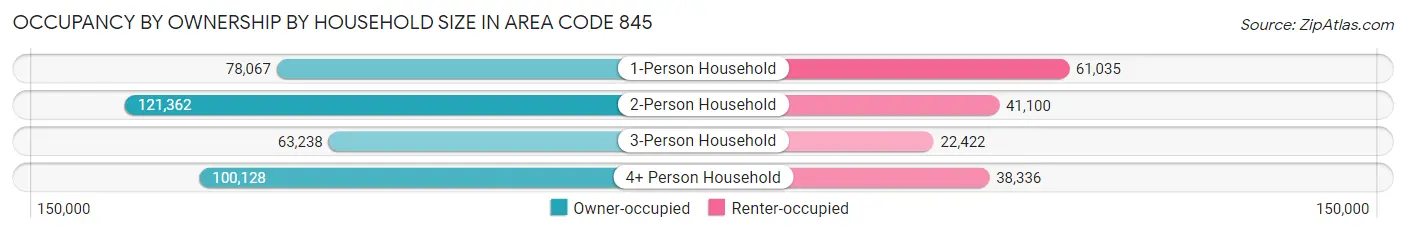
| Household Size | Owner-occupied | Renter-occupied |
| 1-Person Household | 78,067 (56.1%) | 61,035 (43.9%) |
| 2-Person Household | 121,362 (74.7%) | 41,100 (25.3%) |
| 3-Person Household | 63,238 (73.8%) | 22,422 (26.2%) |
| 4+ Person Household | 100,128 (72.3%) | 38,336 (27.7%) |
| Total Housing Units | 362,795 (69.0%) | 162,893 (31.0%) |
Occupancy by Educational Attainment in Area Code 845
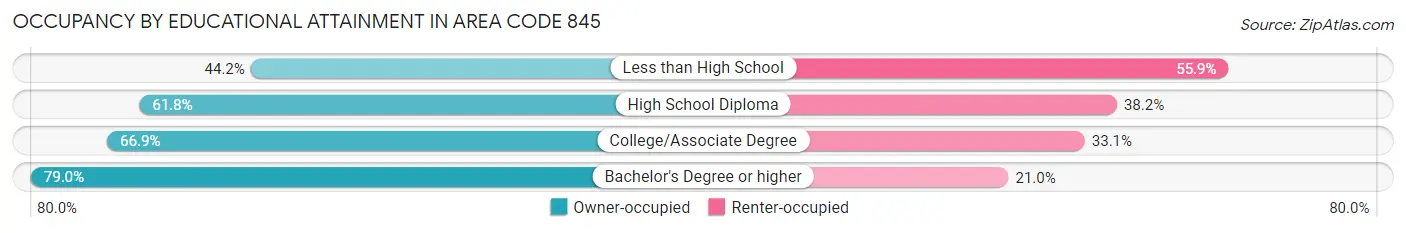
| Household Size | Owner-occupied | Renter-occupied |
| Less than High School | 17,494 (44.2%) | 22,131 (55.8%) |
| High School Diploma | 72,896 (61.8%) | 45,065 (38.2%) |
| College/Associate Degree | 101,726 (66.9%) | 50,340 (33.1%) |
| Bachelor's Degree or higher | 170,679 (79.0%) | 45,357 (21.0%) |
Occupancy by Age of Householder in Area Code 845
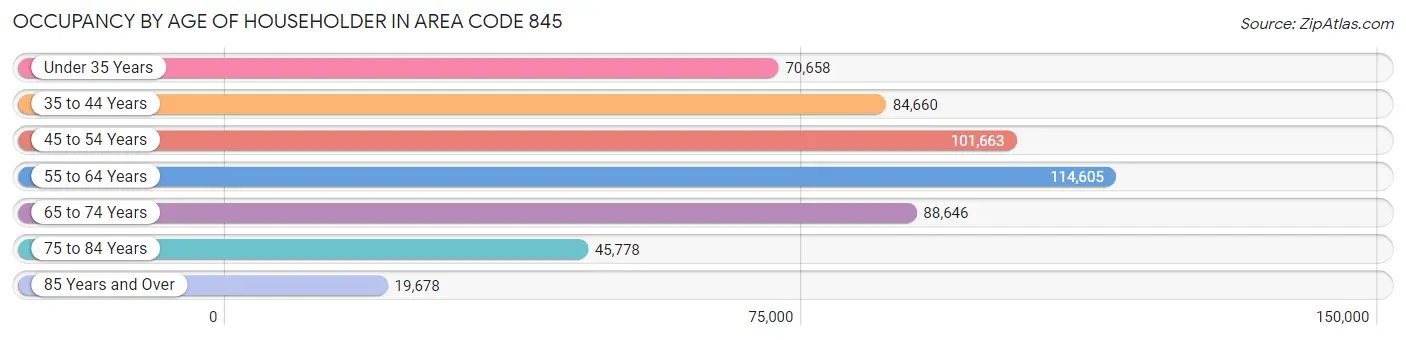
| Age Bracket | # Households | % Households |
| Under 35 Years | 70,658 | 13.4% |
| 35 to 44 Years | 84,660 | 16.1% |
| 45 to 54 Years | 101,663 | 19.3% |
| 55 to 64 Years | 114,605 | 21.8% |
| 65 to 74 Years | 88,646 | 16.9% |
| 75 to 84 Years | 45,778 | 8.7% |
| 85 Years and Over | 19,678 | 3.7% |
| Total | 525,688 | 100.0% |
Housing Finances in Area Code 845
Median Income by Occupancy in Area Code 845
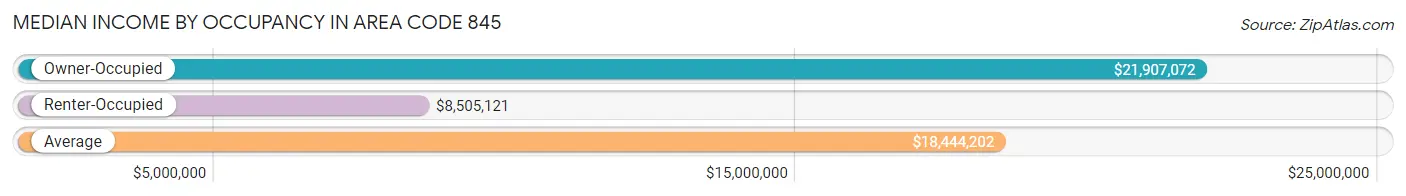
| Occupancy Type | # Households | Median Income |
| Owner-Occupied | 362,795 (69.0%) | $21,907,072 |
| Renter-Occupied | 162,893 (31.0%) | $8,505,121 |
| Average | 525,688 (100.0%) | $18,444,202 |
Occupancy by Householder Income Bracket in Area Code 845
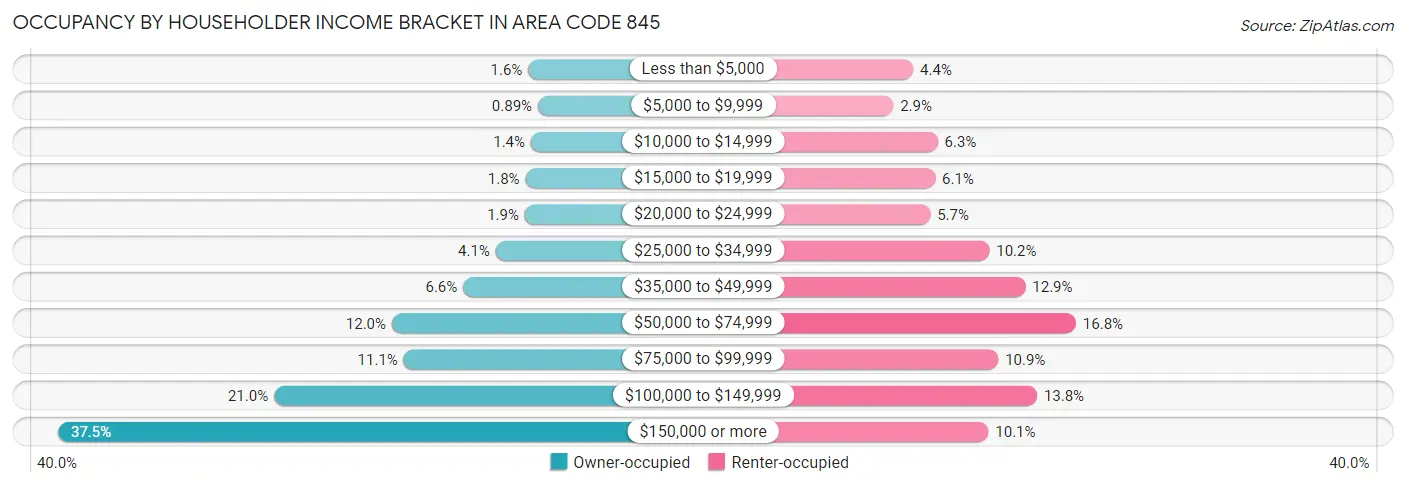
| Income Bracket | Owner-occupied | Renter-occupied |
| Less than $5,000 | 5,927 (1.6%) | 7,146 (4.4%) |
| $5,000 to $9,999 | 3,229 (0.9%) | 4,682 (2.9%) |
| $10,000 to $14,999 | 5,179 (1.4%) | 10,186 (6.2%) |
| $15,000 to $19,999 | 6,687 (1.8%) | 9,869 (6.1%) |
| $20,000 to $24,999 | 6,866 (1.9%) | 9,263 (5.7%) |
| $25,000 to $34,999 | 14,902 (4.1%) | 16,602 (10.2%) |
| $35,000 to $49,999 | 23,913 (6.6%) | 21,080 (12.9%) |
| $50,000 to $74,999 | 43,619 (12.0%) | 27,348 (16.8%) |
| $75,000 to $99,999 | 40,347 (11.1%) | 17,714 (10.9%) |
| $100,000 to $149,999 | 76,174 (21.0%) | 22,517 (13.8%) |
| $150,000 or more | 135,952 (37.5%) | 16,486 (10.1%) |
| Total | 362,795 (100.0%) | 162,893 (100.0%) |
Monthly Housing Cost Tiers in Area Code 845
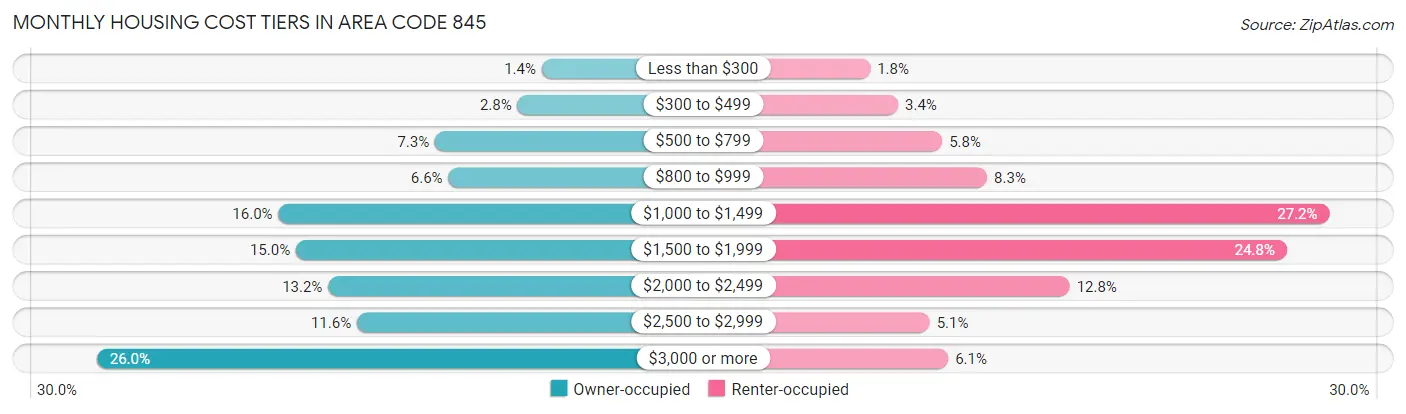
| Monthly Cost | Owner-occupied | Renter-occupied |
| Less than $300 | 5,197 (1.4%) | 2,948 (1.8%) |
| $300 to $499 | 10,062 (2.8%) | 5,461 (3.4%) |
| $500 to $799 | 26,593 (7.3%) | 9,436 (5.8%) |
| $800 to $999 | 23,906 (6.6%) | 13,467 (8.3%) |
| $1,000 to $1,499 | 57,987 (16.0%) | 44,265 (27.2%) |
| $1,500 to $1,999 | 54,468 (15.0%) | 40,426 (24.8%) |
| $2,000 to $2,499 | 48,007 (13.2%) | 20,901 (12.8%) |
| $2,500 to $2,999 | 42,227 (11.6%) | 8,309 (5.1%) |
| $3,000 or more | 94,348 (26.0%) | 9,971 (6.1%) |
| Total | 362,795 (100.0%) | 162,893 (100.0%) |
Physical Housing Characteristics in Area Code 845
Housing Structures in Area Code 845
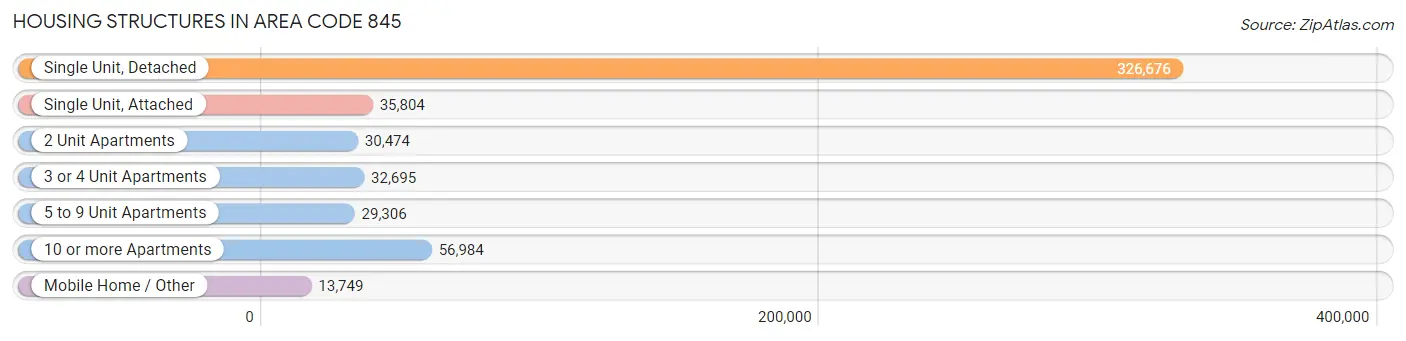
| Structure Type | # Housing Units | % Housing Units |
| Single Unit, Detached | 326,676 | 62.1% |
| Single Unit, Attached | 35,804 | 6.8% |
| 2 Unit Apartments | 30,474 | 5.8% |
| 3 or 4 Unit Apartments | 32,695 | 6.2% |
| 5 to 9 Unit Apartments | 29,306 | 5.6% |
| 10 or more Apartments | 56,984 | 10.8% |
| Mobile Home / Other | 13,749 | 2.6% |
| Total | 525,688 | 100.0% |
Housing Structures by Occupancy in Area Code 845
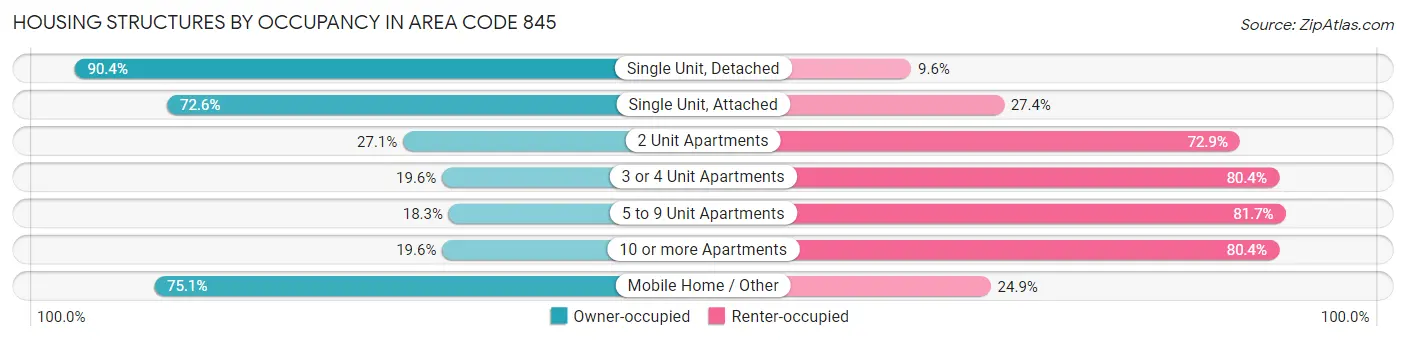
| Structure Type | Owner-occupied | Renter-occupied |
| Single Unit, Detached | 295,281 (90.4%) | 31,395 (9.6%) |
| Single Unit, Attached | 25,981 (72.6%) | 9,823 (27.4%) |
| 2 Unit Apartments | 8,265 (27.1%) | 22,209 (72.9%) |
| 3 or 4 Unit Apartments | 6,413 (19.6%) | 26,282 (80.4%) |
| 5 to 9 Unit Apartments | 5,369 (18.3%) | 23,937 (81.7%) |
| 10 or more Apartments | 11,164 (19.6%) | 45,820 (80.4%) |
| Mobile Home / Other | 10,322 (75.1%) | 3,427 (24.9%) |
| Total | 362,795 (69.0%) | 162,893 (31.0%) |
Housing Structures by Number of Rooms in Area Code 845
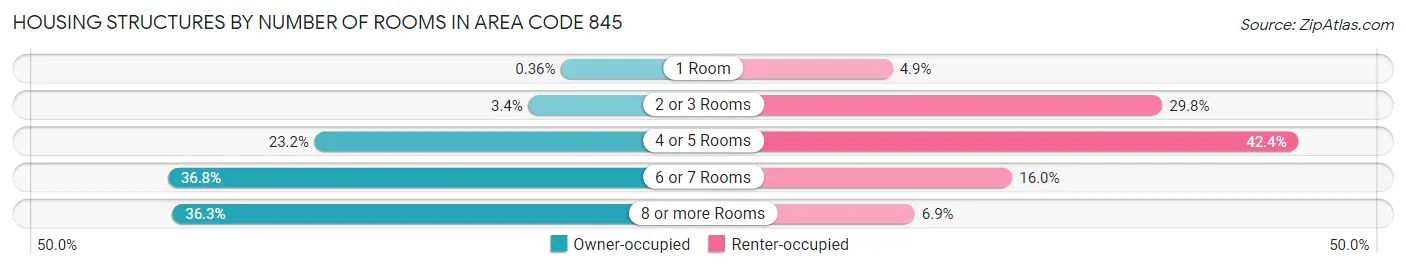
| Number of Rooms | Owner-occupied | Renter-occupied |
| 1 Room | 1,321 (0.4%) | 7,946 (4.9%) |
| 2 or 3 Rooms | 12,282 (3.4%) | 48,580 (29.8%) |
| 4 or 5 Rooms | 84,036 (23.2%) | 69,086 (42.4%) |
| 6 or 7 Rooms | 133,324 (36.7%) | 25,985 (16.0%) |
| 8 or more Rooms | 131,832 (36.3%) | 11,296 (6.9%) |
| Total | 362,795 (100.0%) | 162,893 (100.0%) |
Housing Structure by Heating Type in Area Code 845
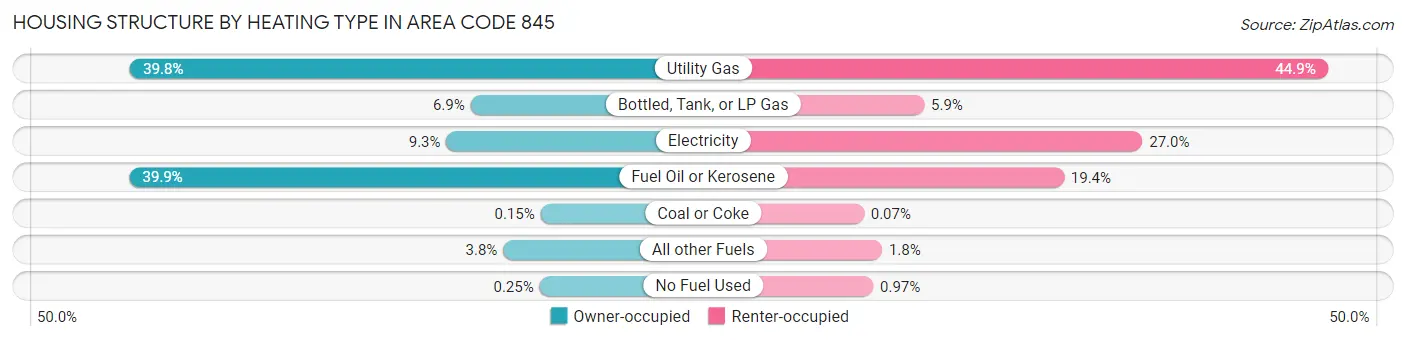
| Heating Type | Owner-occupied | Renter-occupied |
| Utility Gas | 144,433 (39.8%) | 73,085 (44.9%) |
| Bottled, Tank, or LP Gas | 25,064 (6.9%) | 9,606 (5.9%) |
| Electricity | 33,543 (9.2%) | 43,942 (27.0%) |
| Fuel Oil or Kerosene | 144,656 (39.9%) | 31,598 (19.4%) |
| Coal or Coke | 551 (0.2%) | 106 (0.1%) |
| All other Fuels | 13,629 (3.8%) | 2,981 (1.8%) |
| No Fuel Used | 919 (0.3%) | 1,575 (1.0%) |
| Total | 362,795 (100.0%) | 162,893 (100.0%) |
Household Vehicle Usage in Area Code 845
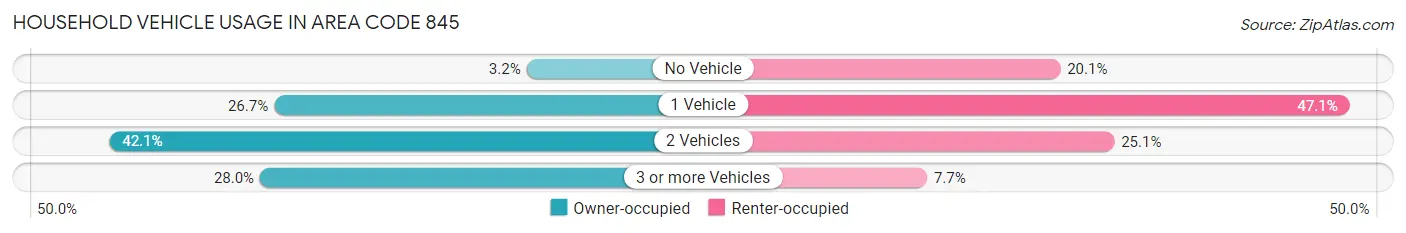
| Vehicles per Household | Owner-occupied | Renter-occupied |
| No Vehicle | 11,444 (3.2%) | 32,734 (20.1%) |
| 1 Vehicle | 96,956 (26.7%) | 76,727 (47.1%) |
| 2 Vehicles | 152,704 (42.1%) | 40,954 (25.1%) |
| 3 or more Vehicles | 101,691 (28.0%) | 12,478 (7.7%) |
| Total | 362,795 (100.0%) | 162,893 (100.0%) |
Real Estate & Mortgages in Area Code 845
Real Estate and Mortgage Overview in Area Code 845
| Characteristic | Without Mortgage | With Mortgage |
| Housing Units | 136,070 | 226,725 |
| Median Property Value | $60,332,700 | $67,416,200 |
| Median Household Income | $15,158,350 | $99,993 |
| Monthly Housing Costs | $187,756 | $91,162 |
| Real Estate Taxes | $1,211,037 | $4,901 |
Property Value by Mortgage Status in Area Code 845
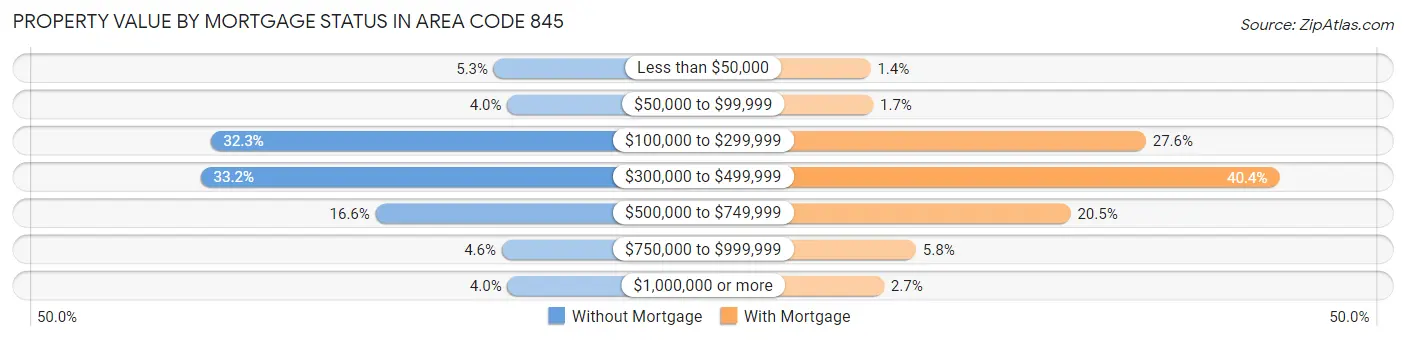
| Property Value | Without Mortgage | With Mortgage |
| Less than $50,000 | 7,230 (5.3%) | 3,223 (1.4%) |
| $50,000 to $99,999 | 5,472 (4.0%) | 3,793 (1.7%) |
| $100,000 to $299,999 | 43,954 (32.3%) | 62,663 (27.6%) |
| $300,000 to $499,999 | 45,210 (33.2%) | 91,474 (40.4%) |
| $500,000 to $749,999 | 22,545 (16.6%) | 46,418 (20.5%) |
| $750,000 to $999,999 | 6,197 (4.5%) | 13,043 (5.8%) |
| $1,000,000 or more | 5,462 (4.0%) | 6,111 (2.7%) |
| Total | 136,070 (100.0%) | 226,725 (100.0%) |
Household Income by Mortgage Status in Area Code 845
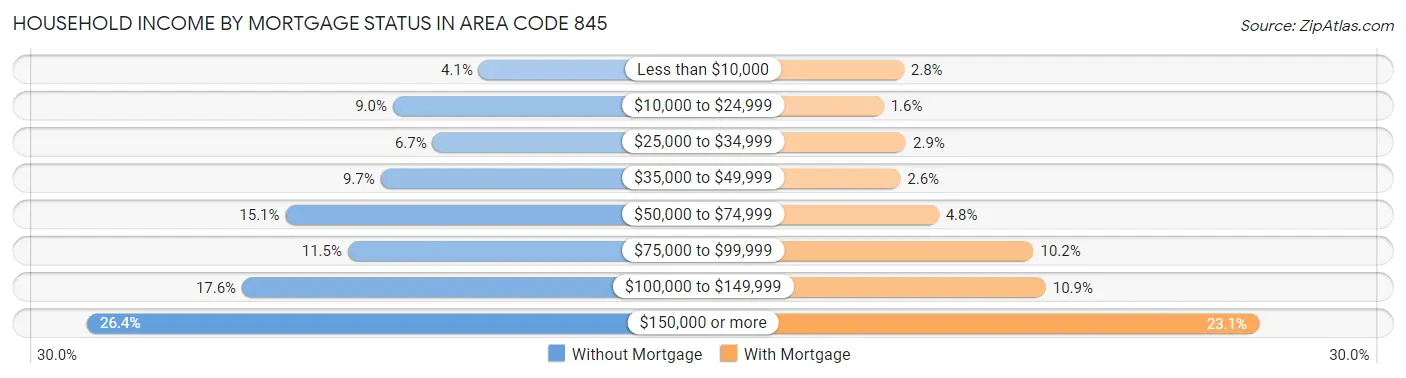
| Household Income | Without Mortgage | With Mortgage |
| Less than $10,000 | 5,509 (4.1%) | 6,268 (2.8%) |
| $10,000 to $24,999 | 12,187 (9.0%) | 3,647 (1.6%) |
| $25,000 to $34,999 | 9,105 (6.7%) | 6,545 (2.9%) |
| $35,000 to $49,999 | 13,147 (9.7%) | 5,797 (2.6%) |
| $50,000 to $74,999 | 20,553 (15.1%) | 10,766 (4.8%) |
| $75,000 to $99,999 | 15,694 (11.5%) | 23,066 (10.2%) |
| $100,000 to $149,999 | 23,916 (17.6%) | 24,653 (10.9%) |
| $150,000 or more | 35,959 (26.4%) | 52,258 (23.1%) |
| Total | 136,070 (100.0%) | 226,725 (100.0%) |
Property Value to Household Income Ratio in Area Code 845
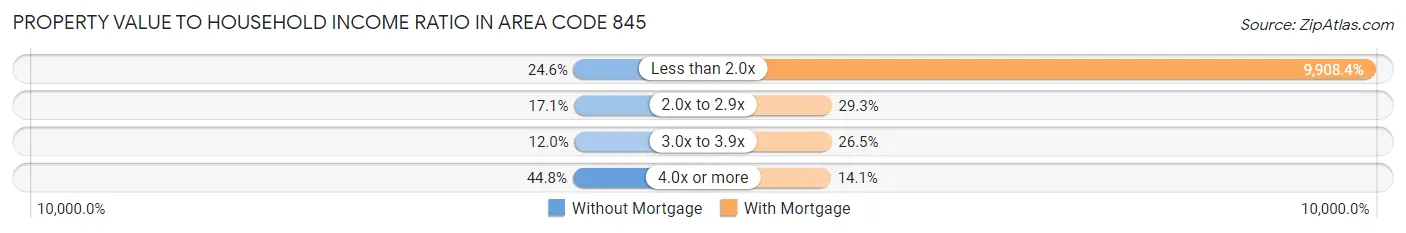
| Value-to-Income Ratio | Without Mortgage | With Mortgage |
| Less than 2.0x | 33,454 (24.6%) | 22,464,891 (9,908.4%) |
| 2.0x to 2.9x | 23,284 (17.1%) | 66,440 (29.3%) |
| 3.0x to 3.9x | 16,306 (12.0%) | 60,153 (26.5%) |
| 4.0x or more | 60,910 (44.8%) | 31,926 (14.1%) |
| Total | 136,070 (100.0%) | 226,725 (100.0%) |
Real Estate Taxes by Mortgage Status in Area Code 845
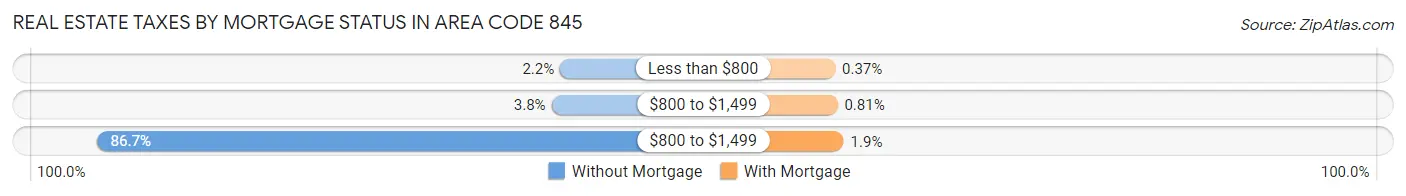
| Property Taxes | Without Mortgage | With Mortgage |
| Less than $800 | 2,999 (2.2%) | 847 (0.4%) |
| $800 to $1,499 | 5,132 (3.8%) | 1,841 (0.8%) |
| $800 to $1,499 | 117,904 (86.7%) | 4,389 (1.9%) |
| Total | 136,070 (100.0%) | 226,725 (100.0%) |
Health & Disability in Area Code 845
Health Insurance Coverage by Age in Area Code 845
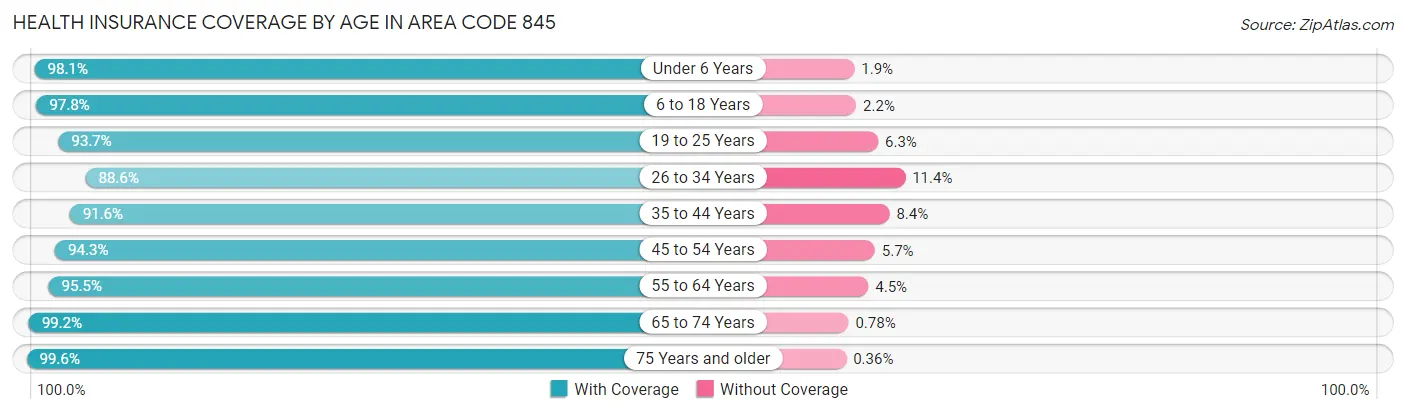
| Age Bracket | With Coverage | Without Coverage |
| Under 6 Years | 105,191 (98.1%) | 2,004 (1.9%) |
| 6 to 18 Years | 249,067 (97.8%) | 5,634 (2.2%) |
| 19 to 25 Years | 125,058 (93.7%) | 8,404 (6.3%) |
| 26 to 34 Years | 138,630 (88.6%) | 17,765 (11.4%) |
| 35 to 44 Years | 159,963 (91.6%) | 14,716 (8.4%) |
| 45 to 54 Years | 178,808 (94.3%) | 10,802 (5.7%) |
| 55 to 64 Years | 193,905 (95.5%) | 9,085 (4.5%) |
| 65 to 74 Years | 141,874 (99.2%) | 1,110 (0.8%) |
| 75 Years and older | 101,567 (99.6%) | 367 (0.4%) |
| Total | 1,394,063 (95.2%) | 69,887 (4.8%) |
Health Insurance Coverage by Citizenship Status in Area Code 845
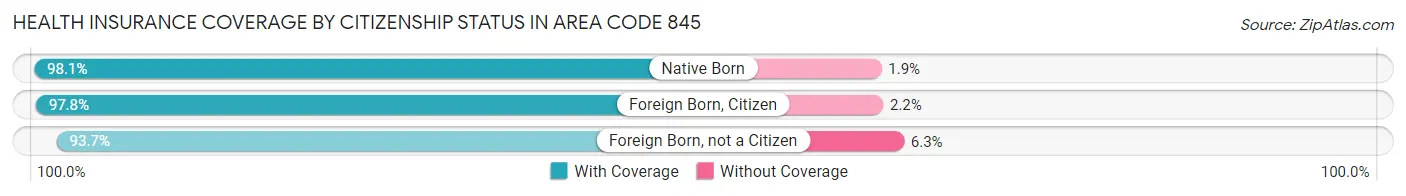
| Citizenship Status | With Coverage | Without Coverage |
| Native Born | 105,191 (98.1%) | 2,004 (1.9%) |
| Foreign Born, Citizen | 249,067 (97.8%) | 5,634 (2.2%) |
| Foreign Born, not a Citizen | 125,058 (93.7%) | 8,404 (6.3%) |
Health Insurance Coverage by Household Income in Area Code 845
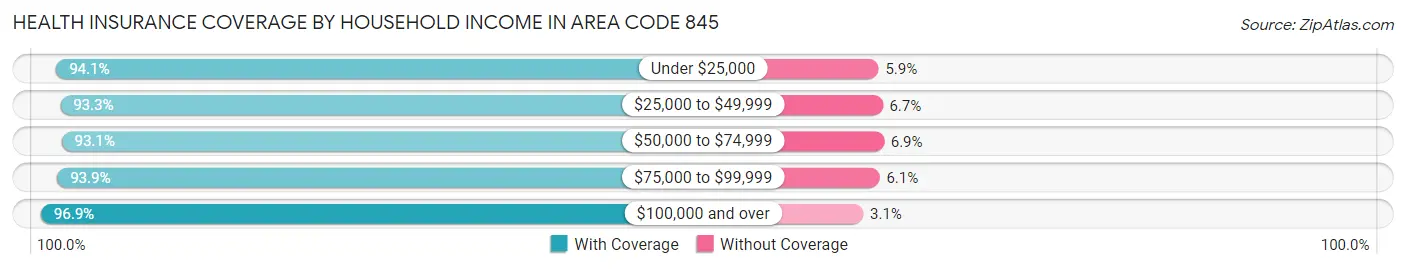
| Household Income | With Coverage | Without Coverage |
| Under $25,000 | 122,103 (94.1%) | 7,695 (5.9%) |
| $25,000 to $49,999 | 158,922 (93.3%) | 11,379 (6.7%) |
| $50,000 to $74,999 | 161,644 (93.1%) | 12,027 (6.9%) |
| $75,000 to $99,999 | 145,084 (93.9%) | 9,465 (6.1%) |
| $100,000 and over | 776,573 (96.9%) | 24,547 (3.1%) |
Public vs Private Health Insurance Coverage by Age in Area Code 845
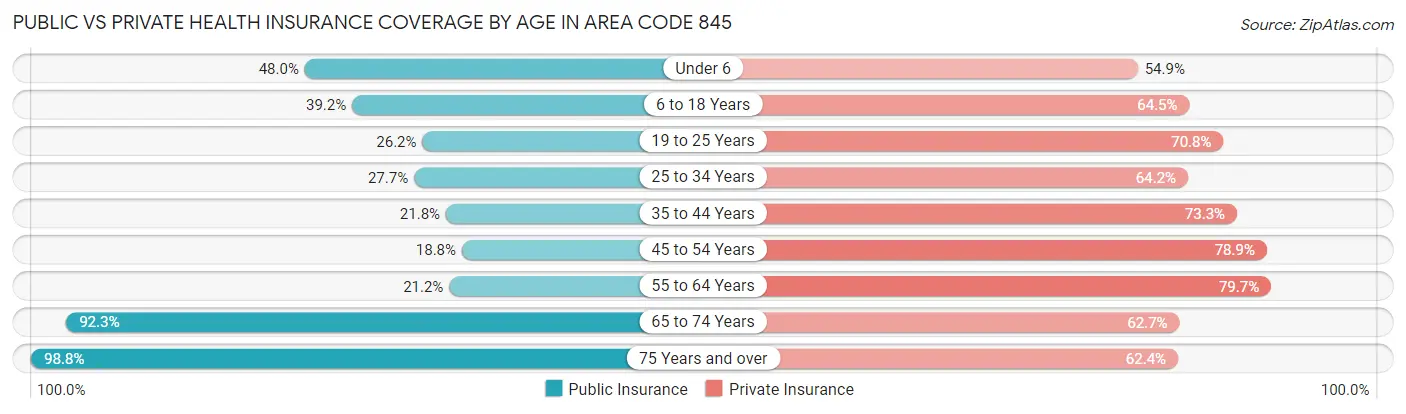
| Age Bracket | Public Insurance | Private Insurance |
| Under 6 | 51,453 (48.0%) | 58,877 (54.9%) |
| 6 to 18 Years | 99,898 (39.2%) | 164,304 (64.5%) |
| 19 to 25 Years | 34,928 (26.2%) | 94,491 (70.8%) |
| 25 to 34 Years | 43,360 (27.7%) | 100,467 (64.2%) |
| 35 to 44 Years | 38,081 (21.8%) | 128,102 (73.3%) |
| 45 to 54 Years | 35,726 (18.8%) | 149,548 (78.9%) |
| 55 to 64 Years | 43,019 (21.2%) | 161,694 (79.7%) |
| 65 to 74 Years | 131,938 (92.3%) | 89,610 (62.7%) |
| 75 Years and over | 100,704 (98.8%) | 63,585 (62.4%) |
| Total | 579,107 (39.6%) | 1,010,678 (69.0%) |
Disability Status by Sex by Age in Area Code 845
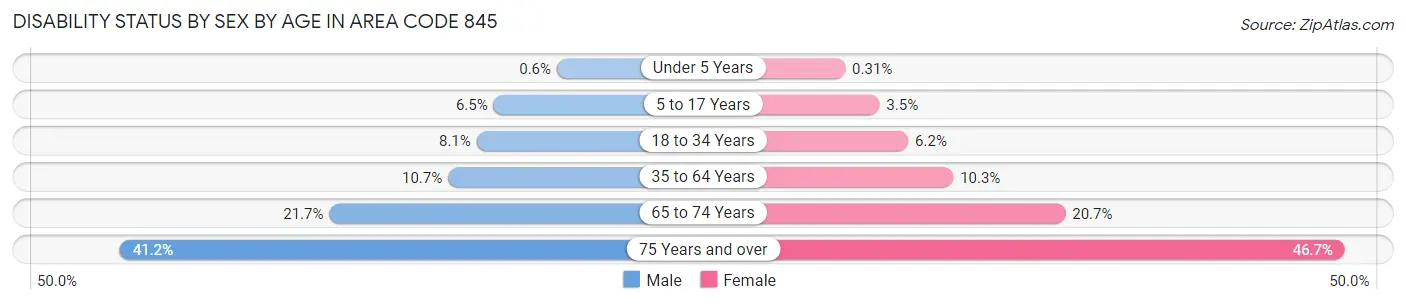
| Age Bracket | Male | Female |
| Under 5 Years | 268 (0.6%) | 135 (0.3%) |
| 5 to 17 Years | 8,328 (6.5%) | 4,261 (3.5%) |
| 18 to 34 Years | 12,834 (8.1%) | 9,398 (6.2%) |
| 35 to 64 Years | 30,162 (10.7%) | 29,514 (10.3%) |
| 65 to 74 Years | 14,717 (21.7%) | 15,597 (20.7%) |
| 75 Years and over | 17,218 (41.2%) | 28,056 (46.7%) |
Disability Class by Sex by Age in Area Code 845
Disability Class: Hearing Difficulty
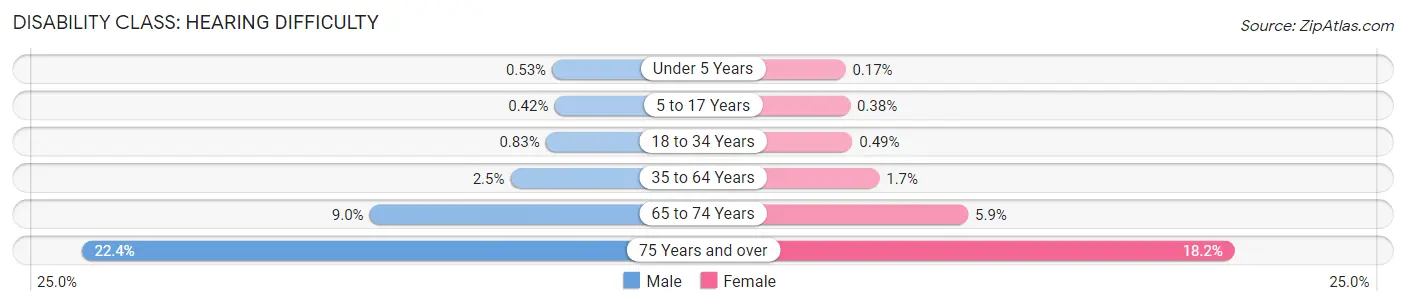
| Age Bracket | Male | Female |
| Under 5 Years | 237 (0.5%) | 74 (0.2%) |
| 5 to 17 Years | 538 (0.4%) | 466 (0.4%) |
| 18 to 34 Years | 1,320 (0.8%) | 746 (0.5%) |
| 35 to 64 Years | 6,931 (2.5%) | 4,963 (1.7%) |
| 65 to 74 Years | 6,101 (9.0%) | 4,404 (5.9%) |
| 75 Years and over | 9,355 (22.4%) | 10,958 (18.2%) |
Disability Class: Vision Difficulty
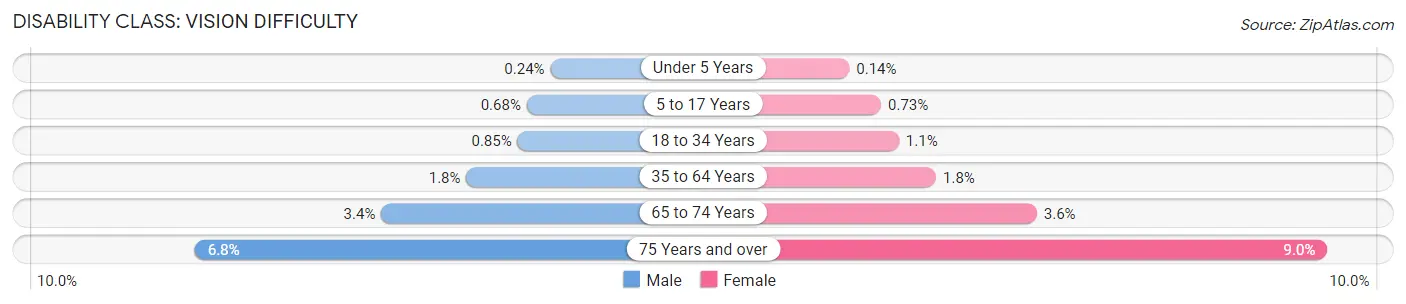
| Age Bracket | Male | Female |
| Under 5 Years | 108 (0.2%) | 61 (0.1%) |
| 5 to 17 Years | 869 (0.7%) | 890 (0.7%) |
| 18 to 34 Years | 1,352 (0.9%) | 1,621 (1.1%) |
| 35 to 64 Years | 5,061 (1.8%) | 5,002 (1.8%) |
| 65 to 74 Years | 2,291 (3.4%) | 2,723 (3.6%) |
| 75 Years and over | 2,861 (6.8%) | 5,417 (9.0%) |
Disability Class: Cognitive Difficulty
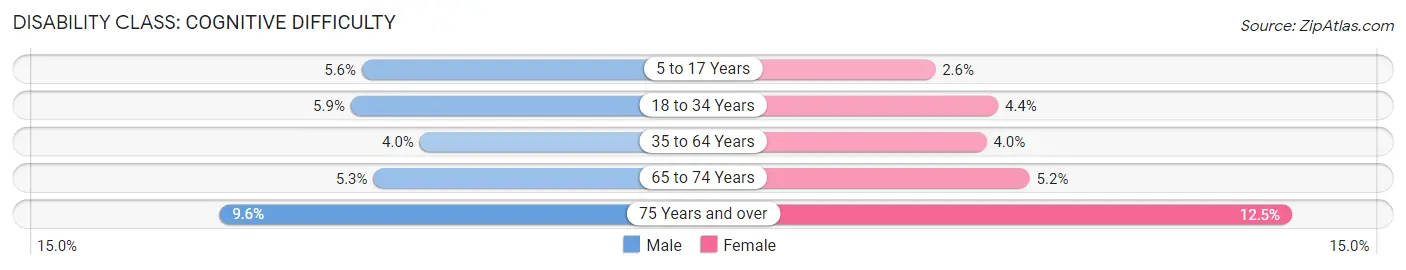
| Age Bracket | Male | Female |
| 5 to 17 Years | 7,212 (5.6%) | 3,169 (2.6%) |
| 18 to 34 Years | 9,439 (5.9%) | 6,641 (4.3%) |
| 35 to 64 Years | 11,283 (4.0%) | 11,516 (4.0%) |
| 65 to 74 Years | 3,588 (5.3%) | 3,933 (5.2%) |
| 75 Years and over | 4,008 (9.6%) | 7,529 (12.5%) |
Disability Class: Ambulatory Difficulty
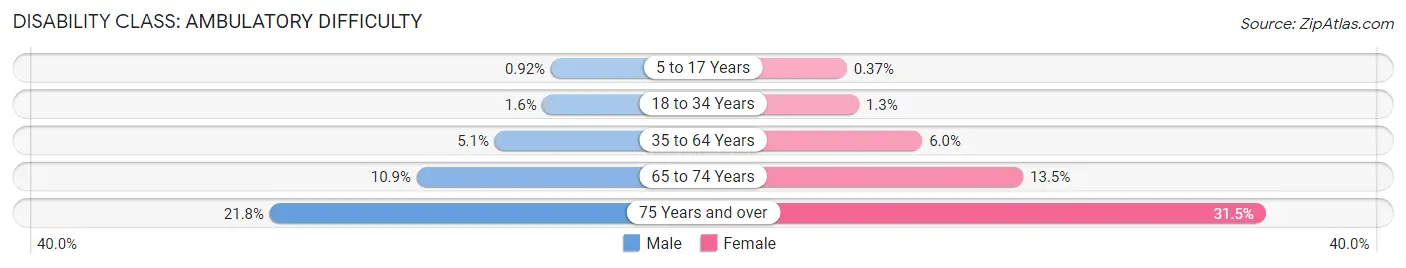
| Age Bracket | Male | Female |
| 5 to 17 Years | 1,188 (0.9%) | 450 (0.4%) |
| 18 to 34 Years | 2,465 (1.5%) | 1,946 (1.3%) |
| 35 to 64 Years | 14,351 (5.1%) | 17,050 (6.0%) |
| 65 to 74 Years | 7,375 (10.9%) | 10,121 (13.5%) |
| 75 Years and over | 9,117 (21.8%) | 18,912 (31.5%) |
Disability Class: Self-Care Difficulty
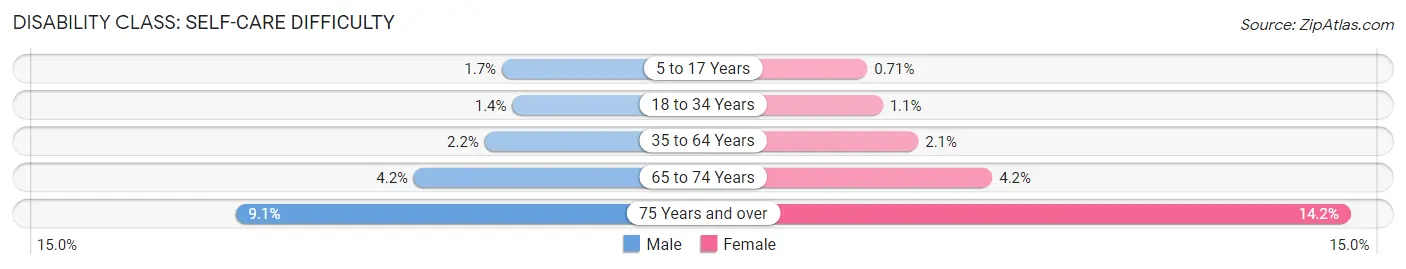
| Age Bracket | Male | Female |
| 5 to 17 Years | 2,197 (1.7%) | 868 (0.7%) |
| 18 to 34 Years | 2,268 (1.4%) | 1,744 (1.1%) |
| 35 to 64 Years | 6,160 (2.2%) | 6,087 (2.1%) |
| 65 to 74 Years | 2,818 (4.2%) | 3,155 (4.2%) |
| 75 Years and over | 3,818 (9.1%) | 8,514 (14.2%) |
Technology Access in Area Code 845
Computing Device Access in Area Code 845
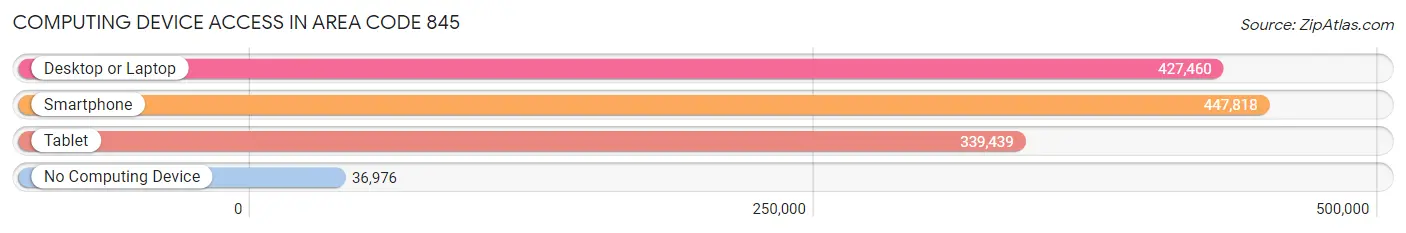
| Device Type | # Households | % Households |
| Desktop or Laptop | 427,460 | 81.3% |
| Smartphone | 447,818 | 85.2% |
| Tablet | 339,439 | 64.6% |
| No Computing Device | 36,976 | 7.0% |
| Total | 525,688 | 100.0% |
Internet Access in Area Code 845
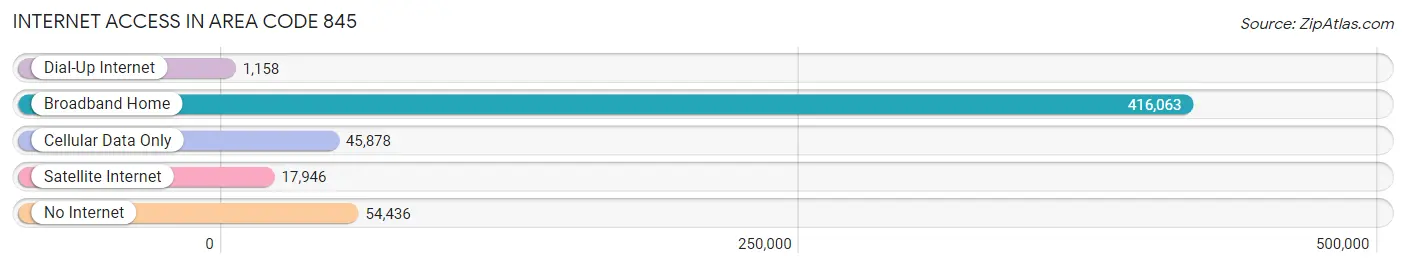
| Internet Type | # Households | % Households |
| Dial-Up Internet | 1,158 | 0.2% |
| Broadband Home | 416,063 | 79.1% |
| Cellular Data Only | 45,878 | 8.7% |
| Satellite Internet | 17,946 | 3.4% |
| No Internet | 54,436 | 10.4% |
| Total | 525,688 | 100.0% |
Area Code 845 Summary
Geography
Area code 845 is located in the state of New York and covers the Hudson Valley region, including the counties of Orange, Rockland, Ulster, Sullivan, Dutchess, and Putnam. It is bordered by the 845 area code to the north, the 845 area code to the east, the 845 area code to the south, and the 845 area code to the west.
Social
The 845 area code is home to a diverse population of people from all walks of life. The area is known for its vibrant arts and culture scene, with many galleries, museums, and performing arts venues. The area is also home to a number of colleges and universities, including SUNY New Paltz, Marist College, and Vassar College.
Economics
The 845 area code is home to a number of major businesses and industries, including IBM, PepsiCo, and the United States Military Academy at West Point. The area is also home to a number of small businesses, including restaurants, retail stores, and service providers.
Demographics
The 845 area code is home to a population of over 1.2 million people. The population is diverse, with a mix of races and ethnicities. The median household income is $63,000, and the median age is 38. The area is also home to a large number of immigrants, with over 20% of the population being foreign-born.
Common Questions
What is Per Capita Income in Area Code 845?
Per Capita income in Area Code 845 is $48,163.
What is the Median Family Income in Area Code 845?
Median Family Income in Area Code 845 is $121,768.
What is the Median Household income in Area Code 845?
Median Household Income in Area Code 845 is $97,588.
What is Income or Wage Gap in Area Code 845?
Income or Wage Gap in Area Code 845 is 29.4%.
Women in Area Code 845 earn 70.6 cents for every dollar earned by a man.
What is Family Income Deficit in Area Code 845?
Family Income Deficit in Area Code 845 is $10,859.
Families that are below poverty line in Area Code 845 earn $10,859 less on average than the poverty threshold level.
What is Inequality or Gini Index in Area Code 845?
Inequality or Gini Index in Area Code 845 is 86.90.
What is the Total Population of Area Code 845?
Total Population of Area Code 845 is 1,486,280.
What is the Total Male Population of Area Code 845?
Total Male Population of Area Code 845 is 740,914.
What is the Total Female Population of Area Code 845?
Total Female Population of Area Code 845 is 745,366.
What is the Ratio of Males per 100 Females in Area Code 845?
There are 99.40 Males per 100 Females in Area Code 845.
What is the Ratio of Females per 100 Males in Area Code 845?
There are 100.60 Females per 100 Males in Area Code 845.
What is the Median Population Age in Area Code 845?
Median Population Age in Area Code 845 is 45.4 Years.
What is the Average Family Size in Area Code 845
Average Family Size in Area Code 845 is 3.1 People.
What is the Average Household Size in Area Code 845
Average Household Size in Area Code 845 is 2.6 People.
How Large is the Labor Force in Area Code 845?
There are 730,047 People in the Labor Forcein in Area Code 845.
What is the Percentage of People in the Labor Force in Area Code 845?
61.5% of People are in the Labor Force in Area Code 845.
What is the Unemployment Rate in Area Code 845?
Unemployment Rate in Area Code 845 is 6.2%.