Area Code 830 Map & Demographics
Area Code 830 Map
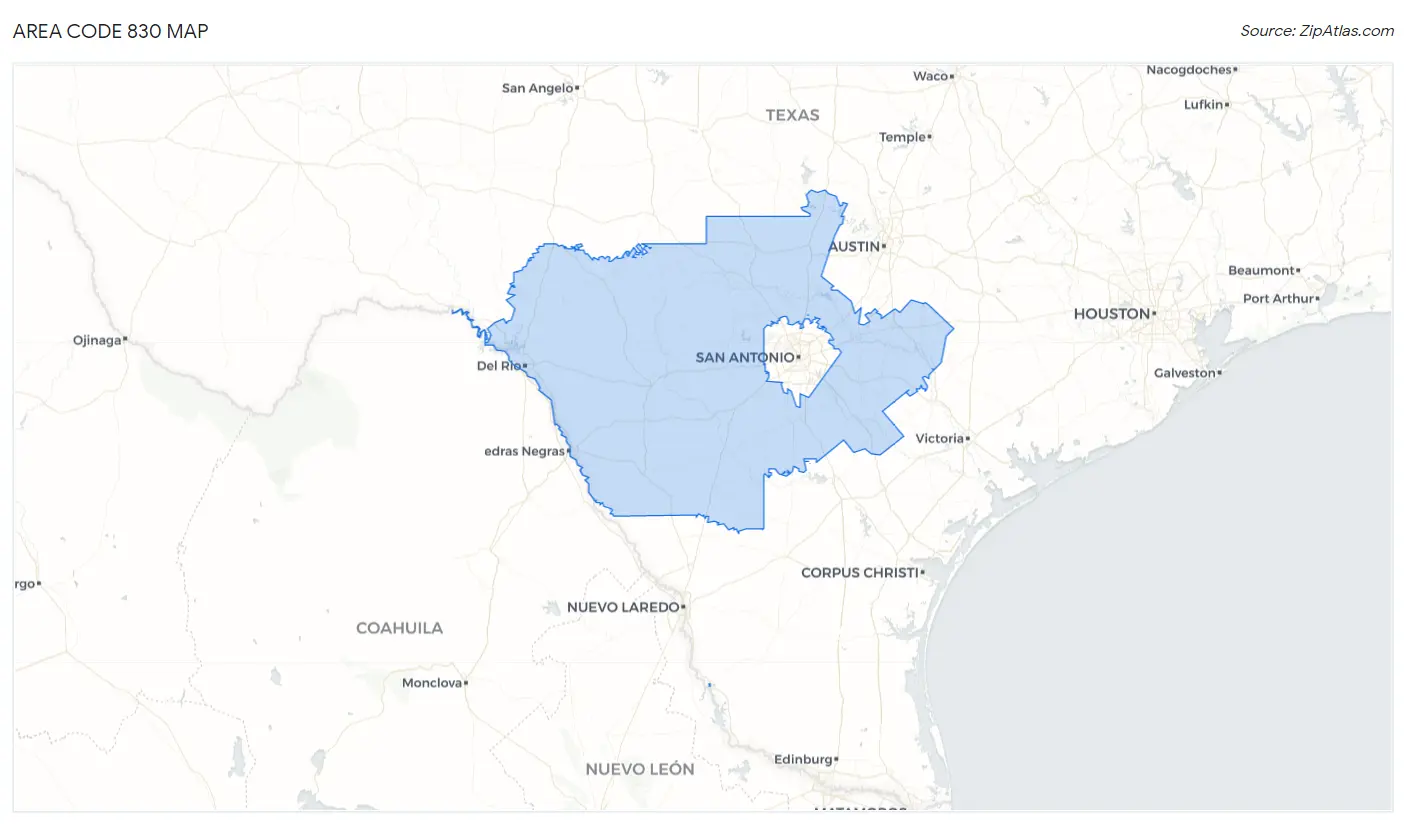
Area Code 830 Overview
$35,377
PER CAPITA INCOME
$85,303
AVG FAMILY INCOME
$72,823
AVG HOUSEHOLD INCOME
35.3%
WAGE / INCOME GAP [ % ]
64.7¢/ $1
WAGE / INCOME GAP [ $ ]
$11,310
FAMILY INCOME DEFICIT
45.05
INEQUALITY / GINI INDEX
915,251
TOTAL POPULATION
461,191
MALE POPULATION
454,060
FEMALE POPULATION
101.57
MALES / 100 FEMALES
98.45
FEMALES / 100 MALES
45.4
MEDIAN AGE
3.1
AVG FAMILY SIZE
2.6
AVG HOUSEHOLD SIZE
381,755
LABOR FORCE [ PEOPLE ]
52.6%
PERCENT IN LABOR FORCE
5.5%
UNEMPLOYMENT RATE
Income in Area Code 830
Income Overview in Area Code 830
Per Capita Income in Area Code 830 is $35,377, while median incomes of families and households are $85,303 and $72,823 respectively.
| Characteristic | Number | Measure |
| Per Capita Income | 915,251 | $35,377 |
| Median Family Income | 241,131 | $85,303 |
| Mean Family Income | 241,131 | $10,766,619 |
| Median Household Income | 329,554 | $72,823 |
| Mean Household Income | 329,554 | $9,966,489 |
| Income Deficit | 241,131 | $11,310 |
| Wage / Income Gap (%) | 915,251 | 35.35% |
| Wage / Income Gap ($) | 915,251 | 64.65¢ per $1 |
| Gini / Inequality Index | 915,251 | 45.05 |
Earnings by Sex in Area Code 830
Average Earnings in Area Code 830 are $38,284, $48,915 for men and $30,932 for women, a difference of 36.8%.
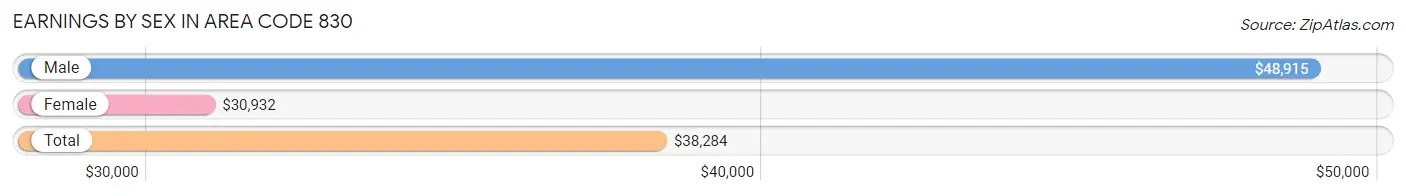
| Sex | Number | Average Earnings |
| Male | 246,179 (54.8%) | $48,915 |
| Female | 203,056 (45.2%) | $30,932 |
| Total | 449,235 (100.0%) | $38,284 |
Earnings by Sex by Income Bracket in Area Code 830
The most common earnings brackets in Area Code 830 are $100,000+ for men (46,117 | 18.7%) and $25,000 to $29,999 for women (15,505 | 7.6%).
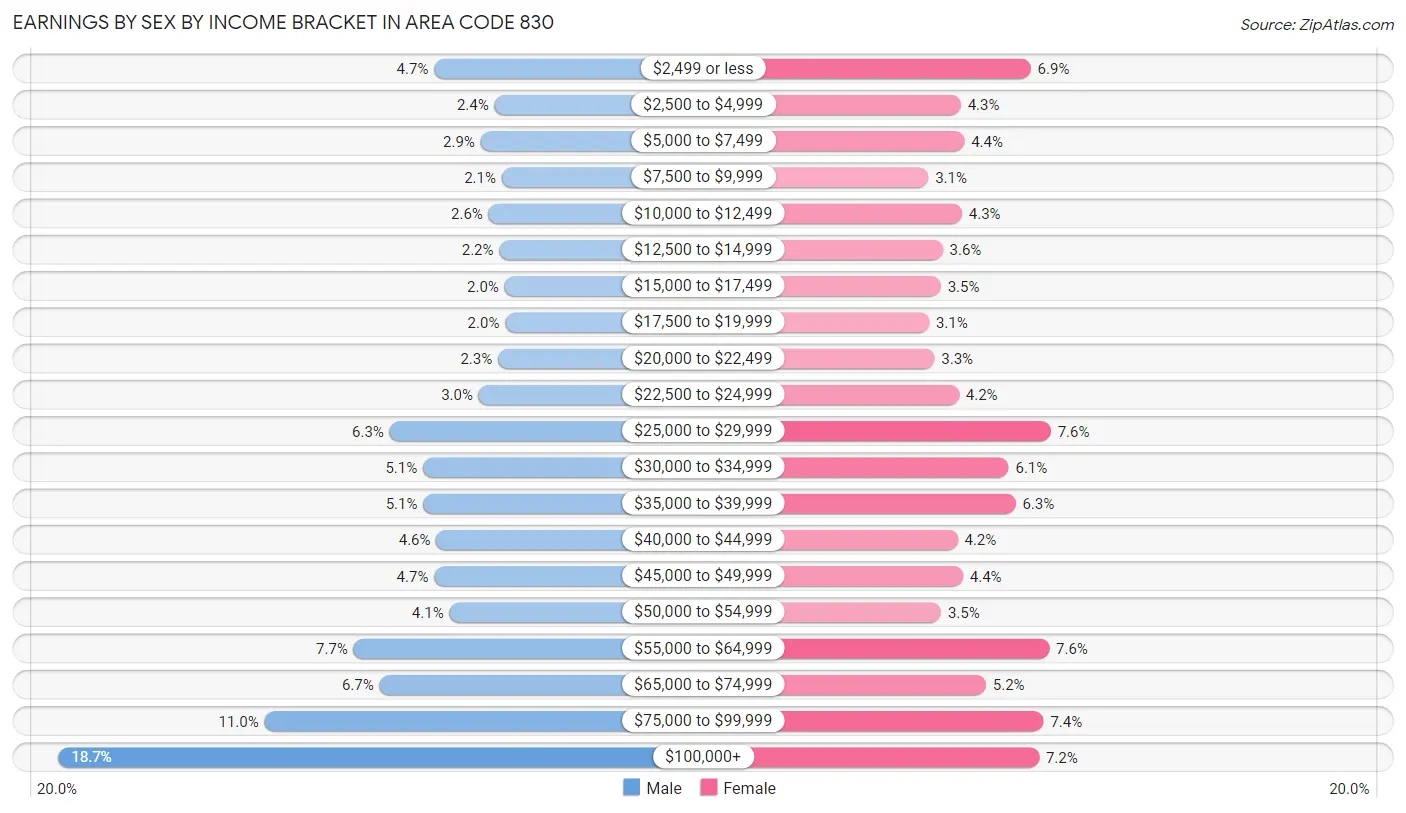
| Income | Male | Female |
| $2,499 or less | 11,441 (4.6%) | 13,981 (6.9%) |
| $2,500 to $4,999 | 5,880 (2.4%) | 8,667 (4.3%) |
| $5,000 to $7,499 | 7,166 (2.9%) | 8,930 (4.4%) |
| $7,500 to $9,999 | 5,212 (2.1%) | 6,199 (3.0%) |
| $10,000 to $12,499 | 6,429 (2.6%) | 8,758 (4.3%) |
| $12,500 to $14,999 | 5,450 (2.2%) | 7,298 (3.6%) |
| $15,000 to $17,499 | 4,943 (2.0%) | 7,141 (3.5%) |
| $17,500 to $19,999 | 4,911 (2.0%) | 6,252 (3.1%) |
| $20,000 to $22,499 | 5,561 (2.3%) | 6,662 (3.3%) |
| $22,500 to $24,999 | 7,346 (3.0%) | 8,537 (4.2%) |
| $25,000 to $29,999 | 15,569 (6.3%) | 15,505 (7.6%) |
| $30,000 to $34,999 | 12,476 (5.1%) | 12,297 (6.1%) |
| $35,000 to $39,999 | 12,457 (5.1%) | 12,840 (6.3%) |
| $40,000 to $44,999 | 11,253 (4.6%) | 8,427 (4.2%) |
| $45,000 to $49,999 | 11,452 (4.6%) | 8,838 (4.3%) |
| $50,000 to $54,999 | 10,049 (4.1%) | 7,168 (3.5%) |
| $55,000 to $64,999 | 18,870 (7.7%) | 15,395 (7.6%) |
| $65,000 to $74,999 | 16,497 (6.7%) | 10,580 (5.2%) |
| $75,000 to $99,999 | 27,100 (11.0%) | 14,969 (7.4%) |
| $100,000+ | 46,117 (18.7%) | 14,612 (7.2%) |
| Total | 246,179 (100.0%) | 203,056 (100.0%) |
Earnings by Sex by Educational Attainment in Area Code 830
Average earnings in Area Code 830 are $5,323,102 for men and $3,262,825 for women, a difference of 38.7%. Men with an educational attainment of bachelor's degree enjoy the highest average annual earnings of $5,102,300, while those with less than high school education earn the least with $2,229,092. Women with an educational attainment of graduate degree earn the most with the average annual earnings of $3,167,066, while those with less than high school education have the smallest earnings of $893,537.
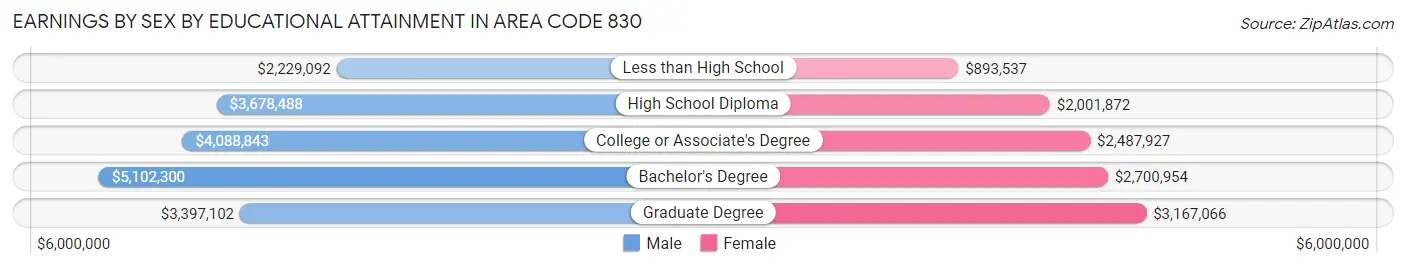
| Educational Attainment | Male Income | Female Income |
| Less than High School | $2,229,092 | $893,537 |
| High School Diploma | $3,678,488 | $2,001,872 |
| College or Associate's Degree | $4,088,843 | $2,487,927 |
| Bachelor's Degree | $5,102,300 | $2,700,954 |
| Graduate Degree | $3,397,102 | $3,167,066 |
| Total | $5,323,102 | $3,262,825 |
Family Income in Area Code 830
Family Income Brackets in Area Code 830
According to the Area Code 830 family income data, there are 5,031,198 families falling into the $100,000 to $149,999 income range, which is the most common income bracket and makes up 2,086.5% of all families. Conversely, the $10,000 to $14,999 income bracket is the least frequent group with only 808,271 families (335.2%) belonging to this category.
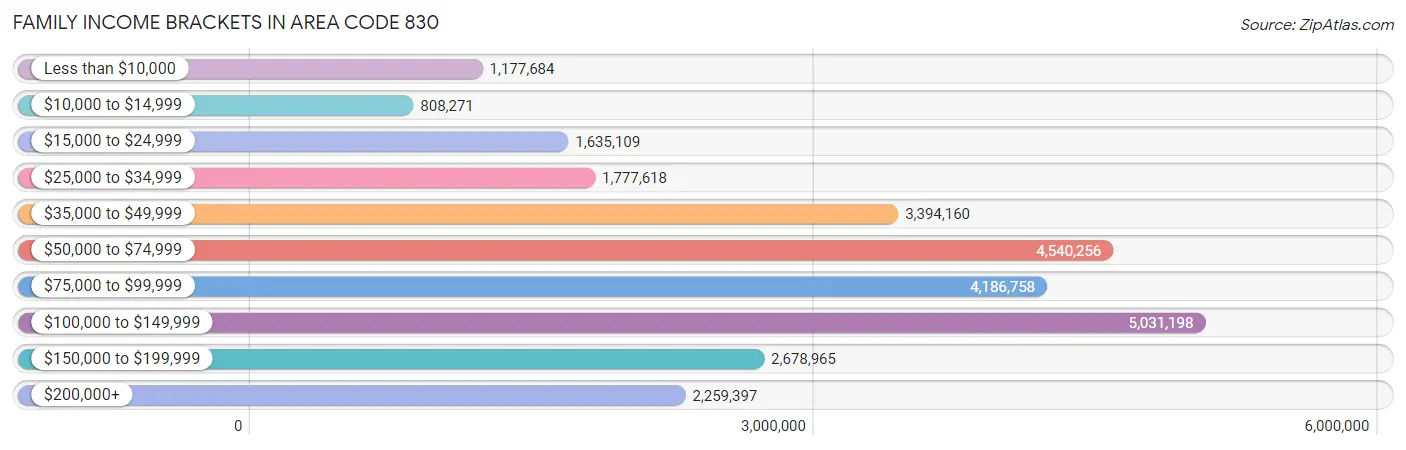
| Income Bracket | # Families | % Families |
| Less than $10,000 | 1,177,684 | 488.4% |
| $10,000 to $14,999 | 808,271 | 335.2% |
| $15,000 to $24,999 | 1,635,109 | 678.1% |
| $25,000 to $34,999 | 1,777,618 | 737.2% |
| $35,000 to $49,999 | 3,394,160 | 1,407.6% |
| $50,000 to $74,999 | 4,540,256 | 1,882.9% |
| $75,000 to $99,999 | 4,186,758 | 1,736.3% |
| $100,000 to $149,999 | 5,031,198 | 2,086.5% |
| $150,000 to $199,999 | 2,678,965 | 1,111.0% |
| $200,000+ | 2,259,397 | 937.0% |
Family Income by Famaliy Size in Area Code 830
7+ person families (5,144 | 2.1%) account for the highest median family income in Area Code 830 with $142,325 per family, while 2-person families (112,549 | 46.7%) have the highest median income of $39,830 per family member.
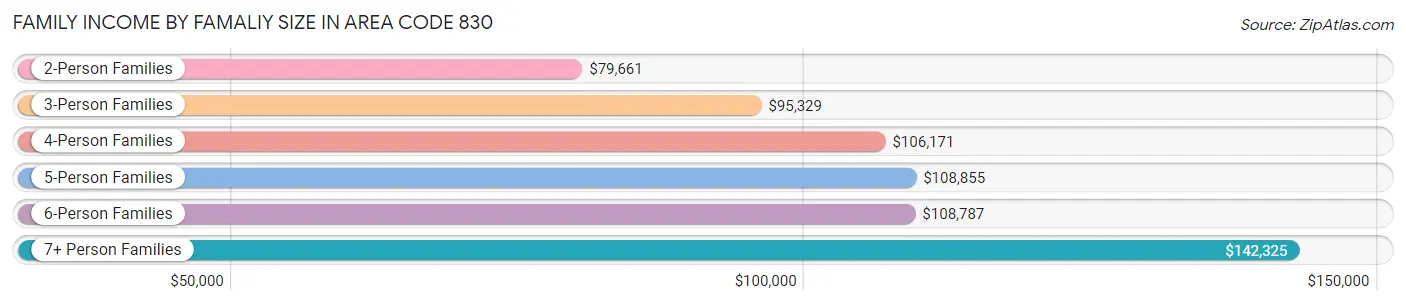
| Income Bracket | # Families | Median Income |
| 2-Person Families | 112,549 (46.7%) | $79,661 |
| 3-Person Families | 50,060 (20.8%) | $95,329 |
| 4-Person Families | 41,868 (17.4%) | $106,171 |
| 5-Person Families | 22,708 (9.4%) | $108,855 |
| 6-Person Families | 8,802 (3.6%) | $108,787 |
| 7+ Person Families | 5,144 (2.1%) | $142,325 |
| Total | 241,131 (100.0%) | $85,303 |
Family Income by Number of Earners in Area Code 830
The median family income in Area Code 830 is $85,303, with families comprising 3+ earners (26,393) having the highest median family income of $133,887, while families with no earners (41,562) have the lowest median family income of $62,545, accounting for 11.0% and 17.2% of families, respectively.
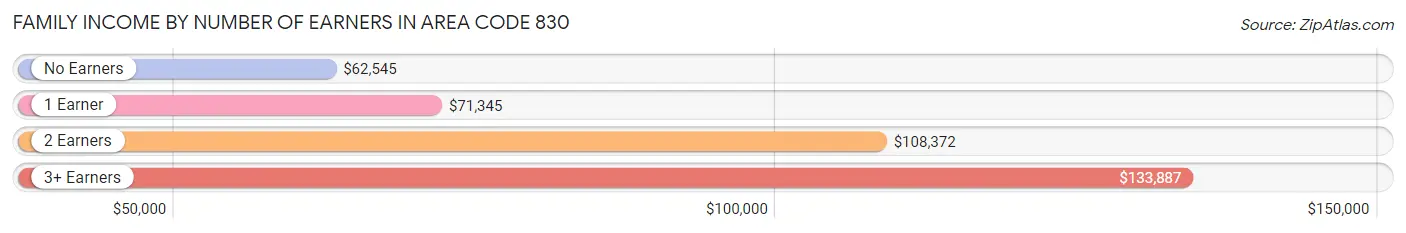
| Number of Earners | # Families | Median Income |
| No Earners | 41,562 (17.2%) | $62,545 |
| 1 Earner | 78,357 (32.5%) | $71,345 |
| 2 Earners | 94,819 (39.3%) | $108,372 |
| 3+ Earners | 26,393 (11.0%) | $133,887 |
| Total | 241,131 (100.0%) | $85,303 |
Household Income in Area Code 830
Household Income Brackets in Area Code 830
With 6,102,351 households falling in the category, the $50,000 to $74,999 income range is the most frequent in Area Code 830, accounting for 1,851.7% of all households. In contrast, only 1,723,238 households (522.9%) fall into the less than $10,000 income bracket, making it the least populous group.
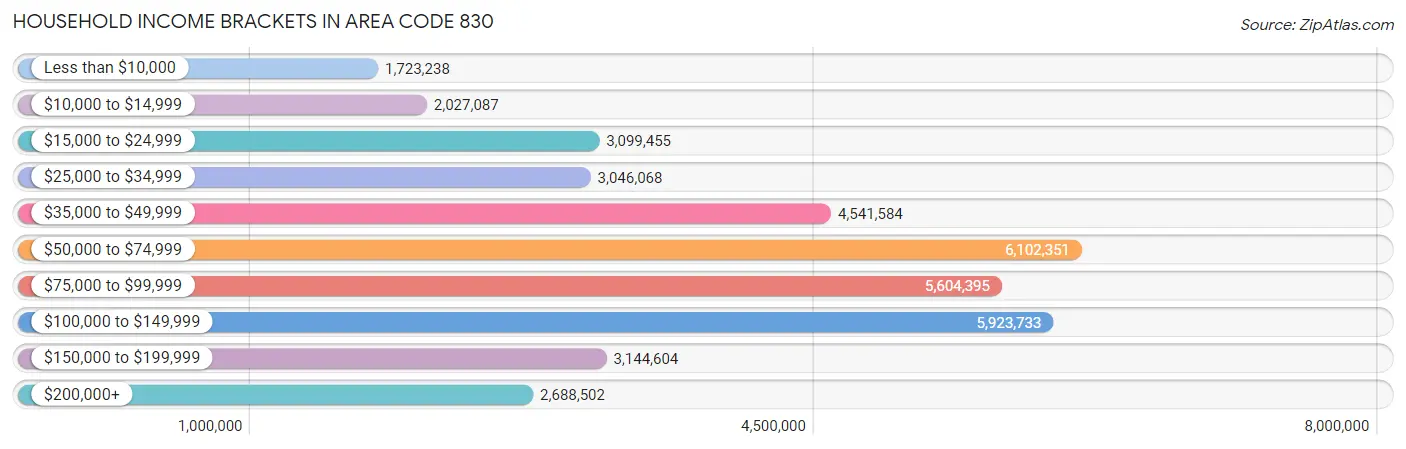
| Income Bracket | # Households | % Households |
| Less than $10,000 | 1,723,238 | 522.9% |
| $10,000 to $14,999 | 2,027,087 | 615.1% |
| $15,000 to $24,999 | 3,099,455 | 940.5% |
| $25,000 to $34,999 | 3,046,068 | 924.3% |
| $35,000 to $49,999 | 4,541,584 | 1,378.1% |
| $50,000 to $74,999 | 6,102,351 | 1,851.7% |
| $75,000 to $99,999 | 5,604,395 | 1,700.6% |
| $100,000 to $149,999 | 5,923,733 | 1,797.5% |
| $150,000 to $199,999 | 3,144,604 | 954.2% |
| $200,000+ | 2,688,502 | 815.8% |
Household Income by Householder Age in Area Code 830
The median household income in Area Code 830 is $72,823, with the highest median household income of $89,870 found in the 45 to 64 years age bracket for the primary householder. A total of 123,865 households (37.6%) fall into this category. Meanwhile, the 15 to 24 years age bracket for the primary householder has the lowest median household income of $55,223, with 9,449 households (2.9%) in this group.
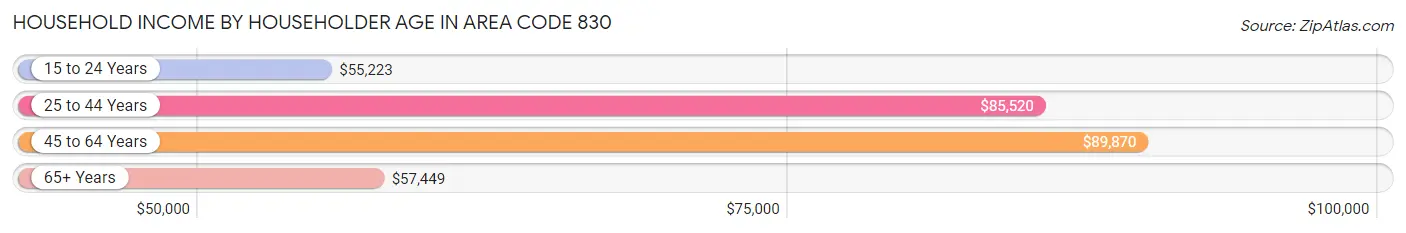
| Income Bracket | # Households | Median Income |
| 15 to 24 Years | 9,449 (2.9%) | $55,223 |
| 25 to 44 Years | 97,216 (29.5%) | $85,520 |
| 45 to 64 Years | 123,865 (37.6%) | $89,870 |
| 65+ Years | 99,024 (30.0%) | $57,449 |
| Total | 329,554 (100.0%) | $72,823 |
Poverty in Area Code 830
Income Below Poverty by Sex and Age in Area Code 830
With 10.8% poverty level for males and 12.9% for females among the residents of Area Code 830, under 5 year old males and 6 to 11 year old females are the most vulnerable to poverty, with 5,451 males (19.7%) and 6,129 females (17.0%) in their respective age groups living below the poverty level.
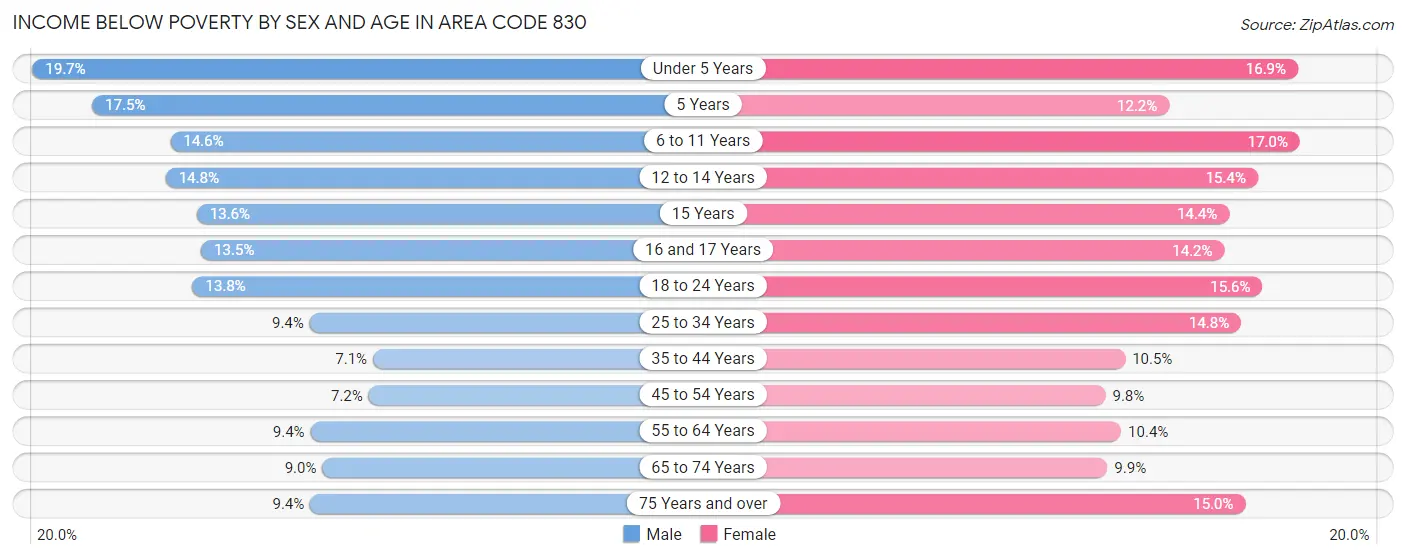
| Age Bracket | Male | Female |
| Under 5 Years | 5,451 (19.7%) | 4,350 (16.9%) |
| 5 Years | 1,032 (17.5%) | 617 (12.1%) |
| 6 to 11 Years | 5,341 (14.6%) | 6,129 (17.0%) |
| 12 to 14 Years | 2,780 (14.8%) | 2,790 (15.4%) |
| 15 Years | 895 (13.6%) | 903 (14.4%) |
| 16 and 17 Years | 1,904 (13.5%) | 1,777 (14.2%) |
| 18 to 24 Years | 5,545 (13.8%) | 5,658 (15.6%) |
| 25 to 34 Years | 5,000 (9.4%) | 7,553 (14.8%) |
| 35 to 44 Years | 3,892 (7.1%) | 5,921 (10.5%) |
| 45 to 54 Years | 4,049 (7.2%) | 5,345 (9.8%) |
| 55 to 64 Years | 5,291 (9.4%) | 6,164 (10.4%) |
| 65 to 74 Years | 4,043 (8.9%) | 4,917 (9.9%) |
| 75 Years and over | 2,775 (9.4%) | 5,415 (15.0%) |
| Total | 47,998 (10.8%) | 57,539 (12.9%) |
Income Above Poverty by Sex and Age in Area Code 830
According to the poverty statistics in Area Code 830, males aged 35 to 44 years and females aged 45 to 54 years are the age groups that are most secure financially, with 92.9% of males and 90.2% of females in these age groups living above the poverty line.
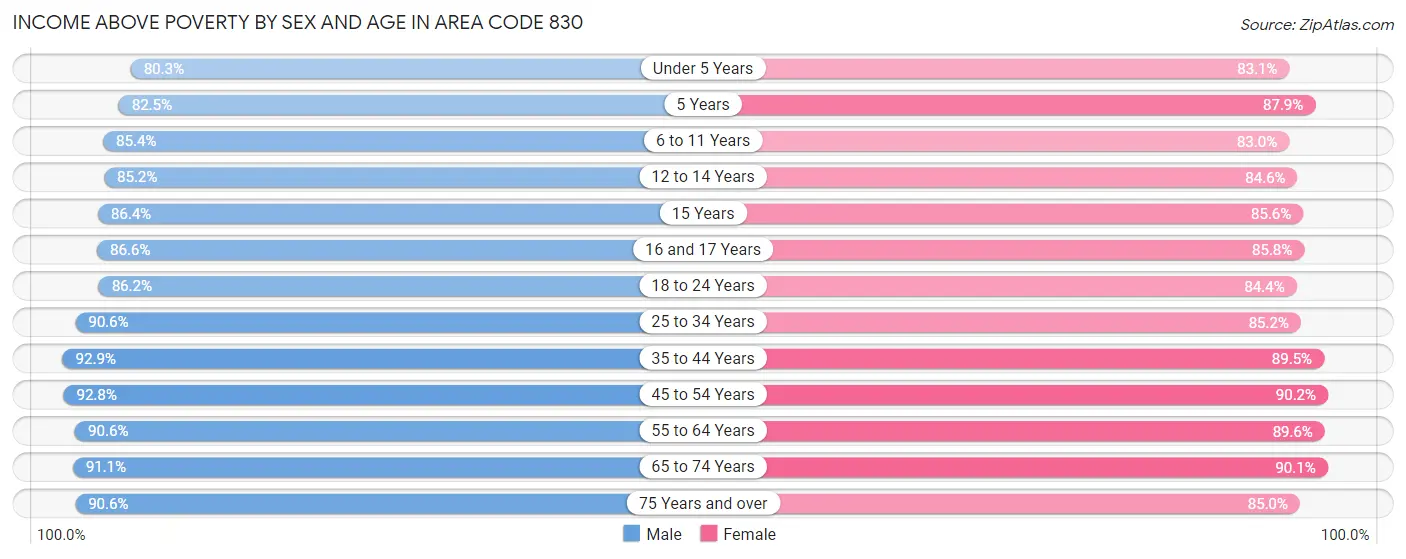
| Age Bracket | Male | Female |
| Under 5 Years | 22,207 (80.3%) | 21,341 (83.1%) |
| 5 Years | 4,869 (82.5%) | 4,460 (87.8%) |
| 6 to 11 Years | 31,273 (85.4%) | 29,928 (83.0%) |
| 12 to 14 Years | 16,050 (85.2%) | 15,277 (84.6%) |
| 15 Years | 5,682 (86.4%) | 5,378 (85.6%) |
| 16 and 17 Years | 12,257 (86.6%) | 10,739 (85.8%) |
| 18 to 24 Years | 34,716 (86.2%) | 30,595 (84.4%) |
| 25 to 34 Years | 48,053 (90.6%) | 43,402 (85.2%) |
| 35 to 44 Years | 51,177 (92.9%) | 50,375 (89.5%) |
| 45 to 54 Years | 51,955 (92.8%) | 49,231 (90.2%) |
| 55 to 64 Years | 51,029 (90.6%) | 53,289 (89.6%) |
| 65 to 74 Years | 41,155 (91.0%) | 44,928 (90.1%) |
| 75 Years and over | 26,758 (90.6%) | 30,724 (85.0%) |
| Total | 397,181 (89.2%) | 389,667 (87.1%) |
Income Below Poverty Among Married-Couple Families in Area Code 830
The poverty statistics for married-couple families in Area Code 830 show that 4.7% or 8,696 of the total 185,351 families live below the poverty line. Families with 5 or more children have the highest poverty rate of 14.6%, comprising of 210 families. On the other hand, families with no children have the lowest poverty rate of 4.1%, which includes 4,480 families.
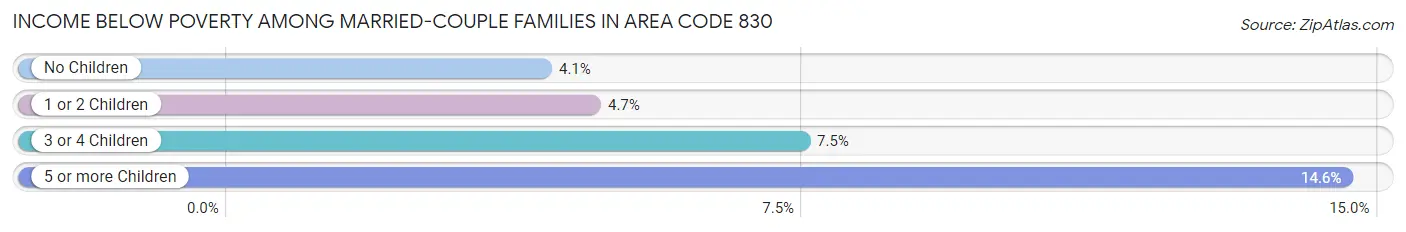
| Children | Above Poverty | Below Poverty |
| No Children | 104,892 (95.9%) | 4,480 (4.1%) |
| 1 or 2 Children | 54,589 (95.3%) | 2,719 (4.7%) |
| 3 or 4 Children | 15,942 (92.5%) | 1,287 (7.5%) |
| 5 or more Children | 1,232 (85.4%) | 210 (14.6%) |
| Total | 176,655 (95.3%) | 8,696 (4.7%) |
Income Below Poverty Among Single-Parent Households in Area Code 830
According to the poverty data in Area Code 830, 12.8% or 2,170 single-father households and 26.9% or 10,441 single-mother households are living below the poverty line. Among single-father households, those with 5 or more children have the highest poverty rate, with 58 households (28.9%) experiencing poverty. Likewise, among single-mother households, those with 5 or more children have the highest poverty rate, with 376 households (64.8%) falling below the poverty line.
| Children | Single Father | Single Mother |
| No Children | 701 (8.6%) | 1,348 (10.1%) |
| 1 or 2 Children | 1,083 (15.1%) | 5,670 (30.0%) |
| 3 or 4 Children | 328 (22.6%) | 3,047 (51.3%) |
| 5 or more Children | 58 (28.9%) | 376 (64.8%) |
| Total | 2,170 (12.8%) | 10,441 (26.9%) |
Income Below Poverty Among Married-Couple vs Single-Parent Households in Area Code 830
The poverty data for Area Code 830 shows that 8,696 of the married-couple family households (4.7%) and 12,611 of the single-parent households (22.6%) are living below the poverty level. Within the married-couple family households, those with 5 or more children have the highest poverty rate, with 210 households (14.6%) falling below the poverty line. Among the single-parent households, those with 5 or more children have the highest poverty rate, with 434 household (55.6%) living below poverty.
| Children | Married-Couple Families | Single-Parent Households |
| No Children | 4,480 (4.1%) | 2,049 (9.5%) |
| 1 or 2 Children | 2,719 (4.7%) | 6,753 (25.9%) |
| 3 or 4 Children | 1,287 (7.5%) | 3,375 (45.7%) |
| 5 or more Children | 210 (14.6%) | 434 (55.6%) |
| Total | 8,696 (4.7%) | 12,611 (22.6%) |
Race in Area Code 830
The most populous races in Area Code 830 are White / Caucasian (661,944 | 72.3%), Hispanic or Latino (416,197 | 45.5%), and Two or more Races (155,105 | 17.0%).
| Race | # Population | % Population |
| Asian | 10,381 | 1.1% |
| Black / African American | 26,349 | 2.9% |
| Hawaiian / Pacific | 481 | 0.1% |
| Hispanic or Latino | 416,197 | 45.5% |
| Native / Alaskan | 4,876 | 0.5% |
| White / Caucasian | 661,944 | 72.3% |
| Two or more Races | 155,105 | 17.0% |
| Some other Race | 56,115 | 6.1% |
| Total | 915,251 | 100.0% |
Ancestry in Area Code 830
The most populous ancestries reported in Area Code 830 are Mexican (367,832 | 40.2%), German (134,001 | 14.6%), English (84,620 | 9.2%), Irish (69,119 | 7.5%), and American (38,655 | 4.2%), together accounting for 75.9% of all Area Code 830 residents.
| Ancestry | # Population | % Population |
| Afghan | 31 | 0.0% |
| African | 1,306 | 0.1% |
| Alaska Native | 3 | 0.0% |
| Albanian | 149 | 0.0% |
| Alsatian | 1,023 | 0.1% |
| American | 38,655 | 4.2% |
| Apache | 877 | 0.1% |
| Arab | 1,642 | 0.2% |
| Argentinean | 226 | 0.0% |
| Armenian | 166 | 0.0% |
| Australian | 255 | 0.0% |
| Austrian | 831 | 0.1% |
| Bangladeshi | 35 | 0.0% |
| Barbadian | 278 | 0.0% |
| Basque | 99 | 0.0% |
| Belgian | 596 | 0.1% |
| Belizean | 130 | 0.0% |
| Bhutanese | 1,818 | 0.2% |
| Blackfeet | 248 | 0.0% |
| Bolivian | 10 | 0.0% |
| Brazilian | 376 | 0.0% |
| British | 4,963 | 0.5% |
| British West Indian | 4 | 0.0% |
| Bulgarian | 244 | 0.0% |
| Burmese | 1,426 | 0.2% |
| Cajun | 443 | 0.1% |
| Canadian | 672 | 0.1% |
| Carpatho Rusyn | 12 | 0.0% |
| Celtic | 175 | 0.0% |
| Central American | 7,611 | 0.8% |
| Central American Indian | 880 | 0.1% |
| Cherokee | 3,121 | 0.3% |
| Cheyenne | 72 | 0.0% |
| Chickasaw | 268 | 0.0% |
| Chilean | 392 | 0.0% |
| Chippewa | 279 | 0.0% |
| Choctaw | 888 | 0.1% |
| Colombian | 1,048 | 0.1% |
| Comanche | 408 | 0.0% |
| Costa Rican | 89 | 0.0% |
| Cree | 21 | 0.0% |
| Creek | 279 | 0.0% |
| Croatian | 372 | 0.0% |
| Crow | 34 | 0.0% |
| Cuban | 1,688 | 0.2% |
| Czech | 8,239 | 0.9% |
| Czechoslovakian | 1,168 | 0.1% |
| Danish | 1,587 | 0.2% |
| Dominican | 905 | 0.1% |
| Dutch | 5,170 | 0.6% |
| Dutch West Indian | 141 | 0.0% |
| Eastern European | 1,158 | 0.1% |
| Ecuadorian | 80 | 0.0% |
| Egyptian | 104 | 0.0% |
| English | 84,620 | 9.2% |
| Estonian | 13 | 0.0% |
| Ethiopian | 272 | 0.0% |
| European | 11,392 | 1.2% |
| Filipino | 224 | 0.0% |
| Finnish | 939 | 0.1% |
| French | 17,991 | 2.0% |
| French American Indian | 37 | 0.0% |
| French Canadian | 1,777 | 0.2% |
| German | 134,001 | 14.6% |
| Ghanaian | 107 | 0.0% |
| Greek | 1,422 | 0.2% |
| Guamanian / Chamorro | 204 | 0.0% |
| Guatemalan | 1,553 | 0.2% |
| Guyanese | 37 | 0.0% |
| Haitian | 409 | 0.0% |
| Hmong | 1 | 0.0% |
| Honduran | 2,106 | 0.2% |
| Hopi | 64 | 0.0% |
| Houma | 6 | 0.0% |
| Hungarian | 1,216 | 0.1% |
| Icelander | 20 | 0.0% |
| Indian (Asian) | 2,663 | 0.3% |
| Indonesian | 139 | 0.0% |
| Iranian | 436 | 0.1% |
| Irish | 69,119 | 7.5% |
| Iroquois | 7 | 0.0% |
| Israeli | 47 | 0.0% |
| Italian | 16,781 | 1.8% |
| Jamaican | 72 | 0.0% |
| Japanese | 420 | 0.1% |
| Jordanian | 196 | 0.0% |
| Kenyan | 41 | 0.0% |
| Kiowa | 12 | 0.0% |
| Korean | 3,845 | 0.4% |
| Laotian | 108 | 0.0% |
| Latvian | 38 | 0.0% |
| Lebanese | 575 | 0.1% |
| Liberian | 179 | 0.0% |
| Lithuanian | 483 | 0.1% |
| Lumbee | 30 | 0.0% |
| Macedonian | 19 | 0.0% |
| Malaysian | 40 | 0.0% |
| Maltese | 64 | 0.0% |
| Mexican | 367,832 | 40.2% |
| Mexican American Indian | 1,656 | 0.2% |
| Mongolian | 15 | 0.0% |
| Native Hawaiian | 754 | 0.1% |
| Navajo | 504 | 0.1% |
| New Zealander | 200 | 0.0% |
| Nicaraguan | 382 | 0.0% |
| Nigerian | 126 | 0.0% |
| Northern European | 1,321 | 0.1% |
| Norwegian | 5,635 | 0.6% |
| Okinawan | 15 | 0.0% |
| Osage | 66 | 0.0% |
| Ottawa | 91 | 0.0% |
| Paiute | 6 | 0.0% |
| Pakistani | 603 | 0.1% |
| Palestinian | 133 | 0.0% |
| Panamanian | 882 | 0.1% |
| Pennsylvania German | 110 | 0.0% |
| Peruvian | 561 | 0.1% |
| Polish | 16,777 | 1.8% |
| Portuguese | 1,769 | 0.2% |
| Potawatomi | 73 | 0.0% |
| Pueblo | 103 | 0.0% |
| Puerto Rican | 7,121 | 0.8% |
| Romanian | 281 | 0.0% |
| Russian | 1,857 | 0.2% |
| Salvadoran | 2,599 | 0.3% |
| Samoan | 38 | 0.0% |
| Scandinavian | 1,906 | 0.2% |
| Scotch-Irish | 11,809 | 1.3% |
| Scottish | 16,677 | 1.8% |
| Seminole | 91 | 0.0% |
| Serbian | 105 | 0.0% |
| Sioux | 613 | 0.1% |
| Slavic | 180 | 0.0% |
| Slovak | 379 | 0.0% |
| Slovene | 261 | 0.0% |
| South African | 62 | 0.0% |
| South American | 2,584 | 0.3% |
| South American Indian | 95 | 0.0% |
| Spaniard | 4,260 | 0.5% |
| Spanish | 4,021 | 0.4% |
| Spanish American | 76 | 0.0% |
| Spanish American Indian | 58 | 0.0% |
| Sri Lankan | 1,541 | 0.2% |
| Subsaharan African | 3,069 | 0.3% |
| Sudanese | 717 | 0.1% |
| Swedish | 6,373 | 0.7% |
| Swiss | 1,411 | 0.2% |
| Syrian | 183 | 0.0% |
| Thai | 2,742 | 0.3% |
| Tohono O'Odham | 18 | 0.0% |
| Tongan | 4 | 0.0% |
| Trinidadian and Tobagonian | 37 | 0.0% |
| Turkish | 182 | 0.0% |
| U.S. Virgin Islander | 15 | 0.0% |
| Ukrainian | 702 | 0.1% |
| Uruguayan | 26 | 0.0% |
| Ute | 16 | 0.0% |
| Venezuelan | 232 | 0.0% |
| Vietnamese | 8 | 0.0% |
| Welsh | 5,230 | 0.6% |
| West Indian | 207 | 0.0% |
| Yakama | 6 | 0.0% |
| Yaqui | 119 | 0.0% |
| Yugoslavian | 42 | 0.0% | View All 164 Rows |
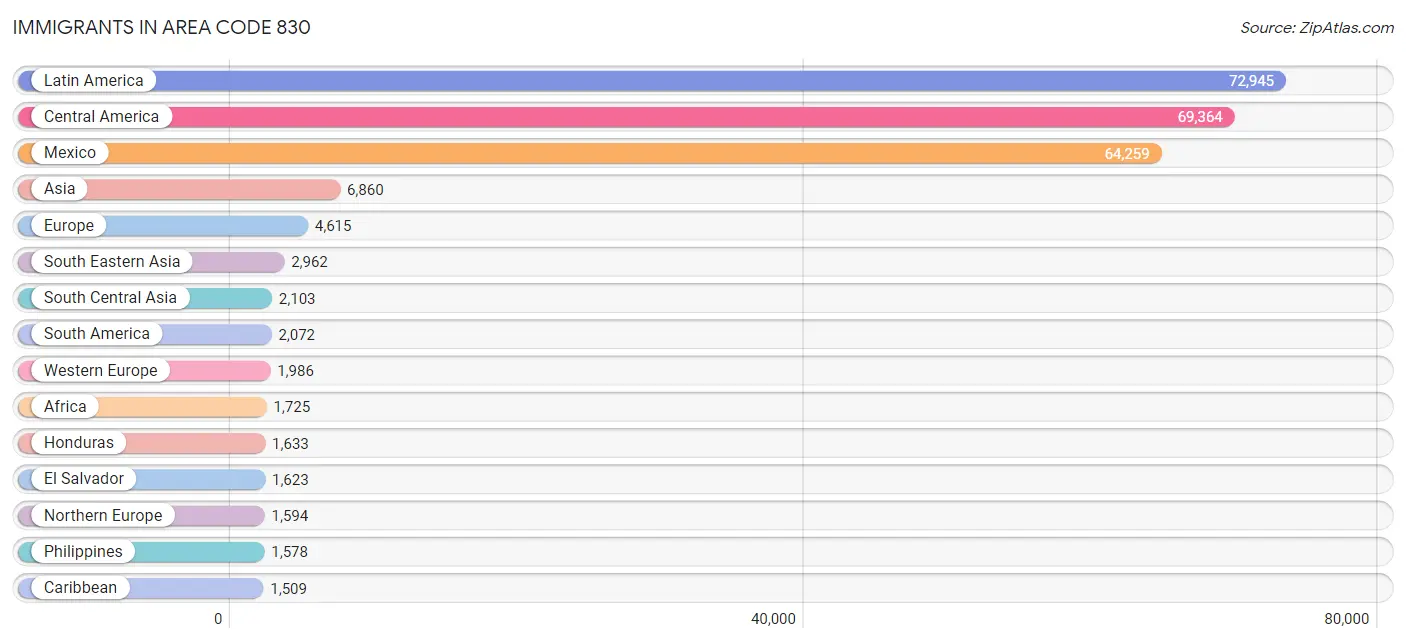
Immigrants in Area Code 830
The most numerous immigrant groups reported in Area Code 830 came from Latin America (72,945 | 8.0%), Central America (69,364 | 7.6%), Mexico (64,259 | 7.0%), Asia (6,860 | 0.7%), and Europe (4,615 | 0.5%), together accounting for 23.8% of all Area Code 830 residents.
| Immigration Origin | # Population | % Population |
| Afghanistan | 31 | 0.0% |
| Africa | 1,725 | 0.2% |
| Albania | 45 | 0.0% |
| Argentina | 152 | 0.0% |
| Asia | 6,860 | 0.7% |
| Australia | 181 | 0.0% |
| Austria | 20 | 0.0% |
| Bangladesh | 150 | 0.0% |
| Barbados | 114 | 0.0% |
| Belarus | 34 | 0.0% |
| Belgium | 53 | 0.0% |
| Belize | 66 | 0.0% |
| Bolivia | 6 | 0.0% |
| Brazil | 195 | 0.0% |
| Bulgaria | 46 | 0.0% |
| Cambodia | 60 | 0.0% |
| Cameroon | 37 | 0.0% |
| Canada | 1,325 | 0.1% |
| Caribbean | 1,509 | 0.2% |
| Central America | 69,364 | 7.6% |
| Chile | 53 | 0.0% |
| China | 766 | 0.1% |
| Colombia | 697 | 0.1% |
| Congo | 11 | 0.0% |
| Costa Rica | 22 | 0.0% |
| Croatia | 24 | 0.0% |
| Cuba | 556 | 0.1% |
| Czechoslovakia | 35 | 0.0% |
| Denmark | 76 | 0.0% |
| Dominican Republic | 576 | 0.1% |
| Eastern Africa | 968 | 0.1% |
| Eastern Asia | 1,417 | 0.2% |
| Eastern Europe | 638 | 0.1% |
| Ecuador | 39 | 0.0% |
| Egypt | 11 | 0.0% |
| El Salvador | 1,623 | 0.2% |
| England | 748 | 0.1% |
| Eritrea | 11 | 0.0% |
| Ethiopia | 198 | 0.0% |
| Europe | 4,615 | 0.5% |
| France | 240 | 0.0% |
| Germany | 1,469 | 0.2% |
| Ghana | 98 | 0.0% |
| Greece | 10 | 0.0% |
| Guatemala | 1,049 | 0.1% |
| Guyana | 87 | 0.0% |
| Haiti | 147 | 0.0% |
| Honduras | 1,633 | 0.2% |
| Hong Kong | 23 | 0.0% |
| Hungary | 8 | 0.0% |
| India | 1,469 | 0.2% |
| Indonesia | 50 | 0.0% |
| Iran | 226 | 0.0% |
| Ireland | 65 | 0.0% |
| Israel | 64 | 0.0% |
| Italy | 38 | 0.0% |
| Jamaica | 10 | 0.0% |
| Japan | 229 | 0.0% |
| Jordan | 91 | 0.0% |
| Kazakhstan | 15 | 0.0% |
| Kenya | 24 | 0.0% |
| Korea | 422 | 0.1% |
| Kuwait | 5 | 0.0% |
| Laos | 41 | 0.0% |
| Latin America | 72,945 | 8.0% |
| Latvia | 11 | 0.0% |
| Lebanon | 78 | 0.0% |
| Liberia | 124 | 0.0% |
| Malaysia | 15 | 0.0% |
| Mexico | 64,259 | 7.0% |
| Middle Africa | 59 | 0.0% |
| Moldova | 9 | 0.0% |
| Nepal | 13 | 0.0% |
| Netherlands | 111 | 0.0% |
| Nicaragua | 283 | 0.0% |
| Nigeria | 69 | 0.0% |
| North Macedonia | 4 | 0.0% |
| Northern Africa | 131 | 0.0% |
| Northern Europe | 1,594 | 0.2% |
| Norway | 60 | 0.0% |
| Oceania | 324 | 0.0% |
| Pakistan | 174 | 0.0% |
| Panama | 429 | 0.1% |
| Peru | 500 | 0.1% |
| Philippines | 1,578 | 0.2% |
| Poland | 148 | 0.0% |
| Portugal | 51 | 0.0% |
| Romania | 51 | 0.0% |
| Russia | 127 | 0.0% |
| Saudi Arabia | 7 | 0.0% |
| Scotland | 51 | 0.0% |
| Serbia | 4 | 0.0% |
| Singapore | 28 | 0.0% |
| Somalia | 88 | 0.0% |
| South Africa | 195 | 0.0% |
| South America | 2,072 | 0.2% |
| South Central Asia | 2,103 | 0.2% |
| South Eastern Asia | 2,962 | 0.3% |
| Southern Europe | 397 | 0.0% |
| Spain | 298 | 0.0% |
| Sri Lanka | 11 | 0.0% |
| Sudan | 75 | 0.0% |
| Sweden | 30 | 0.0% |
| Switzerland | 93 | 0.0% |
| Syria | 17 | 0.0% |
| Taiwan | 62 | 0.0% |
| Thailand | 330 | 0.0% |
| Trinidad and Tobago | 106 | 0.0% |
| Turkey | 99 | 0.0% |
| Uganda | 17 | 0.0% |
| Ukraine | 80 | 0.0% |
| Uruguay | 26 | 0.0% |
| Venezuela | 226 | 0.0% |
| Vietnam | 769 | 0.1% |
| Western Africa | 335 | 0.0% |
| Western Asia | 378 | 0.0% |
| Western Europe | 1,986 | 0.2% |
| Zaire | 11 | 0.0% |
| Zimbabwe | 148 | 0.0% | View All 119 Rows |
Sex and Age in Area Code 830
Sex and Age in Area Code 830
The most populous age groups in Area Code 830 are 15 to 19 Years (34,607 | 7.5%) for men and 10 to 14 Years (31,157 | 6.9%) for women.
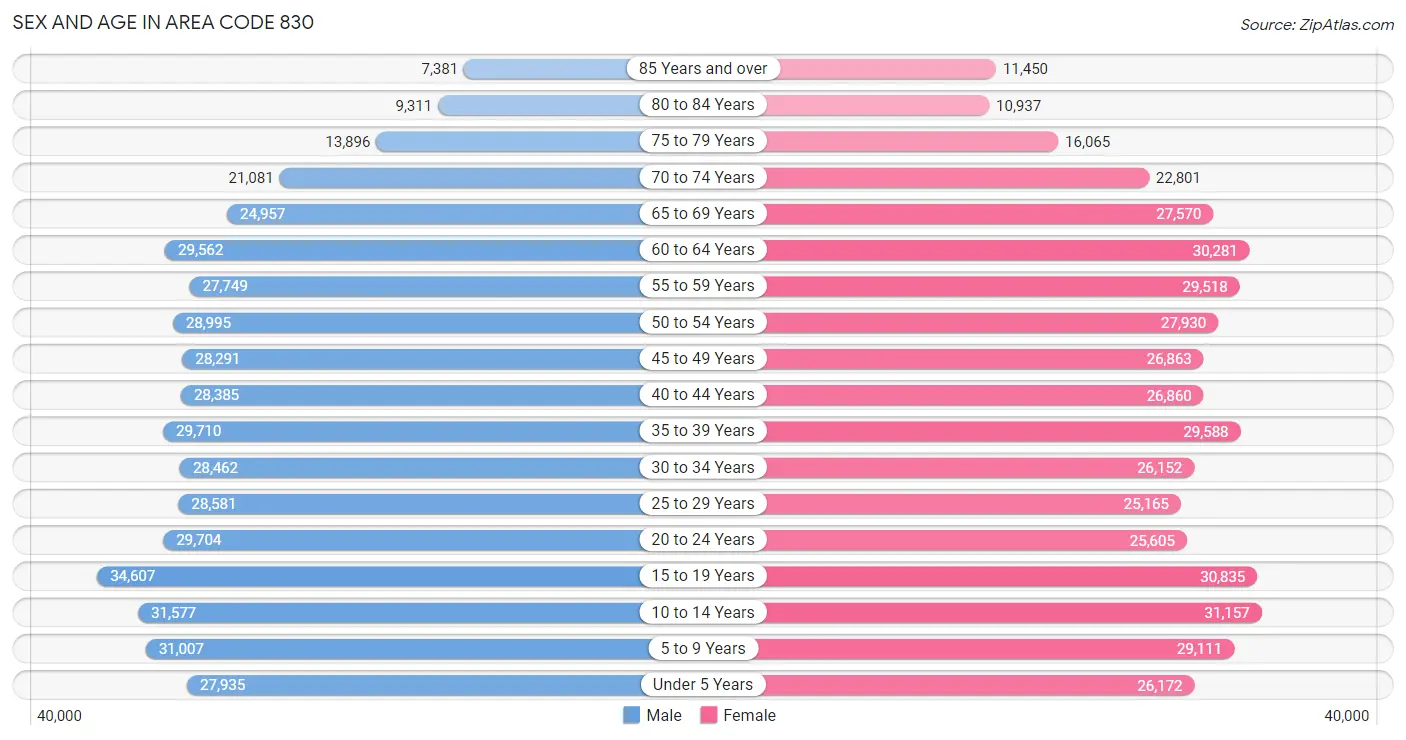
| Age Bracket | Male | Female |
| Under 5 Years | 27,935 (6.1%) | 26,172 (5.8%) |
| 5 to 9 Years | 31,007 (6.7%) | 29,111 (6.4%) |
| 10 to 14 Years | 31,577 (6.9%) | 31,157 (6.9%) |
| 15 to 19 Years | 34,607 (7.5%) | 30,835 (6.8%) |
| 20 to 24 Years | 29,704 (6.4%) | 25,605 (5.6%) |
| 25 to 29 Years | 28,581 (6.2%) | 25,165 (5.5%) |
| 30 to 34 Years | 28,462 (6.2%) | 26,152 (5.8%) |
| 35 to 39 Years | 29,710 (6.4%) | 29,588 (6.5%) |
| 40 to 44 Years | 28,385 (6.1%) | 26,860 (5.9%) |
| 45 to 49 Years | 28,291 (6.1%) | 26,863 (5.9%) |
| 50 to 54 Years | 28,995 (6.3%) | 27,930 (6.1%) |
| 55 to 59 Years | 27,749 (6.0%) | 29,518 (6.5%) |
| 60 to 64 Years | 29,562 (6.4%) | 30,281 (6.7%) |
| 65 to 69 Years | 24,957 (5.4%) | 27,570 (6.1%) |
| 70 to 74 Years | 21,081 (4.6%) | 22,801 (5.0%) |
| 75 to 79 Years | 13,896 (3.0%) | 16,065 (3.5%) |
| 80 to 84 Years | 9,311 (2.0%) | 10,937 (2.4%) |
| 85 Years and over | 7,381 (1.6%) | 11,450 (2.5%) |
| Total | 461,191 (100.0%) | 454,060 (100.0%) |
Families and Households in Area Code 830
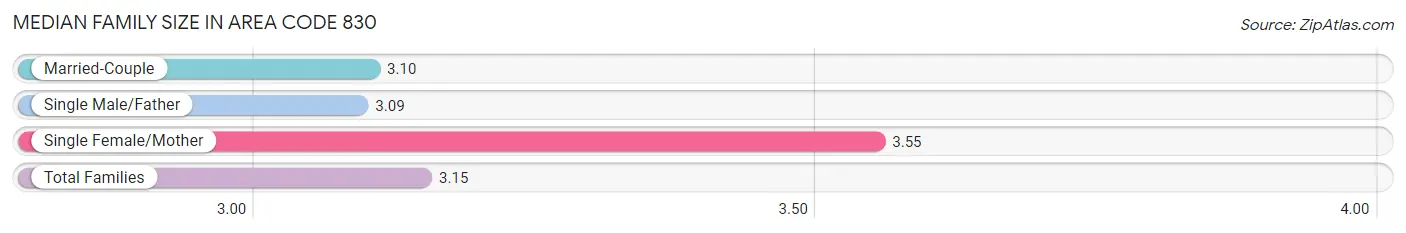
Median Family Size in Area Code 830
The median family size in Area Code 830 is 3.15 persons per family, with single female/mother families (38,838 | 16.1%) accounting for the largest median family size of 3.55281 persons per family. On the other hand, single male/father families (16,942 | 7.0%) represent the smallest median family size with 3.09 persons per family.
| Family Type | # Families | Family Size |
| Married-Couple | 185,351 (76.9%) | 3.10 |
| Single Male/Father | 16,942 (7.0%) | 3.09 |
| Single Female/Mother | 38,838 (16.1%) | 3.55 |
| Total Families | 241,131 (100.0%) | 3.15 |
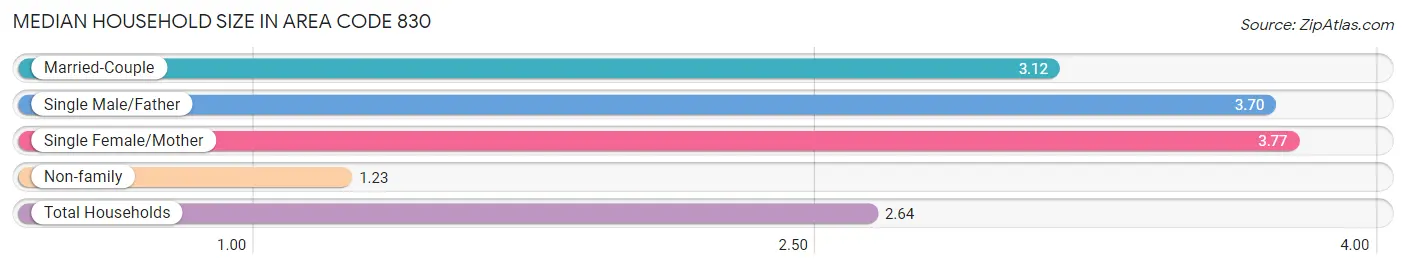
Median Household Size in Area Code 830
The median household size in Area Code 830 is 2.64 persons per household, with single female/mother households (38,838 | 11.8%) accounting for the largest median household size of 3.76583 persons per household. non-family households (88,423 | 26.8%) represent the smallest median household size with 1.23 persons per household.
| Household Type | # Households | Household Size |
| Married-Couple | 185,351 (56.2%) | 3.12 |
| Single Male/Father | 16,942 (5.1%) | 3.70 |
| Single Female/Mother | 38,838 (11.8%) | 3.77 |
| Non-family | 88,423 (26.8%) | 1.23 |
| Total Households | 329,554 (100.0%) | 2.64 |
Household Size by Marriage Status in Area Code 830
Out of a total of 329,554 households in Area Code 830, 241,131 (73.2%) are family households, while 88,423 (26.8%) are nonfamily households. The most numerous type of family households are 2-person households, comprising 106,251, and the most common type of nonfamily households are 1-person households, comprising 75,833.
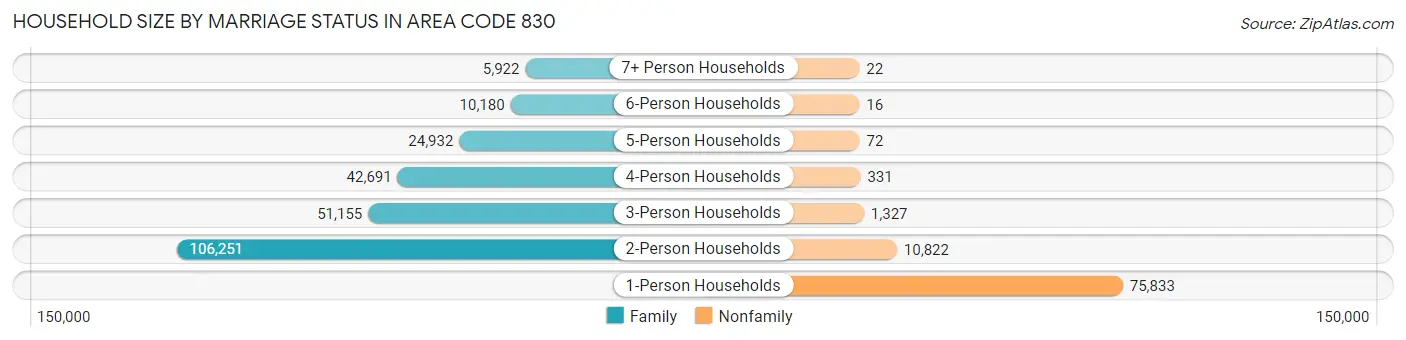
| Household Size | Family Households | Nonfamily Households |
| 1-Person Households | - | 75,833 (23.0%) |
| 2-Person Households | 106,251 (32.2%) | 10,822 (3.3%) |
| 3-Person Households | 51,155 (15.5%) | 1,327 (0.4%) |
| 4-Person Households | 42,691 (13.0%) | 331 (0.1%) |
| 5-Person Households | 24,932 (7.6%) | 72 (0.0%) |
| 6-Person Households | 10,180 (3.1%) | 16 (0.0%) |
| 7+ Person Households | 5,922 (1.8%) | 22 (0.0%) |
| Total | 241,131 (73.2%) | 88,423 (26.8%) |
Female Fertility in Area Code 830
Fertility by Age in Area Code 830
Average fertility rate in Area Code 830 is 84.7 births per 1,000 women. Women in the age bracket of 20 to 34 years have the highest fertility rate with 145.8 births per 1,000 women. Women in the age bracket of 20 to 34 years acount for 69.6% of all women with births.
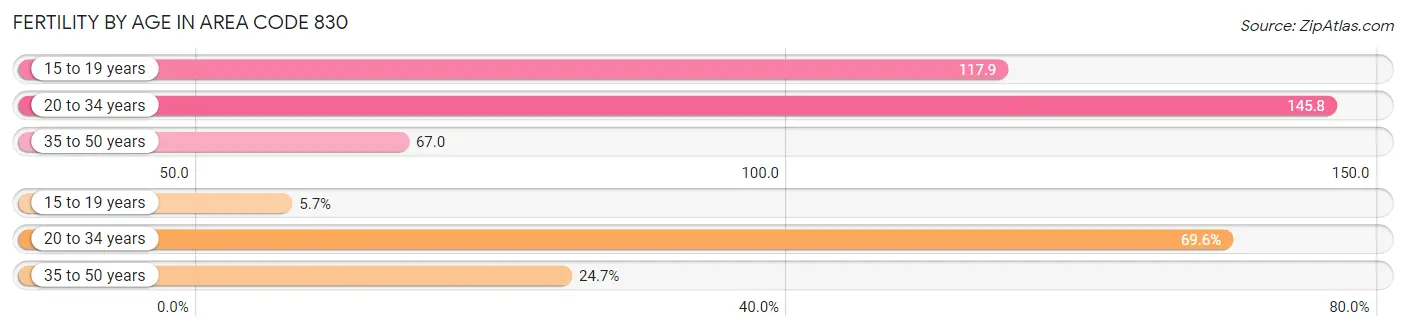
| Age Bracket | Women with Births | Births / 1,000 Women |
| 15 to 19 years | 728 (5.7%) | 117.9 |
| 20 to 34 years | 8,850 (69.6%) | 145.8 |
| 35 to 50 years | 3,144 (24.7%) | 67.0 |
| Total | 12,722 (100.0%) | 84.7 |
Fertility by Age by Marriage Status in Area Code 830
47.1% of women with births (12,722) in Area Code 830 are married. The highest percentage of unmarried women with births falls into 15 to 19 years age bracket with 100.0% of them unmarried at the time of birth, while the lowest percentage of unmarried women with births belong to 20 to 34 years age bracket with 53.7% of them unmarried.
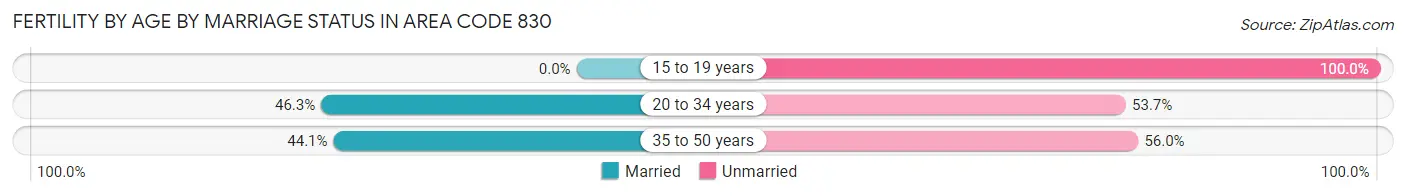
| Age Bracket | Married | Unmarried |
| 15 to 19 years | 0 (0.0%) | 728 (100.0%) |
| 20 to 34 years | 4,097 (46.3%) | 4,753 (53.7%) |
| 35 to 50 years | 1,385 (44.1%) | 1,759 (55.9%) |
| Total | 5,990 (47.1%) | 6,732 (52.9%) |
Fertility by Education in Area Code 830
Average fertility rate in Area Code 830 is 84.7 births per 1,000 women. Women with the education attainment of bachelor's degree have the highest fertility rate of 166.5 births per 1,000 women, while women with the education attainment of less than high school have the lowest fertility at 114.7 births per 1,000 women. Women with the education attainment of high school diploma represent 28.9% of all women with births.
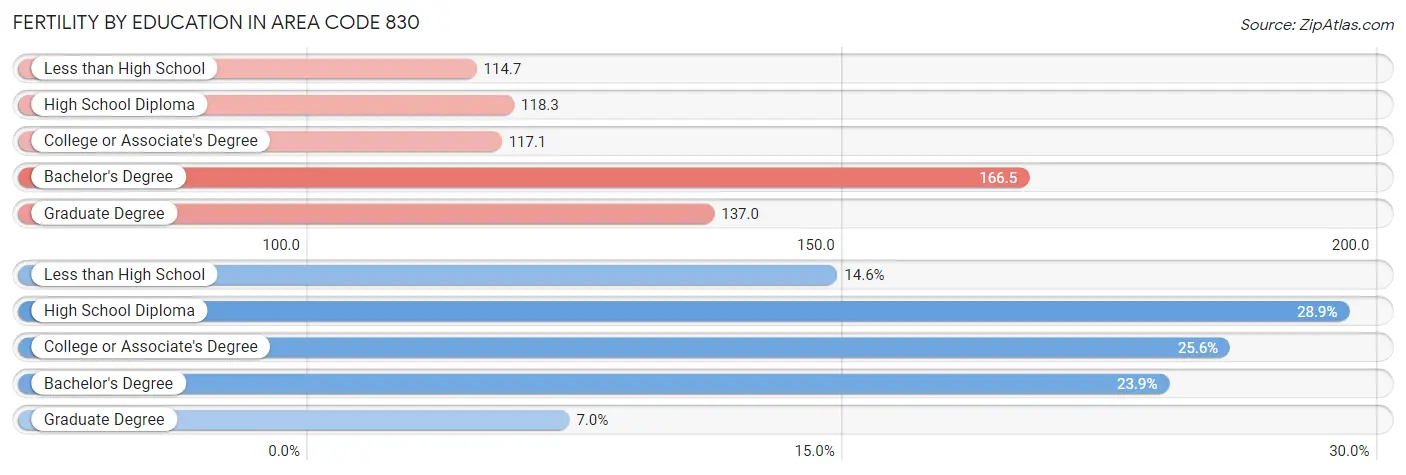
| Educational Attainment | Women with Births | Births / 1,000 Women |
| Less than High School | 1,852 (14.6%) | 114.7 |
| High School Diploma | 3,682 (28.9%) | 118.2 |
| College or Associate's Degree | 3,256 (25.6%) | 117.1 |
| Bachelor's Degree | 3,038 (23.9%) | 166.5 |
| Graduate Degree | 894 (7.0%) | 137.0 |
| Total | 12,722 (100.0%) | 84.7 |
Fertility by Education by Marriage Status in Area Code 830
52.9% of women with births in Area Code 830 are unmarried. Women with the educational attainment of bachelor's degree are most likely to be married with 58.7% of them married at childbirth, while women with the educational attainment of graduate degree are least likely to be married with 100.0% of them unmarried at childbirth.
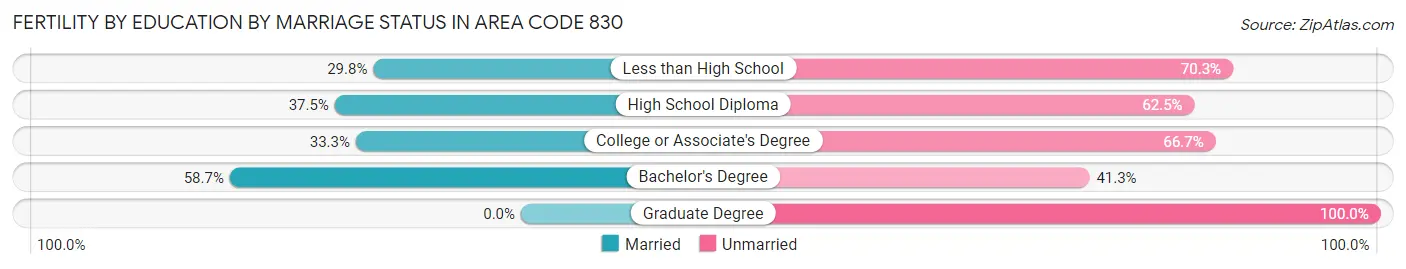
| Educational Attainment | Married | Unmarried |
| Less than High School | 551 (29.7%) | 1,301 (70.3%) |
| High School Diploma | 1,381 (37.5%) | 2,301 (62.5%) |
| College or Associate's Degree | 1,083 (33.3%) | 2,173 (66.7%) |
| Bachelor's Degree | 1,782 (58.7%) | 1,256 (41.3%) |
| Graduate Degree | 0 (0.0%) | 894 (100.0%) |
| Total | 5,990 (47.1%) | 6,732 (52.9%) |
Employment Characteristics in Area Code 830
Employment by Class of Employer in Area Code 830
Among the 401,112 employed individuals in Area Code 830, private company employees (256,305 | 63.9%), local government employees (34,933 | 8.7%), and self-employed (not incorporated) (33,548 | 8.4%) make up the most common classes of employment.
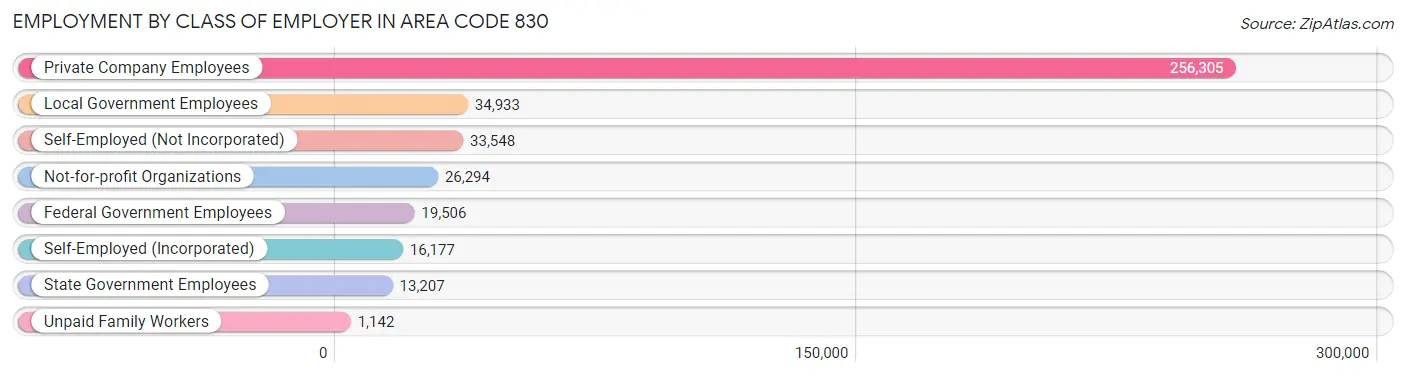
| Employer Class | # Employees | % Employees |
| Private Company Employees | 256,305 | 63.9% |
| Self-Employed (Incorporated) | 16,177 | 4.0% |
| Self-Employed (Not Incorporated) | 33,548 | 8.4% |
| Not-for-profit Organizations | 26,294 | 6.6% |
| Local Government Employees | 34,933 | 8.7% |
| State Government Employees | 13,207 | 3.3% |
| Federal Government Employees | 19,506 | 4.9% |
| Unpaid Family Workers | 1,142 | 0.3% |
| Total | 401,112 | 100.0% |
Employment Status by Age in Area Code 830
According to the labor force statistics for Area Code 830, out of the total population over 16 years of age (725,319), 52.6% or 381,735 individuals are in the labor force, with 5.5% or 20,995 of them unemployed. The age group with the highest labor force participation rate is 35 to 44 years, with 79.6% or 91,188 individuals in the labor force. Within the labor force, the 16 to 19 years age range has the highest percentage of unemployed individuals, with 764.1% or 162,814 of them being unemployed.
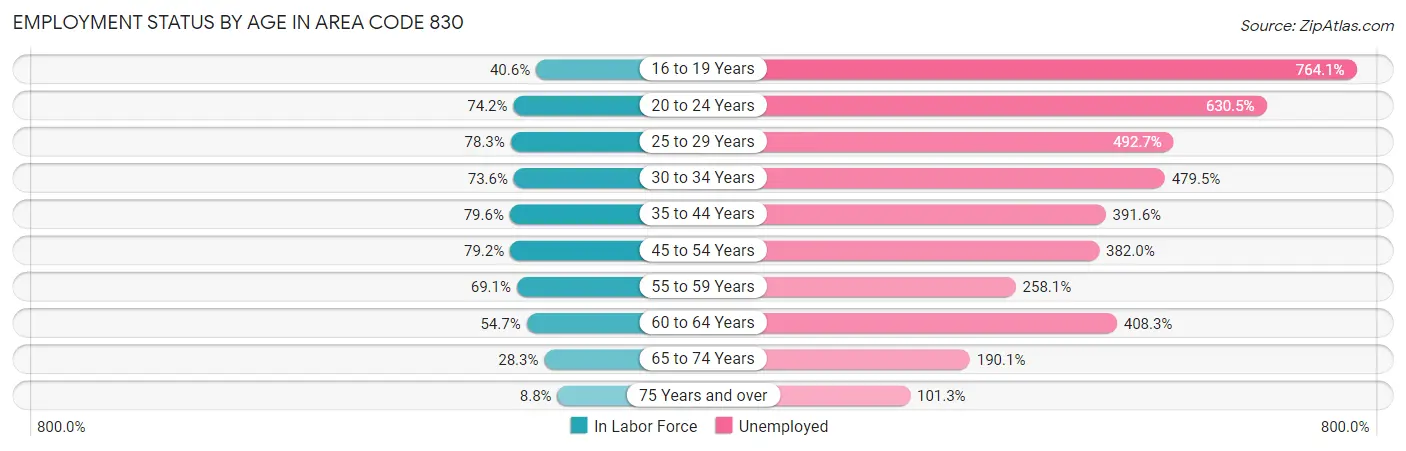
| Age Bracket | In Labor Force | Unemployed |
| 16 to 19 Years | 21,308 (40.6%) | 162,814 (764.1%) |
| 20 to 24 Years | 41,039 (74.2%) | 258,751 (630.5%) |
| 25 to 29 Years | 42,084 (78.3%) | 207,343 (492.7%) |
| 30 to 34 Years | 40,189 (73.6%) | 192,711 (479.5%) |
| 35 to 44 Years | 91,187 (79.6%) | 357,092 (391.6%) |
| 45 to 54 Years | 88,771 (79.2%) | 339,090 (382.0%) |
| 55 to 59 Years | 39,565 (69.1%) | 102,120 (258.1%) |
| 60 to 64 Years | 32,743 (54.7%) | 133,677 (408.3%) |
| 65 to 74 Years | 27,305 (28.3%) | 51,903 (190.1%) |
| 75 Years and over | 6,042 (8.7%) | 6,120 (101.3%) |
| Total | 381,755 (52.6%) | 20,981 (5.5%) |
Employment Status by Educational Attainment in Area Code 830
According to labor force statistics for Area Code 830, 71.3% of individuals (322,161) out of the total population between 25 and 64 years of age (452,092) are in the labor force, with 410.6% or 1,322,793 of them being unemployed. The group with the highest labor force participation rate are those with the educational attainment of bachelor's degree or higher, with 78.6% or 104,133 individuals in the labor force. Within the labor force, individuals with high school diploma education have the highest percentage of unemployment, with 513.9% or 475,101 of them being unemployed.
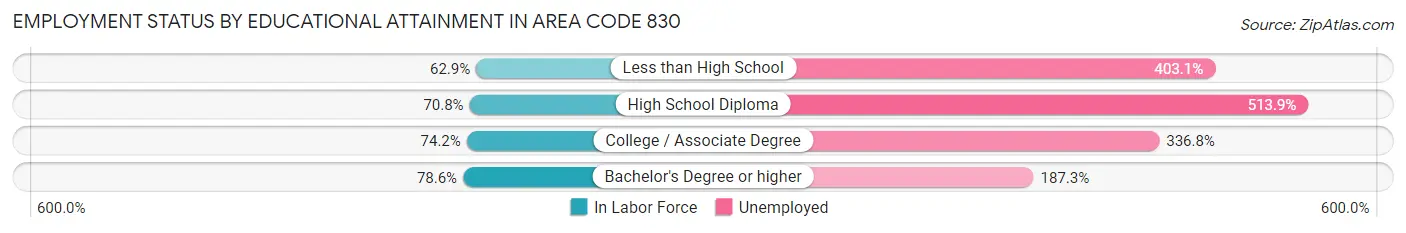
| Educational Attainment | In Labor Force | Unemployed |
| Less than High School | 35,468 (62.9%) | 227,187 (403.1%) |
| High School Diploma | 92,448 (70.8%) | 670,665 (513.9%) |
| College / Associate Degree | 98,406 (74.2%) | 446,849 (336.8%) |
| Bachelor's Degree or higher | 104,127 (78.6%) | 248,270 (187.3%) |
| Total | 322,171 (71.3%) | 1,856,290 (410.6%) |
Employment Occupations by Sex in Area Code 830
Management, Business, Science and Arts Occupations
The most common Management, Business, Science and Arts occupations in Area Code 830 are Management (45,383 | 11.2%), Community & Social Service (39,945 | 9.9%), Education Instruction & Library (24,870 | 6.1%), Health Diagnosing & Treating (24,245 | 6.0%), and Business & Financial (19,995 | 5.0%).
Management, Business, Science and Arts Occupations by Sex
Within the Management, Business, Science and Arts occupations in Area Code 830, the most male-oriented occupations are Architecture & Engineering (87.4%), Computers, Engineering & Science (79.9%), and Computers & Mathematics (78.9%), while the most female-oriented occupations are Education Instruction & Library (76.1%), Health Diagnosing & Treating (71.5%), and Health Technologists (70.3%).
| Occupation | Male | Female |
| Management | 27,713 (61.1%) | 17,670 (38.9%) |
| Business & Financial | 9,318 (46.6%) | 10,677 (53.4%) |
| Computers, Engineering & Science | 14,541 (79.9%) | 3,659 (20.1%) |
| Computers & Mathematics | 6,850 (78.9%) | 1,826 (21.0%) |
| Architecture & Engineering | 5,951 (87.4%) | 861 (12.6%) |
| Life, Physical & Social Science | 1,740 (64.2%) | 972 (35.8%) |
| Community & Social Service | 12,903 (32.3%) | 27,042 (67.7%) |
| Education, Arts & Media | 2,734 (41.7%) | 3,816 (58.3%) |
| Legal Services & Support | 1,416 (45.8%) | 1,676 (54.2%) |
| Education Instruction & Library | 5,949 (23.9%) | 18,921 (76.1%) |
| Arts, Media & Entertainment | 2,804 (51.6%) | 2,629 (48.4%) |
| Health Diagnosing & Treating | 6,917 (28.5%) | 17,328 (71.5%) |
| Health Technologists | 4,814 (29.7%) | 11,414 (70.3%) |
| Total (Category) | 71,392 (48.3%) | 76,376 (51.7%) |
| Total (Overall) | 221,559 (54.8%) | 182,650 (45.2%) |
Services Occupations
The most common Services occupations in Area Code 830 are Food Preparation & Serving (22,349 | 5.5%), Cleaning & Maintenance (14,415 | 3.6%), Healthcare Support (13,146 | 3.3%), Security & Protection (12,446 | 3.1%), and Personal Care & Service (9,183 | 2.3%).
Services Occupations by Sex
Within the Services occupations in Area Code 830, the most male-oriented occupations are Law Enforcement (84.0%), Security & Protection (79.2%), and Firefighting & Prevention (72.6%), while the most female-oriented occupations are Healthcare Support (88.2%), Personal Care & Service (77.7%), and Food Preparation & Serving (55.6%).
| Occupation | Male | Female |
| Healthcare Support | 1,556 (11.8%) | 11,590 (88.2%) |
| Security & Protection | 9,864 (79.2%) | 2,582 (20.7%) |
| Firefighting & Prevention | 3,776 (72.6%) | 1,424 (27.4%) |
| Law Enforcement | 6,088 (84.0%) | 1,158 (16.0%) |
| Food Preparation & Serving | 9,919 (44.4%) | 12,430 (55.6%) |
| Cleaning & Maintenance | 7,794 (54.1%) | 6,621 (45.9%) |
| Personal Care & Service | 2,043 (22.3%) | 7,140 (77.7%) |
| Total (Category) | 31,176 (43.6%) | 40,363 (56.4%) |
| Total (Overall) | 221,559 (54.8%) | 182,650 (45.2%) |
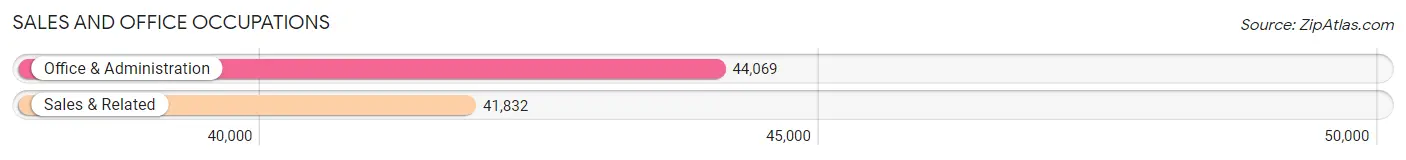
Sales and Office Occupations
The most common Sales and Office occupations in Area Code 830 are Office & Administration (44,069 | 10.9%), and Sales & Related (41,832 | 10.3%).
Sales and Office Occupations by Sex
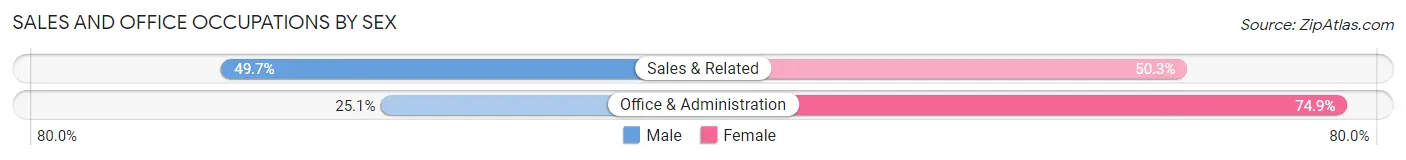
| Occupation | Male | Female |
| Sales & Related | 20,804 (49.7%) | 21,028 (50.3%) |
| Office & Administration | 11,070 (25.1%) | 32,999 (74.9%) |
| Total (Category) | 31,874 (37.1%) | 54,027 (62.9%) |
| Total (Overall) | 221,559 (54.8%) | 182,650 (45.2%) |
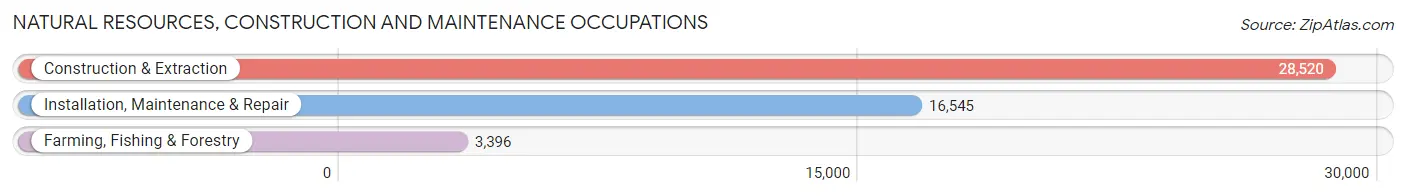
Natural Resources, Construction and Maintenance Occupations
The most common Natural Resources, Construction and Maintenance occupations in Area Code 830 are Construction & Extraction (28,520 | 7.1%), Installation, Maintenance & Repair (16,545 | 4.1%), and Farming, Fishing & Forestry (3,396 | 0.8%).
Natural Resources, Construction and Maintenance Occupations by Sex
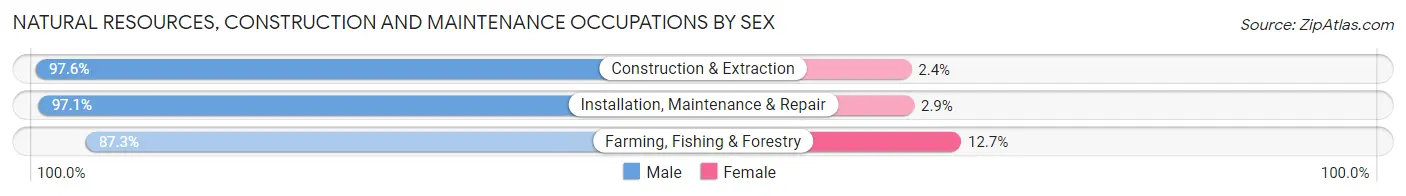
| Occupation | Male | Female |
| Farming, Fishing & Forestry | 2,964 (87.3%) | 432 (12.7%) |
| Construction & Extraction | 27,840 (97.6%) | 680 (2.4%) |
| Installation, Maintenance & Repair | 16,058 (97.1%) | 487 (2.9%) |
| Total (Category) | 46,862 (96.7%) | 1,599 (3.3%) |
| Total (Overall) | 221,559 (54.8%) | 182,650 (45.2%) |
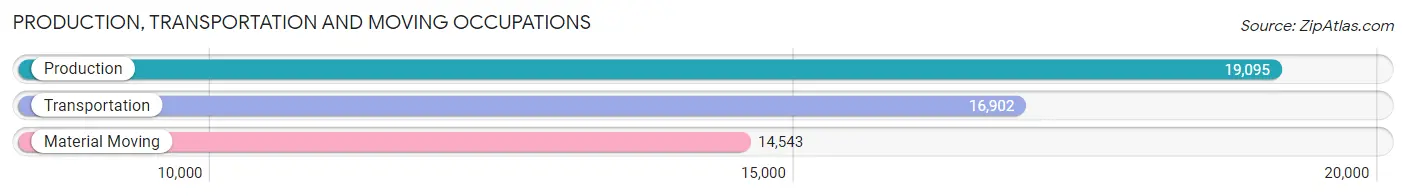
Production, Transportation and Moving Occupations
The most common Production, Transportation and Moving occupations in Area Code 830 are Production (19,095 | 4.7%), Transportation (16,902 | 4.2%), and Material Moving (14,543 | 3.6%).
Production, Transportation and Moving Occupations by Sex
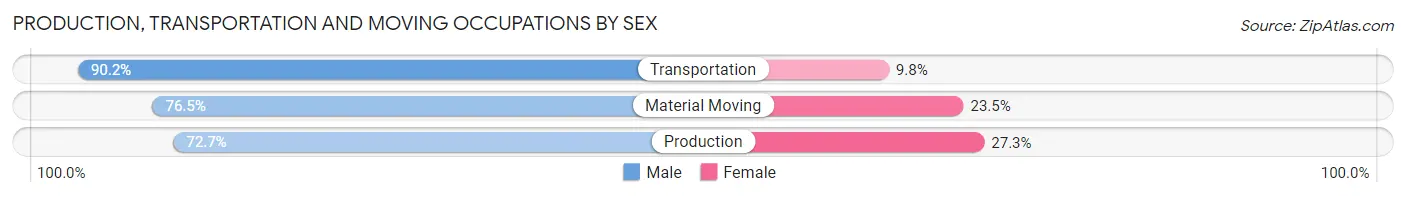
| Occupation | Male | Female |
| Production | 13,880 (72.7%) | 5,215 (27.3%) |
| Transportation | 15,248 (90.2%) | 1,654 (9.8%) |
| Material Moving | 11,127 (76.5%) | 3,416 (23.5%) |
| Total (Category) | 40,255 (79.6%) | 10,285 (20.3%) |
| Total (Overall) | 221,559 (54.8%) | 182,650 (45.2%) |
Employment Industries by Sex in Area Code 830
Employment Industries in Area Code 830
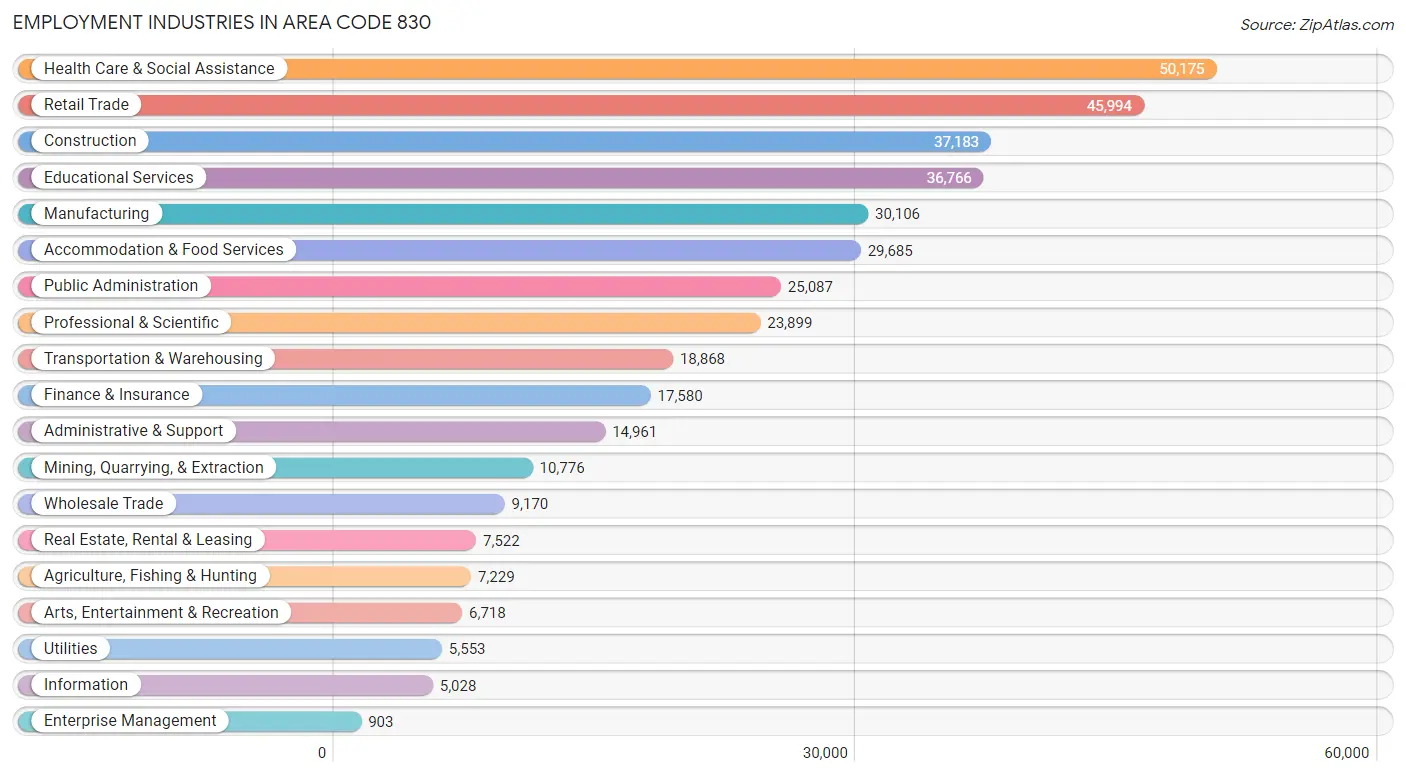
The major employment industries in Area Code 830 include Health Care & Social Assistance (50,175 | 12.4%), Retail Trade (45,994 | 11.4%), Construction (37,183 | 9.2%), Educational Services (36,766 | 9.1%), and Manufacturing (30,106 | 7.4%).
Employment Industries by Sex in Area Code 830
The Area Code 830 industries that see more men than women are Construction (89.1%), Mining, Quarrying, & Extraction (89.0%), and Transportation & Warehousing (82.4%), whereas the industries that tend to have a higher number of women are Health Care & Social Assistance (78.2%), Educational Services (71.7%), and Enterprise Management (66.7%).
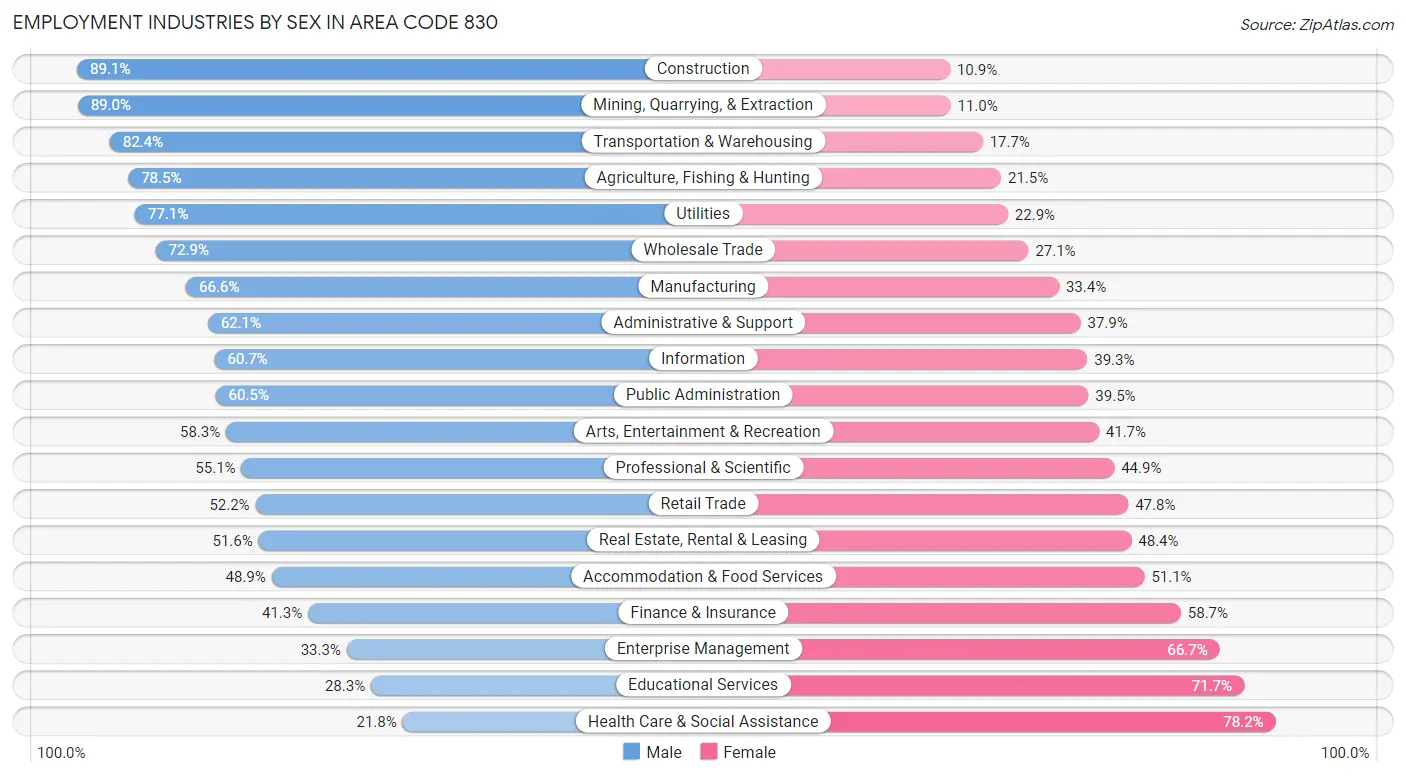
| Industry | Male | Female |
| Agriculture, Fishing & Hunting | 5,678 (78.5%) | 1,551 (21.5%) |
| Mining, Quarrying, & Extraction | 9,591 (89.0%) | 1,185 (11.0%) |
| Construction | 33,137 (89.1%) | 4,046 (10.9%) |
| Manufacturing | 20,039 (66.6%) | 10,067 (33.4%) |
| Wholesale Trade | 6,683 (72.9%) | 2,487 (27.1%) |
| Retail Trade | 24,018 (52.2%) | 21,976 (47.8%) |
| Transportation & Warehousing | 15,538 (82.4%) | 3,330 (17.6%) |
| Utilities | 4,283 (77.1%) | 1,270 (22.9%) |
| Information | 3,052 (60.7%) | 1,976 (39.3%) |
| Finance & Insurance | 7,265 (41.3%) | 10,315 (58.7%) |
| Real Estate, Rental & Leasing | 3,880 (51.6%) | 3,642 (48.4%) |
| Professional & Scientific | 13,174 (55.1%) | 10,725 (44.9%) |
| Enterprise Management | 301 (33.3%) | 602 (66.7%) |
| Administrative & Support | 9,289 (62.1%) | 5,672 (37.9%) |
| Educational Services | 10,404 (28.3%) | 26,362 (71.7%) |
| Health Care & Social Assistance | 10,923 (21.8%) | 39,252 (78.2%) |
| Arts, Entertainment & Recreation | 3,917 (58.3%) | 2,801 (41.7%) |
| Accommodation & Food Services | 14,507 (48.9%) | 15,178 (51.1%) |
| Public Administration | 15,171 (60.5%) | 9,916 (39.5%) |
| Total | 221,559 (54.8%) | 182,650 (45.2%) |
Education in Area Code 830
School Enrollment in Area Code 830
The most common levels of schooling among the 216,328 students in Area Code 830 are high school (54,781 | 25.3%), elementary school (49,108 | 22.7%), and middle school (49,001 | 22.7%).
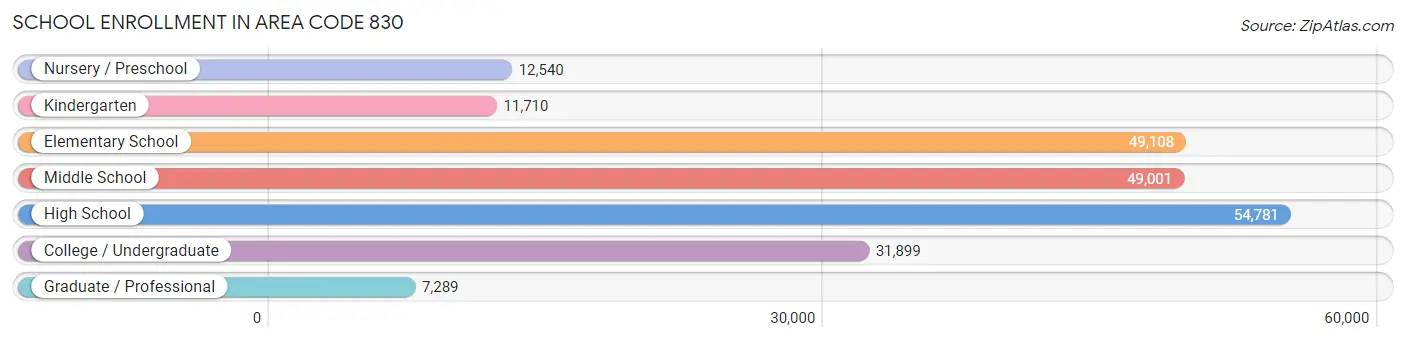
| School Level | # Students | % Students |
| Nursery / Preschool | 12,540 | 5.8% |
| Kindergarten | 11,710 | 5.4% |
| Elementary School | 49,108 | 22.7% |
| Middle School | 49,001 | 22.7% |
| High School | 54,781 | 25.3% |
| College / Undergraduate | 31,899 | 14.7% |
| Graduate / Professional | 7,289 | 3.4% |
| Total | 216,328 | 100.0% |
School Enrollment by Age by Funding Source in Area Code 830
Out of a total of 216,328 students who are enrolled in schools in Area Code 830, 31,259 (14.4%) attend a private institution, while the remaining 185,069 (85.6%) are enrolled in public schools. The age group of 3 to 4 year olds has the highest likelihood of being enrolled in private schools, with 3,608 (35.7% in the age bracket) enrolled. Conversely, the age group of 15 to 17 year olds has the lowest likelihood of being enrolled in a private school, with 34,638 (90.0% in the age bracket) attending a public institution.
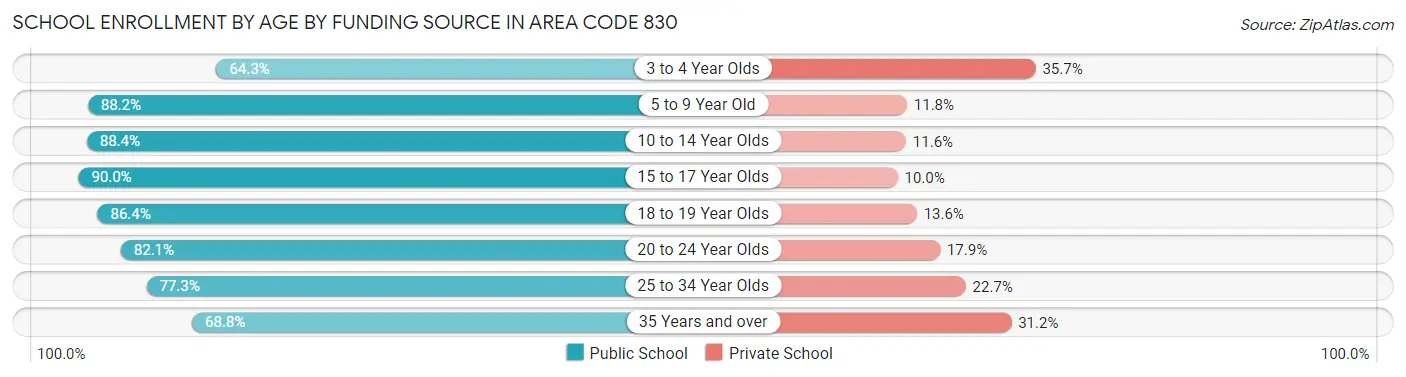
| Age Bracket | Public School | Private School |
| 3 to 4 Year Olds | 6,490 (64.3%) | 3,608 (35.7%) |
| 5 to 9 Year Old | 50,040 (88.2%) | 6,678 (11.8%) |
| 10 to 14 Year Olds | 53,710 (88.4%) | 7,038 (11.6%) |
| 15 to 17 Year Olds | 34,638 (90.0%) | 3,864 (10.0%) |
| 18 to 19 Year Olds | 14,216 (86.4%) | 2,237 (13.6%) |
| 20 to 24 Year Olds | 12,133 (82.1%) | 2,653 (17.9%) |
| 25 to 34 Year Olds | 6,863 (77.3%) | 2,018 (22.7%) |
| 35 Years and over | 6,977 (68.8%) | 3,165 (31.2%) |
| Total | 185,069 (85.6%) | 31,259 (14.4%) |
Educational Attainment by Field of Study in Area Code 830
Business (42,861 | 22.4%), education (28,814 | 15.0%), science & technology (20,528 | 10.7%), bio, nature & agricultural (13,380 | 7.0%), and arts & humanities (13,253 | 6.9%) are the most common fields of study among 191,465 individuals in Area Code 830 who have obtained a bachelor's degree or higher.
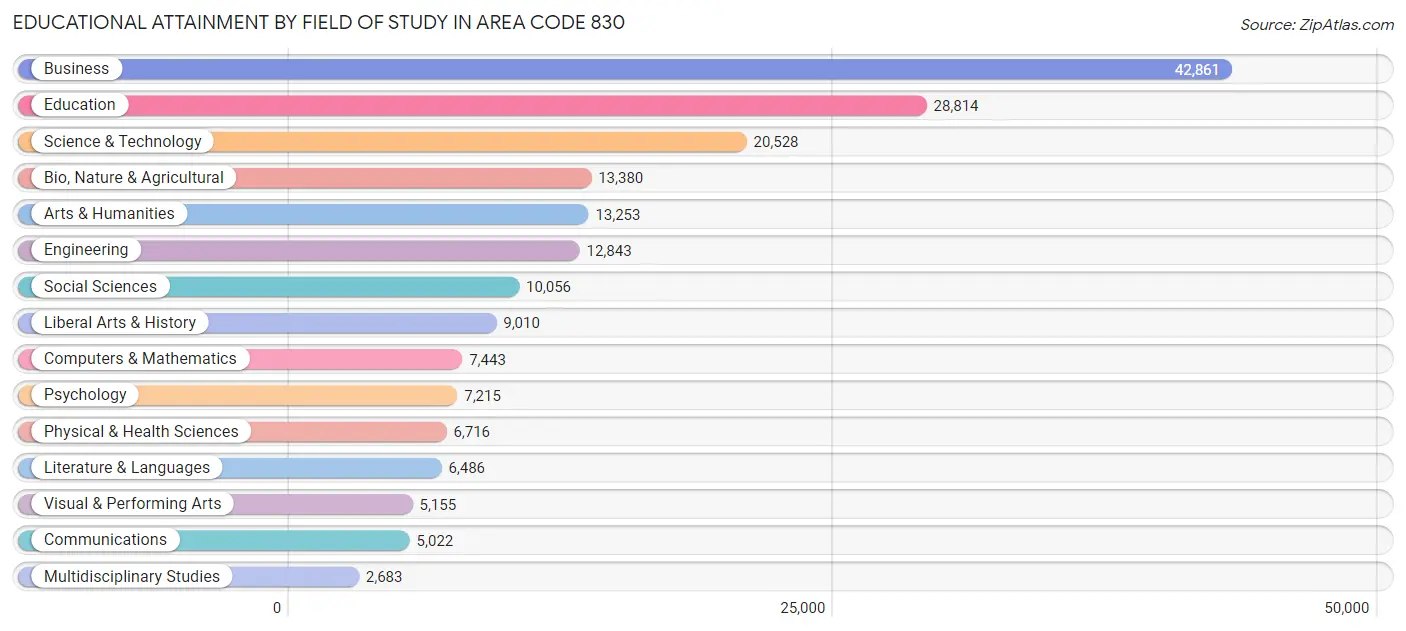
| Field of Study | # Graduates | % Graduates |
| Computers & Mathematics | 7,443 | 3.9% |
| Bio, Nature & Agricultural | 13,380 | 7.0% |
| Physical & Health Sciences | 6,716 | 3.5% |
| Psychology | 7,215 | 3.8% |
| Social Sciences | 10,056 | 5.2% |
| Engineering | 12,843 | 6.7% |
| Multidisciplinary Studies | 2,683 | 1.4% |
| Science & Technology | 20,528 | 10.7% |
| Business | 42,861 | 22.4% |
| Education | 28,814 | 15.0% |
| Literature & Languages | 6,486 | 3.4% |
| Liberal Arts & History | 9,010 | 4.7% |
| Visual & Performing Arts | 5,155 | 2.7% |
| Communications | 5,022 | 2.6% |
| Arts & Humanities | 13,253 | 6.9% |
| Total | 191,465 | 100.0% |
Transportation & Commute in Area Code 830
Vehicle Availability by Sex in Area Code 830
The most prevalent vehicle ownership categories in Area Code 830 are males with 2 vehicles (92,961, accounting for 42.1%) and females with 2 vehicles (72,401, making up 52.0%).
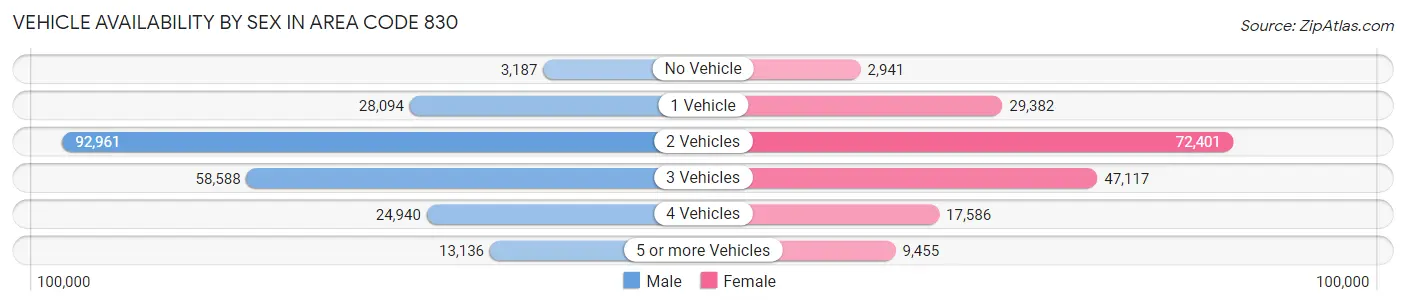
| Vehicles Available | Male | Female |
| No Vehicle | 3,187 (1.4%) | 2,941 (1.6%) |
| 1 Vehicle | 28,094 (12.7%) | 29,382 (16.4%) |
| 2 Vehicles | 92,961 (42.1%) | 72,401 (40.5%) |
| 3 Vehicles | 58,588 (26.5%) | 47,117 (26.3%) |
| 4 Vehicles | 24,940 (11.3%) | 17,586 (9.8%) |
| 5 or more Vehicles | 13,136 (5.9%) | 9,455 (5.3%) |
| Total | 220,906 (100.0%) | 178,882 (100.0%) |
Commute Time in Area Code 830
The most frequently occuring commute durations in Area Code 830 are 10 to 14 minutes (52,060 commuters, 14.5%), 15 to 19 minutes (48,644 commuters, 13.6%), and 5 to 9 minutes (46,904 commuters, 13.1%).
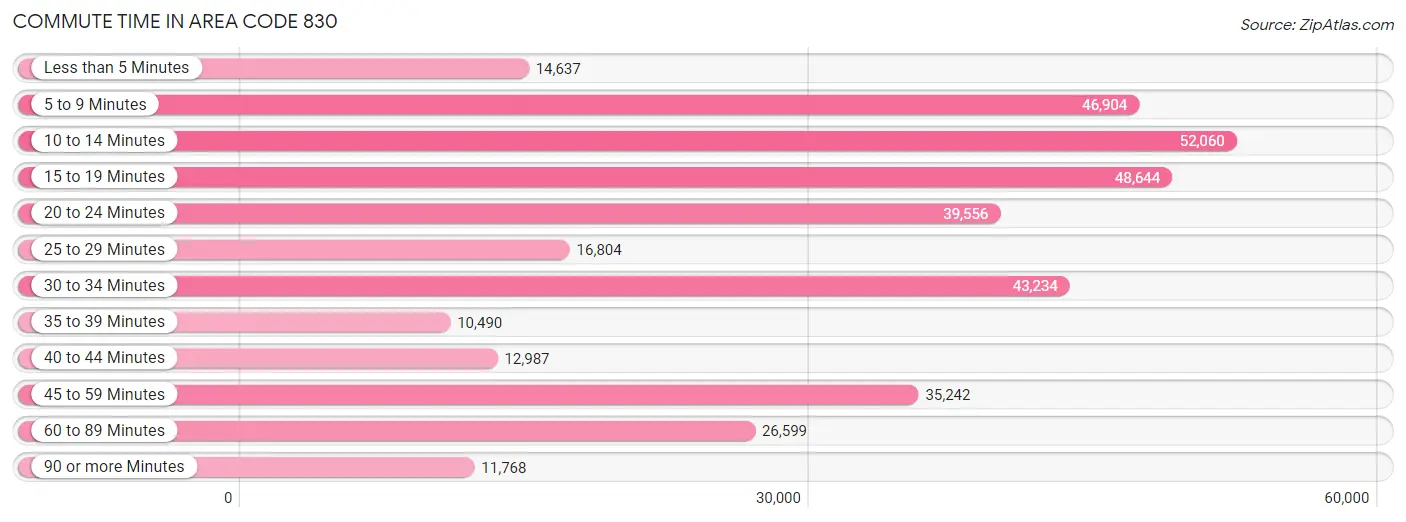
| Commute Time | # Commuters | % Commuters |
| Less than 5 Minutes | 14,637 | 4.1% |
| 5 to 9 Minutes | 46,904 | 13.1% |
| 10 to 14 Minutes | 52,060 | 14.5% |
| 15 to 19 Minutes | 48,644 | 13.6% |
| 20 to 24 Minutes | 39,556 | 11.0% |
| 25 to 29 Minutes | 16,804 | 4.7% |
| 30 to 34 Minutes | 43,234 | 12.0% |
| 35 to 39 Minutes | 10,490 | 2.9% |
| 40 to 44 Minutes | 12,987 | 3.6% |
| 45 to 59 Minutes | 35,242 | 9.8% |
| 60 to 89 Minutes | 26,599 | 7.4% |
| 90 or more Minutes | 11,768 | 3.3% |
Commute Time by Sex in Area Code 830
The most common commute times in Area Code 830 are 10 to 14 minutes (26,726 commuters, 13.3%) for males and 10 to 14 minutes (25,334 commuters, 16.0%) for females.
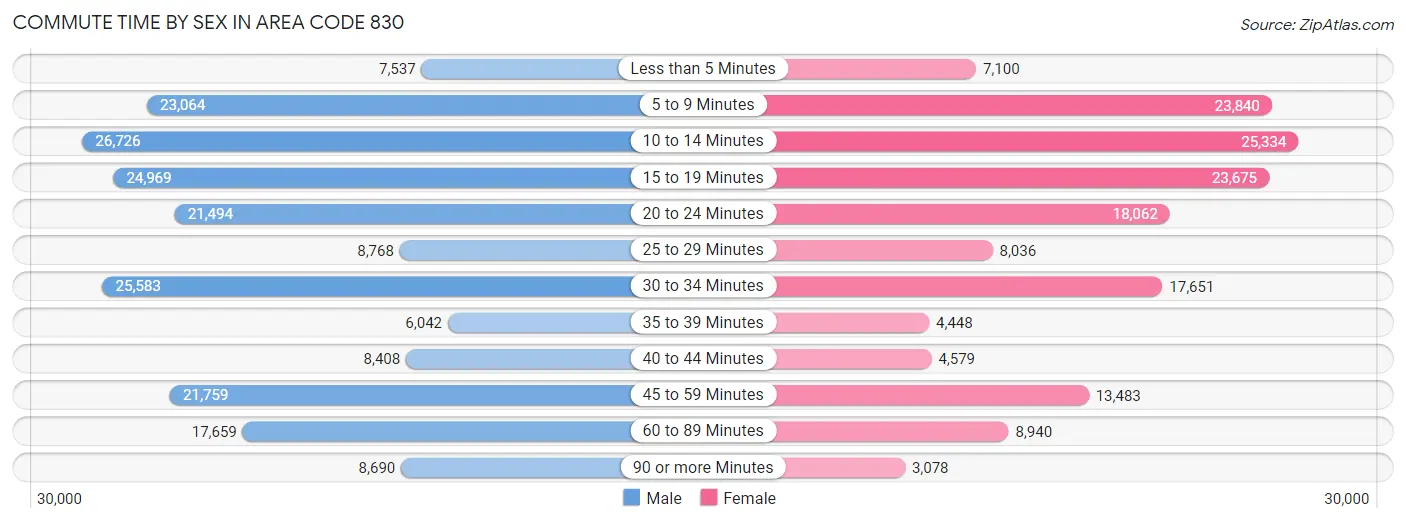
| Commute Time | Male | Female |
| Less than 5 Minutes | 7,537 (3.8%) | 7,100 (4.5%) |
| 5 to 9 Minutes | 23,064 (11.5%) | 23,840 (15.1%) |
| 10 to 14 Minutes | 26,726 (13.3%) | 25,334 (16.0%) |
| 15 to 19 Minutes | 24,969 (12.4%) | 23,675 (15.0%) |
| 20 to 24 Minutes | 21,494 (10.7%) | 18,062 (11.4%) |
| 25 to 29 Minutes | 8,768 (4.4%) | 8,036 (5.1%) |
| 30 to 34 Minutes | 25,583 (12.8%) | 17,651 (11.2%) |
| 35 to 39 Minutes | 6,042 (3.0%) | 4,448 (2.8%) |
| 40 to 44 Minutes | 8,408 (4.2%) | 4,579 (2.9%) |
| 45 to 59 Minutes | 21,759 (10.8%) | 13,483 (8.5%) |
| 60 to 89 Minutes | 17,659 (8.8%) | 8,940 (5.7%) |
| 90 or more Minutes | 8,690 (4.3%) | 3,078 (1.9%) |
Time of Departure to Work by Sex in Area Code 830
The most frequent times of departure to work in Area Code 830 are 7:00 AM to 7:29 AM (31,381, 15.6%) for males and 7:00 AM to 7:29 AM (26,820, 17.0%) for females.
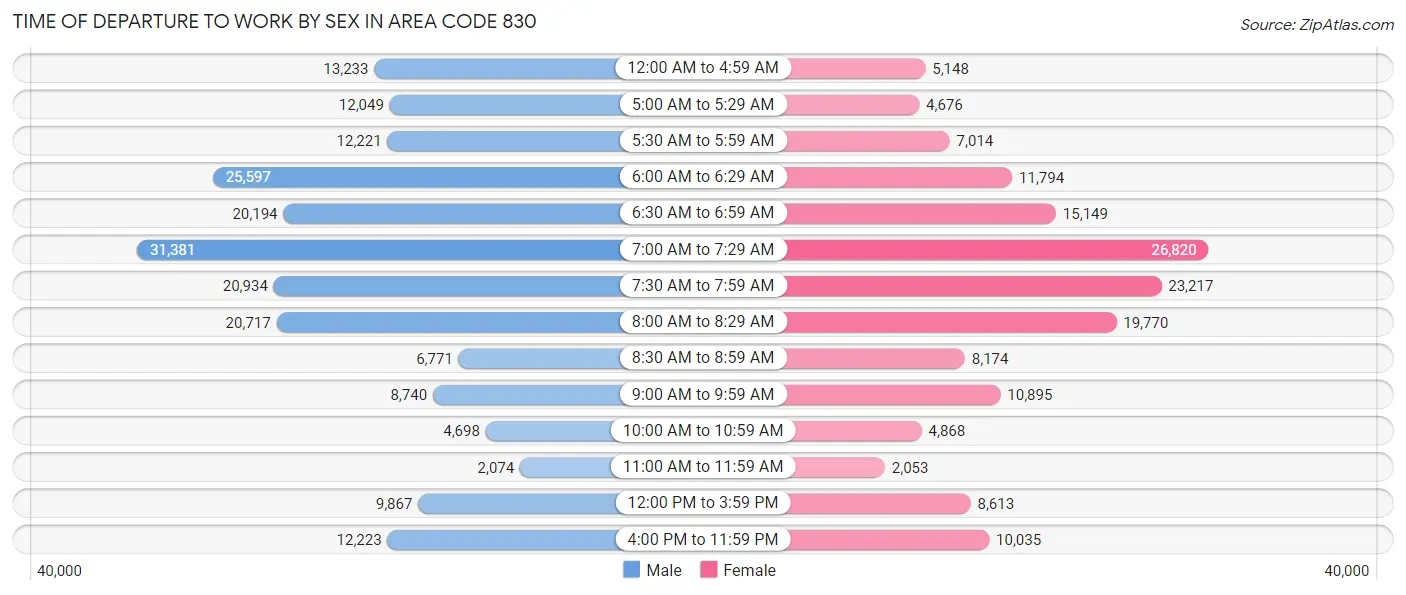
| Time of Departure | Male | Female |
| 12:00 AM to 4:59 AM | 13,233 (6.6%) | 5,148 (3.3%) |
| 5:00 AM to 5:29 AM | 12,049 (6.0%) | 4,676 (3.0%) |
| 5:30 AM to 5:59 AM | 12,221 (6.1%) | 7,014 (4.4%) |
| 6:00 AM to 6:29 AM | 25,597 (12.8%) | 11,794 (7.4%) |
| 6:30 AM to 6:59 AM | 20,194 (10.1%) | 15,149 (9.6%) |
| 7:00 AM to 7:29 AM | 31,381 (15.6%) | 26,820 (17.0%) |
| 7:30 AM to 7:59 AM | 20,934 (10.4%) | 23,217 (14.7%) |
| 8:00 AM to 8:29 AM | 20,717 (10.3%) | 19,770 (12.5%) |
| 8:30 AM to 8:59 AM | 6,771 (3.4%) | 8,174 (5.2%) |
| 9:00 AM to 9:59 AM | 8,740 (4.3%) | 10,895 (6.9%) |
| 10:00 AM to 10:59 AM | 4,698 (2.3%) | 4,868 (3.1%) |
| 11:00 AM to 11:59 AM | 2,074 (1.0%) | 2,053 (1.3%) |
| 12:00 PM to 3:59 PM | 9,867 (4.9%) | 8,613 (5.4%) |
| 4:00 PM to 11:59 PM | 12,223 (6.1%) | 10,035 (6.3%) |
| Total | 200,699 (100.0%) | 158,226 (100.0%) |
Housing Occupancy in Area Code 830
Occupancy by Ownership in Area Code 830
Of the total 329,554 dwellings in Area Code 830, owner-occupied units account for 248,811 (75.5%), while renter-occupied units make up 80,743 (24.5%).
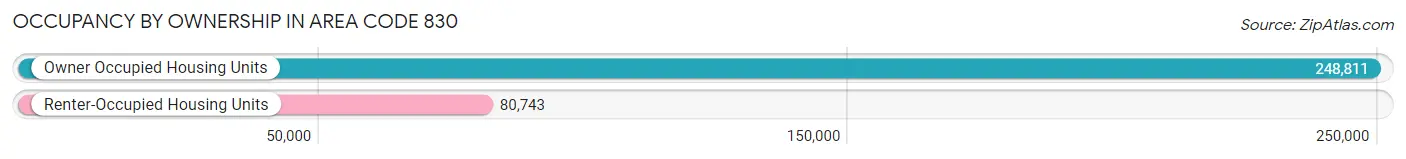
| Occupancy | # Housing Units | % Housing Units |
| Owner Occupied Housing Units | 248,811 | 75.5% |
| Renter-Occupied Housing Units | 80,743 | 24.5% |
| Total Occupied Housing Units | 329,554 | 100.0% |
Occupancy by Household Size in Area Code 830
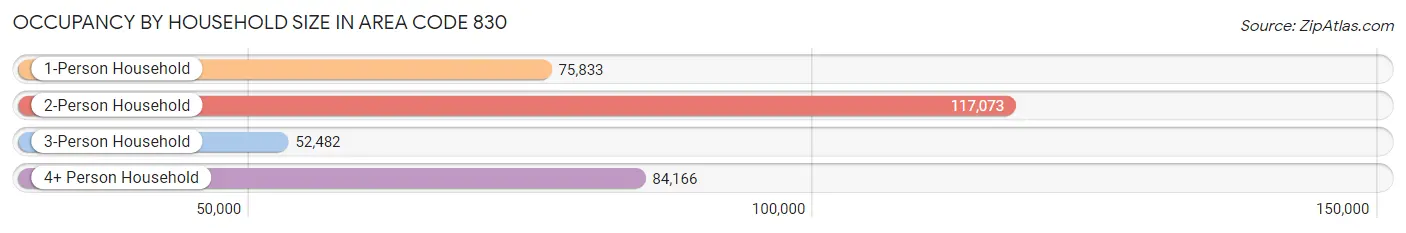
| Household Size | # Housing Units | % Housing Units |
| 1-Person Household | 75,833 | 23.0% |
| 2-Person Household | 117,073 | 35.5% |
| 3-Person Household | 52,482 | 15.9% |
| 4+ Person Household | 84,166 | 25.5% |
| Total Housing Units | 329,554 | 100.0% |
Occupancy by Ownership by Household Size in Area Code 830
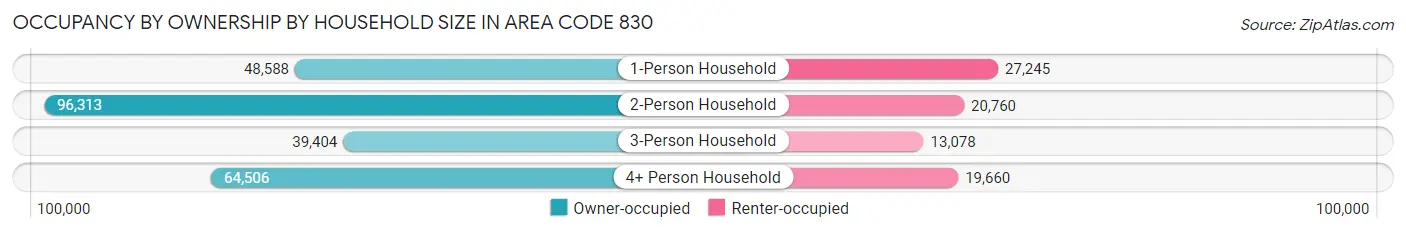
| Household Size | Owner-occupied | Renter-occupied |
| 1-Person Household | 48,588 (64.1%) | 27,245 (35.9%) |
| 2-Person Household | 96,313 (82.3%) | 20,760 (17.7%) |
| 3-Person Household | 39,404 (75.1%) | 13,078 (24.9%) |
| 4+ Person Household | 64,506 (76.6%) | 19,660 (23.4%) |
| Total Housing Units | 248,811 (75.5%) | 80,743 (24.5%) |
Occupancy by Educational Attainment in Area Code 830
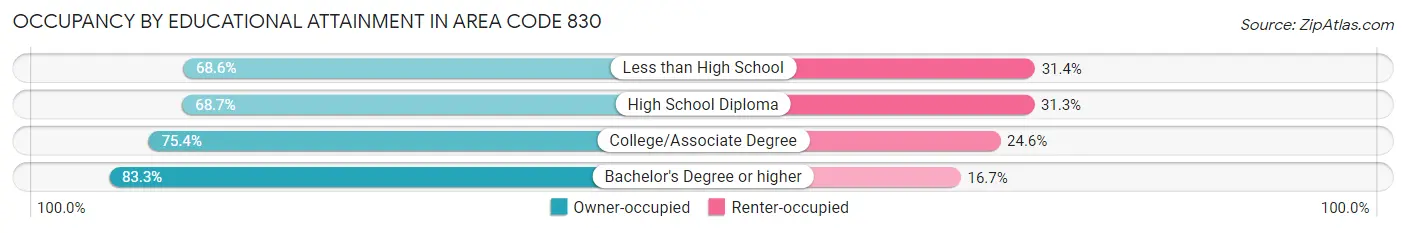
| Household Size | Owner-occupied | Renter-occupied |
| Less than High School | 27,397 (68.6%) | 12,560 (31.4%) |
| High School Diploma | 56,165 (68.7%) | 25,570 (31.3%) |
| College/Associate Degree | 75,419 (75.4%) | 24,569 (24.6%) |
| Bachelor's Degree or higher | 89,830 (83.3%) | 18,044 (16.7%) |
Occupancy by Age of Householder in Area Code 830
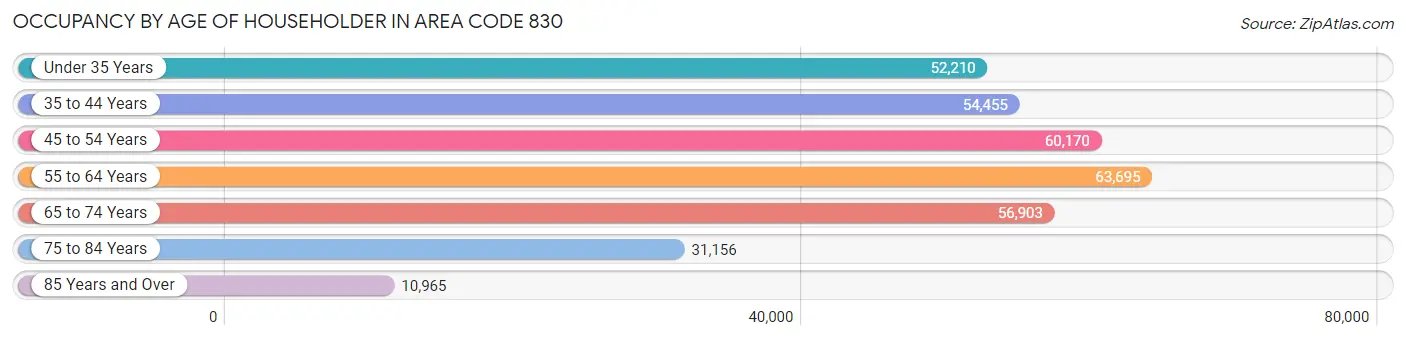
| Age Bracket | # Households | % Households |
| Under 35 Years | 52,210 | 15.8% |
| 35 to 44 Years | 54,455 | 16.5% |
| 45 to 54 Years | 60,170 | 18.3% |
| 55 to 64 Years | 63,695 | 19.3% |
| 65 to 74 Years | 56,903 | 17.3% |
| 75 to 84 Years | 31,156 | 9.5% |
| 85 Years and Over | 10,965 | 3.3% |
| Total | 329,554 | 100.0% |
Housing Finances in Area Code 830
Median Income by Occupancy in Area Code 830
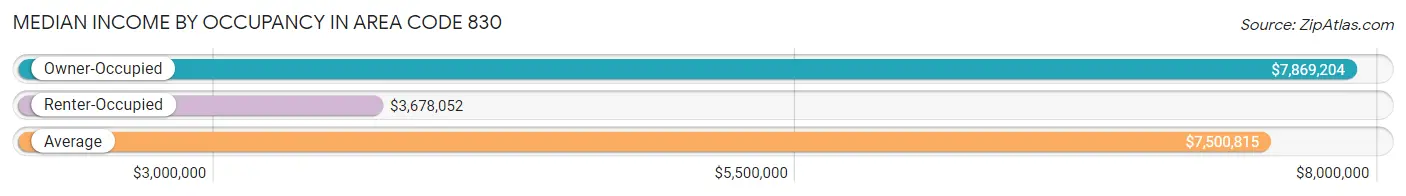
| Occupancy Type | # Households | Median Income |
| Owner-Occupied | 248,811 (75.5%) | $7,869,204 |
| Renter-Occupied | 80,743 (24.5%) | $3,678,052 |
| Average | 329,554 (100.0%) | $7,500,815 |
Occupancy by Householder Income Bracket in Area Code 830
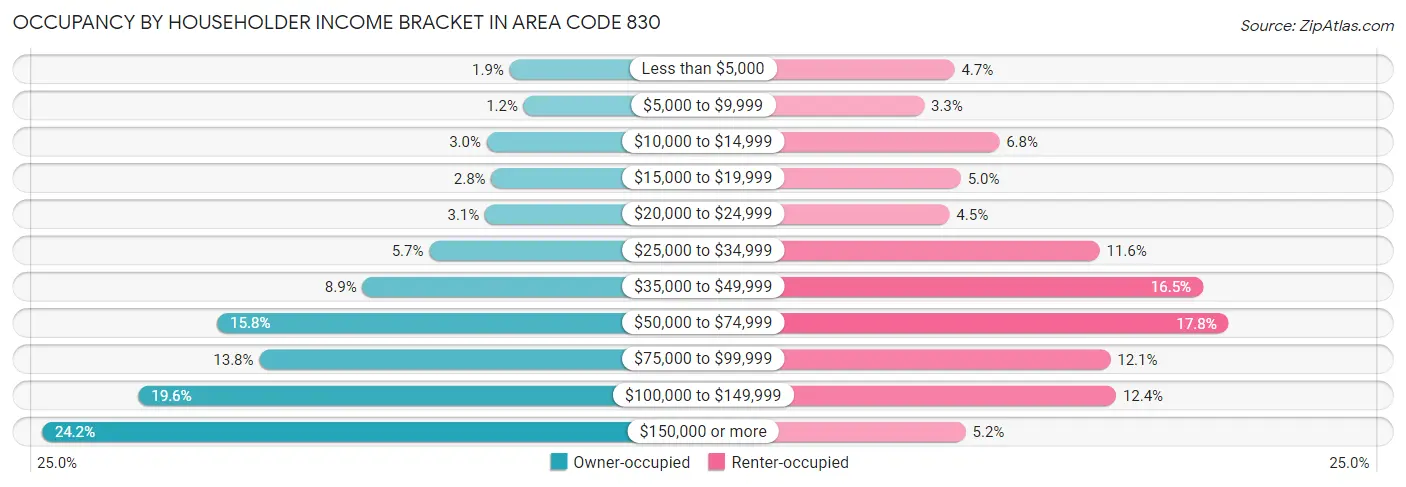
| Income Bracket | Owner-occupied | Renter-occupied |
| Less than $5,000 | 4,735 (1.9%) | 3,803 (4.7%) |
| $5,000 to $9,999 | 3,063 (1.2%) | 2,629 (3.3%) |
| $10,000 to $14,999 | 7,441 (3.0%) | 5,525 (6.8%) |
| $15,000 to $19,999 | 6,881 (2.8%) | 4,048 (5.0%) |
| $20,000 to $24,999 | 7,628 (3.1%) | 3,609 (4.5%) |
| $25,000 to $34,999 | 14,255 (5.7%) | 9,385 (11.6%) |
| $35,000 to $49,999 | 22,170 (8.9%) | 13,358 (16.5%) |
| $50,000 to $74,999 | 39,395 (15.8%) | 14,342 (17.8%) |
| $75,000 to $99,999 | 34,374 (13.8%) | 9,797 (12.1%) |
| $100,000 to $149,999 | 48,714 (19.6%) | 10,014 (12.4%) |
| $150,000 or more | 60,155 (24.2%) | 4,233 (5.2%) |
| Total | 248,811 (100.0%) | 80,743 (100.0%) |
Monthly Housing Cost Tiers in Area Code 830
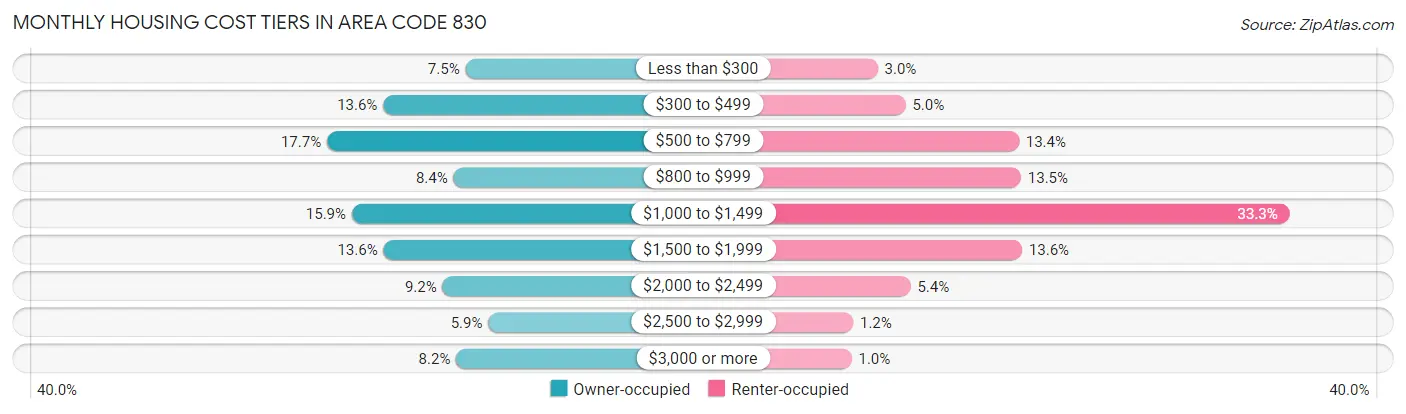
| Monthly Cost | Owner-occupied | Renter-occupied |
| Less than $300 | 18,745 (7.5%) | 2,388 (3.0%) |
| $300 to $499 | 33,805 (13.6%) | 4,046 (5.0%) |
| $500 to $799 | 44,119 (17.7%) | 10,787 (13.4%) |
| $800 to $999 | 20,919 (8.4%) | 10,909 (13.5%) |
| $1,000 to $1,499 | 39,549 (15.9%) | 26,888 (33.3%) |
| $1,500 to $1,999 | 33,759 (13.6%) | 10,970 (13.6%) |
| $2,000 to $2,499 | 22,943 (9.2%) | 4,345 (5.4%) |
| $2,500 to $2,999 | 14,545 (5.9%) | 926 (1.1%) |
| $3,000 or more | 20,427 (8.2%) | 842 (1.0%) |
| Total | 248,811 (100.0%) | 80,743 (100.0%) |
Physical Housing Characteristics in Area Code 830
Housing Structures in Area Code 830
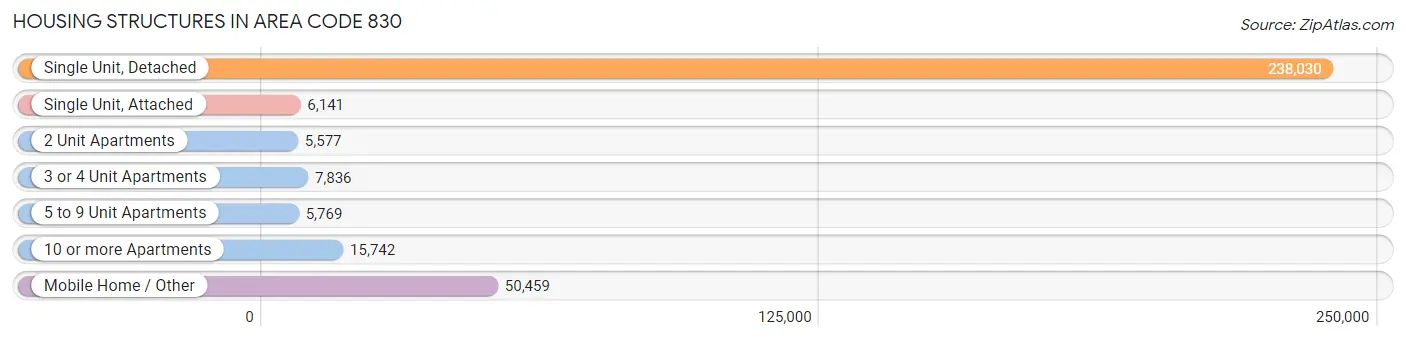
| Structure Type | # Housing Units | % Housing Units |
| Single Unit, Detached | 238,030 | 72.2% |
| Single Unit, Attached | 6,141 | 1.9% |
| 2 Unit Apartments | 5,577 | 1.7% |
| 3 or 4 Unit Apartments | 7,836 | 2.4% |
| 5 to 9 Unit Apartments | 5,769 | 1.8% |
| 10 or more Apartments | 15,742 | 4.8% |
| Mobile Home / Other | 50,459 | 15.3% |
| Total | 329,554 | 100.0% |
Housing Structures by Occupancy in Area Code 830
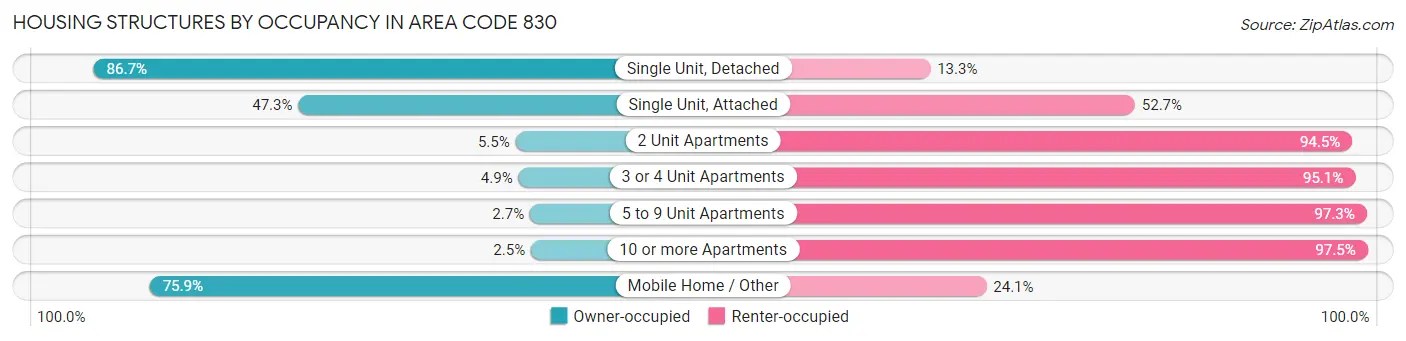
| Structure Type | Owner-occupied | Renter-occupied |
| Single Unit, Detached | 206,370 (86.7%) | 31,660 (13.3%) |
| Single Unit, Attached | 2,905 (47.3%) | 3,236 (52.7%) |
| 2 Unit Apartments | 305 (5.5%) | 5,272 (94.5%) |
| 3 or 4 Unit Apartments | 385 (4.9%) | 7,451 (95.1%) |
| 5 to 9 Unit Apartments | 155 (2.7%) | 5,614 (97.3%) |
| 10 or more Apartments | 393 (2.5%) | 15,349 (97.5%) |
| Mobile Home / Other | 38,298 (75.9%) | 12,161 (24.1%) |
| Total | 248,811 (75.5%) | 80,743 (24.5%) |
Housing Structures by Number of Rooms in Area Code 830
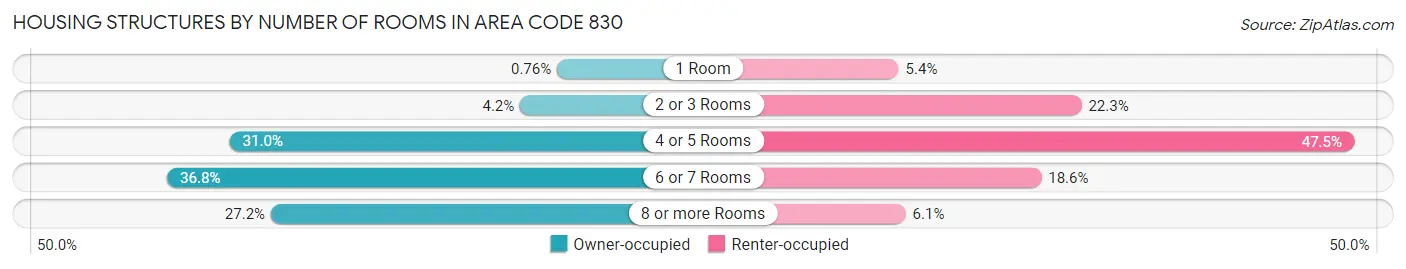
| Number of Rooms | Owner-occupied | Renter-occupied |
| 1 Room | 1,895 (0.8%) | 4,388 (5.4%) |
| 2 or 3 Rooms | 10,377 (4.2%) | 18,037 (22.3%) |
| 4 or 5 Rooms | 77,212 (31.0%) | 38,373 (47.5%) |
| 6 or 7 Rooms | 91,594 (36.8%) | 15,036 (18.6%) |
| 8 or more Rooms | 67,733 (27.2%) | 4,909 (6.1%) |
| Total | 248,811 (100.0%) | 80,743 (100.0%) |
Housing Structure by Heating Type in Area Code 830
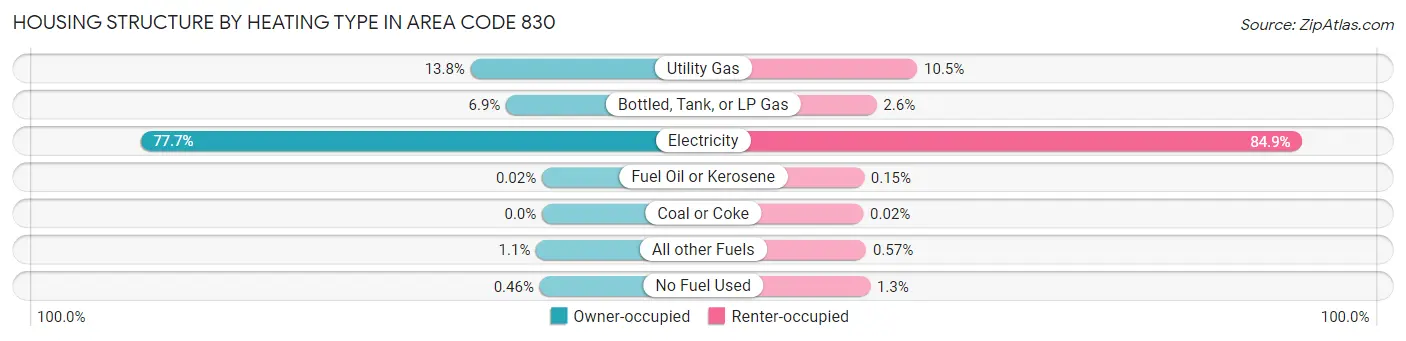
| Heating Type | Owner-occupied | Renter-occupied |
| Utility Gas | 34,338 (13.8%) | 8,434 (10.4%) |
| Bottled, Tank, or LP Gas | 17,256 (6.9%) | 2,083 (2.6%) |
| Electricity | 193,234 (77.7%) | 68,553 (84.9%) |
| Fuel Oil or Kerosene | 41 (0.0%) | 119 (0.2%) |
| Coal or Coke | 0 (0.0%) | 17 (0.0%) |
| All other Fuels | 2,802 (1.1%) | 460 (0.6%) |
| No Fuel Used | 1,140 (0.5%) | 1,077 (1.3%) |
| Total | 248,811 (100.0%) | 80,743 (100.0%) |
Household Vehicle Usage in Area Code 830
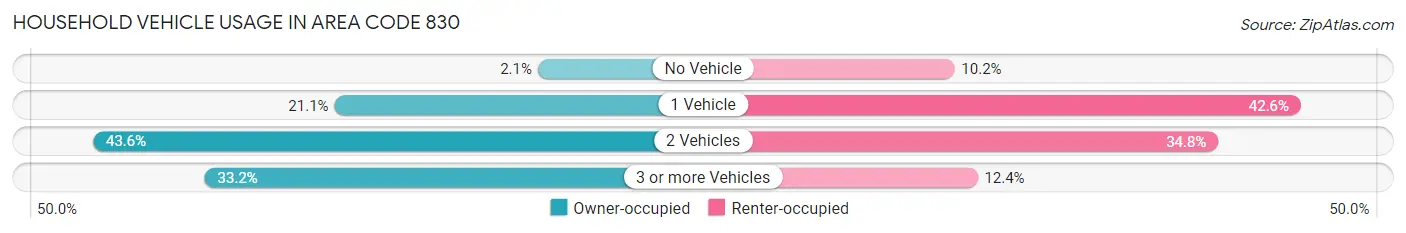
| Vehicles per Household | Owner-occupied | Renter-occupied |
| No Vehicle | 5,197 (2.1%) | 8,254 (10.2%) |
| 1 Vehicle | 52,445 (21.1%) | 34,368 (42.6%) |
| 2 Vehicles | 108,549 (43.6%) | 28,134 (34.8%) |
| 3 or more Vehicles | 82,620 (33.2%) | 9,987 (12.4%) |
| Total | 248,811 (100.0%) | 80,743 (100.0%) |
Real Estate & Mortgages in Area Code 830
Real Estate and Mortgage Overview in Area Code 830
| Characteristic | Without Mortgage | With Mortgage |
| Housing Units | 122,388 | 126,423 |
| Median Property Value | $20,292,300 | $21,604,199 |
| Median Household Income | $6,700,606 | $41,029 |
| Monthly Housing Costs | $56,406 | $19,920 |
| Real Estate Taxes | $215,208 | $6,969 |
Property Value by Mortgage Status in Area Code 830
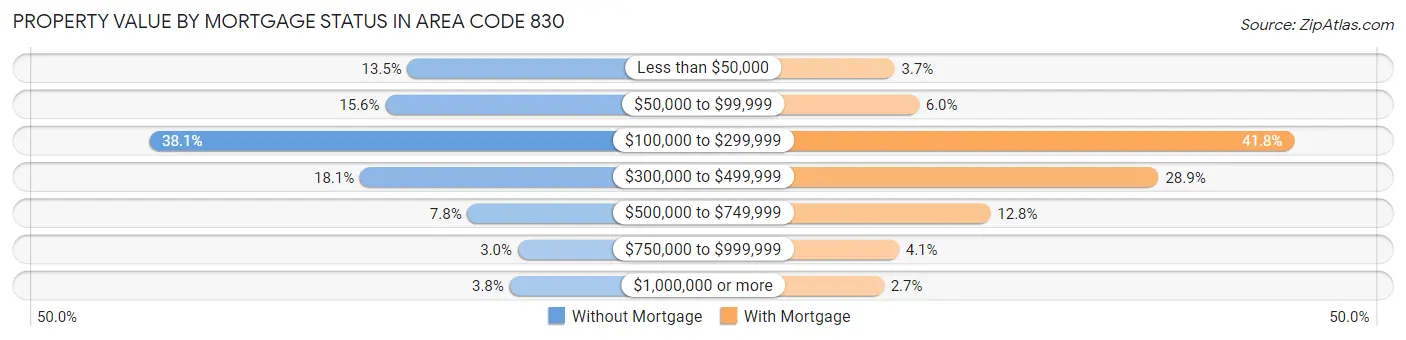
| Property Value | Without Mortgage | With Mortgage |
| Less than $50,000 | 16,552 (13.5%) | 4,695 (3.7%) |
| $50,000 to $99,999 | 19,145 (15.6%) | 7,605 (6.0%) |
| $100,000 to $299,999 | 46,678 (38.1%) | 52,818 (41.8%) |
| $300,000 to $499,999 | 22,087 (18.0%) | 36,476 (28.8%) |
| $500,000 to $749,999 | 9,567 (7.8%) | 16,229 (12.8%) |
| $750,000 to $999,999 | 3,697 (3.0%) | 5,207 (4.1%) |
| $1,000,000 or more | 4,662 (3.8%) | 3,393 (2.7%) |
| Total | 122,388 (100.0%) | 126,423 (100.0%) |
Household Income by Mortgage Status in Area Code 830
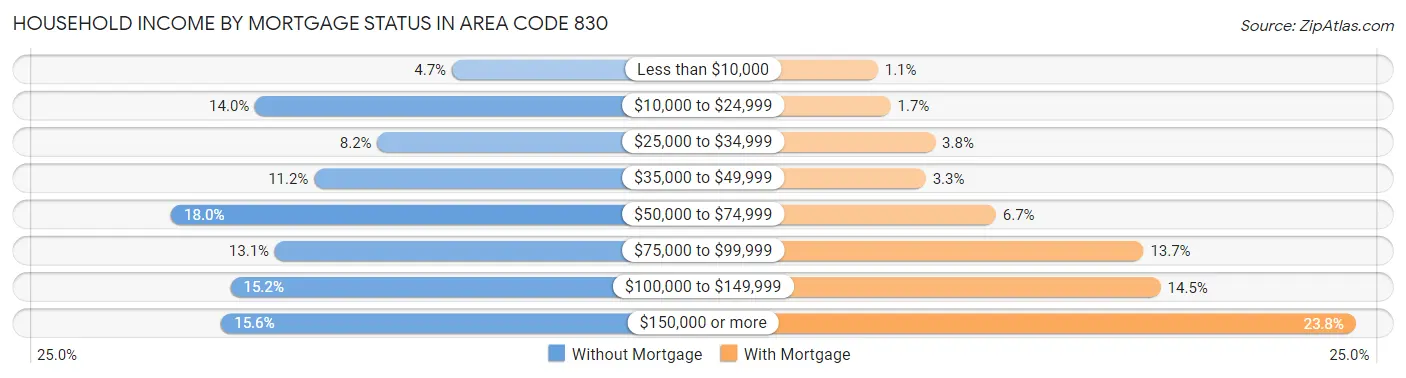
| Household Income | Without Mortgage | With Mortgage |
| Less than $10,000 | 5,692 (4.6%) | 1,336 (1.1%) |
| $10,000 to $24,999 | 17,153 (14.0%) | 2,106 (1.7%) |
| $25,000 to $34,999 | 10,033 (8.2%) | 4,797 (3.8%) |
| $35,000 to $49,999 | 13,725 (11.2%) | 4,222 (3.3%) |
| $50,000 to $74,999 | 22,060 (18.0%) | 8,445 (6.7%) |
| $75,000 to $99,999 | 16,005 (13.1%) | 17,335 (13.7%) |
| $100,000 to $149,999 | 18,594 (15.2%) | 18,369 (14.5%) |
| $150,000 or more | 19,126 (15.6%) | 30,120 (23.8%) |
| Total | 122,388 (100.0%) | 126,423 (100.0%) |
Property Value to Household Income Ratio in Area Code 830
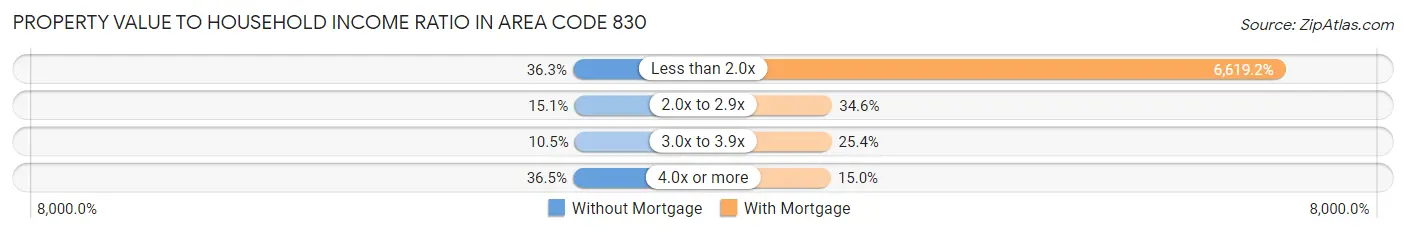
| Value-to-Income Ratio | Without Mortgage | With Mortgage |
| Less than 2.0x | 44,480 (36.3%) | 8,368,218 (6,619.2%) |
| 2.0x to 2.9x | 18,486 (15.1%) | 43,709 (34.6%) |
| 3.0x to 3.9x | 12,870 (10.5%) | 32,140 (25.4%) |
| 4.0x or more | 44,680 (36.5%) | 18,922 (15.0%) |
| Total | 122,388 (100.0%) | 126,423 (100.0%) |
Real Estate Taxes by Mortgage Status in Area Code 830
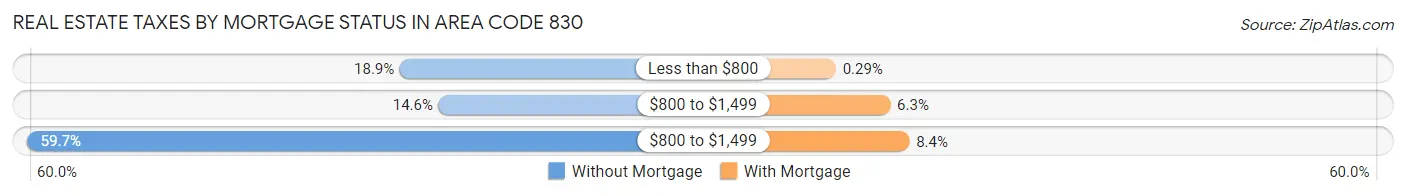
| Property Taxes | Without Mortgage | With Mortgage |
| Less than $800 | 23,071 (18.9%) | 366 (0.3%) |
| $800 to $1,499 | 17,879 (14.6%) | 7,911 (6.3%) |
| $800 to $1,499 | 73,016 (59.7%) | 10,551 (8.4%) |
| Total | 122,388 (100.0%) | 126,423 (100.0%) |
Health & Disability in Area Code 830
Health Insurance Coverage by Age in Area Code 830
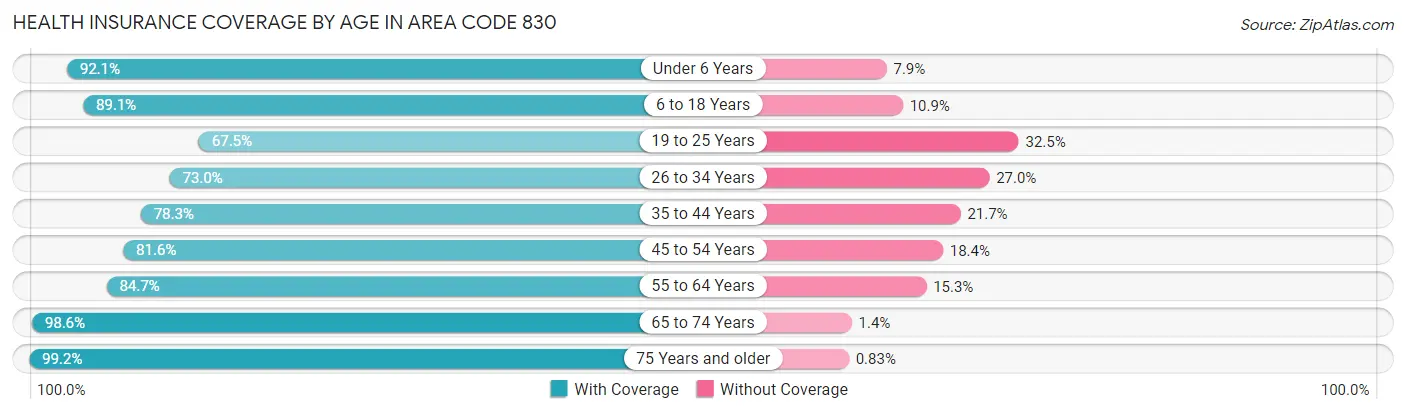
| Age Bracket | With Coverage | Without Coverage |
| Under 6 Years | 60,024 (92.1%) | 5,135 (7.9%) |
| 6 to 18 Years | 147,056 (89.1%) | 17,980 (10.9%) |
| 19 to 25 Years | 49,077 (67.5%) | 23,626 (32.5%) |
| 26 to 34 Years | 68,260 (73.0%) | 25,275 (27.0%) |
| 35 to 44 Years | 86,691 (78.3%) | 23,964 (21.7%) |
| 45 to 54 Years | 89,605 (81.6%) | 20,162 (18.4%) |
| 55 to 64 Years | 98,069 (84.7%) | 17,673 (15.3%) |
| 65 to 74 Years | 93,748 (98.6%) | 1,295 (1.4%) |
| 75 Years and older | 65,128 (99.2%) | 544 (0.8%) |
| Total | 757,658 (84.8%) | 135,654 (15.2%) |
Health Insurance Coverage by Citizenship Status in Area Code 830
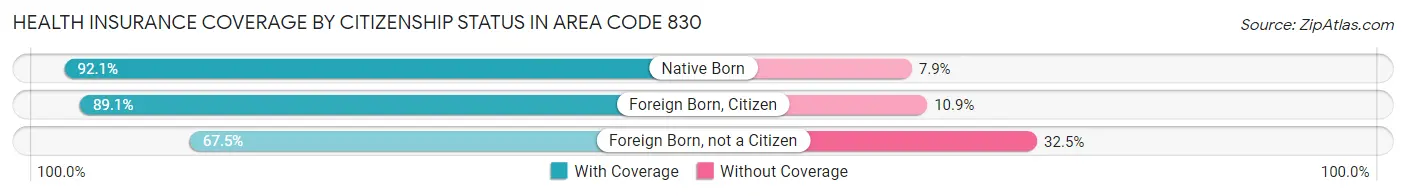
| Citizenship Status | With Coverage | Without Coverage |
| Native Born | 60,024 (92.1%) | 5,135 (7.9%) |
| Foreign Born, Citizen | 147,056 (89.1%) | 17,980 (10.9%) |
| Foreign Born, not a Citizen | 49,077 (67.5%) | 23,626 (32.5%) |
Health Insurance Coverage by Household Income in Area Code 830
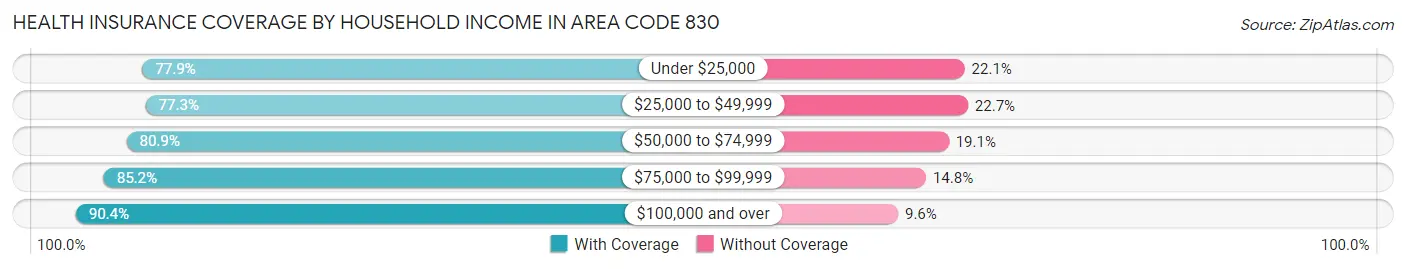
| Household Income | With Coverage | Without Coverage |
| Under $25,000 | 71,740 (77.9%) | 20,332 (22.1%) |
| $25,000 to $49,999 | 106,839 (77.3%) | 31,359 (22.7%) |
| $50,000 to $74,999 | 112,880 (80.9%) | 26,643 (19.1%) |
| $75,000 to $99,999 | 108,618 (85.2%) | 18,928 (14.8%) |
| $100,000 and over | 354,861 (90.4%) | 37,681 (9.6%) |
Public vs Private Health Insurance Coverage by Age in Area Code 830
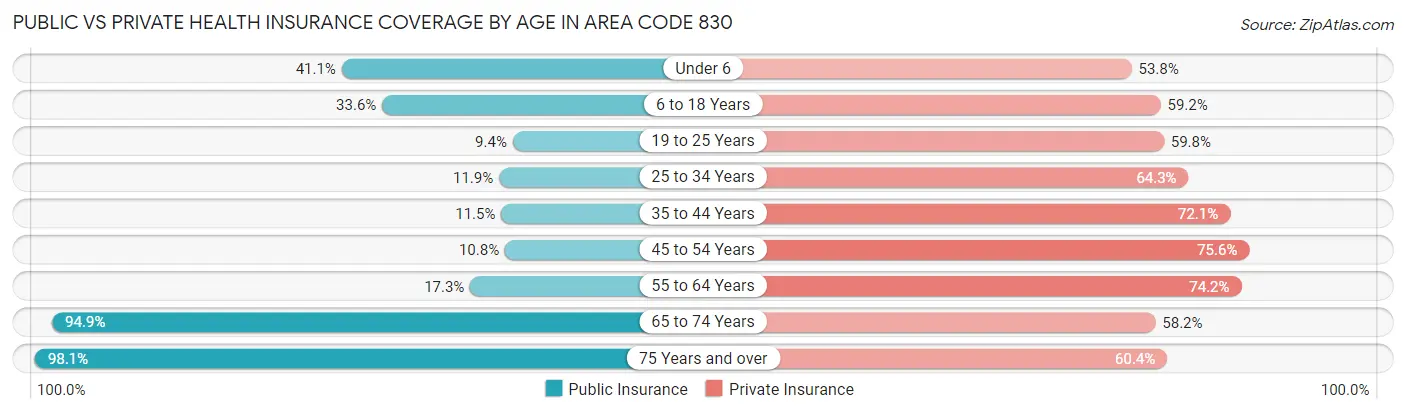
| Age Bracket | Public Insurance | Private Insurance |
| Under 6 | 26,806 (41.1%) | 35,043 (53.8%) |
| 6 to 18 Years | 55,499 (33.6%) | 97,628 (59.2%) |
| 19 to 25 Years | 6,826 (9.4%) | 43,452 (59.8%) |
| 25 to 34 Years | 11,163 (11.9%) | 60,177 (64.3%) |
| 35 to 44 Years | 12,747 (11.5%) | 79,735 (72.1%) |
| 45 to 54 Years | 11,886 (10.8%) | 83,009 (75.6%) |
| 55 to 64 Years | 20,011 (17.3%) | 85,833 (74.2%) |
| 65 to 74 Years | 90,200 (94.9%) | 55,313 (58.2%) |
| 75 Years and over | 64,418 (98.1%) | 39,661 (60.4%) |
| Total | 299,556 (33.5%) | 579,851 (64.9%) |
Disability Status by Sex by Age in Area Code 830
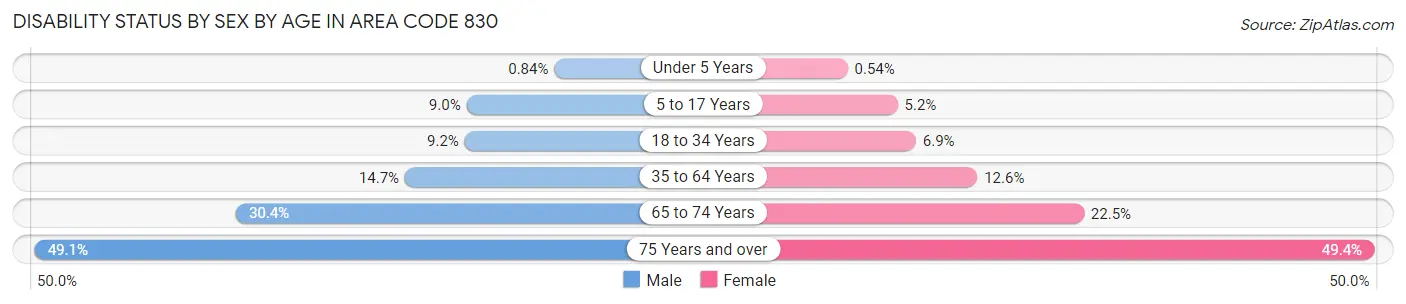
| Age Bracket | Male | Female |
| Under 5 Years | 234 (0.8%) | 140 (0.5%) |
| 5 to 17 Years | 7,478 (9.0%) | 4,086 (5.2%) |
| 18 to 34 Years | 8,468 (9.2%) | 6,031 (6.9%) |
| 35 to 64 Years | 24,442 (14.7%) | 21,367 (12.6%) |
| 65 to 74 Years | 13,731 (30.4%) | 11,199 (22.5%) |
| 75 Years and over | 14,490 (49.1%) | 17,844 (49.4%) |
Disability Class by Sex by Age in Area Code 830
Disability Class: Hearing Difficulty
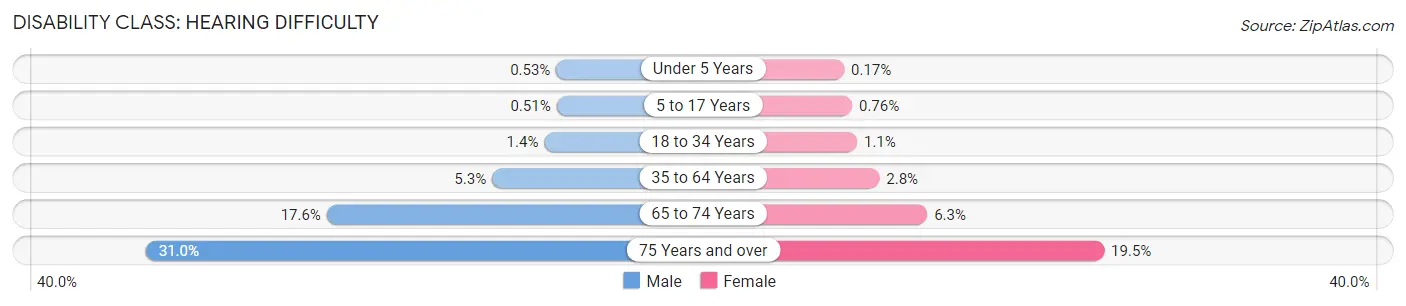
| Age Bracket | Male | Female |
| Under 5 Years | 147 (0.5%) | 45 (0.2%) |
| 5 to 17 Years | 427 (0.5%) | 599 (0.8%) |
| 18 to 34 Years | 1,316 (1.4%) | 994 (1.1%) |
| 35 to 64 Years | 8,812 (5.3%) | 4,736 (2.8%) |
| 65 to 74 Years | 7,940 (17.6%) | 3,162 (6.3%) |
| 75 Years and over | 9,156 (31.0%) | 7,039 (19.5%) |
Disability Class: Vision Difficulty
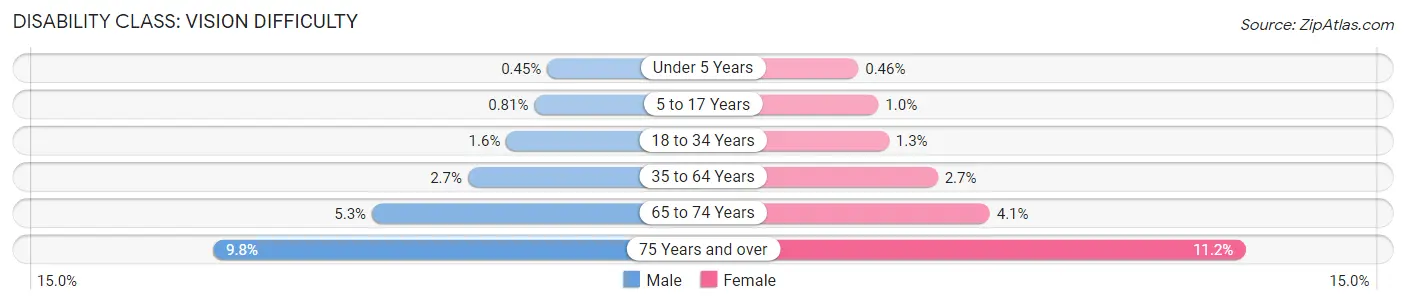
| Age Bracket | Male | Female |
| Under 5 Years | 127 (0.4%) | 121 (0.5%) |
| 5 to 17 Years | 674 (0.8%) | 801 (1.0%) |
| 18 to 34 Years | 1,467 (1.6%) | 1,155 (1.3%) |
| 35 to 64 Years | 4,430 (2.7%) | 4,544 (2.7%) |
| 65 to 74 Years | 2,410 (5.3%) | 2,054 (4.1%) |
| 75 Years and over | 2,880 (9.8%) | 4,057 (11.2%) |
Disability Class: Cognitive Difficulty
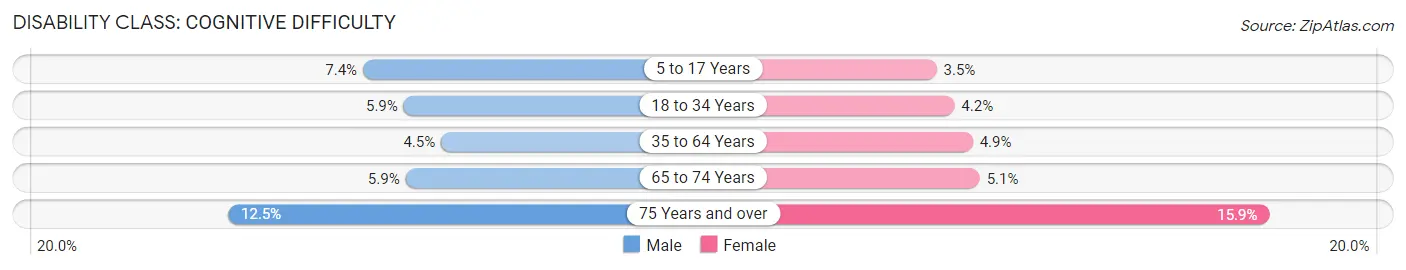
| Age Bracket | Male | Female |
| 5 to 17 Years | 6,190 (7.4%) | 2,780 (3.5%) |
| 18 to 34 Years | 5,478 (5.9%) | 3,669 (4.2%) |
| 35 to 64 Years | 7,551 (4.5%) | 8,256 (4.9%) |
| 65 to 74 Years | 2,647 (5.9%) | 2,550 (5.1%) |
| 75 Years and over | 3,678 (12.4%) | 5,735 (15.9%) |
Disability Class: Ambulatory Difficulty
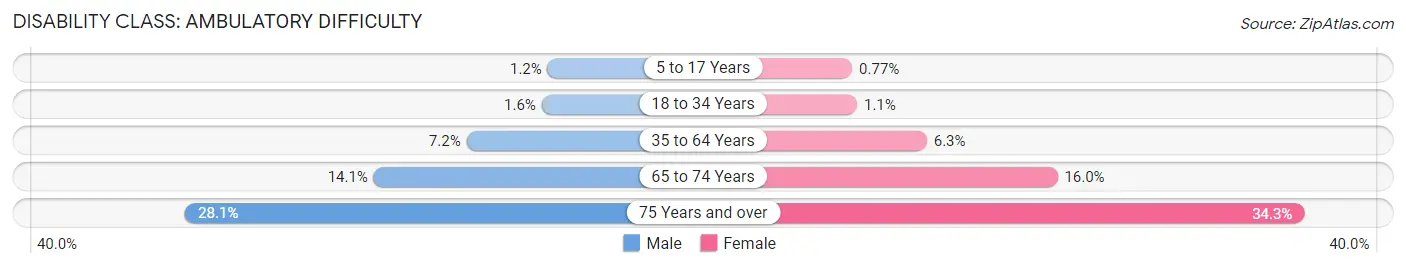
| Age Bracket | Male | Female |
| 5 to 17 Years | 971 (1.2%) | 604 (0.8%) |
| 18 to 34 Years | 1,486 (1.6%) | 989 (1.1%) |
| 35 to 64 Years | 11,946 (7.2%) | 10,721 (6.3%) |
| 65 to 74 Years | 6,362 (14.1%) | 7,979 (16.0%) |
| 75 Years and over | 8,293 (28.1%) | 12,407 (34.3%) |
Disability Class: Self-Care Difficulty
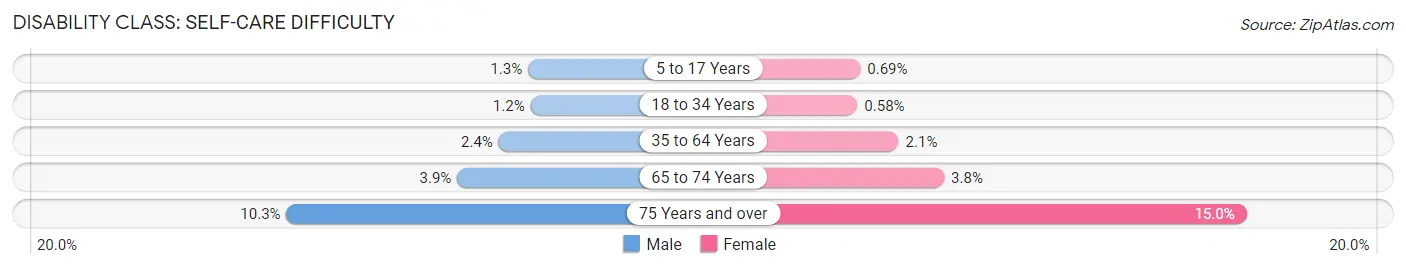
| Age Bracket | Male | Female |
| 5 to 17 Years | 1,086 (1.3%) | 544 (0.7%) |
| 18 to 34 Years | 1,124 (1.2%) | 506 (0.6%) |
| 35 to 64 Years | 3,995 (2.4%) | 3,579 (2.1%) |
| 65 to 74 Years | 1,783 (3.9%) | 1,893 (3.8%) |
| 75 Years and over | 3,036 (10.3%) | 5,430 (15.0%) |
Technology Access in Area Code 830
Computing Device Access in Area Code 830
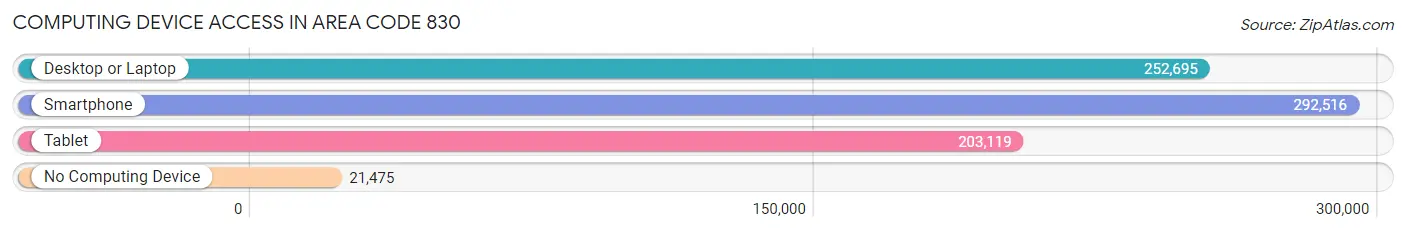
| Device Type | # Households | % Households |
| Desktop or Laptop | 252,695 | 76.7% |
| Smartphone | 292,516 | 88.8% |
| Tablet | 203,119 | 61.6% |
| No Computing Device | 21,475 | 6.5% |
| Total | 329,554 | 100.0% |
Internet Access in Area Code 830
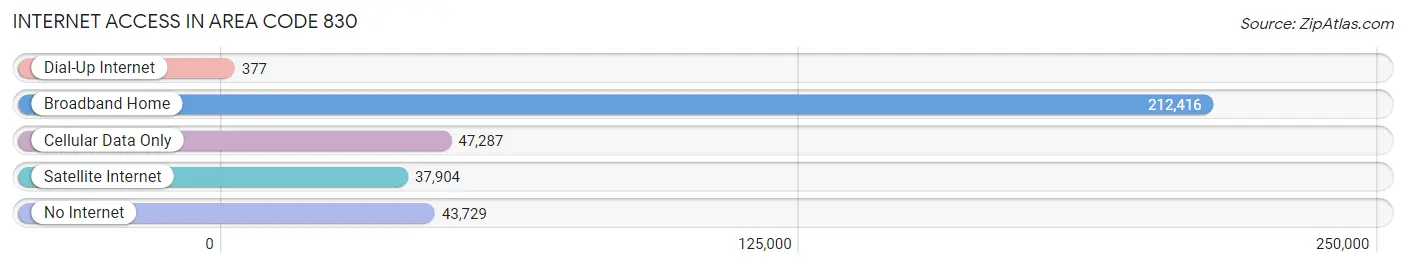
| Internet Type | # Households | % Households |
| Dial-Up Internet | 377 | 0.1% |
| Broadband Home | 212,416 | 64.5% |
| Cellular Data Only | 47,287 | 14.3% |
| Satellite Internet | 37,904 | 11.5% |
| No Internet | 43,729 | 13.3% |
| Total | 329,554 | 100.0% |
Area Code 830 Summary
Geography
Area code 830 is located in the state of Texas. It covers the western and southwestern parts of the state, including the cities of San Antonio, Austin, and Corpus Christi. It also covers parts of the Hill Country, including Kerrville, Fredericksburg, and Boerne.
Social
Area code 830 is home to a diverse population of people from all walks of life. The area is known for its vibrant music and art scene, as well as its unique cuisine. It is also home to a number of universities and colleges, making it a great place for students to live and learn.
Economics
Area code 830 is home to a number of major businesses and industries, including oil and gas, technology, and healthcare. The area is also home to a number of small businesses, making it a great place to start a business.
Demographics
Area code 830 is home to a diverse population of people from all walks of life. The population is predominantly Hispanic, with a large number of African Americans, Asians, and other ethnicities. The median household income is slightly above the national average, and the unemployment rate is slightly below the national average.
Common Questions
What is Per Capita Income in Area Code 830?
Per Capita income in Area Code 830 is $35,377.
What is the Median Family Income in Area Code 830?
Median Family Income in Area Code 830 is $85,303.
What is the Median Household income in Area Code 830?
Median Household Income in Area Code 830 is $72,823.
What is Income or Wage Gap in Area Code 830?
Income or Wage Gap in Area Code 830 is 35.3%.
Women in Area Code 830 earn 64.7 cents for every dollar earned by a man.
What is Family Income Deficit in Area Code 830?
Family Income Deficit in Area Code 830 is $11,310.
Families that are below poverty line in Area Code 830 earn $11,310 less on average than the poverty threshold level.
What is Inequality or Gini Index in Area Code 830?
Inequality or Gini Index in Area Code 830 is 45.05.
What is the Total Population of Area Code 830?
Total Population of Area Code 830 is 915,251.
What is the Total Male Population of Area Code 830?
Total Male Population of Area Code 830 is 461,191.
What is the Total Female Population of Area Code 830?
Total Female Population of Area Code 830 is 454,060.
What is the Ratio of Males per 100 Females in Area Code 830?
There are 101.57 Males per 100 Females in Area Code 830.
What is the Ratio of Females per 100 Males in Area Code 830?
There are 98.45 Females per 100 Males in Area Code 830.
What is the Median Population Age in Area Code 830?
Median Population Age in Area Code 830 is 45.4 Years.
What is the Average Family Size in Area Code 830
Average Family Size in Area Code 830 is 3.1 People.
What is the Average Household Size in Area Code 830
Average Household Size in Area Code 830 is 2.6 People.
How Large is the Labor Force in Area Code 830?
There are 381,755 People in the Labor Forcein in Area Code 830.
What is the Percentage of People in the Labor Force in Area Code 830?
52.6% of People are in the Labor Force in Area Code 830.
What is the Unemployment Rate in Area Code 830?
Unemployment Rate in Area Code 830 is 5.5%.