Area Code 701 Map & Demographics
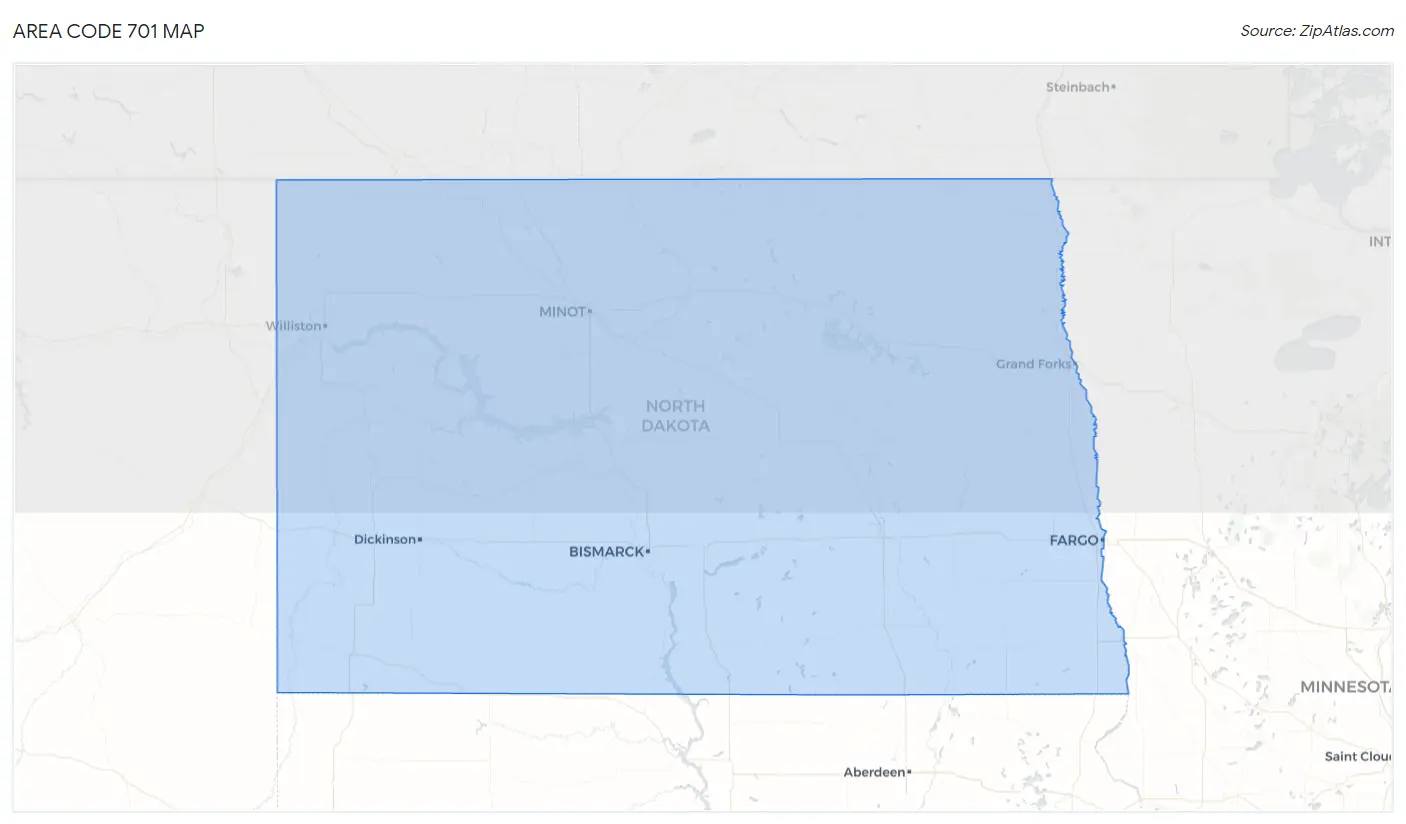
Area Code 701 Map
Area Code 701 Overview
$41,535
PER CAPITA INCOME
$98,050
AVG FAMILY INCOME
$79,550
AVG HOUSEHOLD INCOME
35.3%
WAGE / INCOME GAP [ % ]
64.7¢/ $1
WAGE / INCOME GAP [ $ ]
$11,578
FAMILY INCOME DEFICIT
152.36
INEQUALITY / GINI INDEX
776,110
TOTAL POPULATION
398,964
MALE POPULATION
377,146
FEMALE POPULATION
105.79
MALES / 100 FEMALES
94.53
FEMALES / 100 MALES
44.4
MEDIAN AGE
3.0
AVG FAMILY SIZE
2.4
AVG HOUSEHOLD SIZE
382,962
LABOR FORCE [ PEOPLE ]
62.5%
PERCENT IN LABOR FORCE
4.0%
UNEMPLOYMENT RATE
Income in Area Code 701
Income Overview in Area Code 701
Per Capita Income in Area Code 701 is $41,535, while median incomes of families and households are $98,050 and $79,550 respectively.
| Characteristic | Number | Measure |
| Per Capita Income | 776,110 | $41,535 |
| Median Family Income | 188,131 | $98,050 |
| Mean Family Income | 188,131 | $42,378,936 |
| Median Household Income | 319,543 | $79,550 |
| Mean Household Income | 319,543 | $36,609,343 |
| Income Deficit | 188,131 | $11,578 |
| Wage / Income Gap (%) | 776,110 | 35.34% |
| Wage / Income Gap ($) | 776,110 | 64.66¢ per $1 |
| Gini / Inequality Index | 776,110 | 152.36 |
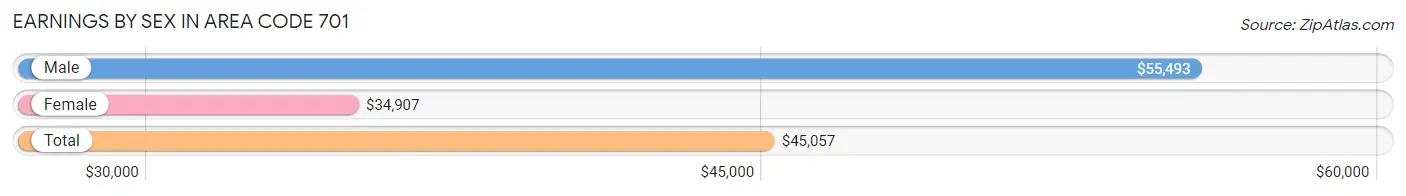
Earnings by Sex in Area Code 701
Average Earnings in Area Code 701 are $45,057, $55,493 for men and $34,907 for women, a difference of 37.1%.
| Sex | Number | Average Earnings |
| Male | 248,034 (54.7%) | $55,493 |
| Female | 205,756 (45.3%) | $34,907 |
| Total | 453,790 (100.0%) | $45,057 |
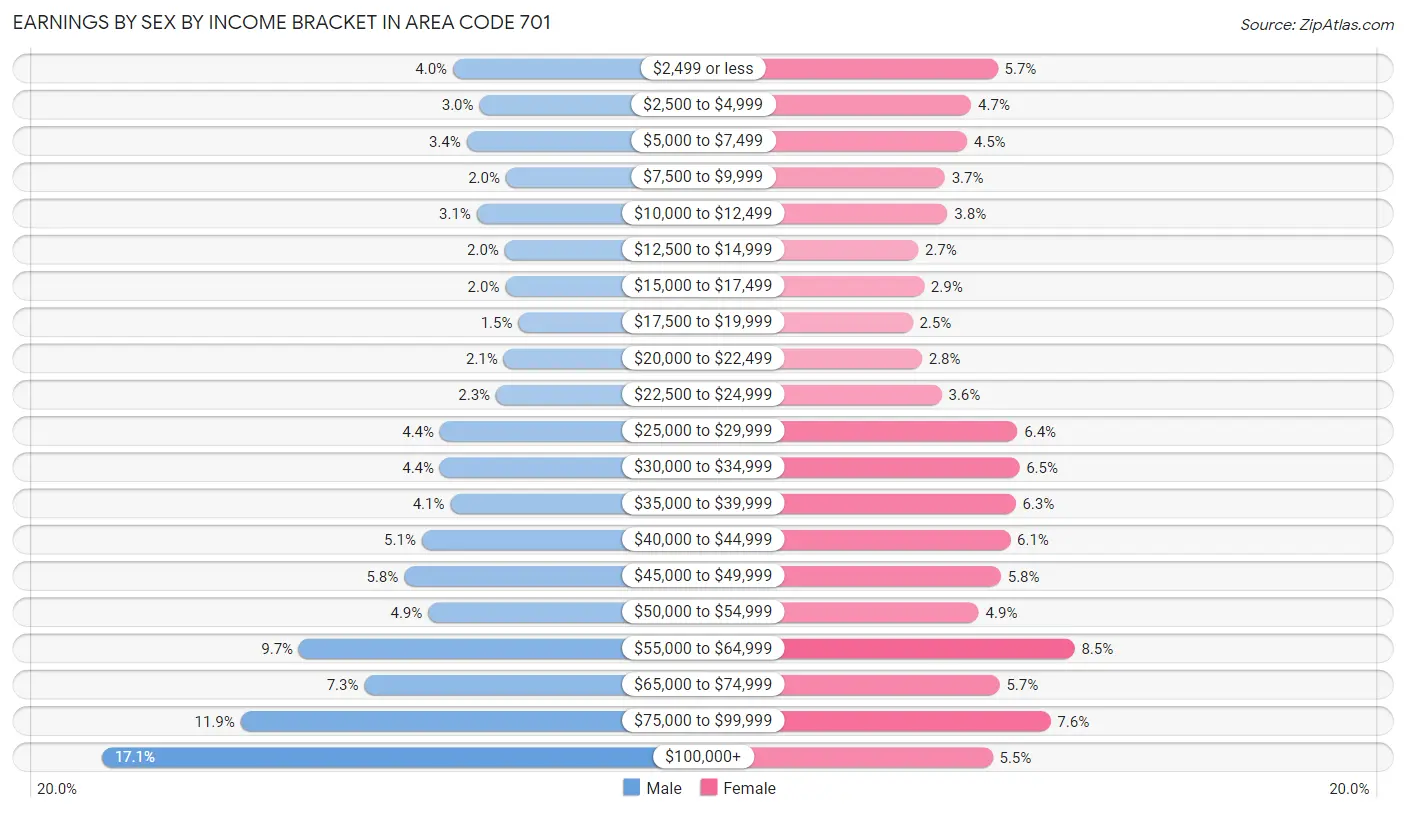
Earnings by Sex by Income Bracket in Area Code 701
The most common earnings brackets in Area Code 701 are $100,000+ for men (42,435 | 17.1%) and $55,000 to $64,999 for women (17,560 | 8.5%).
| Income | Male | Female |
| $2,499 or less | 9,806 (4.0%) | 11,623 (5.7%) |
| $2,500 to $4,999 | 7,344 (3.0%) | 9,593 (4.7%) |
| $5,000 to $7,499 | 8,541 (3.4%) | 9,266 (4.5%) |
| $7,500 to $9,999 | 4,897 (2.0%) | 7,556 (3.7%) |
| $10,000 to $12,499 | 7,598 (3.1%) | 7,765 (3.8%) |
| $12,500 to $14,999 | 4,974 (2.0%) | 5,503 (2.7%) |
| $15,000 to $17,499 | 4,941 (2.0%) | 5,956 (2.9%) |
| $17,500 to $19,999 | 3,731 (1.5%) | 5,063 (2.5%) |
| $20,000 to $22,499 | 5,093 (2.1%) | 5,776 (2.8%) |
| $22,500 to $24,999 | 5,803 (2.3%) | 7,309 (3.5%) |
| $25,000 to $29,999 | 11,003 (4.4%) | 13,144 (6.4%) |
| $30,000 to $34,999 | 11,010 (4.4%) | 13,293 (6.5%) |
| $35,000 to $39,999 | 10,038 (4.1%) | 13,007 (6.3%) |
| $40,000 to $44,999 | 12,700 (5.1%) | 12,594 (6.1%) |
| $45,000 to $49,999 | 14,344 (5.8%) | 11,872 (5.8%) |
| $50,000 to $54,999 | 12,106 (4.9%) | 10,166 (4.9%) |
| $55,000 to $64,999 | 24,102 (9.7%) | 17,560 (8.5%) |
| $65,000 to $74,999 | 18,039 (7.3%) | 11,773 (5.7%) |
| $75,000 to $99,999 | 29,529 (11.9%) | 15,704 (7.6%) |
| $100,000+ | 42,435 (17.1%) | 11,233 (5.5%) |
| Total | 248,034 (100.0%) | 205,756 (100.0%) |
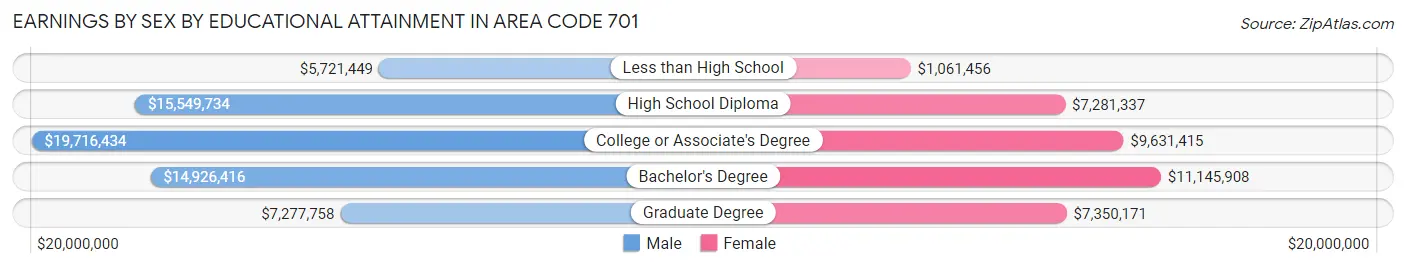
Earnings by Sex by Educational Attainment in Area Code 701
Average earnings in Area Code 701 are $20,183,137 for men and $12,376,744 for women, a difference of 38.7%. Men with an educational attainment of college or associate's degree enjoy the highest average annual earnings of $19,716,434, while those with less than high school education earn the least with $5,721,449. Women with an educational attainment of bachelor's degree earn the most with the average annual earnings of $11,145,908, while those with less than high school education have the smallest earnings of $1,061,456.
| Educational Attainment | Male Income | Female Income |
| Less than High School | $5,721,449 | $1,061,456 |
| High School Diploma | $15,549,734 | $7,281,337 |
| College or Associate's Degree | $19,716,434 | $9,631,415 |
| Bachelor's Degree | $14,926,416 | $11,145,908 |
| Graduate Degree | $7,277,758 | $7,350,171 |
| Total | $20,183,137 | $12,376,744 |
Family Income in Area Code 701
Family Income Brackets in Area Code 701
According to the Area Code 701 family income data, there are 18,075,250 families falling into the $100,000 to $149,999 income range, which is the most common income bracket and makes up 9,607.8% of all families. Conversely, the $10,000 to $14,999 income bracket is the least frequent group with only 960,597 families (510.6%) belonging to this category.
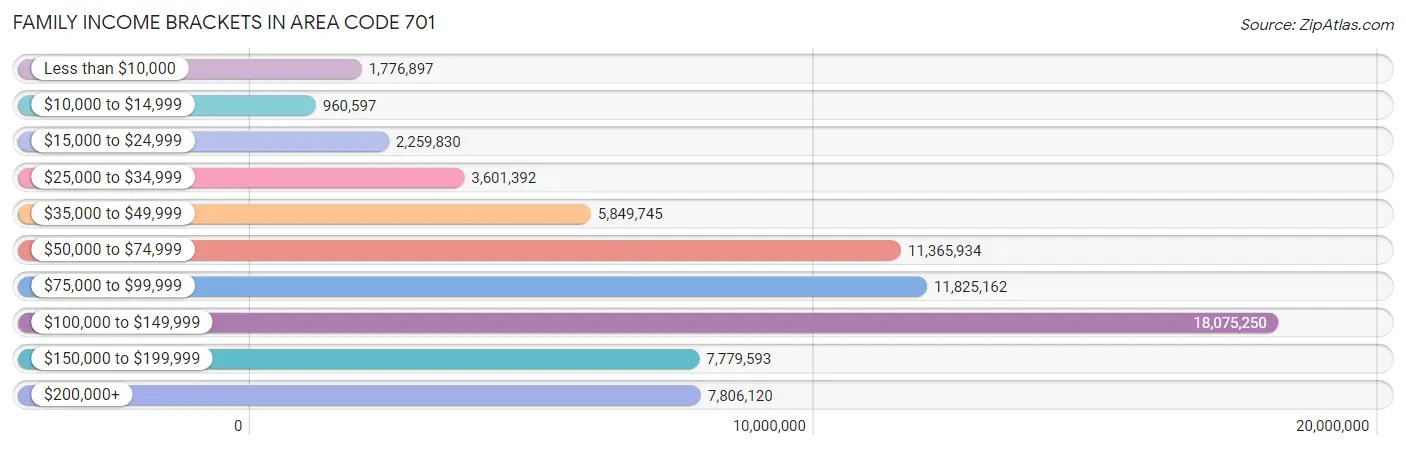
| Income Bracket | # Families | % Families |
| Less than $10,000 | 1,776,897 | 944.5% |
| $10,000 to $14,999 | 960,597 | 510.6% |
| $15,000 to $24,999 | 2,259,830 | 1,201.2% |
| $25,000 to $34,999 | 3,601,392 | 1,914.3% |
| $35,000 to $49,999 | 5,849,745 | 3,109.4% |
| $50,000 to $74,999 | 11,365,934 | 6,041.5% |
| $75,000 to $99,999 | 11,825,162 | 6,285.6% |
| $100,000 to $149,999 | 18,075,250 | 9,607.8% |
| $150,000 to $199,999 | 7,779,593 | 4,135.2% |
| $200,000+ | 7,806,120 | 4,149.3% |
Family Income by Famaliy Size in Area Code 701
4-person families (30,046 | 16.0%) account for the highest median family income in Area Code 701 with $118,357 per family, while 2-person families (98,221 | 52.2%) have the highest median income of $46,544 per family member.
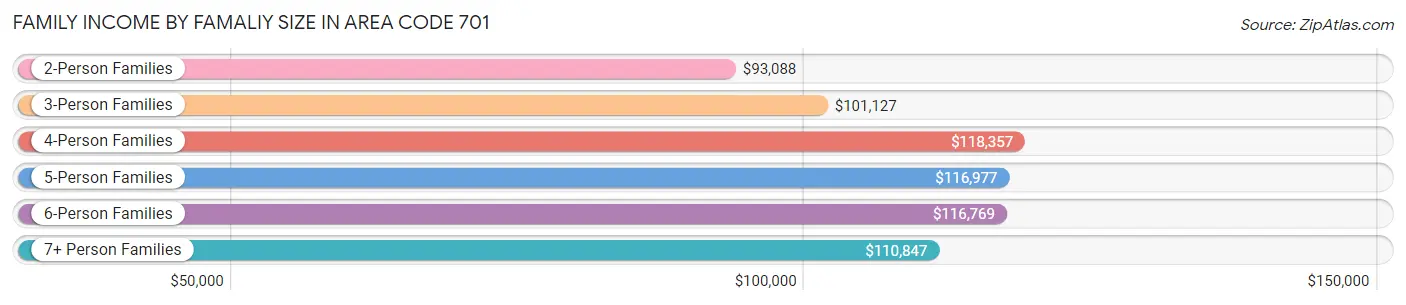
| Income Bracket | # Families | Median Income |
| 2-Person Families | 98,221 (52.2%) | $93,088 |
| 3-Person Families | 35,587 (18.9%) | $101,127 |
| 4-Person Families | 30,046 (16.0%) | $118,357 |
| 5-Person Families | 15,997 (8.5%) | $116,977 |
| 6-Person Families | 5,822 (3.1%) | $116,769 |
| 7+ Person Families | 2,458 (1.3%) | $110,847 |
| Total | 188,131 (100.0%) | $98,050 |
Family Income by Number of Earners in Area Code 701
The median family income in Area Code 701 is $98,050, with families comprising 3+ earners (18,096) having the highest median family income of $147,615, while families with no earners (23,438) have the lowest median family income of $58,848, accounting for 9.6% and 12.5% of families, respectively.
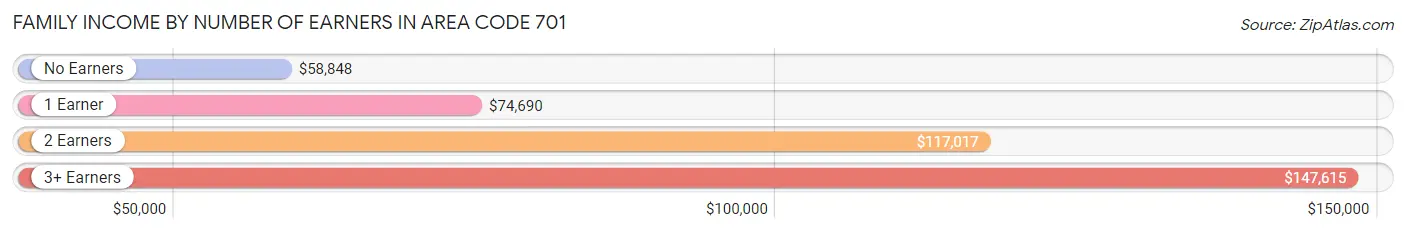
| Number of Earners | # Families | Median Income |
| No Earners | 23,438 (12.5%) | $58,848 |
| 1 Earner | 51,228 (27.2%) | $74,690 |
| 2 Earners | 95,369 (50.7%) | $117,017 |
| 3+ Earners | 18,096 (9.6%) | $147,615 |
| Total | 188,131 (100.0%) | $98,050 |
Household Income in Area Code 701
Household Income Brackets in Area Code 701
With 24,198,672 households falling in the category, the $100,000 to $149,999 income range is the most frequent in Area Code 701, accounting for 7,572.9% of all households. In contrast, only 4,220,204 households (1,320.7%) fall into the $10,000 to $14,999 income bracket, making it the least populous group.
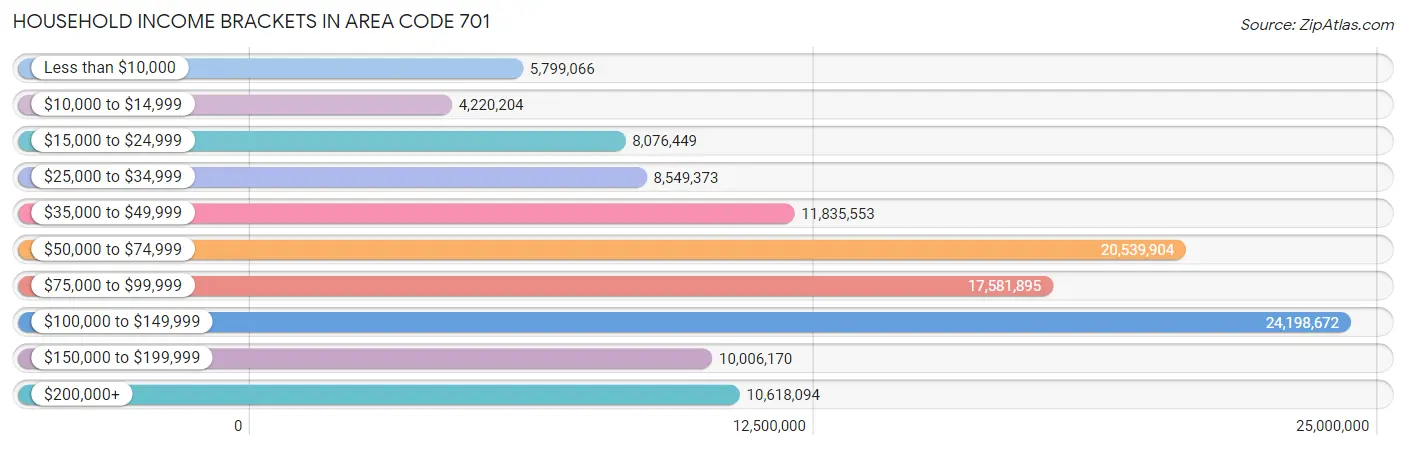
| Income Bracket | # Households | % Households |
| Less than $10,000 | 5,799,066 | 1,814.8% |
| $10,000 to $14,999 | 4,220,204 | 1,320.7% |
| $15,000 to $24,999 | 8,076,449 | 2,527.5% |
| $25,000 to $34,999 | 8,549,373 | 2,675.5% |
| $35,000 to $49,999 | 11,835,553 | 3,703.9% |
| $50,000 to $74,999 | 20,539,904 | 6,427.9% |
| $75,000 to $99,999 | 17,581,895 | 5,502.2% |
| $100,000 to $149,999 | 24,198,672 | 7,572.9% |
| $150,000 to $199,999 | 10,006,170 | 3,131.4% |
| $200,000+ | 10,618,094 | 3,322.9% |
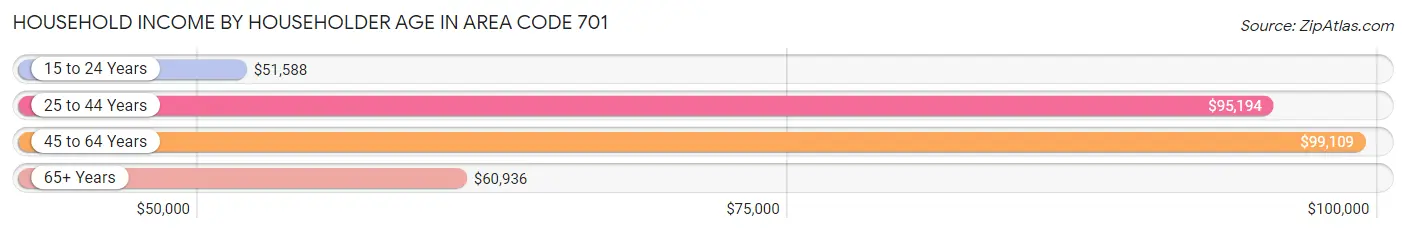
Household Income by Householder Age in Area Code 701
The median household income in Area Code 701 is $79,550, with the highest median household income of $99,109 found in the 45 to 64 years age bracket for the primary householder. A total of 101,046 households (31.6%) fall into this category. Meanwhile, the 15 to 24 years age bracket for the primary householder has the lowest median household income of $51,588, with 26,007 households (8.1%) in this group.
| Income Bracket | # Households | Median Income |
| 15 to 24 Years | 26,007 (8.1%) | $51,588 |
| 25 to 44 Years | 114,642 (35.9%) | $95,194 |
| 45 to 64 Years | 101,046 (31.6%) | $99,109 |
| 65+ Years | 77,848 (24.4%) | $60,936 |
| Total | 319,543 (100.0%) | $79,550 |
Poverty in Area Code 701
Income Below Poverty by Sex and Age in Area Code 701
With 9.8% poverty level for males and 11.8% for females among the residents of Area Code 701, 18 to 24 year old males and 18 to 24 year old females are the most vulnerable to poverty, with 9,222 males (23.6%) and 9,816 females (27.4%) in their respective age groups living below the poverty level.
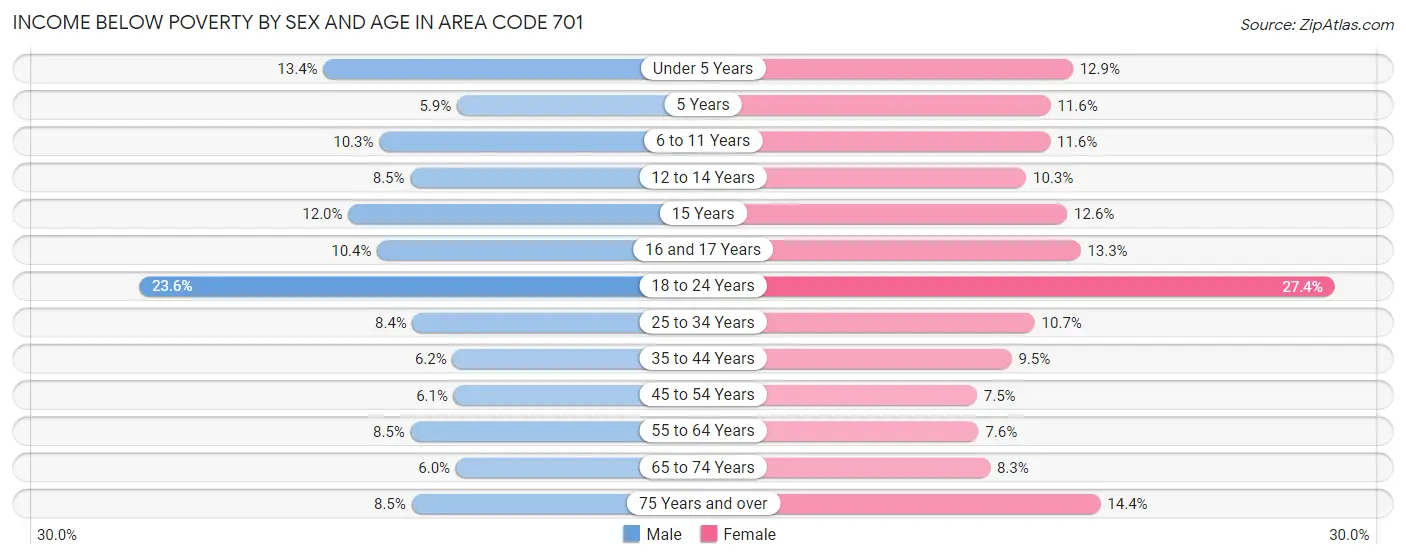
| Age Bracket | Male | Female |
| Under 5 Years | 3,509 (13.4%) | 3,135 (12.9%) |
| 5 Years | 305 (5.9%) | 584 (11.6%) |
| 6 to 11 Years | 3,206 (10.2%) | 3,369 (11.6%) |
| 12 to 14 Years | 1,348 (8.5%) | 1,562 (10.3%) |
| 15 Years | 539 (12.0%) | 580 (12.6%) |
| 16 and 17 Years | 995 (10.4%) | 1,195 (13.3%) |
| 18 to 24 Years | 9,222 (23.6%) | 9,816 (27.4%) |
| 25 to 34 Years | 4,987 (8.4%) | 5,573 (10.7%) |
| 35 to 44 Years | 3,178 (6.2%) | 4,269 (9.5%) |
| 45 to 54 Years | 2,491 (6.1%) | 2,833 (7.5%) |
| 55 to 64 Years | 4,003 (8.5%) | 3,461 (7.6%) |
| 65 to 74 Years | 2,066 (6.0%) | 2,827 (8.3%) |
| 75 Years and over | 1,667 (8.5%) | 3,978 (14.4%) |
| Total | 37,516 (9.8%) | 43,182 (11.8%) |
Income Above Poverty by Sex and Age in Area Code 701
According to the poverty statistics in Area Code 701, males aged 5 years and females aged 45 to 54 years are the age groups that are most secure financially, with 94.1% of males and 92.5% of females in these age groups living above the poverty line.
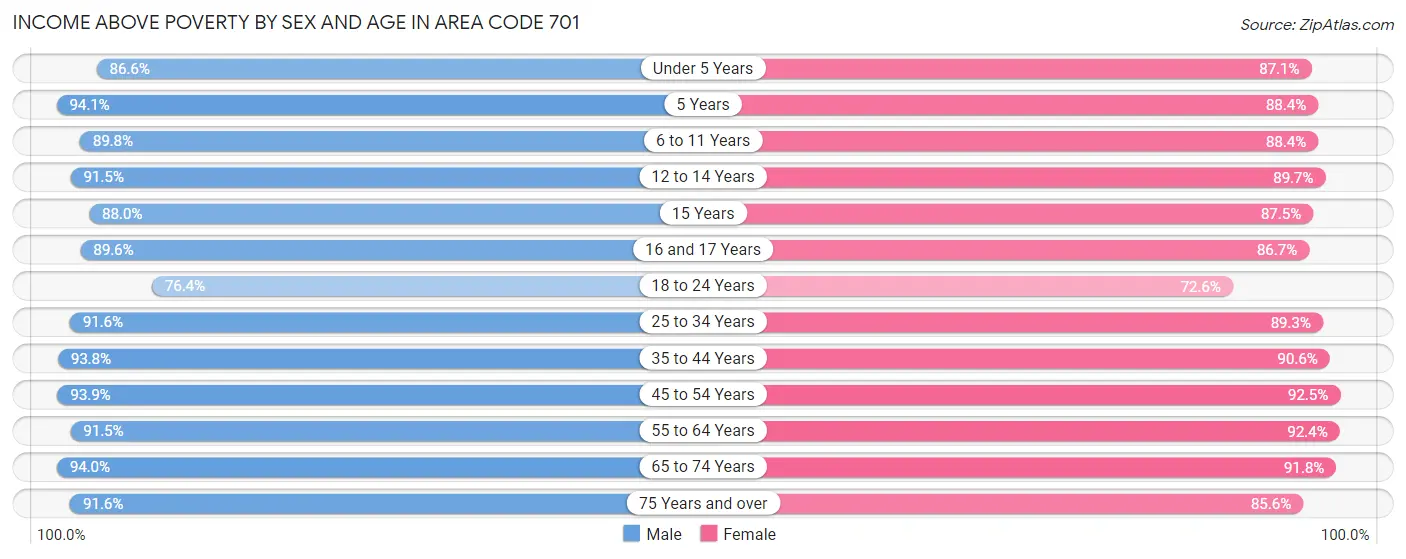
| Age Bracket | Male | Female |
| Under 5 Years | 22,765 (86.6%) | 21,234 (87.1%) |
| 5 Years | 4,849 (94.1%) | 4,442 (88.4%) |
| 6 to 11 Years | 28,085 (89.7%) | 25,664 (88.4%) |
| 12 to 14 Years | 14,479 (91.5%) | 13,655 (89.7%) |
| 15 Years | 3,965 (88.0%) | 4,043 (87.5%) |
| 16 and 17 Years | 8,610 (89.6%) | 7,798 (86.7%) |
| 18 to 24 Years | 29,800 (76.4%) | 25,955 (72.6%) |
| 25 to 34 Years | 54,466 (91.6%) | 46,310 (89.3%) |
| 35 to 44 Years | 48,302 (93.8%) | 40,908 (90.5%) |
| 45 to 54 Years | 38,359 (93.9%) | 34,863 (92.5%) |
| 55 to 64 Years | 43,083 (91.5%) | 42,030 (92.4%) |
| 65 to 74 Years | 32,468 (94.0%) | 31,441 (91.7%) |
| 75 Years and over | 18,066 (91.5%) | 23,647 (85.6%) |
| Total | 347,297 (90.2%) | 321,990 (88.2%) |
Income Below Poverty Among Married-Couple Families in Area Code 701
The poverty statistics for married-couple families in Area Code 701 show that 3.2% or 4,880 of the total 151,409 families live below the poverty line. Families with 5 or more children have the highest poverty rate of 18.3%, comprising of 287 families. On the other hand, families with no children have the lowest poverty rate of 2.5%, which includes 2,195 families.
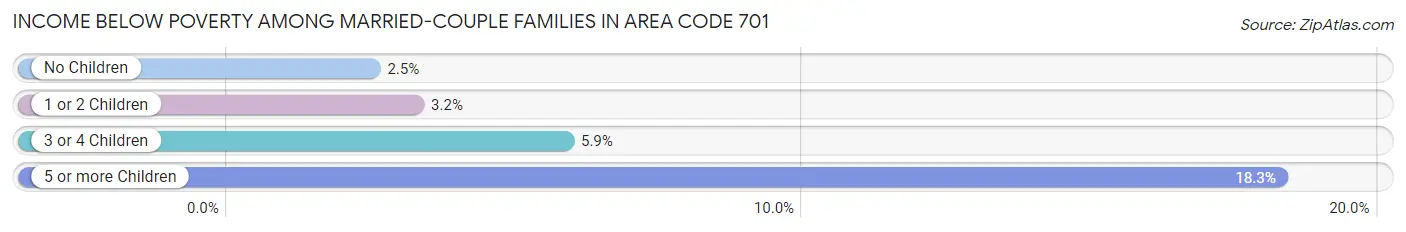
| Children | Above Poverty | Below Poverty |
| No Children | 86,473 (97.5%) | 2,195 (2.5%) |
| 1 or 2 Children | 43,796 (96.8%) | 1,468 (3.2%) |
| 3 or 4 Children | 14,976 (94.2%) | 930 (5.9%) |
| 5 or more Children | 1,284 (81.7%) | 287 (18.3%) |
| Total | 146,529 (96.8%) | 4,880 (3.2%) |
Income Below Poverty Among Single-Parent Households in Area Code 701
According to the poverty data in Area Code 701, 8.3% or 1,052 single-father households and 23.4% or 5,625 single-mother households are living below the poverty line. Among single-father households, those with 5 or more children have the highest poverty rate, with 72 households (30.1%) experiencing poverty. Likewise, among single-mother households, those with 5 or more children have the highest poverty rate, with 213 households (67.8%) falling below the poverty line.
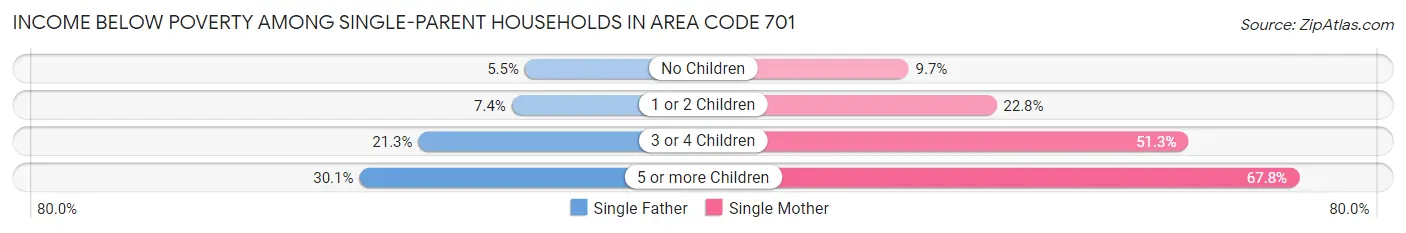
| Children | Single Father | Single Mother |
| No Children | 267 (5.5%) | 640 (9.7%) |
| 1 or 2 Children | 482 (7.4%) | 3,180 (22.8%) |
| 3 or 4 Children | 231 (21.3%) | 1,592 (51.3%) |
| 5 or more Children | 72 (30.1%) | 213 (67.8%) |
| Total | 1,052 (8.3%) | 5,625 (23.4%) |
Income Below Poverty Among Married-Couple vs Single-Parent Households in Area Code 701
The poverty data for Area Code 701 shows that 4,880 of the married-couple family households (3.2%) and 6,677 of the single-parent households (18.2%) are living below the poverty level. Within the married-couple family households, those with 5 or more children have the highest poverty rate, with 287 households (18.3%) falling below the poverty line. Among the single-parent households, those with 5 or more children have the highest poverty rate, with 285 household (51.5%) living below poverty.
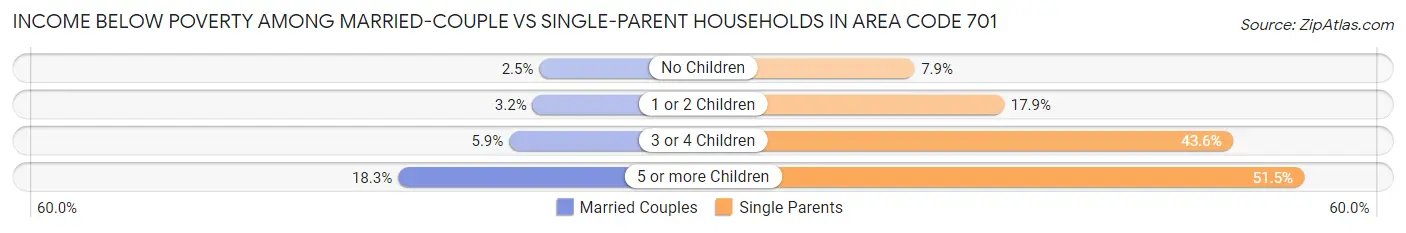
| Children | Married-Couple Families | Single-Parent Households |
| No Children | 2,195 (2.5%) | 907 (7.9%) |
| 1 or 2 Children | 1,468 (3.2%) | 3,662 (17.9%) |
| 3 or 4 Children | 930 (5.9%) | 1,823 (43.6%) |
| 5 or more Children | 287 (18.3%) | 285 (51.5%) |
| Total | 4,880 (3.2%) | 6,677 (18.2%) |
Race in Area Code 701
The most populous races in Area Code 701 are White / Caucasian (655,684 | 84.5%), Native / Alaskan (36,280 | 4.7%), and Two or more Races (34,275 | 4.4%).
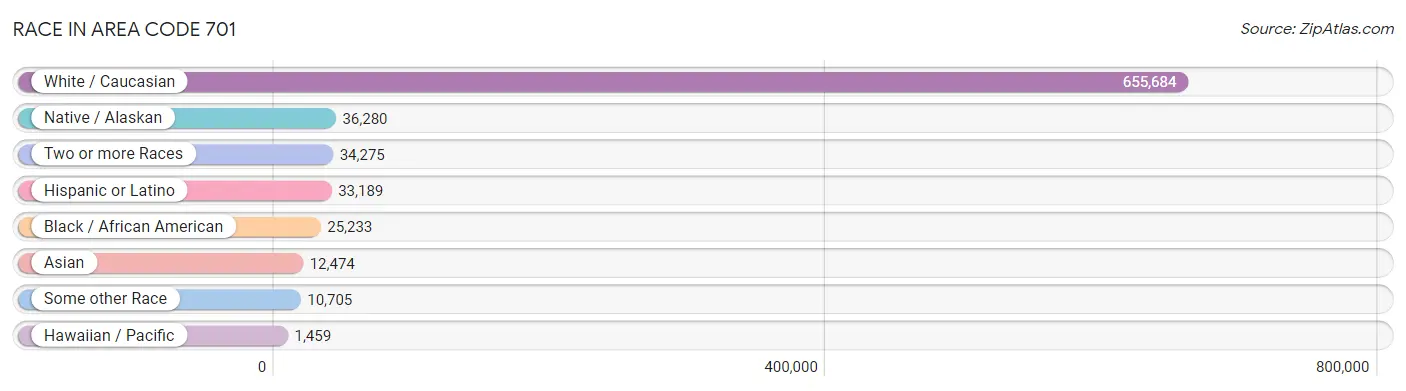
| Race | # Population | % Population |
| Asian | 12,474 | 1.6% |
| Black / African American | 25,233 | 3.3% |
| Hawaiian / Pacific | 1,459 | 0.2% |
| Hispanic or Latino | 33,189 | 4.3% |
| Native / Alaskan | 36,280 | 4.7% |
| White / Caucasian | 655,684 | 84.5% |
| Two or more Races | 34,275 | 4.4% |
| Some other Race | 10,705 | 1.4% |
| Total | 776,110 | 100.0% |
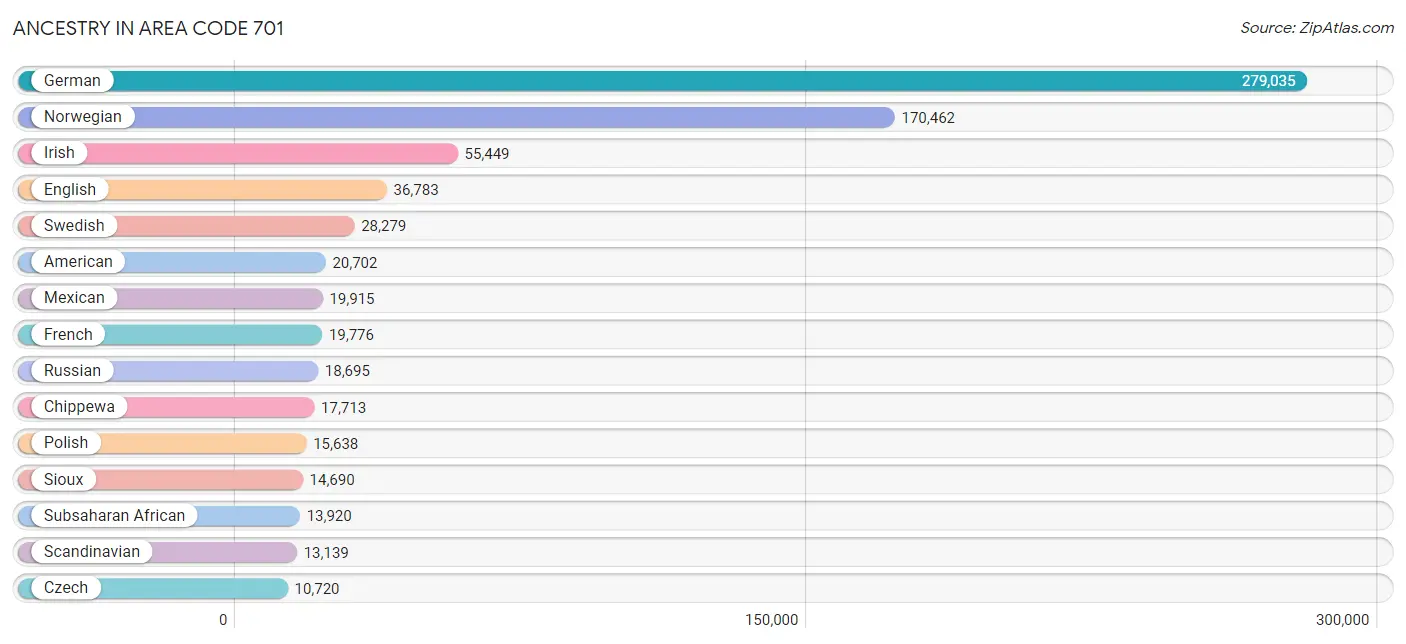
Ancestry in Area Code 701
The most populous ancestries reported in Area Code 701 are German (279,035 | 35.9%), Norwegian (170,462 | 22.0%), Irish (55,449 | 7.1%), English (36,783 | 4.7%), and Swedish (28,279 | 3.6%), together accounting for 73.4% of all Area Code 701 residents.
| Ancestry | # Population | % Population |
| Afghan | 441 | 0.1% |
| African | 3,891 | 0.5% |
| Alaska Native | 54 | 0.0% |
| Alaskan Athabascan | 4 | 0.0% |
| Albanian | 191 | 0.0% |
| Aleut | 13 | 0.0% |
| American | 20,702 | 2.7% |
| Apache | 138 | 0.0% |
| Arab | 3,064 | 0.4% |
| Arapaho | 5 | 0.0% |
| Argentinean | 60 | 0.0% |
| Armenian | 76 | 0.0% |
| Assyrian / Chaldean / Syriac | 14 | 0.0% |
| Australian | 127 | 0.0% |
| Austrian | 1,091 | 0.1% |
| Bahamian | 26 | 0.0% |
| Bangladeshi | 42 | 0.0% |
| Barbadian | 11 | 0.0% |
| Basque | 105 | 0.0% |
| Belgian | 703 | 0.1% |
| Belizean | 4 | 0.0% |
| Bermudan | 6 | 0.0% |
| Bhutanese | 1,434 | 0.2% |
| Blackfeet | 299 | 0.0% |
| Brazilian | 169 | 0.0% |
| British | 2,425 | 0.3% |
| British West Indian | 66 | 0.0% |
| Bulgarian | 160 | 0.0% |
| Burmese | 2,324 | 0.3% |
| Cambodian | 80 | 0.0% |
| Canadian | 802 | 0.1% |
| Cape Verdean | 18 | 0.0% |
| Celtic | 82 | 0.0% |
| Central American | 2,210 | 0.3% |
| Central American Indian | 242 | 0.0% |
| Cherokee | 832 | 0.1% |
| Cheyenne | 143 | 0.0% |
| Chickasaw | 33 | 0.0% |
| Chilean | 275 | 0.0% |
| Chinese | 6 | 0.0% |
| Chippewa | 17,713 | 2.3% |
| Choctaw | 157 | 0.0% |
| Colombian | 840 | 0.1% |
| Colville | 6 | 0.0% |
| Comanche | 118 | 0.0% |
| Costa Rican | 22 | 0.0% |
| Cree | 162 | 0.0% |
| Creek | 142 | 0.0% |
| Croatian | 427 | 0.1% |
| Crow | 225 | 0.0% |
| Cuban | 353 | 0.1% |
| Czech | 10,720 | 1.4% |
| Czechoslovakian | 1,095 | 0.1% |
| Danish | 6,871 | 0.9% |
| Delaware | 18 | 0.0% |
| Dominican | 356 | 0.1% |
| Dutch | 7,996 | 1.0% |
| Eastern European | 862 | 0.1% |
| Ecuadorian | 161 | 0.0% |
| Egyptian | 235 | 0.0% |
| English | 36,783 | 4.7% |
| Estonian | 21 | 0.0% |
| Ethiopian | 100 | 0.0% |
| European | 6,977 | 0.9% |
| Fijian | 275 | 0.0% |
| Filipino | 88 | 0.0% |
| Finnish | 4,372 | 0.6% |
| French | 19,776 | 2.5% |
| French American Indian | 383 | 0.1% |
| French Canadian | 5,698 | 0.7% |
| German | 279,035 | 35.9% |
| German Russian | 2,958 | 0.4% |
| Ghanaian | 223 | 0.0% |
| Greek | 684 | 0.1% |
| Guamanian / Chamorro | 178 | 0.0% |
| Guatemalan | 257 | 0.0% |
| Haitian | 546 | 0.1% |
| Honduran | 176 | 0.0% |
| Hopi | 22 | 0.0% |
| Houma | 199 | 0.0% |
| Hungarian | 1,868 | 0.2% |
| Icelander | 2,958 | 0.4% |
| Indian (Asian) | 2,190 | 0.3% |
| Inupiat | 135 | 0.0% |
| Iranian | 263 | 0.0% |
| Iraqi | 119 | 0.0% |
| Irish | 55,449 | 7.1% |
| Iroquois | 160 | 0.0% |
| Israeli | 5 | 0.0% |
| Italian | 9,300 | 1.2% |
| Jamaican | 627 | 0.1% |
| Japanese | 196 | 0.0% |
| Jordanian | 20 | 0.0% |
| Kenyan | 847 | 0.1% |
| Kiowa | 6 | 0.0% |
| Korean | 4,412 | 0.6% |
| Laotian | 126 | 0.0% |
| Latvian | 48 | 0.0% |
| Lebanese | 817 | 0.1% |
| Liberian | 3,156 | 0.4% |
| Lithuanian | 263 | 0.0% |
| Lumbee | 18 | 0.0% |
| Luxembourger | 447 | 0.1% |
| Macedonian | 2 | 0.0% |
| Malaysian | 80 | 0.0% |
| Menominee | 16 | 0.0% |
| Mexican | 19,915 | 2.6% |
| Mexican American Indian | 208 | 0.0% |
| Mongolian | 33 | 0.0% |
| Moroccan | 21 | 0.0% |
| Native Hawaiian | 749 | 0.1% |
| Navajo | 629 | 0.1% |
| New Zealander | 8 | 0.0% |
| Nicaraguan | 245 | 0.0% |
| Nigerian | 1,322 | 0.2% |
| Northern European | 1,053 | 0.1% |
| Norwegian | 170,462 | 22.0% |
| Ottawa | 2 | 0.0% |
| Paiute | 6 | 0.0% |
| Pakistani | 395 | 0.1% |
| Palestinian | 147 | 0.0% |
| Panamanian | 558 | 0.1% |
| Pennsylvania German | 247 | 0.0% |
| Peruvian | 268 | 0.0% |
| Polish | 15,638 | 2.0% |
| Portuguese | 467 | 0.1% |
| Potawatomi | 61 | 0.0% |
| Pueblo | 37 | 0.0% |
| Puerto Rican | 4,439 | 0.6% |
| Puget Sound Salish | 11 | 0.0% |
| Romanian | 817 | 0.1% |
| Russian | 18,695 | 2.4% |
| Salvadoran | 858 | 0.1% |
| Samoan | 212 | 0.0% |
| Scandinavian | 13,139 | 1.7% |
| Scotch-Irish | 4,298 | 0.5% |
| Scottish | 8,703 | 1.1% |
| Seminole | 29 | 0.0% |
| Senegalese | 136 | 0.0% |
| Serbian | 141 | 0.0% |
| Shoshone | 139 | 0.0% |
| Sierra Leonean | 4 | 0.0% |
| Sioux | 14,690 | 1.9% |
| Slavic | 66 | 0.0% |
| Slovak | 475 | 0.1% |
| Slovene | 325 | 0.0% |
| Somali | 1,906 | 0.3% |
| South African | 467 | 0.1% |
| South American | 1,639 | 0.2% |
| South American Indian | 93 | 0.0% |
| Spaniard | 1,494 | 0.2% |
| Spanish | 655 | 0.1% |
| Spanish American | 25 | 0.0% |
| Sri Lankan | 997 | 0.1% |
| Subsaharan African | 13,920 | 1.8% |
| Sudanese | 152 | 0.0% |
| Swedish | 28,279 | 3.6% |
| Swiss | 2,090 | 0.3% |
| Syrian | 466 | 0.1% |
| Thai | 2,187 | 0.3% |
| Tlingit-Haida | 51 | 0.0% |
| Tongan | 31 | 0.0% |
| Trinidadian and Tobagonian | 8 | 0.0% |
| Tsimshian | 43 | 0.0% |
| Turkish | 131 | 0.0% |
| Ukrainian | 4,108 | 0.5% |
| Ute | 1 | 0.0% |
| Venezuelan | 11 | 0.0% |
| Vietnamese | 303 | 0.0% |
| Welsh | 2,439 | 0.3% |
| West Indian | 36 | 0.0% |
| Yaqui | 3 | 0.0% |
| Yugoslavian | 743 | 0.1% |
| Yuman | 4 | 0.0% |
| Yup'ik | 29 | 0.0% |
| Zimbabwean | 117 | 0.0% | View All 176 Rows |
Immigrants in Area Code 701
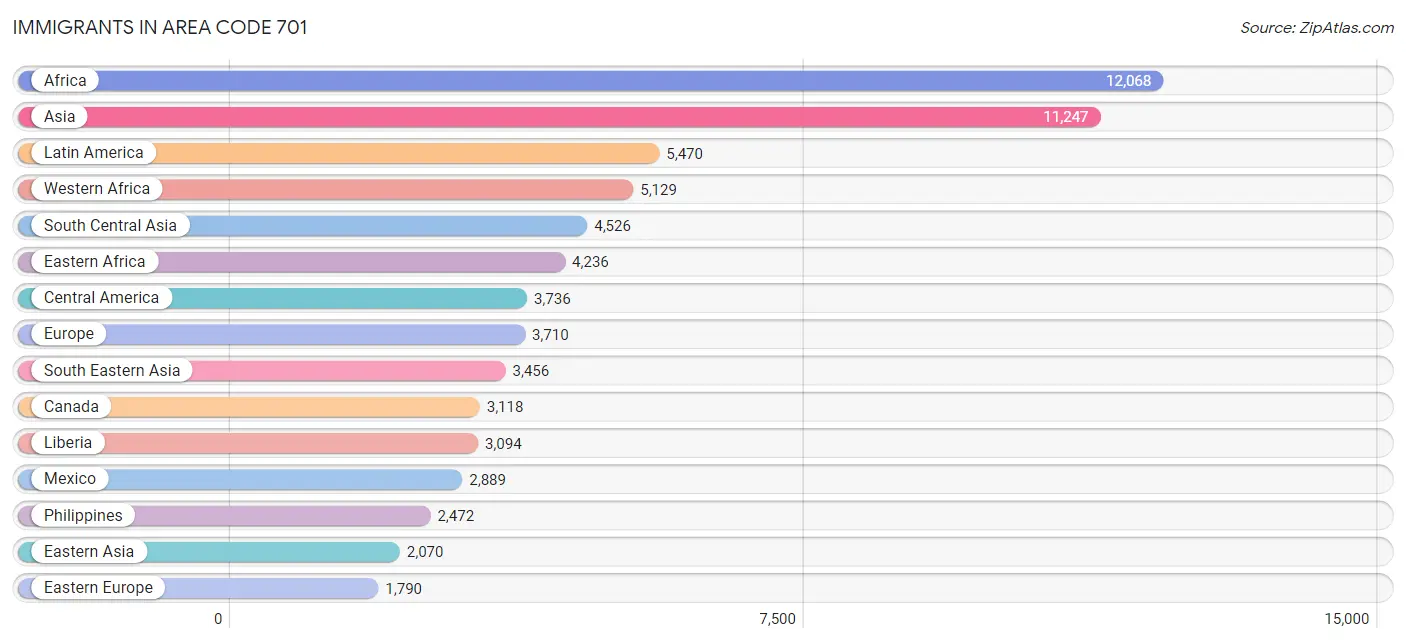
The most numerous immigrant groups reported in Area Code 701 came from Africa (12,068 | 1.5%), Asia (11,247 | 1.5%), Latin America (5,470 | 0.7%), Western Africa (5,129 | 0.7%), and South Central Asia (4,526 | 0.6%), together accounting for 4.9% of all Area Code 701 residents.
| Immigration Origin | # Population | % Population |
| Afghanistan | 325 | 0.0% |
| Africa | 12,068 | 1.5% |
| Argentina | 17 | 0.0% |
| Asia | 11,247 | 1.5% |
| Australia | 117 | 0.0% |
| Austria | 51 | 0.0% |
| Bangladesh | 259 | 0.0% |
| Barbados | 11 | 0.0% |
| Belarus | 12 | 0.0% |
| Belgium | 10 | 0.0% |
| Belize | 49 | 0.0% |
| Bolivia | 1 | 0.0% |
| Bosnia and Herzegovina | 445 | 0.1% |
| Brazil | 217 | 0.0% |
| Bulgaria | 158 | 0.0% |
| Cameroon | 240 | 0.0% |
| Canada | 3,118 | 0.4% |
| Caribbean | 860 | 0.1% |
| Central America | 3,736 | 0.5% |
| Chile | 88 | 0.0% |
| China | 865 | 0.1% |
| Colombia | 234 | 0.0% |
| Congo | 172 | 0.0% |
| Costa Rica | 8 | 0.0% |
| Croatia | 136 | 0.0% |
| Cuba | 60 | 0.0% |
| Czechoslovakia | 19 | 0.0% |
| Denmark | 70 | 0.0% |
| Dominican Republic | 164 | 0.0% |
| Eastern Africa | 4,236 | 0.5% |
| Eastern Asia | 2,070 | 0.3% |
| Eastern Europe | 1,790 | 0.2% |
| Ecuador | 54 | 0.0% |
| Egypt | 206 | 0.0% |
| El Salvador | 118 | 0.0% |
| England | 217 | 0.0% |
| Eritrea | 74 | 0.0% |
| Ethiopia | 115 | 0.0% |
| Europe | 3,710 | 0.5% |
| France | 239 | 0.0% |
| Germany | 738 | 0.1% |
| Ghana | 351 | 0.1% |
| Greece | 51 | 0.0% |
| Grenada | 12 | 0.0% |
| Guatemala | 158 | 0.0% |
| Haiti | 235 | 0.0% |
| Honduras | 112 | 0.0% |
| Hungary | 3 | 0.0% |
| India | 1,374 | 0.2% |
| Indonesia | 66 | 0.0% |
| Iran | 267 | 0.0% |
| Iraq | 351 | 0.1% |
| Ireland | 8 | 0.0% |
| Israel | 24 | 0.0% |
| Italy | 31 | 0.0% |
| Jamaica | 376 | 0.1% |
| Japan | 464 | 0.1% |
| Jordan | 49 | 0.0% |
| Kazakhstan | 8 | 0.0% |
| Kenya | 1,546 | 0.2% |
| Korea | 720 | 0.1% |
| Laos | 53 | 0.0% |
| Latin America | 5,470 | 0.7% |
| Latvia | 7 | 0.0% |
| Lebanon | 38 | 0.0% |
| Liberia | 3,094 | 0.4% |
| Lithuania | 59 | 0.0% |
| Malaysia | 52 | 0.0% |
| Mexico | 2,889 | 0.4% |
| Middle Africa | 1,007 | 0.1% |
| Moldova | 111 | 0.0% |
| Morocco | 15 | 0.0% |
| Nepal | 1,073 | 0.1% |
| Netherlands | 42 | 0.0% |
| Nicaragua | 67 | 0.0% |
| Nigeria | 1,068 | 0.1% |
| Northern Africa | 696 | 0.1% |
| Northern Europe | 589 | 0.1% |
| Norway | 47 | 0.0% |
| Oceania | 408 | 0.1% |
| Pakistan | 353 | 0.1% |
| Panama | 241 | 0.0% |
| Peru | 245 | 0.0% |
| Philippines | 2,472 | 0.3% |
| Poland | 67 | 0.0% |
| Romania | 193 | 0.0% |
| Russia | 282 | 0.0% |
| Saudi Arabia | 122 | 0.0% |
| Scotland | 48 | 0.0% |
| Senegal | 68 | 0.0% |
| Serbia | 93 | 0.0% |
| Sierra Leone | 53 | 0.0% |
| Somalia | 1,514 | 0.2% |
| South Africa | 525 | 0.1% |
| South America | 874 | 0.1% |
| South Central Asia | 4,526 | 0.6% |
| South Eastern Asia | 3,456 | 0.4% |
| Southern Europe | 227 | 0.0% |
| Spain | 145 | 0.0% |
| Sri Lanka | 84 | 0.0% |
| Sudan | 431 | 0.1% |
| Sweden | 4 | 0.0% |
| Syria | 225 | 0.0% |
| Taiwan | 87 | 0.0% |
| Thailand | 271 | 0.0% |
| Trinidad and Tobago | 2 | 0.0% |
| Turkey | 112 | 0.0% |
| Uganda | 85 | 0.0% |
| Ukraine | 106 | 0.0% |
| Uzbekistan | 9 | 0.0% |
| Venezuela | 5 | 0.0% |
| Vietnam | 542 | 0.1% |
| Western Africa | 5,129 | 0.7% |
| Western Asia | 1,107 | 0.1% |
| Western Europe | 1,080 | 0.1% |
| Yemen | 65 | 0.0% |
| Zaire | 595 | 0.1% |
| Zimbabwe | 144 | 0.0% | View All 118 Rows |
Sex and Age in Area Code 701
Sex and Age in Area Code 701
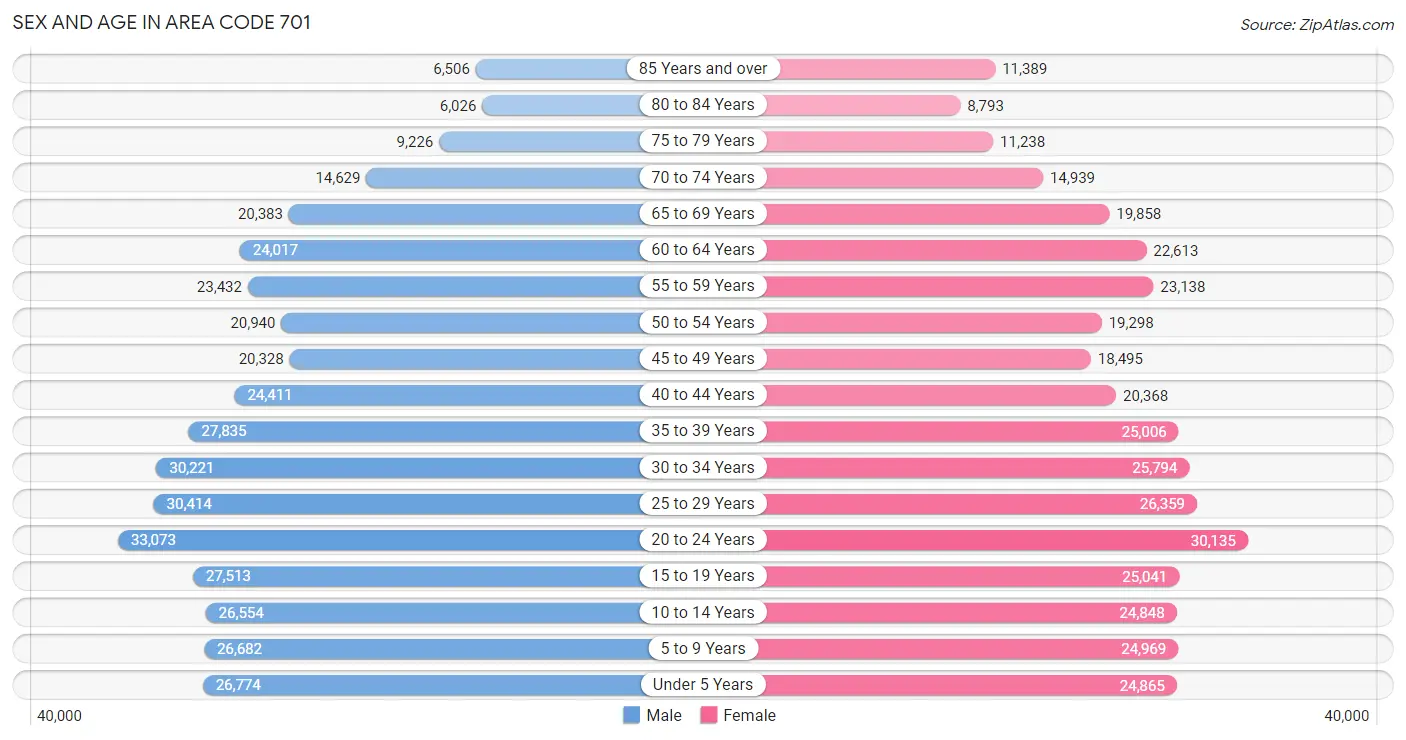
The most populous age groups in Area Code 701 are 20 to 24 Years (33,073 | 8.3%) for men and 20 to 24 Years (30,135 | 8.0%) for women.
| Age Bracket | Male | Female |
| Under 5 Years | 26,774 (6.7%) | 24,865 (6.6%) |
| 5 to 9 Years | 26,682 (6.7%) | 24,969 (6.6%) |
| 10 to 14 Years | 26,554 (6.7%) | 24,848 (6.6%) |
| 15 to 19 Years | 27,513 (6.9%) | 25,041 (6.6%) |
| 20 to 24 Years | 33,073 (8.3%) | 30,135 (8.0%) |
| 25 to 29 Years | 30,414 (7.6%) | 26,359 (7.0%) |
| 30 to 34 Years | 30,221 (7.6%) | 25,794 (6.8%) |
| 35 to 39 Years | 27,835 (7.0%) | 25,006 (6.6%) |
| 40 to 44 Years | 24,411 (6.1%) | 20,368 (5.4%) |
| 45 to 49 Years | 20,328 (5.1%) | 18,495 (4.9%) |
| 50 to 54 Years | 20,940 (5.2%) | 19,298 (5.1%) |
| 55 to 59 Years | 23,432 (5.9%) | 23,138 (6.1%) |
| 60 to 64 Years | 24,017 (6.0%) | 22,613 (6.0%) |
| 65 to 69 Years | 20,383 (5.1%) | 19,858 (5.3%) |
| 70 to 74 Years | 14,629 (3.7%) | 14,939 (4.0%) |
| 75 to 79 Years | 9,226 (2.3%) | 11,238 (3.0%) |
| 80 to 84 Years | 6,026 (1.5%) | 8,793 (2.3%) |
| 85 Years and over | 6,506 (1.6%) | 11,389 (3.0%) |
| Total | 398,964 (100.0%) | 377,146 (100.0%) |
Families and Households in Area Code 701
Median Family Size in Area Code 701
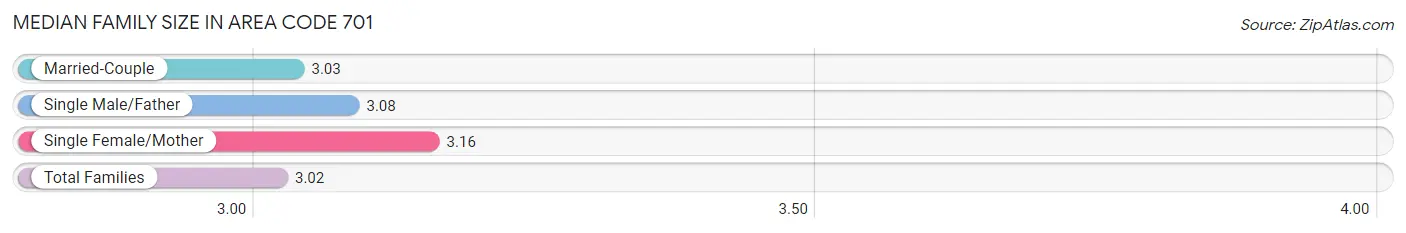
The median family size in Area Code 701 is 3.02 persons per family, with single female/mother families (24,017 | 12.8%) accounting for the largest median family size of 3.15527 persons per family. On the other hand, married-couple families (151,409 | 80.5%) represent the smallest median family size with 3.03 persons per family.
| Family Type | # Families | Family Size |
| Married-Couple | 151,409 (80.5%) | 3.03 |
| Single Male/Father | 12,705 (6.8%) | 3.08 |
| Single Female/Mother | 24,017 (12.8%) | 3.16 |
| Total Families | 188,131 (100.0%) | 3.02 |
Median Household Size in Area Code 701
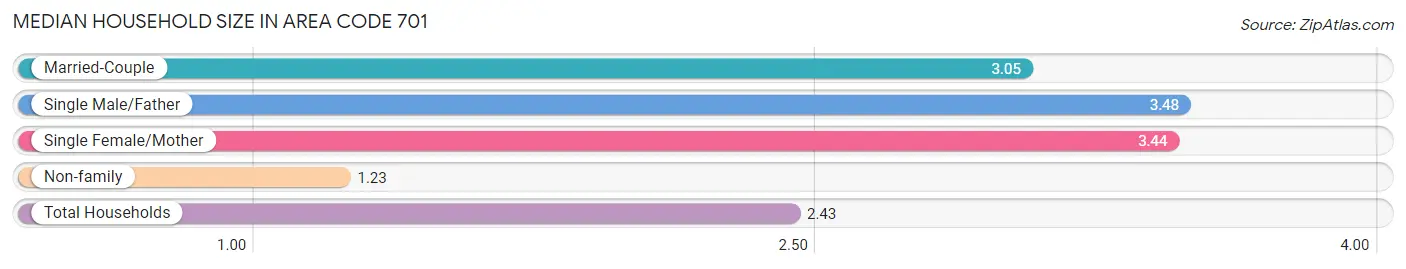
The median household size in Area Code 701 is 2.43 persons per household, with single male/father households (12,705 | 4.0%) accounting for the largest median household size of 3.47552 persons per household. non-family households (131,412 | 41.1%) represent the smallest median household size with 1.23 persons per household.
| Household Type | # Households | Household Size |
| Married-Couple | 151,409 (47.4%) | 3.05 |
| Single Male/Father | 12,705 (4.0%) | 3.48 |
| Single Female/Mother | 24,017 (7.5%) | 3.44 |
| Non-family | 131,412 (41.1%) | 1.23 |
| Total Households | 319,543 (100.0%) | 2.43 |
Household Size by Marriage Status in Area Code 701
Out of a total of 319,543 households in Area Code 701, 188,131 (58.9%) are family households, while 131,412 (41.1%) are nonfamily households. The most numerous type of family households are 2-person households, comprising 92,674, and the most common type of nonfamily households are 1-person households, comprising 106,047.
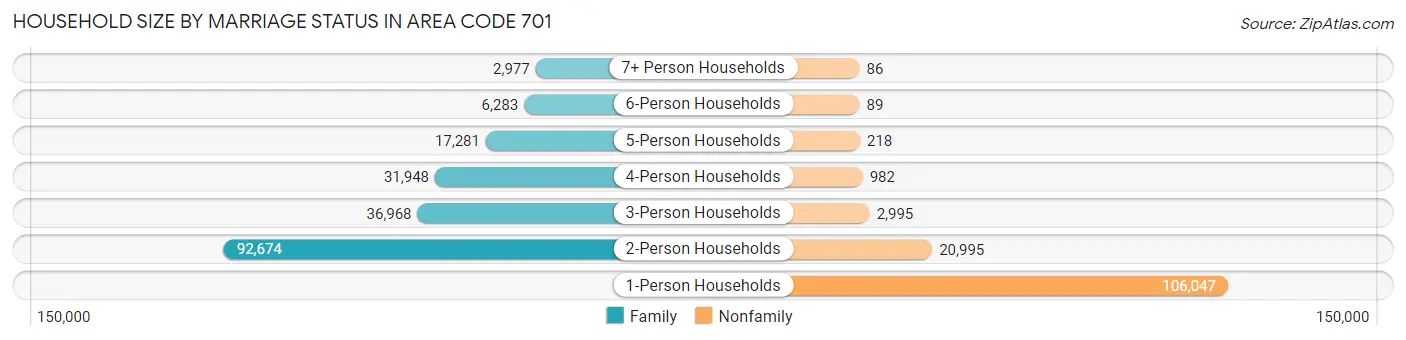
| Household Size | Family Households | Nonfamily Households |
| 1-Person Households | - | 106,047 (33.2%) |
| 2-Person Households | 92,674 (29.0%) | 20,995 (6.6%) |
| 3-Person Households | 36,968 (11.6%) | 2,995 (0.9%) |
| 4-Person Households | 31,948 (10.0%) | 982 (0.3%) |
| 5-Person Households | 17,281 (5.4%) | 218 (0.1%) |
| 6-Person Households | 6,283 (2.0%) | 89 (0.0%) |
| 7+ Person Households | 2,977 (0.9%) | 86 (0.0%) |
| Total | 188,131 (58.9%) | 131,412 (41.1%) |
Female Fertility in Area Code 701
Fertility by Age in Area Code 701
Average fertility rate in Area Code 701 is 103.4 births per 1,000 women. Women in the age bracket of 20 to 34 years have the highest fertility rate with 216.7 births per 1,000 women. Women in the age bracket of 20 to 34 years acount for 79.2% of all women with births.
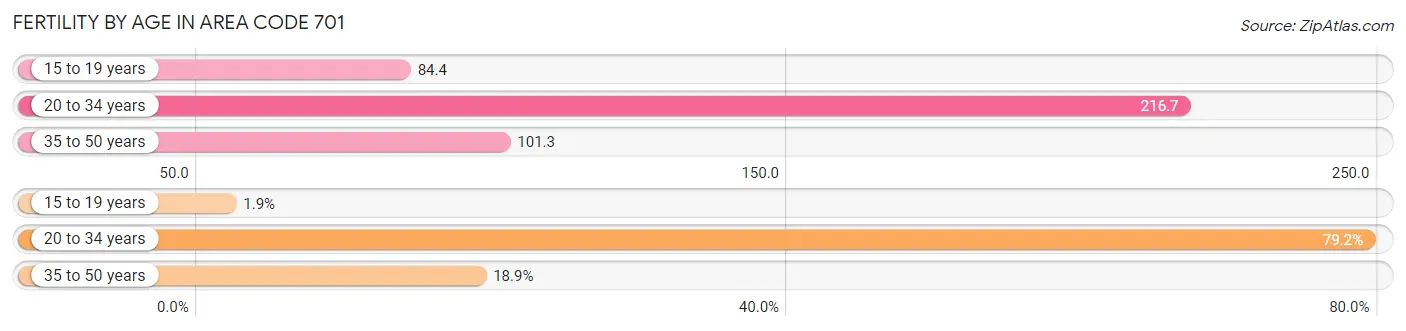
| Age Bracket | Women with Births | Births / 1,000 Women |
| 15 to 19 years | 219 (1.9%) | 84.4 |
| 20 to 34 years | 9,039 (79.2%) | 216.7 |
| 35 to 50 years | 2,155 (18.9%) | 101.3 |
| Total | 11,413 (100.0%) | 103.4 |
Fertility by Age by Marriage Status in Area Code 701
45.1% of women with births (11,413) in Area Code 701 are married. The highest percentage of unmarried women with births falls into 15 to 19 years age bracket with 100.0% of them unmarried at the time of birth, while the lowest percentage of unmarried women with births belong to 20 to 34 years age bracket with 57.3% of them unmarried.
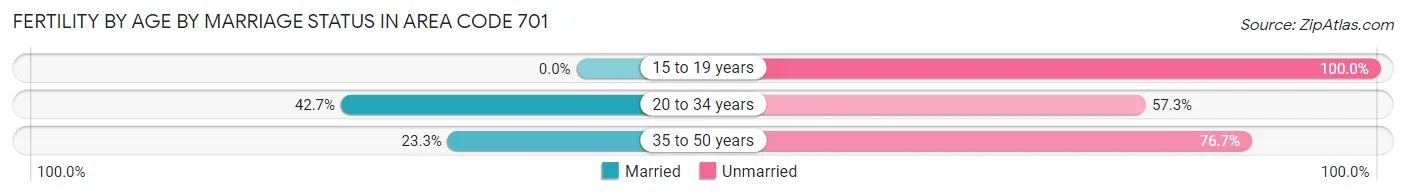
| Age Bracket | Married | Unmarried |
| 15 to 19 years | 0 (0.0%) | 219 (100.0%) |
| 20 to 34 years | 3,859 (42.7%) | 5,180 (57.3%) |
| 35 to 50 years | 503 (23.3%) | 1,652 (76.7%) |
| Total | 5,146 (45.1%) | 6,267 (54.9%) |
Fertility by Education in Area Code 701
Average fertility rate in Area Code 701 is 103.4 births per 1,000 women. Women with the education attainment of graduate degree have the highest fertility rate of 304.6 births per 1,000 women, while women with the education attainment of college or associate's degree have the lowest fertility at 162.3 births per 1,000 women. Women with the education attainment of college or associate's degree represent 33.3% of all women with births.
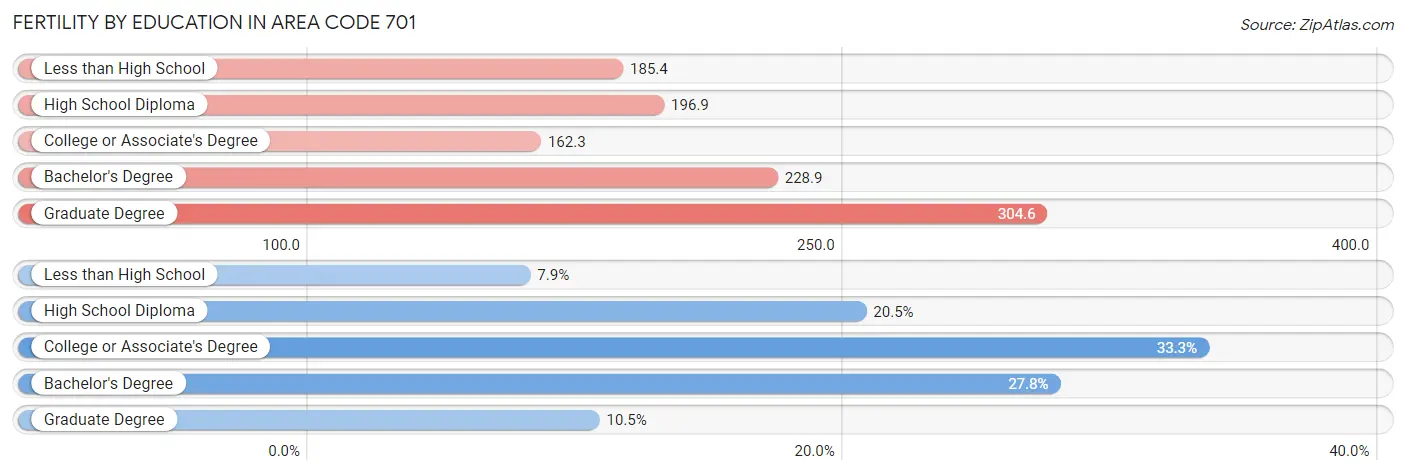
| Educational Attainment | Women with Births | Births / 1,000 Women |
| Less than High School | 903 (7.9%) | 185.4 |
| High School Diploma | 2,340 (20.5%) | 196.9 |
| College or Associate's Degree | 3,804 (33.3%) | 162.3 |
| Bachelor's Degree | 3,168 (27.8%) | 228.9 |
| Graduate Degree | 1,198 (10.5%) | 304.6 |
| Total | 11,413 (100.0%) | 103.4 |
Fertility by Education by Marriage Status in Area Code 701
54.9% of women with births in Area Code 701 are unmarried. Women with the educational attainment of bachelor's degree are most likely to be married with 43.4% of them married at childbirth, while women with the educational attainment of less than high school are least likely to be married with 82.1% of them unmarried at childbirth.
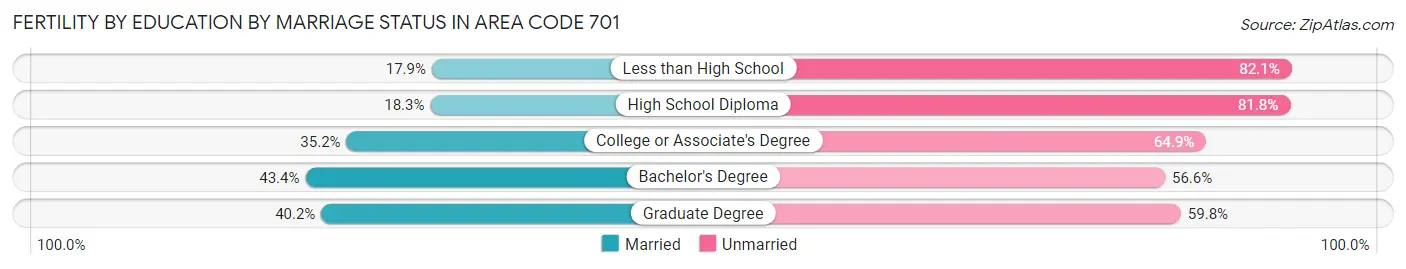
| Educational Attainment | Married | Unmarried |
| Less than High School | 162 (17.9%) | 741 (82.1%) |
| High School Diploma | 427 (18.2%) | 1,913 (81.8%) |
| College or Associate's Degree | 1,337 (35.1%) | 2,467 (64.8%) |
| Bachelor's Degree | 1,376 (43.4%) | 1,792 (56.6%) |
| Graduate Degree | 482 (40.2%) | 716 (59.8%) |
| Total | 5,146 (45.1%) | 6,267 (54.9%) |
Employment Characteristics in Area Code 701
Employment by Class of Employer in Area Code 701
Among the 403,728 employed individuals in Area Code 701, private company employees (243,763 | 60.4%), not-for-profit organizations (42,996 | 10.6%), and local government employees (31,788 | 7.9%) make up the most common classes of employment.
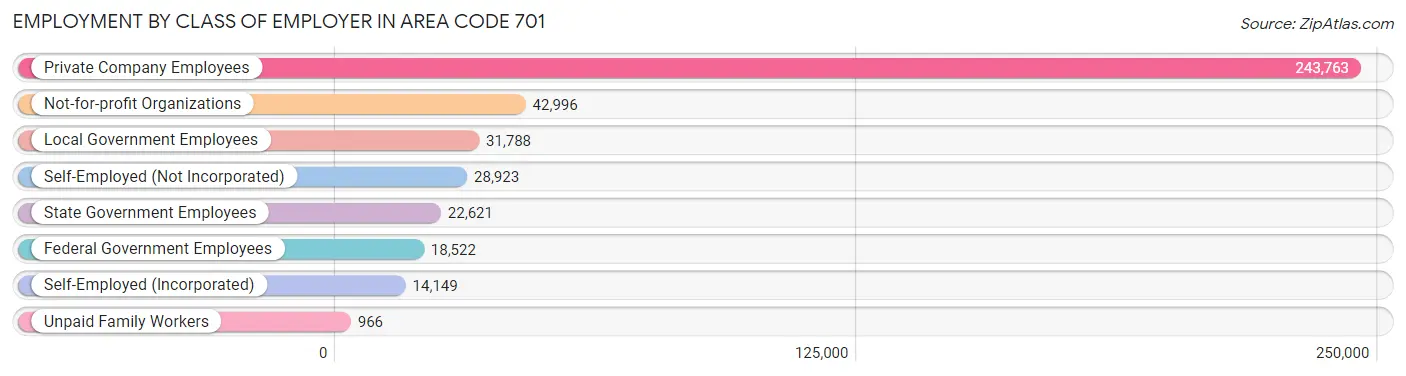
| Employer Class | # Employees | % Employees |
| Private Company Employees | 243,763 | 60.4% |
| Self-Employed (Incorporated) | 14,149 | 3.5% |
| Self-Employed (Not Incorporated) | 28,923 | 7.2% |
| Not-for-profit Organizations | 42,996 | 10.6% |
| Local Government Employees | 31,788 | 7.9% |
| State Government Employees | 22,621 | 5.6% |
| Federal Government Employees | 18,522 | 4.6% |
| Unpaid Family Workers | 966 | 0.2% |
| Total | 403,728 | 100.0% |
Employment Status by Age in Area Code 701
According to the labor force statistics for Area Code 701, out of the total population over 16 years of age (612,262), 62.5% or 382,970 individuals are in the labor force, with 4.0% or 15,127 of them unemployed. The age group with the highest labor force participation rate is 25 to 29 years, with 88.8% or 50,414 individuals in the labor force. Within the labor force, the 16 to 19 years age range has the highest percentage of unemployed individuals, with 1,931.5% or 397,232 of them being unemployed.
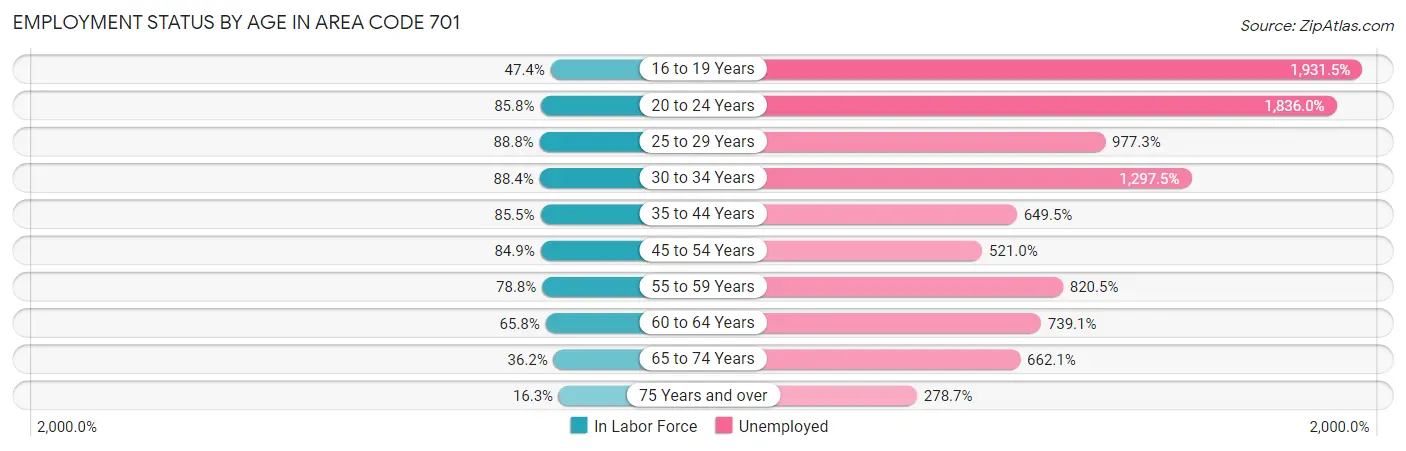
| Age Bracket | In Labor Force | Unemployed |
| 16 to 19 Years | 20,567 (47.4%) | 397,232 (1,931.5%) |
| 20 to 24 Years | 54,219 (85.8%) | 995,479 (1,836.0%) |
| 25 to 29 Years | 50,413 (88.8%) | 492,696 (977.3%) |
| 30 to 34 Years | 49,487 (88.3%) | 642,120 (1,297.5%) |
| 35 to 44 Years | 83,473 (85.5%) | 542,170 (649.5%) |
| 45 to 54 Years | 67,097 (84.9%) | 349,586 (521.0%) |
| 55 to 59 Years | 36,680 (78.8%) | 300,951 (820.5%) |
| 60 to 64 Years | 30,696 (65.8%) | 226,882 (739.1%) |
| 65 to 74 Years | 25,274 (36.2%) | 167,319 (662.1%) |
| 75 Years and over | 8,682 (16.3%) | 24,202 (278.7%) |
| Total | 382,962 (62.5%) | 15,143 (4.0%) |
Employment Status by Educational Attainment in Area Code 701
According to labor force statistics for Area Code 701, 80.1% of individuals (306,556) out of the total population between 25 and 64 years of age (382,669) are in the labor force, with 823.7% or 2,525,102 of them being unemployed. The group with the highest labor force participation rate are those with the educational attainment of bachelor's degree or higher, with 86.5% or 111,434 individuals in the labor force. Within the labor force, individuals with less than high school education have the highest percentage of unemployment, with 2,159.0% or 333,566 of them being unemployed.
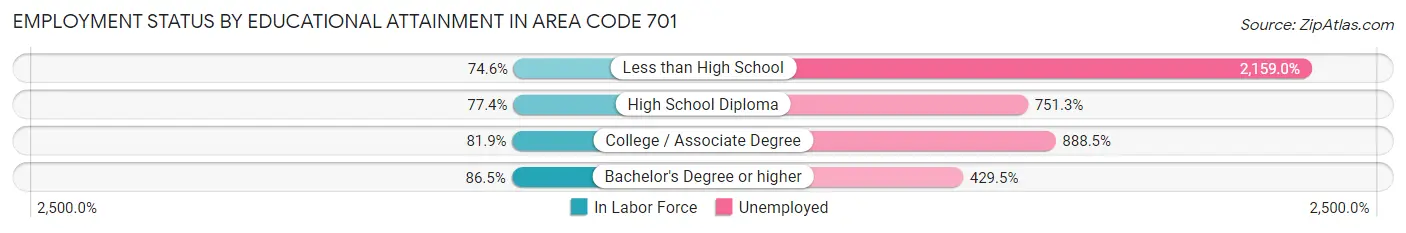
| Educational Attainment | In Labor Force | Unemployed |
| Less than High School | 15,449 (74.6%) | 447,431 (2,159.0%) |
| High School Diploma | 70,867 (77.4%) | 687,575 (751.3%) |
| College / Associate Degree | 115,997 (81.9%) | 1,258,125 (888.5%) |
| Bachelor's Degree or higher | 111,434 (86.5%) | 553,308 (429.5%) |
| Total | 306,556 (80.1%) | 3,152,045 (823.7%) |
Employment Occupations by Sex in Area Code 701
Management, Business, Science and Arts Occupations
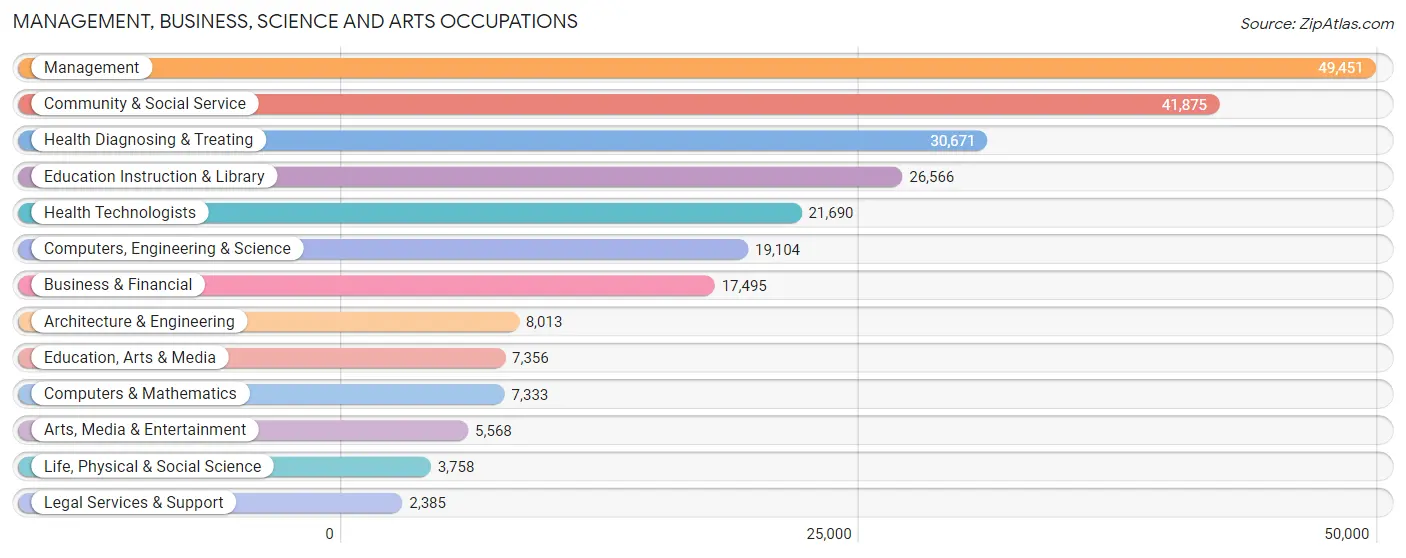
The most common Management, Business, Science and Arts occupations in Area Code 701 are Management (49,451 | 12.2%), Community & Social Service (41,875 | 10.3%), Health Diagnosing & Treating (30,671 | 7.6%), Education Instruction & Library (26,566 | 6.6%), and Health Technologists (21,690 | 5.4%).
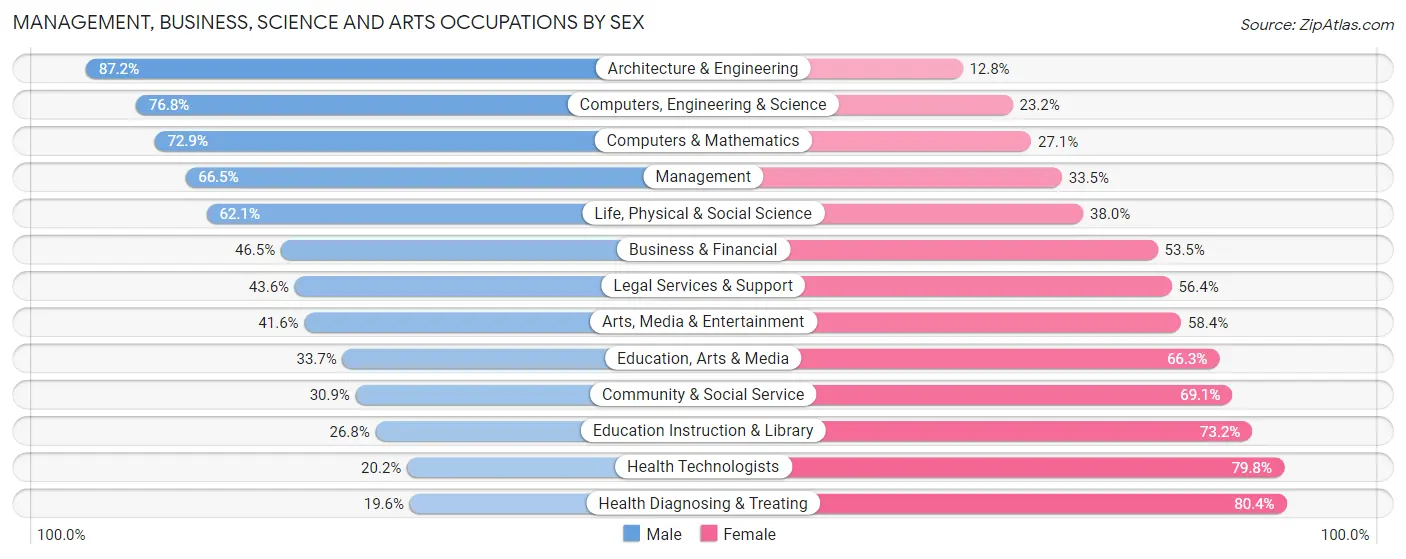
Management, Business, Science and Arts Occupations by Sex
Within the Management, Business, Science and Arts occupations in Area Code 701, the most male-oriented occupations are Architecture & Engineering (87.2%), Computers, Engineering & Science (76.8%), and Computers & Mathematics (72.9%), while the most female-oriented occupations are Health Diagnosing & Treating (80.4%), Health Technologists (79.8%), and Education Instruction & Library (73.2%).
| Occupation | Male | Female |
| Management | 32,876 (66.5%) | 16,575 (33.5%) |
| Business & Financial | 8,137 (46.5%) | 9,358 (53.5%) |
| Computers, Engineering & Science | 14,667 (76.8%) | 4,437 (23.2%) |
| Computers & Mathematics | 5,346 (72.9%) | 1,987 (27.1%) |
| Architecture & Engineering | 6,989 (87.2%) | 1,024 (12.8%) |
| Life, Physical & Social Science | 2,332 (62.1%) | 1,426 (38.0%) |
| Community & Social Service | 12,952 (30.9%) | 28,923 (69.1%) |
| Education, Arts & Media | 2,477 (33.7%) | 4,879 (66.3%) |
| Legal Services & Support | 1,040 (43.6%) | 1,345 (56.4%) |
| Education Instruction & Library | 7,117 (26.8%) | 19,449 (73.2%) |
| Arts, Media & Entertainment | 2,318 (41.6%) | 3,250 (58.4%) |
| Health Diagnosing & Treating | 6,023 (19.6%) | 24,648 (80.4%) |
| Health Technologists | 4,382 (20.2%) | 17,308 (79.8%) |
| Total (Category) | 74,655 (47.1%) | 83,941 (52.9%) |
| Total (Overall) | 218,723 (54.1%) | 185,714 (45.9%) |
Services Occupations
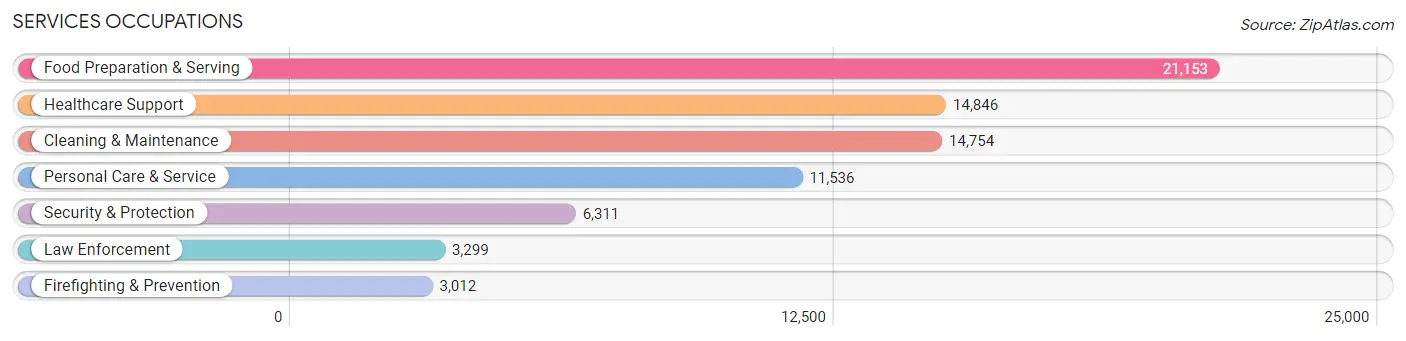
The most common Services occupations in Area Code 701 are Food Preparation & Serving (21,153 | 5.2%), Healthcare Support (14,846 | 3.7%), Cleaning & Maintenance (14,754 | 3.6%), Personal Care & Service (11,536 | 2.9%), and Security & Protection (6,311 | 1.6%).
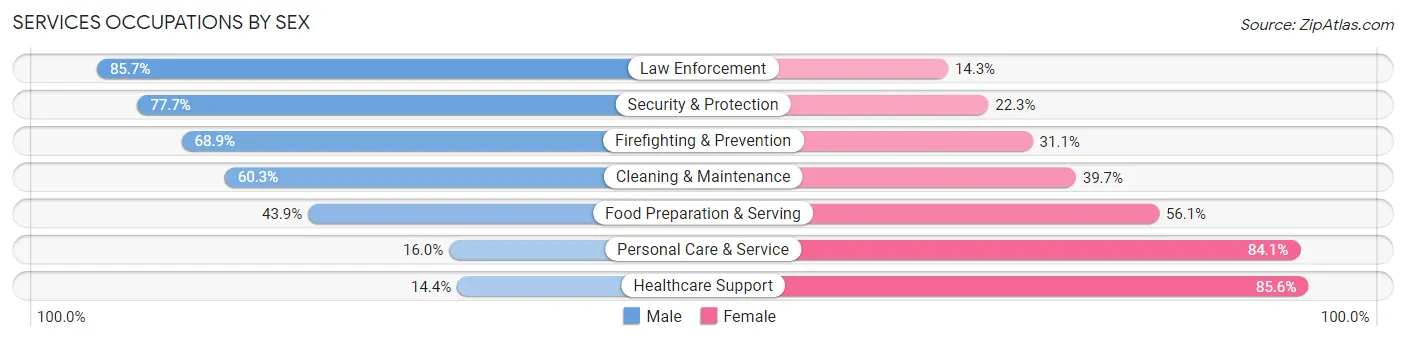
Services Occupations by Sex
Within the Services occupations in Area Code 701, the most male-oriented occupations are Law Enforcement (85.7%), Security & Protection (77.7%), and Firefighting & Prevention (68.9%), while the most female-oriented occupations are Healthcare Support (85.6%), Personal Care & Service (84.1%), and Food Preparation & Serving (56.1%).
| Occupation | Male | Female |
| Healthcare Support | 2,133 (14.4%) | 12,713 (85.6%) |
| Security & Protection | 4,901 (77.7%) | 1,410 (22.3%) |
| Firefighting & Prevention | 2,075 (68.9%) | 937 (31.1%) |
| Law Enforcement | 2,826 (85.7%) | 473 (14.3%) |
| Food Preparation & Serving | 9,281 (43.9%) | 11,872 (56.1%) |
| Cleaning & Maintenance | 8,903 (60.3%) | 5,851 (39.7%) |
| Personal Care & Service | 1,840 (16.0%) | 9,696 (84.1%) |
| Total (Category) | 27,058 (39.4%) | 41,542 (60.6%) |
| Total (Overall) | 218,723 (54.1%) | 185,714 (45.9%) |
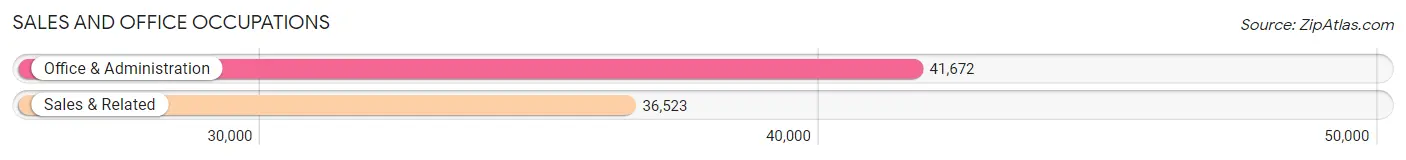
Sales and Office Occupations
The most common Sales and Office occupations in Area Code 701 are Office & Administration (41,672 | 10.3%), and Sales & Related (36,523 | 9.0%).
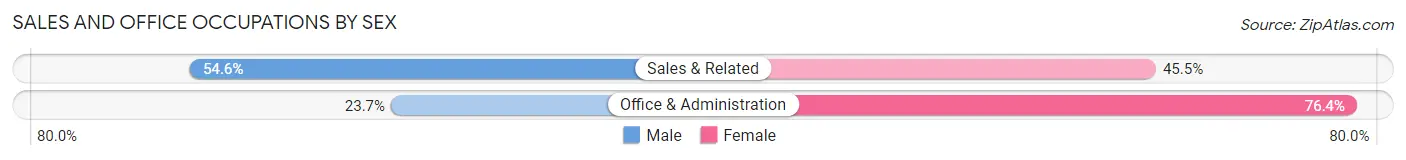
Sales and Office Occupations by Sex
| Occupation | Male | Female |
| Sales & Related | 19,924 (54.5%) | 16,599 (45.5%) |
| Office & Administration | 9,854 (23.6%) | 31,818 (76.3%) |
| Total (Category) | 29,778 (38.1%) | 48,417 (61.9%) |
| Total (Overall) | 218,723 (54.1%) | 185,714 (45.9%) |
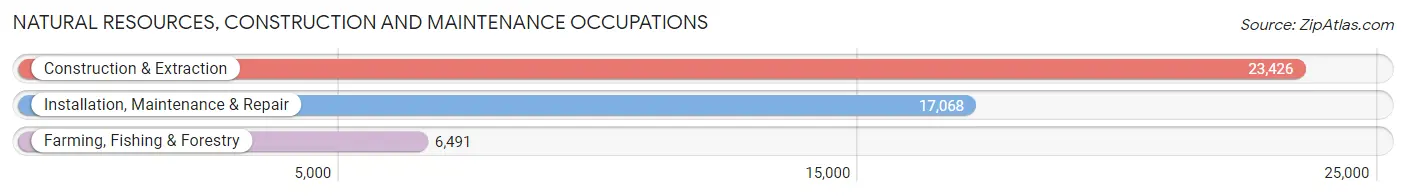
Natural Resources, Construction and Maintenance Occupations
The most common Natural Resources, Construction and Maintenance occupations in Area Code 701 are Construction & Extraction (23,426 | 5.8%), Installation, Maintenance & Repair (17,068 | 4.2%), and Farming, Fishing & Forestry (6,491 | 1.6%).
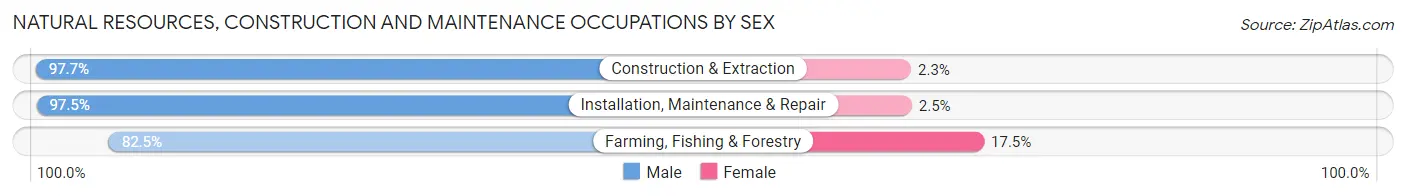
Natural Resources, Construction and Maintenance Occupations by Sex
| Occupation | Male | Female |
| Farming, Fishing & Forestry | 5,354 (82.5%) | 1,137 (17.5%) |
| Construction & Extraction | 22,881 (97.7%) | 545 (2.3%) |
| Installation, Maintenance & Repair | 16,644 (97.5%) | 424 (2.5%) |
| Total (Category) | 44,879 (95.5%) | 2,106 (4.5%) |
| Total (Overall) | 218,723 (54.1%) | 185,714 (45.9%) |
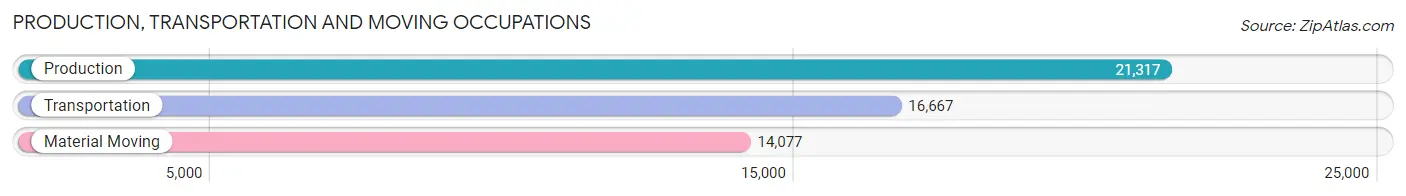
Production, Transportation and Moving Occupations
The most common Production, Transportation and Moving occupations in Area Code 701 are Production (21,317 | 5.3%), Transportation (16,667 | 4.1%), and Material Moving (14,077 | 3.5%).
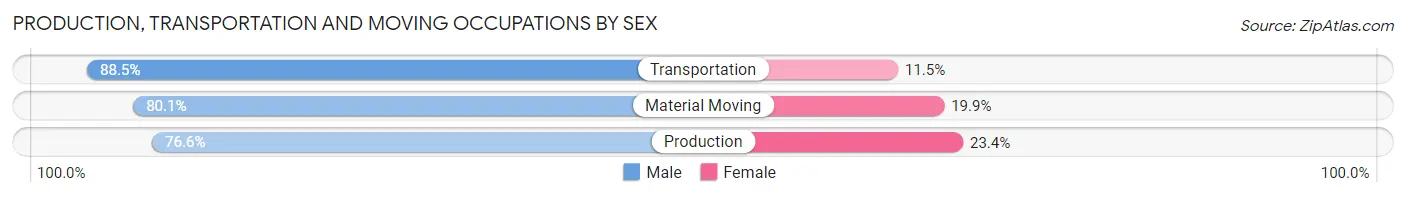
Production, Transportation and Moving Occupations by Sex
| Occupation | Male | Female |
| Production | 16,328 (76.6%) | 4,989 (23.4%) |
| Transportation | 14,755 (88.5%) | 1,912 (11.5%) |
| Material Moving | 11,270 (80.1%) | 2,807 (19.9%) |
| Total (Category) | 42,353 (81.4%) | 9,708 (18.6%) |
| Total (Overall) | 218,723 (54.1%) | 185,714 (45.9%) |
Employment Industries by Sex in Area Code 701
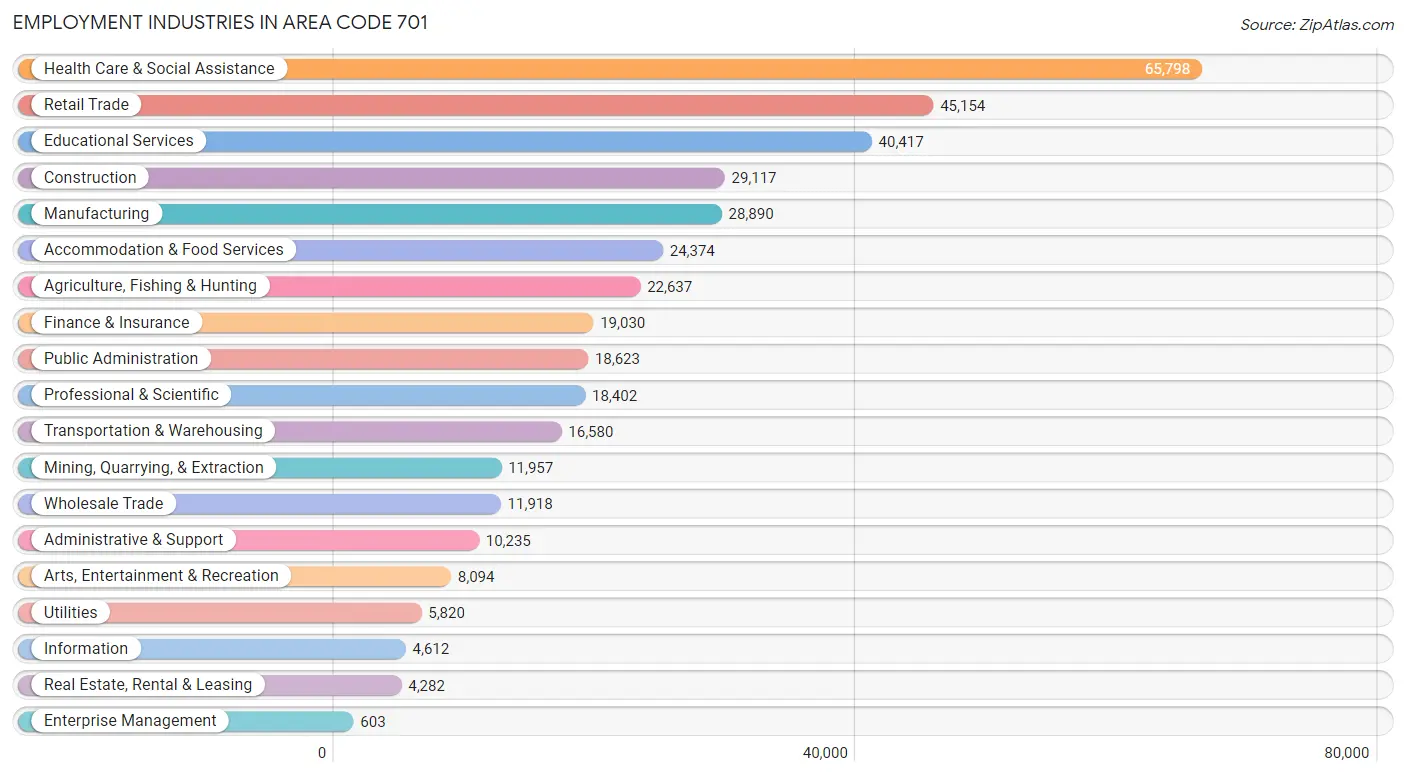
Employment Industries in Area Code 701
The major employment industries in Area Code 701 include Health Care & Social Assistance (65,798 | 16.3%), Retail Trade (45,154 | 11.2%), Educational Services (40,417 | 10.0%), Construction (29,117 | 7.2%), and Manufacturing (28,890 | 7.1%).
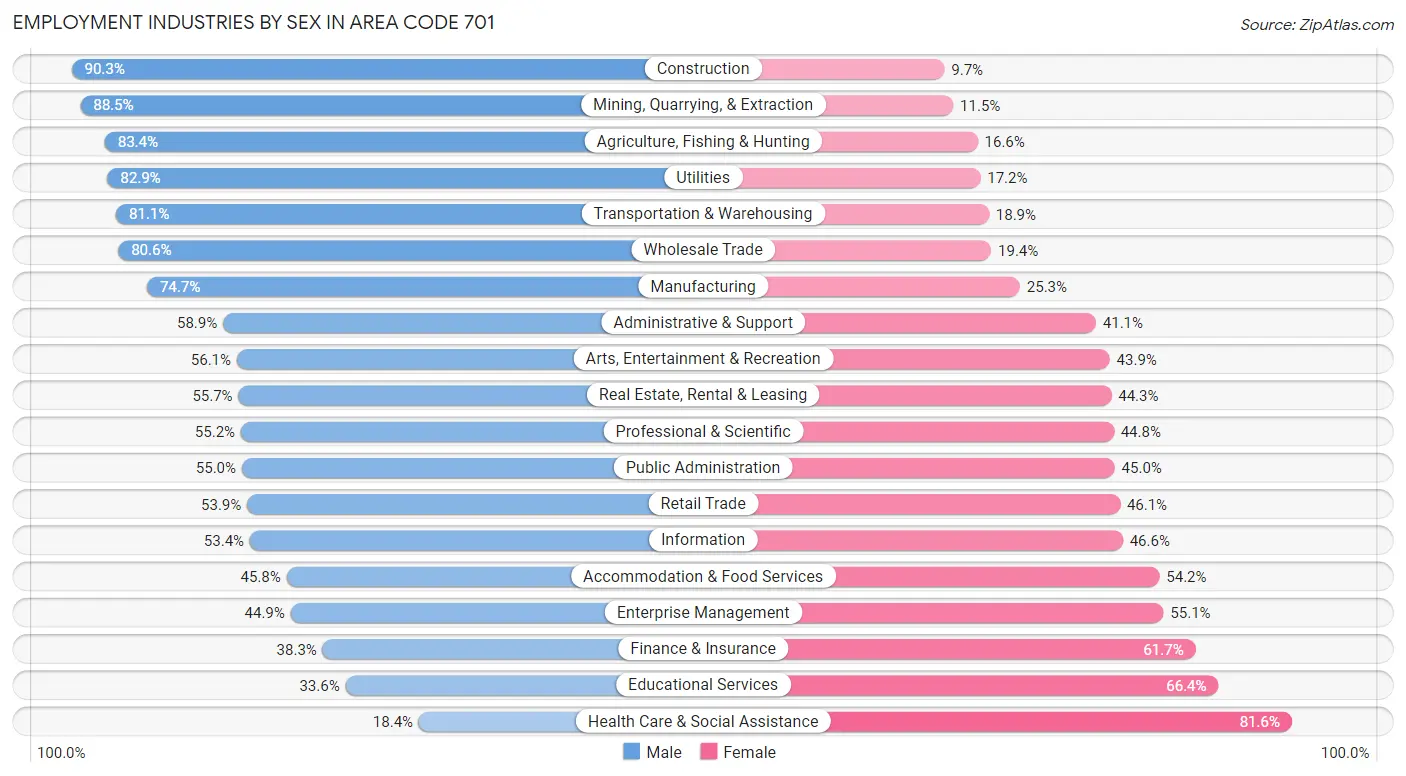
Employment Industries by Sex in Area Code 701
The Area Code 701 industries that see more men than women are Construction (90.3%), Mining, Quarrying, & Extraction (88.5%), and Agriculture, Fishing & Hunting (83.4%), whereas the industries that tend to have a higher number of women are Health Care & Social Assistance (81.6%), Educational Services (66.4%), and Finance & Insurance (61.7%).
| Industry | Male | Female |
| Agriculture, Fishing & Hunting | 18,880 (83.4%) | 3,757 (16.6%) |
| Mining, Quarrying, & Extraction | 10,577 (88.5%) | 1,380 (11.5%) |
| Construction | 26,288 (90.3%) | 2,829 (9.7%) |
| Manufacturing | 21,568 (74.7%) | 7,322 (25.3%) |
| Wholesale Trade | 9,607 (80.6%) | 2,311 (19.4%) |
| Retail Trade | 24,354 (53.9%) | 20,800 (46.1%) |
| Transportation & Warehousing | 13,441 (81.1%) | 3,139 (18.9%) |
| Utilities | 4,822 (82.9%) | 998 (17.2%) |
| Information | 2,461 (53.4%) | 2,151 (46.6%) |
| Finance & Insurance | 7,290 (38.3%) | 11,740 (61.7%) |
| Real Estate, Rental & Leasing | 2,387 (55.7%) | 1,895 (44.3%) |
| Professional & Scientific | 10,164 (55.2%) | 8,238 (44.8%) |
| Enterprise Management | 271 (44.9%) | 332 (55.1%) |
| Administrative & Support | 6,031 (58.9%) | 4,204 (41.1%) |
| Educational Services | 13,571 (33.6%) | 26,846 (66.4%) |
| Health Care & Social Assistance | 12,101 (18.4%) | 53,697 (81.6%) |
| Arts, Entertainment & Recreation | 4,538 (56.1%) | 3,556 (43.9%) |
| Accommodation & Food Services | 11,159 (45.8%) | 13,215 (54.2%) |
| Public Administration | 10,248 (55.0%) | 8,375 (45.0%) |
| Total | 218,723 (54.1%) | 185,714 (45.9%) |
Education in Area Code 701
School Enrollment in Area Code 701
The most common levels of schooling among the 196,671 students in Area Code 701 are college / undergraduate (49,245 | 25.0%), middle school (40,809 | 20.7%), and elementary school (38,976 | 19.8%).
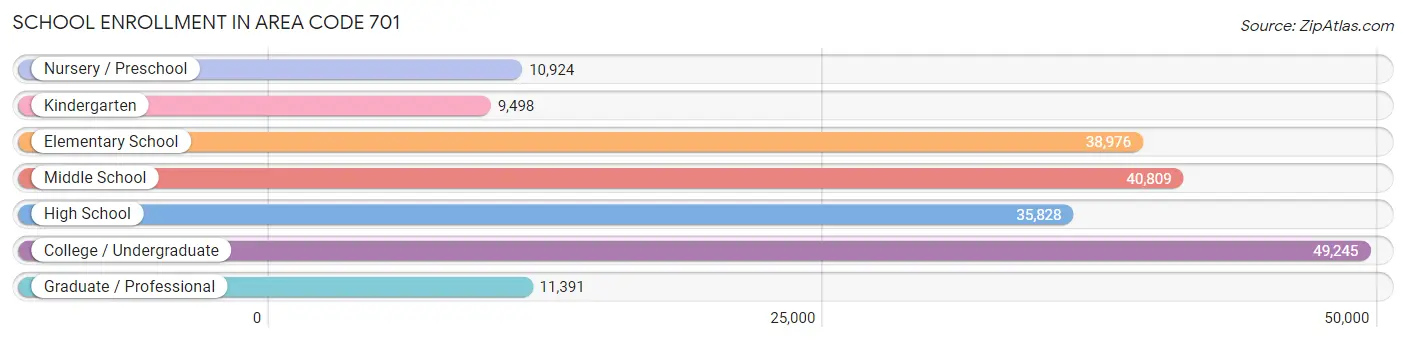
| School Level | # Students | % Students |
| Nursery / Preschool | 10,924 | 5.6% |
| Kindergarten | 9,498 | 4.8% |
| Elementary School | 38,976 | 19.8% |
| Middle School | 40,809 | 20.7% |
| High School | 35,828 | 18.2% |
| College / Undergraduate | 49,245 | 25.0% |
| Graduate / Professional | 11,391 | 5.8% |
| Total | 196,671 | 100.0% |
School Enrollment by Age by Funding Source in Area Code 701
Out of a total of 196,671 students who are enrolled in schools in Area Code 701, 23,069 (11.7%) attend a private institution, while the remaining 173,602 (88.3%) are enrolled in public schools. The age group of 3 to 4 year olds has the highest likelihood of being enrolled in private schools, with 2,042 (31.5% in the age bracket) enrolled. Conversely, the age group of 15 to 17 year olds has the lowest likelihood of being enrolled in a private school, with 24,431 (91.5% in the age bracket) attending a public institution.
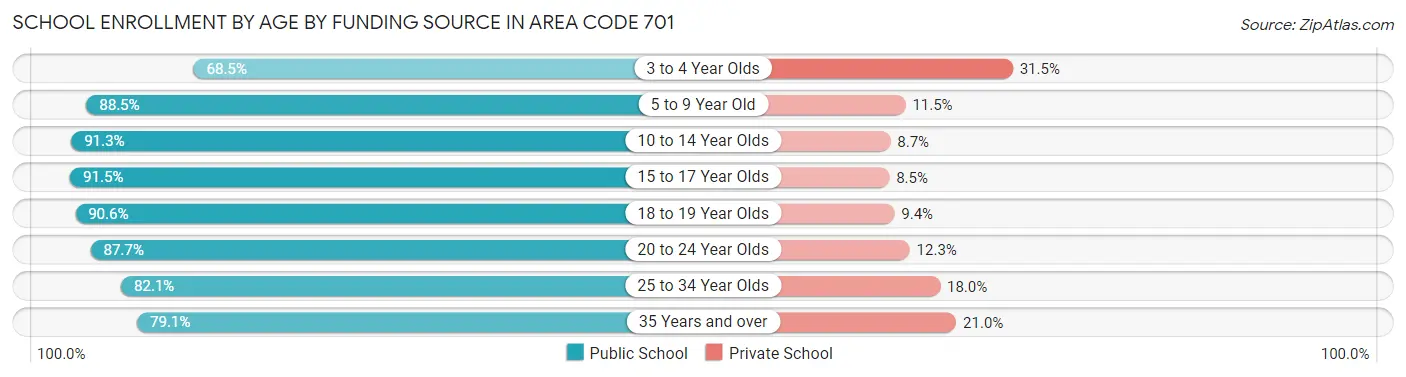
| Age Bracket | Public School | Private School |
| 3 to 4 Year Olds | 4,443 (68.5%) | 2,042 (31.5%) |
| 5 to 9 Year Old | 41,542 (88.5%) | 5,402 (11.5%) |
| 10 to 14 Year Olds | 45,417 (91.3%) | 4,320 (8.7%) |
| 15 to 17 Year Olds | 24,431 (91.5%) | 2,267 (8.5%) |
| 18 to 19 Year Olds | 17,806 (90.6%) | 1,856 (9.4%) |
| 20 to 24 Year Olds | 23,935 (87.7%) | 3,355 (12.3%) |
| 25 to 34 Year Olds | 9,047 (82.1%) | 1,979 (17.9%) |
| 35 Years and over | 6,979 (79.0%) | 1,850 (20.9%) |
| Total | 173,602 (88.3%) | 23,069 (11.7%) |
Educational Attainment by Field of Study in Area Code 701
Business (32,573 | 18.8%), education (30,261 | 17.4%), science & technology (26,005 | 15.0%), arts & humanities (15,632 | 9.0%), and bio, nature & agricultural (14,200 | 8.2%) are the most common fields of study among 173,482 individuals in Area Code 701 who have obtained a bachelor's degree or higher.
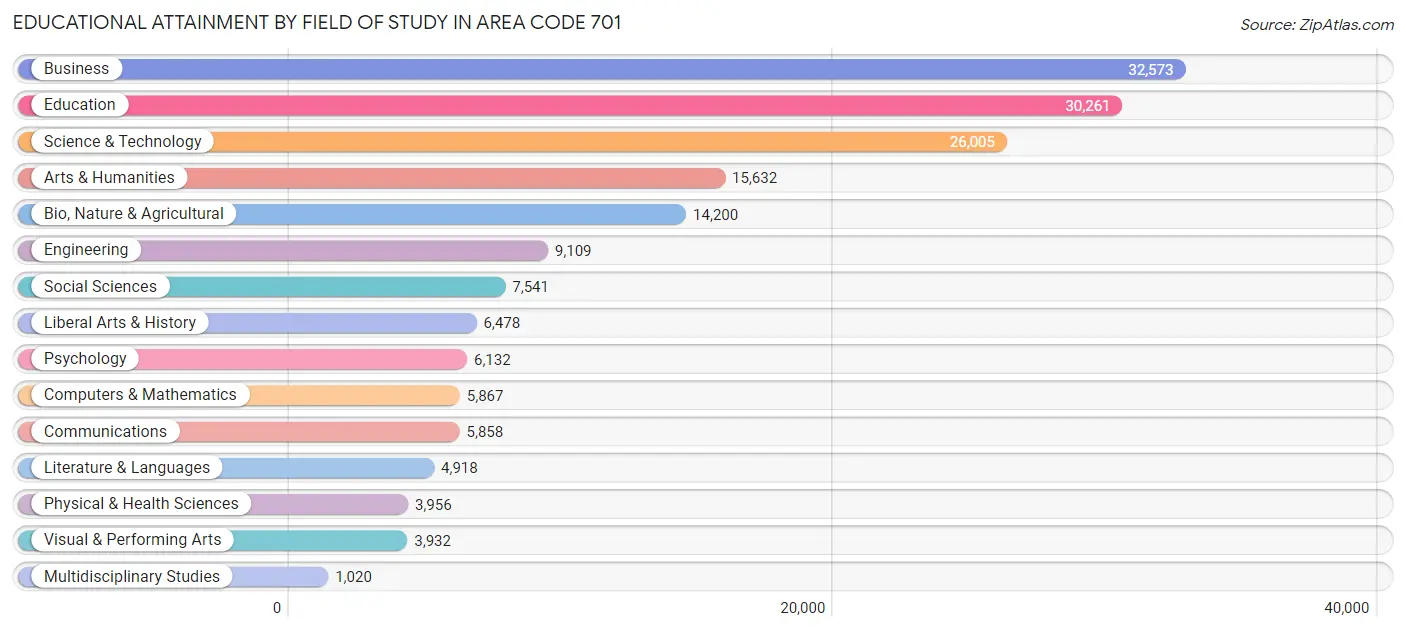
| Field of Study | # Graduates | % Graduates |
| Computers & Mathematics | 5,867 | 3.4% |
| Bio, Nature & Agricultural | 14,200 | 8.2% |
| Physical & Health Sciences | 3,956 | 2.3% |
| Psychology | 6,132 | 3.5% |
| Social Sciences | 7,541 | 4.3% |
| Engineering | 9,109 | 5.2% |
| Multidisciplinary Studies | 1,020 | 0.6% |
| Science & Technology | 26,005 | 15.0% |
| Business | 32,573 | 18.8% |
| Education | 30,261 | 17.4% |
| Literature & Languages | 4,918 | 2.8% |
| Liberal Arts & History | 6,478 | 3.7% |
| Visual & Performing Arts | 3,932 | 2.3% |
| Communications | 5,858 | 3.4% |
| Arts & Humanities | 15,632 | 9.0% |
| Total | 173,482 | 100.0% |
Transportation & Commute in Area Code 701
Vehicle Availability by Sex in Area Code 701
The most prevalent vehicle ownership categories in Area Code 701 are males with 2 vehicles (88,159, accounting for 40.7%) and females with 2 vehicles (73,201, making up 49.2%).
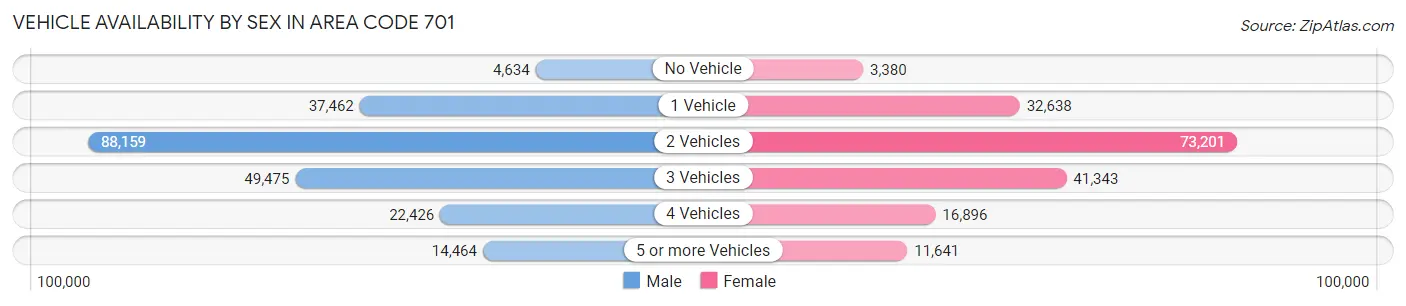
| Vehicles Available | Male | Female |
| No Vehicle | 4,634 (2.1%) | 3,380 (1.9%) |
| 1 Vehicle | 37,462 (17.3%) | 32,638 (18.2%) |
| 2 Vehicles | 88,159 (40.7%) | 73,201 (40.9%) |
| 3 Vehicles | 49,475 (22.8%) | 41,343 (23.1%) |
| 4 Vehicles | 22,426 (10.3%) | 16,896 (9.4%) |
| 5 or more Vehicles | 14,464 (6.7%) | 11,641 (6.5%) |
| Total | 216,620 (100.0%) | 179,099 (100.0%) |
Commute Time in Area Code 701
The most frequently occuring commute durations in Area Code 701 are 10 to 14 minutes (88,652 commuters, 23.4%), 5 to 9 minutes (75,496 commuters, 20.0%), and 15 to 19 minutes (72,830 commuters, 19.3%).
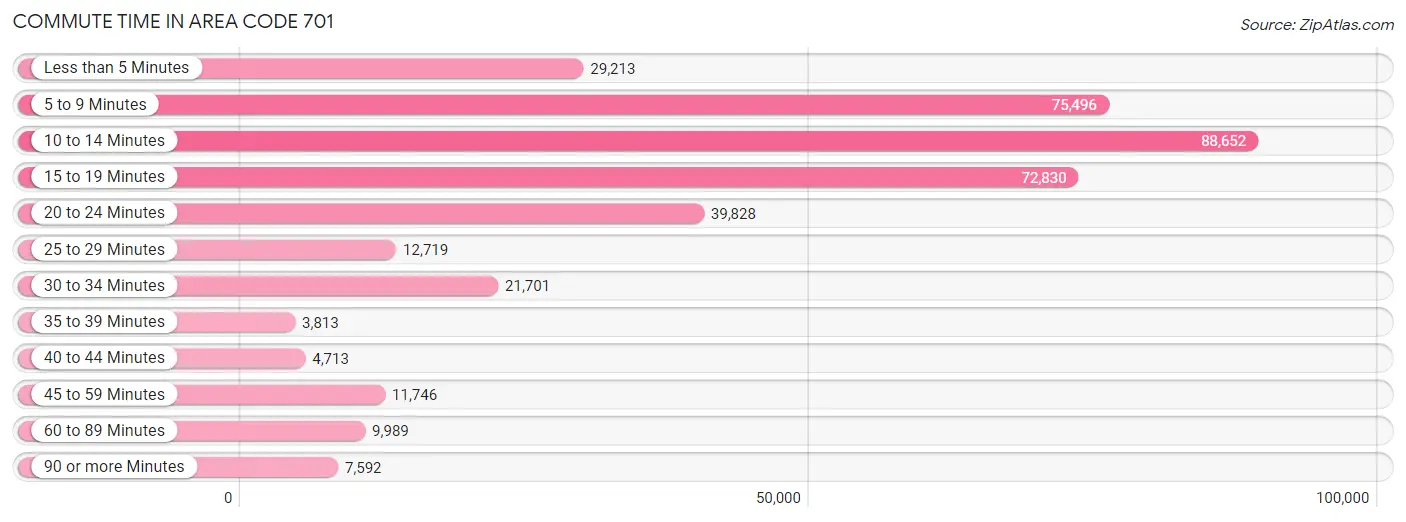
| Commute Time | # Commuters | % Commuters |
| Less than 5 Minutes | 29,213 | 7.7% |
| 5 to 9 Minutes | 75,496 | 20.0% |
| 10 to 14 Minutes | 88,652 | 23.4% |
| 15 to 19 Minutes | 72,830 | 19.3% |
| 20 to 24 Minutes | 39,828 | 10.5% |
| 25 to 29 Minutes | 12,719 | 3.4% |
| 30 to 34 Minutes | 21,701 | 5.7% |
| 35 to 39 Minutes | 3,813 | 1.0% |
| 40 to 44 Minutes | 4,713 | 1.3% |
| 45 to 59 Minutes | 11,746 | 3.1% |
| 60 to 89 Minutes | 9,989 | 2.6% |
| 90 or more Minutes | 7,592 | 2.0% |
Commute Time by Sex in Area Code 701
The most common commute times in Area Code 701 are 10 to 14 minutes (47,749 commuters, 22.9%) for males and 10 to 14 minutes (40,903 commuters, 24.1%) for females.
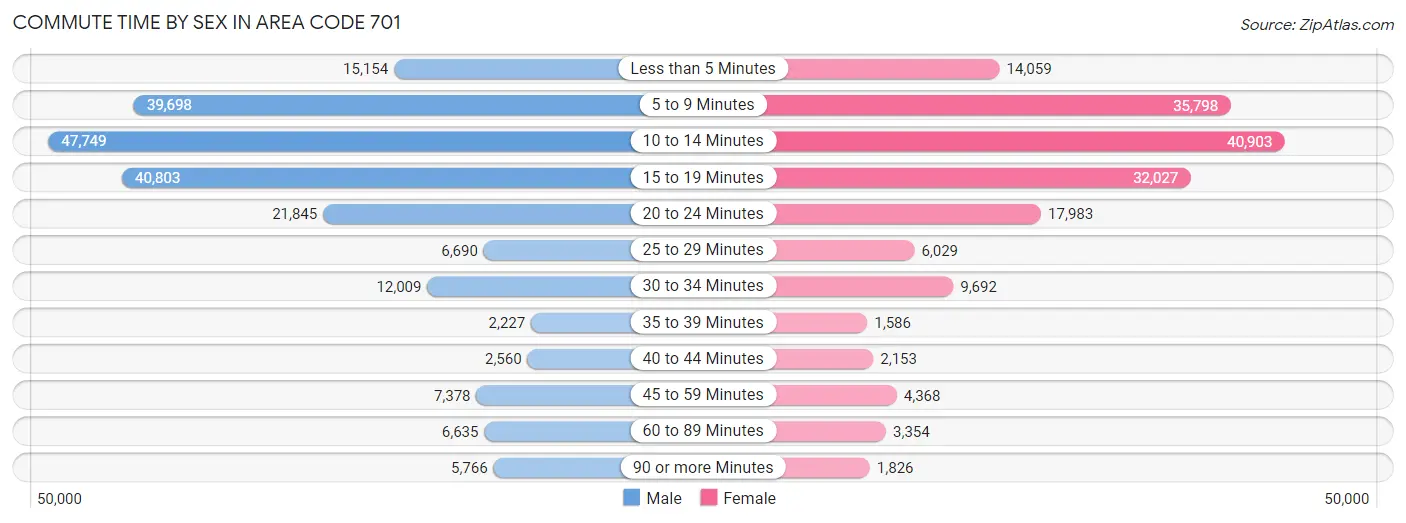
| Commute Time | Male | Female |
| Less than 5 Minutes | 15,154 (7.3%) | 14,059 (8.3%) |
| 5 to 9 Minutes | 39,698 (19.0%) | 35,798 (21.1%) |
| 10 to 14 Minutes | 47,749 (22.9%) | 40,903 (24.1%) |
| 15 to 19 Minutes | 40,803 (19.6%) | 32,027 (18.9%) |
| 20 to 24 Minutes | 21,845 (10.5%) | 17,983 (10.6%) |
| 25 to 29 Minutes | 6,690 (3.2%) | 6,029 (3.5%) |
| 30 to 34 Minutes | 12,009 (5.8%) | 9,692 (5.7%) |
| 35 to 39 Minutes | 2,227 (1.1%) | 1,586 (0.9%) |
| 40 to 44 Minutes | 2,560 (1.2%) | 2,153 (1.3%) |
| 45 to 59 Minutes | 7,378 (3.5%) | 4,368 (2.6%) |
| 60 to 89 Minutes | 6,635 (3.2%) | 3,354 (2.0%) |
| 90 or more Minutes | 5,766 (2.8%) | 1,826 (1.1%) |
Time of Departure to Work by Sex in Area Code 701
The most frequent times of departure to work in Area Code 701 are 7:30 AM to 7:59 AM (37,473, 18.0%) for males and 7:30 AM to 7:59 AM (40,351, 23.8%) for females.
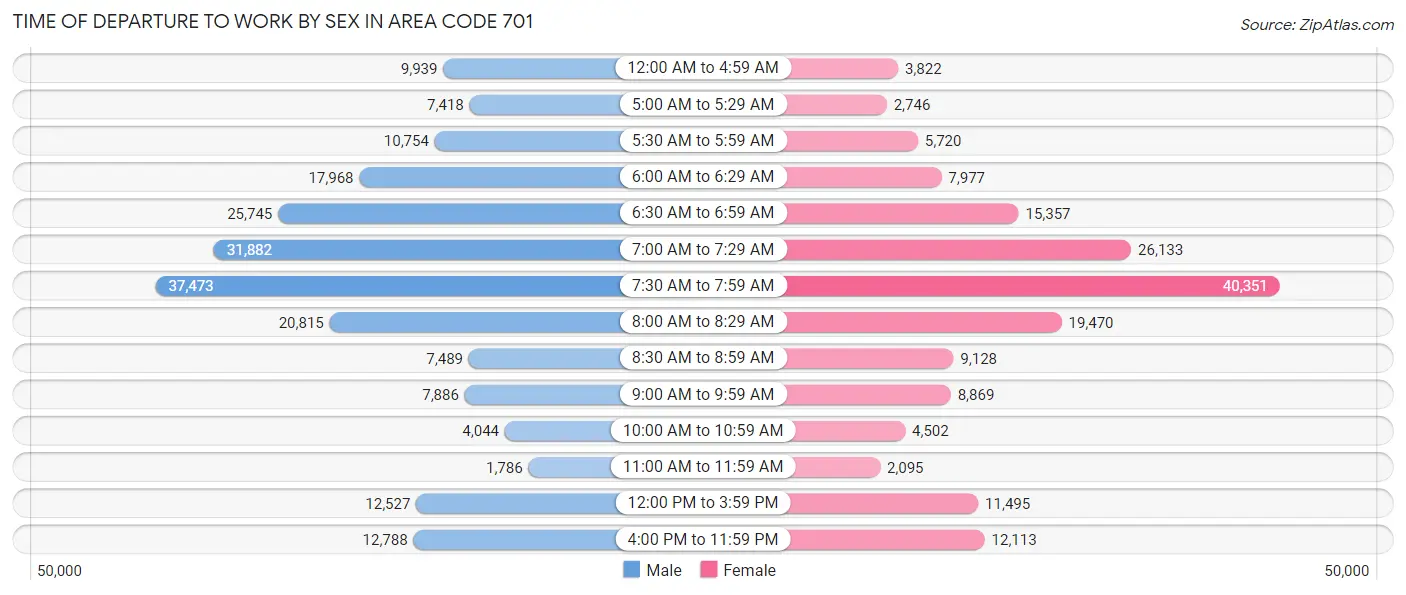
| Time of Departure | Male | Female |
| 12:00 AM to 4:59 AM | 9,939 (4.8%) | 3,822 (2.2%) |
| 5:00 AM to 5:29 AM | 7,418 (3.6%) | 2,746 (1.6%) |
| 5:30 AM to 5:59 AM | 10,754 (5.2%) | 5,720 (3.4%) |
| 6:00 AM to 6:29 AM | 17,968 (8.6%) | 7,977 (4.7%) |
| 6:30 AM to 6:59 AM | 25,745 (12.3%) | 15,357 (9.0%) |
| 7:00 AM to 7:29 AM | 31,882 (15.3%) | 26,133 (15.4%) |
| 7:30 AM to 7:59 AM | 37,473 (18.0%) | 40,351 (23.8%) |
| 8:00 AM to 8:29 AM | 20,815 (10.0%) | 19,470 (11.5%) |
| 8:30 AM to 8:59 AM | 7,489 (3.6%) | 9,128 (5.4%) |
| 9:00 AM to 9:59 AM | 7,886 (3.8%) | 8,869 (5.2%) |
| 10:00 AM to 10:59 AM | 4,044 (1.9%) | 4,502 (2.6%) |
| 11:00 AM to 11:59 AM | 1,786 (0.9%) | 2,095 (1.2%) |
| 12:00 PM to 3:59 PM | 12,527 (6.0%) | 11,495 (6.8%) |
| 4:00 PM to 11:59 PM | 12,788 (6.1%) | 12,113 (7.1%) |
| Total | 208,514 (100.0%) | 169,778 (100.0%) |
Housing Occupancy in Area Code 701
Occupancy by Ownership in Area Code 701
Of the total 319,543 dwellings in Area Code 701, owner-occupied units account for 201,769 (63.1%), while renter-occupied units make up 117,774 (36.9%).
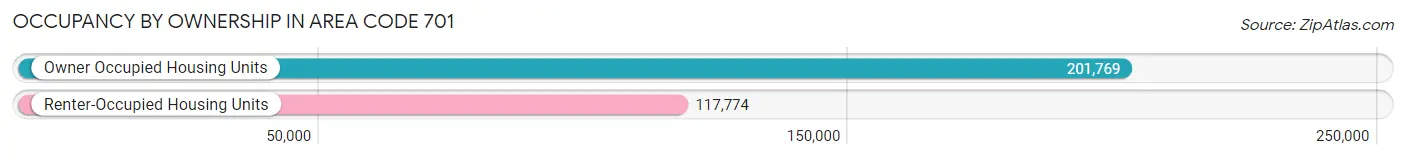
| Occupancy | # Housing Units | % Housing Units |
| Owner Occupied Housing Units | 201,769 | 63.1% |
| Renter-Occupied Housing Units | 117,774 | 36.9% |
| Total Occupied Housing Units | 319,543 | 100.0% |
Occupancy by Household Size in Area Code 701
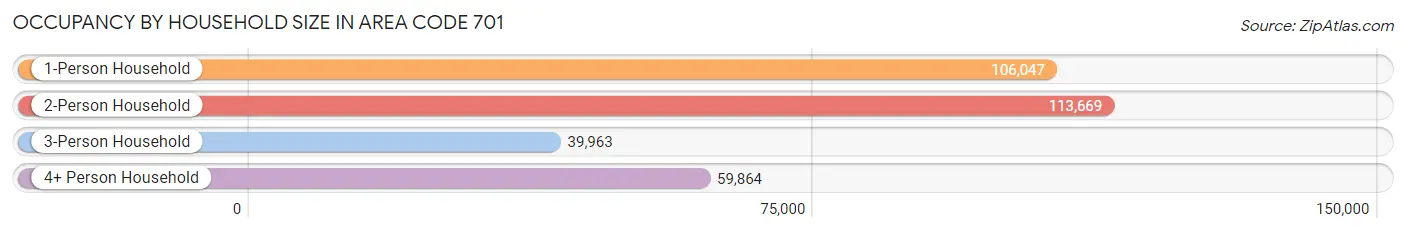
| Household Size | # Housing Units | % Housing Units |
| 1-Person Household | 106,047 | 33.2% |
| 2-Person Household | 113,669 | 35.6% |
| 3-Person Household | 39,963 | 12.5% |
| 4+ Person Household | 59,864 | 18.7% |
| Total Housing Units | 319,543 | 100.0% |
Occupancy by Ownership by Household Size in Area Code 701
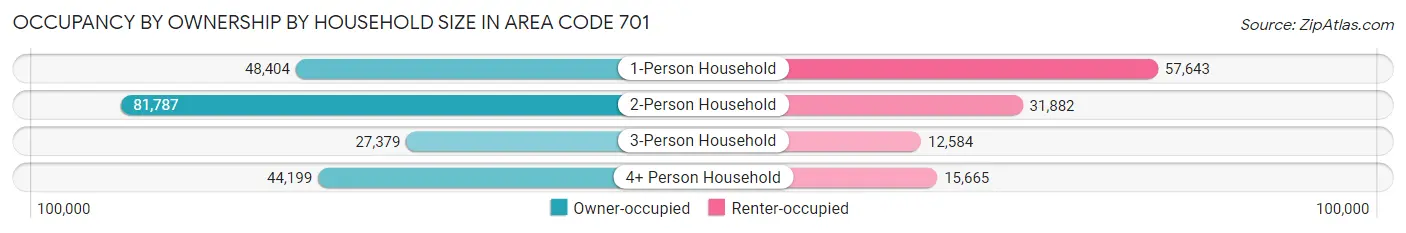
| Household Size | Owner-occupied | Renter-occupied |
| 1-Person Household | 48,404 (45.6%) | 57,643 (54.4%) |
| 2-Person Household | 81,787 (72.0%) | 31,882 (28.1%) |
| 3-Person Household | 27,379 (68.5%) | 12,584 (31.5%) |
| 4+ Person Household | 44,199 (73.8%) | 15,665 (26.2%) |
| Total Housing Units | 201,769 (63.1%) | 117,774 (36.9%) |
Occupancy by Educational Attainment in Area Code 701
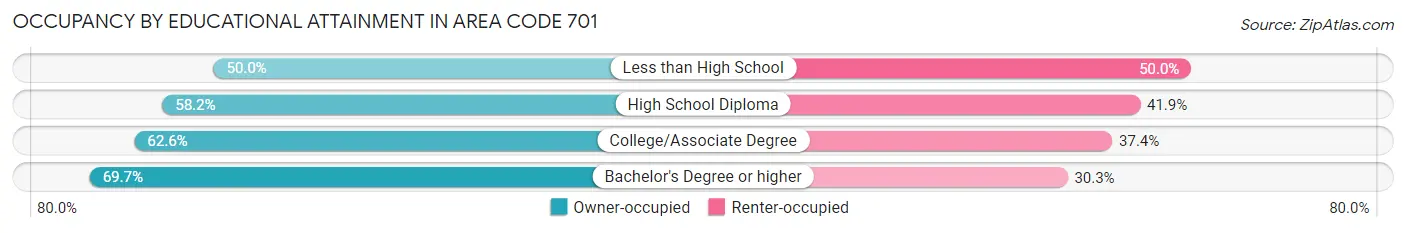
| Household Size | Owner-occupied | Renter-occupied |
| Less than High School | 8,713 (50.0%) | 8,700 (50.0%) |
| High School Diploma | 44,964 (58.2%) | 32,360 (41.8%) |
| College/Associate Degree | 75,153 (62.6%) | 44,945 (37.4%) |
| Bachelor's Degree or higher | 72,939 (69.7%) | 31,769 (30.3%) |
Occupancy by Age of Householder in Area Code 701
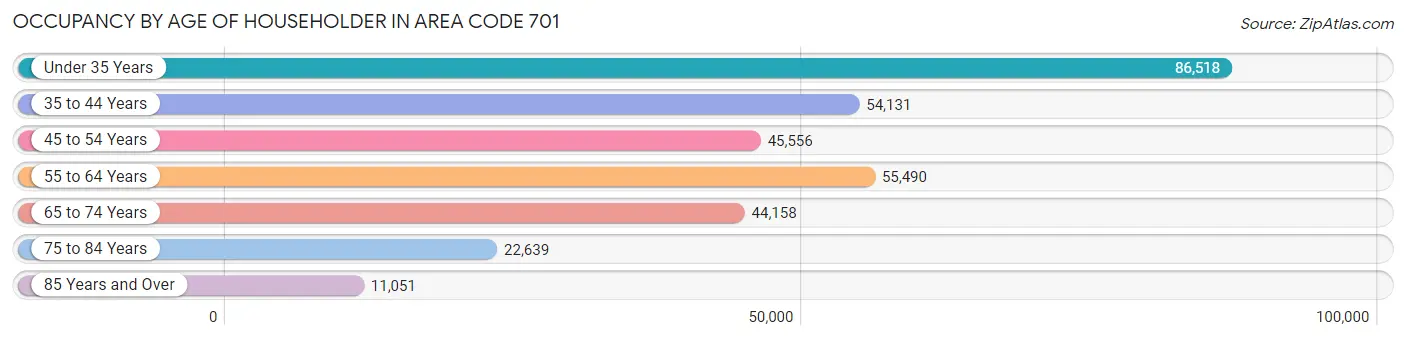
| Age Bracket | # Households | % Households |
| Under 35 Years | 86,518 | 27.1% |
| 35 to 44 Years | 54,131 | 16.9% |
| 45 to 54 Years | 45,556 | 14.3% |
| 55 to 64 Years | 55,490 | 17.4% |
| 65 to 74 Years | 44,158 | 13.8% |
| 75 to 84 Years | 22,639 | 7.1% |
| 85 Years and Over | 11,051 | 3.5% |
| Total | 319,543 | 100.0% |
Housing Finances in Area Code 701
Median Income by Occupancy in Area Code 701
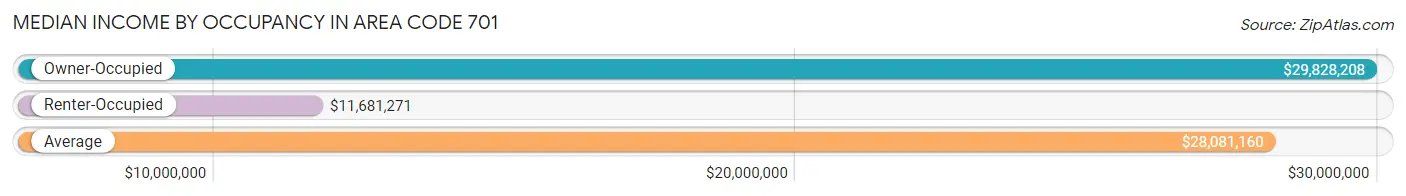
| Occupancy Type | # Households | Median Income |
| Owner-Occupied | 201,769 (63.1%) | $29,828,208 |
| Renter-Occupied | 117,774 (36.9%) | $11,681,271 |
| Average | 319,543 (100.0%) | $28,081,160 |
Occupancy by Householder Income Bracket in Area Code 701
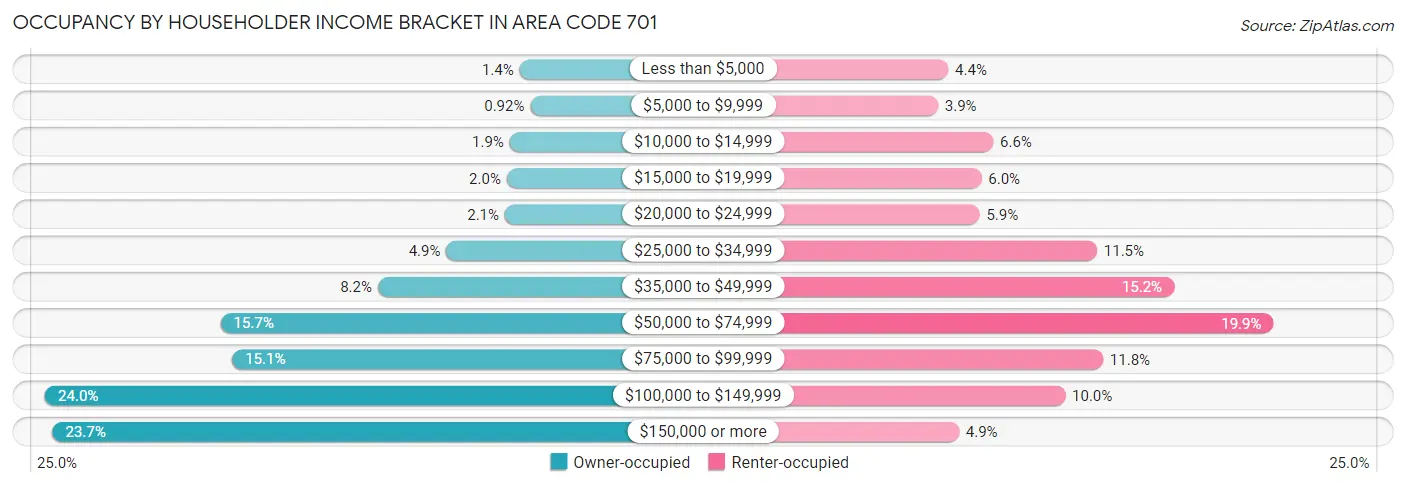
| Income Bracket | Owner-occupied | Renter-occupied |
| Less than $5,000 | 2,893 (1.4%) | 5,198 (4.4%) |
| $5,000 to $9,999 | 1,850 (0.9%) | 4,622 (3.9%) |
| $10,000 to $14,999 | 3,843 (1.9%) | 7,717 (6.6%) |
| $15,000 to $19,999 | 4,123 (2.0%) | 7,053 (6.0%) |
| $20,000 to $24,999 | 4,295 (2.1%) | 6,953 (5.9%) |
| $25,000 to $34,999 | 9,927 (4.9%) | 13,528 (11.5%) |
| $35,000 to $49,999 | 16,509 (8.2%) | 17,854 (15.2%) |
| $50,000 to $74,999 | 31,609 (15.7%) | 23,431 (19.9%) |
| $75,000 to $99,999 | 30,484 (15.1%) | 13,869 (11.8%) |
| $100,000 to $149,999 | 48,471 (24.0%) | 11,749 (10.0%) |
| $150,000 or more | 47,765 (23.7%) | 5,800 (4.9%) |
| Total | 201,769 (100.0%) | 117,774 (100.0%) |
Monthly Housing Cost Tiers in Area Code 701
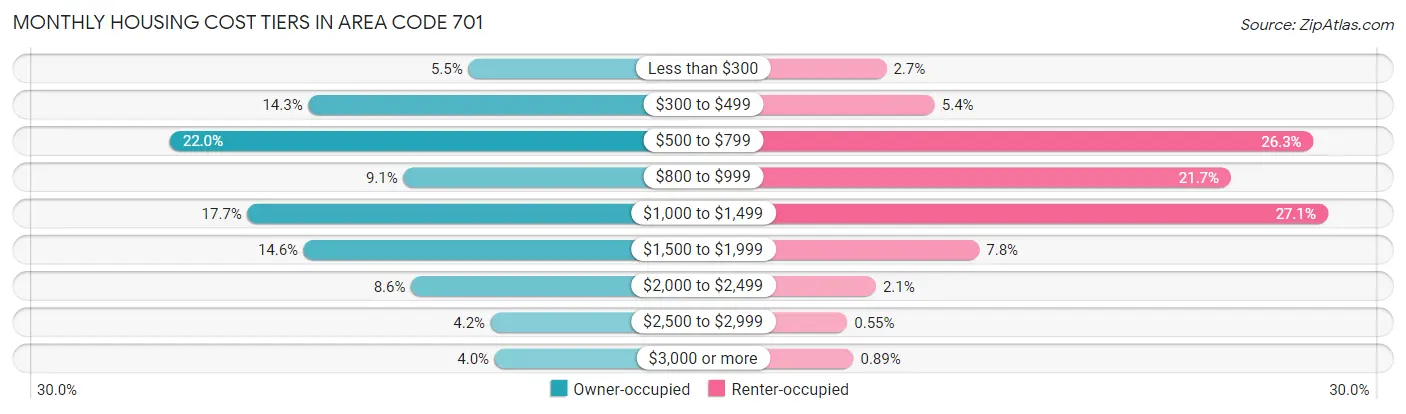
| Monthly Cost | Owner-occupied | Renter-occupied |
| Less than $300 | 11,066 (5.5%) | 3,190 (2.7%) |
| $300 to $499 | 28,885 (14.3%) | 6,340 (5.4%) |
| $500 to $799 | 44,357 (22.0%) | 30,968 (26.3%) |
| $800 to $999 | 18,302 (9.1%) | 25,598 (21.7%) |
| $1,000 to $1,499 | 35,665 (17.7%) | 31,893 (27.1%) |
| $1,500 to $1,999 | 29,388 (14.6%) | 9,238 (7.8%) |
| $2,000 to $2,499 | 17,425 (8.6%) | 2,508 (2.1%) |
| $2,500 to $2,999 | 8,565 (4.2%) | 648 (0.5%) |
| $3,000 or more | 8,116 (4.0%) | 1,046 (0.9%) |
| Total | 201,769 (100.0%) | 117,774 (100.0%) |
Physical Housing Characteristics in Area Code 701
Housing Structures in Area Code 701
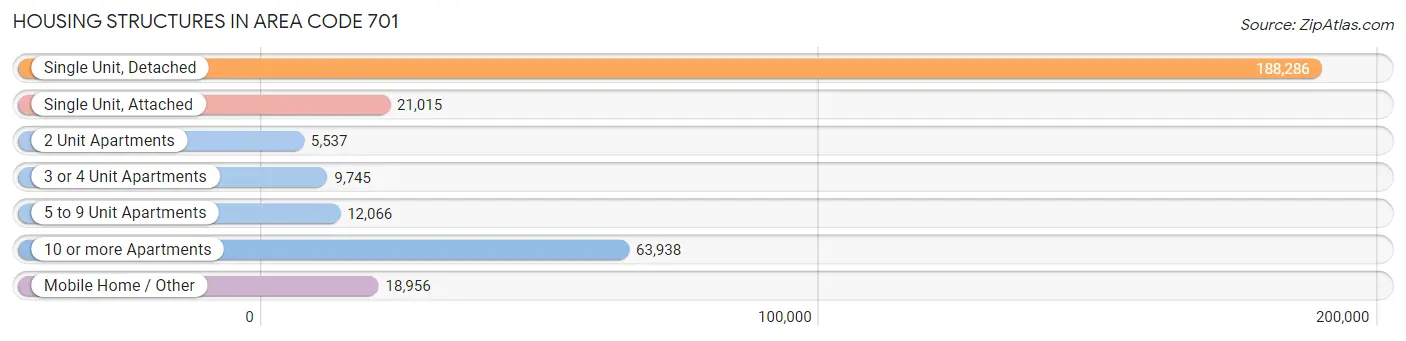
| Structure Type | # Housing Units | % Housing Units |
| Single Unit, Detached | 188,286 | 58.9% |
| Single Unit, Attached | 21,015 | 6.6% |
| 2 Unit Apartments | 5,537 | 1.7% |
| 3 or 4 Unit Apartments | 9,745 | 3.0% |
| 5 to 9 Unit Apartments | 12,066 | 3.8% |
| 10 or more Apartments | 63,938 | 20.0% |
| Mobile Home / Other | 18,956 | 5.9% |
| Total | 319,543 | 100.0% |
Housing Structures by Occupancy in Area Code 701
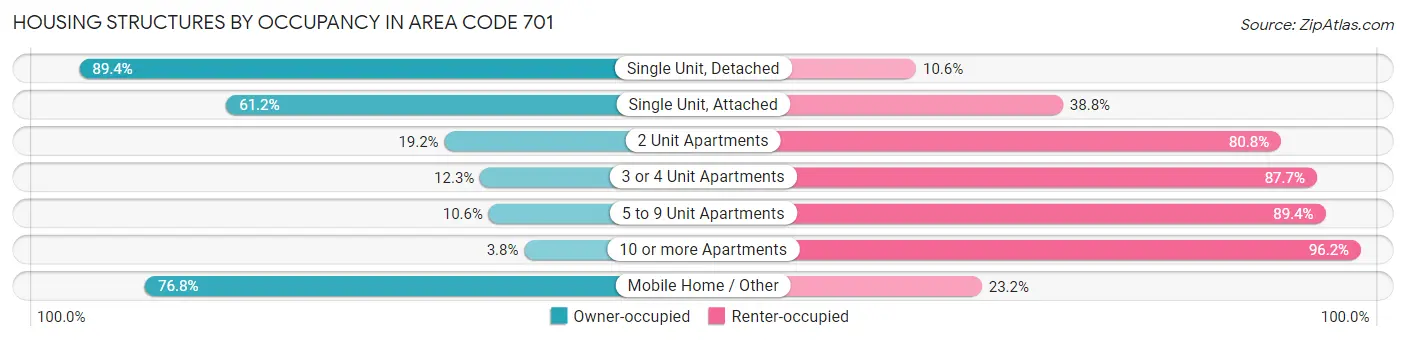
| Structure Type | Owner-occupied | Renter-occupied |
| Single Unit, Detached | 168,407 (89.4%) | 19,879 (10.6%) |
| Single Unit, Attached | 12,852 (61.2%) | 8,163 (38.8%) |
| 2 Unit Apartments | 1,061 (19.2%) | 4,476 (80.8%) |
| 3 or 4 Unit Apartments | 1,198 (12.3%) | 8,547 (87.7%) |
| 5 to 9 Unit Apartments | 1,281 (10.6%) | 10,785 (89.4%) |
| 10 or more Apartments | 2,415 (3.8%) | 61,523 (96.2%) |
| Mobile Home / Other | 14,555 (76.8%) | 4,401 (23.2%) |
| Total | 201,769 (63.1%) | 117,774 (36.9%) |
Housing Structures by Number of Rooms in Area Code 701
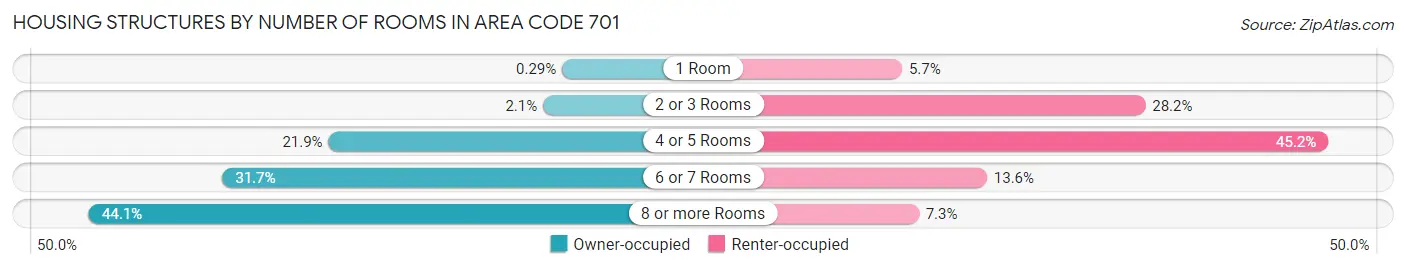
| Number of Rooms | Owner-occupied | Renter-occupied |
| 1 Room | 585 (0.3%) | 6,755 (5.7%) |
| 2 or 3 Rooms | 4,130 (2.1%) | 33,254 (28.2%) |
| 4 or 5 Rooms | 44,194 (21.9%) | 53,178 (45.2%) |
| 6 or 7 Rooms | 63,975 (31.7%) | 16,002 (13.6%) |
| 8 or more Rooms | 88,885 (44.1%) | 8,585 (7.3%) |
| Total | 201,769 (100.0%) | 117,774 (100.0%) |
Housing Structure by Heating Type in Area Code 701
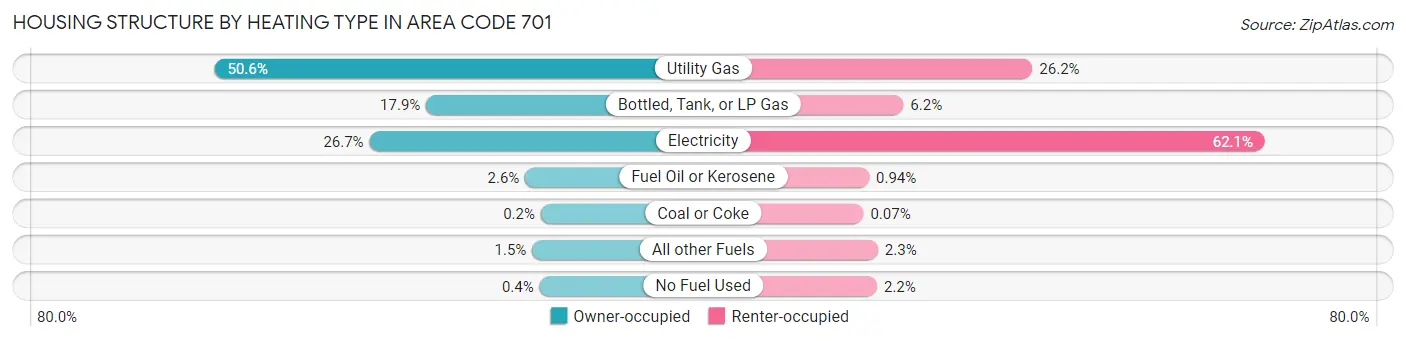
| Heating Type | Owner-occupied | Renter-occupied |
| Utility Gas | 102,172 (50.6%) | 30,836 (26.2%) |
| Bottled, Tank, or LP Gas | 36,148 (17.9%) | 7,352 (6.2%) |
| Electricity | 53,846 (26.7%) | 73,143 (62.1%) |
| Fuel Oil or Kerosene | 5,292 (2.6%) | 1,109 (0.9%) |
| Coal or Coke | 403 (0.2%) | 77 (0.1%) |
| All other Fuels | 3,095 (1.5%) | 2,714 (2.3%) |
| No Fuel Used | 813 (0.4%) | 2,543 (2.2%) |
| Total | 201,769 (100.0%) | 117,774 (100.0%) |
Household Vehicle Usage in Area Code 701
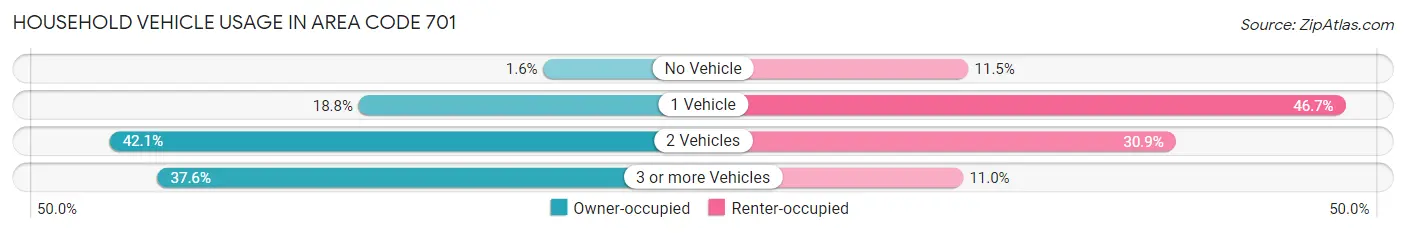
| Vehicles per Household | Owner-occupied | Renter-occupied |
| No Vehicle | 3,170 (1.6%) | 13,480 (11.5%) |
| 1 Vehicle | 37,933 (18.8%) | 55,027 (46.7%) |
| 2 Vehicles | 84,838 (42.0%) | 36,345 (30.9%) |
| 3 or more Vehicles | 75,828 (37.6%) | 12,922 (11.0%) |
| Total | 201,769 (100.0%) | 117,774 (100.0%) |
Real Estate & Mortgages in Area Code 701
Real Estate and Mortgage Overview in Area Code 701
| Characteristic | Without Mortgage | With Mortgage |
| Housing Units | 95,546 | 106,223 |
| Median Property Value | $50,030,700 | $59,970,899 |
| Median Household Income | $25,107,896 | $29,766 |
| Monthly Housing Costs | $184,457 | $7,947 |
| Real Estate Taxes | $394,690 | $2,921 |
Property Value by Mortgage Status in Area Code 701
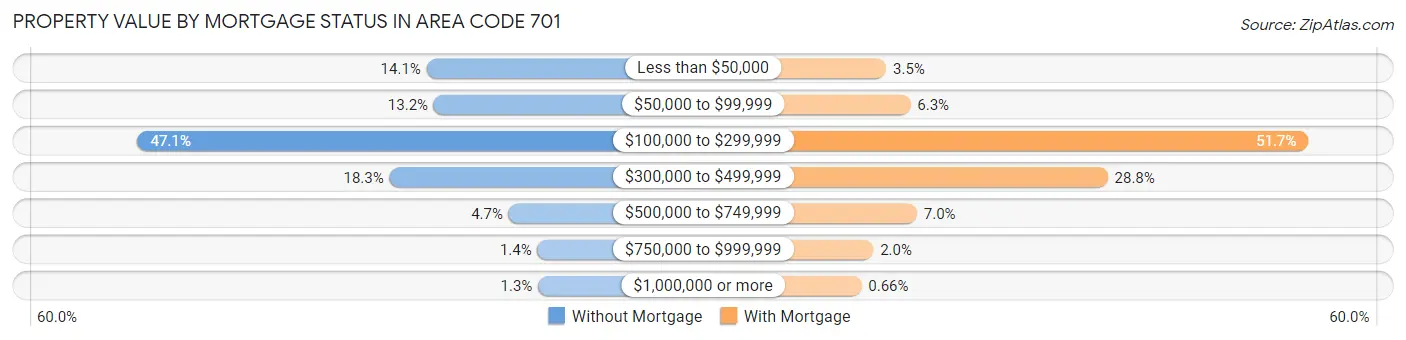
| Property Value | Without Mortgage | With Mortgage |
| Less than $50,000 | 13,428 (14.1%) | 3,711 (3.5%) |
| $50,000 to $99,999 | 12,631 (13.2%) | 6,654 (6.3%) |
| $100,000 to $299,999 | 44,991 (47.1%) | 54,958 (51.7%) |
| $300,000 to $499,999 | 17,475 (18.3%) | 30,601 (28.8%) |
| $500,000 to $749,999 | 4,456 (4.7%) | 7,451 (7.0%) |
| $750,000 to $999,999 | 1,318 (1.4%) | 2,151 (2.0%) |
| $1,000,000 or more | 1,247 (1.3%) | 697 (0.7%) |
| Total | 95,546 (100.0%) | 106,223 (100.0%) |
Household Income by Mortgage Status in Area Code 701
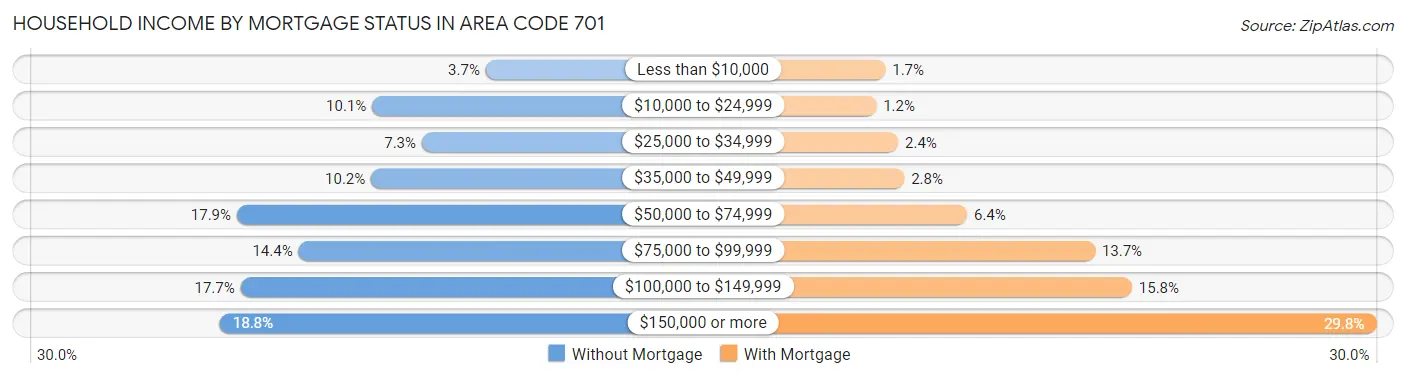
| Household Income | Without Mortgage | With Mortgage |
| Less than $10,000 | 3,485 (3.6%) | 1,802 (1.7%) |
| $10,000 to $24,999 | 9,685 (10.1%) | 1,258 (1.2%) |
| $25,000 to $34,999 | 6,975 (7.3%) | 2,576 (2.4%) |
| $35,000 to $49,999 | 9,746 (10.2%) | 2,952 (2.8%) |
| $50,000 to $74,999 | 17,076 (17.9%) | 6,763 (6.4%) |
| $75,000 to $99,999 | 13,710 (14.3%) | 14,533 (13.7%) |
| $100,000 to $149,999 | 16,870 (17.7%) | 16,774 (15.8%) |
| $150,000 or more | 17,999 (18.8%) | 31,601 (29.7%) |
| Total | 95,546 (100.0%) | 106,223 (100.0%) |
Property Value to Household Income Ratio in Area Code 701
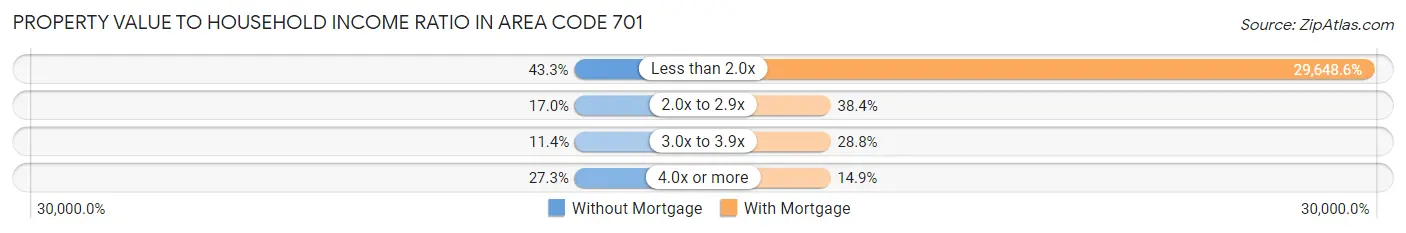
| Value-to-Income Ratio | Without Mortgage | With Mortgage |
| Less than 2.0x | 41,409 (43.3%) | 31,493,647 (29,648.6%) |
| 2.0x to 2.9x | 16,202 (17.0%) | 40,812 (38.4%) |
| 3.0x to 3.9x | 10,902 (11.4%) | 30,598 (28.8%) |
| 4.0x or more | 26,112 (27.3%) | 15,804 (14.9%) |
| Total | 95,546 (100.0%) | 106,223 (100.0%) |
Real Estate Taxes by Mortgage Status in Area Code 701
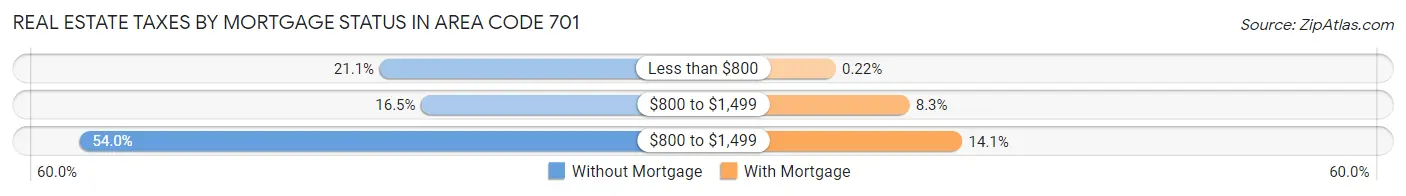
| Property Taxes | Without Mortgage | With Mortgage |
| Less than $800 | 20,124 (21.1%) | 239 (0.2%) |
| $800 to $1,499 | 15,788 (16.5%) | 8,817 (8.3%) |
| $800 to $1,499 | 51,581 (54.0%) | 14,967 (14.1%) |
| Total | 95,546 (100.0%) | 106,223 (100.0%) |
Health & Disability in Area Code 701
Health Insurance Coverage by Age in Area Code 701
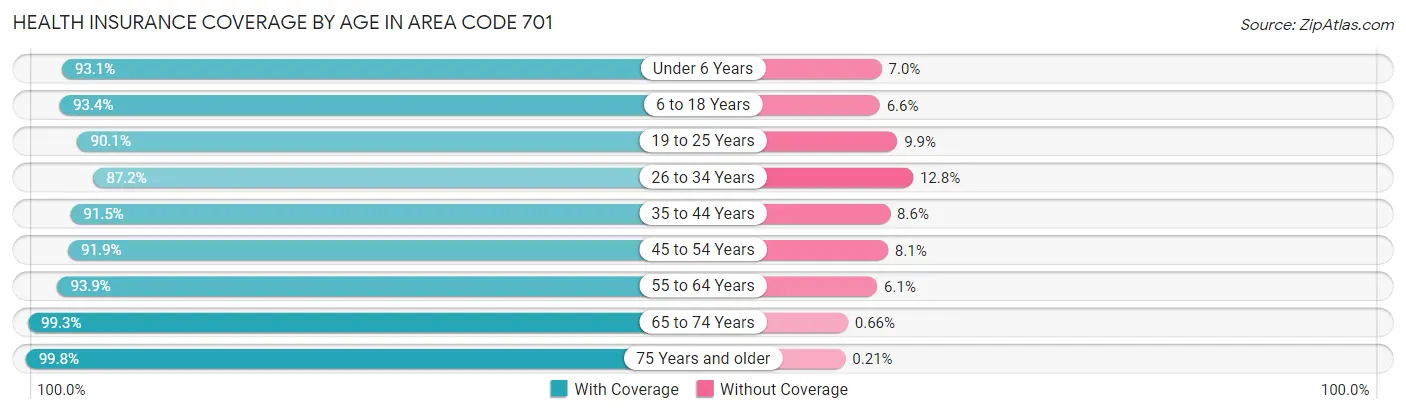
| Age Bracket | With Coverage | Without Coverage |
| Under 6 Years | 57,674 (93.0%) | 4,307 (7.0%) |
| 6 to 18 Years | 123,505 (93.4%) | 8,733 (6.6%) |
| 19 to 25 Years | 76,681 (90.1%) | 8,405 (9.9%) |
| 26 to 34 Years | 84,501 (87.2%) | 12,412 (12.8%) |
| 35 to 44 Years | 87,484 (91.4%) | 8,184 (8.6%) |
| 45 to 54 Years | 71,942 (91.9%) | 6,368 (8.1%) |
| 55 to 64 Years | 86,821 (93.9%) | 5,668 (6.1%) |
| 65 to 74 Years | 68,350 (99.3%) | 452 (0.7%) |
| 75 Years and older | 47,259 (99.8%) | 99 (0.2%) |
| Total | 704,217 (92.8%) | 54,628 (7.2%) |
Health Insurance Coverage by Citizenship Status in Area Code 701
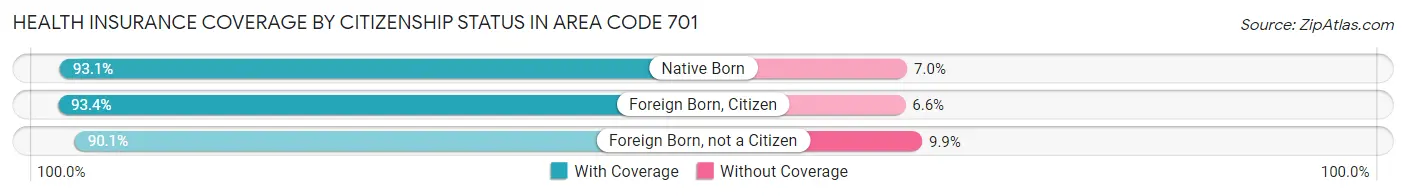
| Citizenship Status | With Coverage | Without Coverage |
| Native Born | 57,674 (93.0%) | 4,307 (7.0%) |
| Foreign Born, Citizen | 123,505 (93.4%) | 8,733 (6.6%) |
| Foreign Born, not a Citizen | 76,681 (90.1%) | 8,405 (9.9%) |
Health Insurance Coverage by Household Income in Area Code 701
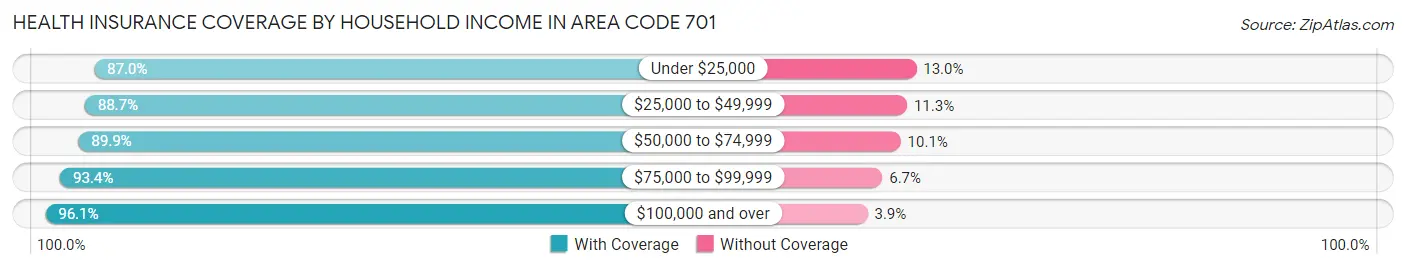
| Household Income | With Coverage | Without Coverage |
| Under $25,000 | 65,172 (87.0%) | 9,759 (13.0%) |
| $25,000 to $49,999 | 90,868 (88.7%) | 11,551 (11.3%) |
| $50,000 to $74,999 | 103,608 (89.9%) | 11,621 (10.1%) |
| $75,000 to $99,999 | 103,212 (93.3%) | 7,355 (6.7%) |
| $100,000 and over | 326,525 (96.1%) | 13,195 (3.9%) |
Public vs Private Health Insurance Coverage by Age in Area Code 701
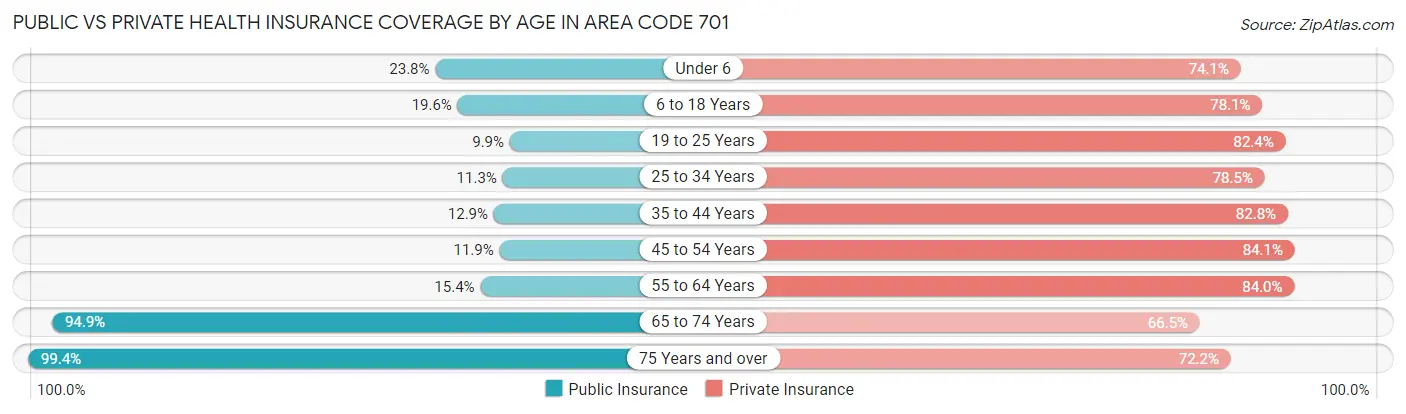
| Age Bracket | Public Insurance | Private Insurance |
| Under 6 | 14,728 (23.8%) | 45,896 (74.1%) |
| 6 to 18 Years | 25,936 (19.6%) | 103,228 (78.1%) |
| 19 to 25 Years | 8,450 (9.9%) | 70,081 (82.4%) |
| 25 to 34 Years | 10,922 (11.3%) | 76,074 (78.5%) |
| 35 to 44 Years | 12,337 (12.9%) | 79,213 (82.8%) |
| 45 to 54 Years | 9,278 (11.8%) | 65,842 (84.1%) |
| 55 to 64 Years | 14,243 (15.4%) | 77,692 (84.0%) |
| 65 to 74 Years | 65,309 (94.9%) | 45,728 (66.5%) |
| 75 Years and over | 47,064 (99.4%) | 34,191 (72.2%) |
| Total | 208,267 (27.5%) | 597,945 (78.8%) |
Disability Status by Sex by Age in Area Code 701
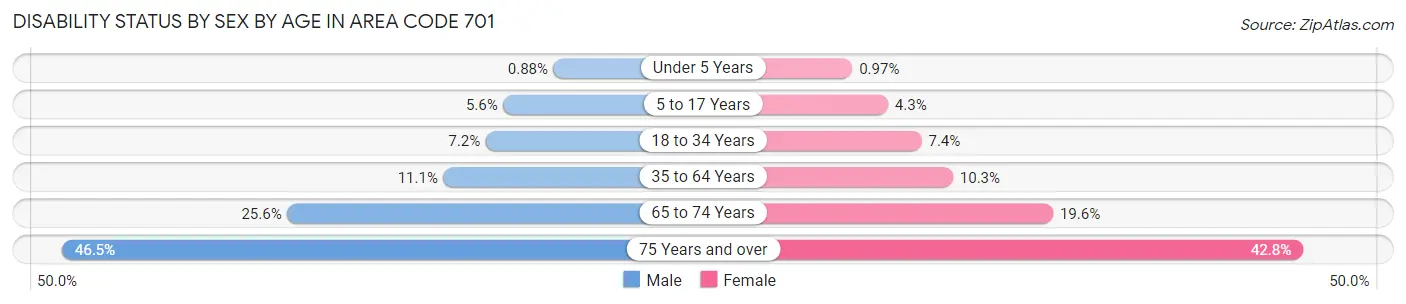
| Age Bracket | Male | Female |
| Under 5 Years | 236 (0.9%) | 242 (1.0%) |
| 5 to 17 Years | 3,737 (5.6%) | 2,718 (4.3%) |
| 18 to 34 Years | 7,291 (7.2%) | 6,834 (7.4%) |
| 35 to 64 Years | 15,340 (11.1%) | 13,215 (10.3%) |
| 65 to 74 Years | 8,841 (25.6%) | 6,718 (19.6%) |
| 75 Years and over | 9,184 (46.5%) | 11,824 (42.8%) |
Disability Class by Sex by Age in Area Code 701
Disability Class: Hearing Difficulty
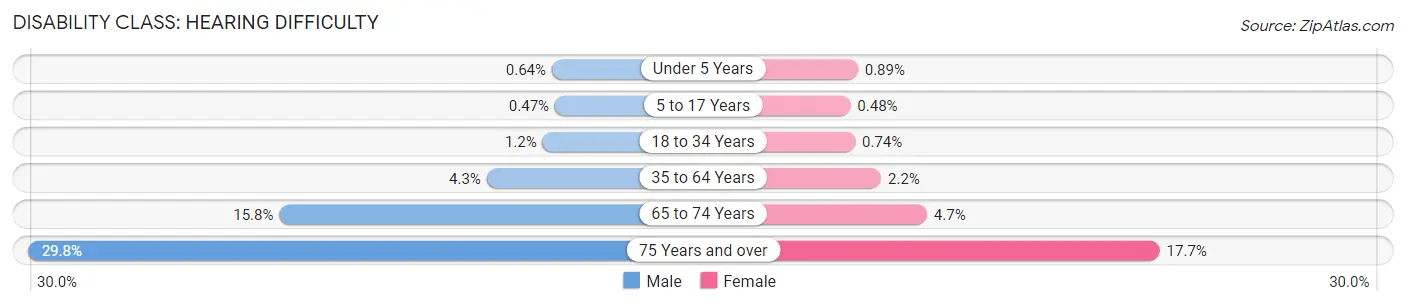
| Age Bracket | Male | Female |
| Under 5 Years | 171 (0.6%) | 221 (0.9%) |
| 5 to 17 Years | 315 (0.5%) | 305 (0.5%) |
| 18 to 34 Years | 1,180 (1.2%) | 681 (0.7%) |
| 35 to 64 Years | 5,909 (4.3%) | 2,804 (2.2%) |
| 65 to 74 Years | 5,464 (15.8%) | 1,626 (4.7%) |
| 75 Years and over | 5,874 (29.8%) | 4,889 (17.7%) |
Disability Class: Vision Difficulty
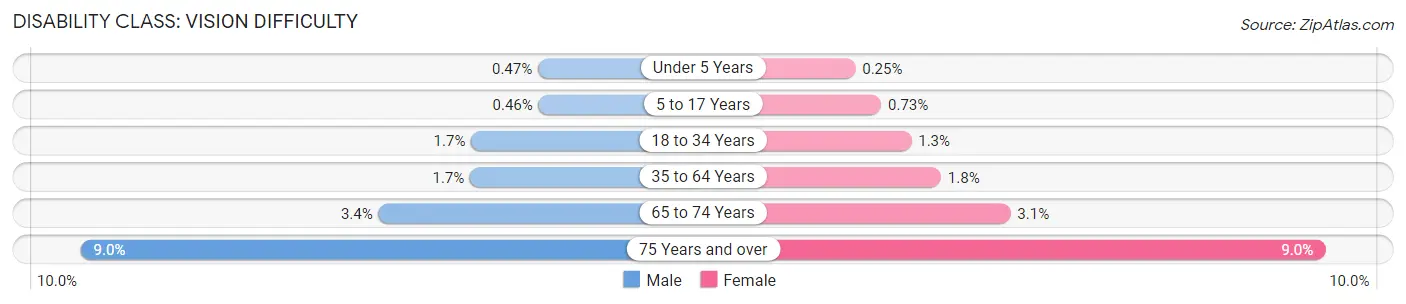
| Age Bracket | Male | Female |
| Under 5 Years | 126 (0.5%) | 62 (0.3%) |
| 5 to 17 Years | 307 (0.5%) | 461 (0.7%) |
| 18 to 34 Years | 1,731 (1.7%) | 1,189 (1.3%) |
| 35 to 64 Years | 2,386 (1.7%) | 2,357 (1.8%) |
| 65 to 74 Years | 1,186 (3.4%) | 1,073 (3.1%) |
| 75 Years and over | 1,768 (9.0%) | 2,478 (9.0%) |
Disability Class: Cognitive Difficulty
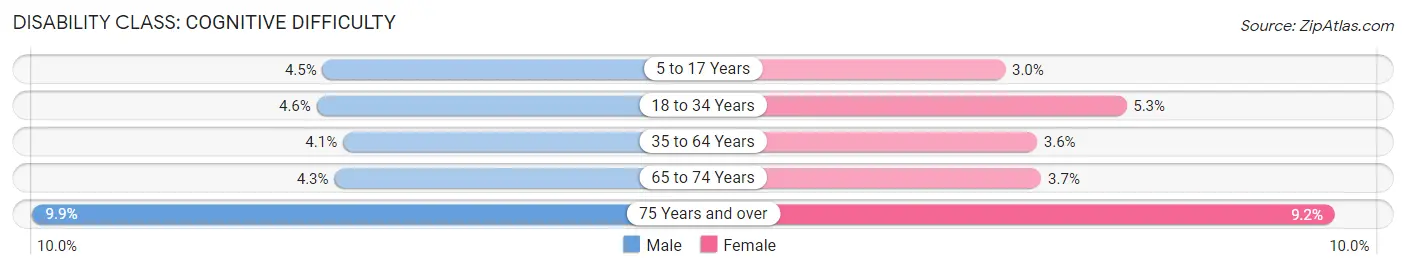
| Age Bracket | Male | Female |
| 5 to 17 Years | 3,011 (4.5%) | 1,920 (3.0%) |
| 18 to 34 Years | 4,651 (4.6%) | 4,875 (5.3%) |
| 35 to 64 Years | 5,654 (4.1%) | 4,636 (3.6%) |
| 65 to 74 Years | 1,468 (4.3%) | 1,267 (3.7%) |
| 75 Years and over | 1,943 (9.9%) | 2,529 (9.1%) |
Disability Class: Ambulatory Difficulty
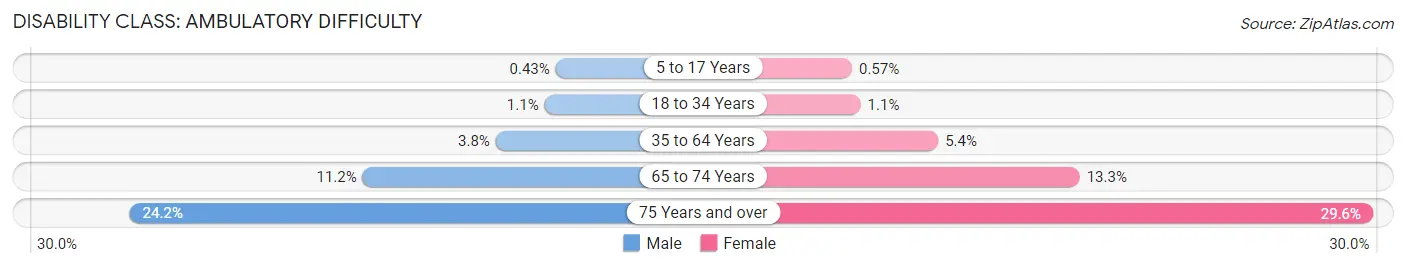
| Age Bracket | Male | Female |
| 5 to 17 Years | 289 (0.4%) | 364 (0.6%) |
| 18 to 34 Years | 1,067 (1.1%) | 969 (1.1%) |
| 35 to 64 Years | 5,213 (3.8%) | 6,884 (5.4%) |
| 65 to 74 Years | 3,862 (11.2%) | 4,539 (13.3%) |
| 75 Years and over | 4,765 (24.1%) | 8,168 (29.6%) |
Disability Class: Self-Care Difficulty
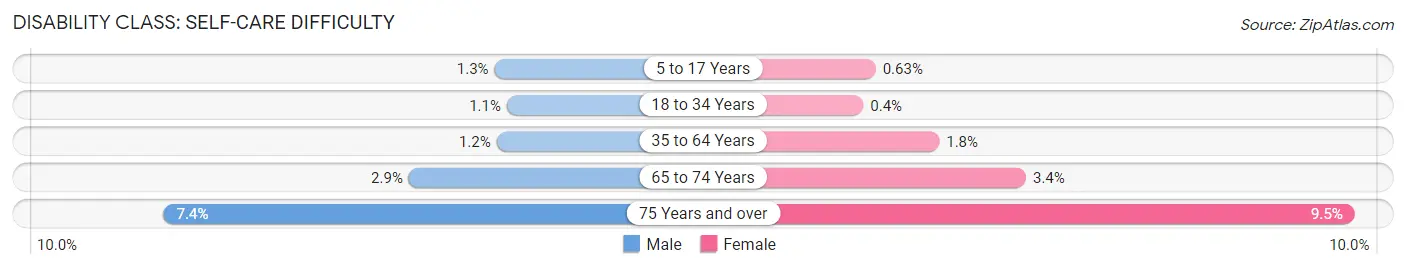
| Age Bracket | Male | Female |
| 5 to 17 Years | 860 (1.3%) | 400 (0.6%) |
| 18 to 34 Years | 1,065 (1.1%) | 373 (0.4%) |
| 35 to 64 Years | 1,709 (1.2%) | 2,323 (1.8%) |
| 65 to 74 Years | 992 (2.9%) | 1,172 (3.4%) |
| 75 Years and over | 1,465 (7.4%) | 2,631 (9.5%) |
Technology Access in Area Code 701
Computing Device Access in Area Code 701
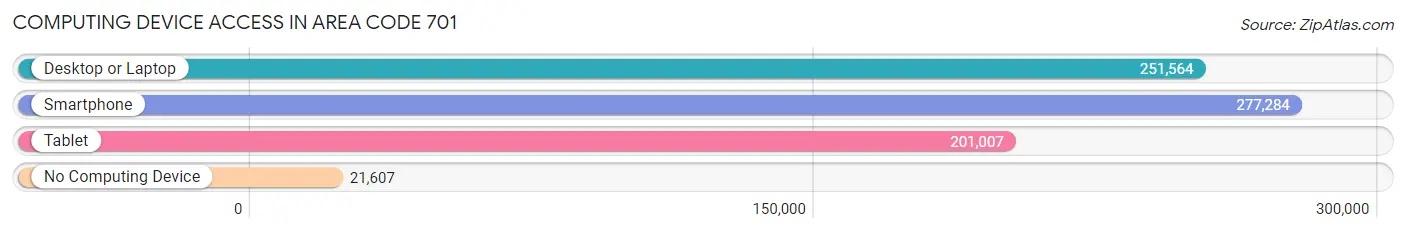
| Device Type | # Households | % Households |
| Desktop or Laptop | 251,564 | 78.7% |
| Smartphone | 277,284 | 86.8% |
| Tablet | 201,007 | 62.9% |
| No Computing Device | 21,607 | 6.8% |
| Total | 319,543 | 100.0% |
Internet Access in Area Code 701
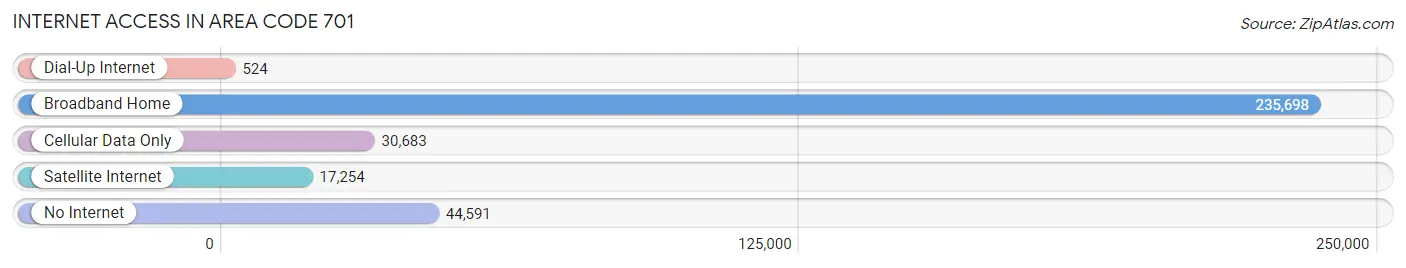
| Internet Type | # Households | % Households |
| Dial-Up Internet | 524 | 0.2% |
| Broadband Home | 235,698 | 73.8% |
| Cellular Data Only | 30,683 | 9.6% |
| Satellite Internet | 17,254 | 5.4% |
| No Internet | 44,591 | 14.0% |
| Total | 319,543 | 100.0% |
Area Code 701 Summary
Geography
Area code 701 is located in the state of North Dakota. It covers the entire state, including the cities of Bismarck, Fargo, Grand Forks, and Minot.
Social
Area code 701 is home to a diverse population of people from all walks of life. The area is known for its friendly and welcoming atmosphere, and its residents are proud of their heritage and culture.
Economics
Area code 701 is an important economic hub for the state of North Dakota. It is home to a number of major industries, including agriculture, energy, and manufacturing. The area is also home to a number of universities and colleges, making it a great place for students to pursue their education.
Demographics
Area code 701 is home to a population of over 700,000 people. The majority of the population is white, with a small percentage of African Americans, Native Americans, and other ethnicities. The median household income is around $50,000, and the unemployment rate is below the national average.
Common Questions
What is Per Capita Income in Area Code 701?
Per Capita income in Area Code 701 is $41,535.
What is the Median Family Income in Area Code 701?
Median Family Income in Area Code 701 is $98,050.
What is the Median Household income in Area Code 701?
Median Household Income in Area Code 701 is $79,550.
What is Income or Wage Gap in Area Code 701?
Income or Wage Gap in Area Code 701 is 35.3%.
Women in Area Code 701 earn 64.7 cents for every dollar earned by a man.
What is Family Income Deficit in Area Code 701?
Family Income Deficit in Area Code 701 is $11,578.
Families that are below poverty line in Area Code 701 earn $11,578 less on average than the poverty threshold level.
What is Inequality or Gini Index in Area Code 701?
Inequality or Gini Index in Area Code 701 is 152.36.
What is the Total Population of Area Code 701?
Total Population of Area Code 701 is 776,110.
What is the Total Male Population of Area Code 701?
Total Male Population of Area Code 701 is 398,964.
What is the Total Female Population of Area Code 701?
Total Female Population of Area Code 701 is 377,146.
What is the Ratio of Males per 100 Females in Area Code 701?
There are 105.79 Males per 100 Females in Area Code 701.
What is the Ratio of Females per 100 Males in Area Code 701?
There are 94.53 Females per 100 Males in Area Code 701.
What is the Median Population Age in Area Code 701?
Median Population Age in Area Code 701 is 44.4 Years.
What is the Average Family Size in Area Code 701
Average Family Size in Area Code 701 is 3.0 People.
What is the Average Household Size in Area Code 701
Average Household Size in Area Code 701 is 2.4 People.
How Large is the Labor Force in Area Code 701?
There are 382,962 People in the Labor Forcein in Area Code 701.
What is the Percentage of People in the Labor Force in Area Code 701?
62.5% of People are in the Labor Force in Area Code 701.
What is the Unemployment Rate in Area Code 701?
Unemployment Rate in Area Code 701 is 4.0%.