Area Code 725 Map & Demographics
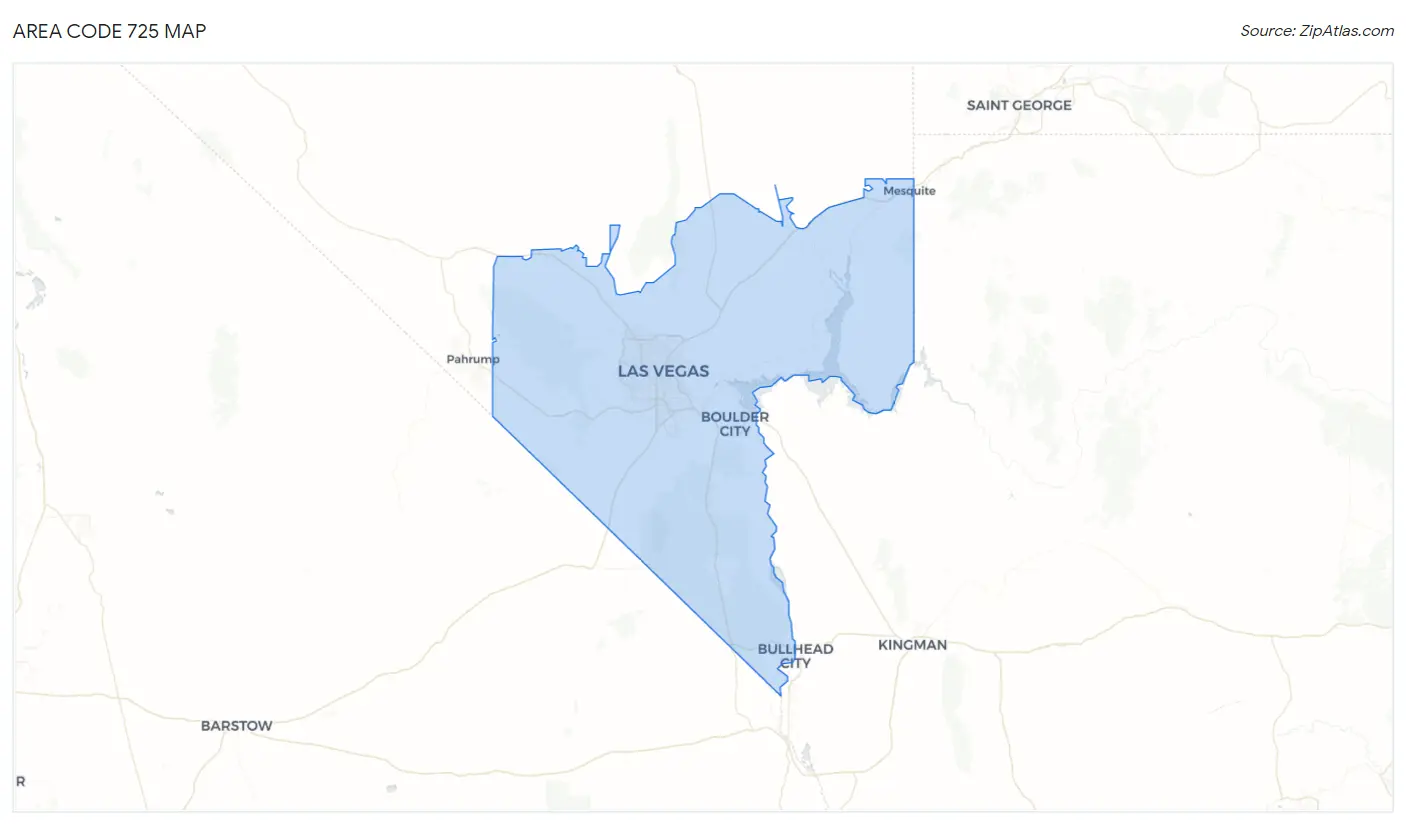
Area Code 725 Map
Area Code 725 Overview
$33,149
PER CAPITA INCOME
$73,109
AVG FAMILY INCOME
$57,652
AVG HOUSEHOLD INCOME
12.6%
WAGE / INCOME GAP [ % ]
87.4¢/ $1
WAGE / INCOME GAP [ $ ]
$11,504
FAMILY INCOME DEFICIT
4.95
INEQUALITY / GINI INDEX
248,803
TOTAL POPULATION
129,326
MALE POPULATION
119,477
FEMALE POPULATION
108.24
MALES / 100 FEMALES
92.38
FEMALES / 100 MALES
43.1
MEDIAN AGE
3.3
AVG FAMILY SIZE
2.5
AVG HOUSEHOLD SIZE
103,851
LABOR FORCE [ PEOPLE ]
51.5%
PERCENT IN LABOR FORCE
8.5%
UNEMPLOYMENT RATE
Income in Area Code 725
Income Overview in Area Code 725
Per Capita Income in Area Code 725 is $33,149, while median incomes of families and households are $73,109 and $57,652 respectively.
| Characteristic | Number | Measure |
| Per Capita Income | 248,803 | $33,149 |
| Median Family Income | 52,768 | $73,109 |
| Mean Family Income | 52,768 | $882,567 |
| Median Household Income | 93,852 | $57,652 |
| Mean Household Income | 93,852 | $760,344 |
| Income Deficit | 52,768 | $11,504 |
| Wage / Income Gap (%) | 248,803 | 12.59% |
| Wage / Income Gap ($) | 248,803 | 87.41¢ per $1 |
| Gini / Inequality Index | 248,803 | 4.95 |
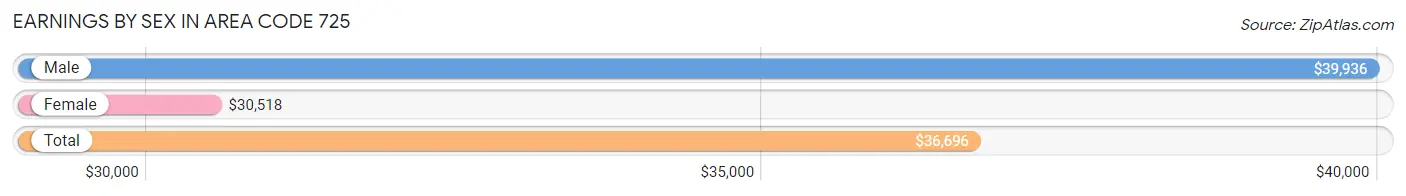
Earnings by Sex in Area Code 725
Average Earnings in Area Code 725 are $36,696, $39,936 for men and $30,518 for women, a difference of 23.6%.
| Sex | Number | Average Earnings |
| Male | 71,575 (55.9%) | $39,936 |
| Female | 56,431 (44.1%) | $30,518 |
| Total | 128,006 (100.0%) | $36,696 |
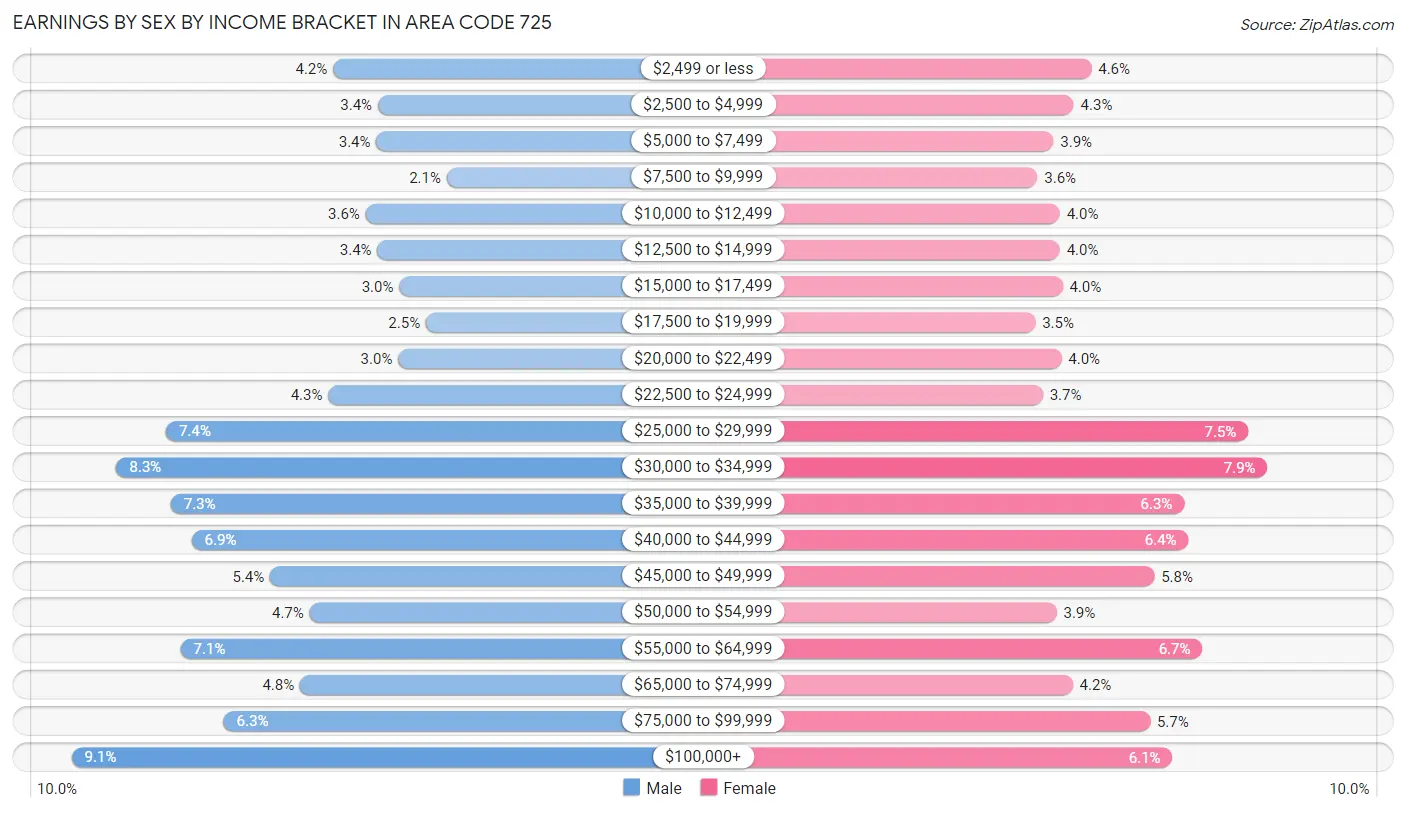
Earnings by Sex by Income Bracket in Area Code 725
The most common earnings brackets in Area Code 725 are $100,000+ for men (6,528 | 9.1%) and $30,000 to $34,999 for women (4,449 | 7.9%).
| Income | Male | Female |
| $2,499 or less | 3,017 (4.2%) | 2,582 (4.6%) |
| $2,500 to $4,999 | 2,418 (3.4%) | 2,401 (4.3%) |
| $5,000 to $7,499 | 2,438 (3.4%) | 2,184 (3.9%) |
| $7,500 to $9,999 | 1,499 (2.1%) | 2,012 (3.6%) |
| $10,000 to $12,499 | 2,584 (3.6%) | 2,250 (4.0%) |
| $12,500 to $14,999 | 2,427 (3.4%) | 2,254 (4.0%) |
| $15,000 to $17,499 | 2,133 (3.0%) | 2,277 (4.0%) |
| $17,500 to $19,999 | 1,777 (2.5%) | 1,993 (3.5%) |
| $20,000 to $22,499 | 2,144 (3.0%) | 2,271 (4.0%) |
| $22,500 to $24,999 | 3,083 (4.3%) | 2,071 (3.7%) |
| $25,000 to $29,999 | 5,264 (7.3%) | 4,246 (7.5%) |
| $30,000 to $34,999 | 5,926 (8.3%) | 4,449 (7.9%) |
| $35,000 to $39,999 | 5,196 (7.3%) | 3,566 (6.3%) |
| $40,000 to $44,999 | 4,919 (6.9%) | 3,611 (6.4%) |
| $45,000 to $49,999 | 3,866 (5.4%) | 3,252 (5.8%) |
| $50,000 to $54,999 | 3,338 (4.7%) | 2,218 (3.9%) |
| $55,000 to $64,999 | 5,067 (7.1%) | 3,756 (6.7%) |
| $65,000 to $74,999 | 3,465 (4.8%) | 2,385 (4.2%) |
| $75,000 to $99,999 | 4,486 (6.3%) | 3,208 (5.7%) |
| $100,000+ | 6,528 (9.1%) | 3,445 (6.1%) |
| Total | 71,575 (100.0%) | 56,431 (100.0%) |
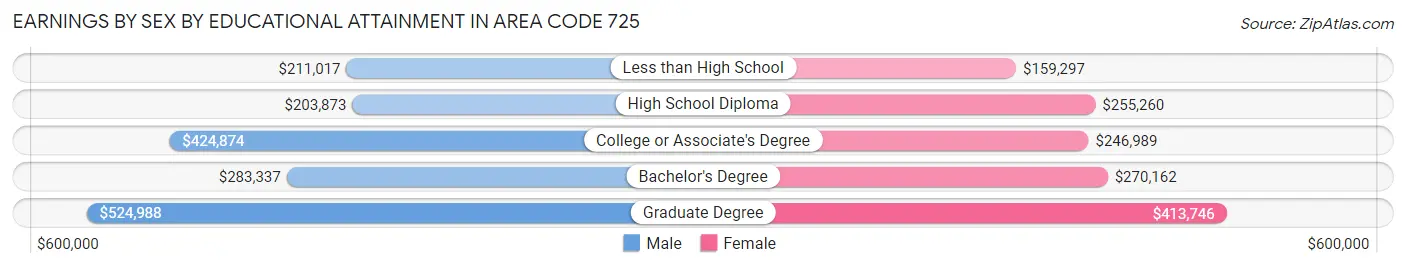
Earnings by Sex by Educational Attainment in Area Code 725
Average earnings in Area Code 725 are $425,996 for men and $230,971 for women, a difference of 45.8%. Men with an educational attainment of graduate degree enjoy the highest average annual earnings of $524,988, while those with high school diploma education earn the least with $203,873. Women with an educational attainment of graduate degree earn the most with the average annual earnings of $413,746, while those with less than high school education have the smallest earnings of $159,297.
| Educational Attainment | Male Income | Female Income |
| Less than High School | $211,017 | $159,297 |
| High School Diploma | $203,873 | $255,260 |
| College or Associate's Degree | $424,874 | $246,989 |
| Bachelor's Degree | $283,337 | $270,162 |
| Graduate Degree | $524,988 | $413,746 |
| Total | $425,996 | $230,971 |
Family Income in Area Code 725
Family Income Brackets in Area Code 725
According to the Area Code 725 family income data, there are 98,254 families falling into the $50,000 to $74,999 income range, which is the most common income bracket and makes up 186.2% of all families. Conversely, the $10,000 to $14,999 income bracket is the least frequent group with only 8,918 families (16.9%) belonging to this category.
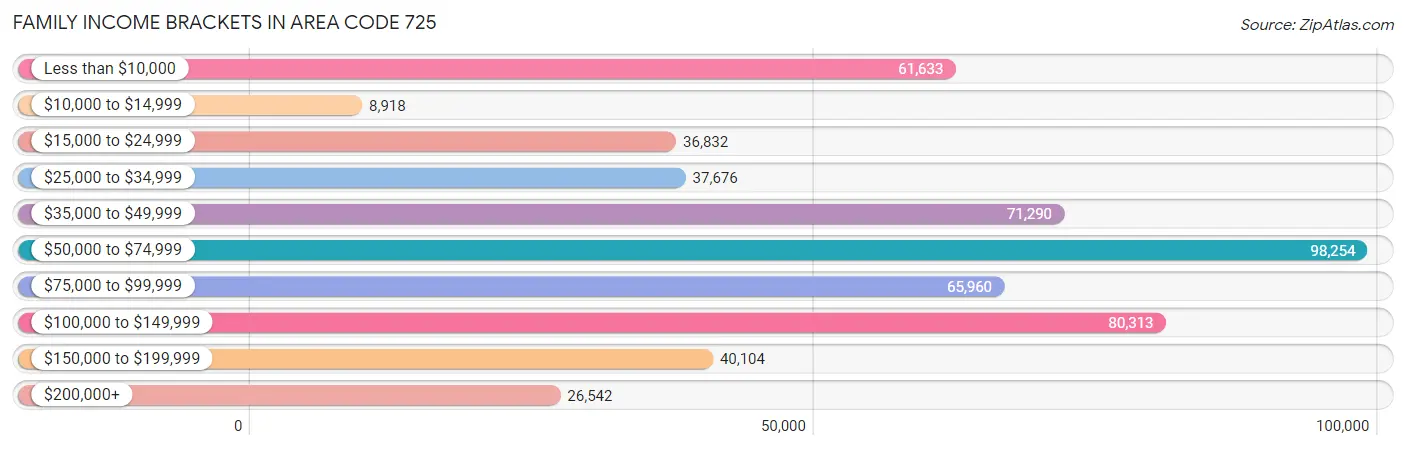
| Income Bracket | # Families | % Families |
| Less than $10,000 | 61,633 | 116.8% |
| $10,000 to $14,999 | 8,918 | 16.9% |
| $15,000 to $24,999 | 36,832 | 69.8% |
| $25,000 to $34,999 | 37,676 | 71.4% |
| $35,000 to $49,999 | 71,290 | 135.1% |
| $50,000 to $74,999 | 98,254 | 186.2% |
| $75,000 to $99,999 | 65,960 | 125.0% |
| $100,000 to $149,999 | 80,313 | 152.2% |
| $150,000 to $199,999 | 40,104 | 76.0% |
| $200,000+ | 26,542 | 50.3% |
Family Income by Famaliy Size in Area Code 725
7+ person families (1,801 | 3.4%) account for the highest median family income in Area Code 725 with $93,635 per family, while 2-person families (23,504 | 44.5%) have the highest median income of $32,703 per family member.
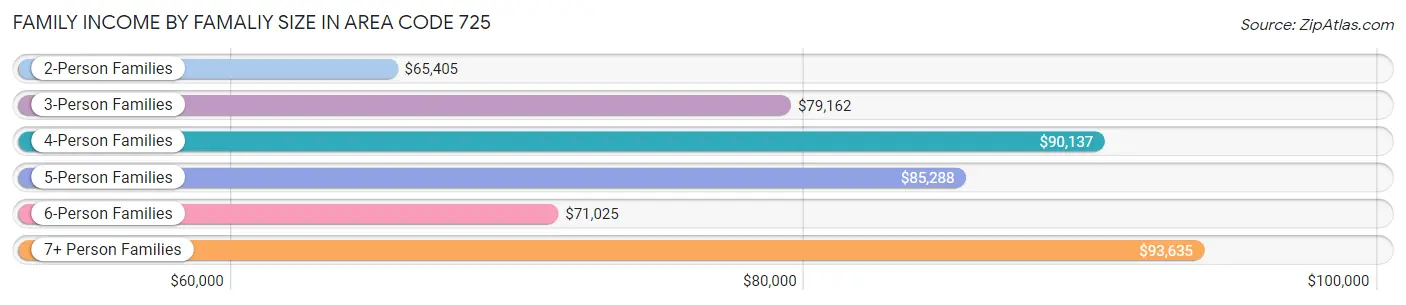
| Income Bracket | # Families | Median Income |
| 2-Person Families | 23,504 (44.5%) | $65,405 |
| 3-Person Families | 10,935 (20.7%) | $79,162 |
| 4-Person Families | 8,764 (16.6%) | $90,137 |
| 5-Person Families | 5,270 (10.0%) | $85,288 |
| 6-Person Families | 2,494 (4.7%) | $71,025 |
| 7+ Person Families | 1,801 (3.4%) | $93,635 |
| Total | 52,768 (100.0%) | $73,109 |
Family Income by Number of Earners in Area Code 725
The median family income in Area Code 725 is $73,109, with families comprising 3+ earners (7,618) having the highest median family income of $130,736, while families with no earners (7,753) have the lowest median family income of $34,586, accounting for 14.4% and 14.7% of families, respectively.
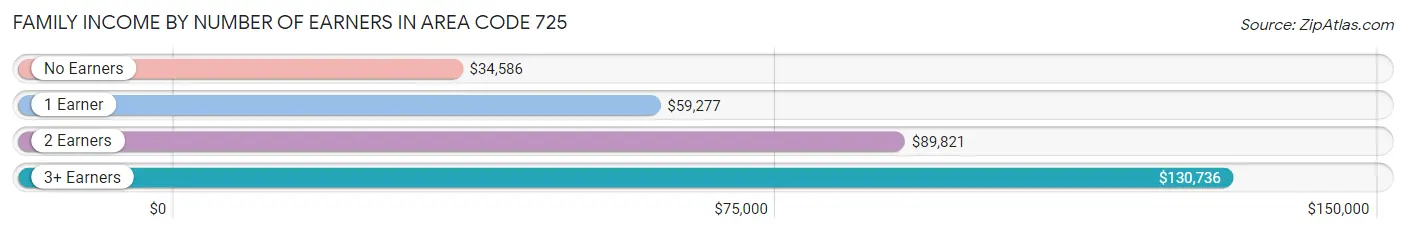
| Number of Earners | # Families | Median Income |
| No Earners | 7,753 (14.7%) | $34,586 |
| 1 Earner | 18,115 (34.3%) | $59,277 |
| 2 Earners | 19,282 (36.5%) | $89,821 |
| 3+ Earners | 7,618 (14.4%) | $130,736 |
| Total | 52,768 (100.0%) | $73,109 |
Household Income in Area Code 725
Household Income Brackets in Area Code 725
With 152,322 households falling in the category, the $50,000 to $74,999 income range is the most frequent in Area Code 725, accounting for 162.3% of all households. In contrast, only 35,664 households (38.0%) fall into the $200,000+ income bracket, making it the least populous group.
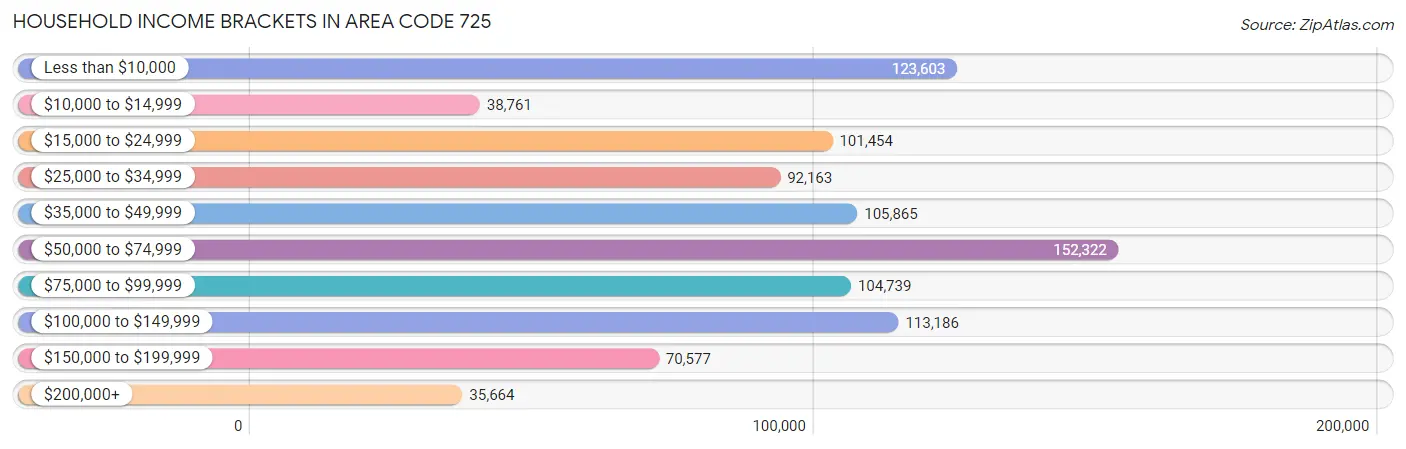
| Income Bracket | # Households | % Households |
| Less than $10,000 | 123,603 | 131.7% |
| $10,000 to $14,999 | 38,761 | 41.3% |
| $15,000 to $24,999 | 101,454 | 108.1% |
| $25,000 to $34,999 | 92,163 | 98.2% |
| $35,000 to $49,999 | 105,865 | 112.8% |
| $50,000 to $74,999 | 152,322 | 162.3% |
| $75,000 to $99,999 | 104,739 | 111.6% |
| $100,000 to $149,999 | 113,186 | 120.6% |
| $150,000 to $199,999 | 70,577 | 75.2% |
| $200,000+ | 35,664 | 38.0% |
Household Income by Householder Age in Area Code 725
The median household income in Area Code 725 is $57,652, with the highest median household income of $74,417 found in the 25 to 44 years age bracket for the primary householder. A total of 32,787 households (34.9%) fall into this category. Meanwhile, the 65+ years age bracket for the primary householder has the lowest median household income of $42,130, with 22,905 households (24.4%) in this group.
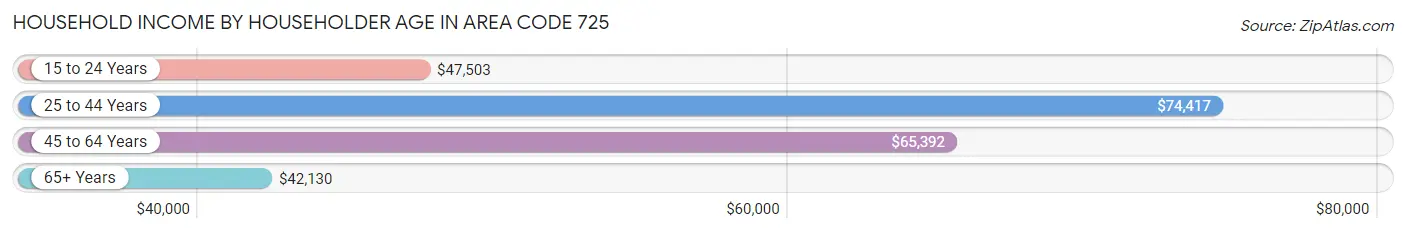
| Income Bracket | # Households | Median Income |
| 15 to 24 Years | 3,402 (3.6%) | $47,503 |
| 25 to 44 Years | 32,787 (34.9%) | $74,417 |
| 45 to 64 Years | 34,758 (37.0%) | $65,392 |
| 65+ Years | 22,905 (24.4%) | $42,130 |
| Total | 93,852 (100.0%) | $57,652 |
Poverty in Area Code 725
Income Below Poverty by Sex and Age in Area Code 725
With 17.1% poverty level for males and 20.3% for females among the residents of Area Code 725, 5 year old males and under 5 year old females are the most vulnerable to poverty, with 496 males (37.1%) and 1,974 females (27.7%) in their respective age groups living below the poverty level.
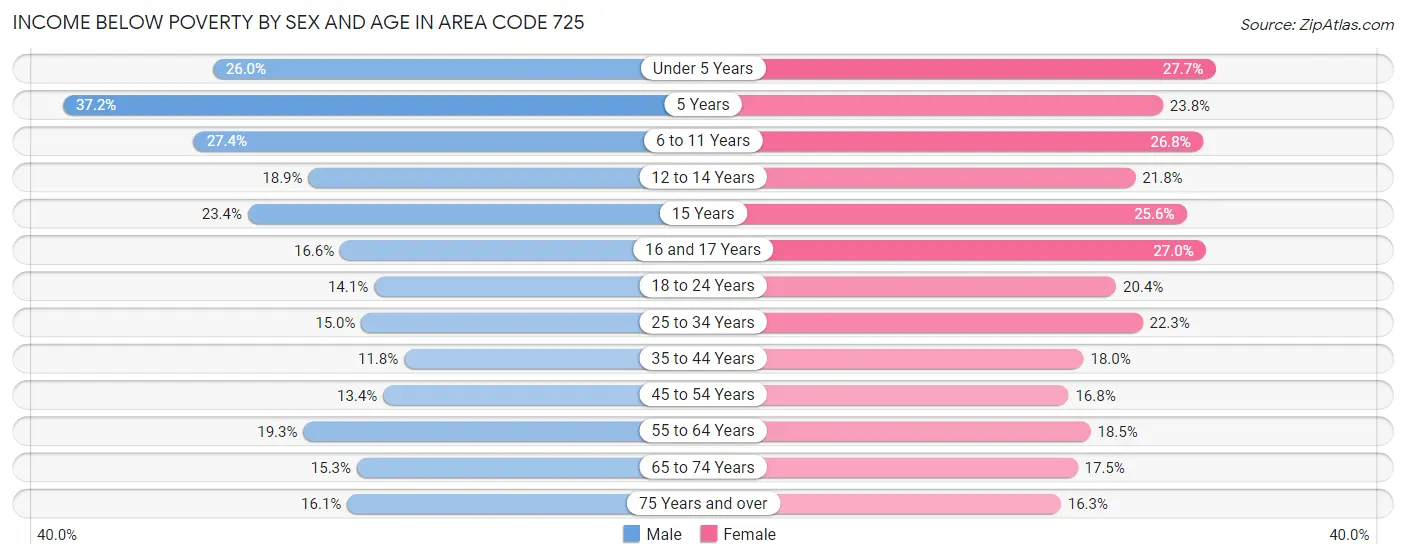
| Age Bracket | Male | Female |
| Under 5 Years | 1,892 (26.0%) | 1,974 (27.7%) |
| 5 Years | 496 (37.1%) | 252 (23.8%) |
| 6 to 11 Years | 2,661 (27.4%) | 2,255 (26.8%) |
| 12 to 14 Years | 877 (18.9%) | 915 (21.8%) |
| 15 Years | 339 (23.4%) | 350 (25.6%) |
| 16 and 17 Years | 467 (16.6%) | 730 (27.0%) |
| 18 to 24 Years | 1,661 (14.1%) | 2,047 (20.4%) |
| 25 to 34 Years | 2,871 (15.0%) | 3,864 (22.3%) |
| 35 to 44 Years | 2,095 (11.8%) | 2,852 (17.9%) |
| 45 to 54 Years | 2,057 (13.4%) | 2,629 (16.8%) |
| 55 to 64 Years | 3,409 (19.3%) | 2,837 (18.5%) |
| 65 to 74 Years | 1,731 (15.3%) | 2,070 (17.5%) |
| 75 Years and over | 937 (16.1%) | 1,213 (16.3%) |
| Total | 21,493 (17.1%) | 23,988 (20.3%) |
Income Above Poverty by Sex and Age in Area Code 725
According to the poverty statistics in Area Code 725, males aged 35 to 44 years and females aged 75 years and over are the age groups that are most secure financially, with 88.2% of males and 83.7% of females in these age groups living above the poverty line.
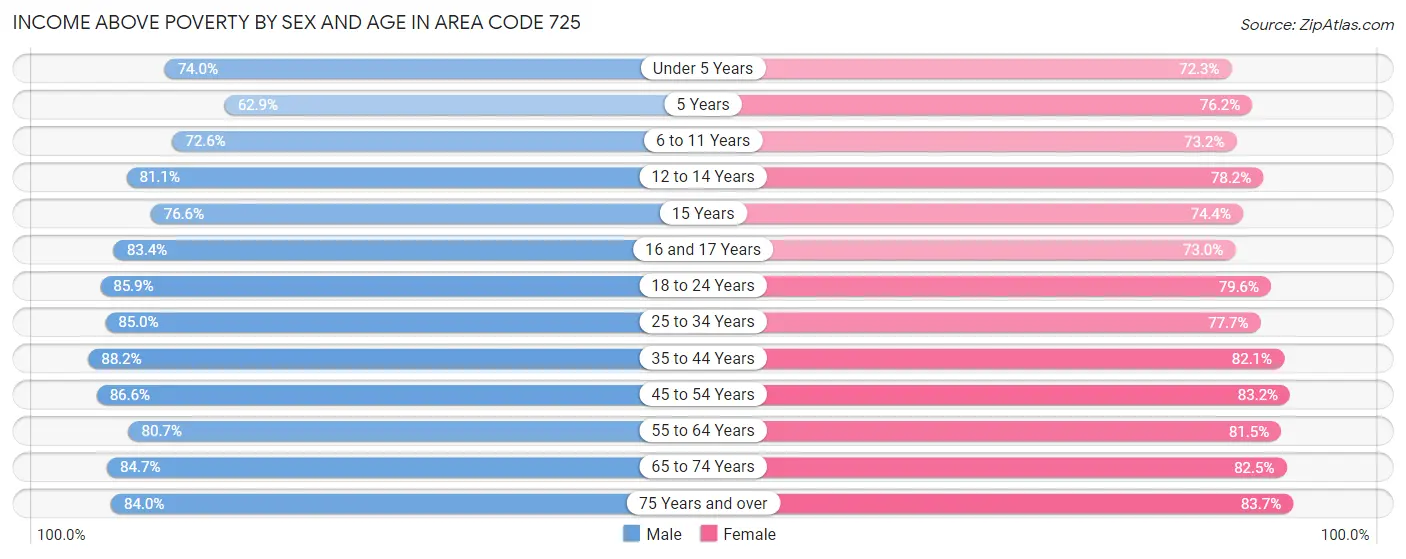
| Age Bracket | Male | Female |
| Under 5 Years | 5,379 (74.0%) | 5,151 (72.3%) |
| 5 Years | 839 (62.8%) | 805 (76.2%) |
| 6 to 11 Years | 7,035 (72.6%) | 6,164 (73.2%) |
| 12 to 14 Years | 3,755 (81.1%) | 3,283 (78.2%) |
| 15 Years | 1,108 (76.6%) | 1,019 (74.4%) |
| 16 and 17 Years | 2,349 (83.4%) | 1,974 (73.0%) |
| 18 to 24 Years | 10,151 (85.9%) | 8,002 (79.6%) |
| 25 to 34 Years | 16,271 (85.0%) | 13,439 (77.7%) |
| 35 to 44 Years | 15,608 (88.2%) | 13,039 (82.1%) |
| 45 to 54 Years | 13,309 (86.6%) | 12,994 (83.2%) |
| 55 to 64 Years | 14,246 (80.7%) | 12,519 (81.5%) |
| 65 to 74 Years | 9,564 (84.7%) | 9,755 (82.5%) |
| 75 Years and over | 4,900 (84.0%) | 6,246 (83.7%) |
| Total | 104,514 (82.9%) | 94,390 (79.7%) |
Income Below Poverty Among Married-Couple Families in Area Code 725
The poverty statistics for married-couple families in Area Code 725 show that 7.7% or 2,541 of the total 32,812 families live below the poverty line. Families with 5 or more children have the highest poverty rate of 43.3%, comprising of 75 families. On the other hand, families with no children have the lowest poverty rate of 4.8%, which includes 933 families.
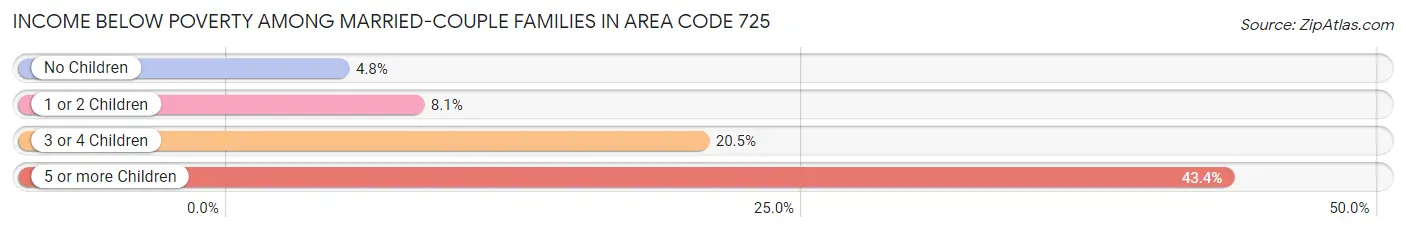
| Children | Above Poverty | Below Poverty |
| No Children | 18,382 (95.2%) | 933 (4.8%) |
| 1 or 2 Children | 8,873 (91.9%) | 781 (8.1%) |
| 3 or 4 Children | 2,918 (79.5%) | 752 (20.5%) |
| 5 or more Children | 98 (56.7%) | 75 (43.3%) |
| Total | 30,271 (92.3%) | 2,541 (7.7%) |
Income Below Poverty Among Single-Parent Households in Area Code 725
According to the poverty data in Area Code 725, 14.3% or 919 single-father households and 26.8% or 3,617 single-mother households are living below the poverty line. Among single-father households, those with 5 or more children have the highest poverty rate, with 51 households (34.0%) experiencing poverty. Likewise, among single-mother households, those with 5 or more children have the highest poverty rate, with 250 households (72.1%) falling below the poverty line.
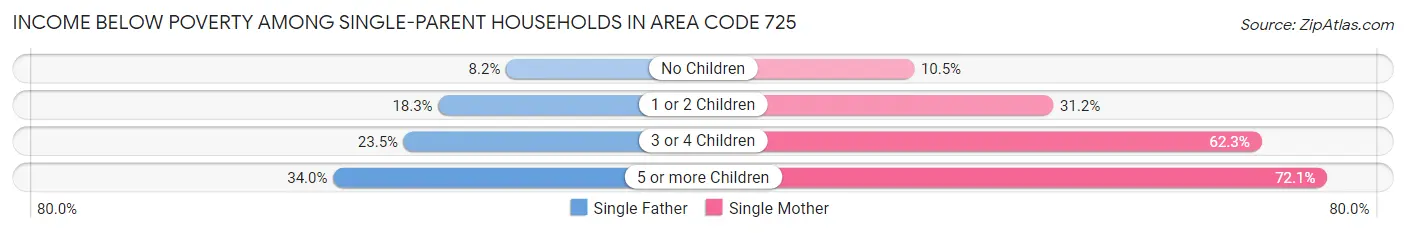
| Children | Single Father | Single Mother |
| No Children | 258 (8.2%) | 594 (10.5%) |
| 1 or 2 Children | 463 (18.3%) | 1,905 (31.2%) |
| 3 or 4 Children | 147 (23.5%) | 868 (62.3%) |
| 5 or more Children | 51 (34.0%) | 250 (72.1%) |
| Total | 919 (14.3%) | 3,617 (26.8%) |
Income Below Poverty Among Married-Couple vs Single-Parent Households in Area Code 725
The poverty data for Area Code 725 shows that 2,541 of the married-couple family households (7.7%) and 4,536 of the single-parent households (22.7%) are living below the poverty level. Within the married-couple family households, those with 5 or more children have the highest poverty rate, with 75 households (43.3%) falling below the poverty line. Among the single-parent households, those with 5 or more children have the highest poverty rate, with 301 household (60.6%) living below poverty.
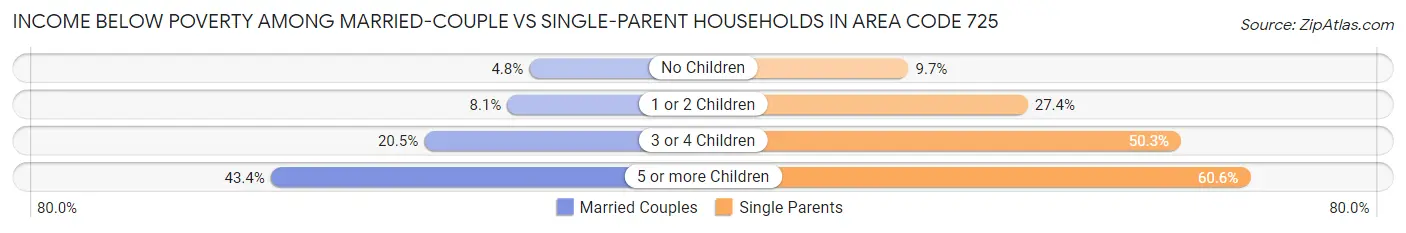
| Children | Married-Couple Families | Single-Parent Households |
| No Children | 933 (4.8%) | 852 (9.7%) |
| 1 or 2 Children | 781 (8.1%) | 2,368 (27.4%) |
| 3 or 4 Children | 752 (20.5%) | 1,015 (50.2%) |
| 5 or more Children | 75 (43.3%) | 301 (60.6%) |
| Total | 2,541 (7.7%) | 4,536 (22.7%) |
Race in Area Code 725
The most populous races in Area Code 725 are Hispanic or Latino (106,503 | 42.8%), White / Caucasian (103,889 | 41.8%), and Some other Race (47,968 | 19.3%).
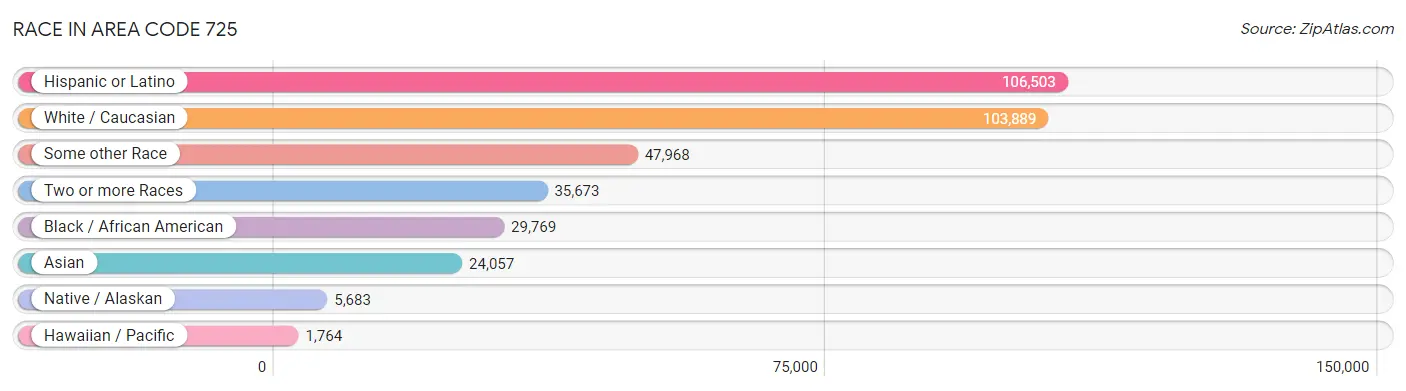
| Race | # Population | % Population |
| Asian | 24,057 | 9.7% |
| Black / African American | 29,769 | 12.0% |
| Hawaiian / Pacific | 1,764 | 0.7% |
| Hispanic or Latino | 106,503 | 42.8% |
| Native / Alaskan | 5,683 | 2.3% |
| White / Caucasian | 103,889 | 41.8% |
| Two or more Races | 35,673 | 14.3% |
| Some other Race | 47,968 | 19.3% |
| Total | 248,803 | 100.0% |
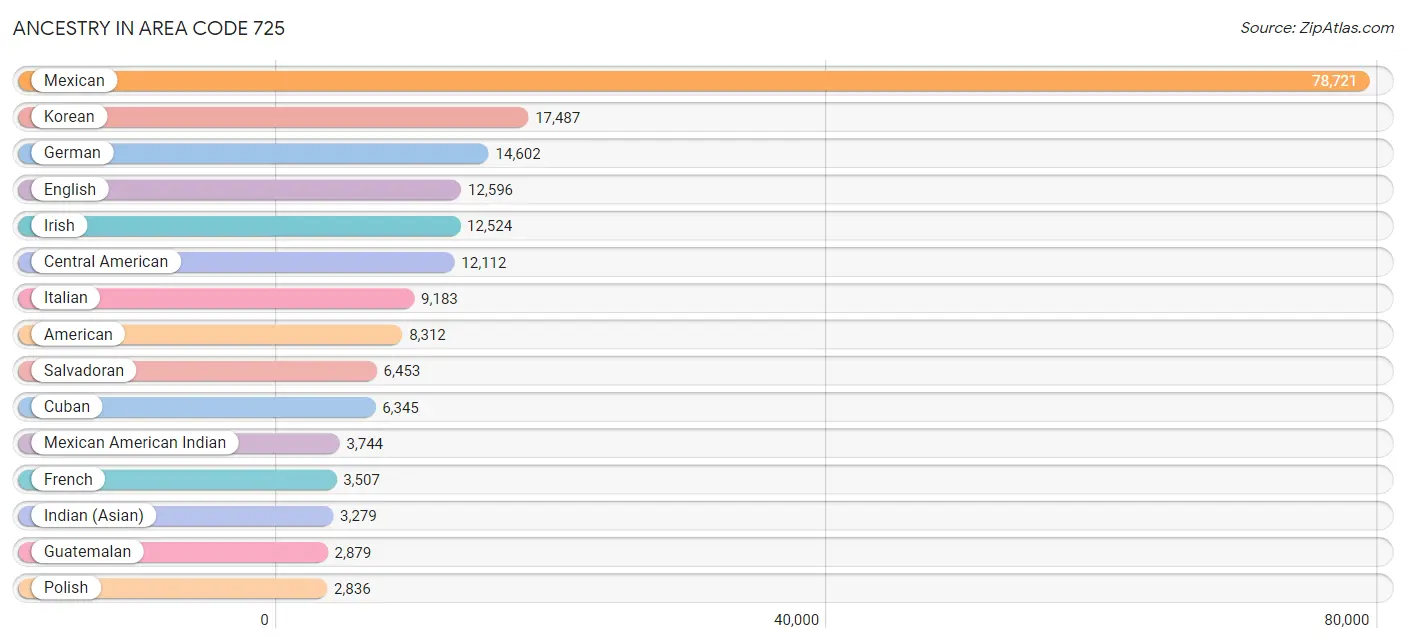
Ancestry in Area Code 725
The most populous ancestries reported in Area Code 725 are Mexican (78,721 | 31.6%), Korean (17,487 | 7.0%), German (14,602 | 5.9%), English (12,596 | 5.1%), and Irish (12,524 | 5.0%), together accounting for 54.6% of all Area Code 725 residents.
| Ancestry | # Population | % Population |
| Afghan | 5 | 0.0% |
| African | 1,327 | 0.5% |
| Alaska Native | 20 | 0.0% |
| Albanian | 27 | 0.0% |
| Aleut | 9 | 0.0% |
| Alsatian | 5 | 0.0% |
| American | 8,312 | 3.3% |
| Apache | 423 | 0.2% |
| Arab | 1,050 | 0.4% |
| Arapaho | 5 | 0.0% |
| Argentinean | 305 | 0.1% |
| Armenian | 289 | 0.1% |
| Assyrian / Chaldean / Syriac | 9 | 0.0% |
| Australian | 41 | 0.0% |
| Austrian | 217 | 0.1% |
| Bangladeshi | 3 | 0.0% |
| Basque | 38 | 0.0% |
| Belgian | 130 | 0.1% |
| Belizean | 195 | 0.1% |
| Bhutanese | 2,234 | 0.9% |
| Blackfeet | 148 | 0.1% |
| Bolivian | 107 | 0.0% |
| Brazilian | 78 | 0.0% |
| British | 981 | 0.4% |
| Bulgarian | 8 | 0.0% |
| Burmese | 1,378 | 0.5% |
| Canadian | 437 | 0.2% |
| Celtic | 127 | 0.1% |
| Central American | 12,112 | 4.9% |
| Central American Indian | 550 | 0.2% |
| Cherokee | 1,161 | 0.5% |
| Chickasaw | 51 | 0.0% |
| Chilean | 382 | 0.2% |
| Chinese | 75 | 0.0% |
| Chippewa | 11 | 0.0% |
| Choctaw | 275 | 0.1% |
| Colombian | 543 | 0.2% |
| Comanche | 91 | 0.0% |
| Costa Rican | 282 | 0.1% |
| Creek | 62 | 0.0% |
| Croatian | 107 | 0.0% |
| Crow | 17 | 0.0% |
| Cuban | 6,345 | 2.5% |
| Cypriot | 11 | 0.0% |
| Czech | 371 | 0.2% |
| Czechoslovakian | 93 | 0.0% |
| Danish | 367 | 0.2% |
| Delaware | 19 | 0.0% |
| Dominican | 637 | 0.3% |
| Dutch | 1,444 | 0.6% |
| Eastern European | 299 | 0.1% |
| Ecuadorian | 359 | 0.1% |
| Egyptian | 146 | 0.1% |
| English | 12,596 | 5.1% |
| Ethiopian | 296 | 0.1% |
| European | 1,841 | 0.7% |
| Filipino | 115 | 0.1% |
| Finnish | 174 | 0.1% |
| French | 3,507 | 1.4% |
| French American Indian | 12 | 0.0% |
| French Canadian | 735 | 0.3% |
| German | 14,602 | 5.9% |
| German Russian | 70 | 0.0% |
| Greek | 594 | 0.2% |
| Guamanian / Chamorro | 340 | 0.1% |
| Guatemalan | 2,879 | 1.2% |
| Haitian | 169 | 0.1% |
| Honduran | 902 | 0.4% |
| Hopi | 70 | 0.0% |
| Hungarian | 654 | 0.3% |
| Icelander | 27 | 0.0% |
| Indian (Asian) | 3,279 | 1.3% |
| Inupiat | 6 | 0.0% |
| Iranian | 241 | 0.1% |
| Iraqi | 110 | 0.0% |
| Irish | 12,524 | 5.0% |
| Iroquois | 76 | 0.0% |
| Israeli | 29 | 0.0% |
| Italian | 9,183 | 3.7% |
| Jamaican | 240 | 0.1% |
| Japanese | 276 | 0.1% |
| Jordanian | 62 | 0.0% |
| Kenyan | 80 | 0.0% |
| Korean | 17,487 | 7.0% |
| Laotian | 463 | 0.2% |
| Latvian | 75 | 0.0% |
| Lebanese | 196 | 0.1% |
| Liberian | 26 | 0.0% |
| Lithuanian | 140 | 0.1% |
| Luxembourger | 12 | 0.0% |
| Macedonian | 47 | 0.0% |
| Malaysian | 479 | 0.2% |
| Maltese | 17 | 0.0% |
| Menominee | 16 | 0.0% |
| Mexican | 78,721 | 31.6% |
| Mexican American Indian | 3,744 | 1.5% |
| Mongolian | 28 | 0.0% |
| Moroccan | 295 | 0.1% |
| Native Hawaiian | 1,811 | 0.7% |
| Navajo | 290 | 0.1% |
| New Zealander | 43 | 0.0% |
| Nicaraguan | 1,207 | 0.5% |
| Nigerian | 398 | 0.2% |
| Northern European | 151 | 0.1% |
| Norwegian | 1,699 | 0.7% |
| Osage | 12 | 0.0% |
| Paiute | 283 | 0.1% |
| Pakistani | 959 | 0.4% |
| Palestinian | 118 | 0.1% |
| Panamanian | 244 | 0.1% |
| Paraguayan | 32 | 0.0% |
| Pennsylvania German | 9 | 0.0% |
| Peruvian | 376 | 0.2% |
| Polish | 2,836 | 1.1% |
| Portuguese | 856 | 0.3% |
| Potawatomi | 6 | 0.0% |
| Pueblo | 57 | 0.0% |
| Puerto Rican | 2,653 | 1.1% |
| Romanian | 688 | 0.3% |
| Russian | 1,154 | 0.5% |
| Salvadoran | 6,453 | 2.6% |
| Samoan | 721 | 0.3% |
| Scandinavian | 483 | 0.2% |
| Scotch-Irish | 534 | 0.2% |
| Scottish | 1,952 | 0.8% |
| Senegalese | 36 | 0.0% |
| Serbian | 232 | 0.1% |
| Shoshone | 91 | 0.0% |
| Sioux | 221 | 0.1% |
| Slavic | 10 | 0.0% |
| Slovak | 262 | 0.1% |
| Slovene | 198 | 0.1% |
| Somali | 21 | 0.0% |
| South African | 71 | 0.0% |
| South American | 2,234 | 0.9% |
| South American Indian | 59 | 0.0% |
| Spaniard | 1,094 | 0.4% |
| Spanish | 903 | 0.4% |
| Spanish American | 32 | 0.0% |
| Sri Lankan | 1,798 | 0.7% |
| Subsaharan African | 2,332 | 0.9% |
| Swedish | 1,151 | 0.5% |
| Swiss | 230 | 0.1% |
| Syrian | 54 | 0.0% |
| Thai | 2,104 | 0.9% |
| Tlingit-Haida | 53 | 0.0% |
| Tohono O'Odham | 11 | 0.0% |
| Tongan | 41 | 0.0% |
| Trinidadian and Tobagonian | 15 | 0.0% |
| Turkish | 34 | 0.0% |
| U.S. Virgin Islander | 12 | 0.0% |
| Ukrainian | 358 | 0.1% |
| Uruguayan | 20 | 0.0% |
| Ute | 8 | 0.0% |
| Venezuelan | 101 | 0.0% |
| Vietnamese | 109 | 0.0% |
| Welsh | 895 | 0.4% |
| West Indian | 111 | 0.0% |
| Yaqui | 16 | 0.0% |
| Yugoslavian | 514 | 0.2% |
| Yuman | 14 | 0.0% |
| Yup'ik | 13 | 0.0% | View All 162 Rows |
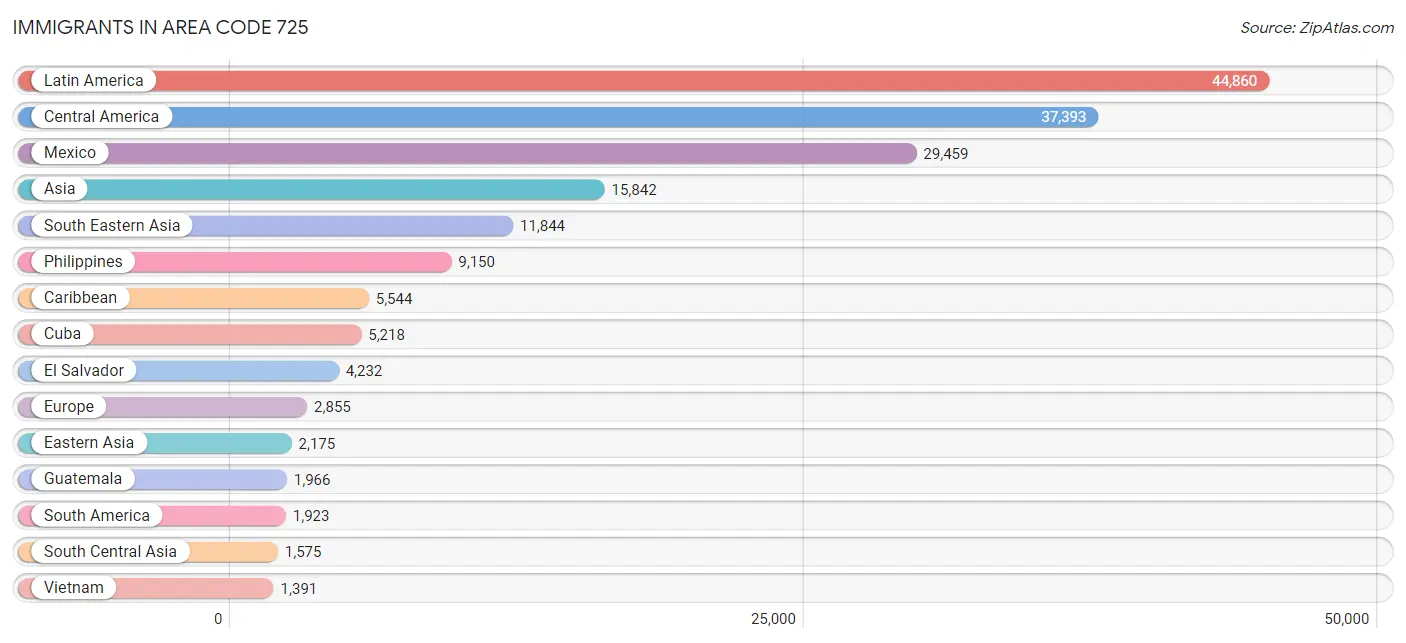
Immigrants in Area Code 725
The most numerous immigrant groups reported in Area Code 725 came from Latin America (44,860 | 18.0%), Central America (37,393 | 15.0%), Mexico (29,459 | 11.8%), Asia (15,842 | 6.4%), and South Eastern Asia (11,844 | 4.8%), together accounting for 56.0% of all Area Code 725 residents.
| Immigration Origin | # Population | % Population |
| Afghanistan | 12 | 0.0% |
| Africa | 1,198 | 0.5% |
| Albania | 11 | 0.0% |
| Argentina | 230 | 0.1% |
| Armenia | 5 | 0.0% |
| Asia | 15,842 | 6.4% |
| Australia | 99 | 0.0% |
| Austria | 60 | 0.0% |
| Bangladesh | 63 | 0.0% |
| Belarus | 6 | 0.0% |
| Belgium | 24 | 0.0% |
| Belize | 124 | 0.1% |
| Bolivia | 49 | 0.0% |
| Bosnia and Herzegovina | 262 | 0.1% |
| Brazil | 273 | 0.1% |
| Cambodia | 232 | 0.1% |
| Cameroon | 18 | 0.0% |
| Canada | 571 | 0.2% |
| Caribbean | 5,544 | 2.2% |
| Central America | 37,393 | 15.0% |
| Chile | 116 | 0.1% |
| China | 879 | 0.4% |
| Colombia | 488 | 0.2% |
| Congo | 16 | 0.0% |
| Costa Rica | 279 | 0.1% |
| Croatia | 42 | 0.0% |
| Cuba | 5,218 | 2.1% |
| Czechoslovakia | 41 | 0.0% |
| Denmark | 33 | 0.0% |
| Dominican Republic | 145 | 0.1% |
| Eastern Africa | 434 | 0.2% |
| Eastern Asia | 2,175 | 0.9% |
| Eastern Europe | 1,298 | 0.5% |
| Ecuador | 230 | 0.1% |
| Egypt | 255 | 0.1% |
| El Salvador | 4,232 | 1.7% |
| England | 248 | 0.1% |
| Eritrea | 101 | 0.0% |
| Ethiopia | 190 | 0.1% |
| Europe | 2,855 | 1.1% |
| France | 97 | 0.0% |
| Germany | 392 | 0.2% |
| Ghana | 37 | 0.0% |
| Greece | 88 | 0.0% |
| Guatemala | 1,966 | 0.8% |
| Guyana | 81 | 0.0% |
| Haiti | 54 | 0.0% |
| Honduras | 586 | 0.2% |
| Hong Kong | 77 | 0.0% |
| Hungary | 82 | 0.0% |
| India | 1,037 | 0.4% |
| Indonesia | 156 | 0.1% |
| Iran | 161 | 0.1% |
| Iraq | 37 | 0.0% |
| Ireland | 46 | 0.0% |
| Israel | 41 | 0.0% |
| Italy | 162 | 0.1% |
| Jamaica | 89 | 0.0% |
| Japan | 332 | 0.1% |
| Jordan | 48 | 0.0% |
| Kenya | 84 | 0.0% |
| Korea | 964 | 0.4% |
| Laos | 232 | 0.1% |
| Latin America | 44,860 | 18.0% |
| Latvia | 38 | 0.0% |
| Lebanon | 49 | 0.0% |
| Liberia | 25 | 0.0% |
| Lithuania | 8 | 0.0% |
| Malaysia | 127 | 0.1% |
| Mexico | 29,459 | 11.8% |
| Micronesia | 63 | 0.0% |
| Middle Africa | 66 | 0.0% |
| Morocco | 63 | 0.0% |
| Nepal | 19 | 0.0% |
| Netherlands | 30 | 0.0% |
| Nicaragua | 651 | 0.3% |
| Nigeria | 162 | 0.1% |
| Northern Africa | 340 | 0.1% |
| Northern Europe | 515 | 0.2% |
| Norway | 1 | 0.0% |
| Oceania | 235 | 0.1% |
| Pakistan | 269 | 0.1% |
| Panama | 96 | 0.0% |
| Peru | 333 | 0.1% |
| Philippines | 9,150 | 3.7% |
| Poland | 88 | 0.0% |
| Portugal | 72 | 0.0% |
| Romania | 294 | 0.1% |
| Russia | 197 | 0.1% |
| Saudi Arabia | 30 | 0.0% |
| Scotland | 28 | 0.0% |
| Serbia | 13 | 0.0% |
| Sierra Leone | 26 | 0.0% |
| Singapore | 53 | 0.0% |
| Somalia | 21 | 0.0% |
| South Africa | 68 | 0.0% |
| South America | 1,923 | 0.8% |
| South Central Asia | 1,575 | 0.6% |
| South Eastern Asia | 11,844 | 4.8% |
| Southern Europe | 397 | 0.2% |
| Spain | 58 | 0.0% |
| Sri Lanka | 14 | 0.0% |
| Sudan | 22 | 0.0% |
| Sweden | 14 | 0.0% |
| Switzerland | 25 | 0.0% |
| Taiwan | 313 | 0.1% |
| Thailand | 492 | 0.2% |
| Trinidad and Tobago | 25 | 0.0% |
| Turkey | 19 | 0.0% |
| Uganda | 17 | 0.0% |
| Ukraine | 153 | 0.1% |
| Venezuela | 91 | 0.0% |
| Vietnam | 1,391 | 0.6% |
| West Indies | 13 | 0.0% |
| Western Africa | 267 | 0.1% |
| Western Asia | 248 | 0.1% |
| Western Europe | 628 | 0.3% |
| Zaire | 21 | 0.0% |
| Zimbabwe | 21 | 0.0% | View All 119 Rows |
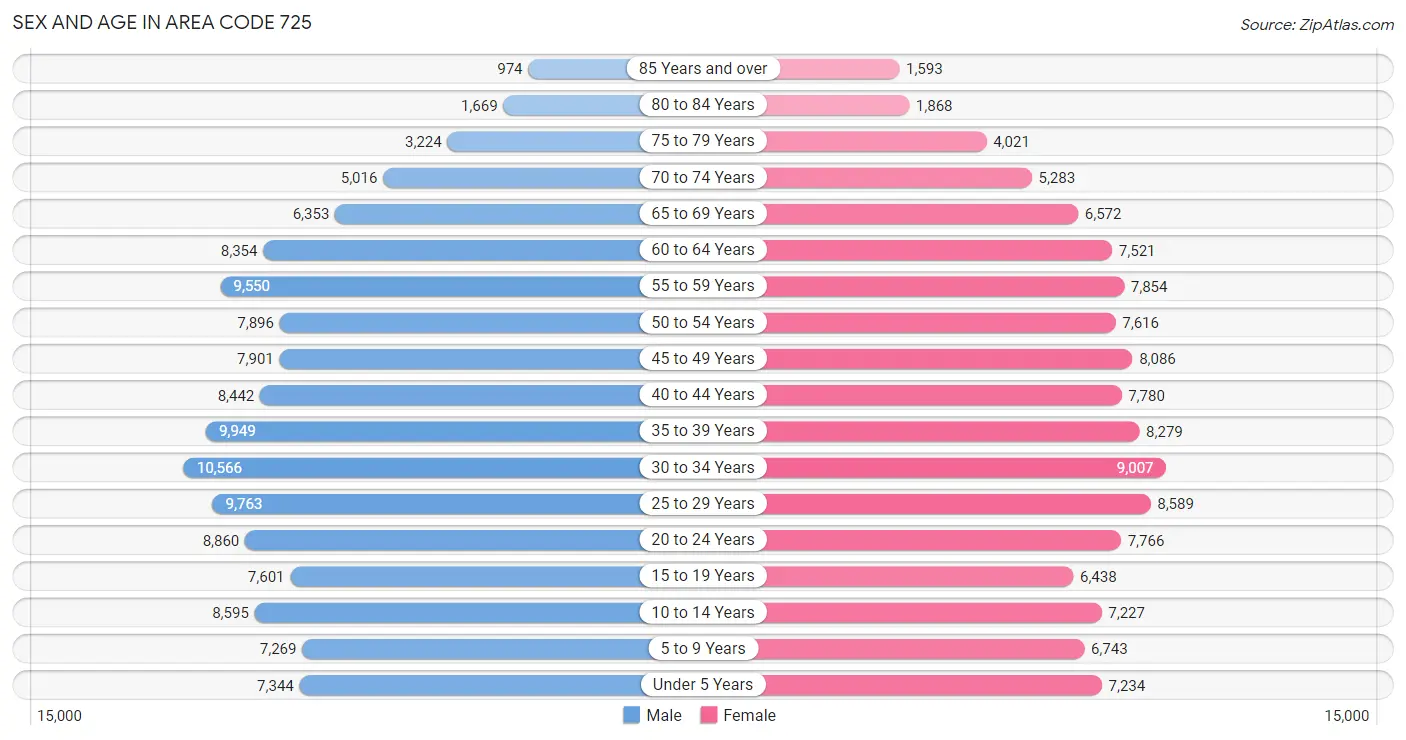
Sex and Age in Area Code 725
Sex and Age in Area Code 725
The most populous age groups in Area Code 725 are 30 to 34 Years (10,566 | 8.2%) for men and 30 to 34 Years (9,007 | 7.5%) for women.
| Age Bracket | Male | Female |
| Under 5 Years | 7,344 (5.7%) | 7,234 (6.0%) |
| 5 to 9 Years | 7,269 (5.6%) | 6,743 (5.6%) |
| 10 to 14 Years | 8,595 (6.7%) | 7,227 (6.0%) |
| 15 to 19 Years | 7,601 (5.9%) | 6,438 (5.4%) |
| 20 to 24 Years | 8,860 (6.9%) | 7,766 (6.5%) |
| 25 to 29 Years | 9,763 (7.5%) | 8,589 (7.2%) |
| 30 to 34 Years | 10,566 (8.2%) | 9,007 (7.5%) |
| 35 to 39 Years | 9,949 (7.7%) | 8,279 (6.9%) |
| 40 to 44 Years | 8,442 (6.5%) | 7,780 (6.5%) |
| 45 to 49 Years | 7,901 (6.1%) | 8,086 (6.8%) |
| 50 to 54 Years | 7,896 (6.1%) | 7,616 (6.4%) |
| 55 to 59 Years | 9,550 (7.4%) | 7,854 (6.6%) |
| 60 to 64 Years | 8,354 (6.5%) | 7,521 (6.3%) |
| 65 to 69 Years | 6,353 (4.9%) | 6,572 (5.5%) |
| 70 to 74 Years | 5,016 (3.9%) | 5,283 (4.4%) |
| 75 to 79 Years | 3,224 (2.5%) | 4,021 (3.4%) |
| 80 to 84 Years | 1,669 (1.3%) | 1,868 (1.6%) |
| 85 Years and over | 974 (0.7%) | 1,593 (1.3%) |
| Total | 129,326 (100.0%) | 119,477 (100.0%) |
Families and Households in Area Code 725
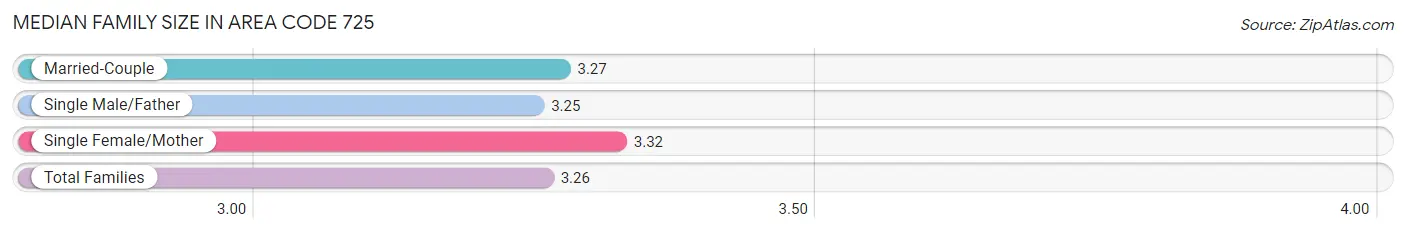
Median Family Size in Area Code 725
The median family size in Area Code 725 is 3.26 persons per family, with single female/mother families (13,519 | 25.6%) accounting for the largest median family size of 3.32222 persons per family. On the other hand, single male/father families (6,437 | 12.2%) represent the smallest median family size with 3.25 persons per family.
| Family Type | # Families | Family Size |
| Married-Couple | 32,812 (62.2%) | 3.27 |
| Single Male/Father | 6,437 (12.2%) | 3.25 |
| Single Female/Mother | 13,519 (25.6%) | 3.32 |
| Total Families | 52,768 (100.0%) | 3.26 |
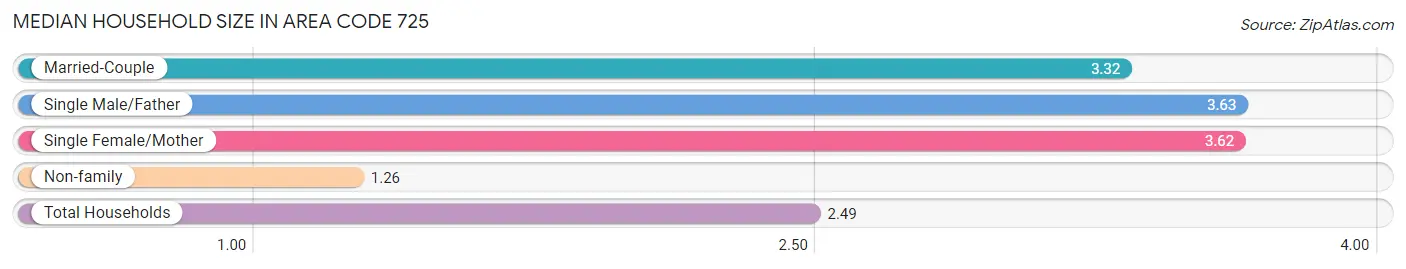
Median Household Size in Area Code 725
The median household size in Area Code 725 is 2.48 persons per household, with single male/father households (6,437 | 6.9%) accounting for the largest median household size of 3.62857 persons per household. non-family households (41,084 | 43.8%) represent the smallest median household size with 1.26 persons per household.
| Household Type | # Households | Household Size |
| Married-Couple | 32,812 (35.0%) | 3.32 |
| Single Male/Father | 6,437 (6.9%) | 3.63 |
| Single Female/Mother | 13,519 (14.4%) | 3.62 |
| Non-family | 41,084 (43.8%) | 1.26 |
| Total Households | 93,852 (100.0%) | 2.48 |
Household Size by Marriage Status in Area Code 725
Out of a total of 93,852 households in Area Code 725, 52,768 (56.2%) are family households, while 41,084 (43.8%) are nonfamily households. The most numerous type of family households are 2-person households, comprising 20,645, and the most common type of nonfamily households are 1-person households, comprising 32,805.
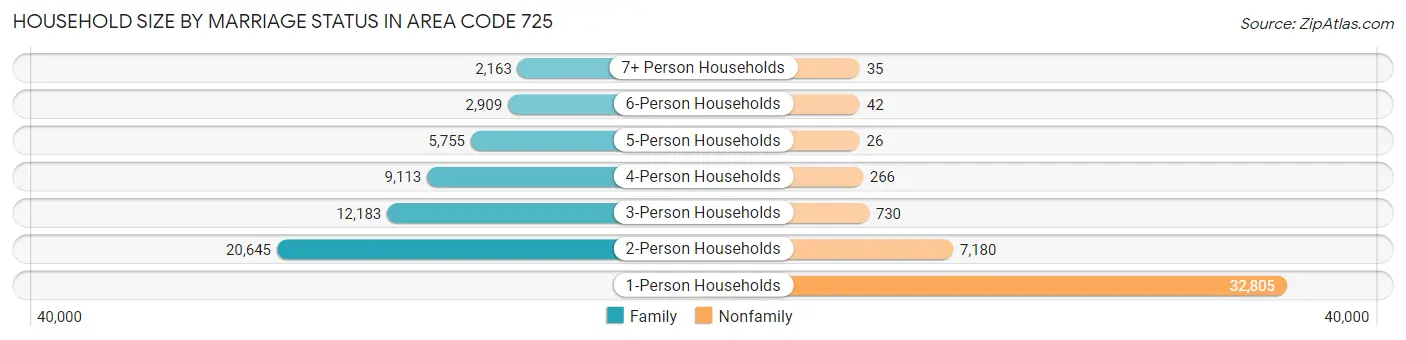
| Household Size | Family Households | Nonfamily Households |
| 1-Person Households | - | 32,805 (34.9%) |
| 2-Person Households | 20,645 (22.0%) | 7,180 (7.6%) |
| 3-Person Households | 12,183 (13.0%) | 730 (0.8%) |
| 4-Person Households | 9,113 (9.7%) | 266 (0.3%) |
| 5-Person Households | 5,755 (6.1%) | 26 (0.0%) |
| 6-Person Households | 2,909 (3.1%) | 42 (0.0%) |
| 7+ Person Households | 2,163 (2.3%) | 35 (0.0%) |
| Total | 52,768 (56.2%) | 41,084 (43.8%) |
Female Fertility in Area Code 725
Fertility by Age in Area Code 725
Average fertility rate in Area Code 725 is 52.6 births per 1,000 women. Women in the age bracket of 20 to 34 years have the highest fertility rate with 78.0 births per 1,000 women. Women in the age bracket of 20 to 34 years acount for 73.7% of all women with births.
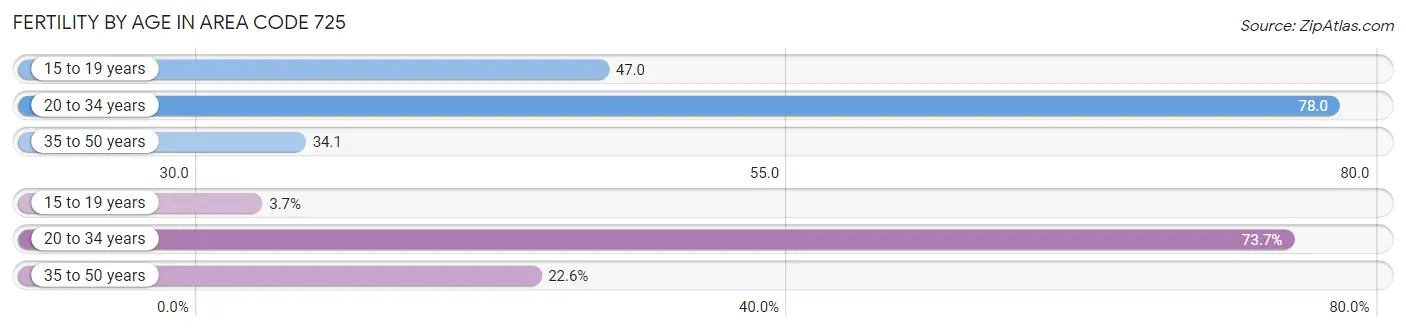
| Age Bracket | Women with Births | Births / 1,000 Women |
| 15 to 19 years | 94 (3.7%) | 47.0 |
| 20 to 34 years | 1,884 (73.7%) | 78.0 |
| 35 to 50 years | 578 (22.6%) | 34.1 |
| Total | 2,556 (100.0%) | 52.6 |
Fertility by Age by Marriage Status in Area Code 725
47.1% of women with births (2,556) in Area Code 725 are married. The highest percentage of unmarried women with births falls into 15 to 19 years age bracket with 100.0% of them unmarried at the time of birth, while the lowest percentage of unmarried women with births belong to 20 to 34 years age bracket with 45.2% of them unmarried.
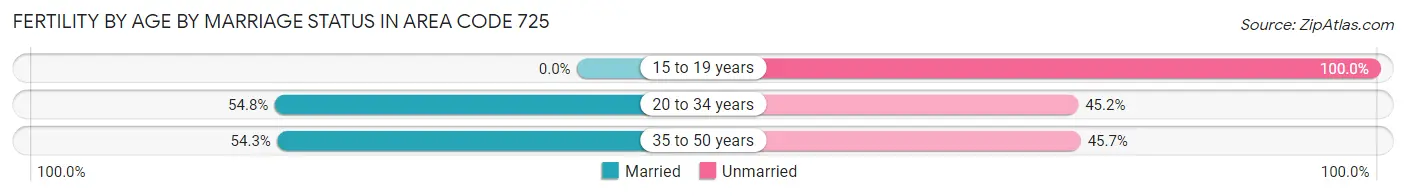
| Age Bracket | Married | Unmarried |
| 15 to 19 years | 0 (0.0%) | 94 (100.0%) |
| 20 to 34 years | 1,032 (54.8%) | 852 (45.2%) |
| 35 to 50 years | 314 (54.3%) | 264 (45.7%) |
| Total | 1,205 (47.1%) | 1,351 (52.9%) |
Fertility by Education in Area Code 725
Average fertility rate in Area Code 725 is 52.6 births per 1,000 women. Women with the education attainment of less than high school have the highest fertility rate of 123.6 births per 1,000 women, while women with the education attainment of bachelor's degree have the lowest fertility at 29.4 births per 1,000 women. Women with the education attainment of high school diploma represent 32.4% of all women with births.
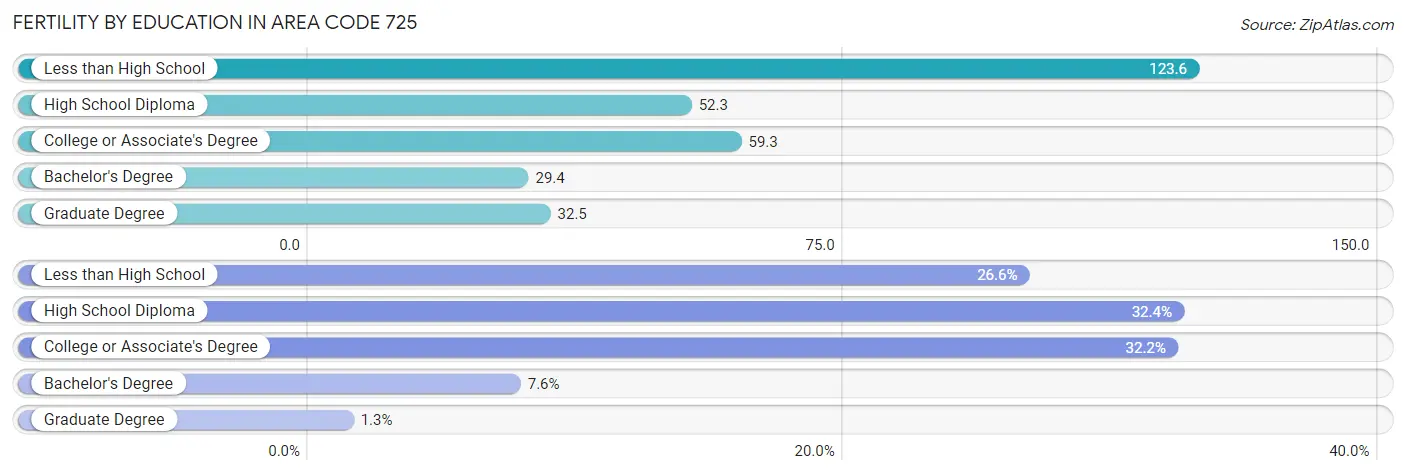
| Educational Attainment | Women with Births | Births / 1,000 Women |
| Less than High School | 680 (26.6%) | 123.6 |
| High School Diploma | 828 (32.4%) | 52.3 |
| College or Associate's Degree | 822 (32.2%) | 59.3 |
| Bachelor's Degree | 193 (7.5%) | 29.4 |
| Graduate Degree | 33 (1.3%) | 32.5 |
| Total | 2,556 (100.0%) | 52.6 |
Fertility by Education by Marriage Status in Area Code 725
52.9% of women with births in Area Code 725 are unmarried. Women with the educational attainment of college or associate's degree are most likely to be married with 63.5% of them married at childbirth, while women with the educational attainment of graduate degree are least likely to be married with 60.6% of them unmarried at childbirth.
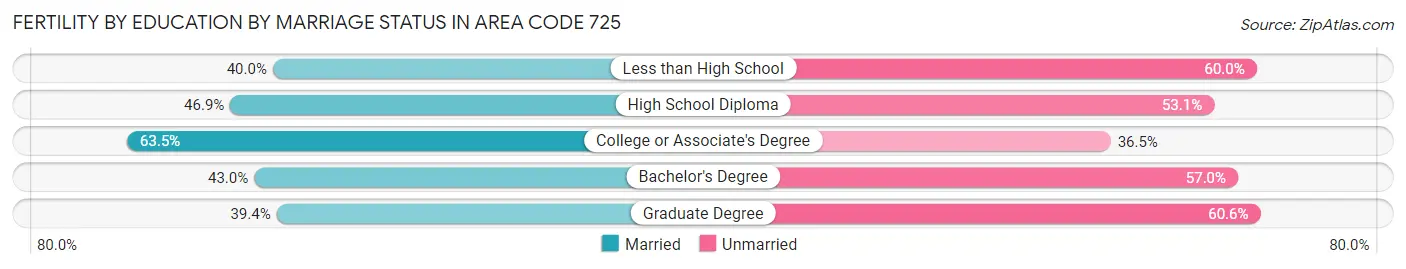
| Educational Attainment | Married | Unmarried |
| Less than High School | 272 (40.0%) | 408 (60.0%) |
| High School Diploma | 388 (46.9%) | 440 (53.1%) |
| College or Associate's Degree | 522 (63.5%) | 300 (36.5%) |
| Bachelor's Degree | 83 (43.0%) | 110 (57.0%) |
| Graduate Degree | 13 (39.4%) | 20 (60.6%) |
| Total | 1,205 (47.1%) | 1,351 (52.9%) |
Employment Characteristics in Area Code 725
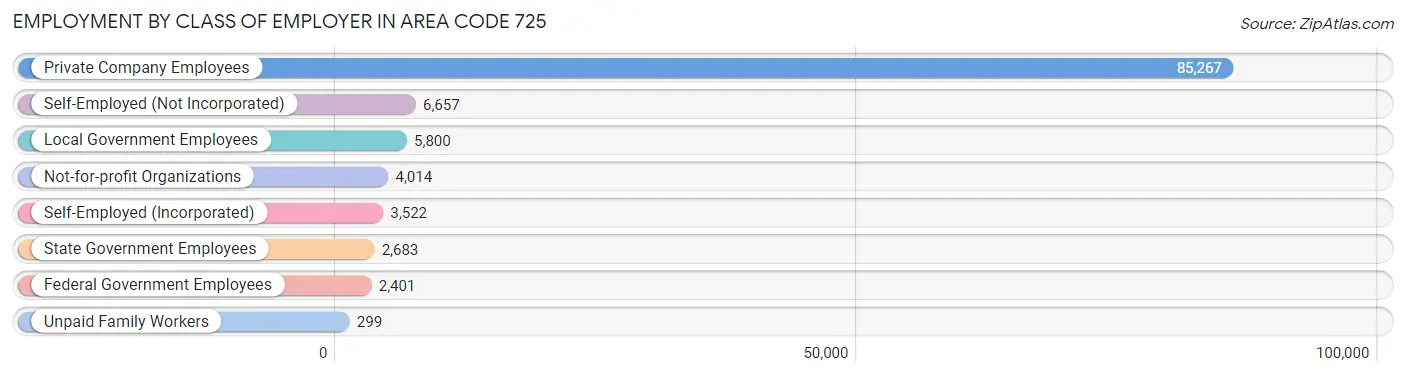
Employment by Class of Employer in Area Code 725
Among the 110,643 employed individuals in Area Code 725, private company employees (85,267 | 77.1%), self-employed (not incorporated) (6,657 | 6.0%), and local government employees (5,800 | 5.2%) make up the most common classes of employment.
| Employer Class | # Employees | % Employees |
| Private Company Employees | 85,267 | 77.1% |
| Self-Employed (Incorporated) | 3,522 | 3.2% |
| Self-Employed (Not Incorporated) | 6,657 | 6.0% |
| Not-for-profit Organizations | 4,014 | 3.6% |
| Local Government Employees | 5,800 | 5.2% |
| State Government Employees | 2,683 | 2.4% |
| Federal Government Employees | 2,401 | 2.2% |
| Unpaid Family Workers | 299 | 0.3% |
| Total | 110,643 | 100.0% |
Employment Status by Age in Area Code 725
According to the labor force statistics for Area Code 725, out of the total population over 16 years of age (201,574), 51.5% or 103,851 individuals are in the labor force, with 8.5% or 8,827 of them unemployed. The age group with the highest labor force participation rate is 25 to 29 years, with 83.9% or 15,394 individuals in the labor force. Within the labor force, the 65 to 74 years age range has the highest percentage of unemployed individuals, with 150.7% or 7,868 of them being unemployed.
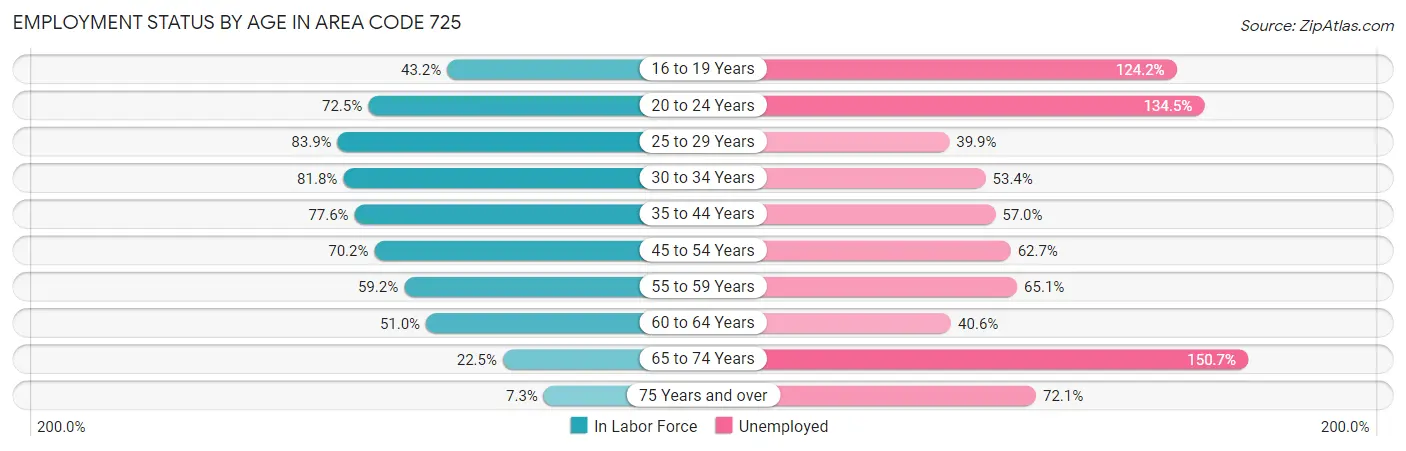
| Age Bracket | In Labor Force | Unemployed |
| 16 to 19 Years | 4,845 (43.2%) | 6,019 (124.2%) |
| 20 to 24 Years | 12,054 (72.5%) | 16,213 (134.5%) |
| 25 to 29 Years | 15,393 (83.9%) | 6,142 (39.9%) |
| 30 to 34 Years | 16,001 (81.8%) | 8,545 (53.4%) |
| 35 to 44 Years | 26,716 (77.5%) | 15,228 (57.0%) |
| 45 to 54 Years | 22,106 (70.2%) | 13,860 (62.7%) |
| 55 to 59 Years | 10,297 (59.2%) | 6,704 (65.1%) |
| 60 to 64 Years | 8,098 (51.0%) | 3,288 (40.6%) |
| 65 to 74 Years | 5,220 (22.5%) | 7,868 (150.7%) |
| 75 Years and over | 973 (7.3%) | 702 (72.1%) |
| Total | 103,851 (51.5%) | 8,827 (8.5%) |
Employment Status by Educational Attainment in Area Code 725
According to labor force statistics for Area Code 725, 63.4% of individuals (86,900) out of the total population between 25 and 64 years of age (137,153) are in the labor force, with 54.3% or 47,187 of them being unemployed. The group with the highest labor force participation rate are those with the educational attainment of less than high school, with 77.1% or 21,685 individuals in the labor force. Within the labor force, individuals with college / associate degree education have the highest percentage of unemployment, with 80.4% or 23,680 of them being unemployed.
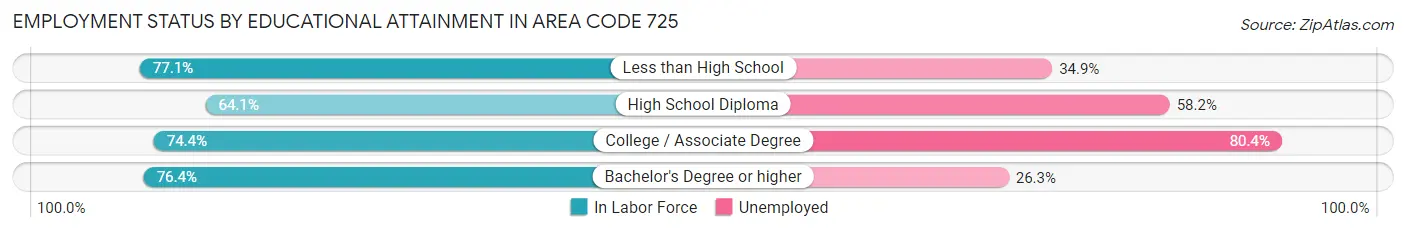
| Educational Attainment | In Labor Force | Unemployed |
| Less than High School | 21,686 (77.1%) | 9,812 (34.9%) |
| High School Diploma | 27,037 (64.1%) | 24,540 (58.2%) |
| College / Associate Degree | 29,452 (74.4%) | 31,837 (80.4%) |
| Bachelor's Degree or higher | 20,832 (76.4%) | 7,173 (26.3%) |
| Total | 86,900 (63.4%) | 74,474 (54.3%) |
Employment Occupations by Sex in Area Code 725
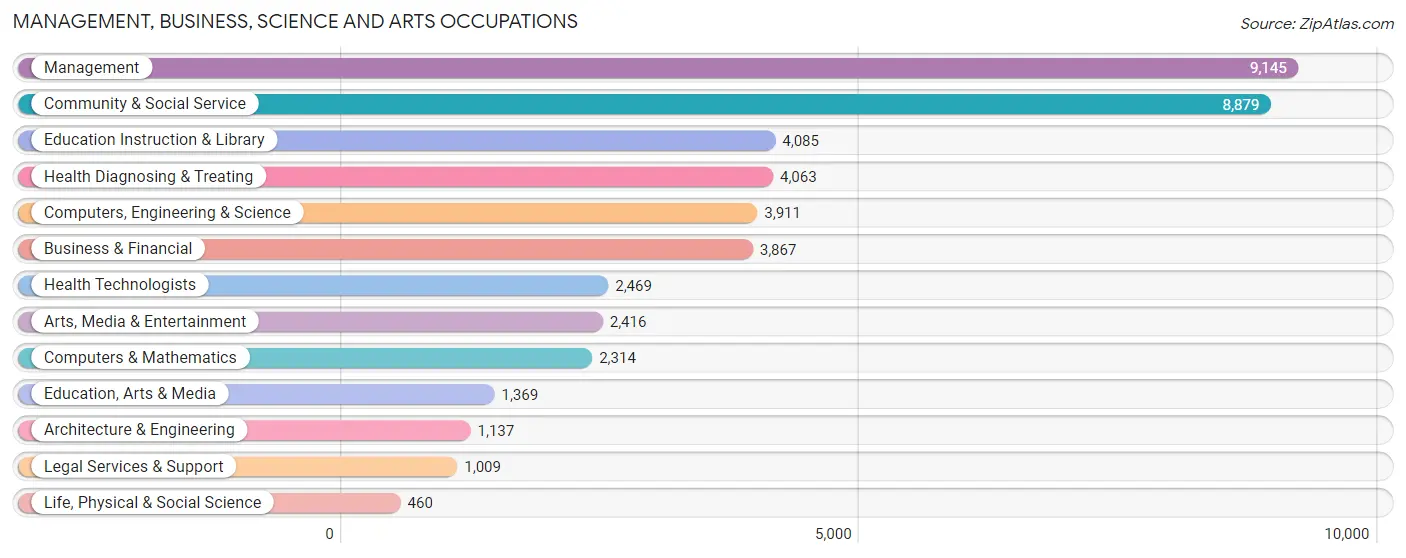
Management, Business, Science and Arts Occupations
The most common Management, Business, Science and Arts occupations in Area Code 725 are Management (9,145 | 8.0%), Community & Social Service (8,879 | 7.8%), Education Instruction & Library (4,085 | 3.6%), Health Diagnosing & Treating (4,063 | 3.6%), and Computers, Engineering & Science (3,911 | 3.4%).
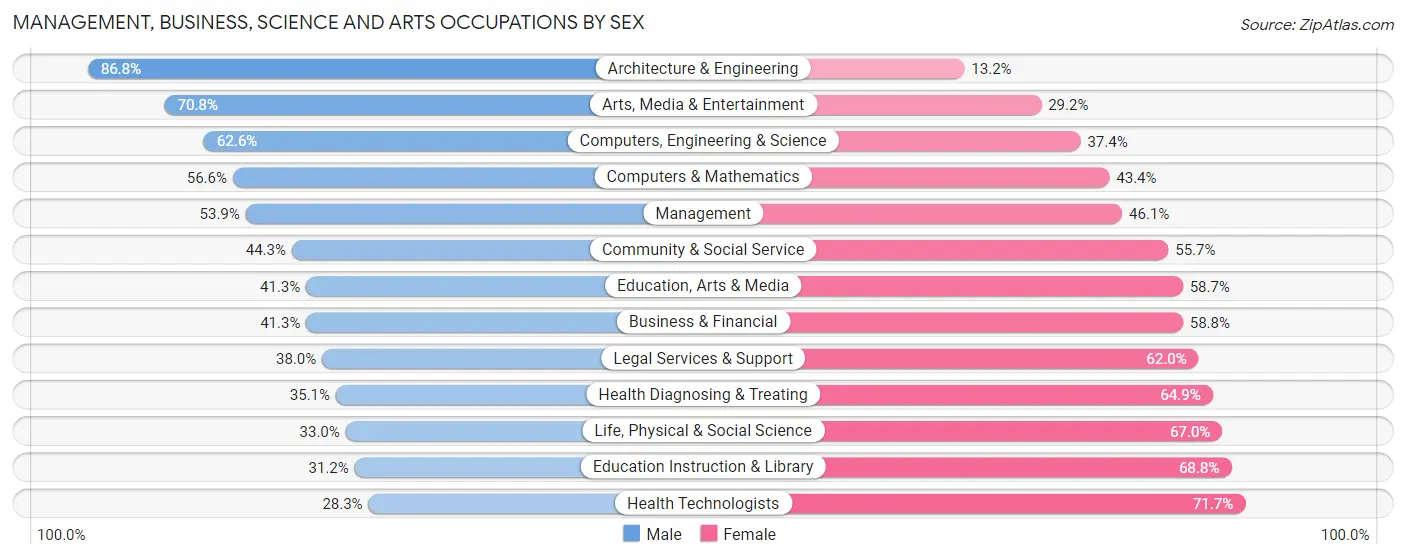
Management, Business, Science and Arts Occupations by Sex
Within the Management, Business, Science and Arts occupations in Area Code 725, the most male-oriented occupations are Architecture & Engineering (86.8%), Arts, Media & Entertainment (70.8%), and Computers, Engineering & Science (62.6%), while the most female-oriented occupations are Health Technologists (71.7%), Education Instruction & Library (68.8%), and Life, Physical & Social Science (67.0%).
| Occupation | Male | Female |
| Management | 4,929 (53.9%) | 4,216 (46.1%) |
| Business & Financial | 1,595 (41.2%) | 2,272 (58.8%) |
| Computers, Engineering & Science | 2,448 (62.6%) | 1,463 (37.4%) |
| Computers & Mathematics | 1,309 (56.6%) | 1,005 (43.4%) |
| Architecture & Engineering | 987 (86.8%) | 150 (13.2%) |
| Life, Physical & Social Science | 152 (33.0%) | 308 (67.0%) |
| Community & Social Service | 3,931 (44.3%) | 4,948 (55.7%) |
| Education, Arts & Media | 565 (41.3%) | 804 (58.7%) |
| Legal Services & Support | 383 (38.0%) | 626 (62.0%) |
| Education Instruction & Library | 1,273 (31.2%) | 2,812 (68.8%) |
| Arts, Media & Entertainment | 1,710 (70.8%) | 706 (29.2%) |
| Health Diagnosing & Treating | 1,425 (35.1%) | 2,638 (64.9%) |
| Health Technologists | 698 (28.3%) | 1,771 (71.7%) |
| Total (Category) | 14,328 (48.0%) | 15,537 (52.0%) |
| Total (Overall) | 63,449 (55.6%) | 50,605 (44.4%) |
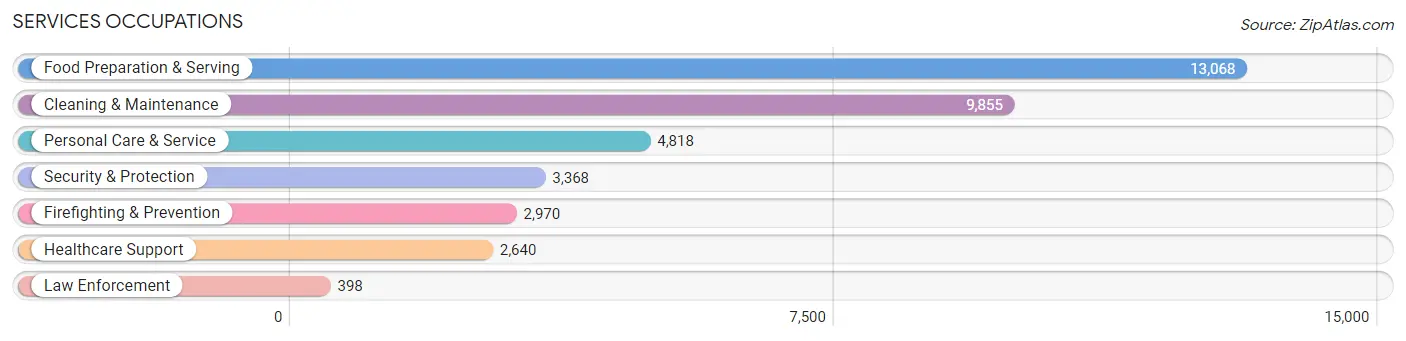
Services Occupations
The most common Services occupations in Area Code 725 are Food Preparation & Serving (13,068 | 11.5%), Cleaning & Maintenance (9,855 | 8.6%), Personal Care & Service (4,818 | 4.2%), Security & Protection (3,368 | 2.9%), and Firefighting & Prevention (2,970 | 2.6%).
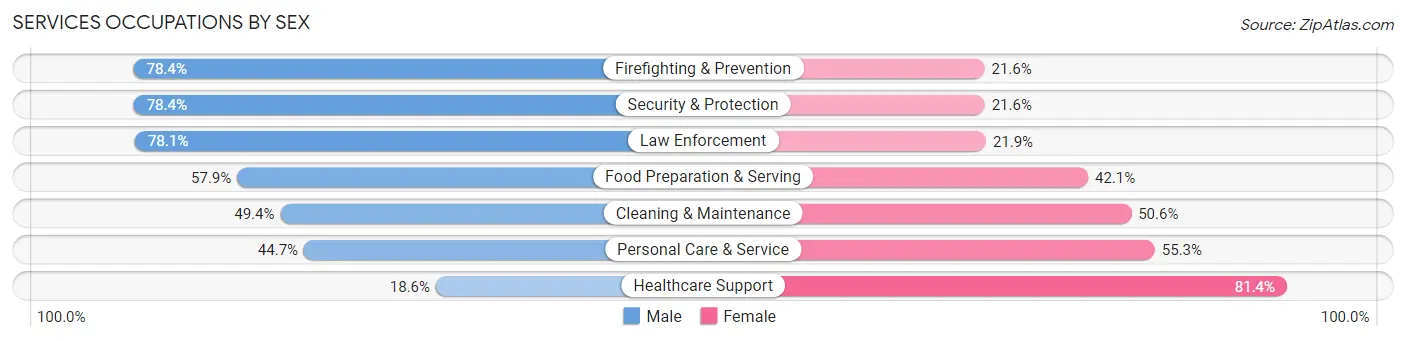
Services Occupations by Sex
Within the Services occupations in Area Code 725, the most male-oriented occupations are Firefighting & Prevention (78.4%), Security & Protection (78.4%), and Law Enforcement (78.1%), while the most female-oriented occupations are Healthcare Support (81.4%), Personal Care & Service (55.3%), and Cleaning & Maintenance (50.6%).
| Occupation | Male | Female |
| Healthcare Support | 490 (18.6%) | 2,150 (81.4%) |
| Security & Protection | 2,640 (78.4%) | 728 (21.6%) |
| Firefighting & Prevention | 2,329 (78.4%) | 641 (21.6%) |
| Law Enforcement | 311 (78.1%) | 87 (21.9%) |
| Food Preparation & Serving | 7,569 (57.9%) | 5,499 (42.1%) |
| Cleaning & Maintenance | 4,865 (49.4%) | 4,990 (50.6%) |
| Personal Care & Service | 2,153 (44.7%) | 2,665 (55.3%) |
| Total (Category) | 17,717 (52.5%) | 16,032 (47.5%) |
| Total (Overall) | 63,449 (55.6%) | 50,605 (44.4%) |
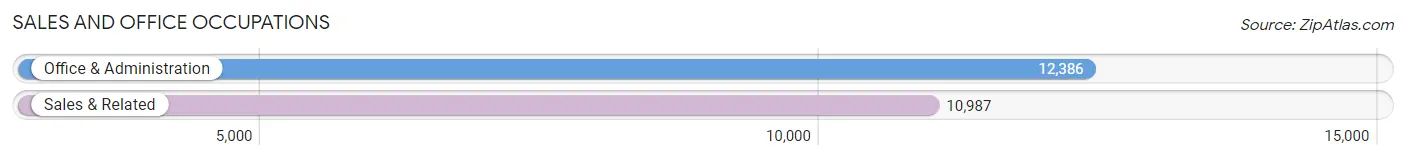
Sales and Office Occupations
The most common Sales and Office occupations in Area Code 725 are Office & Administration (12,386 | 10.9%), and Sales & Related (10,987 | 9.6%).
Sales and Office Occupations by Sex
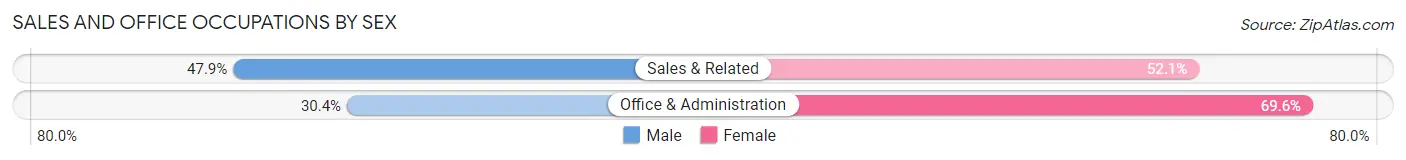
| Occupation | Male | Female |
| Sales & Related | 5,265 (47.9%) | 5,722 (52.1%) |
| Office & Administration | 3,766 (30.4%) | 8,620 (69.6%) |
| Total (Category) | 9,031 (38.6%) | 14,342 (61.4%) |
| Total (Overall) | 63,449 (55.6%) | 50,605 (44.4%) |
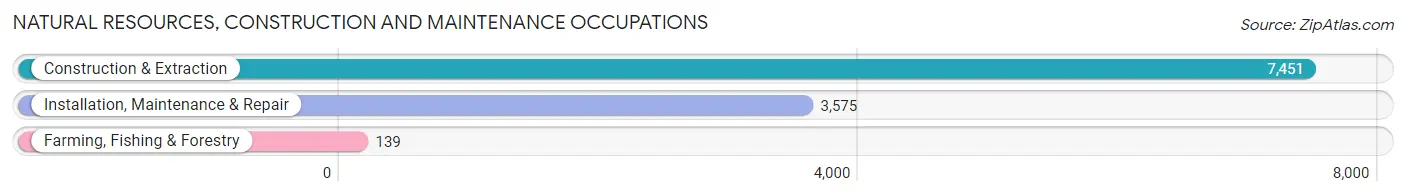
Natural Resources, Construction and Maintenance Occupations
The most common Natural Resources, Construction and Maintenance occupations in Area Code 725 are Construction & Extraction (7,451 | 6.5%), Installation, Maintenance & Repair (3,575 | 3.1%), and Farming, Fishing & Forestry (139 | 0.1%).
Natural Resources, Construction and Maintenance Occupations by Sex
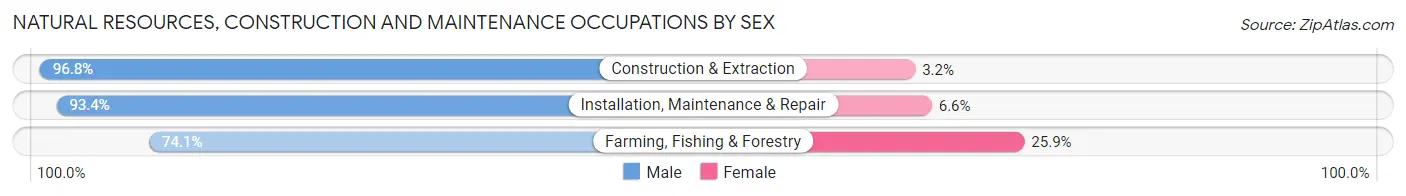
| Occupation | Male | Female |
| Farming, Fishing & Forestry | 103 (74.1%) | 36 (25.9%) |
| Construction & Extraction | 7,213 (96.8%) | 238 (3.2%) |
| Installation, Maintenance & Repair | 3,338 (93.4%) | 237 (6.6%) |
| Total (Category) | 10,654 (95.4%) | 511 (4.6%) |
| Total (Overall) | 63,449 (55.6%) | 50,605 (44.4%) |
Production, Transportation and Moving Occupations
The most common Production, Transportation and Moving occupations in Area Code 725 are Transportation (6,365 | 5.6%), Material Moving (5,354 | 4.7%), and Production (4,183 | 3.7%).
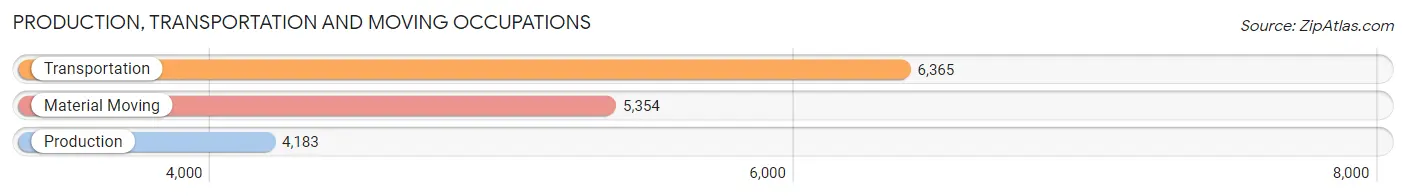
Production, Transportation and Moving Occupations by Sex
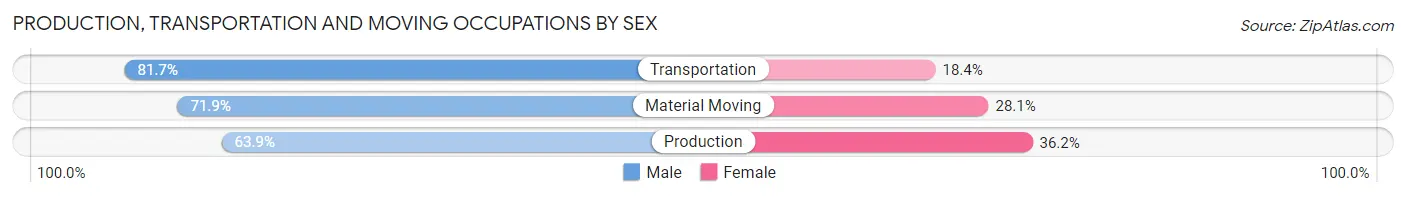
| Occupation | Male | Female |
| Production | 2,671 (63.8%) | 1,512 (36.1%) |
| Transportation | 5,197 (81.7%) | 1,168 (18.3%) |
| Material Moving | 3,851 (71.9%) | 1,503 (28.1%) |
| Total (Category) | 11,719 (73.7%) | 4,183 (26.3%) |
| Total (Overall) | 63,449 (55.6%) | 50,605 (44.4%) |
Employment Industries by Sex in Area Code 725
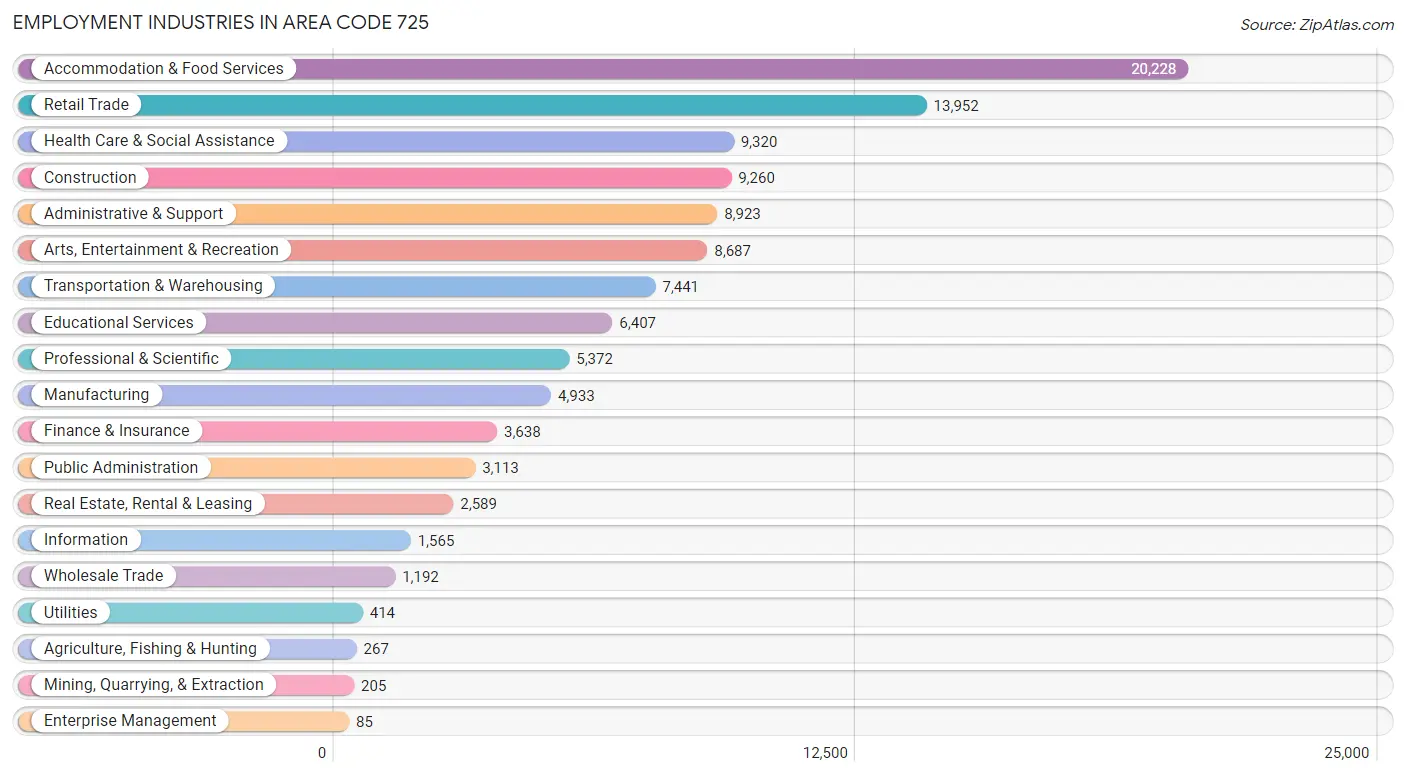
Employment Industries in Area Code 725
The major employment industries in Area Code 725 include Accommodation & Food Services (20,228 | 17.7%), Retail Trade (13,952 | 12.2%), Health Care & Social Assistance (9,320 | 8.2%), Construction (9,260 | 8.1%), and Administrative & Support (8,923 | 7.8%).
Employment Industries by Sex in Area Code 725
The Area Code 725 industries that see more men than women are Construction (91.9%), Utilities (87.4%), and Mining, Quarrying, & Extraction (86.8%), whereas the industries that tend to have a higher number of women are Enterprise Management (96.5%), Health Care & Social Assistance (73.7%), and Educational Services (66.5%).
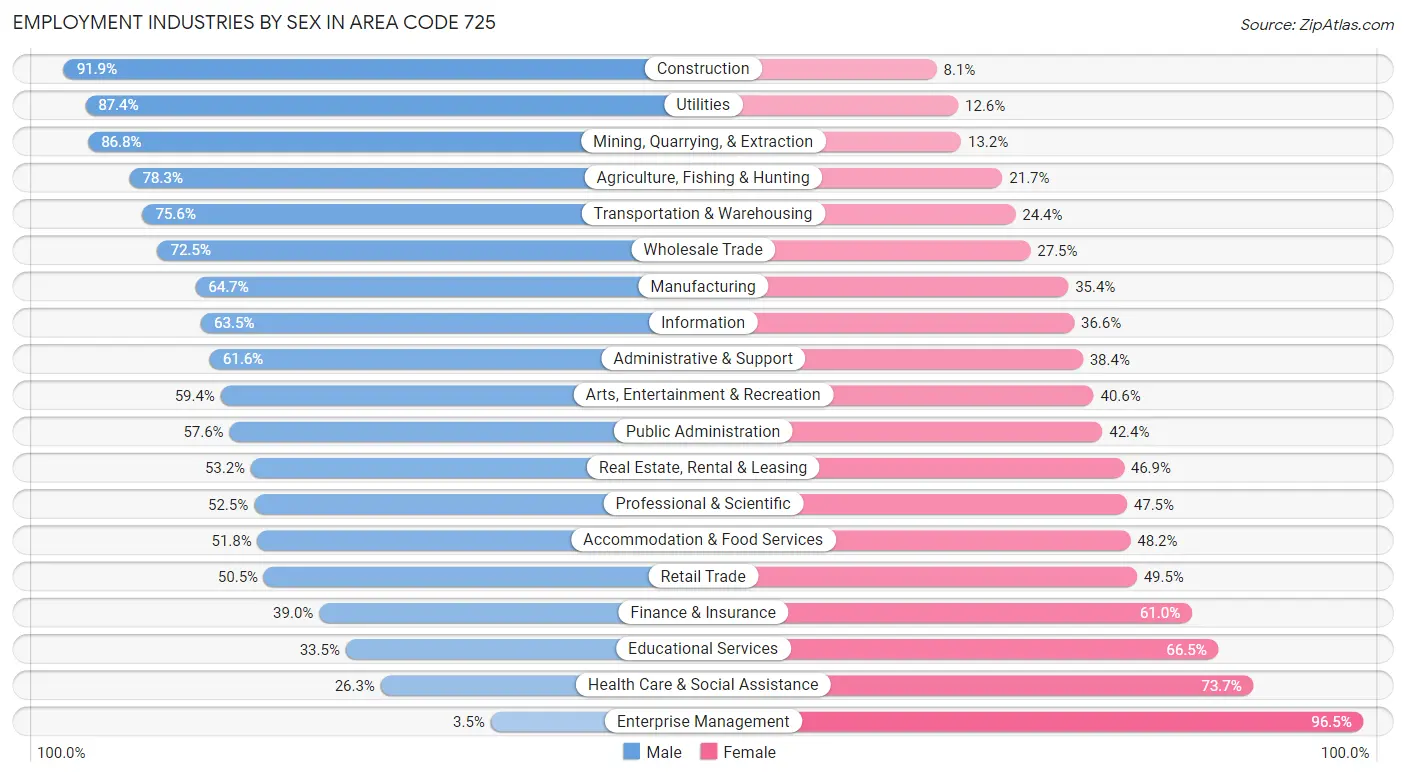
| Industry | Male | Female |
| Agriculture, Fishing & Hunting | 209 (78.3%) | 58 (21.7%) |
| Mining, Quarrying, & Extraction | 178 (86.8%) | 27 (13.2%) |
| Construction | 8,509 (91.9%) | 751 (8.1%) |
| Manufacturing | 3,189 (64.6%) | 1,744 (35.3%) |
| Wholesale Trade | 864 (72.5%) | 328 (27.5%) |
| Retail Trade | 7,041 (50.5%) | 6,911 (49.5%) |
| Transportation & Warehousing | 5,625 (75.6%) | 1,816 (24.4%) |
| Utilities | 362 (87.4%) | 52 (12.6%) |
| Information | 993 (63.4%) | 572 (36.5%) |
| Finance & Insurance | 1,420 (39.0%) | 2,218 (61.0%) |
| Real Estate, Rental & Leasing | 1,376 (53.1%) | 1,213 (46.9%) |
| Professional & Scientific | 2,821 (52.5%) | 2,551 (47.5%) |
| Enterprise Management | 3 (3.5%) | 82 (96.5%) |
| Administrative & Support | 5,500 (61.6%) | 3,423 (38.4%) |
| Educational Services | 2,148 (33.5%) | 4,259 (66.5%) |
| Health Care & Social Assistance | 2,450 (26.3%) | 6,870 (73.7%) |
| Arts, Entertainment & Recreation | 5,161 (59.4%) | 3,526 (40.6%) |
| Accommodation & Food Services | 10,475 (51.8%) | 9,753 (48.2%) |
| Public Administration | 1,793 (57.6%) | 1,320 (42.4%) |
| Total | 63,449 (55.6%) | 50,605 (44.4%) |
Education in Area Code 725
School Enrollment in Area Code 725
The most common levels of schooling among the 50,860 students in Area Code 725 are middle school (12,131 | 23.8%), high school (11,872 | 23.3%), and elementary school (11,620 | 22.9%).
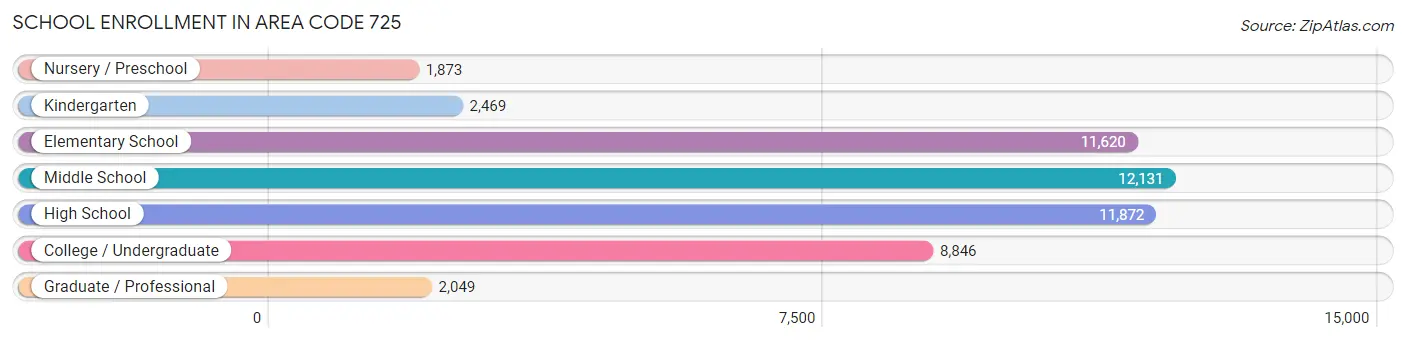
| School Level | # Students | % Students |
| Nursery / Preschool | 1,873 | 3.7% |
| Kindergarten | 2,469 | 4.9% |
| Elementary School | 11,620 | 22.9% |
| Middle School | 12,131 | 23.8% |
| High School | 11,872 | 23.3% |
| College / Undergraduate | 8,846 | 17.4% |
| Graduate / Professional | 2,049 | 4.0% |
| Total | 50,860 | 100.0% |
School Enrollment by Age by Funding Source in Area Code 725
Out of a total of 50,860 students who are enrolled in schools in Area Code 725, 5,884 (11.6%) attend a private institution, while the remaining 44,976 (88.4%) are enrolled in public schools. The age group of 35 years and over has the highest likelihood of being enrolled in private schools, with 1,120 (36.3% in the age bracket) enrolled. Conversely, the age group of 15 to 17 year olds has the lowest likelihood of being enrolled in a private school, with 7,431 (94.9% in the age bracket) attending a public institution.
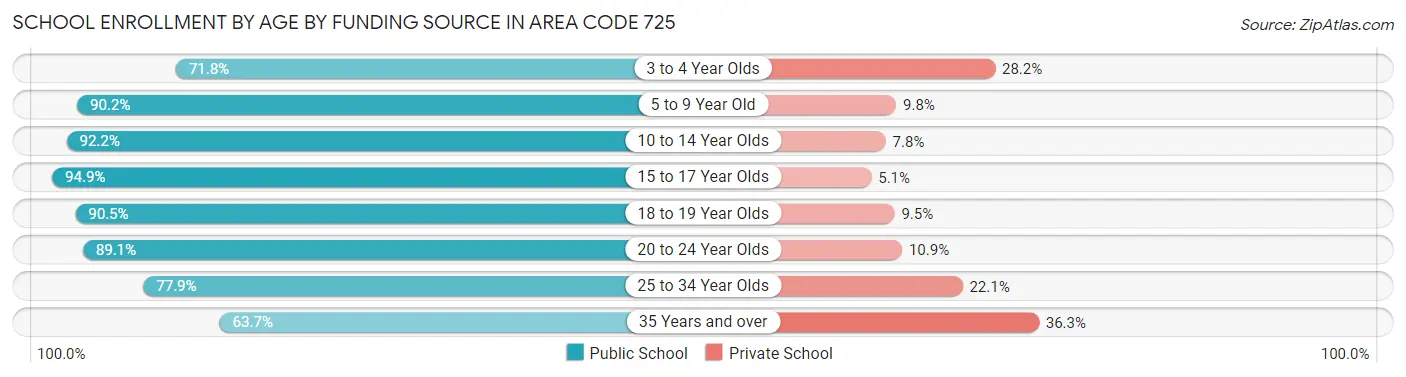
| Age Bracket | Public School | Private School |
| 3 to 4 Year Olds | 1,339 (71.8%) | 526 (28.2%) |
| 5 to 9 Year Old | 11,409 (90.2%) | 1,236 (9.8%) |
| 10 to 14 Year Olds | 14,259 (92.2%) | 1,209 (7.8%) |
| 15 to 17 Year Olds | 7,431 (94.9%) | 403 (5.1%) |
| 18 to 19 Year Olds | 2,901 (90.5%) | 303 (9.5%) |
| 20 to 24 Year Olds | 3,268 (89.1%) | 398 (10.9%) |
| 25 to 34 Year Olds | 2,411 (77.9%) | 685 (22.1%) |
| 35 Years and over | 1,962 (63.7%) | 1,120 (36.3%) |
| Total | 44,976 (88.4%) | 5,884 (11.6%) |
Educational Attainment by Field of Study in Area Code 725
Business (8,110 | 22.0%), education (3,293 | 8.9%), arts & humanities (3,173 | 8.6%), social sciences (3,033 | 8.2%), and science & technology (3,028 | 8.2%) are the most common fields of study among 36,903 individuals in Area Code 725 who have obtained a bachelor's degree or higher.
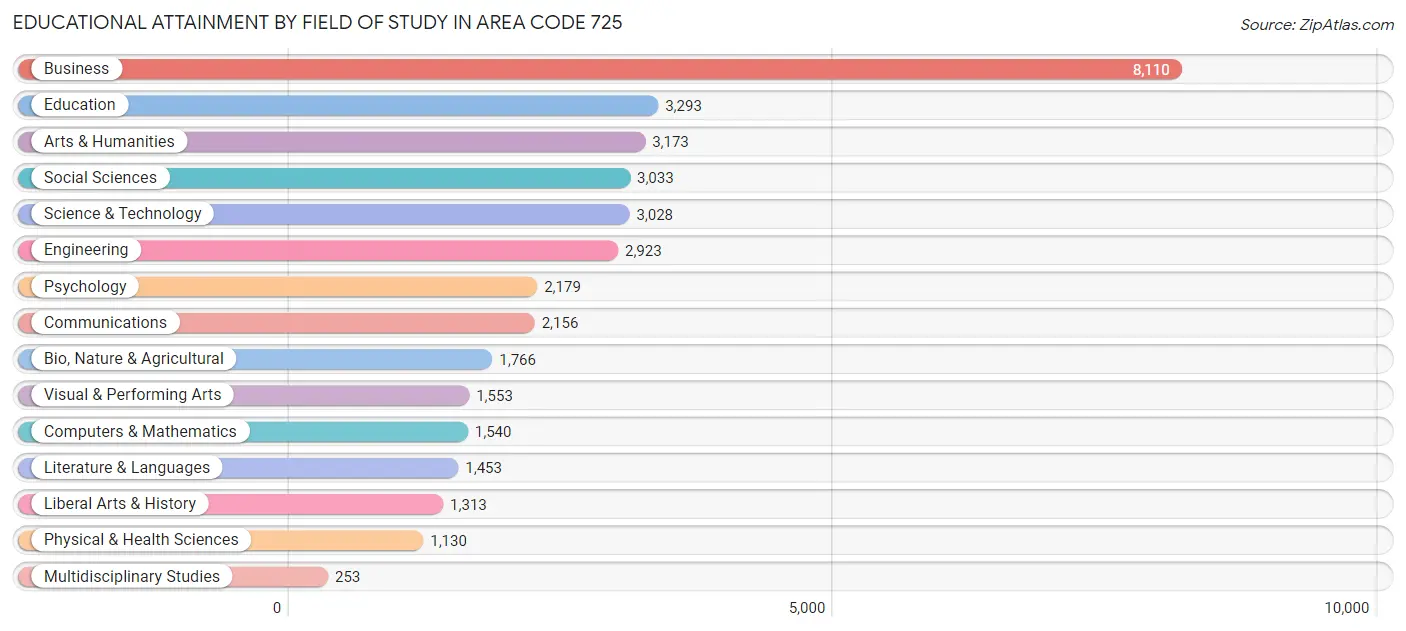
| Field of Study | # Graduates | % Graduates |
| Computers & Mathematics | 1,540 | 4.2% |
| Bio, Nature & Agricultural | 1,766 | 4.8% |
| Physical & Health Sciences | 1,130 | 3.1% |
| Psychology | 2,179 | 5.9% |
| Social Sciences | 3,033 | 8.2% |
| Engineering | 2,923 | 7.9% |
| Multidisciplinary Studies | 253 | 0.7% |
| Science & Technology | 3,028 | 8.2% |
| Business | 8,110 | 22.0% |
| Education | 3,293 | 8.9% |
| Literature & Languages | 1,453 | 3.9% |
| Liberal Arts & History | 1,313 | 3.6% |
| Visual & Performing Arts | 1,553 | 4.2% |
| Communications | 2,156 | 5.8% |
| Arts & Humanities | 3,173 | 8.6% |
| Total | 36,903 | 100.0% |
Transportation & Commute in Area Code 725
Vehicle Availability by Sex in Area Code 725
The most prevalent vehicle ownership categories in Area Code 725 are males with 2 vehicles (23,319, accounting for 37.8%) and females with 2 vehicles (18,150, making up 47.9%).
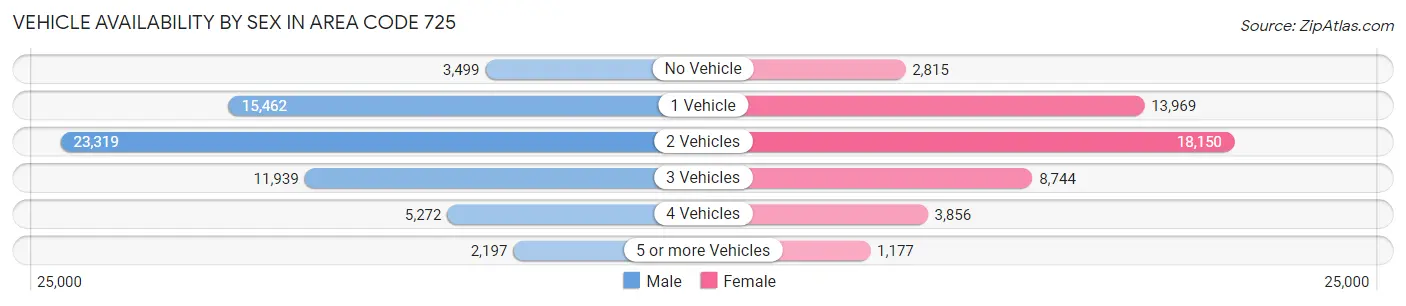
| Vehicles Available | Male | Female |
| No Vehicle | 3,499 (5.7%) | 2,815 (5.8%) |
| 1 Vehicle | 15,462 (25.1%) | 13,969 (28.7%) |
| 2 Vehicles | 23,319 (37.8%) | 18,150 (37.3%) |
| 3 Vehicles | 11,939 (19.4%) | 8,744 (17.9%) |
| 4 Vehicles | 5,272 (8.6%) | 3,856 (7.9%) |
| 5 or more Vehicles | 2,197 (3.6%) | 1,177 (2.4%) |
| Total | 61,688 (100.0%) | 48,711 (100.0%) |
Commute Time in Area Code 725
The most frequently occuring commute durations in Area Code 725 are 20 to 24 minutes (21,460 commuters, 20.9%), 30 to 34 minutes (19,576 commuters, 19.1%), and 15 to 19 minutes (17,615 commuters, 17.2%).
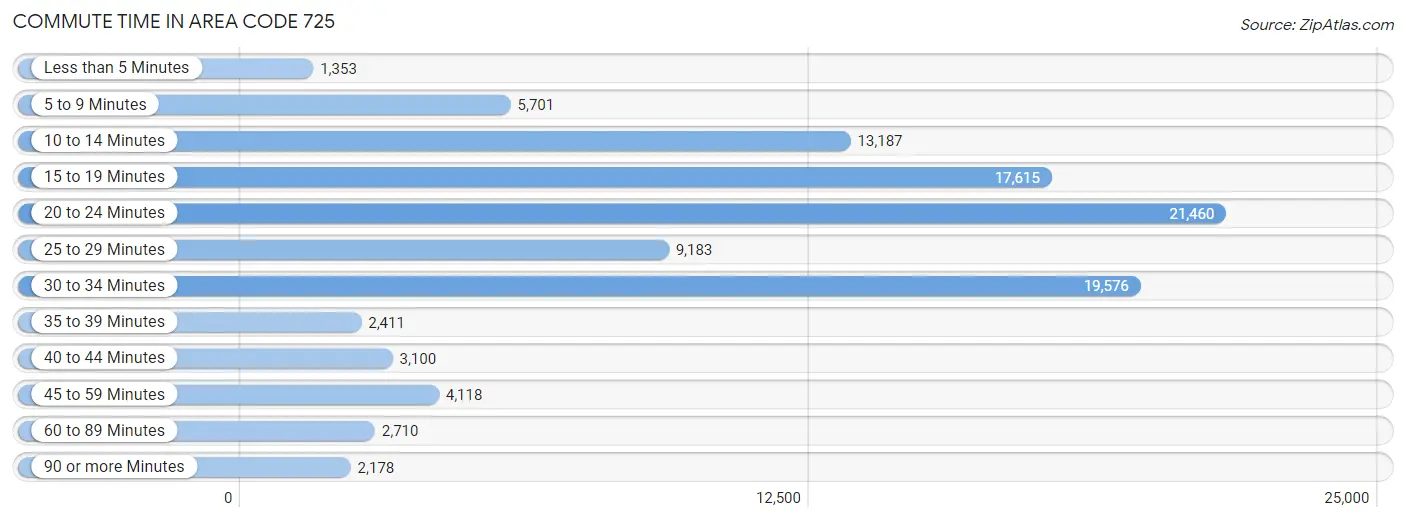
| Commute Time | # Commuters | % Commuters |
| Less than 5 Minutes | 1,353 | 1.3% |
| 5 to 9 Minutes | 5,701 | 5.6% |
| 10 to 14 Minutes | 13,187 | 12.9% |
| 15 to 19 Minutes | 17,615 | 17.2% |
| 20 to 24 Minutes | 21,460 | 20.9% |
| 25 to 29 Minutes | 9,183 | 8.9% |
| 30 to 34 Minutes | 19,576 | 19.1% |
| 35 to 39 Minutes | 2,411 | 2.4% |
| 40 to 44 Minutes | 3,100 | 3.0% |
| 45 to 59 Minutes | 4,118 | 4.0% |
| 60 to 89 Minutes | 2,710 | 2.6% |
| 90 or more Minutes | 2,178 | 2.1% |
Commute Time by Sex in Area Code 725
The most common commute times in Area Code 725 are 20 to 24 minutes (12,194 commuters, 21.0%) for males and 20 to 24 minutes (9,266 commuters, 20.8%) for females.
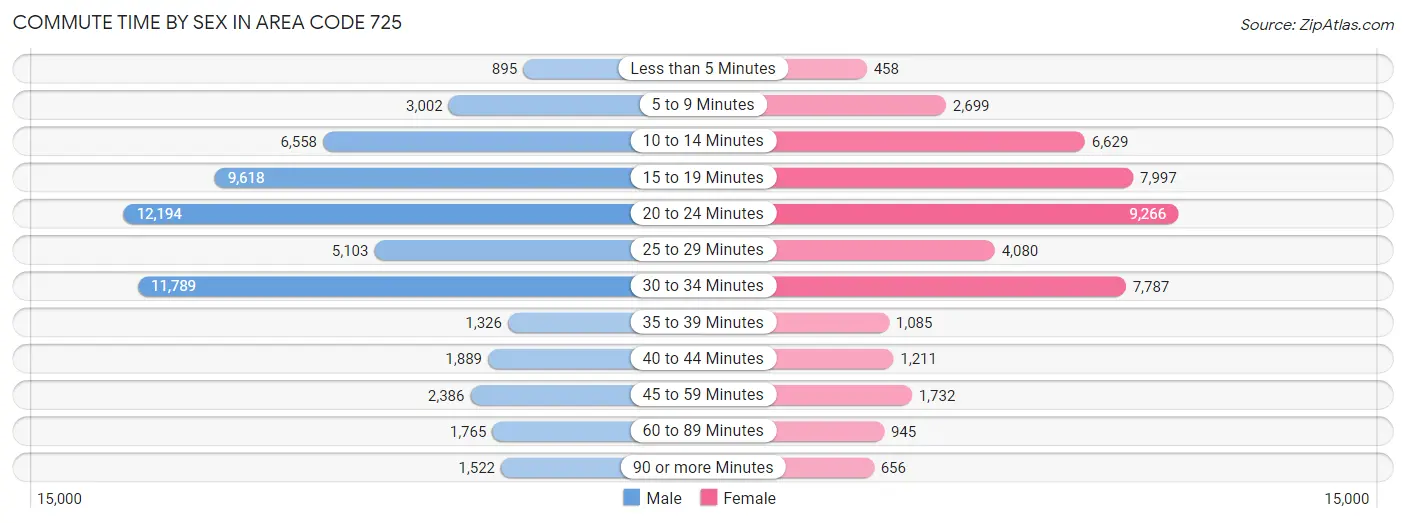
| Commute Time | Male | Female |
| Less than 5 Minutes | 895 (1.5%) | 458 (1.0%) |
| 5 to 9 Minutes | 3,002 (5.2%) | 2,699 (6.1%) |
| 10 to 14 Minutes | 6,558 (11.3%) | 6,629 (14.9%) |
| 15 to 19 Minutes | 9,618 (16.6%) | 7,997 (17.9%) |
| 20 to 24 Minutes | 12,194 (21.0%) | 9,266 (20.8%) |
| 25 to 29 Minutes | 5,103 (8.8%) | 4,080 (9.2%) |
| 30 to 34 Minutes | 11,789 (20.3%) | 7,787 (17.5%) |
| 35 to 39 Minutes | 1,326 (2.3%) | 1,085 (2.4%) |
| 40 to 44 Minutes | 1,889 (3.3%) | 1,211 (2.7%) |
| 45 to 59 Minutes | 2,386 (4.1%) | 1,732 (3.9%) |
| 60 to 89 Minutes | 1,765 (3.0%) | 945 (2.1%) |
| 90 or more Minutes | 1,522 (2.6%) | 656 (1.5%) |
Time of Departure to Work by Sex in Area Code 725
The most frequent times of departure to work in Area Code 725 are 4:00 PM to 11:59 PM (6,925, 11.9%) for males and 8:00 AM to 8:29 AM (5,635, 12.7%) for females.
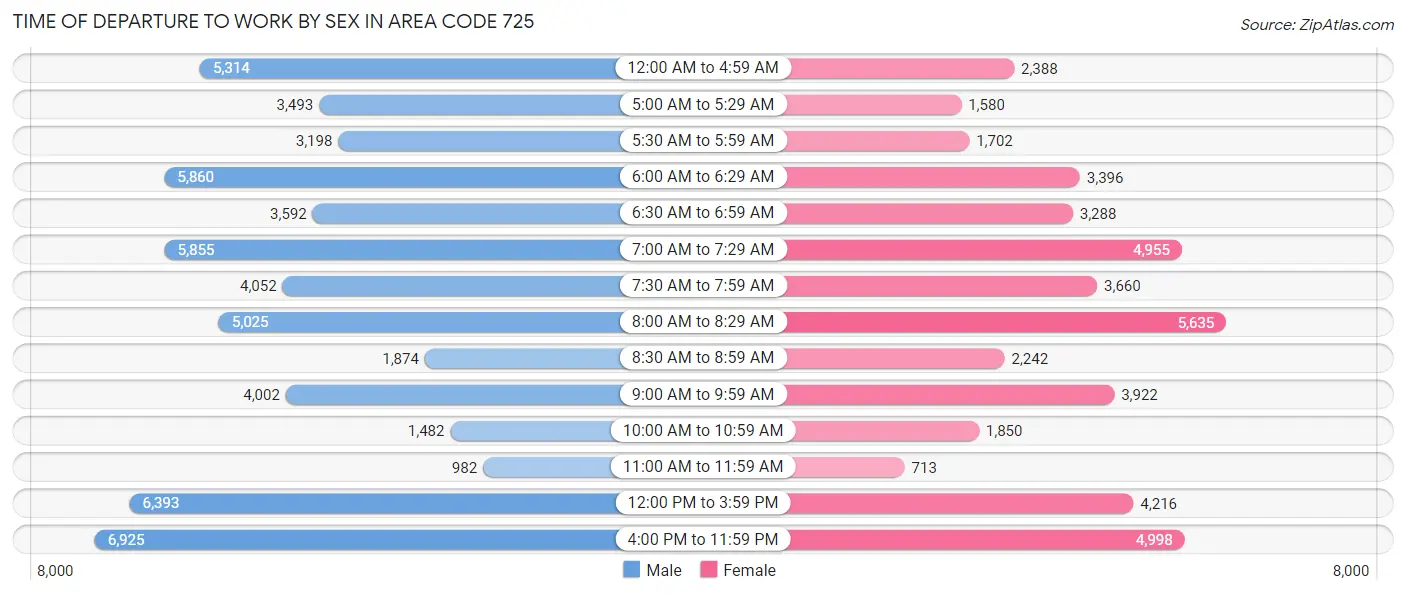
| Time of Departure | Male | Female |
| 12:00 AM to 4:59 AM | 5,314 (9.1%) | 2,388 (5.4%) |
| 5:00 AM to 5:29 AM | 3,493 (6.0%) | 1,580 (3.5%) |
| 5:30 AM to 5:59 AM | 3,198 (5.5%) | 1,702 (3.8%) |
| 6:00 AM to 6:29 AM | 5,860 (10.1%) | 3,396 (7.6%) |
| 6:30 AM to 6:59 AM | 3,592 (6.2%) | 3,288 (7.4%) |
| 7:00 AM to 7:29 AM | 5,855 (10.1%) | 4,955 (11.1%) |
| 7:30 AM to 7:59 AM | 4,052 (7.0%) | 3,660 (8.2%) |
| 8:00 AM to 8:29 AM | 5,025 (8.7%) | 5,635 (12.7%) |
| 8:30 AM to 8:59 AM | 1,874 (3.2%) | 2,242 (5.0%) |
| 9:00 AM to 9:59 AM | 4,002 (6.9%) | 3,922 (8.8%) |
| 10:00 AM to 10:59 AM | 1,482 (2.5%) | 1,850 (4.2%) |
| 11:00 AM to 11:59 AM | 982 (1.7%) | 713 (1.6%) |
| 12:00 PM to 3:59 PM | 6,393 (11.0%) | 4,216 (9.5%) |
| 4:00 PM to 11:59 PM | 6,925 (11.9%) | 4,998 (11.2%) |
| Total | 58,047 (100.0%) | 44,545 (100.0%) |
Housing Occupancy in Area Code 725
Occupancy by Ownership in Area Code 725
Of the total 93,852 dwellings in Area Code 725, owner-occupied units account for 43,252 (46.1%), while renter-occupied units make up 50,600 (53.9%).
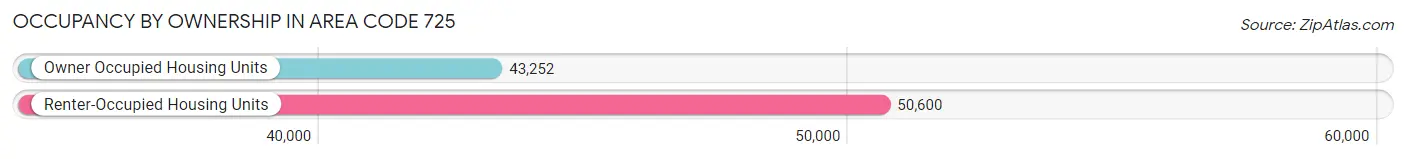
| Occupancy | # Housing Units | % Housing Units |
| Owner Occupied Housing Units | 43,252 | 46.1% |
| Renter-Occupied Housing Units | 50,600 | 53.9% |
| Total Occupied Housing Units | 93,852 | 100.0% |
Occupancy by Household Size in Area Code 725
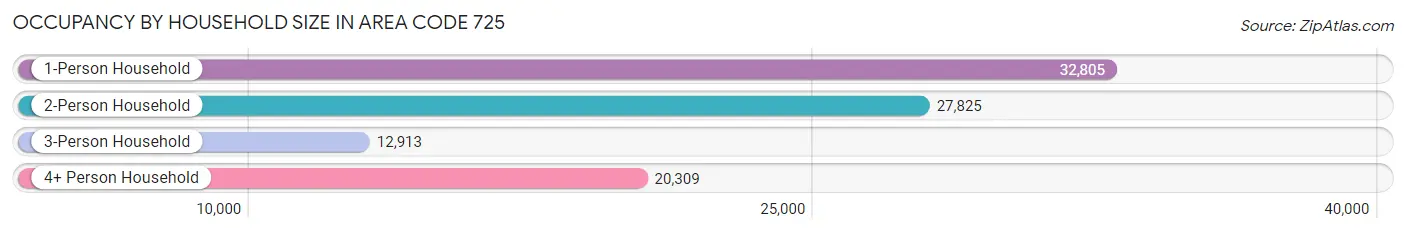
| Household Size | # Housing Units | % Housing Units |
| 1-Person Household | 32,805 | 34.9% |
| 2-Person Household | 27,825 | 29.6% |
| 3-Person Household | 12,913 | 13.8% |
| 4+ Person Household | 20,309 | 21.6% |
| Total Housing Units | 93,852 | 100.0% |
Occupancy by Ownership by Household Size in Area Code 725
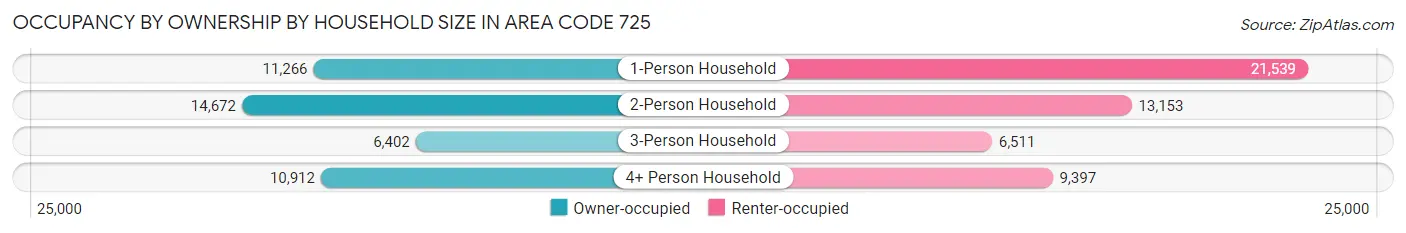
| Household Size | Owner-occupied | Renter-occupied |
| 1-Person Household | 11,266 (34.3%) | 21,539 (65.7%) |
| 2-Person Household | 14,672 (52.7%) | 13,153 (47.3%) |
| 3-Person Household | 6,402 (49.6%) | 6,511 (50.4%) |
| 4+ Person Household | 10,912 (53.7%) | 9,397 (46.3%) |
| Total Housing Units | 43,252 (46.1%) | 50,600 (53.9%) |
Occupancy by Educational Attainment in Area Code 725
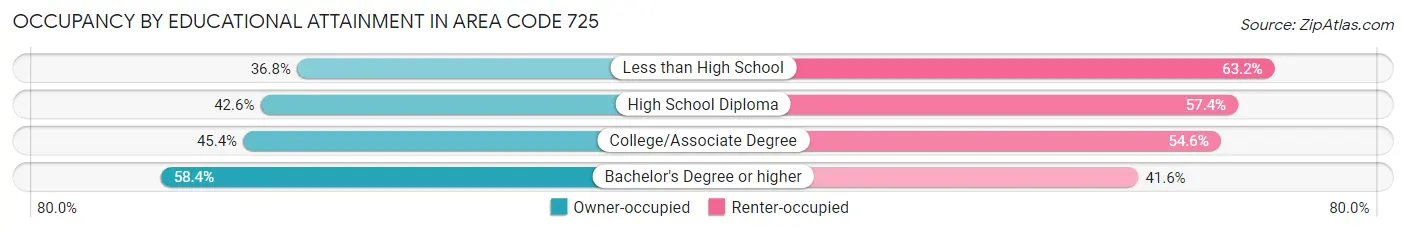
| Household Size | Owner-occupied | Renter-occupied |
| Less than High School | 5,947 (36.8%) | 10,195 (63.2%) |
| High School Diploma | 11,074 (42.6%) | 14,903 (57.4%) |
| College/Associate Degree | 13,864 (45.4%) | 16,694 (54.6%) |
| Bachelor's Degree or higher | 12,367 (58.4%) | 8,808 (41.6%) |
Occupancy by Age of Householder in Area Code 725
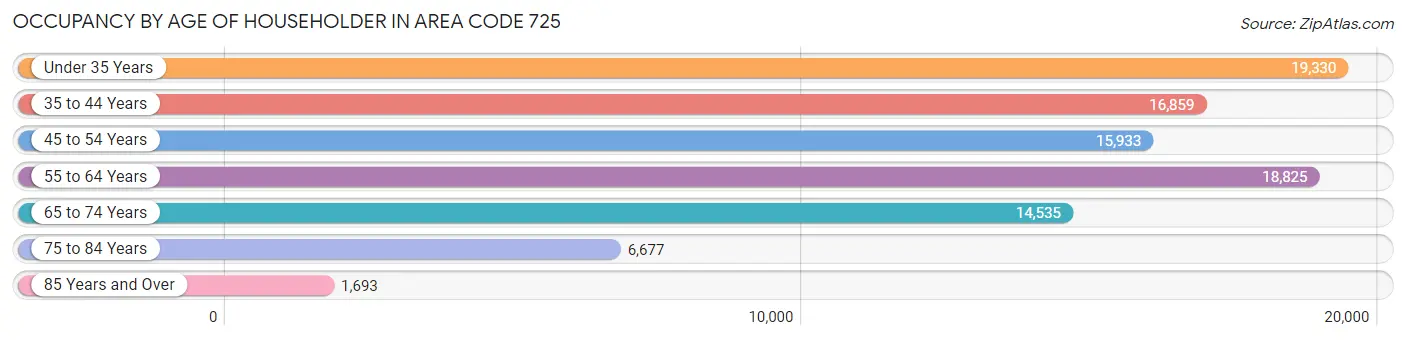
| Age Bracket | # Households | % Households |
| Under 35 Years | 19,330 | 20.6% |
| 35 to 44 Years | 16,859 | 18.0% |
| 45 to 54 Years | 15,933 | 17.0% |
| 55 to 64 Years | 18,825 | 20.1% |
| 65 to 74 Years | 14,535 | 15.5% |
| 75 to 84 Years | 6,677 | 7.1% |
| 85 Years and Over | 1,693 | 1.8% |
| Total | 93,852 | 100.0% |
Housing Finances in Area Code 725
Median Income by Occupancy in Area Code 725
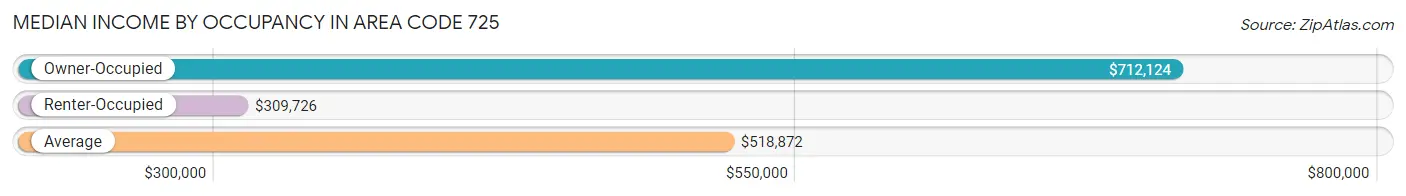
| Occupancy Type | # Households | Median Income |
| Owner-Occupied | 43,252 (46.1%) | $712,124 |
| Renter-Occupied | 50,600 (53.9%) | $309,726 |
| Average | 93,852 (100.0%) | $518,872 |
Occupancy by Householder Income Bracket in Area Code 725
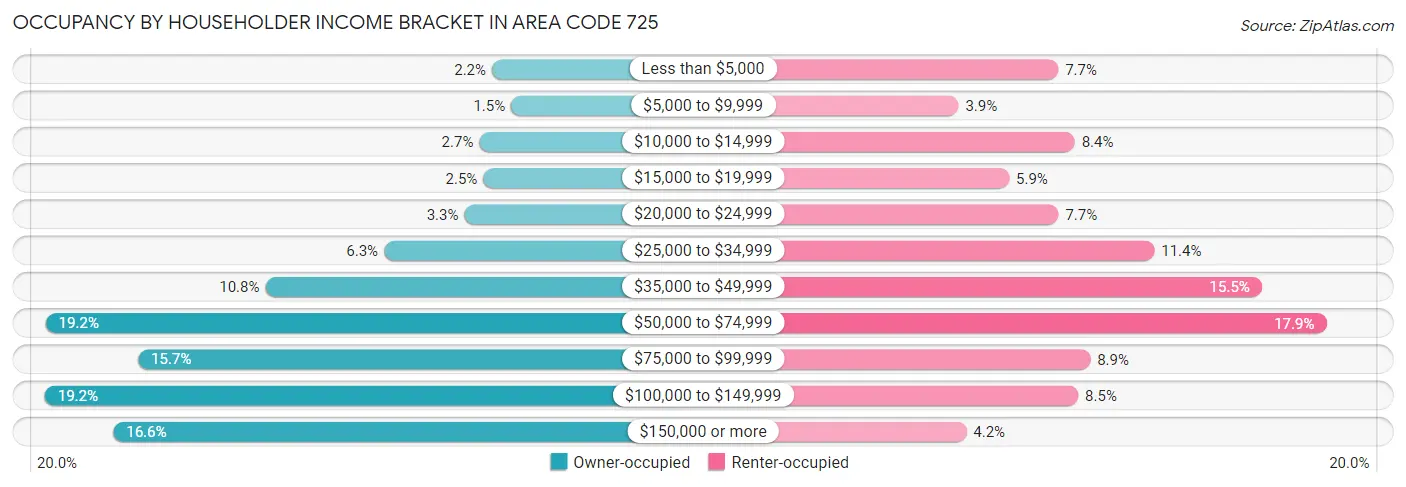
| Income Bracket | Owner-occupied | Renter-occupied |
| Less than $5,000 | 952 (2.2%) | 3,905 (7.7%) |
| $5,000 to $9,999 | 637 (1.5%) | 1,986 (3.9%) |
| $10,000 to $14,999 | 1,157 (2.7%) | 4,223 (8.4%) |
| $15,000 to $19,999 | 1,096 (2.5%) | 2,962 (5.9%) |
| $20,000 to $24,999 | 1,404 (3.3%) | 3,912 (7.7%) |
| $25,000 to $34,999 | 2,728 (6.3%) | 5,758 (11.4%) |
| $35,000 to $49,999 | 4,686 (10.8%) | 7,829 (15.5%) |
| $50,000 to $74,999 | 8,305 (19.2%) | 9,074 (17.9%) |
| $75,000 to $99,999 | 6,784 (15.7%) | 4,526 (8.9%) |
| $100,000 to $149,999 | 8,316 (19.2%) | 4,291 (8.5%) |
| $150,000 or more | 7,187 (16.6%) | 2,134 (4.2%) |
| Total | 43,252 (100.0%) | 50,600 (100.0%) |
Monthly Housing Cost Tiers in Area Code 725
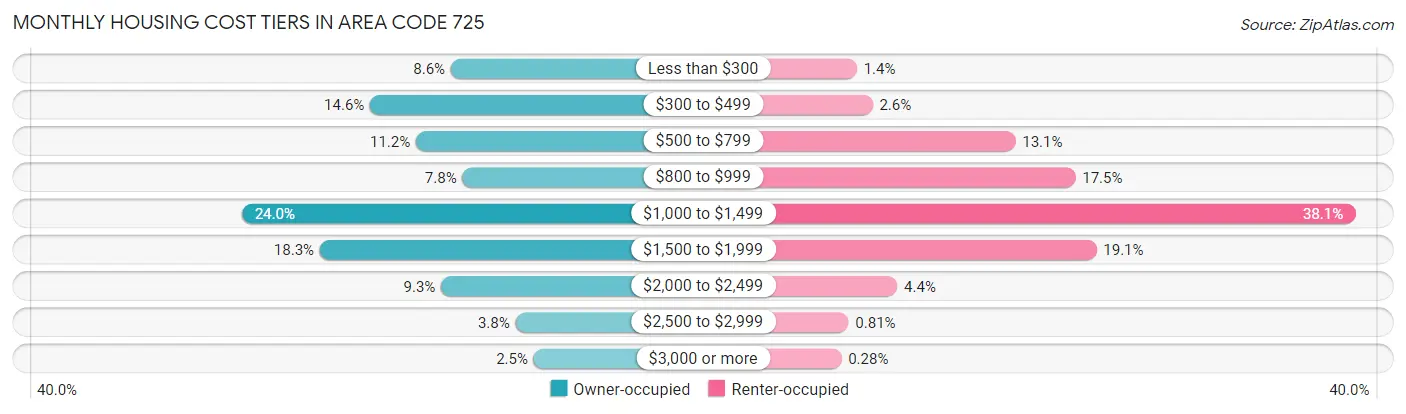
| Monthly Cost | Owner-occupied | Renter-occupied |
| Less than $300 | 3,721 (8.6%) | 716 (1.4%) |
| $300 to $499 | 6,294 (14.5%) | 1,308 (2.6%) |
| $500 to $799 | 4,833 (11.2%) | 6,629 (13.1%) |
| $800 to $999 | 3,351 (7.7%) | 8,867 (17.5%) |
| $1,000 to $1,499 | 10,386 (24.0%) | 19,290 (38.1%) |
| $1,500 to $1,999 | 7,895 (18.2%) | 9,648 (19.1%) |
| $2,000 to $2,499 | 4,030 (9.3%) | 2,227 (4.4%) |
| $2,500 to $2,999 | 1,659 (3.8%) | 412 (0.8%) |
| $3,000 or more | 1,083 (2.5%) | 144 (0.3%) |
| Total | 43,252 (100.0%) | 50,600 (100.0%) |
Physical Housing Characteristics in Area Code 725
Housing Structures in Area Code 725
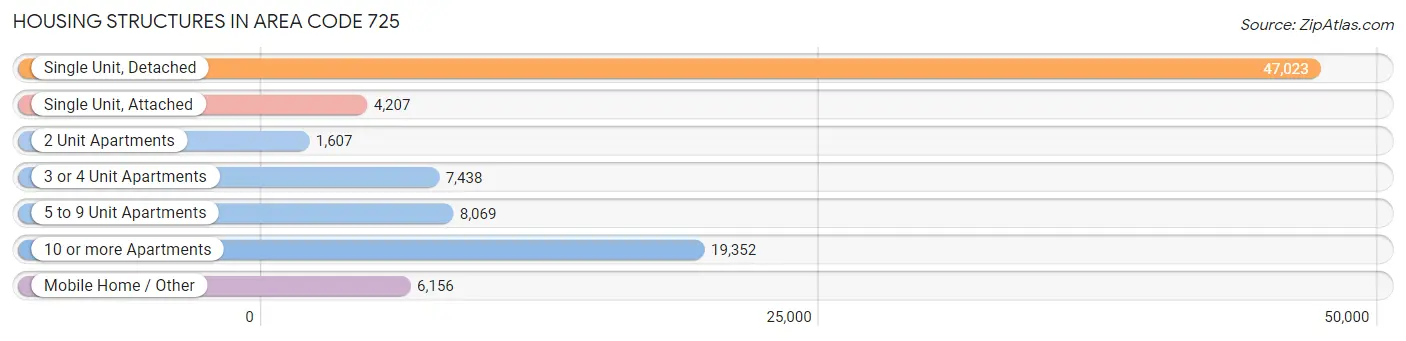
| Structure Type | # Housing Units | % Housing Units |
| Single Unit, Detached | 47,023 | 50.1% |
| Single Unit, Attached | 4,207 | 4.5% |
| 2 Unit Apartments | 1,607 | 1.7% |
| 3 or 4 Unit Apartments | 7,438 | 7.9% |
| 5 to 9 Unit Apartments | 8,069 | 8.6% |
| 10 or more Apartments | 19,352 | 20.6% |
| Mobile Home / Other | 6,156 | 6.6% |
| Total | 93,852 | 100.0% |
Housing Structures by Occupancy in Area Code 725
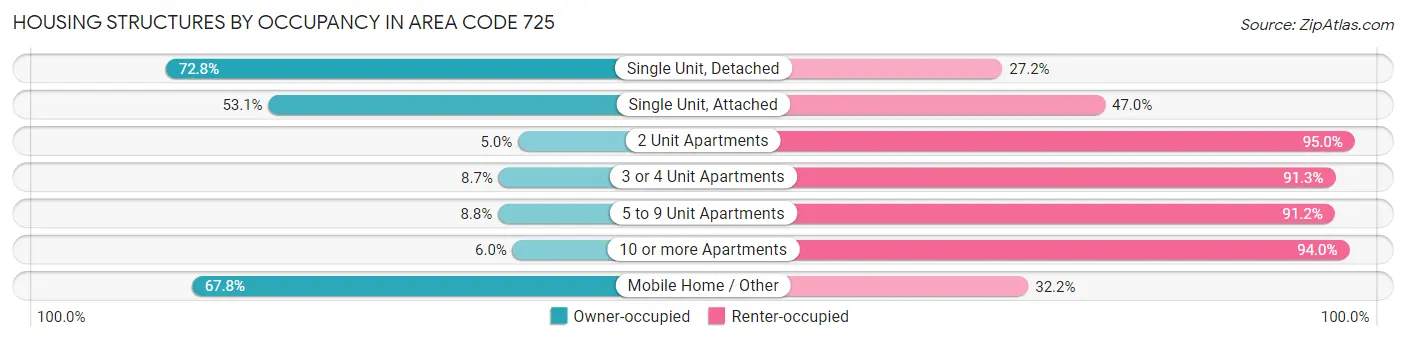
| Structure Type | Owner-occupied | Renter-occupied |
| Single Unit, Detached | 34,238 (72.8%) | 12,785 (27.2%) |
| Single Unit, Attached | 2,232 (53.0%) | 1,975 (46.9%) |
| 2 Unit Apartments | 80 (5.0%) | 1,527 (95.0%) |
| 3 or 4 Unit Apartments | 648 (8.7%) | 6,790 (91.3%) |
| 5 to 9 Unit Apartments | 713 (8.8%) | 7,356 (91.2%) |
| 10 or more Apartments | 1,166 (6.0%) | 18,186 (94.0%) |
| Mobile Home / Other | 4,175 (67.8%) | 1,981 (32.2%) |
| Total | 43,252 (46.1%) | 50,600 (53.9%) |
Housing Structures by Number of Rooms in Area Code 725
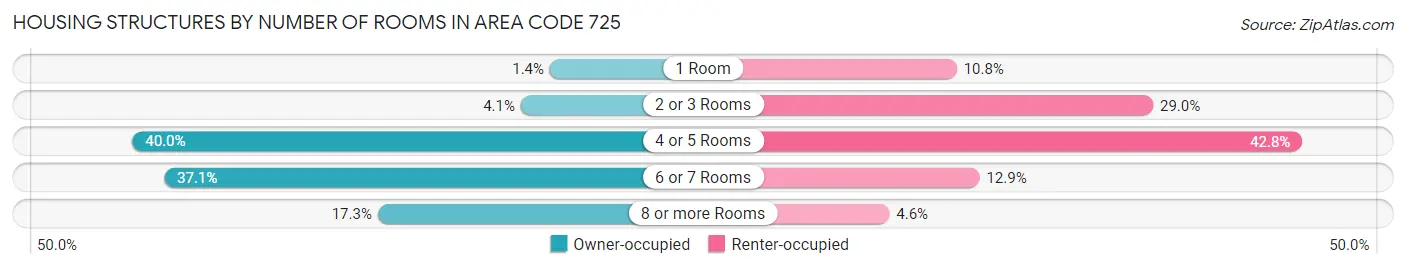
| Number of Rooms | Owner-occupied | Renter-occupied |
| 1 Room | 613 (1.4%) | 5,467 (10.8%) |
| 2 or 3 Rooms | 1,779 (4.1%) | 14,653 (29.0%) |
| 4 or 5 Rooms | 17,312 (40.0%) | 21,634 (42.7%) |
| 6 or 7 Rooms | 16,046 (37.1%) | 6,534 (12.9%) |
| 8 or more Rooms | 7,502 (17.3%) | 2,312 (4.6%) |
| Total | 43,252 (100.0%) | 50,600 (100.0%) |
Housing Structure by Heating Type in Area Code 725
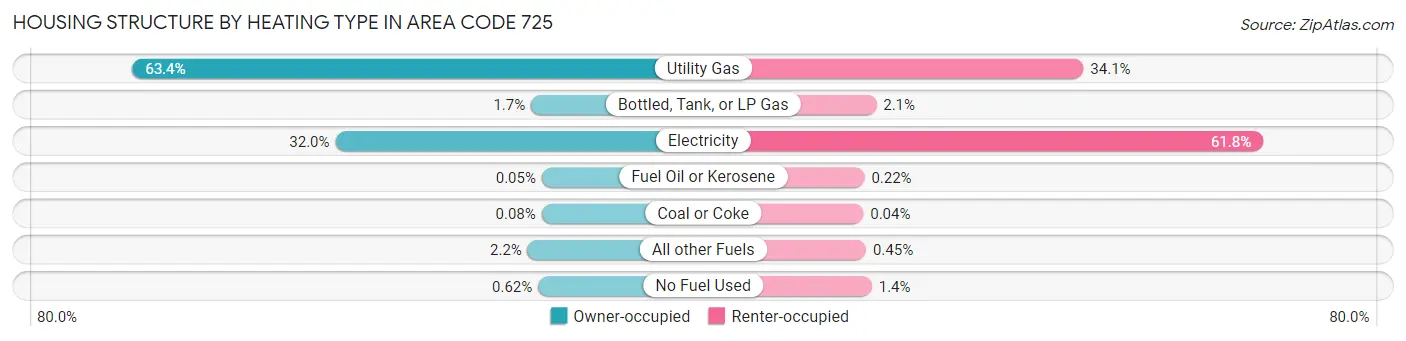
| Heating Type | Owner-occupied | Renter-occupied |
| Utility Gas | 27,399 (63.3%) | 17,237 (34.1%) |
| Bottled, Tank, or LP Gas | 740 (1.7%) | 1,035 (2.1%) |
| Electricity | 13,822 (32.0%) | 31,287 (61.8%) |
| Fuel Oil or Kerosene | 23 (0.1%) | 110 (0.2%) |
| Coal or Coke | 33 (0.1%) | 22 (0.0%) |
| All other Fuels | 965 (2.2%) | 228 (0.4%) |
| No Fuel Used | 270 (0.6%) | 681 (1.3%) |
| Total | 43,252 (100.0%) | 50,600 (100.0%) |
Household Vehicle Usage in Area Code 725
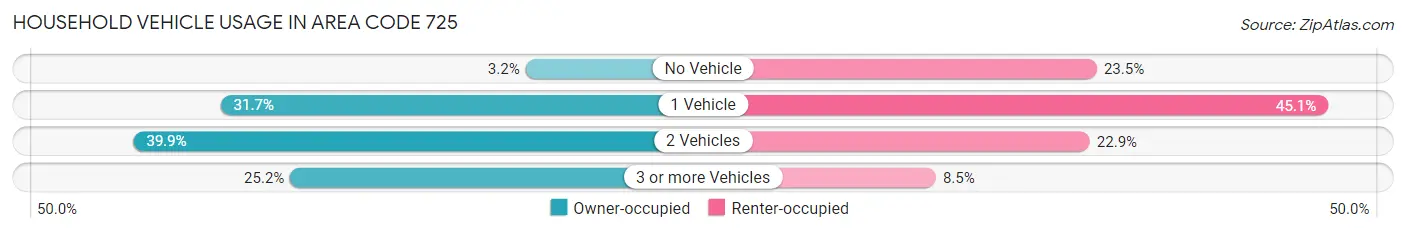
| Vehicles per Household | Owner-occupied | Renter-occupied |
| No Vehicle | 1,403 (3.2%) | 11,906 (23.5%) |
| 1 Vehicle | 13,711 (31.7%) | 22,821 (45.1%) |
| 2 Vehicles | 17,236 (39.9%) | 11,574 (22.9%) |
| 3 or more Vehicles | 10,902 (25.2%) | 4,299 (8.5%) |
| Total | 43,252 (100.0%) | 50,600 (100.0%) |
Real Estate & Mortgages in Area Code 725
Real Estate and Mortgage Overview in Area Code 725
| Characteristic | Without Mortgage | With Mortgage |
| Housing Units | 15,853 | 27,399 |
| Median Property Value | $2,246,800 | $2,734,200 |
| Median Household Income | $466,179 | $5,266 |
| Monthly Housing Costs | $3,721 | $1,045 |
| Real Estate Taxes | $11,105 | $1,155 |
Property Value by Mortgage Status in Area Code 725
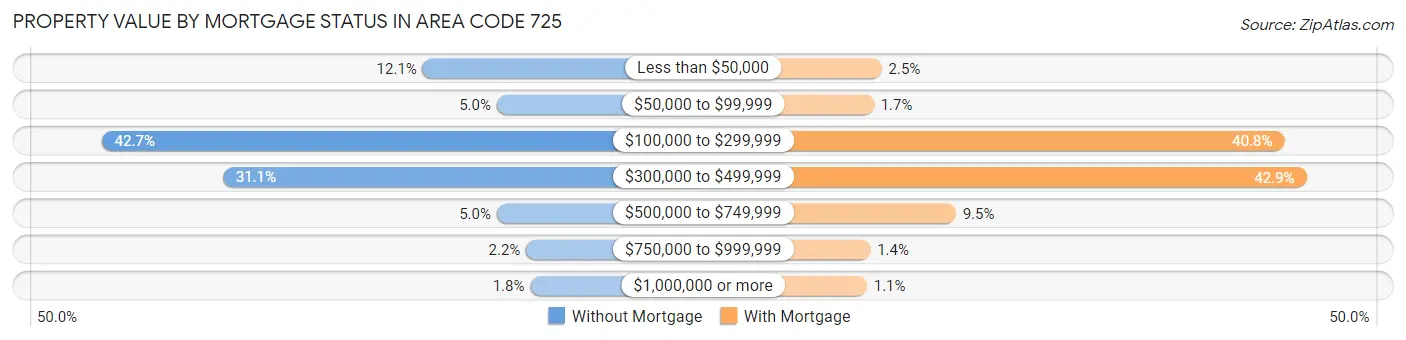
| Property Value | Without Mortgage | With Mortgage |
| Less than $50,000 | 1,917 (12.1%) | 680 (2.5%) |
| $50,000 to $99,999 | 797 (5.0%) | 475 (1.7%) |
| $100,000 to $299,999 | 6,763 (42.7%) | 11,187 (40.8%) |
| $300,000 to $499,999 | 4,933 (31.1%) | 11,765 (42.9%) |
| $500,000 to $749,999 | 797 (5.0%) | 2,615 (9.5%) |
| $750,000 to $999,999 | 354 (2.2%) | 384 (1.4%) |
| $1,000,000 or more | 292 (1.8%) | 293 (1.1%) |
| Total | 15,853 (100.0%) | 27,399 (100.0%) |
Household Income by Mortgage Status in Area Code 725
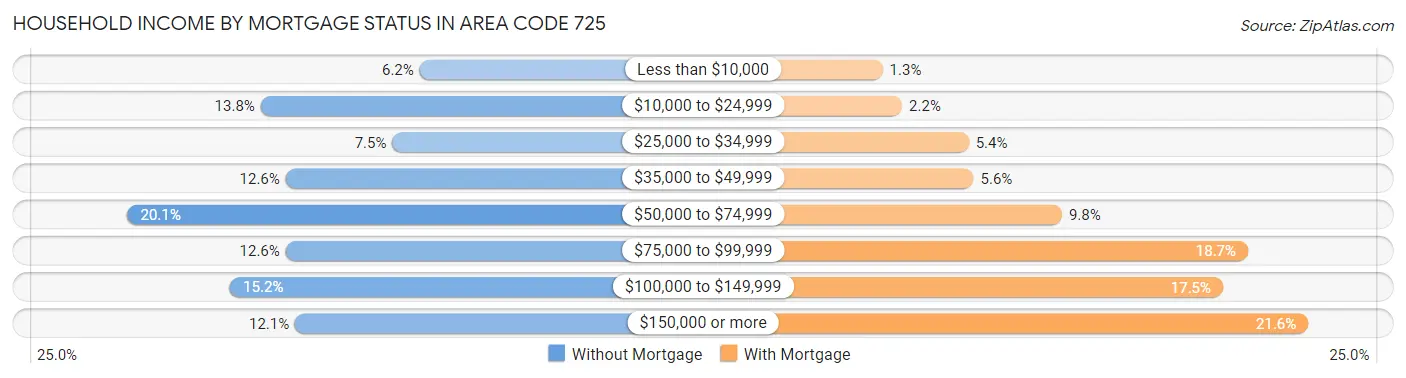
| Household Income | Without Mortgage | With Mortgage |
| Less than $10,000 | 981 (6.2%) | 353 (1.3%) |
| $10,000 to $24,999 | 2,181 (13.8%) | 608 (2.2%) |
| $25,000 to $34,999 | 1,188 (7.5%) | 1,476 (5.4%) |
| $35,000 to $49,999 | 1,993 (12.6%) | 1,540 (5.6%) |
| $50,000 to $74,999 | 3,186 (20.1%) | 2,693 (9.8%) |
| $75,000 to $99,999 | 1,992 (12.6%) | 5,119 (18.7%) |
| $100,000 to $149,999 | 2,411 (15.2%) | 4,792 (17.5%) |
| $150,000 or more | 1,921 (12.1%) | 5,905 (21.5%) |
| Total | 15,853 (100.0%) | 27,399 (100.0%) |
Property Value to Household Income Ratio in Area Code 725
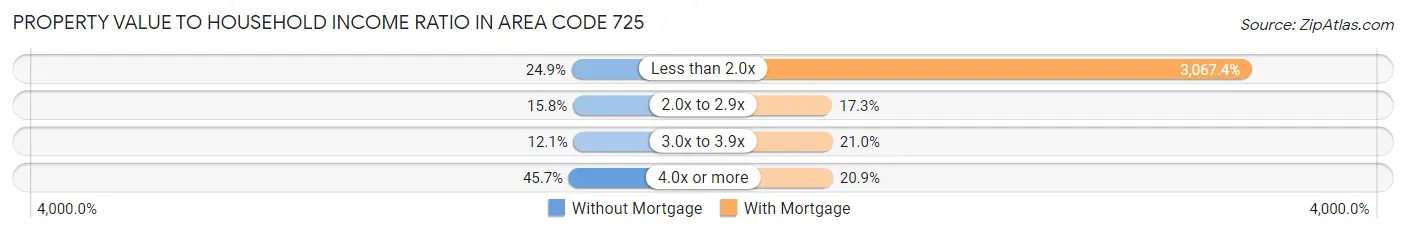
| Value-to-Income Ratio | Without Mortgage | With Mortgage |
| Less than 2.0x | 3,939 (24.8%) | 840,442 (3,067.4%) |
| 2.0x to 2.9x | 2,508 (15.8%) | 4,725 (17.2%) |
| 3.0x to 3.9x | 1,916 (12.1%) | 5,753 (21.0%) |
| 4.0x or more | 7,241 (45.7%) | 5,718 (20.9%) |
| Total | 15,853 (100.0%) | 27,399 (100.0%) |
Real Estate Taxes by Mortgage Status in Area Code 725
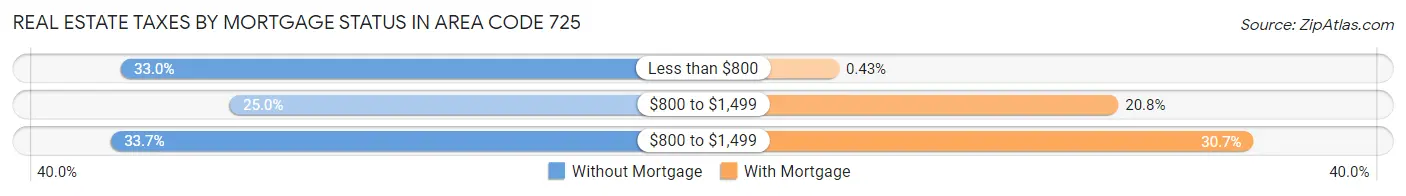
| Property Taxes | Without Mortgage | With Mortgage |
| Less than $800 | 5,223 (33.0%) | 119 (0.4%) |
| $800 to $1,499 | 3,961 (25.0%) | 5,710 (20.8%) |
| $800 to $1,499 | 5,338 (33.7%) | 8,414 (30.7%) |
| Total | 15,853 (100.0%) | 27,399 (100.0%) |
Health & Disability in Area Code 725
Health Insurance Coverage by Age in Area Code 725
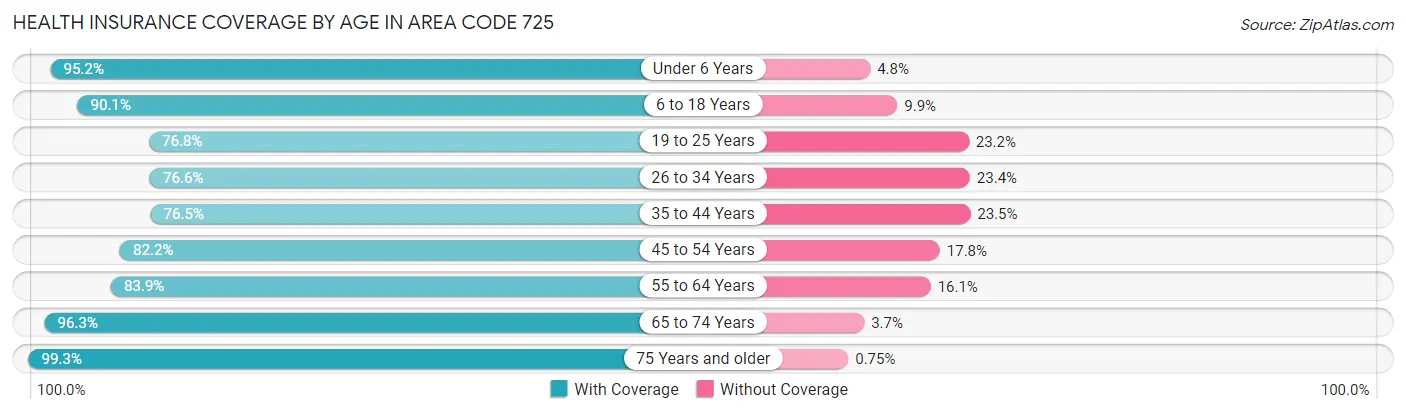
| Age Bracket | With Coverage | Without Coverage |
| Under 6 Years | 16,188 (95.2%) | 823 (4.8%) |
| 6 to 18 Years | 34,877 (90.1%) | 3,826 (9.9%) |
| 19 to 25 Years | 16,969 (76.8%) | 5,133 (23.2%) |
| 26 to 34 Years | 25,230 (76.6%) | 7,716 (23.4%) |
| 35 to 44 Years | 25,675 (76.5%) | 7,885 (23.5%) |
| 45 to 54 Years | 25,453 (82.2%) | 5,521 (17.8%) |
| 55 to 64 Years | 27,685 (83.9%) | 5,317 (16.1%) |
| 65 to 74 Years | 22,261 (96.3%) | 859 (3.7%) |
| 75 Years and older | 13,196 (99.3%) | 100 (0.7%) |
| Total | 207,534 (84.8%) | 37,180 (15.2%) |
Health Insurance Coverage by Citizenship Status in Area Code 725
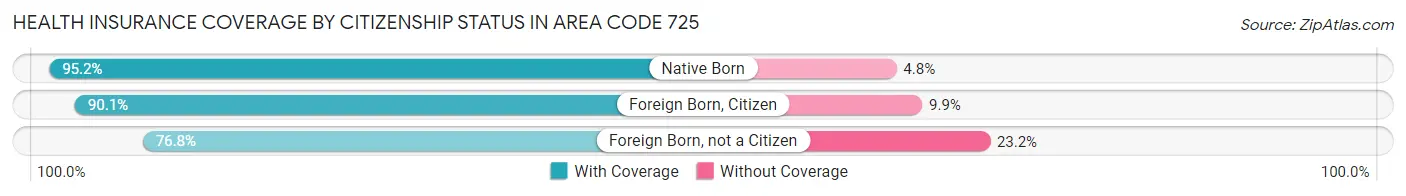
| Citizenship Status | With Coverage | Without Coverage |
| Native Born | 16,188 (95.2%) | 823 (4.8%) |
| Foreign Born, Citizen | 34,877 (90.1%) | 3,826 (9.9%) |
| Foreign Born, not a Citizen | 16,969 (76.8%) | 5,133 (23.2%) |
Health Insurance Coverage by Household Income in Area Code 725
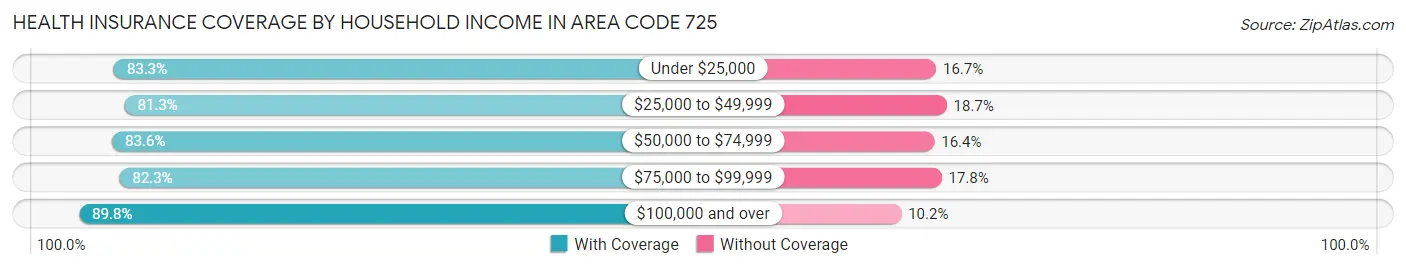
| Household Income | With Coverage | Without Coverage |
| Under $25,000 | 31,790 (83.3%) | 6,385 (16.7%) |
| $25,000 to $49,999 | 40,084 (81.3%) | 9,227 (18.7%) |
| $50,000 to $74,999 | 39,193 (83.6%) | 7,683 (16.4%) |
| $75,000 to $99,999 | 28,417 (82.3%) | 6,133 (17.7%) |
| $100,000 and over | 66,610 (89.8%) | 7,562 (10.2%) |
Public vs Private Health Insurance Coverage by Age in Area Code 725
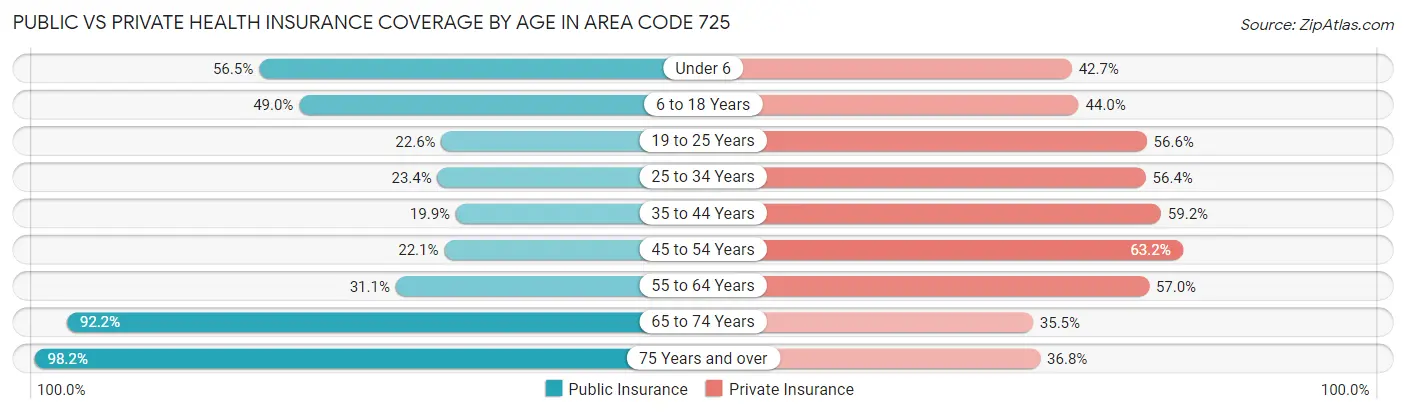
| Age Bracket | Public Insurance | Private Insurance |
| Under 6 | 9,612 (56.5%) | 7,259 (42.7%) |
| 6 to 18 Years | 18,978 (49.0%) | 17,015 (44.0%) |
| 19 to 25 Years | 5,002 (22.6%) | 12,507 (56.6%) |
| 25 to 34 Years | 7,694 (23.4%) | 18,581 (56.4%) |
| 35 to 44 Years | 6,691 (19.9%) | 19,879 (59.2%) |
| 45 to 54 Years | 6,845 (22.1%) | 19,585 (63.2%) |
| 55 to 64 Years | 10,266 (31.1%) | 18,813 (57.0%) |
| 65 to 74 Years | 21,304 (92.1%) | 8,198 (35.5%) |
| 75 Years and over | 13,050 (98.2%) | 4,895 (36.8%) |
| Total | 99,442 (40.6%) | 126,732 (51.8%) |
Disability Status by Sex by Age in Area Code 725
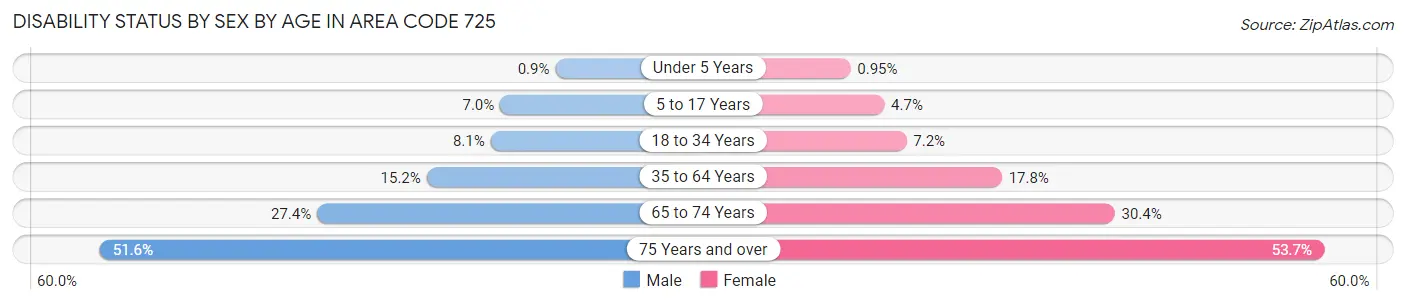
| Age Bracket | Male | Female |
| Under 5 Years | 66 (0.9%) | 69 (0.9%) |
| 5 to 17 Years | 1,416 (7.0%) | 852 (4.7%) |
| 18 to 34 Years | 2,489 (8.1%) | 1,964 (7.2%) |
| 35 to 64 Years | 7,717 (15.2%) | 8,349 (17.8%) |
| 65 to 74 Years | 3,098 (27.4%) | 3,593 (30.4%) |
| 75 Years and over | 3,013 (51.6%) | 4,004 (53.7%) |
Disability Class by Sex by Age in Area Code 725
Disability Class: Hearing Difficulty
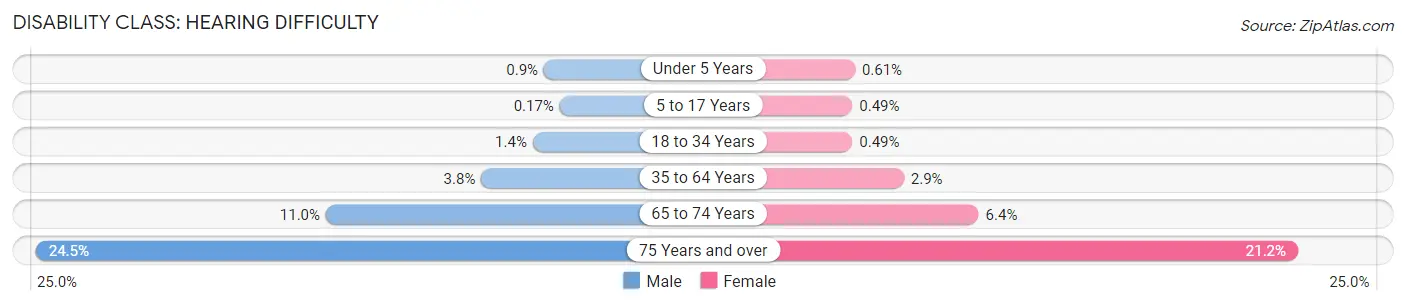
| Age Bracket | Male | Female |
| Under 5 Years | 66 (0.9%) | 44 (0.6%) |
| 5 to 17 Years | 34 (0.2%) | 89 (0.5%) |
| 18 to 34 Years | 435 (1.4%) | 134 (0.5%) |
| 35 to 64 Years | 1,929 (3.8%) | 1,350 (2.9%) |
| 65 to 74 Years | 1,245 (11.0%) | 751 (6.4%) |
| 75 Years and over | 1,429 (24.5%) | 1,578 (21.2%) |
Disability Class: Vision Difficulty
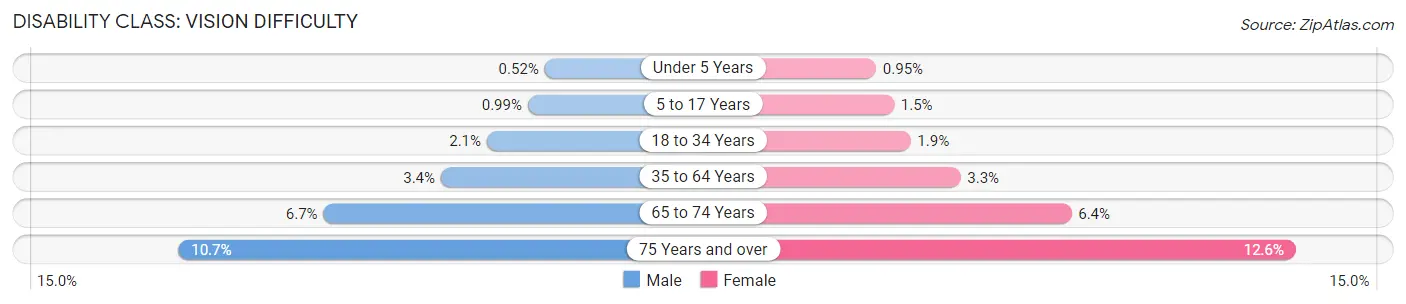
| Age Bracket | Male | Female |
| Under 5 Years | 38 (0.5%) | 69 (0.9%) |
| 5 to 17 Years | 199 (1.0%) | 261 (1.5%) |
| 18 to 34 Years | 653 (2.1%) | 522 (1.9%) |
| 35 to 64 Years | 1,730 (3.4%) | 1,549 (3.3%) |
| 65 to 74 Years | 755 (6.7%) | 756 (6.4%) |
| 75 Years and over | 626 (10.7%) | 943 (12.6%) |
Disability Class: Cognitive Difficulty
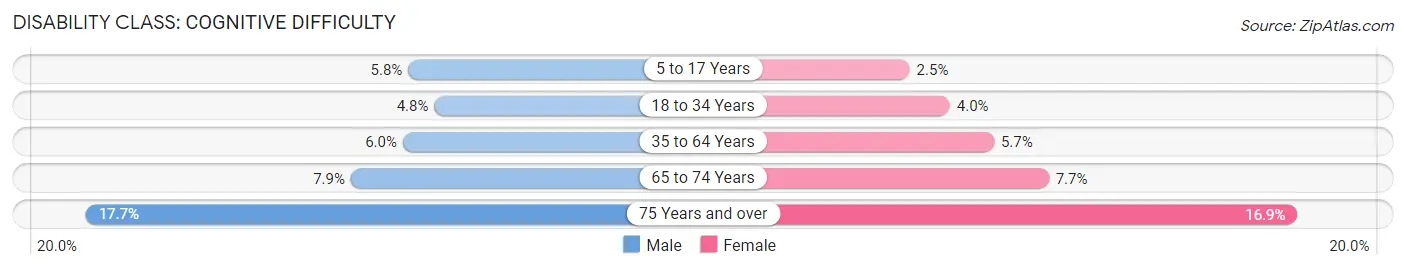
| Age Bracket | Male | Female |
| 5 to 17 Years | 1,160 (5.8%) | 455 (2.5%) |
| 18 to 34 Years | 1,470 (4.8%) | 1,096 (4.0%) |
| 35 to 64 Years | 3,021 (6.0%) | 2,646 (5.7%) |
| 65 to 74 Years | 891 (7.9%) | 908 (7.7%) |
| 75 Years and over | 1,035 (17.7%) | 1,261 (16.9%) |
Disability Class: Ambulatory Difficulty
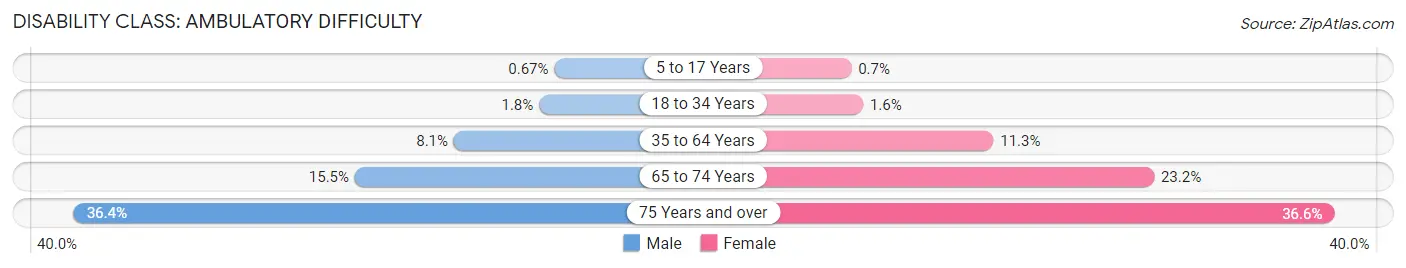
| Age Bracket | Male | Female |
| 5 to 17 Years | 135 (0.7%) | 127 (0.7%) |
| 18 to 34 Years | 552 (1.8%) | 430 (1.6%) |
| 35 to 64 Years | 4,119 (8.1%) | 5,274 (11.3%) |
| 65 to 74 Years | 1,749 (15.5%) | 2,741 (23.2%) |
| 75 Years and over | 2,122 (36.3%) | 2,727 (36.6%) |
Disability Class: Self-Care Difficulty
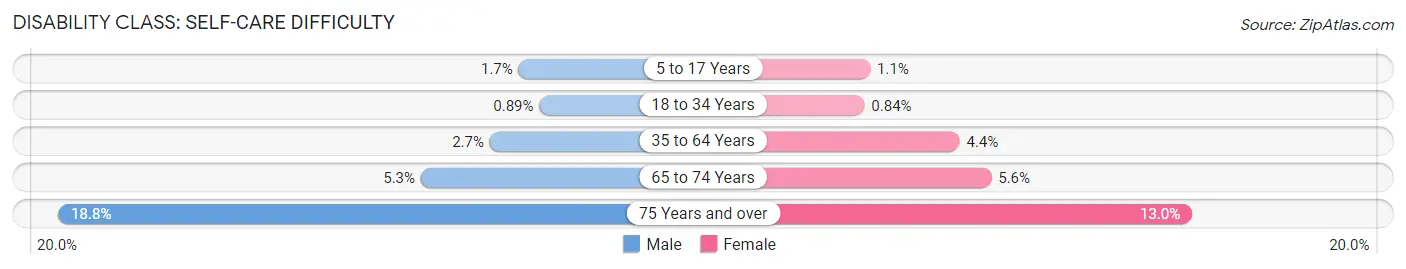
| Age Bracket | Male | Female |
| 5 to 17 Years | 335 (1.7%) | 190 (1.1%) |
| 18 to 34 Years | 272 (0.9%) | 229 (0.8%) |
| 35 to 64 Years | 1,382 (2.7%) | 2,046 (4.4%) |
| 65 to 74 Years | 597 (5.3%) | 656 (5.6%) |
| 75 Years and over | 1,095 (18.8%) | 970 (13.0%) |
Technology Access in Area Code 725
Computing Device Access in Area Code 725
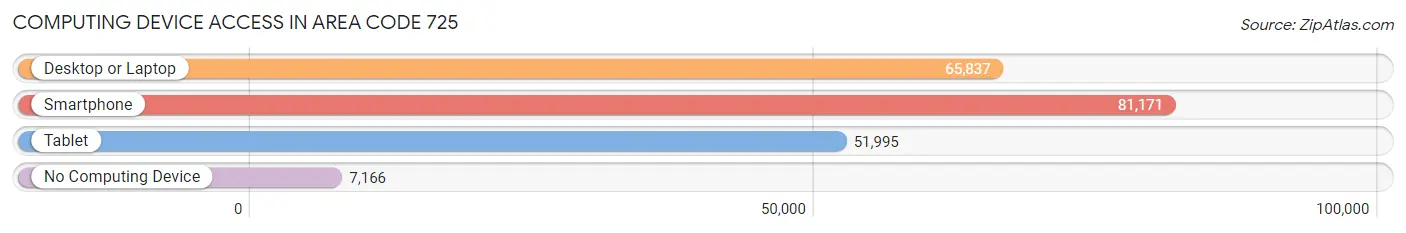
| Device Type | # Households | % Households |
| Desktop or Laptop | 65,837 | 70.2% |
| Smartphone | 81,171 | 86.5% |
| Tablet | 51,995 | 55.4% |
| No Computing Device | 7,166 | 7.6% |
| Total | 93,852 | 100.0% |
Internet Access in Area Code 725
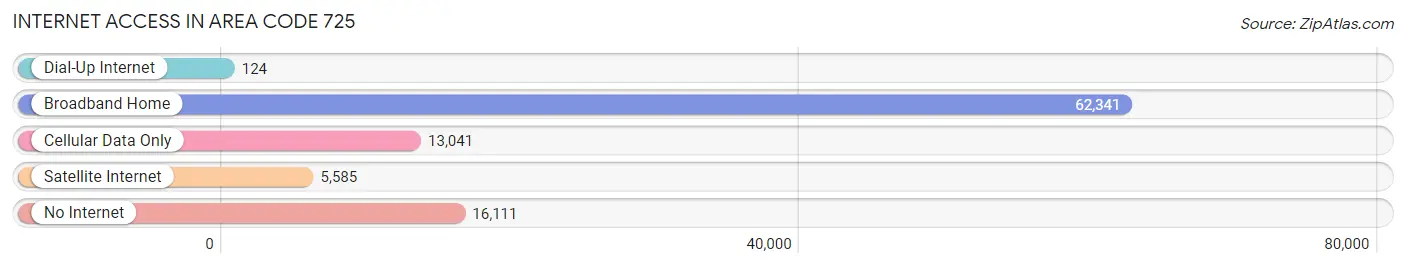
| Internet Type | # Households | % Households |
| Dial-Up Internet | 124 | 0.1% |
| Broadband Home | 62,341 | 66.4% |
| Cellular Data Only | 13,041 | 13.9% |
| Satellite Internet | 5,585 | 5.9% |
| No Internet | 16,111 | 17.2% |
| Total | 93,852 | 100.0% |
Area Code 725 Summary
Geography
Area code 725 is located in the state of Nevada. It covers the Las Vegas metropolitan area, including the cities of Las Vegas, North Las Vegas, and Henderson. It also covers the unincorporated towns of Blue Diamond, Indian Springs, and Jean.
Social
Area code 725 is home to a diverse population of people from all walks of life. The area is known for its vibrant nightlife, entertainment, and cultural attractions. It is also home to a number of professional sports teams, including the Las Vegas Raiders and the Las Vegas Aces.
Economics
Area code 725 is a major economic hub in Nevada. It is home to a number of large corporations, including MGM Resorts International, Caesars Entertainment, and Wynn Resorts. It is also home to a number of smaller businesses, including restaurants, bars, and retail stores.
Demographics
Area code 725 is home to a population of over 2 million people. The population is diverse, with a large Hispanic population and a growing Asian population. The median household income is $54,000, and the median age is 35.
Common Questions
What is Per Capita Income in Area Code 725?
Per Capita income in Area Code 725 is $33,149.
What is the Median Family Income in Area Code 725?
Median Family Income in Area Code 725 is $73,109.
What is the Median Household income in Area Code 725?
Median Household Income in Area Code 725 is $57,652.
What is Income or Wage Gap in Area Code 725?
Income or Wage Gap in Area Code 725 is 12.6%.
Women in Area Code 725 earn 87.4 cents for every dollar earned by a man.
What is Family Income Deficit in Area Code 725?
Family Income Deficit in Area Code 725 is $11,504.
Families that are below poverty line in Area Code 725 earn $11,504 less on average than the poverty threshold level.
What is Inequality or Gini Index in Area Code 725?
Inequality or Gini Index in Area Code 725 is 4.95.
What is the Total Population of Area Code 725?
Total Population of Area Code 725 is 248,803.
What is the Total Male Population of Area Code 725?
Total Male Population of Area Code 725 is 129,326.
What is the Total Female Population of Area Code 725?
Total Female Population of Area Code 725 is 119,477.
What is the Ratio of Males per 100 Females in Area Code 725?
There are 108.24 Males per 100 Females in Area Code 725.
What is the Ratio of Females per 100 Males in Area Code 725?
There are 92.38 Females per 100 Males in Area Code 725.
What is the Median Population Age in Area Code 725?
Median Population Age in Area Code 725 is 43.1 Years.
What is the Average Family Size in Area Code 725
Average Family Size in Area Code 725 is 3.3 People.
What is the Average Household Size in Area Code 725
Average Household Size in Area Code 725 is 2.5 People.
How Large is the Labor Force in Area Code 725?
There are 103,851 People in the Labor Forcein in Area Code 725.
What is the Percentage of People in the Labor Force in Area Code 725?
51.5% of People are in the Labor Force in Area Code 725.
What is the Unemployment Rate in Area Code 725?
Unemployment Rate in Area Code 725 is 8.5%.